Sub-National Revenue Mobilization in Latin America and Caribbean Countries: The Case of Venezuela
Upload
khangminh22Category
view
0download
0
Sust
aina
ble
Dev
elop
men
t
ALICIA BÁRCENAJOSELUIS SAMANIEGOWILSON PERESJOSÉ EDUARDO ALATORRE
The climate emergency in Latin America and the CaribbeanThe path ahead – resignation or action?

ECLACPublications
Thank you for your interest in
this ECLAC publication
Please register if you would like to receive information on our editorial
products and activities. When you register, you may specify your particular
areas of interest and you will gain access to our products in other formats.
www.cepal.org/en/publications
Publicaciones www.cepal.org/apps

The climate emergency in Latin America and the CaribbeanThe path ahead – resignation or action?
Alicia Bárcena Joseluis Samaniego Wilson Peres José Eduardo Alatorre

ECLAC Books
Alicia BárcenaExecutive Secretary
Mario Cimoli Deputy Executive Secretary
Raúl García-BuchacaDeputy Executive Secretary for Management
and Programme Analysis
Joseluis SamaniegoChief, Sustainable Development
and Human Settlements Division
Ricardo Pérez Chief, Publications and Web Services Division
160
This document was prepared by Alicia Bárcena, Executive Secretary of the Economic Commission for Latin America and the Caribbean (ECLAC), Joseluis Samaniego, Chief of the Sustainable Development and Human Settlements Division of the Commission, José Eduardo Alatorre and Wilson Peres. The authors wish to convey thanks for information and valuable conceptual contributions made by the following staff members of that Division: David Barrio, Carlos de Miguel, Jimy Ferrer, Luis Miguel Galindo, José Javier Gómez, Luiz Krieger, Mauricio Pereira, Orlando Reyes, Heloisa Schneider and Nicole Tondreau. The text is based on research carried out by ECLAC between 2009 and 2019, forming a corpus that merits the summarized presentation offered here. The documentation built up over this long reference period has served as a source of information for several organizations of the United Nations system and beyond and, above all, for the countries of Latin America and the Caribbean.
The boundaries and names shown on the maps included in this publication do not imply official endorsement or acceptance by the United Nations.
United Nations publication ISBN: 978-92-1-122032-2 (print) ISBN: 978-92-1-047956-1 (pdf) ISBN: 978-92-1-358269-5 (ePub) Sales No. E.19.II.G.17 LC/PUB.2019/23-P Distribution: G Original: Spanish Copyright © United Nations, 2020 All rights reserved Printed at United Nations, Santiago S.19-00710
This publication should be cited as: A. Bárcena and others, The climate emergency in Latin America and the Caribbean: the path ahead – resignation or action?, ECLAC Books, No. 160 (LC/PUB.2019/23-P), Santiago, Economic Commission for Latin America and the Caribbean (ECLAC), 2020.Applications for authorization to reproduce this work in whole or in part should be sent to the Economic Commission for Latin America and the Caribbean (ECLAC), Publications and Web Services Division, [email protected]. Member States and their governmental institutions may reproduce this work without prior authorization, but are requested to mention the source and to inform ECLAC of such reproduction.

Contents
Foreword ............................................................................................................. 13
Preface .................................................................................................................. 17
Introduction ........................................................................................................ 19A. The economics of global warming .................................................... 24B. Economic instruments for mitigation and adaptation ................... 33
Chapter I Global climate change ....................................................................................... 39
A. Manifestations of climate change ...................................................... 39B. Greenhouse gas emissions ................................................................. 45
Chapter II The effects of climate change in the region .................................................... 57
A. Some consumption patterns and climate change ........................... 58B. The impact of climate change ............................................................ 62C. The effects on agriculture ................................................................... 65D. The water challenge and climate change ......................................... 76E. Health and climate change ................................................................. 79
1. Health and cities ............................................................................ 792. Other effects and changes in disease vectors ............................. 85
F. The impact of rising sea levels on coasts ......................................... 85G. Biodiversity, forests and climate change .......................................... 88H. Management of risk associated with extreme weather events ....... 94
Chapter III Central America and the Caribbean: two extreme cases of asymmetry between low emissions and high vulnerability ................... 97
A. Greenhouse gas emissions in Central America ............................... 971. Emissions and land use change in Central America .............. 1002. Emissions intensity and per capita emissions
in Central America ...................................................................... 1043. The impact of climate change in Central America .................. 110

4 Economic Commission for Latin America and the Caribbean (ECLAC)
B. The impact of rising sea levels on the Caribbean and Central America ......................................................................... 118
C. The Caribbean: negative effects of climate change in a context of high borrowing ........................................................ 1221. The emissions of the Caribbean ................................................. 1232. Extreme events in the Caribbean ............................................... 1293. The situation of cities in the Caribbean .................................... 1334. Estimates of the economic impact of climate change ............. 1405. The challenge of debt in the Caribbean .................................... 1446. The ECLAC debt for climate adaptation swap initiative ....... 146
D. Conclusions ........................................................................................ 148
Chapter IV Adaptation to climate change ........................................................................ 151
A. Adapting to climate change ............................................................. 152B. The inevitability of adaptation ........................................................ 154C. The benefits and estimated costs of adaptation ............................ 157
1. The costs of adaptation ............................................................... 1572. Potential economic benefits ........................................................ 1593. Adaptation in nationally determined contributions .............. 160
D. The need for measuring criteria ...................................................... 163E. Cross-cutting issues .......................................................................... 168
1. Adaptation measures .................................................................. 1682. Nature-based solutions and payment for ecosystem
services: the convergence of adaptation and mitigation ........ 1743. Adaptation to climate change in the agricultural sector ........ 185
F. Adapting to climate change through migration ........................... 1911. Climate-related migration .......................................................... 1912. Some estimates for migration in Latin America
and the Caribbean and its relation to climate change ............ 196G. Closing reflections ............................................................................. 197Annex IV.A1 ............................................................................................... 199
Chapter V Public policies to mitigate climate change ................................................... 219
A. Creating the pathway to low-carbon investment ......................... 219B. Regulatory measures ........................................................................ 222
1. The Paris Agreement as a regulatory measure ........................ 2222. The state and progress of nationally
determined contributions ........................................................... 223C. Measuring climate expenditure ...................................................... 234
1. Environmental protection spending as an approach to climate expenditure ................................................................ 235
2. Applying the Climate Public Expenditure and Institutional Review methodology in Latin America and the Caribbean ...... 236
3. Constraints on the measurement of net climate spending ...... 237

The climate emergency in Latin America and the Caribbean... 5
D. Fiscal measures .................................................................................. 2381. Non-tax measures ........................................................................ 2382. Tax measures ................................................................................ 255
E. Climate financing flows in the region ............................................ 2671. The role of development banking ............................................. 2672. Some estimates of the investment required ............................. 2693. The flow of climate financing in Latin America
and the Caribbean ........................................................................ 2704. The private sector ........................................................................ 2765. Green bonds .................................................................................. 277
F. Sectoral drivers .................................................................................. 2821. Renewable energies for the energy transition ......................... 2822. Clean mobility as a driver of sustainable development
and urban productivity ............................................................... 2923. The contribution of low-carbon livestock to sustainable
development: the case of Brazil ................................................. 300G. Conclusions: social participation as a public policy tool ............. 306Annex V.A1.1 ............................................................................................. 310Annex V.A2.1 ............................................................................................. 313Annex V.A3.1 ............................................................................................. 317Annex V.A4.1 ............................................................................................. 320
Afterword .......................................................................................................... 323
Bibliography ..................................................................................................... 327
ECLAC recent publications ............................................................................ 351
Tables
I.1 Projected increases in the world’s average surface air temperature and average sea level relative to 1986–2005, 2046–2065 and 2081–2100 ...................................................................... 43
I.2 Global warming scenarios: proportion of climate models whose projections exceed the annual average temperature increase in the period 2081–2100 relative to 1850–1900 .................... 51
I.3 Nationally determined contributions (NDCs) in the countries of Latin America: unconditional and conditional targets for greenhouse gas reductions, reference years and high-priority sectors for mitigation and adaptation .................................................. 56
II.1 Latin America and countries of the Organization for Economic Cooperation and Development (OECD): meta-analysis of the income elasticity and price elasticity of demand for petrol, by region, around 2014 ........................................................ 62
II.2 Latin America: potential impact and risks of climate change ............ 65

6 Economic Commission for Latin America and the Caribbean (ECLAC)
II.3 Argentina, Brazil, Chile, Mexico, Peru and South America: estimated changes in agricultural incomes associated with temperature rise, 1998–2008 .................................................... 67
II.4 Latin America (8 countries): marginal impact of climate change on agricultural income, 2006–2015 ..................................... 69
II.5 Meta-analysis of the price and income elasticity of water demand, 1997–2014 ............................................................................ 78
II.6 Latin America and the Caribbean (18 countries): policies related to climate change and biodiversity .................................... 93
II.7 Effects of natural disasters on economic growth ........................... 94III.1 Central America (7 countries): nationally determined
contributions (NDCs), 2019 ............................................................ 105III.2 Scenarios and assumptions for 2030 .............................................. 107III.3 Central America (6 countries): income and price elasticity
of long-run demand for petrol, 1975–2012 ................................... 109III.4 Scenarios and assumptions, 2030 ................................................... 128III.5 The Caribbean: number of disasters, by type, 1990–2017 .......... 131III.6 The Caribbean: population of urban and rural areas,
capital cities and urban percentages, 2018 .................................... 134IV.1 Likelihood of global temperature increases being exceeded
at equilibrium ................................................................................... 155IV.2 Latin America and the Caribbean (33 countries): sectoral
distribution of adaptation-centred measures referred to in nationally determined contributions (NDCs), 2019................ 161
IV.3 Adaptation measures in selected sectors ...................................... 172IV.4 Compendium of initiatives classified as nature-based
solutions (NBS) presented at the 2019 Climate Action Summit .................................................................................. 176
IV.5 Latin America and the Caribbean (5 countries): examples of government-financed ecosystem service payment programmes, 1997–2008 .................................................................. 181
IV.6 Regulatory instruments and economic incentives that support ecosystem-based adaptation .................................... 183
IV.A1.1 Projects of the Ibero-American Programme of Science and Technology for Development (CYTED): sustainable development, global change and ecosystems, 2014–2016 .......... 204
V.1 Latin America and the Caribbean: basic data used to construct the business as usual scenario .................................. 227
V.2 Latin America and the Caribbean: projections by country, 2030 ................................................................................ 229
V.3 Latin America and the Caribbean: aggregate projections, 2030 ............................................................................... 231
V.4 Peru: long-term social discount rate of the Ministry of Economy and Finance, 2019 ....................................................... 239

The climate emergency in Latin America and the Caribbean... 7
V.5 Application of the social cost of carbon in international and development banking, various years ......................................... 245
V.6 Peru: social price of carbon depending on the discount rate and time horizon chosen, 2014 ........................................................................ 246
V.7 Chile: marginal costs associated with emission reduction targets set in nationally determined contributions (NDCs), under different scenarios ..................................................................... 248
V.8 The Americas: characteristics of tradable emission permits in selected jurisdictions, 2012 to the present ..................................... 253
V.9 British Colombia (Canada) and 15 selected countries: carbon tax rates, 2017 ........................................................................... 257
V.10 British Columbia (Canada) and Latin America (4 countries): characteristics of carbon taxes, 2008–present ................................... 259
V.11 Latin America and the Caribbean (19 countries): fiscal instruments benefiting the environment, 1991–2018 ....................... 260
V.12 Latin America and the Caribbean: amount and composition of climate financing, 2013–2017 ...................................................................... 272
V.13 Latin America and the Caribbean: climate funding by origin of resources, 2013–2017 ........................................................................ 273
V.14 Latin America and the Caribbean: funding approved by national and regional development banks, by sector, 2015–2017 .............................................................................. 276
V.15 Climate bonds worldwide and sectors targeted, 2013–2017 .......... 279V.16 Latin America and the Caribbean: green bonds issued, 2016 ........ 279V.17 Chile: contribution of each GWh generated to GDP,
by technology, 2016 .............................................................................. 284V.18 Chile: GDP multipliers for each million dollars invested
in electricity generation, by technology, 2013–2018 ......................... 284V.19 Chile: GDP per worker in the renewable energy sector, 2016 ........ 285V.20 Chile: employment multipliers for each million dollars
of electricity generation, by technology, 2013–2018 ......................... 286V.21 United States: employment in electricity generation, by main
energy technology and subcategories, 2016–2018 ............................ 286V.22 Greenhouse gas emissions over the life cycles of six
technologies, various years ................................................................. 287V.23 Latin America and the Caribbean (23 countries):
energy mix, 2000–2016 ......................................................................... 289V.24 Latin America and the Caribbean (23 countries): electricity
production mix, 2000–2016 .................................................................. 289V.25 Santiago: monthly cost of leasing, operating and maintaining
diesel and electric buses, 2018 ............................................................. 295V.26 European Union and selected countries: examples
of announced targets for electric vehicles, 2020–2030 ..................... 299V.27 Brazil: animal products produced as a proportion
of live weight, 2014 ............................................................................... 302

8 Economic Commission for Latin America and the Caribbean (ECLAC)
V.A2.1 Latin America and the Caribbean: sustainability initiatives implemented by some private banks, 2018 .................................. 313
V.A3.1 Credit lines applicable to sustainability and climate change available from Nacional Financiera (NAFIN) and National Bank for Economic and Social Development (BNDES) as of 2018 .......................................................................... 317
V.A4.1 Latin America and the Caribbean: details of green bond issuance, 2018–2019 .......................................................................... 320
Figures
1 Business as usual pathway and reduction wedges resulting from public policies or investment changes, 2010–2015 ............... 28
2 Carbon budget as per nationally determined contributions in the Paris Agreement for the 2 °C target, 1990–2050 .................. 30
3 Distribution of global greenhouse gas emissions by region, 2016 .................................................................................... 31
4 Latin America and the Caribbean: carbon budget remaining as of 2018 ............................................................................................. 32
5 Benefits and costs of illustrative investments in adaptation........ 36I.1 Manifestations of climate change, 1880–2019................................. 40I.2 Anomaly in the annual temperature of the earth’s surface
relative to the 1986–2005 average ..............................................................42I.3 Latin America and the Caribbean and the world:
greenhouse gas emissions, 1990–2016 ............................................. 46I.4 Growth in global greenhouse gas emissions, 1850–2016 .............. 47I.5 Latin America and the Caribbean and the world:
sectoral shares of greenhouse gas emissions, 2016 ........................ 48I.6 Latin America and the Caribbean: greenhouse gas emissions,
1990, 2000 and 2016 ............................................................................ 49I.7 Latin America and the Caribbean: greenhouse gas emissions
per capita, 2016 ................................................................................... 50I.8 Global emissions of CO2, 2000–2100 ................................................ 51I.9 Global greenhouse gas emissions under different scenarios
and the emissions gap by 2030 ................................................................... 52II.1 Latin America and the Caribbean (18 countries): groups
vulnerable to poverty, by income level, 2012-2017 ........................ 59II.2 Latin America (4 countries): composition of household food
expenditure by income decile, 2012-2016 ....................................... 60II.3 Latin America (4 countries): composition of household
spending on transport fuels (petrol, diesel and biodiesel), by income decile, 2012-2016 .............................................................. 61
II.4 Impact of climate change on world gross domestic product (GDP), by temperature range, according to different studies ........ 63
II.5 Latin America and the Caribbean (26 countries): projected changes in gross domestic product (GDP) per capita because of temperature rise, 2030 and 2050 ................................... 64

The climate emergency in Latin America and the Caribbean... 9
II.6 Latin America and the Caribbean (17 countries): losses expected in the agriculture sector from climate change, 2080 ............ 71
II.7 Latin America (16 countries): proportion of the rural population below the extreme poverty and poverty lines, around 2007 and 2017 ............................................................................. 75
II.8 Latin America and the Caribbean (24 countries): per capita water availability, by country, and distribution of use in the regional total, 2014 ....................................................................... 77
II.9 Latin America and the Caribbean (26 countries): motorization rate, 2005 and 2015 .................................................................................. 81
II.10 Latin America (13 countries): motorization rate, gross domestic product (GDP) per capita and comparison with trends in the United States and Norway, 2005–2015 ...................................... 81
II.11 Latin America and the Caribbean (20 cities): concentrations of coarse particulate matter (PM10) and fine particulate matter (PM2.5), around 2016 ................................................................. 82
II.12 Latin America and the Caribbean: forest cover, 1990-2015 ............... 89II.13 Latin America and the Caribbean (33 countries): threatened
species, by taxonomic group, 2013 and 2016 ...................................... 90III.1 Central America: greenhouse gas emissions, 1990–2016 .................. 98III.2 Central America (7 countries): emissions by sector
and country, 2016 .................................................................................... 99III.3 Central America (6 countries): energy mix, 2016 ............................. 100III.4 Central America (7 countries): changes in forest cover,
1990–2016 ............................................................................................... 101III.5 Central America (7 countries): carbon intensity
of the economy, 1990 and 2016 ............................................................ 105III.6 Central America (7 countries): emissions per capita, 2016 ............. 106III.7 Simulation of greenhouse gas emissions, 2016 and 2030 ................ 107III.8 Central America: net production, exports, imports
and apparent consumption of staple grains, and rate of dependence, 1980 and 2011 ............................................................. 112
III.9 Central America: climate-related disasters, 1969–2018 ................... 114III.10 Central America (7 countries): economic cost of natural
disasters, 2000–2017 .............................................................................. 115III.11 Central America (7 countries): disaster-related fatalities,
2001–2019 ............................................................................................... 116III.12 The Caribbean (5 countries): energy mix, 2016 ................................ 123III.13 The Caribbean (13 countries): emissions by country
and by sector, 2014 ................................................................................ 124III.14 The Caribbean: sectoral emissions shares, 2016 ............................... 125III.15 The Caribbean: composition of energy sector emissions, 2017 ........ 125III.16 The Caribbean: growth in emissions by sector, 1990–2016 ............. 126III.17 The Caribbean (13 countries): emissions per capita, 2016 .............. 126III.18 The Caribbean (13 countries): carbon intensity
of the economy, 1990 and 2016 ............................................................ 127

10 Economic Commission for Latin America and the Caribbean (ECLAC)
III.19 Simulation of greenhouse gas emissions, 2016 and 2030 ................ 128III.20 The Caribbean: damage caused by disasters, 1990–2017 ................ 132III.21 The Caribbean: urban coastline, 2013 ................................................ 136III.22 The Caribbean (13 countries): economic cost of natural
disasters, 2000–2017 .............................................................................. 140III.23 The Caribbean: disaster-related fatalities, 2000–2019 ...................... 142III.24 The Caribbean: total public debt, 2008–2017 .................................... 145III.25 The Caribbean (13 countries): gross central government
public debt, 2018–2019 ......................................................................... 146IV.1 Anomalies in the Earth’s average temperature during the past
65 million years and potential geohistorical analogues for future climates up to 2300 CE relative to the period 1961–1990 ................ 156
IV.2 Latin America and the Caribbean: average annual cost of adaptation, 2010–2050 ...................................................................... 158
IV.3 Cost-benefit ratios of some illustrative investments in adaptation, 2020–2030 ...................................................................... 159
IV.4 Chile: future hydrological conditions and historical conditions observed in the sub-basin feeding the Melado reservoir of the Maule Alto system according to scenario A2, 1976–2099 ............... 164
IV.5 Chile: future hydrological conditions and historical conditions observed in the sub-basin feeding the Melado reservoir of the Maule Alto system according to scenario A2, 1976–2099 ............... 165
V.1 Jurisdictions around the world where carbon pricing instruments have been implemented, 1990–2019 ............................ 222
V.2 GDP and greenhouse gas emissions worldwide, 2014 .................... 224V.3 Latin America and the Caribbean: carbon intensity
of GDP, 1990–2014 ................................................................................. 225V.4 Latin America and the Caribbean: emissions scenarios,
2014–2030 ............................................................................................... 231V.5 Latin America and the Caribbean: required annual rate
of decarbonization, 1990–2014 and 2030 ........................................... 233V.6 Chile: marginal greenhouse gas abatement cost curve
according to the abatement potential of each measure in the non-conventional renewable energy scenario of the MAPS Chile project by 2030 ..................................................... 247
V.7 The European market: the price of emission allowances, 2017–2019 ............................................................................................... 249
V.8 Latin America: structure of taxation related to the environment, 2016 ..................................................................... 256
V.9 Latin America (6 countries): level a petrol tax should have to reflect externalized costs, various years ........................................ 259
V.10 Argentina, Chile, Guatemala and Mexico: structure of direct consumption of fossil fuels for transport (petrol, diesel and biodiesel), 2012–2016 ........................................... 264
V.11 Latin America and the Caribbean: energy subsidies and general government health spending, 2015 .............................. 265

The climate emergency in Latin America and the Caribbean... 11
V.12 Annual changes in the average crude oil price, 1995–2018 ............ 266V.13 Latin America and the Caribbean: climate financing, 2013–2017 ....... 271V.14 Latin America and the Caribbean: climate finance with
and without Brazil, 2013–2017 ............................................................ 272V.15 Latin America and the Caribbean: climate financing
by origin, 2013–2017 ............................................................................. 274V.16 Latin America and the Caribbean: climate financing
by destination, 2016 and 2017 ............................................................. 275V.17 Latin America and the Caribbean (12 countries): average
normalized cost of solar and wind energy, 2018 .............................. 283V.18 Latin America and the Caribbean (33 countries):
trade balance in unrefined, semi-processed and refined hydrocarbons, 2000–2017 ..................................................................... 283
V.19 Brazil, Mexico and rest of Latin America and the Caribbean: net job creation in an energy transition scenario, 2020–2030.......... 285
V.20 Latin America and the Caribbean: proportion of renewable sources in the energy mix, 2000 and 2017 ......................................... 288
V.21 Latin America and the Caribbean: overall energy supply mix on current policies, 2016 and 2040 .............................................. 290
V.22 Mexico City: total bus ownership cost by energy source used, 2019 .................................................................................. 293
V.23 Mexico City: CO2 emissions by vehicle, 2014 ................................... 296V.24 CO2 emissions of conventional and electric vehicles over
a distance of 220,000 km, 2015 ............................................................ 297V.25 Curitiba (Brazil): demand for collective transport
per inhabitant, 2004–2016 .................................................................... 298V.26 Brazil: destination of animal fats and meals, 2014 ........................... 302V.27 Brazil: emissions of different bovine production systems,
various years ......................................................................................... 303V.28 Brazil: carbon sequestrated in different beef cattle
production systems, various years ..................................................... 304V.29 Carbon sequestration potential with different
technologies, 2017 ................................................................................. 304
Boxes
I.1 The state of international negotiations under the Paris Agreement and related progress .......................................................... 53
II.1 Climate change, income distribution and poverty in Mexico .......... 73II.2 Ecuador, El Salvador and Mexico: the welfare effects
of applying a petrol tax .......................................................................... 83III.1 Estimation of the monetary value of forest loss ............................... 103III.2 Central America and the Dominican Republic: vulnerability
to climate change .................................................................................. 110III.3 The Caribbean: impact expected as a result of vulnerability to
the effects of climate change, sea level rise and extreme events ...... 132III.4 Planning and risk .................................................................................. 138

12 Economic Commission for Latin America and the Caribbean (ECLAC)
IV.1 Adaptation glossary ............................................................................. 152IV.2 Colombia: the municipal disaster risk index .................................... 166IV.3 Adaptation in United States agriculture ........................................... 186IV.4 Adaptation in Peruvian agriculture ................................................... 188V.1 Methodological approaches for determining the social
cost of carbon ......................................................................................... 242V.2 Uruguay: the big push for energy sector sustainability .................. 290
Diagrams
II.1 Decomposition of changes in poverty into the income effect and the distribution effect .................................................................... 72
IV.1 Latin America and the Caribbean (13 countries): adaptation measures included in nationally determined contributions (NDCs), 2016–2018 .............................................................................. 162
IV.2 Adaptation needs and options for meeting them ........................... 168V.1 Chile: methodology for estimating the social price
of carbon, 2014 ..................................................................................... 247V.2 Equivalence between selected types of hybrid carbon
pricing systems .................................................................................... 254V.A1.1 Process of calculating climate expenditure by measuring
general government environmental protection spending ............. 312
Maps
II.1 Latin America and the Caribbean: average rise of the mean sea level in the periods 2010–2040 and 2040–2070 ............................. 86
II.2 Latin America and the Caribbean: impact of climate change on coastal areas and coastal dynamics ................................................ 87
II.3 Latin America: expected impact of climate change on biodiversity, 2050 ............................................................................... 91
III.1 Central America: potential biodiversity index, baseline, B2 and A2 scenarios with land use change, 2005 and 2100 ............ 113
III.2 Central America, the Caribbean and northern South America: land area affected if the average sea level rose by 1 metre ............. 118
III.3 Central America, the Caribbean and northern South America: projected urban area, 2040 ................................................................... 119
III.4 Central America, the Caribbean and northern South America: projected flood level, 2040 ................................................................... 120
III.5 Central America, the Caribbean and northern South America: average erosion projected because of sea level changes, 2040 ....... 121
III.6 Central America, the Caribbean and northern South America: change of 0.5 m in vertical breakwater overtopping because of sea level rise, 2040 ............................................................................ 121
III.7 The Caribbean: historical tracks of category 5 hurricanes, 1980–2018 ............................................................................................... 130
III.8 The Caribbean: spatial distribution of population, 2018................. 137V.1 Jurisdictions with carbon pricing initiatives, 2019 ........................... 262

Foreword
As Bruno Latour (2018) points out, causal linkages between climate triggers may follow a path that is difficult to trace and may ultimately be expressed in extreme political positions through a combination of isolated decisions, policies, perceptions and ideologies. If it were indeed possible to trace a chain of causality between unusually protracted droughts in large parts of the Middle East and the Maghreb, wide fluctuations in food prices and availability, local political conflicts, small-scale migration, national armed conflict, and then mass migration to Europe, the initial response of opening borders to take in migrants, migratory saturation, the subsequent closing of borders and the emergence of xenophobic, nationalist and conservative discontent in receiving countries, we could be seeing, on different time scales, a relationship between climate change and extreme political positions in some developed countries. An example of this is what is happening in Europe and the United States, in the latter case fomented by the country’s President, who has stigmatized migration towards the southern border.
These positions are also fuelled by certain phenomena typical of today’s globalization, such as the long slowdown in economic growth, the flight of jobs and taxes, and the unequal appropriation of the fruits of technical progress and productivity, an inequality that is long-standing. These phenomena could also be an expression of the logic of extending the economic life of fossil fuels that prevails in the world’s largest economies. In these economies, there are incentives to resist the shift towards an energy model based on renewable energies, while rivalry for geopolitical and technological dominance is becoming acute.
These pressures combine and reinforce each other in a mixture of equilibria that are very fragile at the international level. In the face of the climate emergency, which gives the Paris Agreement its meaning, the reluctance of some actors to roll out renewable energy on a mass scale and break away from the fossil model is becoming apparent. This stands in the way of the

14 Economic Commission for Latin America and the Caribbean (ECLAC)
achievement of the economies of scale needed for the transition, thereby reinforcing the inertia of economies around more carbon-intensive options.
This hegemonic race based on the fossil energy model is only intensifying the impact of global climate change and all its consequences, and this is exacerbating human insecurity in multiple related dimensions and creating a vicious circle. That circle could result in highly adverse conditions for a solidarity-based response to a change in the climate which, once a certain threshold is crossed, will be reinforced by physical vicious circles due to the release of organic methane deposited in the ground and seas, and the loss of albedo from planetary ice.
Latour argues that climate change calls into question the promise of neoliberalism, hegemonic since the 1990s, that globalization would be a vehicle for the welfare of humanity. The author also challenges climate denialism as a mechanism for promoting the belief that it is possible to stand aside from the global emergency and continue with the inequality-creating model, entrenched behind national borders that protect against migrants displaced by inequality, conflict and global warming, phenomena that, according to Latour, are inextricably linked. Similarly, Greta Thunberg, in her 2019 address to the General Assembly, pointed out the shamelessness of insisting on “fairy tales” of eternal economic growth in the face of the climate emergency. Denialism, stubborn dependence on fossil fuels and nationalistic entrenchment in the face of migration triggered by the climate emergency itself are other fairy tales deliberately constructed to give the status quo a few more years of life, leaving the vulnerable in individual countries and around the world to cope as best they can.
In Latin America and the Caribbean, the same frictions are delaying the shift to lower-carbon economies, there is a risk of the targets adopted being missed, and the challenges for adaptation are increasing, given the inadequacy of global and regional responses. With regard to adaptation processes, Magrin (2015, p. 9) recognizes that “the countries of the region have made progress in incorporating environmental protection into decision-making processes, particularly in terms of environmental institutions and legislation, but there are still difficulties in effectively incorporating environmental issues into relevant public policies”. One of the main challenges of the climate agenda will be to achieve coordination between climate policies and development, spatial planning and sectoral policies. There are now a number of laws dealing with the climate issue, although they are very difficult to effectively implement and follow up on. In several countries there are marked contradictions between land use regulation policies and incentives to increase productivity. The great process of change that the region is undergoing requires planned, consistent, non-contradictory policies and interventions in line with development objectives. It is important to attain a holistic view of the problem, taking advantage of capacities developed for other purposes (such as disaster risk management), connecting the climate issue with development actions

The climate emergency in Latin America and the Caribbean... 15
and pursuing environmentally sound and well-planned land use. Thus, effective governments and institutions have a key role to play in facilitating planning and implementation and represent the main adaptation opportunity or constraint. Governments need to be adequately informed, assess the suitability of interventions and make their own decisions (in accordance with the specific context of each particular situation), avoiding pressures and one-size-fits-all options for developing countries that generate resistance and distrust and retard actions. In all cases, it is important to study and properly understand the interactions and constraints of the climate change-development relationship, as government decisions and actions are often wide-ranging and take in more than one objective, including climate change.”
Some issues of crucial importance from an adaptation point of view require policy decisions that go to the heart of how governments operate. For example, it would be desirable to transform regional information on the expected effects of climate change into mechanisms that change the incentives or rules governing investment. In this regard, it is worth noting the potential offered by the formalization of such information as a basis for public action, the adaptation of licensing processes and the impact evaluation associated with licensing, the updating of land use planning instruments and the inclusion of resilience standards applicable to the operation of critical infrastructure that serve to internalize the cost of keeping it operational at critical times. One of the advances in international negotiations has been to ensure that, alongside national efforts, relevant information and additional funds are made available to countries to accelerate adaptation to climate change. Two extreme scenarios can be envisaged for adaptation to gradual climate change and combined in a variety of ways: adaptation which does not prevent all the damage and losses that could be caused by the accumulation of changes, response deficiencies and limitations outlined, and adaptation which adequately and promptly anticipates threats and that successfully moderates risk and not only reduces vulnerability but goes further by investing in infrastructure and closing gaps derived from the old development style. If climate change is not gradual and there are tipping points followed by sudden changes and self-reinforcing cycles, adaptation will be clearly inadequate and the effects will be unavoidable. For our region, the nationally determined contributions (NDCs) of the Paris Agreement and the Sustainable Development Goals (SDGs) are clear benchmarks for efforts to seize the opportunity to progress likewise with the quality and sustainability of national and local development, while helping to mitigate the climate emergency.
Alicia Bárcena Executive Secretary
Economic Commission for Latin America and the Caribbean (ECLAC)


Preface
After this document was written, in March 2020, the coronavirus disease (COVID-19) health crisis erupted. As in the case of the climate emergency, the COVID-19 crisis has shown the meaning of a global public bad with planetary repercussions —a pandemic in this case— that requires simultaneous, decisive collective action.
Two fronts have been aligned to address this crisis: the health front, to flatten the curve of exponential growth in cases over time and prevent the response capacity of public health systems from being overwhelmed; and the socioeconomic front, to reduce the impact of the resulting sharp recession, which is eroding people’s income and the productive fabric.
As with global warming, inaction in the face of the pandemic has a cost. Following an initial period of indecision in many countries, the will to act and a sense of urgency prevailed. Many governments have therefore committed to significant fiscal and credit efforts to sustain employment, maintain the income of informal sector workers and support the economic viability of micro-, small and medium-sized enterprises. In both the environmental crisis and the pandemic, countries and their governments are facing problems whose solutions are massively expensive, at a time when fiscal resources are being squeezed by the suspension or heavy reduction of key economic activities such as air transport or tourism.
The efforts made have been diverse, owing to the very different economic conditions and fiscal space in each of the countries of Latin America and the Caribbean. Few countries had a solid foundation on which to build a response to the pandemic, as public health policies had lagged behind. In addition, health spending in the region has averaged just 2.2% of GDP, as opposed to the 6% recommended by the World Health Organization (WHO). Despite these

18 Economic Commission for Latin America and the Caribbean (ECLAC)
structural problems, governments have led the response in this situation; markets are unable to resolve this emergency because of their failures to deliver an adequate supply of public goods amid over-commoditization of health services and health inputs.1
The cost of action or inaction is not the only area in which the COVID-19 pandemic and the climate emergency can be compared. In the case of COVID-19, a sense of urgency and political decisiveness prevailed that have yet to appear in the case of the climate emergency. The human and financial resources made available to mitigate the pandemic have been significant; this is far from being the case for the climate emergency, as reflected by the lack of commitment to undertaking the mitigation and adaptation measures discussed in this document. Government leadership has a long way to go on climate emergency, while market pressures on the global climate system continue to mount. Business goes on as if these pressures did not exist —pressures that, perhaps more slowly, but just as inexorably, will spread through economic and social systems as the pandemic has. As we know, the cost of the climate crisis will be much greater if we do not do what is needed to prevent its most extreme effects. The pandemic and the climate crisis both force us to recognize the value of public goods and services as insurance against greater bads and against inequality. The pandemic thus obliges us to consider the strategic value of public goods and the need for their effective governance.
Once the pandemic has run its course, the economic and employment recovery is expected to occur at a fast pace over a not-too-lengthy period, albeit not immediately. In the case of climate change, the exponential curve will only continue to rise, with no foreseeable reversal even in the medium or long term. In the climate emergency, to date there is no immunity to the predatory behaviour of a portion of the human species in the exploitation of fossil fuels. Unless such behaviour is made to carry a high political and economic cost, we will not be able to halt the upward curve of the climate emergency. That is why it is crucial to act now —and this document is a call to do precisely that.
1 For an in-depth analysis, see Economic Commission for Latin America and the Caribbean (ECLAC), “Latin America and the Caribbean and the COVID-19 pandemic: economic and social effects”, Special Report COVID-19, No. 1, 3 April 2020.
Introduction
The environmental impact of the prevailing development style imperils the well-being, and in some cases the survival, of much of humanity. It is one of the great challenges of the present, for it puts at risk the world’s common resources: the atmosphere, the oceans, the poles and biodiversity. The climate is altering to the point where the ranges of sustainable variability in temperature and precipitation are being exceeded, and the composition of the atmosphere is changing, threatening all living beings on land and in the sea.
The evidence on global warming is unequivocal. One of the main causes of this phenomenon is the increase in the concentration of greenhouse gases produced by human activities, including the burning of fossil fuels and changes in land use.1
Climate change is manifested primarily in a rising average global temperature, changing precipitation patterns, continuous sea level rise, reduction of the cryosphere2 and heightened patterns of extreme weather events. These transformations are having a strong impact on economic activities, social welfare and ecosystems. Thus, the main cause of climate change, greenhouse gas emissions, is a negative global externality and, as Stern (2007) has pointed out, the biggest market failure of all time. We are facing a change of era that requires a structural alteration in the forms of production and consumption that characterize the current development
1 The Intergovernmental Panel on Climate Change (IPCC) has established the following criteria to indicate the degree of probability of an outcome or consequence: virtually certain, 99% to 100%; very likely, 90% to 100%; likely, 66% to 100%; about as likely as not, 33% to 66%; unlikely, 0% to 33%; very unlikely, 0% to 10%; and exceptionally unlikely, 0% to 1%. If appropriate, other criteria can be used, namely: extremely likely, 95% to 100%; more likely than not, 50% to 100%; and highly unlikely, 0% to 5% (IPCC, 2013a).
2 If there is less snow and ice, water reserves for human use decrease and the albedo or reflectivity to the sun’s energy of the Earth’s surface is reduced, accelerating heat retention.
20 Economic Commission for Latin America and the Caribbean (ECLAC)
style. Environmental policies at the margin are not enough: it is essential that the international community act collectively and simultaneously to achieve goals aimed at mitigating greenhouse gases, and that urgent adaptation actions be taken to protect the most vulnerable communities, such as small island developing States (SIDS) and the poorest populations in developing countries, who will be the most affected. This means embarking on an energy transition of enormous proportions to decarbonize the economy. The aim must be to decouple emissions from production and consumption, to replace, for example, carbon-based energy sources with clean, renewable sources, to abandon deforestation practices and adopt sustainable agro-forestry methods, and to protect the oceans from pollution and high temperatures in order to preserve plankton life, which is important for food chains.
The economic and social dimension must be fully included in the debate on climate change. Throughout history, developed economies have been able to attain high levels of development based on industrialization that is high in carbon and other pollutants. This is a historical debt that industrialized economies owe developing countries; accordingly, the international community agreed in 1992 that the solution to the problem of climate change required common but differentiated responsibilities, entailing a greater commitment, as well as more resources and technology transfers, from developed countries.
Although growth has enabled humanity to make substantial progress in reducing extreme poverty in the world, increasing agricultural productivity and developing technology, these benefits have come at a high environmental cost and have not spread to everyone, so that global income and wealth inequalities have increased to unsustainable levels. In the environmental field, the result has been increased air pollution in urban areas, the deterioration of biodiversity, native forests and oceans, soil erosion and increased water scarcity.
Developing economies need to grow more if their economic and social problems are to be solved and if income, technology and infrastructure gaps with developed economies are to be reduced. In the region, with its structural gaps in infrastructure, taxation, investment and social and distributive inequality, the need to strengthen sustainability-oriented development options must be addressed. The current style of development is unsustainable because of insufficient economic dynamism, the climate pathway, the gradual depletion of sources of financing based on the exploitation of natural resources and persistent or growing inequality (ECLAC, 2018a).
The production structure, infrastructure, a dominant technological paradigm that is short on innovation and heavily dependent on imported consumption patterns, the political economy of economic incentives and

The climate emergency in Latin America and the Caribbean... 21
subsidies, the regressive consumption mix of private goods and the inadequate quality of public goods have all contributed to a path of low environmental sustainability (ECLAC, 2014a; Stern, 2007 and 2008).
The boom in exports of renewable and non-renewable natural resources helped to reduce poverty and improve social conditions; however, it also contributed to climate change and caused negative externalities such as air pollution and local pollution, a source of increasing conflict. The negative cycle tends to be completed when risk extends to things like energy security (because hydroelectricity becomes inefficient), security of agricultural production, habitability in the event of meteorological disasters, and health. Thus, the inertia of the current development style is eroding the foundations that sustain it.
In the 27 years since the Earth Summit, substantial technological advances have been made in electricity generation in the form of renewable energy and significant progress has been achieved with electricity-based mobility, waste recycling and waste-to-energy conversion. It is now cheaper to generate from non-conventional renewable energy than from fossil fuels. This, coupled with best agricultural practices, opens up the prospect of enhancing welfare in developing countries and leaving a smaller environmental footprint. However, the climate debt between the North and the South is real, as is that within countries, where the prevailing inequality means that the wealthiest sectors are also those responsible for the greatest emissions of greenhouse gases and urban and national pollution.
Altering these trends will require profound transformations in the development paradigm and in the investments that make it possible. More sustainable development implies greater equality and social cohesion, with a mix of high-quality public services and with private consumption whose orientation is consistent with the new paradigm. This would make sustainable development less vulnerable to climate shocks and enable adaptation and mitigation to be pursued more effectively. Thus, the challenge of climate change is part of the challenge of achieving more sustainable development (ECLAC, 2015a).
In 2015, a milestone for the international community and multilateralism was reached: it was recognized that the current style of development was unsustainable. The evidence accumulated over the previous decades, showing deep economic, social and environmental imbalances, led to the negotiation of the most comprehensive and ambitious road map to sustainable development so far. Thus, in September that year, heads of State and government adopted the 2030 Agenda for Sustainable Development and its 17 Sustainable Development Goals (SDGs). The Agenda recognizes equality and sustainability as shared and universal guiding principles

22 Economic Commission for Latin America and the Caribbean (ECLAC)
for transforming the development path and combining policies to change production patterns with the imperatives of caring for the environment. Of the SDGs agreed, Goal 13 (climate action) is of particular note. It highlights the urgent need to adopt measures to combat climate change and its effects, pointing out that no country in the world has been spared these. In addition, global warming is causing permanent changes in the climate system, and the consequences of these changes may be irreversible if action is not taken immediately (ECLAC, 2016c).
Following some earlier efforts of very limited scope, in December 2015 the Paris Agreement that came out of the twenty-first Conference of the Parties to the United Nations Framework Convention on Climate Change (COP21) was approved.3 The Agreement is a set of measures aimed at reducing greenhouse gas emissions through mitigation and adaptation actions to increase the resilience of the population and ecosystems to climate change. One of its objectives is to “strengthen the global response to the threat of climate change, in the context of sustainable development and efforts to eradicate poverty” (UNFCCC, 2016b, p. 22).
Article 2 of the Paris Agreement reiterates three commitments:
(i) Holding the increase in the global average temperature to well below 2 °C above pre-industrial levels and pursuing efforts to limit the temperature increase to 1.5 °C above pre-industrial levels, recognizing that this would significantly reduce the risks and impacts of climate change.
(ii) Increasing the ability to adapt to the adverse impacts of climate change and foster climate resilience and low greenhouse gas emissions development, in a manner that does not threaten food production.
(iii) Making finance flows consistent with a pathway towards low greenhouse gas emissions and climate-resilient development.
Article 3 of the Paris Agreement states that each country must take on individually determined national mitigation and adaptation commitments. These commitments are called nationally determined contributions (NDCs), and are intended to stabilize CO2 emissions, prevent the global temperature from rising by more than 2 °C and, if possible, hold the increase to below 1.5 °C. Countries must report on their progress every five years and the targets must be increasingly ambitious. These targets will not be binding; rather, it will be public visibility that stimulates or punishes action.
3 The Paris Agreement calls on all countries to reduce greenhouse gas emissions, regardless of their level of development. Prior to the Agreement, the international community had been negotiating for years to adopt an instrument that would meet the challenges of climate change. In that process, and with a few exceptions, such as the European Union, the Kyoto Protocol did not prove as effective as initially expected. The agreements reached in Rio de Janeiro on the basis of common but differentiated responsibilities also proved to be very ineffective.

The climate emergency in Latin America and the Caribbean... 23
It is a fragile agreement that was negotiated by 195 member countries of the United Nations and opened for signature on 22 April 2016. It was signed by 97 countries, including the European Union, well over the threshold required for it to enter into force, which was that it had to be ratified by more than 55 Parties accounting for 55% of greenhouse gas emissions. Most positively, it recognizes the seriousness of the problem and the urgent need to limit the temperature increase and achieve carbon neutrality (i.e. for removal to offset emissions) by 2050. The Agreement embodies a consensus on the planet’s carrying capacity in terms of concentrations, expressed in the 2 °C limit on temperature rise, which in turn requires a reduction in the annual flow of emissions. The NDCs are in turn the expression of carbon limits or budgets; they are non-binding but no less real for that. In other words, contributions represent the total amount of greenhouse gases that should be emitted in the course of all a country’s economic activity, which raises the question of how to make the best use of that amount. From an economic point of view, this means calculating the opportunity cost of alternative uses of the atmosphere’s function as a sink.
Less positive is the fact that, although most countries have made a commitment to reduce emissions, the targets are not binding and it is up to the governments of the day to comply with NDCs. The cost of not meeting targets is damage to a country’s reputation and, in terms of the planet, continued temperature rise. Non-compliance by any given country implies appropriation of the environmental space of all other countries. This is precisely what happened in 2017 when the United States announced its withdrawal from the Agreement, which also weakened multilateral commitments and collective and simultaneous action, particularly by the large carbon-producing and emitting countries. The shortcomings of the Agreement are compounded by the fact that decisions are taken by consensus and not by majority, a problem that also afflicts the Convention.
A second problem is that the sum of national actions is insufficient to meet the target: it is estimated that annual emissions will reach 55 gigatons of CO2e in 2030, which implies that the temperature will increase by 3 °C. It was therefore decided to adjust the nationally determined contributions (NDCs), an issue that was addressed at COP24 in Katowice, Poland, in 2018. However, little was achieved. A package was approved that contains a rulebook according to which from 2024 all countries, except the most vulnerable, will have to report on their national targets every two years instead of five, but no rules were established for carbon trading. Attempts by developing countries to secure new and additional funding commitments failed, and loss and damage financing mechanisms were not agreed either. Not enough progress has been made on policies consistent with the Paris Agreement, such as those aimed at drastically reducing high-carbon investments or creating sufficient financial guarantees to reduce the risk of lower-emission

24 Economic Commission for Latin America and the Caribbean (ECLAC)
investments. In addition, progress on climate-sensitive taxation, such as agreements to reduce subsidies for activities harmful to the climate, is still insufficient.
The Paris Agreement, with its progress and shortfalls, represents a major shift in the international policy approach. The universal commitments made under it are reducing the differentiation of responsibilities, a process that in a few decades could lead to a regime based on the ability of the strongest to impose their style of development if global trends in emissions, responsibilities, policies and, in general, the internalization of the role of the atmosphere as a sink do not change. Similarly, the fact that in the main financial mechanism of the Paris Agreement, the Green Climate Fund, donor funds which are meant to provide resources for mitigation and adaptation and which are earmarked for international compensation have been converted into credits is itself highly questionable. The difference is not subtle. Transfer is compensation; it is the cost of internalization (partial or total). Credit is internalization by the affected party (the developing country itself), smoothed over time. It is noteworthy that the global energy problem is not the exhaustion of nature’s fossil fuels, as has always been argued in the field of energy security, but precisely the limitations of nature’s absorption function, saturated as it is by energy waste and the worldwide consequences of this. Global warming is probably the first stark universal symptom of the limit human beings have come up against in the absorption function of the natural world.4
A. The economics of global warming
Global warming and its consequences bring out the problem of how to deal with environmental and social externalities, and the issue of the distribution and economic value of the absorption function of the atmosphere.5 From an economic point of view, the consequences of climate change and defensive measures have been kept out of development and investment accounts, as these have not included the toll taken by the effects of climate change on the health, output, habitat and even viability of certain nations. But this global negative externality imperils the climate, which is a public good for the world (ECLAC, 2016).
Whether this externality is acknowledged or denied is crucial. Thus, the climate denialism of some governments and business groups has the effect of delaying action on this externality, with the effects ultimately falling on current and future generations of vulnerable groups in the societies of their
4 Disturbing levels have also been reached in the global phosphorus and nitrogen cycles, but these have not been the subject of international regulation.
5 It is not the only atmospheric phenomenon affected by this problem. The same tension can be seen in cities over air pollution by substances other than greenhouse gases, and when the scale of the issue is larger, this tension extends to the national and even international level.

The climate emergency in Latin America and the Caribbean... 25
own and other countries. The struggle to divide, transfer, minimize, avoid and measure the burden of this externality is the crux of both international negotiations and national climate policy.
Climate change, like other environmentally or socially destructive phenomena, is a reminder that income partly depends on externalities being actively maintained. This is on top of the short-sightedness that can afflict the economic system when it comes to fully considering the costs of reproducing the economic-production cycle.6 In the case of climate change, it is evident that part of the profitability of fossil fuel use, cement production and farming is achieved at the expense of the world’s climate system and atmosphere, and of nature’s absorption function more generally. The time it takes nature to recover means that this burden is spread within and between generations.
Economic analysts are increasingly interested in studying the causes and consequences of climate change; however, in most economic areas of national governments, especially in industrialized countries, global warming is still treated as an environmental problem rather than as one of development style. Its internalization is seen as a brake on the economy and not as an opportunity to make it better and more dynamic. It is this that gives rise to the very common notion, whether springing from ignorance or self-interest, that the planet’s capacity to absorb greenhouse gases is limitless and that there is consequently no reason to change the style of development. Some developing countries perceive that their contribution to emissions is low and thus there is no need to alter their emissions pattern. They thereby sacrifice much of the opportunity to provide their populations with the additional benefits offered by the absorption of technical progress and its effect in creating new engines of industrialization for development. The very idea of recognizing limits on freedom of access to the atmosphere is only now finding a place in the thinking of the authorities responsible for economic management, as demonstrated by the fact that the Helsinki Principles coalition, whose mission is to review fiscal policy (CO2 taxes, tax spending, net climate expenditure in the public finances and carbon risk in investment portfolios) to align it with the Paris Agreement, was created in December 2018. Only a few countries in Latin America and the Caribbean back this group: Chile (which is one of its joint leaders), Ecuador, Guatemala, Mexico, Costa Rica and Colombia.
There is no doubt that many of the countries of Latin America and the Caribbean, particularly those in Central America and the Caribbean, are highly vulnerable to the effects of climate change, and adaptation is therefore among their top development priorities. However, there is a risk of generating greater inequalities when adaptation policies are designed. These
6 It is legitimate to wonder whether the current economic system would be viable if it internalized all its costs, i.e. if it had to operate without environmental and social externalities.

26 Economic Commission for Latin America and the Caribbean (ECLAC)
policies require priorities to be identified, and when resources are limited this may mean giving preference to the adaptation of people, or sectors, in the light of their economic and political position and role. This involves making financial transfers and investments between territories and from some social groups to others. Adaptation options can be a source of greater equality or greater inequality, depending on the decisions taken. Adapting an export sector, i.e. a source of foreign exchange, may take precedence over the adaptation of populations in vulnerable territories which are marginal to the economy and whose adaptation may have a net cost that there is no appetite to bear, creating a vicious circle of inequality. Obviously, this is not true only of adaptation; mitigation solutions can also be sources of greater equality (better public transport or nature-based solutions in poor communities) or inequality (subsidies for low-emission private mobility). In Latin America and the Caribbean, both because of its geographical location within the area of greatest natural productivity on the planet (between the tropics of Cancer and Capricorn) and because of its rural population that is highly dependent on the integrity of nature and has a high proportion of indigenous peoples, nature-based solutions should be a priority.
The Stern Review (Stern, 2007) marked a milestone in thinking on the subject and confirmed the relevance and importance of analysing the economic impact of climate change and climate action measures by giving the future discount rate a major role in present decision-making. Stern’s argument is that the discount rate should be very low or even negative, as it recognizes the possibility that future generations may not be better placed than present ones and that environmental conditions may be more negative than they are now, thus moving away from the conventional notion of a better future and greater absolute wealth. This approach was highly controversial among specialists,7 but the idea of assessing the costs of inaction in the face of climate change became an indispensable methodological yardstick.
There have essentially been two stages in the economic analysis of both mitigation and adaptation. The first stage was to estimate the costs of global inaction for the twenty-first century. Stern was the first to carry out this estimation, which was then conducted at the national level in the region with the support of ECLAC and, in Brazil’s case, of the Inter-American Development Bank (IDB). These studies were made possible by advances in global and regional climate modelling, with the National Autonomous University of Mexico (UNAM) carrying out a study on the Mexican case, the National Institute for Space Research of Brazil doing another study in which it generated climate models for all of Latin America and the Caribbean, and
7 In 2018, the Nobel Prize in Economics was awarded to William Nordhaus, one of Stern’s critics, who argued that action to address the problem would be less urgent in the context of a more prosperous future with sufficient environmental space for a slower change of course.

The climate emergency in Latin America and the Caribbean... 27
the Caribbean Community Climate Change Centre (CCCCC) in Belize, generating this information for Central America and the Caribbean. The Mexican case was a pioneering one in the region, establishing the methodology designed by Galindo (2009) that was subsequently reproduced in the ECLAC approach from 2009. This first stage, in which the costs of inaction were assessed, was then supplemented by approaches that addressed sectoral impact, e.g. on agriculture (Mendelsohn, 2008; Nordhaus and Boyer, 2000; ECLAC, 2015a), and the impact on poverty. The aim was to analyse the social dimension of this impact, since this is expected to be strongest in agriculture, on which large vulnerable populations depend. Some of the results are presented in chapter II.
The second stage of analysis is more recent and deals with the potential effect of applying instruments. For both mitigation and adaptation, the economic analysis is based on estimating business as usual development and the associated emissions in order to gauge the sensitivity of the existing pathway that the policy will need to modify if the relevant climate target is to be met (see diagram 1). Thus, each measure will contribute to attainment of the national target, with reduction “wedges” in some sectors or through the sector-region mix (see figure 1). In the logic of the Paris Agreement, the sum of national contributions should lead to the global target being met. Given that national commitments are insufficient to achieve the global target of a temperature rise of no more than 2 °C, nationally determined contributions should be reviewed periodically.
Diagram 1 Analysis of climate change
Climatesystem
Welfare
Impactchannels
Economicsystem
Climate change
Damage outsidethe market
Damage accounted for by the markets
Emissions
Consumption
Source: S. Fankhauser, Valuing Climate Change: The Economics of the Greenhouse, Abingdon, Routledge, 1995.

28 Economic Commission for Latin America and the Caribbean (ECLAC)
Figure 1 Business as usual pathway and reduction wedges resulting from public policies
or investment changes, 2010–2015
0
0.5
1.0
1.5
2.0
2.5
3.0
3.5
4.0
2010 2015 2020 2025 2030 2035 2040 2045 2050
Business as usual Sector 1 Sector 2 Sector 3
Gre
enho
use
gas
emis
sion
s
Source: Economic Commission for Latin America and the Caribbean (ECLAC).
The Paris Agreement, besides its environmental content, had a number of unprecedented economic consequences:
(i) First, it defined in absolute terms the planet’s carrying capacity for carbon, a crucial element of nature. This made it possible to establish a global limit or budget for this element for the first time.
(ii) The adoption of national targets under the Paris Agreement created voluntary national carbon limits or budgets, the amount of which are to decrease until the targets are met and the collective achievement of preventing global warming from exceeding 2 °C is achieved. National economic activities must be compatible with this limit or budget.
(iii) There is an opportunity cost to using the atmosphere as a natural resource. In terms of development, the origin of emissions matters, since it is not the same for a ton to be emitted to support unproductive discretionary consumption as for it to be emitted by an activity that generates productive, inclusive and sustainable employment. From the point of view of development consistent with the 2030 Agenda for Sustainable Development and the Paris Agreement, both the amount and origin of emissions matter, since some serve only to satisfy the consumption pattern of a minority of the population, while others could stimulate development.

The climate emergency in Latin America and the Caribbean... 29
(iv) The equitable distribution of the remaining carbon budget among the countries of the world is crucial to global environmental justice. What is emitted by the group of developed countries and the largest emitters in the developing world will determine the space left for developing countries. In its nationally determined contributions (NDCs), each country specifies the emissions level it will aim for over the next five years. It is therefore estimated that NDCs are still too unambitious to meet the limits imposed by the size of the remaining carbon budget for the 2 °C and 1.5 °C targets. A country that chooses to breach its limit or that is unable to restrict its economy in order to abide by its carbon limit or budget will be appropriating the environmental limit or budget of another country or another population group, now and in the future. Every time emissions limits are exceeded, all nations are brought that much closer to an ever-warming world.
IPCC (2018a) set a limit on the amount of cumulative global emissions that is consistent with the goal of limiting temperature increases to less than 1.5 °C and 2 °C above pre-industrial levels. This limit is known as the “carbon budget”. It is estimated that to keep the temperature increase below 2 °C with a confidence level of 66%, the remaining budget is 1,070 gigatons of carbon dioxide (Gt of CO2). To limit the temperature increase to just 1.5 °C, the budget is much lower: 320 Gt of CO2. Currently, about 50 gigatons of carbon dioxide equivalent (Gt of CO2 eq) are emitted per year, so if this flow were to continue, the budget remaining for an increase of up to 1.5 °C would run out in less than a decade and that for an increase of less than 2 °C in about two decades. In order to keep the global economy within the carbon budget limits compatible with the 2 °C target, global emissions would have to be reduced from the current 50 Gt of CO2 eq to about 40 Gt of CO2 eq by 2030. This means reducing the current 7 tons emitted per capita to less than 5 tons per capita (4.7 t of CO2 eq) and achieving neutrality by 2070 (for the 2 °C scenario). If we want to stay within the carbon budget for 1.5 °C, we should have reduced emissions to 24 Gt of CO2 eq by 2030, i.e. from the current 7 tons per capita to less than 3 tons per capita (2.8 tons), and neutrality should be achieved by the middle of this century.
The emissions reduction commitments that the United States, the European Union, China and India, the largest emitters, made around 2015 leave little space for all other countries, given the 2 °C threshold and the remaining carbon budget. On the basis of the distribution shown in figure 2, if the successive revisions of the Paris Agreement do not provide for greater reductions by the four major emitters, the budget available for the rest of the world will run out by 2030.

30 Economic Commission for Latin America and the Caribbean (ECLAC)
Figure 2 Carbon budget as per nationally determined contributions in the Paris Agreement
for the 2 °C target, 1990–2050a
(Gigatons of CO2 per year)
1990
CO
2 em
issi
ons
2000 2010 2020 2030 2040 2050
Rest of world China India European Union United States
0
5
10
15
20
25
30
35
40
Source: G. Peters and others, “Measuring a fair and ambitious climate agreement using cumulative emissions”, Environmental Research Letters, vol. 10, Bristol, IOP Publishing, 2015; Global Carbon Project (GCP), Global Carbon Budget 2015, 2015.
a Budget that offers a 66% likelihood of this target being met.
In this scenario, three types of responses can be anticipated:
(i) Countries pulling out of the Paris Agreement because they consider the goal of 1.5 °C or 2 °C to be undesirable or unattainable. Without a global agreement, global warming would be worse and countries pulling out would obtain short-term advantages, as they would avoid making the necessary adjustments to their economies.8 It remains to be seen whether the countries that did carry on complying with the Agreement could impose sanctions. For example, disciplinary measures such as border tariffs could be imposed on imports of goods from certain economies without there being comparable measures applied to the importing country.
(ii) More pressure from society, and especially the young, for major emitters to achieve greater reductions, both in countries that withdraw from the Agreement and in those that continue to comply with it.
8 This is seen especially when there are changes of government and the new administration does not perceive the seriousness of the problem or seeks to differentiate itself from the previous government. For example, this happened in the Philippines in 2015, when the incoming government described the national goal decided upon by the previous government as nonsense.

The climate emergency in Latin America and the Caribbean... 31
(iii) A change of course in the development models of countries to prioritize renewable energies, decouple from fossil fuels and redirect their investments towards adaptation through technological innovation and solutions based on nature. This response implies a deliberate shift in the composition of the energy mix, urbanization,9 mobility, agriculture and the carbon content of the economy in general.
As noted earlier, global greenhouse gas emissions were 50 Gt CO2 eq in 201610 and Latin America and the Caribbean emitted 4.2 Gt of CO2 eq that year, meaning that the region contributed 8.3% of global emissions, according to IPCC data (see figure 3).
Figure 3 Distribution of global greenhouse gas emissions by region, 2016
(Percentages)
East Asia and Pacific (38.3)
Europe and Central Asia (16.8) North America (14.5)
Latin Americaandthe Caribbean(8.3)
Middle East andNorth Africa (7.4)
South Asia (7.5)
Sub-SaharanAfrica(7.2)
Source: Economic Commission for Latin America and the Caribbean (CEPAL), on the basis of J. Gütschow and others, “The PRIMAP-hist national historical emissions time series”, Earth System Science Data, vol. 8, No. 2, Göttingen, Copernicus Publications, 2016.
If the carbon budget were distributed in accordance with the current global emissions share of Latin America and the Caribbean, the region would have a budget of around 47 Gt of CO2 eq and 110 Gt of CO2 eq to meet the 1.5 °C and 2 °C targets, respectively. If the region continued to grow in line with a business as usual scenario, taking emissions of approximately 4.2 Gt of CO2 in 2016 as the baseline and assuming an annual increase of 1.1% because of growth in the economy, the budget compatible with the
9 There are approaches, such as geoengineering, that follow a very different logic, relying on technological advances such as carbon sequestration in the earth’s crust or the seas, or manipulation of the solar radiation reaching the Earth, to avoid global warming while at the same time maintaining current patterns of mobility and energy production and consumption, with only a few specific mitigation actions.
10 See Gütschow and others (2016) for information on sectoral emissions and FAO (2019) for information on emissions related to land use change.

32 Economic Commission for Latin America and the Caribbean (ECLAC)
1.5 °C objective would be used up in about 11 years and that compatible with the 2 °C objective in just over 23 years. Even if the unconditional and conditional contributions were to be adhered to (see annex A5 for more details on each country’s contributions), the budget would be used up within 10 years for the 1.5 °C target and within about 20 years for the 2 °C target (see figure 4).
Figure 4 Latin America and the Caribbean: carbon budget remaining as of 2018
(Years)
7 78
2022 22
0
5
10
15
20
25
Business as usual Unconditional nationallydetermined contributions
Conditional nationallydetermined contributions
Budget compatiblewith the 1.5 ºC target
Budget compatiblewith the 2 ºC target
Source: Economic Commission for Latin America and the Caribbean (ECLAC).
The way the emissions limit or carbon budget is allocated at the national level needs to be discussed internally to identify how best to use this allowance and the effects it has on well-being depending on whether it is emitted to produce or consume. In other words, the distributive, economic and social implications of using the atmosphere as a repository of emissions must be reflected on and acted on. The limit to carbon emissions or the carbon budget frames the window of opportunity that should determine the speed of change in such fundamental areas as energy production, transport and mobility, the way cities are built and the limits set on the transformation of nature. The world faces the challenge of changing the magnitude and speed of emissions to reduce the annual global flow so as to achieve climate neutrality, i.e. a zero net global flow, by 2050 (the Paris Agreement aims at climate neutrality by then, and some countries in the region, such as Chile and Costa Rica, have signed up to this target). This implies an intermediate target of less than 24 gigatons by 2030, in order to limit the temperature increase to less than 1.5 ºC. Achieving this transformation far transcends specific sectoral or technological policies, requiring a worldwide economic shift towards a great environmental effort that must be the dominant purpose and goal of technology configurations and public policy tools.

The climate emergency in Latin America and the Caribbean... 33
B. Economic instruments for mitigation and adaptation
At present, emissions of CO2 by producers and consumers are cost-free, the consumption or production of fossil fuels is encouraged through subsidies or tax spending, and the destruction of nature does not show up in the economic accounts. Moving from this situation to one in which resilient, low-carbon development is incentivized requires a consistent and constant realignment of regulatory and economic policy.11 The instruments that can be used to promote mitigation and adaptation are very different and will be discussed in depth over the course of this book. For now, a general overview of the topic will be presented.
With regard to mitigation, available instruments include national and urban fiscal policy, reports on the carbon risk of investment portfolios, the policy orientation of national and international development banks, risk management and, of course, technological innovation. A number of coalitions, including the Helsinki Principles coalition, formed by some of the world’s finance ministries, and the Platform for Cooperation on Carbon Pricing in the Americas, participated in by the Pacific Alliance countries and jurisdictions with carbon markets in Canada and on the west coast of the United States, advocate the introduction of carbon pricing. The most obvious pricing option is a CO2 emissions tax, which has already been implemented at very low levels in Argentina, Chile, Colombia and Mexico. It works differently in each of these countries, but essentially applies either to the carbon content of the fuel to be burned or to the carbon content of emissions. The institutional consequences of these two ways of applying the tax are very different: in the first case, the tax can be collected at the time of the initial sale in the market, so that it is then passed on down the chain of buyers; in the second case, since it is collected ex post, there need to be institutions to verify it, and the charges are passed on to the consumer with some delay.
Other instruments that can be used for mitigation purposes involve indirect carbon pricing. The impact of these instruments is distributed more evenly over time. Regulations limiting emissions or requiring higher levels of efficiency in the use of fossil fuels or electrical appliances entail an implicit carbon price, as do the methodologies used to evaluate investment projects, be they public, financial or private. In the current situation, if it remains unchanged, the price imposed is zero. However, some countries in the region have begun to experiment with variations on evaluation methodologies. Thus, Chile has set a rate of US$ 40 per ton emitted in public investments carried out directly or through concessions. This experiment is being evaluated in five Central American countries with a view to possible adoption.
11 The Economic Commission for Latin America and the Caribbean (ECLAC) advocates an approach based on lower-carbon economic drivers in accordance with the idea of the environmental big push (ECLAC 2016 and 2018a).

34 Economic Commission for Latin America and the Caribbean (ECLAC)
To analyse climate change mitigation and adaptation processes comparably over time, it is customary to use a discount rate that allows economic effects to be expressed at present value. There is an intense extra-economic debate on what discount rate to use, since a higher rate sets a lower value on long-term effects (Hanley and Spash, 1995; Brent, 2008; Boardman and others, 2010; Aldred, 2009).12 In Peru, for example, a decision was taken in 2015 to reduce the discount rate from 9% to 4% for projects with lower environmental impacts, including those considered to have lower carbon emissions. In both cases, the shadow or social price of carbon and the reduced discount rate allow any additional cost to be distributed throughout the useful life of the investment to be made.
Development banks have made policy decisions such as not financing certain types of projects and, more generally, favouring projects considered to have lower carbon emissions. By way of example, in 2017 Brazil’s National Bank for Economic and Social Development (BNDES) decided to stop financing large hydroelectric plants.
The application of these policies guides producer and consumer markets by gradually modifying the relative profitability and prices of decisions by investors and consumers, who choose options with lower carbon emissions. The change noted, however, is insufficient. The importance of simultaneously introducing affordable substitutes for carbon-intensive consumption options cannot be underestimated. Disincentives should be compensated for by progressive transfers and alternative investments to reduce the risk of generating situations of great social discontent. The transition to decarbonized economies is complex, especially in a region where it is necessary to change the positive correlation between per capita income, per capita energy consumption and per capita CO2 emissions. This correlation reflects the energy, agricultural and mobility infrastructure built in recent decades and the inertia that persists in what is still being built now. To change this correlation, investments must be compatible with a development style that generates lower carbon emissions. This is what ECLAC has called progressive structural change, which provides a way of addressing the urgent need for an environmental big push (ECLAC, 2015a).
12 There is a debate in economics about whether it is justifiable to apply a discount rate to the future in a situation completely different to the behaviour of returns on private assets, which is the field in which this procedure for measuring returns on investment originated. It does not seem reasonable to us to discount the value or preferences of future generations (which of course cannot be made known), since a world made more uncertain by global warming does not seem more desirable than the present one. The higher the discount rate used when thinking about the future, the less urgency is assigned to action today. This does not seem the right way forward, given that the depletion of the carbon budget calculated for the 2 °C target means that the window of opportunity for action is small.

The climate emergency in Latin America and the Caribbean... 35
Adaptation instruments are less varied, being confined essentially to the implementation of insurance reflecting risks, including those relating to climate, and to more rigorous spatial planning. Land use regulation and spatial planning, like legislation that affects mitigation, create signals that change the cost of investing in infrastructure or living in areas exposed to greater flooding, drought, hurricanes and sea level rises.
The combination of global and national limitations on emissions (of sectoral or territorial application) has created the opportunity to set quantitative targets that have made mitigation processes highly visible. Adaptation, on the other hand, has been more difficult to pin down (ECLAC, 2014a), and specific information has been harder to construct, as it tends to be conflated with existing infrastructure deficiencies or extreme events that cannot be distinguished from climate variability and are difficult to attribute to climate change. Only in 2012 was it possible to create a regional database for Latin America and the Caribbean that has served to identify the various manifestations of the rise in sea levels, which is entirely attributable to the thermal expansion induced by global warming and the continued melting of continental ice.
Latin America and the Caribbean is now seeing the emergence of adaptation measurement techniques serving to distinguish both risks on top of the normal development challenges and the local capacity to deal with them. This makes it possible to measure adaptation achievements and gaps, set targets, fund the necessary work, harmonize measurements regionally and give adaptation the visibility and importance it warrants. ECLAC has carried out an exercise relating to agriculture consisting in probabilistic inference of options for adapting to climate alterations (Galindo, Alatorre and Reyes, 2015a; ECLAC, 2016), in a way, furthermore, that prioritizes solutions based on natural systems.
The weaker global mitigation is, the greater the demands of local adaptation. It is therefore necessary for national adaptation plans (NAPs) to be prepared and implemented in response to new climate conditions, even as enhanced mitigation actions are undertaken within the international framework. Chile and Uruguay, for example, stand out in the region for their progress on adaptation policies. Chile has a national adaptation plan and seven sectoral plans associated with the biodiversity, fisheries and aquaculture, health, infrastructure, cities, energy and agroforestry sectors. Uruguay also has national adaptation plans for cities and the coastal zone, and at least five countries in the region have systems of payment for ecosystem services, including Costa Rica, whose National Forest Financing Fund (FONAFIFO) was a pioneer in this area.

36 Economic Commission for Latin America and the Caribbean (ECLAC)
The good news is that adaptation itself provides an opportunity not only to lessen the future negative effects of climate change, but also to reduce development gaps and energize the region’s economies. Indeed, the most recent report of the Global Commission on Adaptation (2019), led by Ban Ki-moon, notes that the total rate of return on adaptation investment is very high, with a cost-benefit ratio ranging from 2:1 to 10:1 (a return of twice to 10 times each unit invested) and sometimes even more (see figure 5).
Figure 5 Benefits and costs of illustrative investments in adaptation
(Trillions of dollars)
1:1 3:1 5:1 7:1 9:1 11:1 13:1 15:1 17:1
Strengthening earlywarning systems
Net benefits
0.1
4.0
0.7
1.0
1.4
7.1
Benefit-cost ratio
Making newinfraestructure resilent
Improving dryland agriculturecrop production
Protecting mangroves
Making water resourcesmanagement more resilent
Total net benefits
Source: Global Commission on Adaptation, Adapt Now: A Global Call for Leadership on Climate Resilience, Amsterdam, 2019.
Note: This graph is meant to illustrate the broad economic case for investment in a range of adaptation approaches. The net benefits illustrate the approximate global net benefits to be gained by 2030 from an illustrative investment of US$ 1.8 trillion in five areas (the total does not equal the sum of the rows because of rounding). Actual returns depend on many factors, such as economic growth and demand, policy context, institutional capacities and condition of assets. Also, these investments neither address all that may be needed within sectors (e.g. adaptation in the agricultural sector will consist of much more than dryland crop production) nor include all sectors (as health, education and industry sectors are not included). Owing to data and methodological limitations, this graph does not imply full comparability of investments across sectors or countries.
According to the report of the Global Commission on Adaptation (2019), investing $1.8 trillion globally, from 2020 to 2030, in five areas with great potential for high returns on adaptation investments (early warning systems, climate-resilient infrastructure, improved agricultural crop production in drylands, global mangrove protection and investments to make water resources more resilient) could generate US$ 7.1 trillion in total net benefits.
Investments in adaptation pay a threefold dividend. The first is loss avoidance, i.e. the ability of the investment to reduce future losses; the second are the economic benefits of reducing risk (increased productivity and innovation through adaptation); and the third are the social and environmental

The climate emergency in Latin America and the Caribbean... 37
benefits. Thus, investments that support adaptation can have positive effects on development, as can investments that have effects on mitigation. Any investment aimed at restoring the natural heritage and ecosystem services will bring benefits on both the adaptation and the mitigation fronts. Investments in social welfare and the provision of high-quality public services also create jobs and have positive mitigation effects.
In the case of Latin America and the Caribbean, the social benefits of investments and policies to restore ecosystems and improve urban mobility, land-use planning and urban planning are substantial. All of them generate better living conditions for the population. Policies and investments to improve urban mobility not only help to cut greenhouse gas emissions, but also and especially reduce the negative effects on the health of the most vulnerable caused by air pollution, generate employment, reduce travel times and accidents, and are inclusive from the point of view of gender and older persons. Another example is investment in the proper management of solid and liquid waste in cities, which has advantages not only in terms of reducing methane emissions but also in the areas of social inclusion and disease prevention, and increases the potential for job creation because the materials can be reused.
This book presents the results of more than a decade of work carried out at the Economic Commission for Latin America and the Caribbean (ECLAC) on the economics of climate change. It analyses the global evidence and the impact of climate change in the region, examining sectors such as agriculture, health, transport and energy. The links between climate change, sea level, biodiversity and the water challenge are studied. In particular, the effects on the two most vulnerable subregions, Central America and the Caribbean, are addressed and an account is given of the agreements reached in the region to tackle the problem of global warming.
The book takes a structuralist approach in which the organizing concept is that of progressive structural change, defined as a process of transformation towards activities and production processes whose three characteristics are that they are intensive in learning and innovation (Schumpeterian efficiency), are associated with rapidly expanding markets enabling production and employment to increase (Keynesian efficiency) and favour environmental sustainability and the decoupling of economic growth from carbon emissions (environmental efficiency).
The aim is to promote growth that creates jobs and solves environmental problems. This requires institutions and policies that favour expansionary fiscal stances and investments in low-carbon technologies, goods, services and infrastructure; in particular, it means applying technology to preserve the environment and switching from fossil fuel-based energies to renewable ones. This in turn requires economic policies that transform relative price

38 Economic Commission for Latin America and the Caribbean (ECLAC)
structures, regulations and standards. As context, progress on NDCs, climate finance flows and public policy innovations aimed at moving towards lower-carbon development better suited to a warming world are presented. Responding to the challenge of climate change in Latin America and the Caribbean represents a financial, economic, social, cultural, distributive and innovation effort, but it also provides an opportunity for the region to move towards more sustainable and inclusive development (ECLAC, 2016c).
The book consists of five chapters. The first presents the evidence for the climate change that is occurring in the world, and includes global analyses and projections. The second characterizes the phenomenon in Latin America and the Caribbean and links it to the style of development followed in the region over the long term. The third chapter focuses on two subregions where the social and economic effects of climate change are particularly severe: Central America and the Caribbean. The fourth chapter identifies the main adaptation measures in the region, including climate-induced migration. Lastly, the fifth chapter sets out strategies and policy lines for synergistic progress in the sectors and policies that will make it possible to deal with the environmental emergency, together with their contributions to development. As part of public policy, emphasis is placed on the importance of access to information, participation and environmental justice and the relevance of the Escazú Agreement to discussions on climate change.

Chapter I
Global climate change
The increase in greenhouse gas emissions resulting from global production and consumption decisions is already having a noticeable effect on the climate. Temperatures have been rising, and this in turn has led to other changes in the climate system.1 Unless prevented, the changes projected will have major negative effects on human welfare. This chapter presents empirical data on global climate change and projections for different scenarios. It discusses the role of the current economic system as the main determinant of fossil fuel burning, emissions from this and climate change.
A. Manifestations of climate change
There is unequivocal scientific evidence that current climate change is anthropogenic.2 In just 200 years, human activities have brought about the kind of changes in the climate that would have taken millions of years to occur naturally. The cause is greenhouse gas emissions derived mainly from activities such as the burning of fossil fuels, cement manufacturing and changes in land use. Temperature has already increased by about 1 °C relative to the average temperature before the industrial revolution that began in the eighteenth century. If the temperature continues to rise at the same rate as that seen in recent decades, within a few years the terrestrial system will be in a state unprecedented in human history, although not in geological history. If global emissions continue to grow as fast as they have,
1 This is a highly complex system consisting of five main components (the atmosphere, the hydrosphere, the cryosphere, the lithosphere and the biosphere) and the interactions between them. The climate system evolves over time, influenced by its own internal dynamics and by external factors such as volcanic eruptions or solar variations and anthropogenic ones such as changes in the composition of the atmosphere and land use change.
2 Climate change is a naturally occurring cyclical planetary process. The current phenomenon is different because of its great speed and human, i.e. anthropogenic origin.

40 Economic Commission for Latin America and the Caribbean (ECLAC)
the temperature in 2030 could resemble that experienced about 3 million years ago, in the middle of the Pliocene. During that geological era, there were no areas of permanent ice in the northern hemisphere and the sea level was 25 metres higher than it is today.
The increase in the average global temperature (which has large local variations, especially at higher latitudes) is being manifested by alterations in precipitation patterns, a rising sea level, a reduction in the cryosphere and an intensification of extreme weather events (IPCC, 2013b; ECLAC, 2015a). The central problem is that the speed of global warming and its consequences are outstripping the ability of social and economic systems to adapt, and the result is a highly regressive distribution of impact. Failure to alter the factors causing it, especially the burning of fossil fuels, is aggravating the problem and delaying the significant introduction of alternative patterns of investment, production and consumption.
That the climate is altering is obvious (IPCC, 2013a). The average global temperature rose by 0.85 °C (between 0.65 °C and 1.06 °C)3 from 1880 to 2012, and there is evidence that the last three decades have been progressively warming, with the period between 1983 and 2019 being probably the hottest in the last 1,400 years. The average temperature increase has been manifested in a reduction in the number of cold days and nights and an increase in the number of warm days and nights. In addition, the mass of the Greenland and Antarctic ice caps has been decreasing, almost all glaciers have retreated and Arctic ice cover has declined significantly. The average sea level rose by 0.19 metres (between 0.17 and 0.21 metres) in the period from 1901 to 2010 and is currently rising by about 3 millimetres a year (ECLAC/University of Cantabria, 2015b), and forest fires have been becoming more intense (see figure I.1).
Figure I.1 Manifestations of climate change, 1880–2019
A. Anomalies in the combined land and ocean surface temperature relative to the period 1951–1980, 1880–2018a
(degrees centigrade)
-0.6
-0.4
-0.2
0
0.2
0.4
0.6
0.8
1.0
1.2
Temperature Trend
1880
1889
1898
1907
1916
1925
1934
1943
1952
1961
1970
1979
1988
1997
2006
2015
3 Calculated from a linear trend.

The climate emergency in Latin America and the Caribbean... 41
B. Reduction in the extent of Arctic sea ice, 1979–2018b
(millions of square kilometres)
3.0
3.5
4.0
4.5
5.0
5.5
6.0
6.5
7.0
7.5
8.019
79
1982
1985
1988
1991
1994
1997
2000
2003
2006
2009
2012
2015
2018
C. Average sea level rise, 1993–2018c
(millimetres)
0
10
20
30
40
50
60
70
80
90
100
1993 1998 2003 2008 2013 2018
330
340
350
360
370
380
390
400
410
420
Jan
1980
Jul 1
981
Jan
1983
Jul 1
984
Jan
1986
Jul 1
987
Jan
1989
Jul 1
990
Jan
1992
Jul 1
993
Jan
1995
Jul 1
996
Jan
1998
Jul 1
999
Jan
2001
Jul 2
002
Jan
2004
Jul 2
005
Jan
2007
Jul 2
008
Jan
2010
Jul 2
011
Jan
2013
Jul 2
014
Jan
2016
Jul 2
017
Jan
2019
Average Trend
D. Increase in monthly concentrations of CO2 in the atmosphere, 1980–2019d
(parts per million)
Source: Economic Commission for Latin America and the Caribbean (ECLAC), on the basis of Goddard Institute for Space Studies (GISS), National Snow and Ice Data Center (NSIDC) and National Oceanic and Atmospheric Administration (NOAA).
a Temperature figures are annual averages for combined global land and ocean surface temperatures over the years from 1880 to 2018. Increases are calculated relative to the period 1951–1980. The data are from the Goddard Institute for Space Studies (GISS).
b Data on Arctic sea ice come from the National Snow and Ice Data Center (NSIDC) and are for September of each year. c The data on sea level rise were obtained by satellite altimetry and come from the Laboratory for Satellite
Altimetry of the National Oceanic and Atmospheric Administration (NOAA). Seasonality signals were eliminated and six-month moving averages taken.
d The data on atmospheric concentration of CO2 are global measurements and come from the National Oceanic and Atmospheric Administration (NOAA).
Figure I.1 (concluded)

42 Economic Commission for Latin America and the Caribbean (ECLAC)
According to the climate projections of the Intergovernmental Panel on Climate Change (IPCC) (2013b), the temperature will increase by an average of between 1 °C and 2 °C by the middle of the twenty-first century relative to the average temperature in the period 1986–2005 (see figure I.2). Furthermore, by 2100 the temperature is expected to rise by between 1 °C and 3.7 °C, with a maximum likely increase of up to 4.8 °C (see table I.1) (ECLAC, 2015a).
Figure I.2 Anomaly in the annual temperature of the earth’s surface relative to the 1986–2005 average
(Degrees centigrade)
A. Change in the annual temperature of the earth’s surface, 1000–2012
1000 1400 1600 1800 2000
0
0.5
-0.5
-1.0
-1.5
1.0
Range of historical reconstructionsProxy reconstruction (Jones and others, 1998)
Proxy reconstruction (Mann and Jones, 2003)
Temperature anomaly (historical) Uncertainty (temperature anomaly)
B. Anomaly (rise) in annual temperature relative to the 1986–2005 average, 1850–2100
-2
0
2
4
1850
RCP8.5
RCP6.0RCP4.5
RCP2.6
1900 1950 2000 2050 2100
6
Temperature anomaly (historical) Uncertainty (temperature anomaly)Simulations of future scenarios (CMIP5)a Uncertainty (RCP8.5)b
Uncertainty (RCP2.6)b
Source: Economic Commission for Latin America and the Caribbean (ECLAC), The economics of climate change in Latin America and the Caribbean: paradoxes and challenges of sustainable development (LC/G.2624), Santiago, 2015; P. Jones and others, “High-resolution palaeoclimatic records for the last millennium: interpretation, integration and comparison with General Circulation Model control-run temperatures”, The Holocene, vol. 8, No. 4, Thousand Oaks, SAGE Publishing, 1998; M. Mann and P. Jones, “Global surface temperatures over the past two millennia”, Geophysical Research Letters, vol. 30, No. 15, Hoboken, Wiley, 2003; Intergovernmental Panel on Climate Change (IPCC), Climate Change 2013: The Physical Science Basis. Contribution of Working Group I to the Fifth Assessment Report of the Intergovernmental Panel on Climate Change, T. Stocker and others (eds.), Cambridge, Cambridge University Press, 2013; R. Moss and others, “The next generation of scenarios for climate change research and assessment”, Nature, No. 463, Berlin, Springer, 2010.
a Simulated time series based on the multiple models of the fifth phase of the Coupled Model Intercomparison Project (CMIP5) for the period 1950–2100.
b RCP stands for representative concentration pathways.

The climate emergency in Latin America and the Caribbean... 43
Table I.1 Projected increases in the world’s average surface air temperature and average
sea level relative to 1986–2005, 2046–2065 and 2081–2100
Variable Scenario2046–2065 2081–2100
Mean Likely rangec Mean Likely ranged
Mean surface temperaturea (degrees centigrade)
RCP2.6 1.0 0.4–1.6 1.0 0.3–1.7
RCP4.5 1.4 0.9–2.0 1.8 1.1–2.6
RCP6.0 1.3 0.8–1.8 2.2 1.4–3.1
RCP8.5 2.0 1.4–2.6 3.7 2.6–4.8
Mean sea levelb (metres)
RCP2.6 0.24 0.17–0.32 0.40 0.26–0.55
RCP4.5 0.26 0.19–0.33 0.47 0.32–0.63
RCP6.0 0.25 0.18–0.32 0.48 0.33–0.63
RCP8.5 0.30 0.22–0.38 0.63 0.45–0.82
Source: Intergovernmental Panel on Climate Change (IPCC), “Summary for policymakers”, Climate Change 2013: The Physical Science Basis. Contribution of Working Group I to the Fifth Assessment Report of the Intergovernmental Panel on Climate Change, T. Stocker and others (eds.), Cambridge, Cambridge University Press, 2013; Economic Commission for Latin America and the Caribbean (ECLAC), The economics of climate change in Latin America and the Caribbean: paradoxes and challenges of sustainable development (LC/G.2624), Santiago, 2015.
a The fifth phase of the Coupled Model Intercomparison Project (CMIP5) involves presentation of joint results and calculation of temperature anomalies relative to the period 1986–2005. Using the HadCRUT4 model and bearing in mind its uncertainty (confidence interval of between 5% and 95%), the average warming observed in the period 1986–2005 was 0.61 ºC (between 0.55 ºC and 0.67 ºC) relative to the period 1850–1900.
b Based on 21 CMIP5 models. Temperature anomalies are calculated in relation to the period 1986–2005. Where CMIP5 results are not available for a particular atmosphere-ocean general circulation model (AOGCM) and a scenario, the results are estimated as explained in table 13.5 of chapter 13 of IPCC (2013b). Contributions derived from a rapid change in ice cover and from anthropogenic storage of groundwater are treated as if they behaved in accordance with a uniform probability distribution and to a great extent independently of the scenario. This treatment does not imply that the contributions concerned cannot provide the basis for a quantitative assessment of dependence on the different scenarios. On current knowledge, only if the Antarctic ice sheet collapsed could the global mean sea level rise considerably above the likely range during the twenty-first century. There is a medium level of confidence that this additional contribution would not represent a sea level rise of more than a few decimetres during the twenty-first century.
c The calculations are based on projections derived from models whose ranges of results fall between 5% and 95% of the results distribution. Evaluation is then carried out and the probable range obtained after taking account of other uncertainties or different levels of confidence in the models. Where the projections for the change in the global mean surface temperature in 2046–2065 are concerned, the confidence level is medium because the relative importance of natural internal variability and uncertainty about forcing due to non-greenhouse gases and the response are greater than in the period 2081–2100. The likely ranges for 2046–2065 do not take into account the possible influence of the factors leading to the resulting range for the short-term global mean surface temperature change (2016–2035), which is lower than that of the 5% to 95% models. This is because scientific knowledge is insufficient for the influence of these factors on longer-term projections to be quantified.
d The calculations are based on projections derived from models whose ranges of results fall between 5% and 95% of the results distribution. Evaluation is then carried out and the probable range obtained after taking account of other uncertainties or different levels of confidence in the models. The confidence level for the projections of the average global rise in sea level is medium for both time horizons.
Moreover, in all projected scenarios except the one that assumes aggressive mitigation measures (RCP2.6), an average temperature increase over the pre-industrial era (1750) of over 1.5 °C, and very probably over 2 °C,

44 Economic Commission for Latin America and the Caribbean (ECLAC)
is expected by the end of the century.4 The current emissions pathway is close to the RCP8.5 scenario, which is associated with an increase greater than or equal to 4 °C (World Bank, 2013). If this tendency continues, therefore, it seems inevitable that the temperature will rise by 2 °C by the middle of the twenty-first century (Vergara and others, 2013), which will make it difficult to achieve the goal of complying with the United Nations Framework Convention on Climate Change (UNFCCC) and the Paris Agreement.
These projections indicate a high likelihood of the frequency of extreme high temperatures increasing and that of extreme cold temperatures decreasing (ECLAC, 2015a; IPCC, 2013a). Towards the end of the century, this will be accompanied by changes in the intensity and frequency of extreme precipitation phenomena (IPCC, 2013a). In addition, the global intensity of tropical cyclones is likely to increase, although uncertainty persists as to how their frequency will evolve. Arctic ice cover and the size of glaciers will continue to decline (IPCC, 2013a), and sea levels will continue to rise, more quickly indeed than in 1971–2010 (IPCC, 2013a), so that increases of between 24 cm and 30 cm and between 40 cm and 63 cm are expected by the middle and end of the twenty-first century, respectively.
The changes are also evident in Latin America and the Caribbean. It is observed that the average temperature from 2000–2016 was 0.7%, higher than the average from 1901–19905 and that extreme weather events, such as droughts and floods, have become more frequent (IPCC, 2012; Magrin and others, 2007 and 2014; Wang and others, 2014).
According to the climate projections for the most optimistic emissions scenario (RCP2.6), the temperature will increase by an average of about 1 °C by 2100 relative to 1986–2005 in all the subregions of Latin America and the Caribbean. Climate projections suggest, with a medium level of confidence, that temperatures will rise by between 1.6 °C and 4 °C in Central and South America. The level of precipitation in Central America is projected to change by between -22% and 7% by the end of the twenty-first century.
4 The Fifth Assessment Report of the Intergovernmental Panel on Climate Change (IPCC) presented the following scenarios: one where mitigation processes result in a very low level of radiative forcing (RCP2.6); two stabilization scenarios (RCP4.5 and RCP6.0); and one scenario with very high levels of greenhouse gases (RCP8.5). RCP2.6 shows an emissions pathway that leads to very low levels of greenhouse gas concentrations, with emissions peaking and then gradually declining until a substantial reduction is achieved. Scenarios RCP4.5 and RCP6.0 show radiative forcing stabilizing after 2100, while scenario RCP8.5 is characterized by a progressive increase in greenhouse gas emissions, which reach a high concentration. Radiative forcing is the effect of the heat retention of each substance in the atmosphere and thus of the respective combination of gases in the atmosphere. The IPCC uses the term radiative forcing to denote an externally imposed perturbation in the radiative energy budget (the total available) of the Earth’s climate. In the scenarios, which are called representative concentration pathways (RCPs), the total radiative forcing by 2100 relative to 1750 is approximately calculated: 2.6 W/m2 in the case of RCP2.6; 4.5 W/m2 in RCP4.5; 6.0 W/m2 in RCP6.0; and 8.5 W/m2 in RCP8.5.
5 Estimated by the authors based on data from the World Bank Climate Change Knowledge Portal.

The climate emergency in Latin America and the Caribbean... 45
Projections for South America are heterogeneous and the level of confidence is low. For example, it is estimated that rainfall will decrease by 22% in north-eastern Brazil and increase by 25% in south-eastern South America.
In addition, climate phenomena such as the intertropical convergence zone, the North and South American monsoon system, El Niño-Southern Oscillation, Atlantic Ocean oscillations and tropical cyclones occur in Latin America and the Caribbean (IPCC, 2013a and 2013b). In this context, annual precipitation has increased in south-eastern South America,6 parts of the Plurinational State of Bolivia and north-eastern Peru and Ecuador and decreased in central-southern Chile, north-eastern Brazil, southern Peru and parts of Central America and Mexico (IPCC, 2012 and 2013a; Magrin and others, 2007 and 2014). Likewise, glaciers retreated significantly during the second half of the twentieth century (IPCC, 2012 and 2013a; Magrin and others, 2007 and 2014). For more detailed information, see annex A1, which provides annual projections for temperature and precipitation in Latin America and the Caribbean, divided into the following subregions: Central America and Mexico, the Caribbean, the Amazon, north-eastern Brazil, the west coast of South America and south-eastern South America.
B. Greenhouse gas emissions
As already noted, anthropogenic activities are the essential cause of global warming.7 Concentrations of CO2 increased from 280 parts per million (ppm) in the pre-industrial era (1750) to about 407 ppm in 2018 (Tans and Keeling, 2014; IPCC, 2013a; NOAA, 2016). In 2016, global greenhouse gas emissions were 50 Gt of CO2 eq;8 Latin America and the Caribbean emitted 4.2 Gt of CO2 eq that year, giving the region an 8.3% share of total emissions (see figure I.3). The region’s emissions increased considerably from the mid-nineteenth century to 1992, the year the United Nations Framework Convention on Climate Change (UNFCCC) was adopted. The emissions growth rate has eased since then, and the post-Kyoto period (since 2012) has had the lowest emissions growth rate so far (see figure I.4).
6 South-eastern South America covers south-east Brazil and the centre-east area of Argentina, plus Uruguay and Paraguay.
7 The Intergovernmental Panel on Climate Change (IPCC) began to document the evolution of global warming in the 1980s, and it was in the Fifth Assessment Report that it finally attributed this unequivocally to the burning of fossil fuels and land use change. For specific confidence levels, see IPCC (2013a and 2013b).
8 See Gütschow, J. and others (2016) and FAO (2019) for more information on emissions from land use change.

46 Economic Commission for Latin America and the Caribbean (ECLAC)
Figure I.3 Latin America and the Caribbean and the world: greenhouse
gas emissions, 1990–2016(Gigatons of CO2 equivalent)
A. World
0
10
20
30
40
50
60
EnergyAgriculture and livestockIndustrial processesLand use change and forestryWasteOther
1990 1992 1994 1996 1998 2000 2002 2004 2006 2008 2010 2012 2014 2016
B. Latin America and the Caribbean
0
0.5
1.0
1.5
2.0
2.5
3.0
3.5
4.0
4.5
5.0
1990 1992 1994 1996 1998 2000 2002 2004 2006 2008 2010 2012 2014 2016
EnergyAgriculture and livestockIndustrial processesLand use change and forestryWasteOther
Source: Economic Commission for Latin America and the Caribbean (ECLAC), on the basis of J. Gütschow and others, “The PRIMAP-hist national historical emissions time series”, Earth System Science Data, vol. 8, No. 2, Göttingen, Copernicus Publications, 2016; and Food and Agriculture Organization of the United Nations (FAO), Corporate Database for Substantive Statistical Data (FAOSTAT) [online] http://www.fao.org/faostat/en/.

The climate emergency in Latin America and the Caribbean... 47
Figure I.4 Growth in global greenhouse gas emissions, 1850–2016
(Percentages)
Agriculture and livestock Energy Industrial processes Waste Total
1.6
0.3
1.1
0.7
0.3
3.2
1.2
2.4
2.0
0.4
3.3
2.2
3.12.9
1.7
1.8
1.5
1.0
1.4
0.9
2.5
1.1
2.21.9
0.5
0
0.5
1.0
1.5
2.0
2.5
3.0
3.5
1850-1992 1992-1997 1997-2007 2007-2012 2012-2016
Source: Economic Commission for Latin America and the Caribbean (ECLAC), on the basis of J. Gütschow and others, “The PRIMAP-hist national historical emissions time series”, Earth System Science Data, vol. 8, No. 2, Göttingen, Copernicus Publications, 2016; and Food and Agriculture Organization of the United Nations (FAO), Corporate Database for Substantive Statistical Data (FAOSTAT) [online] http://www.fao.org/faostat/en/.
In this context, the emissions of Latin America and the Caribbean have four salient characteristics that should be considered (ECLAC, 2014a):
(a) Fundamental asymmetry. As will be discussed in detail in the next chapter, although the total emissions of the Latin American and Caribbean region account for 8.3% of global emissions, a percentage similar to its share of the world’s population and gross domestic product (GDP), it is particularly vulnerable to the impact of climate change.
(b) The structure of emissions. The structure of the region’s emissions is different from that of global emissions. Whereas 70% of the world’s emissions come from the energy sector, the energy sector share in the region is 45% and that of agriculture and livestock is 23% (see figure I.5). The fact that 19% of emissions in Latin America and the Caribbean originate from changes in land use indicates that there is significant scope for mitigation in respect of deforestation there.
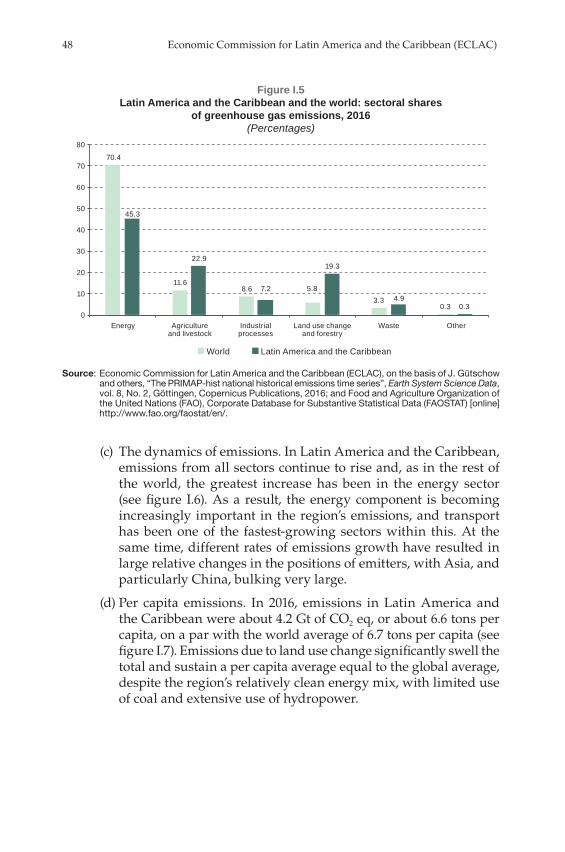
48 Economic Commission for Latin America and the Caribbean (ECLAC)
Figure I.5 Latin America and the Caribbean and the world: sectoral shares
of greenhouse gas emissions, 2016(Percentages)
70.4
11.68.6 5.8
3.30.3
45.3
22.9
7.2
19.3
4.90.3
0
10
20
30
40
50
60
70
80
Energy Agricultureand livestock
Industrialprocesses
Land use changeand forestry
Waste Other
World Latin America and the Caribbean
Source: Economic Commission for Latin America and the Caribbean (ECLAC), on the basis of J. Gütschow and others, “The PRIMAP-hist national historical emissions time series”, Earth System Science Data, vol. 8, No. 2, Göttingen, Copernicus Publications, 2016; and Food and Agriculture Organization of the United Nations (FAO), Corporate Database for Substantive Statistical Data (FAOSTAT) [online] http://www.fao.org/faostat/en/.
(c) The dynamics of emissions. In Latin America and the Caribbean, emissions from all sectors continue to rise and, as in the rest of the world, the greatest increase has been in the energy sector (see figure I.6). As a result, the energy component is becoming increasingly important in the region’s emissions, and transport has been one of the fastest-growing sectors within this. At the same time, different rates of emissions growth have resulted in large relative changes in the positions of emitters, with Asia, and particularly China, bulking very large.
(d) Per capita emissions. In 2016, emissions in Latin America and the Caribbean were about 4.2 Gt of CO2 eq, or about 6.6 tons per capita, on a par with the world average of 6.7 tons per capita (see figure I.7). Emissions due to land use change significantly swell the total and sustain a per capita average equal to the global average, despite the region’s relatively clean energy mix, with limited use of coal and extensive use of hydropower.

The climate emergency in Latin America and the Caribbean... 49
Figure I.6 Latin America and the Caribbean: greenhouse gas emissions,
1990, 2000 and 2016
A. Latin America and the Caribbean: greenhouse gas emissionsby sector, 1990, 2000 and 2016
(gigatons of CO2 equivalent)
0.8
1.0
0.10.1
0.9
1.3
0.2 0.1
1.0
1.9
0.3
0.2
0
0.2
0.4
0.6
0.8
1.0
1.2
1.4
1.6
1.8
2.0
Agricultureand livestock
Energy Industrialprocesses
Waste
B. Latin America and the Caribbean: CO2 emissions by the energy sector, 1990, 2000 and 2016
(megatons of CO2 )
107
278
135 157
287
132
381
171
266
396
159
434
230
455
588
0
100
200
300
400
500
600
700
Buildings Other industrialfuel burning
Other sectors Electricitygeneration
industry
Transport
1990 2000 2016
Source: Economic Commission for Latin America and the Caribbean (ECLAC), on the basis of J. Gütschow and others, “The PRIMAP-hist national historical emissions time series”, Earth System Science Data, vol. 8, No. 2, Göttingen, Copernicus Publications, 2016; M. Muntean and others, Fossil CO2 Emissions of All World Countries: 2018 Report, Luxembourg, European Commission, 2018.

50 Economic Commission for Latin America and the Caribbean (ECLAC)
Figure I.7 Latin America and the Caribbean: greenhouse gas emissions per capita, 2016
(Tons of CO2 equivalent per inhabitant)
0.31.31.52.02.12.32.63.13.13.13.23.74.44.64.75.15.15.35.75.86.06.67.0
8.99.89.911.3
12.512.6
16.829.9
46.763.6
6.76.6
0 10 20 30 40 50 60 70Chile
Costa RicaHaiti
Dominican Rep.El Salvador
HondurasGuatemala
Saint Vincent and the GrenadinesCuba
GrenadaNicaragua
JamaicaSaint Lucia
DominicaEcuador
ColombiaSaint Kitts and Nevis
BarbadosMexico
PeruPanama
BrazilAntigua and Barbuda
UruguayBahamasArgentina
Venezuela (Bol. Rep. of)Belize
SurinameBolivia (Plur. State of)
ParaguayGuyana
Trinidad and Tobago
WorldLatin America and the Caribbean
Source: Economic Commission for Latin America and the Caribbean (ECLAC), on the basis of J. Gütschow and others, “The PRIMAP-hist national historical emissions time series”, Earth System Science Data, vol. 8, No. 2, Göttingen, Copernicus Publications, 2016; Food and Agriculture Organization of the United Nations (FAO), Corporate Database for Substantive Statistical Data (FAOSTAT) [online] http://www.fao.org/faostat/en/.
From the dynamic point of view, there are various greenhouse gas emission or concentration scenarios that can be used to construct climate change projections (ECLAC, 2015a). The Fifth Assessment Report of the IPCC (2013a) considers the following scenarios: one where mitigation leads to a very low level of radiative forcing (RCP2.6), two stabilization scenarios (RCP4.5 and RCP6.0) and a scenario with very high levels of greenhouse gases (RCP8.5) (see figure I.8).
Each pathway analysed by the IPCC involves a relationship between the concentration of greenhouse gases (the stock deposited in the atmosphere), expressed in parts per million, and the likelihood that the temperature will rise and other climate alterations will occur (see table I.2). The most optimistic scenario, RCP2.6, entails a concentration of greenhouse gases, or CO2 equivalent, of 475 parts per million. This concentration would lead to a temperature increase of more than 1 °C in 94% of climate models, 1.5 °C in 56% and 2 °C in 22%. With thermal accumulation of close to 1 °C estimated in 2015 compared to 1961–1990, emissions in the coming years are expected to further transform the climate system.

The climate emergency in Latin America and the Caribbean... 51
Figure I.8 Global emissions of CO2, 2000–2100
(Gigatons of CO2 per year)
-5 000
0
5 000
10 000
15 000
20 000
25 000
30 000
35 000
2000 2020 2040 2060 2080 2100
RCP8.5 RCP6.0 RCP4.5 RCP2.6
Source: Economic Commission for Latin America and the Caribbean (ECLAC), on the basis of C. Le Quéré and others, “Global carbon budget 2014”, Earth System Science Data, vol. 7, Göttingen, Copernicus Publications, 2015; P. Kolp and K. Riahi, RCP Database, 2009 [online] http://www.iiasa.ac.at/web-apps/tnt/RcpDb.
Note: RCP stands for representative concentration pathway.
Table I.2 Global warming scenarios: proportion of climate models whose projections
exceed the annual average temperature increase in the period 2081–2100 relative to 1850–1900a
(Percentages)
Scenario
Combined concentration ofCO2, CH4 and N2O in 2100
(parts per million of CO2 equivalent)
ΔT>+1.0 °C ΔT>+1.5 °C ΔT>+2.0 °C ΔT>+3.0 °C ΔT>+4.0 °C
RCP2.6b 475 94 56 22 0 0
RCP4.5 630 100 100 79 12 0
RCP6.0 800 100 100 100 36 0
RCP8.5 1 313 100 100 100 100 62
Source: Economic Commission for Latin America and the Caribbean (ECLAC), on the basis of Intergovernmental Panel on Climate Change (IPCC), Climate Change 2013: The Physical Science Basis. Contribution of Working Group I to the Fifth Assessment Report of the Intergovernmental Panel on Climate Change, T. Stocker and others (eds.), Cambridge, Cambridge University Press, 2013.
a The projections are for the global models of the fifth phase of the Coupled Model Intercomparison Project (CMIP5).
b RCP stands for representative concentration pathway.
At the outer end of the IPCC radiative forcing scenarios (2013b), a temperature increase of between 1.7 °C and 4.8 °C is envisaged by the end of the century if business as usual continues. Other climate alterations are also expected, such as an average sea level rise of between 40 cm and 63 cm.

52 Economic Commission for Latin America and the Caribbean (ECLAC)
Similarly, projections indicate that the world’ s glaciers will shrink by 15% to 55% by the end of the twenty-first century in the RCP2.6 scenario and by 35% to 85% in the RCP8.5 scenario, and that precipitation patterns will probably intensify (IPCC, 2013a).
The climate and greenhouse gas emissions scenarios show, with some degree of uncertainty, that stabilizing the climate at a temperature increase of no more than 2 °C would mean reducing greenhouse gas emissions from the 47 Gt of CO2 eq emitted in 2016 to 24 Gt of CO2 eq by 2030 (see figure I.9). This would mean reducing emissions of CO2 equivalent per capita from almost seven tons, which is what is currently emitted, to about three tons by 2030, given the approximately 7 billion inhabitants the planet has at present and the 8.5 billion projected for 2030. The challenge, therefore, is to move from approximately seven tons to three tons per capita in a decade, while maintaining or increasing the pace of economic growth. This would imply that the infrastructure that is currently being built and will be in use by 2030 must be compatible with economies that generate low CO2 emissions.
Figure I.9 Global greenhouse gas emissions under different scenarios and the emissions gap by 2030
(Gigatons of CO2 equivalent)
Gt CO2 eq
Gt CO2 eq
202015 2020 2025 2030
30
40
50
60
70
This area shows pathways limiting global temperature increase to below 2 °C by 2100 with about 66% chance
This area shows pathways limiting global temperature increase to below 1.5 °C by 2100 with about 66% chance
No policy baseline
Conditional nationally determined contributions scenario
Remaining gap to stay within 2 °C limit
Median estimate of level consistent with 2 °C: 40 Gt of CO2 eq (range 38 to 45)
Remaining gap to stay within 1.5 °C limit
Median estimate of level consistent with 1.5 °C: 24 Gt of CO2 eq (range 22 to 30)
Current policy scenarioUnconditional nationally determinedcontributions scenario
13
1532
Gt CO2 eq
Gt CO2 eq 29
2 °C range
1.5 °C range
Source: United Nations Environment Programme (UNEP), Emissions Gap Report 2018, Nairobi, 2018.

The climate emergency in Latin America and the Caribbean... 53
The agreement reached at the Conference of the Parties to the United Nations Framework Convention on Climate Change in 2015 was a significant step forward, but insufficient to meet the challenge of climate change. The countries of Latin America and the Caribbean presented their nationally determined contributions (NDCs) at the Conference of the Parties in Paris and ratified their commitments during 2016 (see table I.3). The NDCs include mitigation and adaptation targets across a broad range of economic sectors and activities and in some cases call for early action (before 2020). They also include sectoral targets and, in some countries, even specify possible public policy instruments and certain market mechanisms that could be used. In addition, a distinction is often made between unconditional targets (objectives to be achieved using the country’s own resources) and conditional targets (to be achieved if additional resources are forthcoming)9. Given that targets to stabilize temperature at an increase of no more than 2 °C imply a significant reduction in global greenhouse gas emissions between 2020 and 2030, the effort committed to in the NDCs is insufficient to stabilize climate conditions (UNEP, 2018). For this reason, it is necessary for the targets set to be raised in future rounds or reviews (Black-Arbeláez, 2018).
Box I.1 shows the main outcomes of the twenty-fifth session of the Conference of the Parties, held in Madrid.
Box I.1 The state of international negotiations under the Paris Agreement
and related progress
At the twenty-fifth session of the Conference of the Parties to the United Nations Framework Convention on Climate Change (COP 25), held in Madrid in 2019, the main points dealt with were as follows:
• Greater ambition when nationally determined contributions (NDCs) are reviewed;• Inclusion of the oceans and sectors such as electric mobility and the circular
economy in the negotiations;• The agreement on carbon markets and their accounting rules (Paris Agreement
article 6); • Revision of the Warsaw International Mechanism for Loss and Damage Associated
with Climate Change Impacts; • The gender action plan;• Response measures;• Capacity-building arrangements;• The enhanced transparency framework for action and support established at
COP 21 and its reporting format.
9 Nationally determined contributions (NDCs) represent the commitments and initiatives adopted by each of the countries vis-à-vis the international community under the United Nations Framework Convention on Climate change (UNFCCC). The aim of these commitments and initiatives is to reduce greenhouse gas emissions and keep the increase in the average global temperature below 2 °C or even 1.5 °C relative to the pre-industrial era, taking into consideration national circumstances, implementation strategies, monitoring mechanisms and information availability (UNFCCC, 2016).
54 Economic Commission for Latin America and the Caribbean (ECLAC)
The main advances will now be summarized:
Ambition: A growing number of low-emission countries are supporting the goal of carbon neutrality by 2050 as part of the Climate Ambition Alliance. Countries also showed their ambition with their updated NDCs for 2020. Ten countries in Latin America and the Caribbean (Chile, Colombia, Costa Rica, the Dominican Republic, Ecuador, Guatemala, Haiti, Honduras, Paraguay and Peru) made a commitment to generate 70% of their electricity from renewable sources by 2030, an initiative presented by Colombia. The European Commission announced the European Green Deal, whose main objective is to make the European Union climate-neutral. As for the large carbon emitters, they are not showing a great level of ambition. As climate culture increases, so negotiations are becoming increasingly decoupled from social demands. Social urgency is not being reflected in the level of ambition and the dynamics of discussions on the Paris Agreement. The Parties to the United Nations Framework Convention on Climate Change (UNFCCC) made significant progress on the technical documents that will enable progress to be made in the run-up to the twenty-sixth session of the Conference (COP 26), which will be held in Glasgow (United Kingdom) in 2020. The consensus regime means that negotiating issues are at the mercy of shifting agendas and progress cannot be made in areas that should be of common interest. However, the importance of science for making key decisions on innovation, technology transfer, capacity-building and nature-based solutions, as well as for more ambitious, rapid and effective climate action, is recognized.
Sectoral issues: The Latin American States recognize their strategic role in nature-based solutions, given that they are home to several of the world’s most important coastal, mountain, forest and water systems. On Chile’s initiative, the issue of oceans and land use was addressed at COP 25. At the session dedicated to agriculture and forests, the Latin American and Caribbean Platform for Climate Action in Agriculture (PLACA) was launched; nine countries of the region joined it and the first meeting will take place in March 2020. At the session dealing with energy, the ministers of Chile and Colombia established the regional target for Latin America and the Caribbean of obtaining 70% of energy from renewable sources by 2030. A session was also devoted to transport. Progress was made in mainstreaming climate action into all production sectors so that they would become part of the solution. A coalition of finance ministers from 51 countries representing 30% of global GDP launched an action plan to address climate change. Recognition of the vulnerability of African countries led to tension over the possibility that it would skew the flow of financial resources by underplaying the vulnerability of other regions of the world. The project to support the strengthening of the designated national Green Climate Fund authorities for Argentina, Costa Rica, Cuba, El Salvador, Guatemala, Honduras, Nicaragua, Panama, Paraguay and Uruguay through the United Nations Environment Programme (UNEP) was presented. This project will help to identify and address the main barriers to electric mobility, through assessments and creation of the necessary capacities, as well as the provision of financing alternatives to accelerate the adoption of electric mobility technology.
Financing: Only US$ 10 billion out of US$ 100 billion is available for the Green Climate Fund. Moreover, part of this Fund is being delivered in the form of credit, thus diminishing its status as an international transfer mechanism. It is expected that by COP 26 there will be more mandates (as a fund-raising mechanism), and that the discussion on long-term financing will include a new collective goal of mobilizing funding of more than $100 billion per year. This will be done in the framework of the Conference of the Parties, and will no longer include only the developed countries listed in annex I of the United Nations Framework Convention on Climate Change (UNFCCC) as donors, but will also include countries at an intermediate level of development. Contributions to the Adaptation Fund were renewed, but its source of funding, the Clean Development Mechanism (CDM) fee, expired. Funding based on internationally transferred mitigation outcomes was not accepted. There is a shortfall in mandates associated with adaptation: there were no applications at previous sessions of the Conference. There is no mechanism for funding losses and damage, nor is there funding for the gender plan. Besides, the real economic and financial discussion takes place outside the Framework Convention on Climate Change.
Box I.1 (continued)

The climate emergency in Latin America and the Caribbean... 55
Transparency in the presentation of progress reports: No progress has been made in this area. Another attempt will be made at the United Nations Climate Change Conference, to be held in Bonn in June 2020, with the aim of adopting a decision in the run-up to COP 26. The Latin American and Caribbean countries support the use of common tabular formats, provided that training is provided for their completion and for the audit process, as they are highly technical.
Losses and damage: The Warsaw International Mechanism, which supports those most vulnerable to climate change, was renewed. In this area, the Santiago Network for Averting, Minimizing and Addressing Loss and Damage was created with the aim of catalysing technical support to deal with the effects and building capacity in the most vulnerable countries. Decisions about the governance of the Warsaw International Mechanism and its financing were left pending.
Non-State actors: Local governments are showing greater ambition than national ones, as they gain large co-benefits from climate action; however, they are not part of the UNFCCC, and their contribution is subsumed in the national effort. The countries of the Independent Association for Latin America and the Caribbean (AILAC), together with Argentina and Uruguay, have expressed interest in addressing climate action at the local level, involving cities and the private sector more in their climate goals. The Global Climate Action Agenda, aimed at promoting and implementing climate action by non-State actors such as local governments and businesses, was extended for five more years. An extension of the Marrakech Partnership for Global Climate Action climate training and participation programme was agreed. This is an opportunity to generate social consensuses over the level of national and international ambition. The minimum funding for training will be of the order of some thousands of dollars. There is a deficit of mandates related to this area.
The gender action plan: The enhanced Lima work programme on gender and its gender action plan were approved for 5 years, with extensive participation by Mexico, Costa Rica and Peru, and will be revised in 2022. The plan pays special attention to the implementation and scaling up of fair climate solutions from a gender perspective. It will strengthen the role and empowerment of women in their respective local communities, providing them with tools to better address climate change. It is innovative in establishing a central link between the human rights agenda and the different types of discrimination suffered by women because of their gender. It was agreed, within this framework, to organize a technical workshop on gender, to create a formal network of women negotiators in the UNFCCC process and to hold a high-level event on gender justice for climate change and biodiversity. There is no funding agreement for the gender action plan, but there is a commitment to achieve it. Better collection of data and improved use of policy tools (such as gender budgeting) were urged. The work of the gender action plan will extend beyond the United Nations.
Markets (Paris Agreement article 6): There were advances with the technical documents that will allow progress to be made in the run-up to COP 26; however, there is no agreement on markets, so private international financing is uncertain. It is possible that de facto solutions will come from transactions, even in the absence of a negotiated framework. Interests differ greatly between countries with lower and higher mitigation costs, making consensus agreements difficult. There is a persistent culture in the developed world of outsourcing efforts to developing countries, using arguments of environmental integrity, while developing countries are arguing for the need to maintain the integrity of certificates that reflect past mitigation efforts, as well as their contractual relationships. The effort to reconcile the economic integrity of past efforts with climate ambition is thus becoming fraught, in a context where mitigation targets are insufficient in themselves and insignificant if the validity of certificates issued during the stage of the Kyoto Protocol to the United Nations Framework Convention on Climate Change is upheld. The discussion thus veers between raising the ambition of the targets and invalidating past reduction certificates, with all the attendant economic costs. Costa Rica proposed the San José Principles for High Ambition and Integrity in International Carbon Markets, under which the reductions considered under the Kyoto Protocol would be eliminated. Several Latin American countries signed up to them, but Brazil, Chile and Mexico did not. Several European States also rejected this option.
Source: Prepared by the authors.
Box I.1 (concluded)

56 Economic Commission for Latin America and the Caribbean (ECLAC)
Tabl
e I.3
N
atio
nally
det
erm
ined
con
trib
utio
ns (N
DC
s) in
the
coun
trie
s of
Lat
in A
mer
ica:
unc
ondi
tiona
l and
con
ditio
nal t
arge
ts fo
r gre
enho
use
gas
redu
ctio
ns, r
efer
ence
yea
rs a
nd h
igh-
prio
rity
sect
ors
for m
itiga
tion
and
adap
tatio
n
Energy
Agricultu
re
Land use change
and silviculture
Biodiversity
Forestry
Manufacturing
Water resources
Coastal zones
Health
Tourism
TransportWaste
Infrastru
cture
Risk management
Housing
Mitig
ation
Adap
tatio
n Citie
s
Unconditional ta
rget
(perce
ntages
) Conditional ta
rget
(perce
ntages
) Year set fo
r attainment of target
Comparative sc
enario
Arge
ntina
Boliv
ia (P
lur. S
tate
of
Braz
il
Chile
Colom
bia
Costa
Rica
Cuba
Ecua
dor
El S
alvad
or
Guat
emala
Hond
uras
Mex
ico
Pana
ma
Para
guay
Peru
Dom
inica
n Rep
.
Urug
uay
Vene
zuela
(Bol.
Rep
. of)
Busin
ess a
s usu
al20
30
2010
2005
leve
lsEm
ission
s per
unit
of G
DP o
f 200
7Bu
sines
s as u
sual
Busin
ess a
s usu
al
Actio
n-ba
sed
Busin
ess a
s usu
al
2010
Busin
ess a
s usu
al(1
995-
2012
)Bu
sines
s as u
sual
(201
3)
Actio
n-ba
sed
Busin
ess a
s usu
al (2
000)
Busin
ess a
s usu
al (2
010)
Busin
ess a
s usu
al (2
010)
Busin
ess a
s usu
al (1
990)
Busin
ess a
s usu
al (2
011)
2025
2025
2025
2030
2030
2030
2030
2030
2030
2030
2030
2030
2030
2030
15 37
30
30 2030
44 11,2
22,6
20-2
5
25-40
38-45
.8
2025101015
25 10 20
35-4
5
Busin
ess a
s usu
al
So
urce
: A
Bár
cena
and
oth
ers
(coo
rds.
), E
cono
mic
s of
clim
ate
chan
ge in
Lat
in A
mer
ica
and
the
Car
ibb
ean:
a g
rap
hic
view
(LC
/TS
.201
7/84
/Rev
.1),
San
tiago
, Eco
nom
ic
Com
mis
sion
for
Latin
Am
eric
a an
d t
he C
arib
bea
n (E
CLA
C),
2018
.
Chapter II
The effects of climate change in the region
There are four characteristics of climate change that hinder efforts towards a solution, particularly in developing countries, and most of all in Latin America and the Caribbean (ECLAC, 2015a).
(i) The time paradox. Climate change is a process whose full effects manifest themselves in the long run. Even if present effects are difficult to identify, however, there is increasing awareness that the solution requires immediate action involving simultaneous mitigation and adaptation.
(ii) The fundamental asymmetry between emissions and vulnerability. Overall emissions in Latin America and the Caribbean account for only 8.3% of the global total,1 but at the same time the region’s geographical, climatic, socioeconomic and demographic characteristics make it particularly vulnerable to the impacts of climate change (ECLAC, 2015c). One example is the great sensitivity of its natural assets, such as forests and biodiversity, to this change. Estimates put the economic costs of climate change in the region at between 1.5% and 5% of current regional gross domestic product (GDP) by 2050, adding together the effects of losses in agriculture and hydroelectric generation, disease vectors,
1 Although the level of regional emissions is low by comparison with global emissions, their local importance is very great because greenhouse gas emissions from the burning of fossil fuels are associated with emissions of other pollutants harmful to health. As will be seen later, this burden of pollution is severe in many cities of Latin America and the Caribbean.

58 Economic Commission for Latin America and the Caribbean (ECLAC)
extreme events and other destructive factors.2 This impact is non-linear and varies from subregion to subregion and period to period (positive effects can even be expected for some periods in the south of the Southern Cone).
(iii) Inequality within countries. There is also asymmetry at the national level which, in combination with that discussed in the previous point, results in a twofold inequality. The poor are generally most vulnerable to the negative impacts of climate change, while their contribution to greenhouse gas emissions within a given country is lower than that of higher-income groups. This is the result of segmented and highly differentiated fossil fuel consumption patterns.
(iv) The inevitability and urgency of adaptation. Given the increased frequency of extreme weather events and the pathway of greenhouse gas emissions in a business as usual scenario towards a probable temperature increase of at least 2 °C during the twenty-first century, adaptation processes must inevitably be implemented to reduce the expected harm. However, adaptation has limits, faces barriers and can be inefficient, and there will be residual and in some cases irreversible damage in the future, as well as additional costs. Adaptation can entail measures that improve social and environmental conditions in the region, such as restraining deforestation, protecting biodiversity, enhancing the resilience of economic activities and protecting critical infrastructure (ECLAC, 2015a). This very inevitability should be treated as a driver of more sustainable development.
A. Some consumption patterns and climate change
The Latin American economy was highly dynamic during the commodity price boom, with an average annual GDP growth rate of 3.0% between 1990 and 2015, yielding an average per capita GDP growth rate of 1.6% for those years. This rapid growth, together with the implementation of important social policies, helped to lift a significant part of the population out of poverty. The poverty rate fell from 48.4% to 29.2% between 1990 and 2015 (ECLAC, 2016). Growth and poverty reduction have led to the formation of new low- and middle-income groups in Latin America and the Caribbean, some of which remain highly vulnerable to macroeconomic or climate shocks, as their income is just 1.8 times the poverty line (see figure II.1).
2 This cost may be an underestimate, as it includes only some sectors and does not incorporate all potential effects or take account of feedback and adaptation processes.

The climate emergency in Latin America and the Caribbean... 59
Figure II.1 Latin America and the Caribbean (18 countries): groups vulnerable to poverty,
by income level, 2012-2017a
(Percentages)
0
10
20
30
40
50
60
70
80
90
100
Uru
guay
(201
7)
Chi
le(2
017)
Cos
ta R
ica
(201
7)
Pana
ma
(201
7)
Sai
nt L
ucia
(201
6)
Bra
zil
(201
7)
Para
guay
(201
7)
Dom
inic
an R
ep.
(201
6)B
oliv
ia(P
lur.
Sta
te o
f)(2
017)
Ecua
dor
(201
7)
Peru
(201
7)
Col
ombi
a(2
017)
Mex
ico
(201
6)
El S
alva
dor
(201
7)
Nic
arag
ua(2
014)
Gua
tem
ala
(201
4)
Hon
dura
s(2
017)
Hai
ti(2
012)
Not vulnerable Vulnerable to poverty(income 1.8 times US$ 5.5 a day)US$ 5.5 a day poverty lineUS$ 1.9 a day poverty lineUS$ 3.2 a day poverty line
Source: Prepared by the authors, on the basis of World Bank, DataBank [online database] https://databank.worldbank.org/home.aspx.
a Latest figures available.
This economic dynamism and poverty reduction brought new groups of consumers into the consumption structure of the current style of development. Although food is one of the main items of household expenditure (Gamaletsos, 1973; Lluch, Powell and Williams, 1977), the share of food expenditure in total expenditure per decile decreases as incomes rise (see figure II.2), as expressed in Engel’s well-known law (Chai and Moneta, 2010; Lewbel, 2012). This expands opportunities to consume new goods and services, something that is decisive in determining whether or not there is progress towards a more sustainable style of development (ECLAC, 2014a; Galindo and others, 2015).
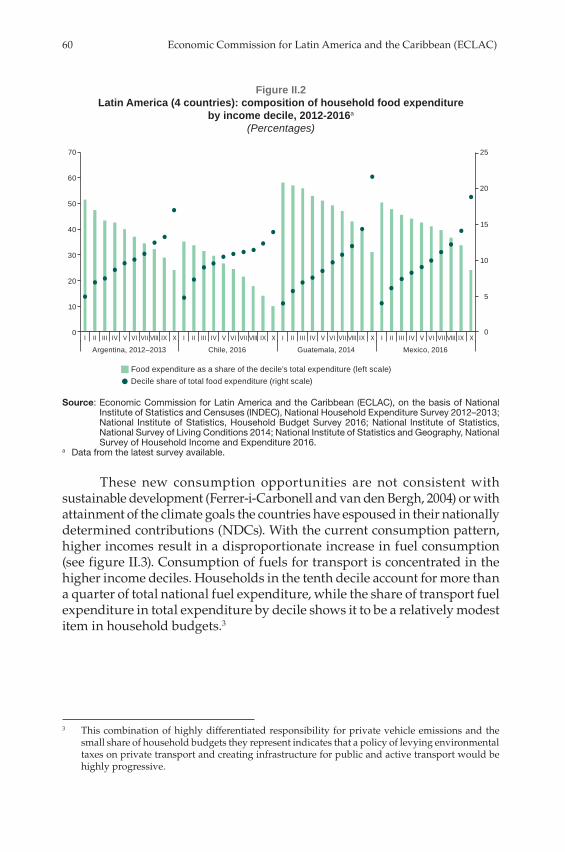
60 Economic Commission for Latin America and the Caribbean (ECLAC)
Figure II.2 Latin America (4 countries): composition of household food expenditure
by income decile, 2012-2016a
(Percentages)
5
0
10
15
20
25
0
10
20
30
40
50
60
70
I II III IV V VI VII VIII IX X I II III IV V VI VII VIII IX X I II III IV V VI VII VIII IX XI II III IV V VI VII VIII IX X
Argentina, 2012–2013 Chile, 2016 Guatemala, 2014 Mexico, 2016
Food expenditure as a share of the decile’s total expenditure (left scale)Decile share of total food expenditure (right scale)
Source: Economic Commission for Latin America and the Caribbean (ECLAC), on the basis of National Institute of Statistics and Censuses (INDEC), National Household Expenditure Survey 2012–2013; National Institute of Statistics, Household Budget Survey 2016; National Institute of Statistics, National Survey of Living Conditions 2014; National Institute of Statistics and Geography, National Survey of Household Income and Expenditure 2016.
a Data from the latest survey available.
These new consumption opportunities are not consistent with sustainable development (Ferrer-i-Carbonell and van den Bergh, 2004) or with attainment of the climate goals the countries have espoused in their nationally determined contributions (NDCs). With the current consumption pattern, higher incomes result in a disproportionate increase in fuel consumption (see figure II.3). Consumption of fuels for transport is concentrated in the higher income deciles. Households in the tenth decile account for more than a quarter of total national fuel expenditure, while the share of transport fuel expenditure in total expenditure by decile shows it to be a relatively modest item in household budgets.3
3 This combination of highly differentiated responsibility for private vehicle emissions and the small share of household budgets they represent indicates that a policy of levying environmental taxes on private transport and creating infrastructure for public and active transport would be highly progressive.
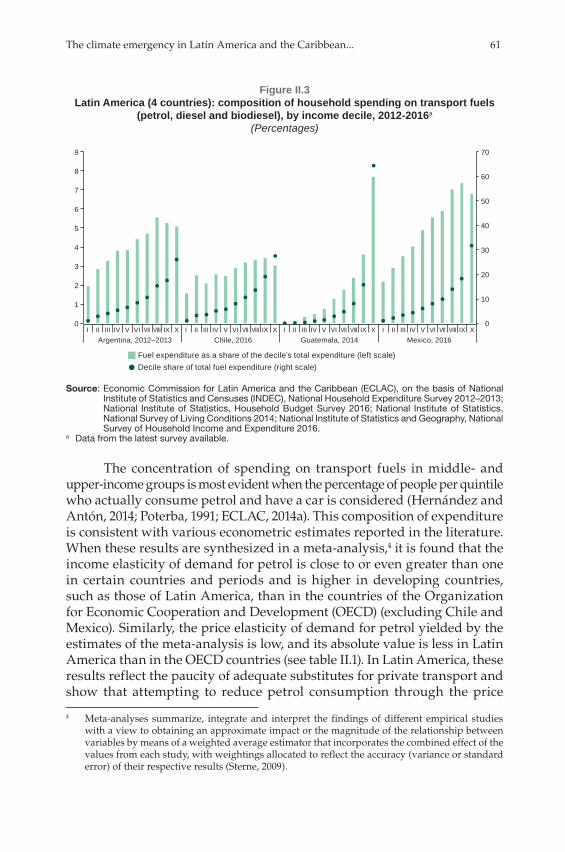
The climate emergency in Latin America and the Caribbean... 61
Figure II.3 Latin America (4 countries): composition of household spending on transport fuels
(petrol, diesel and biodiesel), by income decile, 2012-2016a
(Percentages)
0
10
20
30
40
50
60
70
0
1
2
3
4
5
6
7
8
9
II II III IVIV V VI VII VIII IX X II II III IVIV V VI VII VIII IX X II II III IVIV V VI VII VIII IX X II II III IVIV V VI VII VIII IX XArgentina, 2012–2013 Chile, 2016 Guatemala, 2014 Mexico, 2016
Fuel expenditure as a share of the decile’s total expenditure (left scale)Decile share of total fuel expenditure (right scale)
Source: Economic Commission for Latin America and the Caribbean (ECLAC), on the basis of National Institute of Statistics and Censuses (INDEC), National Household Expenditure Survey 2012–2013; National Institute of Statistics, Household Budget Survey 2016; National Institute of Statistics, National Survey of Living Conditions 2014; National Institute of Statistics and Geography, National Survey of Household Income and Expenditure 2016.
a Data from the latest survey available.
The concentration of spending on transport fuels in middle- and upper-income groups is most evident when the percentage of people per quintile who actually consume petrol and have a car is considered (Hernández and Antón, 2014; Poterba, 1991; ECLAC, 2014a). This composition of expenditure is consistent with various econometric estimates reported in the literature. When these results are synthesized in a meta-analysis,4 it is found that the income elasticity of demand for petrol is close to or even greater than one in certain countries and periods and is higher in developing countries, such as those of Latin America, than in the countries of the Organization for Economic Cooperation and Development (OECD) (excluding Chile and Mexico). Similarly, the price elasticity of demand for petrol yielded by the estimates of the meta-analysis is low, and its absolute value is less in Latin America than in the OECD countries (see table II.1). In Latin America, these results reflect the paucity of adequate substitutes for private transport and show that attempting to reduce petrol consumption through the price
4 Meta-analyses summarize, integrate and interpret the findings of different empirical studies with a view to obtaining an approximate impact or the magnitude of the relationship between variables by means of a weighted average estimator that incorporates the combined effect of the values from each study, with weightings allocated to reflect the accuracy (variance or standard error) of their respective results (Sterne, 2009).
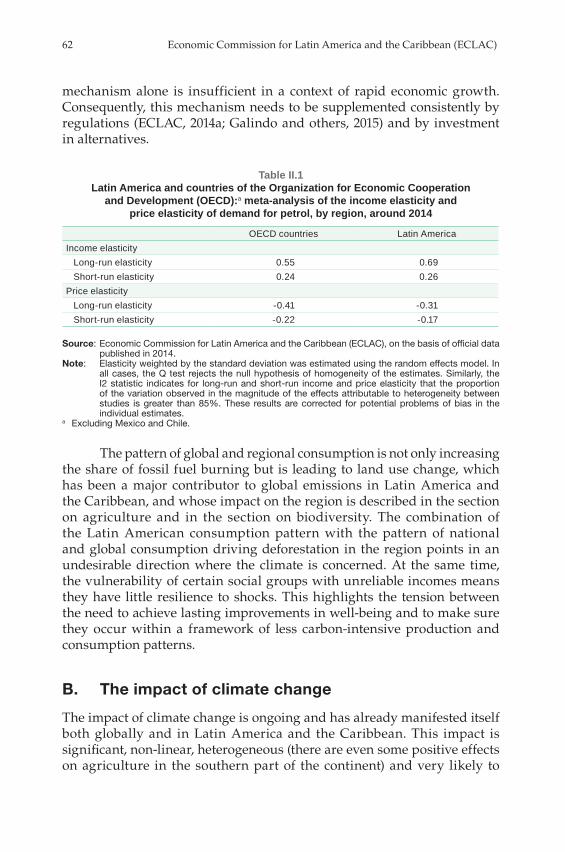
62 Economic Commission for Latin America and the Caribbean (ECLAC)
mechanism alone is insufficient in a context of rapid economic growth. Consequently, this mechanism needs to be supplemented consistently by regulations (ECLAC, 2014a; Galindo and others, 2015) and by investment in alternatives.
Table II.1 Latin America and countries of the Organization for Economic Cooperation
and Development (OECD):a meta-analysis of the income elasticity and price elasticity of demand for petrol, by region, around 2014
OECD countries Latin AmericaIncome elasticity
Long-run elasticity 0.55 0.69Short-run elasticity 0.24 0.26
Price elasticityLong-run elasticity -0.41 -0.31Short-run elasticity -0.22 -0.17
Source: Economic Commission for Latin America and the Caribbean (ECLAC), on the basis of official data published in 2014.
Note: Elasticity weighted by the standard deviation was estimated using the random effects model. In all cases, the Q test rejects the null hypothesis of homogeneity of the estimates. Similarly, the I2 statistic indicates for long-run and short-run income and price elasticity that the proportion of the variation observed in the magnitude of the effects attributable to heterogeneity between studies is greater than 85%. These results are corrected for potential problems of bias in the individual estimates.
a Excluding Mexico and Chile.
The pattern of global and regional consumption is not only increasing the share of fossil fuel burning but is leading to land use change, which has been a major contributor to global emissions in Latin America and the Caribbean, and whose impact on the region is described in the section on agriculture and in the section on biodiversity. The combination of the Latin American consumption pattern with the pattern of national and global consumption driving deforestation in the region points in an undesirable direction where the climate is concerned. At the same time, the vulnerability of certain social groups with unreliable incomes means they have little resilience to shocks. This highlights the tension between the need to achieve lasting improvements in well-being and to make sure they occur within a framework of less carbon-intensive production and consumption patterns.
B. The impact of climate change
The impact of climate change is ongoing and has already manifested itself both globally and in Latin America and the Caribbean. This impact is significant, non-linear, heterogeneous (there are even some positive effects on agriculture in the southern part of the continent) and very likely to

The climate emergency in Latin America and the Caribbean... 63
increase. For example, there is evidence of effects on agriculture, water, biodiversity, the sea level, forests, tourism, health and urban areas (Magrin and others, 2014; ECLAC, 2009 and 2010; Galindo and others, 2014). Estimates from various studies suggest that the impact will increase exponentially as the temperature goes up (Nordhaus and Moffat, 2017), with a rise of between 2 °C and 3 °C reducing global GDP by about 1.5% (see figure II.4), but that it will vary from country to country.
Figure II.4 Impact of climate change on world gross domestic product (GDP), by temperature
range, according to different studies(Percentages of global GDP)
0.4
-0.6
-1.5
-4.4
-6.4-7
-6
-5
-4
-3
-2
-1
0
1
< 1 °C Between 1 °Cand 2 °C
Between 2 °Cand 3 °C
Between 3 °Cand 4 °C
> 4 °C
Temperature rise
Source: Prepared by the authors, on the basis of W. Nordhaus and A. Moffat, “A survey of global impacts of climate change: replication, survey methods, and a statistical analysis”, NBER Working Paper, No. 23646, Cambridge, National Bureau of Economic Research (NBER), 2017.
Studies carried out from 1990 to 2010 put the cost of climate change to Latin America and the Caribbean at between 1.5% and 5% of current GDP if the temperature rises by 2.5°C, something that is likely to occur by about 2050 (Bosello, Carraro and De Cian, 2010). A more recent estimate (Vergara and others, 2014) is of a loss of some 2% of GDP. These estimates contain uncertainties, are not periodic, are conservative, are confined to certain sectors and regions and have a number of methodological limitations, such as difficulties in incorporating adaptation processes, loss of biodiversity and the potential effects of extreme climate events (Stern, 2013; Galindo and others, 2014).
It has been established that, at the global level, there is a non-linear relationship between productivity and temperature: temperatures above 13 °C cause productivity to drop, so that it is estimated that global GDP per capita could be 23% lower by 2100 in a scenario without mitigation

64 Economic Commission for Latin America and the Caribbean (ECLAC)
(Burke, Hsiang and Miguel, 2015). In the case of Latin America and the Caribbean, estimates show that significant adverse effects could materialize in a time frame of just 10 years (see figure II.5). By 2030, for example, it is estimated that per capita GDP in Belize, the Bolivarian Republic of Venezuela, Guyana, Nicaragua and Suriname could be 10% lower than it would be without climate change, with a reduction of over 5% for all the rest of the region’s economies except Argentina, Peru, the Plurinational State of Bolivia and Uruguay. In Chile, GDP is expected to increase (Burke, Hsiang and Miguel, 2015). It is important to mention that the impact estimates concern only the increase in temperature and leave out costs from natural disasters, water availability or losses of agricultural yield, among other factors. By 2050, a greater impact is obviously expected.
Figure II.5 Latin America and the Caribbean (26 countries): projected changes in gross domestic
product (GDP) per capita because of temperature rise, 2030 and 2050a
(Percentages)
-11.0-9.6-8.7-8.6-8.0-7.1
-5.6-12.2
-11.2-10.6
-8.8-8.6-8.4-8.3-8.0-7.9
-10.8-8.0-7.8-6.5
-5.2-4.6
-3.5-3.2-2.5
2.1
-37.4-33.3
-30.8-30.3-28.4
-25.7-21.2
-40.9-37.8
-31.0-30.2-29.5-29.1-28.4-28.1
-28.9-28.1
-24.0-19.4-18.2
-13.5-12.7
-10.77.7
-50 -40 -30 -20 -10 0 10 20NicaraguaHonduras
PanamaEl SalvadorGuatemalaCosta Rica
MexicoSuriname
GuyanaBelize
Dominican Rep.Haiti
CubaBahamas
Saint Vincent and the GrenadinesTrinidad and Tobago
Venezuela (Bol. Rep. of)Paraguay
BrazilColombiaEcuador
Bolivia (Plur. State of)Uruguay
ArgentinaPeruChile
Cen
tral A
mer
ica
and
Mex
ico
The
Car
ibbe
anS
outh
Am
eric
a
2050 2030
-36.0
-36.6
Source: Prepared by the authors, on the basis of M. Burke, S. Hsiang and E. Miguel, “Global non-linear effect of temperature on economic production”, Nature, No. 527, Berlin, Springer, 2015.
a Percentage difference between GDP per capita without climate change and GDP per capita in the pessimistic scenario for temperature rise.
The transmission channels for the impact of climate change are of very different kinds and may include possible collateral or feedback effects (ECLAC, 2015a). Some of these effects are summarized in table II.2.

The climate emergency in Latin America and the Caribbean... 65
Table II.2 Latin America: potential impact and risks of climate change
Impact Key risks Climate drivers
Agriculture Diminished food output and quality, lower incomes and higher prices.
- Rising temperatures and extreme episodes - Erratic precipitation outside the biological range and extreme episodes
- Fertilization owing to increased concentration of CO2
Water Reduced availability of water in semi-arid regions and those depending on glacier melt, and flooding in rural and urban areas as result of extreme precipitation.
- Rising temperature trend - Tendency to drought - Snow cover - Rising precipitation
Biodiversity and forests
Disappearance of forests, coral bleaching, loss of biodiversity and ecosystem services.
- Increased deforestation - Fertilization owing to increased concentration of CO2
- Rising temperature trend - Acidification of oceans
Health Spread of vector-borne diseases at greater heights and latitudes than in their original distribution.
- Higher temperatures - Increased precipitation
Tourism Loss of infrastructure, rising sea level, appearance of invasive species and extreme events in coastal zones.
- Rising sea level - Extreme temperatures - Extreme precipitation and flooding
Poverty Falling incomes for vulnerable populations, especially agricultural incomes, and greater income inequality.
- Rising temperatures and increase in extreme episodes
- Tendency to drought - Precipitation that is erratic or outside crop physiology parameters
Source: Economic Commission for Latin America and the Caribbean (ECLAC), on the basis of Intergovernmental Panel on Climate Change (IPCC), “Central and South America”, Climate Change 2014: Impacts, Adaptation, and Vulnerability. Volume II: Regional Aspects, V. Barros and others (eds.), Cambridge, Cambridge University Press, 2014; L. Galindo and others, “Cambio climático, agricultura y pobreza en América Latina: una aproximación empírica”, Project Documents (LC/W.620), Santiago, Economic Commission for Latin America and the Caribbean (ECLAC), 2014.
C. The effects on agriculture
The agriculture sector’s share of GDP has been declining in the region, dropping from 10% in 1980 to about 4.7% in 2017, although this was a slower rate of reduction than in the rest of the world. Agriculture sector employment as a percentage of the total has also declined, from 19% in 1992 to 14% in 2017,5 although this was slower than the decline in the agriculture sector’s share of GDP and there were differences between countries. The agriculture sector thus acts as a buffer against macroeconomic shocks and their impact on social conditions (ECLAC/ILO/FAO, 2012).
5 The data are from World Bank (2019).
66 Economic Commission for Latin America and the Caribbean (ECLAC)
Agriculture is particularly sensitive to climate and thus to climate change. In Latin America and the Caribbean, the agriculture sector accounted for about 5% of GDP,6 14% of the working population and 29% of regional exports7 in 2017, and some 20% of the population lives in rural areas. Agriculture is also essential for food security, economic dynamism and poverty reduction (Galindo and others, 2014; ECLAC, 2019; World Bank, 2019).
The impact of climate change in Latin America and the Caribbean, acting upon plant and animal physiology, follows an inverted U-shaped relationship between agricultural and livestock output (and hence net income in the sector) and temperature and precipitation. The relationship has different turning points depending on the product type and region, and there is a high degree of uncertainty about the magnitude of the expected impact (see table II.3). There is also a negative relationship between extreme weather events (days of extreme heat or precipitation, droughts, floods or extreme natural events) and agricultural yields, and growing concern about desertification and land degradation, intensified by climate change (IPCC, 2014a; Galindo and others, 2014). This impact also differs by type of production unit, e.g., between irrigated and unirrigated farms (Dinar and Mendelsohn, 2012; Mendelsohn and Dinar, 2009; Massetti and Mendelsohn, 2011; Seo and Mendelsohn, 2007; Mendelsohn, 2007; Kurukulasuriya and Mendelsohn, 2007; Galindo, Alatorre and Reyes, 2015a).
Differing socioeconomic conditions from one agricultural region to another mean that the impact of climate change varies by region and country. One way to compare these outcomes is by marginal monetary impact, which provides a way of quantifying the effects of climate change on agriculture, as can be seen in table II.3.
The results of different studies on Latin America dealing with the average marginal impact of temperature and precipitation on farm income per hectare and their respective sensitivities or elasticities are summarized in table II.4. These elasticities are heterogeneous and show how important changes in the climate system are for agriculture. Strikingly, all reported temperature elasticities are negative (except in the study by Lozanoff and Cap for Argentina), while precipitation elasticities present mixed results.
6 Share of annual GDP by economic activity at current prices.7 Exports of food and agricultural commodities as a share of all goods exports.

The climate emergency in Latin America and the Caribbean... 67
Tabl
e II.
3 A
rgen
tina,
Bra
zil,
Chi
le, M
exic
o, P
eru
and
Sout
h A
mer
ica:
est
imat
ed c
hang
es in
agr
icul
tura
l inc
omes
ass
ocia
ted
w
ith te
mpe
ratu
re ri
se, 1
998–
2008
Auth
orC
ount
ryTe
mpe
ratu
re ri
se(°
C)
Inco
me
chan
ge(p
erce
ntag
es)
San
ghi (
1998
)aB
razi
l2.
0Fr
om -5
to -1
13.
5Fr
om -7
to -1
4M
ende
lsoh
n an
d ot
hers
(200
0)b
Sou
th A
mer
ica
2.0
From
0.1
8 to
0.4
6Lo
zano
ff an
d C
ap (2
006)
cA
rgen
tina
From
2.0
to 3
.0Fr
om -2
0 to
-50
Tim
min
s (2
006)
Bra
zil
2.0
-0.6
21G
onzá
lez
and
Vela
sco
(200
8)C
hile
2.5
and
5.0
0.74
and
1.4
8S
eo a
nd M
ende
lsoh
n (2
007)
dS
outh
Am
eric
a1.
9, 3
.3 a
nd 5
-64,
-38
and
-20
(sm
all f
arm
s)-4
2, -8
8 an
d -8
(lar
ge fa
rms)
Seo
and
Men
dels
ohn
(200
7)e
Sou
th A
mer
ica
From
1.4
to 5
.1Fr
om -9
.3 to
-18.
9Fr
om 1
.3 to
3.2
From
-5.0
to -1
9.1
From
0.6
to 2
.0Fr
om 4
1.5
to 4
9.5
Seo
and
Men
dels
ohn
(200
7)f
Sou
th A
mer
ica
From
1.4
to 5
.1E
xoge
nous
: fro
m -6
.9 to
-32.
9En
doge
nous
: fro
m -5
.4 to
-28.
0Fr
om 1
.3 to
3.2
Exo
geno
us: f
rom
-5.7
to -1
7.6
Endo
geno
us: f
rom
-4.2
to -1
9.0
From
0.6
to 2
.0E
xoge
nous
: fro
m 4
.7 to
0.1
Endo
geno
us: f
rom
9.7
to -1
.1M
ende
lsoh
n an
d ot
hers
(200
7b)
Bra
zil
10g
-33
Seo
and
Men
dels
ohn
(200
8b)
Sou
th A
mer
ica
From
5.1
to 2
.0Fr
om -2
3 to
-43
Seo
and
Men
dels
ohn
(200
7)S
outh
Am
eric
a1.
9, 3
.3 a
nd 5
From
-14.
2 to
-53.
0Fr
om -1
4.8
to -3
0.2
From
2.3
to -1
2.4
San
ghi a
nd M
ende
lsoh
n (2
008)
hB
razi
lFr
om 1
.0 to
3.5
From
-1.3
to -3
8.5
Men
dels
ohn,
Are
llano
and
Chr
iste
nsen
(201
0)i
Mex
ico
From
2.3
to 5
.1Fr
om -4
2.6
to -5
4.1
Cun
ha a
nd o
ther
s (2
011)
jB
razi
l2.
0-1
4

68 Economic Commission for Latin America and the Caribbean (ECLAC)
Auth
orC
ount
ryTe
mpe
ratu
re ri
se(°
C)
Inco
me
chan
ge(p
erce
ntag
es)
Seo
(201
1)k
Sou
th A
mer
ica
1.2,
2.0
and
2.6
From
-26
a 17
(priv
ate
irrig
atio
n)Fr
om -1
2 a
-25
(pub
lic ir
rigat
ion)
From
-17
to -2
9 (d
ryla
nd)
Gal
indo
, Rey
es a
nd A
lato
rre
(201
5)l
Peru
3.7,
4.2
, 3.1
and
3.6
From
-8 to
-13
(per
hec
tare
)G
alin
do, R
eyes
and
Ala
torr
e (2
015)
mM
exic
o2.
5Fr
om -1
8.6
to 3
6.4
(per
hec
tare
)
So
urce
: L.
Gal
indo
and
oth
ers,
“C
ambi
o cl
imát
ico,
agr
icul
tura
y p
obre
za e
n A
mér
ica
Latin
a: u
na a
prox
imac
ión
empí
rica”
, Pro
ject
Doc
umen
ts (L
C/W
.620
), S
antia
go, E
cono
mic
Com
mis
sion
fo
r Lat
in A
mer
ica
and
the
Car
ibb
ean
(EC
LAC
), 20
14; L
. Gal
ind
o, O
. Rey
es a
nd J
. Ala
torr
e, “
Clim
ate
chan
ge, i
rrig
atio
n an
d a
gric
ultu
ral a
ctiv
ities
in M
exic
o: a
Ric
ard
ian
anal
ysis
w
ith p
anel
dat
a”, J
ourn
al o
f D
evel
opm
ent
and
Agr
icul
tura
l Eco
nom
ics,
vol
. 7, N
o. 7
, 201
5; J
. Loz
anof
f an
d E
. Cap
, “Im
pac
t of
clim
ate
chan
ge o
ver
Arg
entin
e ag
ricul
ture
: an
econ
omic
stu
dy”
, Bue
nos
Aire
s, N
atio
nal I
nstit
ute
for
Agr
icul
tura
l Tec
hnol
ogy,
201
1; R
. Men
del
sohn
, J. A
rella
no a
nd P
. Chr
iste
nsen
, “A
Ric
ard
ian
anal
ysis
of M
exic
an fa
rms”
, E
nviro
nmen
t an
d D
evel
opm
ent
Eco
nom
ics,
vol
. 15,
No.
2, C
amb
ridge
, Cam
brid
ge U
nive
rsity
Pre
ss, 2
010;
R. M
end
elso
hn a
nd o
ther
s, “
Clim
ate
anal
ysis
with
sat
ellit
e ve
rsus
w
eath
er s
tatio
n d
ata”
, Clim
atic
Cha
nge,
vol
. 81,
No.
1, B
erlin
, Sp
ringe
r, 20
07; S
. Seo
, “A
n an
alys
is o
f pub
lic a
dap
tatio
n to
clim
ate
chan
ge u
sing
agr
icul
tura
l wat
er s
chem
es in
S
outh
Am
eric
a”, E
colo
gica
l Eco
nom
ics,
vol
. 70,
No.
4, A
mst
erd
am, E
lsev
ier,
2011
; S. S
eo a
nd R
. Men
del
sohn
, “C
limat
e ch
ange
imp
acts
on
Latin
Am
eric
an fa
rmla
nd v
alue
s:
the
role
of f
arm
typ
e”, R
evis
ta d
e E
cono
mia
e A
gron
egóc
io, v
ol. 6
, No.
2, V
iços
a, F
eder
al U
nive
rsity
of V
iços
a, 2
008;
N. S
eo a
nd R
. Men
del
sohn
, “A
n an
alys
is o
f cro
p c
hoic
e:
adap
ting
to c
limat
e ch
ange
in L
atin
Am
eric
an f
arm
s”, P
olic
y R
esea
rch
Wor
king
Pap
er, N
o. 4
162,
Was
hing
ton,
D.C
., W
orld
Ban
k, 2
007;
A. S
angh
i and
R. M
end
elso
hn, “
The
imp
acts
of g
lob
al w
arm
ing
on fa
rmer
s in
Bra
zil a
nd In
dia
”, G
lob
al E
nviro
nmen
tal C
hang
e, v
ol. 1
8, N
o. 4
, Am
ster
dam
, Els
evie
r, 20
08; C
. Tim
min
s, “
End
ogen
ous
land
use
and
th
e R
icar
dia
n va
luat
ion
of c
limat
e ch
ange
”, E
nviro
nmen
tal a
nd R
esou
rce
Eco
nom
ics,
vol
. 33,
No.
1, V
enic
e, E
urop
ean
Ass
ocia
tion
of E
nviro
nmen
tal a
nd R
esou
rce
Eco
nom
ists
(E
AE
RE
), 20
06; R
. Men
del
sohn
and
oth
ers,
“C
ount
ry-s
pec
ific
mar
ket i
mp
acts
of c
limat
e ch
ange
”, C
limat
ic C
hang
e, v
ol. 4
5, N
os. 3
-4, B
erlin
, Sp
ringe
r, 20
00; R
. Gon
zále
z an
d J
. Ve
lasc
o, “
Eva
luat
ion
of th
e im
pac
t of c
limat
ic c
hang
e on
the
econ
omic
val
ue o
f lan
d in
agr
icul
tura
l sys
tem
s in
Chi
le”,
Chi
lean
Jou
rnal
of A
gric
ultu
ral R
esea
rch,
vol
. 68,
No.
1,
Chi
llán,
Ins
titut
e of
Agr
icul
tura
l Res
earc
h (IN
IA),
2008
; D
. C
unha
and
oth
ers,
“Im
pac
ts o
f cl
imat
e ch
ange
on
Bra
zilia
n ag
ricul
ture
: an
ana
lysi
s of
irrig
atio
n as
an
adap
tatio
n st
rate
gy”,
Pro
ceed
ings
of
1st
Clim
ate
Cha
nge,
Eco
nom
ic D
evel
opm
ent,
Env
ironm
ent
and
Peo
ple
Con
fere
nce,
P.
Mar
jano
vi (
ed.),
Sre
msk
a K
amen
ica,
Ed
ucon
s U
nive
rsity
, 20
11; A
. San
ghi,
“Glo
bal
war
min
g an
d c
limat
e se
nsiti
vity
: Bra
zilia
n an
d In
dia
n ag
ricul
ture
”, C
hica
go, U
nive
rsity
of C
hica
go, 1
998.
No
te:
Car
bon
fert
iliza
tion
is n
ot in
clud
ed in
the
estim
ates
, whi
ch a
re c
arrie
d o
ut a
ccor
din
g to
the
Ric
ard
ian
mod
el. W
ith th
is, t
he p
oten
tial i
mp
act o
f clim
ate
chan
ge o
n th
e ec
onom
ic
valu
e of
land
or
on n
et in
com
e p
er h
ecta
re is
est
imat
ed o
n th
e as
sum
ptio
n th
at,
in a
com
pet
itive
mar
ket,
the
val
ue o
f la
nd r
eflec
ts t
he le
vel o
f p
rod
uctiv
ity.
Diff
eren
t le
vels
of
pro
duc
tivity
are
the
out
com
e of
a s
et o
f con
trol
var
iab
les,
suc
h as
clim
atic
con
diti
ons
and
the
use
of e
lect
ricity
and
fert
ilize
rs (D
inar
and
Men
del
sohn
, 201
2). A
num
ber
of
criti
cism
s ha
ve b
een
mad
e of
the
Ric
ard
ian
mod
el, o
f cou
rse
(Clin
e, 2
007)
. In
the
tab
le, p
ositi
ve v
alue
s re
pre
sent
ben
efits
and
neg
ativ
e va
lues
det
rimen
ts.
a In
the
clim
ate
scen
ario
, pre
cip
itatio
n is
ass
umed
to
incr
ease
by
7%.
b
The
imp
act
is e
xpre
ssed
as
a p
erce
ntag
e of
GD
P.
c In
the
clim
ate
scen
ario
, the
cha
nge
in p
reci
pita
tion
is a
ssum
ed t
o b
e b
etw
een
-5%
and
10%
.d
The
aver
age
leve
l of p
oint
pre
cip
itatio
n m
ay in
crea
se (o
r d
ecre
ase)
in s
ome
coun
trie
s ev
en if
the
re is
a r
educ
tion
(or
incr
ease
) in
tota
l ann
ual r
ainf
all.
e P
reci
pita
tion
incr
ease
s an
d d
ecre
ases
ove
r tim
e w
ithou
t an
y ap
par
ent
pat
tern
.f
The
exog
enou
s m
odel
pre
dic
ts g
reat
er d
amag
e an
d lo
wer
ben
efits
tha
n th
e en
dog
enou
s m
odel
in a
ll sc
enar
ios.
The
diff
eren
ce in
crea
ses
over
tim
e.
g P
erce
ntag
e.
h In
the
clim
ate
scen
ario
, the
cha
nge
in p
reci
pita
tion
is a
ssum
ed t
o b
e b
etw
een
-8%
and
14%
. i
Pro
ject
ions
are
mad
e fo
r si
tuat
ions
of l
ower
and
hig
her
annu
al p
reci
pita
tion
in a
set
of c
limat
e ch
ange
sce
nario
s.
j Fa
rmer
s’ in
com
es t
end
to
incr
ease
in a
reas
whe
re ir
rigat
ion
tech
niq
ues
are
pra
ctic
ed, b
ut lo
sses
occ
ur in
are
as w
here
agr
icul
ture
is r
ain-
fed
. k
A c
limat
e sc
enar
io w
ith a
n ov
eral
l inc
reas
e in
rai
nfal
l and
ano
ther
with
an
over
all d
ecre
ase
are
cons
ider
ed.
The
follo
win
g S
outh
Am
eric
an c
ount
ries
are
cons
ider
ed:
Arg
entin
a, t
he
Bol
ivar
ian
Rep
ublic
of V
enez
uela
, Bra
zil,
Chi
le, C
olom
bia
, Ecu
ador
and
Uru
guay
. l
The
AC
CE
SS
mod
el e
stim
ates
tak
e a
tem
per
atur
e in
crea
se o
f 3.
7 °C
and
4.2
°C
and
a c
hang
e in
pre
cip
itatio
n of
12.
9% a
nd 4
.0%
in s
umm
er a
nd w
inte
r, re
spec
tivel
y; t
he C
NR
M-
CM
5 m
odel
est
imat
es t
ake
a te
mp
erat
ure
incr
ease
of 3
.1 °
C a
nd 3
.6 °
C a
nd a
cha
nge
in p
reci
pita
tion
of 1
8.9%
and
3.1
% in
sum
mer
and
win
ter,
resp
ectiv
ely.
m
The
pro
ject
ed im
pac
t on
net
inco
me
per
hec
tare
, con
sid
erin
g al
l typ
es o
f far
ms,
is e
stim
ated
from
a 2
.5 °
C in
crea
se in
tem
per
atur
e an
d a
10%
red
uctio
n in
pre
cip
itatio
n.
Tab
le II
.3 (c
onc
lud
ed)

The climate emergency in Latin America and the Caribbean... 69
Tabl
e II.
4 La
tin A
mer
ica
(8 c
ount
ries)
: mar
gina
l im
pact
of c
limat
e ch
ange
on
agric
ultu
ral i
ncom
e, 2
006–
2015
Auth
ors/
coun
tries
Farm
sTe
mpe
ratu
rePr
ecip
itatio
nM
argi
nal c
hang
e in
inco
mes
(d
olla
rs p
er h
ecta
re/°
C)
Elas
ticity
Mar
gina
l cha
nge
in in
com
es
(dol
lars
per
hec
tare
/mm
/mon
th)
Elas
ticity
Arg
entin
a (L
ozan
off
and
Cap
, 201
1)Fa
mily
agr
icul
ture
1 63
80.
64-1
84-1
.04
Com
mer
cial
agr
icul
ture
1 36
41.
43-1
36.8
-1.8
2B
razi
l (M
ende
lsoh
n an
d ot
hers
, 200
7)a
Agric
ultu
re (w
eath
er s
tatio
n)-0
.97
2.32
Agric
ultu
re (s
atel
lite)
-0.3
10.
03Ag
ricul
ture
(com
bina
tion
of
wea
ther
sta
tion
and
sate
llite
)-0
.18
0.01
Arg
entin
a, V
enez
uela
(B
oliv
aria
n R
epub
lic o
f),
Bra
zil,
Chi
le, C
olom
bia,
Ec
uado
r and
Uru
guay
(S
eo a
nd M
ende
lsoh
n,
2008
a)
Agric
ultu
re-7
4-0
.53
-49.
9-2
.16
Live
stoc
k-1
75-2
.47
-1.9
-0.1
5M
ixed
farm
s-8
8-0
.99
-34.
6-2
.32
Tota
l sam
ple
-76
-0.6
8-2
2.5
-1.2
2E
xpec
tatio
n-9
4.7
-0.8
5-3
5.2
-1.9
1A
rgen
tina,
Ven
ezue
la
(Bol
ivar
ian
Rep
ublic
of),
B
razi
l, C
hile
, Col
ombi
a,
Ecua
dor a
nd U
rugu
ay
(Seo
and
Men
dels
ohn,
20
08b)
Fam
ily a
gric
ultu
re-2
21.8
4-1
.61
-3.1
2-0
.13
Com
mer
cial
agr
icul
ture
-144
.32
-1.5
1-5
2.62
-3.3
1R
ain-
fed
agric
ultu
re-1
43.5
9-1
.46
-39.
91-2
.42
Irrig
ated
agr
icul
ture
-408
.71
-2.6
336
.78
1.29
Tota
l sam
ple
-175
.28
-1.5
5-3
0.37
-1.6
0A
rgen
tina,
Ven
ezue
la
(Bol
ivar
ian
Rep
ublic
of),
B
razi
l, C
hile
, Col
ombi
a,
Ecua
dor a
nd U
rugu
ay
(Men
dels
ohn,
200
8)
Fam
ily a
gric
ultu
re-1
5514
Rai
n-fe
d fa
mily
agr
icul
ture
-101
55Irr
igat
ed fa
mily
agr
icul
ture
-198
-125
Com
mer
cial
agr
icul
ture
-157
45R
ain-
fed
com
mer
cial
agr
icul
ture
-170
35Irr
igat
ed c
omm
erci
al a
gric
ultu
re-1
1725
3

70 Economic Commission for Latin America and the Caribbean (ECLAC)
Auth
ors/
coun
tries
Farm
sTe
mpe
ratu
rePr
ecip
itatio
nM
argi
nal c
hang
e in
inco
mes
(d
olla
rs p
er h
ecta
re/°
C)
Elas
ticity
Mar
gina
l cha
nge
in in
com
es
(dol
lars
per
hec
tare
/mm
/mon
th)
Elas
ticity
Mex
ico
(Men
dels
ohn,
A
rella
no a
nd C
hris
tens
en,
2010
)b
Fam
ily a
gric
ultu
re-4
217
-626
.5C
omm
erci
al a
gric
ultu
re-4
995
-99.
9R
ain-
fed
agric
ultu
re-5
938
-47.1
Irrig
ated
agr
icul
ture
-20
304
-4 9
38.4
Tota
l sam
ple
-7 1
51-7
68A
rgen
tina,
Ven
ezue
la
(Bol
ivar
ian
Rep
ublic
of),
B
razi
l, C
hile
, Col
ombi
a,
Ecua
dor a
nd U
rugu
ay
(Seo
, 201
1)
Agric
ultu
re (p
rivat
e irr
igat
ion)
-504
.98
-3.6
5-9
2.88
-3.7
2Ag
ricul
ture
(pub
lic ir
rigat
ion)
-242
.92
-1.8
8-4
0.91
-1.7
5Ag
ricul
ture
(rai
n-fe
d)-1
65.5
0-2
.08
-3.6
3-0
.25
Mex
ico
(Gal
indo
, Rey
es a
nd
Ala
torr
e, 2
015)
bIrr
igat
ed a
gric
ultu
re-6
384
-3.4
7-1
022
-2.1
3R
ain-
fed
agric
ultu
re-6
24.1
6-1
.89
-158
.95
-2.3
4M
ixed
agr
icul
ture
-2 2
73-3
.19
-448
.30
-2.1
8
So
urce
: L.
Gal
ind
o, O
. Rey
es a
nd J
. Ala
torr
e, “
Clim
ate
chan
ge, i
rrig
atio
n an
d a
gric
ultu
ral a
ctiv
ities
in M
exic
o: a
Ric
ard
ian
anal
ysis
with
pan
el d
ata”
, Jou
rnal
of D
evel
opm
ent
and
Agr
icul
tura
l Eco
nom
ics,
vol
. 7, N
o. 7
, 201
5; J
. Loz
anof
f and
E. C
ap, “
Imp
act o
f clim
ate
chan
ge o
ver A
rgen
tine
agric
ultu
re: a
n ec
onom
ic s
tud
y”, B
ueno
s A
ires,
N
atio
nal I
nstit
ute
for
Agr
icul
tura
l Tec
hnol
ogy,
201
1; R
. M
end
elso
hn,
“The
imp
act
of c
limat
e ch
ange
on
agric
ultu
re in
dev
elop
ing
coun
trie
s”,
Jour
nal o
f N
atur
al
Res
ourc
es P
olic
y R
esea
rch,
vol
. 1,
No.
1,
Rou
tled
ge,
Tayl
or &
Fra
ncis
, 20
08;
R.
Men
del
sohn
, J.
Are
llano
and
P.
Chr
iste
nsen
, “A
Ric
ard
ian
anal
ysis
of
Mex
ican
fa
rms”
, Env
ironm
ent
and
Dev
elop
men
t E
cono
mic
s, v
ol. 1
5, N
o. 2
, Cam
brid
ge, C
amb
ridge
Uni
vers
ity P
ress
, 201
0; R
. Men
del
sohn
and
oth
ers,
“C
limat
e an
alys
is
with
sat
ellit
e ve
rsus
wea
ther
sta
tion
dat
a”, C
limat
ic C
hang
e, v
ol. 8
1, N
o. 1
, Ber
lin, S
prin
ger,
2007
; S. S
eo, “
An
anal
ysis
of p
ublic
ad
apta
tion
to c
limat
e ch
ange
usi
ng
agric
ultu
ral w
ater
sch
emes
in S
outh
Am
eric
a”, E
colo
gica
l Eco
nom
ics,
vol
. 70,
No.
4, A
mst
erd
am, E
lsev
ier,
2011
; S. S
eo a
nd R
. Men
del
sohn
, “A
Ric
ard
ian
anal
ysis
of
the
imp
act
of c
limat
e ch
ange
on
Sou
th A
mer
ican
far
ms”
, C
hile
an J
ourn
al o
f A
gric
ultu
ral R
esea
rch,
vol
. 68
, N
o. 1
, C
hillá
n, In
stitu
te o
f A
gric
ultu
ral R
esea
rch,
20
08; S
. Seo
and
R. M
end
elso
hn, “
Clim
ate
chan
ge im
pac
ts o
n La
tin A
mer
ican
farm
land
val
ues:
the
role
of f
arm
typ
e”, R
evis
ta d
e E
cono
mia
e A
gron
egóc
io, v
ol.6
, N
o. 2
, Viç
osa,
Fed
eral
Uni
vers
ity o
f Viç
osa,
200
8.N
ote
: M
argi
nal i
mp
act
is e
valu
ated
for
the
ave
rage
of
the
clim
ate
varia
ble
s. E
last
iciti
es a
re c
alcu
late
d a
s th
e ra
tio b
etw
een
the
per
cent
age
chan
ge in
net
inco
me
per
he
ctar
e an
d t
he p
erce
ntag
e ch
ange
in t
emp
erat
ure
or p
reci
pita
tion.
a
Ana
lysi
s of
the
effe
cts
of c
limat
e ch
ange
on
agric
ultu
ral i
ncom
es w
ith r
esp
ect
to t
he s
ourc
e of
the
clim
ate
dat
a: (i
) wea
ther
sta
tion,
(ii)
sate
llite
and
(iii)
com
bin
atio
n of
(i)
and
(ii).
b
In t
he s
tud
ies
on M
exic
o, t
he r
esul
ts a
re e
xpre
ssed
in M
exic
an p
esos
per
hec
tare
(pes
os/h
a) a
nd n
ot in
dol
lars
per
hec
tare
as
with
the
oth
er s
tud
ies.
Tab
le II
.4 (c
onc
lud
ed)

The climate emergency in Latin America and the Caribbean... 71
The losses that climate change can potentially cause in agriculture will also be affected by human factors such as land tenure or the application of different public policies in the agriculture sector. Regarding the first factor, incentives to invest in adaptation are lessened when ownership is decoupled from use. Figure II.6 gives estimates of these losses by 2080.
Figure II.6 Latin America and the Caribbean (17 countries): losses expected in the agriculture
sector from climate change, 2080(Percentages)
-10
0
10
20
30
40
50
60
70
80
Arg
entin
a
Bol
ivia
(Plu
r. S
tate
of)
Bra
zil
Chi
le
Col
ombi
a
Cos
ta R
ica
Ecua
dor
El S
alva
dor
Gua
tem
ala
Hon
dura
s
Mex
ico
Nic
arag
ua
Pana
ma
Para
guay
Peru
Uru
guay
Vene
zuel
a(B
ol. R
ep. o
f)
Latin
Am
eric
a an
dth
e C
arib
bean
Agriculture, 2017 (value added as share of GDP) Agricultural employment, 2017 (share of total)Impact (crop model), 2080 Impact (Ricardian model), 2080Impact: preferred estimate(with fertilization effect), 2080
Impact: preferred estimate(without fertilization effect), 2080
Source: Economic Commission for Latin America and the Caribbean (ECLAC), on the basis of World Bank, World Development Indicators [online database] https://databank.bancomundial.org/source/world-development-indicators; W. Cline, Global Warming and Agriculture: Impact Estimates by Country, Washington, D.C., Peterson Institute for International Economics (PIIE), 2007.
Note: The “Agriculture, 2017” column of the chart shows the share of agricultural value added in total GDP. The impact of climate change on agriculture was derived from a linear function of the preferred estimate of impact by 2080 included in Cline (2007). The impact for Latin America and the Caribbean is a simple average. It was assumed that the impact for Paraguay was that reported under the heading “Other South America” (Cline, 2007) and that the impact for Uruguay was the same as for Argentina. The crop model estimates the impact of climate variables on crop production or yields and thereby forecasts the potential impact of climate change. With the Ricardian model, the potential effects of climate change on the economic values of land or net income per hectare are estimated, on the assumption that land values in a competitive market reflect productivity. Thus, different levels of productivity are the result of a set of control variables, such as electricity and fertilizer use and climate conditions (Dinar and Mendelsohn, 2012).
To reduce poverty, it is usually necessary for average individual income to change because of economic growth or shifts in income distribution (Bourguignon and Morrisson, 2002; Epaulard, 2003; ECLAC, 2013). Assuming constant log-normal income distribution, an increase in the average income of the population translates into a reduction in poverty (see diagram II.1; Datt and Ravallion, 1992; OECD, 2010).

72 Economic Commission for Latin America and the Caribbean (ECLAC)
Diagram II.1 Decomposition of changes in poverty into the income effect and the distribution effect
Distribution effect
0
0
0
New distribution Growth effect
0
Growth effecton poverty
Distribution effecton poverty
Poverty line
Den
sity
(pro
porti
on o
f the
pop
ulat
ion
mea
sure
d fro
m 0
to 1
)
Initial distribution
0 1 10 100 Income of the population (dollars per day, log scale)
0.6
0.5
0.4
0.3
0.2
Source: F. Bourguignon, “The growth elasticity of poverty reduction: explaining heterogeneity across country and time periods”, Inequality and Growth: Theory and Policy Implications, T. Eicher and S. Turnovsky (eds.), Cambridge, The MIT Press, 2003.
Changes in weather patterns affect agricultural productivity and farmers’ incomes, which also impacts the total income of rural households. This being so, climate change can be expected to increase rural poverty (Mendelsohn and others, 2007) and inequality in two steps: first, because of the impact on agriculture sector growth (Thurlow, Zhu and Diao, 2009) and, second, because of the impact of the latter on the evolution of poverty (Thurlow, Zhu and Diao, 2009; Christiaensen, Demery and Kuhl, 2011; Christiaensen and Demery, 2007). The agriculture sector remains strategically important in the region and a significant part of the severest poverty is concentrated in rural areas (Byerlee, Diao and Jackson, 2005; Christiaensen, Demery and Kuhl, 2011; Nissanke and Thorbecke, 2007; Ravallion and Chen, 2007). See box II.1 for a case study dealing with Mexico.
In Latin America, there is found to be an inverse relationship between economic growth and poverty, with estimates showing a sensitivity (elasticity) of between -1.5 and -1.7 to each percentage point of economic growth for indigence and between -0.94 and -1.76 for poverty (depending on the indicator used in the latter case). Sensitivity or elasticity to changes in income distribution is positive and statistically significant in all cases (Galindo and others, 2014). Climate change, compounded by downturns in economic cycles, may erode the progress made in combating poverty and indigence (see figure II.7).
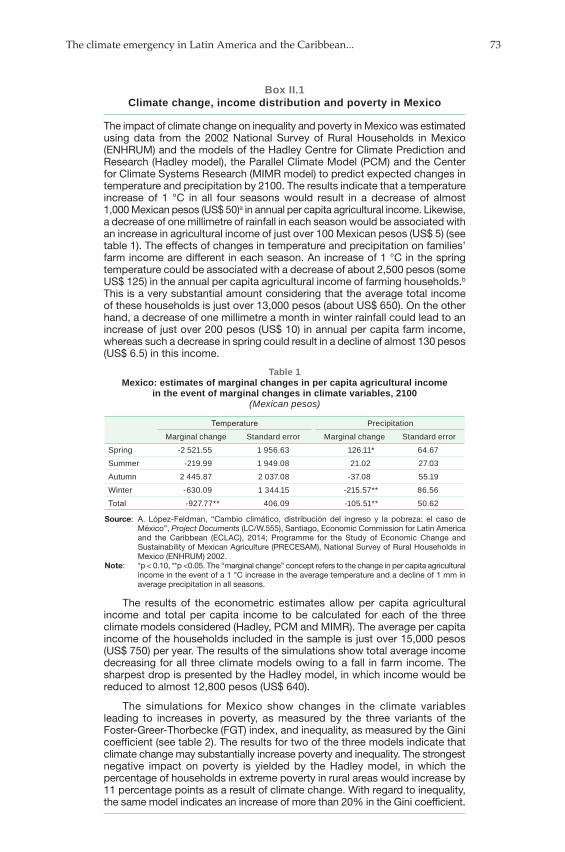
The climate emergency in Latin America and the Caribbean... 73
Box II.1 Climate change, income distribution and poverty in Mexico
The impact of climate change on inequality and poverty in Mexico was estimated using data from the 2002 National Survey of Rural Households in Mexico (ENHRUM) and the models of the Hadley Centre for Climate Prediction and Research (Hadley model), the Parallel Climate Model (PCM) and the Center for Climate Systems Research (MIMR model) to predict expected changes in temperature and precipitation by 2100. The results indicate that a temperature increase of 1 °C in all four seasons would result in a decrease of almost 1,000 Mexican pesos (US$ 50)a in annual per capita agricultural income. Likewise, a decrease of one millimetre of rainfall in each season would be associated with an increase in agricultural income of just over 100 Mexican pesos (US$ 5) (see table 1). The effects of changes in temperature and precipitation on families’ farm income are different in each season. An increase of 1 °C in the spring temperature could be associated with a decrease of about 2,500 pesos (some US$ 125) in the annual per capita agricultural income of farming households.b This is a very substantial amount considering that the average total income of these households is just over 13,000 pesos (about US$ 650). On the other hand, a decrease of one millimetre a month in winter rainfall could lead to an increase of just over 200 pesos (US$ 10) in annual per capita farm income, whereas such a decrease in spring could result in a decline of almost 130 pesos (US$ 6.5) in this income.
Table 1 Mexico: estimates of marginal changes in per capita agricultural income
in the event of marginal changes in climate variables, 2100(Mexican pesos)
Temperature PrecipitationMarginal change Standard error Marginal change Standard error
Spring -2 521.55 1 956.63 126.11* 64.67Summer -219.99 1 949.08 21.02 27.03Autumn 2 445.87 2 037.08 -37.08 55.19Winter -630.09 1 344.15 -215.57** 86.56Total -927.77** 406.09 -105.51** 50.62
Source: A. López-Feldman, “Cambio climático, distribución del ingreso y la pobreza: el caso de México”, Project Documents (LC/W.555), Santiago, Economic Commission for Latin America and the Caribbean (ECLAC), 2014; Programme for the Study of Economic Change and Sustainability of Mexican Agriculture (PRECESAM), National Survey of Rural Households in Mexico (ENHRUM) 2002.
Note: *p < 0.10, **p <0.05. The “marginal change” concept refers to the change in per capita agricultural income in the event of a 1 °C increase in the average temperature and a decline of 1 mm in average precipitation in all seasons.
The results of the econometric estimates allow per capita agricultural income and total per capita income to be calculated for each of the three climate models considered (Hadley, PCM and MIMR). The average per capita income of the households included in the sample is just over 15,000 pesos (US$ 750) per year. The results of the simulations show total average income decreasing for all three climate models owing to a fall in farm income. The sharpest drop is presented by the Hadley model, in which income would be reduced to almost 12,800 pesos (US$ 640).
The simulations for Mexico show changes in the climate variables leading to increases in poverty, as measured by the three variants of the Foster-Greer-Thorbecke (FGT) index, and inequality, as measured by the Gini coefficient (see table 2). The results for two of the three models indicate that climate change may substantially increase poverty and inequality. The strongest negative impact on poverty is yielded by the Hadley model, in which the percentage of households in extreme poverty in rural areas would increase by 11 percentage points as a result of climate change. With regard to inequality, the same model indicates an increase of more than 20% in the Gini coefficient.

74 Economic Commission for Latin America and the Caribbean (ECLAC)
Table 2 Mexico: impact of climate change on poverty and inequality in rural areas
according to different climate models, 2014Poverty Inequality
Incidence(percentages) Depth Severity Gini coefficient
Current level 38 0.221 0.193 0.599Climate modelHadley model 49 0.444 0.598 0.737Parallel Climate Model 4 0.254 0.249 0.619
MIMR model 48% 0.439 0.586 0.734
Source: A. López-Feldman, “Cambio climático, distribución del ingreso y la pobreza: el caso de México”, Project Documents (LC/W.555), Santiago, Economic Commission for Latin America and the Caribbean (ECLAC), 2014; Programme for the Study of Economic Change and Sustainability of Mexican Agriculture (PRECESAM), National Survey of Rural Households in Mexico (ENHRUM) 2002.
Note: The poverty incidence rate is defined as the proportion of the population living below the poverty line. The depth of poverty is defined as the average distance from the poverty line of the individuals living below it, expressed as a proportion of this line; i.e., it represents the amount of aggregate income by which they fall short of the poverty line, normalized by the population. The severity of poverty measures the income deficit of individuals living below the poverty line, squared; i.e., it is the squared sum of the distance between individuals and the poverty line.
These estimates of the potential magnitude of the impact of climate change on poverty and inequality in Mexico support the hypothesis that climate change can be expected to have a significant effect on household welfare. It is therefore important to take measures to reduce this impact, particularly in the case of households whose main source of income is agriculture, as this is a vulnerable sector of the population.
Source: L. Galindo and others, “Cambio climático, la distribución del ingreso y la pobreza: el caso de México”, Síntesis de políticas públicas sobre cambio climático, Santiago, European Union/Economic Commission for Latin America and the Caribbean (ECLAC), 2017; A. López-Feldman, “Cambio climático, distribución del ingreso y la pobreza: el caso de México”, Project Documents (LC/W.555), Santiago, Economic Commission for Latin America and the Caribbean (ECLAC), 2014; Programme for the Study of Economic Change and Sustainability of Mexican Agriculture (PRECESAM), National Survey of Rural Households in Mexico (ENHRUM) 2002.
a The exchange rate fluctuated around 20 Mexican pesos to the dollar in 2018 and 2019.b The change is not statistically significant.
The relationships between economic growth, which reduces poverty, and poor income distribution, which exacerbates it (Adams Jr., 2004; Bourguignon, 2003 and 2004; Datt and Ravallion, 1992; Ravallion, 1995; Fan, Gulati and Thorat, 2008), can be used to construct prospective scenarios for the potential impact of climate change on poverty in view of its effects on the growth rate of the agriculture sector (Epaulard, 2003; Ravallion and Datt, 2002).8
8 There is also another, inverse relationship between economic growth and poverty if it is considered that poverty reduction would contribute to long-run economic growth (Aghion, Caroli and García-Peñalosa, 1999; Alesina and Rodrik, 1994).
Box II.1 (concluded)

The climate emergency in Latin America and the Caribbean... 75
Figure II.7 Latin America (16 countries): proportion of the rural population below the extreme
poverty and poverty lines, around 2007 and 2017(Percentages)
0 10 20 30 40 50 60
UruguayChile
Costa RicaParaguay
BrazilEcuador
Dominican Rep.El Salvador
PeruPanama
Latin AmericaColombia
GuatemalaMexico
HondurasNicaragua
Bolivia (Plur. State of)
A. Extreme poverty
B. Poverty
0 10 20 30 40 50 60 70 80
UruguayChile
Costa RicaBrazil
EcuadorParaguay
Dominican Rep.Panama
PeruColombia
Latin AmericaEl Salvador
Bolivia (Plur. State of)Mexico
NicaraguaHonduras
Guatemala
Around 2007 Around 2017
Source: Economic Commission for Latin America and the Caribbean (ECLAC), CEPALSTAT [online database] http://estadisticas.cepal.org/cepalstat/WEB_CEPALSTAT/Portada.asp; Compacts for Equality: Towards a Sustainable Future (LC/G.2586(SES.35/3)), Santiago, 2014; L. Galindo and others, “El cambio climático, la agricultura y la pobreza en América Latina”, Síntesis de políticas públicas sobre cambio climático, Santiago, European Union/Economic Commission for Latin America and the Caribbean (ECLAC), 2017.
A baseline or business as usual scenario was constructed to estimate the potential climate impact on rural poverty. For this purpose, it was assumed that the historical behaviour of each country’s average per capita growth rate would remain unchanged up to 2025, the population growth forecasts of the

76 Economic Commission for Latin America and the Caribbean (ECLAC)
Latin American and Caribbean Demographic Centre (CELADE)-Population Division of ECLAC were used, and income distribution was left unchanged. The projections for this business as usual scenario point to a considerably smaller reduction in rural poverty and indigence in Latin America by 2025 because of the effect of climate change on agriculture.9 This shows that climate change affects rural poverty and has an impact on social policy objectives in the region.
D. The water challenge and climate change
Latin America and the Caribbean has a high availability of water resources distributed unevenly between subregions and countries (Magrin and others, 2007). Water availability is around 13,867 trillion cubic meters (m3), equivalent to 22.162 m3 of water per capita. Water withdrawal was 329.728 billion m3 in 2014,10 of which 71% was used for agriculture, 17% for domestic consumption and 12% for industry (see figure II.8).
Climate change is jeopardizing the availability of water;11 at the same time, demand for human consumption is increasing with improved incomes and population growth. This demand is influenced by the cost of supply, the prices of other goods, the demographic and socioeconomic characteristics of households and the climate, particularly temperature and precipitation (see table II.5).
Climate change is altering precipitation patterns, soil moisture and runoff, and glacier melting is also contributing by affecting water availability and consumption trends (see annex A1 for expected variations by subregion in Latin America and the Caribbean). An increase in temperature will result in a rise in water demand that will intensify the pressure on this resource (Sebri, 2014). For example, the number of people in situations of water stress is expected to increase as climate change intensifies (IPCC, 2008 and 2014a; ECLAC, 2015a).12 This impact is apparent in the region.
9 See Galindo and others (2014) for more model data.10 See World Bank (2019).11 Deforestation is another source of pressure. According to Antonio Nobre of Brazil’s National
Institute for Space Research (INPE), the evapotranspiration of the Amazon rainforest creates a large airborne river with a greater flow than the Amazon itself which, after being redirected by the Andes mountain range, precipitates into the Southern Cone and supplies urban-rural areas such as those of São Paulo, Rio de Janeiro and Buenos Aires. This phenomenon, which could be at risk because of ongoing deforestation (Nobre, 2014), explains the radical difference between the forested zone to the east of the Andes and the desert to the west, as well as the absence of extreme weather events on the Atlantic coast of Brazil.
12 Water stress is a concept that describes the extent to which the population is exposed to the risk of water shortage. A basin is considered to suffer water stress when its water availability per inhabitant is less than 1,000 m3/year (based on the historical average runoff) or when the ratio between water extraction and the historical annual average runoff is greater than 0.4 (IPCC, 2008).

The climate emergency in Latin America and the Caribbean... 77
Figure II.8 Latin America and the Caribbean (24 countries): per capita water availability,
by country, and distribution of use in the regional total, 2014a
A. Per capita water availability(cubic metres)
0
10 000
20 000
30 000
40 000
50 000
60 000
Hai
ti
Puer
to R
ico
Dom
inic
an R
ep.
El S
alva
dor
Trin
idad
and
Tob
ago
Mex
ico
Cub
a
Jam
aica
Arg
entin
a
Gua
tem
ala
Hon
dura
s
Para
guay
Cos
ta R
ica
Nic
arag
uaVe
nezu
ela
(Bol
. Rep
. of)
Uru
guay
Bra
zil
Ecua
dor
Bol
ivia
(Plu
r. S
tate
of)
Pana
ma
Bel
ize
Col
ombi
a
Chi
le
Peru
Euro
pean
Uni
on
Wor
ldLa
tin A
mer
ica
and
the
Car
ibbe
an
B. Distribution of water use, by sector(percentages)
Agriculture(71)
Industry(12)
Domestic use(17)
Source: Economic Commission for Latin America and the Caribbean (ECLAC), on the basis of World Bank, World Development Indicators [online database] https://databank.bancomundial.org/source/world-development-indicators.
Note: The data on per capita water availability are for national freshwater flows and cover the national renewable resources (national river flows and groundwater replenished by rainfall) of each country. The data on the distribution of use are for water extracted from its source for a given use. Extraction for agriculture is total withdrawals for irrigation and livestock production, domestic use includes drinking water, municipal use or supply and use for public services, commercial establishments and households, and the industry category covers total extraction for direct industrial use (including withdrawals for refrigeration of thermoelectric plants).
a Latest figure available.

78 Economic Commission for Latin America and the Caribbean (ECLAC)
Table II.5 Meta-analysis of the price and income elasticity of water demand, 1997–2014
Author MethodElasticity
Price Income
Espey, Espey and Shaw (1997)
Meta-analysis Short run: 0.38(from 0.03 to 2.23)
Long run: 0.64(from 0.10 to 3.33)
Dalhuisen and others (2003)
Meta-analysis 0.41 0.43
Arbués, Garcı́aValiñas and Martı́nezEspiñeira (2003)
Survey From 0.1 to 0.4
Strand and Walker (2005) Instrumental variables 0.3
Olmstead, Hanemann and Stavins (2007)
Discrete/continuous choice model
0.33
Worthington and Hoffman (2008)
Survey Short run: from 0 to 0.5
Long run: from 0.5 to 1
Nauges and Whittington (2009)
Survey From 0.3 to 0.6 From 0.1 to 0.3
Grafton and others (2011) Instrumental variables 0.429 0.11
Sebri (2014) Meta-analysis 0.365(from 3.054 to 0.002)
0.207(from 0.440 to 1.560)
Source: Economic Commission for Latin America and the Caribbean (ECLAC), The economics of climate change in Latin America and the Caribbean: paradoxes and challenges of sustainable development (LC/G.2624), Santiago, 2015; M. Espey, J. Espey and W. Shaw, “Price elasticity of residential demand for water: a meta-analysis”, Water Resources Research, vol. 33, No. 6, Hoboken, Wiley, 1997; J. Dalhuisen and others, “Price and income elasticities of residential water demand: a meta-analysis”, Land Economics, vol. 79, No. 2, Madison, University of Wisconsin Press, 2003; F. Arbués, M. Garcıía-Valiñas and R. Martıínez-Espiñeira, “Estimation of residential water demand: a state-of-the-art review”, The Journal of Socio-Economics, vol. 32, No. 1, Amsterdam, Elsevier, 2003; J. Strand and I. Walker, “Water markets and demand in Central American cities”, Environment and Development Economics, vol. 10, No. 3, Cambridge, Cambridge University Press, 2005; S. Olmstead, W. Hanemann and R. Stavins, “Water demand under alternative price structures”, Journal of Environmental Economics and Management, vol. 54, No. 2, Amsterdam, Elsevier, 2007; A. Worthington and M. Hoffman, “An empirical survey of residential water demand modelling”, Journal of Economic Surveys, vol. 22, No. 5, Hoboken, Wiley, 2008; C. Nauges and D. Whittington, “Estimation of water demand in developing countries: an overview”, The World Bank Research Observer, vol. 25, No. 2, Washington, D.C., World Bank, 2009; Q. Grafton and others, “Determinants of residential water consumption: evidence and analysis from a 10-country household survey”, Water Resources Research, vol. 47, No. 8, Hoboken, Wiley, 2011; M. Sebri, “A meta-analysis of residential water demand studies”, Environment, Development and Sustainability, vol. 16, No. 3, Berlin, Springer, 2014.
Note: Espey, Espey and Shaw (1997) used 24 articles with 124 price elasticities for residential water demand in the United States. Dalhuisen and others (2003) used 64 studies that yielded 296 price elasticities and 161 income elasticities. Arbués, García-Valiñas and Martínez-Espiñeira (2003) studied estimates of residential water demand; however, few of the studies considered were published later than 1990. Strand and Walker (2005) calculated water demand in 17 cities of Central America and the Bolivarian Republic of Venezuela. Olmstead, Hanemann, and Stavins (2007) used a structural discrete/continuous choice model with household data from 11 urban areas in the United States and Canada. Nauges and Whittington (2009) compiled studies from Central America (El Salvador, Guatemala, Honduras, Nicaragua and Panama), the Bolivarian Republic of Venezuela, Africa (Kenya and Madagascar) and Asia (Cambodia, Indonesia, the Philippines, Saudi Arabia, Sri Lanka and Viet Nam). Grafton and others (2011) estimated residential water demand in 10 Organization for Economic Cooperation and Development (OECD) countries (Australia, Canada, the Czech Republic, France, Italy, Mexico, the Netherlands, Norway, the Republic of Korea and Sweden). Sebri (2014) identified 100 studies on residential water demand, from which he obtained 638 estimates of price elasticity; with regard to income elasticity, he had 72 studies, from which he obtained 332 elasticities.

The climate emergency in Latin America and the Caribbean... 79
For example, the volume of the Magdalena and Cauca rivers in Colombia has been decreasing, and the same has happened in Central America, where rivers are showing the effects of a tendency towards drought (Carmona Duque and Poveda Jaramillo, 2011; Dai, 2011; ECLAC, 2015a). Andean glaciers have been rapidly retreating and melting in the Bolivarian Republic of Venezuela, Chile, Colombia, Ecuador, Peru and the Plurinational State of Bolivia, with losses of between 20% and 50% in area, mainly since the end of the 1970s, associated with rising temperatures. This has reduced the availability of water (Magrin and others, 2014; Bradley and others, 2009) in their respective basins and a number of cities. The Cotacachi glacier in Ecuador has already disappeared, and this has affected agriculture and tourism, as well as causing a loss of biodiversity (Vergara and others, 2009). In Colombia, the snow-capped volcano of Santa Isabel has lost 44% of its ice cover and consequently become less attractive to tourists. In Chile, the San Quintín glacier has shrunk rapidly (UNEP/ECLAC/GRID-Arendal, 2010).
In contrast, the volume of water in Mar Chiquita lake in the provinces of Córdoba and Santiago del Estero in Argentina has increased, as has that in Lagoa dos Patos, a lake in southern Brazil, because of higher precipitation and reduced evapotranspiration due to land use change (IPCC, 2014a); Doyle and Barros, 2011; Saurral, Barros and Lettenmaier, 2008; Magrin and others, 2014; Marques, 2012; Bucher and Curto, 2012; Pasquini and others, 2006; Rodrigues and others, 2010).
E. Health and climate change
1. Health and cities
Cities emit 70% of greenhouse gases (UN-Habitat, 2011) and consume 80% of the energy produced worldwide (Sánchez, 2013). In 1950, just 41% of the population of Latin America and the Caribbean lived in urban areas (ECLAC, 2013), but now the figure is 80% (ECLAC/MINURVI/UN-Habitat, 2016). This urbanization process has had favourable economic and social consequences, such as greater dynamism in production activities, the development of services, increased productivity and the harnessing of economies of scale (ECLAC/MINURVI/UN-Habitat, 2016; McGranahan and Satterthwaite, 2014). However, urbanization has also given rise to negative externalities such as air pollution, greenhouse gas generation, road accidents, road congestion, health problems and water pollution, which are eroding the foundations of economic dynamism (ECLAC, 2015a).

80 Economic Commission for Latin America and the Caribbean (ECLAC)
This complex mix of negative externalities is inseparable from the current style of development (Galindo and others, 2015) and suggests that business as usual is unsustainable in the long run. For example, transport in the region’s urban areas has costs associated with traffic accidents, vehicle congestion, the construction of infrastructure that fosters CO2 emissions and air pollution, with significant effects on the health and well-being of the population (Parry and Small, 2005; Bell and others, 2006; Hernández and Antón, 2014; Borja-Aburto and others, 1998; Rosales-Castillo and others, 2001). Increased vehicle traffic is negatively affecting productivity (Weisbrod, Vary and Treyz, 2003; Hymel, 2009; Harriet, Poku and Emmanuel, 2013; Salon and others, 2012; Litman and Laube, 2002; Litman, 2014; Olawale, Adebambo and Boye, 2015; Schwartz and Rosen, 2015; Mpogole and Msangi, 2016). Empirical research has found a statistically significant positive link between increased mobility and urban development, improved productivity and higher incomes (Prud’homme and Lee, 1999; Cervero, 2001; Graham, 2007; Broersma and Van Dijik, 2007; Hymel, 2009).
In addition, negative externalities are highly likely to intensify if a development style that encourages private transport use is maintained. For example, in Latin America and the Caribbean there are now 199 vehicles per 1,000 inhabitants (see figure II.9). However, this is much lower than the average for developed countries (ECLAC, 2014b), which differ significantly in motorization rates. The rate in Europe is almost twice as high as in the region (577 vehicles per 1,000 inhabitants) but lower than in the United States and Canada (806 vehicles per 1,000 inhabitants), which indicates that urban layout and the availability and quality of public transport influence automobile use, and thus that the region ought to make decisions about its system of urban mobility (see figure II.10).
Although the level of motorization is relatively low in Latin America and the Caribbean, however, health standards are being dangerously breached in a considerable number of cities (see figure II.11). It is also important to bear in mind that greenhouse gas emissions from the burning of fossil fuels are accompanied by the emission of other locally regulated pollutants (such as suspended particles and sulphur and nitrogen oxides) that have major negative health effects.
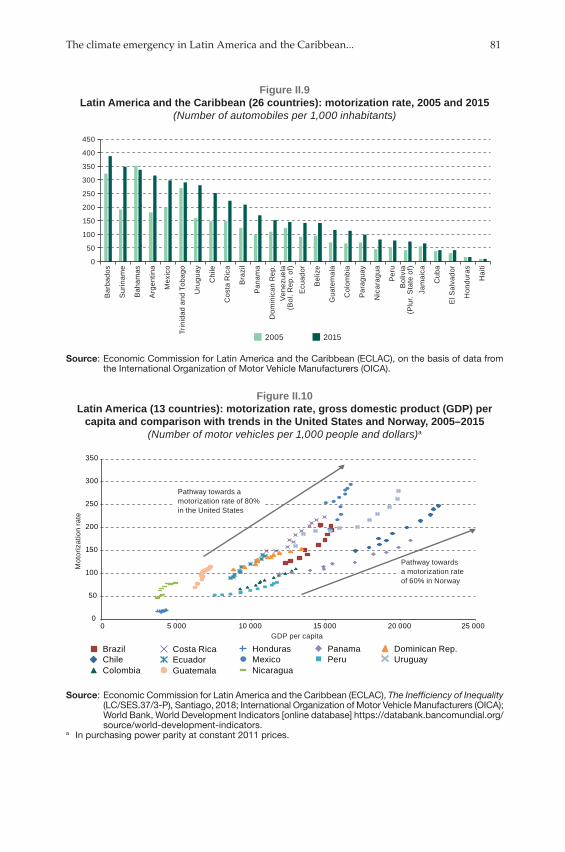
The climate emergency in Latin America and the Caribbean... 81
Figure II.9 Latin America and the Caribbean (26 countries): motorization rate, 2005 and 2015
(Number of automobiles per 1,000 inhabitants)
2005 2015
0
50
100
150
200
250
300
350
400
450
Bar
bado
s
Sur
inam
e
Bah
amas
Arg
entin
a
Mex
ico
Trin
idad
and
Tob
ago
Uru
guay
Chi
le
Cos
ta R
ica
Bra
zil
Pana
ma
Dom
inic
an R
ep.
Vene
zuel
a(B
ol. R
ep. o
f)Ec
uado
r
Bel
ize
Gua
tem
ala
Col
ombi
a
Para
guay
Nic
arag
ua
Peru
Bol
ivia
(Plu
r. S
tate
of)
Jam
aica
Cub
a
El S
alva
dor
Hon
dura
s
Hai
ti
Source: Economic Commission for Latin America and the Caribbean (ECLAC), on the basis of data from the International Organization of Motor Vehicle Manufacturers (OICA).
Figure II.10 Latin America (13 countries): motorization rate, gross domestic product (GDP) per
capita and comparison with trends in the United States and Norway, 2005–2015(Number of motor vehicles per 1,000 people and dollars)a
0
50
100
150
200
250
300
350
0 5 000 10 000 15 000 20 000 25 000
Mot
oriz
atio
n ra
te
GDP per capita
BrazilChileColombia
Costa RicaEcuadorGuatemala
HondurasMexicoNicaragua
PanamaPeru
Dominican Rep.Uruguay
Pathway towards a motorization rate of 80% in the United States
Pathway towards a motorization rate of 60% in Norway
Source: Economic Commission for Latin America and the Caribbean (ECLAC), The Inefficiency of Inequality (LC/SES.37/3-P), Santiago, 2018; International Organization of Motor Vehicle Manufacturers (OICA); World Bank, World Development Indicators [online database] https://databank.bancomundial.org/source/world-development-indicators.
a In purchasing power parity at constant 2011 prices.

82 Economic Commission for Latin America and the Caribbean (ECLAC)
Figure II.11 Latin America and the Caribbean (20 cities): concentrations of coarse particulate
matter (PM10) and fine particulate matter (PM2.5), around 2016(Micrograms per cubic metre)
0
10
20
30
40
50
60
70
80
90
La P
az (B
oliv
ia(P
lur.
Sta
te o
f))(2
010-
2013
)
San
tiago
(200
9-20
14)
Med
ellin
(Col
ombi
a)(2
010-
2015
)S
an S
alva
dor
(201
0-20
16)
Lim
a(2
010-
2016
)
Cue
nca
(Ecu
ador
)(2
010-
2017
)
Gua
tem
ala
City
(201
1-20
14)
Rio
de
Jane
iro(B
razi
l)(2
010-
2015
)
San
tiago
de
Cal
i(2
010-
2016
)
Tegu
ciga
lpa
(201
4-20
16)
Mex
ico
City
(201
0-20
16)
Qui
to(2
010-
2016
)
Bog
ota
(201
2-20
16)
São
Pau
lo (B
razi
l)(2
010-
2016
)
San
Jos
é(2
011-
2013
)
Bue
nos
Aire
s(2
010-
2012
)
Mon
tevi
deo
(200
9-20
14)
A. Average annual concentrations of PM10
B. Average annual concentrations of PM2.5
0
5
10
15
20
25
30
35
40
45
La P
az (B
oliv
ia(P
lur.
Sta
te o
f))(2
010-
2013
)
Lim
a(2
010-
2016
)
Med
ellin
(Col
ombi
a)(2
010-
2015
)
Gua
tem
ala
City
(201
1-20
14)
Sant
iago
(200
6-20
14)
San
Salv
ador
(201
0-20
16)
Tegu
ciga
lpa
(201
4-20
16)
San
José
(201
1-20
13)
Mex
ico
City
(201
0-20
16)
Sant
iago
de
Cal
i(2
010-
2016
)
Qui
to(2
010-
2016
)
São
Pau
lo (B
razi
l)(2
010-
2016
)
Bogo
ta(2
012-
2016
)
Buen
os A
ires
(201
0-20
16)
Rio
de
Jane
iro(B
razi
l)(2
010-
2015
)
Cue
nca
(Ecu
ador
)(2
010-
2017
)
2016 2010 World Health Organization limitEuropean Union limit
Source: Economic Commission for Latin America and the Caribbean (ECLAC), on the basis of World Health Organization (WHO), Ambient Air Pollution Database, 2017 [online] https://www.who.int/airpollution/data/cities/en/.
The increase in the use of private transport and the resulting consumption of petrol is the main urban contributor to greenhouse gas emissions. The associated local pollutants cause respiratory diseases, asthma and bronchitis, with the greatest effects being on children and those over the age of 65 (Cropper and Sahin, 2009; Lozano, 2004; Pino and others, 2004; Barnett and others, 2005).
Furthermore, the effects of local air pollution on the health of the population have intensified as a result of climate change (IPCC, 2013a). It has been concluded with medium confidence that a rise in local surface temperatures can trigger chemical feedback effects that increase maximum levels of ozone and fine particulate matter (PM2.5), which would have adverse consequences
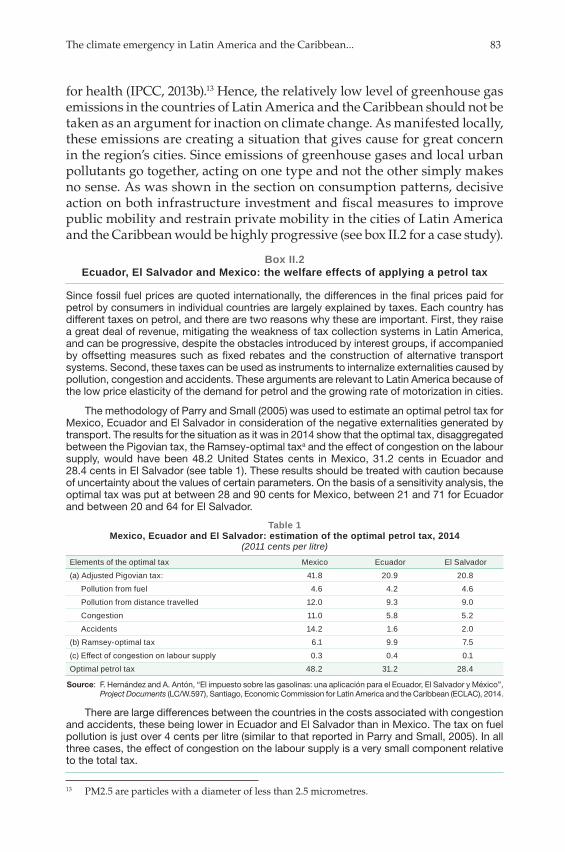
The climate emergency in Latin America and the Caribbean... 83
for health (IPCC, 2013b).13 Hence, the relatively low level of greenhouse gas emissions in the countries of Latin America and the Caribbean should not be taken as an argument for inaction on climate change. As manifested locally, these emissions are creating a situation that gives cause for great concern in the region’s cities. Since emissions of greenhouse gases and local urban pollutants go together, acting on one type and not the other simply makes no sense. As was shown in the section on consumption patterns, decisive action on both infrastructure investment and fiscal measures to improve public mobility and restrain private mobility in the cities of Latin America and the Caribbean would be highly progressive (see box II.2 for a case study).
Box II.2 Ecuador, El Salvador and Mexico: the welfare effects of applying a petrol tax
Since fossil fuel prices are quoted internationally, the differences in the final prices paid for petrol by consumers in individual countries are largely explained by taxes. Each country has different taxes on petrol, and there are two reasons why these are important. First, they raise a great deal of revenue, mitigating the weakness of tax collection systems in Latin America, and can be progressive, despite the obstacles introduced by interest groups, if accompanied by offsetting measures such as fixed rebates and the construction of alternative transport systems. Second, these taxes can be used as instruments to internalize externalities caused by pollution, congestion and accidents. These arguments are relevant to Latin America because of the low price elasticity of the demand for petrol and the growing rate of motorization in cities.
The methodology of Parry and Small (2005) was used to estimate an optimal petrol tax for Mexico, Ecuador and El Salvador in consideration of the negative externalities generated by transport. The results for the situation as it was in 2014 show that the optimal tax, disaggregated between the Pigovian tax, the Ramsey-optimal taxa and the effect of congestion on the labour supply, would have been 48.2 United States cents in Mexico, 31.2 cents in Ecuador and 28.4 cents in El Salvador (see table 1). These results should be treated with caution because of uncertainty about the values of certain parameters. On the basis of a sensitivity analysis, the optimal tax was put at between 28 and 90 cents for Mexico, between 21 and 71 for Ecuador and between 20 and 64 for El Salvador.
Table 1 Mexico, Ecuador and El Salvador: estimation of the optimal petrol tax, 2014
(2011 cents per litre)Elements of the optimal tax Mexico Ecuador El Salvador(a) Adjusted Pigovian tax: 41.8 20.9 20.8
Pollution from fuel 4.6 4.2 4.6Pollution from distance travelled 12.0 9.3 9.0Congestion 11.0 5.8 5.2Accidents 14.2 1.6 2.0
(b) Ramsey-optimal tax 6.1 9.9 7.5(c) Effect of congestion on labour supply 0.3 0.4 0.1Optimal petrol tax 48.2 31.2 28.4
Source: F. Hernández and A. Antón, “El impuesto sobre las gasolinas: una aplicación para el Ecuador, El Salvador y México”, Project Documents (LC/W.597), Santiago, Economic Commission for Latin America and the Caribbean (ECLAC), 2014.
There are large differences between the countries in the costs associated with congestion and accidents, these being lower in Ecuador and El Salvador than in Mexico. The tax on fuel pollution is just over 4 cents per litre (similar to that reported in Parry and Small, 2005). In all three cases, the effect of congestion on the labour supply is a very small component relative to the total tax.
13 PM2.5 are particles with a diameter of less than 2.5 micrometres.

84 Economic Commission for Latin America and the Caribbean (ECLAC)
In Mexico and Ecuador, applying the optimal tax could bring welfare gains of 12.9% and 11.8%, respectively (see table 2). This gain is measured as the percentage change in expenditure relative to the original pre-tax expenditure on petrol. In El Salvador, the gain would be only 0.6%. This difference is the result of the gap between the current tax and the optimal tax. A petrol tax of zero cents would have resulted in a small increase in welfare in Mexico in 2014, when there was an occasional subsidy. The tax charged in El Salvador, meanwhile, was 2.6 times below the optimal level. Had the tax been zero cents, there would have been a small reduction in welfare.
Table 2 Mexico, Ecuador and El Salvador: welfare effects of applying
a petrol tax, 2014a
MexicoProportion of the optimal
petrol taxTax
(cents/litre)Change in welfare
(percentage)
Optimal taxt*F = 48.2
0 0 2.90.25 t*F 12.0 8.10.50 t*F 24.1 11.10.75 t*F 36.1 12.5
1 (t*F) 48.2 12.91.25 t*F 60.2 12.61.50 t*F 72.2 11.7
EcuadorProportion of the optimal
petrol taxTax
(cents/litre)Change in welfare
(percentage)
Optimal taxt*F = 31.2
0 0 0.00.25 t*F 7.8 6.20.50 t*F 15.6 9.70.75 t*F 23.4 11.4
1 (t*F) 31.2 11.81.25 t*F 39.0 11.41.50 t*F 46.8 10.4
El SalvadorProportion of the optimal
petrol taxTax
(cents/litre)Change in welfare
(percentage)
Optimal taxt*F = 28.4
0 0 -1.10.25 t*F 7.1 -0.30.50 t*F 14.2 0.20.75 t*F 21.3 0.5
1 (t*F) 28.4 0.61.25 t*F 35.5 0.51.50 t*F 42.6 0.3
Source: F. Hernández and A. Antón, “El impuesto sobre las gasolinas: una aplicación para el Ecuador, El Salvador y México”, Project Documents (LC/W.597), Santiago, Economic Commission for Latin America and the Caribbean (ECLAC), 2014.
a With respect to the current rate, as a percentage of initial spending before tax.
Source: Prepared by the authors, on the basis of F. Hernández and A. Antón, “El impuesto sobre las gasolinas: una aplicación para el Ecuador, El Salvador y México”, Project Documents (LC/W.597), Santiago, Economic Commission for Latin America and the Caribbean (ECLAC), 2014; I. Parry and K. Small, “Does Britain or the United States have the right gasoline tax?”, American Economic Review, vol. 95, No. 4, Nashville, American Economic Association (AEA), 2005.
a Ramsey’s (1927) tax rule suggests that goods that are highly complementary with leisure should be subject to high taxes. This is because pure leisure is not taxed; therefore, the second-best solution is to levy high taxes on market goods that are complements to leisure. In this case, petrol is considered a weak substitute for leisure.
Box II.2 (concluded)

The climate emergency in Latin America and the Caribbean... 85
2. Other effects and changes in disease vectors
The effects of climate change on health also include other disease transmission channels such as heatwaves, an increase in the distribution areas of malaria and dengue vectors because of changes in precipitation and temperature, flood-related diarrhoeal diseases (IPCC, 2007a and 2014b; WHO/WMO/UNEP, 2008) and respiratory diseases, Chagas disease, bronchial asthma and bronchopneumonia (McMichael, 1993; Schwartz, Levin and Hodge, 1997; Checkley and others, 2000; Patz and others, 2000).
In Latin America, the main health effects associated with climate change are malaria, dengue, heat stress and cholera (Magrin and others, 2007). The greatest risk of malaria transmission is in the tropical and subtropical regions of South America (WHO/WMO/UNEP, 2008). The risk of contracting dengue fever, meanwhile, is highly sensitive to even very small changes in temperature (WHO, 2004; Hales and others, 2002; Confalonieri and others, 2007). Brazil, Honduras, Guatemala and Nicaragua are the countries with the largest number of reported cases of dengue fever between 1990 and 2007. And although it is not easy to attribute outbreaks to climate change, its effect on all these elements creates additional burdens for health systems and extra barriers to overcoming poverty.
F. The impact of rising sea levels on coasts
The sea level is currently rising at an average global rate of 3.3 millimetres per year, and could rise by between 40 and 63 cm by the end of the twenty-first century (IPCC, 2013b). In Latin America and the Caribbean, the sea level rose by between 2 and 7 mm a year between 1950 and 2008; the smallest increase was off Ecuador and the largest off northern Brazil and the Bolivarian Republic of Venezuela. Projections by the Environmental Hydraulics Institute of the University of Cantabria (IHCantabria) (ECLAC, 2011b) indicate that the greatest increase between 2010 and 2040 will be on the Atlantic coast, particularly off the northern coast of South America and the Caribbean islands. The average sea level rise is also projected to accelerate between 2040 and 2070, perhaps to as much as 3.6 millimetres a year (see map II.1).

86 Economic Commission for Latin America and the Caribbean (ECLAC)
Map II.1 Latin America and the Caribbean: average rise of the mean sea level in the periods
2010–2040 and 2040–2070(Millimetres per year)
4.0
3.6
3.2
2.8
2.4
2.0
1.6
1.2
0.8
0.4
0
45º S
30º S
15º S
0º N
15º N
30º N
45º S
30º S
15º S
0º N
15º N
30º N
120º O 90º O 60º O 30º O 120º O 90º O 60º O 30º O
A. 2010-2040 A. 2040-2070
Source: Economic Commission for Latin America and the Caribbean (ECLAC), “Efectos del cambio climático en la costa de América Latina y el Caribe: dinámicas, tendencias y variabilidad climática”, Project Documents (LC/W.447/Rev.1), Santiago, 2011.
In this context, besides the rise in sea level, changes are occurring in wave characteristics and heights, penetration inland, surface water temperature, salinity, the meteorological component of tides and the dynamics of extreme events (hurricanes and El Niño Southern Oscillation). This will increase the complexity of impacts and the vulnerability of the region’s socioeconomic and ecological systems. Thus, the expectation is of increased coastal erosion, greater bleaching of corals, a reduction in some tourist uses and beach coastal defence, a loss of port infrastructure operability, impaired maritime works safety and greater flooding of ecosystems (ECLAC, 2012a). Coastal dynamics and the possible impacts of alterations to them due to climate change are shown in map II.2.
The physical and socioeconomic characteristics of the region, with its many island developing countries, a high proportion of the population living in coastal areas and the likely increase in the construction of infrastructure in vulnerable areas, may intensify the effects of rising sea levels (ECLAC, 2012a). This should spur planners to modernize authorization procedures for building in zones affected by sea level rise, including adjustments to enforceable requirements in environmental impact statements and the land-use planning process. Furthermore, given that investment decisions have two-way economic effects, for example when it comes to the construction of tourist infrastructure, these modernization efforts should be coordinated between countries in the region that are recipients of foreign investment in infrastructure.

The climate emergency in Latin America and the Caribbean... 87
Map II.2 Latin America and the Caribbean: impact of climate change on coastal areas
and coastal dynamicsA. Coastal impacts B. Coastal dynamics
>2 to 3 mm/year in extreme flooding
Sea level rise of 2 mm/year
>0.2 °C/year clockwise
>0.3 °C/year clockwise
5 mm/year in storm surges
>0.3 °C/year counterclockwise
Generalized beach erosion of 0.16 to 0.3 m/year due
to sea level rise Interannual variability of El Niño Southern
Oscillation of the same order of magnitude as
sea level rise in the last six decades
FloodingUrban areas affected by floodingInfrastructure affected below 1 m>40% of change over the last 60 years in the 100-year total sea level (excluding hurricanes)>6 mm/year in extreme coastal flooding
Beach erosionChanges in potential sediment transport rateErosion due to beach rotation
SeaportsSeaport shipping operations may be affected due to increase in wave heightsReduction in the reliability of coastal structures>0.3 m/year in Hs12<0.1 m/year in annual mean wave heightsLower sea level rise detected (approximately 1 mm/year)30% to 40% change in 50-year flooding event between decades of 1950 to 1960 and 1998 to 2008Annual mean energy flux direction shift (°C/year)Strong trends found in storm surge extremes
-2 mm/year in storm surges
Source: Intergovernmental Panel on Climate Change (IPCC), “Central and South America”, Climate Change 2014: Impacts, Adaptation, and Vulnerability. Volume II: Regional Aspects, V. Barros and others (eds.), Cambridge, Cambridge University Press, 2014.
Note: “Hs12” means significant wave height exceeded 12 hours per year on average, determining how robust port infrastructure needs to be to remain operational. A “50-year flooding event” means an event whose scale is such that it only occurs once every 50 years. There are also larger events that are accordingly less frequent and more spaced out, occurring for example every 100 years or more.
Loss of port operability and safety and damage to infrastructure have economic, social and environmental costs, and the functionality and operability of much port infrastructure will have to be reassessed with a view to adaptation. This problem also arises in coastal cities, where most defence, transport, water supply, energy and sanitation infrastructure has been designed for climatic conditions that are going to change substantially. The tourism sector, meanwhile, may be affected by erosion, receding beaches, extreme events and the appearance of invasive species, as is already happening with the proliferation of sargasso in large areas of the Caribbean. At the

88 Economic Commission for Latin America and the Caribbean (ECLAC)
same time, the impact of climate change on marine and coastal ecosystems is occurring in a context of existing vulnerability resulting from the human activities taking place around them (tourism, unplanned urban growth, pollution from land-based sources and aquaculture), which threatens fishery resources, corals and mangroves (IPCC, 2014a; ECLAC, 2012a). Some of these effects are already evident, such as the bleaching of Mesoamerican coral, associated with rising sea temperatures and acidification, and the loss of mangroves in Central and South America (Magrin and others, 2014).
This shows the need to implement adaptation measures that can reduce these vulnerabilities. Accordingly, construction sector regulations must be improved to accommodate the effects of climate change and ensure that infrastructure continues to function when extreme events take place. Projections of rising sea levels should be officially included in land-use plans for coastal areas, and mechanisms for transferring risks associated with port and coastal infrastructure through the insurance market need to be developed.
G. Biodiversity, forests and climate change
Latin America and the Caribbean has a variety of climates and ecosystems that results in great biological diversity (Magrin and others, 2014; Guevara and Laborde, 2008; Mittermeier, Robles and Mittermeier, 1997; Székely, 2009): 178 ecological regions representing more than 50% of the planet’s biodiversity have been identified there, and it contains 21% of the world’s terrestrial ecoregions, 22% of freshwater ecoregions and 16% of marine ecoregions (ECLAC, 2014b), as well as the habitats of 40% of the world’s species of flora and fauna (Galindo and others, 2017a). Between 25% and 50% of species in Latin America and the Caribbean are endemic (Herzog and others, 2011) and particularly susceptible to the effects of climate change because of the difficulty they have adapting to different habitats (IPCC, 2002). There is also a great area of forest, totalling 935 million hectares and representing 23% of the world total as of 2015 (see figure II.12), but dwindling because of changing land use. Of this area, 47% was primary forest, equivalent to 34% of all the world’s primary forest.14
14 Forested areas were calculated from FAO (2015).

The climate emergency in Latin America and the Caribbean... 89
Figure II.12 Latin America and the Caribbean: forest cover, 1990-2015
(Thousands of hectares and percentages)
23.0
23.5
24.0
24.5
25.0
25.5
26.0
880 000
900 000
920 000
940 000
960 000
980 000
1 000 000
1 020 000
1 040 000
1990 2000 2005 2010 2015Forest area
Thousands of hectares of forest (left scale)
Forest cover in Latin America and the Caribbean as percentage of world total (right scale)
Source: Economic Commission for Latin America and the Caribbean (ECLAC), on the basis of Food and Agriculture Organization of the United Nations (FAO), Global Forest Resources Assessment 2015: Desk Reference, Rome, 2015.
Note: FAO (2015) provides the latest figures available at the time of writing. The regional totals are based on figures for the countries that have full time series for the years analysed: 1990, 2000, 2005, 2010 and 2015.
This natural wealth of the region’s is at risk because of a complex mix of factors that is being compounded by climate change. The latter is hastening the loss of biodiversity, altering habitats and favouring invasive species, on top of which there is the direct harm done by overexploitation and pollution. The negative effects on biodiversity in the region are explained by the great sensitivity of ecosystems and the difficulty species have adapting to new climate conditions (Magrin and others, 2014). Negative consequences are therefore expected for populations dependent on agriculture, fishing and tourism, which require biological and ecosystem resources to be preserved.
The region contains 5 of the 20 countries with the world’s largest numbers of threatened species of fauna (Brazil, Colombia, Ecuador, Mexico and Peru) and 7 of the 20 with the largest numbers of threatened plant species (Brazil, Colombia, Cuba, Jamaica, Mexico, Panama and Peru) (UNEP, 2010). In other words, biodiversity in the region is already vulnerable and is fundamentally threatened by habitat destruction and overexploitation of species, on top of which comes the effect of climate change on biomes. The transformation of the landscape by land use change is also driving climate change. Figure II.13 shows the number of threatened bird and fish species.

90 Economic Commission for Latin America and the Caribbean (ECLAC)
Figure II.13 Latin America and the Caribbean (33 countries): threatened species,
by taxonomic group, 2013 and 2016(Units)
A. Fish
0
20
40
60
80
100
120
140
160
180
Ant
igua
and
Bar
buda
Arg
entin
aB
aham
asB
arba
dos
Bel
ize
Bol
ivia
(Bol
. Rep
. of)
Bra
zil
Chi
leC
olom
bia
Cos
ta R
ica
Cub
aD
omin
ica
Dom
inic
an R
ep.
Ecua
dor
El S
alva
dor
Gre
nada
Gua
tem
ala
Guy
ana
Hai
tiH
ondu
ras
Jam
aica
Mex
ico
Nic
arag
uaPa
nam
aPa
ragu
ayPe
ruS
aint
Kitt
s an
d N
evis
Sai
nt L
ucia
Sai
nt V
ince
nt a
ndth
e G
rena
dine
sS
urin
ame
Trin
idad
and
Tob
ago
Uru
guay
Vene
zuel
a(B
ol. R
ep. o
f)
B. Birds
0
20
40
60
80
100
120
140
160
180
Ant
igua
and
Bar
buda
Arg
entin
aB
aham
asB
arba
dos
Bel
ize
Bol
ivia
(Plu
r. S
tate
of)
Bra
zil
Chi
leC
olom
bia
Cos
ta R
ica
Cub
aD
omin
ica
Dom
inic
an R
ep.
Ecua
dor
El S
alva
dor
Gre
nada
Gua
tem
ala
Guy
ana
Hai
tiH
ondu
ras
Jam
aica
Mex
ico
Nic
arag
uaPa
nam
aPa
ragu
ayPe
ruS
aint
Kitt
s an
d N
evis
Sai
nt L
ucia
Sai
nt V
ince
nt a
ndth
e G
rena
dine
sS
urin
ame
Trin
idad
and
Tob
ago
Uru
guay
Vene
zuel
a(B
ol. R
ep. o
f)
2013 2016
Source: Economic Commission for Latin America and the Caribbean (ECLAC), on the basis of World Bank, World Development Indicators [online database] https://databank.bancomundial.org/source/world-development-indicators; International Union for Conservation of Nature (IUCN).
Note: Threatened species are those that the International Union for the Conservation of Nature (IUCN) has classified as endangered, vulnerable, rare, indeterminate, out of danger or insufficiently known.
Climate change is intensified by processes such as land use change and deforestation, the very processes that are having such a strong impact on biodiversity in Latin America. For example, land use change has already engendered six hotspots for biodiversity loss: Mesoamerica, the Chocó-Darién-Western Ecuador Hotspot, the tropical Andes, central Chile, the Brazilian Atlantic forest and the Brazilian Cerrado (Mittermeier

The climate emergency in Latin America and the Caribbean... 91
and others, 2005). Deforestation may take the Amazon rainforest over a critical threshold whereby, what with temperature increases and changes in precipitation patterns, irreversible harm is done to biodiversity (IPCC, 2014a). Thus, climate change will accelerate the loss of species of flora and fauna, degrade ecosystems and lead to further losses of the ecosystem goods and services these provide. Ecosystems already negatively affected by human activities will be damaged yet further (see map II.3).
Map II.3 Latin America: expected impact of climate change on biodiversity, 2050
Malaria
Precipitation
Areas currently affected
Possible extent by 2050
Increase
Decrease
Coasts threatened by sea level riseCities threatened by sea level rise
Reduced water availability
Negative effects on fisheries
Negative effects on agriculture
Shrinking of glaciersIncreased risk of forest firesIncreased aridity and reduction of water resourcesEcosystem changesNegative impacts on mountain regionsOzone depletion
Increased vulnerability to extremeatmospheric eventsBiodiversity threatened
Coral reefs and mangroves threatened
Risk of desertification
Source: Economic Commission for Latin America and the Caribbean/United Nations Environment Programme (ECLAC/UNEP), Gráficos Vitales del Cambio Climático para América Latina y el Caribe (DEW/1327/PA), Santiago, 2010.
In addition, transformations in biodiversity have collateral effects on climate. In the Amazon basin, for example, 50% of rainfall originates from surface evaporation and water transpired by vegetation. Reducing this coverage can be expected to lead to a 20% reduction in rainfall and an increase in surface temperature (IPCC, 2007a; Nobre, 2014).

92 Economic Commission for Latin America and the Caribbean (ECLAC)
The economic, social and environmental importance of conserving biodiversity lies in the goods and services it provides for economic activities and social welfare. Ecosystems provide four types of services (Galindo and others, 2017a):
(i) Provisioning in the form of food or production inputs. For example, the conservation of coastal areas, mangroves and coral reefs is essential to the productivity of fishing activities (Millennium Ecosystem Assessment, 2005).
(ii) The regulation services generated by natural ecosystem processes, such as soil formation, nutrient cycling and primary production, which maintain living conditions on the planet (Millennium Ecosystem Assessment, 2005).
(iii) Support services provided indirectly by natural ecosystem processes, such as improved air quality, climate regulation, erosion control, maintenance of nutrient cycles, and water purification (López and Montes, 2011; Millennium Ecosystem Assessment, 2005). For example, water quality in natural springs and temporary water flows are regulated by vegetation, microorganisms and the soil itself.
(iv) Cultural services, which are non-material benefits obtained from ecosystems in the form of spiritual enrichment, scenic beauty, artistic and intellectual inspiration, cognitive development, reflection, recreation and aesthetic experiences (Millennium Ecosystem Assessment, 2005). For example, the aesthetic beauty offered by biodiversity is the basis for activities such as ecotourism, which accounts for 7% of world tourism (Gómez and Ortega, 2007).
There are a wide range of policies for climate change adaptation and mitigation and for biodiversity conservation in the region (see table II.6) (Galindo and others, 2017a), and the region now has 4 million km2 of protected areas, representing 20% of the world total (ECLAC/ILO/FAO, 2012; UNEP, 2010; ECLAC, 2015a). Strategies, activities and projects related to ecosystem-based adaptation have also been progressively incorporated into climate change response plans and programmes in several countries (Vergara and others, 2014). Given that ecosystems are natural buffers for extreme weather events, such measures may ultimately be more efficient and effective than the development of physical engineering structures if implemented through appropriate management processes (Colls, Ash and Ikkala, 2009).15
15 For example, mangroves could be used instead of artificial breakwaters, upper basins could be forested to retain soil and prevent sedimentation in low-lying areas, or slopes could be forested to protect against landslides, etc.

The climate emergency in Latin America and the Caribbean... 93
Tabl
e II.
6 La
tin A
mer
ica
and
the
Car
ibbe
an (1
8 co
untr
ies)
: pol
icie
s re
late
d to
clim
ate
chan
ge a
nd b
iodi
vers
ity
Cou
ntry
/act
ivity
Clim
ate
chan
ge
miti
gatio
n
Stre
ngth
enin
g of
nat
ural
pr
otec
ted
area
s
Adap
tatio
n to
cl
imat
e ch
ange
Con
serv
atio
n an
d m
anag
emen
t of
wat
er re
sour
ces
Obs
erva
tion
and
mon
itorin
g
Con
serv
atio
n an
d m
anag
emen
t of
fore
st
reso
urce
s
Paym
ent f
or
envi
ronm
enta
l se
rvic
es
Red
uctio
n of
er
osio
n
Arg
entin
aB
oliv
ia (P
lurin
atio
nal
Sta
te o
f)B
razi
lC
hile
Col
ombi
aC
osta
Ric
aC
uba
Dom
inic
an R
epub
licEc
uado
rEl
Sal
vado
rG
uate
mal
aH
ondu
ras
Mex
ico
Nic
arag
uaPa
nam
aPa
ragu
ayPe
ruVe
nezu
ela
(Bol
ivar
ian
Rep
ublic
of)
So
urce
: L. G
alin
do
and
oth
ers,
“P
roce
sos
de
adap
taci
ón a
l cam
bio
clim
átic
o: a
nális
is d
e A
mér
ica
Latin
a”, S
ínte
sis
de
Pol
ítica
s P
úblic
as s
obre
Cam
bio
Clim
átic
o, S
antia
go,
Eur
opea
n U
nion
/Eco
nom
ic C
omm
issi
on fo
r La
tin A
mer
ica
and
the
Car
ibb
ean
(EC
LAC
), 20
17.
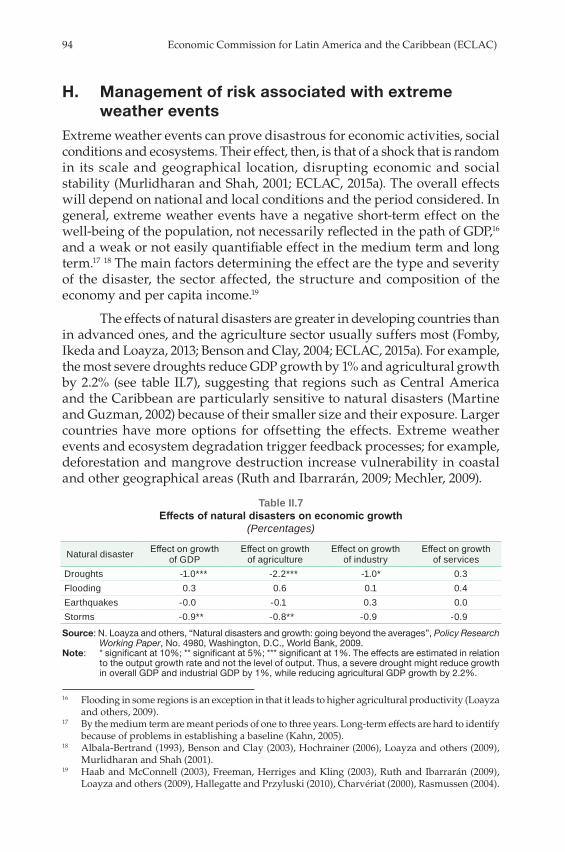
94 Economic Commission for Latin America and the Caribbean (ECLAC)
H. Management of risk associated with extreme weather events
Extreme weather events can prove disastrous for economic activities, social conditions and ecosystems. Their effect, then, is that of a shock that is random in its scale and geographical location, disrupting economic and social stability (Murlidharan and Shah, 2001; ECLAC, 2015a). The overall effects will depend on national and local conditions and the period considered. In general, extreme weather events have a negative short-term effect on the well-being of the population, not necessarily reflected in the path of GDP,16 and a weak or not easily quantifiable effect in the medium term and long term.17 18 The main factors determining the effect are the type and severity of the disaster, the sector affected, the structure and composition of the economy and per capita income.19
The effects of natural disasters are greater in developing countries than in advanced ones, and the agriculture sector usually suffers most (Fomby, Ikeda and Loayza, 2013; Benson and Clay, 2004; ECLAC, 2015a). For example, the most severe droughts reduce GDP growth by 1% and agricultural growth by 2.2% (see table II.7), suggesting that regions such as Central America and the Caribbean are particularly sensitive to natural disasters (Martine and Guzman, 2002) because of their smaller size and their exposure. Larger countries have more options for offsetting the effects. Extreme weather events and ecosystem degradation trigger feedback processes; for example, deforestation and mangrove destruction increase vulnerability in coastal and other geographical areas (Ruth and Ibarrarán, 2009; Mechler, 2009).
Table II.7 Effects of natural disasters on economic growth
(Percentages)
Natural disaster Effect on growth of GDP
Effect on growth of agriculture
Effect on growth of industry
Effect on growth of services
Droughts -1.0*** -2.2*** -1.0* 0.3Flooding 0.3 0.6 0.1 0.4Earthquakes -0.0 -0.1 0.3 0.0Storms -0.9** -0.8** -0.9 -0.9
Source: N. Loayza and others, “Natural disasters and growth: going beyond the averages”, Policy Research Working Paper, No. 4980, Washington, D.C., World Bank, 2009.
Note: * significant at 10%; ** significant at 5%; *** significant at 1%. The effects are estimated in relation to the output growth rate and not the level of output. Thus, a severe drought might reduce growth in overall GDP and industrial GDP by 1%, while reducing agricultural GDP growth by 2.2%.
16 Flooding in some regions is an exception in that it leads to higher agricultural productivity (Loayza and others, 2009).
17 By the medium term are meant periods of one to three years. Long-term effects are hard to identify because of problems in establishing a baseline (Kahn, 2005).
18 Albala-Bertrand (1993), Benson and Clay (2003), Hochrainer (2006), Loayza and others (2009), Murlidharan and Shah (2001).
19 Haab and McConnell (2003), Freeman, Herriges and Kling (2003), Ruth and Ibarrarán (2009), Loayza and others (2009), Hallegatte and Przyluski (2010), Charvériat (2000), Rasmussen (2004).

The climate emergency in Latin America and the Caribbean... 95
Natural disasters also have collateral effects, for example on the public finances and infrastructure and in the form of property losses, lifestyle changes and disruption of transport and international trade, while reinforcing poverty traps (Caballeros-Otero and Zapata, 1995; Murlidharan and Shah, 2001; Mechler, 2009). Natural disasters have a negative impact on social conditions, with the poor (particularly children and the elderly) generally being hardest hit because they usually live in high-risk areas, depend on a single income source, do not have a cushion of assets or savings, do not have access to credit or insurance and are less educationally equipped to deal with such disasters (Kalkstein and Sheridan, 2007; Pelling, Özerdem and Barakat, 2002; Kahn, 2005; Kelly and Adger, 2000). Climate variability is one of the main factors causing fluctuations in farm incomes, as discussed in the section dealing with the impact on agriculture, and this most strongly affects lower-income groups, who may require up to a decade to replenish their livestock after a climate shock (Dercon, 2006; Rosenzweig and Binswanger, 1993; Rasmussen, 2004).
Natural disasters also have long-term repercussions; for example, they affect education by increasing school absenteeism, which is not then recovered, and they contribute to malnutrition, which reduces cognitive skills (World Bank, 2010), with all the attendant effects on productivity and long-term incomes (ECLAC, 2015a). The assessment of these effects should always take into account the fact that a high proportion of the region’s population live in conditions of vulnerability (Cecchini and others, 2012; Galindo and others, 2014a).


Chapter III
Central America and the Caribbean: two extreme cases of asymmetry between
low emissions and high vulnerability
In Latin America and the Caribbean, two subregions stand out for their great vulnerability to climate change and the small share of emissions they generate: Central America and the Caribbean. The climatic, geographical and socioeconomic peculiarities of these subregions are justification for analysing them separately. This chapter presents the emissions profiles of the countries of these two subregions and projects them out to 2030 in the context of their nationally determined contributions (NDCs). It also discusses the potential effects of climate change, higher temperatures and rising sea levels before going on to analyse the occurrence and effects of extreme events and, in the particular case of the Caribbean, consider the initiative of the Economic Commission for Latin America and the Caribbean (ECLAC) to have debt swapped for adaptation to climate change.
A. Greenhouse gas emissions in Central America
Central America is a paradigmatic case of asymmetry between greenhouse gas emissions and vulnerability to climate change: it is one of the most vulnerable areas in the world despite emitting just 132 megatons or so of CO2 equivalent (Mt of CO2 eq) in 2016, representing 0.26% of global emissions.1
1 Emissions in the Central American countries are 2.8 tons of CO2 equivalent (t of CO2 eq) per capita, as compared to a global average of 6.7 t of CO2 eq.

98 Economic Commission for Latin America and the Caribbean (ECLAC)
The energy sector2 is the largest source of emissions, accounting for 47% of the total, and electricity generation is the activity that is most intensive in fossil fuel use. The agriculture and livestock sector is the second-largest emitter, with 31%, followed in third place by changes in land use, with 10% (see figure III.1).
Emissions increased by 0.2% per year between 1990 and 2016. Emissions from the energy and industrial processes sectors grew fastest during this period, by an average of about 4.8% per year, while emissions from land use change fell at an average annual rate of 6.1%.
Figure III.1 Central America: greenhouse gas emissions, 1990–2016
A. Emissions by sector, 2016(thousands of tons of CO2 equivalent)
61.7
41.0
13.68.6 6.7
0.90
10
20
30
40
50
60
70
Energy Agricultureand livestock
Land use changeand forestry
Waste Industrialprocesses
Other
B. Sectoral structure of emissions, 2016(percentages)
Energy(47)
Agricultureand livestock
(31)
Land use changeand forestry
(10)
Waste(6)
Industrialprocesses
(5)
Other(1)
2 According to the 2006 IPCC Guidelines for National Greenhouse Gas Inventories (IPCC, 2006), the energy sector comprises mainly: exploration and exploitation of primary energy sources, conversion of primary energy sources into more usable energy forms in refineries and power plants, transmission and distribution of fuels, and use of fuels in stationary and mobile applications. Emissions arise from these activities by combustion and as fugitive emissions, or escape without combustion.

The climate emergency in Latin America and the Caribbean... 99
C. Average annual emissions growth by sector, 1990–2016(percentages)
1.0
4.8 4.73.7
2.5
0.2
-8
-6
-4
-2
0
2
4
6
Agricultureand livestock
Energy Industrialprocesses
Land usechange
Other Waste Total
-6.1
Source: Economic Commission for Latin America and the Caribbean (ECLAC), on the basis of J. Gütschow and others, “The PRIMAP-hist national historical emissions time series”, Earth System Science Data, vol. 8, Göttingen, Copernicus Publications, 2016; Food and Agriculture Organization of the United Nations (FAO), Corporate Database for Substantive Statistical Data (FAOSTAT) [online] http://www.fao.org/faostat/en/.
The countries’ emissions pathways differ considerably.3 In Costa Rica, for example, land use change results in emissions being absorbed, while this same process gives rise to large amounts of emissions in Guatemala, Panama and Belize. However, energy and agriculture play a large role in greenhouse gas emissions in all the countries (see figure III.2).
Figure III.2 Central America (7 countries): emissions by sector and country, 2016
(Megatons of CO2 equivalent)
0.4
5.8
2.6
11.3
6.5
10.9
3.6
0.7
8.7
8.0
17.1
10.8
6.0
10.4
0.0 0.
6
0.7
3.5
0.7
0.3 0.9
3.4
-11.
0
0.7
9.1
1.6
1.3
8.4
0.1 0.1
0.2
0.2
0.1 0.1
0.1 2.
0
1.1 1.9
1.5
1.3
0.8
-15
-10
-5
0
5
10
15
20
Belize Costa Rica El Salvador Guatemala Honduras Nicaragua Panama
Agriculture and livestock Energy Industrial processesLand use change Other Waste
0.0
Source: Economic Commission for Latin America and the Caribbean (ECLAC), on the basis of J. Gütschow and others, “The PRIMAP-hist national historical emissions time series (1850–2016)”, Potsdam, 2018 [online] http://dataservices.gfz-potsdam.de/pik/showshort.php?id=escidoc:3842934.
3 Although information on greenhouse gas emissions is available in the countries from national inventories, it is not continuous and covers different years. For this reason, Gütschow and others (2018) and FAO (2019) are used to harmonize the analysis.
Figure III.1 (concluded)

100 Economic Commission for Latin America and the Caribbean (ECLAC)
Renewables make up a large part of Central America’s energy mix, which means less reliance on imported fossil fuels to generate electricity. This provides energy security while simultaneously yielding environmental, economic and social benefits (see figure III.3).
Figure III.3 Central America (6 countries): energy mix, 2016
(Percentages)
A. Composition of the energy mix
0
20
40
60
80
100
Costa Rica El Salvador Guatemala Honduras Nicaragua Panama CentralAmerica
Coal Oil Natural gasNuclear energy Hydroelectric power Geothermal energySolar, wind andother renewables
Biofuels and waste Other
B. Renewables share of the total energy supply
5146
64
5055
21
52
0
10
20
30
40
50
60
70
Costa Rica El Salvador Guatemala Honduras Nicaragua Panama CentralAmerica
Source: Economic Commission for Latin America and the Caribbean (ECLAC), on the basis of International Energy Agency (IEA).
1. Emissions and land use change in Central America
Forests and natural ecosystems occupy a considerable portion of the territory of the Central American countries. It is estimated that forest areas covered a combined 20.1 million hectares as of 2016, or 39% of the region’s land area. These forests serve a variety of functions that are important for economic activities and social welfare, such as replenishing aquifers, capturing and storing carbon, providing cultural and recreational assets and scenic beauty, and harbouring species of flora and fauna in a variety of ecosystems. However,

The climate emergency in Latin America and the Caribbean... 101
it is observed that direct and indirect anthropogenic activity is now putting heavy pressure on forested areas and that many of these functions receive no monetary compensation, which is contributing to their deterioration.
In 1990, Central America’s forest cover, leaving aside consideration of what state it was in, totalled 27 million hectares. An almost linear decrease in that area reduced it to 20 million hectares by 2016 (see figure III.4). This suggests an average deforestation rate of 27,000 hectares a year in the period 1990–2016. However, the reduction in forest cover has not been uniform in the region, but has differed greatly between countries. For example, cumulative deforestation in El Salvador, Guatemala, Honduras and Nicaragua since 1990 has been particularly high (see figure III.4). The opposite trend can be observed in Costa Rica, where deforestation at a rate of 18,800 ha/year between 1990 and 2000 gave way to reforestation at a rate of approximately 25,600 ha/year in the period 2001–2016.
Figure III.4 Central America (7 countries): changes in forest cover, 1990–2016
A. Forest cover, 1990–2016(millions of hectares)
0
5
10
15
20
25
30
1990
1991
1992
1993
1994
1995
1996
1997
1998
1999
2000
2001
2002
2003
2004
2005
2006
2007
2008
2009
2010
2011
2012
2013
2014
2015
2016
Belize Costa Rica El Salvador GuatemalaHonduras Nicaragua Panama
B. Cumulative change in forest cover, 1990–2016(millions of hectares)
-0.25
0.22
-0.12
-1.24
-3.66
-1.40
-0.44
-6.90
-8 -7 -6 -5 -4 -3 -2 -1 0 1
Belize
Costa Rica
El Salvador
Guatemala
Honduras
Nicaragua
Panama
CentralAmerica
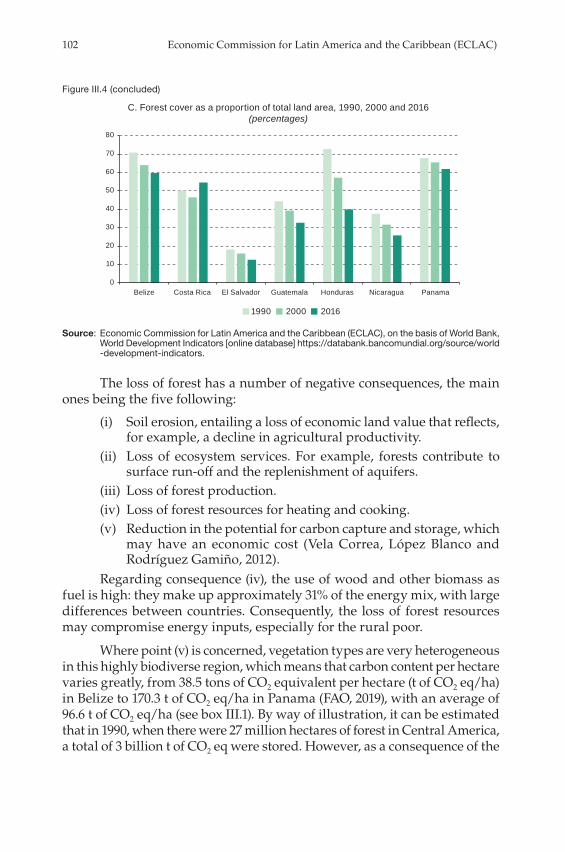
102 Economic Commission for Latin America and the Caribbean (ECLAC)
C. Forest cover as a proportion of total land area, 1990, 2000 and 2016(percentages)
0
10
20
30
40
50
60
70
80
Belize Costa Rica El Salvador Guatemala Honduras Nicaragua Panama
1990 2000 2016
Source: Economic Commission for Latin America and the Caribbean (ECLAC), on the basis of World Bank, World Development Indicators [online database] https://databank.bancomundial.org/source/world -development-indicators.
The loss of forest has a number of negative consequences, the main ones being the five following:
(i) Soil erosion, entailing a loss of economic land value that reflects, for example, a decline in agricultural productivity.
(ii) Loss of ecosystem services. For example, forests contribute to surface run-off and the replenishment of aquifers.
(iii) Loss of forest production.(iv) Loss of forest resources for heating and cooking.(v) Reduction in the potential for carbon capture and storage, which
may have an economic cost (Vela Correa, López Blanco and Rodríguez Gamiño, 2012).
Regarding consequence (iv), the use of wood and other biomass as fuel is high: they make up approximately 31% of the energy mix, with large differences between countries. Consequently, the loss of forest resources may compromise energy inputs, especially for the rural poor.
Where point (v) is concerned, vegetation types are very heterogeneous in this highly biodiverse region, which means that carbon content per hectare varies greatly, from 38.5 tons of CO2 equivalent per hectare (t of CO2 eq/ha) in Belize to 170.3 t of CO2 eq/ha in Panama (FAO, 2019), with an average of 96.6 t of CO2 eq/ha (see box III.1). By way of illustration, it can be estimated that in 1990, when there were 27 million hectares of forest in Central America, a total of 3 billion t of CO2 eq were stored. However, as a consequence of the
Figure III.4 (concluded)

The climate emergency in Latin America and the Caribbean... 103
net reduction in cover, and assuming that the remaining ecosystems have maintained the same average carbon storage capacity, the retained content in the region decreased to 2.316 billion t of CO2 eq (a drop of about 24%) during the period 1990–2015.
Box III.1 Estimation of the monetary value of forest loss
Considering the establishment of a global carbon market with a price per ton, the indirect economic cost of the loss of carbon reservoirs can be estimated on the basis of the CO2 equivalent content presented in table 1. The indirect economic cost is obtained by assigning to the social cost of carbon a monetary value of US$ 25.84 for each ton emitted or no longer stored; the range of values calculated for this social cost ranges from US$ 6 to US$ 100 per ton of CO2 equivalent (t of CO2 eq) (Caballero and others, 2019).
Table 1 Central America (7 countries): estimated carbon content, 1990 and 2015
CountryForested area
(thousands of ha)Average carbon storage capacity
(millions of tons of CO2 equivalent (t of CO2 eq))
Estimated carbon content
(millions of t of CO2 eq)
1990 2015 1990 2015
Belize 1 616 1 361 38.5 62.2 52.4
Costa Rica 2 564 2 786 89.2 228.7 248.5
El Salvadora 377 261 96.6 36.4 25.2
Guatemala 4 748 3 504 104.5 496.2 366.1
Hondurasa 8 136 4 472 96.6 785.7 431.9
Nicaragua 4 514 3 114 131.2 592.2 408.6
Panama 5 040 4 601 170.3 858.3 783.5
Total 26 995 20 098 96.6b 3 060 2 316
Source: Economic Commission for Latin America and the Caribbean (ECLAC), on the basis of World Bank, World Development Indicators [online database] https://databank.bancomundial.org/source/world-development-indicators; Food and Agriculture Organization of the United Nations (FAO), Corporate Database for Substantive Statistical Data (FAOSTAT) [online] http://www.fao.org/faostat/en/.
a No carbon storage figures are available for El Salvador and Honduras, so these countries have been assigned the average value for the others in the region, 96.6 tons of CO2 equivalent per hectare (t of CO2 eq/ha).
b Average.
In the period 1990–2015, if carbon is assumed to have a social cost of US$ 6, US$ 25.84 and US$ 100 per t of CO2 eq, the indirect cost caused by the potential loss due to CO2 emissions is estimated at US$ 4.462 billion, US$ 19.215 billion and US$ 74.361 billion, respectively. Of course, these costs vary from country to country and there are even countries that potentially profit during the period considered (see table 2).

104 Economic Commission for Latin America and the Caribbean (ECLAC)
Table 2 Central America (7 countries): loss of carbon reservoirs
and associated social cost, 1990–2015
Country
Loss of forest cover (thousands
of ha)
Carbon losses
(millions of t of CO2 eq)
Estimated cost of deforestation(millions of dollars)
Social cost of carbon:
US$ 6/t of CO2 eq
Social cost of carbon:
US$ 25.84/t of CO2 eq
Social cost of carbon: US$ 100/t of CO2 eq
Belize -255 -10 -59 -253 -981
Costa Ricaa 222 20 119 512 1 982
El Salvador -116 -11 -67 -290 -1 124
Guatemala -1 244 -130 -780 -3 360 -13 004
Honduras -3 664 -354 -2 123 -9 143 -35 384
Nicaragua -1 400 -184 -1 102 -4 746 -18 368
Panama -439 -75 -449 -1 934 -7 483
Total -6 897 -744 -4 462 -19 215 -74 361
Source: Economic Commission for Latin America and the Caribbean (ECLAC), on the basis of World Bank, World Development Indicators [online database] https://databank.bancomundial.org/source/world-development-indicators; Food and Agriculture Organization of the United Nations (FAO), Corporate Database for Substantive Statistical Data (FAOSTAT) [online] http://www.fao.org/faostat/en/.
a Since net forest cover is reported to have increased in Costa Rica in the period analysed, the social cost of carbon is negative and can be interpreted as an expense not incurred or a saving.
This shows that forests are of growing economic importance, and that this importance is not only direct, but also relates to the social cost that can be assigned to a ton of CO2 and to the role that forests can play in meeting mitigation targets set in nationally determined contributions (NDCs).
Source: Economic Commission for Latin America and the Caribbean (ECLAC), on the basis of World Bank, World Development Indicators [online database] https://databank.bancomundial.org/source/world-development-indicators; Food and Agriculture Organization of the United Nations (FAO), Corporate Database for Substantive Statistical Data (FAOSTAT) [online] http://www.fao.org/faostat/en/; K. Caballero and others, “El costo social del carbono: una visión agregada desde América Latina”, Project Documents (LC/TS.2019/10), Santiago, Economic Commission for Latin America and the Caribbean (ECLAC), 2019.
2. Emissions intensity and per capita emissions in Central America
The ratio of total emissions to GDP in Central America is 671 t of CO2 eq for every million 2010 dollars, just above the world average of 639 t of CO2 eq for every million 2010 dollars (see figure III.5). However, the average annual decarbonization rate of the Central America region between 1990 and 2016 was 3.8%, as compared to a global rate of 1.4%. This may represent a competitive advantage in the new world economy of the twenty-first century.
Box III.1 (concluded)

The climate emergency in Latin America and the Caribbean... 105
Figure III.5 Central America (7 countries): carbon intensity of the economy, 1990 and 2016
(Tons of CO2 equivalent for every million 2010 dollars)
13 539
8821 624 1 342
8 421
1 532709
1 818928
2 894
132 839 1 0911 672
539 609 671 6390
2 000
4 000
6 000
8 000
10 000
12 000
14 000
16 000B
eliz
e
Cos
ta R
ica
Gua
tem
ala
Hon
dura
s
Nic
arag
ua
Pana
ma
El S
alva
dor
Cen
tral
Am
eric
a
Wor
ld
1990 2016
Source: Economic Commission for Latin America and the Caribbean (ECLAC), on the basis of J. Gütschow and others, “The PRIMAP-hist national historical emissions time series (1850–2016)”, Potsdam, 2018 [online] http://dataservices.gfz-potsdam.de/pik/showshort.php?id=escidoc:3842934.
The targets proposed in the nationally determined contributions (NDCs) are summarized in table III.1.
Table III.1 Central America (7 countries): nationally determined contributions (NDCs), 2019
CountryPercentage reduction
ObservationsUnconditional Conditional
Belize N/Aa N/A MeasuredCosta Rica 44 44 Compared to business as usualEl Salvador N/A N/A MeasuredGuatemala 11.2 22.6 Compared to business as usualHonduras N/A 15 Compared to business as usualNicaragua N/A N/A MeasuredPanama N/A N/A Measured
Source: Economic Commission for Latin America and the Caribbean (ECLAC).a N/A: Not applicable.
Per capita emissions by country are shown in figure III.6.
It is estimated that global emissions need to be reduced from the 50 gigatons (Gt) of CO2 eq currently emitted to 40 Gt of CO2 eq by 2030 if international commitments are to be met and the global temperature increase is to be stabilized at no more than 2 °C. This means reducing per capita emissions from about 7 t of CO2 eq to less than 5 t of CO2 eq per inhabitant in the same period (UNEP, 2018).
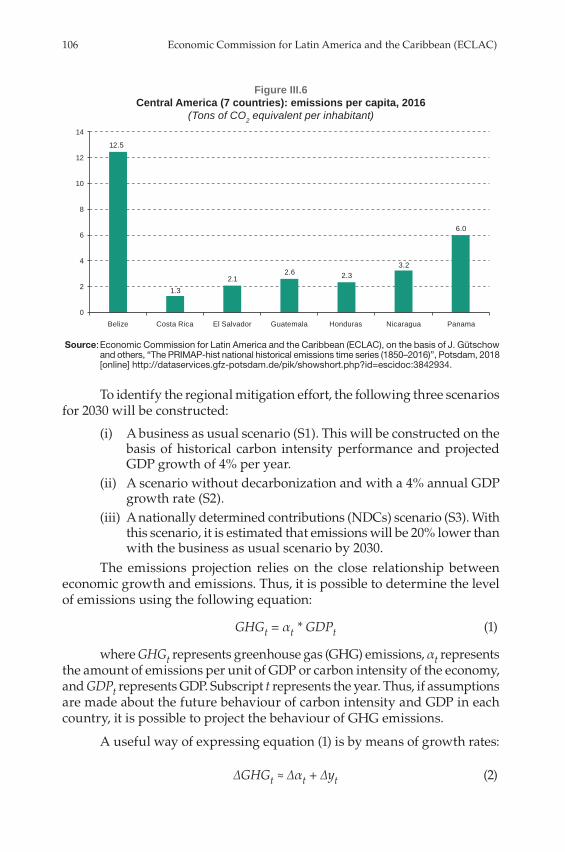
106 Economic Commission for Latin America and the Caribbean (ECLAC)
Figure III.6 Central America (7 countries): emissions per capita, 2016
(Tons of CO2 equivalent per inhabitant)
12.5
1.32.1
2.6 2.33.2
6.0
0
2
4
6
8
10
12
14
Belize Costa Rica El Salvador Guatemala Honduras Nicaragua Panama
Source: Economic Commission for Latin America and the Caribbean (ECLAC), on the basis of J. Gütschow and others, “The PRIMAP-hist national historical emissions time series (1850–2016)”, Potsdam, 2018 [online] http://dataservices.gfz-potsdam.de/pik/showshort.php?id=escidoc:3842934.
To identify the regional mitigation effort, the following three scenarios for 2030 will be constructed:
(i) A business as usual scenario (S1). This will be constructed on the basis of historical carbon intensity performance and projected GDP growth of 4% per year.
(ii) A scenario without decarbonization and with a 4% annual GDP growth rate (S2).
(iii) A nationally determined contributions (NDCs) scenario (S3). With this scenario, it is estimated that emissions will be 20% lower than with the business as usual scenario by 2030.
The emissions projection relies on the close relationship between economic growth and emissions. Thus, it is possible to determine the level of emissions using the following equation:
GHGt = αt * GDPt (1)
where GHGt represents greenhouse gas (GHG) emissions, αt represents the amount of emissions per unit of GDP or carbon intensity of the economy, and GDPt represents GDP. Subscript t represents the year. Thus, if assumptions are made about the future behaviour of carbon intensity and GDP in each country, it is possible to project the behaviour of GHG emissions.
A useful way of expressing equation (1) is by means of growth rates:
∆GHGt ≈ ∆αt + ∆yt (2)

The climate emergency in Latin America and the Caribbean... 107
where ∆ represents the percentage annual change in the variables. Thus, the emissions growth rate approximates to the sum of the carbon intensity and GDP growth rates. In the absence of a decoupling process in the economy, then (∆αt = 0), emissions will grow at the same speed as GDP. However, if the goal is to maintain high growth in the economy while restraining emissions growth, the carbon intensity of the economy will have to be reduced (∆αt < 0). Consequently, reducing the absolute level of emissions requires the rate of change of carbon intensity in the economy to be negative and greater in absolute terms than GDP growth (∆αt < 0; |∆αt| > ∆GDPt).
The results are summarized in table III.2 and figure III.7.
Table III.2 Scenarios and assumptions for 2030
Scenario
Assumptions about average annual
growth, 2016–2030Results for greenhouse gas (GHG) emissions, 2030
∆GDPtGHGGDP t
∆ ∆GHGt
GHG (megatons of
CO2 equivalent)
GHG per capita(tons of CO2
equivalent per inhabitant)
Difference from scenario S1
(percentages)
Scenario S1 4.1 -3.8 0.34 139 2.4 -
Scenario S2 4.1 0 4.1 233 4.0 67
Scenario S3 4.1 -5.3 -1.2 111 1.9 -20
Source: Economic Commission for Latin America and the Caribbean (ECLAC).Note: S1 is the business as usual scenario, S2 is one in which the decarbonization rate is zero, and in
S3 emissions are cut by 20% relative to the business as usual scenario.
Figure III.7 Simulation of greenhouse gas emissions, 2016 and 2030
A. Total emissions(megatons of CO2 equivalent)
132139
233
111
0
50
100
150
200
250
2016 S1(business as usual)
S2 S3
Current 2030

108 Economic Commission for Latin America and the Caribbean (ECLAC)
B. Emissions per capita(tons of CO2 equivalent)
2.8
2.4
4.0
1.9
0
1
2
3
4
5
2016 S1(business as usual)
S2 S3
Current 2030
Source: Economic Commission for Latin America and the Caribbean (ECLAC).Note: The results illustrated were obtained by applying the formula ∆GHGt ≈ ∆αt + ∆yt, where GHGt
represents greenhouse gas emissions, αt represents the amount of emissions per unit of GDP or carbon intensity of the economy, subscript t represents the year and ∆ represents the annual percentage change in the variables. S1 is the business as usual scenario, S2 is one in which the decarbonization rate is zero, and in S3 emissions are cut by 20% relative to the business as usual scenario.
In the business as usual scenario (S1), in which strong economic growth is projected and the aggregate decarbonization rate in the countries remains high, a total of 139 Mt of CO2 eq of greenhouse gases would be emitted annually by 2030, which is more than at present. In this scenario, per capita greenhouse gas emissions are cut from the current 2.8 t of CO2 eq to 2.4 t of CO2 eq by 2030. Thus, international commitments would be met if the historical decarbonization rate were maintained.
In fact, even in the case of scenario S2, in which the decarbonization rate is zero, i.e., in which emissions grow at the same rate as the economy, emissions per capita would reach 4.0 t of CO2 eq, which is still lower than the value set in international commitments. This offers considerable room for manoeuvre in meeting nationally determined contributions (NDCs) in the region.
Lastly, scenario E3, in which a policy of accelerated decarbonization is applied so that emissions are reduced (or capture is increased) by 20% relative to the business as usual scenario, yields a reduction in per capita emissions to 1.9 t of CO2 eq per capita by 2030, which is well below the global target and very close to carbon neutrality.
By 2030, transport and electricity generation will be the main sources of greenhouse gas emissions. There is increasing concern about curbing deforestation, improving public mobility infrastructure, avoiding the negative impact of private mobility, identifying the determinants of the demand
Figure III.7 (concluded)

The climate emergency in Latin America and the Caribbean... 109
for petrol and constructing scenarios from the possible paths of these and the effect of applying relevant public policies. According to econometric estimates of the demand for petrol in the countries of Central America, this demand has high income elasticity and low price elasticity, more so than in Latin America and the Caribbean as a whole (see table III.3).
Table III.3 Central America (6 countries): income and price elasticity of long-run
demand for petrol, 1975–2012
Country Income elasticity Price elasticityCosta Rica 0.750 -0.299El Salvador 0.836 -0.217Guatemala 0.880 -0.267Honduras 0.948 -0.259Nicaragua 0.855 -0.123Panama 0.839 -0.394
Source: Economic Commission for Latin America and the Caribbean (ECLAC).
The way petrol consumption responds to changing incomes suggests that economic growth will cause it to increase rapidly, along with air pollution and other negative externalities such as vehicle traffic and road accidents (Cnossen, 2005). Moreover, the fact that the response (elasticity) to price changes is low (inelastic) indicates that applying consumption taxes, within reasonable limits, would be insufficient to control this increase, and that there is a need to invest in alternative public mobility options. Thus, if the development style is maintained, private consumption of fossil fuels will continue to increase substantially. As noted above, it is possible that Central America’s per capita emissions may be kept below the medium-term global threshold (2030) even without major efforts. However, these emissions will make it difficult to meet national climate targets (and other sustainable development goals) and reduce negative externalities (Galindo and others, 2014a).
The Central American countries have the potential to meet their international commitments and at the same time avoid the harm associated with urban transport pollution. As part of this effort, they should set out to restore degraded ecosystems in order to reduce their vulnerability to macroeconomic and climate impacts, with social inclusion and preservation of natural and environmental resources. Fiscal, regulatory and investment policies can contribute decisively to this transition. In the case of Central America, the synergy between adaptation and mitigation is very evident, and efforts to find solutions based on nature, environmental services and forestation are becoming more and more viable.

110 Economic Commission for Latin America and the Caribbean (ECLAC)
3. The impact of climate change in Central America
Extreme events such as drought, cyclones and El Niño Southern Oscillation are recurrent in both Central America and the Caribbean, and their severity has been increasing with climate change. These events are magnifying the region’s socioeconomic vulnerability, and the effects of climate change are exposing it to risks relating to agricultural production and food security, hydroelectricity, health, ecosystem performance and fiscal contingencies (ECLAC, 2018a).
Box III.2 Central America and the Dominican Republic: vulnerability to climate change
According to the Germanwatch Global Climate Risk Index for 183 countries, the country where the impact was greatest in the period 1996–2015 was Honduras. Nicaragua ranked fourth, Guatemala ninth, the Dominican Republic eleventh, El Salvador fifteenth, Belize twenty-sixth, Costa Rica seventy-eighth and Panama ninety-seventh.
The DARA/CVF Climate Vulnerability Monitor (2012) is based on research and scientific information covering the global effects (losses and gains) of climate change and the carbon economy in economic, environmental and health terms by 2010 and 2030 (annual averages). The indicator of the impact of climate change on a population comprises two parts: the effect of climate change and the impact arising from the role played by carbon in society, i.e., carbon intensity. With regard to the latter, the economic, environmental and health impact is evaluated and the purchase and consumption of fuels is considered, as is the release of greenhouse gases due to combustion. The costs and benefits of extraction, production and consumption are analysed, irrespective of their effects on climate change. Estimates are presented in table 1.
Table 1 Central America and the Dominican Republic: Climate Vulnerability Monitor,
total national losses, 2010 and 2030
Economic costs (percentages of GDP)
Human losses (number of people)
Impact of climate change
Impact of carbon intensity
Impact of climate change and
carbon intensity
Impact of climate change
Impact of carbon intensity
Mortality People affected2010 2030 2010 2030 2010 2030 2010 2030 2010 2030
Belize 7.7 14.2 5.3 10.2 50 60 25 000 30 000 2 000 2 500Costa Rica 3.1 6.3 0.6 0.9 700 850 75 000 200 000 25 000 30 000Dominican Republic 2.4 4.8 0.3 0.3 3 000 3 500 100 000 150 000 45 000 60 000
El Salvador 3.6 7.2 0.5 0.8 1 500 1 500 1 100 000 1200 000 150 000 250 000Guatemala 2.9 5.8 0.8 1.2 3 500 5 000 150 000 250 000 100 000 150 000Honduras 4.6 9.0 1.5 2.5 2 500 3 000 95 000 200 000 55 000 65 000Nicaragua 6.3 11.7 2.4 4.3 1 500 2 000 200 000 300 000 25 000 25 000Panama 42 8.4 2.1 3.8 550 650 250 000 400 000 75 000 100 000
Source: International DARA Foundation/Climate Vulnerable Forum (DARA/CVF), Climate Vulnerability Monitor: A Guide to the Cold Calculus of a Hot Planet, Madrid, 2012.
Note: Impact is presented as an annual average.

The climate emergency in Latin America and the Caribbean... 111
The Climate Vulnerability Monitor also estimates an indicator of the level of vulnerability resulting from the damage caused or lack of it. The impact is significant in relation to the size of the economy or population. The greatest impact is the result of high levels of vulnerability. The Climate Vulnerability Monitor classifies the level of vulnerability into five categories that are statistically determined using standard deviation. The classification ranges from acute (the most vulnerable category) to severe, high, moderate and low (the least vulnerable category). For example, in countries that have a low level of vulnerability, climate change has no impact or is beneficial. The vulnerability levels of the Central American countries are presented in table 2.
Table 2 Central America and the Dominican Republic: vulnerability levels according
to the Climate Vulnerability Monitor, 2010 and 2030
Climate change Carbon intensity2010 2030 2010 2030
Belize Acute Acute High HighCosta Rica Moderate High Low LowDominican Republic High Acute High HighEl Salvador Severe Acute Low LowGuatemala Moderate High Low ModerateHonduras Severe Acute Moderate ModerateNicaragua Moderate High Low ModeratePanama Moderate Severe High Severe
Source: International DARA Foundation/Climate Vulnerable Forum (DARA/CVF), Climate Vulnerability Monitor: A Guide to the Cold Calculus of a Hot Planet, Madrid, 2012.
Source: Economic Commission for Latin America and the Caribbean (ECLAC), Climate Change in Central America: Potential Impacts and Public Policy Options (LC/MEX/L.1196), Mexico City, 2018; International DARA Foundation/Climate Vulnerable Forum (DARA/CVF), Climate Vulnerability Monitor: A Guide to the Cold Calculus of a Hot Planet, Madrid, 2012.
The average temperature in Central America has increased by 0.54 °C in the last half century (SICA, 2011). The RCP6.0 representative concentration pathway scenario projects a temperature increase of between 1.8 °C and 3.5 °C by 2081–2100 compared to 1986–2005 in Central America and Mexico as a whole. In the RCP8.5 scenario, the increase is expected to be between 2.9 °C and 5.5 °C. As for precipitation, RCP6.0 estimates a change of between 5% and 17% and RCP8.5 one of between 11% and 26% (IPCC, 2013b).
Although there is high availability of water in Central America (approximately 21,000 m3/year per capita in 2014),4 it is distributed very unevenly between countries. The variability of the interannual pattern and geographical differences in precipitation have large effects on this stock (SICA, 2011). In the coming decades, the current bimodal interannual pattern of precipitation could be distorted: periods of abundant rainfall could become longer and the dry spell from July to August shorter. In the longer term, the volume of annual precipitation is expected to fall in much of the region (ECLAC, 2012b and 2015a). In short, Central America is predicted to be hotter and drier.
4 According to World Bank (2019).
Box III.2 (concluded)

112 Economic Commission for Latin America and the Caribbean (ECLAC)
These climatic transformations are affecting economic activities, social welfare and ecosystems. Agriculture is particularly sensitive to climate change in Central America, since the sector is essential for food security and generates 9% of regional GDP, employs 30% of the working population and produces key inputs for agro-industrial activities (ECLAC, 2015a and 2019a).
Without adaptation measures, production of staple grains could decline significantly in this century and dependence on imports could increase (see figure III.8). In scenario B2 (the least bad) of the Intergovernmental Panel on Climate Change (IPCC), yields of maize, bean and rice crops would be reduced by 17%, 19% and 30%, respectively, compared to the last decade; the reduction in scenario A2 would be 35%, 43% and 50%. This would have negative consequences for economic dynamics, social conditions and poverty reduction in the region (ECLAC/CAC/SICA, 2013a). Migration from areas that lose their agricultural capacity or where extreme events are recurrent may increase.
Figure III.8 Central America: net production, exports, imports and apparent consumption
of staple grains, and rate of dependence, 1980 and 2011
0 500
1 000 1 500 2 000 2 500 3 000 3 500 4 000 4 500 5 000
A. Maize, 2011(thousands of tons)
+ =-
+ =-
+ =-
C. Rice, 2011(thousands of tons)
D. Rate of dependencea
(percentages)
B. Beans, 2011(thousands of tons)
0
100
200
300
400
500
600
0
200
400
600
800
1 000
1 200
Net production Imports Exports Apparentconsumption
1980 2011
Maize: 12
Beans: 12
Rice: 8
50
20
50
Net production Imports Exports Apparentconsumption
Net production Imports Exports Apparentconsumption
Source: Economic Commission for Latin America and the Caribbean (ECLAC), The economics of climate change in Latin America and the Caribbean: paradoxes and challenges of sustainable development (LC/G.2624), Santiago, 2015.
a The rate of dependence is the imported share of all grains consumed by the countries.

The climate emergency in Latin America and the Caribbean... 113
Central America has a great variety of ecosystems, including tropical forests, which in 2005 covered 45% of the territory and contained 7% of the planet’s biodiversity. Severe degradation and destruction of biodiversity are currently taking place and are likely to intensify with climate change, as mentioned above. The potential biodiversity index (PBI) is expected to decline by 13% during this century because of land use change, and this estimate does not take account of climate change, which can be expected to exacerbate the loss. It is estimated that the PBI would fall by 33% in IPCC scenario B2 and 58% in scenario A2 by the end of the century (see map III.1) (ECLAC, 2011a).
Map III.1 Central America: potential biodiversity index, baseline, B2 and A2 scenarios
with land use change, 2005 and 2100(Differences from baseline scenario)
A. Baseline scenario, 2005 B. Baseline scenario, 2100
C. Intergovernmental Panel on Climate Change (IPCC) scenario B2, 2100
D. IPCC scenario A2, 2100
Central American total -33% Central American total -58%
Central American total -13%
0.000-0.200 0.201-0.400 0.401-0.600 0.601-0.800 0.801-1.000
Source: Economic Commission for Latin America and the Caribbean (ECLAC), La economía del cambio climático en Centroamérica: reporte técnico 2011 (LC/MEX/L.1016), Mexico City, 2011; The economics of climate change in Latin America and the Caribbean: paradoxes and challenges of sustainable development (LC/G.2624), Santiago, 2015.

114 Economic Commission for Latin America and the Caribbean (ECLAC)
According to the EM DAT International Disaster Database, there were 288 extreme weather events between 1990 and 2018, with an increase of 3% a year in the last three decades relative to the 1970s. The most recurrent events are floods, storms, landslides and avalanches (86% of the total), followed by droughts (9%). These events cause significant economic, social and environmental losses (ECLAC, 2011a; ECLAC/CAC/SICA, 2013b) (see figure III.9).
Figure III.9 Central America: climate-related disasters, 1969–2018
(Number of disasters)
0
5
10
15
20
25
1969
1971
1973
1976
1979
1981
1983
1986
1988
1990
1992
1994
1996
1998
2000
2002
2004
2006
2008
2010
2012
2014
2016
2018
Climate-related Hydrological Meteorological
Source: Economic Commission for Latin America and the Caribbean (ECLAC), on the basis of Centre for Research on the Epidemiology of Disasters (CRED), EM-DAT International Disaster Database [online] https://www.emdat.be/.
Losses and damage caused by extreme events have been estimated at double-digit percentages of GDP in some cases, those resulting from Hurricane Iris in Belize being an example. Guatemala, Honduras and El Salvador have also been affected by events that have caused major disruption to economic activities, as well as considerable human losses. The latter is also true of Nicaragua (see figures III.10 and III.11). In addition to these costs, extreme events intensify the historical tendency to emigration. This is very noticeable in the population expulsion effect caused by drought and changing rainfall patterns in the “dry corridor” regions, especially in the three countries of northern Central America.

The climate emergency in Latin America and the Caribbean... 115
Figure III.10 Central America (7 countries): economic cost of natural disasters, 2000–2017
(Percentages of GDP)
C. El Salvador
2001
2002
2005
2006
2007
2008
2009
2010
2011
2015
2017
0
2
4
6
F. Nicaragua
2001
2002
2004
2005
2007
2008
2009
2010
2011
2012
2013
2014
2015
2016
2017
0
0.005
0.010
0.015
0.020
B. Costa Rica
2001
2002
2003
2004
2005
2007
2008
2010
2011
2012
2015
2016
2017
0
0.1
0.2
0.3
E. Honduras
2001
2002
2003
2004
2005
2006
2007
2008
2009
2010
2011
2012
2014
2016
2017
0
0.5
1.0
1.5
A. Belize
2001
2005
2007
2008
2010
2015
2016
0
10
20
30
D. Guatemala
2001
2002
2003
2005
2006
2007
2008
2009
2010
2011
2012
2014
2015
2016
2017
0
1
2
3
4
G. Panama
2001
2002
2003
2004
2005
2006
2007
2008
2009
2010
2011
2012
2013
2014
2015
2016
2017
0
0.1
0.2
0.3
0.4
Source: Economic Commission for Latin America and the Caribbean (ECLAC), on the basis of Centre for Research on the Epidemiology of Disasters (CRED), EM-DAT International Disaster Database [online] https://www.emdat.be/.
Note: Natural disasters includes floods, storms, land movements, drought, fires and extreme temperatures.

116 Economic Commission for Latin America and the Caribbean (ECLAC)
Figure III.11 Central America (7 countries): disaster-related fatalities, 2001–2019
(Number)
C. El Salvador
2001
2002
2005
2006
2007
2008
2009
2010
2011
2015
2017
2018
0
100
200
300
F. Nicaragua
2001
2002
2004
2005
2007
2008
2009
2010
2011
2012
2013
2014
2015
2016
2017
2018
0
50
100
150
200
B. Costa Rica
2001
2002
2003
2004
2005
2007
2008
2010
2011
2012
2015
2016
2017
2018
2019
0
10
20
30
E. Honduras
2001
2002
2003
2004
2005
2006
2007
2008
2009
2010
2011
2012
2014
2016
2017
2018
0
50
100
150
A. Belize
2001
2005
2007
2008
2010
2015
2016
0
10
20
30
D. Guatemala
2001
2002
2003
2005
2006
2007
2008
2009
2010
2011
2012
2014
2015
2016
2017
2018
0
500
1 000
1 500
G. Panama
2001
2002
2003
2004
2005
2006
2007
2008
2009
2010
2011
2012
2013
2014
2015
2016
2017
2018
0
10
20
30
Source: Economic Commission for Latin America and the Caribbean (ECLAC), on the basis of Centre for Research on the Epidemiology of Disasters (CRED), EM-DAT International Disaster Database [online] https://www.emdat.be/.
Extreme events also negatively affect women’s economic autonomy by depleting their livelihoods and increasing their burden of reproductive and unpaid care work. Moreover, women are less likely to be employed in “cash for work” programmes implemented after a disaster to rebuild infrastructure and provide paid employment, as men generally have more experience in infrastructure-related roles. For example, women’s employment was hit hard

The climate emergency in Latin America and the Caribbean... 117
in Honduras after Hurricane Mitch in 1998 for several reasons. In most of the export fruit-growing sector, men continued to work on the reconstruction of plantations, while the washing and packing jobs done by women ceased. In manufacturing, women workers were laid off (ECLAC, 2019c).
In Central America, policies have been formulated in response to climate change at the regional and national levels, and the goal is to mainstream this response from environmental institutions to key sectors such as finance, agriculture, health and public works. The implementation of sectoral agendas would strengthen institutional linkages in a way that maximized co-benefits and minimized intersectoral costs. Within this framework, the objective is to move towards environmentally sustainable economies with low emissions, in addition to overcoming the dichotomy between mitigation and adaptation. Moreover, the exposure to threats and the vulnerability of Central American societies have made the response to extreme events and climate change one of the priorities of the integration process, in recognition of the fact that the situation represents both a threat and an opportunity and incentive to move towards sustainable development.
Since 2009, ECLAC has been assisting the Central American Integration System (SICA) and the governments of the region in obtaining data on the actual and potential impact of climate change. It has also helped organize policy response dialogues, dealing particularly with the initiative to study the economics of climate change in Central America and the Dominican Republic. Strengthening the technical capacity of national and regional institutions to implement and coordinate public policies is a priority working area in the region. In 2018 and 2019, for example, ECLAC carried out an analysis of the effects of introducing a CO2 content accounting value in public investment projects as part of an effort to modernize project evaluation methods. This study was carried out with representatives of the National Systems for Public Investment (SNIP) of Costa Rica (chair of the SNIP Network during 2018–2019), Honduras, Nicaragua and Panama (and in 2019 Guatemala expressed an interest in participating). The experience of Chile, where a value for CO2 emissions had been introduced into the public project evaluation methodology, was taken as a benchmark.
Improving technical capabilities and coordinating climate change policy will make it possible to focus work on the impact experienced by vulnerable populations and on investments that are better conceived from a climate perspective. It will also reduce the constraints that economic considerations place on proposals such as green tax reform and increased investment in public and intergenerational common goods and services such as water, food and energy security, and public transport.
The nationally determined contributions (NDCs) of the region’s countries identify key sectors for strengthening adaptation processes: human health, marine-coastal zones, agriculture, livestock and food security, forest

118 Economic Commission for Latin America and the Caribbean (ECLAC)
resources, biodiversity, protected areas, conservation and management of strategic ecosystems, infrastructure, integrated water resources management and integrated disaster risk reduction management. To achieve these adaptation goals and thereby reduce regional vulnerability, a wide-ranging public policy strategy must be implemented.
B. The impact of rising sea levels on the Caribbean and Central America
It is on the Atlantic seaboard that the sharpest upward trend in the sea level can be observed. On the northern coast of South America and the Caribbean coast, the values for 2040 are approximately 3 mm per year, with lower values for the Caribbean islands. Maps III.2 and III.3 show the heterogeneous effect that would arise in a scenario in which the sea level rose by 1 m and there was an effect from El Niño Southern Oscillation. The heterogeneity would be due both to the values for the land area affected and to the different ways in which the population is distributed in the countries. In any event, the places where the greatest areas would be affected are those where there are large conurbations, especially in island countries.5
Map III.2 Central America, the Caribbean and northern South America: land area affected
if the average sea level rose by 1 metre(Square metres)
Source: Economic Commission for Latin America and the Caribbean/University of Cantabria (ECLAC/UC), “The effects of climate change in the coastal areas of Latin America and the Caribbean: impacts”, Project Documents (LC/W.484), Santiago, 2012; Government of Spain/Economic Commission for Latin America and the Caribbean (ECLAC), “The effects of climate change in the coastal areas of Latin America and the Caribbean” [online database] https://c3a.ihcantabria.com/.
5 A sea level rise of 1 m could lead to an area of up to 180,000 m2 being flooded in southern states of Mexico such as Campeche, Yucatán and Quintana Roo.

The climate emergency in Latin America and the Caribbean... 119
Map III.3 Central America, the Caribbean and northern South America:
projected urban area, 2040 (Square metres)
Source: Economic Commission for Latin America and the Caribbean/University of Cantabria (ECLAC/UC), “The effects of climate change in the coastal areas of Latin America and the Caribbean: impacts”, Project Documents (LC/W.484), Santiago, 2012; Government of Spain/Economic Commission for Latin America and the Caribbean (ECLAC), “The effects of climate change in the coastal areas of Latin America and the Caribbean” [online database] https://c3a.ihcantabria.com/.
The temporary sea level rise historically caused by hurricanes (1999–2005), coupled with the scenario of a permanent rise of 1 m by 2040, would have various effects (see map III.4):
• The projected flood level (in the absence of hurricanes) would be about one metre in the Caribbean.
• There would be a great impact on the population of the Caribbean islands, especially the easternmost.6
• The effect of hurricanes would change significantly in countries such as Honduras, Panama and Costa Rica, and somewhat less in the Dominican Republic.7
6 There would also be a major impact on the population of the Brazilian coasts, with great disruption in the large conurbations, and on that of extensive parts of the eastern seaboard of Mexico.
7 The Bolivarian Republic of Venezuela would also be strongly affected.

120 Economic Commission for Latin America and the Caribbean (ECLAC)
Map III.4 Central America, the Caribbean and northern South America:
projected flood level, 2040(Metres)
Source: Economic Commission for Latin America and the Caribbean/University of Cantabria (ECLAC/UC), “The effects of climate change in the coastal areas of Latin America and the Caribbean: impacts”, Project Documents (LC/W.484), Santiago, 2012; Government of Spain/Economic Commission for Latin America and the Caribbean (ECLAC), “The effects of climate change in the coastal areas of Latin America and the Caribbean” [online database] https://c3a.ihcantabria.com/.
The beaches of the Atlantic and Caribbean coast are expected to be the most affected by the change in sea level and the intensity and direction of waves acting on the profile and planform of beaches. Indeed, average annual retreat rates are estimated at around 0.16 m (see map III.5). In the region as a whole, erosion rates are due to the combined effect of rising sea levels and higher waves. The worst hit areas are expected to be the northern Caribbean and the southern coasts of Brazil as far as the River Plate.
Under average conditions, the likelihood of adverse navigation conditions arising for vessels entering ports will be greater in the future. This would mean an increase in the average number of hours per year for which ports would have to close. Wave changes could result in breakwaters being overtopped. The combination of wave changes and sea level rise is likely to reduce the effectiveness of these walls. Map III.6 shows the areas that would be most affected in Central America and the Caribbean.8
8 In the rest of the region, the areas most affected would be the west coast from Ecuador northward, the north coast of Argentina, Uruguay, and the south and north of Brazil. Southern Peru and northern Chile would also be affected, but less severely.

The climate emergency in Latin America and the Caribbean... 121
Map III.5 Central America, the Caribbean and northern South America: average erosion
projected because of sea level changes, 2040(Metres)
Source: Economic Commission for Latin America and the Caribbean/University of Cantabria (ECLAC/UC), “The effects of climate change in the coastal areas of Latin America and the Caribbean: impacts”, Project Documents (LC/W.484), Santiago, 2012; Government of Spain/Economic Commission for Latin America and the Caribbean (ECLAC), “The effects of climate change in the coastal areas of Latin America and the Caribbean” [online database] https://c3a.ihcantabria.com/.
Map III.6 Central America, the Caribbean and northern South America: change of 0.5 m
in vertical breakwater overtopping because of sea level rise, 2040(Percentages)
Source: Economic Commission for Latin America and the Caribbean/University of Cantabria (ECLAC/UC), “The effects of climate change in the coastal areas of Latin America and the Caribbean: impacts”, Project Documents (LC/W.484), Santiago, 2012; Government of Spain/Economic Commission for Latin America and the Caribbean (ECLAC), “The effects of climate change in the coastal areas of Latin America and the Caribbean” [online database] https://c3a.ihcantabria.com/.

122 Economic Commission for Latin America and the Caribbean (ECLAC)
Consequently, strengthening infrastructure with engineering works and by restoring systems such as corals and mangroves is critical to the proper functioning of the region. As will be seen in the next section, this will depend on whether the financial resources are available to meet this new demand for adaptation.
C. The Caribbean: negative effects of climate change in a context of high borrowing
The Caribbean relies heavily on economic activities such as tourism and agriculture, which are particularly sensitive to climatic conditions (ECLAC, 2010). Agriculture generates a large number of jobs, and the rural population continues to constitute a substantial percentage of the total population (ECLAC/MINURVI/UN-HABITAT, 2016). It is therefore relevant that, in different climate scenarios, yields of cassava, banana, sweet potato and tomato plantations are predicted to fall by between 1% and 30% by 2050, with rice crop yields ranging from a 3% decrease to a 2% increase. Lower yields would have negative consequences in a number of areas, such as growth in output and investment in agriculture, the external sector, poverty reduction and food security (Clarke and others, 2013; ECLAC, 2015a).
Between 1950 and 2000, the number of warmer days and nights increased, the number of colder days and nights decreased, the number of drier days and rainier days increased, and the sea temperature rose by 1.5 ºC. The climate scenarios of IPCC (2013b) show representative concentration pathways (RCPs) for the period 2016–2035 that would lead to a temperature increase of between 0.5 °C and 0.7 °C above the base period average. A further increase of between 0.8 °C and 3 °C is forecast by 2081–2100. In the first period, annual precipitation would decrease by an average of between 1% and 3% relative to the base period average, while in the second period the decrease would be between 5% and 16% (UNFCCC, 2007; ECLAC, 2015a). Like Central America, the Caribbean will be warmer and drier.
As noted in the previous section, Caribbean countries are particularly exposed to rising sea levels and extreme weather events, such as hurricanes and storms, that exacerbate the loss and erosion of coastal areas, the deterioration of marine ecosystems, the alteration of marine habitats and the loss of mangroves or corals. In particular, it is estimated that the entire coral ecosystem will have collapsed by 2050. Biodiversity loss has negative effects on economic activities and the welfare of the population: less tourism, destruction of coastal infrastructure, population movements and debt. In addition, climate change is expected to affect people’s health through heat waves, natural disasters caused by extreme weather events, and communicable diseases such as malaria, dengue, leptospirosis and gastroenteritis (Clarke and others, 2013).

The climate emergency in Latin America and the Caribbean... 123
1. The emissions of the Caribbean
In contrast to the path being followed in Central America, the energy mix of the Caribbean countries is dominated by oil. In the case of Haiti, biofuels predominate, while in Trinidad and Tobago it is natural gas (see figure III.12).
Figure III.12 The Caribbean (5 countries): energy mix, 2016
(Percentages)
0
10
20
30
40
50
60
70
80
90
100
Cuba Dominican Rep. Haiti Jamaica Trinidad and Tobago
Coal Oil Natural gasNuclear energy Hydroelectricity Biofuels and wasteGeothermal energy Solar, wind and
other renewablesOther
Source: Economic Commission for Latin America and the Caribbean (ECLAC), on the basis of J. Gütschow and others, “The PRIMAP-hist national historical emissions time series”, Earth System Science Data, vol. 8, Göttingen, Copernicus Publications, 2016; Food and Agriculture Organization of the United Nations (FAO), Corporate Database for Substantive Statistical Data (FAOSTAT) [online] http://www.fao.org/faostat/en/.
The level of emissions by country varies, but energy is usually the largest category (see figure III.13).9 Trinidad and Tobago and Cuba are the countries with the most emissions, at 87 Mt of CO2 eq and 36 Mt of CO2 eq, respectively. At the same time, the forest cover of Cuba and the Dominican Republic absorbs emissions.
9 Currently, the information available in the countries on greenhouse gas emissions is based on national inventories; however, this information covers different years, so the database of Gütschow and others (2018) and FAO (2019) is used to harmonize the analysis.

124 Economic Commission for Latin America and the Caribbean (ECLAC)
Figure III.13 The Caribbean (13 countries): emissions by country and by sector, 2014
(Megatons of CO2 equivalent)
0
0.5
1.0
1.5
2.0
2.5
3.0
Saint Kittsand Nevis
Saint Vincentand the
Grenadines
Grenada Dominica Antiguaand Barbuda
Saint Lucia Barbados Bahamas
-20
-10
0
10
20
30
40
50
60
70
Jamaica Haiti Dominican Rep. Cuba Trinidad and Tobago
Agriculture and livestock Energy Industrial processesLand use change Other Waste
Source: Economic Commission for Latin America and the Caribbean (ECLAC), on the basis of J. Gütschow and others, “The PRIMAP-hist national historical emissions time series (1850–2016)”, Potsdam, 2018 [online] http://dataservices.gfz-potsdam.de/pik/showshort.php?id=escidoc:3842934.
With regard to the sectoral composition of emissions, in 2016 the burning of fossil fuels accounted for 90% of these: most emissions came from the energy sector (74%), followed by industrial processes (16%) and agriculture (12%). On the other hand, the subregion captures carbon because of land use change (see figures III.14 and III.15). In contrast to other regions of Latin America and the Caribbean, the transport sector still accounted for a relatively minor share in the Caribbean as of 2017. At the aggregate level, 179 Mt of CO2 eq were emitted in the Caribbean in 2016,10 and the average annual growth rate was 3.8%. Emissions from the waste sector and the industrial processes sector were the fastest-growing between 1990 and 2016, and emissions from land use change fell by an average of 2.8% annually over the same period (see figure III.16).
10 This means that emissions per capita were 4.6 t of CO2 eq, which compares favourably with the world average of 6.7 t of CO2 eq.

The climate emergency in Latin America and the Caribbean... 125
Figure III.14 The Caribbean: sectoral emissions shares, 2016
(Percentages)
11.85
74.20
16.18
-12.19
0.42
9.53
-20
-10
0
10
20
30
40
50
60
70
80
Agricultureand livestock
Energy Industrialprocesses
Land use change Other Waste
Source: Economic Commission for Latin America and the Caribbean (ECLAC), on the basis of United States Securities and Exchange Commission, EDGAR database [online] https://www.sec.gov/edgar.shtml.
Figure III.15 The Caribbean: composition of energy sector emissions, 2017
(Percentages)
36.4
24.5
19.2
13.6
6.4
0
5
10
15
20
25
30
35
40
Power industry Othet industrialcombustion
Other sectors Transport Buildings
Source: Economic Commission for Latin America and the Caribbean (ECLAC), on the basis of United States Securities and Exchange Commission, EDGAR database [online] https://www.sec.gov/edgar.shtml.

126 Economic Commission for Latin America and the Caribbean (ECLAC)
Figure III.16 The Caribbean: growth in emissions by sector, 1990–2016
(Percentages)
0.7
2.1
4.6
-2.8
0.7
3.0
3.8
-4
-3
-2
-1
0
1
2
3
4
5
Agricultureand livestock
Energy Industrialprocesses
Land use change Other Waste Total
Source: Economic Commission for Latin America and the Caribbean (ECLAC), on the basis of J. Gütschow and others, “The PRIMAP-hist national historical emissions time series (1850–2016)”, Potsdam, 2018 [online] http://dataservices.gfz-potsdam.de/pik/showshort.php?id=escidoc:3842934.
Figure III.17 ranks the countries by their per capita emissions in 2016. Several of them have exceeded the limit of 5 tons per capita and it will be necessary to reduce emissions to achieve the target of not exceeding that value by 2030. However, as noted above, in absolute terms, total emissions from the Caribbean represent only those of a medium-sized economy in the region, and the emissions of each individual country represent approximately 10% of those of a medium-sized continental country.
Figure III.17 The Caribbean (13 countries): emissions per capita, 2016
(Tons of CO2 equivalent per inhabitant)
1.5
2.0
3.1
3.1
3.1
3.7
4.4
4.6
5.1
5.3
7.0
9.8
63.6
0 10 20 30 40 50 60 70
Haiti
Dominican Rep.
Saint Vincent andthe Grenadinas
CubaGrenada
Jamaica
Saint Lucia
Dominica
Saint Kitts and Nevis
Barbados
Antigua and Barbuda
Bahamas
Trinidad and Tobago
Source: Economic Commission for Latin America and the Caribbean (ECLAC), on the basis of J. Gütschow and others, “The PRIMAP-hist national historical emissions time series (1850–2016)”, Potsdam, 2018 [online] http://dataservices.gfz-potsdam.de/pik/showshort.php?id=escidoc:3842934.

The climate emergency in Latin America and the Caribbean... 127
The ratio between total emissions and GDP is 844 t of CO2 eq for every million 2010 dollars, which is higher than the world average of 639 t of CO2 eq (see figure III.18). The region has also seen a coupling process of 1% per year since 1990, with the exceptions of Jamaica, Antigua and Barbuda and Barbados, where carbon intensity has been reduced.
Figure III.18 The Caribbean (13 countries): carbon intensity of the economy, 1990 and 2016
(Tons of CO2 equivalent per million 2010 dollars)
569
349 151
370
135 200
329
1 016
975 254
300
3 360
112
653
928
527
322 369
482 675
292
363 2 025
781 307
528
4 036 457
844
639
0 500 1 000 1 500 2 000 2 500 3 000 3 500 4 000 4 500
Antigua and Barbuda
Barbados
Bahamas
Cuba
Dominica
Dominican Rep.
Grenada
Haiti
Jamaica
Saint Kitts and Nevis
Saint Lucia
Trinidad and Tobago
Saint Vincent andthe Grenadines
The Caribbean
World
2016 1990
Source: Economic Commission for Latin America and the Caribbean (ECLAC), on the basis of J. Gütschow and others, “The PRIMAP-hist national historical emissions time series (1850–2016)”, Potsdam, 2018 [online] http://dataservices.gfz-potsdam.de/pik/showshort.php?id=escidoc:3842934.
As already mentioned in the section on Central America, it is estimated that, in order to meet international commitments and stabilize the global temperature increase at no more than 2 °C, it is necessary to reduce global emissions from 50 Gt of CO2 eq, which is what is currently emitted, to 40 Gt of CO2 eq by 2030. This means reducing per capita emissions from approximately 7 t of CO2 eq to less than 5 t of CO2 eq per inhabitant in the same period (UNEP, 2018). As in the case of Central America, the regional mitigation effort can be calculated on the basis of the following three hypothetical scenarios for 2030:
(i) A business as usual scenario, which is constructed by taking the historical performance of carbon intensity and a GDP projection of 2.8% per year (S1).
(ii) A scenario without greater carbonization, which in this case is better than the historical performance (S2).
(iii) A scenario of compliance with nationally determined contributions (NDCs), in which it is estimated that emissions are reduced by 20% compared to the business as usual scenario by 2030 (S3).

128 Economic Commission for Latin America and the Caribbean (ECLAC)
The results of evaluating the above scenarios for 2030 are summarized in table III.4 and figure III.19.
Table III.4 Scenarios and assumptions, 2030
Scenario
Assumed average annual growth,
2016–2030Greenhouse gas (GHG) emissions outcomes, 2030
∆GDPtGHGGDP t
∆ ∆GHGt
GHG (megatons of
CO2 equivalent)
GHG per capita(tons of CO2
equivalent per inhabitant)
Difference from scenario S1
(percentages)
Scenario S1 2.8 1 3.8 302 7.3 -Scenario S2 2.8 0 2.8 264 6.4 -13Scenario S3 2.8 -0.6 2.2 242 5.8 -20
Source: Economic Commission for Latin America and the Caribbean (ECLAC).Note: S1 is the business as usual scenario, S2 is one in which the decarbonization rate is zero, and in
S3 emissions are cut by 20% relative to the business as usual scenario.
Figure III.19 Simulation of greenhouse gas emissions, 2016 and 2030
A. Total emissions(megatons of CO2 equivalent)
2016 S1 (business as usual) S2 S3
179
302
264 242
0
50
100
150
200
250
300
350
Actual 2030
B. Emissions per capita(tons of CO2 equivalent)
2016Actual 2030
S1 (business as usual) S2 S3
4.6
7.3
6.45.8
0
1
2
3
4
5
6
7
8
Source: Economic Commission for Latin America and the Caribbean).Note: S1 is the business as usual scenario, S2 is one in which the decarbonization rate is zero, and in
S3 emissions are cut by 20% relative to the business as usual scenario.

The climate emergency in Latin America and the Caribbean... 129
In the business as usual scenario (S1), a total of 302 Mt of CO2 eq of greenhouse gases would be emitted by 2030 (it was previously noted that 179 Mt of CO2 eq were emitted in 2016), owing to increased carbon intensity in the countries. Per capita emissions would increase from the current 4.6 t of CO2 eq to 7.3 t of CO2 eq by 2030, and carbon intensity would increase at the observed rate of 1% per year. If the observed rate of historical decarbonization or evolution of the carbon intensity of GDP were maintained, international commitments would be far from being met. In the case of scenario S2, where the decarbonization rate is zero, i.e., where the increase in the carbon intensity of GDP is zero or emissions are growing at the same rate as the economy, per capita emissions would reach 6.4 t of CO2 eq. In scenario S3, where the commitment to reduce emissions by 20% compared to the business as usual scenario is met, per capita emissions would be 5.8 t of CO2 eq. However, in order to reach this value, it would be necessary for the carbon intensity of GDP to decrease. In this scenario, the goal of keeping per capita emissions in the subregion below 5 t of CO2 eq, which is what is needed to achieve the climate targets, would be within sight.
This indicates that, with a marginal effort to decarbonize the electricity mix, i.e., a modest rate of renewable energy penetration, especially in countries with higher carbon intensity, coupled with the electrification of industry and an effort to improve the efficiency of mobility systems and agriculture, the Caribbean countries would be on track to meet the goal of keeping emissions down to 5 tons per capita. Alternatively, restoring ecosystems, such as mangrove forests, would increase carbon capture, creating scope to burn fossil fuels. The local co-benefits for the subregion are obvious, since this would provide gains in terms of energy sufficiency and independence in addition to increased space in the external sector in the medium term (once the phase of importing equipment for generation with renewables had been completed) and improved mobility systems, which would be more efficient and emit fewer pollutants hazardous to health. The option of improved ecosystem management and afforestation would be very helpful in preventing and mitigating the destructive effects of the extreme events referred to in the following section. In combination, as can be appreciated, these actions would substantially improve the development style in the Caribbean countries.
2. Extreme events in the Caribbean
As in the Central American countries, the fundamental asymmetry of climate change can be observed in an extreme form in the small island developing States of the Caribbean: 0.36% of global greenhouse gas emissions are

130 Economic Commission for Latin America and the Caribbean (ECLAC)
generated in those States,11 but their vulnerability is particularly high because of their socioeconomic, geographical and climatic conditions. Almost all the islands are in the hurricane corridor and, naturally, a large proportion of the population and economic activities are located in coastal areas (see map III.7).
Map III.7 The Caribbean: historical tracks of category 5 hurricanes, 1980–2018
TS TD ET N/A H1 H2 H3 H4 H5
Source: National Oceanic and Atmospheric Administration (NOAA), Historical Hurricane Tracks [online] https://coast.noaa.gov/hurricanes/#/search/basin/2/filter/categories/H5/pressure/years.
Note: H stands for hurricane, TS for tropical storm, TD for tropical depression and ET for extratropical storm, while N/A means “not applicable” (i.e., not corresponding to any of the meteorological systems listed here). The tracks of the 14 category 5 hurricanes that occurred in the Caribbean between 1980 and 2018 are shown. In date order, they are: Hurricane Allen, 31 July to 11 August 1980; Hurricane Gilbert, 8 to 20 September 1988; Hurricane Hugo, 10 to 25 September 1989; Hurricane Mitch, 22 October to 9 November 1998; Hurricane Ivan, 2 to 24 September 2004; Hurricane Emily, 11 to 21 July 2005; Hurricane Rita, 18 to 26 September 2005; Hurricane Wilma, 15 to 26 October 2005; Hurricane Dean, 13 to 23 August 2007; Hurricane Felix, 31 August to 6 September 2007; Hurricane Matthew, 28 September to 10 October 2016; Hurricane Irma, 30 August to 13 September 2017; Hurricane Maria, 16 September to 2 October 2017; and Hurricane Michael, 6 to 15 October 2018.
11 The Caribbean’s annual emissions are 179,000 tons of CO2 equivalent, about half of this being explained by hydrocarbon-related activities in Trinidad and Tobago. Of the other countries, the four most populous in the region are, in order, the largest emitters: Cuba, the Dominican Republic, Haiti and Jamaica. In all of them, the largest emissions come from the energy sector. This is because they depend heavily on imports of fossil fuels and because renewable sources play little part in electricity generation. This contrasts with the situation in the countries of Central America, which, together with Uruguay, are leaders in renewable electricity generation.
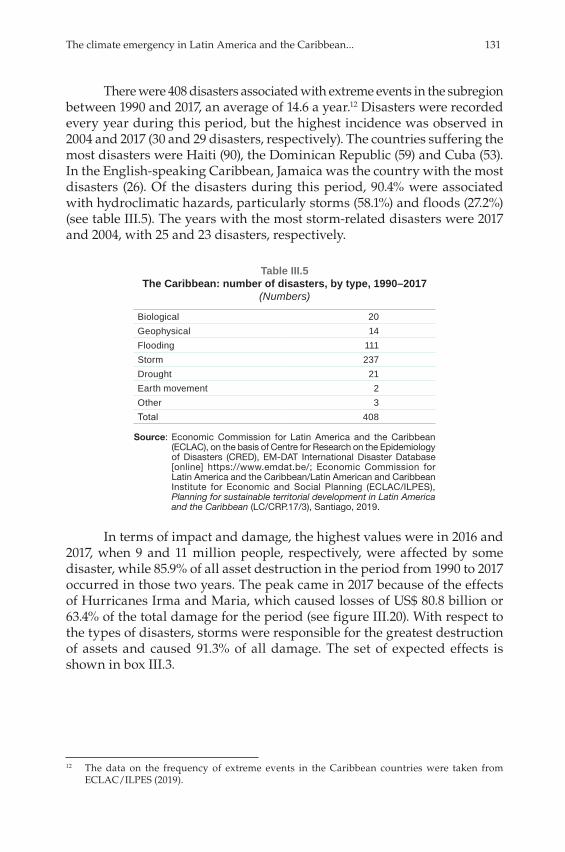
The climate emergency in Latin America and the Caribbean... 131
There were 408 disasters associated with extreme events in the subregion between 1990 and 2017, an average of 14.6 a year.12 Disasters were recorded every year during this period, but the highest incidence was observed in 2004 and 2017 (30 and 29 disasters, respectively). The countries suffering the most disasters were Haiti (90), the Dominican Republic (59) and Cuba (53). In the English-speaking Caribbean, Jamaica was the country with the most disasters (26). Of the disasters during this period, 90.4% were associated with hydroclimatic hazards, particularly storms (58.1%) and floods (27.2%) (see table III.5). The years with the most storm-related disasters were 2017 and 2004, with 25 and 23 disasters, respectively.
Table III.5 The Caribbean: number of disasters, by type, 1990–2017
(Numbers)
Biological 20Geophysical 14Flooding 111Storm 237Drought 21Earth movement 2Other 3Total 408
Source: Economic Commission for Latin America and the Caribbean (ECLAC), on the basis of Centre for Research on the Epidemiology of Disasters (CRED), EM-DAT International Disaster Database [online] https://www.emdat.be/; Economic Commission for Latin America and the Caribbean/Latin American and Caribbean Institute for Economic and Social Planning (ECLAC/ILPES), Planning for sustainable territorial development in Latin America and the Caribbean (LC/CRP.17/3), Santiago, 2019.
In terms of impact and damage, the highest values were in 2016 and 2017, when 9 and 11 million people, respectively, were affected by some disaster, while 85.9% of all asset destruction in the period from 1990 to 2017 occurred in those two years. The peak came in 2017 because of the effects of Hurricanes Irma and Maria, which caused losses of US$ 80.8 billion or 63.4% of the total damage for the period (see figure III.20). With respect to the types of disasters, storms were responsible for the greatest destruction of assets and caused 91.3% of all damage. The set of expected effects is shown in box III.3.
12 The data on the frequency of extreme events in the Caribbean countries were taken from ECLAC/ILPES (2019).

132 Economic Commission for Latin America and the Caribbean (ECLAC)
Figure III.20 The Caribbean: damage caused by disasters, 1990–2017
(Billions of 2017 dollars)
0
10
20
30
40
50
60
70
80
90
1990 1995 2000 2005 2010 2015
Source: Economic Commission for Latin America and the Caribbean (ECLAC), on the basis of Centre for Research on the Epidemiology of Disasters (CRED), EM-DAT International Disaster Database [online] https://www.emdat.be/; Economic Commission for Latin America and the Caribbean/Latin American and Caribbean Institute for Economic and Social Planning (ECLAC/ILPES), Planning for sustainable territorial development in Latin America and the Caribbean (LC/CRP.17/3), Santiago, 2019.
Box III.3 The Caribbean: impact expected as a result of vulnerability
to the effects of climate change, sea level rise and extreme events
• Deterioration of coastal conditions, e.g., beach erosion and coral bleaching negatively affecting local resources, such as fisheries, and reducing the value of beaches as a tourist destination.
• Floods, storm surges, erosion and other coastal hazards, which are exacerbated by rising sea levels and threaten vital infrastructure, settlements and facilities that contribute to the livelihoods of local communities.
• Increased invasion of non-native species, such as sargasso in the Caribbean.
• Economic losses from lower agricultural yields.
• Loss of mangrove forests and coral reefs due to rising sea levels.
• Ocean discoloration and acidification.
• Damage to forests caused by extreme events.
• Reduction in freshwater availability due to reduced precipitation and saltwater intrusion.
• Flooding of coastal settlements and croplands.
• Decrease in tourism due to the increased frequency and severity of extreme weather events.
• Resort to external borrowing to compensate for losses caused by extreme weather events.
Source: Economic Commission for Latin America and the Caribbean (ECLAC), on the basis of Intergovernmental Panel on Climate Change (IPCC), Climate Change 2007: Impacts, Adaptation, and Vulnerability, Cambridge, Cambridge University Press, 2007; United Nations Framework Convention on Climate Change (UNFCCC), “Vulnerability and adaptation to climate change in small island developing states”, Bonn, 2007; Economic Commission for Latin America and the Caribbean (ECLAC), The economics of climate change in Latin America and the Caribbean: paradoxes and challenges of sustainable development (LC/G.2624), Santiago, 2015.

The climate emergency in Latin America and the Caribbean... 133
3. The situation of cities in the Caribbean13
Growing urbanization in the Caribbean is increasing the vulnerability of the subregion, as cities are low-lying and exposed to rising sea levels. Increasing their resilience is therefore a necessity. Urban growth is expected to increase the risk to inhabitants, owing to the exploitation of nearby resources (McHardy and Donovan, 2016) and the increasing pace of sea level rise (Kopp and others, 2016), which, as measured by satellite altimetry, is already taking place at ±3.4 mm per year. For example, in the Bahamas, which were terribly affected by Hurricane Dorian in 2019, 82.8% of the population live less than 10 m above sea level and 94.9% live within 5 km of the coast (Mycoo and Donovan, 2017). The document prepared by the Latin American and Caribbean Institute for Economic and Social Planning (ILPES) for the 2019 Regional Council for Planning states: “In addition to the increased risks to low-lying coastal zones and the exposure of people living in coastal areas, the vulnerabilities of SIDS are also spreading to other critical sectors because of the loss of biodiversity and the destruction of natural protection systems such as reefs and mangroves […] Freshwater aquifers in the great coastal plains of Belize, Guyana and Suriname are also vulnerable to saline intrusion […] At the same time, unsustainable production and consumption patterns are putting more and more pressure on resources such as land, water and biodiversity.14 Failure to pay attention to these factors may have severe environmental and socioeconomic consequences” (ECLAC/ILPES, 2019, p. 52).
ECLAC/ILPES (2019) points out how heavily the population is concentrated in cities, with 18 of the 30 capital cities of the Caribbean being home to more than half the urban population of the country or territory concerned. There are six capitals that contain the whole of the urban population of the country or territory in question, namely Bridgetown, Road Town, Willemstad, Saint George’s, Brades Estate and Philipsburg. While 89% of total population of Curaçao live in Willemstad, 81.9% of the population of Antigua and Barbuda live in Saint John, Nassau is home to 70% of the population of the Bahamas, and 67% of the population of Puerto Rico reside in San Juan. In the Cayman Islands and the United States Virgin Islands, about half the population lives in the capital city (see table III.6).
13 This section takes information and text from ECLAC/ILPES (2019). 14 Mycoo and Donovan (2017) describe harmful land use practices caused in part by unresolved
conflicts arising from inherited land tenure systems associated with plantation economies, obsolete land records, poor execution of physical development plans and environmental policies and regulations, poor site selection for urban settlements, inadequate application of urbanization standards and building codes, deep governance and infrastructure deficits, economic and social inequality and limited application of tools for measuring the value of environmental resources in protecting urban assets (ECLAC/ILPES, 2019).

134 Economic Commission for Latin America and the Caribbean (ECLAC)
Tabl
e III
.6
The
Car
ibbe
an: p
opul
atio
n of
urb
an a
nd ru
ral a
reas
, cap
ital c
ities
and
urb
an p
erce
ntag
es, 2
018
(Tho
usan
ds o
f peo
ple
and
perc
enta
ges)
Reg
ion
or c
ount
ry
Urb
an
popu
latio
na (th
ousa
nds
of p
eopl
e)
Rur
al
popu
latio
n (th
ousa
nds
of p
eopl
e)
Tota
l (th
ousa
nds
of p
eopl
e)
Urb
an
popu
latio
na (p
erce
ntag
es
of to
tal)
Cap
ital c
ity
Popu
latio
n liv
ing
in
capi
tal
(thou
sand
s of
peo
ple)
Popu
latio
n liv
ing
in c
apita
l (p
erce
ntag
es
of to
tal)
Urb
an
popu
latio
n liv
ing
in c
apita
la (p
erce
ntag
es
of to
tal)
Latin
Am
eric
a an
d th
e C
arib
bean
526
057
125
955
652
012
80.7
100
786
15.5
19.2
The
Car
ibbe
anb
32 5
4013
673
46 2
1370
.4 1
2 94
228
.039
.8A
ngui
lla15
015
100.
0Th
e Va
lley
19.
39.
3A
ntig
ua a
nd B
arbu
da25
7810
324
.6S
aint
Joh
n21
20.1
81.9
Aru
ba46
6010
643
.4O
ranj
esta
d30
28.3
65.1
Bah
amas
332
6839
983
.0N
assa
u28
070
.084
.4B
arba
dos
8919
728
631
.1B
ridge
tow
n89
31.1
100.
0B
eliz
e17
520
838
245
.7B
elm
opan
236.
013
.1B
erm
udas
610
6110
0.0
Ham
ilton
1016
.516
.5B
ritis
h V
irgin
Isla
nds
1517
3247
.7R
oad
Tow
n15
47.7
100.
0C
aym
an Is
land
s62
062
100.
0G
eorg
e To
wn
3555
.955
.9C
uba
8 85
12
638
11 4
8977
.0H
avan
a 2
136
18.6
24.1
Cur
açao
144
1816
289
.1W
illem
stad
144
89.1
100.
0D
omin
ica
5222
7470
.5R
osea
u15
20.1
28.5
Dom
inic
an R
epub
lic8
823
2 06
010
883
81.1
San
to D
omin
go3
172
29.1
36.0
Fren
ch G
uian
a24
743
290
85.3
Cay
enne
5819
.823
.3G
rena
da39
6910
836
.3S
aint
Geo
rge’
s39
36.3
100.
0G
uade
loup
e44
27
449
98.5
Bas
se-T
erre
5813
.013
.2G
uyan
a20
857
478
226
.6G
eorg
etow
n11
014
.152
.8H
aiti
6 14
34
970
11 1
1355
.3Po
rt-au
-Prin
ce2
637
23.7
42.9
Jam
aica
1 61
41
285
2 89
955
.7K
ings
ton
589
20.3
36.5
Mar
tiniq
ue34
342
385
89.0
Fort-
de-F
ranc
e79
20.6
23.1

The climate emergency in Latin America and the Caribbean... 135
Reg
ion
or c
ount
ry
Urb
an
popu
latio
na (th
ousa
nds
of p
eopl
e)
Rur
al
popu
latio
n (th
ousa
nds
of p
eopl
e)
Tota
l (th
ousa
nds
of p
eopl
e)
Urb
an
popu
latio
na (p
erce
ntag
es
of to
tal)
Cap
ital c
ity
Popu
latio
n liv
ing
in
capi
tal
(thou
sand
s of
peo
ple)
Popu
latio
n liv
ing
in c
apita
l (p
erce
ntag
es
of to
tal)
Urb
an
popu
latio
n liv
ing
in c
apita
la (p
erce
ntag
es
of to
tal)
Mon
tser
rat
05
59.
1B
rade
s Es
tate
09.
110
0.0
Puer
to R
ico
3 42
423
53
659
93.6
San
Jua
n2
454
67.1
71.7
Sai
nt K
itts
and
Nev
is17
3956
30.8
Bas
sete
rre
1425
.884
.0S
aint
Luc
ia34
146
180
18.7
Cas
tries
2212
.466
.3S
aint
Vin
cent
and
th
e G
rena
dine
s58
5311
052
.2K
ings
tow
n27
24.2
46.3
Sin
t Maa
rten
410
4110
0.0
Phili
psbu
rg41
100.
010
0.0
Sur
inam
e37
519
356
866
.1Pa
ram
arib
o23
942
.163
.8Tr
inid
ad a
nd T
obag
o73
064
31
373
53.2
Port
of S
pain
544
39.7
74.6
Turk
s an
d C
aico
s Is
land
s33
236
93.1
Coc
kbur
n To
wn
515
.116
.3U
nite
d S
tate
s V
irgin
Isla
nds
100
410
595
.7C
harlo
tte
Am
alie
5249
.952
.1
So
urce
: U
nite
d N
atio
ns, W
orld
Urb
aniz
atio
n P
rosp
ects
: The
201
8 R
evis
ion,
New
Yor
k, 2
018;
Eco
nom
ic C
omm
issi
on fo
r La
tin A
mer
ica
and
the
Car
ibb
ean/
Latin
Am
eric
an
and
Car
ibb
ean
Inst
itute
for
Eco
nom
ic a
nd S
ocia
l Pla
nnin
g (E
CLA
C/I
LPE
S),
Pla
nnin
g fo
r su
stai
nab
le t
errit
oria
l dev
elop
men
t in
Lat
in A
mer
ica
and
the
Car
ibb
ean
(LC
/CR
P.17
/3),
San
tiago
, 201
9.a
The
defi
nitio
n of
“ur
ban
” is
the
one
use
d in
eac
h co
untr
y.b
Incl
udes
the
30
mem
ber
cou
ntrie
s an
d a
ssoc
iate
mem
ber
s of
the
Car
ibb
ean
Dev
elop
men
t an
d C
oop
erat
ion
Com
mitt
ee (C
DC
C).
Tab
le II
I.6 (c
onc
lud
ed)

136 Economic Commission for Latin America and the Caribbean (ECLAC)
With regard to the exposure of settlements to the effect of rising sea levels and hurricanes, the Bahamas, Cuba, the Dominican Republic, Haiti and Jamaica have more than 100 km of urban coastline (see figure III.21), and many cities are less than 5 metres above sea level (see map III.8). Flood risks are exacerbated by the complexity of water systems and the incipient nature of countries’ adaptive capacity.
In addition, according to ILPES, by 2050 the Caribbean will have an urbanization rate of 82.5%, higher than the rest of the region’s. This rate will represent an increase of at least 15%, in a dispersed pattern that will form “city-regions” and “urban corridors”. “Urban expansion in the Caribbean will result in a two- to fivefold increase in the current total urban area, in response to an estimated increase of some 10 million new urban inhabitants by 2050”15 (ECLAC/ILPES, 2019, p. 45).
Figure III.21 The Caribbean: urban coastline, 2013
(Kilometres)
Dominica15.00
Suriname2.60
Saint Lucia8.70
Antigua and Barbuda
8.20
Saint Kittsand Nevis
12.35
Saint Vincent and the Grenadines
5.70
Grenada10.20
Jamaica207.95
Haiti124.11
Bahamas147.45
Dominican Rep.120.75
Barbados40.92
Guyana78.69
Cuba156.05
Belize46.63
Trinidad and Tobago38.70
Source: M. Mycoo and M. Donovan, A Blue Urban Agenda: Adapting to Climate Change in the Coastal Cities of Caribbean and Pacific Small Island Developing States, Washington, D.C., Inter-American Development Bank (IDB), 2017; Economic Commission for Latin America and the Caribbean/Latin American and Caribbean Institute for Economic and Social Planning (ECLAC/ILPES), Planning for sustainable territorial development in Latin America and the Caribbean (LC/CRP.17/3), Santiago, 2019.
15 According to research by McHardy and Donovan, in 2050 the urban area of the Caribbean will be equivalent to an area between three times the size of Barbados and the whole of Trinidad and Tobago (see McHardy and Donovan, 2016). Studies by Angel and others (2010) have projected significant increases in urban land cover in the Caribbean and in Pacific small island developing States between 2000 and 2050. For example, Trinidad and Tobago is expected to experience a seven-fold increase in urban land cover (ECLAC/ILPES, 2019, p. 45).

The climate emergency in Latin America and the Caribbean... 137
Map III.8 The Caribbean: spatial distribution of population, 2018
Dominican Rep.Cayman Islands
Netherlands Antilles
Antigua and Barbuda
Cuba
Grenada
Jamaica
Saint Kitts and Nevis
Turks and Caicos Islands
Trinidad and Tobago
Bahamas
British Virgin Islands
Guadeloupe
Haiti
Puerto Rico
Martinique
Antigua and Barbuda
Saint Vincent and the Grenadines
British Virgin IslandsGuadeloupePuerto Rico
United States Virgin Islands
Venezuela(Bol. Rep. of)
Population by area (percentages) Urban area Rural area
Source: Latin American and Caribbean Institute for Economic and Social Planning (ILPES), on the basis of Economic Commission for Latin America and the Caribbean (ECLAC), CEPALSTAT [online database] http://estadisticas.cepal.org/cepalstat/WEB_CEPALSTAT/Portada.asp; Economic Commission for Latin America and the Caribbean/Latin American and Caribbean Institute for Economic and Social Planning (ECLAC/ILPES), Planning for sustainable territorial development in Latin America and the Caribbean (LC/CRP.17/3), Santiago, 2019.
In such a scenario, pressures on land, services and infrastructure will also increase, and policies to anticipate these pressures, such as improved security of land tenure, public land management, housing policy, transport, waste management and water security, will be crucial (see box III.4). As long as territories are unprepared and these phenomena are unplanned, the development style will multiply existing vulnerabilities by adding those created by the uncontrolled growth of informal settlements.

138 Economic Commission for Latin America and the Caribbean (ECLAC)
Box III.4 Planning and risk
Disaster risk reduction (DRR) has been integrated into a number of development frameworks and international agreements, such as the Hyogo Framework for Action 2005–2015: Building the Resilience of Nations and Communities to Disasters, and its successor, the Sendai Framework for Disaster Risk Reduction 2015–2030. It was also integrated into the Samoa Pathway and into the 2030 Agenda for Sustainable Development. In addition, given the Caribbean’s vulnerability to disasters, stakeholders in the subregion also need to improve their capacity to incorporate disaster risk management components into sectoral and budget planning. Disaster risk management consists of five pillars with their respective outcomes (GFDRR, 2013):
(i) Risk identification. Improved identification and understanding of disaster risks through building capacity for assessment and analysis.
(ii) Risk reduction. Avoided creation of new risks and reduced risks in society through greater disaster risk consideration in policy and investment.
(iii) Preparedness. Improved capacity to manage crises through developing forecasting and disaster management capacities.
(iv) Financial protection. Increased financial resilience of governments, private sector and households through financial protection strategies (parametric insurance, traditional insurance and budgetary provisions).
(v) Resilient recovery. Quicker, more resilient recovery through support for reconstruction planning.
Although progress has been made with disaster risk management planning (Bahamas, Barbados, Belize, Dominican Republic, Guyana, Haiti, Jamaica, Saint Lucia, Suriname and Trinidad and Tobago), this approach has not yet permeated the regulatory and institutional frameworks governing sectoral and territorial institutions or planning and budgeting processes, as reported in the following paragraphs:
• Information for decision-making on disaster risk management. Although most development and sectoral policies acknowledge this need for data and identify important gaps, there are no clear guidelines for the generation and dissemination of disaster risk management-related information. The countries analysed have institutions responsible for the study and monitoring of geological and hydrometeorological hazards, but this information is not necessarily accessible or used to guide actions and decisions. Information is still being primarily used in the academic sector and in early warning systems. Nevertheless, it should be noted that most countries already have laws ensuring access to public information. Therefore, it is necessary to clarify the role of disaster risk management in this regard and build upon the accomplishments of such laws. As expressed in most disaster risk management instruments, it is recommended that disaster risk management information systems should be implemented, as well as technical guidelines to support sectoral and territorial engagement, and that consistency in the collection of data should be ensured. It is important to highlight the importance of consistently collecting sectoral baseline data, as they are useful not only for identifying and reducing risks, but also for assessing the effects and impacts of disasters. On the subject of sectoral data, the Economic Commission for Latin America and the Caribbean and World Bank have evaluated a number of disasters in the subregion, thereby consolidating a baseline in a range of sectors that should be kept continually updated.
• Integration of disaster risk management into the project preparation and evaluation cycle. The standards and instruments used in some countries for carrying out environmental impact assessments already integrate disaster risk analysis, as well as the design and implementation of disaster risk reduction measures. However, the lack of national information systems or technical guidelines makes it difficult to properly consider disaster risk management in the preparation and evaluation cycle of public investment and development projects in general. A combination of improved data and strengthened technical capabilities is crucial to incorporating disaster risk management into public investment projects. The incorporation of a multi-hazard disaster risk management component throughout the life cycle of a project would increase its resilience and sustainability, and contribute to protecting public investments, while ensuring continuity in the provision of public services and products.
The climate emergency in Latin America and the Caribbean... 139
• Territorial approach. In some countries, the development of regional, provincial or municipal disaster risk management plans has been promoted, while in others the approach has been to incorporate them into development plans, or for both types of instruments to coexist. However, the territorial approach and the definition of sectoral roles and responsibilities where disaster risk management is concerned has not always been accompanied by the allocation of financial resources or budget incentives. It is suggested that countries strengthen the territorial component of their disaster risk management strategies, as it is observed that most local authorities are tasked primarily with emergency preparedness and response tasks. This requires an update of disaster risk management frameworks to establish binding responsibilities for territorial levels and strengthen areas such as risk identification, planning of mitigation measures, data gathering and considerations for reconstruction processes that do not reproduce recognized risks and vulnerabilities.
• Sectoral approach. The countries of the subregion have evolved from having a national institution in charge of disasters to creating national systems of disaster risk management. These systems have generated normative and institutional frameworks that have gradually defined the roles and responsibilities of the different sectors and institutions in charge of matters related to disaster risk management. Some specific sectors such as agriculture, environment, infrastructure and health show advances in the incorporation of such management. Perhaps one of the strongest links identified is between environment, climate change and disaster risk management. It is also observed that, to the extent that a country has updated frameworks for climate change adaptation and mitigation, there is linkage with the principles and activities of disaster risk management. Similarly, several development and sectoral policies recognize the importance of land use and territorial planning to increase resilience and adapt to or mitigate the effects of climate change. Furthermore, some aspects of disaster risk management have been considered in environmental impact studies, in particular the identification of natural hazards that may affect a given project, as well as the elaboration of mitigation measures to ensure its sustainability. Sectors that have modified their norms and structures to incorporate a disaster risk management strategy show better performance through the incorporation of specific actions into planning and sectoral budgets.
• Macroeconomic policies. Some normative frameworks for disaster risk management in the subregion provide for the creation of national funds. Some of these are qualified for the financing of ex ante activities and others are only qualified to meet the emerging needs of disaster response. However, the fact that legal frameworks mandate the creation of these funds does not necessarily mean that the required resources have been estimated or actually allocated. When ministries of economy and finance have well defined disaster risk management roles and responsibilities, the design and establishment of national financial protection strategies has been facilitated, which also contributes to both the sustainability and the acquisition of funds. In addition, many countries have arranged catastrophe insurance facilities in the international market.
• Integration of disaster risk management into development policies and other instruments. Different degrees of progress have been attained in the countries of the subregion, opening up a variety of opportunities for sharing experiences and cooperating. Post-disaster recovery processes represent an opportunity to rectify the previously followed course and rebuild with resilience by incorporating disaster risk management into development strategies.
Source: O. Bello and others, “Mainstreaming disaster risk management strategies in development instruments: policy briefs for selected member countries of the Caribbean Development and Cooperation Committee”, Studies and Perspectives series, No. 58 (LC/TS.2017/80; LC/CAR/TS.2017/6), Santiago, Economic Commission for Latin America and the Caribbean (ECLAC), 2017; C. Weekes and O. Bello, “Mainstreaming disaster risk management strategies in development instruments (II): policy briefs for Barbados, Guyana, Saint Lucia, Suriname, and Trinidad and Tobago”, Studies and Perspectives series, No. 75 (LC/TS.2019/7), Santiago, Economic Commission for Latin America and the Caribbean (ECLAC), 2019; Economic Commission for Latin America and the Caribbean/Latin American and Caribbean Institute for Economic and Social Planning (ECLAC/ILPES), Planning for sustainable territorial development in Latin America and the Caribbean (LC/CRP.17/3), Santiago, 2019; Global Facility for Disaster Reduction and Recovery (GFDRR), Managing Disaster Risks for a Resilient Future: A Strategy for the Global Facility for Disaster Reduction and Recovery 2013–2015, Washington, D.C., 2013.
Box III.4 (concluded)

140 Economic Commission for Latin America and the Caribbean (ECLAC)
As can be seen in relation to the dynamics of human settlements, adaptation and mitigation go hand in hand in the urban context, since to be less exposed cities would have to have a shorter sea frontage and thus a higher density, which would at the same time make them more compact. This would reduce the intensity of emissions and allow for mobility options that would have a smaller environmental footprint. Similarly, the role of natural defences is critical in curbing the impact of climate phenomena, be they mangroves, reefs or ground vegetation.
4. Estimates of the economic impact of climate change
The cost of climate-related disasters in the period 2000–2017 was substantial, as can be seen in figure III.22, where it is expressed as a proportion of GDP. In 2017, the impact of Hurricane Maria in Dominica was estimated at 260% of GDP, while in 2004 the effects of Hurricane Ivan in Grenada amounted to 148% of GDP. This type of extreme event has caused damage equivalent to two-digit percentages of GDP in Antigua and Barbuda, the Bahamas, Haiti and Saint Vincent and the Grenadines, while in Cuba, the Dominican Republic, Jamaica, Saint Lucia and Saint Kitts and Nevis there has been at least one event that has cost more than 1% of GDP.
Figure III.22 The Caribbean (13 countries): economic cost of natural disasters, 2000–2017
(Percentages of GDP)
D. Cuba
2001
2002
2003
2004
2005
2006
2007
2008
2012
2013
2015
2016
2017
0
2
4
6C. Barbados
2002
2004
2010
2017
0
0.05
0.10
0.15
B. Bahamas
2001
2004
2005
2007
2008
2011
2012
2013
2015
2016
2017
0
5
10
15
A. Antigua and Barbuda
2008
2010
2017
0
5
10
15

The climate emergency in Latin America and the Caribbean... 141
L. Saint Vincent and the Grenadines
2002
2004
2005
2010
2011
2013
2016
0
5
10
15
K. Saint Lucia
2004
2007
2010
2013
2016
0
1
2
3
J. Saint Kitts and Nevis
2017
1.98
2.00
2.02
2.04
2.06
H. Haiti
2001
2002
2003
2004
2005
2006
2007
2008
2009
2010
2011
2012
2013
2014
2015
2016
2017
0
10
20
30G. Grenada
2004
2010
0
50
100
150
I. Jamaica
2001
2002
2004
2005
2006
2007
2008
2010
2012
2014
2016
2017
0
2.5
5.0
7.5
8.0
M. Trinidad and Tobago
2004
2005
2010
0
0.002
0.004
0.006
0.008
F. Dominican Rep.
2001
2002
2003
2004
2005
2007
2008
2009
2010
2011
2012
2013
2014
2015
2016
2017
0
0.5
1.0
1.5E. Dominica
2007
2011
2015
2017
0
100
200
300
Source: Economic Commission for Latin America and the Caribbean (ECLAC), on the basis of Centre for Research on the Epidemiology of Disasters (CRED), EM-DAT International Disaster Database [online] https://www.emdat.be/.
Figure III.22 (concluded)

142 Economic Commission for Latin America and the Caribbean (ECLAC)
The loss of human life has been high and increasing (see figure III.23). In the period 2000–2012 there were more deaths from floods and storms than in 1980–1989 (ECLAC, 2019c). Greater urbanization and the increase in agricultural land are lethality risk factors in the nations of the Caribbean Community (CARICOM).
Figure III.23 The Caribbean: disaster-related fatalities, 2000–2019
(Numbers)
E. Dominica F. Dominican Rep.
G. Grenada H. Haiti
A. Antigua and Barbuda B. Bahamas
C. Barbados D. Cuba
2007
2011
2015
2017
2001
2002
2003
2004
2005
2007
2008
2009
2010
2011
2012
2013
2014
2015
2016
2017
2018
2004
2010
2001
2002
2003
2004
2005
2006
2007
2008
2009
2010
2011
2012
2013
2014
2015
2016
2017
2019
2008
2010
2017
2001
2004
2005
2007
2008
2011
2012
2013
2015
2016
2017
2002
2004
2010
2017
2001
2002
2003
2004
2005
2006
2007
2008
2012
2013
2015
2016
2017
2018
2019
0
5
10
15
20
0
2 000
4 000
6 000
0
0.25
0.50
0.75
1.00
0
10
20
30
40
0
10
20
30
0
200
400
600
0
0.25
0.50
0.75
1.00
0
20
40
60

The climate emergency in Latin America and the Caribbean... 143
M. Trinidad and Tobago
K. Saint Lucia L. Saint Vincent and the Grenadines
2004
2005
2010
2018
2004
2007
2010
2013
2016
2002
2004
2005
2010
2011
2013
2016
0
2.5
5.0
7.5
10.0
12.5
0
5
10
15
0
1
2
3
I. Jamaica J. Saint Kitts and Nevis20
01
2002
2004
2005
2006
2007
2008
2010
2012
2014
2016
2017
2017
−0.050
−0.025
0.000
0.025
0.050
0
5
10
15
Source: Economic Commission for Latin America and the Caribbean (ECLAC), on the basis of Centre for Research on the Epidemiology of Disasters (CRED), EM-DAT International Disaster Database [online] https://www.emdat.be/.
Another effect of this type of extreme event is to increase the pressures that drive emigration, which has a strong female component in the region. For example, Hurricane Maria caused between 20.5% and 27.3% of Dominica’s total population to migrate, while 861 men and 773 women had to be evacuated from Barbuda and taken to Antigua (Lebrechtta, 2019). As in Central America, extreme events negatively affect women’s economic autonomy, reducing their livelihoods and increasing the burden of reproductive work and unpaid care. In the Caribbean, many poor women are employed at the lower end of the tourism sector: when disasters cause severe damage to the sector, many are left unemployed because they do not have the skills to take up other jobs (ECLAC, 2019c).
According to Bello and De Meira (2019), the Caribbean countries were more affected than other types of small island developing States in the period 1990–2018 in terms of the number of disasters, the ratio of affected
Figure III.23 (concluded)

144 Economic Commission for Latin America and the Caribbean (ECLAC)
population to total population, and the ratio of damage to GDP. The ratio of affected population to total population was 5.8% in Caribbean small island developing States, 3.5% in the Pacific and 2.1% in the Atlantic, the Indian Ocean, the Mediterranean and the South China Sea. “As regards the damage/GDP ratio, the highest average value was in the Caribbean, followed by SIDS in the AIMS region (3.7%) and SIDS in the Pacific (2.8%)” (ECLAC/ILPES, 2019, p. 47). Where Central America and South America are concerned, the average value of the damage-to-GDP ratio in countries where a disaster occurred during the period 1970–2010 was 6.9% in the Caribbean, 3% in Central America and 0.4% in South America (Bello and others, 2017).
The Caribbean is an outlier for the economic impact of disasters relative to the size of economies. For example, in four assessments of the disasters16 occurring in the Atlantic during the 2017 hurricane season, the total cost was found to have exceeded 40% of GDP;17 in three of them, it was over 100%. External shocks of this magnitude mean that social and economic gains may be lost, underscoring the importance of including resilience components in development policies.
5. The challenge of debt in the Caribbean
The Caribbean region faces difficulties arising from high debt and slow growth. The structurally high level of debt in the countries of the region is periodically compounded by economic losses caused by extreme weather events. The Caribbean small island developing States are among the most indebted in the world, and the level of public debt to GDP is particularly severe in Antigua and Barbuda, Barbados, Grenada, Jamaica and Saint Kitts and Nevis. The situation is exacerbated by declining foreign direct investment (FDI) flows, high unemployment, especially among youth, and slow economic growth.
16 The Economic Commission for Latin America and the Caribbean (ECLAC) has been a pioneer in disaster assessment and the development of a methodology for this purpose. The damage and loss assessment (DaLA) methodology serves to calculate the losses, damages and additional costs associated with a specific event. The main references used in this section are the disaster assessments carried out by ECLAC in the following countries: Bahamas (2015, 2016 and 2017), Belize (2016), Anguilla (2017), Turks and Caicos Islands (2017), British Virgin Islands (2017) and Sint Maarten (2017). The 2016 assessments of Belize and the Bahamas were conducted jointly with the Food and Agriculture Organization of the United Nations (FAO) and the Pan American Health Organization (PAHO). The 2015 and 2017 assessments of the Bahamas were conducted in conjunction with PAHO, and those of Anguilla and Sint Maarten with the Caribbean Development Bank.
17 Reported damage underestimates the effects of disasters, since the EM-DAT International Disaster Database only contains information on damage defined as partially or totally destroyed physical assets. ECLAC evaluations include losses (the monetary value of goods that go unproduced and services that go unprovided) and additional costs incurred in producing goods and temporarily providing interrupted services, in addition to the costs of dealing with the emergency (ECLAC, 2014a). From this other point of view, losses from hurricanes Irma and Maria in Anguilla, the Bahamas, the British Virgin Islands, the Turks and Caicos Islands and Sint Maarten represented 48% of the total cost.

The climate emergency in Latin America and the Caribbean... 145
In fact, the slowness of growth is partly attributed to the debt burden, as it restricts fiscal space and has made it difficult to finance the Sustainable Development Goals (SDGs). High debt has induced a period of fiscal consolidation that restricts the ability to sustain social spending and the much-needed investment in infrastructure that precedes private investment. The economic situation in the subregion has been aggravated by the long decline of foreign direct investment, which is an important source of funding.
Figure III.24 shows the debt path from 2008 to 2017, distinguishing between countries that export goods and countries that export services, such as tourism or financial services. It should be noted that the debt of goods exporters has increased as a result of declining commodity prices and falling tax revenues.
Figure III.24 The Caribbean: total public debt, 2008–2017
(Percentages of GDP)
0
10
20
30
40
50
60
70
80
90
2008 2009 2010 2011 2012 2013 2014 2015 2016 2017
Service producers The Caribbean Good producers
Source: Economic Commission for Latin America and the Caribbean (ECLAC), on the basis of official data from the countries; Economic Commission for Latin America and the Caribbean (ECLAC), Fiscal Panorama of Latin America and the Caribbean, 2019 (LC/PUB.2019/8-P), Santiago, 2019; Fiscal Panorama of Latin America and the Caribbean, 2018 (LC/PUB.2018/4-P), Santiago, 2018; Fiscal Panorama of Latin America and the Caribbean, 2017 (LC/PUB.2017/6-P), Santiago, 2017; Fiscal Panorama of Latin America and the Caribbean, 2016 (LC/L.4140), Santiago, 2016.
The average debt burden has increased since the global crisis of 2008–2009 despite the implementation of adjustment programmes, whether domestically initiated or agreed with the International Monetary Fund (IMF). In 2017, the average debt in the Caribbean was equivalent to 73.6% of GDP: 66.4% in goods-producing countries and 75.9% in service providers. Seven Caribbean countries had debts exceeding 70% of GDP; considering that the debt sustainability threshold according to the IMF is 60% of GDP, it is no exaggeration to say that the region is in difficulties. Debt service is also critical. Total service represented 27% of the subregion’s GDP: 26% in goods-producing countries and 27% in service providers. In one extreme case, interest and repayments represented about 60% of government revenue.
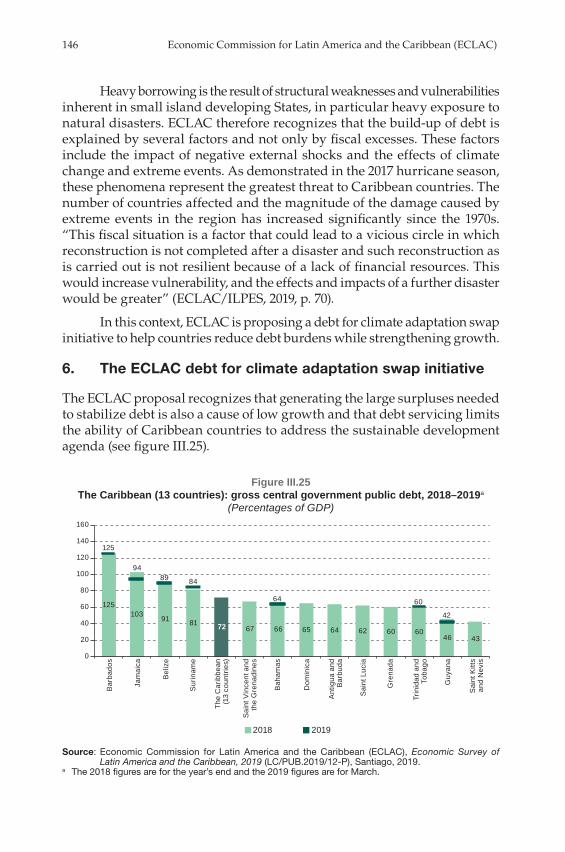
146 Economic Commission for Latin America and the Caribbean (ECLAC)
Heavy borrowing is the result of structural weaknesses and vulnerabilities inherent in small island developing States, in particular heavy exposure to natural disasters. ECLAC therefore recognizes that the build-up of debt is explained by several factors and not only by fiscal excesses. These factors include the impact of negative external shocks and the effects of climate change and extreme events. As demonstrated in the 2017 hurricane season, these phenomena represent the greatest threat to Caribbean countries. The number of countries affected and the magnitude of the damage caused by extreme events in the region has increased significantly since the 1970s. “This fiscal situation is a factor that could lead to a vicious circle in which reconstruction is not completed after a disaster and such reconstruction as is carried out is not resilient because of a lack of financial resources. This would increase vulnerability, and the effects and impacts of a further disaster would be greater” (ECLAC/ILPES, 2019, p. 70).
In this context, ECLAC is proposing a debt for climate adaptation swap initiative to help countries reduce debt burdens while strengthening growth.
6. The ECLAC debt for climate adaptation swap initiative
The ECLAC proposal recognizes that generating the large surpluses needed to stabilize debt is also a cause of low growth and that debt servicing limits the ability of Caribbean countries to address the sustainable development agenda (see figure III.25).
Figure III.25 The Caribbean (13 countries): gross central government public debt, 2018–2019a
(Percentages of GDP)
2018 2019
125103 91 81 72 67 66 65 64 62 60 60
46 43
125
9489 84
64 60
42
0
20
40
60
80
100
120
140
160
Bar
bado
s
Jam
aica
Bel
ize
Sur
inam
e
The
Car
ibbe
an(1
3 co
untri
es)
Sai
nt V
ince
nt a
ndth
e G
rena
dine
s
Bah
amas
Dom
inic
a
Ant
igua
and
Bar
buda
Sai
nt L
ucia
Gre
nada
Trin
idad
and
Toba
go
Guy
ana
Sai
nt K
itts
and
Nev
is
Source: Economic Commission for Latin America and the Caribbean (ECLAC), Economic Survey of Latin America and the Caribbean, 2019 (LC/PUB.2019/12-P), Santiago, 2019.
a The 2018 figures are for the year’s end and the 2019 figures are for March.
The climate emergency in Latin America and the Caribbean... 147
The debt relief approach proposed by ECLAC has two dimensions:
(i) In the case of countries that are heavily indebted to official creditors, funds interested in fostering resilience and adaptation would be persuaded to acquire multilateral and bilateral debt at negotiated discount rates.
(ii) In the case of countries that are heavily indebted to private creditors, a repurchase and debt swap mechanism would be applied. The Caribbean countries’ debt repayments would be deposited in a fund earmarked for climate resilience, in order to finance investments in green industries clearly aimed at adaptation and mitigation projects, in accordance with the countries’ own priorities.
The role of climate funds is crucial, as the funds committed would already be discounted in donors’ budgets and would represent a resource that could be drawn on. These funds would be among the few sources of concessional financing for middle-income countries such as the small island developing States of the Caribbean.
The resilience fund would provide financing to obtain a mix of public and private resources for green industries able to meet the requirements of climate funds and oriented towards the development of greener value chains. Such industries would encompass production, marketing, regulation, and research and development.
The ECLAC proposal may also be attractive to creditors: it would offer lower payment risk, strengthen the resilience of Caribbean countries and help to build up a fund that could be gradually increased through investments with positive returns. It is also an opportunity for member countries to secure the fiscal space needed to generate the requisite investment, while pursuing adaptation and mitigation strategies. The proposal could inspire a broad approach in the region whereby fiscal management can be improved and a future debt build-up prevented, while providing a coordination framework for financing more sustainable growth in the region.18
The twenty-sixth meeting of the Caribbean Development and Cooperation Committee (CDCC), held in April 2016, supported the ECLAC proposal. The initiative was also endorsed by CARICOM heads of government at the thirty-eighth session held in July 2017. To move towards the resolution, the CDCC recommended the creation of a working group that has now met twice. The latest meeting recommended three countries to test the initiative, illustrate its benefits and initiate dialogue with major creditors and sources of climate financing. The recommended countries were Antigua and Barbuda, Saint Lucia and Saint Vincent and the Grenadines, owing to their debt profile and
18 ECLAC recognizes the need to improve fiscal management and has worked with several countries in the Caribbean to develop their capacity to carry out fiscal expenditure assessments so that government priorities are better aligned with budget allocations.
148 Economic Commission for Latin America and the Caribbean (ECLAC)
the impact that Hurricanes Irma and Maria had on Barbuda. The dialogue is proceeding cautiously to avoid premature announcements that could affect the collaboration of creditors. The respective debts are being analysed using the World Bank framework and the IMF debt sustainability analysis to determine how the initiative would work. This will provide guidance on the level of discount needed to operationalize the proposal. ECLAC is to study the impact of debt relief on progress towards compliance with the SDGs and contrast the gap between repayment and the financing needed to achieve that objective.
The heart of the initiative is that multilateral institutions forgive part of the debt of the smaller economies and that an amount equivalent to the annual payment be contributed in the local currency of the debtor countries to the aforementioned Caribbean Resilience Fund, whose purpose is to finance mitigation and adaptation processes for 10 years. This instrument, which would advance the 2030 Agenda for Sustainable Development, requires the solidarity of Latin American countries that have a vote at IMF, the World Bank and the Inter-American Development Bank (IDB) (ECLAC, 2016a).
Although they are financially fragile and investment efficiency is low, many Caribbean countries have limited access to concessional external financing because they are considered middle-income. Restricted access to financing and adjustments arising from their debt situation make it difficult to adopt and implement projects aimed at mitigating and adapting to climate change. In addition to debt relief, the external constraint needs to be eased in other respects in the Caribbean; for example, reliance on energy-linked imports needs to be reduced and mobility and coastal protection based on ecosystem solutions need to be improved, all of which would help expand the scope for the countries’ development.
D. Conclusions
When it comes to climate change, the countries of Central America and the Caribbean are more vulnerable than the rest of the region because of a combination of factors such as the occurrence of extreme weather events, the small size of their territories, their relatively limited economic structures and the constraints of their fiscal position.
This is compounded by a limited capacity for planning, information generation and prevention, all of which has cumulative effects that reduce the development capacity of these countries. The situation in the Caribbean is particularly serious because of the heavy debt burden, the recurrence of hurricane damage and losses, and the increasing rate of urbanization. The type of urban growth, which is rapid and unplanned and has significant infrastructure deficits, increases vulnerability owing to high exposure to the sea and the low elevation of human settlements.

The climate emergency in Latin America and the Caribbean... 149
Disaster risk reduction and the response to sea level rise, i.e., adaptation, has multiple fronts ranging from information generation to financial protection and public participation. In these countries, ecosystem-based adaptation plays a particularly important role in coastal protection. At the same time, adaptation actions are in some cases inseparable from mitigation actions, examples being mangrove and coral recovery and urban densification. A pattern of consumption that was less dependent on imports, such as one based on renewable energy and better public mobility systems, could help alleviate the burden of the external constraint.
In the face of this scenario, it is essential to increase the scope for financial action to promote adaptation and resilience in the Caribbean countries, whence the ECLAC initiative of reducing debt by swapping it for investment in resilience. The idea is that this would break the vicious circle of failure to fully address vulnerabilities and lack of resilience because there are not enough fiscal resources for investment, which interacts with social dynamics to create chronic barriers to development and perpetuate and even worsen vulnerability.

Chapter IV
Adaptation to climate change
Climate change adaptation is the process of adjustment to actual or expected climate and its effects. In human systems, adaptation seeks to moderate or forestall harm or exploit beneficial opportunities. In natural systems, human intervention may facilitate adjustment to expected climate and its effects (IPCC, 2014a).1 Adaptation can reduce the risks of climate change impacts, but there are limits to its effectiveness, especially with greater magnitudes and rates of climate change. Taking a longer-term perspective, in the context of sustainable development, increases the likelihood that more immediate adaptation actions will also enhance future options and preparedness (IPCC, 2014a).
Adaptation can contribute to the well-being of current and future populations, the security of assets and the maintenance of ecosystem goods, functions and services now and in the future. An important consideration is that adaptation is place- and context-specific, and there is no one-size-fits-all approach to risk reduction.
As has been shown in previous chapters, the Latin American and Caribbean region is extremely vulnerable to climate change because of its dependence on highly climate-sensitive activities, its low adaptive capacity and its exposure to various extreme hydrometeorological events. Thus, in the face of the now unavoidable effects of climate change, the region’s priorities include increasing society’s resilience and adaptive capacity and exploring synergies between adaptation processes and other development goals. This
1 This definition, used in the Fifth Assessment Report of the Intergovernmental Panel on Climate Change (IPCC) (known as AR5), differs in scope and focus from the definition used in previous reports, reflecting scientific progress in this area.

152 Economic Commission for Latin America and the Caribbean (ECLAC)
chapter discusses the objective of adaptation and different options for the region and presents the sectors mentioned by the countries in their nationally determined contributions (NDCs) as priorities for adaptation.
A. Adapting to climate change
The goal of adaptation is to reduce or avoid the negative impact of climate variability by increasing resilience in vulnerable sectors (see box IV.1 for definitions of key adaptation-related terms). Adaptation determines the net physical and economic impact of climate change on production activities, society and ecosystems. However, identifying genuine adaptation processes is a very complex task entailing a high level of uncertainty, as is shown by the great variability of cost estimates.
Box IV.1 Adaptation glossary
Adaptation. Adaptation involves reducing risk and vulnerability by seeking opportunities and building capacity to cope with climate impacts on nations, regions, cities, the private sector, communities, individuals and natural systems. It also involves implementing decisions and actions to mobilize that capacity.
Adaptation deficit. This is the gap between the current state of a system and the state that would minimize the adverse effects of current climatic conditions and their variability. Essentially, it is inadequate adaptation to current climatic conditions. It has been suggested that it often forms part of a large development deficit.
Adaptation needs. These are circumstances that make it necessary to gather information, obtain resources and carry out actions aimed at ensuring the security of the population and of assets or resources in response to climate impact.
Adaptation options. These are the set of appropriate measures and strategies available to meet needs.
Adaptive capacity. This is the capacity of a system to adjust to climate change (in particular climate variability and extreme events), mitigate potential damage, capitalize on opportunities and cope with consequences.
Autonomous adaptation. Autonomous adaptation or spontaneous adaptation is the adjustment that takes place in ecosystems and human systems without external intervention and in response to a changing environment. In human systems, this is often referred to as “coping capacity”. The ability to adapt autonomously is part of resilience, although not exactly the same (Walker and others, 2004). All systems, whether social or ecological, have some capacity for autonomous adaptation. Ecosystems that have persisted for a long time can be inferred to have a great capacity to adapt autonomously, at least to past variability. Environmental change that is faster than in the past or accompanied by other stressors may exceed the adaptive capacity that the system has demonstrated. The autonomous adaptation mechanisms of organisms and ecosystems consist of changes in physiology, behaviour, phenology, the genetic composition of populations and the composition of the community. Phenological changes occur within the range allowed by genes and the variety of genes in the population. Changes in community composition occur through migration or local extinction.

The climate emergency in Latin America and the Caribbean... 153
Incremental adaptation. Incremental or gradual adaptation consists of actions whose main purpose is to maintain the essence and integrity of what already exists: technology, institutions, governance, values or systems. An example of this type of adaptation is the adjustment of cropping systems by introducing new varieties, changing sowing dates or increasing irrigation efficiency.
Planned adaptation. Planned or assisted adaptation is a deliberate intervention aimed at increasing the ability of the organism, ecosystem or socioecological system to survive and function at an acceptable level in the face of climate change. Planned adaptation of natural systems involves measures such as ensuring an appropriate habitat and dispersal pathways, reducing non-climatic stressors and physically moving organisms and establishing them in new areas. In ecosystem-based adaptation, the use of biodiversity and ecosystem services is integrated into climate change adaptation strategies.
Resilience. This is the capacity of a social or ecological system to absorb shocks while maintaining its basic structure and modes of functioning, capacity for self-organization and capacity to adapt to stress and change.
Transformative adaptation. Transformative adaptation seeks to change the fundamental attributes of the system in response to current or expected climate change, often on a larger and more ambitious scale than incremental adaptation. It involves, for example, changes in activities such as agriculture, cattle ranching and migration, and in perceptions and paradigms relating to the nature of climate change, adaptation and its relationship to other human and natural systems.
Vulnerability. This is the predisposition of a system to be adversely affected. Until the Fourth Assessment Report of the Intergovernmental Panel on Climate Change (IPCC), known as AR4, vulnerability was considered to comprise three elements: exposure, sensitivity and adaptive capacity. However, in the Special Report on Managing the Risks of Extreme Events and Disasters to Advance Climate Change Adaptation (IPCC, 2012) and the IPCC Fifth Assessment Report (AR5), vulnerability refers only to sensitivity and adaptive capacity, while exposure is incorporated into the concept of risk. At the macro level, vulnerability has biophysical and socioeconomic determinants.
Source: G. Magrin, “Adaptación al cambio climático en América Latina y el Caribe”, Project Documents (LC/W.692), Santiago, Economic Commission for Latin America and the Caribbean (ECLAC), 2015; B. Walker and others, “Resilience, adaptability and transformability in social-ecological systems”, Ecology and Society, vol. 9, No. 2, Resilience Alliance, 2014; Intergovernmental Panel on Climate Change (IPCC), Managing the Risks of Extreme Events and Disasters to Advance Climate Change Adaptation, Cambridge, Cambridge University Press, 2012.
Climate change adaptation plays a different role in Latin America and the Caribbean than in other regions, for several reasons. The first is that adaptation offers an additional opportunity to improve quality of life in rural areas, with effects as massive as those that could be achieved by mitigation based on better urban development. Adaptation in Latin America and the Caribbean, unlike other regions of the world, is largely inseparable from mitigation and also benefits without exception from the restoration of ecosystems, the restoration of soils, the recovery of general, coastal and riparian plant cover, and the positive impact on biodiversity. At the same
Box IV.1 (concluded)

154 Economic Commission for Latin America and the Caribbean (ECLAC)
time, solutions based on better management of nature have numerous co-benefits in terms of human security and the resilience and sustainability of development. In addition, the length of the region from north to south places it among the areas of greatest biological productivity on the planet, which can be conducive to ecosystem restoration. Proper management of the natural heritage, ecosystems, biodiversity and watersheds will increase the resilience of communities, businesses and nations in the region.
Sustainable management of nature is a way of adapting to climate change and mitigating its effects. In addition, this way of building adaptation helps to reduce greenhouse gas emissions in a region where land use change remains a major source of emissions, as discussed in chapter II. The continued destruction of ecosystems calls into question the overall rationality of the region’s current production systems and decision-making mechanisms. These are fragmented and are subject to short-term, partial or limited rationalities which together add up to an irrationality that seems greater than the human capacity to reorganize the economic and social system.
Chapter III showed that when cities grow with a high degree of informality and segregation, adaptive capacity is reduced and vulnerability increases because the planning and execution of public works is compartmentalized by sector. The upside is that adaptation creates a twofold opportunity. First, the public works required, including ecosystem restoration, provide an economic boost. This suggests that the approach taken to adaptation costs needs to be improved, with the net cost for development being measured rather than the gross cost of actions, which is what the climate literature usually considers. Second, adaptation provides an opportunity to close gaps in infrastructure coverage and quality, which is one of the aims of the Sustainable Development Goals (SDGs).
Despite the importance of adaptation for Latin America and the Caribbean, its incorporation into investment planning, programming and execution has been considerably delayed because of the time being taken to identify specific measurement criteria, targets, costs and financing.
B. The inevitability of adaptation
The need to adapt to climate change is a consequence that the developed countries of Europe and Oceania, the United States, the countries of the former socialist bloc and some developing countries such as China and India have inadvertently imposed on the other developing countries because of the accumulation of emissions in the atmosphere.2 The measure that would
2 This was only inadvertent until the negotiation of the United Nations Framework Convention on Climate Change (UNFCCC), as formal recognition of global warming made its relationship to adaptation evident.

The climate emergency in Latin America and the Caribbean... 155
most benefit the region, then, would be an ambitious mitigation process in developed countries and large developing-country emitters.
As discussed in chapter II, it is very likely that, given current pathways and the inadequacy of national targets (UNEP, 2018), the concentration of greenhouse gases in the atmosphere will reach 450 ppm, leading with an 80% probability to an average global temperature increase of 2 °C relative to the pre-industrial era (see table IV.1). Going by the representative concentration pathways, it is possible that higher temperatures will be reached towards the end of this century compared to the same reference point (Nakićenović and Swart, 2000). In Latin America and the Caribbean, it is imperative to adapt to the new climate conditions in order to reduce the expected negative impact as much as possible.
Table IV.1 Likelihood of global temperature increases being exceeded at equilibriuma
(Percentages)
CO2 eq. concentration
stabilization level (ppm)
2 °C 3 °C 4 °C 5 °C 6 °C 7 °C
450 78 18 3 1 0 0500 96 44 11 3 1 0550 99 69 24 7 2 1650 100 94 58 24 9 4750 100 99 82 47 22 9
Source: N. Stern, “The economics of climate change”, American Economic Review, vol. 98, No. 2, Pittsburgh, American Economic Association (AEA), 2008.
a Temperature increases are relative to the pre-industrial era.
If greenhouse gases continue to be emitted at the current rate, not only will the temperature continue to climb, but data from the different geological eras indicate that sea level rise, currently about 3 millimetres per year (Mengel and others, 2018), as seen in chapter II, could accelerate if temperatures incompatible with polar ice formation are reached (see figure IV.1). If the concentration of greenhouse gases continues to increase, the twenty-first century could see a return to the temperatures and concentrations of the Eocene, a period when the concentration of emissions was comparable and the formation of polar ice in the northern hemisphere was intermittent or non-existent. In a pessimistic scenario, it is estimated that concentrations and temperature in the twenty-third century could be incompatible with the formation of permanent ice in both hemispheres. That means that a process of emissions capture that occurred on Earth over 10 to 20 million years would be reversed in five centuries (Burke and others, 2018).

156 Economic Commission for Latin America and the Caribbean (ECLAC)
Figure IV.1 Anomalies in the Earth’s average temperature during the past 65 million years
and potential geohistorical analogues for future climates up to 2300 CE relative to the period 1961–1990
(Degrees centigrade)
Zachos et al. (2008) EPICA Dome CNGRIP
Lisiecki & Ramo (2004)Marcott et al. (2013) HadCRUT4
Cha
nge
in te
mpe
ratu
re
Southern Hemisphere Ice Sheets
Northern Hemisphere Ice Sheets
Millions of years before present60
-5
0
40 20 5 3 1 300 100 20 10 1950 2150Thousands of years before present Year of common
era (CE)
EarlyEocene
Pre-industrial
Historical
Mid-PlioceneLast interglacial
period Mid-Holocene
Pala
eoce
ne
Olig
ocen
e
Plio
cene
Plei
stoc
ene
Hol
ocen
e
Eoce
ne
Mio
cene
5
10
15
2100
2200
2005
Source: K. Burke and others, “Pliocene and Eocene provide best analogs for near-future climates”, Proceedings of the National Academy of Sciences of the United States of America (PNAS), vol. 115, No. 52, Washington, D.C., National Academy of Sciences (NAS), 2018.
On the way to these scenarios, average sea level rise changes. During the Eocene, there were no ice sheets at the poles and the sea level was 75 metres higher than at present; during the Pliocene, the extent of ice was limited and the average sea level was 25 metres higher than now (Hansen and others, 2008). Although the adaptation required today is on a different scale and sea level rise is progressive, this process threatens coastal cities and much of the Caribbean’s territory. If efforts to curb emissions fail, the consequences for the behaviour of the global climate will be those of the most extreme IPCC scenarios. Or they may be unpredictable, owing to the multiplicity of interactions between the planet’s different systems.
While adaptation is inescapable, the work of governments will also be determined by problems similar to those associated with poverty and income inequality. The ethical value judgements made in decision-making spheres about the lives and assets of vulnerable and at-risk individuals and social groups will determine the effort made to achieve adaptation, which will usually be territorially specific.

The climate emergency in Latin America and the Caribbean... 157
C. The benefits and estimated costs of adaptation
1. The costs of adaptation
Latin America and the Caribbean is a region that is highly vulnerable to extreme weather events, as was seen in chapter III. According to the Centre for Research on the Epidemiology of Disasters (CRED),3 84,000 people died because of them between 1990 and 2017, and over 163 million were directly affected (ECLAC, 2019a).
Identifying and measuring the economic cost of adaptation measures is a complicated process, not least because it is difficult to identify a specific adaptation baseline distinct from existing development gaps (Agrawala and Fankhauser, 2008; World Bank, 2010). The Economic Commission for Latin America and the Caribbean (ECLAC) underscores the importance of progress in implementing climate change adaptation measures as part of development strategy: such measures should respond to the nature of climate change and the collateral risks it creates, such as growing demand for energy, food and raw materials and continuous pressures on the environment. Furthermore, conditions of vulnerability and poverty should be considered when implementing the measures, as should projected climate trends for the twenty-first century (ECLAC, 2018b). The costs of efficient adaptation processes for the region are lower than those associated with inaction in the face of the impact of climate change. Investing in adaptation is an economically efficient option that is consistent with the guidelines of the 2030 Agenda for Sustainable Development.
There are preliminary estimates of the costs of adapting to climate change in the region, although they are highly uncertain. In 2010, the World Bank estimated these annual costs at between US$ 16.8 billion and US$ 21.5 billion between 2010 and 2050.4 The estimate includes agriculture, water resources, infrastructure, coastal zones, health, extreme weather events and fisheries. This expenditure is equivalent to less than 0.3% of regional GDP and would mainly go on protecting coastal zones (World Bank, 2010; Galindo and others, 2014c). Agrawala and others (2010) put adaptation costs at around 0.24% of regional GDP. This estimate included irrigation, water infrastructure, coastal protection, early warning systems, investment in climate-resilient settlements, cooling, treatment of diseases and investment in adaptation research and development.
3 See Centre for Research on the Epidemiology of Disasters (CRED), EM-DAT International Disaster Database [online] http://www.emdat.be/.
4 Undiscounted figures.

158 Economic Commission for Latin America and the Caribbean (ECLAC)
Going by these figures, the cost of adaptation would be less than 0.5% of the region’s GDP as of the end of the first decade of this century (World Bank, 2010; Vergara and others, 2013). However, these estimates have limitations, are subject to significant uncertainties, are difficult to compare and are likely to underestimate the costs of adaptation, as losses without a market value are ignored. They mainly include hard adaptation measures, namely infrastructure works (Agrawala and Fankhauser, 2008; Stern, 2007; ECLAC, 2014b) and underestimate nature-based options (see figure IV.2).
Figure IV.2 Latin America and the Caribbean: average annual cost of adaptation, 2010–2050
(Percentages of regional GDP)
0 0.1 0.2 0.3 0.4 0.5 0.6
Total
Infrastructure
Coastal zones
Fisheries
Agriculture
Extreme weather events
Health
Water supply
AD-WITCH CSIRO NCAR
Source: W. Vergara and others, The Climate and Development Challenge for Latin America and the Caribbean: Options for Climate-Resilient, Low-Carbon Development, Washington, D.C., Inter-American Development Bank (IDB), 2013; World Bank, Natural Hazards, UnNatural Disasters: The Economics of Effective Prevention, Washington, D.C., 2010; S. Agrawala and others, “Plan or react? Analysis of adaptation costs and benefits using integrated assessment models”, OECD Environment Working Papers, No. 23, Paris, Organization for Economic Cooperation and Development (OECD), 2010.
Note: The total adaptation costs come from World Bank (2010) and Agrawala and others (2010). The former reflect the scenarios of the National Centre for Atmospheric Research (NCAR) and the Commonwealth Scientific and Industrial Research Organization (CSIRO) and run up to 2050. Those of the study by Agrawala and others (2010) are for 2105. AD-WITCH is the adaptation module of the WITCH global dynamic model, which integrates interactions between the economy, technological options and climate change.
The common ground between adaptation and sustainable development make the two processes synergetic (Osman-Elasha and others, 2009). However, to achieve these synergies, timely and efficient climate change adaptation processes would have to be incorporated into national development plans, with their mechanisms for monitoring and evaluating measures implemented by local and national governments. In addition, there should be common metrics to make adaptation processes and progress with them comparable at the regional level (ECLAC, 2017). In a context of rising global temperatures and their regional effects, implementing efficient and equitable climate

The climate emergency in Latin America and the Caribbean... 159
change adaptation processes should be a priority. This means inducing the necessary changes in the behaviour of economic and social agents through public policies, economic incentives or changes in individual characteristics that trigger or induce these adaptation processes (OECD, 2012; Artikov and others, 2006; Knowler and Bradshaw, 2007; Prokopy and others, 2008; Galindo and others, 2014a).
2. Potential economic benefits
Investment in adaptation, like any investment, has multiplier effects on the rest of the economy: it is essentially preventive and offers an opportunity not only to reduce the negative impact of climate change but also to narrow development gaps and boost economies. The report of the Global Commission on Adaptation (2019) led by Ban Ki-moon, which was published in September 2019, states that investment in adaptation has a very high total rate of return: the cost-benefit ratio ranges from 2:1 to 10:1 and in some cases is even higher (see figure IV.3).
Figure IV.3 Cost-benefit ratios of some illustrative investments in adaptation, 2020–2030
1:1 3:1 5:1 7:1 9:1 11:1 13:1 15:1 17:1
Strengthening early warning systems
Making new infraestructure resilient
Improving dryland agriculturecrop production
Protecting mangroves
Making water resourcesmanagement more resilient
Source: Economic Commission for Latin America and the Caribbean (ECLAC), on the basis of Global Commission on Adaptation, Adapt Now: A Global Call for Leadership on Climate Resilience, Amsterdam, 2019.
Note: Approximate global net benefits to be gained by 2030 from an illustrative investment of US$ 1.8 trillion in five areas. Actual returns depend on many factors, such as economic growth and demand, policy context, institutional capacities and the condition of assets. Also, these investments neither address all that may be needed within sectors (e.g. adaptation in the agricultural sector will consist of much more than dryland crop production) nor include all sectors (as health, education and industry sectors are not included). Data and methodological limitations mean that this graph does not imply full comparability of investments across sectors or countries.

160 Economic Commission for Latin America and the Caribbean (ECLAC)
As was seen in chapter I, the work of the Global Commission on Adaptation found that if US$ 1.8 trillion were invested globally in five areas between 2020 and 2030, US$ 7.1 trillion in total net benefits could be generated. The areas where investment in adaptation has the potential to offer a high return are early warning systems, climate-resilient infrastructure, improved production of dryland agricultural crops, global protection of mangroves and investments to increase the resilience of water resources. Investments in adaptation pay a threefold dividend. The first is the losses that are avoided, i.e. the reduction of future losses. The second is the economic benefits of reducing risk, namely increased productivity and innovation. The third is the social and environmental benefits. Without the need for adaptation, these additional investments would not be made or would be made only later.
Thus, investment in adaptation can have positive effects on development, as can investment in mitigation. Any investment aimed at restoring natural assets and ecosystem services will bring benefits on both fronts, namely adaptation and mitigation.
3. Adaptation in nationally determined contributions
In the countries of Latin America and the Caribbean, the fundamental role that adaptation processes play in the region’s economies and societies is recognized. Accordingly, the nationally determined contributions (NDCs) of these countries have included adaptation actions related to the particular vulnerabilities of each. Table IV.2 summarizes the sectors mentioned in each country’s NDCs in relation to adaptation.5
5 NDCs put more emphasis on mitigation in general. The ommitments made will need to be increasingly ambitious if they are to be effective and meet the objectives of the Paris Agreement (Diffenbaugh, Singh and Mankin, 2018).

The climate emergency in Latin America and the Caribbean... 161
Tabl
e IV
.2
Latin
Am
eric
a an
d th
e C
arib
bean
(33
coun
trie
s): s
ecto
ral d
istr
ibut
ion
of a
dapt
atio
n-ce
ntre
d m
easu
res
refe
rred
to in
nat
iona
lly
dete
rmin
ed c
ontr
ibut
ions
(ND
Cs)
, 201
9
Cou
ntry
/Sec
tor
Wat
erA
gric
ultu
reH
ealth
Bio
dive
rsity
Coa
stal
zone
s
Land
use
,ch
ange
of
land
use
and
silv
icul
ture
Ris
km
anag
emen
tFo
rest
sIn
frast
ruct
ure
Hum
anse
ttlem
ents
Ener
gyTo
uris
mTr
ansp
ort
Hou
sing
Indu
stry
Jam
aica
Mex
ico
Bah
amas
Col
ombi
aG
uate
mal
aB
eliz
ePa
ragu
ayC
osta
Ric
aC
hile
Hon
dura
sS
aint
Vin
cent
and
th
e G
rena
dine
s U
rugu
ayA
ntig
ua a
nd B
arbu
daD
omin
ican
Rep
.S
urin
ame
Sai
nt K
itts
and
Nev
isA
rgen
tina
Vene
zuel
a (B
ol. R
ep. o
f)N
icar
agua
Bra
zil
Cub
aEc
uado
rH
aiti
Bar
bado
sPe
ruS
aint
Luc
iaB
oliv
ia (P
lur.
Sta
te o
f)El
Sal
vado
rG
rena
daG
uyan
aD
omin
ica
Pana
ma
So
urce
: E
cono
mic
Com
mis
sion
for L
atin
Am
eric
a an
d th
e C
arib
bean
(EC
LAC
), on
the
basi
s of
the
natio
nally
det
erm
ined
con
trib
utio
ns (N
DC
s) o
f the
cou
ntrie
s of
Lat
in A
mer
ica
and
the
Car
ibb
ean.
No
te:
This
tab
le s
how
s th
e p
riorit
y se
ctor
s fo
r ad
apta
tion
men
tione
d in
the
ND
Cs
sub
mitt
ed b
y 33
cou
ntrie
s of
Lat
in A
mer
ica
and
the
Car
ibb
ean.
Som
e in
itiat
ives
cov
er
mor
e th
an o
ne s
ecto
r. Fo
r ex
amp
le, t
he a
gric
ultu
re s
ecto
r in
clud
es li
vest
ock
in t
he B
aham
as a
nd U
rugu
ay.

162 Economic Commission for Latin America and the Caribbean (ECLAC)
Diagram IV.1 highlights the key sectors and policies for adaptation. The great diversity of sectoral actions relates to both lifestyles and the role of ecosystems and natural resources.
Diagram IV.1 Latin America and the Caribbean (13 countries): adaptation measures included
in nationally determined contributions (NDCs), 2016–2018
Energía
Health• Increase the resilience of the
population to the health effects of climate change.
• Pay attention to problems deriving from heat waves.
• Establish health risk reduction strategies.
• Adapt health systems to changing patterns of epidemic vectors.
• Adapt to food security and diets.• Adapt to plagues and to respiratory
and transmitted diseases arising directly from climatic events.
• Contribute to consumption of potable water.
Agriculture• Identify crops resistant to extreme events.• Develop efficient irrigation technologies.• Design strategies to support small producers.• Promote food security and resilience.• Change agricultural and livestock practices.• Create soil conservation systems.
Forests and biodiversity• Quantify the risk of losing biodiversity.• Improve the adaptive capacity
of ecosystems.• Encourage carbon capture:
conservation and restoration.• Increase the resilience of ecosystems
and biodiversity.• Promote synergies with
mitigation measures.• Encourage synergy between
conservation, sustainable management of forests and enhancement of forest carbon stocks (REDD+).
• Adopt forestry stewardship practices.
Cities• Analyse infrastructure vulnerability.• Provide training in climate risk
management and prevention.• Set up natural disaster
warning systems.• Build infrastructure and services.• Pursue green sustainability initiatives:
buildings, water, urban drainage and permeable paving.
• Work to ensure urban sustainability and access to urban land.
• Use spatial planning instruments.• Demarcate urban areas of the
country where fatal weather conditions may arise.
• Incorporate adaptation criteria into public investment projects.
Energy• Analyse water availability
for electricity generation.• Build electricity infrastructure
that is resilient to extreme events.
• Design monitoring and evaluation systems.
• Generate and analyse weather information.
• Develop the security and potential of renewable energies.
Water• Carry out integrated watershed
management to ensure access to water.• Secure the supply of drinking
and irrigation water.• Design water collection systems.• Identify areas vulnerable to drought.• Enhance the availability of water
for hydroelectric plants.• Build infrastructure to deal with
river spates.• Promote the use of treated wastewater.• Incorporate adaptation into integrated
water management.
Argentina, Brazil, Chile, Colombia, Costa Rica, the
Dominican Republic, Ecuador, Honduras, Mexico, Nicaragua,
Panama, Peru and Uruguay have reported on measures to reduce vulnerability and
increase resilience to climate change.
Source: Economic Commission for Latin America and the Caribbean (ECLAC).
Measures in the energy sector include analysing the availability of water for electricity production, reducing contingencies in energy infrastructure and making this infrastructure resilient to extreme events. In the forest sector (which in some countries also includes the biodiversity, ecosystems and coastal zones subsectors), the measures identified are aimed at increasing

The climate emergency in Latin America and the Caribbean... 163
adaptive capacity and forest carbon stocks while generating additional forest co-benefits, fostering resilience to the effects of climate on ecosystems and biodiversity and promoting sustainable forest management practices.
In the case of agriculture, which is a key sector, policies aim to produce crops that are resistant to extreme events, employ efficient irrigation technologies, implement support strategies for small producers, change agricultural and livestock practices and implement soil conservation systems. In the case of cities, the main focus is on infrastructure vulnerability analysis, climate risk management and prevention, natural disaster warning systems, construction of infrastructure and services, green sustainability initiatives, urban sustainability, land management and public investment projects. As regards adaptation in the water sector, the most important areas are integrated watershed management, the supply of water for drinking and irrigation, water collection systems, the identification of areas vulnerable to drought, hydropower management and integrated water management. In the health sector, there are measures and policies to increase the resilience of the population, address problems arising from heat waves, reduce health risks, adapt health systems to changes in the vectors that transmit epidemics and contribute to the consumption of potable water and improvements in its quality. There are also measures that pursue additional health benefits in different sectors, such as agriculture, housing and transport.
Cross-cutting adaptation measures are also considered, such as generation of climate information (research and development), vulnerability analysis, the identification of climate risks, the planning, strengthening and expansion of early warning systems and monitoring networks, integrated land management, reduction of vulnerability, identification and promotion of good practices and adaptation tools, institutional strengthening and capacity-building, and education and communication.
D. The need for measuring criteria
Mitigation has considerably greater visibility than adaptation in international discussions, in the measurement of spending associated with climate change and financing, and in the national targets set in nationally determined contributions (NDCs). One reason for this is that, while there are clear measurement criteria for mitigation, a measuring methodology for adaptation that distinguishes it from normal development gaps has yet to be found.
An effort like this is possible in actions taken in response to sea level rise and reduced freshwater storage capacity in the glaciers of the region that feed cities and river basins. Work has been done in the region to measure how water availability has changed in river basins, how crop
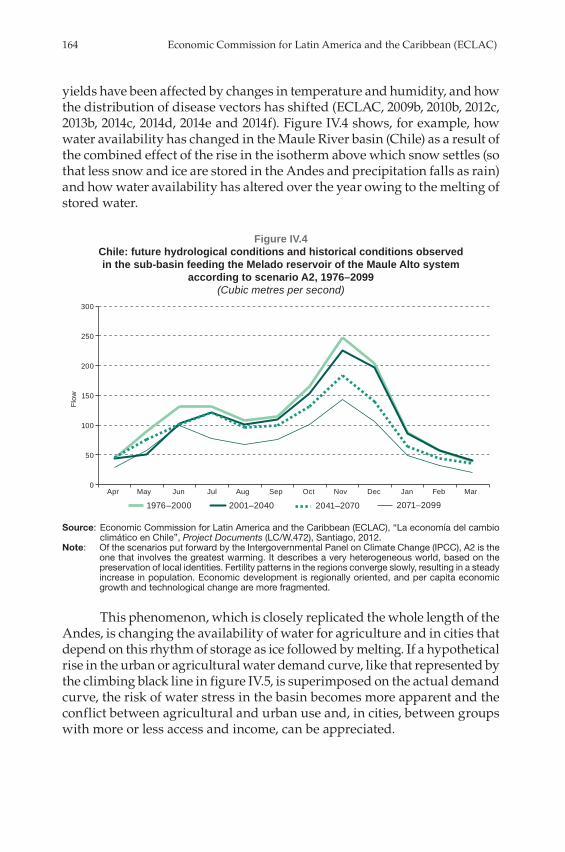
164 Economic Commission for Latin America and the Caribbean (ECLAC)
yields have been affected by changes in temperature and humidity, and how the distribution of disease vectors has shifted (ECLAC, 2009b, 2010b, 2012c, 2013b, 2014c, 2014d, 2014e and 2014f). Figure IV.4 shows, for example, how water availability has changed in the Maule River basin (Chile) as a result of the combined effect of the rise in the isotherm above which snow settles (so that less snow and ice are stored in the Andes and precipitation falls as rain) and how water availability has altered over the year owing to the melting of stored water.
Figure IV.4 Chile: future hydrological conditions and historical conditions observed in the sub-basin feeding the Melado reservoir of the Maule Alto system
according to scenario A2, 1976–2099(Cubic metres per second)
0
50
100
150
200
250
300
Apr May Jun Jul Aug Sep Oct Nov Dec Jan Feb Mar
Flow
1976–2000 2001–2040 2041–2070 2071–2099
Source: Economic Commission for Latin America and the Caribbean (ECLAC), “La economía del cambio climático en Chile”, Project Documents (LC/W.472), Santiago, 2012.
Note: Of the scenarios put forward by the Intergovernmental Panel on Climate Change (IPCC), A2 is the one that involves the greatest warming. It describes a very heterogeneous world, based on the preservation of local identities. Fertility patterns in the regions converge slowly, resulting in a steady increase in population. Economic development is regionally oriented, and per capita economic growth and technological change are more fragmented.
This phenomenon, which is closely replicated the whole length of the Andes, is changing the availability of water for agriculture and in cities that depend on this rhythm of storage as ice followed by melting. If a hypothetical rise in the urban or agricultural water demand curve, like that represented by the climbing black line in figure IV.5, is superimposed on the actual demand curve, the risk of water stress in the basin becomes more apparent and the conflict between agricultural and urban use and, in cities, between groups with more or less access and income, can be appreciated.

The climate emergency in Latin America and the Caribbean... 165
Figure IV.5 Chile: future hydrological conditions and historical conditions observed in the sub-basin feeding the Melado reservoir of the Maule Alto system
according to scenario A2, 1976–2099(Cubic metres per second)
0
50
100
150
200
250
300
Apr May Jun Jul Aug Sep Oct Nov Dec Jan Feb Mar
Flow
1976–2000 2001–2040 2041–2070 2071–2099
Source: Economic Commission for Latin America and the Caribbean (ECLAC), “La economía del cambio climático en Chile”, Project Documents (LC/W.472), Santiago, 2012.
Note: Of the scenarios put forward by the Intergovernmental Panel on Climate Change (IPCC), A2 is the one that involves the greatest warming. It describes a very heterogeneous world, based on the preservation of local identities. Fertility patterns in the regions converge slowly, resulting in a steady increase in population. Economic development is regionally oriented, and per capita economic growth and technological change are more fragmented.
In addition, ECLAC has made available to the region a database on sea level rise developed with the support of Spain’s Ministry of the Environment (now Ministry for the Ecological Transition) and the Institute of Environmental Hydraulics of the University of Cantabria (ECLAC, 2012c). This prospective study identifies long-term trends that need to be addressed with adaptation measures, such as the loss of working days in ports, shoreline erosion and destructive astronomical and meteorological tides because of rising sea levels. This information has been applied in adaptation studies in Cuba and Brazil. Analyses of the economic impact of climate change and the database on sea level rise and its effects on the region’s coasts illustrate the likely costs of climate inaction and the routes by which they might be propagated, providing a reviewable but firm basis for formulating adaptation policies.
Sectoral adaptation planning documents have been prepared in Chile, Colombia, Paraguay, Peru, Uruguay and other countries in the region, and adaptation actions have even been proposed in some of these countries’ NDCs.6
6 See Samaniego and Schneider (2019) for a breakdown of these measures and current adaptation plans.

166 Economic Commission for Latin America and the Caribbean (ECLAC)
However, there remains the challenge of designing an approach that can measure adaptation comparably at the regional level and that is sufficiently integrated to include national targets. The Organization for Economic Cooperation and Development (OECD) suggests that adaptation measurement and evaluation frameworks should combine qualitative, quantitative and binary indicators, as no single category is sufficient. The policy framework should also be supplemented by indicators that, for example, serve to measure the number of projects implemented in response to the policy or the number of households benefiting (OECD, 2012).
Measuring adaptation better would make it possible to prioritize actions, target resources and, not least, set goals that provide the sense of urgency and visibility which adaptation merits. Without a regionally harmonized criterion for measuring adaptation, mitigation will continue to be more visible and receive more attention, possibly to the detriment of adaptation. Some progress has been made in Latin America, notably the population risk index being developed in Colombia (see box IV.2).
Box IV.2 Colombia: the municipal disaster risk index
Colombia has developed an index of human vulnerability to disasters that is adjusted for local capabilities and based on census information. Since 2015, the National Planning Department (DNP) has been working on the construction of the Municipal Index of Capability-Adjusted Disaster Risk, a tool that serves to measure and compare municipalities according to the risk their populations are at from hydrometeorological events associated with heavy rainfall and their capacity to manage these (DNP, 2019). The Municipal Index is designed to be applied in episodes connected with heavy precipitation, such as landslides and flooding, and its design and implementation are useful for applying similar measurement criteria to other types of extreme events or at different territorial levels.
The Index seeks to orient public policies so that they are consistent with territorial peculiarities and take account of the heterogeneity of municipalities as regards the threats they are exposed to, their vulnerability and their institutional capacity to respond. This heterogeneity meant that the application of common, standardized strategies in all municipalities and departments was ineffective (DNP, 2019).
The Index is constructed from a component that measures risk and one that measures capabilities. The risk component includes damage or losses that may arise when, in a given territory and at a given time, hazardous physical phenomena (threats) coincide with populations at risk (exposure) that are prone to be affected by those phenomena (vulnerability). This component quantifies the proportion of the population in municipalities that is socially vulnerable and exposed to the most critical conditions of hydrometeorological threats.
The second component, the capabilities index, evaluates municipalities according to their financial, socioeconomic and institutional capabilities, which determine the actions of territorial entities in relation to disaster risk management. This index is constructed on the basis of three dimensions and six variables, as shown in the table.
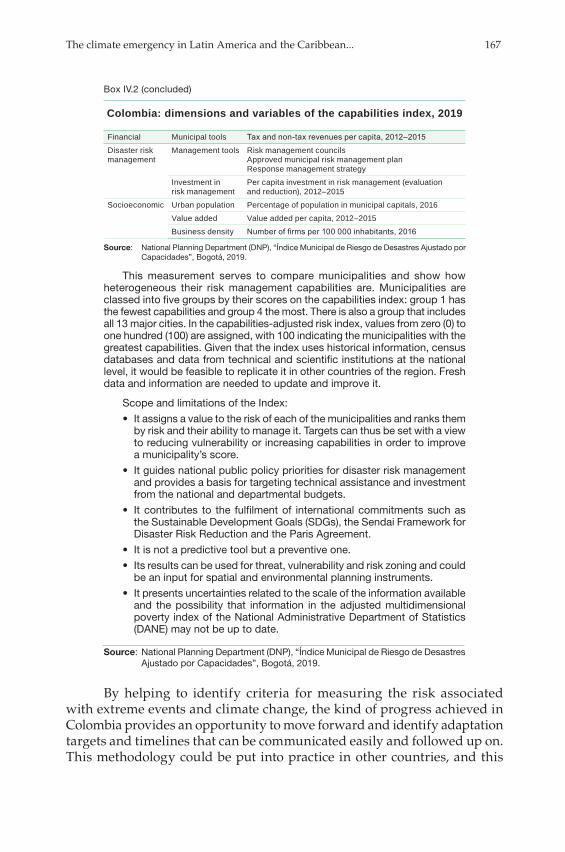
The climate emergency in Latin America and the Caribbean... 167
Colombia: dimensions and variables of the capabilities index, 2019
Financial Municipal tools Tax and non-tax revenues per capita, 2012–2015Disaster risk management
Management tools Risk management councilsApproved municipal risk management planResponse management strategy
Investment in risk management
Per capita investment in risk management (evaluation and reduction), 2012–2015
Socioeconomic Urban population Percentage of population in municipal capitals, 2016Value added Value added per capita, 2012–2015Business density Number of firms per 100 000 inhabitants, 2016
Source: National Planning Department (DNP), “Índice Municipal de Riesgo de Desastres Ajustado por Capacidades”, Bogotá, 2019.
This measurement serves to compare municipalities and show how heterogeneous their risk management capabilities are. Municipalities are classed into five groups by their scores on the capabilities index: group 1 has the fewest capabilities and group 4 the most. There is also a group that includes all 13 major cities. In the capabilities-adjusted risk index, values from zero (0) to one hundred (100) are assigned, with 100 indicating the municipalities with the greatest capabilities. Given that the index uses historical information, census databases and data from technical and scientific institutions at the national level, it would be feasible to replicate it in other countries of the region. Fresh data and information are needed to update and improve it.
Scope and limitations of the Index:
• It assigns a value to the risk of each of the municipalities and ranks them by risk and their ability to manage it. Targets can thus be set with a view to reducing vulnerability or increasing capabilities in order to improve a municipality’s score.
• It guides national public policy priorities for disaster risk management and provides a basis for targeting technical assistance and investment from the national and departmental budgets.
• It contributes to the fulfilment of international commitments such as the Sustainable Development Goals (SDGs), the Sendai Framework for Disaster Risk Reduction and the Paris Agreement.
• It is not a predictive tool but a preventive one.
• Its results can be used for threat, vulnerability and risk zoning and could be an input for spatial and environmental planning instruments.
• It presents uncertainties related to the scale of the information available and the possibility that information in the adjusted multidimensional poverty index of the National Administrative Department of Statistics (DANE) may not be up to date.
Source: National Planning Department (DNP), “Índice Municipal de Riesgo de Desastres Ajustado por Capacidades”, Bogotá, 2019.
By helping to identify criteria for measuring the risk associated with extreme events and climate change, the kind of progress achieved in Colombia provides an opportunity to move forward and identify adaptation targets and timelines that can be communicated easily and followed up on. This methodology could be put into practice in other countries, and this
Box IV.2 (concluded)

168 Economic Commission for Latin America and the Caribbean (ECLAC)
would strengthen adaptation policies in the region, allow efforts to be better targeted and facilitate comparisons of countries’ progress. The index could be expanded to cover critical infrastructure as well.
E. Cross-cutting issues
1. Adaptation measures
In a broad sense, adaptation includes any deliberate adjustment made in response to new climate conditions, whether actual or expected (Agrawala and Fankhauser, 2008; IPCC, 2007b). In addition to reducing the negative impact of climate change, albeit without completely eliminating it, it can have positive economic, social or environmental side effects (World Bank, 2010; OECD, 2012; Galindo and others, 2014a; Hepburn and Stern, 2008; Garnaut and others, 2010).
There are various adaptation options, ranging from new infrastructure to institutional, regulatory or behavioural changes (see diagram IV.2).
Diagram IV.2 Adaptation needs and options for meeting them
Physical and environmental
needsInstitutional
needsInformation, training and resources
Access technology
Private sector Social needs
Reduce poverty and inequality
Maintain ecosystem services
Improve the evaluation and understanding of ecosystem
services
Monitor systems to avoid going over critical thresholds
Strengthen human and
technological capabilities
Pursue inter- and intrainstitutional
coordination
Encourage flexibility
Create robust institutions
Involve the private sector in adaptation
Generate and transfer information
Access financing
Ensure the availability of
natural, physical, human, political and
financial assets
Promote stable livelihoods and
subsistence strategies
Provide access to education
and information
Source: G. Magrin, “Adaptación al cambio climático en América Latina y el Caribe”, Project Documents (LC/W.692), Santiago, Economic Commission for Latin America and the Caribbean (ECLAC), 2015.

The climate emergency in Latin America and the Caribbean... 169
The following are some options for addressing adaptation needs:
• Structural and physical options – Environmental engineering and construction. Engineering
works are usually expensive, long-term alternatives requiring acceptance of the uncertainty associated with the projection of climate impact.
– Ecosystem-based adaptation. These options, based on nature’s capacity to absorb or limit the impact of climate change, can be effective and efficient and depend less on climate projections and their uncertainties.
– Technology. There are numerous technology-based adaptation alternatives in the agricultural sector, such as more efficient methods of irrigation and fertilization, water storage and harvesting, genetic enhancement to build tolerance to stress factors, adjustment of the planting schedule based on estimated yields, risk mapping, monitoring technologies and second-generation biofuels. Digital technologies (mobile phones, the Internet) have created opportunities to disseminate information (forecasts, alerts, markets, advice) and to capture relevant and up-to-date information for analysis and decision-making (the advance of floods, disease outbreaks, disaster response). Adaptation technologies are known in all countries and can generally be applied anywhere on the planet because they are easily transferred.
– Services. Various options have been cited for measures to reduce climate vulnerability, including social safety nets to meet the basic needs of the most vulnerable people in the event of climate disasters (floods, droughts), public health services, prevention campaigns, adequate access to services (maintenance of drains, diversification of water sources), access to agricultural markets, food banks and distribution of food surpluses.
• Social options – Education. Lack of education is a limiting factor that contributes
to vulnerability. Education programmes, extramural activities, outreach and community meetings are key tools for disseminating knowledge on adaptation options and building social capital that promotes social resilience. Education should be seen as a public good that is conducive to dialogue and networking and increases resilience at the individual and socioecological system levels.
– Information. Information strategies aimed at raising awareness of climate risks and encouraging citizens to respond are an integral part of adaptation. Examples include early warning

170 Economic Commission for Latin America and the Caribbean (ECLAC)
systems, risk and vulnerability mapping, systematic monitoring and remote sensing, climate services, particularly improved forecasting, and local-scale climate scenarios.
– Behaviour. Behavioural adaptation measures are essential and include livelihood diversification, changes in agricultural and animal husbandry practices, crop substitution, soil and water conservation and labour migration. Government incentives can be a good way to encourage changes in human behaviour.
• Institutional options – Economic. Among the measures that can be taken in this area are
financial incentives (including taxes and subsidies), insurance (particularly insurance based on climate indices), catastrophe bonds, revolving funds, payments for environmental services, water tariffs, disaster contingency funds and money transfers.
– Laws and regulations. Laws, regulations and planning measures, such as the creation of protected areas and land use rezoning, are institutional measures that can improve the safety and resilience of communities through land use allocation. Other examples are legal rights and access to resources that can determine adaptive capacity. In several countries, security of land tenure is considered a priority for individuals to be able to make long-term decisions, such as changing agricultural practices. The following are some examples of laws and regulations related to the agricultural sector: zoning and spatial planning laws; leasing law; water resource regulations and agreements; laws to support disaster risk reduction; laws to incentivize the purchase of insurance; the establishment of property rights and land tenure; protected areas; and fishing quotas.
– Government policies and programmes. These include national and regional adaptation plans (including the mainstreaming of climate change), subnational and local adaptation plans, disaster planning and preparedness, and sectoral plans. These last concern integrated water resources management, landscape and watershed management, integrated coastal zone management, adaptive management, ecosystem-based management, sustainable forest management, fisheries management and community-based adaptation, among other things.7
Although there is growing recognition of the importance of social and institutional measures, most adaptation assessments have been limited to determining the impact of adaptation in reducing vulnerability or to analysing how it has been integrated into the planning process. The implementation or
7 See ECLAC (2015a) and IPCC (2014a and 2014b).

The climate emergency in Latin America and the Caribbean... 171
effects of adaptation measures in terms of catalysing development are rarely assessed (IPCC, 2014a and 2014b); moreover, adaptation based on ecosystem integrity is undervalued.
In taking adaptation measures, significant constraints and inefficiencies, as well as technical, economic and social barriers, must be confronted (UNFCCC, 2007a and 2007b; Agrawala and Fankhauser, 2008). There are adaptation processes that have significant residual effects or costs, some of them irreversible. This occurs, for example, when a permanent change in the average temperature is perceived as temporary or seasonal and adjustments are made to the exploitation of water resources or the expansion of the agricultural frontier in the belief that these are temporary, which can result in overexploitation of water resources (Easterling and others, 1993; Bosello, Carraro and De Cian, 2010; Fankhauser, 1995; Rosenzweig and Parry, 1994; Darwin and others, 1995; Galindo, 2009).
Accordingly, an appropriate adaptation strategy should include some basic measures (Galindo and others, 2014b) such as the following:
• Building a portfolio of flexible adaptation measures. This portfolio should include the precautionary principle to avoid irreversible damage, as well as co-beneficial options such as increased energy and water efficiency, health protection and reduction of air pollution in cities, improved food and energy security, introduction of irrigation and crop changes, prevention and early warning of extreme weather events, and preservation of biodiversity and forests (Galindo and others, 2014b).
• Early adaptation that includes prevention measures (Bosello, Carraro and De Cian, 2010; Galindo and others, 2014b).
• Regional integration to reduce local risk and the level of exposure to climate change, considering, for example, food and energy security issues in the regional context (Galindo and others, 2014b).8
There is now a large portfolio of adaptation measures (see table IV.3) that are relatively easy to implement and offer significant co-benefits. Some of them involve management improvements that are inexpensive and provide significant benefits. An example of a measure that provides co-benefits is the use of inputs, such as fertilizers or increased irrigation, which generate positive economic effects (Bosello, Carraro and De Cian, 2010). Another example is the moving of sowing dates in South America, which offers the prospect of an economic benefit estimated at around 38% relative to the baseline (Tan and Shibasaki, 2003).
8 For example, a decline in output of a staple crop in a region such as Central America may be anticipated, and then international trade can be adapted to deal with that decline through agreements with countries or regions that are not similarly affected.

172 Economic Commission for Latin America and the Caribbean (ECLAC)
Table IV.3 Adaptation measures in selected sectors
Adaptation measures in agriculture Sea level rise• Mixture of crops and livestock.• Efficient management of irrigation water.• Climate monitoring and prediction.• Development and use of new crops.• Multiple crop or mixed cropping systems.• Use of genetic diversity.• Development and use of varieties or species
that are resistant to pests and diseases and are better adapted to the climate and the requirements of hibernation or increased resistance to heat and drought.
• Change in farm production and practices: use of diversification strategies, such as intercropping, agroforestry, integration of animal husbandry programmes and adjustments to sowing and growing dates.
• Expansion of farmland, changes in agricultural spatial distribution and land use management.
• Exploitation of topographical characteristics.• Intensification of input use: fertilizers,
irrigation, seeds.• Adoption of new technologies.• Insurance schemes.• Diversification of agricultural incomes
and activities.
• Integrated planning and management of the coastal space.
• Integrated management of watersheds and coastal areas.
• Protection of coastal wetlands.• Flood-resistant construction codes
and buildings.• Coastal dikes, defences, barriers and seawalls.• Land use planning and delimitation of
risk areas.• Spatial planning.• Realignment and planned prohibition,
hard defences.• Sediment replenishment and management.• Replenishment of coastal dunes and beaches.• Building limits.• Barriers against saltwater.• More efficient water use.• Freshwater injection.• Upgrading of drainage systems and
improvements in urban drainage.• Polders.• Changes in land use and zoning.• Flood alert systems.• Community-based disaster risk reduction.• Balance between conservation of marine
fisheries, coral reefs and mangroves.• Improvements in livelihoods and survival
of traditional populations.• Management of non-climatic stress factors.
Health sector Water sector• Prophylactic measures and sanitation.• Introduction of public health training,
emergency response and prevention and monitoring programmes.
• Improvements to the adaptive capacity of the different social groups.
• Social security networks.• Building regulations.• Improvements in public health infrastructure.• Prevention of waterborne diseases.• Supply of drinking water.• Early warning systems to identify the presence
of infectious diseases.• Monitoring networks to alert the population
to heat waves.• Design of systems to prevent and deal
with natural disasters.• Improvements to public health.• Anti-vector programmes.• Disease eradication programmes.• Health education programmes.• Research.• Vector control research and development.• Vaccinations.• Disease eradication.• Implementation of local pollution control
measures and additional co-benefits.
• Water conservation and management of water demand (water permits, pricing and taxes).
• Watershed management.• Land use management.• Efficient water use and changes
in usage patterns.• Water recycling.• Irrigation efficiency.• Water management infrastructure.• Import of products for intensive water use.• Increased use of rainfed agriculture.• Improvements in institutions and governance
to ensure the effective application of these adaptation measures.
• Sources of improvement: - Water storage and conservation techniques. - Sustainable groundwater exploration and extraction.
- Reduction of losses (control of leakage, retention pipes).
- Elimination of species that invade water storage.
- Rainwater collection. - Water transfers. - Risk management to deal with the variability of precipitation.
- Water allocation (e.g. municipal use versus agricultural use).
- Desalinization.

The climate emergency in Latin America and the Caribbean... 173
Biodiversity and ecosystems Glacier retreat• Increase in the number of protected areas.• Improved representation and replication within
networks of protected areas.• Improved management and restoration
of existing protected areas to enhance recovery capacity.
• Design of new natural areas and restoration sites.
• Incorporation of the expected impact of climate change into management plans, programmes and activities.
• Administration and restoration of ecosystem functions.
• Incorporation of good practices in the fisheries sector.
• Spatial planning.• Emphasis on the conservation of endangered
species and resources.• Transfer of endangered species. • Establishment of populations of species
in captivity.• Reduction of pressures independent of climate
change on species.• Improvements to existing laws, regulations
and policies.• Protection of biological corridors, refugia
and stepping stones.• Improvements to monitoring programmes.• Design of dynamic landscape
conservation plans.• Meeting of wildlife and biodiversity needs.• Management of multiple forest use.
• Design of high-altitude reservoirs.• Use of drought-tolerant strains
in high-altitude agriculture.• Measures to manage demand.• Extension and design of water
collection systems.• Planning of glacial basins.• Generation of statistical data and information
on glacier dynamics.
Source: Economic Commission for Latin America and the Caribbean (ECLAC), “El gasto en protección ambiental en América Latina y el Caribe: bases conceptuales y experiencia regional”, Project Documents (LC/W.634), Santiago, 2014.
As noted, restoring the functions of ecosystems in order to maintain or restore the environmental services they provide is a particularly suitable adaptation measure in the region’s rural areas, as is making technological options for water management available to rural inhabitants, campesinos and indigenous peoples. This variant of adaptation has gained ground over the present decade and has two constituent elements: ecosystem-based adaptation (EbA) and payment for environmental services, which is the occasional complement to the former and makes it financially sustainable (Magrin, 2015).
Magrin (2015, p. 28) notes that EbA offers additional benefits for biodiversity, agriculture and coastal infrastructure, and further states that it “presents less risk of maladaptation than engineering works because it conserves ecosystems and their services, is more flexible and sensitive to unanticipated environmental changes, can help achieve sustainable development objectives, can contribute to mitigation, and produces environmental, social and economic co-benefits in the form of ecosystem goods and services [...] EbA is often complex to implement as it requires the cooperation of various actors and organizations (institutions, sectors and communities), and the benefits it
Table IV.3 (concluded)

174 Economic Commission for Latin America and the Caribbean (ECLAC)
provides are dispersed among a very wide range of beneficiaries. In addition, the standard protocols and comparable methodologies that normally exist for other types of options (such as technology and infrastructure) are usually lacking.” EbA is achieved in the following ways: “ecological restoration of ecosystems; community management of natural resources; conservation and establishment of protected areas; increase in biological diversity; afforestation and reforestation; prescribed burning and reduction of forest fires; ecological corridors; ex situ conservation of seeds and germplasm banks; adaptive spatial planning; establishment of diverse agricultural systems with the use of indigenous and local knowledge and the maintenance of genetic diversity; integrated water resource management (recognizing the role of watersheds, forests and associated vegetation in regulating water flows)” (Magrin, 2015, p. 28).
Ecological restoration of degraded ecosystems improves biodiversity provision by 44% and that of environmental services by 25%, increases the potential for carbon sequestration, promotes community organization, economic activities and livelihoods in rural areas, and at the same time helps in adapting to and mitigating climate change (Magrin and others, 2014; Magrin, 2015). This type of restoration reconciles economic development, adaptation and biodiversity conservation and reduces degradation rates where adaptive community management is in place.
2. Nature-based solutions and payment for ecosystem services: the convergence of adaptation and mitigation
Nature-based solutions (NBS) is the new term used since the 2019 United Nations Climate Action Summit to refer to the protection, restoration and sustainable management of ecosystems. NBS represent a promising alternative for addressing climate change, as they incorporate a comprehensive approach to simultaneously addressing mitigation and adaptation challenges while protecting biodiversity and human well-being (Seddon and others, 2019). Thus, NBS seek to reduce dilemmas and promote synergies between the Sustainable Development Goals (Seddon and others, 2020).
NBS are defined as solutions to challenges facing society that are inspired and supported by nature; that are cost-effective while providing environmental, social and economic benefits; and that help increase resilience. They relate to natural features and processes that are incorporated into cities, landscapes and marine areas through locally adapted, resource-efficient and systemic interventions, and provide benefits to both biodiversity and people (Raymond and others, 2017). They therefore encompass a wide range of actions, such as the protection and management of natural and semi-natural ecosystems, the incorporation of green areas and bodies of water in urban areas, and the application of ecosystem-based principles for agricultural systems (Seddon and others, 2020).

The climate emergency in Latin America and the Caribbean... 175
The sustainable use, management, conservation and restoration of ecosystems play a central role in climate change adaptation and mitigation policies by increasing resilience and reducing disaster risks, as well as maintaining and increasing carbon stocks and sinks and providing services that replace the use of fossil fuels. An example of an NBS that integrates mitigation and adaptation actions is the restoration of natural forests in upland areas, as these have the potential to protect established communities in lower-lying areas from flooding and landslides while serving as carbon sinks and protecting biodiversity. Planting trees and increasing green space in urban areas is another example, as these can have a cooling effect on cities while sequestering carbon, giving protection from air pollution and providing other recreational and health services to the population (Seddon and others, 2020).
Given that emissions from agriculture, livestock, land use change and forestry are large in Latin America and the Caribbean (approximately 1.8 Gt of CO2 equivalent), accounting for 42% of the total, NBS represent a significant mitigation opportunity. Their mitigation potential varies between countries: for example, it is estimated that in tropical countries with low emissions and extensive forest cover, NBS can mitigate about 50% of national emissions through measures to avoid deforestation. It is calculated, albeit with a degree of uncertainty, that NBS have the potential to achieve 30% of the global emissions reduction needed to maintain an emissions pathway that limits the temperature increase to 2 °C by 2030 (Seddon and others, 2020). It has been estimated that the implementation of measures including zero deforestation, large-scale restoration and reforestation, nutrient management in agricultural lands and reduction of methane from livestock in the region can contribute to the capture of 1.1 Gt of CO2 equivalent per year by 2050 (Vergara, Fenhann and Schletz, 2015).
NBS are also an important tool for increasing the region’s adaptive capacity, as well as for reducing exposure and sensitivity to the impacts of climate change. For example, the protection, restoration or management of natural forests and wetlands in watersheds can secure and regulate the water supply and reduce the risk of floods and landslides, as well as soil erosion. The restoration of mangroves makes it possible to maintain a protective barrier for coastal communities against flooding, reducing storm damage and coastal erosion (see the case of Cuba in ECLAC, 2018f). In this way, large investments in infrastructure are avoided to some extent, while NBS offer the advantage of being flexible and easily adaptable to long-term changes such as sea level rise, while also entailing much lower conservation costs.
Because of their potential, NBS were one of the 12 topics discussed at the 2019 Climate Action Summit convened by the Secretary-General of the United Nations. A number of initiatives to promote climate action were presented at the Summit, including some NBS relating to the region (see table IV.4).

176 Economic Commission for Latin America and the Caribbean (ECLAC)
Tabl
e IV
.4
Com
pend
ium
of i
nitia
tives
cla
ssifi
ed a
s na
ture
-bas
ed s
olut
ions
(NB
S) p
rese
nted
at t
he 2
019
Clim
ate
Act
ion
Sum
mit
Initi
ativ
eC
ount
ryO
bjec
tive
Glo
bal C
ampa
ign
for N
atur
eLe
d by
Cos
ta R
ica
toge
ther
with
par
tner
cou
ntrie
s th
at in
clud
e th
e B
aham
as, C
ongo
, Gab
on,
Gua
tem
ala,
Guy
ana,
Lib
eria
and
Sur
inam
e,
as w
ell a
s di
ffere
nt o
rgan
izat
ions
and
foun
datio
ns.
This
cam
paig
n is
pro
vidi
ng p
ublic
sup
port
to th
e gr
owin
g m
ovem
ent f
or n
atur
e an
d th
e gl
obal
N
ew D
eal f
or P
eopl
e an
d N
atur
e
The
cam
paig
n’s
goal
is to
hel
p co
nser
ve 3
0% o
f the
Ear
th’s
land
s an
d oc
eans
by
2030
(30x
30 ta
rget
) and
con
tribu
te to
the
Paris
Agr
eem
ent
goal
s th
roug
h na
ture
-bas
ed s
olut
ions
, inv
olvi
ng c
reat
ing
and
expa
ndin
g pr
otec
ted
area
s, re
stor
ing
degr
aded
eco
syst
ems
and
esta
blis
hing
mor
e am
bitio
us in
tern
atio
nal c
onse
rvat
ion
targ
ets
in th
e po
st-2
020
glob
al
biod
iver
sity
fram
ewor
k.
Am
azon
Sac
red
Hea
dwat
ers
Pach
amam
a A
llian
ce, C
onfe
dera
tion
of In
dige
nous
N
atio
nalit
ies
of th
e Ec
uado
rian
Am
azon
(C
ON
FEN
IAE)
and
Inte
r-Et
hnic
Ass
ocia
tion
for t
he D
evel
opm
ent o
f the
Per
uvia
n R
ain
Fore
st (A
IDES
EP)
It se
eks
to b
uild
a s
hare
d vi
sion
am
ong
indi
geno
us p
eopl
es,
non-
gove
rnm
enta
l org
aniz
atio
ns (N
GO
s), t
he p
hila
nthr
opic
com
mun
ity,
soci
al e
ntre
pren
eurs
and
gov
ernm
ents
with
a v
iew
to e
stab
lishi
ng a
bi
natio
nal p
rote
cted
regi
on th
at is
off-
limits
to in
dust
rial s
cale
reso
urce
ex
tract
ion
and
gove
rned
in a
ccor
danc
e w
ith tr
aditi
onal
indi
geno
us
prin
cipl
es o
f coo
pera
tion
and
harm
ony
that
fost
er a
mut
ually
enh
anci
ng
hum
an-E
arth
rela
tions
hip.
Th
e M
inis
teria
l Kat
owic
e D
ecla
ratio
n on
“For
est f
or
the
Clim
ate”
Alb
ania
, And
orra
, Ant
igua
and
Bar
buda
, A
rgen
tina,
Aus
tralia
, Aus
tria,
Bah
rain
Bel
arus
, B
elgi
um, B
oliv
ia (P
lurin
atio
nal S
tate
of),
Bul
garia
, C
ambo
dia,
Can
ada,
Cen
tral A
frica
n R
epub
lic,
Chi
le, C
hina
, Côt
e d’
Ivoi
re, C
roat
ia, C
ypru
s,
Cze
chia
, Dem
ocra
tic P
eopl
e’s
Rep
ublic
of
Kore
a, D
enm
ark,
Est
onia
, Eth
iopi
a, F
iji, F
inla
nd,
Fran
ce, G
eorg
ia, G
erm
any,
Gre
ece,
Hun
gary
, Ic
elan
d, In
done
sia,
Irel
and,
Ital
y, J
apan
, Jor
dan,
Ku
wai
t, La
o Pe
ople
’s D
emoc
ratic
Rep
ublic
, La
tvia
, Lie
chte
nste
in, L
ithua
nia,
Lux
embo
urg,
M
alta
, Mex
ico,
Mon
aco,
Mor
occo
, Mya
nmar
, N
ethe
rland
s, N
ew Z
eala
nd, N
orth
Mac
edon
ia,
Nor
way
, Pal
au, P
arag
uay,
Phi
lippi
nes,
Pol
and,
Po
rtuga
l, R
epub
lic o
f Kor
ea, R
epub
lic o
f Mol
dova
, R
oman
ia, R
ussi
an F
eder
atio
n, S
aint
Luc
ia,
San
Mar
ino,
Sau
di A
rabi
a, S
erbi
a, S
eych
elle
s,
Sie
rra
Leon
e, S
inga
pore
, Slo
vaki
a, S
love
nia,
S
outh
Sud
an, S
pain
, Sri
Lank
a, S
tate
of P
ales
tine,
S
udan
, Sw
eden
, Sw
itzer
land
, Tha
iland
, Ukr
aine
, U
nite
d K
ingd
om, V
iet N
am
A gl
obal
initi
ativ
e to
enh
ance
the
role
of f
ores
ts in
reac
hing
the
Paris
Agr
eem
ent g
oal,
with
81
Parti
es to
the
Uni
ted
Nat
ions
Fra
mew
ork
Con
vent
ion
on C
limat
e C
hang
e (U
NFC
CC
) end
orsi
ng th
e
decl
arat
ion
so fa
r.

The climate emergency in Latin America and the Caribbean... 177
Initi
ativ
eC
ount
ryO
bjec
tive
Bui
ldin
g R
esili
ence
in th
e C
entra
l A
mer
ican
Reg
ion
unde
r a
Syn
ergi
stic
App
roac
h be
twee
n M
itiga
tion
and
Adap
tatio
n - F
ocus
ing
on A
gric
ultu
re, F
ores
try a
nd O
ther
La
nd U
ses
(AFO
LU) S
ecto
r
Led
by B
eliz
e, C
osta
Ric
a, th
e D
omin
ican
R
epub
lic, E
l Sal
vado
r, G
uate
mal
a, H
ondu
ras,
N
icar
agua
and
Pan
ama
The
coun
tries
of t
he C
entra
l Am
eric
an In
tegr
atio
n S
yste
m (S
ICA)
co
mm
it to
: (i)
cons
erva
tion
of fo
rest
s an
d fo
rest
eco
syst
ems;
(ii
) tra
nsfo
rmat
ion
of a
gric
ultu
ral p
rodu
ctio
n sy
stem
s; (i
ii) in
tegr
atio
n an
d pr
omot
ion
of s
usta
inab
le p
ract
ices
in s
ugar
cane
, pin
eapp
le,
oil p
alm
, coc
oa a
nd c
offee
; (iv
) con
serv
atio
n of
the
mai
n fo
rest
are
as;
(v) d
evel
opm
ent o
f exp
ande
d m
easu
rem
ent,
repo
rting
and
ver
ifica
tion
(MR
V) s
yste
ms.
PRO
Am
azon
ia –
Util
izin
g Fo
rest
C
onse
rvat
ion
and
Sus
tain
able
Pr
oduc
tion
Prac
tices
to A
ddre
ss
Clim
ate
Cha
nge
and
Stre
ngth
en
Loca
l Liv
elih
oods
in E
cuad
or
Ecua
dor
PRO
Am
azon
ia is
an
ambi
tious
five
-yea
r col
labo
rativ
e in
itiat
ive
to s
hift
the
agric
ultu
re a
nd fo
rest
ry s
ecto
rs in
the
Am
azon
regi
on to
mor
e su
stai
nabl
e m
anag
emen
t and
pro
duct
ion
prac
tices
.
Rid
ge to
Ree
f – G
rena
da P
roje
ctC
arib
bean
sm
all i
slan
d de
velo
ping
Sta
tes
(SID
S)C
onse
rvin
g B
iodi
vers
ity a
nd E
nhan
cing
Eco
syst
ems:
the
Cas
e fo
r Pro
tect
ed A
reas
for C
limat
e C
hang
e R
esili
ence
in C
arib
bean
S
mal
l Isl
and
Dev
elop
ing
Sta
tes.
Larg
e S
cale
For
est C
onse
rvat
ion
with
Indi
geno
us P
eopl
es in
the
Thre
aten
ed B
razi
lian
Am
azon
Inte
rnat
iona
l Con
serv
atio
n Fu
nd o
f Can
ada
(ICFC
), En
viro
nmen
tal D
efen
se F
und
(ED
F)
and
Clim
ate
Land
Am
bitio
n an
d R
ight
s Ad
min
istra
tion
(CLA
RA)
Inte
rnat
iona
l con
serv
atio
n N
GO
s ha
ve c
omm
itted
long
-term
with
th
e K
ayap
o pe
ople
to h
elp
them
bui
ld c
apac
ity to
pro
tect
thei
r lan
ds,
cons
titut
iona
l rig
hts
and
the
prim
ary
fore
st e
cosy
stem
s on
whi
ch th
eir
cultu
re a
nd li
velih
oods
are
bas
ed.
Prot
ectin
g H
alf t
he E
arth
th
roug
h a
Glo
bal D
eal f
or N
atur
e S
erve
s as
Key
to N
atur
e-B
ased
C
limat
e S
olut
ions
Nat
ure
Nee
ds H
alf,
RES
OLV
E, W
ILD
Fou
ndat
ion
The
Glo
bal D
eal f
or N
atur
e, la
unch
ed in
Apr
il 20
19, i
s a
time-
boun
d,
scie
nce-
driv
en p
lan
to s
ave
the
dive
rsity
and
abu
ndan
ce o
f life
, avo
id
cata
stro
phic
clim
ate
chan
ge a
nd s
ecur
e es
sent
ial e
cosy
stem
ser
vice
s.
It se
eks
to m
aint
ain
85%
fore
st c
over
in c
ritic
al a
reas
, e.g
., th
e A
maz
on,
and
iden
tify
spec
ific
area
s fo
r clim
ate
stab
iliza
tion.
Glo
bal C
oord
inat
ion
for C
arbo
n S
tora
ge in
Col
lect
ive
Terr
itorie
s of
Indi
geno
us P
eopl
es a
nd
Loca
l Com
mun
ities
in th
e Eq
uato
rial R
egio
n
Glo
bal A
llian
ce o
f Ter
ritor
ial C
omm
uniti
esEv
iden
ce to
dat
e sh
ows
that
the
clos
est a
nd b
est p
ositi
oned
to m
anag
e th
e E
arth
’s c
arbo
n-ric
h la
nds,
esp
ecia
lly in
dige
nous
peo
ples
and
loca
l co
mm
uniti
es, h
ave
not y
et b
een
inte
grat
ed in
to e
mer
ging
nat
iona
l and
gl
obal
clim
ate
solu
tions
.
Wat
er R
eser
ves
as E
cosy
stem
-B
ased
Ada
ptat
ion
Inst
rum
ents
fo
r Lat
in A
mer
ican
Cou
ntrie
s
Wor
ld W
ildlif
e Fu
nd (W
WF)
Mex
ico
The
mai
n go
al o
f the
initi
ativ
e is
to a
lloca
te to
the
envi
ronm
ent a
t lea
st
30%
of t
he to
tal w
ater
ava
ilabl
e in
Lat
in A
mer
ican
cou
ntrie
s to
sec
ure
prot
ectio
n of
the
mai
n fre
shw
ater
eco
syst
ems
and
free-
flow
ing
river
s,
and
the
bene
fits
that
flow
from
them
.50
/50
– Th
e Pl
an to
Sav
e Li
fe
on E
arth
Avaa
zH
alf o
f the
pla
net s
pare
d fro
m h
arm
ful a
ctiv
ities
and
the
othe
r hal
f of
the
plan
et s
hare
d w
ith n
atur
e.
Tab
le IV
.4 (c
ont
inue
d)

178 Economic Commission for Latin America and the Caribbean (ECLAC)
Initi
ativ
eC
ount
ryO
bjec
tive
Con
serv
atio
n O
ppor
tuni
ties
Und
er
Clim
ate
Cha
nge
Con
side
ratio
ns:
The
Exp
erie
nce
from
the
Am
azon
Bio
me
WW
FTh
e cr
eatio
n of
new
pro
tect
ed a
reas
or t
he e
xpan
sion
of e
xist
ing
ones
, es
peci
ally
in z
ones
whe
re c
onse
rvat
ion
and
resi
lienc
e po
tent
ial i
s hi
gh,
thei
r inc
lusi
on in
land
scap
e ap
proa
ches
and
the
impl
emen
tatio
n of
st
rate
gies
that
stre
ngth
en c
onne
ctiv
ity w
ithin
the
biom
e ar
e be
com
ing
fund
amen
tal a
ctio
ns to
ena
ble
biod
iver
sity
to a
dapt
to c
limat
e ch
ange
an
d to
mai
ntai
n th
e su
pply
of e
cosy
stem
ser
vice
s in
the
long
term
in
the
Am
azon
bio
me.
Her
itage
Col
ombi
a (H
ECO
): R
esili
ent L
ands
cape
s th
at M
axim
ize
the
Con
tribu
tion
to C
olom
bia´
s M
itiga
tion
and
Adap
tatio
n G
oals
WW
FW
here
fore
sted
land
scap
es a
nd th
eir r
ole
in g
reen
hous
e ga
s (G
HG
) em
issi
ons
and
miti
gatio
n ar
e co
ncer
ned,
the
coun
try’s
nat
ural
fore
sts
cove
r som
e 60
mill
ion
hect
ares
and
sto
re a
bout
26.
22 b
illio
n to
ns
of C
O2 e
q.
And
es A
ctio
n: R
esto
ratio
n of
O
ne M
illio
n H
ecta
res
of H
igh
And
ean
Fore
st E
cosy
stem
s
Uni
ted
Nat
ions
Env
ironm
ent P
rogr
amm
e (U
NEP
)A
ndes
Act
ion
is a
new
Lat
in A
mer
ican
-led
larg
e-sc
ale
rest
orat
ion
initi
ativ
e ai
min
g to
rest
ore
a m
illio
n he
ctar
es o
f hig
h A
ndea
n ec
osys
tem
s (m
ostly
pol
ylep
is fo
rest
s) in
Arg
entin
a, B
oliv
ia (P
lurin
atio
nal S
tate
of),
C
hile
, Col
ombi
a, E
cuad
or a
nd P
eru
over
the
next
25
year
s.
Leve
ragi
ng N
BS
for W
ater
Sec
urity
an
d C
limat
e Ac
tion
Fore
st T
rend
sTh
e in
itiat
ive
aim
s to
leve
rage
wat
er s
ecto
r inv
estm
ents
to s
cale
na
ture
-bas
ed s
olut
ions
for c
limat
e ac
tion.
Wat
er re
sour
ce m
anag
ers
and
serv
ice
prov
ider
s, s
uch
as d
rinki
ng w
ater
util
ities
, hav
e lo
ng b
een
at th
e fo
refro
nt o
f ado
ptin
g na
ture
-bas
ed s
olut
ions
.Pu
tting
No
Def
ores
tatio
n in
to P
ract
ice
This
is a
mul
ti-st
akeh
olde
r ini
tiativ
e
with
a w
orld
wid
e m
embe
rshi
p.Th
e H
igh
Car
bon
Sto
ck A
ppro
ach
(HC
SA)
is a
pra
ctic
al m
etho
dolo
gy
for i
mpl
emen
ting
com
mitm
ents
to a
void
all
defo
rest
atio
n.R
esto
ring
Fore
sts
and
Land
s as
a C
ruci
al R
espo
nse
to C
limat
e C
hang
e an
d S
usta
inab
le D
evel
opm
ent
The
Inte
rnat
iona
l Uni
on fo
r Con
serv
atio
n of
Nat
ure
and
Nat
ural
Res
ourc
es (I
UC
N),
as th
e S
ecre
taria
t fo
r the
Bon
n C
halle
nge
(IUC
N is
an
NG
O w
ith
Uni
ted
Nat
ions
obs
erve
r sta
tus)
. It b
rings
toge
ther
59
gov
ernm
ents
and
priv
ate
entit
ies
that
hav
e al
read
y co
mm
itted
to th
e C
halle
nge.
This
initi
ativ
e us
es th
e al
read
y si
gnifi
cant
pro
gres
s on
the
Bon
n C
halle
nge
as a
spr
ingb
oard
for a
dditi
onal
com
mitm
ents
and
to
acce
lera
te a
ctio
n on
the
rest
orat
ion
of d
efor
este
d an
d de
grad
ed la
nds,
re
cogn
ized
as
a cr
itica
l nat
ure-
base
d so
lutio
n to
clim
ate
chan
ge.
Perv
erse
Ince
ntiv
es fo
r Ag
ri-B
usin
ess
and
Def
ores
tatio
n:
A Lo
ve A
ffair
that
Mus
t End
Glo
bal F
ores
t Coa
litio
n (G
FC),
Heñ
oi, C
limat
e La
nd A
mbi
tion
and
Rig
hts
Alli
ance
(CLA
RA)
Perv
erse
ince
ntiv
es u
nder
pin
the
unsu
stai
nabl
e m
odel
of s
oy a
nd b
eef
prod
uctio
n, w
hich
resu
lts in
con
flict
s w
ith in
dige
nous
peo
ples
and
loca
l co
mm
uniti
es, w
ho a
re v
iole
ntly
dis
poss
esse
d of
thei
r lan
ds a
nd fo
rest
s.
Indi
geno
us p
eopl
es a
nd lo
cal c
omm
uniti
es in
Sou
ther
n C
omm
on
Mar
ket (
MER
CO
SU
R) c
ount
ries
are
dem
andi
ng th
e im
med
iate
rem
oval
of
per
vers
e in
cent
ives
and
sub
sidi
es fo
r agr
ibus
ines
s, a
nd o
ppos
e a
Euro
pean
Uni
on-M
ERC
OS
UR
trad
e ag
reem
ent t
hat w
ould
ince
ntiv
ize
the
indu
stry
furth
er.
So
urce
: E
cono
mic
Com
mis
sion
for L
atin
Am
eric
a an
d th
e C
arib
bean
(EC
LAC
), on
the
basi
s of
Nat
ure-
Bas
ed S
olut
ions
(NB
S) F
acili
tatio
n Te
am, C
ompe
ndiu
m o
f Con
trib
utio
ns
Nat
ure-
Bas
ed S
olut
ions
, Nai
rob
i, U
nite
d N
atio
ns E
nviro
nmen
t P
rogr
amm
e (U
NE
P),
2019
.
Tab
le IV
.4 (c
onc
lud
ed)

The climate emergency in Latin America and the Caribbean... 179
Despite the advantages of NBS, there are various barriers to their implementation; since they can be considered a public good, whose benefits are not limited to a single organization, they are not adequately funded. In fact, less than 1% of global climate finance focuses on coastal protection, infrastructure and risk management (including NBS). For another thing, they have benefits that are outside the market, such as effects on health and biodiversity, so measurement of their cost-effectiveness is uncertain; it is also difficult to measure their long-term effectiveness, and this prevents these projects from being compared with more traditional ones (Seddon and others, 2020). Moreover, given the mitigation potential of NBS, there may be a risk of promoting monoculture or diverting attention from decarbonization in other sectors of the economy.
To overcome these challenges, it is important to generate an institutional framework that recognizes the value of ecosystems and their potential to generate a new type of economy capable of coexisting harmoniously with nature. This requires a systemic, science-based interdisciplinary approach that allows resources to be redirected towards more efficient uses.
(a) Reorienting financing
NBS do not necessarily require additional financial resources, but they do often require existing funds to be redirected and used more effectively. The vast majority of agricultural subsidies and probably most public funding and almost all private sector investment in agricultural research and development support conventional agricultural production patterns that increase emissions and degradation of the means of production themselves (FAO, 2011). The most effective production development policy would be to redirect available resources; this means making current investments more sustainable and profitable over time, and recognizing the potential of ecosystems to provide solutions for the entire production system.
Encouraging the gradual and progressive reorientation of existing investments in accordance with the best international experiences would create the conditions for overcoming the initial barriers to the adoption of new production systems, until the flows of benefits appeared in a planned transition strategy. The reorientation of investments should include labour training and the strengthening of technical assistance. One problem to be solved is the gap between the capital available for investment and projects capable of being implemented. The transition to sustainability requires planning.

180 Economic Commission for Latin America and the Caribbean (ECLAC)
(b) Payment for ecosystem services and enabling conditions to support ecosystem-based adaptation measures
Payment for ecosystem services is based on the principle of internalizing or reflecting the economic and cultural benefits that accrue from the ability of ecosystems to sustain a flow of benefits, such as regulation of water flows, carbon storage, provision of habitats for biodiversity and landscape beauty. Such initiatives provide monetary and non-monetary incentives to communities, farmers and private landowners to protect, restore and conserve natural ecosystems and adopt sustainable agricultural, forestry and land use practices. In water resource management, these actions generate benefits for users of environmental services through water regulation and control of flooding, erosion, sediment, etc., ensuring a consistent, high-quality water supply and helping to reduce the costs of water treatment and equipment maintenance (WWAP, 2018).
The importance of payments for ecosystem services in the region is explained by their cost-effectiveness, given that regional and local governments have limited capacity for comprehensive diagnosis, control and monitoring, and compliance with traditional policies.9 Payments for ecosystem services are often implemented through water or conservation funds financed by public-private partnerships, government subsidies or contributions paid by water or resource users. The funds are usually governed by a contract between the founding members designating an independent institution to manage the financial resources and ensure that they are used for the protection and sustainable management of ecosystems and landscapes (Stanton and others, 2010).
In Latin America, about 65% of cases are financed by the public sector, a quarter by the private sector and the rest (10%) by the non-commercial private sector. In Europe, North America and Asia the pattern is similar, although with a greater presence of public models (70%). Africa, by contrast, is where private models are most prevalent (85%), with more than half being financed by the commercial private sector through ecotourism (Ezzine de Blas, Le Coq and Guevara Sanginés, 2017).
Costa Rica was the pioneer of this type of initiative in the region with its Forest Act (No. 7575) of 1996, which laid the groundwork for the future establishment of the first programme of payments for ecosystem services in 1997. For the first time, a definition of “environmental services” was coined: they were those “provided by the forest and forest plantations and having a direct impact on the protection and improvement of the environment”. These services may be “mitigation of greenhouse gas emissions (fixing, reduction, sequestration, storage and absorption), protection of water for
9 There is abundant literature on payment for ecosystem services in the region, which demonstrates the efficiency of this approach in terms of environmental, social and economic outcomes (Echavarria and others, 2015).

The climate emergency in Latin America and the Caribbean... 181
urban, rural or hydroelectric use, protection of biodiversity for conservation and sustainable scientific and pharmaceutical use, research and genetic improvement, protection of ecosystems, forms of life and natural scenic beauty for tourism and scientific purposes” (article 3, Law No. 7575). This law created the National Forestry Financing Fund (FONAFIFO) as the institution in charge of financing or attracting funds for the programme (article 46). The Government is a central actor in a well-defined environmental governance scheme. Through this programme, the 1980s approach to granting environmental subsidies or incentives was changed to one of economic recognition (Flores Aguilar and others, 2018).
Restoring the natural heritage through reforestation is a fundamental step towards the decarbonization of economies. These investments are the least costly and safest way to store carbon and could provide a service to humanity, paid for by the international community. Furthermore, it is the most effective way to recover ecosystem services (such as water supply and land use) that are vital for reducing vulnerabilities and avoiding ecological disasters. The region could provide these services for humanity, and would be compensated on the basis of the principle of common but differentiated responsibilities.
A number of ecosystem service payment systems with multilevel and intersectoral structures now operate in the region. For example, between 2001 and 2015 in Brazil, nine states had laws and decrees specifically regulating these programmes, six had some other type of regulation and eight had draft laws for their regulation. In total, 418 municipalities were paying for environmental services (Garcia Alarcon and others, 2016). In addition to Brazil and Costa Rica, Ecuador, Guatemala and Mexico have ecosystem service payment initiatives financed by government because they are environmental preservation measures (see table IV.5).
Table IV.5 Latin America and the Caribbean (5 countries): examples of government-financed
ecosystem service payment programmes, 1997–2008
Country Level Start Name BeneficiariesBrazil State of
Amazonas2007 Bolsa Floresta In 2008, 2,700 traditional and indigenous families
benefited from financial compensation and health care in exchange for a halt to deforestation in primary forests.
Costa Rica National 1997 National Forest Financing Fund
This is an incentive for reforestation and agro-forestry ecosystems. Since 2003, more than 7,000 contracts have been signed and around 2 million trees planted.
Ecuador National 2008 Forest Partner Programme
As of 2010, the programme was protecting over 500,000 hectares of natural ecosystems and had over 60,000 beneficiaries.
Guatemala National 1997 Forest Incentives Programme
In 2009, the programme included 4,174 beneficiaries who planted 94,151 hectares of forest. It also covered 155,790 hectares of natural forest that had been turned into protected areas thanks to the economic incentives.

182 Economic Commission for Latin America and the Caribbean (ECLAC)
Country Level Start Name BeneficiariesMexico National 2003 Payment for
Environmental Services (PSA)
Covers programmes that support communities, ejidos, regional forestry associations and forest landowners. It includes the Hydrological Environmental Services Programme (PSAH), the Programme to Develop the Market for Environmental Services through Carbon Capture and Biodiversity Derivatives and to Promote the Establishment and Improvement of Agroforestry Systems (PSA-CABSA), the Forest Environmental Services Project (PSAB) and ProÁrbol, a programme that builds on the experience of PSAH, CABSA and PSAB and aims to support hydrological environmental services, biodiversity conservation, agroforestry systems with shade crops and development of the idea of carbon sequestration. In 2018, the Sowing Life programme was created to encourage rural producers with incomes below the rural welfare line to produce agroforestry crops. Producers must have a minimum of 2.5 hectares to allocate to the project and are given support of US$ 250 per month.
Source: G. Magrin, “Adaptación al cambio climático en América Latina y el Caribe”, Project Documents (LC/W.692), Santiago, Economic Commission for Latin America and the Caribbean (ECLAC), 2015.
There have been specific projects in which the impact of payment for environmental services on the adoption of silvopastoral systems has been assessed. These include projects in Costa Rica and one funded by the Global Environment Facility (GEF) that have been implemented by the Tropical Agricultural Research and Higher Education Centre (CATIE), the Food and Agriculture Organization of the United Nations (FAO), the Nitlapan Research and Development Institute in Nicaragua, the Centre for Research on Sustainable Agricultural Production Systems (CIPAV) Foundation in Colombia and the World Bank. Between 2003 and 2006, a number of livestock farmers in Colombia, Costa Rica and Nicaragua received between US$ 2,000 and US$ 2,400 per farm (about 10% to 15% of their net income) to implement the silvopastoral systems programme. This programme reduced degraded pastures by 60% in the three countries, while the area allocated to silvopastoral systems increased significantly. Associated benefits included a 71% increase in carbon sequestration, a 10% increase in milk production and a 115% increase in farm income. At the same time, herbicide use was reduced by 60% and the use of fire to manage pastures became less frequent (FAO, 2015). The complementarity between ecosystem-based adaptation and payment for environmental services can be strengthened by applying the tools shown in table IV.6.
The design and implementation of payments for ecosystem services should consider local aspects to avoid problems that can arise when the following occur: the plan is confused and it is not clear whether the goal refers to actions or outcomes; the initiative is perceived as a commodification of nature and its intangible values; the action is not efficient in reducing poverty; difficulties arise in building trust among the beneficiaries of the proposal; and there are issues related to gender or land tenure.
Table IV.5 (concluded)

The climate emergency in Latin America and the Caribbean... 183
Table IV.6 Regulatory instruments and economic incentives that support
ecosystem-based adaptation
Instruments and incentives Application to ecosystem-based adaptation (EbA)Financial (market and non-market sources)Payments for ecosystem services (not tradable)
Payments to compensate those maintaining ecosystem services (e.g. payments for managing watersheds).
Carbon financing Carbon storage payments, e.g. Clean Development Mechanism (CDM) and voluntary carbon market.
Reducing emissions from deforestation and forest degradation in developing countries (REDD) incentives
Incentives to reduce deforestation and degradation of forests in developing countries.
Biodiversity-based mechanisms
Payments based on indirect or representative indicators of biodiversity (e.g. area of forest left undisturbed).
Debt for nature swaps Debt write-offs in exchange for ecosystem conservation (e.g. creation of protected areas in Costa Rica in exchange for debt relief).
Conservation trust funds Funds to improve management and ensure conservation of protected areas (e.g. conservation agreements).
Certification and labelling Certification of products and services whose production has minimal impact on ecosystems (e.g. ecotourism).
Increased access and premium pricing in green markets
Increase in the value of sustainable products and services (e.g. organic products or organic coffee) and in their market access.
Market development Development of new markets for environmentally friendly products and services and expansion of existing ones.
Environmental awards or recognition
Public recognition of good environmental stewardship.
Removal of harmful subsidies (fisheries, agriculture, energy)
Removal of subsidies that destroy, degrade or lead to unsustainable use of ecosystems.
Taxes, fees and charges Taxes on activities that destroy or degrade natural resources or involve poor management of them (e.g. taxes on pesticide use or unsustainable logging).
Negotiable quotas Quotas for the extraction of natural ecosystem goods, such as fuelwood, timber, fish or wildlife, to ensure they are sustainably managed.
Non-financialDetermination of land tenure, zoning and ownership and of usage and management rights
Clarification of land tenure and rights to improve conservation, restoration and sustainable management of ecosystems.
Public advocacy and capacity-building to support EbA
Increased recognition of the value of EbA and its role in adaptation strategies, leading to increased implementation.
Development, improvement and enforcement of laws
Laws to promote the implementation of EbA and enforcement tools, and laws to promote the sustainable use of ecosystems or discourage mismanagement (e.g. protected area legislation, pesticide use regulations and water pollution laws).
Institutional strengthening and partnerships
Allocation of financial and human resources to relevant institutions and the creation of networks involving the different stakeholders.
Development, transfer and application of environmentally sound technologies
Development of material and non-material technologies that can help in implementing EbA (e.g. development of software or early warning systems).
Source: G. Magrin, “Adaptación al cambio climático en América Latina y el Caribe”, Project Documents (LC/W.692), Santiago, Economic Commission for Latin America and the Caribbean (ECLAC), 2015.

184 Economic Commission for Latin America and the Caribbean (ECLAC)
It should also be considered that EbA may require actions to provide one ecosystem service at the expense of other services. For example, carbon accumulation based on increased net primary production may affect water provision (Viglizzo and others, 2012). It is therefore crucial to carefully analyse options and consider not only the costs and benefits, but also the non-economic value of ecosystem services (Magrin, 2015).
(c) Legislation
Multilateral environmental agreements (the Convention on Biological Diversity, the United Nations Framework Convention on Climate Change (UNFCCC) and its Paris Agreement, the United Nations Convention to Combat Desertification in Those Countries Experiencing Serious Drought and/or Desertification, Particularly in Africa, the Sendai Framework for Disaster Risk Reduction 2015-2030 and the New Urban Agenda) are opportunities to implement nature-based solutions (NBS). The 2030 Agenda summarizes many of these agreements and provides a general framework for pursuing these solutions.
At the same time, governments need to assess and, where appropriate, amend their legal and regulatory regimes to remove barriers to the incorporation of NBS and to advance their use. National legislation to facilitate the implementation of NBS at the local level is particularly important. A small but growing number of countries have adopted policy frameworks that promote them (WWAP, 2018). Regional frameworks can also stimulate change. The European Union, for example, has significantly increased opportunities for the deployment of NBS by harmonizing legislation and policies related to agriculture, water resources and the environment.
In 2014, Peru adopted a national legal framework to regulate and supervise investment in green infrastructure, the Law on Compensation Mechanisms for Ecosystem Services; this is the first national regulatory framework specifically for green infrastructure investment in the drinking water and sanitation sector in Latin America and the Caribbean. It aims to promote, regulate and monitor mechanisms of remuneration for such services when ecosystem managers enter into an agreement with those who pay for their services or for the conservation, rehabilitation and sustainable use of the sources of these services.
(d) Improving intersectoral collaboration and the knowledge base
The implementation of NBS demands higher levels of intersectoral and institutional collaboration than grey infrastructure models, particularly when applied at the landscape scale. This is an opportunity for the development of an integrated public policy agenda. The policy landscape remains highly fragmented in many countries; NBS, in addition to benefiting from potential harmonization, could also be a means to achieve it. Clear mandates at the

The climate emergency in Latin America and the Caribbean... 185
highest level are something that can accelerate the adoption of NBS and encourage better cross-sectoral coordination. For these to exist, there is a need to improve the knowledge base of NBS processes (including through greater scientific rigour), to incorporate the traditional knowledge of local communities about ecosystem functioning and nature-society interactions, and to ensure that those who possess the knowledge are fully and effectively involved in assessments, decision-making, implementation and management. Ultimately, the viability of NBS depends on the conviction of decision-makers and on stakeholders being aware of the expected results, the monitoring model, the costs of implementation and their cost-effectiveness.
3. Adaptation to climate change in the agricultural sector
The agricultural sector is of strategic importance in Latin America and the Caribbean, as it generates 4.7% of the region’s GDP, employs 14% of the population and accounts for 29% of exports. Some 80% of rural farms are family-run, accounting for between 27% and 67% of food production (ECLAC/ILO/FAO, 2012).10
The Intergovernmental Panel on Climate Change (IPCC) has identified three types of adaptation options in the agricultural sector to increase its resilience and reduce its vulnerability to the effects of climate change: structural and physical options, social options and institutional options.
The scope of benefits depends on the type of measure implemented. In the agricultural sector, for example, data indicate that some adaptation measures reduce financial costs significantly, although there are significant differences depending on the type of crop or region (Agrawala and others, 2010; Galindo and others, 2014b). The cost of some of these measures, such as better management (changes in planting and growing dates or changes in the crop mix, among others), is low, and their benefits are substantial, making them cost-effective. At the same time, combining them with the use of additional inputs such as fertilizers or better irrigation practices generates positive economic effects that can outweigh the total impact (Galindo and others, 2014b). In other cases, however, such as biodiversity, it is stressed that damage is irreversible. Box IV.3 identifies the factors that influence the implementation of adaptation measures in United States agriculture.
In the agricultural sector, measuring the benefits of adaptation and setting quantitative targets is extremely complex. This is because adaptation by agricultural producers simultaneously incorporates practices aimed at coping with changes in input and product prices, temperature and water availability, as well as various weather events, including extreme ones.
10 This section is based on Magrin (2015).

186 Economic Commission for Latin America and the Caribbean (ECLAC)
Agricultural censuses provide information on the choice of crops, agricultural practices and the main characteristics of producers in different regions of a country. As climate, geographical and soil quality characteristics are also known, in countries that have regions with heterogeneous climates, this information makes it possible to construct production patterns for different climate characteristics.
Box IV.3 Adaptation in United States agriculture
Factors contributing to better management practices and conservation agriculture in the United States farming sector include information on environmental damage and pest infestation, education, income, participation in social networks and government programmes, and social capital (Prokopy and others, 2008; Knowler and Bradshaw, 2007; Reidsma and others, 2010; Galindo and others, 2014b) (see figures 1 and 2).
Figure 1 United States: determinants of agricultural best management
practice adoption(Vote count)
Acres
Age
CapitalDiversity
Education
Experience
Income
Information
Work
Agency
Local
Type ofowner
General attitudes
Adoption payments
Profitabilityof practices
Inheritance Risk
General awareness
CauseProgramme
Animal
Grains
Other
River
SlopeSoil quality
0
10
20
30
40
50
Posi
tivel
y si
gnifi
cant
0 5 10 15Negatively significant
Tenancy
Source: Economic Commission for Latin America and the Caribbean (ECLAC), on the basis of L. Prokopy and others, “Determinants of agricultural best management practice adoption: evidence from the literature”, Journal of Soil and Water Conservation, vol. 63, No. 5, Ankeny, Soil and Water Conservation Society, 2008.
Note: The chart is based on Prokopy and other (2008), who applied the vote count methodology to 55 best practice adoption studies over the 25 years prior to publication of the study. This methodology involves tallying the number of times a variable is positively significant, negatively significant or non-significant. The variables considered are significant with at least 95% confidence. The blue dots are capacity-related variables, the green dots attitude-related variables, the orange dots environmental awareness variables and the grey dots farm characteristics variables.

The climate emergency in Latin America and the Caribbean... 187
Figure 2 United States: factors correlating positively or negatively with the adoption
of conservation agriculture, according to selected studies(Number of studies)
Remuneratedlabour
Well-drained soilFamily labourEmphasis ongrain cultivation
Information sourceTemperatureFarm profitability
Gross farm income
ExperienceProgramme participationEnvironmental awareness
Technical outreach or assistanceIncome
Area plantedImportance of cattle
Information access
Importance of crop revenues
ErosionDebt Hectares irrigated
Distance to roads
Owner (tenant = 1)
Precipitation
Farm size
High soil productivity
Slope
Education
Non-farm activitiesAge
0
2
4
6
8
Stu
dies
whe
re e
ach
varia
ble
corr
elat
es p
ositi
vely
0 2 4 6Studies where each variable correlates negatively
Management capacityFarm orsoil type
Product prices
Source: Economic Commission for Latin America and the Caribbean (ECLAC), on the basis of Organization for Economic Cooperation and Development (OECD), Farmer Behaviour, Agricultural Management and Climate Change, Paris, 2012; D. Knowler and B. Bradshaw, “Farmers’ adoption of conservation agriculture: a review and synthesis of recent research”, Food Policy, vol. 32, No. 1, Amsterdam, Elsevier, 2007.
Note: The chart is based on Knowler and Bradshaw (2007) and the observations are based on data readings taken close to the date of publication of the study.
Source: Economic Commission for Latin America and the Caribbean (ECLAC), on the basis of L. Prokopy and others, “Determinants of agricultural best management practice adoption: evidence from the literature”, Journal of Soil and Water Conservation, vol. 63, No. 5, Ankeny, Soil and Water Conservation Society, 2008; D. Knowler and B. Bradshaw, “Farmers’ adoption of conservation agriculture: a review and synthesis of recent research”, Food Policy, vol. 32, No. 1, Amsterdam, Elsevier, 2007; P. Reidsma and others, “Adaptation to climate change and climate variability in European agriculture: the importance of farm level responses”, European Journal of Agronomy, vol. 32, No. 1, Amsterdam, Elsevier, 2010; L. Galindo and others, “Cambio climático, agricultura y pobreza en América Latina: una aproximación empírica”, Project Documents (LC/W.620), Santiago Economic Commission for Latin America and the Caribbean (ECLAC), 2014; Organization for Economic Cooperation and Development (OECD), Farmer Behaviour, Agricultural Management and Climate Change, Paris, 2012.
Given the socioeconomic characteristics of agricultural producers, it is possible to determine how the climate affects the choice of crops. It is therefore possible to identify how a change in climatic conditions may affect producers’ choice of crop and likewise their expected incomes, as illustrated in box IV.4 in relation to Peruvian agriculture. This methodology can be applied at the national level, as though the group of farmers choosing different crops according to different climatic conditions behaved like one single individual in the whole country. This approach makes it possible
Box IV.3 (concluded)

188 Economic Commission for Latin America and the Caribbean (ECLAC)
to obtain a predictor or indicator of the route to adaptation: maintaining a variety of crops. However, if temperature and humidity continue to change, the collective farmer will see this diversity impoverished by limits on the adaptive capacity of crops. This will mark the possible path of adaptation.
Box IV.4 Adaptation in Peruvian agriculture
Peru’s fourth National Agricultural Census of 2012 was used to estimate the effects of temperature and rainfall on the choice of major crops and the income expected from them (Galindo, Alatorre and Reyes, 2015a). The likelihood of crops being chosen within a temperature range of 0 ºC to 35 °C is shown in figure 1. It can be seen that the crop most likely to be chosen when temperatures are low is the white potato, followed by the native potato. As the temperature increases, the preference for both types of potato decreases in favour of coffee, the two maize varieties considered and, to a lesser extent, alfalfa. Hard yellow maize is the crop most likely to be chosen at high temperatures. All other crops are unlikely to be chosen. Cassava shows a similar trend to white potatoes, being less likely to be chosen as temperatures rise, while the likelihood of bananas being chosen increases. Rice and grapes have a practically zero likelihood of being chosen. Figure 1 also shows how the likelihood of a crop being chosen changes within an average precipitation range of between 0 mm and 300 mm per month. A low level of precipitation favours the choice of white potatoes and alfalfa. As precipitation increases, so does the likelihood of the two species of corn, hard yellow and starchy, being chosen, and the same is true for cassava and banana. However, only starchy corn and banana show an increasing probability of being chosen over the whole range considered, while that of the rest of the crops peaks and then declines.
Figure 1 Peru: likelihood of crop choice by annual temperature and
monthly precipitation
0 5 10 15 20 25 30 350
0.2
0.4
0.6
0.8
1.0
Temperature (°C)
Prob
abilit
y
White potato AlfalfaCoffeeHard yellow maize Starchy maize
Native potato
A. Likelihood of crop choice by annual temperature

The climate emergency in Latin America and the Caribbean... 189
0
0.2
0.4
0.6
0.8
1.0
B. Likelihood of crop choice by monthly precipitation
0 50 100 150 200 250 300Precipitation (mm)
Prob
abilit
y
White potatoAlfalfaPaddy riceCoffeeHard yellow maize
Native potatoBanana Grape
CassavaStarchy maize
Source: L. Galindo, J. Alatorre and O. Reyes, “Adaptación al cambio climático a través de la elección de cultivos en Perú”, El Trimestre Económico, vol. 82, No. 327, Mexico City, Fondo de Cultura Económica (FCE), 2015.
In terms of income, the crops that show annual losses when the temperature rises by 1 °C are alfalfa, rice, coffee, hard yellow corn, bananas and cassava. An increase in the level of precipitation (measured in millimetres per month) causes losses in practically all crops, the exceptions being white potatoes and cassava (see figure 2B).
Figure 2 Peru: percentage changes in income per crop
(Percentages)
A. Temperature rise of 1 °C
-50 -40 -30 -20 -10 0 10 20
White potato
Alfalfa
Rice
Coffee
Hard yellow maize
Starchy maize
Native potato
Banana
Grape
Cassava
Box IV.4 (continued)

190 Economic Commission for Latin America and the Caribbean (ECLAC)
B. Monthly precipitation rise of 1 mm
-2.0 -1.5 -1.0 -0.5 0 0.5
White potato
Alfalfa
Rice
Coffee
Hard yellow maize
Starchy maize
Native potato
Banana
Grape
Cassava
Source: L. Galindo, J. Alatorre and O. Reyes, “Adaptación al cambio climático a través de la elección de cultivos en Perú”, El Trimestre Económico, vol. 82, No. 327, Mexico City, Fondo de Cultura Económica (FCE), 2015.
When temperature and precipitation scenarios for 2070 are considered, the likelihood of both potato species, alfalfa, rice, coffee, grapes and cassava being chosen decreases, with the two maize species and bananas gaining. A drop in producers’ expected conditional income of between 8% and 13% is projected.
Source: L. Galindo, J. Alatorre and O. Reyes, “Adaptación al cambio climático a través de la elección de cultivos en Perú”, El Trimestre Económico, vol. 82, No. 327, Mexico City, Fondo de Cultura Económica (FCE), 2015.
A wide range of adaptation options are now available for agriculture, the water sector, health, biodiversity and protection from extreme weather events and for coastal zones. These measures have co-benefits, such as energy efficiency, reduction of air pollution, preservation of biodiversity and curbing of deforestation. However, they also have limitations, and there are obstacles to their implementation. There will always be residual and even irreversible damage, as well as inefficient adaptation options that cause significant collateral damage.
The following are some of the limiting factors or barriers to planning and implementing adaptation options in the sector (IPCC, 2014a):
• Knowledge and technology constraints in rural areas because of a lack of impact and vulnerability studies or information dissemination channels. They can also arise if these exist but are inappropriate because of a lack of integrated or multidisciplinary studies on natural and socioeconomic systems or deficiencies in research on adaptive capacity and local indigenous knowledge.
Box IV.4 (concluded)

The climate emergency in Latin America and the Caribbean... 191
• Physical constraints. The rate and magnitude of climate change and the geographical characteristics of the local environment can be an obstacle to adaptation. Adaptation actions in the agricultural sector may be limited by water availability and quality, or land use change in mountain regions may restrict the migration of plant species to higher-altitude areas.
• Constraints related to the biological tolerance of species to climate change. Many may present problems with their physiological adaptive capacity as they are forced to migrate to areas more conducive to survival. In turn, environmental degradation can reduce the productivity and resilience of agricultural systems.
• Economic and financial constraints. The short-term dynamics of economic systems can undermine the capacity for adaptation. While development may alleviate the lack of resources, it can also put pressure on natural resources and ecosystems and limit their adaptive capacity. Lack of capital can likewise restrict the implementation of adaptation measures.
• Human resources. Lack of trained human capital limits information-gathering, technology take-up and use, leadership in prioritizing and implementing public policies, and adaptation measures.
• Social and cultural constraints. Cultural values, world views, norms and behaviours can influence the perception of risk, the adoption of adaptation measures, the distribution of vulnerability and adaptive capacity in society.
• Governance and institutions. The lack of coordination tools is a limiting factor when it comes to addressing cross-cutting issues and long-term challenges. Also, intersectoral work and institutional capacities are limited. These aspects mean a reduced capacity to deal with environmental problems that require coordination (Samaniego and others, 2017).
F. Adapting to climate change through migration
1. Climate-related migration
Migration has been the subject of extensive discussion and a variety of theories in the academic world. Although migration as a form of adaptation to the impact of climate change is often mentioned in the literature on the subject, it is still hotly debated (Mobjörk and others, 2016). According to IPCC (2014a and 2014b), migration is an adaptation strategy widely used in response to social and environmental changes. Extreme climate events

192 Economic Commission for Latin America and the Caribbean (ECLAC)
displace populations in the short term because of the loss of dwellings or economic disruption, although only a proportion of those displaced end up as permanent migrants.
The Government Office for Science report (2011) lays out a framework for climate-driven migration based on theories and empirical studies on the topic. It emphasizes that climate change influences migration decisions through economic, environmental and to some extent political factors (e.g. falling rural wages or rising agricultural prices).
There are different patterns of migration: international or national; permanent, circular or temporary; and voluntary or forced. Climate change and climate variability seem to be affecting these patterns in different ways. It is clear that rising sea levels which render areas uninhabitable cause permanent migration, while extreme weather events involve more temporary movements within the region. Circular movements seem to be associated with drought. However, extreme weather events can also influence permanent migration. Places at high risk of extreme weather events could be partially or totally abandoned. This could exacerbate the large migratory movements that are already taking place, particularly migration from rural to urban areas (Mobjörk and others, 2016).
Adaptation through migration perfectly illustrates the interaction between the above-mentioned climate risks. It also highlights how responding to one risk can create conditions of vulnerability to another. Many factors contribute to migration, such as lack of water security, sea level rise, food insecurity and extreme events. Most people who move or migrate for reasons related to climate change also face difficulties in adapting to the urban environment. They often end up in risk-prone areas, like the urban poor. In other words, migration because of a lack of arable land or water can lead to a new situation in which extreme events are the main risk factor.
Adaptation processes cushion the negative effects of climate change on society’s means of subsistence. Lack of or insufficient adaptation threatens food security and the viability of some human settlements. Migration then becomes an ex situ adaptation option. Climate change is thus a driver of major disruptions within and between countries. This can lead to national security responses, as has been shown in the matter of migration flows magnified by prolonged droughts.
Resilience and adaptive capacity reduce the push factors for large-scale migration (loss of livelihoods, food shortages and sea level rise). This section presents the relationship between the potential effects of climate change on migration and the national security responses being considered.

The climate emergency in Latin America and the Caribbean... 193
(a) National security concerns over migration and resource disputes
Since the early 2000s, there has been growing interest among researchers and policymakers in the impact of climate change on security (Mobjörk and others, 2016).11 In 2007, the Secretary-General of the United Nations, Ban Ki-moon, stated in an article that the origin of the conflict in Darfur (which resulted in 200,000 deaths and millions of people displaced) was an ecological crisis caused in part by climate change.12 Some experts believe that the revolts that have taken place in the Middle East and Maghreb were also originally related to climate change (IEEE, 2016), a period of drought and the failure of agriculture in those years.
ECLAC believes that there is a relationship between migration from Central America, particularly the dry northern corridor extending from Guatemala to Honduras, and the long-term drying up of that area, aggravated by ongoing climate change. This phenomenon has taken a political turn because of the confrontation between the President of the United States and the Government of Mexico regarding the closure of the United States border and the diplomatic and trade actions of 2019 aimed at curbing migration by putting pressure on the countries involved. ECLAC, together with the governments of these four countries, is promoting a development programme aimed at economic revitalization and efficient adaptation to climate change with a human security focus. In other words, the focus is on development, not national security, throughout the migration cycle: departure, transit and return (Bárcena, 2019).
The approach that links national security to climate change is being analysed by military circles and security bodies in the United States. In January 2019, the United States intelligence community presented a document entitled Statement for the Record: Worldwide Threat Assessment of the US Intelligence Community (Coats, 2019). In this assessment, the intelligence agencies declare that climate change is an urgent and growing national security threat and that it is contributing to an increase in natural disasters, refugee flows and
11 In its resolution No. 66/290 (A/RES/66/290), the United Nations General Assembly (2012, p. 1) “agrees that human security is an approach to assist Member States in identifying and addressing widespread and cross-cutting challenges to the survival, livelihood and dignity of their people. Based on this, a common understanding on the notion of human security includes […] the right of people to live in freedom and dignity, free from poverty and despair. All individuals, in particular vulnerable people, are entitled to freedom from fear and freedom from want, with an equal opportunity to enjoy all their rights and fully develop their human potential.”
12 In the case of Darfur, the environmental aspects contributing to the crisis were desertification and drought, which forced the nations or peoples living there to move to other areas where their livestock could graze, resulting in ethnic clashes over land ownership or use. The climate dimension of the Arab revolts is the rise in commodity prices resulting from long droughts.

194 Economic Commission for Latin America and the Caribbean (ECLAC)
conflicts over basic resources such as food and water.13 They add that these effects are already occurring and are projected to increase in scope, scale and intensity over time (Coats, 2019). Inadequate adaptation in situ is part of the background to these judgments and has the potential to affect large populations seeking ex situ alternatives and to provoke situations of conflict with political or military security implications.
The World Economic Forum has also included climate change as a global risk in The Global Risks Report 2019 (WEF, 2019). The relationship between climate change and security is analysed in greater depth in United Nations (2009), which identifies five pathways by which climate change could affect security, all with inadequate adaptation as a backdrop:
(i) Vulnerability: climate change threatens food security and human health and increases the degree of human exposure to extreme events.
(ii) Development: if climate change slows or reverses development, vulnerability will increase and the ability of States to maintain stability may be undermined.
(iii) Reactions: migrations occur as a form of adaptation.(iv) Statelessness: the loss of the territory of a State and its status as
such and impairment of the rights of individuals.(v) International conflicts: these can arise if climate change undermines
shared or undelimited international resources, which can impact on international cooperation.
In United Nations (2009), climate change is perceived as a “threat multiplier” that exacerbates vulnerabilities arising from persistent poverty. It also increases the weakness of resource management and conflict resolution institutions. This view of climate change as a threat multiplier rather than a direct cause of conflict is widely accepted. From this point of view, the way climate change affects security risks (including violent conflicts) depends on the capacity of societies to cope with the changes, i.e. to adapt.
Existing vulnerabilities, governance structures and adaptive capacity are critical factors influencing the risks associated with the increased threats of climate change. The same phenomenon will have different impacts and
13 Extreme events are not synonymous with natural disasters. The term is used loosely, since an extreme event may lead to human disasters because of deficiencies of various kinds that prevent harm from being forestalled. These may be “hard” deficiencies, such as investment shortfalls, or “soft” deficiencies, as when a low value is set on populations at risk. Sometimes they are even the result of the financial strategies of local governments, which neglect to invest in prevention and concentrate on rehabilitation, which they expect to be paid for by other levels of government (or other governments, through international assistance) as part of the reaction to a humanitarian emergency. A negative incentive to externalize the cost of adaptation is that the likelihood of an extreme event is perceived to be low, which is an inducement to postpone prevention. Added to this is the perception that the political returns to prevention are lower than those to rehabilitation after an emergency.

The climate emergency in Latin America and the Caribbean... 195
consequences depending on the prevailing institutional and social conditions. Therefore, while it is not inevitable that climate change will affect security, it does increase the risk of insecurity (Mobjörk and others, 2016).
Human insecurity almost never has a single cause, but arises from the interaction of multiple factors. According to IPCC (2014a and 2014b), human security will be progressively threatened as the climate changes, since this jeopardizes livelihoods, culture and identity, triggers migratory movements and increases the risk of violent conflict (Adger and others, 2014).
In its analysis of security risks related to climate change, the Stockholm International Peace Research Institute (SIPRI) (Mobjörk and others, 2016) lists six thematic areas where climate change may pose security risks: (i) water security, (ii) food security, (iii) sea level rise and coastal degradation, (iv) extreme weather events and climate-related disasters, (v) climate-related migration and (vi) violent conflict. These security risks interact with one another (e.g. water scarcity can affect food security or trigger migration), so finding solutions to these threats requires an integrated approach.
(b) Priority areas of adaptation for food and water security
It has already been indicated that the region expects changes in the frequency and variability of heat waves, droughts and floods. Together with weak governance, these factors increase water and food insecurity, as they do throughout the world. This increases the risk of social unrest, migration and tension between countries. Latin America and the Caribbean has a high average availability of water resources, although they are distributed heterogeneously between the different countries. The areas of the region that may be most affected by water stress are Mexico, the Caribbean and Central America, as they will be drier. Andean cities will suffer from water stress and South America will be more exposed to flooding (ECLAC, 2018a). The Andean countries are cited as one of the areas of the world where the supply of drinking water is of greatest concern, owing to their dependence on glaciers and water from snow settling in the mountains. In the Andean region, the melting of glaciers and snow on mountains may generate tensions, social discontent and migratory and security risks. Increasing water scarcity will put agricultural production and power generation at risk, all of which could lead people to decide to leave their homes and migrate. The IPCC report argues that the region is particularly vulnerable because of its fragile ecosystem (Werz and Conley, 2012).
In this respect, adaptation concerns all the dimensions identified in the preceding sections and in the chapter on agriculture. For example, water deposits could be created where there used to be snow, and freshwater reserves could be built up from floods and hurricanes. Technologies for condensing atmospheric water in areas of human consumption stress, procedures for
196 Economic Commission for Latin America and the Caribbean (ECLAC)
recycling the water available and, in other cases, changes in priorities for the growth of human settlements in areas of unreliable water supply could also be implemented.
Reduced productivity could compromise food security in very poor areas that are highly dependent on agriculture, such as north-east Brazil, the Andean zones and Central America (especially the Dry Corridor). Increased food price volatility can have serious repercussions in import-dependent countries, and higher prices for staple foods can increase the risk of conflict (Mobjörk and others, 2016).
2. Some estimates for migration in Latin America and the Caribbean and its relation to climate change
The report of the Secretary-General mentioned above contains estimates of the number of people who could migrate as a result of climate change. Those estimates have a very wide range and are considered to be highly uncertain. Predictions of the number of people who may have to migrate by 2050 because of climate change and environmental degradation range from 50 million to 350 million.
According to the findings of a recent report by the World Bank (2018) on internal migration (Groundswell: Preparing for Internal Climate Migration), the impact of climate change on three densely populated regions of the world could result in more than 140 million people relocating within the borders of their countries by 2050.14 These regions include Mexico and Central America, for which three scenarios are proposed (a more optimistic one, a pessimistic one and one with inclusive development). Depending on the scenario, the number of migrants ranges from 200,000 to 3.9 million by 2050, with averages of between 1.4 million and 2.1 million. In the most pessimistic scenario (3.9 million by 2050), climate migrants represent about 1% of the population by 2050. Another finding of the study is that climate migrants’ share of total internal migration is projected to increase from between 6.3% and 8.9% in 2020 to between 8.5% and 12.6% in 2050.
(a) Insecurity associated with climate change policies
Different studies show that climate change mitigation and adaptation actions can increase vulnerability in certain populations. The IPCC report cited above mentions the importance of resource distribution in conflicts. According to this view, in circumstances where property rights and conflict management institutions are ineffective or illegitimate, climate mitigation or adaptation efforts that involve changing the distribution of access to resources have the potential to create and worsen conflicts.
14 The United Nations Development Programme (UNDP, 2009) estimates that internal migrants numbered 740 million worldwide at the start of the new millennium, three times the number of international migrants.

The climate emergency in Latin America and the Caribbean... 197
Specific case studies are also mentioned, such as the link between rising prices for certain foods and the expansion of land given over to biofuel production, or the difficulties that may arise in schemes to pay for environmental services (reducing emissions from deforestation and forest degradation in developing countries (REDD), for example). In certain circumstances, these factors have the potential to fuel conflicts over resources and property rights.
The issue of conflict and climate change is perhaps the most discussed in reflections on the subject. According to IPCC (2014a and 2014b), there is little consensus about a direct relationship between climate change and violent conflict, although there is agreement about the existence of indirect links (the cases of Darfur and the Arab Spring were mentioned at the beginning). As noted, climate change is recognized as a threat multiplier that exacerbates existing trends, tensions and instability (poverty, ethnic or religious divisions, competition for resources and weak institutions).
G. Closing reflections
With regard to Latin America and the Caribbean, and in relation to adaptation processes, Magrin (2015, p. 9) acknowledges that:
the countries of the region have made progress in incorporating environmental protection into decision-making, particularly when it comes to environmental institutions and legislation, but there are still difficulties in effectively incorporating environmental issues into relevant public policies. One of the main challenges of the climate agenda [...] will be to achieve linkage between climate policies and development, land use and sectoral policies.
There are now a number of laws associated with the climate issue, although actual implementation and monitoring are proving very difficult. In several countries there are marked contradictions between land use regulation policies and incentives to increase productivity.
And she adds:
The great process of change that the region is undergoing requires planned, consistent, non-contradictory policies and interventions in line with development objectives. It is important to attain a holistic view of the problem, taking advantage of capacities developed for other purposes (such as disaster risk management), connecting the climate issue with development actions and pursuing environmentally sound and well-planned land use. Thus, effective governments and institutions have a key role to play in facilitating planning and implementation and represent the main adaptation opportunity or constraint. Governments need to be adequately informed, assess the suitability of interventions and make their own decisions (in accordance

198 Economic Commission for Latin America and the Caribbean (ECLAC)
with the specific context of each particular situation), avoiding pressures and one-size-fits-all options for developing countries that generate resistance and distrust and retard actions. In all cases, it is important to study and properly understand the interactions and constraints of the climate change-development relationship, as government decisions and actions are often wide-ranging and take in more than one objective, including climate change (Magrin, 2015, p. 9).
Some issues of crucial importance from an adaptation point of view require policy decisions that go to the heart of how governments operate. For example, it would be desirable to transform regional information on the expected effects of climate change into mechanisms that change the incentives or rules governing investment. In this regard, it is worth noting the potential offered by the formalization of such information as a basis for public action, the adaptation of licensing processes and the impact evaluation associated with licensing, the updating of land use planning instruments and the inclusion of resilience standards applicable to the operation of critical infrastructure that serve to internalize the cost of keeping it operational at critical times. One of the advances in international negotiations has been to ensure that, alongside national efforts, relevant information and additional funds are made available to countries to accelerate adaptation to climate change.
Two extreme scenarios can be envisaged for adaptation to gradual climate change and combined in a variety of ways. On the one hand, adaptation may not prevent all the damage and losses that could be caused by the accumulation of changes, response deficiencies and limitations outlined above. On the other hand, adaptation may be taken as a mission that adequately and promptly anticipates threats and that successfully moderates risk and not only reduces vulnerability but goes further by investing in infrastructure and closing gaps derived from the old development style. Lastly, if climate change is not gradual and there are tipping points followed by sudden changes and self-reinforcing cycles, the adaptation measures discussed in this chapter will be clearly inadequate and the effects will be unavoidable.

The climate emergency in Latin America and the Caribbean... 199
Annex IV.A1 Adaptation projects in the countries of Latin America and the Caribbean15
1. Examples of adaptation projects
(a) Projects financed by the EUROCLIMA+ programme
• Regional and local climate risk management in Brazil and Argentina. This project seeks to contribute to climate resilience in the area of intervention, reducing the risk of disasters associated with floods and droughts, with emphasis on the vulnerable populations of the Intermunicipal Consortium of the Western Metropolitan Region of São Paulo (CIOESTE) in Brazil and the Argentine municipality of Córdoba. Setting out from modelling studies and cost analysis of climate threats, priority populations for intervention will be identified and plans for adaptation and management of the main climate threats will be implemented. The initiatives will involve these vulnerable populations in diagnosis, the search for solutions and publicization and training activities. The project is led by CIOESTE.
• Design and initial implementation of a drought information system for southern South America (SISA), which will provide governments, non-governmental and private institutions and individuals with monitoring, prediction, preparedness and impact mitigation tools and information. The participating countries are Argentina, Brazil, Chile, Paraguay, the Plurinational State of Bolivia and Uruguay. Drought information is complemented by improvements in regional institutional capabilities, planning and preparedness and the governance of risk management, and by reduction of the economic, social and environmental effects of drought on agricultural production, hydropower generation and river navigation in southern South America. The leading entity is the National Meteorological Service (SMN) of Argentina, representing the Regional Climate Centre for Southern South America (CRC-SAS).
• Binational project to reduce the vulnerability of people and livelihoods to the risks of drought and flooding in border territories of Ecuador and Peru. The objective of the project is to reduce the vulnerability of the Catamayo-Chira cross-border basin by strengthening public institutions in the area of risk management and by preparing the civilian border population. The project is strengthening binational institutions by implementing technical and legal tools to enable local governments along the border to
15 This annex is based on Magrin (2015).

200 Economic Commission for Latin America and the Caribbean (ECLAC)
improve governance and public policy in respect of disaster risk reduction in the event of drought and flooding. It also seeks to strengthen vulnerable border communities and prepare them for risk reduction in the face of natural phenomena (droughts, floods and forest fires). Another objective is to bring the flood early warning system into operation and equip it with widely available information technology at three sites that are particularly prone to flooding and drought in the Catamayo-Chira transboundary basin. The leading entity is the regional government of Piura (Peru). Its partners include the provincial government of Loja (Ecuador) and Ecuador’s National Risk and Emergency Management Service (formerly the National Secretariat for Risk Management), the province of Viterbo (Italy), the department of Meurthe and Moselle (France), the department of Aude (France) and the Observatory of Climate Change in Latin America (LOCAL) (France). The Spanish Agency for International Development Cooperation (AECID) is the executing agency.
• Strengthening of national and regional systems for monitoring and managing the risks of drought and floods in a context of climate change and desertification in the Andean countries. Its objective is to reduce the social and economic impact associated with flooding and drought by capacity-building and coordination of regional, national and local institutions involved in drought and flood risk management in the countries of western South America. The project is contributing to the creation of local information, early warning and drought and flood mitigation systems. Participants include the Bolivarian Republic of Venezuela, Chile, Colombia, Ecuador, Peru and the Plurinational State of Bolivia. It is led by the Ministry of People’s Power for the Environment and the National Institute of Meteorology and Hydrology (INAMEH) in the Bolivarian Republic of Venezuela; the Office of Meteorology, the National Irrigation Corporation, the National Forestry Corporation (CONAF) and the Department of Water (DGA) of the Ministry of Public Works (MOP) in Chile; the Institute of Hydrology, Meteorology and Environmental Studies (IDEAM) in Colombia; the Ministry of the Environment, the National Institute of Meteorology and Hydrology (INAMHI) and the Secretariat of Risk Management in Ecuador; the Ministry of the Environment, the National Meteorology and Hydrology Service (SENAMHI) and the National Centre for Disaster Risk Estimation, Prevention and Reduction (CENEPRED) in Peru; and the International Research Centre on El Niño (CIIFEN) in association with the National Meteorology and Hydrology Service (SENAMHI) of the Office of the Deputy Minister of Civil Defence in the Plurinational State of Bolivia. The executing agency of the project is the Spanish Agency for International Cooperation for Development (AECID).

The climate emergency in Latin America and the Caribbean... 201
• Information, governance and action for the reduction of drought risk in Peru and the Plurinational State of Bolivia in a climate change context. The project aims to increase the prevention capacity, preparedness and responsiveness to climate change of public bodies, social actors and populations in the Peruvian-Bolivian highlands through dialogue between national hydrometeorological services and users involved in the agricultural sector. The entity leading the project is the National Meteorology and Hydrology Service (SENAMHI) of the Plurinational State of Bolivia, associated with the National Meteorology and Hydrology Service (SENAMHI) of Peru, HELVETAS Swiss Intercooperation (programmes for Peru and the Plurinational State of Bolivia), Peru’s Centre for Disaster Studies and Prevention (PREDES) and other institutions of the Peruvian and Bolivian States. The executing agency is the Spanish Agency for International Development Cooperation (AECID).
• Capacity-building for flood and drought disaster risk reduction and promotion of resilience in Central America. The project has a regional and inclusive approach for the benefit of the Central American population. It aims to create and improve governance instruments for risk management and increased resilience in the face of flooding and drought in the Central American Integration System (SICA) region. It covers Belize, Costa Rica, the Dominican Republic, Guatemala, El Salvador, Honduras, Nicaragua and Panama. The lead entity is the Central American Commission on Environment and Development (CCAD), associated with the Coordination Centre for the Prevention of Natural Disasters in Central America (CEPREDENAC), the Regional Committee on Water Resources (CRRH) and the Global Water Partnership in Central America. The executing agency is the Spanish Agency for International Development Cooperation (AECID).
• Disaster risk reduction and adaptation to the effects of climate change against the dangers of floods and droughts in north-central Cuba affected by Hurricane Irma. The project is strengthening integrated management capacity for preparedness, response, prevention and adaptation to the risks of floods and droughts. It is inclusive and gender-sensitive. It strengthens the surveillance and monitoring system of the hydrometeorological early warning system for cases of drought and flooding. The aim is to promote the integration of disaster risk reduction and climate change adaptation agendas from the national to the local levels, working on the ground with a pilot of the early warning system and integrated water management model. The leading entity is the United Nations Development Programme (UNDP) and the project partners are the National Institute of Hydraulic Resources (INRH), the National Civil Defence Staff (EMNDC), the Institute
202 Economic Commission for Latin America and the Caribbean (ECLAC)
of Meteorology (INSMET), the National Hazard, Vulnerability and Risk Studies Group of the Environment Agency (AMA) and the Provincial Administration Councils (CAP) of the governments of Ciego de Ávila and Camagüey. The executing agency is the French Development Agency (AFD).
(b) Projects relating to ecosystem-based adaptation
• Agriculture and water resources in the Colombian, Ecuadorian and Peruvian Andes. This is a project targeting the Andean regions of Colombia, Ecuador and Peru (CIAT, 2014a and 2014b) and aimed at reducing the vulnerability of agriculture and water resources. Its objectives are: – To conserve and restore upper river basins in order to preserve
regulatory power (increase the time that water is retained in the soil and regulate runoff levels to avoid spates and increase return flows, thereby augmenting water volume in dry spells).
– To promote conservation agriculture in upper and middle basins (in order to improve the water retention capacity of the soil, decrease erosion and reduce contamination of water sources).
– To encourage traditional and customary practices in family agriculture, especially those that contribute to resilience (native varieties and species that are tolerant of climatic conditions), and management practices that do not affect the soil and favour crop rotation and good nutrient use. It is also proposed that consideration be given to agroforestry systems for some crops (e.g. maize, coffee and beans) in order to moderate temperature increases.
(i) Replacement of slash-and-burn agriculture in Central America: since 2000, FAO has been implementing special food security programmes with the Governments of Guatemala, Honduras, Nicaragua and El Salvador, among others. Practices, experiences and results in the subregion’s agroforestry systems are being shared and the traditional slash-and-burn system is being replaced, especially on slopes. Agroforestry systems are more efficient and resilient, as they reduce the land area needed to support a family, increase the variety of production, allow yields to be sustained over time, increase labour and capital productivity, reduce fertilization costs and boost the development of local markets (FAO, 2015).
• Cuba’s silvopastoral system: in Cuba, the silvopastoral system composed of Leucaena (at low density: 595 trees/ha) and Panicum maximum increases the availability and nutritional value of fodder in comparison with monoculture, and gains of more than 500 g per animal per day can be achieved without supplementation.

The climate emergency in Latin America and the Caribbean... 203
For milk production, a system involving a variety of grasses and herbaceous leguminous plants associated with Leucaena at high density (25,000 trees/ha) greatly increased the availability of dry matter and production in comparison with monoculture. Soil macrofauna and carbon sequestration have also been found to be significantly higher in silvopastoral systems (Milera, 2013).
• The Coffee and Subsistence Agriculture in Central America and Ecosystem-based Adaptation (CASCADA) project, led by Conservation International and CATIE with the collaboration of the Agricultural Research Centre for International Development (CIRAD) and Bioversity International, aimed at adaptation of smallholder production systems to climate change and capacity-building in communities in Costa Rica, Honduras and Guatemala. See [online] http://www.conservation.org/projects/Pages/sobre-cascada.aspx.
• The EcoAdapt project for research and action in three model forests (Jujuy in Argentina, Chiquitano in the Plurinational State of Bolivia and Araucarias de Alto Malleco in Chile) to ensure that water management contributes to local development and reduces the vulnerability of populations to climate change. The project is based on capacity-building, knowledge sharing, conflict prevention and mitigation and the promotion of joint work with key local and national actors.
• CRISTAL (Community-based Risk Screening Tool – Adaptation and Livelihoods) is an assessment tool to help project planners and managers integrate risk reduction and climate change adaptation into community projects. It has been applied in Costa Rica, the Dominican Republic, Ecuador, Guatemala, Haiti, Honduras, Nicaragua, Peru and the Plurinational State of Bolivia. According to users, the tool helps local communities to identify climate- and gender-related adaptation measures that respect local and cultural traditions. See [online] http://www.iisd.org/cristaltool.
• The Climate Vulnerability and Capacity Analysis (CVCA) methodology, developed by CARE International, analyses vulnerability to climate change and community resilience. It combines community knowledge with scientific information for a better understanding of the local impact of climate change. This methodology is used in CARE Case Study: Application of Climate Vulnerability and Capacity Assessment (CVCA) Methodology in Ecuador, Peru and Bolivia: Regional Project for Adaptation to the Impact of Rapid Glacier Retreat in the Tropical Andes (PRAA). See [online] https://insights.careinternational.org.uk/media/k2/attachments/PRAA_CVCA_CS_0611-FINAL.pdf.

204 Economic Commission for Latin America and the Caribbean (ECLAC)
• The Action Plan for the Prevention and Control of Deforestation in the Legal Amazon and its policies to control illegal deforestation, and establishment and reinforcement of protected areas. By 2015, protected areas (indigenous territories, strictly protected areas and sustainably managed areas) covered 54% of the remaining forest in the Amazon (Soares-Filho and others, 2010). Deforestation rates, which had reached one of their highest levels in 2004 (27,772 km2), then fell back slowly to 4,571 km2 in 2012 and 5,891 km2 in 2013. The expansion of the protected area network is a conservation paradigm centred on maintaining biodiversity and leaving large blocks of forest that act as “green barriers” to deforestation. These areas also serve to sustain traditional livelihoods and maintain climate-vegetation balance and hydrological regimes, as well as helping to prevent forest fires. Prompt financial support is needed to expand the model and thus continue to provide protection to regions under immediate threat. Conservation initiatives aimed at private landowners are also required, such as:
(i) Development of agricultural and forestry markets in a way that takes account of environmental and social conditions;
(ii) Land use planning to prevent the expansion of agribusiness and cattle ranching;
(iii) Strengthened monitoring and capacity-building in government agencies;
(iv) Economic and technical incentives for compliance with the country’s forest code (Soares-Filho and others, 2010).
The Ibero-American Programme on Science and Technology for Development (CYTED) has implemented several projects in the area of sustainable development, global change and ecosystems through EbA and payment for ecosystem services (see table IV.A1.1).
Table IV.A1.1 Projects of the Ibero-American Programme of Science and Technology
for Development (CYTED): sustainable development, global change and ecosystems, 2014–2016
Project Aim CountriesIbero-American Network of Bioeconomy and Climate Change (REBICAMCLI) (2015)
To model the effects of climate change on food production and propose adaptation measures that will increase local, regional and global food security.
Colombia, Costa Rica, Cuba, Honduras, Mexico, Spain
VESPLAN (Vulnerability, Ecosystem Services and Rural Land Use Planning) network (2016)
To contribute to the sharing of experiences on the comprehensive assessment of ecosystem services, including quantification, modelling, valuation and mapping, and their vulnerability.
Argentina, Brazil, Chile, Colombia, Guatemala, Mexico, Paraguay, Spain

The climate emergency in Latin America and the Caribbean... 205
Project Aim CountriesCYTED network for monitoring the state of conservation and recovery of humid and dry forests in Latin America in the context of deforestation avoided (IBERO_REDD+) (2015)
To encourage cooperation among specialists with a view to sharing experiences and transferring knowledge on the conservation and recovery of Ibero-American humid and dry forests as a tool for carbon capture in the context of the World Bank Forest Carbon Partnership Facility (FCPF), the United Nations REDD+ programme (reducing emissions from deforestation and forest degradation and the role of conservation, sustainable management of forests and enhancement of forest carbon stocks in developing countries) and other related programmes.
Colombia, Costa Rica, Ecuador, Mexico, Nicaragua, Panama, Paraguay, Spain
Ibero-American Biodiversity Information Infrastructure (I3B) (2015)
To strengthen the region’s ability to study its biodiversity and to conserve and manage the environment through online access to biodiversity information.
Argentina, Brazil, Chile, Colombia, Costa Rica, Cuba, Ecuador, Spain, Mexico, Nicaragua, Uruguay, Venezuela (Bolivarian Republic of)
Sustainability and Resilience of Coupled Human and Natural Systems in Major Cases in South America
To develop scientific knowledge of the mechanisms involved in coupled natural and human systems that help determine the long-term sustainability of ecosystem services.
Argentina, Bolivia (Plurinational State of), Brazil, Canada, Chile, Netherlands, Spain, Sweden, United States, Uruguay
Development of methodologies, environmental indicators and programmes for comprehensive environmental assessment and restoration of degraded ecosystems (RESECODE) (2014)
To develop new methodological tools, innovative environmental management experiences and relevant scientific knowledge for the comprehensive assessment, monitoring and restoration of degraded ecosystems; to homogenize the level of knowledge of degraded ecosystems and standardize assessment and analysis criteria in order to facilitate comparison between functionally different ecosystems; to transfer the results to the productive sector, management bodies, governments and regional organizations in order to improve policies, strategies, methodologies and programmes aimed at the improvement and sustainable use of the goods and services provided by these ecosystems to human systems.
Argentina, Brazil, Chile, Colombia, Costa Rica, Cuba, Ecuador, Guatemala, Panama, Portugal, Spain, Uruguay, Venezuela (Bolivarian Republic of)
Ibero-American Network of Agroecology for the Development of Agricultural Systems Resilient to Climate Change (REDAGRES) (2015)
To promote the sharing of scientific knowledge related to the area of agroecology, climate change and resilience, train a critical mass of professionals and technicians and open lines of research and outreach at research institutes and universities.
Argentina, Brazil, Chile, Colombia, Cuba, Mexico, Peru, Spain
Network on Climate Change Adaptation and Ecosystems as an Adaptation Strategy (RACC) (2014)
To form a climate change adaptation network that contributes to the understanding and management of ecosystems as an adaptation strategy in the Latin America region, which is particularly sensitive to the effects of climate change.
Argentina, Chile, Colombia, Nicaragua, Panama, Peru
Source: Ibero-American Programme on Science and Technology for Development.
Table IV.A1.1 (concluded)

206 Economic Commission for Latin America and the Caribbean (ECLAC)
(c) Examples of environmental services payment projects
The Payment for Environmental Services Programme of Costa Rica’s National Forestry Financing Fund (FONAFIFO) was established in 1997 and is the oldest in Latin America and the Caribbean. Producers receive payments for specific land uses, including natural forests, natural regeneration areas and forest plantations. They must register a sustainable forest management plan and sign a contract with FONAFIFO. Payments are received annually, subject to verification of compliance with the plan, and contracts are for five years, with the option of renewal for a further period. The payment amounts are set annually. Generally, adjustments are made for inflation over the previous year’s amounts (Magrin, 2015). Payment for ecosystem services is recognized by area and number of trees, depending on the scheme, and the 2019 contract amounts were as follows:16
• Reforestation with fast-growth species: 699,024 colones per hectare, distributed over the first 5 years and with contracts lasting 10 years,17 from 1 to 300 ha, with the species Gmelina arborea, Acacia mangium, Vochysia guatemalensis and Vochysia hondurensis.
• Reforestation with medium-growth species: 788,166 colones per hectare, distributed over the first 5 years and with contracts lasting 16 years, from 1 to 300 ha, with the species Tectona grandis, Pinus sp., Cordia alliodora, Vochysia ferruginea, Eucalyptus sp. and Cedrela odorata.
• Forestry plantations with short rotation periods: 376,100 colones per hectare, distributed over the first four years. Contract duration: six years, from 1 to 300 ha.
• Agroforestry systems: 968 colones per tree, distributed over the first five years of the contract. From 350 to 10,000 trees.
• Mixed agroforestry systems for small producers: 35,435 colones per hectare per year (forest protection); 22,700 colones per hectare per year (natural regeneration); 57,392 colones for every 200 trees per year, distributed over the five years of the contract.
• Forest protection: 354,350 colones, distributed over the five years of the contract, from 2 to 300 ha.
• Natural regeneration: 113,503 colones per hectare, distributed over the five years of the contract, from 2 to 300 ha.
• Post-harvest protection: 138,420 colones per hectare, distributed over the five years of the contract, from 2 to 300 ha.
Global Environment Facility (GEF) project carried out by CATIE, FAO, the Nitlapan Research and Development Institute in Nicaragua, CIPAV in
16 See National Forest Office, “Monto por modalidad”, 2018 [online] https://onfcr.org/monto- por-modalidad/.
17 At the time of writing, the exchange rate was 578.84 colones to the dollar.

The climate emergency in Latin America and the Caribbean... 207
Colombia and the World Bank between 2003 and 2006. The effects of payment for environmental services on the adoption of silvopastoral systems were evaluated. Livestock farmers in Colombia, Costa Rica and Nicaragua received between US$ 2,000 and US$ 2,400 per farm (about 10% to 15% of their net income) to implement the silvopastoral systems programme. This programme led to a 60% reduction in degraded pastures in the three countries, while the area given over to silvopastoral systems increased significantly. The benefits associated with the project included increases of 71% in carbon sequestration, 10% in milk production and 115% in farm income. Meanwhile, the use of herbicides was reduced by 60% and the use of fire to manage pastures became less frequent (FAO, 2015; Magrin, 2015).
The Regional Gateway for Technology Transfer and Climate Change Action in Latin America and the Caribbean (REGATTA) carried out four projects in Central America (Costa Rica, Guatemala, El Salvador, Honduras, Nicaragua and Panama), the Caribbean (Antigua and Barbuda, Dominica and Haiti), the Andes (Colombia, Ecuador and Peru) and the Gran Chaco (Argentina, Paraguay and the Plurinational State of Bolivia).
(d) Adaptation plans in the countries of Latin America and the Caribbean
ArgentinaArgentina has adaptation measures designed for forests, water, crop
management, health, biodiversity conservation and extreme events. It is expected that both the National Mitigation Plan and the National Adaptation Plan will be finalized in 2019, forming the National Climate Change Response Plan. The Federal Commitment on Climate Change was signed in 2017. This instrument adds 22 jurisdictions and sets out 182 provincial mitigation and adaptation measures. In addition, as of 2019 it has received a donation of US$ 2,992,042 from the Readiness Programme for the preparation of the National Adaptation Plan.
National Action Plan for Forests and Climate Change, 2017. See [online] https://www.argentina.gob.ar/ambiente/sustentabilidad/planes-sectoriales.
Bolivarian Republic of VenezuelaThe Bolivarian Republic of Venezuela has given national priority to
adapting to the adverse effects of climate change. It is planning measures and actions in the following areas: electricity, industry, housing, transport, health, popular participation and organization, biological diversity, food sovereignty and sustainable agriculture, water conservation and management, conservation and sustainable management of forests, research, monitoring and systematic observation, education and culture, waste management, land use planning, and risk, emergency and disaster management. It is encouraging the development of municipal and local adaptation plans

208 Economic Commission for Latin America and the Caribbean (ECLAC)
for risk management that involve shared responsibility between the State and the People’s Power through eco-socialist technical committees, so that actions aimed at adapting to climate change, with a gender and vulnerable populations perspective, can be applied locally.
BrazilBrazil has an NDC for adaptation, but it does not specify the sectors
where actions will be prioritized. The Brazilian NDC presented in Paris was announced in a decree that subdivides it into different thematic areas: adaptation, risk management and resilience; forests, biodiversity, agriculture and fisheries; energy; transport; industry; cities and waste; defence and security; science, technology and innovation; and long-term vision. It also envisages a Biodiversity and Climate Protection in the Mata Atlântica project contributing to the conservation of biodiversity, the reduction of greenhouse gas emissions and climate change adaptation in that biome. Work is being done with local communities to include small landowners in an environmental land registry. Attempts are being made to unlock forest finance in order to mobilize large-scale public-private financing through innovative funding mechanisms that promote the conservation and sustainable use of forests as natural capital, a resource for adaptation to climate change and a source of development. Its AdaptaClima platform is a collaborative portal to systematize and share initiatives on climate change adaptation through increased access to knowledge and coordination of the actors involved with this agenda in Brazil.
(i) National Policy on Climate Change (2009-2020). Includes adaptation policies. See [online] https://www.mma.gov.br/clima/politica-nacional-sobre-mudanca-do-clima.
(ii) Health Sector Plan for Climate Change Mitigation and Adaptation (instrument of the National Policy on Climate Change, 2013 to 2020). See [online] https://www.mma.gov.br/images/arquivo/80076/Saude.pdf.
(iii) Action Plan for the Prevention and Control of Deforestation in the Legal Amazon, 2016. See [online] http://combateaodesmatamento.mma.gov.br/images/conteudo/Planos_ultima_fase.pdf.
(iv) Sectoral Plan for Climate Change Mitigation and Adaptation for the Consolidation of a Low Carbon Emissions Economy in Agriculture (instrument of the National Policy on Climate Change, 2016 to 2020). See [online] https://www.mma.gov.br/images/arquivo/80076/Plano_ABC_VERSAO_FINAL_13jan2012.pdf.
(v) Urban Transport and Mobility Plan (includes adaptation), 2011. See [online] https://www.mma.gov.br/images/consultasclima/ 3-mineracao.pdf.

The climate emergency in Latin America and the Caribbean... 209
ChileChile has an adaptation NDC aimed at increasing resilience in the
country, with sector-specific adaptation plans that have been developed separately. The NDC envisages a specific contribution from forestry and land use change, centring on the sustainable management and recovery of 100,000 ha of mainly native forest and the afforestation of 100,000 ha, mostly with native species, providing mitigation and adaptation benefits. Chile has developed a National Climate Change Adaptation Plan as well as sectoral plans in the forestry, agriculture, biodiversity, fisheries and aquaculture, health, infrastructure, and cities and energy sectors. In 2008, it prepared a Plan for Adaptation to Climate Change in the Forestry and Agriculture Sector. In farming, this involves 12 institutions of the Ministry of Agriculture and presents 21 adaptation measures in the agriculture and forestry sectors.
At the local level, there is the Chilean Network of Municipalities Coping with Climate Change and adaptation actions sponsored by Adapt Chile, a specialized non-governmental organization (NGO), which has access to international cooperation funds. The network is made up of 45 municipalities and is open to any other Chilean municipality that wishes to commit to planning and managing its territory. With its help, municipal climate profiles are being prepared, compiling information with a view to gaining a better understanding of the negative effects that climate change produces locally, and so are local climate change plans to serve as internal planning tools of the municipalities, being designed to integrate and implement climate change adaptation in local management. The network has funding of US$ 9,960,000 from the Climate Change Adaptation Fund, implemented by the Ministry of the Environment, the Ministry of Agriculture and the regional government (intendencia). For cities it has developed the Cities Fit for Climate Change project to support municipal governments in adapting their development plans to climate change. Another example is EcoLogística, a project that promotes low-carbon urban freight transport policies and practices.
(i) Infrastructure Services Climate Change Adaptation and Mitigation Plan, 2017–2022.
(ii) Climate Change Adaptation Plan for Cities, 2017–2022.(iii) Climate Change Adaptation Plan for the Energy Sector, 2017−2022.(iv) National Climate Change Adaptation Plan for the Health Sector,
2018, see [online] https://www.minsal.cl/minsal-presento-el-plan-nacional-de-adaptacion-al-cambio-climatico-del-sector-salud/.
(v) National Strategy for Climate Change and Plant Resources 2017–2025, see [online] https://www.enccrv-chile.cl/index.php/descargas/publicaciones/87-enccrv-2017-2025-v2/file.

210 Economic Commission for Latin America and the Caribbean (ECLAC)
ColombiaColombia has an adaptation NDC focused on the same sectors as in
the area of mitigation. Colombia has adopted comprehensive climate change plans to address climate change in its territories. These plans set out from vulnerability analysis and an inventory of regional greenhouse gases to identify, evaluate and recommend measures and actions for greenhouse gas emissions mitigation and adaptation so that they can be implemented by public and private entities on the ground. To date, 13 departmental plans have been formulated and are being implemented (Atlántico, Cauca, Cesar, Cundinamarca, Choco, Huila, Magdalena, Quindio, Santander, Arauca, Casanare, Vichada and Meta).
(i) National Climate Change Policy, 2017, see [online] https://redjusticiaambientalcolombia.files.wordpress.com/2018/01/politica-crisis-climatica-colombia-2017.pdf.
(ii) Programme to Integrate Agriculture into National Adaptation Plans (involving other countries), 2017, see [online] http://www.co.undp.org/content/colombia/es/home/presscenter/articles/2017/08/11/se-lanza-el-programa-de-integraci-n-de-la-agricultura-en-los-planes-de-adaptaci-n-nacional-nap-ag.html.
(iii) Climate Change Management Plan for Colombian Seaports, 2017, see [online] http://www.minambiente.gov.co/index.php/component/content/article/476-plantilla-cambio-climatico-%2032#documentos.
(iv) Agreement to develop and implement a Strategic Agenda for Disaster Management in the Transport Sector, as established in the National Disaster Risk Management Plan, 2018, see [online] http://portal.gestiondelriesgo.gov.co/Documents/PNGRD/AES_Sector_Transporte_20-03-2018.pdf.
Costa RicaCosta Rica has an adaptation NDC centred on the development of a
National Adaptation Plan that covers disaster risk reduction, community-based adaptation, ecosystem-based adaptation, local planning and management for territorial adaptation, public infrastructure adaptation, environmental health, capacity-building, technology transfer and financing for adaptation. The process of formulating the National Adaptation Plan was initiated in 2017 with the assistance of the Spanish Agency for International Development Cooperation (AECID).
The National Climate Change Adaptation Policy of Costa Rica 2018–2030 includes six sectors: water, biodiversity and forests, agriculture and fishing, tourism, health and infrastructure, see [online] http://www.pgrweb.go.cr/DocsDescargar/Normas/No%20DE-41091/Version1/Politica_ADAPTACION_24_abril.pdf; https://www.iucn.org/es/news/mexico-central-america-and-caribbean/201810/el-plan-nacional-de-adaptacion-de-costa-rica-se-construye-incorporando-el-enfoque-de-adaptacion-basada-en-ecosistemas.

The climate emergency in Latin America and the Caribbean... 211
CubaCuba’s priority is adaptation, and mitigation is seen as part of a
commitment to international solidarity and as an opportunity for the country’s development. Adaptation and mitigation measures are present in new legislation, namely Law No. 124 on Inland Waters, adopted in 2017. It establishes a framework of standards relating to the resilience of the country’s inland waters and adaptation to climate change, which is named as a central objective. There are also important national and international projects, such as one to reduce vulnerability to coastal flooding through ecosystem-based adaptation. With resources from the adaptation fund, this project aims to reduce the vulnerability of communities in the coastal areas of Artemisa and Mayabeque, provinces in southern Cuba that are highly sensitive to climate change. The country has also developed a programme of communication, education and public awareness on climate change and hazard, vulnerability and risk studies in response to the need to foster a culture associated with this issue, its consequences and adaptation measures. Various organizations and associations, representing large sectors of Cuban society, are involved in the development of the programme.
(i) National Economic and Social Development Plan to 2030: Proposed Vision for the Nation, Priorities and Strategic Sectors, including agriculture, 2016.
(ii) State Plan to Address Climate Change (Project Life), which includes protection for people living in coastal zones and adaptation of agriculture to meteorological variables, 2017, see [online] http://repositorio.geotech.cu/jspui/bitstream/1234/1513/1/05%20Plan%20de%20Estado%20para%20el%20Enfrentamiento%20al%20Cambio%20Climático%20”Tarea%20Vida”.pdf.
(iii) Document entitled Conceptualización del modelo económico y social cubano de desarrollo socialista, 2016, see [online] http://www.granma.cu/file/pdf/gaceta/Conceptualizaci%C3%B3n%20del%20modelo%20economico%20social%20Version%20Final.pdf.
Dominican RepublicNational Strategy for Adaptation to Climate Change in the Agricultural
Sector of the Dominican Republic, 2014–2020.
EcuadorEcuador has an adaptation NDC centred on agriculture and other
land uses, water, ecosystems, risk and capacity-building. Through the project Strengthening Community Resilience to the Adverse Effects of Climate Change with an Emphasis on Food Security and Gender Considerations (FORECCSA), policies are being implemented to enable populations to develop their adaptive capacities (access to water, food sovereignty). A bottom-up approach is applied. At the territorial level, climate change is
212 Economic Commission for Latin America and the Caribbean (ECLAC)
being managed in the working groups of REDD+, the citizen participation council. In communities, it is being managed through the community-based adaptation approach.
National Climate Change Adaptation Plan, 2019, centred on the sectoral and local scale. The six priority sectors for adaptation in the country are: (i) natural assets, (ii) water assets, (iii) health, (iv) human settlements, (v) productive and strategic sectors and (vi) food sovereignty, agriculture, livestock, aquaculture and fisheries. See [online] http://www.ec.undp.org/content/ecuador/es/home/presscenter/articles/2019/plan-nacional-de-adaptacion--una-respuesta-para-reducir-los-efec.html; http://www.ambiente.gob.ec/inicia-fase-de-socializacion-del-plan-nacional-de-adaptacion-al-cambio-climatico/.
El SalvadorThe formulation of the Initial Plan for Adaptation to Climate Change
in the San Salvador Metropolitan Area was developed with the support of UNDP and the Ministry of the Environment and Natural Resources. As a follow-up to this, workshops were held with municipal, central government and civil society specialists, followed by an open online consultation with the main objective of formulating adaptation measures. The Council of Mayors and the Planning Office of the San Salvador Metropolitan Area (OPAMSS) are interested in promoting the adaptation measures of the San Salvador Metropolitan Area.
National Plan for Climate Change and Agroclimatic Risk Management for the Agriculture, Forestry, Fisheries and Aquaculture Sector, 2017. See [online] http://centa.gob.sv/docs/unidad%20ambiental/Plan%20Nacional%20de%20Cambio%20Climático.pdf.
GuatemalaGuatemala has an NDC geared towards reducing vulnerability across
the board and improving adaptation processes in key sectors by strengthening adaptation in areas related to human health, marine-coastal zones, agriculture, livestock and food security, forest resources, protected areas, the conservation and management of strategic ecosystems, infrastructure, integrated water resource management, the quality of productive infrastructure, soil protection and comprehensive disaster risk reduction management. Guatemala has a Framework Law to Regulate Vulnerability Reduction, Mandatory Adaptation to the Effects of Climate Change and Greenhouse Gas Mitigation (Congressional Decree No. 7-2013), a National Climate Change Policy and a National Climate Change Action Plan. The country is promoting the Latin American Network of Territories, Municipalities and Cities against Climate Change, in which several municipalities participate jointly in the form of an association. It
The climate emergency in Latin America and the Caribbean... 213
focuses on a model of climate adaptation through municipal development councils in the east of the country. Its Gender Environmental Policy treats gender as mainly linked to climate change adaptation.
(i) The National Climate Change Action Plan, which includes the areas of human health, marine and coastal zones, agriculture, livestock and food security, forests, ecosystems and protected areas, water resource management and infrastructure. It also includes five strategic sectors: energy, industrial processes, agriculture, land use, land use change and forestry, and waste, 2016, see [online] https://www.segeplan.gob.gt/nportal/index.php/sala-de-prensa/731-guatemala-cuenta-con-plan-de-accion-nacional-de-cambio-climatico.
(ii) Plan for Reducing Vulnerability to Climate Change in the Coastal Marine Zone, 2018.
HondurasThe NDC treats adaptation to climate change as a priority to reduce
the country’s vulnerability. The priority sectors are water resources, risk management, agriculture and food security, forests and biodiversity, marine coastal systems, human health and infrastructure. At the territorial level, the Honduras Component of the Urban Adaptation to Climate Change in Central America Programme was developed by the Ministry of Foreign Affairs, the German Development Bank (KfW) and the Central District Municipal Mayor’s Office. The programme includes vulnerable neighbourhoods and settlements in the Central District of Tegucigalpa and Comayagüela. The Presidential Office for Climate Change and the Honduran Coffee Institute (IHCAFE) are working on restoration of 250,000 ha of conventional coffee using multi-layer agroforestry systems with native species. Ecosystem-based adaptation practices are being incorporated in buffer zones around protected areas occupied by coffee plantations. Efforts are likewise being made to reduce greenhouse gas emissions from the coffee sector, which is the most productive and socially important sector in the country, in order to contribute to the goal set by the NDC of restoring 1 million productive hectares. One of the initiatives of the Secretariat of Natural Resources and Environment (MiAmbiente+), Climat and IHCAFE is aimed at increasing the energy efficiency of the coffee processing and value added process.
(i) Road map (NDC Partnership action plan), which includes adaptation measures, 2018, see [online] http://ndcpartnership.org/news/honduras-lanza-el-primer-plan-de-acción-climática-del-ndc-partnership.
(ii) Municipal Climate Change Adaptation Plans for Santa Rita and Cabañas, 2018, see [online] http://www.resilientcentralamerica.org/mejoran-produccion-de-cafe-y-frijol-entre-un-17-y-23-gracias-a-estrategias-de-adaptacion-al-cambio-climatico/.
214 Economic Commission for Latin America and the Caribbean (ECLAC)
MexicoMexico is prioritizing actions to protect communities from climate
change and to increase the resilience of infrastructure and the ecosystems that are home to the country’s biodiversity. The adaptation priorities are the social sector, ecosystem-based adaptation, strategic infrastructure and productive systems. In view of Mexico’s vulnerability to climate effects, its Climate Change Act places great emphasis on adaptation measures.
National Climate Change Strategy Vision 10-20-40, which includes a chapter on adaptation in areas such as the social sector, strategic infrastructure, productive systems and the environment, 2013. See [online] https://www.gob.mx/cms/uploads/attachment/file/41978/Estrategia-Nacional-Cambio-Climatico-2013.pdf.
NicaraguaNicaragua has a National Climate Change Mitigation and Adaptation
Policy, and its NDC is a synthesis of its policy. Both the policy and the NDC were formulated within the framework of a model of partnerships, dialogue and consensus with the different production sectors: Nicaragua’s Superior Council of Private Enterprise (COSEP), municipal governments, the productive sector and universities and government entities, during 2017–2018. The country recognizes that it requires financial support to implement priority adaptation measures in the areas of infrastructure, health, forests, agriculture, water and sanitation, disaster risk management, early warning systems, resilient ecosystem management and sustainable use and management of protected areas. The country has identified 13 priority actions in the framework of climate change adaptation.
National Forests and Climate Change Strategy to Address Poverty in Nicaragua, 2017, see [online] https://plataformacelac.org/politica/481.
PanamaBetween 2009 and 2011, the Integration of Climate Change Adaptation
and Mitigation Measures in the Management of Natural Resources in Two Priority Watersheds of Panama Programme was implemented, financed by the Millennium Development Goals Fund (MDG-F) and executed by four Panamanian State institutions (the National Environment Authority (ANAM), the Ministry of Agricultural Development (MIDA), the Ministry of Health (MINSA) and the National Civil Protection System (SINAPROC)), together with four United Nations agencies (UNDP, the United Nations Environment Programme (UNEP), FAO and the Pan American Health Organization (PAHO)). The basins prioritized were those of the Chucunaque and Tabasará rivers. The main objective was to increase climate change adaptation and mitigation capacity to contribute to poverty reduction and environmental sustainability for the population in the implementation area. A National Adaptation Fund

The climate emergency in Latin America and the Caribbean... 215
was established under Law No. 8 of 2015 and became operational in 2017 to invest in the 10 most vulnerable districts. Another project, the Productive Investment for Climate Change Adaptation Initiative (CAMBio II), which is also being implemented in Panama and six other countries, has been allocated US$ 28 million.
National Biodiversity Strategy and Action Plan (EPANB) 2018-2050, 2018. See [online] https://www.cbd.int/doc/world/pa/pa-nbsap-v2-es.pdf.
ParaguayParaguay’s adaptation NDC prioritizes water resources, forests,
agriculture and livestock, energy, infrastructure, health and sanitation, risk and natural disaster management and early warning systems. The National Climate Change Act (2017) established the regulatory framework for mitigation and adaptation and created the National Climate Change Commission, the National Directorate for Climate Change and the Climate Change Fund. In addition, Paraguay already had 11 sets of regulations on issues related to the energy sector, institutional arrangements, forests, REDD+ and land use change.
Paraguay has plans and strategies that can serve as a regulatory framework for climate-related issues. At the national level, adaptation is a priority established in the National Development Plan 2014–2030. On that basis, the National Plan for Adaptation to Climate Change was approved in October 2016 and the National Strategy for Adaptation to Climate Change (2015) was drawn up. At the sectoral level, the National Plan for Disaster Risk Management and Adaptation to Climate Change in the Paraguayan Agricultural Sector has been implemented, a vulnerability analysis has been conducted and action plans have been developed for the agriculture, livestock, health and water resources sectors.
As part of the National Plan for Adaptation to Climate Change, guides to the preparation of local and sectoral adaptation plans are being generated in a participatory manner. Working through the National Directorate for Climate Change, the Ministry of the Environment (SEAM) has trained over 3,000 people in 10 departments so that they can advise key actors on the preparation of local adaptation plans.
The National Plan for Adaptation to Climate Change of 2016 includes the sectors of agricultural production and food security, water resources, risk management and reduction, infrastructure, transport and energy, health and epidemiology, environment, forests and fragile ecosystems, regulatory and legal aspects, education and dissemination. See [online] http://archivo.seam.gov.py/sites/default/files/users/comunicacion/Plan%20Nacional%20de%20Adaptaci%c3%b3n%20al%20Cambio%20Clim%c3%a1tico%20%202017.pdf; http://dncc.seam.gov.py/adaptacion/plan-nacional-de-adaptacion.
216 Economic Commission for Latin America and the Caribbean (ECLAC)
PeruIn its adaptation NDC, Peru notes that priority is being given to the
water, agriculture, fisheries, forestry and health sectors in order to reduce vulnerability to climate change.
Sectoral work has been carried out in the framework of the Multisectoral Working Group for the Implementation of NDCs, where “tentative schedules” or work plans have been developed with a view to implementing actions derived from NDCs in the sectors requiring mitigation (energy, transport, industry, waste, forests) and adaptation (forests, health, agriculture, water, fisheries and aquaculture).
Technical assistance for climate change management, including capacity-building activities, is being provided through the General Directorate for Climate Change and Desertification of the Ministry of the Environment (MINAM). Since 2014, these activities have been part of the National Climate Change Training Plan (PNCCC) 2013-2017. This plan is aimed at public officials and regional technical groups and addresses adaptation issues such as ecosystem and natural resource management, climate risk management, soil and water management and technology management. International cooperation projects have also contributed to capacity-building, as they provide financial support and promote initiatives, seeking to link up with national planning instruments.
At the local level, the technological adaptation measures promoted by the Climate Change Adaptation Programme (PACC) have been implemented and are having an impact on communities. They are supporting adaptation to climate change in two micro-basins: Huacrahuacho, in Cusco, and Mollebamba, in Apurímac.
National Climate Change Adaptation Plan and NDCs. For 2019, priority has been given to disseminating the NDCs and linking them to the Regional Climate Change Strategies (ERCC), 2019 (discussion of the conceptual model and the road map). The priority sectors are: water, agriculture, health, fisheries, aquaculture and forests. See [online] http://ledslac.org/es/2019/04/dialogo-regional-para-la-elaboracion-del-plan-nacional-de-adaptacion-nap-del-peru/; https://www.gob.pe/institucion/minam/noticias/25651-avanza-construccion-del-plan-nacional-de-adaptacion-frente-al-cambio-climatico.
Plurinational State of BoliviaThe NDC was created in the framework of a National Development Plan
that gives equal importance to adaptation, mitigation and risk management and treats territorial linkage as crucial. In the forest sector, the Plurinational State of Bolivia has been developing the Joint Mitigation and Adaptation Mechanism for the Comprehensive and Sustainable Management of Forests and Mother Earth, an alternative to the REDD+ approach designed for the

The climate emergency in Latin America and the Caribbean... 217
comprehensive management and sustainable use of the forests and life systems of Mother Earth, conservation, protection and restoration of biodiversity life systems, and environmental functions through the development of sustainable production systems, including agricultural systems.
The sectors for implementing the Living Well Adaptation Mechanism are listed below:
(i) Programme of Life Systems Resilience for Food Security with Sovereignty.
(ii) Programme for the Prevention and Reduction of Risk from the Impact of Climate Change.
(iii) Comprehensive Water Management Programme, as part of the 2016-2020 Economic and Social Development Plan, see [online] https://www.mmaya.gob.bo/wp-content/uploads/2019/06/ANTEPROYECTO_POA-PPTTO_2019_5-9-181.pdf.
(iv) Education and health programmes related to climate change.(v) Joint Mitigation and Adaptation Mechanism for the Comprehensive
and Sustainable Management of Forests and Mother Earth, as part of the 2016-2020 Economic and Social Development Plan, see [online] http://www.madretierra.gob.bo/index.php/direcciones/mecanismo-de-adaptacion.
UruguayUruguay has established its main priorities, implementation and
support needs, plans and measures for adaptation to the adverse effects of climate change. Its NDC centres on the issues of social vulnerability, health, disaster risk reduction, cities, infrastructure and land use planning, biodiversity and ecosystems, coastal zones, water resources, agriculture, energy, tourism, and climate services.
Uruguay has its National Climate Change Adaptation Plan for Cities, which is supported by the Green Climate Fund and UNDP and is intended to meet the needs of adaptation and resilience to climate change in urban centres, protect their infrastructure and environments, and facilitate their integration into policies, programmes and activities. The plan will be implemented in a participatory manner, involving local actors and seeking to build capacity in communities. It addresses the main shortcomings in climate change adaptation in cities and in local government planning and budgets. At the municipal level, a Municipal Climate Change Adaptation Plan has been developed for the departments of Rivera and Tacuarembó. The plan was presented in 2019 and will be implemented by the municipal government (intendencia) of the Rivera department with financial support from AECID and technical support from the Río Negro Institute Foundation (INDRA) (Uruguay), the Nativa Foundation (Plurinational State of Bolivia) and the Avina Foundation.

218 Economic Commission for Latin America and the Caribbean (ECLAC)
(i) National Plan of Adaptation to Climate Variability and Change for the Agricultural Sector (PNA-Agro), 2019, involving the following lines of action: sustainable production, protection of ecosystems, institutional strengthening and producer organizations, see [online] http://www.uy.undp.org/content/uruguay/es/home/library/environment_energy/PNA-Agro_Uruguay.html#targetText=El%20Plan%20Nacional%20de%20Adaptaci%C3%B3n,%2C%20ambiental%2C%20social%20e%20institucional.
(ii) National Coastal Zone Adaptation Plan (NAP Costas), 2019, see [online] https://www.mvotma.gub.uy/napcostas#que-es-el-plan-nacional-de-adaptacion-costera.
(iii) National Climate Change Adaptation Plan for Cities and Infrastructure (NAP Ciudades), 2018, see [online] http://www.uy.undp.org/content/uruguay/es/home/projects/napciudades.html.

Chapter V
Public policies to mitigate climate change
As discussed in previous chapters, the changes needed to transition to a resilient low-carbon development style are not spontaneous and are not occurring as quickly as they need to, which means there is no choice but to design policy measures that can provide the regulatory frameworks and incentives needed to ensure the transition is both prompt and as far-reaching as required.
A. Creating the pathway to low-carbon investment
The transition to lower-carbon development is not happening spontaneously, and nor will it under the institutional and social arrangements that currently shape and determine the operating rules of financial markets, goods and services markets and capital markets and their respective regulatory frameworks. This is particularly true if it is hoped that the transition will be as rapid and far-reaching as required. The path to change involves putting in place a new social, institutional and regulatory framework, reorienting incentives and meeting private and social costs; there needs to be consistent movement towards sustainable development, accompanied by the construction of resilient, lower-carbon societies. And this concerted effort can only be deliberate, coordinated and coherent: this is a task that governments alone can perform, within an international framework of shared values in relation to this new orientation.

220 Economic Commission for Latin America and the Caribbean (ECLAC)
All other social actors will support, resist or go along with the new direction of development and its policies of renewal as their interests and breadth of vision determine. The main lever of change is the redirection of investment and consumption. The former is driven by profitability, the latter by the whole gamut of basic, superstructural and psychological needs, such as the need for prestige, security and others. Profitability is determined by the sum of costs that are internalized and the subtraction or rejection of costs that are externalized in economic activity. Internalized costs include technology and wage costs, the financial cost of credit and insurance, the fiscal cost determined by the structure of taxes and fiscal expenditure, and rates of return or surplus, which have a significant cultural component.
External costs are the costs or consequences that fall on social actors other than those generating them and that do not enter into the latter’s economic calculations precisely because they are transferred to those other actors (Lorenzo, 2018). Paradigmatic external costs arise from the destruction or degradation of the natural heritage, health and well-being, and include activities such as the discharge of polluting waste from production processes into water, soil and air, and greenhouse gas emissions; costs caused by the disruption of the economic structure, which affect workers’ levels of social protection and livelihoods; the use or abuse of society’s time because of spatial segregation and congestion; the effect of inequality in exacerbating social frictions; and future costs associated with productivity, cohesion and democratic solidarity, among others.
These external costs are tolerated or inflicted on the basis of factors such as narratives about development and its imperatives; the discourse that prioritizes growth over well-being; the disorganization of society in its various manifestations; the information asymmetries between those inflicting damage for profit and those suffering it and bearing the consequences; the culture of privilege; the absence of channels for making decisions with broad social support; and the weakness of mechanisms for reparation and the application of justice.
This chapter analyses some institutional barriers and opportunities relating to the transition to production and consumption patterns that will make it possible to carry out economic activity within the environmental frontiers needed to mitigate global warming. The situation with other natural resources, whether extractive or related to nature’s absorption function, has essentially similar determinants.
The transition to less destructive, lower-carbon economies will occur as investment choices are made to employ lower-emission technologies, pursue greater energy efficiency, move away from fossil fuel use, increase carbon capture in ecosystems or adopt technological solutions. Since

The climate emergency in Latin America and the Caribbean... 221
investment decisions in the economic system are primarily profit-driven, the transition depends on how profitable the lower-emission investment options are compared to the business as usual options that are driving the world’s temperature above the 2 °C threshold representing relative climate security.
There are different options for penalizing carbon, and all of them contribute to the partial or total internalization of the social cost of emitting (directly or indirectly) a unit of carbon, so that responsibility for the damage is assigned to whoever causes it (Goulder and Schein, 2013; Aldy and Stavins, 2012; Edenhofer and others, 2015; Metcalf and Weisbach, 2009; Schmalensee and Stavins, 2017). Economic and regulatory instruments create signals consisting of explicit or implicit prices that lead economic actors to decide how to respond to the damage they cause, whether by reducing emissions, offsetting them or paying a price for their social cost.
Both tax and non-tax systems are used to assign values to carbon. They generally provide options for meeting environmental policy objectives in a way that complements regulation. The main carbon pricing instruments include taxes, subsidies and tradable emission permits.
Tradable emission permits and carbon taxes are intended to internalize the costs that carbon emissions impose on society. The difference between them is that, with the tax, the government sets a price by fiat and lets the market determine total emissions, while with a tradable emission permit system the government caps emissions and creates a market that ultimately determines the price. There are also hybrid systems that take elements from the design of both pure instruments. For example, there are tax regimes in which emission reduction units are accepted as payment of tax liabilities, and there are tradable emission permit systems that have maximum and minimum prices; however, all variants are based on the principle of internalizing environmental damage (Goulder and Schein, 2013).
The use of these instruments has been increasing worldwide since the 1990s, initially in the United States, Canada and European countries, and more recently in some developing economies (see figure V.1).
Setting an emissions cap, as is done in emission standards or the broader version of the Paris Agreement, is a regulatory instrument that has economic implications, as it reveals the opportunity cost of activities subject to emission limits. The main public policies on mitigation that are associated with carbon budgets, fiscal policies (both tax and non-tax), climate financing and improvements in the framework making public participation possible will now be discussed.

222 Economic Commission for Latin America and the Caribbean (ECLAC)
Figure V.1 Jurisdictions around the world where carbon pricing instruments
have been implemented, 1990–2019(Number of jurisdictions)
0
5
10
15
20
25
30
1990
1991
1992
1996
2000
2004
2005
2007
2008
2009
2010
2011
2012
2013
2014
2015
2016
2017
2018
2019
Tradable emission permits Carbon tax
Source: World Bank, Carbon Pricing Dashboard, 2019 [online database] https://carbonpricingdashboard.worldbank.org/.
B. Regulatory measures
1. The Paris Agreement as a regulatory measure
The Paris Agreement has the virtue of being one of the few globally agreed environmental standards, and it sets the objective of keeping the global average temperature increase well below 2 °C and as close as possible to 1.5 °C above the pre-industrial level. As discussed in chapter I above, this means reducing current emissions (which in 2018 totalled 50 gigatons worldwide) to a level consistent with those targets; i.e. setting an overall emissions budget that enables these two objectives to be achieved.
The remaining carbon budget or environmental leeway for the emission of greenhouse gases raises ethical and economic issues of the utmost importance. The Paris Agreement and the United Nations Framework Convention on Climate Change (UNFCCC), the Kyoto Protocol and the corpus of international law all aim to apply a shared values approach to the apportionment of the carbon budget. However, defections from this corpus, such as that announced by the Government of the United States, the failure of parties to meet their commitments, announced or otherwise, and the growth in emissions themselves reflect another reality: de facto appropriation of the remaining budget, leading in the medium or long term either to warming as uncontrolled as the emissions themselves, or to the law of the jungle. This will operate when the role the carbon budget plays in the different levels of global warming becomes clear and emitting becomes the privilege of the strongest. This is the risk if the multilateral regime is allowed to deteriorate.

The climate emergency in Latin America and the Caribbean... 223
Nationally determined contributions (NDCs) are the national expression of the global carbon budget and are the result of each country’s commitment to limit or reduce the rate of emissions growth. They pose similar dilemmas for national actors: either an internal division is made between individuals, sectors or territories on the basis of an agreement on shared values, or the leeway available is appropriated in an exercise more or less determined by the balance of relative strength within each country. To the extent that NDCs aspire to set stricter carbon budgets, the dilemma between applying values or force to access the function of the atmosphere as a repository of emissions will intensify and expose the priorities and forces operating within economies and their contribution to collective well-being.
The global and national carbon budget highlights the difference between emitting to achieve greater social welfare, employment and development, or to satisfy the consumption pattern of a minority of the population that makes direct use of fossil fuels. How the carbon budget is applied will have consequences that either contribute to greater environmental and economic justice and the possibility of moving in the right direction, or generate environmental poverty between and within countries. The carbon budget reveals the physical and economic scarcity of the global carbon absorption function and shows at the appropriate scale the direction and type of climate action needed to orient structural change so that it is compatible with this budget.
2. The state and progress of nationally determined contributions
As a result of the international agreement on the temperature threshold and its relationship to concentrations and emissions, governments pledged to contribute to the achievement of the global target through nationally determined contributions (NDCs) which, as seen above, are insufficient to meet this target and will be regularly reviewed. The region’s governments have also committed to complying with their NDCs under the Paris Agreement, both by mitigating greenhouse gas emissions and by taking adaptation measures to lessen the negative effects of climate change. How do the mitigation commitments submitted by the Latin American and Caribbean countries relate to their respective carbon budgets and global climate objectives?
An exercise will now be presented with the objective of quantifying the mitigation effort committed to at the regional level, i.e. the region’s carbon budget, and comparing it with the current situation. This will give an idea of the gap that separates us from the climate target estimated for achieving the objectives stipulated in the Paris Agreement. That gap is an indicator of the extent and possible effectiveness of the measures that need to be taken to harmonize aspirations and actions.Emissions are projected
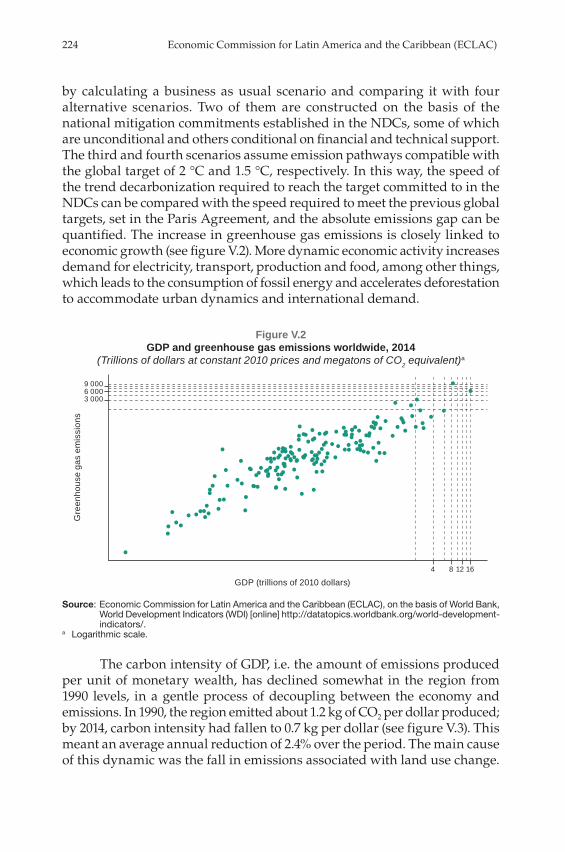
224 Economic Commission for Latin America and the Caribbean (ECLAC)
by calculating a business as usual scenario and comparing it with four alternative scenarios. Two of them are constructed on the basis of the national mitigation commitments established in the NDCs, some of which are unconditional and others conditional on financial and technical support. The third and fourth scenarios assume emission pathways compatible with the global target of 2 °C and 1.5 °C, respectively. In this way, the speed of the trend decarbonization required to reach the target committed to in the NDCs can be compared with the speed required to meet the previous global targets, set in the Paris Agreement, and the absolute emissions gap can be quantified. The increase in greenhouse gas emissions is closely linked to economic growth (see figure V.2). More dynamic economic activity increases demand for electricity, transport, production and food, among other things, which leads to the consumption of fossil energy and accelerates deforestation to accommodate urban dynamics and international demand.
Figure V.2 GDP and greenhouse gas emissions worldwide, 2014
(Trillions of dollars at constant 2010 prices and megatons of CO2 equivalent)a
3 0006 0009 000
4 8 12 16
GDP (trillions of 2010 dollars)
Gre
enho
use
gas
emis
sion
s
Source: Economic Commission for Latin America and the Caribbean (ECLAC), on the basis of World Bank, World Development Indicators (WDI) [online] http://datatopics.worldbank.org/world-development-indicators/.
a Logarithmic scale.
The carbon intensity of GDP, i.e. the amount of emissions produced per unit of monetary wealth, has declined somewhat in the region from 1990 levels, in a gentle process of decoupling between the economy and emissions. In 1990, the region emitted about 1.2 kg of CO2 per dollar produced; by 2014, carbon intensity had fallen to 0.7 kg per dollar (see figure V.3). This meant an average annual reduction of 2.4% over the period. The main cause of this dynamic was the fall in emissions associated with land use change.

The climate emergency in Latin America and the Caribbean... 225
Figure V.3 Latin America and the Caribbean: carbon intensity of GDP, 1990–2014
(Kg of CO2 equivalent per dollar at 2010 prices)
0
0.2
0.4
0.6
0.8
1.0
1.2
1.4
1990
1991
1992
1993
1994
1995
1996
1997
1998
1999
2000
2001
2002
2003
2004
2005
2006
2007
2008
2009
2010
2011
2012
2013
2014
Source: Economic Commission for Latin America and the Caribbean (ECLAC), on the basis of World Resources Institute (WRI), CAIT Climate Data Explorer [online database] http://cait2.wri.org.
As was seen in chapter III, the relationship between emissions and economic growth is used to project the level of emissions, determined by the following equation:
GHGit = αt * yit (1)
where GHGt represents greenhouse gas emissions, represents the amount of emissions per unit of GDP produced, i.e. the carbon intensity of the economy, and yt represents GDP. Subscript i and t represent country i in year t. Thus, assuming a certain future behaviour of each country’s carbon intensity and GDP, it is possible to project the behaviour of greenhouse gas emissions. A useful way to express equation (1) is by growth rates:
∆GHGit ≈ ∆αt + ∆yit (2)
where ∆ represents the annual percentage change in the variables. Thus, the rate of emissions growth approximates to the sum of the rates of carbon intensity and GDP growth. Accordingly, in the absence of decoupling in the economy (∆αit = 0), emissions will grow at the same speed as GDP; conversely, if the aim is to reduce emissions while still maintaining high growth in the economy, it will be necessary to reduce the latter’s carbon intensity (∆αit < 0).

226 Economic Commission for Latin America and the Caribbean (ECLAC)
Equation (2) is used to estimate a business as usual scenario by making assumptions about the evolution of each country’s GDP and carbon intensity and then aggregating the results at the regional level. To construct the business as usual scenario, it is assumed that the economy’s GDP and carbon intensity will maintain the historical growth they had from 1990 to 2014. The estimates for the scenarios represented by the NDCs will depend on the target set in each country. In the case of the countries where the target was to reduce emissions relative to the business as usual scenario, the percentage reduction was taken directly. For countries where an absolute reduction target was set, the proposed reduction was estimated relative to the base year indicated in each NDC. Lastly, for countries where a target for reducing the carbon intensity of the economy was set, the carbon intensity targeted for 2030 was calculated and the level of emissions was estimated on the basis of the GDP estimate made to obtain the business as usual scenario.1 The scenarios compatible with the 2 °C and 1.5 °C targets were calculated on the basis of an absolute reduction of 25% and 45%, respectively, from 2010 emissions, as indicated by the scientists of the Intergovernmental Panel on Climate Change (IPCC, 2018a).
To aggregate the reduction commitments established in the countries of the region, the different types of commitments (reduction relative to the business as usual scenario, absolute reduction and reduction of carbon intensity) and time horizons (2025 and 2030) were homogenized to create a business as usual scenario up to 2030. To calculate the unconditional and conditional scenarios, the reduction target for the sectors included in the commitments was set and then the sectors not included were added, with a growth rate equal to that of the business as usual scenario being assumed for the latter. For countries with negative emissions from land use change and forestry, these emissions were kept constant up to 2030.2 The basic data used to construct the business as usual scenario are presented in table V.1.
Tables V.2 and V.3 present the results of the exercise by country and for the whole region, respectively. In the business as usual scenario, regional emissions would total 4.7 GtCO2eq in 2030. If the unconditional national mitigation commitments accepted in each country’s NDC are added in, emissions would be 4.1 GtCO2eq or 13% lower than in the business as usual scenario. In the case of the conditional scenario, emissions would be 23% lower than in the business as usual scenario, at 3.6 GtCO2eq. The scenarios compatible with the 2 °C and 1.5 °C targets represent a reduction of 32% and 50% relative to the business as usual scenario, with emissions of 3.2 and 2.3 GtCO2eq, respectively.
1 In the case of Chile and Uruguay, which have a carbon intensity target, a trend GDP figure was calculated and then the emissions compatible with the proposed intensity were calculated.
2 The reduction potential of countries where policy measures were taken is not accounted for.

The climate emergency in Latin America and the Caribbean... 227
Tabl
e V.
1 La
tin A
mer
ica
and
the
Car
ibbe
an: b
asic
dat
a us
ed to
con
stru
ct th
e bu
sine
ss a
s us
ual s
cena
rio
Cou
ntry
GD
P in
201
4(m
illio
ns o
f 20
10 d
olla
rs)
Tota
l gr
eenh
ouse
ga
ses
in 2
014
(MtC
O2e
q)
Gre
enho
use
gase
s w
ithou
t lan
d us
e ch
ange
in 2
014
(MtC
O2e
q)
Tota
l car
bon
inte
nsity
of G
DP
in 2
014
(kg
of C
O2
equi
vale
nt
per d
olla
r)
Car
bon
inte
nsity
(w
ithou
t lan
d us
e ch
ange
) of G
DP
in 2
014
(kg
of C
O2 e
quiv
alen
t pe
r dol
lar)
Gro
wth
199
0–20
14
GD
P(p
erce
ntag
es)
Tota
l car
bon
inte
nsity
of G
DP
(per
cent
ages
)
Car
bon
inte
nsity
(w
ithou
t lan
d us
e ch
ange
) of G
DP
(per
cent
ages
)
Ant
igua
and
Bar
buda
1 22
6 1.
11.
10.
90.
92.
42.
21.
9A
rgen
tina
446
703
443.
334
8.6
1.0
0.8
3.3
-1.7
-1.6
Bah
amas
10 4
13
3.1
2.7
0.3
0.3
1.4
4.5
-0.4
Bar
bado
s4
574
3.4
3.4
0.7
0.7
1.0
-0.3
-0.3
Bel
ize
1 55
0 12
.19.
87.
86.
34.
6-3
.9-2
.0B
oliv
ia (P
lurin
atio
nal
Sta
te o
f)24
475
13
4.2
48.5
5.5
2.0
4.1
-2.9
-0.5
Bra
zil
2 42
3 23
4 1
357.
21
051.
00.
60.
43.
0-3
.2-0
.3C
hile
258
133
-7.8
97.2
0.0
0.4
5.0
NA
-1.8
Col
ombi
a34
9 51
2 18
2.4
162.
90.
50.
53.
7-5
.0-2
.2C
osta
Ric
a43
128
2.
513
.90.
10.
34.
4-1
1.0
-2.2
Cub
a70
733
32
.946
.80.
50.
71.
90.
5-2
.4D
omin
ica
506
0.4
0.2
0.7
0.5
2.0
2.3
-0.5
Dom
inic
an R
epub
lic64
314
24
.433
.10.
40.
55.
31.
2-1
.9Ec
uado
r86
333
94
.560
.61.
10.
73.
5-2
.2-0
.4El
Sal
vado
r20
557
12
.611
.80.
60.
63.
2-1
.0-0
.8G
rena
da84
4 1.
91.
92.
32.
32.
6-1
.6-1
.6G
uate
mal
a47
896
38
.430
.90.
80.
63.
7-2
.20.
5G
uyan
a2
747
25.0
4.5
9.1
1.6
3.8
-0.9
-1.2
Hai
ti7
804
8.8
8.7
1.1
1.1
0.7
1.9
1.9
Hon
dura
s18
142
49
.621
.52.
71.
23.
7-3
.7-0
.6Ja
mai
ca13
523
10
.29.
40.
80.
71.
2-1
.0-1
.0M
exic
o1
184
179
729.
172
1.7
0.6
0.6
2.5
-0.4
-0.3
Nic
arag
ua10
903
14
.714
.51.
41.
33.
6-7
.2-1
.7Pa
nam
a40
672
26
.317
.80.
60.
46.
0-3
.7-2
.1

228 Economic Commission for Latin America and the Caribbean (ECLAC)
Cou
ntry
GD
P in
201
4(m
illio
ns o
f 20
10 d
olla
rs)
Tota
l gr
eenh
ouse
ga
ses
in 2
014
(MtC
O2e
q)
Gre
enho
use
gase
s w
ithou
t lan
d us
e ch
ange
in 2
014
(MtC
O2e
q)
Tota
l car
bon
inte
nsity
of G
DP
in 2
014
(kg
of C
O2
equi
vale
nt
per d
olla
r)
Car
bon
inte
nsity
(w
ithou
t lan
d us
e ch
ange
) of G
DP
in 2
014
(kg
of C
O2 e
quiv
alen
t pe
r dol
lar)
Gro
wth
199
0–20
14
GD
P(p
erce
ntag
es)
Tota
l car
bon
inte
nsity
of G
DP
(per
cent
ages
)
Car
bon
inte
nsity
(w
ithou
t lan
d us
e ch
ange
) of G
DP
(per
cent
ages
)
Para
guay
32 1
09
183.
239
.95.
71.
23.
2-0
.4-0
.7Pe
ru18
0 42
4 16
1.5
89.7
0.9
0.5
4.8
-2.1
-1.6
Sai
nt K
itts
and
Nev
is86
7 0.
40.
40.
50.
43.
90.
3-0
.6S
aint
Luc
ia1
453
1.2
1.1
0.8
0.8
2.3
-0.4
-0.7
Sai
nt V
ince
nt a
nd th
e G
rena
dine
s70
7 0.
30.
30.
40.
42.
75.
3-0
.2
Sur
inam
e4
900
8.0
3.4
1.6
0.7
2.7
-2.3
-2.0
Trin
idad
and
Tob
ago
22 4
79
24.9
25.4
1.1
1.1
4.4
-2.2
-2.1
Uru
guay
47 3
84
22.7
33.2
0.5
0.7
3.4
13.1
-2.3
Vene
zuel
a (B
oliv
aria
n R
epub
lic o
f)25
6 80
7 33
7.5
271.
11.
31.
12.
5-1
.7-0
.5
Latin
Am
eric
a an
d th
e C
arib
bean
5 67
9 23
2 3
940.
03
187.
00.
70.
63.
1-2
.4-0
.8
So
urce
: J.
Sam
anie
go a
nd o
ther
s, P
anor
ama
de
las
cont
ribuc
ione
s d
eter
min
adas
a n
ivel
nac
iona
l en
Am
éric
a La
tina
y el
Car
ibe,
201
9: a
vanc
es p
ara
el c
ump
limie
nto
del
A
cuer
do
de
Par
ís (L
C/T
S.2
019/
89),
San
tiago
, Eco
nom
ic C
omm
issi
on fo
r La
tin A
mer
ica
and
the
Car
ibb
ean
(EC
LAC
), 20
19.
Tab
le V
.1 (c
onc
lud
ed)

The climate emergency in Latin America and the Caribbean... 229
Tabl
e V.
2 La
tin A
mer
ica
and
the
Car
ibbe
an: p
roje
ctio
ns b
y co
untr
y, 2
030
Cou
ntry
Bus
ines
s as
usu
al(to
ns o
f CO
2 eq
uiva
lent
)
Unc
ondi
tiona
l nat
iona
lly
dete
rmin
ed c
ontri
butio
n (N
DC
)(to
ns o
f CO
2 equ
ival
ent)
Con
ditio
nal n
atio
nally
de
term
ined
con
tribu
tion
(ND
C)
(tons
of C
O2 e
quiv
alen
t)
Com
patib
le w
ith
2 °C
targ
et(to
ns o
f CO
2 eq
uiva
lent
)
Com
patib
le w
ith
1.5
°C ta
rget
(tons
of C
O2
equi
vale
nt)
GD
P(m
illio
ns o
f 20
10 d
olla
rs)
Ant
igua
and
B
arbu
da2.
3 2.
3 2
.3
0.8
0
.6
1 7
95
Arg
entin
a57
5.6
465.
7 3
55.8
3
14.0
2
30.3
7
53 2
03
Bar
bado
s3.
8 3.
8 2
.8
2.7
2
.0
5 3
30B
aham
as7.
8 7.
8 5
.5
5.1
3
.8
13
078
Bel
ize
13.5
13
.5
13.
5 1
0.7
7.8
3
174
Bol
ivia
(P
lurin
atio
nal
Sta
te o
f)16
1.8
161.
8 1
61.8
1
14.9
8
4.2
46
613
Bra
zil
1 32
0.1
1 16
5.1
1 1
65.1
1
112
.9
816
.1
3 8
92 3
73C
hile
55.4
60
.0
36.
8 6
2.6
45.
9 5
60 7
98C
olom
bia
146.
3 11
7.0
102
.4
236
.3
173
.3
621
958
Cos
ta R
ica
8.5
1.5
1.5
3
.9
2.9
8
6 29
5C
uba
29.4
29
.4
29.
4 6
5.1
47.
7 9
6 01
9D
omin
ica
0.7
0.7
0.2
0
.6
0.4
6
89D
omin
ican
R
epub
lic
47.8
47
.8
17.
8 1
7.8
13.
0 1
47 4
92
Ecua
dor
115.
2 99
.3
87.
6 6
5.7
48.
2 1
49 1
48El
Sal
vado
r17
.7
17.7
1
7.7
9.7
7
.1
34
039
Gre
nada
2.3
2.3
1.0
1
.3
1.0
1
265
Gua
tem
ala
48.6
43
.2
37.
6 3
0.1
22.
1 8
6 06
1G
uyan
a39
.4
39.4
3
9.4
9.2
6
.7
5 0
15H
aiti
13.2
12
.5
9.2
6
.0
4.4
8
689
Hon
dura
s 49
.6
49.6
4
6.4
35.
5 2
6.0
32
265
Jam
aica
10.5
9.
9 9
.8
7.3
5
.4
16
480
Mex
ico
1 01
3.4
790.
4 6
48.6
5
52.8
4
05.4
1
760
395

230 Economic Commission for Latin America and the Caribbean (ECLAC)
Cou
ntry
Bus
ines
s as
usu
al(to
ns o
f CO
2 eq
uiva
lent
)
Unc
ondi
tiona
l nat
iona
lly
dete
rmin
ed c
ontri
butio
n (N
DC
)(to
ns o
f CO
2 equ
ival
ent)
Con
ditio
nal n
atio
nally
de
term
ined
con
tribu
tion
(ND
C)
(tons
of C
O2 e
quiv
alen
t)
Com
patib
le w
ith
2 °C
targ
et(to
ns o
f CO
2 eq
uiva
lent
)
Com
patib
le w
ith
1.5
°C ta
rget
(tons
of C
O2
equi
vale
nt)
GD
P(m
illio
ns o
f 20
10 d
olla
rs)
Nic
arag
ua
8.1
8.1
8.1
3
2.1
23.
5 1
9 06
2Pa
nam
a 37
.7
37.7
3
7.7
18.
0 1
3.2
103
193
Para
guay
285.
7 25
7.1
228
.5
122
.7
90.
0 5
2 99
0Pe
ru24
7.2
197.
8 1
73.1
1
14.0
8
3.6
384
080
Sai
nt K
itts
and
Nev
is
0.8
0.8
0.5
0
.3
0.2
1
604
Sai
nt L
ucia
1.6
1.6
1.5
1
.0
0.7
2
079
S
aint
Vin
cent
and
th
e G
rena
dine
s1.
0 0.
7 0
.7
0.4
0
.3
1 0
76
Sur
inam
e 8.
6 8.
6 8
.6
5.2
3
.8
7 5
33Tr
inid
ad a
nd
Toba
go36
.1
36.1
3
0.8
19.
3 1
4.2
44
689
Uru
guay
29.0
36
.9
32.
9 1
0.1
7.4
8
0 52
5Ve
nezu
ela
(Bol
ivar
ian
Rep
ublic
of)
381.
3 38
1.3
305
.0
204
.4
149
.9
379
063
Latin
Am
eric
a an
d th
e C
arib
bean
4 72
0.0
4 10
7.4
3 6
19.5
3
192
.4
2 3
41.1
9
398
069
So
urce
: J.
Sam
anie
go a
nd o
ther
s, P
anor
ama
de
las
cont
ribuc
ione
s d
eter
min
adas
a n
ivel
nac
iona
l en
Am
éric
a La
tina
y el
Car
ibe,
201
9: a
vanc
es p
ara
el c
ump
limie
nto
del
A
cuer
do
de
Par
ís (L
C/T
S.2
019/
89),
San
tiago
, Eco
nom
ic C
omm
issi
on fo
r La
tin A
mer
ica
and
the
Car
ibb
ean
(EC
LAC
), 20
19.
Tab
le V
.2 (c
onc
lud
ed)

The climate emergency in Latin America and the Caribbean... 231
Table V.3 Latin America and the Caribbean: aggregate projections, 2030
Scenario
A B C D
Emissions by 2030
(GtCO2e)
Difference from business as
usual(GtCO2e)
Difference from business as
usual (percentages)
Annual speed of decarbonization(percentages)
Business as usual 4.7 - - -2Unconditional nationally determined contributions (NDCs)
4.1 -0.6 -13 -2.8
Conditional nationally determined contributions (NDCs)
3.6 -1.1 -23 -3.6
2 °C 3.4 -1.5 -32 -4.4
1.5 °C 2.3 -2.4 -50 -6.3
Source: Economic Commission for Latin America and the Caribbean (ECLAC), Quadrennial report on regional progress and challenges in relation to the 2030 Agenda for Sustainable Development in Latin America and the Caribbean (LC/FDS.3/3/Rev.1), Santiago, 2019.
The aggregate information for Latin America and the Caribbean is also shown in figure V.4. As can be seen, only conditional commitments on a regional scale would make it possible to achieve a level of emissions closer to that needed to meet the 2 °C target.
Figure V.4 Latin America and the Caribbean: emissions scenarios, 2014–2030
4.7
4.1
3.6
3.2
3.9
2.3
2.0
2.5
3.0
3.5
4.0
4.5
5.0
2000 2005 2010 2015 2020 2025 2030
Historical Business as usual Unconditional nationally determined contributions (NDCs)
Conditional nationally determined contributions (NDCs)
Consistent with the 2 °C targetConsistent with the 1.5 °C target
A. Emissions pathway, 2014–2030(gigatons of CO2 equivalent)
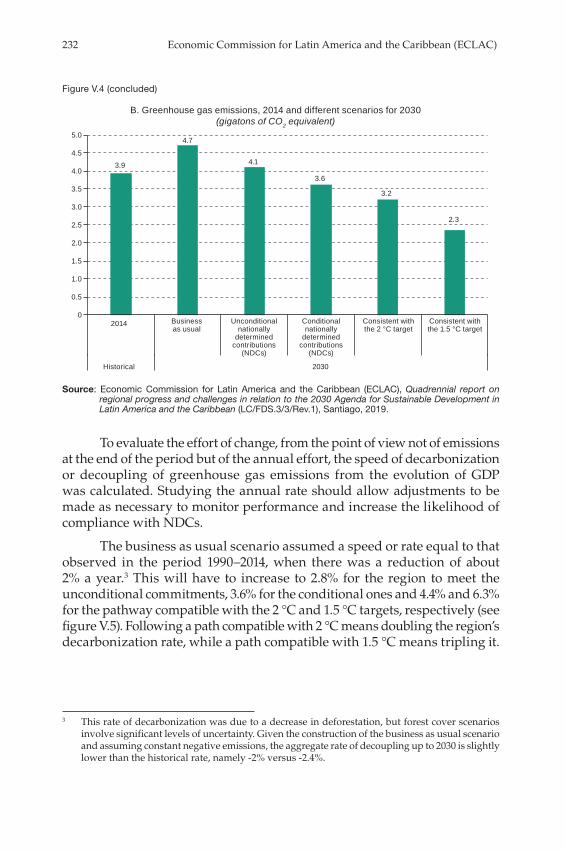
232 Economic Commission for Latin America and the Caribbean (ECLAC)
B. Greenhouse gas emissions, 2014 and different scenarios for 2030(gigatons of CO2 equivalent)
3.9
4.7
4.1
3.6
3.2
2.3
0
0.5
1.0
1.5
2.0
2.5
3.0
3.5
4.0
4.5
5.0
Businessas usual
Unconditional nationally
determined contributions
(NDCs)
Conditional nationally
determined contributions
(NDCs)
Consistent with the 2 °C target
Consistent with the 1.5 °C target
Historical
2014
2030
Source: Economic Commission for Latin America and the Caribbean (ECLAC), Quadrennial report on regional progress and challenges in relation to the 2030 Agenda for Sustainable Development in Latin America and the Caribbean (LC/FDS.3/3/Rev.1), Santiago, 2019.
To evaluate the effort of change, from the point of view not of emissions at the end of the period but of the annual effort, the speed of decarbonization or decoupling of greenhouse gas emissions from the evolution of GDP was calculated. Studying the annual rate should allow adjustments to be made as necessary to monitor performance and increase the likelihood of compliance with NDCs.
The business as usual scenario assumed a speed or rate equal to that observed in the period 1990–2014, when there was a reduction of about 2% a year.3 This will have to increase to 2.8% for the region to meet the unconditional commitments, 3.6% for the conditional ones and 4.4% and 6.3% for the pathway compatible with the 2 °C and 1.5 °C targets, respectively (see figure V.5). Following a path compatible with 2 °C means doubling the region’s decarbonization rate, while a path compatible with 1.5 °C means tripling it.
3 This rate of decarbonization was due to a decrease in deforestation, but forest cover scenarios involve significant levels of uncertainty. Given the construction of the business as usual scenario and assuming constant negative emissions, the aggregate rate of decoupling up to 2030 is slightly lower than the historical rate, namely -2% versus -2.4%.
Figure V.4 (concluded)

The climate emergency in Latin America and the Caribbean... 233
Figure V.5 Latin America and the Caribbean: required annual rate of decarbonization,
1990–2014 and 2030(Percentages)
2030
-2.4-2.0
-2.8
-3.6
-4.4
-6.3-7
-6
-5
-4
-3
-2
-1
0
Business as usual
Unconditional nationally
determined contributions
(NDCs)
Conditional nationally
determined contributions
(NDCs)
Consistent with the 2 °C target
Consistent with the 1.5 °C target
Historical
1990–2014
Source: Economic Commission for Latin America and the Caribbean (ECLAC), Quadrennial report on regional progress and challenges in relation to the 2030 Agenda for Sustainable Development in Latin America and the Caribbean (LC/FDS.3/3/Rev.1), Santiago, 2019.
A faster rate of decarbonization is needed to achieve the regional mitigation targets set in the NDCs, which means increasing the share of renewable energies in the energy mix and modernizing the production structure in order to make progress with all three pillars of sustainable development (see ECLAC, 2018a). The extent to which the speed of decarbonization falls short of the target will guide the additional policy effort and action required to achieve it.
For NDCs to be fulfilled with the necessary speed and thoroughness, they need to be matched with specific policies. A key policy is the allocation and legal enforcement of contribution responsibilities in different sectors and territories of the country. This makes it possible to adopt complementary cross-cutting measures or create internal markets to lower compliance costs, and to combine simultaneous actions in different sectors and territories. Although the assignment of internal compliance responsibilities should be the norm in the region, discussion of it is only in the very earliest stages and the first review is scheduled for 2020. This inertia and the consequent inaction threaten the effectiveness of NDCs as a lever for structural change leading to lower-carbon development that is potentially inclusive, dynamic and of better quality.

234 Economic Commission for Latin America and the Caribbean (ECLAC)
C. Measuring climate expenditure
The fiscal arrangements and resources that governments put in place can contribute to or delay attainment of the objectives of the Paris Agreement, and it is therefore important to measure the expenditure that helps to fulfil them. However, focusing only on the measurement of supporting expenditure may give a misleading idea of the role the government plays by applying the fiscal instrument. A more appropriate measure is net pro-Paris Agreement spending or net climate spending, arrived at by measuring pro-Paris Agreement spending and then deducting from it spending that increases emissions or the carbon intensity of public spending. This is a measure that more clearly reflects the actions and financial commitments of governments in the effort to achieve the goals of the Agreement.
Measuring spending is a complex process because the institutions whose expenditures affect climate change, whether on the mitigation or adaptation side, are widely dispersed. In addition, there are difficulties in defining what is favourable or unfavourable to the Paris Agreement, harmonizing these definitions, agreeing on criteria for updating them, creating classifiers and agreeing on statistical practices. This involves a major institutional challenge.
Analysis of budget information involves reviewing national and international classifications. In the case of climate spending, innovation will be needed in the specific classification, although the Rio markers and the classifications of the International Development Finance Club (IDFC) and periodic improvements to these can be taken as a basis. Development banks have definitions of climate finance that they use to report on the composition of their portfolios, and the system of definitions should be dynamic to capture technological changes and improve information on net climate financing. An inter-agency team needs to work on this, given the existence of multiple budget classifications and climate and economic definitions.
One development that provides guidance on how to calculate net climate spending is the progress made in countries and institutions where methodologies for collecting and measuring information on environmental protection spending have been designed and adopted. Various agencies, such as the Organization for Economic Cooperation and Development (OECD), the Statistical Office of the European Union (Eurostat) and the United Nations Statistical Office, have developed guidelines and methodologies aimed at creating a coherent, standardized system for measuring environmental protection expenditure. However, the calculation of environmental protection expenditure has been irregular and there are differences in the methods and concepts used in the countries.
ECLAC has designed a line of research aimed at encouraging countries to produce regular, systematic official statistics on environmental protection expenditure, using the System of Environmental-Economic Accounting

The climate emergency in Latin America and the Caribbean... 235
(SEEA) as a basis. This line of research has been extended to include applications for measuring public spending on climate change. This exercise in quantifying public and private spending on the prevention and mitigation of environmental damage shows the way forward for the measurement of climate spending.
1. Environmental protection spending as an approach to climate expenditure
Although there are homogeneous criteria for classifying environmental protection activities, measurements of public spending for environmental purposes are heterogeneous in the region.4 Systematic, ongoing work to estimate environmental protection spending is carried out in only a few countries, although environmental accounting systems have been implemented in Mexico, Colombia and Guatemala (ECLAC, 2014a).
The data available indicate that spending on environmental protection is still low. In Colombia, total environmental protection spending by both general government and part of the private sector in 2015 was estimated at 0.6% of GDP (DANE, 2016). In Mexico, a figure of 0.8% of GDP for environmental protection was published that same year, including general government and households (INEGI, 2016). According to Eurostat, spending on environmental protection in the 28 countries of the European Union was 0.67% of GDP in 2013. Among those countries, Serbia had the lowest figure, at 0.07% of GDP (ECLAC, 2018c).
To obtain more standardized results, ECLAC prepared a guide to measuring central government spending on environmental protection (ECLAC/INEGI, 2015). Applying this guide shows that environmental protection expenditure in Chile was 0.1% of GDP in 2012 (ECLAC/MMA, 2015), while in Costa Rica it represented 0.19% of GDP in 2015 (ECLAC, 2018c). However, these figures are only a lower bound, since central government alone was analysed. Because environmental protection spending is conceptually broader than climate spending, it can be assumed that the latter will be lower than the figures reported for gross environmental spending.
4 A climate expenditure classifier would make it possible to homogenize and standardize measurements and make international comparisons. Environmental fiscal labels exist in most countries thanks to the use of the Classification of Environmental Protection Activities (CEPA) and the Classification of the Functions of Government (COFOG) in the environmental subheading. The classification of climate expenditure should match the classifications already defined in international manuals and standards.

236 Economic Commission for Latin America and the Caribbean (ECLAC)
2. Applying the Climate Public Expenditure and Institutional Review methodology in Latin America and the Caribbean
The United Nations Development Programme (UNDP) has developed a method for measuring climate expenditure called the Climate Public Expenditures and Institutional Review.5 It takes in the direct and indirect impact of climate change policies, programmes and projects. Direct expenditure meets the primary purpose criterion, while various weights and criteria are applied to indirect expenditure to incorporate it into the measurement of expenditure. Direct expenditure is internationally comparable, but indirect expenditure needs to be analysed and validated more thoroughly. This method provides general recommendations for organizing and classifying information that are based on existing definitions, such as those of the Rio markers for climate change mitigation and adaptation.
Applying the Climate Public Expenditure and Institutional Review methodology has made it possible to estimate climate change expenditure in some Latin American and Caribbean countries thanks to the work done by multidisciplinary teams and committees to standardize approaches and concepts. The dilemma between comparability and progress was settled in favour of the latter, and it was decided that each country should define what is meant by climate expenditure, how the types of expenditure are classified and how the budget is allocated in accordance with adaptation and mitigation needs. The methodology was thus adapted to each country’s definitions and particular ministerial structure, so that the figures are not strictly comparable from country to country.
Chile, Colombia, Ecuador, El Salvador and Honduras began applying this methodology around 2015. Chile does not publish aggregate climate change spending; public climate change spending ranges from 0.27% to 2.24% of GDP in the other countries. In the period 2011–2015, Colombia averaged spending of 0.27% of GDP, while Ecuador and El Salvador averaged 1.39% and 1.07%, respectively. Honduras spent 2.24% of GDP in the period 2014–2015.
Disaggregating this figure shows which are the main ministries implementing climate spending. In Chile, these are the Ministry of Energy and the Ministry of Agriculture, which account for 24.4% and 9.3% of this expenditure, respectively. In Ecuador, the Ministry of Electricity and Renewable Energy accounts for the bulk of climate expenditure, almost 76%. In El Salvador, the Ministry of Economy (27.4%) and the National Water and Sewerage Administration (19.1%) are the largest spenders. In Honduras, the National Electric Power Company is responsible for over 44% of climate spending. The financing of public climate expenditure comes mainly from
5 This section is based on UNDP (2019).

The climate emergency in Latin America and the Caribbean... 237
domestic resources, spent chiefly on implementing national development plans and managing the institutions analysed. In Ecuador, 60% of funding is domestic, while in El Salvador and Honduras the figure is close to 80%.
Adaptation spending exceeds mitigation spending in the following cases.6 In El Salvador, it is reported that 63% of climate expenditure goes on adaptation, 27% on mitigation and the remaining 10% on the losses and damages category. In Honduras, 64.3% goes on adaptation and 34.4% on mitigation. In Chile, 63% of expenditure is considered to be on adaptation and 19% on mitigation, with the remaining 18% being mixed expenditure. The country’s adaptation expenditures go on infrastructure and the promotion of more resilient agriculture. Also considered are the Climate Change Adaptation Plan of the Forestry and Agricultural Sector, the Plan for Adaptation to Climate Change in Biodiversity and the National Climate Change Adaptation Plan, among others. In Ecuador, on the other hand, 79.3% of climate expenditure is on mitigation, going mainly on investing more in hydroelectric infrastructure and introducing changes in the energy mix that reduce greenhouse gas emissions; adaptation expenditure accounts for 20.7%.
Ecuador and Honduras have budget classifiers that provide real-time information on climate spending. With respect to the Climate Public Expenditure and Institutional Review methodology, however, there is the challenge of standardizing measurement in order to achieve greater comparability between countries and ensure that comparison works as an incentive for improvement.
3. Constraints on the measurement of net climate spending
In sum, difficulties in identifying and classifying the information needed to estimate climate spending stem from the following factors, among others:
• A lack of disaggregated information to distinguish this type of expenditure from other types
• A lack of stable funding for spending estimation.• difficulties in identifying funding sources.• Heterogeneity in environmental expenditure information at the
different levels of government.• Difficulties in constructing historical series.• A lack of spending concepts and methodologies covering both
expenditure that advances the goals of the Paris Agreement and expenditure that acts against these (i.e. net climate spending).
6 This greater expenditure on adaptation is accounted for by prevention activities and responses to changes in extreme weather events, such as hurricanes.
238 Economic Commission for Latin America and the Caribbean (ECLAC)
• A lack of regular information and dispersion of spending implementation at the sectoral level.
• Lack of information on how resources generated by local governments are allocated.
D. Fiscal measures
1. Non-tax measures
(a) The environmental discount rate
The discount rate establishes a value relationship between the present and the future. When evaluating private investment, it can be used to recalculate earnings at present value and thence evaluate the profitability of that investment over time once all the costs associated with it, including financial costs, are taken into account. In the public sector, since there is no owner of the investment resource and this is not financed in the private capital market and does not create tradable goods in international markets, the discount rate is simply a filter to distinguish projects that yield social benefits sooner rather than later. This reflects what finance ministries consider to be the opportunity cost of public investment. What is not considered, though, is whether or not social benefits are properly captured in the accounts, something that depends on how environmental and health externalities are internalized in the formula used to evaluate public investment.
A positive discount rate means that the future is discounted in favour of the present. This makes sense from the individual point of view of an investor whose priority is monetary gain and its evaluation today, even if the future is devalued. From the government’s point of view, it makes less sense to undervalue the nation of the future and its inhabitants by prioritizing short-term actions above those that yield welfare over long periods. The higher the rate, the more the nation of the future is undervalued, the more short-term the thinking of the public decision-maker and the stricter the filter, with the investment required to show a return in a shorter time.
In an area such as the environment, this results in a bias towards investments that may lead to higher emissions but that can be built and operated in a shorter time frame. This is what is happening when thermoelectric plants are built instead of hydroelectric ones, which have longer payback periods, or when roads are built instead of metros, trains and trams, which yield their benefits in the longer term.7 The practice of screening investments by a discount rate is universal; however, governments can use lower discount
7 Metros, trains and trams are further disadvantaged by the way investment is accounted for, as rail options include internalization of the cost of rolling stock and the creation of new rights of way, while neither these costs nor the constant renewal they are subject to as part of operating costs are internalized in the case of roads.

The climate emergency in Latin America and the Caribbean... 239
rates when it comes to public investment that brings climate or broader environmental benefits. Revising discount rates in this way is a sovereign right when investments are administered with public resources.
Environmentally important investments, particularly those related to climate change, have intertemporal effects; in fact, they are motivated by their intertemporal and even intergenerational effects and, therefore, by considerations of intergenerational equity (Azqueta, 2007). The importance of environmental sustainability has led several Latin American and Caribbean countries to consider climate change criteria when evaluating public investment projects, such as the social cost of carbon, which is discussed below, or the modification of social discount rates, as has been done by Peru’s Ministry of Economy and Finance.
In 2017, the general social discount rate or opportunity cost that the Peruvian Ministry of Economy and Finance used to evaluate public investment projects was 8%. However, for projects that generated positive externalities, such as environmental services to reduce or mitigate greenhouse gas emissions, the specific social discount rate was 4%. In the social evaluation of public investment projects, a long-term social discount rate (SDR) is also applied when projects extend beyond one generation. Using the long-term SDR solves the drawbacks of the constant 8% discount rate, according to which more distant flows of net benefits are subject to a larger discount that brings down their present value to close to zero (MEF, 2019). To overcome the difficulty of applying a constant discount rate, the most recent economic literature has proposed a time-decreasing long-term SDR (Kamiche and Diderot, 2018; MEF, 2019).
The social project evaluation carried out by the Ministry of Economy and Finance (MEF, 2019) applies the social discount rate of 8% to calculate the net flows of social benefits over the first 20 years of the evaluation horizon, while the rates shown in table V.4 are applied from the twenty-first year onward.
Table V.4 Peru: long-term social discount rate of the Ministry
of Economy and Finance, 2019
Evaluation horizon(years)
Rate(percentages)
Less than 20 8.021 to 49 5.550 to 74 4.075 to 99 3.0100 to 149 2.0150 to 199 2.0200 and over 1.0
Source: Ministry of Economy and Finance (MEF), “Anexo N° 11: parámetros de evaluación social”, Lima, 2019; J. Kamiche and J. Diderot, Actualización de la tasa social de descuento de largo plazo, Lima, Ministry of Economy and Finance (MEF), 2018.

240 Economic Commission for Latin America and the Caribbean (ECLAC)
The 20 years that have to elapse before the initial discount rate changes means that the relative profitability of high- and low-carbon projects is not altered in favour of the latter when periods within that time are compared, and it is only afterwards that the handicap on the profitability of long-term projects is compensated for. Applying differentiated rates to low-carbon projects from the outset when project comparisons are made seems a promising way to move relative returns in favour of these types of projects. The shift in their favour could be reinforced by measures such as efficiency standards and the tax or non-tax price of carbon, which is discussed below.
(b) The social cost of carbon
Emissions of polluting and greenhouse gases are a public bad that is non-rivalrous and non-excludable,8 a negative externality whose effects are universal. Hence, the case for internationally concerted action on carbon pricing to help shift relative profitability in favour of lower-emission projects has gained new strength. One mechanism is taxation, which will be discussed below. A pair of international bodies have been set up to advance the discussion on carbon pricing. One is the High-Level Commission on Carbon Prices, which argues that a well-designed carbon price is an indispensable part of a strategy for reducing emissions in an efficient way and can be usefully complemented by shadow pricing in public sector activities (High-Level Commission on Carbon Prices, 2017, pp. 1–2). Another is the coalition created in December 2018 and chaired by the finance ministries of Chile and Finland, which also advocates the introduction of carbon pricing.
Taxes are not the only way to introduce a carbon price or value. Compliance with rules or regulations involves assigning an implicit price to carbon: an infinite price when the restriction is absolute and a price above zero when there are regulations on emissions or the energy efficiency of machines and processes. Another way of introducing a carbon price, which is discussed below, is by assigning a value to emissions (as to any externality) in the investment appraisal process in the financial sector or in public or private investment appraisal methodologies. This is known as the shadow or social cost of carbon.
Unlike a carbon tax, which is distributed over a short period of time (i.e. the current generation), the social price makes it possible to discriminate between high- and low-carbon investments, depending on their value. Excluding investments with large externalities or high emissions may mean opting for higher-cost alternatives or not, as the case may be. Either way, the additional cost or savings achieved will be distributed over the life of the investment considered. The social price concept implies the principle of
8 A public good or bad is non-excludable because no-one can be excluded from its effects and non-rivalrous in that more than one person can be affected at the same time.

The climate emergency in Latin America and the Caribbean... 241
internalization of damage and the effort that society is willing to make to obtain the good or service in question. The underlying idea is that public investments, whether made directly by governments or under concessions granted by them, should be oriented towards lower-emission options, and that the evaluation process should serve to rule out investments that are cheaper but more polluting, by including at least part of the social cost involved, namely that associated with greenhouse gas emissions. In other words, the profitability of investment options is modified in favour of those with lower carbon emissions. When the latter are associated with other emissions that could substantially affect local health, this also prevents some of the health damage that would occur in the absence of the social price.
In the economic literature, a shadow price is the reference price of a good or service including social and private costs; it represents the real cost or true opportunity cost of producing or consuming a good or service and is often not the same as the market price. Most national public investment systems in Latin America and the Caribbean use the term “social price” for this concept. According to the literature, there are three methods of valuing social prices: (i) taking a market price as a reference; (ii) making a monetary calculation of the social cost of the carbon; and (iii) estimating the additional (marginal) costs of reducing emissions. Each of these methods is explained below.
One of the internationally available methods for calculating the social cost of carbon takes the price of carbon credits as an indirect or approximate value for what people are willing to pay to reduce greenhouse gas emissions. However, the market price of carbon credits currently underestimates the value of a ton of traded carbon dioxide to society because the market is not competitive and supply and demand in it present design problems. As a result, this methodology is not widely used, and in the countries where it has been, such as Chile, it has been discarded.
An alternative to the market price method is to estimate the social cost of carbon, which expresses in monetary terms the damage caused by increased emissions to, for example, agricultural productivity or human health, or property damage due to the increased destructive potential of extreme natural events, among other things.
The social cost of carbon method considers not only the total cost that an additional unit of carbon generates today, but also the total cost of the damage that carbon causes by remaining in the atmosphere. It then considers the present value of the impact that emitting an additional metric ton of carbon would have, using a 100-year horizon (Watkiss, 2006). In this way, the externality of this emission can be accounted for and incorporated into project assessments and other decisions.

242 Economic Commission for Latin America and the Caribbean (ECLAC)
Box V.1 Methodological approaches for determining the social cost of carbon
Nordhaus (2007) defines the social cost of carbon as the market price assigned to the right to emit one ton of carbon by burning fossil fuels. This price usually reflects the social cost associated with the damage caused by the increase in greenhouse gas emissions, usually over a 100-year horizon. In public policy terms, the social cost of carbon offers more application options than a tax.
The social cost of carbon is obtained by monetizing the economic costs of climate change on the basis of simulations of various future emissions pathways (Anthoff and others, 2011). Normally, this additional carbon impact is derived from the difference between the business as usual scenario and the scenario being considered over various periods (Golosov and others, 2014; Nordhaus, 2014). The monetary economic costs associated with an additional unit of carbon emissions are identified (Greenstone, Kopits and Wolverton, 2013; Golosov and others, 2014; Anthoff and others, 2009; Watkiss, 2006). Stern (2007) estimates the social cost of carbon derived from greenhouse gas emissions by calculating the damage caused by climate change in comparison with a path where emissions do not cause any damage, a procedure that is defined as the balanced growth equivalent (Hope, 2006). The social cost of carbon is then understood as the marginal cost of the damage from climate change (Kuik and others, 2008) and expresses the present value of the present and future social costs (the present and future marginal social damage) caused by emitting an extra ton of carbon into the atmosphere (Hope, 2006).
There are two methods of estimating the social cost of carbon based on the damage caused by emissions. A first method directly estimates the difference in damage caused by climate change due to a marginal change in CO2 emissions, but the impact does not have to be linear. A second method estimates the marginal cost of emissions at the point where it is equal to the marginal cost of reducing them, taking the paths of these curves as a reference. Thus, the optimum point is defined as the point at which the marginal damage curve and that of the marginal cost of reducing emissions intersect (Clarkson and Deyes, 2002). The greater economic impact caused by higher carbon emissions represents the additional cost of the damage that can be avoided if a ton of carbon is removed or never emitted at a given point in time (Anthoff and others, 2011).
Alternatively, the benchmark taken can be just the cost of avoiding additional emissions to achieve a reduction target, rather than the damage caused. This is estimated using integrated assessment modelling that incorporates different scientific disciplines and employs simplified representations of society, the climate and the interactions between climate change, its impact on natural and social systems, and the cost of policies to mitigate that impact. The end result of these models is a monetary estimate of the cost to society today of emitting one ton of carbon.
Source: Economic Commission for Latin America and the Caribbean (ECLAC), on the basis of W. Nordhaus, The Challenge of Global Warming: Economic Models and Environmental Policy, New Haven, Yale University, 2007; D. Anthoff and others, “Regional and sectoral estimates of the social cost of carbon: an application of FUND”, Discussion Paper, No. 2011-18, Kiel, Kiel Institute for the World Economy, 2011; “Equity weighting and the marginal damage costs of climate change”, Ecological Economics, vol. 68, No. 3, Amsterdam, Elsevier, 2009; P. Watkiss, “The social cost of carbon”, Paris, Organization for Economic Cooperation and Development (OECD), 2006; W. Nordhaus, “Estimates of the social cost of carbon: concepts and results from the DICE-2013R model and alternative approaches”, Journal of the Association of Environmental and Resource Economists, vol. 1, Nos. 1–2, Chicago, University of Chicago Press, 2014; N. Stern, The Economics of Climate Change: The Stern Review, Cambridge, Cambridge University Press, 2007; M. Greenstone, E. Kopits and A. Wolverston, “Developing a social cost of carbon for US regulatory analysis: a methodology and interpretation”, Review of Environmental Economics and Policy, vol. 7, No. 1, Oxford, Oxford University Press, 2013; M. Golosov and others, “Optimal taxes on fossil fuel in general equilibrium”, Econometrica, vol. 82, No. 1, Hoboken, Wiley, 2014; C. Hope, “The social cost of carbon following the Stern Review”, Cambridge, University of Cambridge, 2006; O. Kuik and others, “Methodological aspects of recent climate change damage cost studies”, Integrated Assessment Journal, vol. 8, No. 1, Vancouver, Public Knowledge Project (PKP), 2008; R. Clarkson and K. Deyes, “Estimating the social cost of carbon emissions”, Government Economic Service Working Paper, No. 140, London, HM Treasury, 2002.

The climate emergency in Latin America and the Caribbean... 243
There are now a number of estimates derived from integrated models. Among the best-known models are the following:
(i) Dynamic integrated climate-economy (DICE) and regional integrated climate-economy (RICE) models, which are perhaps the most widely used in climate change economics (Nordhaus, 1992; Nordhaus and Boyer, 2000).9
(ii) The policy analysis of the greenhouse effect (PAGE) model (Hope, 2006), which has received wide recognition since the Stern report (2007).
(iii) The computable dynamic stochastic general equilibrium (DSGE) model developed by Golosov and others (2014), which is technically very sound.
(iv) The climate framework for uncertainty, negotiation and distribution (FUND) model (Tol, 1997), which, together with that of Golosov and others (2014), can be used to simulate different scenarios in order to estimate the social cost of carbon.
These models are used with a great variety of specifications and scenarios that enable a range of specific results to be obtained (Li and Nordhaus, 2013).10 However, they have some major limitations, such as incomplete treatment of non-catastrophic effects and potential catastrophic effects, the discount rate problem and climate sensitivity.11
The third and last method of gauging the social price uses the marginal abatement cost curves as a quantitative basis for comparing the cost of reducing emissions among the available alternatives in terms of their effectiveness rather than the damage caused by the emission. Each alternative represents the additional cost of replacing a benchmark technology with a low-emission alternative. Some limitations of these curves are mentioned in the literature:
9 The DICE model contains a macroeconomic growth model in which fossil fuels are a production input that causes CO2 emissions. The increase in emissions in the different blocks of the model results in a rise in temperature that, over time, has negative effects on the economy. There is also the (low) possibility of a catastrophic loss of 30% of total output (Ackerman and Finlayson, 2006).
10 See Clarke and others (2009) for a description of the 10 most used integrated analysis models.11 The discount rate is a controversial issue, as its rationale is purely ethical and value-based, as
seen in the previous section. High discount rates assume a more prosperous future with more technological capacity, making it advisable to postpone climate action in the present. They favour present welfare and minimize the diversion of resources towards climate action. Conversely, those who advocate low and even negative discount rates assume scenarios in which there is no such prosperity owing, among other things, to climate change itself, and in which technological solutions have neither the scale nor the power required. They therefore apply the precautionary principle that, in the face of uncertainty, it is preferable to act decisively now. This approach finds no justification for undervaluing future generations. The discussion between Nordhaus and Stern on this subject, which took place in the first decade of the twenty-first century, is an example of this polarity. Global warming has no historical precedent at these levels, so it seems wiser to apply the precautionary principle.

244 Economic Commission for Latin America and the Caribbean (ECLAC)
• They do not capture institutional or non-commercial barriers to implementation, particularly indirect costs and those not related to the transaction.
• They involve a very limited treatment of the uncertainties in the underlying analyses and the assumptions used (such as the economic life of the options, risk and return properties, and the treatment of the discount rate).
• There are difficulties in capturing the interactions between the different measures, which could limit the total abatement potential.
• They do not address dimensions other than direct costs, e.g., strategic, operational or political factors.
Despite these limitations, the marginal abatement cost method is the one used in Chile, the only country in Latin America and the Caribbean to have implemented a social cost of carbon in the national public investment system. One of the most positive aspects of this method is that it reflects the additional (or marginal) cost of removing a ton of carbon. The social price indicates what the government estimates the country is willing to pay to restrict the amount of carbon that can be emitted into the atmosphere, i.e. to not emit an additional ton. Depending on the social cost of carbon, investment options in which the cost of removing a ton of carbon is lower than that price in the national investment system become viable in the absence of other barriers.
The map of possible investments ranked by the cost of avoiding carbon emissions and their potential emission savings is known as the marginal abatement cost (MAC) curve, with the costs being regional, national or sectoral. Marginal abatement cost curves have been developed in some Latin American and Caribbean countries: in Chile, Brazil, Colombia and Peru under the Mitigation Action Plans and Scenarios (MAPS) project, and in Mexico, where this project was not carried out. The marginal abatement costs (or cost-effectiveness) method makes it possible to quantify the cost of public investment decisions and to compare their effectiveness when it comes to meeting each country’s targets and commitments under the United Nations Framework Convention on Climate Change.
Table V.5 presents some applications of the social cost of carbon at development and investment banks around the world.

The climate emergency in Latin America and the Caribbean... 245
Table V.5 Application of the social cost of carbon in international and development banking,
various years
Bank ApplicationAsian Development Bank (ADB)
A price of US$ 36.3 per ton of carbon dioxide equivalent (tCO2eq) was used in 2016. This price increases by 2% a year in real terms to reflect the growing marginal damage caused by climate change over time.
European Bank for Reconstruction and Development (EBRD)
A carbon price of 35 euros (US$ 43) per tCO2eq has been applied with effect from the greenhouse gas emissions of 2014, rising by 2% a year in real terms. EBRD has not financed any carbon-based energy project since the methodology was introduced.
European Investment Bank (EIB)
The price applied to carbon emissions in 2018 was 38 euros (US$ 47) per tCO2eq. This price has been increasing annually in real terms since 2016, rising to between 121 and 150 euros per tCO2e by 2050. EIB also uses low and high carbon price scenarios in its sensitivity tests.
World Bank A low price and a high price are applied in economic project analyses. These prices are US$ 40 and US$ 80 per tCO2eq, respectively, in 2020, rising to US$ 50 and US$ 100 per tCO2eq, respectively, by 2030. After 2030, they rise at a rate of 2.25% a year up to 2050.
Source: Economic Commission for Latin America and the Caribbean (ECLAC), on the basis of official international data.
The methods used to apply the social price of carbon in two countries of the region, Peru and Chile, will now be described. In the former, the Ministry of Economy and Finance (MEF) applies this price when evaluating public investment projects. In doing so, it incorporates the social benefits or costs of reducing or increasing greenhouse gas emissions (MEF, 2019). The damage calculation methodology (social cost of carbon methodology) of the Nordhaus dynamic optimization model (DICE), serving to estimate the optimal production path for capital stock and emissions, was used to estimate the social price of carbon. The DICE model offered the following advantages:
• It is easy to calibrate and simulate, so reference pathways could be constructed from aggregate projections to 2030 made by the country’s institutions.
• It requires only a few parameters whose values could be obtained from available studies on the Peruvian economy.
• Emissions from land use change and deforestation can be managed exogenously, while emissions associated with energy production and transport are modelled endogenously.
The following procedure was used to calculate the social price of carbon:
(i) Input emission pathways, GDP and population, and calculate the temperature and per capita consumption associated with the baseline scenario year by year.
(ii) Add one unit of carbon emissions in year t and recalculate year by year, from t onwards, the temperature and per capita consumption pathways resulting from this emissions adjustment.

246 Economic Commission for Latin America and the Caribbean (ECLAC)
(iii) Compute the marginal damage caused in each year on the basis of the per capita consumption calculated in steps (i) and (ii).
(iv) Discount the resulting marginal damage series from the base year using a fixed discount rate and calculate the social price of carbon as the net present value of the damage series.
Because Peruvian emissions are only a small share of the global total, the temperature change due to the country’s contribution is not substantial and so was omitted from the calculation. The objective taken was to limit the marginal increase in emissions to 100,000 tons of carbon. In this way, the values presented in table V.6 were obtained for the discount rate and time horizons chosen (2050 and 2100). The social price of carbon in Peru was calculated at US$ 6.38 per ton of carbon in 2014, in the scenario where the social discount rate is 9% and the horizon is 2100.
Table V.6 Peru: social price of carbon depending on the discount rate and time horizon chosen, 2014
(Dollars per ton of carbon)
Time horizonDiscount rate (percentages)
9 5 3 2.50To 2050 (37 years) 5.15 7.08 8.49 8.9To 2100 (87 years) 6.38 10.99 15.79 17.48
Source: F. Cartes, “Metodología de inclusión de precio social de carbono en proyectos de inversión pública”, document presented at the Regional Seminar on Instruments of Green Fiscal Policy, Climate Change and Environmental Sustainability, San José, Economic Commission for Latin America and the Caribbean (ECLAC), 7–8 November 2018; University of the Pacific Research Centre (CIUP), Estimación del precio social del carbono para la evaluación social de proyectos en el Perú, Lima, University of the Pacific, 2016.
Chile uses the methodological approach of the United Kingdom, which is based on the willingness to reduce, and therefore pay for, greenhouse gas emissions in a way that is compatible with the mitigation target set in the NDC. The social price of carbon was estimated in Chile by analysing the marginal cost of reducing carbon dioxide emissions to meet the NDC. This analysis was carried out in the framework of the MAPS Chile project. Diagram V.1 provides a schematic illustration of the methodology used in the country. In the MAPS Chile project, more than 96 greenhouse gas emission reduction measures were evaluated. Multisectoral groups developed mitigation scenarios to analyse the cost of abatement, the potential for mitigation and the feasibility of each measure, such as promoting energy efficiency, increasing the share of non-conventional renewable energies and using nuclear power. Specific scenarios were used (baseline, mid-range and high) along with an 80/20 effectiveness scenario to identify measures leading to 80% compliance with the target (compared to the 20% left unanalysed), which groups together a small set of mitigation measures that together have high mitigation potential. For each of these scenarios, CO2eq emissions were projected and marginal abatement cost curves were constructed, such as the one shown in figure V.6.

The climate emergency in Latin America and the Caribbean... 247
Diagram V.1 Chile: methodology for estimating the social price of carbon, 2014
Reduce emission intensity by 30% from
the 2007 level by 2030. Conditionally, reduce emissions by between
35% and 45%.
Greenhouse gas mitigation measures
applied to the situation in the country.
Packaging of measures in mitigation scenarios.
Marginal cost analysis of each of
the measures in each proposed scenario.For each scenario, rank the measures in ascending order
by marginal abatement cost and abatement potential.
Calculation of the shadow carbon price
using the marginal abatement cost curves of each scenario and the abatement target
for 2030.
MAPS Chile Shadow price of carbon
Chile’s nationally determined
contribution under the Paris
Agreement
Marginal abatement cost
curves
Source: Ministry of Social Development, Integrando el cambio climático en el sistema nacional de inversión pública de Chile, Santiago, 2017.
Figure V.6 Chile: marginal greenhouse gas abatement cost curve according to the abatement
potential of each measure in the non-conventional renewable energy scenario of the MAPS Chile project by 2030
(Dollars per tCO2)
-300
-200
-100
0
100
200
300
400
0 5 10 15 20 25 30 35
Renewable energies for thermal uses in new and existing installations
Use of non-conventional renewable energies in irrigated agriculture
Electricity generation in irrigation works
Self-supply of electricity
Cos
t
Abatement potential in millions of tons of carbon dioxide (MtCO2)
47.3 49.5
35% emissions abatement target
(29.57 MtCO2)
30% emissions abatement target
(18.25 MtCO2)
Electricity generation with biogas in landfills
Incentives for mini-hydro technology
Anaerobic digestion plant for municipal
solid waste
Incentives for wind technology
Self-generation projects with non-conventional renewable energies
in industrial and mining plants
Amendment of the Non-conventional Renewable Energy
Act: 30/30 (30% by 2030)
Incentives for photovoltaic technology
Incentives for geothermal technology
Incentives for solar concentration technology
Promotion of cleaner networks by applying a contract-based
emission factor checked against actual generation
under these contracts
Source: MAPS Chile, Resultados de fase 2, Santiago, 2014.
There is a social price for carbon associated with each of the targets in each specific scenario. For example, in the non-conventional renewable energies scenario, if the targets of reducing emissions by 30%12 and 35% are taken, the social price or marginal cost of the reduction is US$ 47.3 and US$ 49.5 per tCO2, respectively.
12 This reduction represents 75% of what would have to be abated or offset in Chile to reach carbon neutrality, considering emissions and captures in 2017.
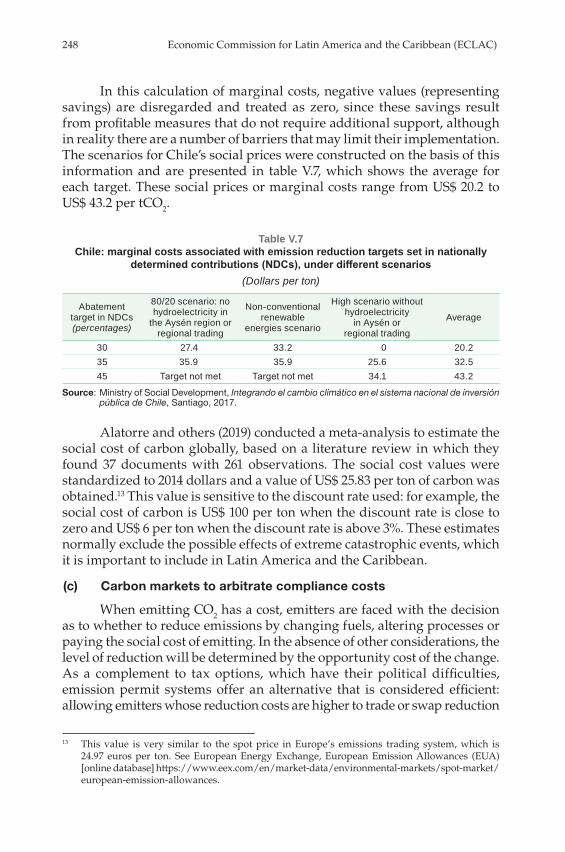
248 Economic Commission for Latin America and the Caribbean (ECLAC)
In this calculation of marginal costs, negative values (representing savings) are disregarded and treated as zero, since these savings result from profitable measures that do not require additional support, although in reality there are a number of barriers that may limit their implementation. The scenarios for Chile’s social prices were constructed on the basis of this information and are presented in table V.7, which shows the average for each target. These social prices or marginal costs range from US$ 20.2 to US$ 43.2 per tCO2.
Table V.7 Chile: marginal costs associated with emission reduction targets set in nationally
determined contributions (NDCs), under different scenarios(Dollars per ton)
Abatement target in NDCs (percentages)
80/20 scenario: no hydroelectricity in
the Aysén region or regional trading
Non-conventional renewable
energies scenario
High scenario without hydroelectricity
in Aysén or regional trading
Average
30 27.4 33.2 0 20.235 35.9 35.9 25.6 32.545 Target not met Target not met 34.1 43.2
Source: Ministry of Social Development, Integrando el cambio climático en el sistema nacional de inversión pública de Chile, Santiago, 2017.
Alatorre and others (2019) conducted a meta-analysis to estimate the social cost of carbon globally, based on a literature review in which they found 37 documents with 261 observations. The social cost values were standardized to 2014 dollars and a value of US$ 25.83 per ton of carbon was obtained.13 This value is sensitive to the discount rate used: for example, the social cost of carbon is US$ 100 per ton when the discount rate is close to zero and US$ 6 per ton when the discount rate is above 3%. These estimates normally exclude the possible effects of extreme catastrophic events, which it is important to include in Latin America and the Caribbean.
(c) Carbon markets to arbitrate compliance costs
When emitting CO2 has a cost, emitters are faced with the decision as to whether to reduce emissions by changing fuels, altering processes or paying the social cost of emitting. In the absence of other considerations, the level of reduction will be determined by the opportunity cost of the change. As a complement to tax options, which have their political difficulties, emission permit systems offer an alternative that is considered efficient: allowing emitters whose reduction costs are higher to trade or swap reduction
13 This value is very similar to the spot price in Europe’s emissions trading system, which is 24.97 euros per ton. See European Energy Exchange, European Emission Allowances (EUA) [online database] https://www.eex.com/en/market-data/environmental-markets/spot-market/european-emission-allowances.
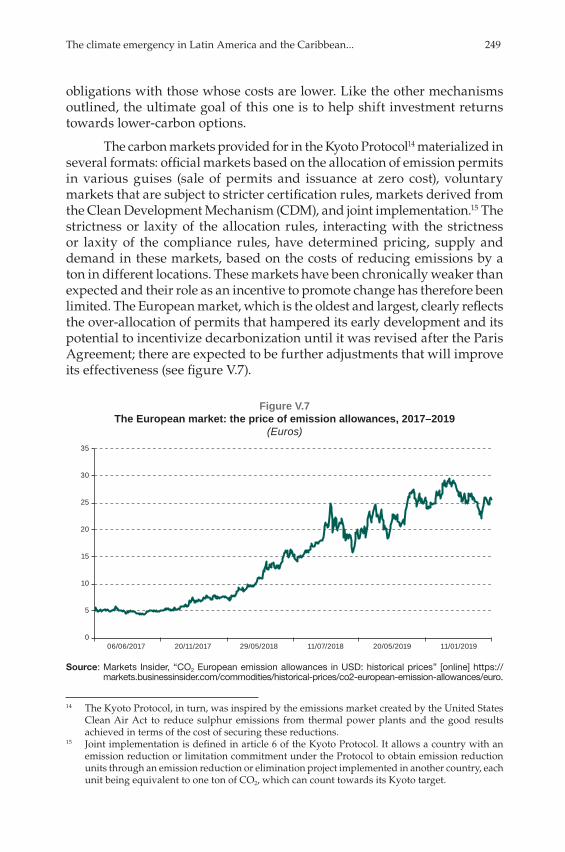
The climate emergency in Latin America and the Caribbean... 249
obligations with those whose costs are lower. Like the other mechanisms outlined, the ultimate goal of this one is to help shift investment returns towards lower-carbon options.
The carbon markets provided for in the Kyoto Protocol14 materialized in several formats: official markets based on the allocation of emission permits in various guises (sale of permits and issuance at zero cost), voluntary markets that are subject to stricter certification rules, markets derived from the Clean Development Mechanism (CDM), and joint implementation.15 The strictness or laxity of the allocation rules, interacting with the strictness or laxity of the compliance rules, have determined pricing, supply and demand in these markets, based on the costs of reducing emissions by a ton in different locations. These markets have been chronically weaker than expected and their role as an incentive to promote change has therefore been limited. The European market, which is the oldest and largest, clearly reflects the over-allocation of permits that hampered its early development and its potential to incentivize decarbonization until it was revised after the Paris Agreement; there are expected to be further adjustments that will improve its effectiveness (see figure V.7).
Figure V.7 The European market: the price of emission allowances, 2017–2019
(Euros)
0
5
10
15
20
25
30
35
11/01/201920/05/201911/07/201829/05/201820/11/201706/06/2017
Source: Markets Insider, “CO2 European emission allowances in USD: historical prices” [online] https://markets.businessinsider.com/commodities/historical-prices/co2-european-emission-allowances/euro.
14 The Kyoto Protocol, in turn, was inspired by the emissions market created by the United States Clean Air Act to reduce sulphur emissions from thermal power plants and the good results achieved in terms of the cost of securing these reductions.
15 Joint implementation is defined in article 6 of the Kyoto Protocol. It allows a country with an emission reduction or limitation commitment under the Protocol to obtain emission reduction units through an emission reduction or elimination project implemented in another country, each unit being equivalent to one ton of CO2, which can count towards its Kyoto target.

250 Economic Commission for Latin America and the Caribbean (ECLAC)
(d) Tradable emission permits
The tradable emission permit system sets the maximum limit for total allowable emissions in an area, sector or system, regardless of who makes the emission reduction effort within the system boundary.16 The emphasis is on the amount of CO2 emissions, and the implicit price of these is revealed by the market thus constructed (Goulder and Schein, 2013). This is the main advantage of the system: it allows the public policy objective, i.e. the reduction of emissions, to be clearly established.
The allocation of permits can be contentious. There is no theoretical reason not to give out permits for free and in perpetuity (as in Chile’s problematic and regressive model of water rights allocation), but from a practical and political perspective this is not feasible and initiatives have opted to auction permits and restrict the period of compliance to three years. This has allowed the authorities to maintain control, but has limited the development of the secondary market, so that, in practice, the system is more like a tax than a tradable emission permit system.
In the same way as taxes, a tradable emission permit system may include only carbon dioxide emissions, as with the Regional Greenhouse Gas Initiative (RGGI), or it may include all greenhouse gases, as in California. First, governments set an emissions cap for a limited geographic area (a jurisdiction, in the cases known to date) and then allocate emission permits to specific establishments, either for free or for a consideration, by purchase or auction.17 Once the emission permits have been delivered or auctioned, companies can trade them. If the market works, and there is no incentive to accumulate or speculate because of uncertainty, the companies with lower abatement costs will sell their emission allowances in secondary markets to companies with higher costs, and the total emissions target will generally be met at a lower cost (Goulder and Shein, 2013; Aldy and Stavins, 2012).
The system is more complex than that needed to implement a tax, but it can lead to greater cost efficiency. Designing a tradable emission permit system involves determining which emissions and sectors or areas will be regulated, what the emission limit will be, at what point emissions will be regulated (upstream or downstream) and how the permits will be allocated
16 Tradable emission permits set an upper limit on total emissions, and limited permits are allocated to emitters to make up the maximum established. Emitters can trade the allocated permits on secondary markets, which enables a market price to be established for emissions by creating supply and demand for permits.
17 In the case of the sulphur reduction market created in the United States as a result of the Clean Air Act, those regulated were participants in the coal-fired power generation sector, regardless of location. Discussions on the rules and instruments to be used to control aviation and bunker fuels will have to focus on mobile emission sources within a sector. One approach would be to identify territorial sectoral combinations within a country or even in global sectors, such as cement manufacture, regardless of where in the world production takes place.

The climate emergency in Latin America and the Caribbean... 251
and distributed. As with taxes, the use to which the revenues will be put if the permits are sold or auctioned must be resolved and the impact on competitiveness determined.
Measures can be taken to complement the tradable emission permit system, such as allowing emission credits to be taken up between compliance periods or permits to be accumulated or loaned for future compliance periods, creating a reserve to stabilize prices and ensure liquidity, creating trading registries to monitor and track carbon offsets, accounting for carbon offsetting, and linking various systems internationally.18 Emission permits present an institutional challenge, as it is necessary to build an additional market, create an institutional infrastructure and resolve issues related to measurement, reporting and verification of emissions, permits, abatements and trading.19
Carbon pricing instruments involving emission reduction markets have been implemented in several countries and subnational jurisdictions (states) of the Americas to support climate change mitigation efforts. Because of the potential for synergies between carbon pricing systems, this section considers not only some Latin American countries but also some North American jurisdictions.
The two main systems in the Americas are the Western Climate Initiative (WCI) and the Regional Greenhouse Gas Initiative (RGGI).
The Western Climate Initiative, Inc. is an initiative of some states in the United States and some provinces in Canada to coordinate mitigation policies and jointly implement a system of tradable emission permits. In 2019, British Columbia, California, Manitoba, Nova Scotia and Quebec were members of the initiative, but only California and Quebec established tradable emission permit systems linked to joint auctions. Beginning in January 2013, tradable emission permit systems were established independently in these two jurisdictions. One year later, on 1 January 2014, the systems were linked and the first tradable emission permit system connected internationally between two subnational jurisdictions was created. In 2017, Ontario launched its tradable emission permit system with the goal of linking it to the California and Quebec carbon market; however, its prime minister decided not to link it. At present, only Nova Scotia is considering establishing a tradable emission permit system.
Western Climate Initiative had an initial compliance period of two years, since when each compliance and permit allocation period has lasted three calendar years. Permits for each period’s emissions are issued by 1
18 Linking means integrating emission permit markets.19 Like all markets, tradable emission permit markets are the product of a regulatory structure within which
they operate.

252 Economic Commission for Latin America and the Caribbean (ECLAC)
November (or the first business day thereafter) of the second year of the period. To date, the compliance periods have been as follows: 2013–2014, 2015–2017 and 2018–2020.
In both California and Quebec, the permit allocation system is complex, with permits being distributed by auction or free allocation, depending on the sector, and transition periods are set so that affected businesses can adjust more readily. Electricity distribution services and natural gas suppliers receive permits on behalf of their customers. Investor-owned electric services access permits through state auctions. In California, the programme initially covered six greenhouse gases within the industrial and electricity sectors. In 2015, coverage was expanded to include transportation fuels and natural gas (CARB/MDDELCC, 2017).
The Government of Canada is pursuing an initiative to bring together the carbon pricing criteria of the various market initiatives in some Canadian provinces. This includes the tradable emission permits already mentioned and the British Columbia CO2 tax, among other things.
Mexico has moved towards the creation of an institutional framework that will enable a national market to be established and declared its intention of joining WCI, and in October 2019 it published the ground rules for the Emissions Trading System Test Programme (SEMARNAT, 2019).
The Regional Greenhouse Gas Initiative (RGGI), which includes the states of Connecticut, Delaware, Maine, Maryland, Massachusetts, New Hampshire, New York, Rhode Island and Vermont, was the first mandatory tradable emission permit programme in the United States, covering only CO2 emissions and the electricity sector. The system sets an emissions cap that falls by 2.5% per year until 2020 and 3% thereafter. Permits are acquired mainly through quarterly auctions, with a standardized price format and closed bidding.
The Initiative is notable for its transparency and commitment to the periodic review programme designed to make adjustments to the tradable emission permit market (Rahim, 2017). The implementation of the Initiative was accompanied by a 57% reduction in CO2 emissions in the region in the period 2005–2016. Although not all the reduction in emissions can be attributed exclusively to the Initiative, given that other policies have operated, one estimate found that total emissions would have been at least 24% higher if the programme had not been implemented (Murray and Maniloff, 2015). Table V.8 shows the main characteristics of tradable emission permits in the Americas.

The climate emergency in Latin America and the Caribbean... 253
Table V.8 The Americas: characteristics of tradable emission permits in selected jurisdictions,
2012 to the present
Subnational jurisdictions
Tradable emission permits
Tradable emission permits Tax base Start
year
Floor price (dollars per ton of CO2eq)
National coverage (percentages of greenhouse
gases)California Linked tradable CO2eq
emission permits, minimum price, offsetting, free permits and auctions
Emissions 2014 14 and rising 85
Quebec Linked tradable CO2eq emission permits, minimum price, offsetting, free permits and auctions
Emissions 2014 14 and rising 71
Regional Greenhouse Gas Initiative (RGGI)
Integrated tradable CO2eq emission permits, minimum price, offsetting, permit auctions, electricity sector only
Emissions 2012 2.15 23
Source: Economic Commission for Latin America and the Caribbean (ECLAC), on the basis of official international data.
While policies and regulations aimed at mitigating greenhouse gases exist in every country and in subnational jurisdictions, it is estimated that initiatives can have a significant synergistic impact in terms of reducing greenhouse gas mitigation costs, and market instruments (permits and certificates) are expected to be an important complementary element in efforts to implement the Paris Agreement climate agenda.
The practical difficulties of implementing the two pure carbon pricing instruments described above have been addressed by designing systems that combine features of both, or hybrid systems combining taxation and emissions trading. For example, in a tax system there may also be emission caps, or offsets may be incorporated as a complementary mechanism to reduce abatement costs, as with the Mexican tax. Likewise, in a system of tradable emission permits, a price band can be established in the market to provide certainty about the long-term price and avoid variability. The decision will ultimately depend on the political feasibility of implementing one or the other system and on the willingness of the authorities to provide markets with long-term certainties while offering a degree of flexibility in short-term operations.
In essence, hybrid tradable emission permit systems with price bands and auctions are equivalent to tax systems. In turn, tax systems with an emissions cap and offsetting are equivalent to a tradable emission permit system. Hybrid systems can incorporate the advantages and mitigate the disadvantages of both instruments. Moreover, not only do they help to

254 Economic Commission for Latin America and the Caribbean (ECLAC)
prevent price volatility and ensure that emissions are effectively reduced, but they can reduce the potential for error of each of the two pure instruments (Goulder and Schein, 2013). Notwithstanding the advantages they offer from an economic perspective, hybrid systems necessarily involve a greater administrative effort, which means that the cost of implementation is higher and that a more advanced institutional infrastructure and a more complex measurement, reporting and verification system must be in place.
Diagram V.2 schematically compares and equates the various hybrid systems in which carbon pricing applies. The lower arrow represents taxes and the upper arrow tradable emission permit systems. Pure carbon pricing instruments are located at either end of the arrows, where the carbon tax, or green tax, and tradable emission permits with ownership rights are shown. As changes are made to the two instruments, they move closer together and are comparable. For example, a tradable emission permit system with annual auctions is closer to a tax than to a pure permit system, while a tax with offsets is closer to a pure permit system than to a tax.
Diagram V.2 Equivalence between selected types of hybrid carbon pricing systems
System of tradable emission permits with
annual auctions, ceiling and floor
System of tradable emission permits
with auctions System of tradable emission permits with
ownership rights in perpetuity
Green tax
Revenue-neutral green tax
Green tax with offsets
Source: Economic Commission for Latin America and the Caribbean (ECLAC), on the basis of official international data.
In 2018, following the formation of the platform for cooperation on carbon pricing in the Americas, both entities or jurisdictions of the Western Climate Initiative and Chile, Colombia, Costa Rica, Mexico and its state of Sonora, and Peru have held regular meetings with the support of the World Bank Partnership for Market Readiness (PMR) and ECLAC, and with funding from EUROCLIMA+, a European Union project, to support the harmonization of their measurement, reporting and verification systems so that emissions trading in an expanded market is facilitated by the mutual acceptance of procedures.

The climate emergency in Latin America and the Caribbean... 255
2. Tax measures
(a) Environment-related taxes in the region
The application of economic policy instruments to protect the environment in general and promote climate change mitigation and adaptation in particular is based on the idea that making sustainable use of natural resources has benefits or that destroying those resources has costs which are not fully reflected when market prices are formed (Lorenzo, 2018). Environmental taxes are a price assigned to carbon and are intended to change the behaviour of consumers and producers and to internalize the cost of environmental side effects that have a cost to society. The ultimate effect of the tax is to change the profitability of production and consumption patterns in favour of lower-carbon options by sending a signal to society as a whole.
The economic literature recognizes that environmental pollution problems, such as deteriorating air quality and global warming, can be corrected, albeit partially, through excise taxes on the consumption of goods such as petrol and cars (Ferrer and Escalante, 2014). These taxes are sources of revenue for government and can be designed to reflect the cost of externalities that consumers and producers of polluting goods and services pass on to others. In the context of a profound change in production and consumption patterns, such designs are part of a reorientation that should be consistent and comprehensive and encompass much more than fiscal policy instruments.
In the international context, environmental taxes have gained importance as part of fiscal reforms, particularly in the most developed countries. In the countries of Latin America and the Caribbean, although there is no history of fiscal reforms whose central objective is environmental, an increasing number of taxes that provide environmental benefits have been introduced, such as taxes on the carbon content of fossil fuels, energy, energy emissions and vehicles, as well as traditional taxes levied on fuels because of the revenue-raising potential resulting from their low price elasticity (see figure V.8).20
Fuel tax is the main environment-related tax in the countries of the region and usually generates the bulk of the revenue from such taxes. In addition, several countries have adopted measures to curb the use of private urban transport, which is also a greenhouse gas emission reduction measure (Lorenzo, 2016).
20 Low price elasticity is a characteristic that fossil fuels have traditionally shared with other goods that are addictive, such as alcohol and tobacco. More recently, it has been recognized that the sugar contained in food and beverages also has this characteristic. Sugar is of interest not because it is polluting, but because the problems it causes, such as obesity and diabetes, have to be dealt with by public health systems and affect society’s productive capacity.

256 Economic Commission for Latin America and the Caribbean (ECLAC)
Figure V.8 Latin America: structure of taxation related to the environment, 2016
(Percentages of GDP)
Other Transport Energy
0
0.5
1.0
1.5
2.0
2.5
3.0
Hon
dura
s
Cos
ta R
ica
Uru
guay
Mex
ico
Nic
arag
ua
Para
guay
Arg
entin
a
Chi
le
Gua
tem
ala
Pana
ma
Bra
zil
Col
ombi
a
El S
alva
dor
Peru
Ecua
dor
Dom
inic
anR
ep.
Bol
ivia
(Plu
r. S
tate
of)
Latin
Am
eric
a(1
7 co
untri
es)
OEC
D(3
4 co
untri
es)
Source: Economic Commission for Latin America and the Caribbean (ECLAC), Fiscal Panorama of Latin America and the Caribbean, 2019 (LC/PUB.2019/8-P), Santiago, 2019.
Automobile use and the associated fuel consumption produce problems and externalities in the form not only of poorer air quality and consequences for people’s health, but also of traffic congestion, road accidents in major urban centres and indeed the costs associated with the provision and maintenance of infrastructure for private motor transport. These externalities make taxes on cars and fuels an important issue for public decision-makers and a challenge for those designing the tax.
Estimating the optimal level of the tax is complex, as it depends on technical, scientific and public policy considerations as well as on the estimation methodology used. Many estimates exist, but according to the Report of the High-Level Commission on Carbon Prices, led by economists Joseph Stiglitz and Nicolas Stern, a price that would be compatible with the Paris Agreement goals would be between US$ 40 and US$ 80 per ton of CO2 in 2020, and between US$ 50 and US$ 100 by 2030 (High-Level Commission on Carbon Prices, 2017). Other considerations include the effects on competitiveness, distributive impact, consistency with other instruments and, above all, political feasibility.
Currently, taxes vary greatly by country and jurisdiction (see table V.9). Each of the countries considered has regulations that actually reduce the tax base. In British Columbia, for example, all revenue is recycled to economic agents; as a result, the final burden is considerably lower than the values in the table would indicate, since the revenue allows other taxes to be lowered

The climate emergency in Latin America and the Caribbean... 257
(Murray and Rivers, 2015). Another example is Sweden: the world’s highest CO2 tax was implemented there in 1991, but exemptions and other benefits brought the effective rate down to 11 euros per tCO2 in 1990–2004 (Lundgren and Marklund, 2010). The tax was 105 euros and 132 euros per tCO2 in 2001 and 2017, respectively.
Table V.9 British Colombia (Canada) and 15 selected countries: carbon tax rates, 2017
(Dollars per tCO2eq)
Jurisdiction Jurisdiction
British Columbia 24 Japan 3
Chile 5 Mexico 1–3
Denmark 27 Norway 3–56
Finland 69–73 Portugal 8
France 36 United Kingdom 24
Iceland 12 South Africa 8.5
India 6 Sweden 132
Ireland 24 Switzerland 87
Source: World Bank, World Development Indicators [online database] https://databank.bancomundial.org/source/world-development-indicators.
It can be seen that the value of the carbon tax on fossil fuels in the region (US$ 3 in Mexico, US$ 5 in Chile) is not significant enough to change consumer behaviour. Nevertheless, this tax is still a sign of the direction society wishes to move in as regards the use of these fuels. For this tax to act as a deterrent and approach the value of the externality, it would have to be at least US$ 40 to US$ 100 per ton. Low price elasticity means that governments choose to assign a very low value to this tax, and this is why it raises only modest revenues and is not very decarbonizing.
In 2008, the Canadian province of British Columbia began to apply a wide-ranging tax to all fuels at a rate calculated on the basis of their carbon content. This was the first experiment with a CO2 tax in the Americas and its main feature is that it is revenue-neutral. Virtually all the revenue from it is returned to households and economic agents. This made it possible to reach broad political agreement on its implementation. Consequently, it is a fairly high tax compared to those applied in other jurisdictions: it was US$ 24 per tCO2eq in 2017 and is scheduled to increase to US$ 39 in 2022 (Murray and Rivers, 2015).
Although almost all jurisdictions in the Americas have fuel taxes, especially for transport fuels, only five countries have implemented an explicit CO2 tax, for reasons that differ from country to country. These
258 Economic Commission for Latin America and the Caribbean (ECLAC)
countries are Argentina, Canada, Chile, Colombia and Mexico. There are minor though significant differences in the structure of the tax and the institutional infrastructure in the five countries. The Latin American countries that have implemented fuel taxes based on carbon content are Argentina, Colombia and Mexico. In the first two, the tax rises progressively to US$ 10 per tCO2eq. Colombia’s tax is relatively limited: it covers all fuels except natural gas (in power generation) and coal, which means that it only covers 20% of emissions (40 million tons). It does, however, have the innovative feature that all revenues, estimated at US$ 160 million per year, will go into an environmental fund.
In Mexico, the tax is only US$ 1 to 3 per tCO2eq and, as in Colombia, natural gas is exempt. The tax was a first step in the design of other systems of instruments to set a carbon price and has served to create an institutional infrastructure capable of accommodating the tradable emission permit systems of the Western Climate Initiative, which has been declared the main objective. On 1 October 2019, the ground rules for the operation of an emissions market were published (SEMARNAT, 2019). If the country joins the Western Climate Initiative system, the CO2 price will have to be increased, at least implicitly. The system of tradable emission permits operated by California and Quebec has a minimum price of US$ 14 per tCO2. Changing the value of the tax is likely to be difficult, however, as both the previous and the current governments have pledged not to alter the level of taxation, as part of a policy of not increasing the tax burden.
In Chile, the carbon tax is based on emissions at source, regardless of the carbon content of the fuel or the sector emitting. This model is more complicated than taking the carbon content of fossil fuels as the basis for the tax. Applying this tax meant adapting the institutional system to measure or estimate emissions at source, in order to be able to collect the tax in coordination with the Ministry of Finance. This could pave the way for the country to move towards complementary systems, such as offsetting or even tradable emission permits (Pizarro, Pinto and Ainzúa, 2018a and 2018b). Table V.10 presents the main characteristics of these taxes.
Figure V.9 presents estimates of the optimum level for a petrol tax that incorporates the social cost of local pollution, accidents and health effects, among other things. For example, there are estimates for El Salvador and Guatemala indicating that road congestion and local pollution are the most important elements when a fuel tax is considered (Hernández and Antón, 2014).

The climate emergency in Latin America and the Caribbean... 259
Table V.10 British Columbia (Canada) and Latin America (4 countries): characteristics
of carbon taxes, 2008–present
National and subnational jurisdictions
Tax on CO2 Tax base Start year
Tax rate (dollars per
tCO2eq)
National coverage
(percentages of greenhouse
gases)Argentina Tax on fuel, carbon
content. Section III of Law No. 23966.
Purchase and sale of fossil fuels. All sectors except biofuels.
2018 1–10 (2019–2028)
40
Colombia Tax on fuel, carbon content. Art. 221 of Law No. 1819, December 2016.
Purchase and sale of fossil fuels. All fuels except coal and natural gas for electricity generation.
2017 5 20
Chile Tax on emissions. Art. 8 of Law No. 20780 and the later simplified version, Law No. 20899.
Emission in boilers or turbines (>50 MW). All sectors and fossil fuels except biomass.
2017 5 42
Mexico Tax on fuel, carbon content.
Purchase and sale of fossil fuels. All fuels except gas.
2014 1–4 30
British Columbia
Revenue-neutral tax. All fuels with minimal exceptions.
2008 24 70
Source: Economic Commission for Latin America and the Caribbean (ECLAC), on the basis of official international data.
Figure V.9 Latin America (6 countries): level a petrol tax should have to reflect
externalized costs, various years(Cents per litre)
0
10
20
30
40
50
60
70
Brazil Chile Ecuador El Salvador Guatemala Mexico
Accidents Congestion Local pollutionRamsey tax Pollution from fuel
Source: F. Hernández and A. Sarabia, “El impuesto óptimo a la gasolina en Guatemala”, Project Documents (LC/TS.2018/65), Santiago, Economic Commission for Latin America and the Caribbean (ECLAC), 2018; I. Parry and others, Getting Energy Prices Right: From Principle to Practice, Washington, D.C., International Monetary Fund (IMF), 2014; A. Sarabia and F. Hernández, “Optimal gasoline tax in developing, oil-producing countries: the case of Mexico”, Energy Policy, vol. 67, Amsterdam, Elsevier, 2014.
Note: Taxes are in 2011 prices for Mexico, El Salvador and Ecuador, 2010 prices for Brazil and Chile and 2016 prices for Guatemala.

260 Economic Commission for Latin America and the Caribbean (ECLAC)
Table V.11 presents a summary of the environment-related taxes or fiscal instruments applied in Latin America and the Caribbean countries between 1991 and 2018.
Table V.11 Latin America and the Caribbean (19 countries): fiscal instruments benefiting
the environment, 1991–2018
Country Years Tax measureArgentina 2013
and 2018• Average tax of 10%, ranging from 30% to 50% depending on vehicle
type, on high-end cars and motorcycles, boats and sport aircraft.• Fuel tax based on carbon content.
Bolivia (Plurinational State of)
2007 and 2014
• Additional 12.5% rate for mining through reform of corporation tax.
Brazil 2013 and 2014
• Electricity taxes.• Increase in tax rates on industrialized products for passenger
transport vehicles.Chile 2005, 2014
and 2017• The 2014 tax reform included a tax on new vehicles sales, varying
with the urban energy efficiency of each vehicle in km/l, with the objective of charging for the environmental damage caused by vehicles over their lifetimes.
• Tax of US$ 5 per ton of carbon emitted by generating companies with installed capacity over 50 MW.
• Progressive tax on mining operations whose sales exceed 12,000 tons of fine copper per year. The tax varies between 0.5% and 34.5% depending on the amount of sales and, from 50,000 tons upward, on the operating margin.
Colombia 1993, 2014 and 2018
• Creation of a parafiscal contribution to mitigate fuel price fluctuations
• Application of compensatory taxes for water pollution.• Application of royalties for oil production.• Application of logging taxes when reforestation does not
compensate for the depletion of the resource.• Tax on the carbon contained in hydrocarbons.
Costa Rica 2009 and 2013
• Tax of US$ 25 on each overland goods export shipment.
Cuba 2012 • Tax of 35% on company revenues (50% in the case of natural resources).
Dominican Republic
2012–2013 • Increase in the excise duty on hydrocarbons with the introduction of an ad valorem rate.
Ecuador 2011 and 2014
• Vehicle pollution tax.• New progressive excise tax rate, which is lower for hybrid
and electric vehicles.• Tax of US$ 0.02 per unit on non-returnable plastic bottles.
El Salvador 2009 and 2013
• New ad valorem tax on first registration of vehicles: automobiles: 1% to 8%; boats: 2% to 10%; aircraft: 2% to 5%.
• New ad valorem tax on fuel sales based on the international oil price.
Guatemala 2012 and 2013
• A special tax was introduced for the first registration of land motor vehicles.
• Tax on the use of land, sea and air vehicles. Honduras 2011, 2012
and 2013• Introduction of a surcharge (eco-tax) on used vehicle imports
of between 5,000 and 10,000 lempiras.• Increase in the tax on imports of oil and oil products.• Reduction of the electricity subsidy.• Tax on the revenue of foreign air, land and sea transport
companies. The rate is 10% of total annual gross income originating in Honduras.

The climate emergency in Latin America and the Caribbean... 261
Country Years Tax measureMexico 1991, 2013
and 2014• Creation of a tax on the sale and import of fossil fuels, according
to their carbon content. The tax averages US$ 3 per ton of carbon emitted (2013 fiscal reform); natural gas is exempt because it is considered clean.
• Reform of value added tax: a 16% rate is applied to foreign passenger transport.
• Tax on hydrocarbon exploitation and extraction.• Tax on wastewater disposal in any receiving body (land, rivers,
seas, etc.).• Payment of fees to protect reefs.
Nicaragua 2009 and 2012
• Increase in the vehicle tax rate.
Panama 2012 • Value added tax reform: a 16.5% rate is applied to business electricity consumption.
Peru 2007 and 2012
• Introduction of differentiated rates in the selective consumption tax (ISC). These rates apply to fuels such as diesel, petrol and kerosene, according to how harmful they are.
• Abolition of the 10% rate for this tax on imports of new cars that run on natural gas or petrol.
Trinidad and Tobago
2000 • Tax of 0.1% on the gross revenues of oil companies. The proceeds of the tax go into a green fund.
Uruguay 2012 and 2013
• Increase in the top rates of the specific domestic tax (IMESI) applicable to motor vehicles.
Venezuela (Bolivarian Republic of)
2006 • Tax of 33.33% on hydrocarbon extraction.
Source: Economic Commission for Latin America and the Caribbean (ECLAC), Panorama Fiscal de América Latina y el Caribe, 2014: hacia una mayor calidad de las finanzas públicas (LC/L.3766), Santiago, 2014.
One of the advantages of production and consumption taxes is that they are easy to implement, especially when applied to fuels. Unlike more sophisticated systems, such as tradable emission permits (emission tax), they do not require a complex system of measurement, reporting and verification and can be implemented through the existing tax administration system. A carbon tax is a Pigouvian tax par excellence, enabling the unaccounted external cost of the CO2 emitted from an economic activity to be internalized (Metcalf and Weisbach, 2009).
One of the lessons learned from the cases of Mexico and Chile is that carbon taxes should not be designed as one-time changes: it is better to plan for a progressive increase over time, starting as soon as they are introduced, as this sends out a much more powerful directional signal. If a tax is adopted at a low rate and no such increase is envisaged, it will be politically more difficult to agree on increases that will make it an effective lever for change, especially at a time of sluggish economic growth in the region such as the second half of the 2010s.
Map V.1 shows the jurisdictions in the world where there have been carbon pricing initiatives.
Table V.11 (concluded)
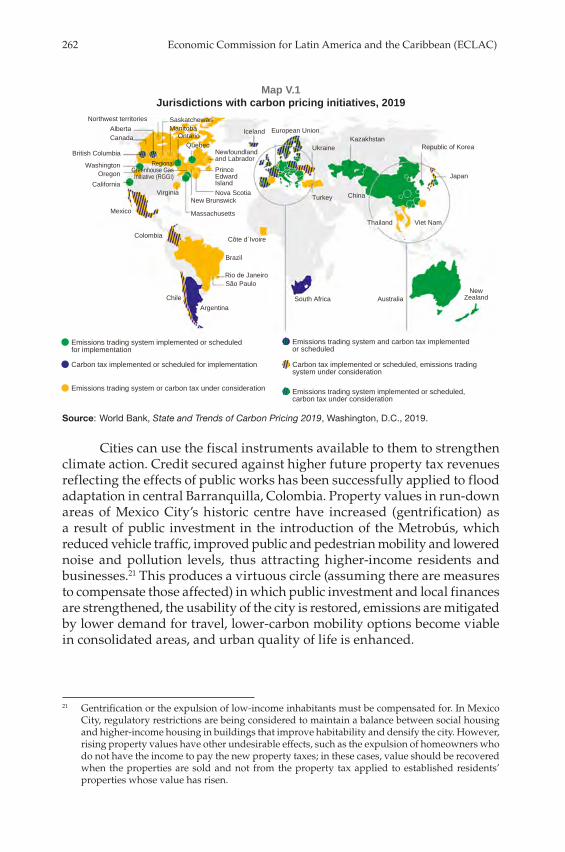
262 Economic Commission for Latin America and the Caribbean (ECLAC)
Map V.1 Jurisdictions with carbon pricing initiatives, 2019
Emissions trading system implemented or scheduled for implementation
Carbon tax implemented or scheduled for implementation
Emissions trading system or carbon tax under consideration
Emissions trading system and carbon tax implemented or scheduled
Carbon tax implemented or scheduled, emissions trading system under consideration
Emissions trading system implemented or scheduled, carbon tax under consideration
South Africa Australia
Northwest territories
Regional Greenhouse Gas Initiative (RGGI)
Newfoundlandand Labrador
Iceland European Union
Nova Scotia
SaskatchewanManitoba
OntarioQuebec
New Brunswick
Massachusetts
Rio de JaneiroSão Paulo
ArgentinaChile
Brazil
Côte d´Ivoire
Prince EdwardIsland
Ukraine
Turkey
KazakhstanRepublic of Korea
Japan
NewZealand
Viet NamThailand
China
British Columbia
Mexico
Colombia
VirginiaCalifornia
OregonWashington
CanadaAlberta
Source: World Bank, State and Trends of Carbon Pricing 2019, Washington, D.C., 2019.
Cities can use the fiscal instruments available to them to strengthen climate action. Credit secured against higher future property tax revenues reflecting the effects of public works has been successfully applied to flood adaptation in central Barranquilla, Colombia. Property values in run-down areas of Mexico City’s historic centre have increased (gentrification) as a result of public investment in the introduction of the Metrobús, which reduced vehicle traffic, improved public and pedestrian mobility and lowered noise and pollution levels, thus attracting higher-income residents and businesses.21 This produces a virtuous circle (assuming there are measures to compensate those affected) in which public investment and local finances are strengthened, the usability of the city is restored, emissions are mitigated by lower demand for travel, lower-carbon mobility options become viable in consolidated areas, and urban quality of life is enhanced.
21 Gentrification or the expulsion of low-income inhabitants must be compensated for. In Mexico City, regulatory restrictions are being considered to maintain a balance between social housing and higher-income housing in buildings that improve habitability and densify the city. However, rising property values have other undesirable effects, such as the expulsion of homeowners who do not have the income to pay the new property taxes; in these cases, value should be recovered when the properties are sold and not from the property tax applied to established residents’ properties whose value has risen.
The climate emergency in Latin America and the Caribbean... 263
Another option for using fiscal instruments in a more climate-friendly way is for the city government to create land banks with a view to the construction of modal services and exchanges in public transport systems and for private investment in the creation of these services to be authorized in exchange for fees paid to the local treasury. In this way, public transport nodes equipped with services and car parks that provide revenues to the public treasury could help fund improvements to public transport systems via the fees and charges paid by tenants, customers and private transport users who switch to the node services, given that 30% of car users could make part of their journeys by public transport and thus finance the city. This effect is similar to that of the carbon tax, with the difference that it offers direct user benefits.
There are new instruments available for cities to increase urban density while at the same time raising funds that fall within the tax category of fees. The importance of these instruments is growing rapidly where they have been implemented. This is the case with the issue of building permits for a fee (OODC) and certificates of additional building potential (CEPAC). Both are equivalent to creating land at height, and the city sells them to the private sector for a pre-set price (OODC) or by auction (CEPAC).22 Combining these mechanisms with local land use plans, if the latter promote development based on mass transit along with densification and diversification of uses, could be an effective aid in reducing demand for private travel in cities and emissions of local pollutants and greenhouse gases.
(b) Reducing energy subsidies in Latin America
Subsidies are direct fiscal expenditures (actually disbursed) or tax expenditures (resources foregone) which, when applied to energy, increase the producer’s profitability by lowering the prices paid by consumers, favouring consumption and expanding the producer’s market. They are established on the grounds that they benefit the poorest consumers, but in fact they do so in a highly regressive context, since the greatest benefit is obtained by those who consume the most, namely higher-income households and those with the highest rates of motorization, where direct consumption is concerned (see figure V.10). In the case of intermediate consumption, i.e. consumption for generation, the process is the same except that the price reduction is assumed to be reflected in the electricity tariffs paid by consumers. Normally, subsidies are also provided for electricity consumption, creating a twofold incentive for energy consumption when they coexist with the others.
22 This carries the risk of creating oligopolies of owners of urban development rights once the scale of these processes becomes large enough.

264 Economic Commission for Latin America and the Caribbean (ECLAC)
Figure V.10 Argentina, Chile, Guatemala and Mexico: structure of direct consumption of fossil
fuels for transport (petrol, diesel and biodiesel), 2012–2016(Percentages)
0
10
20
30
40
50
60
70
0
1
2
3
4
5
6
7
8
9
I III V VII IX I III V VII IX I III V VII IX I III V VII IXArgentina Chile Guatemala Mexico
Fuel spending as share of total spending in decile (left scale)Decile’s share of total fuel spending (right scale)
Source: Economic Commission for Latin America and the Caribbean (ECLAC), on the basis of household income and expenditure surveys.
Note: The data for Argentina were obtained from the National Household Expenditure Survey (ENGHo) covering the period 2012–2013, those for Chile are from the 2016 Family Budget Survey (EPF), those for Guatemala are from the 2014 National Living Conditions Survey (ENCOVI) and those for Mexico are from the 2016 National Household Income and Expenditure Survey.
Consumption subsidies, particularly for companies (intermediate consumption) and households (final consumption), exist when the price is set below an international benchmark price, resulting in tax expenditure, or when the country importing hydrocarbons pays a portion of the consumer price. Producer subsidies exist when the prices suppliers receive are above the benchmark price (IMF, 2013). Subsidies encourage the production of fossil fuels by making them more profitable, or encourage consumption by making them cheaper.
Energy subsidies are a global phenomenon, and in Latin America and the Caribbean many countries subsidize consumption of oil, gas and electricity products. In most countries, subsidies begin to be applied after exchange-rate devaluation or to soften the impact on the domestic economy of major increases or large fluctuations in oil prices (which also affect electricity generation costs) (Fanelli, Jiménez and López, 2015), after which they are never removed. They are also provided to sustain the profitability of certain activities considered economically or socially beneficial, examples being subsidies for road transport or small-scale fishing. From an environmental perspective, this increases the destructive effect on the natural production of ecosystems and their capacity for absorption and regeneration.
The relevance of maintaining fossil fuel subsidies has been questioned because of concerns about global warming due to worldwide consumption of hydrocarbons and its impact on pollution, as well as the regressive nature of

The climate emergency in Latin America and the Caribbean... 265
subsidies and the cost of reaching the target population. New international conditions point to the need to curb the demand for these fuels by means of fiscal instruments or to meet it instead from less polluting energy sources (United Nations, 2012; Mendoza, 2014).
Fossil fuel subsidies are estimated to have represented about 6.5% of world GDP in 2017 (Coady and others, 2019), with the percentage being higher in oil-exporting countries. Energy subsidies are high in a number of Latin American countries, averaging 3.4% of GDP in 2015 (see figure V.11). Subsidies, which are regressive, together with tax evasion and avoidance, which are also regressive, total about 10% of GDP in Latin America and the Caribbean (ECLAC, 2019a).
Figure V.11 Latin America and the Caribbean: energy subsidies and general government
health spending, 2015(Percentages of GDP)
0
5
10
15
20
25
Dom
inic
a
Bar
bado
s
Uru
guay
Bah
amas
Hon
dura
sS
aint
Kitt
san
d N
evis
Gre
nada
Peru
Ant
igua
and
Bar
buda
Cos
ta R
ica
Guy
ana
Para
guay
Sur
inam
e
Jam
aica
Gua
tem
ala
Mex
ico
Bra
zil
Col
ombi
a
Pana
ma
Arg
entin
a
Bel
ize
Chi
le
Hai
ti
Nic
arag
ua
El S
alva
dor
Ecua
dor
Dom
inic
an R
ep.
Bol
ivia
(Plu
r. S
tate
of)
Trin
idad
and
Toba
goVe
nezu
ela
(Bol
. Rep
. of)
General government health spending Energy subsidies
Source: Economic Commission for Latin America and the Caribbean (ECLAC), on the basis of D. Coady and others, “How large are global energy subsidies?”, IMF Working Paper, No. 15/105, Washington, D.C., International Monetary Fund (IMF), 2015; World Bank, World Development Indicators [online database] https://databank.bancomundial.org/source/world-development-indicators.
The high oil prices of the 2000s were an incentive to subsidize hydrocarbon prices and consumption despite the high fiscal cost, non-transparent effects on efficiency, and the regressiveness of distribution (Di Bella and others, 2015).
However, the temporary decline in fuel prices in the period 2012–2016 (see figure V.12), the demand for more fiscal space and the belief that fossil fuel consumption has an effect on global warming have strengthened the case for using fiscal policy to reduce this consumption through various methods

266 Economic Commission for Latin America and the Caribbean (ECLAC)
of applying a fiscal value to carbon. The idea that hydrocarbon subsidies are not an ideal tool is gradually gaining ground. However, society is strongly wedded to fossil fuels, which have a low price elasticity and high income elasticity as a result. Reducing or abolishing subsidies poses a great many challenges, and efforts to address the issue have often been clumsy. This could be seen in France in 2019, when the yellow vest rebellion emerged in the face of increasing diesel prices as a result of a rise in its hydrocarbon tax, and more recently in Ecuador, when diesel and petrol subsidies were abruptly withdrawn without any transitional social compensation, without sequencing and without any information on the use the resources saved would be put to.23
Figure V.12 Annual changes in the average crude oil price, 1995–2018
(Dollars per barrel)
0
20
40
60
80
100
120
1995
1996
1997
1998
1999
2000
2001
2002
2003
2004
2005
2006
2007
2008
2009
2010
2011
2012
2013
2014
2015
2016
2017
2018
Source: Economic Commission for Latin America and the Caribbean (ECLAC), on the basis of United Nations Conference on Trade and Development (UNCTAD).
Note: The prices shown in the chart are for United Kingdom Brent crude oil, light blend, API gravity 38°, spot price, free on board (FOB) in United Kingdom ports.
The 2030 Agenda for Sustainable Development and its Sustainable Development Goals, together with the agenda that came out of the Paris Agreement, which gave rise to the NDCs to tackle climate change, have put the reform of energy subsidies more clearly on the public agenda. However,
23 The reduction of these subsidies, which inform many consumption and investment decisions, should be accompanied by the creation of substitute and complementary goods and monetary compensation for the most affected groups. For example, making a straightforward transfer to people in place of the fuel subsidy would have a progressive compensatory effect, since it would represent a larger portion of the income of low-income people than of high-income people. Some of the tax savings could be allocated to this compensation measure. Substitutes could be modes of transport that offer the quality, reliability and safety required to effectively replace the demand for private motorized mobility.

The climate emergency in Latin America and the Caribbean... 267
there are economic policy measures that must be considered if viable reform is to be achieved, most notably the following: (i) create alternative options as fossil fuel consumption declines, such as improving public transport systems and electrifying them on the basis of renewable sources; (ii) depoliticize fuel prices in resource-rich countries; (iii) combine the reduction with compensation for the transition, differentiating between consumers and producers; and (iv) carry out these reforms at a time of low consumption or prices, in order to reduce the direct impact and resistance to them (Cottrell, 2014).
In summary, the elimination of subsidies reduces the profitability of hydrocarbon production, as well as sales and consumption, depending on price and income sensitivity in each country, in addition to improving the profitability of renewable energies relative to fossil fuels.
E. Climate financing flows in the region
1. The role of development banking
The financial sector has a key role to play in shifting relative returns towards lower-carbon investment so that progress can be made towards the Paris Agreement targets. The United Nations Framework Convention on Climate Change (UNFCCC) was negotiated in the belief that the supply of climate finance to developing countries should be increased, with resources from the countries listed in annex II of that document. The prevailing assumption was that there would not be sufficient resources available to make low-carbon investments, as these are less profitable than others because of the additional cost involved. Over the history of the UNFCCC and the Kyoto Protocol, small funds have appeared to finance the many variants of mitigation and an adaptation fund has been established.
In the wake of the 2008 financial crisis, the push for recovery based on increased global liquidity and the decline in the profitability of non-climate projects, the argument that there is a lack of funds has become untenable and has given way to two positions. One is that there are no projects which offer adequate returns and are structured in such a way that the financial system can support them. This position assumes that the functioning of the financial system is neutral and that its procedures do not have to be adapted to the climate emergency, it being rather up to those in charge of projects to find a way to make them profitable. The other position is that the financial system does not account for damage or risks that have no market value or recognize the contributions and risk reduction entailed by lower-carbon investments. On this view, the financial system must adjust to the new reality posed by climate change.

268 Economic Commission for Latin America and the Caribbean (ECLAC)
The first position has given rise to the creation of small climate funds which, with fiscal resources from developed countries, help to make otherwise unprofitable projects profitable. These funds are mainly managed by the World Bank and based on the model established by the Global Environment Facility, the financial mechanism of several environmental conventions. Thanks to climate funds, first the international financial system and then development banks have learned to finance projects on the basis of the risk reduction they offer and have pursued initiatives in this area. These funds are designed to initiate and sustain a pilot project phase that has already lasted a generation. In their absence, banks would not be financing climate projects unless they were profitable for other reasons, such as technological advances in wind and photovoltaic energy. Following the same logic as these earlier funds, but more ambitiously, the Green Climate Fund was created under the Paris Agreement to mobilize US$ 100 billion per year of medium-term financing.
As regards the second position, the G20 working group on the financial sector chaired by China renewed the discussion on the sector’s role and highlighted the existence of new types of risk it would have to address: the physical risks that global warming poses to infrastructure and investment (e.g., sea level rise, drought and water stress); the technological risks of activities whose markets could suddenly disappear and whose investments could quickly turn from assets into liabilities (stranded assets); and changes in investor preferences for reputational reasons. Reference was also made to the advisability of combining instruments such as bonds with credit in order to match project maturities and move forward with the identification of climate financing and risks.
The International Development Finance Club (IDFC) was also required to report on its alignment with the objectives of the UNFCCC and the Paris Agreement and to quantify the proportion of its portfolios committed to the financing of lower-carbon projects. Definitions have been progressively agreed regarding the suitability of projects for mitigation and adaptation, albeit with major limitations. To date, no bank has reported on net climate financing and few have developed exclusion lists of projects no longer being financed because they are harmful to climate efforts.
The Helsinki principles coalition is a further step in the right direction. These principles call above all for progress towards the implementation of carbon pricing mechanisms, the reduction of subsidies that are harmful to the fight against climate change and better monitoring of climate finance by governments and financial systems.

The climate emergency in Latin America and the Caribbean... 269
The development of the second approach, whose tendency is to improve processes and capacities in the financial sector, clearly reveals the potential for internalizing climate risk, applying a social price to carbon, distinguishing between discount rates, diversifying guarantees for this type of project, establishing technological floors or minimums and operating techniques for certain types of projects in relation to emissions, and ruling out investments with high carbon emissions even if they are profitable, helping to bring financiers and projects closer together. In this way, the financial sector is becoming a driver of change in relative returns as opposed to an onlooker in a changing world.
Strengthening the second position, which presupposes an active financial system, implies that financing as a whole will become climate-smart, and not just the meagre funds made available by international cooperation, which are totally inadequate for change on the scale required by the Paris Agreement.
2. Some estimates of the investment required
Globally, the amount of resources spent to meet the financial needs of the conditional and unconditional commitments set forth in NDCs could exceed US$ 4 trillion (Weischer and others, 2016). According to Engle (2016), the World Bank puts the needs of International Development Association (IDA)24 member countries at between US$ 800 billion and US$ 900 billion by 2030, representing more than US$ 60 billion per year until then.25
The level of climate investment is far from adequate to meet the needs arising from these estimates and from what IPCC has proposed. Global investment totalled US$ 437 billion in 2015 and US$ 383 billion in 2016 (Buchner and others, 2017). Set against the trillions of dollars estimated to be required, these amounts are still tentative.
The quantification of the funds needed to make the transition to the agreed level of decarbonization is a pending issue in Latin America and the Caribbean, and only a few countries, such as Colombia and Chile, have financial strategies in place. There is still a long way to go to determine the difference between gross financing, in which the estimated figures are usually very high because investment that has to be made anyway is attributed to the change, and net financing, which represents only the additional part needed
24 IDA is the part of the World Bank that helps the poorest countries. It is overseen by 173 nations and aims to reduce poverty by providing loans (called credits) and grants for programmes that drive economic growth, reduce inequality and improve living standards. See World Bank, “What is IDA?” [online] https://ida.worldbank.org/about/what-ida.
25 These values represent the sum total of the amounts declared in the NDCs.

270 Economic Commission for Latin America and the Caribbean (ECLAC)
to decarbonize investments.26 As was seen in the section on the social price, that cost can actually be a saving.
There are 10 countries in the region whose commitments under the United Nations Framework Convention on Climate Change (UNFCCC) included information on the investments needed to comply with their NDCs.27 These investments totalled US$ 51 billion (World Bank, 2019b). The other countries did not include this information. In the case of Brazil, the cost of implementing the country’s NDC is put at 1% of annual GDP, amounting to between US$ 240 billion and US$ 260 billion by 2030 (IDB, 2017).
3. The flow of climate financing in Latin America and the Caribbean
Monitoring of climate finance in the region helps to put into perspective the change needed and the means to carry it out. This section reviews the sources and resources mobilized for climate change. ECLAC has been monitoring the performance of climate finance flows since 2013, and its reports indicate that they have averaged US$ 20.5 billion per year between 2013 and 2017 (see figure V.13). Contrary to the global trend, the flow of these resources has been increasing in the region. The falls observed in 2015 and 2016 were due to factors exogenous to the climate context and were mainly attributable to the behaviour of Brazil, whose political and economic crisis has significantly affected investment.
According to the data for the various financial institutions and instruments for which it is possible to distinguish information relating to Latin America and the Caribbean, resources approved for climate purposes in 2017 amounted to US$ 22.3 billion, 40% more than in 2016 and the largest annual amount mobilized in the period reported on by ECLAC. The increase in 2017 was significantly greater than the global increase. According to IDFC data, the 2017 total for the 18 development banks that declared climate finance commitments was 23% higher than that of 2016, with investment being 3% higher in the case of clean energy and 2% in that of renewable energy, according to data from Bloomberg (2019) and REN21 (2018), respectively.
26 IPCC (2018a) estimates that annual gross investment worth 1% to 1.5% of global gross fixed capital formation needs to be allocated to the energy sector, and 1.7% to 2.5% to other development infrastructure. It is further estimated that, in the energy system alone, average annual investment needs between 2016 and 2035 will be around US$ 2.4 trillion in 2010 dollars, which is about 2.5% of global GDP. It is also estimated that the increase in total energy-related investment by 2050 would have to be about 12% for the 1.5 °C pathway to be kept to, and that average annual investment in energy technologies yielding low carbon emissions and leading to energy efficiency would have to increase sixfold compared to 2015. Adaptation costs are difficult to calculate because they vary according to the degrees of temperature increase and the way they would affect the climate, and it has not yet been possible to establish them. The lack of data for estimating climate-resilient investment needs also complicates the calculation, given the underinvestment in basic infrastructure that characterizes many countries.
27 The countries are Antigua and Barbuda, Bahamas, Dominica, the Dominican Republic, Grenada, Guyana, Haiti, Saint Lucia, Suriname and Trinidad and Tobago.

The climate emergency in Latin America and the Caribbean... 271
Figure V.13 Latin America and the Caribbean: climate financing, 2013–2017
(Millions of current dollars)
20 300 21 948 20 974
16 706
22 340
0
5 000
10 000
15 000
20 000
25 000
2013 2014 2015 2016 2017
Source: Economic Commission for Latin America and the Caribbean (ECLAC), on the basis of data from the different institutions; J. Samaniego and H. Schneider, “Cuarto informe sobre financiamiento para el cambio climático en América Latina y el Caribe, 2013–2016”, Project Documents (LC/TS.2019/15), Santiago, Economic Commission for Latin America and the Caribbean (ECLAC), 2019.
Note: The figures are for approved funding for climate change projects at 11 financial institutions and for resources mobilized by way of bilateral and multilateral climate funds, green bonds and other local resources. The financial institutions are the French Development Agency (AFD), the Central American Bank for Economic Integration (CABEI), the Colombian Foreign Trade Bank (BANCOLDEX), the Development Bank of Latin America (CAF), the Caribbean Development Bank (CDB), the Banco del Estado de Chile, the European Investment Bank (EIB), the Inter-American Development Bank (IDB), the National Bank for Economic and Social Development (BNDES) of Brazil, the World Bank and Mexico’s Nacional Financiera (NAFIN) and Trust Funds for Agriculture (FIRA).
Brazil accounts for a large share of the region’s financial flows, as shown in figure V.14. Without Brazil, the amount of resources managed by the rest of the countries of Latin America and the Caribbean grew by just under 50% between 2016 and 2017, and in the latter year the amount was almost double that of 2013.
Table V.12 shows the behaviour and composition of the climate resources approved in the region. The supply of resources managed by national development banks and other local resources has been declining, with their share of total resources mobilized falling significantly. In contrast to 2013, the multilateral banks have become the most important financial actors. This change in positions is due not only to the slowdown in the Brazilian economy already mentioned, but seemingly also to the internal policies of the multilateral institutions, which have set ambitious targets for the allocation of their resources. Thus, for example, IDB and the World Bank have committed themselves to allocating up to 30% of their portfolio for climate purposes by 2020.

272 Economic Commission for Latin America and the Caribbean (ECLAC)
Figure V.14 Latin America and the Caribbean: climate finance with and without Brazil, 2013–2017
(Millions of current dollars)
20 300 21 948
20 974
16 706
22 340
13 130
8 996 10 394 11 750 12 573
17 850
9 976
0
5 000
10 000
15 000
20 000
25 000
2013 2014 2015 2016 2017 2018
With Brazil Without Brazil
Source: Economic Commission for Latin America and the Caribbean (ECLAC), on the basis of data from the different institutions; J. Samaniego and H. Schneider, “Cuarto informe sobre financiamiento para el cambio climático en América Latina y el Caribe, 2013–2016”, Project Documents (LC/TS.2019/15), Santiago, Economic Commission for Latin America and the Caribbean (ECLAC), 2019.
Note: Because of the importance of the National Bank for Economic and Social Development (BNDES) in mobilizing resources to combat climate change in Brazil, this analysis only subtracted resources owed to that institution.
Table V.12 Latin America and the Caribbean: amount and composition of climate financing, 2013–2017
(Millions of current dollars and percentages)
Year Climate fundsa
Multilateral banksb
National development
banks
Other local
resources
Climate bondsc Total
2013 Amount 350.25 5 923.49 11 884.00 2 142.75 - 20 300.49 Share of total 1.7 29.2 58.5 10.6 0.0 100.0
2014 Amount 543.11 7 857.32 11 783.00 1 523.07 242.00 21 948.5 Share of total 2.4 35.4 53.2 7.9 1.1 100.0
2015 Amount 436.07 8 293.15 9 622.55 1 558.22 1 063.75 20 973.70Share of total 2.1 39.5 46.0 7.4 5.1 100.0
2016 Amount 523.38 7 308.56 4 561.21 623.11 3 689.37 16 705.63 Share of total 3.1 43.7 27.3 3.7 22.1 100.0
2017 Amount 435.51 11 827.20 5 567.47 320.99 4 189.2 22 340.35Share of total 1.9 53.0 25.0 1.4 18.8 100.0
Source: Economic Commission for Latin America and the Caribbean (ECLAC), on the basis of data from the different institutions; J. Samaniego and H. Schneider, “Cuarto informe sobre financiamiento para el cambio climático en América Latina y el Caribe, 2013–2016”, Project Documents (LC/TS.2019/15), Santiago, Economic Commission for Latin America and the Caribbean (ECLAC), 2019.
a Multilateral climate funds were considered. Data for 2013 do not include resources from the NAMA Facility. Where the Amazon Fund is concerned, resources provided by international donors were included, while the Fund’s other resources were counted among those managed by the National Bank for Economic and Social Development (BNDES).
b The data declared by the Central American Bank for Economic Integration (CABEI) to the International Development Finance Club (IDFC) were included, as were the data reported by the Caribbean Development Bank (CDB) on its website.
c No climate bonds were issued in Latin America and the Caribbean in 2013.
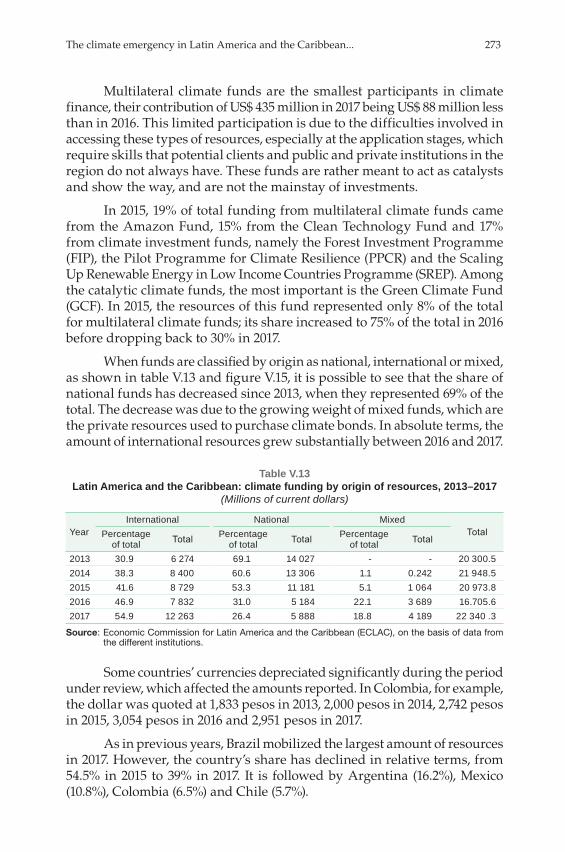
The climate emergency in Latin America and the Caribbean... 273
Multilateral climate funds are the smallest participants in climate finance, their contribution of US$ 435 million in 2017 being US$ 88 million less than in 2016. This limited participation is due to the difficulties involved in accessing these types of resources, especially at the application stages, which require skills that potential clients and public and private institutions in the region do not always have. These funds are rather meant to act as catalysts and show the way, and are not the mainstay of investments.
In 2015, 19% of total funding from multilateral climate funds came from the Amazon Fund, 15% from the Clean Technology Fund and 17% from climate investment funds, namely the Forest Investment Programme (FIP), the Pilot Programme for Climate Resilience (PPCR) and the Scaling Up Renewable Energy in Low Income Countries Programme (SREP). Among the catalytic climate funds, the most important is the Green Climate Fund (GCF). In 2015, the resources of this fund represented only 8% of the total for multilateral climate funds; its share increased to 75% of the total in 2016 before dropping back to 30% in 2017.
When funds are classified by origin as national, international or mixed, as shown in table V.13 and figure V.15, it is possible to see that the share of national funds has decreased since 2013, when they represented 69% of the total. The decrease was due to the growing weight of mixed funds, which are the private resources used to purchase climate bonds. In absolute terms, the amount of international resources grew substantially between 2016 and 2017.
Table V.13 Latin America and the Caribbean: climate funding by origin of resources, 2013–2017
(Millions of current dollars)
YearInternational National Mixed
TotalPercentage of total Total Percentage
of total Total Percentage of total Total
2013 30.9 6 274 69.1 14 027 - - 20 300.5 2014 38.3 8 400 60.6 13 306 1.1 0.242 21 948.5 2015 41.6 8 729 53.3 11 181 5.1 1 064 20 973.8 2016 46.9 7 832 31.0 5 184 22.1 3 689 16.705.62017 54.9 12 263 26.4 5 888 18.8 4 189 22 340 .3
Source: Economic Commission for Latin America and the Caribbean (ECLAC), on the basis of data from the different institutions.
Some countries’ currencies depreciated significantly during the period under review, which affected the amounts reported. In Colombia, for example, the dollar was quoted at 1,833 pesos in 2013, 2,000 pesos in 2014, 2,742 pesos in 2015, 3,054 pesos in 2016 and 2,951 pesos in 2017.
As in previous years, Brazil mobilized the largest amount of resources in 2017. However, the country’s share has declined in relative terms, from 54.5% in 2015 to 39% in 2017. It is followed by Argentina (16.2%), Mexico (10.8%), Colombia (6.5%) and Chile (5.7%).

274 Economic Commission for Latin America and the Caribbean (ECLAC)
Figure V.15 Latin America and the Caribbean: climate financing by origin, 2013–2017
(Billions of current dollars)
6.3 8.4 8.7 7.8
12.3
14.0 13.3
11.2
5.2
5.9
0.00.2
0.0
3.7
4.2
0
5
10
15
20
25
2013 2014 2015 2016 2017
InternationalNationalMixed
Source: Economic Commission for Latin America and the Caribbean (ECLAC), on the basis of data from the different institutions; J. Samaniego and H. Schneider, “Cuarto informe sobre financiamiento para el cambio climático en América Latina y el Caribe, 2013–2016”, Project Documents (LC/TS.2019/15), Santiago, Economic Commission for Latin America and the Caribbean (ECLAC), 2019.
Among the sources reviewed, no information was found on any type of financial initiative to combat climate change in the Bolivarian Republic of Venezuela, Grenada, Saint Kitts and Nevis, Sao Tome and Principe or Trinidad and Tobago. This does not mean that this type of action does not exist in these countries, but that it may have been carried out by institutions other than those analysed or may be included among the regional initiatives of the institutions analysed.In Brazil, which is one of the major players in climate finance, there has been a trend towards a reduction in this type of financing since 2012 because of the economic slowdown, which was particularly marked in 2015. Renewable energy auctions have also been suspended because of this slowdown. This reduction is in evidence at the National Bank for Economic and Social Development (BNDES). The bank’s disbursements fell by 28% in 2015, and in 2016 they were down by 35% and 53% on 2015 and 2014, respectively (BNDES, 2016). In 2017, although the institution’s disbursements continued to fall compared to 2016 (BNDES, 2019), the drop (25%) was considerably less than in previous years. In 2017, Brazil’s GDP growth was 0.7%, driven by budgetary adjustments and favourable economic conditions. The sectors in which the most resources were disbursed were infrastructure, with growth of 4% over the previous year, and agriculture, which grew by 3%. The amounts mobilized for the green economy increased by nearly 1%. It should also be noted that the major infrastructure works built for the world sports events held in 2014 and 2016, which included, for example, the modernization of public transport, were completed in the period under study.

The climate emergency in Latin America and the Caribbean... 275
In terms of the destination of climate financing, mitigation dominates (see figure V.16). Of the total climate resources approved by local and regional development banks (BNDES, IDB, EIB, CDB, BANCOLDEX, Banco del Estado, CABEI, CAF and NAFIN) in 2016 and 2017, 77% went to mitigation. In 2015, this proportion had been 87%. In 2017, adaptation accounted for 17% of resources, two percentage points more than the previous year.
Figure V.16 Latin America and the Caribbean: climate financing by destination, 2016 and 2017
(Millions of current dollars)
0.4
15.0
77.2
7.3
1.3
17.0
77.0
4.7
0
10
20
30
40
50
60
70
80
90
Mitigation and adaptation Adaptation Mitigation Other environmental
2016 2017
Source: Economic Commission for Latin America and the Caribbean (ECLAC), on the basis of data from the different institutions; J. Samaniego and H. Schneider, “Cuarto informe sobre financiamiento para el cambio climático en América Latina y el Caribe, 2013–2016”, Project Documents (LC/TS.2019/15), Santiago, Economic Commission for Latin America and the Caribbean (ECLAC), 2019.
Table V.14 shows the destination of climate finance by sector. In 2017, the focus of mitigation projects was energy generation from renewable sources, together with transport and energy efficiency (64% of the total). There was very substantial growth in renewable energy investments, from 27% of the total in 2016 to 45% in 2017. The focus of investments in 2016 was also on these three sectors (48%), which by 2015 had accounted for 69% of total investments. The decrease observed between the two years was mainly due to the transport sector. Resources for adaptation increased in all three years analysed. In 2015 and 2016, the focus was on agriculture, forests and land use, while investments in 2017 centred on water sources, wastewater and disaster risk management.
With regard to financial instruments, according to data from IDFC, a grouping in which the Latin American banks included in the ECLAC studies participate, 97% of resources are mobilized through loans, of which 82% are non-concessional. In 2015, 72% were non-concessional (IDFC, 2018).

276 Economic Commission for Latin America and the Caribbean (ECLAC)
Table V.14 Latin America and the Caribbean: funding approved by national and regional
development banks, by sector, 2015–2017(Millions of dollars and percentages)
Sector2015 2016 2017
Amount Share of total Amount Share
of total Amount Share of total
Renewable energies (generation and transmission)
6 393.33 40.0 3 074.56 27.4 6 925.07 45.3
Energy efficiency 513.76 3.2 842.56 7.5 678.60 4.4Transport 4 187.34 26.2 1 517.47 13.5 2 126.12 13.9Agriculture, forestry and land use 828.04 5.2 679.78 6.1 1 358.20 8.9Waste and wastewater 129.13 0.8 130.13 1.2 567.05 3.7Infrastructure 110.05 0.7 150.00 1.3 - 0.0Intersectoral investment 8.80 0.1 997.45 8.9 54.50 0.4Other mitigation 1 702.13 10.6 1 263.23 11.3 60.84 0.4Total mitigation (M) 13 873.38 86.8 8 655.17 77.2 11 770.38 77.0Agriculture, forestry and land use 131.70 0.8 274.28 2.4 113.80 0.7Adaptation policies, technical support, institutional capacity
10.00 0.1 67.87 0.6 0.70 0.0
Infrastructure 43.40 0.3 - 0.0 45.86 0.3Energy, transport and other environmental constructions and infrastructure
- 0.0 20.57 0.2 98.70 0.6
Water sources, wastewater and disaster risk management
154.28 1.0 136.38 1.2 459.80 3.0
Financial services - 0.0 3.04 0.0 - 0.0Information and communication technologies
- 0.0 1.95 0.0 - 0.0
Intersectoral investment 6.06 0.0 101.90 0.9 65.40 0.4Other adaptation 1 082.00 6.8 1 081.17 9.6 1 817.19 11.9Total adaptation (A) 1 427.44 8.9 1 687.16 15.0 2 601.45 17.0Total mitigation and adaptation (M/A)
11.76 0.1 49.05 0.4 200.00 1.3
Other environmental destinations (OE)
673.27 4.2 819.26 7.3 714.80 4.7
Total (M+A+M/A+OE) 15 985.85 100.0 11 210.64 100.0 15 286.63 100.0
Source: Economic Commission for Latin America and the Caribbean (ECLAC), on the basis of data from the different institutions; J. Samaniego and H. Schneider, “Cuarto informe sobre financiamiento para el cambio climático en América Latina y el Caribe, 2013–2016”, Project Documents (LC/TS.2019/15), Santiago, Economic Commission for Latin America and the Caribbean (ECLAC), 2019.
4. The private sector
The private sector is increasingly involved in financing climate change mitigation and adaptation projects. It comprises a wide range of local and international banks and financial institutions, private and pension funds, and other funds specially created to address the issue. This group also includes domestic savers and carbon finance companies.

The climate emergency in Latin America and the Caribbean... 277
A total of US$ 437 billion was mobilized worldwide in 2015 and US$ 383 billion in 2016. Of these totals, 68% and 62%, respectively, were resources from the private sector. The private financing flow of the Climate Policy Initiative (CPI) includes resources committed by corporations and project developers implementing new renewable energy projects, loans from commercial banks, direct infrastructure investment by institutional investors and household savings (Buchner and others, 2017).
Of the US$ 237 billion invested by the private sector in 2016, project developers accounted for 52% of initiatives, totalling US$ 125 billion. This group is led by China and the United States, which finance such activities in their own countries. They are followed by commercial financial institutions, which account for 23% (US$ 60 billion). The remaining 25%, totalling US$ 54 billion, are resources from corporations, savers, financial instruments such as shares, venture capital and infrastructure funds, and institutional investors (Buchner and others, 2017).
Bloomberg’s quantification exercises for renewable and clean energies, whose data are used by CPI and other institutions, are helpful for information purposes, but data on private sector climate action are difficult to track and measure.28 The actors involved and the instruments that can be used are many and very diverse; there are transactions between private parties that take place outside the conventional financial system and there are initiatives that can migrate to different territories and actors. Moreover, these institutions do not usually publicize this type of information. In the case of banks, only some account for these data separately. And, of course, there is also the risk that the same investment project will be counted twice or more.
Progress has been made by commercial banks in Latin America and the Caribbean (see annex V.A2). Several institutions have established lines of financing for environmental protection and climate change mitigation. However, few of them as yet allocate resources of their own for these purposes and publish this information. In most cases, these lines of financing are resources from multilateral banks or national development banks that are being lent on. Annexes V.A2 and V.A3 summarize some examples of the programmes and lines of finance available from private banks and national public banks, respectively, and put to use in the region.
5. Green bonds
These bonds work like conventional bonds, with the difference that they are labelled as green by the issuer and specify that the resources raised from the debt issuance will be used in projects that generate environmental and
28 Bloomberg regularly publishes its Clean Energy Investment Trends reports. See [online] https://about.bnef.com/clean-energy-investment/.
278 Economic Commission for Latin America and the Caribbean (ECLAC)
climate benefits.29 Green bonds finance climate and environmental activities that have a clear purpose. The universe of this type of bonds also includes those serving to finance climate change-related activities or generating environmental benefits but not labelled as green by the issuer, since they have not been explicitly identified with this purpose. These are called “unlabelled green bonds”.
In 2017, green bonds ranked third as a source of climate finance and the amount issued increased to US$ 4.1 billion from US$ 1.7 billion the previous year. The private sector was clearly dominant, accounting for 57% of green bonds issued in Latin America and the Caribbean. This is a well-known financial instrument in the sector, much in demand in the market and providing a quick and easy way of raising resources, unlike other sources of climate finance. While these bonds have the capacity to capture fresh resources for climate and environmental purposes, they need to be made more transparent to ensure that they are credible and that the funds come from legitimate sources and are used appropriately. The labelling is governed by the Climate Bonds Taxonomy, which sets standards for bonds and their certification mechanisms.30
As can be seen in table V.15, the amounts associated with green bonds more than doubled worldwide in the five years from 2013 to 2017, inclusive. In addition, the quantity of labelled bonds increased significantly from 11% of total bonds issued in 2015 to 17% in 2016 and 25% in 2017. Labelled bonds are those that explicitly provide for the financing of new or existing projects yielding climate and environmental benefits.
The global trend has been replicated in Latin America and the Caribbean, where matters have moved very quickly. As of 2013, no bond of this type had been issued in the region. In 2014, the first two were issued in Peru, one by the International Finance Corporation (IFC) for an amount in soles equivalent to US$ 42 million (Kidney, 2014) and the second by Peruvian wind energy producer Wind Energy S.A. for US$ 204 million. Two other bonds were issued in 2015, one in Mexico and one in Brazil. The Mexican bond was worth US$ 500 million, while the Brazilian bond was issued in euros and was worth the equivalent of US$ 563 million. In 2016, 10 bonds were issued for a total value of some US$ 3.6 billion (see table V.16), three times the amount issued in 2015. These bonds represent 22% of the total resources mobilized for climate change in the region.
29 See Climate Bonds Initiative, “Labelled green bonds data: latest 3 months” [online database] https://www.climatebonds.net/cbi/pub/data/bonds.
30 The Climate Bonds Taxonomy contains the definitions of the Climate Bond Standard and Certification Scheme. See Climate Bonds Initiative (2019).

The climate emergency in Latin America and the Caribbean... 279
Table V.15 Climate bonds worldwide and sectors targeted, 2013–2017
2013 2014 2015 2016 2017Bonds accumulated (billions of dollars)Climate bond total 346.0 502.6 597.7 694.0 895.0Labelled 36.6 65.9 118.0 221.0Unlabelled 346.0 466.0 531.8 576.0 674.0Number of issuers 260 280 407 780 1 128Sector (percentages)Transport 76.0 71.3 70.1 66.8 61.0Energy 11.8 14.9 19.8 18.8 19.0Multiple sectors 4.7 8.2 13.0Financial sector 9.2 10.0Water 0.1 0.5 2.6 3.0Construction and industry 1.4 2.7 3.3 2.0 2.0Agriculture and forestation 0.4 0.8 0.4 0.9 1.0Waste and pollution control 1.2 0.3 1.2 0.7 1.0Total 100 100 100 100 100
Source: Economic Commission for Latin America and the Caribbean (ECLAC), on the basis of Climate Bonds Initiative annual data.
Table V.16 Latin America and the Caribbean: green bonds issued, 2016
Issuer CountryAmount
(millions of dollars)
Share of total (percentages)
Mexico City Mexico 53.59 1.5Bancolombia Colombia 114.59 3.1Suzano Papel y Celulosa Brazil 286.53 7.8Mexico City Airport Trust Mexico 1 000.00 27.1Mexico City Airport Trust Mexico 1 000.00 27.1Nacional Financiera (NAFIN) Mexico 107.181 2.9Central American Bank for Economic Integration Central America 70.16 1.9Suzano Papel y Celulosa Brazil 500.00 13.6National Bank of Costa Rica Costa Rica 500.00 13.6CPFL Energias Renováveis Brazil 57.31 1.6Total 3 689 366 100.0
Source: Economic Commission for Latin America and the Caribbean (ECLAC), on the basis of Climate Bonds Initiative data.
Note: The exchange rates used were 3.49 reais, 18.66 Mexican pesos and 3 054.12 Colombian pesos per United States dollar.
Of the bonds shown in table V.16, 60% were issued in the private sector. The interest of the private sector in this instrument could be due to the fact that bonds are a well-known and easily managed instrument for the financial departments of private sector organizations. The issuance of green bonds is similar to that of the normal debt bonds often issued by large companies, which is seen as an advantage. Companies appreciate the fact that the costs of having these bonds certified by third parties are not high, and that their acceptance in the market has been very positive (see annex V.A4).

280 Economic Commission for Latin America and the Caribbean (ECLAC)
Green bonds have not gone uncriticized. For example, it has been argued that they can be used as vehicles for greenwashing because it is not certain that they will actually be used for environmental purposes and because the information published by issuers and buyers is not entirely transparent. Furthermore, the information from issuers does not allow the origin of the funds to be traced, so there is a risk of funds from illicit sources being used. The Climate Bonds Initiative, a non-profit organization registered in England and Wales, was set up to palliate this situation somewhat and has been monitoring green bonds and publishing the findings on its website since its creation in 2009.31 It does not trace the origin of resources, however. It acts as a public data source providing guides to green bond investing for issuers and investors. The purpose of the organization is to promote the use of common definitions across the different markets. Similarly, the World Bank, one of the world’s largest issuers, uses the criteria set out in the Green Bond Framework as selection criteria for its projects.
Besides these initiatives, others have been implemented or are being designed to provide transparency and greater clarity to investors after some companies and other organizations also began to take an interest in and issue these types of bonds. These initiatives include the following:
• The Green Bond Principles, which the International Capital Market Association (ICMA) published in March 2015 and updated in 2016.
• The Expert Network on Second Opinions (ENSO) set up by the non-governmental organization Centre for International Climate Research (CICERO).32
• The Statement of Investor Expectations for the Green Bond Market, an investor initiative led by the Coalition for Environmentally Responsible Economies (CERES).
• The Climate Bonds Standard and Certification Scheme, a certification mechanism belonging to the Climate Bonds Initiative.
• The ASEAN Green Bond Standards, published in 2017 (ASEAN, 2018).• The green bond standards that the International Organization for
Standardization (ISO) is considering launching.33
31 See Climate Bonds Initiative, “Labelled green bonds data: latest 3 months” [online database] https://www.climatebonds.net/cbi/pub/data/bonds.
32 CICERO is an independent non-profit entity that operates as a research institute and provides institutions with a second opinion on the framework and orientation applied to evaluate and select projects that provide the option of investing in green bonds. It also assesses the soundness of the framework in terms of meeting institutions’ environmental objectives.
33 See Environmental Finance, “ISO to consider green bond standard” [online] https://www.environmental-finance.com/content/news/iso-to-consider-green-bond-standard.html.

The climate emergency in Latin America and the Caribbean... 281
Since 2014, three different indices have been available for green bonds: the Solactive Green Bond Index,34 the S&P Green Bond Index35 and the Bloomberg Barclays MSCI Global Green Bond Index.36 These initiatives are aimed at increasing the liquidity of the instrument. In Mexico, the Mexican Stock Exchange (BMV) introduced the Bono Verde instrument, thereby strengthening its commitment to the creation of environmental markets and Mexico’s transition to a low-carbon economy. This made the BMV the first exchange in Latin America to offer a segment dedicated to green bonds (Grupo BMV, 2017). Via this segment, investors will be able to identify green label emissions by their ticker symbol, which facilitates the financing of low-carbon projects aimed at combating climate change. In addition to the BMV, the initiative is led by the Mexican Carbon Platform, Mexico2, and supported by a coalition that is committed to developing the green bond market. The members of this coalition are the Mexico Bankers Association (ABM), HSBC bank, the International Finance Corporation (IFC, a member of the World Bank Group), the British Embassy and the Secretariat of Environment and Natural Resources (SEMARNAT). The country has already issued several bonds of this type and is the largest issuer in the region.
In 2016, the Brazilian Federation of Banks (FEBRABAN), in conjunction with the Brazilian Business Council for Sustainable Development (CEBDS), published a guide to issuing green securities in Brazil. It is based on benchmarks from the international market for green securities or bonds, such as the World Bank, IFC, the Climate Bonds Initiative and the Green Bond Principles published by ICMA. The guide is indicative and is intended for agents in the Brazilian green securities market, including potential issuers (such as companies and financial institutions), underwriters, investors, external assessors and other participants.
In Chile, green bonds are also viewed as a financial tool for achieving energy goals. A study titled “Perspectivas del financiamiento de las energías limpias en Chile: ¿oportunidades para los bancos verdes y los bonos verdes?”, prepared by the Natural Resources Defence Council (NRDC) with the support of the Chilean Renewable Energy and Storage Association (ACERA), was published in April 2016. The study indicates that the resources created using this type of instrument could help the country close clean energy financing gaps and support subsectors that capital does not flow to, despite their commercial potential. In addition, the Santiago Stock Exchange is looking at the feasibility of launching a segment for green bonds in 2018.
34 See Solactive, “Indices” [online] http://www.solactive.com/equity-indexing/faz-indices/?index= DE000SLA0FS4.
35 See [online] https://us.spindices.com/indices/fixed-income/sp-green-bond-index.36 See [online] https://www.msci.com/documents/10199/242721/Barclays_MSCI_Green_Bond_
Index.pdf/6e4d942a-0ce4-4e70-9aff-d7643e1bde96.

282 Economic Commission for Latin America and the Caribbean (ECLAC)
F. Sectoral drivers
There are some promising drivers that could give a major boost to sustainable development, enhancing its quality and dynamism while contributing to climate action. This section provides data on three preferred sectors for climate action: renewable energies, public mobility and lower-carbon cattle ranching. These sectors have the potential to reduce carbon and other environmental footprints, offer advantages in terms of inclusion or employment and economic dynamism, and also show good prospects for carrying out production in the region or easing the external constraint. Because of the availability and importance of information on energy, this sector goes into greater depth than the other two. Other promising sectors include the care economy, appropriate waste management and the design of a circular economy, construction with materials based on carbon capture and biological production based on sustainable ecosystem management. This section does not discuss these sectors for reasons of space. For the sectors it does deal with, it documents simultaneous economic, social and environmental contributions that interact or have the potential to interact virtuously. This interaction increases the capacity for growth by easing the external constraint, since net additional imports to the region rise only slightly or actually fall as a result of it, the reasons being that these sectors become more employment-intensive or generate positive social inclusion dynamics, while pressure on the environmental frontier of climate change and on other natural resources is reduced.
1. Renewable energies for the energy transition
(a) The contribution of renewable energies to the sustainability of development
This contribution can be seen in all three pillars of sustainable development: the economic, the social and the environmental, in that order. One of the economic contributions made by renewable energies is the fact that the cost of generation is lower than for fossil fuel-based energies. The cost of generating electricity from renewable sources is no longer the main barrier to the energy transition. Figure V.17 shows that, in 2018, the average normalized cost of wind energy was between US$ 0.044 and US$ 0.10 per kWh, that of solar energy was between US$ 0.058 and US$ 0.14, and that of energy generated by fossil fuels was between US$ 0.049 and US$ 0.174 (IRENA, 2019).
Another contribution made by renewable energies is that they ease the external constraint. The hydrocarbon trade balance in Latin America and the Caribbean is increasingly unfavourable, reproducing the dynamics of other natural resources: crude oil is exported and semi-finished and refined fossil fuel products are imported. This is compounded by the gradual depletion of reserves and the decline in primary production. The hydrocarbons trade

The climate emergency in Latin America and the Caribbean... 283
surplus is slowly disappearing (see figure V.18). The transition to renewable sources is easing both the external constraint and the environmental constraint entailed by compliance with NDCs.
Figure V.17 Latin America and the Caribbean (12 countries): average normalized cost
of solar and wind energy, 2018(Dollars per kWh)
0
0.02
0.04
0.06
0.08
0.10
0.12
0.14
0.16
0.18
0.20
Arg
entin
a
Bra
zil
Chi
le
Ecua
dor
Cos
ta R
ica
Gua
tem
ala
Hon
dura
s
Mex
ico
Pana
ma
Peru
Dom
inic
anR
ep.
Uru
guay
Solar energy Wind energy Low fossil fuel averageHigh fossil fuel average
Source: Economic Commission for Latin America and the Caribbean (ECLAC), on the basis of Bloomberg, New Energy Outlook 2019, New York, 2019; International Renewable Energy Agency (IRENA), Global Energy Transformation: The REmap Transition Pathway, Abu Dhabi, 2019.
Note: The cost of generating electricity from fossil fuels varies by country and source, but in 2018 the average cost worldwide was between US$ 0.049 and US$ 0.174 per kWh (IRENA, 2019).
Figure V.18 Latin America and the Caribbean (33 countries): trade balance in unrefined,
semi-processed and refined hydrocarbons, 2000–2017(Millions of dollars)
-100 000
-50 000
0
50 000
100 000
150 000
200 000
250 000
2000
2001
2002
2003
2004
2005
2006
2007
2008
2009
2010
2011
2012
2013
2014
2015
2016
2017
Fossil fuel commodity trade balanceDerivatives and refined products trade balanceOverall trade balance
Source: United Nations, International Trade Statistics Database (UN COMTRADE) [online] https://comtrade.un.org/.
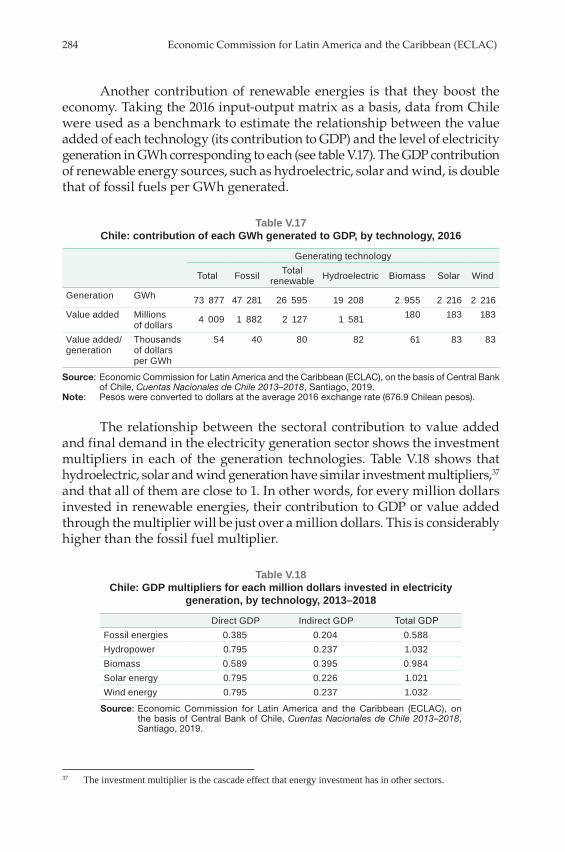
284 Economic Commission for Latin America and the Caribbean (ECLAC)
Another contribution of renewable energies is that they boost the economy. Taking the 2016 input-output matrix as a basis, data from Chile were used as a benchmark to estimate the relationship between the value added of each technology (its contribution to GDP) and the level of electricity generation in GWh corresponding to each (see table V.17). The GDP contribution of renewable energy sources, such as hydroelectric, solar and wind, is double that of fossil fuels per GWh generated.
Table V.17 Chile: contribution of each GWh generated to GDP, by technology, 2016
Generating technology
Total Fossil Total renewable Hydroelectric Biomass Solar Wind
Generation GWh 73 877 47 281 26 595 19 208 2 955 2 216 2 216Value added Millions
of dollars 4 009 1 882 2 127 1 581 180 183 183
Value added/ generation
Thousands of dollars per GWh
54 40 80 82 61 83 83
Source: Economic Commission for Latin America and the Caribbean (ECLAC), on the basis of Central Bank of Chile, Cuentas Nacionales de Chile 2013–2018, Santiago, 2019.
Note: Pesos were converted to dollars at the average 2016 exchange rate (676.9 Chilean pesos).
The relationship between the sectoral contribution to value added and final demand in the electricity generation sector shows the investment multipliers in each of the generation technologies. Table V.18 shows that hydroelectric, solar and wind generation have similar investment multipliers,37 and that all of them are close to 1. In other words, for every million dollars invested in renewable energies, their contribution to GDP or value added through the multiplier will be just over a million dollars. This is considerably higher than the fossil fuel multiplier.
Table V.18 Chile: GDP multipliers for each million dollars invested in electricity
generation, by technology, 2013–2018
Direct GDP Indirect GDP Total GDPFossil energies 0.385 0.204 0.588Hydropower 0.795 0.237 1.032Biomass 0.589 0.395 0.984Solar energy 0.795 0.226 1.021Wind energy 0.795 0.237 1.032
Source: Economic Commission for Latin America and the Caribbean (ECLAC), on the basis of Central Bank of Chile, Cuentas Nacionales de Chile 2013–2018, Santiago, 2019.
37 The investment multiplier is the cascade effect that energy investment has in other sectors.

The climate emergency in Latin America and the Caribbean... 285
The contribution to GDP per worker is also higher in the renewable energy sector. This is because these energies are more capital-intensive, so workers are more productive for the Chilean economy than those employed in fossil fuel-based generation (see table V.19).
Table V.19 Chile: GDP per worker in the renewable energy sector, 2016
GDP (millions of dollars)
Number of employees (number)
GDP/employee (dollars)
Country total 225 775 8 216 000 27 480Electricity generating sector 4 008 7 623 525 744Fossil energies 1 882 5 990 314 190Hydropower 1 581 1 385 1 141 259Biomass 180 28 6 436 535Solar energy 183 115 1 592 848Wind energy 183 105 1 744 547
Source: Economic Commission for Latin America and the Caribbean (ECLAC), on the basis of Central Bank of Chile, Cuentas Nacionales de Chile 2013–2018, Santiago, 2019.
In Latin America and the Caribbean, the energy transition has the potential to create a significant number of new “green” jobs that could represent an increase of up to 66% in the period 2020–2030 (see figure V.19).
Figure V.19 Brazil, Mexico and rest of Latin America and the Caribbean: net job creation
in an energy transition scenario, 2020–2030(Thousands of jobs created)
0
200
400
600
800
1 000
1 200
Brazil Mexico Total
2020 2025 2030
Rest of Latin Americaand the Caribbean
Source: Economic Commission for Latin America and the Caribbean/International Labour Organization (ECLAC/ILO), “Environmental sustainability and employment in Latin America and the Caribbean”, Employment Situation in Latin America and the Caribbean, No. 19 (LC/TS.2018/85), Santiago, 2018.
It is estimated that, in Chile, the quantity and quality of employment created by non-conventional renewable energies could be greater if the country settled on a production development policy that encouraged local

286 Economic Commission for Latin America and the Caribbean (ECLAC)
production and import substitution, at least in part. This would harness the capacity of each of the renewable energies to attract employment. The estimated employment multipliers for Chile’s different generating technologies are presented in table V.20.
Table V.20 Chile: employment multipliers for each million dollars of electricity generation,
by technology, 2013–2018
Direct employment Indirect employment Total employmentFossil energies 1.427 0.757 2.183Hydropower 0.671 0.200 0.871Biomass 0.105 0.070 0.176Solar energy 0.537 0.153 0.690Wind energy 1.064 0.317 1.381
Source: Economic Commission for Latin America and the Caribbean (ECLAC), on the basis of Central Bank of Chile, Cuentas Nacionales de Chile 2013–2018, Santiago, 2019.
The data available for the region are consistent with those reported by the United States National Association of State Energy Officials (NASEO), whose annual report, the U.S. Energy and Employment Report, seeks to promote effective, informed and robust energy policies and programmes and to identify trends and important skill sets for the energy workforce of the future (NASEO/EFI, 2019). According to these data, renewable energy-based electricity generation is much more dynamic in terms of job creation (64% of the total) than fossil energy-based electricity generation, which created 24% of jobs in the sector in 2018 (see table V.21).
Table V.21 United States: employment in electricity generation, by main energy technology
and subcategories, 2016–2018(Numbers of workers)
Energy source 2016 2017 2018Non-conventional renewable energies
Solar 373 807 349 725 334 992Wind 101 738 107 444 111 166Geothermal 5 768 7 927 8 526
Bioenergy Combined heat and power 26 014 27 239 29 245Bioenergy 12 385 12 976
Hydropower Low-impact 9 295 11 531 11 578Traditional 56 259 55 341 54 870
Nuclear energy Nuclear 68 176 64 743 62 987Fossil energies Coal 86 035 92 843 86 202
Petroleum and oils 12 840 12 407 12 582Natural gas Advanced (low-emission) 36 117 66 385 69 159
Traditional 52 125 41 034 43 526Other Other types of generation/other fuels 32 695 34 839 37 775Total 860 869 883 843 875 584
Source: Economic Commission for Latin America and the Caribbean (ECLAC), on the basis of National Association of State Energy Officials/Energy Futures Initiative (NASEO/EFI), The 2019 U.S. Energy and Employment Report, Arlington, 2019.

The climate emergency in Latin America and the Caribbean... 287
Another advantage offered by renewable energies is that they leave a smaller environmental footprint per unit generated. Obviously, energy is consumed and greenhouse gases are emitted in the different stages of building, manufacturing and installing generation plants, whether generation is from fossil or renewable energies. Data on this process and on the behaviour of the plant during its life cycle should be the basis for comparing the technologies and their respective energy sources. The environmental gain offered by renewable energies lies in their near-zero emissions when operational;38 however, emissions are also lower in the preceding and subsequent stages, and are significantly lower than those released over the life cycle of fossil fuel power plants (see table V.22). Besides greenhouse gases, these plants emit other pollutants that have a local impact, such as nitrogen and sulphur oxides, mercury, carbon monoxide and particles. This is in addition to the emissions generated by transport to supply them, which are further increased if the input has to be transported over long distances and, for example, ships have to be used. Over the lifetime of renewable energies, net emissions become virtually zero.
Table V.22 Greenhouse gas emissions over the life cycles of six technologies, various years
(Grams of CO2eq/kWh of electricity)
Stage Natural gas Shale gas Coal Nuclear Onshore
windOffshore
windUpstream (extraction, processing, transport and construction)
22.3 42.8 104 24.4 11.7 10.8
Operation 442 442 881 13.7 0.09 0.21Downstream (dismantling, processing and disposal of materials and infrastructure)
0.0 0.0 0.02 1.1 0.2 0.18
Total 465 486 985 39.3 11.9 11.2
Source: A. Louwen, “Comparison of the life cycle greenhouse gas emissions of shale gas, conventional fuels and renewable alternatives from a Dutch perspective”, master’s thesis on energy science, Utrecht, University of Utrecht, 2011.
(b) The situation with renewable energies in Latin America and the Caribbean and policies to increase their share in the electricity mix
To summarize briefly, it can be said that the energy situation in Latin America and the Caribbean is one in which hydropower is declining, despite the investment made in it. This is due in part to the reduction in rainfall, but also to investment based on fossil fuels, with a persistent role for shale gas in particular. The share of renewable sources in the energy mix
38 See Louwen (2011), Vattenfall (2019), UCS (2017), Pehl and others (2017), WNA (2011) and Hardisty, Clark and Hynes (2012) for information on these emissions and their life cycle.
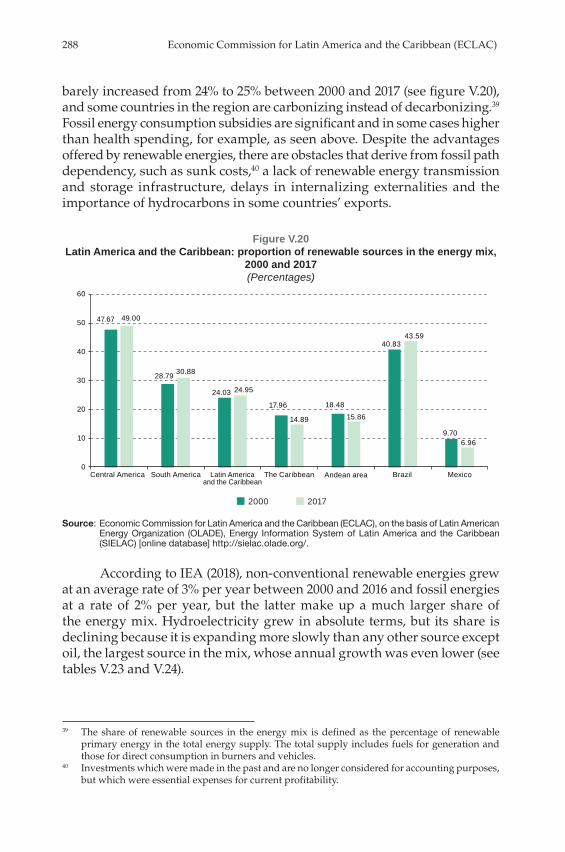
288 Economic Commission for Latin America and the Caribbean (ECLAC)
barely increased from 24% to 25% between 2000 and 2017 (see figure V.20), and some countries in the region are carbonizing instead of decarbonizing.39 Fossil energy consumption subsidies are significant and in some cases higher than health spending, for example, as seen above. Despite the advantages offered by renewable energies, there are obstacles that derive from fossil path dependency, such as sunk costs,40 a lack of renewable energy transmission and storage infrastructure, delays in internalizing externalities and the importance of hydrocarbons in some countries’ exports.
Figure V.20 Latin America and the Caribbean: proportion of renewable sources in the energy mix,
2000 and 2017(Percentages)
47.67
28.79
24.03
17.96 18.48
40.83
9.70
49.00
30.88
24.95
14.89 15.86
43.59
6.96
0
10
20
30
40
50
60
Central America South America Latin Americaand the Caribbean
The Caribbean Andean area Brazil Mexico
2000 2017
Source: Economic Commission for Latin America and the Caribbean (ECLAC), on the basis of Latin American Energy Organization (OLADE), Energy Information System of Latin America and the Caribbean (SIELAC) [online database] http://sielac.olade.org/.
According to IEA (2018), non-conventional renewable energies grew at an average rate of 3% per year between 2000 and 2016 and fossil energies at a rate of 2% per year, but the latter make up a much larger share of the energy mix. Hydroelectricity grew in absolute terms, but its share is declining because it is expanding more slowly than any other source except oil, the largest source in the mix, whose annual growth was even lower (see tables V.23 and V.24).
39 The share of renewable sources in the energy mix is defined as the percentage of renewable primary energy in the total energy supply. The total supply includes fuels for generation and those for direct consumption in burners and vehicles.
40 Investments which were made in the past and are no longer considered for accounting purposes, but which were essential expenses for current profitability.
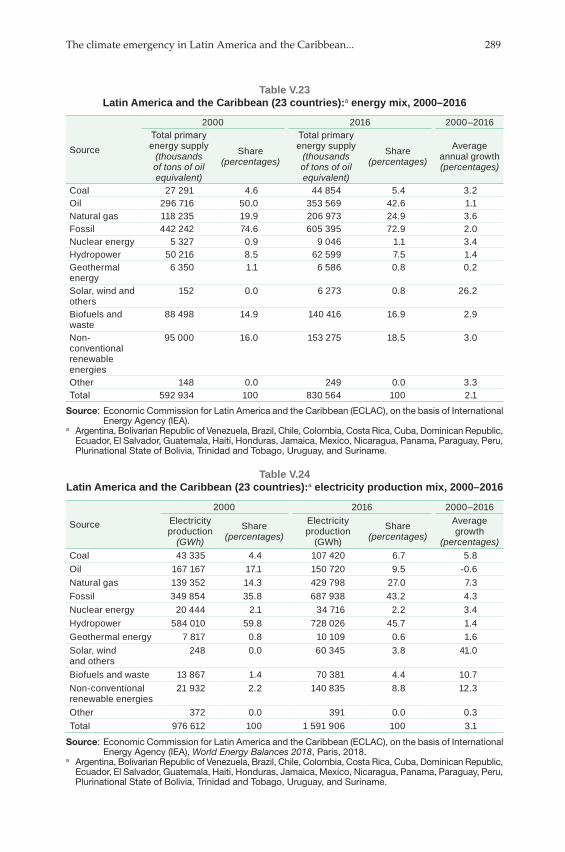
The climate emergency in Latin America and the Caribbean... 289
Table V.23 Latin America and the Caribbean (23 countries):a energy mix, 2000–2016
Source
2000 2016 2000–2016Total primary energy supply
(thousands of tons of oil equivalent)
Share(percentages)
Total primary energy supply
(thousands of tons of oil equivalent)
Share(percentages)
Average annual growth(percentages)
Coal 27 291 4.6 44 854 5.4 3.2Oil 296 716 50.0 353 569 42.6 1.1Natural gas 118 235 19.9 206 973 24.9 3.6Fossil 442 242 74.6 605 395 72.9 2.0Nuclear energy 5 327 0.9 9 046 1.1 3.4Hydropower 50 216 8.5 62 599 7.5 1.4Geothermal energy
6 350 1.1 6 586 0.8 0.2
Solar, wind and others
152 0.0 6 273 0.8 26.2
Biofuels and waste
88 498 14.9 140 416 16.9 2.9
Non-conventional renewable energies
95 000 16.0 153 275 18.5 3.0
Other 148 0.0 249 0.0 3.3Total 592 934 100 830 564 100 2.1
Source: Economic Commission for Latin America and the Caribbean (ECLAC), on the basis of International Energy Agency (IEA).
a Argentina, Bolivarian Republic of Venezuela, Brazil, Chile, Colombia, Costa Rica, Cuba, Dominican Republic, Ecuador, El Salvador, Guatemala, Haiti, Honduras, Jamaica, Mexico, Nicaragua, Panama, Paraguay, Peru, Plurinational State of Bolivia, Trinidad and Tobago, Uruguay, and Suriname.
Table V.24 Latin America and the Caribbean (23 countries):a electricity production mix, 2000–2016
Source
2000 2016 2000–2016Electricity production
(GWh)
Share(percentages)
Electricity production
(GWh)
Share(percentages)
Average growth
(percentages)Coal 43 335 4.4 107 420 6.7 5.8Oil 167 167 17.1 150 720 9.5 -0.6Natural gas 139 352 14.3 429 798 27.0 7.3Fossil 349 854 35.8 687 938 43.2 4.3Nuclear energy 20 444 2.1 34 716 2.2 3.4Hydropower 584 010 59.8 728 026 45.7 1.4Geothermal energy 7 817 0.8 10 109 0.6 1.6Solar, wind and others
248 0.0 60 345 3.8 41.0
Biofuels and waste 13 867 1.4 70 381 4.4 10.7Non-conventional renewable energies
21 932 2.2 140 835 8.8 12.3
Other 372 0.0 391 0.0 0.3Total 976 612 100 1 591 906 100 3.1
Source: Economic Commission for Latin America and the Caribbean (ECLAC), on the basis of International Energy Agency (IEA), World Energy Balances 2018, Paris, 2018.
a Argentina, Bolivarian Republic of Venezuela, Brazil, Chile, Colombia, Costa Rica, Cuba, Dominican Republic, Ecuador, El Salvador, Guatemala, Haiti, Honduras, Jamaica, Mexico, Nicaragua, Panama, Paraguay, Peru, Plurinational State of Bolivia, Trinidad and Tobago, Uruguay, and Suriname.

290 Economic Commission for Latin America and the Caribbean (ECLAC)
According to the projection for the policies currently applied in Latin America and the Caribbean, there will only be marginal changes in the energy mix by 2040 (OLADE, 2018), since the investments provided for in national energy plans are not sufficiently transformative (see figure V.21). According to the review of the policies to be applied, the transition will not occur fast enough to comply with NDCs unless both regulatory and economic disincentives for fossil fuels and incentives for renewables are applied, and unless governments provide clear guidance on the way forward.
Figure V.21 Latin America and the Caribbean: overall energy supply mix on current policies,
2016 and 2040(Percentages)
2016 2040
38
29
5
1
7
1616
4
39
30
6
1
7
16
1
0 10 20 30 40 50
Oil and derivatives
Natural gas
Coal
Nuclear
Hydropower
Biomass
Solar and wind
Source: Economic Commission for Latin America and the Caribbean (ECLAC), on the basis of Latin American Energy Organization (OLADE), Panorama Energético de América Latina y el Caribe, 2018, Quito, 2018.
Box V.2 Uruguay: the big push for energy sector sustainability
Uruguay’s energy mix has undergone a profound change that can be considered a major boost to sustainability. Policies promoting technological development have been successfully coordinated, oil imports have been reduced, the shares of indigenous non-traditional renewable energy sources and locally sourced energy have been increased, local capabilities and jobs have been created, care for the environment has been promoted and emissions have been reduced. Total energy investments in the period 2010–2015 were US$ 7.1 billion, of which US$ 4.7 billion came from the private sector. Investments in the energy transition represented over 3% of Uruguay’s GDP each year in that period (Kreimerman, 2019).
In 2017, Uruguay’s national energy assessment (MIEM, 2018) shows that the share of renewable energies in the electricity generation mix was 98%, with 243 MW of photovoltaic panels installed and 1,511 MW of energy produced by wind farms. Electricity generation grew by 3% from 2016 to 2017, but the consumption of fossil fuels for this purpose fell by 46% and their share of the electricity generation mix fell from 3% to 2% in 2017.

The climate emergency in Latin America and the Caribbean... 291
The primary energy mix in Uruguay has therefore changed dramatically, as can be seen in figure 1 comparing the mix in 2000 and 2017. The advance of renewable sources has been very significant, as has the reduction of fossil sources.
Figure 1 Uruguay: primary energy mix, by source, 2000 and 2017
(Percentages)
2000 2017
0
1
1
6
13
43
36
4
1
0
0
19
16
60
0 10 20 30 40 50 60 70
Imported electricity
Natural gas
Solar
Wind
Hydropower
Biomass
Oil
Source: Ministry of Industry, Energy and Mining, Balance Energético 2017, Montevideo, 2018.
The 2008 crisis checked CO2 emissions, and structural change in the energy mix had the same effect from 2012 (see figure 2).
Figure 2 Uruguay: CO2 emissions, 2006–2017
(Gg)
6 078
8 500
8 000
7 500
7 000
6 500
6 000
5 500
5 000
4 500
4 000
5 597
7 505
7 251
5 963
7 238
8 198
7 046
6 199 6 3556 304
5 837
2006 2007 2008 2009 2010 2011 2012 2013 2014 2015 2016 2017
Source: Ministry of Industry, Energy and Mining, Balance Energético 2017, Montevideo, 2018.
If public transport in Uruguay were also electrified, it would be a firm step towards renewability in the entire energy mix.
Source: R. Kreimerman, “¿Un big push energético? Reflexiones a partir del caso de Uruguay”, document presented at the third meeting of the Forum of the Countries of Latin America and the Caribbean on Sustainable Development, Santiago, Economic Commission for Latin America and the Caribbean (ECLAC), 22–26 April 2019; Ministry of Industry, Energy and Mining, Balance Energético 2017, Montevideo, 2018.
Box V.2 (concluded)

292 Economic Commission for Latin America and the Caribbean (ECLAC)
From the point of view of sustainability, the increase in investment in renewable energies and their greater shares of the primary energy mix and final consumption offer quantifiable advantages in all three dimensions: the economic, the social and the environmental. And they offer even more advantages if, in addition to the limited survey carried out in this section, efforts to strengthen production chains and decentralize generation are considered. The expansion of fossil energies is only possible in a context of tolerance for their negative externalities and insufficient complementary investments in the renewables sector. The available data show that the development of the renewable energy sector is a contribution to sustainable development.
2. Clean mobility as a driver of sustainable development and urban productivity“Urban mobility patterns in the region show exponential growth in the number of motor vehicles and a marked user and investment bias towards private transport, increasing the inefficiency of the system” (ECLAC, 2019e, p. 168).
Urban mobility is increasingly inefficient in the region’s cities, which are locked in a vicious circle of economic inefficiencies, since the proliferation of cars and the fuels they run on increases the external constraint and constitutes a poor collective solution for mobility. This solution leads to health productivity losses due to emissions and noise, economic losses due to traffic congestion, degradation of urban spaces, low passenger carrying capacity per vehicle and high greenhouse gas emissions (Vasconcellos, 2019a). At the same time, investment in public mobility is insufficient to achieve the necessary quality in terms of reliability, efficiency, modal links and comfort to make this type of mobility a viable substitute for the private variety. The interaction between private solutions, the fact that public investment is biased towards private transport infrastructure and the low quality of public services are mutually reinforcing. Moreover, 97% of final demand in the transport sector is for oil derivatives (OECD/IEA, 2017). Radically improving public mobility and electrifying it in order to break the vicious circle can be a major driver of sustainable development and a great boost to productive development in the region. The electrification of private mobility is also undoubtedly a factor that can promote development and reduce the environmental footprint, but it does not prevent either congestion or the indirect impact on natural resources through mining.
(a) The contribution of clean mobility to the sustainability of development: electric buses
The cost of battery manufacturing is key to the total cost of electric vehicles. From 2010 to 2017, the average price of batteries fell from US$ 1,000 to US$ 209 per kWh, a reduction of 79% in seven years (Bloomberg, 2018b). In

The climate emergency in Latin America and the Caribbean... 293
addition, their density or ability to deliver energy continues to increase at a rate of 5% to 7% per year, which resulted in electric vehicle range increasing by 41% between 2012 and 2016 (OECD/IEA, 2018).
The cost of batteries makes the initial (purchase) price of electric buses compared to conventional ones the main barrier to the electrification of buses. This is leading to the design of new business models that involve the implementation of, for example, initial subsidies, battery leasing systems, shared ownership mechanisms or separation of ownership and operation, among others. Bloomberg (2018a) suggests that by 2030 electric and conventional vehicles will cost the same and batteries will constitute 8% of the total cost of electric buses, compared to 26% in 2016. The increase in demand could mean that parity is reached earlier, in 2025.
In contrast to the initial cost, the total cost of ownership is lower for electric buses than for those with internal combustion engines. This cost includes that of purchasing and maintaining the unit, plus the fuel or energy consumed over its lifetime. In the example of Mexico City shown in figure V.22, the total ownership cost of electric buses is the lowest of those analysed for a 10-year lifespan (World Bank, 2019a).
Figure V.22 Mexico City: total bus ownership cost by energy source used, 2019a
(Dollars per kilometre)2.00
1.75
1.50
1.25
1.00
0.75
0.50
0.25
0 0.23 0.23 0.23 0.23 0.23 0.23
0.21 0.22 0.25 0.34 0.31 0.24
0.31 0.33 0.33 0.45 0.47
0.36
0.28 0.28 0.34
0.33 0.22
0.22
0.49 0.49 0.36
0.34
0.19
0.18
0.08 0.08 0.05 0.05 0.05
0.11
0.15
0.07 0.05
Euro 5 diesel Euro 6 diesel Natural gas Hybrid Slow (depot)charging electric
Quick chargingelectric
PersonnelCapital investedInterestMaintenanceFuelFuel taxesPurchase taxes
Source: World Bank, World Development Indicators [online database] https://databank.bancomundial.org/source/world-development-indicators.
a The cost is calculated on the basis of a 10-year lifespan.
According to OECD/IEA (2018), typical battery manufacturing plants will increase the density of batteries and lower their price. In addition, lithium batteries, which are reaching their maximum density (Soam, 2019), will be the main technology of the next decade. According to Bloomberg (2018b),

294 Economic Commission for Latin America and the Caribbean (ECLAC)
world production capacity will increase from 131 GWh/year, the current level, to approximately 400 GWh/year in 2021, with 73% of production coming from China. Expected demand by 2030 is 1,500 GWh/year and demand for materials such as cobalt, lithium and nickel is expected to increase from approximately 0.7 million cubic metres in 2018 to over 10 million cubic metres in 2030. Solid state batteries hold out promise when it comes to increasing density and reducing size, weight and limitations associated with raw materials, among other issues.
The economic dynamism of this sector could be captured in the region if the demand for electric vehicles in cities were planned in such a way as to send a signal strong and large enough to elicit a response from the regional automotive industry. In the absence of such planning and coordination, vehicles will be supplied by Chinese companies, especially electric buses, but also the bicycles and scooters that have recently been added to the mobility menu, and possibly other vehicles, such as drones, in the future.
In the Chilean capital, Santiago, following the expiry of the original contracts for the public transport system in 2018, the system’s business model was renewed and the Ministry of Transport and Telecommunications incorporated 200 electric buses into the system’s tendering process. This was the trigger for a number of measures aimed at bringing electric buses into the fleet. Thus, 300 buses acquired by two electricity generators, Engie and the Italian firm Enel, had been introduced by August 2019, with Enel considering introducing another 83 buses by the end of this year (Enel, 2019). According to a personal communication from the Metropolitan Public Transport Board (DTPM), another 25 electric buses purchased by the financial company NEoT Capital with funds from its strategic partners Mitsubishi Corporation and the French electricity company EDF Energy will be incorporated into Santiago’s urban transport system in December 2019.41 With this, four operators in the city, Metbus, Vule, Servicio de Transporte de Personas (STP) and Redbus, will be running more than 400 electric buses made by three different manufacturers, namely BYD, Yutong and King Long, and leased by three companies, Enel, Engie and NEoT Capital. When they are all operational, these buses will make up 6% of the fleet and the country will be among those with the most vehicles of this type in its urban public transport fleet (Schneider, 2019).
The BYD buses purchased by Enel are 12 metres long and have a range of 250 kilometres. Metbus operates them under a 10-year leasing contract, at the end of which it will become the owner of the buses. The monthly leasing fee for the electric buses is approximately 60% higher than for diesel ones, but operating costs (energy) and maintenance costs (chassis, engine and
41 NEoT Capital is an investor specializing in distributed renewable energy and electric mobility services. See [online] https://neotcapital.com/.
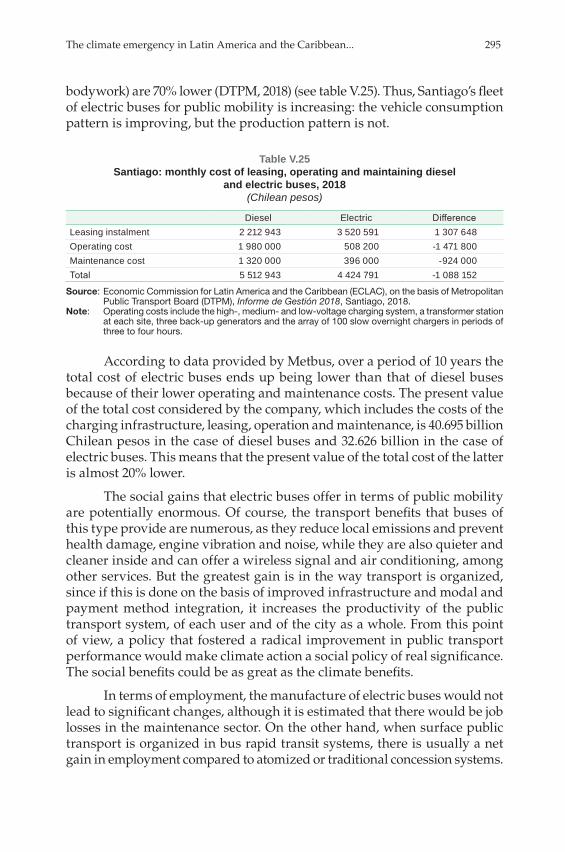
The climate emergency in Latin America and the Caribbean... 295
bodywork) are 70% lower (DTPM, 2018) (see table V.25). Thus, Santiago’s fleet of electric buses for public mobility is increasing: the vehicle consumption pattern is improving, but the production pattern is not.
Table V.25 Santiago: monthly cost of leasing, operating and maintaining diesel
and electric buses, 2018(Chilean pesos)
Diesel Electric DifferenceLeasing instalment 2 212 943 3 520 591 1 307 648 Operating cost 1 980 000 508 200 -1 471 800 Maintenance cost 1 320 000 396 000 -924 000 Total 5 512 943 4 424 791 -1 088 152
Source: Economic Commission for Latin America and the Caribbean (ECLAC), on the basis of Metropolitan Public Transport Board (DTPM), Informe de Gestión 2018, Santiago, 2018.
Note: Operating costs include the high-, medium- and low-voltage charging system, a transformer station at each site, three back-up generators and the array of 100 slow overnight chargers in periods of three to four hours.
According to data provided by Metbus, over a period of 10 years the total cost of electric buses ends up being lower than that of diesel buses because of their lower operating and maintenance costs. The present value of the total cost considered by the company, which includes the costs of the charging infrastructure, leasing, operation and maintenance, is 40.695 billion Chilean pesos in the case of diesel buses and 32.626 billion in the case of electric buses. This means that the present value of the total cost of the latter is almost 20% lower.
The social gains that electric buses offer in terms of public mobility are potentially enormous. Of course, the transport benefits that buses of this type provide are numerous, as they reduce local emissions and prevent health damage, engine vibration and noise, while they are also quieter and cleaner inside and can offer a wireless signal and air conditioning, among other services. But the greatest gain is in the way transport is organized, since if this is done on the basis of improved infrastructure and modal and payment method integration, it increases the productivity of the public transport system, of each user and of the city as a whole. From this point of view, a policy that fostered a radical improvement in public transport performance would make climate action a social policy of real significance. The social benefits could be as great as the climate benefits.
In terms of employment, the manufacture of electric buses would not lead to significant changes, although it is estimated that there would be job losses in the maintenance sector. On the other hand, when surface public transport is organized in bus rapid transit systems, there is usually a net gain in employment compared to atomized or traditional concession systems.

296 Economic Commission for Latin America and the Caribbean (ECLAC)
As far as the environmental footprint is concerned, CO2 emissions by vehicle type, passenger transported and kilometre are obviously lower with electric vehicles, particularly where public transport is concerned, owing to the volume of passengers transported. This last point also applies to internal combustion vehicles. An evaluation carried out by SEDEMA (2016) in Mexico City compares the CO2 emissions per passenger transported of collective and individual means of transport, without considering electric buses (see figure V.23).
Figure V.23 Mexico City: CO2 emissions by vehicle, 2014
(Grams of CO2 per kilometre and per passenger)
344
261
238
141
43
219
0
50
100
150
200
250
300
350
400
450
SUV Sedan Motorbike Hybrid car Electric car Bus Metrobus
Source: Secretariat of the Environment (SEDEMA), Inventario de emisiones de la CDMX 2014: contaminantes criterio, tóxicos y de efecto invernadero, Mexico City, 2016.
Note: Metrobús is a transport system operating in Mexico City that consists of buses running in dedicated lanes.
The potential of electric vehicles to reduce emissions is directly related to their use and, to a lesser extent, their production. The emissions benefits of these vehicles depend on the configuration of the energy system forming the electricity grid that supplies their batteries. The cleaner the electricity grid, the greater the contribution of this technology to the fight against climate change. CO2 emissions during the manufacturing stage are determined by the way commodities are extracted and produced and materials are transported and assembled. As with the energy used by these vehicles, emissions in the manufacturing process are critical and must be considered when assessing the impact of implementing electric mobility in the fight against climate change. Special attention should be paid at this stage to ensure that one lot of emissions does not end up being replaced by another.

The climate emergency in Latin America and the Caribbean... 297
The Netherlands Organisation for Applied Scientific Research (TNO) produced a study in which it quantified the CO2 emissions of pure electric cars and plug-in hybrids and compared them with those of cars running on petrol and diesel in the Netherlands. The research took in the whole life cycle of the vehicle, from manufacturing to recycling and disposal, and concluded that, at the manufacturing stage, pure electric vehicles and plug-in hybrids emitted between 28% and 39% more CO2 than petrol, diesel, and petrol hybrid vehicles (see figure V.24) (TNO, 2015). When the full production cycle from manufacture to use of the vehicles (well-to-wheel or WTW)42 was considered, the conclusion was that electric vehicles emitted 35% less on average than similar petrol or diesel vehicles over a distance of 220,000 km (TNO, 2015). This is consistent with information from other reports (Schneider, 2019).
Figure V.24 CO2 emissions of conventional and electric vehicles over a distance
of 220,000 km, 2015(Grams per kilometre)
0
50
100
150
200
250
300
Green energy Grey energyand
green energy
Green energy Grey energyand
green energy
Petrol Diesel Petrol hybrid
Plug-in hybrid Battery-powered electric
CO2 tank to wheel (TTW) CO2 well to wheel (WTW) CO2 WTW plus production
Source: Netherlands Organisation for Applied Scientific Research (TNO), “Energie- en milieu-aspecten van elektrische personenvoertuigen”, TNO Rapport, Delft, 2015.
Note: Manufacturing includes maintenance and recycling (disassembly). Green energy is energy produced from non-conventional renewable sources and grey energy is the combination of this with fossil energy.
(b) Public transport quality as a driver of development
A number of improved public transport systems have been introduced in the region, such as bus rapid transit systems, cable cars, escalators in residential areas, expanded underground railway systems, trolleybuses and vehicles such as bicycles and scooters made available for public use. In
42 Well to wheel (WTW) refers to the amount of energy in the stage from manufacture to use, well to tank (WTT) the amount of energy in the stage from fuel production to use, and tank to wheel (TTW) the energy provided by the fuel in the vehicle tank.

298 Economic Commission for Latin America and the Caribbean (ECLAC)
terms of cost-effectiveness, bus rapid transit systems have been particularly successful, but their vehicles have considerable room for improvement and service could also be greatly improved by electrification. As regards the transition to the latter, however, as of 2019 there are only two electric vehicle plants in the region. These plants belong to BYD, China’s largest manufacturer, which has a plant in Campinas in Brazil and another in Buenos Aires that is not yet producing.
The vicious circle triggered by poor service quality leads to the service becoming financially compromised, in a spiral of underfunding that results in passengers leaving the system as soon as they can, making the operation more expensive for the remaining users (Vasconcellos, 2019b). Figure V.25 illustrates this phenomenon in relation to Curitiba (Brazil), the city where the region’s bus rapid transit systems were launched. Vasconcellos (2019b) has also documented the phenomenon in other Brazilian cities.
Figure V.25 Curitiba (Brazil): demand for collective transport per inhabitant, 2004–2016
(Daily journeys per inhabitant)
0.3
0.4
0.5
0.6
0.7
0.8
2004 2006 2008 2010 2012 2014 2016
Source: E. Vasconcellos, “Mobilidade urbana em Curitiba: os limites do sonho”, Revista dos Transportes Públicos, vol. 41, São Paulo, National Association of Public Transportation (ANTP), 2019.
Regulatory frameworks channel investments in the desired direction and, as was seen earlier, to make them viable it is necessary to provide the right incentives, redesign institutional frameworks, apply governance at local, national and regional levels, create appropriate regulations and provide greater stimulus to public investment and public-private partnerships. Electric vehicle penetration targets are a good sign (see table V.26). Chile has set a goal of total electrification of the public transport system, a situation that is still exceptional in the region.

The climate emergency in Latin America and the Caribbean... 299
Table V.26 European Union and selected countries: examples of announced targets
for electric vehicles, 2020–2030
Country TargetChina Five million electric vehicles by 2020, including 200,000 buses.European Union 15% and 30% of vehicles sold by 2025 and 2030, respectively, must be electric. Finland 250,000 electric vehicles by 2030.India 30% of vehicles and 100% of buses sold by 2030 must be electric.Ireland 500,000 electric vehicles by 2030; 100% of the vehicles sold that year must
be electric.Japan 20% to 30% of vehicles sold by 2030 must be electric.Netherlands Electric vehicles must have a 10% market share by 2020 and 100% by 2030;
100% of buses sold by 2025 must be electric and 100% of the public bus stock must be by 2030.
New Zealand 64,000 electric vehicles by 2021.Norway 100% of vehicles and buses sold by 2025 must be electric; 75% of
the long-distance bus fleet and 50% of trucks must be electric by 2030.Republic of Korea 200,000 electric vehicles by 2020.Slovenia 100% of vehicles sold by 2030 must be electric.United Kingdom 396,000 to 431,000 electric vehicles by 2020.United States (eight states)
3,300,000 electric vehicles by 2025.
Source: Organization for Economic Cooperation and Development/International Energy Agency (OECD/IEA), Global EV Outlook 2018: Towards cross-modal electrification, Paris, 2018.
Fostering domestic demand has been one of the main incentives for Chinese industry, along with State subsidies and poor air quality in many municipalities. Only electric buses are purchased in cities like Shanghai and Shenzhen. In 2011, 0.6% of all buses sold in China were electric. By 2017, these already made up between 22% and 26% of the country’s stock (Bloomberg, 2018a; ITDP, 2018). In 2017, the share of electric and hybrid buses reached 39.5% of the total in China (ITDP, 2018) and about 1.6% in Europe, with 2,100 units (Bloomberg, 2018a). China is the largest producer and consumer of this type of vehicle: it accounts for 99% of the world’s electric bus stock and 99% of sales, which places it in a privileged position to capture demand from other countries.
In 2009, the city of Shenzhen, which has 12 million inhabitants, was the first of 13 cities selected by the State to showcase and promote electric vehicles in China, including buses, as part of a planned process to stimulate industrial production. By the end of 2017, 16,359 buses of this type (ITDP, 2018) made up the city’s entire fleet, making Shenzhen the first city in the world to have fully electrified public passenger transport mobility. In 2016, according to the Shenzhen Municipal Transport Commission, technological change resulted in emissions savings equivalent to what would have been produced by the consumption of 366,000 tons of coal (ITDP, 2018).
300 Economic Commission for Latin America and the Caribbean (ECLAC)
Maintaining and even increasing the modal share of public transport requires a radical rise in service quality. Low quality produces a vicious circle of abandonment of the service in favour of private transport that needs to be broken in the interests of greater inclusiveness and environmental and time use improvements. The policy lesson is that urban demand for sustainable electrification needs to be planned for to achieve the scale and sustainability the regional industry requires. There is also a need to move from an approach that considers only the capital expenditure involved in introducing buses to one that takes into account both capital and operating expenditure, a framework in which the electric option proves cheaper. This means adjusting both urban regulatory frameworks and the financial mechanisms tried so far, to facilitate their introduction.
3. The contribution of low-carbon livestock to sustainable development: the case of Brazil
Land use change and agriculture are major sources of emissions in Latin America and the Caribbean, as was seen in chapter II, and sustainable ecosystem management is important.
Three paths can be followed in the low-carbon livestock sector (FAO/AGROSAVIA, 2018)
(i) improve productivity and reduce the emissions intensity of livestock by improving feed, genetics, health and animal husbandry, which has the potential to increase food production and income;
(ii) manage soil carbon by restoring degraded and fragmented landscapes through selective intensification of production, thereby creating favourable conditions for biodiversity and climate, the provision of critical ecosystem services, watershed protection and carbon sequestration. About 30% of the global potential to sequester carbon through improved grazing management is in the Latin American and Caribbean region;
(iii) integrate livestock into the circular bioeconomy through the utilization of waste, e.g., manure and crop residues, which can be converted into energy (biomass) and enable nutrient recovery.
These three practices stimulate rural development, curtail the physical expansion of the sector and free up large amounts of land for other uses or to promote environmental recovery. Practices that enable carbon to be sequestered in grasslands increase resilience to climate variability, enhance long-term adaptation and create additional benefits in food security, biodiversity and water conservation.
Economically and environmentally proven methods include silvopastoral systems, agroforestry arrangements that combine fodder plants, grasses and legumes with shrubs and trees for animal feed and other complementary uses

The climate emergency in Latin America and the Caribbean... 301
(FAO/CIPAV, 2019). These production systems make it possible to intensify production based on natural processes and achieve greater sustainability than with conventional land use. Ecological interactions increase productivity, efficiency, the provision of environmental services and, ultimately, the economic performance of estates.
FAO/CIPAV (2019) highlights the benefits of better-quality fodder plants, which reduce the need for supplementation from external sources and increase the number of livestock per hectare up to fourfold. In addition, they increase carbon sequestration in the soil and plants, improve soils and fix nitrogen, optimize water infiltration and the hydrological cycle, and increase bird and insect biodiversity, which improves pollination and pest control. A number of variations on the method are described in the literature, such as crop-livestock-forest systems, forest-livestock integration or crop-livestock integration, depending on the characteristics of each initiative.
Low-carbon cattle farming offers a number of economic advantages. The recovery of grasslands and the implementation of integrated systems would make it possible to reduce cultivated and grazed areas by up to 1.4 million hectares and between 4 and 5 million hectares, respectively. These areas could be removed from the production system and used for forest restoration. This increase in productivity would also make it possible to increase the animal stock per hectare. While in degraded areas the rate is 0.7 animal units per hectare (AU/ha), the load is 1.5 AU/ha in recovered areas and 2.5 AU/ha in areas of integrated forest-livestock systems.
On the basis of the results of pasture recovery and integrated production, the Brazilian Agricultural Research Corporation (EMBRAPA) created the “carbon neutral meat” seal (Alves and others, 2015 and 2018) certifying beef whose emissions are neutralized or captured during the production process. The system is audited and serves to evaluate enteric emissions and sequestration achieved via vegetation and soils. EMBRAPA (2018) estimates that 1.5 million hectares in Brazil can be certified under this system, the equivalent of 1% of the Brazilian herd, or approximately 2.2 million head of cattle.
Another certification process is for “low-carbon meat”, namely meat that can be produced from properly managed grasslands which sequester carbon, whether in integrated systems or otherwise, thereby mitigating animal emissions. The concept of low-carbon meat centres on improving soil quality by fixing emissions. Potential coverage of up to 50 million hectares is being evaluated (EMBRAPA, 2018).
Another important innovation in the meat production sector is the more thorough exploitation of animal products throughout the production chain. Exploitation of animal products employed 53,943 people directly

302 Economic Commission for Latin America and the Caribbean (ECLAC)
in Brazil in 2014 (ABRA, 2016). The same source indicates that there were 344 processing plants in operation, producing more than 12 billion kilos of derivatives with a value of more than US$ 2 billion. Table V.27 shows that animal processing percentages are still low, so growth in the sector could reduce environmental impact and create more jobs and income.
Table V.27 Brazil: animal products produced as a proportion of live weight, 2014
(Percentages)
Animal species Raw material ProportionBovine and buffaloes Offal 35
Blood 3Pigs Offal 17
Blood 3Sheep and goats Offal 21
Blood 4Chickens Offal 16
Blood 9Feathers 3
Turkeys Offal 13Blood 7Feathers 3
Fish Offal 45
Source: Economic Commission for Latin America and the Caribbean (ECLAC), on the basis of Brazilian Association of Animal Recycling (ABRA), II Diagnóstico da Indústria Brasileira de Reciclagem Animal, Brasilia, 2016.
Figure V.26 shows the destination of fat and meal production in 2014. There is clearly a consumer market for animal products that could be expanded.
Figure V.26 Brazil: destination of animal fats and meals, 2014
(Percentages)
Biodiesel(14)
Other(3)
Animal productionand feeding
(60)
Pet food(12)
Hygiene and cleaning(11)
Source: Economic Commission for Latin America and the Caribbean (ECLAC), on the basis of Brazilian Association of Animal Recycling (ABRA), II Diagnóstico da Indústria Brasileira de Reciclagem Animal, Brasilia, 2016.
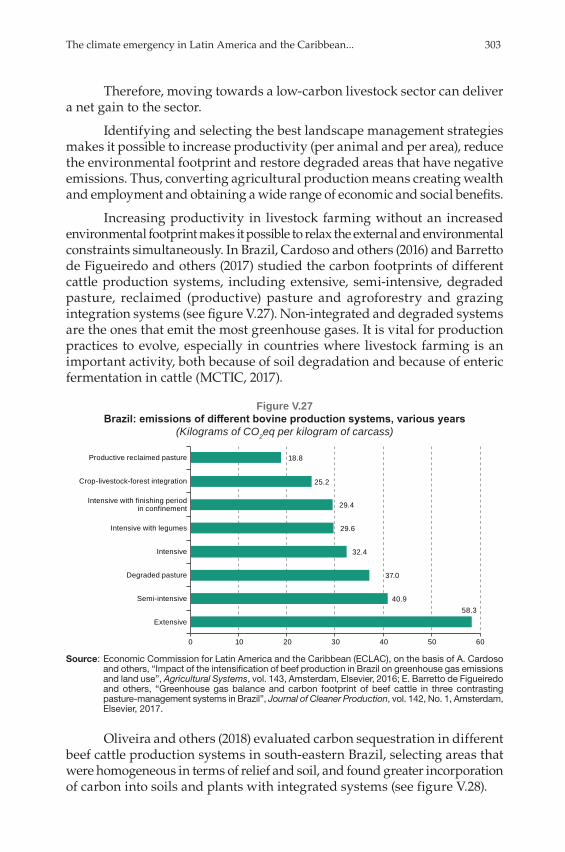
The climate emergency in Latin America and the Caribbean... 303
Therefore, moving towards a low-carbon livestock sector can deliver a net gain to the sector.
Identifying and selecting the best landscape management strategies makes it possible to increase productivity (per animal and per area), reduce the environmental footprint and restore degraded areas that have negative emissions. Thus, converting agricultural production means creating wealth and employment and obtaining a wide range of economic and social benefits.
Increasing productivity in livestock farming without an increased environmental footprint makes it possible to relax the external and environmental constraints simultaneously. In Brazil, Cardoso and others (2016) and Barretto de Figueiredo and others (2017) studied the carbon footprints of different cattle production systems, including extensive, semi-intensive, degraded pasture, reclaimed (productive) pasture and agroforestry and grazing integration systems (see figure V.27). Non-integrated and degraded systems are the ones that emit the most greenhouse gases. It is vital for production practices to evolve, especially in countries where livestock farming is an important activity, both because of soil degradation and because of enteric fermentation in cattle (MCTIC, 2017).
Figure V.27 Brazil: emissions of different bovine production systems, various years
(Kilograms of CO2eq per kilogram of carcass)
58.340.9
37.0
32.4
29.6
29.4
25.2
18.8
0 10 20 30 40 50 60
Extensive
Semi-intensive
Degraded pasture
Intensive
Intensive with legumes
Intensive with finishing periodin confinement
Crop-livestock-forest integration
Productive reclaimed pasture
Source: Economic Commission for Latin America and the Caribbean (ECLAC), on the basis of A. Cardoso and others, “Impact of the intensification of beef production in Brazil on greenhouse gas emissions and land use”, Agricultural Systems, vol. 143, Amsterdam, Elsevier, 2016; E. Barretto de Figueiredo and others, “Greenhouse gas balance and carbon footprint of beef cattle in three contrasting pasture-management systems in Brazil”, Journal of Cleaner Production, vol. 142, No. 1, Amsterdam, Elsevier, 2017.
Oliveira and others (2018) evaluated carbon sequestration in different beef cattle production systems in south-eastern Brazil, selecting areas that were homogeneous in terms of relief and soil, and found greater incorporation of carbon into soils and plants with integrated systems (see figure V.28).

304 Economic Commission for Latin America and the Caribbean (ECLAC)
Figure V.28 Brazil: carbon sequestrated in different beef cattle production systems, various years
(Tons of CO2eq per hectare and per year)
6.2
11.5
11.5
30.5
32.5
0 5 10 15 20 25 30 35
Extensive grazing
Intensive grazing
Crop-livestock integration
Livestock-forest integration
Crop-livestock-forest integration
Source: Economic Commission for Latin America and the Caribbean (ECLAC), on the basis of P. Oliveira and others, Produção de carne carbono neutro: um novo conceito para carne sustentável produzida nos trópicos, Brasilia, Brazilian Agricultural Research Corporation (EMBRAPA), 2018.
Grassland reclamation technologies and the adoption of integrated production systems are turning farming into a carbon sink, mainly thanks to the incorporation of carbon into the soil. Carbon fixing potential is 10.7 million tCO2eq in integrated systems and over 123.0 million tCO2eq in reclaimed grasslands (see figure V.29). For comparison, this carbon sequestration would be equivalent to approximately 1.5 times Ecuador’s total current emissions.
Figure V.29 Carbon sequestration potential with different technologies, 2017
(Millions of tons of CO2eq)
-150 -100 -50 0 50 100 150
Agricultural crops
Reclaimed pasture
Degraded pasture
Maize-livestock integration
Soya-livestock integration
Soya-livestock-forest integration
16.4
-123
96.7
-0.73
-9.2
-0.72
Source: Observatorio ABC, Agricultura de baixa emissão de carbono: avaliação do uso estratégico das áreas prioritárias do Programa ABC, Brasilia, 2017.
Note: Estimated potential carbon capture if the Low-Carbon Agriculture (ABC) Plan were applied in full. Negative numbers indicate carbon sequestration (negative emissions).

The climate emergency in Latin America and the Caribbean... 305
The Low-Carbon Agriculture (ABC) Plan was launched in Brazil in 2010 as a credit line for the purpose of changing production methods and processes to create systems with lower carbon emissions, thereby reducing the environmental impact and increasing the efficiency of agriculture. An observatory (Observatorio ABC, 2017b) monitors the effects of the plan and reports on its results. The plan aims to reduce emissions so that up to 163 million fewer tons of CO2eq are emitted and is a clear example of a climate-smart production development policy.
Pasture recovery and the implementation of integrated systems costs approximately US$ 530 per hectare. The rate of implementation of the plan has been low in recent years, since of the 152.33 billion reais budgeted, only 20.5 billion had been allocated by 2016 because of an increase in the programme’s interest rate.
Changing processes poses a number of policy challenges, such as providing appropriate incentives for farmers to opt for these systems and overcome initial cost barriers, approving public policies that promote rural outreach and producer training, and creating measurement and monitoring systems and tools. Integrated agricultural and forest-livestock systems offer economic advantages thanks to increased productivity, and simultaneously ease the external and environmental constraints, which shows their transformative potential and their contribution to climate action.
Other experiences in Latin America and the Caribbean also show the benefits of implementing crop-livestock-forest systems. In the Eastern Plains region of Colombia, crop-livestock-forest models with large pastures suitable for mechanization have made it possible to renew pastures given over to agriculture at low cost. This reduces stress on the animals and complements their feed with grazing, while generating ecosystem services. In crop-livestock-forest systems, pastures are renewed every 4 or 5 years and a large number of animals can be kept per hectare: 2.5 AU/ha, as compared to the usual 0.8 AU/ha (Restrepo, 2018).
In Uruguay, Oyhantçabal and Jones (2018) point to the potential of livestock-forest systems to reduce emissions intensity per kilogram of beef while boosting carbon sequestration in soils and biomass through the adoption of good practices, such as improving the quantity and quality (digestibility) of livestock feed, working to increase soil organic matter and carbon, restoring soils where organic matter has been lost and degradation is observed, and increasing afforestation for shelter and shade. This set of practices, which make it possible to achieve greater efficiency and convert low-productivity livestock systems into high-productivity ones, has been applied on a pilot scale in the Climate-smart Livestock Production and Land Restoration in the Uruguayan Rangelands project, implemented with the support of the Global Environment Facility (GEF) and the Food and Agriculture Organization of the United Nations (FAO) with climate-smart livestock practices on 35,000 ha directly and 400,000 ha in the indirect intervention area.
306 Economic Commission for Latin America and the Caribbean (ECLAC)
Argentina established a national control system for organic production in 1992, and in 1999 the policy was reinforced by Law No. 25127 on Ecological, Biological or Organic Production and its complementary regulations. This created a legal framework for the development of organic livestock farming, something that was recognized by the European Union, which granted Argentina the status of a country with an equivalent control system. Today 3.2 million hectares in the country are certified organic, which represents 7.3% of the global total (43.7 million hectares). Between 1997 and 2017, Argentina’s organic product exports grew at an average annual rate of 13%. The land area dedicated to organic livestock (2.9 million hectares) is mainly given over to sheep (94%) and cattle (6%): the former are located in the Patagonian region and the latter throughout the country. In the organic sheep business, 762,000 head intended for wool and meat production are grazing on natural pastures (Güelvenzú, 2018).
Although the sectoral examples presented are very limited, it has been possible to demonstrate that climate action is contributing to the objectives of the 2030 Agenda and clearly helping to increase productivity, social inclusion or employment, and to reduce the carbon footprint and other environmental footprints. The same exercise remains to be carried out to document the economic, social and environmental footprint of activities such as the penetration of organic materials in the construction industry, the production of ecosystem services, the development of the care economy and investment in the circular economy and the treatment of solid and liquid urban waste. These sectors are the targets of the dynamic and progressive structural change that will give a great boost to sustainability and the fulfilment of the Sustainable Development Goals. In the sectors mentioned, there is no dilemma: change provides net gains over the status quo and public policies should be designed to help realize them as soon as possible.
G. Conclusions: social participation as a public policy tool
This publication aims to draw attention to the importance of society’s participation as part of the public policy toolkit for climate change. This participation has three dimensions: access to environmental and climate information, involvement in decision-making, and access to environmental justice.43 This issue, linked to the forthcoming application of the Escazú Agreement on access rights, is the necessary complement to the climate
43 Given the length of this book and the ramifications of the subject of social participation, it is dealt with in ECLAC/OHCHR (2019), a publication that reports on institutional advances in the region, as well as policies and actions originating in society that have led to the defence of rights through administrative and judicial mechanisms.

The climate emergency in Latin America and the Caribbean... 307
policies pursued by governments, as a response by society to the growing threat that global warming poses to the well-being and quality of life of large sectors of the population.
As has been seen in this chapter, the number of economic policy instruments is growing and their application is becoming more and more far-reaching, enabling progress to be made in the right direction. But this implementation is not fast enough or ambitious enough to respond adequately to the commitment represented by the Paris Agreement or, more importantly, to the climate emergency. In the light of what has been said in this and earlier chapters, it is clear that institutional arrangements, the pace at which alternative technologies spread and the operating rules of the markets that currently exist will not be adequate to drive the development style in the right direction unless public adaptation and mitigation policies are implemented.
It is also evident that each measure, negotiated separately, comes up against multiple forms of resistance that ultimately explain why effectiveness in achieving climate objectives is low. With regard to the carbon taxes applied in the region, it has become clear that these were one-off negotiations in all but one case. The same has happened with the modification of fossil fuel subsidies, and the change from the previous situation has therefore been marginal. This is also the case in relation to the NDCs, in two ways: because it can be seen that they are inadequate to achieve the reduction required to meet the Paris Agreement goal, and because national efforts have so far been insufficient to increase the rate of decarbonization to a level consistent with the goals set by the NDCs. Thus, the NDCs have not yet been truly recognized as an element capable of integrating and structuring effective public policies.
Although the changes may be marginal, they certainly point in the right direction. But, at the risk of simplification, it could be said that these processes look back towards the status quo and the change possible within it, which becomes the benchmark. As an alternative, a very different situation could be imagined in which changes were made by looking forward, i.e. towards the transformations that are needed. In this other scenario, the NDCs could be the point of reference, the compass guiding the whole set of public policies, and they could be contrasted not so much with change relative to the previous situation, but with their contribution to the fulfilment of their objectives.
Accepting NDCs as a guide means adopting a carbon budget, either annually or for the whole compliance period. It is best to do it both ways, as this makes it easier to calibrate each of the set of measures so as to match the overall change to the speed of decarbonization required and obtain the highest level of co-benefits and the most virtuous interactions between

308 Economic Commission for Latin America and the Caribbean (ECLAC)
the instruments for mitigation purposes. Something similar applies to the adaptation discussed in the previous chapter, when there is a clear indicator for it. The idea of moving towards carbon neutrality is gaining ground, and that involves moving towards emission reduction targets, which differ from targets related to the carbon intensity of GDP or the electricity mix. Emission reduction targets, such as those of Costa Rica, Argentina and Chile (where such targets were being discussed at the time of writing), are clearer for the purpose of giving coherence to cross-cutting and sectoral public policies.
There are still counterproductive instruments, such as subsidies for fossil fuel consumption and encouragement of private mobility, which make expanding the environmental frontier for development difficult, serve sectoral goals and, as noted in the relevant section, have a regressive social distribution. Maintaining the social objective even as efforts to expand the environmental space continue requires a shift away from support for the consumption or production of things that benefit lower-income sectors at a very high cost towards direct support for the individuals and populations targeted. The political context is undoubtedly very important for giving consistency to public policies, and having a common objective to organize them around is of no small importance.
Funds labelled as climate funds are marginal compared to what needs to be invested to shape a style of development that can simultaneously increase social prosperity and care for the planet. The financial system itself has much to improve in terms of risk management and internalization of the climate impacts of financing. Within countries, too, a great deal needs to be improved when it comes to designing financial and fiscal strategies that are aligned with climate objectives. The resulting investments would generate legitimate profits, i.e. profits not arrived at by externalizing damage, to the detriment of investments whose profitability is spurious because it comes at the cost of aggravating climate change or failing to take adaptation needs into account. This would lead to climate finance gradually becoming the normal way to finance both governments and public and private investments.
Each country, as its economic and political circumstances dictate, will have to find the combination that works best to redirect investment and consumption and spread the effort of change between the present generation and future generations. But all the instruments described, namely annual and total carbon budgets allocated by sectors and territories, CO2 taxes and emissions trading markets, must be involved to at least some extent.
NDCs have been prepared on the basis of public consultation processes (Samaniego and others, 2019). There are far-reaching issues, such as the implementation of the instruments described and the periodic adjustment of NDCs called for by the Paris Agreement, which require a structured forum for discussion over and above government interministerial committees.

The climate emergency in Latin America and the Caribbean... 309
Access to information, participation and justice in environmental matters is indispensable. The Escazú Agreement offers a benchmark and a guide for countries to give legitimacy and support to these processes of change.
Monitoring progress towards compliance with NDCs and the Paris Agreement requires strengthened oversight, reporting and verification mechanisms that enable annual adjustments to be made to the policies implemented to keep economies on the right track, thus allowing policies to be related to results. And it is worth emphasizing that regional intergovernmental coordination has the potential to make information comparable, to harmonize the design and application of instruments, and even to attempt some solutions on the appropriate scale. Lastly, it brings out the importance of the sectoral dimension which, because of its heterogeneity, calls for solutions on very different scales and with territorial peculiarities.

310 Economic Commission for Latin America and the Caribbean (ECLAC)
Annex V.A1.1
Methodology for measuring climate expenditure
Calculating gross climate expenditure involves collecting a considerable amount of information from national statistics and even designing surveys to apply in the public and private sectors. Agreement must be reached on expenditure that varies in terms of the goals identified, such as environmental expenditure, whose main object is to reduce pollution, and expenditure that has other environmental objectives.
The challenge with regard to climate spending is greater, since there is no consensus on how to define it or internationally validated standards for classifying policies relating to it. In quantifying climate spending, as in measuring environmental protection spending, three questions must be answered: (i) Who does the spending? (ii) How is the money spent? (iii) To what purpose is it spent? (ECLAC/INEGI, 2015).
For the purposes of measuring environmental protection and climate expenditure, it is necessary to have information gathering protocols, as well as estimation methodologies, indicators and statistical analyses, which are the components of the system (see diagram VA1.1). The dynamism of the environmental sector, the requirements of each country and international comparability must also be considered.
To classify public sector climate expenditure, it is advisable to apply the primary purpose criterion, which makes it possible to identify the main goal of budgetary expenditure and to account for allocated expenditure whose primary purpose is to combat climate change or adapt to its impact. In practice, however, it is difficult to determine the primary purpose of spending because investments and expenditures usually have multiple objectives. Nor is it easy to know whether climate change adaptation or mitigation was the real objective of the expenditure: sometimes the aim is to make more efficient use of inputs, and only after the event can the objective be interpreted as climate-motivated. Furthermore, many budget lines do not make it explicit that the expenditure is for climate change mitigation or adaptation, so this approach would exclude such expenditure from the accounting.
The budget structure does not yet allow for the generation of information on a subject as particular as climate change, and budget labels are usually framed by criteria of a more administrative nature. Although there is an environmental function classifier within government spending, climate spending is even more specific, so the identification process begins at the most basic level of information. This means that grouping climate spending is a process that involves going case by case or from the particular to the

The climate emergency in Latin America and the Caribbean... 311
general. The analysis also needs to review the policies involved case by case and be clear and consistent about the conceptual differences between mitigation and adaptation. The first concept is clearer, as it relates directly to the reduction of greenhouse gas emissions; the second may be less easy to identify, as noted in the previous chapter.
Coverage is also important. The quantification of expenditure is linked ex ante to the ministries and institutions that have environmental or climate responsibilities. However, all institutions are involved in environmental and climate spending, so it is necessary to analyse each budget sub-item, which requires a greater effort to identify the objectives of spending in its different institutional components: general government, financial corporations, non-financial corporations (industries), households, non-profit institutions serving households and the rest of the world.44 In turn, general government is made up of central, regional and local governments. ECLAC/INEGI (2015) recommends starting with the analysis of public expenditure by central government. As noted, this exercise was done in relation to environmental protection expenditure in Chile (ECLAC/MMA, 2015) and Costa Rica (ECLAC, 2018c). Spending that affects climate is widely dispersed among different institutions and at different administrative levels, and there are major difficulties in identifying, classifying and, in particular, collecting and processing the information.
In economies where different economic actors interact, expenditure associated with efforts to combat climate change can be recorded in more than one institution, resulting in double counting. For this reason, transfers and subsidies must be carefully considered and included so as not to overestimate spending in any one sector (OECD, 2007a). It is generally possible to access data on who makes environmental service payments and purchases, but it is not always possible to obtain information on the financing source. To avoid the problems of double counting, two approaches are used that theoretically lead to the same result (although they do not usually coincide in practice): (i) accounting for spending by whoever undertakes and implements climate action, and (ii) allocating it to whoever finances it.
44 Climate spending, like all fiscal spending, can finance current or capital expenditure. Current expenditure is operational and includes workers’ wages, use of goods and services, and consumption of fixed capital. It also includes interest, subsidies, donations, social benefits and other expenses related to current transfers, among other things. Capital expenditure is that on investments to acquire movable and immovable goods that will be used continuously during one or more accounting periods. These investments include the purchase of machinery and equipment, transfers of resources for capital, the execution of works and others (ECLAC/INEGI, 2015).

312 Economic Commission for Latin America and the Caribbean (ECLAC)
Diagram V.A1.1 Process of calculating climate expenditure by measuring general government
environmental protection spending
I. Preparation
Identification oflead institution
Formation of working team and
inter-agency agreements
Technical team
Executive team
First steps of working team
Determination of coverage to be measured and identification of
information sources
Central government
State government
Local government
Off-budget central government
General government environmental
protection spending
II. Information analysis
II. Estimation of expenditure
Notification of results
Dissemination of results
Source: Economic Commission for Latin America and the Caribbean/National Institute of Statistics and Geography (ECLAC/INEGI), “Guía metodológica: medición del gasto en protección ambiental del gobierno general”, Project Documents (LC/W.653), Santiago, 2015.

The climate emergency in Latin America and the Caribbean... 313
An
nex
V.A
2.1
Pri
vate
ban
k cl
imat
e fi
nan
ce in
itia
tive
s in
Lat
in A
mer
ica
and
th
e C
arib
bea
n
Tabl
e V.
A2.
1 La
tin A
mer
ica
and
the
Car
ibbe
an: s
usta
inab
ility
initi
ativ
es im
plem
ente
d by
som
e pr
ivat
e ba
nks,
201
8
Inst
itutio
nC
ount
ryS
trate
gy, p
olic
y or
pro
gram
me
Fina
ncin
g lin
es
or o
ther
inst
rum
ent
Are
aFu
ndin
g so
urce
Envi
ronm
enta
l an
d so
cial
ris
k an
alys
is
Ecua
dor
prin
cipl
es
Nat
iona
l Ban
k of
Mex
ico
(Citi
bana
mex
)
Mex
ico
Com
preh
ensi
ve
ener
gy
effici
ency
pr
ogra
mm
e
Sus
tain
able
Bus
ines
s C
redi
tEn
ergy
effi
cien
cy fo
r sm
all
and
med
ium
-siz
ed
ente
rpris
es (S
MEs
)
In c
onju
nctio
n w
ith
the
Mul
tilat
eral
In
vest
men
t Fun
d (M
IF)
of th
e In
ter-
Am
eric
an
Dev
elop
men
t Ban
k (ID
B)
Yes
Yes
Ban
colo
mbi
a G
roup
Col
ombi
aS
usta
inab
le
Bus
ines
s S
trate
gy
Gre
en L
ine
Ener
gy e
ffici
ency
with
re
new
able
ene
rgie
s an
d cl
eane
r pro
duct
ion
met
hods
Ow
n fu
nds
Yes
(diff
eren
t bu
sine
ss u
nits
)Ye
s
Spe
cial
dev
elop
men
t ba
nkin
g lin
esD
evel
opm
ent b
anki
ng
Envi
ronm
enta
l Cre
dit L
ine
of
the
Sw
iss
Sta
te S
ecre
taria
t fo
r Eco
nom
ic A
ffairs
(SEC
O)
Con
vers
ion
to e
ffici
ent
tech
nolo
gies
with
a p
ositi
ve
envi
ronm
enta
l im
pact
SEC
O s
ubsi
dies
My
Plan
etA
ltern
ativ
e en
ergy
veh
icle
sO
wn
fund
sD
evel
opm
ent B
ank
of L
atin
Am
eric
a (C
AF)
line
Sus
tain
able
con
stru
ctio
n,
treat
men
t pla
nts
and
acqu
isiti
on o
f ene
rgy-
effici
ent
mac
hine
ry
CA
F
Ban
CO
2Pa
ymen
t for
en
viro
nmen
tal s
ervi
ces
Volu
ntar
y off
sets

314 Economic Commission for Latin America and the Caribbean (ECLAC)
Inst
itutio
nC
ount
ryS
trate
gy, p
olic
y or
pro
gram
me
Fina
ncin
g lin
es
or o
ther
inst
rum
ent
Are
aFu
ndin
g so
urce
Envi
ronm
enta
l an
d so
cial
ris
k an
alys
is
Ecua
dor
prin
cipl
es
Ban
co d
e C
rédi
to e
In
vers
ione
s (B
CI)
Chi
leB
usin
ess
line
with
en
viro
nmen
tal a
ppro
ach
Non
-con
vent
iona
l ren
ewab
le
ener
gies
for l
arge
firm
s an
d pr
oper
ty d
evel
oper
s (ru
n-of
-riv
er h
ydro
elec
tric
stat
ions
and
win
d en
ergy
)
Ow
n fu
nds
No
No
BCI A
ltern
ativ
e En
ergi
es
Mut
ual F
und
Opp
ortu
nity
to in
vest
in
com
pani
es o
pera
ting
in
non-
conv
entio
nal r
enew
able
en
ergi
es, o
ptim
izat
ion
and
dece
ntra
lizat
ion
of th
e su
pply
of
thes
e en
ergi
es
Cus
tom
ers
BCI N
on-c
onve
ntio
nal
Ren
ewab
le E
nerg
ies
Trad
ing
Fund
I
Sha
res
or d
ebt s
ecur
ities
of
non-
conv
entio
nal r
enew
able
en
ergy
trad
ing
com
pani
es
Cus
tom
ers
Car
bon
Neu
tral C
ard
Cre
dit c
ard,
CO
2eq
emis
sion
s re
duct
ion
and
offse
tting
Cus
tom
ers
Tab
le V
.A2.
1 (c
ont
inue
d)
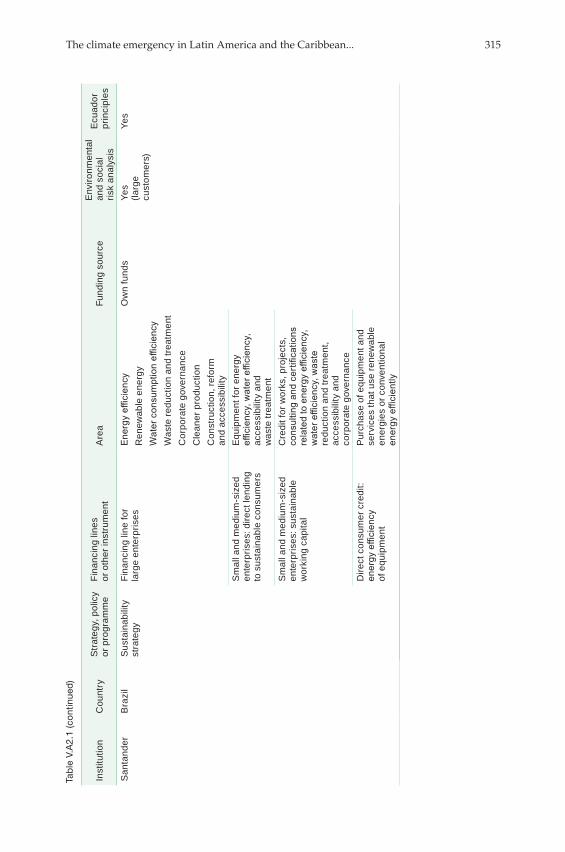
The climate emergency in Latin America and the Caribbean... 315
Inst
itutio
nC
ount
ryS
trate
gy, p
olic
y or
pro
gram
me
Fina
ncin
g lin
es
or o
ther
inst
rum
ent
Are
aFu
ndin
g so
urce
Envi
ronm
enta
l an
d so
cial
ris
k an
alys
is
Ecua
dor
prin
cipl
es
San
tand
erB
razi
lS
usta
inab
ility
st
rate
gyFi
nanc
ing
line
for
larg
e en
terp
rises
Ener
gy e
ffici
ency
Ren
ewab
le e
nerg
yW
ater
con
sum
ptio
n effi
cien
cy
Was
te re
duct
ion
and
treat
men
t C
orpo
rate
gov
erna
nce
Cle
aner
pro
duct
ion
Con
stru
ctio
n, re
form
an
d ac
cess
ibili
ty
Ow
n fu
nds
Yes
(larg
e cu
stom
ers)
Yes
Sm
all a
nd m
ediu
m-s
ized
en
terp
rises
: dire
ct le
ndin
g to
sus
tain
able
con
sum
ers
Equi
pmen
t for
ene
rgy
effici
ency
, wat
er e
ffici
ency
, ac
cess
ibili
ty a
nd
was
te tr
eatm
ent
Sm
all a
nd m
ediu
m-s
ized
en
terp
rises
: sus
tain
able
w
orki
ng c
apita
l
Cre
dit f
or w
orks
, pro
ject
s,
cons
ultin
g an
d ce
rtific
atio
ns
rela
ted
to e
nerg
y effi
cien
cy,
wat
er e
ffici
ency
, was
te
redu
ctio
n an
d tre
atm
ent,
acce
ssib
ility
and
co
rpor
ate
gove
rnan
ceD
irect
con
sum
er c
redi
t: en
ergy
effi
cien
cy
of e
quip
men
t
Purc
hase
of e
quip
men
t and
se
rvic
es th
at u
se re
new
able
en
ergi
es o
r con
vent
iona
l en
ergy
effi
cien
tly
Tab
le V
.A2.
1 (c
ont
inue
d)

316 Economic Commission for Latin America and the Caribbean (ECLAC)
Inst
itutio
nC
ount
ryS
trate
gy, p
olic
y or
pro
gram
me
Fina
ncin
g lin
es
or o
ther
inst
rum
ent
Are
aFu
ndin
g so
urce
Envi
ronm
enta
l an
d so
cial
ris
k an
alys
is
Ecua
dor
prin
cipl
es
San
tand
erB
razi
lS
anta
nder
S
usta
inab
le
Agric
ultu
re
Prog
ram
me:
cr
edit
for r
ural
pr
oduc
ers
look
ing
to in
vest
in
inno
vatio
n an
d th
e su
stai
nabi
lity
of
the
coun
trysi
de
Dire
ct c
onsu
mer
cre
dit:
acce
ssib
ility
Adap
tatio
n of
veh
icle
s,
acce
ssib
ility
equ
ipm
ent,
liftin
g pl
atfo
rms,
whe
elch
airs
an
d he
arin
g ai
ds
Ow
n fu
nds
and
BN
DES
tran
sfer
s
Dire
ct c
onsu
mer
cre
dit:
clea
ner p
roce
sses
Purc
hase
of e
quip
men
t th
at re
duce
s th
e so
cioe
nviro
nmen
tal i
mpa
ct
caus
ed b
y co
mpa
nies
, suc
h as
sys
tem
s to
reus
e w
ater
an
d eq
uipm
ent t
o re
cycl
e an
d re
duce
pol
lutin
g ga
ses
Dire
ct c
onsu
mer
cre
dit:
agric
ultu
rePu
rcha
se o
f mac
hine
s,
vehi
cles
and
tech
nica
l so
lutio
ns fo
r agr
icul
ture
and
liv
esto
ck th
at h
ave
a lo
wer
en
viro
nmen
tal i
mpa
ctR
educ
e an
d O
ffset
CO
2 Pr
ogra
mm
e
Line
s of
the
Nat
iona
l Ban
k fo
r Eco
nom
ic a
nd S
ocia
l D
evel
opm
ent (
BN
DES
): fin
anci
ng to
pro
mot
e su
stai
nabl
e fa
rmin
g
Low
-car
bon
agric
ultu
reM
oder
agro
Mod
erin
fraB
ND
ES A
utom
atic
Inov
agro
BN
DES
Car
bon
cred
its
So
urce
: E
cono
mic
Com
mis
sion
for
Latin
Am
eric
a an
d t
he C
arib
bea
n (E
CLA
C),
on t
he b
asis
of d
ata
from
the
diff
eren
t in
stitu
tions
.
Tab
le V
.A2.
1 (c
onc
lud
ed)

The climate emergency in Latin America and the Caribbean... 317
Annex V.A3.1
Climate development finance initiatives in Latin America and the Caribbean: Nacional Financiera (NAFIN) and National Bank for Economic and Social Development (BNDES)
Table V.A3.1 Credit lines applicable to sustainability and climate change available from Nacional
Financiera (NAFIN) and National Bank for Economic and Social Development (BNDES) as of 2018
Institution Credit lines applicable to sustainability and climate changeNAFIN, Mexico
1. Sustainable Project Financing Programme.Short-, medium- and long-term financing for Mexican and international companies or financial intermediaries, involving the design, structuring and implementation of financial mechanisms in accordance with the particular characteristics of each priority and strategic project: medium-sized or large enterprises or special-purpose vehicles incorporated in Mexico for the development of energy projects, financial institutions (domestic or foreign) and multilateral financial organizations that provide financing for energy projects.This product contributes to the fulfilment of the objectives of the National Development Plan 2013–2018, which establishes the necessary lines of action to foster and guide inclusive and enabling green growth that preserves the country’s natural heritage while promoting competitiveness and employment.The following are financed under the Programme:• Photovoltaic projects. Financing to design, build and implement solar projects in order
to produce electricity from renewable sources and to promote the development of infrastructure and electrical coverage in the country, in alignment with the energy reform, by designing financing structures, participated in by development banks, that make the development of renewable energy projects viable.
• Wind projects. Financing for the design and construction of wind farms to support private investment in the country and act as a promoter of energy reform, through large-scale financing aimed at developing strategic sectors that will help increase electricity transmission infrastructure and coverage.
• Hydroelectric projects. Financing to design, build and develop hydroelectric plants in order to boost the development of electrical infrastructure and coverage in the country, in alignment with the energy reform.
• Energy efficiency projects: combined cycle and cogeneration. - Electricity generating plants: financing to build and operate cogeneration plants for the purpose of producing electricity.
- Transmission and storage plants. Innovative technologies: financing for waste processing, an alternative way of generating electricity without using non-renewable fuels by using waste as a heat source. This type of project contributes to the progressive replacement of traditional fuels (sustainable development) and is a long-term productive investment with high environmental and socio-economic impact, both locally and regionally.
• Public-private partnerships. These are a mechanism for enlisting private capital to build public infrastructure and its associated services. A central element in public-private partnership projects is the optimal distribution of risk between the public and private sectors, with the aim of making the cost of the project lower than that of traditional public works.
• Value added tax (VAT): financing of VAT to be paid from the investments required for the construction of the project.
• Corporate finance. Medium- and long-term direct financing for companies involving the design, structuring and implementation of financial mechanisms in accordance with the particular characteristics of each strategic project considered a priority for Mexico. Corporate financing methods include the following:
• Transmission lines. Financing to design, construct and implement transmission lines (a set of devices to transport or guide electrical energy from a generating source to centres of consumption), in order to promote the development of transmission infrastructure and electrical coverage in the country, in alignment with the energy reform.
• Petrochemicals, steel and gas pipelines.

318 Economic Commission for Latin America and the Caribbean (ECLAC)
Table V.A3.1 (continued)
Institution Credit lines applicable to sustainability and climate changeNAFIN, Mexico
3. Investment programmes: Nacional Financiera Indirect Equity Investment. This promotes and develops the venture capital industry in Mexico through the Mexican Capital Investment Corporation (CMIC) or Fund of Funds. The corporate structure of CMIC is divided into vehicles with specific investment theses in private equity, venture capital, mezzanine debt and the energy sector.
4. Credits handled through the Electricity Saving Trust (FIDE):a
• Sustainable improvement of housing: credit for the installation of equipment to harness solar energy and increase the efficiency of electricity use in existing homes in order to generate gas and electricity savings.
• Ecocredits: - Mass corporate. Credit for replacing obsolete equipment with new equipment using state-of-the-art technology, obtained from FIDE-certified suppliers.
- Individual. Credit for the company to save on energy consumption by using small-scale clean energy. Current devices are replaced by more efficient ones, and production processes are adapted.
5. New programmes. Funding for service station operators to invest in modernization to cope with the new competition conditions in the energy industry. This funding is processed through other financial institutions, such as BanBajío, BanRegio, Multiva and Santander.
6. Products for financial intermediaries (network of NAFIN-accredited financial intermediaries): • Guarantees allowing them to lend to Mexican companies, in order to promote the latter’s
financial inclusion and improve their credit conditions.• Funding. Financing is received to lend on to companies that need to consolidate and develop.
7. Management of international credit line projects.BNDES, Brazil
Manages resources through credit lines, programmes and funds and other initiatives.1. Credit lines:
• BNDES Forestry. Line of credit for reforestation, conservation and forest recovery of degraded or converted areas, and sustainable use of native areas in the form of forest management.
• BNDES Energy Efficiency.• Financing lines applicable to climate projects:
- BNDES Finem - Energy Efficiency. For projects focused on reducing energy consumption and increasing the efficiency of the national energy system.
- BNDES Finem - Power Generation. To expand and modernize the infrastructure for generating energy from renewable sources and natural gas thermoelectric plants.
- BNDES Finem - Electricity Distribution. To expand and modernize the energy distribution infrastructure.
2. Programmes:• BNDES Forest Offset. Supports the regularization of legal reserve liabilities on rural
estates devoted to agribusiness and the preservation and enhancement of native forests and remaining ecosystems.
• BNDES Proplastic - Socioenvironmental. Supports investments aimed at rationalizing the use of natural resources, creating clean development mechanisms and systems for managing and recovering environmental liabilities, and financing social investment projects and programmes carried out by companies in the plastics production chain.
• Programmes eligible for guarantees specifically aimed at climate change. These include the Climate Fund Programme, which offers the following subprogrammes: - Urban mobility (operations within the sphere of BNDES Automatic).b
- Efficient machinery and equipment (operations within the sphere of the products of BNDES Finamec and BNDES Automatic).
- Renewable energies (operations within the sphere of BNDES Automatic). - Sustainable cities and climate change (operations within the sphere of BNDES Automatic). - Native forests (operations within the sphere of BNDES Automatic). - Carbon management and services (operations within the sphere of BNDES Automatic). - Solid waste (operations within the sphere of BNDES Automatic).

The climate emergency in Latin America and the Caribbean... 319
Table V.A3.1 (concluded)
Institution Credit lines applicable to sustainability and climate changeBNDES, Brazil
3. Funds and other initiatives:• Amazon Fund. The central objective of the Amazon Fund is to promote projects to
prevent and combat deforestation and to conserve and sustainably use the forests of the Amazon biome, in accordance with decree No. 6527 of 1 August 2008. The Amazon Fund is managed by BNDES, and resources are raised exclusively from donations.
• Climate Fund Programme. The purpose of this is to implement the package of reimbursable resources of the National Climate Change Fund, or Climate Fund, created by Law No. 12114 of 9 December 2009 and regulated by decree No. 7343 of 26 October 2010. It is an accounting fund, linked to the Ministry of the Environment with the aim of guaranteeing resources to support projects or studies and financing for ventures aimed at mitigating climate change.
• BNDES Atlantic Forest initiative. This selects projects aimed at reforesting the region with native species, in order to provide them with non-reimbursable financial resources from the BNDES Social Fund.
• BNDES Clean Development Fund. Support for firms and projects with the potential to generate certified carbon reductions, via equity holdings in companies.
• Investment and Equity Fund – Forestry. Investment fund to take equity stakes in companies or ventures whose emphasis is on forest assets.
Source: Economic Commission for Latin America and the Caribbean (ECLAC), on the basis of data from the different institutions.
a See [online] http://www.fide.org.mx/index.php?option=com_content&view=article&id=108&Itemid=180. FIDE is a private non-profit trust established on 14 August 1990 at the initiative of the Federal Electricity Commission (CFE) in support of the Electricity Saving Programme. Its purpose is to contribute to actions for saving and efficiently using electricity. It is made up of the following: - Settlors: Confederation of Industrial Chambers (CONCAMIN), National Manufacturing Industry Chamber
(CANACINTRA), National Chamber of Electrical Manufactures (CANAME), Mexican Construction Industry Chamber (CMIC), National Chamber of Consulting Companies (CNEC) and Mexican Union of Electrical Workers (SUTERM).
- Fiduciary: Nacional Financiera (NAFIN), which grants powers to a fiduciary delegate who acts as a proxy for the trustee and in turn delegates powers to the director general of FIDE, with the latter then delegating powers to the deputy directors in their areas of competence.
- Trustees: CFE and electricity consumers who are beneficiaries of the services provided by the trust.b Investments to implement, expand, restore and modernize facilities or activities in the industrial, agricultural,
infrastructure, trade, service, forestry production, fisheries and aquaculture sectors.c Financing for the production and acquisition of Brazilian machinery and equipment accredited by BNDES.

320 Economic Commission for Latin America and the Caribbean (ECLAC)
An
nex
V.A
4.1
Det
ails
of
gre
en b
on
d is
suan
ce in
Lat
in A
mer
ica
and
th
e C
arib
bea
n
Tabl
e V.
A4.
1 La
tin A
mer
ica
and
the
Car
ibbe
an: d
etai
ls o
f gre
en b
ond
issu
ance
, 201
8–20
19
Sec
tor
Com
pany
Cou
ntry
Am
ount
in th
e is
suin
g cu
rren
cyC
urre
ncy
Am
ount
in
mill
ions
of
dol
lars
Issu
e da
teM
atur
ityO
bser
vatio
ns
2018
Priv
ate
Ban
co G
alic
ia É
min
ent
Arg
entin
a10
0 00
0 00
0do
llar
100.
00A
pril
2018
Cre
ate
finan
cing
inst
rum
ents
for p
roje
cts
with
a s
peci
fic fo
cus
on e
nviro
nmen
tal
impr
ovem
ent,
such
as
alte
rnat
ive
ener
gies
, en
viro
nmen
tal e
ffici
ency
, cle
an tr
ansp
ort
and
was
te m
anag
emen
tPr
ivat
eR
io E
nerg
y (C
opac
aban
a G
eraç
ão d
e En
ergi
a e
Part
icip
açõe
s S
.A.)
Bra
zil
127
780
000
real
32.8
5Au
gust
20
18Au
gust
203
3Ei
ght w
ind
pow
er p
lant
s
Publ
ic-
priv
ate
Com
panh
ia d
e Tr
ansm
issã
o de
Ene
rgia
El
étric
a Pa
ulis
ta
(ISA
CTE
EP)
Bra
zil
621
000
000
real
179.
00A
pril
2018
Apr
il 20
25Fi
nanc
e pr
ojec
ts a
war
ded
in th
e pu
blic
re
new
able
ene
rgy
auct
ions
of 2
016
and
2017
Priv
ate
Agu
as A
ndin
asC
hile
1 50
0 00
0de
velo
pmen
t un
it (U
F)68
.10
Mar
ch 2
018
Mar
ch 2
025
Fina
nce
proj
ects
that
hav
e a
posi
tive
envi
ronm
enta
l and
soc
ial i
mpa
ctPr
ivat
eA
gros
uper
Chi
le10
0 00
0 00
0do
llar
100.
00O
ctob
er
2018
Oct
ober
20
25Fi
nanc
e so
me
of th
e ac
quis
ition
s m
ade
in th
e sa
lmon
indu
stry
Priv
ate
Empr
esa
de E
nerg
ía
del P
acífi
co (E
PSA)
Col
ombi
a70
000
000
000
Col
ombi
an
peso
24.0
0Ju
ly 2
018
July
203
0S
olar
ene
rgy
proj
ects
in Y
umbo
, Bol
ívar
, C
hica
moc
ha a
nd V
alle
dupa
rPr
ivat
eB
anco
lom
bia
Col
ombi
a29
9 99
0 00
0 00
0C
olom
bian
pe
so10
1.47
July
201
8Ju
ly 2
023
Fina
nce
sust
aina
ble
proj
ects
that
miti
gate
cl
imat
e ch
ange
Mul
tilat
eral
Dev
elop
men
t Ban
k of
La
tin A
mer
ica
(CA
F)C
olom
bia
150
000
000
000
Col
ombi
an
peso
50.7
0M
ay 2
018
May
202
8Fi
nanc
e pr
ojec
ts w
ith h
igh
envi
ronm
enta
l an
d so
cial
impa
ctPu
blic
Fide
icom
isos
Inst
ituid
os
en R
elac
ión
con
la
Agr
icul
tura
(FIR
A) (b
ank)
Mex
ico
2 50
0 00
0 00
0M
exic
an
peso
129.
48O
ctob
er
2018
Oct
ober
20
21C
reat
e a
spec
ific
gree
n po
rtfo
lio
for t
he ru
ral s
ecto
r
Publ
icM
exic
o C
ityM
exic
o1
100
000
000
Mex
ican
pe
so56
.971
Nov
embe
r 20
18N
ovem
ber
2028
Fina
nce
or re
finan
ce p
roje
cts
that
offe
r en
viro
nmen
tal b
enefi
ts

The climate emergency in Latin America and the Caribbean... 321
Sec
tor
Com
pany
Cou
ntry
Am
ount
in th
e is
suin
g cu
rren
cyC
urre
ncy
Am
ount
in
mill
ions
of
dol
lars
Issu
e da
teM
atur
ityO
bser
vatio
ns
Priv
ate
BBV
A B
anco
mer
Mex
ico
3 50
0 00
0 00
0M
exic
an
peso
185.
90S
epte
mbe
r 20
18S
epte
mbe
r 20
21Fi
nanc
e su
stai
nabl
e pr
ojec
ts, e
spec
ially
bu
ildin
g an
d re
new
able
ene
rgy
proj
ects
Priv
ate
Mes
a La
Paz
win
d fa
rmM
exic
o37
6 00
0 00
0do
llar
376.
00Ju
ne 2
018
June
204
4C
ontri
bute
to th
e co
nstru
ctio
n of
a
306
MW
win
d fa
rm (u
nder
con
stru
ctio
n)Pr
ivat
ePr
otis
a Pe
ru (p
aper
an
d ca
rdbo
ard)
Peru
100
000
000
sol
29.6
8O
ctob
er
2018
Oct
ober
20
24En
ergy
effi
cien
cy, p
ollu
tion
prev
entio
n an
d co
ntro
l, an
d su
stai
nabl
e w
ater
m
anag
emen
t pro
ject
sPu
blic
Lim
aPe
ru7
535
000
dolla
r7.
535
Oct
ober
20
18D
ecem
ber
2029
Fina
nce
hous
ing
Mul
tilat
eral
Dev
elop
men
t Ban
k of
Lat
in A
mer
ica
(CA
F)R
egio
nal
50 0
00 0
00do
llar
50.0
0N
ovem
ber
2018
Nov
embe
r 20
23Pr
ojec
ts w
ith h
igh
envi
ronm
enta
l im
pact
Mul
tilat
eral
Dev
elop
men
t Ban
k of
Lat
in A
mer
ica
(CA
F)R
egio
nal
30 0
00 0
00do
llar
30.0
0Au
gust
20
18Au
gust
202
3Pr
ojec
ts w
ith h
igh
envi
ronm
enta
l im
pact
Priv
ate
Inve
nerg
yU
rugu
ay64
750
000
dolla
r64
.75
Janu
ary
2018
July
204
2Fi
nanc
e th
e La
Jac
inta
Sol
ar 6
4.8
MW
ph
otov
olta
ic fa
cilit
yPr
ivat
e At
las
Ren
ewab
le E
nerg
yU
rugu
ay10
8 00
0 00
0do
llar
108.
00Ju
ly 2
018
July
204
2R
efina
nce
two
sola
r pro
ject
s, E
l Nar
anja
l (5
0 M
W) a
nd D
el L
itora
l (16
MW
) T
otal
1 51
3.5
2019
Priv
ate
Agu
as A
ndin
asC
hile
2 00
0 00
0de
velo
pmen
t un
it (U
F)83
.19
Mar
ch 2
019
Mar
ch 2
044
Fina
nce
proj
ects
with
a p
ositi
ve
envi
ronm
enta
l and
soc
ial i
mpa
ctPu
blic
Cor
pora
ción
Fin
anci
era
de D
esar
rollo
(CO
FID
E)Pe
ru10
0 00
0 00
0so
l29
.68
Apr
il 20
19A
pril
2022
Fina
nce
ener
gy p
roje
cts,
in p
artic
ular
sol
ar
and
smal
l-sca
le h
ydro
pow
erPr
ivat
e A
ES T
ietê
B
razi
l82
0 00
0 00
0re
al21
0.0
Apr
il 20
19M
arch
202
9Fi
nanc
e th
e G
uaim
bê a
nd O
uroe
ste
sola
r po
wer
pla
nts
Priv
ate
Con
sorc
io T
rans
man
taro
Peru
400
000
000
dolla
r40
0.0
Apr
il 20
19A
pril
2034
Fina
nce
and
refin
ance
cap
ital e
xpen
ditu
res
cert
ified
by
the
Clim
ate
Bon
ds In
itiat
ive’
s gr
een
bond
prin
cipl
esPr
ivat
e K
labi
nB
razi
l50
0 00
0 00
0do
llar
500.
0A
pril
2019
Apr
il 20
49Pr
omot
e th
e su
stai
nabl
e m
anag
emen
t of
euc
alyp
tus
and
pine
fore
sts
cert
ified
by
the
Fore
st S
tew
ards
hip
Cou
ncil
(FS
C)
Priv
ate
Tran
smis
sora
Alia
nça
de
Ener
gia
Elét
rica
(TA
ESA)
B
razi
l21
0 00
0 00
0re
al53
.98
May
201
9M
ay 2
044
Bui
ld th
ree
trans
mis
sion
line
s to
impr
ove
the
flow
of a
ltern
ativ
e re
new
able
ene
rgy
Priv
ate
Will
iam
s C
arib
bean
Cap
ital
Bar
bado
s3
000
000
Bar
bado
s do
llar
1.5
June
201
9Ju
ne 2
023
Phot
ovol
taic
sol
ar p
lant
Tab
le V
.A4.
1 (c
ont
inue
d)

322 Economic Commission for Latin America and the Caribbean (ECLAC)
Sec
tor
Com
pany
Cou
ntry
Am
ount
in th
e is
suin
g cu
rren
cyC
urre
ncy
Am
ount
in
mill
ions
of
dol
lars
Issu
e da
teM
atur
ityO
bser
vatio
ns
Publ
icC
hile
an S
tate
Chi
le1
418
000
000
dolla
r1
418.
0Ju
ne 2
019
Janu
ary
2050
Mul
tisec
tor g
reen
Priv
ate
Inve
rsio
nes
CM
PC
C
hile
2.5
deve
lopm
ent
unit
(UF)
100.
0Ju
ly 2
019
July
202
9Fi
nanc
e pr
ojec
ts fo
r pap
er b
ags
for t
he
reta
il se
ctor
, mod
erni
zatio
n of
spe
cific
m
achi
nery
at t
he P
uent
e A
lto p
lant
an
d im
prov
emen
t of t
he L
aja
was
te
treat
men
t pla
ntPr
ivat
eEr
gon
Peru
Peru
222
000
000
dolla
r22
2.0
July
201
9Ju
ly 2
024
Ren
ewab
le e
nerg
ies
Priv
ate
Neo
ener
gia
Bra
zil
1 29
4 44
9 00
0re
al33
2.76
July
201
9Ju
ne 2
029
Fina
nce
and
refin
ance
rene
wab
le a
nd g
rid
proj
ects
(a h
ydro
elec
tric
plan
t and
win
d fa
rms
and
trans
mis
sion
ass
ets
in s
ever
al
Bra
zilia
n st
ates
)Pr
ivat
eAt
hon
Ener
gia
Bra
zil
40 0
00 0
00re
al10
.28
July
201
9Ju
ly 2
029
Gre
en s
olar
: six
sol
ar g
ener
atio
n pr
ojec
ts
for r
emot
e se
lf-co
nsum
ptio
nPu
blic
Chi
lean
Sta
teC
hile
861
000
000
euro
725.
05Ju
ly 2
019
July
203
1G
reen
mul
tisec
tor
Priv
ate
Ban
co d
e C
hile
Chi
le48
000
000
dolla
r48
.0Au
gust
20
19Au
gust
203
1R
efina
nce
sust
aina
ble
rene
wab
le e
nerg
y pr
ojec
ts lo
cate
d in
diff
eren
t reg
ions
of
the
coun
try
Priv
ate
Sab
ará
Bra
zil
20 0
00 0
00re
al5.
14Au
gust
20
19Au
gust
202
4R
efina
nce
the
only
sod
ium
chl
orite
pr
oduc
tion
plan
t in
Bra
zil,
whe
re a
ll th
e en
ergy
use
d is
from
rene
wab
le s
ourc
esPr
ivat
eC
elul
ose
Irani
Bra
zil
505
000
000
real
129.
82Au
gust
20
19S
epte
mbe
r 20
25Pr
omot
e su
stai
nabl
e an
d ce
rtifi
ed fo
rest
m
anag
emen
t and
refin
ance
a p
aper
re
cycl
ing
unit
Mul
tilat
eral
Cen
tral A
mer
ican
Ban
k fo
r Eco
nom
ic In
tegr
atio
n (C
AB
EI)
Cen
tral
Am
eric
a37
5 00
0 00
0do
llar
375.
00O
ctob
er
2019
Oct
ober
20
24C
ontri
bute
to th
e co
nfigu
ratio
n of
pro
ject
s su
ch a
s th
e C
osta
Ric
an e
lect
ricity
grid
, as
wel
l as
sola
r ene
rgy
field
s an
d w
ind
ener
gy fi
elds
Tota
l (to
Oct
ober
201
9)4
644.
4
So
urce
: E
cono
mic
Com
mis
sion
for
Lat
in A
mer
ica
and
the
Car
ibb
ean
(EC
LAC
), on
the
bas
is o
f C
limat
e B
ond
s In
itiat
ive,
“La
bel
led
gre
en b
ond
s d
ata:
late
st 3
mon
ths”
[o
nlin
e d
atab
ase]
htt
ps:
//w
ww
.clim
ateb
ond
s.ne
t/cb
i/pub
/dat
a/b
ond
s?ite
ms_
per
_pag
e=10
0&or
der
=fie
ld_b
ond
_cur
renc
y&so
rt=
asc&
pag
e=1;
offi
cial
dat
a fr
om th
e d
iffer
ent
com
pan
ies.
No
te:
The
dol
lar c
onve
rsio
n ra
tes
used
wer
e on
e d
olla
r to
3.98
reai
s, 1
9.30
81 M
exic
an p
esos
, 3.3
69 s
oles
, 1.8
75 e
uros
, 2,9
56.4
3 C
olom
bia
n p
esos
and
2 B
arb
ados
dol
lars
. O
ne C
hile
an d
evel
opm
ent
unit
(UF)
was
tak
en t
o b
e w
orth
41.
5 d
olla
rs.
Tab
le V
.A4.
1 (c
onc
lud
ed)

Afterword
The information and analyses presented in this book are stark: the world is experiencing an environmental emergency. There is ample evidence for the extent of global warming and its close dependence on greenhouse gas emissions produced by human activities, in particular fossil fuel use, hydrocarbon-based energy generation and land use changes that are accelerating deforestation.
The emergency is global in scale, as are its determinants and consequences. However, this should not obscure the fact that the local and territorial dimensions are often those that directly affect people’s quality of life and health. A notable example is the close relationship between the increasing pollution of cities and the pattern of mobility consumption based on fossil fuel-powered vehicles.
A further consideration is that the speed of temperature increase, with its direct correlates in the form of melting Arctic ice and sea level rise, has almost certainly been underestimated. This has led to a progressive recognition that the world has moved from a climate crisis which has unfolded over many decades to an environmental emergency that is now destroying biodiversity and increasing the frequency and intensity of extreme weather events.
In this context, the pace of the international community’s response has been inadequate, a view that has particularly taken hold among younger generations, who perceive that the effects of climate change will catch up with them in their maturity. The Paris Agreement of 2015 was a step forward, but the conviction has rapidly grown that its targets, and the commitments accordingly entered into at the national level, will not suffice to curb global warming. Targets need to be more ambitious, particularly those that depend on international collaboration.

324 Economic Commission for Latin America and the Caribbean (ECLAC)
In the face of these dynamics, the situation in Latin America and the Caribbean is paradoxical. The region produces only 8.3% of the world’s greenhouse gas emissions, which is similar to its share of the global population and economy, but it bears a disproportionate share of the human and material costs of climate change. Ultimately, the historical inequity between the developed and developing worlds remains, or is even widening, in the environmental dimension. The most developed countries have been and are the ones that are depleting the world’s carbon budget and still failing to provide significant resources to support mitigation and adaptation in the poorest countries. There is still no recognition in practical terms that responsibilities are shared but unequal, and that the damage caused merits compensation.
This book places particular emphasis on the analysis of two cases in which this inequity manifests itself in an extreme form: Central America and the Caribbean. Both subregions periodically suffer the devastating effects of extreme weather events, which entail high costs and long recovery periods. The case of the Caribbean countries is particularly worrying because of the additional cost imposed by an unsustainable debt situation, which needs to be resolved through mechanisms to reduce the debt burden while supporting meaningful adaptation programmes.
The impact of the environmental emergency at the subnational and sectoral level in the region’s countries is heterogeneous. Although the effects are and will continue to be negative in most territories, their intensity varies greatly and in some cases (the minority) there could even be economic advantages. This heterogeneity is particularly serious in the case of agricultural production, which is highly dependent on climatic conditions. This is not only because agriculture plays such a major role in the production and exports of numerous countries in the region, but above all because, in many of them, the farming population tends to be the poorest and the most vulnerable when the productivity of cultivated land decreases. Climate change is thus an additional obstacle to efforts to combat extreme poverty, for example in the dry corridor of the countries of northern Central America.
In response to this broad diagnosis, the book concludes with two chapters suggesting strategies, policies and actions to address the effects of the environmental crisis. The first strategic proposal is that, despite the relationships and synergies between mitigation and adaptation measures, the latter may need to be prioritized in the region, as they are not only inevitable but may yield economic benefits far outweighing the costs. A wide spectrum of adaptation measures are at once realistic, cost-effective and efficient. In particular, there is great potential for developing or strengthening natural ecosystems that can be realized if there is appropriate charging for environmental services and an effective local governance structure. The urgent need for adaptation actions is seen most clearly in the

The climate emergency in Latin America and the Caribbean... 325
increasing migration flows driven by climate change, especially those from low-productivity agricultural areas. This is a striking example of the close relationship between environmental, social and economic dynamics, and of how problems are transmitted between them.
The second proposal is for a comprehensive approach to be taken when formulating and, above all, implementing environmental policies, something that also holds true for the mechanisms used to put them into effect. The book examines a wide variety of instruments associated with both price signals and direct regulation. The conclusions are similar: no single instrument can achieve the desired results, but rather integrated intervention packages must be implemented. In addition, environmental issues must be effectively incorporated into the public policy system, despite the difficulties involved.
This holistic policy perspective also needs to permeate the approach taken to the environmental emergency. The region is facing an environmental crisis, but also one of inequality and growth too slow to generate the jobs needed to reduce unemployment and informality and absorb new entrants into the workforce. Moreover, without structural changes in production and consumption patterns, it will not be possible to expand the now limited scope for reconciling employment growth, poverty reduction and sustainability.
On this view, growth, equality and sustainability are inseparable in Latin America and the Caribbean. Not only do objectives and policy instruments interact in these three dimensions, but so do problems. What particularly stands out is the short-sightedness or short-termism of public and private decision makers: the true extent of the environmental emergency is not recognized, and nor is the urgency of addressing it; there are groundless hopes that increased consumption will mask inequality based on the culture of privilege; and investment decisions are often dissociated from the need to achieve growth and employment through technical progress and the diversification of production structures.
Given this situation, the answer suggested in the present book, which summarizes the ECLAC view, is to grow with equality and sustainability. To achieve this, progressive structural change based on an environmental big push is needed. Adaptation efforts, which are synergistic with mitigation efforts, have a central role to play in this strategy. This needs to be put into effect through actions in the sectors driving decarbonization: renewable energies (especially non-conventional ones), urban and long-distance electromobility, digitization, low-carbon agriculture and other solutions based on nature and the circular economy. The pursuit and coordination of public and private measures and investments aimed at changing the energy mix and production and consumption patterns is a path that will make it possible to gradually move away from an unsustainable development style that has failed to deliver on the economic, social and environmental fronts alike.


Bibliography
ABEEólica (Brazilian Wind Energy Association) (2018), Dados Mensais, São Paulo, January [online] http://almaco.org.br/wp-content/uploads/2018/02/Dados-Mensais-ABEE%C3%B3lica-Janeiro-de-2018.pdf.
(2017), “Brasil sobe no ranking mundial de capacidade instalada de energia eólica”, São Paulo, 10 February [online] http://www.abeeolica.org.br/noticias/brasil-sobe-no-ranking-mundial-de-capacidade-instalada-de-energia-eolica/.
ABIEC (Brazilian Association of Meat Exporting Industries) (2019), Beef Report: Perfil da Pecuária no Brasil, São Paulo.
ABRA (Brazilian Association of Animal Recycling) (2016), II Diagnóstico da Indústria Brasileira de Reciclagem Animal, Brasilia.
Ackerman, F. and I. Finlayson (2006), “The economics of inaction on climate change: a sensitivity analysis”, Climate Policy, vol. 6, No. 5, Hoboken, Taylor and Francis.
Adger, W. and others (2014), “Human security”, Climate Change 2014: Impacts, Adaptation, and Vulnerability. Part A: Global and Sectoral Aspects, V. Barros and others (eds.), Cambridge, Cambridge University Press.
Aghion, P., E. Caroli and C. García-Peñalosa (1999), “Inequality and economic growth: the perspective of the new growth theories”, Journal of Economic Literature, vol. 37, No. 4, Nashville, American Economic Association.
Agrawala, S. and S. Fankhauser (eds.) (2008), Economic Aspects of Adaptation to Climate Change: Costs, Benefits and Policy Instruments, Paris, Organization for Economic Cooperation and Development (OECD), June.
Agrawala, S. and others (2010), “Plan or react? Analysis of adaptation costs and benefits using integrated assessment models”, OECD Environment Working Papers, No. 23, Paris, Organization for Economic Cooperation and Development (OECD).
Alatorre, J. and others (2019), “El costo social del carbono: una visión agregada desde América Latina”, Project Documents (LC/TS.2019/10), Santiago, Economic Commission for Latin America and the Caribbean (ECLAC).
Albala-Bertrand, J. (1993), Political Economy of Large Natural Disasters: With Special Reference to Developing Countries, Oxford, Clarendon Press.
Aldred, J. (2009), “Ethics and climate change cost-benefit analysis: Stern and after”, New Political Economy, vol. 14, No. 4, Abingdon, Taylor & Francis.

328 Economic Commission for Latin America and the Caribbean (ECLAC)
Aldy, J. and R. Stavins (2012), “The promise and problems of pricing carbon: theory and experience”, Journal of Environment and Development, vol. 21, No. 2, Thousand Oaks, SAGE Publications.
Alesina, A. and D. Rodrik (1994), “Distributive politics and economic growth”, The Quarterly Journal of Economics, vol. 109, No. 2, Oxford, Oxford University Press.
Alves, F. and others (2018), 50 perguntas, 50 respostas sobre a Carne Carbono Neutro (CCN), Brasilia, Brazilian Agricultural Research Corporation (EMBRAPA).
(2015), Carne carbono neutro: um novo conceito para carne sustentavel produzida nos tropicos, Brasilia, Corporacion Brasilena de Investigacion Agricola (EMBRAPA).
Angel, S. and others (2010), “A planet of cities: urban land cover estimates and projections for all countries, 2000–2050”, Working Paper, No. WP10SA3, Cambridge, Lincoln Institute of Land Policy.
Anthoff, D. and others (2011), “Regional and sectoral estimates of the social cost of carbon: an application of FUND”, Discussion Paper, No. 2011-18, Kiel, Kiel Institute for the World Economy, June.
(2009), “Equity weighting and the marginal damage costs of climate change”, Ecological Economics, vol. 68, No. 3, Amsterdam, Elsevier.
Arbués, F., M. García-Valiñas and R. Martínez-Espiñeira (2003), “Estimation of residential water demand: a state-of-the-art review”, The Journal of Socio-Economics, vol. 32, No. 1, Amsterdam, Elsevier, March.
Arbués, F., I. Villanúa and R. Barberán (2010), “Household size and residential water demand: an empirical approach”, The Australian Journal of Agricultural and Resource Economics, vol. 54, No. 1, Hoboken, Wiley, January.
Artikov, I. and others (2006), “Understanding the influence of climate forecasts on farmer decisions as planned behavior”, Journal of Applied Meteorology and Climatology, vol. 45, No. 9, Boston, American Meteorological Society (AMS), September.
ASEAN (Association of Southeast Asian Nations) (2018), ASEAN Green Bond Standards, Bangkok.
Atkinson, R. (2019), “Trading up: why America must ditch China and pursue better manufacturing opportunities”, The National Interest, Washington, D.C., Center for the National Interest, 13 August [online] https://nationalinterest.org/feature/trading-why-america-must-ditch-china-and-pursue-better-manufacturing-opportunities-73256.
Azqueta, D. (2007), Introducción a la Economía Ambiental, New York, McGraw-Hill.Bank of Brasil (2017), Relatório Anual 2016, Brasilia, May [online] http://www.bb.com.
br/docs/pub/siteEsp/ri/pt/dce/dwn/relan2016.pdf.Bárcena, A. (2019), “Plan de Desarrollo Integral: El Salvador-Guatemala-Honduras-
México”, document presented at the conference ECLAC’s Diagnostic, Opportunity Areas and Recommendations, Mexico City, Economic Commission for Latin America and the Caribbean (ECLAC), 20 May.
Bárcena, A. and others (eds.) (2018), Economics of climate change in Latin America and the Caribbean: a graphic view (LC/TS.2017/84/Rev.1), Santiago.
Barnett, A. and others (2005), “Air pollution and child respiratory health: a case-crossover study in Australia and New Zealand”, American Journal of Respiratory and Critical Care Medicine, vol. 171, No. 11, New York, American Thoracic Society (ATS), June.
Barretto de Figueiredo, E. and others (2017), “Greenhouse gas balance and carbon footprint of beef cattle in three contrasting pasture-management systems in Brazil”, Journal of Cleaner Production, vol. 142, No. 1, Amsterdam, Elsevier, January.

The climate emergency in Latin America and the Caribbean... 329
Bell, M. and others (2006), “The avoidable health effects of air pollution in three Latin American cities: Santiago, São Paulo, and Mexico City”, Environmental Research, vol. 100, No. 3, Amsterdam, Elsevier, March.
Bello, O. and L. de Meira (2019), “Disasters and small island developing states (SIDS): where geography and vulnerability meet”, FOCUS, No. 1, Port of Spain, Economic Commission for Latin America and the Caribbean (ECLAC).
Bello, O. and others (2017), “Mainstreaming disaster risk management strategies in development instruments: policy briefs for selected member countries of the Caribbean Development and Cooperation Committee”, Studies and Perspectives series, No. 58 (LC/TS.2017/80; LC/CAR/TS.2017/6), Santiago, Economic Commission for Latin America and the Caribbean (ECLAC).
Benson, C. and E. Clay (2004), Understanding the Economic and Financial Impacts of Natural Disasters, Disaster Risk Management series, No. 3, Washington, D.C., World Bank.
(2003), “Disasters, vulnerability, and the global economy”, Building Safer Cities: The Future of Disaster Risk, Disaster Risk Management series, No. 3, A. Kreimer, M. Arnold and A. Carlin (eds.), Washington, D.C., World Bank.
Bianchi, B. and others (2019), Green Your Bus Ride: Clean Buses in Latin America, Washington, D.C., World Bank.
Black-Arbeláez, T. (2018), “Análisis económico y ambiental de las contribuciones previstas determinadas a nivel nacional presentadas en América Latina y el Caribe: posibles impactos en las metas planteadas”, Project Documents (LC/TS.2017/59), Santiago, Economic Commission for Latin America and the Caribbean (ECLAC), March.
Bloomberg (2019), Bloomberg New Energy Finance (BNEF) Database, New York [online] https://www.bloomberg.com/impact/products/bloombergnef/.
(2018a), Electric Buses in Cities: Driving Towards Cleaner Air and Lower CO2, New York. (2018b), Electric Vehicle Outlook 2018, New York.BNDES (National Bank for Economic and Social Development) (2019), “Evolução dos
desembolsos”, Brasilia [online] https://www.bndes.gov.br/wps/portal/site/home/transparencia/estatisticas-desempenho/desembolsos/evolucao-dos-desembolsos/.
(2017), Relatório Anual 2016, Brasilia, May [online] https://www.bndes.gov.br/SiteBNDES/bndes/bndes_pt/Hotsites/Relatorio_Anual_2016/index.html.
(2016), “O desenrolar da energia eólica no Brasil”, Brasilia, 15 December [online] http://www.bndes.gov.br/wps/portal/site/home/conhecimento/noticias/noticia/energia-eolica-brasil.
Boardman, A. and others (2010), Cost-Benefit Analysis: Concepts and Practice, New Jersey, Prentice Hall, August.
Borja-Aburto, V. and others (1998), “Mortality and ambient fine particles in southwest Mexico City, 1993-1995”, Environmental Health Perspectives, vol. 106, No. 12, Research Triangle, National Institute of Environmental Health Sciences.
Bosello, F., C. Carraro and E. De Cian (2010), “Market- and policy-driven adaptation”, Smart Solutions to Climate Change: Comparing Costs and Benefits, B. Lomborg (ed.), Cambridge, Cambridge University Press, September.
Bourguignon, F. (2004), “The poverty-growth-inequality triangle”, New Delhi Working Paper, No. 125, New Delhi, Indian Council for Research on International Economic Relations (ICRIER).
(2003), “The growth elasticity of poverty reduction: explaining heterogeneity across countries and time periods”, Inequality and Growth: Theory and Policy Implications, T. Eicher and S. Turnovsky (eds.), Cambridge, The MIT Press.
330 Economic Commission for Latin America and the Caribbean (ECLAC)
Bourguignon, F. and C. Morrisson (2002), “Inequality among world citizens: 1820–1992”, American Economic Review, vol. 92, No. 4, Pittsburgh, American Economic Association (AEA).
BP (2019), BP Statistical Review of World Energy 2019, Rio de Janeiro, June.Bradley, R. and others (2009), “Recent changes in freezing level heights in the Tropics
with implications for the deglacierization of high mountain regions”, Geophysical Research Letters, vol. 36, No. 17, Hoboken, Wiley, September.
Brazil, Government of (2018), PAC: 7º Balanço 2015-2018, Brasilia [online] http://www.pac.gov.br/pub/up/relatorio/37855886e9418dce3f9baf3128444233.pdf.
(2014), Balanço 4 anos: 11º Balanço 2011 a 2014, Brasilia [online] http://www.pac.gov.br/pub/up/relatorio/f9d3db229b483b35923b338906b022ce.pdf.
(2011), Balanço 4 anos: 2007–2010, Brasilia [online] http://www.pac.gov.br/pub/up/relatorio/b701c4f108d61bf921012944fb273e36.pdf.
Brazilian Forum on Climate Change (2018), Proposta Inicial de Implementação da Contribuição Nacionalmente Determinada do Brasil (NDC), Brasilia, May.
Brent, R. (2008), Applied Cost-Benefit Analysis, Cheltenham, Edward Elgar Publishing.Broersma, L. and J. van Dijk (2007) “The effect of congestion and agglomeration on
multifactor productivity growth in Dutch regions”, Journal of Economic Geography, vol. 8, No. 2, Oxford, Oxford University Press.
Bucher, E. and E. Curto (2012), “Influence of long-term climatic changes on breeding of the Chilean flamingo in Mar Chiquita, Córdoba, Argentina”, Hydrobiologia, vol. 697, No. 1, Berlin, Springer.
Buchner, B. and others (2017), Global Landscape of Climate Finance 2017, San Francisco, Climate Policy Initiative (CPI), October [online] https://climatepolicyinitiative.org/wp-content/uploads/2017/10/2017-Global-Landscape-of-Climate-Finance.pdf.
Bueno, R., E. Stanton and F. Ackerman (2008), “The Caribbean and climate change: the costs of inaction”, New York, Environmental Defense Fund (EDF).
Burke, K. and others (2018), “Pliocene and Eocene provide best analogs for near-future climates”, Proceedings of the National Academy of Sciences of the United States of America (PNAS), vol. 115, No. 52, Washington, D.C., National Academy of Sciences (NAS), December.
Byerlee, D., X. Diao and C. Jackson (2005), “Agriculture, rural development, and pro-poor growth: country experiences in the post-reform era”, Agriculture and Rural Development Discussion Paper, No. 21, Washington, D.C., World Bank.
Caballeros-Otero, R. and R. Zapata (1995), “The impacts of natural disasters on developing economies: implications for the international development and disaster community”, Disaster Prevention for Sustainable Development: Economic and Policy Issues, M. Munasinghe and C. Clarke (eds.), Washington, D.C., International Decade for Natural Disaster Reduction/World Bank.
CARB/MDDELCC (California Air Resources Board/Ministry of Sustainable Development, Environment and Fight Against Climate Change) (2017), “California cap-and-trade program and Québec cap-and-trade system”, Joint Auction, No. 11, Sacramento, May.
Cardoso, A. and others (2016), “Impact of the intensification of beef production in Brazil on greenhouse gas emissions and land use”, Agricultural Systems, vol. 143, Amsterdam, Elsevier, March.
Carmona, A. and G. Poveda (2011), “Identificación de modos principales de variabilidad hidroclimática en Colombia mediante la transformada de Hilbert-Huang”, document presented at the IX Colombian Congress of Meteorology, Bogotá, 23–25 March.
The climate emergency in Latin America and the Caribbean... 331
Cartes, F. (2018), “Metodología de inclusión de precio social de carbono en proyectos de inversión pública”, document presented at the Regional Seminar on Instruments of Green Fiscal Policy, Climate Change and Environmental Sustainability, San José, Economic Commission for Latin America and the Caribbean (ECLAC), 7–8 November.
Cecchini, S. and others (2012), “Vulnerabilidad de la estructura social en América Latina: medición y políticas públicas”, Realidad, Datos y Espacio: Revista Internacional de Estadística y Geografía, vol. 3, No. 2, Aguascalientes, National Institute of Statistics and Geography.
Cervero, R. (2001) “Efficient urbanisation: economic performance and the shape of the metropolis”, Urban Studies, vol. 38, No. 10, Thousand Oaks, SAGE Publications.
Chai, A. and A. Moneta (2010), “Retrospectives: Engel curves”, Journal of Economic Perspectives, vol. 24, No. 1, Pittsburgh, American Economic Association (AEA), February.
Charvériat, C. (2000), Natural Disasters in Latin America and the Caribbean: An Overview of Risk, Washington, D.C., Inter-American Development Bank (IDB), October.
Checkley, W. and others (2000), “Effects of El Niño and ambient temperature on hospital admissions for diarrhoeal diseases in Peruvian children”, The Lancet, vol. 355, No. 9202, Amsterdam, Elsevier, February.
Christiaensen, L. and L. Demery (2007), “Down to earth: agriculture and poverty reduction in Africa”, Directions in Development Poverty, No. 38781, Washington, D.C., World Bank.
CIUP (Pacific University Investigation Center) (2016), Estimación del precio social del carbono para la evaluación social de proyectos en el Perú, Lima, Pacific University.
Clarke, C. and others (2013), “An assessment of the economic and social impacts of climate change on the health sector in the Caribbean” (LC/CAR.L.396), Santiago, Economic Commission for Latin America and the Caribbean (ECLAC), February.
(2009), “International, U.S. and E.U. climate change control scenarios: results from EMF 22”, Energy Economics, vol. 31, No. 2, Amsterdam, Elsevier.
Clarkson, R. and K. Deyes (2002), “Estimating the social cost of carbon emissions”, Government Economic Service Working Paper, No. 140, London, HM Treasury.
Climate Bonds Initiative (2019), “Climate Bonds Taxonomy”, London, October [online] https://www.climatebonds.net/standard/taxonomy.
Cline, W. (2007), Global Warming and Agriculture: Impact Estimates by Country, Washington, D.C., Center for Global Development (CGD).
Cnossen, S. (2005), Theory and Practice of Excise Taxation: Smoking, Drinking, Gambling, Polluting, and Driving, Oxford, Oxford University Press.
Coady, D. and others (2019), “Global fossil fuel subsidies remain large: an update based on country-level estimates”, IMF Working Paper, No. 19/89, Washington, D.C., International Monetary Fund (IMF), May.
Coats, D. (2019), Statement for the Record: Worldwide Threat Assessment of the US Intelligence Community, Washington, D.C., Office of the Director of National Intelligence.
Colls, A., N. Ash and N. Ikkala (2009), Ecosystem-based Adaptation: A Natural Response to Climate Change, Gland, International Union for Conservation of Nature (IUCN).
Confalonieri, U. and others (2007), “Human health”, Climate Change 2007: Impacts, Adaptation and Vulnerability, Cambridge, Cambridge University Press.
Cottrell, J. (2014), “Reforming EHS in Europe: success stories, failures and agenda”, Paying the Polluter: Environmentally Harmful Subsidies and Their Reform, F. Oosterhuis and P. ten Brink (eds.), Cheltenham, Edward Elgar Publishing.

332 Economic Commission for Latin America and the Caribbean (ECLAC)
Cropper, M. and S. Sahin (2009), “Valuing mortality and morbidity in the context of disaster risks”, Policy Research Working Paper, No. 4832, Washington, D.C., World Bank.
Dai, A. (2011), “Drought under global warming: a review”, Wiley Interdisciplinary Reviews: Climate Change, vol. 2, No. 1, Hoboken, Wiley, January–February.
Dalhuisen, J. and others (2003), “Price and income elasticities of residential water demand: a meta-analysis”, Land Economics, vol. 79, No. 2, Madison, University of Wisconsin Press.
DANE (National Administrative Department of Statistics) (2016), “Cuenta de actividades y flujos relacionados 2014-2015”, Boletín Técnico, Bogotá, August.
DARA/CVF (International DARA Foundation/Climate Vulnerable Forum) (2012), Climate Vulnerability Monitor: A Guide to the Cold Calculus of a Hot Planet, Madrid.
Darwin, R. and others (1995), “World agriculture and climate change: economic adaptations”, Agricultural Economics Reports, No. 33933, Washington, D.C., United States Department of Agriculture.
Datt, G. and M. Ravallion (1992), “Growth and redistribution components of changes in poverty measures: a decomposition with applications to Brazil and India in the 1980s”, Journal of Development Economics, vol. 38, No. 2, Amsterdam, Elsevier.
Dercon, S. (2006), “Economic reform, growth and the poor: evidence from rural Ethiopia”, Journal of Development Economics, vol. 81, No. 1, Amsterdam, Elsevier.
Di Bella, G. and others (2015), “Energy subsidies in Latin America and the Caribbean: stocktaking and policy challenges”, IMF Working Paper, No. 15/30, Washington, D.C., International Monetary Fund (IMF).
Diffenbaugh, N., D. Singh and J. Mankin (2018), “Unprecedented climate events: historical changes, aspirational targets, and national commitments”, Science Advances, vol. 4, No. 2, Washington, D.C., American Association for the Advancement of Science (AAAS).
Dinar, A. and R. Mendelsohn (eds.) (2012), Handbook on Climate Change and Agriculture, Cheltenham, Edward Elgar Publishing.
DNP (National Planning Department) (2019), Índice municipal de riesgo de desastres ajustado por capacidades, Bogotá.
Doyle, M. and V. Barros (2011), “Attribution of the river flow growth in the Plata Basin”, International Journal of Climatology, vol. 31, No. 15, Hoboken, Wiley, December.
DTPM (Metropolitan Public Transport Board), Informe de Gestión 2018, Santiago.Easterling, W. and others (1993), “Paper 2: agricultural impacts of and responses to
climate change in the Missouri-Iowa-Nebraska-Kansas (MINK) region”, Climatic Change, vol. 24, No. 1–2, Berlin, Springer, June.
ECLAC (Economic Commission for Latin America and the Caribbean) (2019a), CEPALSTAT [online database] http://estadisticas.cepal.org/cepalstat/WEB_CEPALSTAT/Portada.asp.
(2019b), Fiscal Panorama of Latin America and the Caribbean, 2019 (LC/PUB.2019/8-P), Santiago.
(2019c), Annotated index of the position document of the fourteenth session of the Regional Conference on Women in Latin America and the Caribbean “Women’s autonomy in changing economic scenarios” (LC/MDM.58/3), Santiago.
(2019d), Preliminary Overview of the Economies of Latin America and the Caribbean, 2018 (LC/PUB.2019/1-P), Santiago, January.
(2019e), Quadrennial report on regional progress and challenges in relation to the 2030 Agenda for Sustainable Development in Latin America and the Caribbean (LC/FDS.3/3/Rev.1), Santiago.

The climate emergency in Latin America and the Caribbean... 333
(2018a), The Inefficiency of Inequality (LC/SES.37/3-P), Santiago. (2018b), Social Panorama of Latin America, 2017 (LC/PUB.2018/1-P), Santiago. (2018c), Estimación del gasto en protección ambiental en Costa Rica (LC/TS.2018/14), Santiago. (2018d), Fiscal Panorama of Latin America and the Caribbean, 2018 (LC/PUB.2018/4-P), Santiago. (2018e), Climate Change in Central America: Potential Impacts and Public Policy
Options (LC/MEX/L.1196), Mexico City, August. (2017), Fiscal Panorama of Latin America and the Caribbean, 2017 (LC/PUB.2017/6-P), Santiago. (2016a), Social Panorama of Latin America, 2015 (LC/G.2691-P), Santiago. (2016b), Fiscal Panorama of Latin America and the Caribbean, 2016 (LC/L.4140), Santiago. (2016c), Horizons 2030: equality at the centre of sustainable development
(LC/G.2660/Rev.1), Santiago. (2015), The economics of climate change in Latin America and the Caribbean: paradoxes
and challenges of sustainable development (LC/G.2624), Santiago, February. (2014a), “El gasto en protección ambiental en América Latina y el Caribe: bases
conceptuales y experiencia regional”, Project Documents (LC/W.634), Santiago. (2014b), Compacts for Equality: Towards a Sustainable Future (LC/G.2586(SES.35/3)), Santiago. (2014c), “La economía del cambio climático en la Argentina: primera aproximación”,
Project Documents (LC/W.567), Santiago, January. (2014d), “La economía del cambio climático en el Estado Plurinacional de Bolivia”,
Project Documents (LC/W.627), Santiago, November. (2014e), “La economía del cambio climático en el Paraguay”, Project Documents
(LC/W.617), Santiago, August. (2014f), “La economía del cambio climático en el Perú”, Project Documents
(LC/W.640), Santiago, December. (2013a), Social Panorama of Latin America, 2012 (LC/G.2557-P), Santiago. (2013b), “La economía del cambio climático en el Ecuador, 2012”, Project Documents
(LC/W.560), J. Samaniego and others (coords.), Santiago, October. (2012a), Sustainable development 20 years on from the earth summit: progress, gaps
and strategic guidelines for Latin America and the Caribbean (LC/L.3346/Rev.1), Santiago, March.
(2012b), The Economics of Climate Change in Central America: Summary 2012 (LC/MEX/L.1076), Mexico City.
(2012c), “La economía del cambio climático en Chile”, Project Documents (LC/W.472), Santiago, May.
(2011a), La economía del cambio climático en Centroamérica: reporte técnico 2011 (LC/MEX/L.1016), Mexico City, July.
(2011b), “Efectos del cambio climático en la costa de América Latina y el Caribe: dinámicas, tendencias y variabilidad climática”, Project Documents (LC/W.447/Rev.1), Santiago.
(2010a), Economics of climate change in Latin America and the Caribbean: summary 2010 (LC/G.2474), Santiago, November.
(2010b), “La economía del cambio climático en el Uruguay: síntesis”, Project Documents (LC/W.330), Santiago, October.
(2009a), Economics of climate change in Latin America and the Caribbean: summary 2009 (LC/G.2425), Santiago, November.
(2009b), “La economía del cambio climático en Chile: síntesis”, Project Documents (LC/W.288), J. Samaniego and others (eds.), Santiago, November.

334 Economic Commission for Latin America and the Caribbean (ECLAC)
ECLAC/CAC/SICA (Economic Commission for Latin America and the Caribbean/Central American Council for Agriculture/Central American Integration System) (2013a), Impactos potenciales del cambio climático sobre los granos básicos en Centroamérica (LC/MEX/L.1123), Mexico City.
(2013b), Gestión integral de riesgos y seguros agropecuarios en Centroamérica y la República Dominicana: situación actual y líneas de acción potenciales (LC/MEX/L.1122), Mexico City.
ECLAC/European Commission (Economic Commission for Latin America and the Caribbean/ European Commission) (2014), “The economics of climate change in Latin America and the Caribbean: paradoxes and challenges. Overview for 2014”, Project Documents (LC/L.3895), J. Samaniego (coord.), Santiago, December.
ECLAC/IDB (Economic Commission for Latin America and the Caribbean/Inter-American Development Bank) (2013), Valoración de daños y pérdidas: ola invernal en Colombia 2010-2011 (LC/BOG/L.23), Bogotá, January.
ECLAC/ILO (Economic Commission for Latin America and the Caribbean/International Labour Organization) (2018), “Environmental sustainability and employment in Latin America and the Caribbean”, Employment Situation in Latin America and the Caribbean, No. 19 (LC/TS.2018/85), Santiago, October.
ECLAC/ILO/FAO (Economic Commission for Latin America and the Caribbean/International Labour Organization/Food and Agriculture Organization of the United Nations) (2012), Políticas de mercado de trabajo y pobreza rural en América Latina, F. Soto and E. Klein (coords.), Rome.
ECLAC/ILPES (Economic Commission for Latin America and the Caribbean/Latin American and Caribbean Institute for Economic and Social Planning) (2019), Planning for sustainable territorial development in Latin America and the Caribbean (LC/CRP.17/3), Santiago, August.
ECLAC/INEGI (Economic Commission for Latin America and the Caribbean/National Institute of Statistics and Geography) (2015), “Guía metodológica: medición del gasto en protección ambiental del gobierno general”, Project Documents (LC/W.653), Santiago.
ECLAC/MMA (Economic Commission for Latin America and the Caribbean/Ministry of the Environment) (2015), Estimación del gasto público en protección ambiental en Chile (LC/W.655), Santiago.
ECLAC/MINURVI/UN-Habitat (Economic Commission for Latin America and the Caribbean/ General Assembly of Ministers and High-level Authorities of the Housing and Urban Development Sector in Latin America and the Caribbean/United Nations Human Settlements Programme) (2016), “América Latina y el Caribe: desafíos, dilemas y compromisos de una agenda urbana común”, Project Documents (LC/W.716), Santiago.
ECLAC/OHCHR (Economic Commission for Latin America and the Caribbean/Office of the United Nations High Commissioner for Human Rights) (2019), Climate change and human rights: contributions by and for Latin America and the Caribbean (LC/TS.2019/94), Santiago.
ECLAC/University of Cantabria (Economic Commission for Latin America and the Caribbean/University of Cantabria) (2015a), “The effects of climate change on the coasts of Latin America and the Caribbean: climate variability, dynamics and trends”, Project Documents (LC/W.447/Rev.1), Santiago, September.
(2015b), “The effects of climate change in the coastal areas of Latin America and the Caribbean: impacts”, Project Documents (LC/W.484), Santiago, July.

The climate emergency in Latin America and the Caribbean... 335
(2012a), “Efectos del cambio climático en la costa de América Latina y el Caribe: vulnerabilidad y exposición”, Project Documents (LC/W.460), Santiago, April.
(2012b), “Efectos del cambio climático en la costa de América Latina y el Caribe: riesgos”, Project Documents (LC/W.483), Santiago, July.
(2012c), “Efectos del cambio climático en la costa de América Latina y el Caribe: efectos teóricos”, Project Documents (LC/W.471), Santiago, July.
(2011), “Efectos del cambio climático en la costa de América Latina y el Caribe: guía metodológica”, Project Documents (LC/W.450), Santiago, December.
Echavarria, M. and others (2015), “Green infrastructure in the drinking water sector in Latin America and the Caribbean: trends, challenges, and opportunities” [online] https://www.forest-trends.org/wp-content/uploads/imported/infrastructura-verde-english-050616-pdf.pdf EcoDecisión.
Edenhofer, O. and others (2015), “Closing the emission price gap”, Global Environmental Change, vol. 31, Amsterdam, Elsevier.
Eletrobras (2017), Relatorio Anual 2017, Rio de Janeiro [online] http://eletrobras.com/pt/SobreaEletrobras/Relatorio_Anual_Sustentabilidade/2017/Relatorio-Anual-Eletrobras-2017.pdf.
EMBRAPA (Brazilian Agricultural Research Corporation) (2018), “Workshop discute diretrizes da marca Carne baixo carbono”, Brasilia, 5 October [online] https://www.embrapa.br/busca-de-noticias/-/noticia/38285320/workshop-discute-diretrizes-da-marca-carne-baixo-carbono.
Enel (2019), “Llegan a Chile 100 nuevos buses eléctricos de los 183 correspondientes a la segunda etapa que traen conjuntamente Enel X, Metrobus y BYD”, Comunicado de Prensa, Santiago, 31 July.
Engle, N. (2016), “Monitoring and evaluation of resilience and the importance of transparency in (I)NDCs”, document presented at the seminar Explorando el Financiamiento y MRV hacia la Integración entre Mitigación y Adaptación en las Políticas Climáticas, San José, 10–12 October.
Epaulard, A. (2003), “Macroeconomic performance and poverty reduction”, Working Paper, No. 03/72, Washington, D.C., International Monetary Fund (IMF), April.
Espey, M., J. Espey and W. Shaw (1997), “Price elasticity of residential demand for water: a meta-analysis”, Water Resources Research, vol. 33, No. 6, Hoboken, Wiley, June.
European Commission (2019), “Avances en la acción climática de América Latina: contribuciones nacionalmente determinadas al 2019”, Serie de Estudios Temáticos EUROCLIMA+, No. 13, Brussels.
Ezzine de Blas, D., J. Le Coq and A. Guevara Sangines (eds.) (2017), Los pagos por servicios ambientales en America Latina: gobernanza, impactos y perspectivas, Mexico City, Universidad Iberoamericana (IBERO).
Fan, S., A. Gulati and S. Thorat (2008), “Investment, subsidies, and pro-poor growth in rural India”, Agricultural Economics, vol. 39, No. 2, Hoboken, Wiley.
Fanelli, J., J. Jiménez and I. López (2015), “La reforma fiscal ambiental en América Latina”, Project Documents (LC/W.683), Santiago, Economic Commission for Latin America and the Caribbean (ECLAC).
Fankhauser, S. (1995), Valuing Climate Change: The Economics of the Greenhouse, London, Earthscan Publications.
FAO (Food and Agriculture Organization of the United Nations) (2019), Corporate Database for Substantive Statistical Data (FAOSTAT) [online] http://www.fao.org/faostat/en/.
(2015), Global Forest Resources Assessment 2015: Desk Reference, Rome.

336 Economic Commission for Latin America and the Caribbean (ECLAC)
FAO/AGROSAVIA (Food and Agriculture Organization of the United Nations/Colombian Agricultural Research Corporation) (2018), Innovaciones en producción cárnica con bajas emisiones de carbono: experiencias y desafíos en ALC. Resúmenes del evento realizado en Montería, Colombia, Santiago.
FAO/CIPAV (Food and Agriculture Organization of the United Nations/Center for Research on Sustainable Agricultural Production Systems) (2019), Silvopastoral Systems and their Contribution to Improved Resource Use and Sustainable Development Goals: Evidence from Latin America, Cali.
Ferrer, J. and R. Escalante (2014), “Demanda de gasolina en la zona metropolitana del valle de México: análisis empírico de la reducción del subsidio”, Revista de Economía del Rosario, vol. 17, No. 1, Bogotá, Del Rosario University.
Flores Aguilar, A. and others (2018), “Gobernanza ambiental y pagos por servicios ambientales en America Latina”, Sociedad y Ambiente, No 16, Lerma, El Colegio de la Frontera Sur.
Ferrer-i-Carbonell, A. and J. van den Bergh (2004), “A micro-econometric analysis of determinants of unsustainable consumption in the Netherlands”, Environmental and Resource Economics, vol. 27, No. 4, Berlin, Springer.
Fomby, T., Y. Ikeda and N. Loayza (2013), “The growth aftermath of natural disasters”, Journal of Applied Econometrics, vol. 28, No. 3, Hoboken, Wiley.
Freeman, M., J. Herriges and C. Kling (2003), The Measurement of Environmental and Resource Values: Theory and Methods, London, Routledge.
Galindo, L. (2009), “La economía del cambio climático en México: síntesis”, Mexico City, Secretariat of the Environment and Natural Resources.
Galindo, L., J. Alatorre and O. Reyes (2015a), “Adaptación al cambio climático a través de la elección de cultivos en Perú”, El Trimestre Económico, vol. 82, No. 327, Mexico City, Fondo de Cultura Económica (FCE).
(2015b), “Climate change, irrigation and agricultural activities in Mexico: a Ricardian analysis with panel data”, Journal of Development and Agricultural Economics, vol. 7, No. 7, Academic Journals.
Galindo, L. and others (2017a), “El cambio climático y sus efectos en la biodiversidad de América Latina”, Síntesis de Políticas Públicas sobre Cambio Climático, Santiago, European Union/Economic Commission for Latin America and the Caribbean (ECLAC).
(2017b), “Procesos de adaptación al cambio climático: análisis de América Latina”, Síntesis de Políticas Públicas sobre Cambio Climático, Santiago, European Union/Economic Commission for Latin America and the Caribbean (ECLAC).
(2015), “Ocho tesis sobre el cambio climático y el desarrollo sostenible en América Latina y el Caribe”, Project Documents (LC/W.690), Santiago, Economic Commission for Latin America and the Caribbean (ECLAC).
(2014a), “Paradojas y riesgos del crecimiento económico en América Latina y el Caribe: una visión ambiental de largo plazo”, Environment and Development series, No. 156 (LC/L.3868), Santiago, Economic Commission for Latin America and the Caribbean (ECLAC).
(2014b), “Cambio climático, agricultura y pobreza en América Latina: una aproximación empírica”, Project Documents (LC/W.620), Santiago, Economic Commission for Latin America and the Caribbean (ECLAC), September.
(2014c), “Procesos de adaptación al cambio climático: análisis de América Latina”, Project Documents (LC/W.647), Santiago, Economic Commission for Latin America and the Caribbean (ECLAC).

The climate emergency in Latin America and the Caribbean... 337
Gamaletsos, T. (1973), “Further analysis of cross-country comparison of consumer expenditure patterns”, European Economic Review, vol. 4, No. 1, Amsterdam, Elsevier, April.
Garcia Alarcon, G. and others (2016), “The challenges of implementing a legal framework for payment for ecosystem services in Santa Catarina, Brazil”, Natureza & Conservacao, vol. 14, No. 2.
Garnaut, R. and others (2010), “The implications of rapid development for emissions and climate-change mitigation”, The Economics and Politics of Climate Change, D. Helm and C. Hepburn (eds.), Oxford, Oxford University Press.
Global Commission on Adaptation (2019), Adapt Now: A Global Call for Leadership on Climate Resilience, Amsterdam, September.
Golosov, M. and others (2014), “Optimal taxes on fossil fuel in general equilibrium”, Econometrica, vol. 82, No. 1, Hoboken, Wiley.
Gómez, J. and S. Ortega (2007), Biocomercio sostenible, biodiversidad y desarrollo en Colombia, Bogotá, iM Editores.
Goulder, L. and A. Schein (2013), “Carbon taxes versus cap and trade: a critical review”, NBER Working Paper, No. 19.338, Cambridge, National Bureau of Economic Research (NBER), August.
Government Office for Science (2011), Migration and Global Environmental Change: Future Challenges and Opportunities. Final Project Report, Foresight, London.
Grafton, Q. and others (2011), “Determinants of residential water consumption: evidence and analysis from a 10-country household survey”, Water Resources Research, vol. 47, No. 8, Hoboken, Wiley, August.
Graham, D. (2007), “Variable returns to agglomeration and the effect of road traffic congestion”, Journal of Urban Economics, vol. 62, No. 1, Amsterdam, Elsevier.
Greenstone, M., E. Kopits and A. Wolverston (2013), “Developing a social cost of carbon for US regulatory analysis: a methodology and interpretation”, Review of Environmental Economics and Policy, vol. 7, No. 1, Oxford, Oxford University Press.
Grupo BMV (2017), Bonos Verdes, Mexico City.Güelvenzú, D. (2018), “Sistemas de certificación de carne vacuna ecológica”,
Innovaciones en Producción cárnica con bajas emisiones de carbono: experiencias y desafíos en ALC. Resúmenes del evento realizado en Montería, Colombia, Santiago, Food and Agriculture Organization of the United Nations/Colombian Agricultural Research Corporation (FAO/AGROSAVIA).
Guevara, S. and J. Laborde (2008), “The landscape approach: designing new reserves for protection of biological and cultural diversity in Latin America”, Environmental Ethics, vol. 30, No. 3, Denton, Center for Environmental Philosophy (CEP).
Gütschow, J. and others (2018), “The PRIMAP-hist national historical emissions time series (1850-2016)”, Potsdam [online] http://dataservices.gfz-potsdam.de/pik/showshort.php?id=escidoc:3842934.
(2016), “The PRIMAP-hist national historical emissions time series”, Earth System Science Data, vol. 8, No. 2, Göttingen, Copernicus Publications.
Haab, T. and K. McConnell (2003), Valuing Environmental and Natural Resources: The Econometrics of Non-Market Valuation, Cheltenham, Edward Elgar Publishing.
Hales, S. and others (2002), “Potential effect of population and climate changes on global distribution of dengue fever: an empirical model”, The Lancet, vol. 360, No. 9336, Amsterdam, Elsevier, September.
Hallegatte, S. and V. Przyluski (2010), “The economics of natural disasters: concepts and methods”, Policy Research Working Paper, No. 5507, Washington, D.C., World Bank.

338 Economic Commission for Latin America and the Caribbean (ECLAC)
Hanley, N. and C. Spash (1995), Cost-Benefit Analysis and the Environment, Cheltenham, Edward Elgar Publishing.
Hansen, J. and others (2008), “Target atmospheric CO2: where should humanity aim?”, The Open Atmospheric Science Journal, vol. 2, New York, Goddard Institute for Space Studies.
Hardisty, P., T. Clark and R. Hynes (2012), “Life cycle greenhouse gas emissions from electricity generation: a comparative analysis of Australian energy sources”, Energies, vol. 5, No. 4, Basel, Multidisciplinary Digital Publishing Institute (MDPI).
Harriet, T., K. Poku and K. Emmanuel (2013), “An assessment of traffic congestion and its effect on productivity in urban Ghana”, International Journal of Business and Social Science, vol. 4, No. 3, New York, Center for Promoting Ideas (CPI).
Heller, N. and E. Zavaleta (2009), “Biodiversity management in the face of climate change: a review of 22 years of recommendations”, Biological Conservation, vol. 142, No. 1, Amsterdam, Elsevier, January.
Hepburn, C. and N. Stern (2008), “A new global deal on climate change”, Oxford Review of Economic Policy, vol. 24, No. 2, Oxford, Oxford University Press, June.
Hernández, F. and A. Antón (2014), “El impuesto sobre las gasolinas: una aplicación para el Ecuador, El Salvador y México”, Project Documents (LC/W.597), Santiago, Economic Commission for Latin America and the Caribbean (ECLAC).
Herzog, S. and others (eds.) (2011), Climate Change and Biodiversity in the Tropical Andes, Paris, Inter-American Institute for Global Change Research (IAI)/Scientific Committee on Problems of the Environment (SCOPE).
High-Level Commission on Carbon Prices (2017), Report of the High-Level Commission on Carbon Prices, Washington, D.C., May.
Hochrainer, S. (2006), Macroeconomic Risk Management Against Natural Disasters: Analysis Focused on Governments in Developing Countries, Berlin, Springer, December.
Hope, C. (2006), “The social cost of carbon following the Stern Review”, Cambridge, University of Cambridge.
Hymel, K. (2009), “Does traffic congestion reduce employment growth?”, Journal of Urban Economics, vol. 65, No. 2, Amsterdam, Elsevier.
IDB (Inter-American Development Bank) (2017), “Documento-base para subsidiar os diálogos estruturados sobre a elaboração de uma estratégia de implementação e financiamento da contribuição nacionalmente determinada do Brasil ao Acordo de Paris”, Brasilia [online] http://www.mma.gov.br/images/arquivos/clima/ndc/documento_base_ndc_2_2017.pdf.
(2015), “Indicadores de riesgo de desastre y de gestión de riesgos: programa para América Latina y el Caribe”, Technical Note, No. 765, Washington, D.C.
(2014), Climate Change and the IDB: Building Resilience and Reducing Emissions. Regional Study: LAC Small Island Development States, Washington. D.C.
IDFC (International Development Finance Club) (2018), IDFC Green Finance Mapping Report 2018, Paris, December.
IEA (International Energy Agency) (2018), World Energy Balances 2018, Paris.IEEE (Spanish Institute for Strategic Studies) (2016), Panorama Estratégico 2016, Madrid,
Ministry of Defence.IMF (International Monetary Fund) (2013), Case Studies on Energy Subsidy Reform:
Lessons and Implications, Washington, D.C., January.INBio (National Biodiversity Institute) (2004), “Biodiversidad en Centroamérica”,
San José, unpublished.
The climate emergency in Latin America and the Caribbean... 339
INEGI (National Institute of Statistics and Geography) (2016), “Cuentas económicas y ecológicas de México 2015”, Boletín de Prensa, No. 516/16, Aguascalientes, November.
IPCC (Intergovernmental Panel on Climate Change) (2018a), Global Warming of 1.5 °C: An IPCC Special Report on the Impacts of Global Warming of 1.5 °C Above Pre-industrial Levels and Related Global Greenhouse Gas Emission Pathways, in the Context of Strengthening the Global Response to the Threat of Climate Change, Sustainable Development, and Efforts to Eradicate Poverty, Geneva.
(2018b), Special Report: Global Warming of 1.5°C, Geneva. (2014a), Climate Change 2014: Impacts, Adaptation, and Vulnerability. Part A:
Global and Sectoral Aspects, V. Barros and others (eds.), Cambridge, Cambridge University Press.
(2014b), Climate Change 2014: Impacts, Adaptation, and Vulnerability. Volume II: Regional Aspects, V. Barros and others (eds.), Cambridge, Cambridge University Press.
(2013a), Climate Change 2013: The Physical Science Basis, T. Stocker and others (eds.), Cambridge, Cambridge University Press.
(2013b), “Summary for policymakers”, Climate Change 2013: The Physical Science Basis. Contribution of Working Group I to the Fifth Assessment Report of the Intergovernmental Panel on Climate Change, T. Stocker and others (eds.), Cambridge, Cambridge University Press.
(2012), Managing the Risks of Extreme Events and Disasters to Advance Climate Change Adaptation: Special Report of the Intergovernmental Panel on Climate Change, C. Field and others (eds.), Cambridge, Cambridge University Press.
(2008), “Climate change and water”, Technical Paper, No. 6, B. Bates and others (eds.), Geneva, June.
(2007a), Climate Change 2007: The Physical Science Basis, Cambridge, Cambridge University Press.
(2007b), Climate Change 2007: Impacts, Adaptation, and Vulnerability, Cambridge, Cambridge University Press.
(2006), 2006 IPCC Guidelines for National Greenhouse Gas Inventories, Hayama, Institute for Global Environmental Strategies
(2002), “Climate change and biodiversity”, Technical Paper, N° 5, H. Gitay and others (eds.), Geneva, April.
IRENA (International Renewable Energy Agency) (2019), Global Energy Transformation: The REmap Transition Pathway, Abu Dhabi.
ITDP (Institute for Transportation and Development Policy) (2018), “China tackles climate change with electric buses”, New York, 11 September [online] https://www.itdp.org/2018/09/11/electric-buses-china/.
Kahn, M. (2005), “The death toll from natural disasters: the role of income, geography, and institutions”, Review of Economics and Statistics, vol. 87, No. 2, Cambridge, The MIT Press.
Kalkstein, A. and S. Sheridan (2007), “The social impacts of the heat–health watch/warning system in Phoenix, Arizona: assessing the perceived risk and response of the public”, International Journal of Biometeorology, vol. 52, No. 1, Berlin, Springer, October.
Kamiche, J. and J. Diderot (2018), Actualización de la tasa social de descuento de largo plazo, Lima, Ministry of Economy and Finances (MEF).
Kelly, P. and W. Adger (2000), “Theory and practice in assessing vulnerability to climate change and facilitating adaptation”, Climatic Change, vol. 47, No. 4, Berlin, Springer.

340 Economic Commission for Latin America and the Caribbean (ECLAC)
Kidney, S. (2014), “IFC issues first Peruvian Soles-denominated PEN 118m ($42m) green bond, for domestic investor RIMAC Seguros, AAA, 20yr. A fantastic kick-start for a domestic green bond market in Peru?”, London, Climate Bonds Initiative, 13 August [online] https://www.climatebonds.net/2014/08/ifc-issues-first-peruvian-soles-denominated-pen-42m-15m-green-bond-domestic-investor-rimac.
Knowler, D. and B. Bradshaw (2007), “Farmers’ adoption of conservation agriculture: a review and synthesis of recent research”, Food Policy, vol. 32, No. 1, Amsterdam, Elsevier.
Kopp, R. and others (2016), “Temperature-driven global sea-level variability in the Common Era”, Proceedings of the National Academy of Sciences, vol. 113, No. 11, Washington, D.C., National Academy of Sciences.
Kreimerman, R. (2019), “¿Un big push energético? Reflexiones a partir del caso de Uruguay”, document presented at the third meeting of the Forum of the Countries of Latin America and the Caribbean on Sustainable Development, Santiago, Economic Commission for Latin America and the Caribbean (ECLAC), 22–26 April.
Kurukulasuriya, P. and R. Mendelsohn (2007), “Endogenous irrigation: The impact of climate change on farmers in Africa”, Policy Research Working Paper, No. 4278, Washington, D.C., World Bank.
Lamhauge, N., E. Lanzi and S. Agrawala (2012), “Monitoring and evaluation for adaptation: lessons from development cooperation agencies”, OECD Environment Working Papers, No. 38, Paris, Organization for Economic Cooperation and Development (OECD).
Latour, B. (2018), Down to Earth: Politics in the New Climatic Regime, Cambridge, Polity Press.
Lebrechtta, N. (2019), “Challenges of the economy: effects of climate change and migration on gender equality in the English-speaking Caribbean”, document prepared for the Dialogue of Specialists: The Challenges of the Economy from a Gender Perspective, Santiago, Economic Commission for Latin America and the Caribbean (ECLAC), 10–11 June.
Le Quéré, C. and others (2016), “Global carbon budget 2016”, Earth System Science Data, vol. 8, Göttingen, Copernicus Publications.
(2015), “Global carbon budget 2015”, Earth System Science Data, vol. 7, Göttingen, Copernicus Publications.
Lewbel, A. (2012), “Engel curve”, The New Palgrave Dictionary of Economics, 2012 Version, S. Durlauf and L. Blume (eds.), Basingstoke, Palgrave Macmillan.
Li, Z. and W. Nordhaus (2013), “The social cost of carbon: methods and a survey of estimates”, Berkeley, University of California, Berkeley, unpublished.
Litman, T. (2014), “The mobility-productivity paradox: exploring the negative relationships between mobility and economic productivity”, British Columbia, Victoria Transport Policy Institute.
Litman, T. and F. Laube (2002), “Automobile dependency and economic development”, British Columbia, Victoria Transport Policy Institute.
Lluch, C., A. Powell and R. Williams (1977), Patterns in Household Demand and Saving, Oxford, Oxford University Press.
Loayza, N. and others (2009), “Natural disasters and growth: going beyond the averages”, Policy Research Working Paper, No. 4980, Washington, D.C., World Bank.
López, B. and C. Montes (2011), “Biodiversidad y servicios de los ecosistemas”, Biodiversidad en España: base de la sostenibilidad ante el cambio global, Madrid, Observatorio de la Sostenibilidad en España (OSE).
The climate emergency in Latin America and the Caribbean... 341
Lorenzo, F. (2018), “Política económica y contribuciones determinadas a nivel nacional en los países de América Latina y el Caribe”, Project Documents (LC/TS.2018/79), Santiago, Economic Commission for Latin America and the Caribbean (ECLAC).
(2016), “Inventario de instrumentos fiscales verdes en América Latina: experiencias, efectos y alcances”, Project Documents (LC/W.723), Santiago, Economic Commission for Latin America and the Caribbean (ECLAC).
Louwen, A. (2011), “Comparison of the life cycle greenhouse gas emissions of shale gas, conventional fuels and renewable alternatives from a Dutch perspective”, master thesis on energy science, Utrecht, University of Utrecht [online] https://www.ebn.nl/wp-content/uploads/2017/11/A-Louwen_thesis_Final_PDF.pdf.
Lozano, N. (2004), “Air pollution in Bogotá, Colombia: a concentration-response approach”, Desarrollo y Sociedad, No. 54, Bogotá, University of Los Andes.
Lundgren, T. and P. Marklund (2010), “Climate policy and profit efficiency”, CERE Working Paper, No. 11, Umeå, Center for Environmental and Natural Resource Economics (CERE).
Magrin, G. (2015), “Adaptación al cambio climático en América Latina y el Caribe”, Project Documents (LC/W.692), Santiago, Economic Commission for Latin America and the Caribbean (ECLAC), December.
Magrin, G. and others (2014), “Central and South America”, Climate Change 2014: Impacts, Adaptation, and Vulnerability. Volume II: Regional Aspects, V. Barros and others (eds.), Cambridge, Cambridge University Press
(2007), “Latin America”, Climate Change 2007: Impacts, Adaptation, and Vulnerability, Cambridge, Cambridge University Press.
Margaree Consultants (2002), Assessment of the Economic Impact of Climate Change on CARICOM Countries, Toronto, July.
Margulis, S. and U. Narain (2010), “The cost to developing countries of adapting to climate change: new methods and estimates”, Working Paper, No. 55726, Washington, D.C., World Bank.
Marques, W. (2012), “The temporal variability of the freshwater discharge and water levels at the Patos Lagoon, Brazil”, International Journal of Geosciences, vol. 3, No. 4, Wuhan, Scientific Research Publishing.
Martine, G. and J. Guzman (2002), “Population, poverty, and vulnerability: mitigating the effects of natural disasters”, ECSP Report, No. 8, Washington, D.C., Wilson Center.
Massetti, E. and R. Mendelsohn (2011), “The impact of climate change on US agriculture: a repeated cross-sectional Ricardian analysis”, Handbook on Climate Change and Agriculture, A. Dinar and R. Mendelsohn (eds.), Cheltenham, Edward Elgar Publishing.
Mawdsley, J., R. O’Malley and D. Ojima (2009), “A review of climate-change adaptation strategies for wildlife management and biodiversity conservation”, Conservation Biology, vol. 23, No. 5, Hoboken, Wiley, October.
McGranahan, G. and O. Satterthwaite (2014), “Urbanisation concepts and trends”, Working Paper, London, International Institute for Environment and Development (IIED).
McHardy, P. and M. Donovan (2016), The State of Housing in six Caribbean Countries, Washington, D.C., Inter-American Development Bank (IDB).
McMichael, A. (1993), “Global environmental change and human population health: a conceptual and scientific challenge for epidemiology”, International Journal of Epidemiology, vol. 22, No. 1, Oxford, Oxford University Press.
Mechler, R. (2009), “Can national savings measures help explain post disaster welfare changes?”, Policy Research Working Paper, No. 4988, Washington, D.C., World Bank.

342 Economic Commission for Latin America and the Caribbean (ECLAC)
MEF (Ministry of Economy and Finances) (2019), “Anexo N° 11: parámetros de evaluación social”, Lima [online] https://www.mef.gob.pe%2Fcontenidos%2Finv_publica%2Fanexos%2Fanexo11_directiva001_2019EF6301.pdf.
Mendelsohn, R. (2008), “The impact of climate change on agriculture in developing countries”, Journal of Natural Resources Policy Research, vol. 1, No. 1, Abingdon, Taylor & Francis.
(2007), “Past climate change impacts on agriculture”, Handbook of Agricultural Economics. Volume 3: Agricultural Development: Farmers, Farm Production and Farm Markets, R. Evenson and P. Pingali (eds.), Amsterdam, Elsevier.
Mendelsohn, R. and A. Dinar (2009), Climate Change and Agriculture: An Economic Analysis of Global Impacts, Adaptation and Distributional Effects, Cheltenham, Edward Elgar Publishing.
Mendoza, M. (2014), “Panorama preliminar de los subsidios y los impuestos a las gasolinas y diésel en los países de América Latina”, Project Documents (LC/W.641), Santiago, Economic Commission for Latin America and the Caribbean (ECLAC).
Mengel, M. and others (2018), “Committed sea-level rise under the Paris Agreement and the legacy of delayed mitigation action”, Nature Communications, vol. 9, Berlin, Springer.
Metcalf, G. and D. Weisbach (2009), “Design of a carbon tax”, Public Law Working Paper, No. 254, Chicago, University of Chicago.
Meza, F. (2017), “Estimación de costos asociados a la seguridad hídrica en la agricultura como medida de adaptación al cambio climático en Chile: un estudio en el contexto del Plan de Adaptación al Cambio Climático del Sector Silvoagropecuario”, Project Documents (LC/TS.2017/47), Santiago, Economic Commission for Latin America and the Caribbean (ECLAC), June.
Milera, M. (2013), “Contibución de los sistemas silvopastoriles en la producción y el medio ambiente”, Avances en Investigación Agropecuaria, vol. 17, No. 3, Colima, University of Colima.
Millennium Ecosystem Assessment (2005), Ecosystems and Human Well-being: Biodiversity Synthesis, Washington, D.C.
Ministry of Agriculture, Livestock and Supply (2018), Plano Agrícola e Pecuário 2018-2019, Brasilia [online] http://www.agricultura.gov.br/assuntos/sustentabilidade/plano-agricola-e-pecuario/arquivos-pap/copy_of_PlanoAgricolaePecurio20182019.pdf.
Ministry of Industry, Energy and Mining (2018), Balance Energético 2017, Montevideo.Ministry of Transport and Telecommunications (2018), Informe de gestión 2018, Santiago.Mittermeier, R. and others (2005), Hotspots Revisited: Earth’s Biologically Richest and Most
Endangered Terrestrial Ecoregions, Arlington County, Conservation International.Mittermeier, R., P. Robles and C. Mittermeier (1997), Megadiversity: Earth’s Biologically
Wealthiest Nations, Monterrey, CEMEX.Mobjörk, M. and others (2016), Climate-related Security Risks: Towards an Integrated
Approach, Stockholm, Stockholm International Peace Research Institute (SIPRI).MOP (Ministry of Public Works) (2004), Diagnóstico y Clasificacion de los Cursos y
Cuerpos de Agua según Objetivos de Calidad: Cuenca del Río Maule, Santiago. Mpogole, H. and S. Msangi (2016), “Traffic congestion in Dar es Salaam: Implications
for workers’ productivity”, Journal of Sustainable Development, vol. 9, No. 6, Richmond Hill, Canadian Center of Science and Education (CCSE).
MCTIC (Ministry of Science, Technology, Innovations and Communications) (2017), Estimativas anuais de de emissões de gases de efeito estufa no Brasil, 4ª edição, Brasilia.

The climate emergency in Latin America and the Caribbean... 343
Murlidharan, T. and H. Shah (2001), “Catastrophes and macroeconomic risk factors: an empirical study”, Laxenburg, International Institute for Applied Systems Analysis (IIASA).
Murray, B. and P. Maniloff (2015), “Why have greenhouse emissions in RGGI states declined? An econometric attribution to economic, energy market, and policy factors”, Energy Economics, vol. 51, Amsterdam, Elsevier.
Murray, B. and N. Rivers (2015), “British Columbia’s revenue-neutral carbon tax: a review of the latest ‘grand experiment’ in environmental policy”, Energy Policy, vol. 86, Amsterdam, Elsevier.
Mycoo, M. and M. Donovan (2017), A Blue Urban Agenda: Adapting to Climate Change in the Coastal Cities of Caribbean and Pacific Small Island Developing States, Washington, D.C., Inter-American Development Bank (IDB).
Nakićenović, N. and R. Swart (eds.) (2000), Special Report on Emissions Scenarios, Cambridge, Cambridge University Press, October.
NASEO/EFI (National Association of State Energy Officials/Energy Futures Initiative) (2019), The 2019 U.S. Energy and Employment Report, Arlington.
Nauges, C. and D. Whittington (2009), “Estimation of water demand in developing countries: an overview”, The World Bank Research Observer, vol. 25, No. 2, Washington, D.C., World Bank.
Nissanke, M. and E. Thorbecke (eds.) (2007), The Impact of Globalization on the World’s Poor: Transmission Mechanisms, Basingstoke, Palgrave Macmillan.
NOAA (National Oceanic and Atmospheric Administration) (2019a), “State of the Climate: Global Climate Report for annual 2018”, Washington, D.C., January [online] https://www.ncdc.noaa.gov/sotc/global/201813.
(2019b), “Historical hurricane tracks” [online database] https://www.climate.gov/maps-data/dataset/historical-hurricane-tracks-gis-map-viewer.
(2016), “Trends in atmospheric carbon dioxide”, Washington, D.C. [online] http://www.esrl.noaa.gov/gmd/ccgg/trends/#globa.
Nobre, A. (2014), The Future Climate of Amazonia: Scientific Assessment Report, São Paulo, Amazon Regional Network.
Nordhaus, W. (2014), “Estimates of the social cost of carbon: concepts and results from the DICE-2013R model and alternative approaches”, Journal of the Association of Environmental and Resource Economists, vol. 1, No. 1–2, Chicago, University of Chicago Press.
(2007), The Challenge of Global Warming: Economic Models and Environmental Policy, New Haven, Yale University.
(1992), “The DICE model: background and structure”, Cowles Foundation Discussion Paper, No. 1009, February, New Haven, Yale University.
(1975), “Can we control carbon dioxide?”, Working Paper, No. 75–63, Laxenburg, International Institute for Applied Systems Analysis (IIASA), June [online] https://pure.iiasa.ac.at/id/eprint/365/1/WP-75-063.pdf.
Nordhaus, W. and J. Boyer (2000), Warming the World: The Economics of the Greenhouse Effect, Cambridge, The MIT Press.
Nordhaus, W. and A. Moffat (2017), “A survey of global impacts of climate change: replication, survey methods, and a statistical analysis”, NBER Working Paper, No. 23646, Cambridge, National Bureau of Economic Research (NBER).
Observatorio ABC (2017), Agricultura de baixa emissão de carbono: avaliação do uso estratégico das áreas prioritárias do Programa ABC, Brasilia, April [online] http://observatorioabc.com.br/wp-content/uploads/2017/05/Relatorio-Completo_A%CC%81reas_Priorita%CC%81rias.pdf.

344 Economic Commission for Latin America and the Caribbean (ECLAC)
(2017b), Impactos econômicos e ambientais do Plano ABC, São Paulo, September. (2016), “Análise dos recursos do Programa ABC: instituições financeiras privadas.
Safra 2015/16”, Relatório, vol. 3, No. 1, Brasilia, August. (2015), “Invertendo o sinal de carbono da agropecuária brasileira: uma estimativa
do potencial de mitigação de tecnologías do Plano ABC de 2012 a 2023”, Relatório, vol. 2, No. 5, São Paulo, June.
OECD (Organization for Economic Cooperation and Development) (2012b), Farmer Behaviour, Agricultural Management and Climate Change, Paris.
(2010), “Agriculture and pro-poor growth”, JLP-PPG Briefing Note, No. 4, Paris, June.
(2007a), Pollution Abatement and Control Expenditure in OECD Countries, Paris. (2007b), Promoting Pro-Poor Growth: Policy Guidance for Donors, Paris.OECD/IEA (Organization for Economic Cooperation and Development/International
Energy Agency) (2018), Global EV Outlook 2018: Towards Cross-modal Electrification, Paris. (2017), Energy Technology Perspectives 2017: Catalysing Energy Technology
Transformations, Paris.OLADE (Latin American Energy Organization) (2018), Panorama Energético de
América Latina y el Caribe, 2018, Quito.Olawale, F., S. Adebambo and A. Boye (2015), “Correlates of road traffic congestion
and workers’ performance in Lagos metropolis”, European Journal of Business and Management, vol. 7, No. 17, International Institute for Science, Technology and Education (IISTE).
Oliveira, P. and others (2018), Produção de carne carbono neutro: um novo conceito para carne sustentável produzida nos trópicos, Brasilia, Brazilian Agricultural Research Corporation (EMBRAPA).
Olmstead, S., W. Hanemann and R. Stavins (2007), “Water demand under alternative price structures”, Journal of Environmental Economics and Management, vol. 54, No. 2, Amsterdam, Elsevier, September.
Osman-Elasha, B. and others (2009), “Community development and coping with drought in rural Sudan”, Climate Change and Adaptation, N. Leary and others (eds.), London, Earthscan.
Oyhantçabal, W. and C. Jones (2018), “Innovaciones en producción cárnica con bajas emisiones de carbono: experiencias y desafíos en Uruguay: las opciones para mitigar en la ganadería pastoril uruguaya”, Innovaciones en Producción cárnica con bajas emisiones de carbono: experiencias y desafíos en ALC. Resúmenes del evento realizado en Montería, Colombia, Santiago, Food and Agriculture Organization of the United Nations/Colombian Agricultural Research Corporation (FAO/AGROSAVIA).
Pasquini, A. and others (2006), “Recent rainfall and runoff variability in central Argentina”, Quaternary International, vol. 158, No. 1, Amsterdam, Elsevier.
Patz, J. and others (2000), “The potential health impacts of climate variability and change for the United States: executive summary of the report of the health sector of the U.S. National Assessment”, Environmental Health Perspectives, vol. 108, No. 4, Research Triangle, National Institute of Environmental Health Sciences (NIEHS), April.
Pehl, M. and others (2017), “Understanding future emissions from low-carbon power systems by integration of life-cycle assessment and integrated energy modelling”, Nature Energy, vol. 2, Berlin, Springer [online] https://www.nature.com/articles/s41560-017-0032-9.
Pelling, M., A. Özerdem and S. Barakat (2002), “The macro-economic impact of disasters”, Progress in Development Studies, vol. 2, No. 4, Thousand Oaks, SAGE Publications.

The climate emergency in Latin America and the Caribbean... 345
Pérez, C. and A. Marín (2015), “Cambio tecnológico y desarrollo sustentable”, Integración y Comercio, No. 39, Buenos Aires, Institute for the Integration of Latin America and the Caribbean (INTAL).
Peters, G. and others (2015), “Measuring a fair and ambitious climate agreement using cumulative emissions”, Environmental Research Letters, vol. 10, No. 10, Bristol, IOP Publishing.
Pino, P. and others (2004), “Fine particulate matter and wheezing illnesses in the first year of life”, Epidemiology, vol. 15, No. 6, Cambridge, Wolters Kluwer, November.
Pizarro, R., F. Pinto and S. Ainzúa (2018a), “Strategy: Chile’s green tax”, Folletos de Impuestos Verdes, No. 3, Santiago, Ministry of the Environment.
(2018b), “Potentialities and possible transitions of Chile´s green tax”, Folletos de Impuestos Verdes, No. 5, Santiago, Ministry of the Environment.
Polebitski, A. and R. Palmer (2010), “Seasonal residential water demand forecasting for census tracts”, Journal of Water Resources Planning and Management, vol. 136, No. 1, Reston, American Society of Civil Engineers (ASCE).
Porter, J. and others (2014), “Food security and food production systems”, Climate Change 2014: Impacts, Adaptation, and Vulnerability. Part A: Global and Sectoral Aspects, V. Barros and others (eds.), Cambridge, Cambridge University Press.
Poterba, J. (1991), “Is the gasoline tax regressive?”, NBER Working Paper, No. 3578, Cambridge, National Bureau of Economic Research (NBER), January.
Prokopy, L. and others (2008), “Determinants of agricultural best management practice adoption: evidence from the literature”, Journal of Soil and Water Conservation, vol. 63, No. 5, Ankeny, Soil and Water Conservation Society.
Prud’homme, R. and C. Lee (1999), “Size, sprawl, speed and the efficiency of cities”, Urban Studies, vol. 36, No. 11, Thousand Oaks, SAGE Publications.
Rahim, S. (2017), “Time for a RGGI makeover?”, E&E News, Washington, D.C., Environment and Energy Publishing, 28 June [online] https://www.eenews.net/climatewire/stories/1060056710/search?keyword=RGGI.
Ramseur, J. (2017), “The Regional Greenhouse Gas Initiative: lessons learned and issues for Congress”, CRS Report, No. 41.836, Washington, D.C., Congressional Research Service (CRS).
Rasmussen, T. (2004), “Macroeconomic implications of natural disasters in the Caribbean”, Working Paper, No. 04/224, Washington, D.C., International Monetary Fund (IMF).
Ravallion, M. (2004), “Defining pro-poor growth: a response to Kakwani”, One Pager, No. 4, Brasilia, International Policy Centre for Inclusive Growth (IPC-IG).
(1995), “Growth and poverty: evidence for developing countries in the 1980s”, Economics Letters, vol. 48, No. 3–4, Amsterdam, Elsevier, June.
Ravallion, M. and G. Datt (2002), “Why has economic growth been more pro-poor in some states of India than others?”, Journal of Development Economics, vol. 68, No. 2, Amsterdam, Elsevier, August.
Raymond, C. y otros (2017), “A framework for assessing and implementing the co-benefits of nature-based solutions in urban areas”, Environmental Science & Policy, vol. 77, noviembre.
Reidsma, P. and others (2010), “Adaptation to climate change and climate variability in European agriculture: the importance of farm level responses”, European Journal of Agronomy, vol. 32, No. 1, Amsterdam, Elsevier, January.
REN21 (Renewable Energy Policy Network for the 21st Century) (2018), Renewables 2018: Global Status Report, Paris.

346 Economic Commission for Latin America and the Caribbean (ECLAC)
Restrepo, J. (2018), “Una visión de ganadería sostenible desde AGROSAVIA”, Innovaciones en Producción cárnica con bajas emisiones de carbono: experiencias y desafíos en ALC. Resúmenes del evento realizado en Montería, Colombia, Santiago, Food and Agriculture Organization of the United Nations/Colombian Agricultural Research Corporation (FAO/AGROSAVIA).
Rodrigues, A. and others (2010), “Global changes in pampean lowland streams (Argentina): implications for biodiversity and functioning”, Hydrobiologia, vol. 657, No. 1, Berlin, Springer.
Rodríguez, A. and L. Meza (eds.) (2016), “Agrobiodiversidad, agricultura familiar y cambio climático”, Seminars and Conferences series, No. 85 (LC/L.4193), Santiago, Economic Commission for Latin America and the Caribbean/Food and Agriculture Organization of the United Nations (ECLAC/FAO).
Rogelj, J. and others (2019), “Estimating and tracking the remaining carbon budget for stringent climate targets”, Nature, vol. 571, Berlin, Springer.
Rosales-Castillo, J. and others (2001), “Acute effects of air pollution on health: evidence from epidemiological studies”, Salud Pública de México, vol. 43, No. 6, Cuernavaca, National Public Health Institute, December.
Rosenzweig, C. and M. Parry (1994), “Potential impact of climate change on world food supply”, Nature, vol. 367, Berlin, Springer, January.
Rosenzweig, M. and H. Binswanger (1993), “Wealth, weather risk and the composition and profitability of agricultural investments”, The Economic Journal, vol. 103, No. 416, Hoboken, Wiley.
Ruth, M. and M. Ibarrarán (eds.) (2009), Distributional Impacts of Climate Change and Disasters: Concepts and Cases, Cheltenham, Edward Elgar Publishing.
Salon, D. and others (2012), “How do local actions affect VMT? A critical review of the empirical evidence”, Transportation Research Part D: Transport and Environment, vol. 17, No. 7, Amsterdam, Elsevier.
Samaniego, J. and others (2019), Panorama de las contribuciones determinadas a nivel nacional en América Latina y el Caribe, 2019: avances para el cumplimiento del Acuerdo de París (LC/TS.2019/89), Santiago, Economic Commission for Latin America and the Caribbean (ECLAC).
(2017), “Adaptación al cambio climático en el sector agropecuario en América Latina y el Caribe”, Síntesis de Políticas Públicas sobre Cambio Climático, Santiago, Economic Commission for Latin America and the Caribbean (ECLAC), April.
Samaniego, J. and H. Schneider (2019), “Cuarto informe sobre financiamiento para el cambio climático en América Latina y el Caribe, 2013-2016”, Project Documents (LC/TS.2019/15), Santiago, Economic Commission for Latin America and the Caribbean (ECLAC), August.
Sánchez, L. (ed.) (2018), “Economics of climate change in Latin America and the Caribbean: a graphic view”, Project Documents (LC/TS.2017/84/Rev.1), A. Bárcena and others (coords.), Santiago, Economic Commission for Latin America and the Caribbean (ECLAC), August.
(ed.) (2013), “Respuestas urbanas al cambio climático en América Latina”, Project Documents (LC/W.563), Santiago, Economic Commission for Latin America and the Caribbean (ECLAC), December.
Saurral, R., V. Barros and D. Lettenmaier (2008), “Land use impact on the Uruguay River discharge”, Geophysical Research Letters, vol. 35, No. 12, Hoboken, Wiley.
Schmalensee, R. and R. Stavins (2017), “Lessons Learned from Three Decades of Experience with Cap and Trade”, Review of Environmental Economics and Policy, vol. 11, No. 1, Oxford, Oxford University Press.

The climate emergency in Latin America and the Caribbean... 347
Schneider, H. (2019), “La sostenibilidad en el transporte”, Santiago, Konrad-Adenauer-Stiftung (KAS), unpublished.
Schwartz, J., R. Levin and K. Hodge (1997), “Drinking water turbidity and pediatric hospital use for gastrointestinal illness in Philadelphia”, Epidemiology, vol. 8, No. 6, Cambridge, Wolters Kluwer, November.
Schwartz, S. and W. Rosen (2015), Street Smart: The Rise of Cities and the Fall of Cars, New York, PublicAffairs.
Sebri, M. (2014), “A meta-analysis of residential water demand studies”, Environment, Development and Sustainability, vol. 16, No. 3, Berlin, Springer, June.
Secretariat of the Environment and Natural Resources (2019), “Acuerdo por el que se establecen las bases preliminares del Programa de Prueba del Sistema de Comercio de Emisiones”, Diario Oficial de la Federación, Mexico City, 1 October.
Seddon, N. and others (2020), “Understanding the value and limits of nature-based solutions to climate change and other global challenges”, Philosophical Transactions of the Royal Society B: Biological Sciences, vol. 375, No. 1794.
(2019), Nature-based solutions in nationally determined contributions: synthesis and recommendations for enhancing climate ambition and action by 2020, Gland/Oxford, International Union for Conservation of Nature and Natural Resources (IUCN)/University of Oxford.
SEDEMA (Secretariat of the Environment) (2016), Inventario de emisiones de la CDMX 2014: contaminantes criterio, tóxicos y de efecto invernadero, Mexico City.
SEEG (Estimation System of Greenhouse Gas Emissions) (2018), “Estimativas de emissões de gases de efeito estufa do Brasil 1970 – 2017”, SEEG Coleção, No. 6, São Paulo, noviembre [online] http://www.observatoriodoclima.eco.br/wp-content/uploads/2018/11/PPT-SEEG-6-LANCAMENTO-GERAL-2018.11.21-FINAL-DIST-compressed.pdf.
Seo, N. and R. Mendelsohn (2007), “An analysis of crop choice: adapting to climate change in Latin American farms”, Policy Research Working Paper, No. 4162, Washington, D.C., World Bank.
SICA (Central American Integration System) (2011), “Variabilidad climática y eventos extremos en Centroamérica: reporte exploratorio”, Mexico City, unpublished.
Soam, Y. (2019), “Solid-state batteries: a new era of energy storage”, IAM/Sagacious Research, 30 January [online] https://www.iam-media.com/solid-state-batteries-new-era-energy-storage.
Soares-Filho, B. and others (2010), “Role of Brazilian Amazon protected areas in climate change mitigation”, Proceedings of the National Academy of Sciences of the United States of America (PNAS), vol. 107, No. 24, Washington, D.C., National Academy of Sciences (NAS), June.
Stanton, T. and others (2010), State of Watershed Payments 2010: An Emerging Marketplace, Ecosystem Marketplace [online] https://www.forest-trends.org/wp-content/uploads/imported/state_of_water_2010.pdf.
Stern, N. (2013), “The structure of economic modeling of the potential impacts of climate change: grafting gross underestimation of risk onto already narrow science models”, Journal of Economic Literature, vol. 51, No. 3, Pittsburgh, American Economic Association (AEA), September.
(2008), “The economics of climate change”, American Economic Review, vol. 98, No. 2, Pittsburgh, American Economic Association (AEA), May.
(2007), The Economics of Climate Change: The Stern Review, Cambridge, Cambridge University Press, January.

348 Economic Commission for Latin America and the Caribbean (ECLAC)
Sterne, J. and T. Palmer (ed.) (2009), Meta-Analysis in Stata: An Updated Collection from the Stata Journal, College Station, Stata Press.
Strand, J. and I. Walker (2005), “Water markets and demand in Central American cities”, Environment and Development Economics, vol. 10, No. 3, Cambridge, Cambridge University Press.
Székely, A. (2009), “Latinoamérica y la biodiversidad”, Mexico City, National Autonomous University of Mexico.
Tan, G. and R. Shibasaki (2003), “Global estimation of crop productivity and the impacts of global warming by GIS and EPIC integration”, Ecological Modelling, vol. 168, No. 3, Amsterdam, Elsevier, October.
Tans, P. and R. Keeling (2014), “Trends in atmospheric carbon dioxide”, Washington, D.C., National Oceanic and Atmospheric Administration (NOAA) [online] http://www.esrl.noaa.gov/gmd/ccgg/trends/index.html.
Thurlow, J., T. Zhu and X. Diao (2009), “The impact of climate variability and change on economic growth and poverty in Zambia”, IFPRI Discussion Paper, No. 890, Washington, D.C., International Food Policy Research Institute (IFPRI).
TNO (Netherlands Organisation for Applied Scientific Research) (2015), “Energie- en milieu-aspecten van elektrische personenvoertuigen”, TNO Rapport, Delft.
Tol, R. (1997), “The Climate Framework for Uncertainty, Negotiation and Distribution”, Climate Change and Integrated Assessment Models: Bridging the Gaps, O. Cameron, K. Fukuwatari and T. Morita (eds.), Tsukuba, Center for Global Environmental Research.
UCS (Union of Concerned Scientists) (2017), “Benefits of renewable energy use”, Cambridge [online] https://www.ucsusa.org/resources/benefits-renewable-energy-use.
UN-Habitat (United Nations Human Settlements Programme) (2011), Global Report on Human Settlements 2011. Cities and Climate Change: Policy Directions, Rio de Janeiro.
UNDP (United Nations Development Programme) (2019), Experiencias en la aplicación de la metodología del Gasto Público e Institucionalidad para el Cambio Climático (CPEIR) en Honduras, Colombia, Chile, Ecuador y El Salvador, New York, May.
(2009), Human Development Report 2009, New York. UNDRR (United Nations Office for Disaster Risk Reduction) (2009), Terminology on
Disaster Risk Reduction, Geneva.UNEP (United Nations Environment Programme) (2018), The Emissions Gap Report 2018,
Nairobi. (2016), GEO-6: Regional Assessment for Latin America and the Caribbean, Panama City. (2015), The Emissions Gap Report 2015, Nairobi. (2010), Latin America and the Caribbean: Environment Outlook. GEO LAC 3, Panama City.UNEP/ECLAC/GRID-Arendal (United Nations Environment Programme/Economic
Commission for Latin America and the Caribbean/GRID-Arendal) (2010), Vital Climate Change Graphics for Latin America and the Caribbean 2010, Arendal.
UNFCCC (United Nations Framework Convention on Climate Change) (2016), Aggregate Effect of the Intended Nationally Determined Contributions: An Update (FCCC/CP/2016/2), Bonn.
(2016b), Report of the Conference of the Parties on its twenty-first session, held in Paris from 30 November to 13 December 2015. Addendum. Part two: Action taken by the Conference of the Parties at its twenty-first session (FCCC/CP/2015/10/Add.1), Bonn.
(2007a), Climate Change: Impacts, Vulnerabilities and Adaptation in Developing Countries, Bonn.
(2007b), Investment and Financial Flows to Address Climate Change, Bonn.
The climate emergency in Latin America and the Caribbean... 349
(2007c), “Vulnerability and adaptation to climate change in small island developing states”, Bonn.
United Nations (2012), Follow-up to paragraph 143 on human security of the 2005 World Summit Outcome (A/RES/66/290), New York.
(2009), Climate change and its possible security implications: report of the Secretary-General (A/64/350), New York, September.
(2004), World Population to 2300 (ST/ESA/SER.A/236), New York.Vasconcellos, E. (2019a), “Contribuciones a un gran impulso ambiental para
América Latina y el Caribe: movilidad urbana sostenible”, Project Documents (LC/TS.2019/2), Santiago, Economic Commission for Latin America and the Caribbean (ECLAC), July.
(2019b), “Mobilidade urbana em Curitiba: os limites do sonho”, Revista dos Transportes Públicos, vol. 41, São Paulo, National Association of Public Transportation (ANTP).
(2017), “OMU: Observatorio de Movilidad Urbana de América Latina 2014”, document prepared for the Technical Support for Strategies to Mitigate Air Pollution workshop, Mexico City, Development Bank of Latin America (CAF), 18–19 January [online] https://www.itf-oecd.org/comprehensive-mobility-management-policies-reduce-air-pollution.
Vasconcellos, E. and A. Mendonça (2016), “Observatorio de Movilidad Urbana: resumen borrador 2015-2016”, Caracas, Development Bank of Latin America (CAF).
Vattenfall (2019), Life Cycle Assessment for Vattenfall’s Electricity Generation: Including a Case Study for the Nordic Countries Group Environment, Stockholm [online] https://group.vattenfall.com/siteassets/corporate/who-we-are/sustainability/doc/life_cycle_assessment_2019.pdf.
Vela Correa, G., J. López Blanco and M. Rodríguez Gamiño (2012), “Niveles de carbono orgánico total en el Suelo de Conservación del Distrito Federal, centro de México”, Investigaciones Geográficas, No. 77, Institute of Geography, National Autonomous University of Mexico (UNAM).
Vergara, W., J. Fenhann and M. Schletz (2015), Zero Carbon Latin America: A Pathway for Net Decarbonisation of the Regional Economy by Mid-Century: Vision Paper, UNEP DTU Partnership.
Vergara, W. and others (2014), The Climate and Development Challenge for Latin America and the Caribbean: Options for Climate-Resilient, Low-Carbon Development, Washington, D.C., Inter-American Development Bank/Economic Commission for Latin America and the Caribbean/World Wide Fund for Nature (IDB/ECLAC/WWF).
(2013), The Climate and Development Challenge for Latin America and the Caribbean: Options for Climate-Resilient, Low-Carbon Development, Washington, D.C., Inter-American Development Bank (IDB).
(2009), “The potential consequences of climate-induced coral loss in the Caribbean by 2050–2080”, Assessing the Potential Consequences of Climate Destabilization in Latin America, W. Vergara (ed.), Washington, D.C., World Bank.
Vicuña, S. and others (2012), “Consumo urbano de aguas en la cuenca del río Maipo”, Santiago, Pontifical Catholic University of Chile (PUC).
Viglizzo, E. and others (2012), “Ecosystem service evaluation to support land-use policy”, Agriculture, Ecosystems and Environment, vol. 154, No. 1, Amsterdam, Elsevier.
Wang, Q. and others (2014), “Temporal-spatial characteristics of severe drought events and their impact on agriculture on a global scale”, Quaternary International, vol. 349, Amsterdam, Elsevier.
Watkiss, P. (2006), “The social cost of carbon”, Paris, Organization for Economic Cooperation and Development (OECD), January.

350 Economic Commission for Latin America and the Caribbean (ECLAC)
Weisbrod, G., D. Vary and G. Treyz (2003), “Measuring economic costs of urban traffic congestion to business”, Transportation Research Record: Journal of the Transportation Research Board, vol. 1839, No. 1, Thousand Oaks, SAGE Publications.
Weischer, L. and others (2016), “Investing in ambition: analysis of the financial aspects in (intended) nationally determined contributions”, Briefing Paper, Bonn, Germanwatch/Perspectives Climate Group, May.
Werz, M. and L. Conley (2012), Climate Change, Migration, and Conflict; Addressing Complex Crisis Scenarios in the 21st Century, Washington, D.C., Center for American Progress.
WHO (World Health Organization) (2004), Comparative Quantification of Health Risks: Global and Regional Burden of Disease Attribution to Selected Major Risk Factors, Geneva.
WHO/OMM/UNEP (World Health Organization/World Meteorological Organization/United Nations Environment Programme) (2008), “Cambio climático y salud humana: riesgos y respuestas. Resumen actualizado 2008”, Washington, D.C.
WMO (World Meteorological Organization) (2017), WMO Greenhouse Gas Bulletin, No. 13, Geneva, October.
WNA (World Nuclear Association) (2011), “Comparison of lifecycle greenhouse gas emissions of various electricity generation sources”, WNA Report, London [online] http://www.world-nuclear.org/uploadedFiles/org/WNA/Publications/Working_Group_Reports/comparison_of_lifecycle.pdf.
World Bank (2019a), World Development Indicators [online database] https://databank.bancomundial.org/source/world-development-indicators.
(2019b), Mitigation Content Database [online database] http://spappssecext.worldbank.org/sites/indc/Pages/Mitigation.aspx.
(2018), Groundswell: Preparing for Internal Climate Migration, Washington, D.C. (2017), “Preparing Mexico’s urban transport sector for a low-carbon
transition”, Washington, D.C., 6 April [online] https://www.worldbank.org/en/results/2017/04/06/preparing-mexico-urban-transport-sector-low- carbon-transition.
(2013), Turn Down the Heat: Climate Extremes, Regional Impacts, and the Case for Resilience, Washington, D.C.
(2012), Economics of Adaptation to Climate Change Study: Synthesis Report, Washington, D.C.
(2010), Natural Hazards, UnNatural Disasters: The Economics of Effective Prevention, Washington, D.C.
World Economic Forum (2019), The Global Risks Report 2019, Geneva.Worthington, A. and M. Hoffman (2008), “An empirical survey of residential water
demand modelling”, Journal of Economic Surveys, vol. 22, No. 5, Hoboken, Wiley, December.
WWAP (World Water Assessment Programme), The United Nations world water development report 2018: nature-based solutions for water, Paris, United Nations Educational, Scientific and Cultural Organization (UNESCO).
Zhou, Y. and R. Tol (2005), “Economic analysis of domestic, industrial and agricultural water demands in China”, Water Supply, vol. 5, No. 6, London, IWA Publishing, December.

Publicaciones recientes de la CEPAL ECLAC recent publications
www.cepal.org/publicaciones
Informes Anuales/Annual ReportsTambién disponibles para años anteriores/Issues for previous years also available
Estudio Económico de América Latina y el Caribe 2019Economic Survey of Latin America and the Caribbean 2019
Balance Preliminar de las Economías de América Latina y el Caribe 2019Preliminary Overview of the Economies of Latin America and the Caribbean 2019
Panorama Social de América Latina 2019Social Panorama of Latin America 2019
La Inversión Extranjera Directa en América Latina y el Caribe 2019Foreign Direct Investment in Latin America and the Caribbean 2019
Anuario Estadístico de América Latina y el Caribe 2018Statistical Yearbook for Latin America and the Caribbean 2018
Perspectivas del Comercio Internacional de América Latina y el Caribe 2019International Trade Outlook for Latin America and the Caribbean 2019
Informe de avance cuatrienal sobre el progreso y los desafíos regionales de la Agenda 2030 para el Desarrollo Sostenible en América Latina y el Caribe
América del Sur
POR UN DESARROLLOSOSTENIBLE CON IGUALDAD
Des
arro
llo e
igua
ldad
: el p
ensa
mie
nto
de
la C
EPA
L en
su
sépt
imo
dec
enio
Desarrollo e igualdad:el pensamiento de la CEPAL
en su séptimo decenioTextos seleccionados del período 2008-2018
Ricardo Bielschowsky - Miguel Torres | compiladores
COLECCIÓN 70 AÑOS
El Pensamiento de la CEPAL/ECLAC Thinking
Libros y Documentos Institucionales/Institutional Books and Documents
Desarrollo e igualdad: el pensamiento de la CEPAL en su séptimo decenio. Textos seleccionados del período 2008-2018
La ineficiencia de la desigualdadThe Inefficiency of Inequality
Horizontes 2030: la igualdad en el centro del desarrollo sostenibleHorizons 2030: Equality at the centre of sustainable developmentHorizontes 2030: a igualdade no centro do desenvolvimento sustentável
Informe de avance cuatrienal sobre el progreso y los desafíos regionales de la Agenda 2030 para el Desarrollo Sostenible en América Latina y el CaribeQuadrennial report on regional progress and challenges in relation to the 2030 Agenda for Sustainable Development in Latin America and the Caribbean
Hacia una agenda regional de desarrollo social inclusivo: bases y propuesta inicialTowards a regional agenda for inclusive social development: bases and initial proposal
Libros de la CEPAL/ECLAC Books
Los sistemas de pensiones en la encrucijada: desafíos para la sostenibilidad en América Latina
Recursos naturales, medio ambiente y sostenibilidad. 70 años de pensamiento de la CEPAL
La bonanza de los recursos naturales para el desarrollo: dilemas de gobernanza
Páginas Selectas de la CEPAL/ECLAC Select Pages
Protección social universal en América Latina y el Caribe. Textos seleccionados 2006-2019
Migración y desarrollo sostenible: la centralidad de los derechos humanos. Textos seleccionados 2008-2019
Empleo en América Latina y el Caribe. Textos seleccionados 2006-2017

AGOSTO • 2019
Régimen monetario e instituciones laborales: una interpretación alternativa de la tendencia a la disminución del traspaso del tipo de cambio (pass-through) en los países periféricos
Martín Cherkasky y Martín Abeles 7
Modelos de estado desarrollista
Luiz Carlos Bresser-Pereira 39
El desarrollo del capital de riesgo en América Latina y el Caribe: una perspectiva comparada
Ernesto H. Stein y Rodrigo A. Wagner 53
La heterogeneidad de los efectos de la educación preescolar sobre los resultados cognitivos en América Latina
Juan Antonio Dip y Luis Fernando Gamboa 79
Crecimiento económico y desarrollo financiero en el Brasil: investigación a partir del modelo de regresión flexible
Filipe de Morais Cangussu Pessoa, Marcelo José Braga y Gabriel Alves de Sampaio Morais 101
Importancia de los términos de intercambio en la economía colombiana
Andrés Felipe Oviedo Gómez y Lya Paola Sierra Suárez 125
Evaluaciones ex post de corto y largo plazo de iniciativas ambientales comunitarias en Chile
Cristian Mardones 155
El bienestar de la población de los estados de México bajo un enfoque de multidimensionalidad
Amilcar O. Fernández Domínguez y Denise Gómez Hernández 183
Factores hereditarios y sociales que explican la desigualdad en las habilidades tempranas: el caso de los niños chilenos
Ricardo Rivas 207
OBSERVATORIODEMOGRÁFICO
América Latinay el Caribe
DEMOGRAPHICOBSERVATORYLatin America and the Caribbean
ISSN 1990-424X
2 0 1 8
Proyecciones de Población
Population projections
20
18
OBS
ERVA
TORI
O D
EMO
GRÁ
FICO
• D
EMO
GRA
PHIC
OBS
ERVA
TORY
CEPL
/ECL
AC
Población
Nº 108ISSN 0303-1829
Comisión Económica para América Latina y el Caribe (CEPAL)Centro Latinoamericano y Caribeño de Demografía (CELADE)División de Población de la CEPAL
ENERO-JUNIO 2019
AÑO XLVI
notas de
Amores imposibles: la brecha entre universitarios y el resto de grupos educativos en los mercados matrimoniales de América Latina, 1970-2010Victoria San Juan Bernuy Albert Esteve
La estructura de los hogares y el ahorro en México: un enfoque de clases latentesCurtis Huffman Paloma Villagómez-Ornelas Delfino Vargas Chanes
Transferencias intergeneracionales por género y efectos económicos del envejecimiento demográfico en MéxicoIván Mejía-Guevara Estela Rivero Isalia Nava
Inmigración e inclusión laboral y protección social según el origen y el tiempo de residencia de los migrantes en países seleccionados de América LatinaIgnacio Carrasco José Ignacio Suárez
Epicentros de emigración: un análisis comparativo de la evolución de sus dinámicas socioeconómicas y demográficas en Colombia y el BrasilGisela P. Zapata
Construcciones y alcances del derecho a la salud en el Primer Plan Nacional de Acción en Derechos Humanos (Argentina, 2017-2020): prioridades de agenda y lineamientos de política pública desde un enfoque de derechos humanosLaura Gottero
Una estimación de la mortalidad en la ciudad de Buenos Aires hacia 1827Luis Pablo Dmitruk Tomás Guzmán
La diversidad sexual y de género en censos y encuestas de América Latina: entre la invisibilidad y la lógica heteronormativaFernanda Stang Alva
Compresión de la mortalidad en el Uruguay: niveles y diferencias regionales en el período 1996-2014Mariana Paredes Mariana Tenenbaum
Factores asociados al trabajo infantil en la República Bolivariana de VenezuelaMalinda Coa Ravelo Ernesto Ponsot Balaguer
La innovación exportadora en las pequeñas y medianas empresas Programas de apoyo y financiamiento
en América Latina Nanno Mulder Andrea Pellandra
ISSN 1564-4170
SERIE
138
COMERCIO INTERNACIONAL
ISSN 1564-4170
SERIE
266
FINANCIAMIENTO PARA EL DESARROLLO
Financiamiento para el desarrollo en América Latina y el CaribeLa movilización
de recursos para el desarrollo medioambiental
Georgina Cipoletta Tomassian Adriana Matos
Derechos de acceso
en asuntos ambientales
en el EcuadorHacia el desarrollo de una actividad minera
respetuosa del entorno y las comunidades
Daniel Barragán
ISSN 1564-4170
SERIE
165MEDIO AMBIENTE Y DESARROLLO
Revista CEPAL/CEPAL Review
Coediciones/Co-editions Copublicaciones/Co-publications
Documentos de Proyectos Project Documents
Series de la CEPAL/ECLAC Series
Observatorio Demográfico Demographic Observatory
Notas de Población
Metodologías de la CEPALECLAC Methodologies

Publicaciones de la CEPAL
Info
rme
s A
nu
ale
s
OBSE
RVA
TORIO
DEM
OG
RÁ
FICO
Libr
os d
e la
CEP
AL
Revi
sta
CEP
AL
Libr
os in
stitu
cion
ales
Pági
nas
Sele
ctas
Libros de la CEPAL
Manuales de la CEPAL
Notas de Población
Cuadernos Estadísticos
www.cepal.org/es/suscripciones www.cepal.org/en/suscripciones
Subscribe to receive up-to-the-minute information on ECLAC publications
Suscríbase y reciba información oportuna sobre las publicaciones de la CEPAL
facebook.com/publicacionesdelacepal
www.cepal.org/publicaciones
Las publicaciones de la CEPAL también se pueden adquirir a través de: ECLAC publications also available at:
shop.un.orgTel. (1-888)254-4286Fax (1-800)338-4550
Contacto/Contact: [email protected]/Orders: [email protected]
United Nations PublicationsPO Box 960
Herndon, VA 20172USA

ECONOMIC COMMISSION FOR LATIN AMERICA AND THE CARIBBEAN (ECLAC)COMISIÓN ECONÓMICA PARA AMÉRICA LATINA Y EL CARIBE (CEPAL)
www.eclac.org
This book presents the results of more than a decade of work carried out by the Economic Commission for Latin America and the Caribbean (ECLAC)
on the economics of climate change. It analyses the conclusive global data and the impact of climate change in the region, examining sectors such as agriculture, health, transport and energy. In particular, it addresses the effects of climate change on the two most vulnerable subregions, Central America and the Caribbean, and gives an account of the agreements reached in the region to tackle the problem of global warming.
The book discusses the advances made in relation to climate issues, climate finance flows and public policy innovations aimed at moving towards lower-carbon development better suited to a changing climate. Responding to the challenge of climate change in Latin America and the Caribbean represents a financial, economic, social, cultural, distributive and innovation effort, but it also provides an opportunity for the region to move towards more sustainable and inclusive development.
Sust
aina
ble
Dev
elop
men
t
ALICIA BÁRCENAJOSELUIS SAMANIEGOWILSON PERESJOSÉ EDUARDO ALATORRE
The climate emergency in Latin America and the CaribbeanThe path ahead – resignation or action?
Copyright © 2022 FDOKUMEN