INTRASEASONAL VARIABILITY OF RAINFALL OVER NORTHERN SOUTH AMERICA AND CARIBBEAN REGION
19
EARTH SCIENCES RESEARCH JOURNAL Earth Sci. Res. J. Vol. 12, No. 2 (December 2008): 194-212 INTRASEASONAL VARIABILITY OF RAINFALL OVER NORTHERN SOUTH AMERICA AND CARIBBEAN REGION J.D. Pabón 1 and J. Dorado 2 1 Oficina 317, Edificio 212 (Aulas de Ciencias Humanas). Department of Geography, National University of Colombia. E-mail address: [email protected] 2 Posgraduate Program in Meteorology, Department of Geosciences, National University of Colombia ABSTRACT Based on decadal (amounts for each ten days) precipitation data from meteorological stations situated in North- ern South America and Caribbean region, a decadal precipitation index (DPI) was calculated in order to study the intraseasonal variability (ISV) of regional rainfall. The spectral analysis of DPI allows to identify signals with 20-25, 30, 40 and 50-60 days period. According to the analysis of their spatial distribution these signals are well defined over the Caribbean island and coastal sector such as in some sectors of the Andean region; the 60-days signal is presented only over Caribbean region and in some places in the Pacific sector; in the eastern lowlands of Orinoco and Amazon basin these signals are not clearly expressed. Exploring the relationship between regional ISV and Madden-Julian Oscillation correlation analysis was made. Due to the presence of signals different of 30-60 days, the correlation coefficients were very low. Considering this situation, high frequency smoothing was applied to DPI time series; after that, a relative correlation was de- tected between smoothed DPI and Madden-Julian Index (MJI). Keywords: Intraseasonal Variability, Madden-Julian Oscillation, Rainfall. RESUMEN Con base en datos de precipitación decadal (acumulados de diez días) provenientes de estaciones meteorológicas localizadas en el norte de Suramérica y en el Caribe, se calculó un Índice de Precipitación De- cadal (IPD) para estudiar la variabilidad Intraestacional (VIS) de la precipitación de ésta región. El análisis espectral del IPD muestra señales con períodos de 20-25, 30, 40 y 50-60 días. De acuerdo con el análisis de la 194 Manuscript received: October 10th, 2008. Accepted for publication: November 22 th , 2008.
-
Upload
independent -
Category
Documents
-
view
0 -
download
0
Transcript of INTRASEASONAL VARIABILITY OF RAINFALL OVER NORTHERN SOUTH AMERICA AND CARIBBEAN REGION
EARTH SCIENCES
RESEARCH JOURNAL
Earth Sci. Res. J. Vol. 12, No. 2 (December 2008): 194-212
INTRASEASONAL VARIABILITY OF RAINFALL OVER
NORTHERN SOUTH AMERICA AND CARIBBEAN REGION
J.D. Pabón1 and J. Dorado2
1 Oficina 317, Edificio 212 (Aulas de Ciencias Humanas). Department of Geography,
National University of Colombia. E-mail address: [email protected]
2 Posgraduate Program in Meteorology, Department of Geosciences,
National University of Colombia
ABSTRACT
Based on decadal (amounts for each ten days) precipitation data from meteorological stations situated in North-ern South America and Caribbean region, a decadal precipitation index (DPI) was calculated in order to study theintraseasonal variability (ISV) of regional rainfall. The spectral analysis of DPI allows to identify signals with20-25, 30, 40 and 50-60 days period. According to the analysis of their spatial distribution these signals are welldefined over the Caribbean island and coastal sector such as in some sectors of the Andean region; the 60-dayssignal is presented only over Caribbean region and in some places in the Pacific sector; in the eastern lowlandsof Orinoco and Amazon basin these signals are not clearly expressed.
Exploring the relationship between regional ISV and Madden-Julian Oscillation correlation analysis was made.Due to the presence of signals different of 30-60 days, the correlation coefficients were very low. Consideringthis situation, high frequency smoothing was applied to DPI time series; after that, a relative correlation was de-tected between smoothed DPI and Madden-Julian Index (MJI).
Keywords: Intraseasonal Variability, Madden-Julian Oscillation, Rainfall.
RESUMEN
Con base en datos de precipitación decadal (acumulados de diez días) provenientes de estacionesmeteorológicas localizadas en el norte de Suramérica y en el Caribe, se calculó un Índice de Precipitación De-cadal (IPD) para estudiar la variabilidad Intraestacional (VIS) de la precipitación de ésta región. El análisisespectral del IPDmuestra señales con períodos de 20-25, 30, 40 y 50-60 días. De acuerdo con el análisis de la
194
Manuscript received: October 10th, 2008.Accepted for publication: November 22th, 2008.
distribución espacial, estas señales están bien definidas sobre las islas del Caribe y la zona costera, así como enalgunos sectores de la región andina; la señal de 60 días se presenta únicamente en el Caribe y sobre algunoslugares del Pacífico; en las tierras bajas de las cuencas del Orinoco y Amazonas las señales no se expresanclaramente.
Se analiza también la relación entre laVIS regional de la precipitación y la Oscilación deMadden-Julian. Debidoa la presencia de señales diferentes a las de 30-60 días en la precipitación, los coeficientes de correlaciónobtenidos son muy bajos. Por esto, se realizó la suavización de las altas frecuencias en las series del IPD y secalcularon nuevamente los coeficientes de correlación del IPD con el Índice Madden-Julian, después de lo cualhubo un notorio aumento de los coeficientes de correlación.
Palabras clave: Variabilidad intrestacional, Oscilación Maden-Julian, Lluvia.
1. Introduction
Extreme phases of climate variability bring to differ-ent regions warm or cold periods, rainy (more precip-itation than normal or more frequent heavy rainfallevents) or dry conditions, and so. This variability im-pacts in several ways ecosystems and economic sys-tems of the countries around the world, producing insome cases disasters. In the climate systemmany pro-cesses generate this variability. For example, thetropical Pacific phenomena El Niño (warm condi-tion) and La Niña (cold conditions) are the cause of2-7 years time scale oscillations of climatic variablesknown as ENSO cycle (Philander, 1990; Hastenrath,1996; see also ENSO bibliography in COAPS, 2006).In addition to the ENSO cycle, signals such asquasi-biennial component (Ropelewski et al., 1992;Meehl, 1997; Baldwin et al., 2001), and fluctuationsin the period interval of 20-90 days calledintraseasonal oscillations (Knutson & Weickman,1987; Bantzer & Wallace, 1996; Nogués-Paegle et
al., 2000; Krishnamurti & Shukla, 2000; Goswami&Mohan, 2001; Bond & Vecchi, 2003; Krishnamurti& Shukla, 2007) have been identified.
Today the most studied signal of climate vari-ability is that caused by ENSO. There are many worksrelated to the effects of ENSO in monthly precipitationof different regions in the world (Ropelewski et al.,1986; Ropelewski & Halpert, 1987; Pabón &Montealegre, 1992; Peel et al., 2002; Poveda, 2004;and many others). Currently, seasonal climate pre-diction schemes are based on the knowledge about
particularities of ENSO cycle in a given region,however, because they do not include other modes ofclimate variability, prediction fails frequently, espe-cially in month-to-month range and less (see for ex-ample Hendon et al., 2000; Jones & Schemm, 2000;Jones et al., 2004c). A source of fails in prediction inmonth-to-month range is associated to the no inclu-sion of intraseasonal variations in the schemes. Infact, the phases of intraseasonal fluctuations activateand deactivate rainfall for periods of a couple ofweeks lasting or forwarding the beginning or end ofrainy season, or breaking it. The rainy phase ofintraseasonal variability also activates heavy precipi-tation events and related to them disasters(flashfloods, landslides, etc). Due to practical valueto improve subseasonal predictability (Waliser et al.2003; Webster & Hoyos, 2004), the interest onintraseasonal modes of climate variability has beenincreasing in last decade and many efforts have beendoing to study this variability especially the associ-ated toMadden-Julian Oscillation (Madden& Julian,1994), the dominant mode in intraseasonal climatevariability.
Several authors have been studied theintraseasonal variability (hereafter ISV) in precipi-tation for different geographical regions of theworld. Krishnamurti & Shukla, (2000, 2007), forexample, found modes with 45 and 20 days periodin precipitation in India. Wang et al. (1996) ex-plored ISV of precipitation in China finding 12, 21and 43 days period. Analysis was made also for Af-
INTRASEASONAL VARIABILITY OF RAINFALL OVER NORTHERN SOUTH AMERICA AND CARIBBEAN REGION
195
rica (Janicot & Sultan, 2001; Mathews, 2004) andsignals over 10-25 and 25-60 days period werefound in convection and precipitation in the westernregion (Sultan et al., 2003; Mounier & Janicot,2004); satatistically significant spectral peaks over15 and 40 days period were found for Sahel precipi-tation (Janicot & Sultan 2001). Jones et al. (2004a)using outgoing long wave radiation data developeda climatology for tropical intraseasonal convectiveanomalies. Also, Ye & Cho (2001), analyzed pre-cipitation data for United States, and found 24 and37 days signals. ISV of convection and precipitationfor different regions of South America has beenstudied by Garreaud (2000), Petersen et al. (2002),Misra (2005).
Exploring the causes of ISV of precipitationmany researchers have been paying special attentionto its relationship to Madden-Julian Oscillation(MJO), because theMJO is the dominant mode of trop-ical ISV. Thus, Bantzer & Wallace (1996) analyzedtemperature and precipitation data using satellite dataand found a 40-50 days component, close to MJO pe-riod. Liebman et al. (1994) investigated the relation-ship between tropical cyclones of the Indian andwestern Pacific oceans and the MJO and found thatcyclones preferentially occur during the convectivephase of the oscillation; but they noted, however, thatthe increase in cyclone activity during active periodsof convection is not restricted to MJO activity andconcluded that the last does not influence tropical cy-clones in a unique fashion (this situation may be dueto the existence of other modes of ISV). A similaranalysis was done by Maloney & Hartman (2000a,b)for hurricanes of eastern north Pacific and Gulf ofMexico (information on Caribbean is also included).Kayano & Kousky (1999) studied the MJO in theglobal tropics using pentad-means for the 1979-1995period computed for 200- and 850-hPa zonal winds,200-hPa velocity potential, 500-hPa geopotentialheight and pressure vertical velocity, 925-hPa tem-perature and specific humidity, SLP and totalprecipitable water (PW); they found in all variables aneastward traveling large-scale oscillatory regimewith a period of approximately 45 days. In the otherhand, Jones et al. (2004b) using pentadal precipita-
tion data based on Global Precipitation ClimatologyProject (GPCP) confirmed that over Indian Ocean, In-donesia, Western Pacific, Eastern South America,Western North America, northeast Africa, the Mid-dle East, and Eastern China, extremes precipitationevents increases with the presence of active (convec-tive) phase of MJO. Barlow et al. (2005) analyzingdaily precipitation for Southwest Asia found that thisvariable is modulated by MJO activity in the easternIndian Ocean, with strength comparable to theinterannual variability. Bond & Vechi (2003) founda relationship between MJO and precipitation of Ore-gon and Washington states. ISVwas detected in con-vective processes over Amazon region by Petersen et
al. (2002).
The climate variability for northern South Amer-ica and Caribbean region has been studied mainly ininterannual scale (Hastenrath, 1976; Pabón &Montealegre, 1992; Enfield, 1996; Alfaro et al.,1998; Enfield & Alfaro, 1999; Montealegre &
196
J.D. PABÓN AND J. DORADO
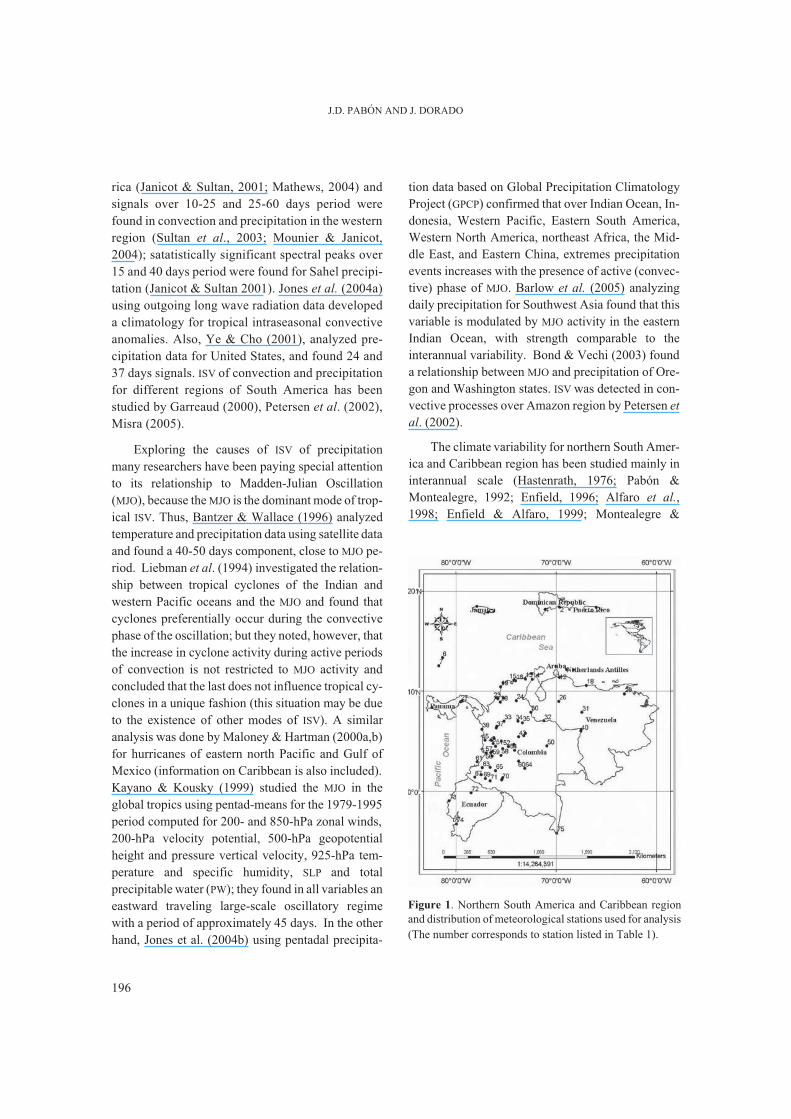
Figure 1. Northern South America and Caribbean regionand distribution of meteorological stations used for analysis(The number corresponds to station listed in Table 1).
INTRASEASONAL VARIABILITY OF RAINFALL OVER NORTHERN SOUTH AMERICA AND CARIBBEAN REGION
197
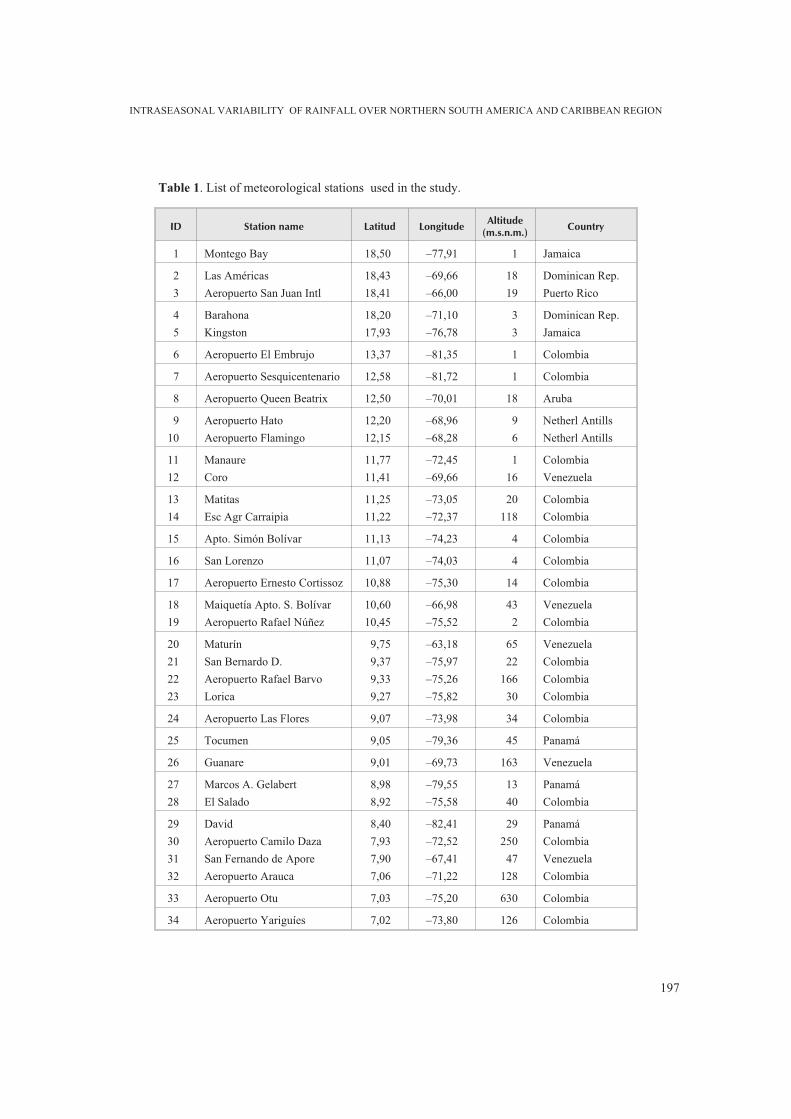
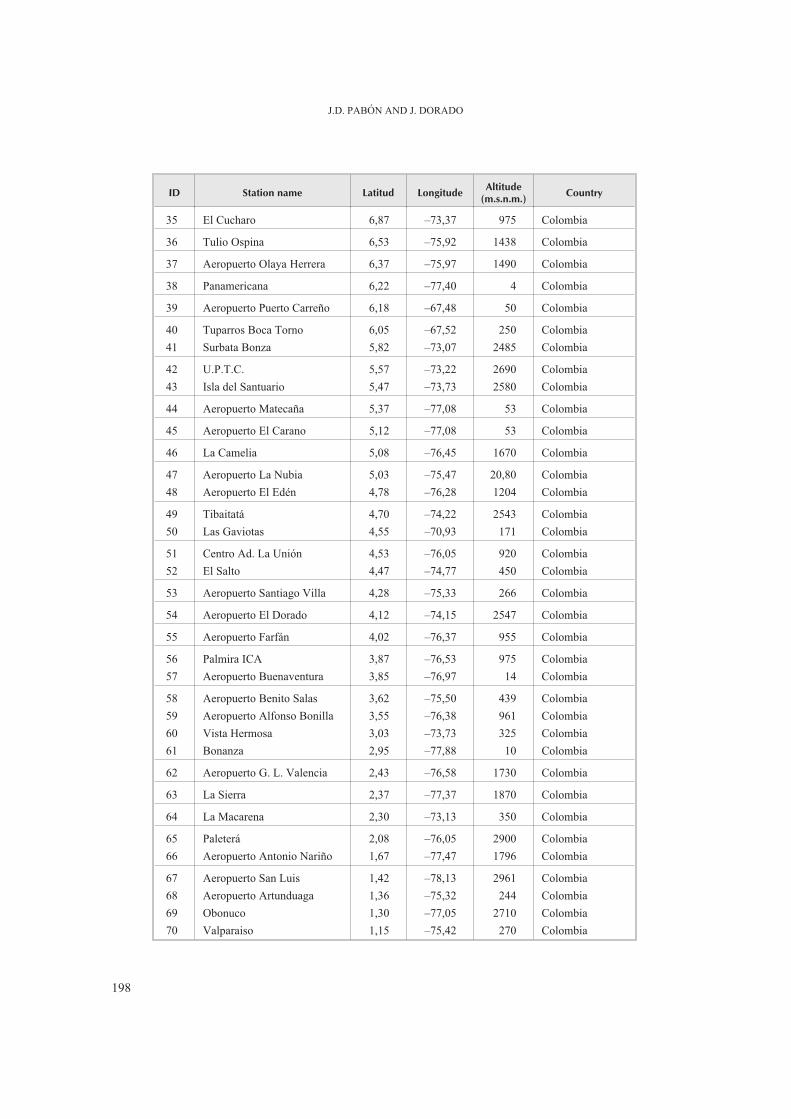
Table 1. List of meteorological stations used in the study.
ID Station name Latitud LongitudeAltitude
(m.s.n.m.)Country
1 Montego Bay 18,50 –77,91 1 Jamaica
2
3
Las Américas
Aeropuerto San Juan Intl
18,43
18,41
–69,66
–66,00
18
19
Dominican Rep.
Puerto Rico
4
5
Barahona
Kingston
18,20
17,93
–71,10
–76,78
3
3
Dominican Rep.
Jamaica
6 Aeropuerto El Embrujo 13,37 –81,35 1 Colombia
7 Aeropuerto Sesquicentenario 12,58 –81,72 1 Colombia
8 Aeropuerto Queen Beatrix 12,50 –70,01 18 Aruba
9
10
Aeropuerto Hato
Aeropuerto Flamingo
12,20
12,15
–68,96
–68,28
9
6
Netherl Antills
Netherl Antills
11
12
Manaure
Coro
11,77
11,41
–72,45
–69,66
1
16
Colombia
Venezuela
13
14
Matitas
Esc Agr Carraipia
11,25
11,22
–73,05
–72,37
20
118
Colombia
Colombia
15 Apto. Simón Bolívar 11,13 –74,23 4 Colombia
16 San Lorenzo 11,07 –74,03 4 Colombia
17 Aeropuerto Ernesto Cortissoz 10,88 –75,30 14 Colombia
18
19
Maiquetía Apto. S. Bolívar
Aeropuerto Rafael Núñez
10,60
10,45
–66,98
–75,52
43
2
Venezuela
Colombia
20
21
22
23
Maturín
San Bernardo D.
Aeropuerto Rafael Barvo
Lorica
9,75
9,37
9,33
9,27
–63,18
–75,97
–75,26
–75,82
65
22
166
30
Venezuela
Colombia
Colombia
Colombia
24 Aeropuerto Las Flores 9,07 –73,98 34 Colombia
25 Tocumen 9,05 –79,36 45 Panamá
26 Guanare 9,01 –69,73 163 Venezuela
27
28
Marcos A. Gelabert
El Salado
8,98
8,92
–79,55
–75,58
13
40
Panamá
Colombia
29
30
31
32
David
Aeropuerto Camilo Daza
San Fernando de Apore
Aeropuerto Arauca
8,40
7,93
7,90
7,06
–82,41
–72,52
–67,41
–71,22
29
250
47
128
Panamá
Colombia
Venezuela
Colombia
33 Aeropuerto Otu 7,03 –75,20 630 Colombia
34 Aeropuerto Yariguíes 7,02 –73,80 126 Colombia
198
J.D. PABÓN AND J. DORADO
ID Station name Latitud LongitudeAltitude
(m.s.n.m.)Country
35 El Cucharo 6,87 –73,37 975 Colombia
36 Tulio Ospina 6,53 –75,92 1438 Colombia
37 Aeropuerto Olaya Herrera 6,37 –75,97 1490 Colombia
38 Panamericana 6,22 –77,40 4 Colombia
39 Aeropuerto Puerto Carreño 6,18 –67,48 50 Colombia
40
41
Tuparros Boca Torno
Surbata Bonza
6,05
5,82
–67,52
–73,07
250
2485
Colombia
Colombia
42
43
U.P.T.C.
Isla del Santuario
5,57
5,47
–73,22
–73,73
2690
2580
Colombia
Colombia
44 Aeropuerto Matecaña 5,37 –77,08 53 Colombia
45 Aeropuerto El Carano 5,12 –77,08 53 Colombia
46 La Camelia 5,08 –76,45 1670 Colombia
47
48
Aeropuerto La Nubia
Aeropuerto El Edén
5,03
4,78
–75,47
–76,28
20,80
1204
Colombia
Colombia
49
50
Tibaitatá
Las Gaviotas
4,70
4,55
–74,22
–70,93
2543
171
Colombia
Colombia
51
52
Centro Ad. La Unión
El Salto
4,53
4,47
–76,05
–74,77
920
450
Colombia
Colombia
53 Aeropuerto Santiago Villa 4,28 –75,33 266 Colombia
54 Aeropuerto El Dorado 4,12 –74,15 2547 Colombia
55 Aeropuerto Farfán 4,02 –76,37 955 Colombia
56
57
Palmira ICA
Aeropuerto Buenaventura
3,87
3,85
–76,53
–76,97
975
14
Colombia
Colombia
58
59
60
61
Aeropuerto Benito Salas
Aeropuerto Alfonso Bonilla
Vista Hermosa
Bonanza
3,62
3,55
3,03
2,95
–75,50
–76,38
–73,73
–77,88
439
961
325
10
Colombia
Colombia
Colombia
Colombia
62 Aeropuerto G. L. Valencia 2,43 –76,58 1730 Colombia
63 La Sierra 2,37 –77,37 1870 Colombia
64 La Macarena 2,30 –73,13 350 Colombia
65
66
Paleterá
Aeropuerto Antonio Nariño
2,08
1,67
–76,05
–77,47
2900
1796
Colombia
Colombia
67
68
69
70
Aeropuerto San Luis
Aeropuerto Artunduaga
Obonuco
Valparaiso
1,42
1,36
1,30
1,15
–78,13
–75,32
–77,05
–75,42
2961
244
2710
270
Colombia
Colombia
Colombia
Colombia
Pabon, 2000; Giannini et al., 2000; Chang &Stephenson, 2000; Chang & Taylor, 2002; Taylor et
al., 2002; Poveda, 2004, Nobre et al., 2006), espe-cially the associated to ENSO, with purpose to im-prove seasonal-interannual climate prediction. TheISV of precipitation have been less studied, howeversome attempts have been carried out by Poveda et al.(2002), who analyzed the daily cycle of precipitationof ColombianAndes and found a significant relation-ship betweenMJO and daily precipitation, such as be-tween MJO and amplitude of daily cycle. Pabón(2007), explored ISV using decadal (ten daysamounts) precipitation data for different regions ofColombia and found 20-25 and 50-70 days periodicalcomponents; searching the relationship of the ana-lyzed times series withMJO it was found a low corre-spondence because the presence of other mode of ISVdifferent to MJO mode. These works show the evi-dences of ISVmodes in climate of the region.
Taking in account the state of knowledge aboutthe ISV and the regional importance for improvingclimate prediction and to strength the disaster pre-vention systems, especially in the component relatedto heavy rainfall, this paper try to analyze in more de-tail the characteristics of ISV of precipitation innorthern South America and Caribbean region.
2. Data and methodology
For the analysis in the current study as basic datawas used daily precipitation for the 1978-2004 pe-riod from meteorological stations distributed overnorthern South America and Caribbean region as
showed in Figure 1 (the 75 are listed in Table 1). Se-lection of the meteorological stations was doneconsidering criteria as representativeness of a givenregion, length of record period at least 20 years andminimal gaps in data series. Considering the com-plex topography over Colombian territory that gen-erates a rich climate diversity, it was necessary toinclude a relatively high density of the network forthis region.
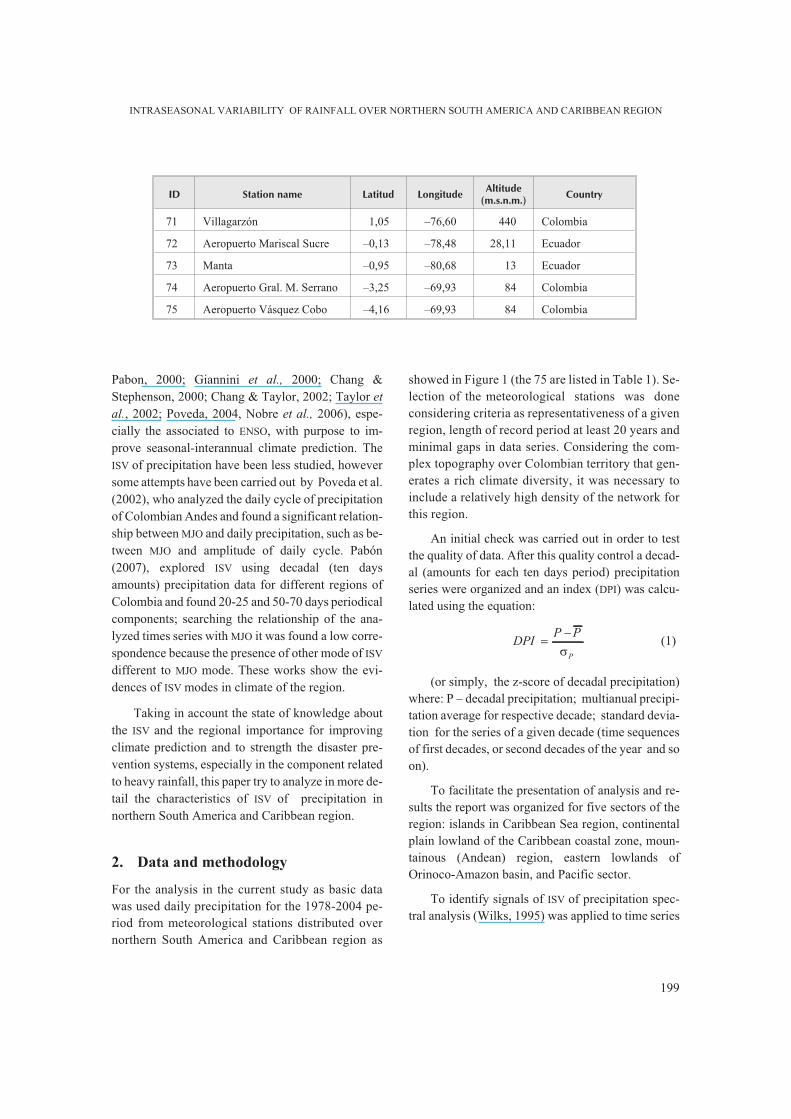
An initial check was carried out in order to testthe quality of data. After this quality control a decad-al (amounts for each ten days period) precipitationseries were organized and an index (DPI) was calcu-lated using the equation:
DPIP P
P
=
-
s
(1)
(or simply, the z-score of decadal precipitation)where: P – decadal precipitation; multianual precipi-tation average for respective decade; standard devia-tion for the series of a given decade (time sequencesof first decades, or second decades of the year and soon).
To facilitate the presentation of analysis and re-sults the report was organized for five sectors of theregion: islands in Caribbean Sea region, continentalplain lowland of the Caribbean coastal zone, moun-tainous (Andean) region, eastern lowlands ofOrinoco-Amazon basin, and Pacific sector.
To identify signals of ISV of precipitation spec-tral analysis (Wilks, 1995) was applied to time series
INTRASEASONAL VARIABILITY OF RAINFALL OVER NORTHERN SOUTH AMERICA AND CARIBBEAN REGION
199
ID Station name Latitud LongitudeAltitude
(m.s.n.m.)Country
71 Villagarzón 1,05 –76,60 440 Colombia
72 Aeropuerto Mariscal Sucre –0,13 –78,48 28,11 Ecuador
73 Manta –0,95 –80,68 13 Ecuador
74 Aeropuerto Gral. M. Serrano –3,25 –69,93 84 Colombia
75 Aeropuerto Vásquez Cobo –4,16 –69,93 84 Colombia

200
J.D. PABÓN AND J. DORADO
Estación San Juan
(Puerto Rico)
-2
-1
0
1
2
YEARS (In decadal resolution)
Estación Manaure(Colombia)
-2
-1
0
1
2
d
Estación Apto La Nubia
(Colombia)
-2
-1
0
1
2
Estación Maturin(Venezuela)
-2
-1
0
1
2
2
d
Estación Apto Buenaventura
(Colombia)
-2
-1
0
1
2
d
2004
1996
1997
1998
1999
2000
2001
2002
2003
2004
1996
1997
1999
1998
2000
2001
2002
2003
Decadalprecipitationindex
YEARS (In decadal resolution)
Decadalprecipitationindex
2004
1996
1997
1999
1998
2000
2001
2002
2003
YEARS (In decadal resolution)
YEARS (In decadal resolution)
YEARS (In decadal resolution)
Decadalprecipitationindex
Decadalprecipitationindex
Decadalprecipitationindex
2004
1996
1997
1999
1998
2000
2001
2002
2003
2004
1996
1997
1998
2000
2001
2002
Figure 2: Intraseasonal fluctuations of DPI.

INTRASEASONAL VARIABILITY OF RAINFALL OVER NORTHERN SOUTH AMERICA AND CARIBBEAN REGION
201
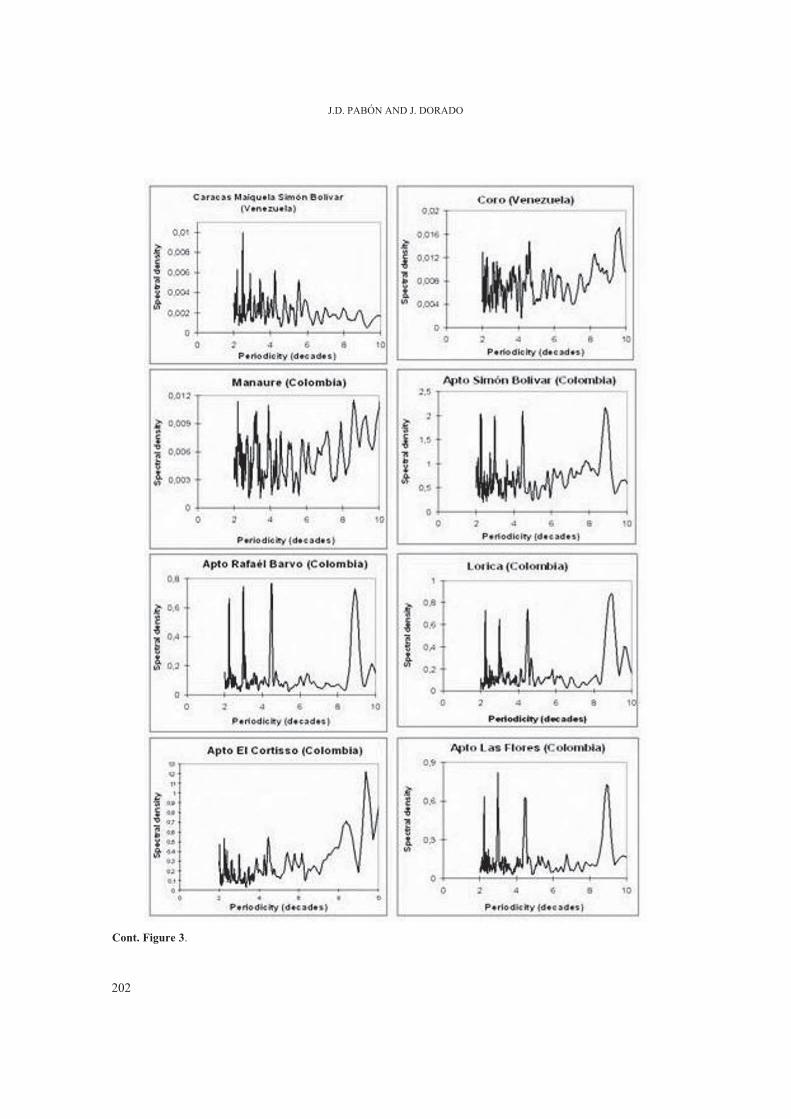
Figure 3. Spectral density for DPI of stations located on the islands (left) and coastal sector (right) of Caribbean region.
202
J.D. PABÓN AND J. DORADO
Cont. Figure 3.

of DPI using commercial software that calculates thespectral density.
Considering that Madden-Julian Oscillation in-duces the most outstanding signal of ISV in the trop-ics, an attempt to associate the regional ISV ofprecipitation with MJO was done; therefore the Mad-den-Julian Index (MJI) for 120 and 40°W was com-pared with DPI series. For that, DPI was smoothedusing moving averages to filtrate high frequencymodes. MJI data was taken from NOAA/NCEP/CPCWeb page (see http://www.cpc.ncep.noaa.gov/prod-
ucts/precip/CWlink/daily_mjo_index/details.shtml)
Finally, correlation coefficients forMJI and orig-inal and smoothed DPI were calculated.
3. Analysis and discussion
Figure 2 shows the 3-points (30 days) moving aver-ages of DPI for five stations (one for each delimitedsector) in the region; this presentation visualizes theintraseasonal fluctuations of DPI. The MJI for 120and 40°W is also presented to compare with DPI se-ries.
The lines that correspond to MJI over both 120and 40°W has similar fluctuations with a noticeabledelay caused by the eastward propagation of MJO,however in 1997-1998 (during strong El Niño event)this concordance was disrupted. It is possible to ob-serve also that during El Niño events (1997-1998 and2002-2003 in the analyzed period) the MJI tends tohave the lowest values, while during cold events LaNiña (1996, 1999-2000, and 2003-2004) the highestvalues are presented.
At first glance, in the Figure 2 it is possible to ob-serve too, that some extreme events of DPI aresynchronic in different regions in spite they differ bytheir magnitude. Comparing DPI and MJI evolution isnot possible to identify any pattern of correlation be-cause in some periods they are in the same phase, andin times are in counter phase. However, a correspon-dence may be detected for extreme rainfall events:maximums values of DPI are associated with mini-mum of MJI; at least the most outstanding rainfall
(heavy rainfall) events are associated to low values ofMJI.
The figures 3-5 present spectra of several sta-tions of the regions analyzed in this paper (due tolimitation of space, is not possible to present thespectra for all 78 stations). Also, it is necessary toconsider that in these graphics the periods less than2 decades (20 days) are not observed, because 2 de-cades coincide with 0.5 frequency (Niquist fre-quency), under which is not possible to representthe spectrum.
The analysis of Figure 3 (left side) shows that forEast and Central Caribbean region the graphics aresimilar: all spectra have peaks at 20, 30, 45 and 60days period. In the Western sector ( Aeropuerto ElEmbrujo–Providence Island, and AeropuertoSesquicentenario – San Andres Island) these peaksare not marked and just the 20, 30 and 60 days periodare slightly noticeable. In several spectra peaks arepresented even over 80-90-days period, however thisinterval approaches to seasonal scale. The spectraover Caribbean coastal sector (Figure 3, right) showalso peaks at 20, 30, and 45-days period, but the sig-nal over 60-days period is very weak or is missing.
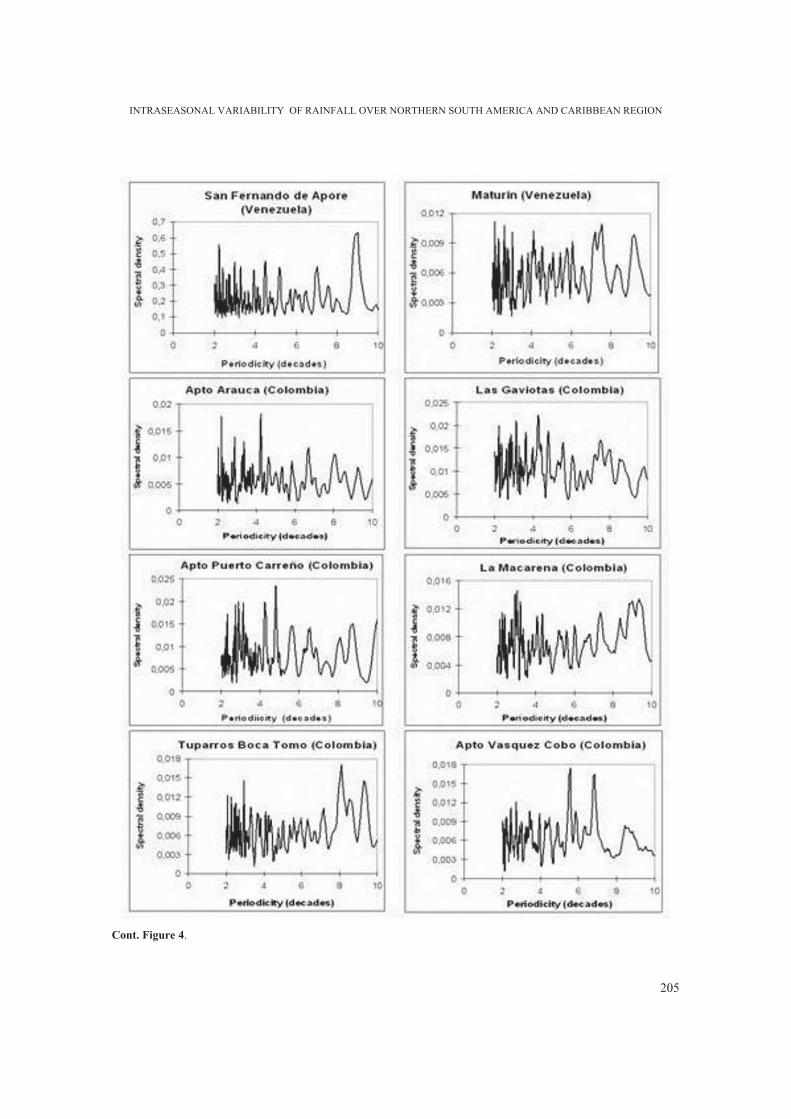
In the mountainous sector of the region (Figure4) there are some places were spectra did not pre-sented an outstanding signal or the signals are weak(Airport La Nubia, Airport A Nariño and Obonuco inPasto, Colombia), however many of them (AirportCamilo Daza – Cúcuta, UPTC and Eldorado, also inColombia) have the 20, 30, and 45-days periods arewell defined
The Figure 4 (right side) shows spectra for mete-orological stations of the eastern lowlands ofOrinoco and Amazon basin. These spectra in the sec-tor of intraseasonal frequencies are very noisy and itis difficult to identify clearly defined peaks at a givenperiod.
The same situation occurs in several places in thePacific sector (Figure 5), however there are pointslike Tocumen (Panama), Panamericana and Bonanza(Colombia) and Manta (Ecuador) where peaksoutstand over 20-25, 30 and 45-days period. Also, a
INTRASEASONAL VARIABILITY OF RAINFALL OVER NORTHERN SOUTH AMERICA AND CARIBBEAN REGION
203

204
J.D. PABÓN AND J. DORADO
Figure 4. Same as Figure 3, but for the stations located on Andean (left) and eastern plain (right) zone region.
INTRASEASONAL VARIABILITY OF RAINFALL OVER NORTHERN SOUTH AMERICA AND CARIBBEAN REGION
205
Cont. Figure 4.
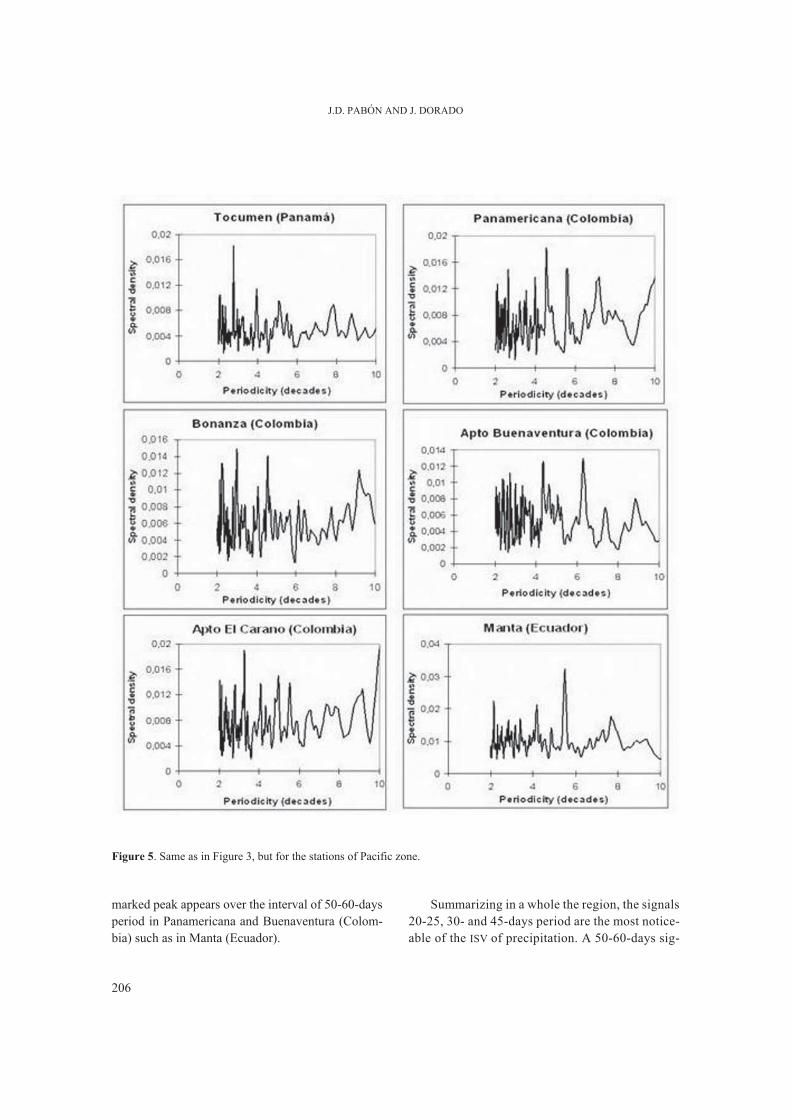
marked peak appears over the interval of 50-60-daysperiod in Panamericana and Buenaventura (Colom-bia) such as in Manta (Ecuador).
Summarizing in a whole the region, the signals20-25, 30- and 45-days period are the most notice-able of the ISV of precipitation. A 50-60-days sig-
206
J.D. PABÓN AND J. DORADO
Figure 5. Same as in Figure 3, but for the stations of Pacific zone.
INTRASEASONAL VARIABILITY OF RAINFALL OVER NORTHERN SOUTH AMERICA AND CARIBBEAN REGION
207
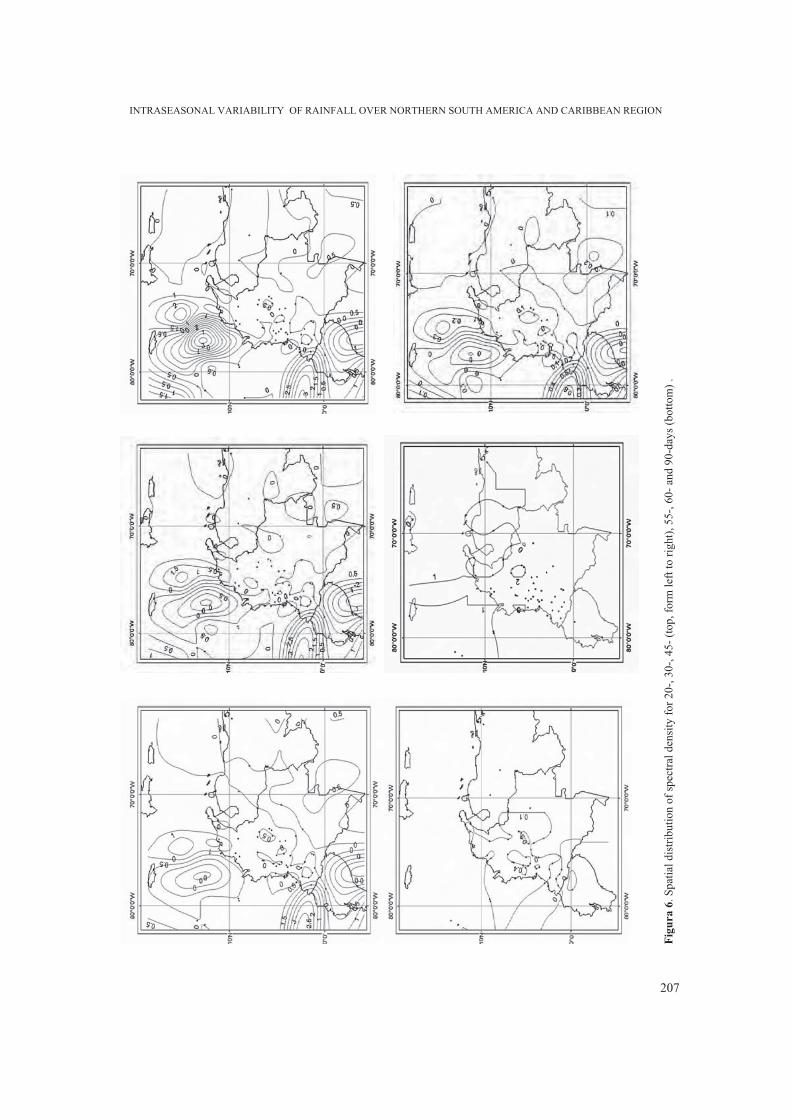
Figura6.Spatialdistributionofspectraldensityfor20-,30-,45-(top,formlefttoright),55-,60-and90-days(bottom).
208
J.D. PABÓN AND J. DORADO
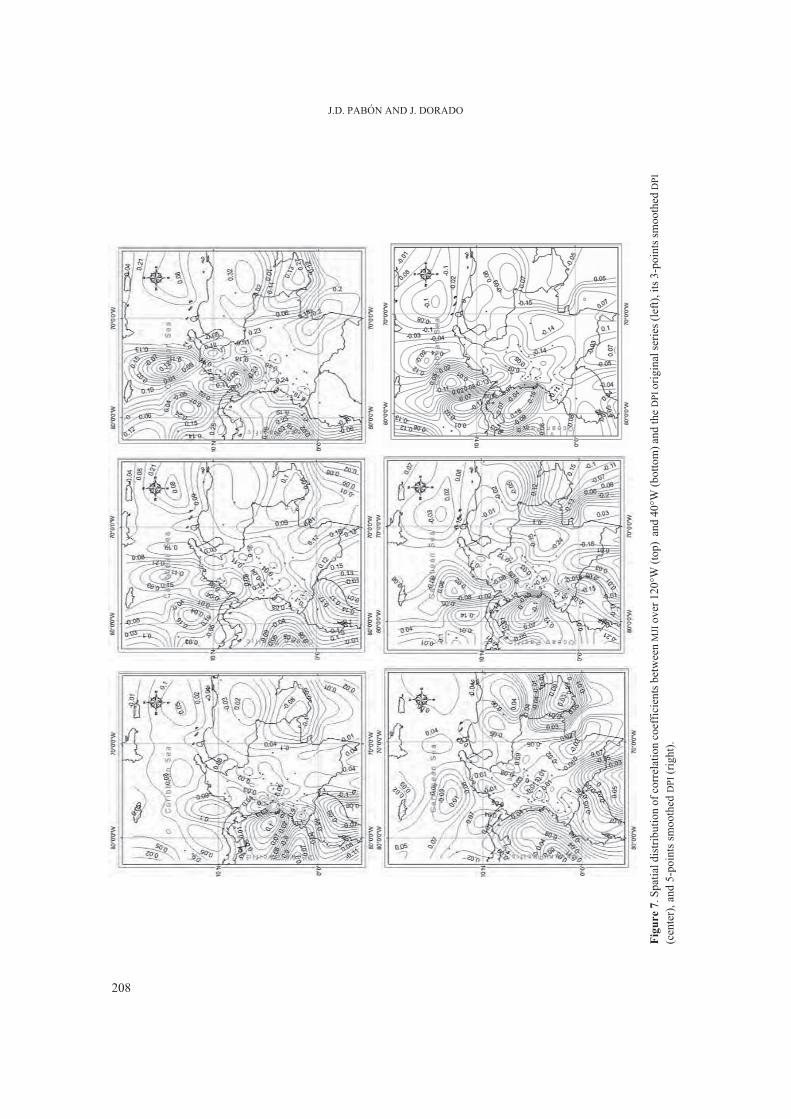
Figure7.SpatialdistributionofcorrelationcoefficientsbetweenMJIover120°W(top)and40°W
(bottom)andtheDPIoriginalseries(left),its3-pointssmoothedDPI
(center),and5-pointssmoothedDPI(right).
nal appears clearly in the Caribbean region, but isnot important in others regions.
The maps presented in Figure 6 show the spatialdistribution of spectral density of 20-, 30-, and45-days signals. It is possible to conclude that in spitethe 20-days signal is observed in all region, the majorspectral density is observed over Western Caribbeanand southwestern sector (Ecuador and Pacificocean). For 30- and 45-days signals there is a similardistribution.
The relationship between DPI and MJI was ex-plored calculating the correlation coefficients.These coefficients are very low when the correla-tion is calculated for original (not smoothed) DPItime series, and increase as the high frequencymodes are smoothing by moving averages. Thisfact suggests that the high frequency of ISV of re-gional precipitation is controlled by processes dif-ferent from MJO. The spatial distribution ofcorrelation coefficients are presented in Figure 7.
4. Conclusions
The analysis made above shows that in the ISV ofprecipitation over Northern South America andCaribbean region there are signals with 20, 30, 45and 60-days period. The three first are persistentlyobserved in all the zones of the analyzed region,while the last is observed only in both the Carib-bean islands and some places of Pacific sector.
Searching the relationship between intraseasonalvariability of regional precipitation and Mad-den-Julian Oscillation it did not find a defined associ-ation pattern and even the correlation coefficientsbetweenMJI and DPIwere very low; however, was es-tablished that the heavy rainfall events are associatedwith low values of MJI.
The low values of correlation coefficients andtheir increasing with smoothing of DPI suggest thatthe regional ISV is controlled not only by MJO. It isnecessary to explore the nature of high frequency(20-days, for example) modes.
Acknowledgments
This paper partially reports the results of the researchproject “Analysis of colombian climate variabilitygenerated by processes different from El Niño-LaNiña-Southern Oscillation cycle” supported by bothColciencias (Colombian research support agency;grant No. 1118-05-16900, RC 178-2004) and Re-search Division of National University of Colombia(project numbers DIB-20100004448 (805253) and
DIB-20101004929).
References
Alfaro, E., Cid, L. & Enfield, D. (1998). Relacionesentre el inicio y el término de la estación lluviosaen Centroamérica y los Océanos Pacífico yAtlántico Tropical. Revista de Investigaciones
Marinas 26, 59-69.
Baldwin M.P., Gray L.J., Dunkerton T. J., HamiltonK., Haynes P. H., Randel W. J., Holton J. R., Al-exander M. J., Hirota I., T. Horinouchi T., JonesD. B. A., Kinnersley J. S., Marquardt C., Sato K.,Takahashi M., 2001: The Quasi-Biennial Oscilla-tion. Reviews of Geophysicis, 39,2, pp. 179-229
Bantzer C H., Wallace J M., 1996: IntraseasonalVariability in Tropical Mean Temperature andPrecipitation and their Relation to the Tropical40-50 Day Oscillation. J. of Atmos. Sc., v. 53,No. 21 (Nov ), pp. 3032-3045.
BarlowM., Wheeler M., Lyon B., Cullen H., 2005:Modulation of Daily Precipitation over South-west Asia by the Madden–Julian OscillationMonthly Wea. Review, 133 pp3579-3594.
Bond N.A., Vecchi G.A., 2003: The Influence of theMadden-Julian oscillation on precipitation inOregon and Washington. Wea. Forecasting, v.18, pp. 600-613.
Coaps, 2006: A Comprehensive Bibliography OnThe El Nino Phenomena, Center for Ocean-At-mospheric Prediction Studies (COAPS), FloridaState University, URL: http://www.coaps.
INTRASEASONAL VARIABILITY OF RAINFALL OVER NORTHERN SOUTH AMERICA AND CARIBBEAN REGION
209

fsu.edu/lib/biblio/enso-bib-intro.html (Accesedat december 2006).
Chen A.A., Stephenson T.S., 2000: Analyzing andUnderstanding Climate Variability in the Carib-bean Islands. University of the West Indies,Kingston 7, Jamaica.
Chen, A. A., and M.Taylor, 2002: Investigating thelink between early season Caribbean rainfall andthe El Niño+1 year. Int. J. Climatology, v. 22 (1),pp.87-106.
Enfield, D. B., 1996: Relationships of inter-Ameri-can rainfall to tropical Atlantic and Pacific SSTvariability. Geophys. Res. Letters. 23,3305-3308.
Enfield, D. & Alfaro, E. (1999). The dependence ofCaribbean rainfall on the interaction of the tropi-cal Atlantic and Pacific Oceans. Journal of Cli-
mate 12, 2093-2103.
Garreaud R.D., 2000: Intraseasonal Variability ofMoisture and Rainfall over the South AmericanAltiplano. Monthly Wea. Rev., 128, pp.337-3346.
Giannini, A., Y. Kushnir Y., Cane M.A., 2000:Interannual Variability of Caribbean Rainfall,ENSO, and the Atlantic Ocean. Journal of Cli-
mate, 13, pp. 297–311.
Goswami, B. N., and R. S. A. Mohan, 2001:Intraseasonal oscillations and interannual vari-ability of the Indian summer monsoon. J.Cli-
mate, 14, 1180–1198.
Hastenrath, S., 1976: Variations in low-latitude cir-culation and extreme climatic events in the tropi-cal Americas. J. Atmos. Sci., 33, 202-215.
Hastenrath S.,1996: Climate Dynamics of the Trop-ics. Updated Edition from Climate and Circula-tion of the Tropics. Atmospheric SciencesLibrary. Kluwer Academic Publishers.Dordrecht, Netherlands, 488 p.
Hendon H.H., LiebmannB., NewmanM., Glick J.D.,2000: Mediu-range Forecast Errors Associated
with Actives Episodes of the Madden-Julian Os-cillation. Mon. Wea. Review, v. 128, pp. 69-86.
Janicot S., Sultan B., 2001: Intra-seasonal modula-tion of convection in theWest African monsoon.Geophys. Res. Lett., 28, 523–526.
Jones C., Carvalho L.M.V., Higgins R.W., WaliserD.E., Schem J.K.E., 2004a: Climatology ofTropical Intraseasonal Convective Anomalies:1979-2002. J. of Climate, v. 17, pp. 523-539.
Jones, C., and Schemm J.-K. E., 2000: The influenceof intraseasonal variations on medium-rangeweather forecasts over South America. Mon.
Wea. Rev., 128, 486–494.
Jones C., Waliser D.E., Lau K.M., Stern W., 2004b:Global Occurrence of Extreme Precipitation andMadden-Julian Oscillation: Observations andPredictability. J. of Climate, v. 7, pp. 4575-4589.
Jones C., Waliser D.E., Lau K.M., Stern W., 2004c:The Madden–Julian Oscillation and Its Impacton Northern HemisphereWeather Predictability.Mon. Wea. Rev., 115, pp. 1462–1471.
Kayano M.T., Kousky V.E., 1999: Intraseasonal(30–60 day) variability in the global tropics:principal modes and their evolution. Tellus, 51A,pp. 373-376.
Knutson, T. R., and K. M. Weickmann, 1987: 30–60day atmospheric oscillations: Composite life cy-cles of convection and circulation anomalies.Mon. Wea. Rev., 115, pp. 1407–1436.
Krishnamurti V., Shukla J., 2000: Intraseasonal andinteranual variability of rainfall over India. J. ofClimate, v. 13, pp. 4366-4377.
Krishnamurti V., Shukla J., 2007: Intraseasonal andSeasonally Persisting Patterns of Indian Mon-soon Rainfall. J. of Climate, v. 20, pp. 3-20.
Liebmann B., H. H. Hendon, and J. D. Glick, 1994:The relationship between tropical cyclones ofthe western Pacific and Indian Oceans and theMadden–Julian oscillation. J. Meteor. Soc. Ja-
pan, 72, 401–411.
210
MEHMET C. DEMIREL, ERCAN KAHYA AND DIEGO RIVERA

Madden R.A., Julian P.R., 1994: Observations of the40-50-day tropical oscillation — a review.Mon.
Weather Rev., v. 122, No. 5, pp. 814-837.
Maloney E.D., Hartmann D.L., 2000a: Modulationof hurricane activity in the Gulf of Mexico by theMadden–Julian oscilllation. Science, 287, Issue5460, pp. 2002–2004.
Maloney E.D., Hartmann D.L., 2000b: Modulationof Eastern North Pacific Hurricanes by the Mad-den-Julian Oscillation. J. of Climate, v. 13, No.9, pp. 1451-1460.
Meehl G.A., 1997: The South Asian monsoon andthe tropospheric biennial oscillation (TBO). J.
Climate, 10, p. 1921–1943.
Misra V., 2005: Simulation of the Intraseasonal Vari-ance of the South American Summer Monsoon.,Monthly Wea. Rev., 133, pp. 663-676.
Montealegre J.E., Pabón J.D., 2000: La variabilidadclimática interanual asociada al ciclo El Niño-LaNiña-Oscilación del Sur y su efecto en el patrónpluviométrico de Colombia. Meteorología
Colombiana, Nº 2, pp. 7-21.
Mounier, F., and S. Janicot (2004), Evidence of twoindependent modes of convection atintraseasonal timescale in theWest African sum-mer monsoon, Geophys. Res. Lett., 31, L16116,doi:10.1029/2004GL020665.
Nobre P., Marengo J.A., Calvacanti I.F.A., ObregónG., Barros V., Camilloni I., Campos N., FerreiraA.G., 2006: Seasonal-to-Decadal Predictabilityand Prediction of South American Climate. J. of
Climate, 19, pp. 5988-6004.
Nogués-Paegle, J., L. A. Byerle, and K. Mo, 2000:Intraseasonal modulation of South Americansummer precipitation. Mon. Wea. Rev., 128,
837–850.
Pabón J.D., Montealegre J.E., 1992: Interrelaciónentre el ENOS y la precipitación en elnoroccidente de Suramérica. Boletín ERFEN,No. 31, p. 12.
Pabón J.D., 2007: Improving Climate PredictionSchemes With Intraseasonal Variability: A KeyTool Toward Hydrometeorological DisastersReduction in Tropical America. In Proceedingsof International Roundtable Meeting on Lessonsfrom Natural Disasters Policy Issues and Mitiga-tion Strategies (Vellore, India, 8 – 12 January2007), 10 p.
Peel M.C., McMahon ., T.A., Finlayson B.L, 2002:Variability of Annual Precipitation and Its Rela-tionship to El Niño-Southern Oscillation. J. of
Climate, 15 (6), pp. 545-551.
Petersen W.A., Nesbitt S.W., Blaskeslee R.J., CifelliR., Hein P., Rutledge S.A., 2002: TRMMObser-vations of Intraseasonal Variability in Convec-tive Regimes over the Amazon. J. of Climate, 15,pp.1278-1294.
Philander S.G.H., 1990: El Niño, La Niña andSouthern Oscillation. Academic Press, 291p
Poveda G.,MesaO., Agudelo P., Álvarez J., Arias P.,Moreno H., Salazar L., Toro V., Vieira S., 2002:Influencia de ENSO, oscilación Madden-Julian,ondas del Este, huracanes y fases de la Luna en elciclo diurno de la precipitación en los AndesTropicales de Colombia. Meteorología
Colombiana. No. 5, pp.3-12.
Poveda G., 2004: La hidroclimatología de Colombia:una síntesis desde la escala inter-decadal hasta laescala diurna. Rev. Acad. Colomb. Cien., 28(107): 201-222.
Ropelewski, C. F., and M. S. Halpert, 1986: NorthAmerican precipitation and temperature pat-terns associated with the El Niño/Southern Os-cillation (ENSO). Mon. Wea. Rev., 114,
2352–2362.
Ropelewski C.F., Halpert M.S., 1987: Global and re-gional scale precipitation patterns associatedwith the El Niño/Southern Oscillation. Mon.
Wea. Rev., 115, pp. 1606-1626.
Ropelewski C.F., Halpert M.S., X. Wang 1992: Ob-served Tropospheric Biennial Variability and its
INTRASEASONAL VARIABILITY OF RAINFALL OVER NORTHERN SOUTH AMERICA AND CARIBBEAN REGION
211
Relationship to the Southern Oscillation. J. of
Climate, 5 (6), pp. 594-614.
Sultan B., Janicot S., Diedhiou A., 2003: The WestAfrican monsoon dynamics. Part I: Documenta-tion of intraseasonal variability. J. of Cli-
mate, 16, pp. 3389-3406.
Taylor M.A., Enfield D.B., Chen A.A:, 2002: Influ-ence of the tropical Atlantic versus the tropicalPacific on Caribbean rainfall. J. of Geoph. Res.,
v. 107, No. C9, 3127, doi:10.1029/2001JC001097, 2002
Walisser D.E., Stern W.,Schubert S., Lau K.M.,2003: Dynamic predictability of intraseasonalvariability associated with the Asian summermonsoon. Q. J. R. Meteorol. Soc., 129, pp.2897–2925.
Wang X.L., Corte-Real J., Zhang X., 1996:Intraseasonal oscillations and associated spa-tial-temporal structures of precipitation overChina. J. of Geophysicar Research, v. 101, No.D14, pp. 19035-19042.
Webster P.J., Hoyos C., 2004: Prediction of mon-soon rainfall and river discharge on 15-30-daytime scales. Bull. of the American Meteo. Soc.,v. 85, pp. 1745-1765
Wilks D.s., 1995: Statistical Methods in Atmo-spheric Sciences. Academic Press. San Diego.467 p.
Ye H., Cho H.-R., 2001: Spatial and temporal char-acteristics of intraseasonal oscillations of pre-cipitation over the United States. Theoretical
and Applied Climatology. v.68, pp. 51-66.
212
J.D. PABÓN AND J. DORADO