SLA-11 To configure the Simple Network Management ... - Cisco
84
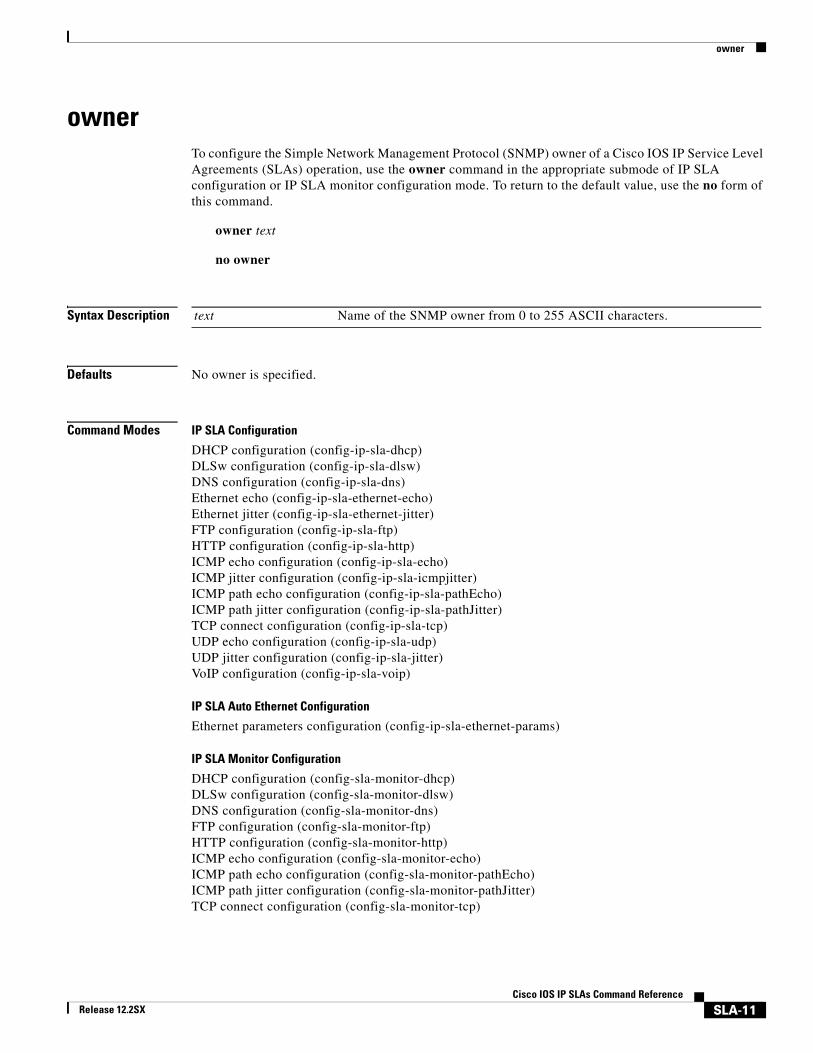
owner SLA-11 Cisco IOS IP SLAs Command Reference Release 12.2SX owner To configure the Simple Network Management Protocol (SNMP) owner of a Cisco IOS IP Service Level Agreements (SLAs) operation, use the owner command in the appropriate submode of IP SLA configuration or IP SLA monitor configuration mode. To return to the default value, use the no form of this command. owner text no owner Syntax Description Defaults No owner is specified. Command Modes IP SLA Configuration DHCP configuration (config-ip-sla-dhcp) DLSw configuration (config-ip-sla-dlsw) DNS configuration (config-ip-sla-dns) Ethernet echo (config-ip-sla-ethernet-echo) Ethernet jitter (config-ip-sla-ethernet-jitter) FTP configuration (config-ip-sla-ftp) HTTP configuration (config-ip-sla-http) ICMP echo configuration (config-ip-sla-echo) ICMP jitter configuration (config-ip-sla-icmpjitter) ICMP path echo configuration (config-ip-sla-pathEcho) ICMP path jitter configuration (config-ip-sla-pathJitter) TCP connect configuration (config-ip-sla-tcp) UDP echo configuration (config-ip-sla-udp) UDP jitter configuration (config-ip-sla-jitter) VoIP configuration (config-ip-sla-voip) IP SLA Auto Ethernet Configuration Ethernet parameters configuration (config-ip-sla-ethernet-params) IP SLA Monitor Configuration DHCP configuration (config-sla-monitor-dhcp) DLSw configuration (config-sla-monitor-dlsw) DNS configuration (config-sla-monitor-dns) FTP configuration (config-sla-monitor-ftp) HTTP configuration (config-sla-monitor-http) ICMP echo configuration (config-sla-monitor-echo) ICMP path echo configuration (config-sla-monitor-pathEcho) ICMP path jitter configuration (config-sla-monitor-pathJitter) TCP connect configuration (config-sla-monitor-tcp) text Name of the SNMP owner from 0 to 255 ASCII characters.
-
Upload
khangminh22 -
Category
Documents
-
view
0 -
download
0
Transcript of SLA-11 To configure the Simple Network Management ... - Cisco
owner
ownerTo configure the Simple Network Management Protocol (SNMP) owner of a Cisco IOS IP Service Level Agreements (SLAs) operation, use the owner command in the appropriate submode of IP SLA configuration or IP SLA monitor configuration mode. To return to the default value, use the no form of this command.
owner text
no owner
Syntax Description
Defaults No owner is specified.
Command Modes IP SLA Configuration
DHCP configuration (config-ip-sla-dhcp)DLSw configuration (config-ip-sla-dlsw)DNS configuration (config-ip-sla-dns)Ethernet echo (config-ip-sla-ethernet-echo)Ethernet jitter (config-ip-sla-ethernet-jitter)FTP configuration (config-ip-sla-ftp)HTTP configuration (config-ip-sla-http)ICMP echo configuration (config-ip-sla-echo)ICMP jitter configuration (config-ip-sla-icmpjitter)ICMP path echo configuration (config-ip-sla-pathEcho)ICMP path jitter configuration (config-ip-sla-pathJitter)TCP connect configuration (config-ip-sla-tcp)UDP echo configuration (config-ip-sla-udp)UDP jitter configuration (config-ip-sla-jitter)VoIP configuration (config-ip-sla-voip)
IP SLA Auto Ethernet Configuration
Ethernet parameters configuration (config-ip-sla-ethernet-params)
IP SLA Monitor Configuration
DHCP configuration (config-sla-monitor-dhcp)DLSw configuration (config-sla-monitor-dlsw)DNS configuration (config-sla-monitor-dns)FTP configuration (config-sla-monitor-ftp)HTTP configuration (config-sla-monitor-http)ICMP echo configuration (config-sla-monitor-echo)ICMP path echo configuration (config-sla-monitor-pathEcho)ICMP path jitter configuration (config-sla-monitor-pathJitter)TCP connect configuration (config-sla-monitor-tcp)
text Name of the SNMP owner from 0 to 255 ASCII characters.
SLA-11Cisco IOS IP SLAs Command Reference
Release 12.2SX

owner
UDP echo configuration (config-sla-monitor-udp)UDP jitter configuration (config-sla-monitor-jitter)VoIP configuration (config-sla-monitor-voip)
Note The configuration mode varies depending on the Cisco IOS release you are running and the operation type configured. See the “Usage Guidelines” section for more information.
Command History
Usage Guidelines The owner name contains one or more of the following: ASCII form of the network management station’s transport address, network management station name (that is, the domain name), and network management personnel’s name, location, or phone number. In some cases, the agent itself will be the owner of the operation. In these cases, the name can begin with “agent.”
IP SLAs Operation Configuration Dependence on Cisco IOS Release
The Cisco IOS command used to begin configuration for an IP SLAs operation varies depending on the Cisco IOS release you are running (see Table 9). You must configure the type of IP SLAs operation (such as User Datagram Protocol [UDP] jitter or Internet Control Message Protocol [ICMP] echo) before you can configure any of the other parameters of the operation.
The configuration mode for the owner command varies depending on the Cisco IOS release you are running (see Table 9) and the operation type configured. For example, if you are running Cisco IOS Release 12.4 and the ICMP echo operation type is configured, you would enter the owner command in ICMP echo configuration mode (config-sla-monitor-echo) within IP SLA monitor configuration mode.
Examples The following examples set the owner of IP SLAs ICMP echo operation 1 to 172.16.1.189 cwb.cisco.com User1 RTP 555-0100. Note that the Cisco IOS command used to begin configuration for an IP SLAs operation varies depending on the Cisco IOS release you are running (see Table 9).
IP SLA Configurationip sla 1icmp-echo 172.16.1.176owner 172.16.1.189 cwb.cisco.com User1 RTP 555-0100
Release Modification
11.2 This command was introduced.
12.2(33)SRA This command was integrated into Cisco IOS Release 12.2(33)SRA.
12.2(33)SRB The Ethernet echo, Ethernet jitter, and Ethernet parameters configuration modes were added.
Table 9 Command Used to Begin Configuration of an IP SLAs Operation Based on Cisco IOS
Release
Cisco IOS Release Global Configuration Command Command Mode Entered
12.4(4)T, 12.0(32)SY, 12.2(33)SRB, or later releases
ip sla IP SLA configuration
12.3(14)T, 12.4, 12.4(2)T, 12.2(31)SB2, or 12.2(33)SXH
ip sla monitor IP SLA monitor configuration
SLA-12Cisco IOS IP SLAs Command Reference
Release 12.2SX

owner
!ip sla schedule 1 life forever start-time now
IP SLA Monitor Configurationip sla monitor 1type echo protocol ipIcmpEcho 172.16.1.176owner 172.16.1.189 cwb.cisco.com User1 RTP 555-0100
!ip sla monitor schedule 1 life forever start-time now
Related Commands Command Description
ip sla Begins configuration for an IP SLAs operation and enters IP SLA configuration mode.
ip sla monitor Begins configuration for an IP SLAs operation and enters IP SLA monitor configuration mode.
SLA-13Cisco IOS IP SLAs Command Reference
Release 12.2SX

paths-of-statistics-kept
paths-of-statistics-keptTo set the number of paths for which statistics are maintained per hour for a Cisco IOS IP Service Level Agreements (SLAs) operation, use the paths-of-statistics-kept command in the appropriate submode of IP SLA configuration or IP SLA monitor configuration mode. To return to the default value, use the no form of this command.
paths-of-statistics-kept size
no paths-of-statistics-kept
Syntax Description
Defaults 5 paths
Command Modes IP SLA Configuration
ICMP path echo configuration (config-ip-sla-pathEcho)
IP SLA Monitor Configuration
ICMP path echo configuration (config-sla-monitor-pathEcho)
Note The configuration mode varies depending on the Cisco IOS release you are running and the operation type configured. See the “Usage Guidelines” section for more information.
Command History
Usage Guidelines A path is the route the request packet of the operation traverses through the network to get to its destination. The packet may take a different path to reach the same destination for each IP SLAs operation.
When the number of paths reaches the size specified, no further path-based information is stored.
Note This command is supported by the IP SLAs Internet Control Message Protocol (ICMP) path echo operation only.
size Number of paths for which statistics are maintained per hour. The default is 5.
Release Modification
11.2 This command was introduced.
12.2(33)SRA This command was integrated into Cisco IOS Release 12.2(33)SRA.
SLA-14Cisco IOS IP SLAs Command Reference
Release 12.2SX

paths-of-statistics-kept
For the IP SLAs ICMP path echo operation, the amount of router memory required to maintain the distribution statistics table is based on multiplying all of the values set by the following four commands:
• distributions-of-statistics-kept
• hops-of-statistics-kept
• paths-of-statistics-kept
• hours-of-statistics-kept
The general equation used to calculate the memory requirement to maintain the distribution statistics table for an ICMP path echo operation is as follows:Memory allocation = (160 bytes) * (distributions-of-statistics-kept size) * (hops-of-statistics-kept size) * (paths-of-statistics-kept size) * (hours-of-statistics-kept hours)
Note To avoid significant impact on router memory, careful consideration should be used when configuring the distributions-of-statistics-kept, hops-of-statistics-kept, paths-of-statistics-kept, and hours-of-statistics-kept commands.
IP SLAs Operation Configuration Dependence on Cisco IOS Release
The Cisco IOS command used to begin configuration for an IP SLAs operation varies depending on the Cisco IOS release you are running (see Table 10). You must configure the type of IP SLAs operation (such as User Datagram Protocol [UDP] jitter or Internet Control Message Protocol [ICMP] echo) before you can configure any of the other parameters of the operation.
The configuration mode for the paths-of-statistics-kept command varies depending on the Cisco IOS release you are running (see Table 10) and the operation type configured. For example, if you are running Cisco IOS Release 12.4 and the ICMP path echo operation type is configured, you would enter the paths-of-statistics-kept command in ICMP path echo configuration mode (config-sla-monitor-pathEcho) within IP SLA monitor configuration mode.
Examples The following examples show how to maintain statistics for only three paths for IP SLAs ICMP path echo operation 2. Note that the Cisco IOS command used to begin configuration for an IP SLAs operation varies depending on the Cisco IOS release you are running (see Table 10).
IP SLA Configurationip sla 2path-echo 172.16.1.177paths-of-statistics-kept 3
!ip sla schedule 2 life forever start-time now
Table 10 Command Used to Begin Configuration of an IP SLAs Operation Based on Cisco IOS
Release
Cisco IOS Release Global Configuration Command Command Mode Entered
12.4(4)T, 12.0(32)SY, 12.2(33)SRB, or later releases
ip sla IP SLA configuration
12.3(14)T, 12.4, 12.4(2)T, 12.2(31)SB2, or 12.2(33)SXH
ip sla monitor IP SLA monitor configuration
SLA-15Cisco IOS IP SLAs Command Reference
Release 12.2SX

paths-of-statistics-kept
IP SLA Monitor Configurationip sla monitor 2type pathEcho protocol ipIcmpEcho 172.16.1.177paths-of-statistics-kept 3
!ip sla monitor schedule 2 life forever start-time now
Related Commands Command Description
distributions-of-statistics-kept Sets the number of statistics distributions kept per hop during the lifetime of the IP SLAs operation.
hops-of-statistics-kept Sets the number of hops for which statistics are maintained per path for the IP SLAs operation.
hours-of-statistics-kept Sets the number of hours for which statistics are maintained for the IP SLAs operation.
ip sla Begins configuration for an IP SLAs operation and enters IP SLA configuration mode.
ip sla monitor Begins configuration for an IP SLAs operation and enters IP SLA monitor configuration mode.
statistics-distribution-interval Sets the time interval for each statistics distribution kept for the IP SLAs operation.
SLA-16Cisco IOS IP SLAs Command Reference
Release 12.2SX

reply-dscp-bits
reply-dscp-bitsTo specify the differentiated services codepoint (DSCP) value for an echo reply packet of a Cisco IOS IP Service Level Agreements (SLAs) label switched path (LSP) Health Monitor operation, use the reply-dscp-bits command in auto IP SLA MPLS parameters configuration mode. To return to the default value, use the no form of this command.
reply-dscp-bits dscp-value
no reply-dscp-bits dscp-value
Syntax Description
Command Default The DSCP value is 0.
Command Modes Auto IP SLA MPLS parameters configuration (config-auto-ip-sla-mpls-params)
Command History
Usage Guidelines You must configure the type of LSP Health Monitor operation (such as LSP ping) before you can configure any of the other parameters of the operation.
Examples The following example shows how to configure operation parameters, proactive threshold monitoring, and scheduling options using the LSP Health Monitor. In this example, LSP Health Monitor operation 1 is configured to automatically create IP SLAs LSP ping operations for all Border Gateway Protocol (BGP) next hop neighbors in use by all VPN routing and forwarding (VRF) instances associated with the source Provider Edge (PE) router. The DSCP value for the echo reply packets of IP SLAs operations created by LSP Health Monitor operation 1 is set to 5.
mpls discovery vpn interval 60mpls discovery vpn next-hop!auto ip sla mpls-lsp-monitor 1type echo ipsla-vrf-alltimeout 1000scan-interval 1secondary-frequency connection-loss 10
dscp-value Specifies the differentiated services codepoint (DSCP) value for an echo reply packet.
Release Modification
12.2(27)SBC This command was introduced.
12.4(6)T This command was integrated into Cisco IOS Release 12.4(6)T.
12.2(33)SRA This command was integrated into Cisco IOS Release 12.2(33)SRA.
12.0(32)SY This command was integrated into Cisco IOS Release 12.0(32)SY.
12.2(31)SB2 This command was integrated into Cisco IOS Release 12.2(31)SB2.
12.2(33)SXH This command was integrated into Cisco IOS Release 12.2(33)SXH.
SLA-17Cisco IOS IP SLAs Command Reference
Release 12.2SX

reply-dscp-bits
secondary-frequency timeout 10delete-scan-factor 2reply-dscp-bits 5
!auto ip sla mpls-lsp-monitor reaction-configuration 1 react connectionLoss threshold-type consecutive 3 action-type trapOnlyauto ip sla mpls-lsp-monitor reaction-configuration 1 react timeout threshold-type consecutive 3 action-type trapOnlyip sla logging traps!auto ip sla mpls-lsp-monitor schedule 1 schedule-period 60 start-time now
Related Commands Command Description
auto ip sla mpls-lsp-monitor
Begins configuration for an IP SLAs LSP Health Monitor operation and enters auto IP SLA MPLS configuration mode.
SLA-18Cisco IOS IP SLAs Command Reference
Release 12.2SX

reply-mode
reply-modeTo specify the reply mode for an echo request packet of a Cisco IOS IP Service Level Agreements (SLAs) label switched path (LSP) Health Monitor operation, use the reply-mode command in auto IP SLA MPLS parameters configuration mode. To return to the default value, use the no form of this command.
reply-mode {ipv4 | router-alert}
no reply-mode {ipv4 | router-alert}
Syntax Description
Command Default The reply mode for an echo request packet is an IPv4 UDP packet by default.
Command Modes Auto IP SLA MPLS parameters configuration (config-auto-ip-sla-mpls-params)
Command History
Usage Guidelines You must configure the type of LSP Health Monitor operation (such as LSP ping) before you can configure any of the other parameters of the operation.
Examples The following example shows how to configure operation parameters, proactive threshold monitoring, and scheduling options using the LSP Health Monitor. In this example, LSP Health Monitor operation 1 is configured to automatically create IP SLAs LSP ping operations for all Border Gateway Protocol (BGP) next hop neighbors in use by all VPN routing and forwarding (VRF) instances associated with the source Provider Edge (PE) router. The reply mode of an echo request packet for IP SLAs operations created by LSP Health Monitor operation 1 is an IPv4 UDP packet with router alert.
mpls discovery vpn interval 60mpls discovery vpn next-hop!auto ip sla mpls-lsp-monitor 1type echo ipsla-vrf-alltimeout 1000scan-interval 1
ipv4 Replies with an IPv4 User Datagram Protocol (UDP) packet (default).
router-alert Replies with an IPv4 UDP packet with router alert.
Release Modification
12.2(27)SBC This command was introduced.
12.4(6)T This command was integrated into Cisco IOS Release 12.4(6)T.
12.2(33)SRA This command was integrated into Cisco IOS Release 12.2(33)SRA.
12.0(32)SY This command was integrated into Cisco IOS Release 12.0(32)SY.
12.2(31)SB2 This command was integrated into Cisco IOS Release 12.2(31)SB2.
12.2(33)SXH This command was integrated into Cisco IOS Release 12.2(33)SXH.
SLA-19Cisco IOS IP SLAs Command Reference
Release 12.2SX

reply-mode
secondary-frequency connection-loss 10secondary-frequency timeout 10delete-scan-factor 2reply-mode router-alert
!auto ip sla mpls-lsp-monitor reaction-configuration 1 react connectionLoss threshold-type consecutive 3 action-type trapOnlyauto ip sla mpls-lsp-monitor reaction-configuration 1 react timeout threshold-type consecutive 3 action-type trapOnlyip sla logging traps!auto ip sla mpls-lsp-monitor schedule 1 schedule-period 60 start-time now
Related Commands Command Description
auto ip sla mpls-lsp-monitor
Begins configuration for an IP SLAs LSP Health Monitor operation and enters auto IP SLA MPLS configuration mode.
SLA-20Cisco IOS IP SLAs Command Reference
Release 12.2SX

request-data-size
request-data-sizeTo set the protocol data size in the payload of a Cisco IOS IP Service Level Agreements (SLAs) operation’s request packet, use the request-data-size command in the appropriate submode of IP SLA configuration, auto IP SLA MPLS configuration, or IP SLA monitor configuration mode. To return to the default value, use the no form of this command.
request-data-size bytes
no request-data-size
Syntax Description
Defaults The default data size will vary depending on the type of IP SLAs operation you are configuring. See the CISCO-RTTMON-MIB documentation for more details.
Command Modes IP SLA Configuration
DLSw configuration (config-ip-sla-dlsw)ICMP echo configuration (config-ip-sla-echo)ICMP path echo configuration (config-ip-sla-pathEcho)ICMP path jitter configuration (config-ip-sla-pathJitter)UDP echo configuration (config-ip-sla-udp)UDP jitter configuration (config-ip-sla-jitter)
Auto IP SLA MPLS Configuration
MPLS parameters configuration (config-auto-ip-sla-mpls-params)
IP SLA Monitor Configuration
DLSw configuration (config-sla-monitor-dlsw)ICMP echo configuration (config-sla-monitor-echo)ICMP path echo configuration (config-sla-monitor-pathEcho)ICMP path jitter configuration (config-sla-monitor-pathJitter)UDP echo configuration (config-sla-monitor-udp)UDP jitter configuration (config-sla-monitor-jitter)
Note The configuration mode varies depending on the Cisco IOS release you are running and the operation type configured. See the “Usage Guidelines” section for more information.
Command History
bytes Size (in bytes) of the protocol data in the payload of the request packet of the operation. The range is from 0 to the maximum of the protocol.
Release Modification
11.2 This command was introduced.
12.2(33)SRA This command was integrated into Cisco IOS Release 12.2(33)SRA.
SLA-21Cisco IOS IP SLAs Command Reference
Release 12.2SX

request-data-size
Usage Guidelines The request-data-size command is also used to set the padding size for the data frame of an IP SLAs Ethernet operation. See the documentation for the request-data-size (Ethernet) command for more information.
IP SLAs Operation Configuration Dependence on Cisco IOS Release
The Cisco IOS command used to begin configuration for an IP SLAs operation varies depending on the Cisco IOS release you are running (see Table 11). Note that if you are configuring an IP SLAs LSP Health Monitor operation, see Table 12 for information on Cisco IOS release dependencies. You must configure the type of IP SLAs operation (such as User Datagram Protocol [UDP] jitter or Internet Control Message Protocol [ICMP] echo) before you can configure any of the other parameters of the operation.
The configuration mode for the request-data-size command varies depending on the Cisco IOS release you are running and the operation type configured. For example, if you are running Cisco IOS Release 12.4 and the ICMP echo operation type is configured, you would enter the request-data-size command in ICMP echo configuration mode (config-sla-monitor-echo) within IP SLA monitor configuration mode.
Examples The following examples show how to set the request packet size to 40 bytes for IP SLAs ICMP echo operation 3. Note that the Cisco IOS command used to begin configuration for an IP SLAs operation varies depending on the Cisco IOS release you are running (see Table 11).
IP SLA Configurationip sla 3icmp-echo 172.16.1.175request-data-size 40
!ip sla schedule 3 life forever start-time now
IP SLA Monitor Configurationip sla monitor 3type echo protocol ipIcmpEcho 172.16.1.175request-data-size 40
Table 11 Command Used to Begin Configuration of an IP SLAs Operation Based on Cisco IOS
Release
Cisco IOS Release Global Configuration Command Command Mode Entered
12.4(4)T, 12.0(32)SY, 12.2(33)SRB, or later releases
ip sla IP SLA configuration
12.3(14)T, 12.4, 12.4(2)T, 12.2(31)SB2, or 12.2(33)SXH
ip sla monitor IP SLA monitor configuration
Table 12 Command Used to Begin Configuration of an IP SLAs LSP Health Monitor Operation
Based on Cisco IOS Release
Cisco IOS Release Global Configuration Command Command Mode Entered
12.4(6)T, 12.0(32)SY, 12.2(31)SB2, 12.2(33)SRB, 12.2(33)SXH, or later releases
auto ip sla mpls-lsp-monitor Auto IP SLA MPLS configuration
SLA-22Cisco IOS IP SLAs Command Reference
Release 12.2SX

request-data-size
!ip sla monitor schedule 3 life forever start-time now
Related Commands Command Description
auto ip sla mpls-lsp-monitor
Begins configuration for an IP SLAs LSP Health Monitor operation and enters auto IP SLA MPLS configuration mode.
ip sla Begins configuration for an IP SLAs operation and enters IP SLA configuration mode.
ip sla monitor Begins configuration for an IP SLAs operation and enters IP SLA monitor configuration mode.
SLA-23Cisco IOS IP SLAs Command Reference
Release 12.2SX

samples-of-history-kept
samples-of-history-keptTo set the number of entries kept in the history table per bucket for a Cisco IOS IP Service Level Agreements (SLAs) operation, use the samples-of-history-kept command in the appropriate submode of IP SLA configuration or IP SLA monitor configuration mode. To return to the default value, use the no form of this command.
samples-of-history-kept samples
no samples-of-history-kept
Syntax Description
Defaults 16 entries
Command Modes IP SLA Configuration
ICMP path echo configuration (config-ip-sla-pathEcho)
IP SLA Monitor Configuration
ICMP path echo configuration (config-sla-monitor-pathEcho)
Note The configuration mode varies depending on the Cisco IOS release you are running and the operation type configured. See the “Usage Guidelines” section for more information.
Command History
Usage Guidelines An IP SLAs operation can collect history and capture statistics. By default, the history for an IP SLAs operation is not collected. If history is collected, each history bucket contains one or more history entries from the operation. When the operation type is ICMP path echo, an entry is created for each hop along the path that the operation takes to reach its destination. The type of entry stored in the history table is controlled by the filter-for-history command. The total number of entries stored in the history table is controlled by the combination of the samples-of-history-kept, buckets-of-history-kept, and lives-of-history-kept commands.
Note This command is supported by the IP SLAs ICMP path echo operation only.
Note Collecting history increases the RAM usage. Collect history only when you think there is a problem in the network.
samples Number of entries kept in the history table per bucket. The default is 16.
Release Modification
11.2 This command was introduced.
12.2(33)SRA This command was integrated into Cisco IOS Release 12.2(33)SRA.
SLA-24Cisco IOS IP SLAs Command Reference
Release 12.2SX

samples-of-history-kept
IP SLAs Operation Configuration Dependence on Cisco IOS Release
The Cisco IOS command used to begin configuration for an IP SLAs operation varies depending on the Cisco IOS release you are running (see Table 13). You must configure the type of IP SLAs operation (such as User Datagram Protocol [UDP] jitter or Internet Control Message Protocol [ICMP] echo) before you can configure any of the other parameters of the operation.
The configuration mode for the samples-of-history-kept command varies depending on the Cisco IOS release you are running (see Table 13) and the operation type configured. For example, if you are running Cisco IOS Release 12.4 and the ICMP path echo operation type is configured, you would enter the samples-of-history-kept command in ICMP path echo configuration mode (config-sla-monitor-pathEcho) within IP SLA monitor configuration mode.
Examples In the following examples, ten entries are kept in the history table for each of the lives of IP SLAs ICMP path echo operation 1. Note that the Cisco IOS command used to begin configuration for an IP SLAs operation varies depending on the Cisco IOS release you are running (see Table 13).
IP SLA Configurationip sla 1path-Echo 172.16.1.176history lives-kept 3samples-of-history-kept 10
!ip sla schedule 1 life forever start-time now
IP SLA Monitor Configurationip sla monitor 1type pathecho protocol ipIcmpEcho 172.16.1.176lives-of-history-kept 3samples-of-history-kept 10
!ip sla monitor schedule 1 life forever start-time now
Related Commands
Table 13 Command Used to Begin Configuration of an IP SLAs Operation Based on Cisco IOS
Release
Cisco IOS Release Global Configuration Command Command Mode Entered
12.4(4)T, 12.0(32)SY, 12.2(33)SRB, or later releases
ip sla IP SLA configuration
12.3(14)T, 12.4, 12.4(2)T, 12.2(31)SB2, or 12.2(33)SXH
ip sla monitor IP SLA monitor configuration
Command Description
buckets-of-history-kept Sets the number of history buckets that are kept during the lifetime of the IP SLAs operation.
filter-for-history Defines the type of information kept in the history table for the IP SLAs operation.
ip sla Begins configuration for an IP SLAs operation and enters IP SLA configuration mode.
SLA-25Cisco IOS IP SLAs Command Reference
Release 12.2SX

samples-of-history-kept
ip sla monitor Begins configuration for an IP SLAs operation and enters IP SLA monitor configuration mode.
lives-of-history-kept Sets the number of lives maintained in the history table for the IP SLAs operation.
Command Description
SLA-26Cisco IOS IP SLAs Command Reference
Release 12.2SX

scan-interval
scan-intervalTo specify the time interval at which the IP Service Level Agreements (SLAs) label switched path (LSP) Health Monitor checks the scan queue for Border Gateway Protocol (BGP) next hop neighbor updates, use the scan-interval command in auto IP SLA MPLS parameters configuration mode. To return to the default value, use the no form of this command.
scan-interval minutes
no scan-interval
Syntax Description
Command Default Scan interval is 240 minutes.
Command Modes Auto IP SLA MPLS parameters configuration (config-auto-ip-sla-mpls-params)
Command History
Usage Guidelines At each scan interval, a new IP SLA operation is automatically created for each newly discovered BGP next hop neighbor listed in the LSP Health Monitor scan queue. If there is more than one IP SLAs operation created at a specific scan interval, the start time for each newly created IP SLAs operation is randomly distributed to avoid having all of the operations start at the same time.
Use the delete-scan-factor command in IP SLA monitor configuration mode to specify the number of times the LSP Health Monitor should check the scan queue before automatically deleting IP SLAs operations for BGP next hop neighbors that are no longer valid.
You must configure the type of LSP Health Monitor operation (such as LSP ping) before you can configure any of the other parameters of the operation.
Examples The following example shows how to configure operation parameters, proactive threshold monitoring, and scheduling options using the LSP Health Monitor. In this example, LSP Health Monitor operation 1 is configured to automatically create IP SLAs LSP ping operations for all Border Gateway Protocol
minutes Specifies the time interval (in minutes) at which the LSP Health Monitor checks the scan queue for BGP next hop neighbor updates.
Release Modification
12.2(27)SBC This command was introduced.
12.4(6)T This command was integrated into Cisco IOS Release 12.4(6)T.
12.2(33)SRA This command was integrated into Cisco IOS Release 12.2(33)SRA.
12.0(32)SY This command was integrated into Cisco IOS Release 12.0(32)SY.
12.2(31)SB2 This command was integrated into Cisco IOS Release 12.2(31)SB2.
12.2(33)SXH This command was integrated into Cisco IOS Release 12.2(33)SXH.
SLA-27Cisco IOS IP SLAs Command Reference
Release 12.2SX
scan-interval
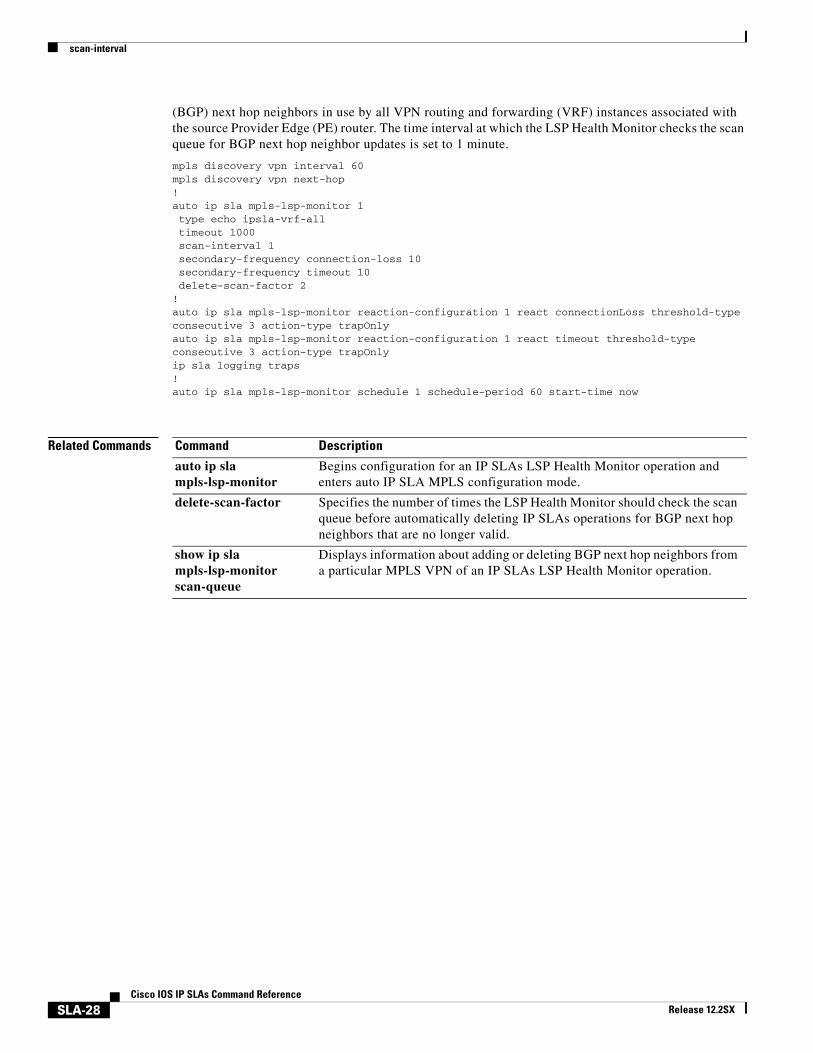
(BGP) next hop neighbors in use by all VPN routing and forwarding (VRF) instances associated with the source Provider Edge (PE) router. The time interval at which the LSP Health Monitor checks the scan queue for BGP next hop neighbor updates is set to 1 minute.
mpls discovery vpn interval 60mpls discovery vpn next-hop!auto ip sla mpls-lsp-monitor 1type echo ipsla-vrf-alltimeout 1000scan-interval 1secondary-frequency connection-loss 10secondary-frequency timeout 10delete-scan-factor 2
!auto ip sla mpls-lsp-monitor reaction-configuration 1 react connectionLoss threshold-type consecutive 3 action-type trapOnlyauto ip sla mpls-lsp-monitor reaction-configuration 1 react timeout threshold-type consecutive 3 action-type trapOnlyip sla logging traps!auto ip sla mpls-lsp-monitor schedule 1 schedule-period 60 start-time now
Related Commands Command Description
auto ip sla mpls-lsp-monitor
Begins configuration for an IP SLAs LSP Health Monitor operation and enters auto IP SLA MPLS configuration mode.
delete-scan-factor Specifies the number of times the LSP Health Monitor should check the scan queue before automatically deleting IP SLAs operations for BGP next hop neighbors that are no longer valid.
show ip sla mpls-lsp-monitor scan-queue
Displays information about adding or deleting BGP next hop neighbors from a particular MPLS VPN of an IP SLAs LSP Health Monitor operation.
SLA-28Cisco IOS IP SLAs Command Reference
Release 12.2SX

secondary-frequency
secondary-frequencyTo set a faster measurement frequency (secondary frequency) to which a Cisco IOS IP Service Level Agreements (SLAs) operation should change when a reaction condition occurs, use the secondary-frequency command in the appropriate submode of auto IP SLA MPLS configuration or IP SLA configuration mode. To disable the secondary frequency, use the no form of this command.
secondary-frequency {both | connection-loss | timeout} frequency
no secondary-frequency {connection-loss | timeout}
Syntax Description
Command Default The secondary frequency option is disabled.
Command Modes Auto IP SLA MPLS Configuration
MPLS parameters configuration (config-auto-ip-sla-mpls-params)
IP SLA Configuration and IP SLA Monitor Configuration
LSP ping configuration (config-sla-monitor-lspPing)LSP trace configuration (config-sla-monitor-lspTrace)
Note The configuration mode varies depending on the Cisco IOS release you are running and the operation type configured. See the “Usage Guidelines” section for more information.
Command History
both Specifies that the operation measurement frequency should increase to the secondary frequency value if a one-way connection loss or one-way timeout is detected.
connection-loss Specifies that the operation measurement frequency should increase to the secondary frequency value if a one-way connection loss is detected.
timeout Specifies that the operation measurement frequency should increase to the secondary frequency value if a one-way timeout is detected.
frequency Secondary frequency to which an IP SLAs operation should change when a reaction condition occurs.
Release Modification
12.2(27)SBC This command was introduced.
12.4(6)T This command was integrated into Cisco IOS Release 12.4(6)T. The both keyword was added.
12.2(33)SRA This command was integrated into Cisco IOS Release 12.2(33)SRA.
12.0(32)SY This command was integrated into Cisco IOS Release 12.0(32)SY.
12.2(31)SB2 This command was integrated into Cisco IOS Release 12.2(31)SB2.
12.2(33)SXH This command was integrated into Cisco IOS Release 12.2(33)SXH.
SLA-29Cisco IOS IP SLAs Command Reference
Release 12.2SX

secondary-frequency
Usage Guidelines This command provides the capability to specify a secondary frequency for an IP SLAs operation. If the secondary frequency option is configured and a failure (such as a connection loss or timeout) is detected for a particular path, the frequency at which the path is remeasured will increase to the secondary frequency value (testing at a faster rate). When the configured reaction condition is met (such as N consecutive connection losses or N consecutive timeouts), an SNMP trap and syslog message can be sent and the measurement frequency will return to its original frequency value.
Note By default, if the secondary frequency option is not enabled, the frequency at which an operation remeasures a failed LSP is the same as the schedule period.
IP SLAs Operation Configuration Dependence on Cisco IOS Release
The Cisco IOS command used to begin configuration for an IP SLAs operation varies depending on the Cisco IOS release you are running (see Table 14). Note that if you are configuring an IP SLAs LSP Health Monitor operation, see Table 15 for information on Cisco IOS release dependencies. You must configure the type of IP SLAs operation (such as LSP ping) before you can configure any of the other parameters of the operation.
The configuration mode for the secondary-frequency command varies depending on the Cisco IOS release you are running and the operation type configured. For example, if you are running Cisco IOS Release 12.4(6)T and the LSP ping operation type is configured (without using the LSP Health Monitor), you would enter the secondary-frequency command in LSP ping configuration mode (config-sla-monitor-lspPing) within IP SLA configuration mode.
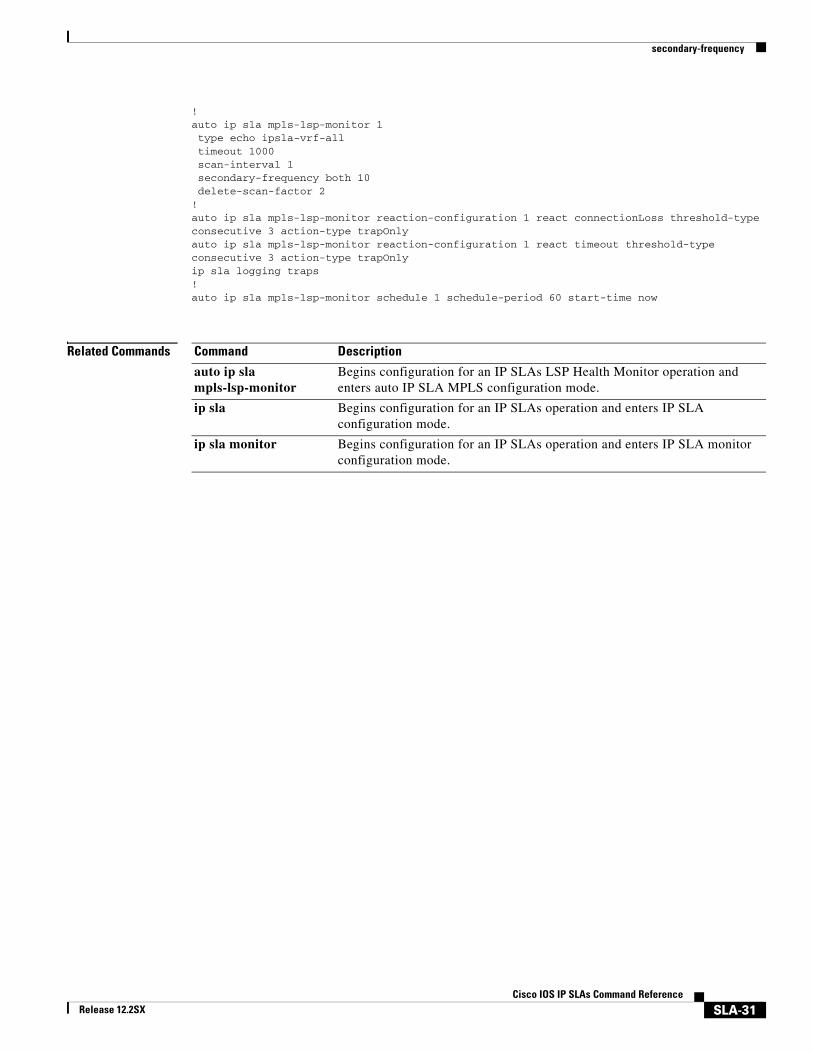
Examples The following example shows how to configure operation parameters, proactive threshold monitoring, and scheduling options using the LSP Health Monitor. In this example, LSP Health Monitor operation 1 is configured to automatically create IP SLAs LSP ping operations for all Border Gateway Protocol (BGP) next hop neighbors in use by all VPN routing and forwarding (VRF) instances associated with the source Provider Edge (PE) router. The secondary frequency option is enabled for both connection loss and timeout events, and the secondary frequency is set to 10 seconds.
mpls discovery vpn interval 60mpls discovery vpn next-hop
Table 14 Command Used to Begin Configuration of an IP SLAs Operation Based on Cisco IOS
Release
Cisco IOS Release Global Configuration Command Command Mode Entered
12.4(4)T, 12.0(32)SY, 12.2(33)SRB, or later releases
ip sla IP SLA configuration
12.3(14)T, 12.4, 12.4(2)T, 12.2(31)SB2, or 12.2(33)SXH
ip sla monitor IP SLA monitor configuration
Table 15 Command Used to Begin Configuration of an IP SLAs LSP Health Monitor Operation
Based on Cisco IOS Release
Cisco IOS Release Global Configuration Command Command Mode Entered
12.4(6)T, 12.0(32)SY, 12.2(31)SB2, 12.2(33)SRB, 12.2(33)SXH, or later releases
auto ip sla mpls-lsp-monitor Auto IP SLA MPLS configuration
SLA-30Cisco IOS IP SLAs Command Reference
Release 12.2SX
secondary-frequency
!auto ip sla mpls-lsp-monitor 1type echo ipsla-vrf-alltimeout 1000scan-interval 1secondary-frequency both 10delete-scan-factor 2
!auto ip sla mpls-lsp-monitor reaction-configuration 1 react connectionLoss threshold-type consecutive 3 action-type trapOnlyauto ip sla mpls-lsp-monitor reaction-configuration 1 react timeout threshold-type consecutive 3 action-type trapOnlyip sla logging traps!auto ip sla mpls-lsp-monitor schedule 1 schedule-period 60 start-time now
Related Commands Command Description
auto ip sla mpls-lsp-monitor
Begins configuration for an IP SLAs LSP Health Monitor operation and enters auto IP SLA MPLS configuration mode.
ip sla Begins configuration for an IP SLAs operation and enters IP SLA configuration mode.
ip sla monitor Begins configuration for an IP SLAs operation and enters IP SLA monitor configuration mode.
SLA-31Cisco IOS IP SLAs Command Reference
Release 12.2SX

show ip sla monitor application
show ip sla monitor application
Note Effective with Cisco IOS Release 12.4(4)T, the show ip sla monitor application command is replaced by the show ip sla application command. See the show ip sla application command for more information.
To display global information about Cisco IOS IP Service Level Agreements (SLAs), use the show ip sla monitor application command in user EXEC or privileged EXEC mode.
show ip sla monitor application [tabular | full]
Syntax Description
Defaults Full format
Command Modes User EXECPrivileged EXEC
Command History
Usage Guidelines Use the show ip sla monitor application command to display information such as supported operation types and supported protocols.
Examples The following is sample output from the show ip sla monitor application command in full format:
Router# show ip sla monitor application
IP Service Level Agreement MonitorVersion: 2.2.0 Round Trip Time MIBTime of last change in whole IP SLA Monitor: *17:21:30.819 UTC Tue Mar 19 2002Estimated system max number of entries: 4699 Number of Entries configured:5 Number of active Entries:5
tabular (Optional) Displays information in a column format, reducing the number of screens required to display the information.
full (Optional) Displays all information, using identifiers next to each displayed value. This is the default.
Release Modification
12.3(14)T This command was introduced.
12.4(4)T This command was replaced by the show ip sla application command.
12.2(31)SB2 This command was integrated into Cisco IOS Release 12.2(31)SB2. This command replaces the show rtr application command.
12.2(33)SXH This command was integrated into Cisco IOS Release 12.2(33)SXH.
SLA-32Cisco IOS IP SLAs Command Reference
Release 12.2SX

show ip sla monitor application
Number of pending Entries:0 Number of inactive Entries:0 Supported Operation TypesType of Operation to Perform: echoType of Operation to Perform: pathEchoType of Operation to Perform: udpEchoType of Operation to Perform: tcpConnectType of Operation to Perform: httpType of Operation to Perform: dnsType of Operation to Perform: jitterType of Operation to Perform: dlswType of Operation to Perform: dhcpType of Operation to Perform: ftp
Supported ProtocolsProtocol Type: ipIcmpEchoProtocol Type: ipUdpEchoApplProtocol Type: snaRUEchoProtocol Type: snaLU0EchoApplProtocol Type: snaLU2EchoApplProtocol Type: ipTcpConnProtocol Type: httpApplProtocol Type: dnsApplProtocol Type: jitterApplProtocol Type: dlswProtocol Type: dhcpProtocol Type: ftpAppl Number of configurable probe is 490
Related Commands Command Description
show ip sla monitor configuration
Displays configuration values including all defaults for all IP SLAs operations or the specified operation.
SLA-33Cisco IOS IP SLAs Command Reference
Release 12.2SX

show ip sla monitor authentication
show ip sla monitor authentication
Note Effective with Cisco IOS Release 12.4(4)T, the show ip sla monitor authentication command is replaced by the show ip sla authentication command. See the show ip sla authentication command for more information.
To display Cisco IOS IP Service Level Agreements (SLAs) authentication information, use the show ip sla monitor authentication command in user EXEC or privileged EXEC mode.
show ip sla monitor authentication
Syntax Description This command has no arguments or keywords.
Command Modes User EXECPrivileged EXEC
Command History
Usage Guidelines Use the show ip sla monitor authentication command to display information such as supported operation types and supported protocols.
Examples The following is sample output from the show ip sla monitor authentication command:
Router# show ip sla monitor authentication
IP SLA Monitor control message uses MD5 authentication, key chain name is: ipsla
Related Commands
Release Modification
12.3(14)T This command was introduced.
12.4(4)T This command was replaced by the show ip sla authentication command.
12.2(31)SB2 This command was integrated into Cisco IOS Release 12.2(31)SB2. This command replaces the show rtr authentication command.
12.2(33)SXH This command was integrated into Cisco IOS Release 12.2(33)SXH.
Command Description
show ip sla monitor configuration
Displays configuration values for IP SLAs operations.
SLA-34Cisco IOS IP SLAs Command Reference
Release 12.2SX

show ip sla monitor collection-statistics
show ip sla monitor collection-statistics
Note Effective with Cisco IOS Release 12.4(2)T, the show ip sla monitor collection-statistics command is replaced by the show ip sla monitor statistics aggregated command. See the show ip sla monitor statistics aggregated command for more information.
To display statistical errors for all Cisco IOS IP Service Level Agreements (SLAs) operations or a specified operation, use the show ip sla monitor collection-statistics command in user EXEC or privileged EXEC mode.
show ip sla monitor collection-statistics [operation-number]
Syntax Description
Command Modes User EXECPrivileged EXEC
Command History
Usage Guidelines Use the show ip sla monitor collection-statistics command to display information such as the number of failed operations and the failure reason. You can also use the show ip sla monitor distribution-statistics and show ip sla monitor totals-statistics commands to display additional statistical information.
This command shows information collected over the past two hours, unless you specify a different amount of time using the hours-of-statistics-kept command.
For one-way delay jitter operations, the clocks on each device must be synchronized using Network Time Protocol (NTP) or global positioning systems. If the clocks are not synchronized, one-way measurements are discarded. (If the sum of the source to destination (SD) and the destination to source (DS) values is not within 10 percent of the round-trip time, the one-way measurement values are assumed to be faulty, and are discarded.)
Note This command does not support the IP SLAs ICMP path jitter operation.
Examples The following is sample output from the show ip sla monitor collection-statistics command:
operation-number (Optional) Number of the IP SLAs operation to display.
Release Modification
12.3(14)T This command was introduced.
12.4(2)T This command was replaced by the show ip sla monitor statistics aggregated command.
12.2(31)SB2 This command was integrated into Cisco IOS Release 12.2(31)SB2. This command replaces the show rtr collection-statistics command.
12.2(33)SXH This command was integrated into Cisco IOS Release 12.2(33)SXH.
SLA-35Cisco IOS IP SLAs Command Reference
Release 12.2SX

show ip sla monitor collection-statistics
Router# show ip sla monitor collection-statistics 1
Collected StatisticsEntry Number: 1Start Time Index: *17:15:41.000 UTC Thu May 16 1996Path Index: 1Hop in Path Index: 1Number of Failed Operations due to a Disconnect: 0Number of Failed Operations due to a Timeout: 0Number of Failed Operations due to a Busy: 0Number of Failed Operations due to a No Connection: 0Number of Failed Operations due to an Internal Error: 0Number of Failed Operations due to a Sequence Error: 0Number of Failed Operations due to a Verify Error: 0Target Address: 172.16.1.176
Output for HTTP Operations
The following is output from the show ip sla monitor collection-statistics command when the specified operation is an HTTP operation:
Router# show ip sla monitor collection-statistics 2
Collected Statistics Entry Number:2HTTP URL:http://172.20.150.200Start Time:*00:01:16.000 UTC Mon Nov 1 2003 Comps:1 RTTMin:343 OvrTh:0 RTTMax:343 DNSTimeOut:0 RTTSum:343 TCPTimeOut:0 RTTSum2:117649 TraTimeOut:0 DNSRTT:0 DNSError:0 TCPConRTT:13 HTTPError:0 TransRTT:330 IntError:0 MesgSize:1771 Busies:0
Output for UDP Jitter Operations
The following is sample output from the show ip sla monitor collection-statistics command, where operation 2 is a jitter operation that includes one-way statistics. Table 16 describes the significant fields shown in the display.
Router# show ip sla monitor collection-statistics
Collected Statistics
Entry Number: 2Target Address: 5.0.0.1, Port Number:99Start Time: 11:12:03.000 UTC Thu Jul 1 1999RTT Values:NumOfRTT: 600 RTTSum: 3789 RTTSum2: 138665Packet Loss Values:PacketLossSD: 0 PacketLossDS: 0PacketOutOfSequence: 0 PacketMIA: 0 PacketLateArrival: 0InternalError: 0 Busies: 0Jitter Values:MinOfPositivesSD: 1 MaxOfPositivesSD: 2NumOfPositivesSD: 26 SumOfPositivesSD: 31 Sum2PositivesSD: 41MinOfNegativesSD: 1 MaxOfNegativesSD: 4NumOfNegativesSD: 56 SumOfNegativesSD: 73 Sum2NegativesSD: 133MinOfPositivesDS: 1 MaxOfPositivesDS: 338
SLA-36Cisco IOS IP SLAs Command Reference
Release 12.2SX

show ip sla monitor collection-statistics
NumOfPositivesDS: 58 SumOfPositivesDS: 409 Sum2PositivesDS: 114347MinOfNegativesDS: 1 MaxOfNegativesDS: 338NumOfNegativesDS: 48 SumOfNegativesDS: 396 Sum2NegativesDS: 114332One Way Values:NumOfOW: 440OWMinSD: 2 OWMaxSD: 6 OWSumSD: 1273 OWSum2SD: 4021OWMinDS: 2 OWMaxDS: 341 OWSumDS: 1643 OWSum2DS: 120295
Output for UDP Jitter (codec) Operations
The following is sample output from the show ip sla monitor collection-statistics command, where operation 10 is a UDP jitter (codec) operation. Table 16 describes the significant fields shown in the display.
Router# show ip sla monitor collection-statistics 10
Entry Number: 10
Start Time Index: 12:57:45.931 UTC Wed Mar 12 2003Number of successful operations: 60Number of operations over threshold: 0Number of failed operations due to a Disconnect: 0Number of failed operations due to a Timeout: 0Number of failed operations due to a Busy: 0Number of failed operations due to a No Connection: 0Number of failed operations due to an Internal Error: 0Number of failed operations due to a Sequence Error: 0Number of failed operations due to a Verify Error: 0Voice Scores:MinOfICPIF: 2 MaxOfICPIF: 20 MinOfMos: 3.20 MaxOfMos: 4.80
RTT Values:NumOfRTT: 600 RTTSum: 3789 RTTSum2: 138665Packet Loss Values:PacketLossSD: 0 PacketLossDS: 0PacketOutOfSequence: 0 PacketMIA: 0 PacketLateArrival: 0InternalError: 0 Busies: 0
Jitter Values:NumOfJitterSamples: 540MinOfPositivesSD: 1 MaxOfPositivesSD: 2NumOfPositivesSD: 26 SumOfPositivesSD: 31 Sum2PositivesSD: 41MinOfNegativesSD: 1 MaxOfNegativesSD: 4NumOfNegativesSD: 56 SumOfNegativesSD: 73 Sum2NegativesSD: 133MinOfPositivesDS: 1 MaxOfPositivesDS: 338NumOfPositivesDS: 58 SumOfPositivesDS: 409 Sum2PositivesDS: 114347MinOfNegativesDS: 1 MaxOfNegativesDS: 338NumOfNegativesDS: 48 SumOfNegativesDS: 396 Sum2NegativesDS: 114332Interarrival jitterout: 0 Interarrival jitterin: 0
One Way Values:NumOfOW: 440OWMinSD: 2 OWMaxSD: 6 OWSumSD: 1273 OWSum2SD: 4021OWMinDS: 2 OWMaxDS: 341 OWSumDS: 1643 OWSum2DS: 120295
SLA-37Cisco IOS IP SLAs Command Reference
Release 12.2SX

show ip sla monitor collection-statistics
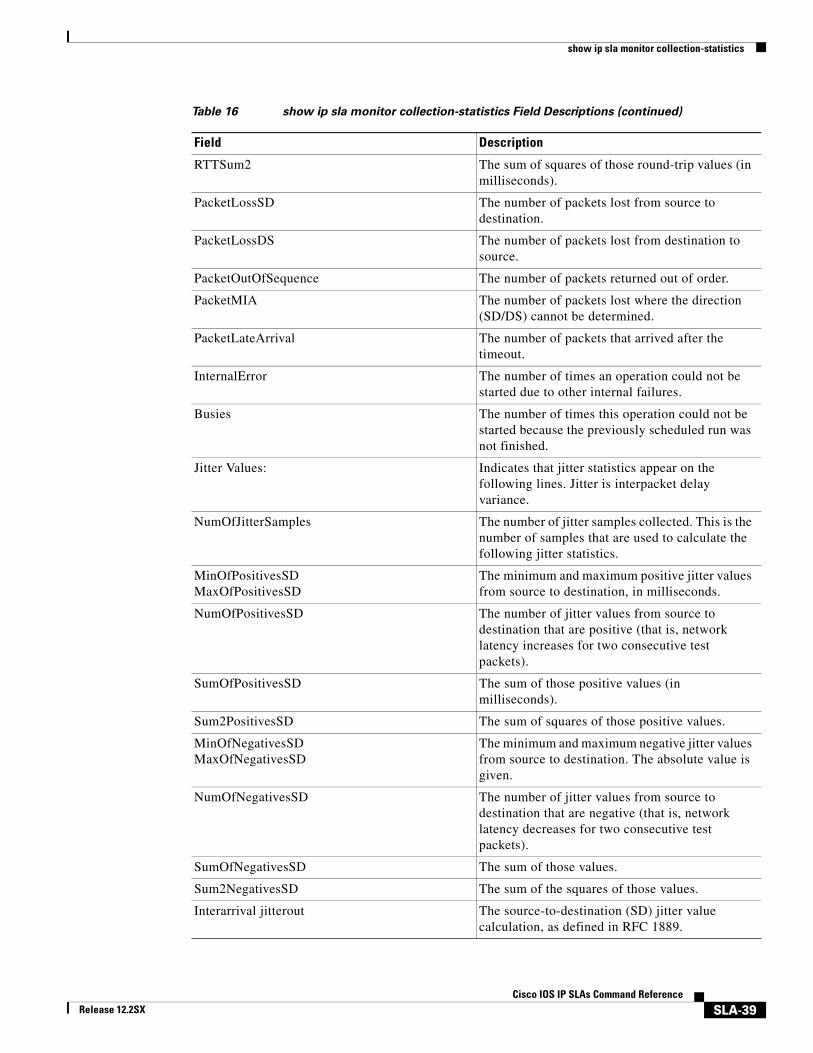
Table 16 show ip sla monitor collection-statistics Field Descriptions
Field Description
Voice Scores Indicates that Voice over IP statistics appear on the following lines. Voice score data is computed when the operation type is configured as type jitter (codec).
ICPIF The Calculated Planning Impairment Factor (ICPIF) value for the operation. The ICPIF value is computed by IP SLAs using the formula Icpif = Io + Iq + Idte + Idd + Ie – A, where
• The values for Io, Iq, and Idte are set to zero.
• The value Idd is computed based on the measured one-way delay.
• The value Ie is computed based on the measured packet loss.
• The value of A is specified by the user.
ICPIF values are expressed in a typical range of 5 (very low impairment) to 55 (very high impairment). ICPIF values numerically lower than 20 are generally considered “adequate.”
Note This value is intended only for relative comparisons, and may not match ICPIF values generated using alternate methods.
MinOfICPIF The lowest (minimum) ICPIF value computed for the collected statistics.
MaxOfICPIF The highest (maximum) ICPIF value computed for the collected statistics.
Mos The estimated Mean Opinion Score (Conversational Quality, Estimated) for the latest iteration of the operation. The MOS-CQE is computed by IP SLAs as a function of the ICPIF.
MOS values are expressed as a number from 1 (1.00) to 5 (5.00), with 5 being the highest level of quality, and 1 being the lowest level of quality. A MOS value of 0 (zero) indicates that MOS data could not be generated for the operation.
MinOfMos The lowest (minimum) MOS value computed for the collected statistics.
MaxOfMos The highest (maximum) ICPIF value computed for the collected statistics.
RTT Values Indicates that round-trip-time statistics appear on the following lines.
NumOfRTT The number of successful round-trips.
RTTSum The sum of all successful round-trip values (in milliseconds).
SLA-38Cisco IOS IP SLAs Command Reference
Release 12.2SX
show ip sla monitor collection-statistics
RTTSum2 The sum of squares of those round-trip values (in milliseconds).
PacketLossSD The number of packets lost from source to destination.
PacketLossDS The number of packets lost from destination to source.
PacketOutOfSequence The number of packets returned out of order.
PacketMIA The number of packets lost where the direction (SD/DS) cannot be determined.
PacketLateArrival The number of packets that arrived after the timeout.
InternalError The number of times an operation could not be started due to other internal failures.
Busies The number of times this operation could not be started because the previously scheduled run was not finished.
Jitter Values: Indicates that jitter statistics appear on the following lines. Jitter is interpacket delay variance.
NumOfJitterSamples The number of jitter samples collected. This is the number of samples that are used to calculate the following jitter statistics.
MinOfPositivesSDMaxOfPositivesSD
The minimum and maximum positive jitter values from source to destination, in milliseconds.
NumOfPositivesSD The number of jitter values from source to destination that are positive (that is, network latency increases for two consecutive test packets).
SumOfPositivesSD The sum of those positive values (in milliseconds).
Sum2PositivesSD The sum of squares of those positive values.
MinOfNegativesSDMaxOfNegativesSD
The minimum and maximum negative jitter values from source to destination. The absolute value is given.
NumOfNegativesSD The number of jitter values from source to destination that are negative (that is, network latency decreases for two consecutive test packets).
SumOfNegativesSD The sum of those values.
Sum2NegativesSD The sum of the squares of those values.
Interarrival jitterout The source-to-destination (SD) jitter value calculation, as defined in RFC 1889.
Table 16 show ip sla monitor collection-statistics Field Descriptions (continued)
Field Description
SLA-39Cisco IOS IP SLAs Command Reference
Release 12.2SX

show ip sla monitor collection-statistics
Related Commands
Interarrival jitterin The destination-to-source (DS) jitter value calculation, as defined in RFC 1889.
One Way Values Indicates that one-way measurement statistics appear on the following lines.
One Way (OW) values are the amount of time required for the packet to travel from the source router to the target router (SD) or from the target router to the source router (DS).
NumOfOW Number of successful one-way time measurements.
OWMinSD Minimum time (in milliseconds) from the source to the destination.
OWMaxSD Maximum time (in milliseconds) from the source to the destination.
OWSumSD Sum of the OWMinSD and OWMaxSD values.
OWSum2SD Sum of the squares of the OWMinSD and OWMaxSD values.
Table 16 show ip sla monitor collection-statistics Field Descriptions (continued)
Field Description
Command Description
show ip sla monitor configuration
Displays configuration values including all defaults for all IP SLAs operations or the specified operation.
show ip sla monitor distributions-statistics
Displays statistics distribution information (captured response times) for all IP SLAs operations or the specified operation.
show ip sla monitor totals-statistics
Displays the total statistical values (accumulation of error counts and completions) for all IP SLAs operations or the specified operation.
show ntp status Displays the status of the NTP configuration on your system.
SLA-40Cisco IOS IP SLAs Command Reference
Release 12.2SX
show ip sla monitor configuration
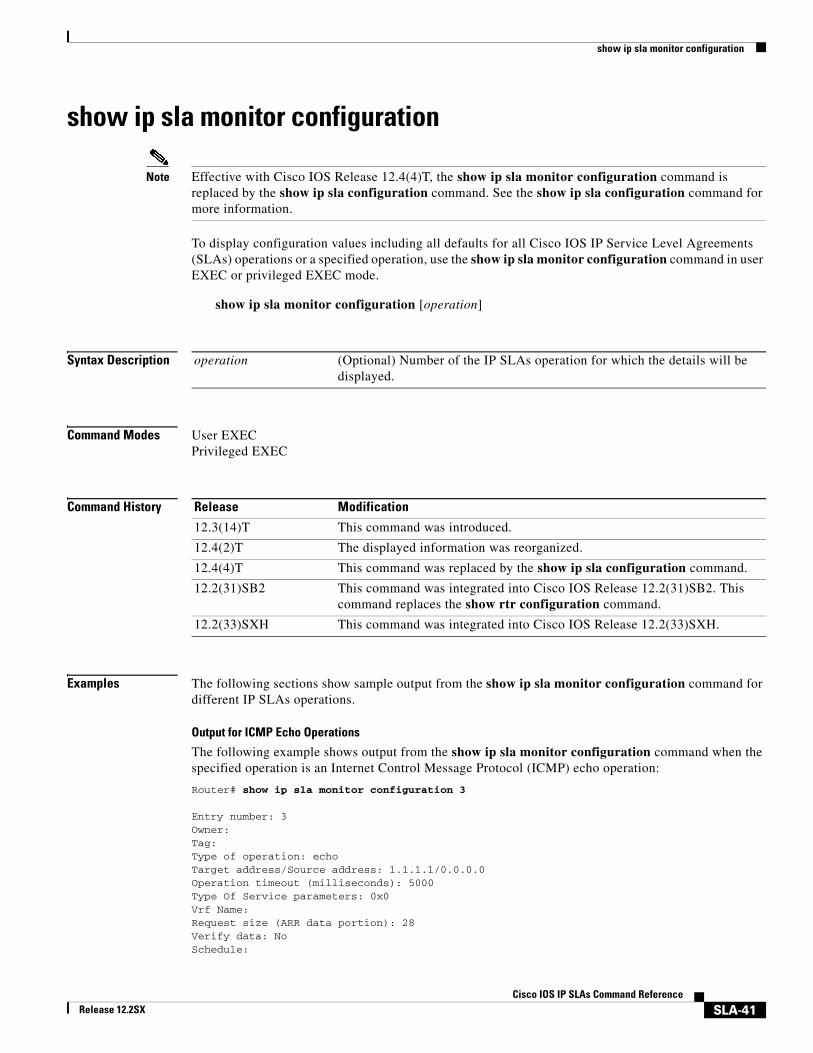
show ip sla monitor configuration
Note Effective with Cisco IOS Release 12.4(4)T, the show ip sla monitor configuration command is replaced by the show ip sla configuration command. See the show ip sla configuration command for more information.
To display configuration values including all defaults for all Cisco IOS IP Service Level Agreements (SLAs) operations or a specified operation, use the show ip sla monitor configuration command in user EXEC or privileged EXEC mode.
show ip sla monitor configuration [operation]
Syntax Description
Command Modes User EXECPrivileged EXEC
Command History
Examples The following sections show sample output from the show ip sla monitor configuration command for different IP SLAs operations.
Output for ICMP Echo Operations
The following example shows output from the show ip sla monitor configuration command when the specified operation is an Internet Control Message Protocol (ICMP) echo operation:
Router# show ip sla monitor configuration 3
Entry number: 3Owner: Tag: Type of operation: echoTarget address/Source address: 1.1.1.1/0.0.0.0Operation timeout (milliseconds): 5000Type Of Service parameters: 0x0Vrf Name: Request size (ARR data portion): 28Verify data: NoSchedule:
operation (Optional) Number of the IP SLAs operation for which the details will be displayed.
Release Modification
12.3(14)T This command was introduced.
12.4(2)T The displayed information was reorganized.
12.4(4)T This command was replaced by the show ip sla configuration command.
12.2(31)SB2 This command was integrated into Cisco IOS Release 12.2(31)SB2. This command replaces the show rtr configuration command.
12.2(33)SXH This command was integrated into Cisco IOS Release 12.2(33)SXH.
SLA-41Cisco IOS IP SLAs Command Reference
Release 12.2SX

show ip sla monitor configuration
Next Scheduled Start Time: Start Time already passed Group Scheduled: False Operation frequency (seconds): 60 Life/Entry Ageout (seconds): Forever/never Recurring (Starting Everyday): FALSE Status of entry (SNMP RowStatus): ActiveThreshold (ms): 5000Distribution Statistics: Number of statistic hours kept: 2 Number of statistic distribution buckets kept: 5 Statistic distribution interval (milliseconds): 10Number of history Lives kept: 0Number of history Buckets kept: 15History Filter Type: NoneEnhanced History:
Output for HTTP Operations
The following example shows output from the show ip sla monitor configuration command when the specified operation is a Hypertext Transfer Protocol (HTTP) operation:
Router# show ip sla monitor configuration 3
Entry number: 3Owner: Tag: Type of operation: httpTarget address/Source address: 1.1.1.1/0.0.0.0Operation timeout (milliseconds): 5000Type Of Service parameters: 0x0HTTP Operation: getHTTP Server Version: 1.0URL: http://www.cisco.comProxy: Raw String(s):Cache Control: enableSchedule: Next Scheduled Start Time: Start Time already passed Group Scheduled: False Operation frequency (seconds): 60 Life/Entry Ageout (seconds): Forever/never Recurring (Starting Everyday): FALSE Status of entry (SNMP RowStatus): ActiveThreshold (ms): 5000Distribution Statistics: Number of statistic hours kept: 2 Number of statistic distribution buckets kept: 5 Statistic distribution interval (milliseconds): 10Number of history Lives kept: 0Number of history Buckets kept: 15History Filter Type: None
Output for ICMP Path Jitter Operations
The following example shows output from the show ip sla monitor configuration command when the specified operation is an ICMP path jitter operation:
Router# show ip sla monitor configuration 3
Entry number: 3Owner: Tag: Type of operation: pathJitterTarget address/Source address: 1.1.1.1/0.0.0.0
SLA-42Cisco IOS IP SLAs Command Reference
Release 12.2SX

show ip sla monitor configuration
Packet Interval/Number of Packets: 20 ms/10Target Only: DisabledOperation timeout (milliseconds): 5000Type Of Service parameters: 0x0Loose Source Routing: DisabledLSR Path:Vrf Name: Request size (ARR data portion): 28Verify data: NoSchedule: Next Scheduled Start Time: Start Time already passed Group Scheduled: False Operation frequency (seconds): 60 Life/Entry Ageout (seconds): Forever/never Recurring (Starting Everyday): FALSE Status of entry (SNMP RowStatus): ActiveThreshold (ms): 5000
Output for ICMP Path Echo Operations
The following example shows output from the show ip sla monitor configuration command when the specified operation is an ICMP path echo operation:
Router# show ip sla monitor configuration 3
Entry number: 3Owner: Tag: Type of operation: pathEchoTarget address/Source address: 1.1.1.1/0.0.0.0Packet Interval/Number of Packets: 20 ms/10Operation timeout (milliseconds): 5000Type Of Service parameters: 0x0Loose Source Routing: DisabledVrf Name: LSR Path:Request size (ARR data portion): 28Verify data: NoSchedule: Next Scheduled Start Time: Start Time already passed Group Scheduled: False Operation frequency (seconds): 60 Life/Entry Ageout (seconds): Forever/never Recurring (Starting Everyday): FALSE Status of entry (SNMP RowStatus): ActiveThreshold (ms): 5000Distribution Statistics: Number of statistic hours kept: 2 Number of statistic paths kept: 5 Number of statistic hops kept: 16 Number of statistic distribution buckets kept: 5 Statistic distribution interval (milliseconds): 10Number of history Lives kept: 0Number of history Buckets kept: 15History Filter Type: None
Output for DNS Operations
The following example shows output from the show ip sla monitor configuration command when the specified operation is a Domain Name System (DNS) operation:
Router# show ip sla monitor configuration 3
Entry number: 3
SLA-43Cisco IOS IP SLAs Command Reference
Release 12.2SX

show ip sla monitor configuration
Owner: Tag: Type of operation: dnsTarget Address/Source address: 1.1.1.1/0.0.0.0Target Port/Source Port: 1111/0Operation timeout (milliseconds): 5000Type Of Service parameters: 0x0Schedule: Next Scheduled Start Time: Start Time already passed Group Scheduled: False Operation frequency (seconds): 60 Life/Entry Ageout (seconds): Forever/never Recurring (Starting Everyday): FALSE Status of entry (SNMP RowStatus): ActiveThreshold (ms): 5000Distribution Statistics: Number of statistic hours kept: 2 Number of statistic distribution buckets kept: 5 Statistic distribution interval (milliseconds): 10Number of history Lives kept: 0Number of history Buckets kept: 15History Filter Type: None
Output for UDP Echo Operations
The following example shows output from the show ip sla monitor configuration command when the specified operation is a UDP echo operation:
Router# show ip sla monitor configuration 3
Entry number: 3Owner: Tag: Type of operation: udpEchoTarget address/Source address: 1.1.1.1/0.0.0.0Target Port/Source Port: 1111/0Operation timeout (milliseconds): 5000Type Of Service parameters: 0x0Data Pattern:Vrf Name: Request size (ARR data portion): 28Verify data: NoControl Packets: enabledSchedule: Next Scheduled Start Time: Start Time already passed Group Scheduled: False Operation frequency (seconds): 60 Life/Entry Ageout (seconds): Forever/never Recurring (Starting Everyday): FALSE Status of entry (SNMP RowStatus): ActiveThreshold (ms): 5000Distribution Statistics: Number of statistic hours kept: 2 Number of statistic distribution buckets kept: 5 Statistic distribution interval (milliseconds): 10Number of history Lives kept: 0Number of history Buckets kept: 15History Filter Type: NoneEnhanced History:
Output for TCP Connect Operations
The following example shows output from the show ip sla monitor configuration command when the specified operation is a Transmission Control Protocol (TCP) connect operation:
SLA-44Cisco IOS IP SLAs Command Reference
Release 12.2SX

show ip sla monitor configuration
Router# show ip sla monitor configuration 3
Entry number: 3Owner: Tag: Type of operation: tcpConnectTarget Address/Source address: 1.1.1.1/0.0.0.0Target Port/Source Port: 1111/0Operation timeout (milliseconds): 5000Type Of Service parameters: 0x0Control Packets: enabledSchedule: Next Scheduled Start Time: Start Time already passed Group Scheduled: False Operation frequency (seconds): 60 Life/Entry Ageout (seconds): Forever/never Recurring (Starting Everyday): FALSE Status of entry (SNMP RowStatus): ActiveThreshold (ms): 5000Distribution Statistics: Number of statistic hours kept: 2 Number of statistic distribution buckets kept: 5 Statistic distribution interval (milliseconds): 10Number of history Lives kept: 0Number of history Buckets kept: 15History Filter Type: NoneEnhanced History:
Output for DHCP Operations
The following example shows output from the show ip sla monitor configuration command when the specified operation is a Dynamic Host Configuration Protocol (DHCP) operation:
Router# show ip sla monitor configuration 3
Entry number: 3Owner: Tag: Type of operation: dhcpTarget Address/Source address: 1.1.1.1/0.0.0.0Operation timeout (milliseconds): 5000Dhcp option:Schedule: Next Scheduled Start Time: Start Time already passed Group Scheduled: False Operation frequency (seconds): 60 Life/Entry Ageout (seconds): Forever/never Recurring (Starting Everyday): FALSE Status of entry (SNMP RowStatus): ActiveThreshold (ms): 5000Distribution Statistics: Number of statistic hours kept: 2 Number of statistic distribution buckets kept: 5 Statistic distribution interval (milliseconds): 10Number of history Lives kept: 0Number of history Buckets kept: 15History Filter Type: None
Output for FTP Operations
The following example shows output from the show ip sla monitor configuration command when the specified operation is a File Transfer Protocol (FTP) operation:
Router# show ip sla monitor configuration 3
SLA-45Cisco IOS IP SLAs Command Reference
Release 12.2SX

show ip sla monitor configuration
Entry number: 3Owner: Tag: Type of operation: ftpSource address: 0.0.0.0FTP URL: ftp://ipsla:[email protected]/test.txtOperation timeout (milliseconds): 5000Type Of Service parameters: 0x0Schedule: Next Scheduled Start Time: Start Time already passed Group Scheduled: False Operation frequency (seconds): 60 Life/Entry Ageout (seconds): Forever/never Recurring (Starting Everyday): FALSE Status of entry (SNMP RowStatus): ActiveThreshold (ms): 5000Distribution Statistics: Number of statistic hours kept: 2 Number of statistic distribution buckets kept: 5 Statistic distribution interval (milliseconds): 10Number of history Lives kept: 0Number of history Buckets kept: 15History Filter Type: None
Output for UDP Jitter Operations
The following example shows output from the show ip sla monitor configuration command when the specified operation is a User Datagram Protocol (UDP) jitter operation:
Router# show ip sla monitor configuration 3
Entry number: 3Owner: Tag: Type of operation: jitterTarget Address/Source address: 1.1.1.1/0.0.0.0Target Port/Source Port: 1111/0Packet Interval/Number of Packets: 20 ms/10Operation timeout (milliseconds): 5000Type Of Service parameters: 0x0Vrf Name: Request size (ARR data portion): 28Verify data: NoControl Packets: enabledSchedule: Next Scheduled Start Time: Start Time already passed Group Scheduled: False Operation frequency (seconds): 60 Life/Entry Ageout (seconds): Forever/never Recurring (Starting Everyday): FALSE Status of entry (SNMP RowStatus): ActiveThreshold (ms): 5000Distribution Statistics: Number of statistic hours kept: 2 Number of statistic distribution buckets kept: 5 Statistic distribution interval (milliseconds): 10Enhanced History:
Related Commands
SLA-46Cisco IOS IP SLAs Command Reference
Release 12.2SX

show ip sla monitor configuration
Command Description
ip sla monitor Begins configuration for an IP SLAs operation and enters IP SLA monitor configuration mode.
SLA-47Cisco IOS IP SLAs Command Reference
Release 12.2SX

show ip sla monitor distributions-statistics
show ip sla monitor distributions-statistics
Note Effective with Cisco IOS Release 12.4(2)T, the show ip sla monitor distributions-statistics command is replaced by the show ip sla monitor statistics aggregated details command. See the show ip sla monitor statistics aggregated command for more information.
To display distribution statistics (captured response times) for all Cisco IOS IP Service Level Agreements (SLAs) operations or the specified operation, use the show ip sla monitor distributions-statistics command in user EXEC or privileged EXEC mode.
show ip sla monitor distributions-statistics [operation] [tabular | full]
Syntax Description
Defaults Statistics are displayed for the past two hours.
Command Modes User EXECPrivileged EXEC
Command History
Usage Guidelines The distribution statistics consist of the following:
• The sum of completion times (used to calculate the mean)
• The sum of the completion times squared (used to calculate standard deviation)
• The maximum and minimum completion time
• The number of completed attempts
Note This command does not support the IP SLAs ICMP path jitter operation.
operation (Optional) Number of the IP SLAs operation to display.
tabular (Optional) Displays information in a column format, reducing the number of screens required to display the information. This is the default.
full (Optional) Displays all information, using identifiers next to each displayed value.
Release Modification
12.3(14)T This command was introduced.
12.4(2)T This command was replaced by the show ip sla monitor statistics aggregated details command.
12.2(31)SB2 This command was integrated into Cisco IOS Release 12.2(31)SB2. This command replaces the show rtr distributions-statistics command.
12.2(33)SXH This command was integrated into Cisco IOS Release 12.2(33)SXH.
SLA-48Cisco IOS IP SLAs Command Reference
Release 12.2SX

show ip sla monitor distributions-statistics
This command shows information collected over the past two hours, unless you specify a different amount of time using the hours-of-statistics-kept command.
You can also use the show ip sla monitor collection-statistics and show ip sla monitor totals-statistics commands to display additional statistical information.
Examples The following is sample output from the show ip sla monitor distributions-statistics command:
Router# show ip sla monitor distributions-statistics
Captured Statistics Multiple Lines per Entry
Line 1Entry = Entry NumberStartT = Start Time of Entry (hundredths of seconds)Pth = Path IndexHop = Hop in Path IndexDst = Time Distribution IndexComps = Operations CompletedOvrTh = Operations Completed Over ThresholdsSumCmp = Sum of Completion Times (milliseconds)Line 2SumCmp2L = Sum of Completion Times Squared Low 32 Bits (milliseconds)SumCmp2H = Sum of Completion Times Squared High 32 Bits (milliseconds)TMax = Completion Time Maximum (milliseconds)TMin = Completion Time Minimum (milliseconds)Entry StartT Pth Hop Dst Comps OvrTh SumCmp SumCmp2L SumCmp2H TMax TMin1 17417068 1 1 1 2 0 128 8192 0 64 64
The fields shown in the display are self-explanatory.
Related Commands Command Description
show ip sla monitor collection-statistics
Displays statistical errors for all IP SLAs operations or the specified operation.
show ip sla monitor configuration
Displays configuration values including all defaults for all IP SLAs operations or the specified operation.
show ip sla monitor totals-statistics
Displays the total statistical values (accumulation of error counts and completions) for all IP SLAs operations or the specified operation.
SLA-49Cisco IOS IP SLAs Command Reference
Release 12.2SX

show ip sla monitor enhanced-history collection-statistics
show ip sla monitor enhanced-history collection-statistics
Note Effective with Cisco IOS Release 12.4(4)T, the show ip sla monitor enhanced-history collection-statistics command is replaced by the show ip sla enhanced-history collection-statistics command. See the show ip sla enhanced-history collection-statistics command for more information.
To display enhanced history statistics for all collected history buckets for the specified Cisco IOS IP Service Level Agreements (SLAs) operation, use the show ip sla monitor enhanced-history collection-statistics command in user EXEC or privileged EXEC mode.
show ip sla monitor enhanced-history collection-statistics [operation-number] [interval seconds]
Syntax Description
Command Modes User EXECPrivileged EXEC
Command History
Usage Guidelines This command displays data for each bucket of enhanced history data. Data is shown individually (one after the other).
The number of buckets and the collection interval is set using the enhanced-history command.
You can also use the following commands to display additional statistics or history information, or to view the status of the operation:
• show ip sla monitor enhanced-history distribution-statistics
• show ip sla monitor statistics
• show ip sla monitor statistics aggregated
operation-number (Optional) Number of the operation for which enhanced history statistics is displayed.
interval seconds (Optional) Displays enhanced history distribution statistics for only the specified aggregation interval.
Release Modification
12.3(14)T This command was introduced.
12.4(4)T This command was replaced by the show ip sla enhanced-history collection-statistics command.
12.2(31)SB2 This command was integrated into Cisco IOS Release 12.2(31)SB2. This command replaces the show rtr enhanced-history collection-statistics command.
12.2(33)SXH This command was integrated into Cisco IOS Release 12.2(33)SXH.
SLA-50Cisco IOS IP SLAs Command Reference
Release 12.2SX

show ip sla monitor enhanced-history collection-statistics
Tip If the letter n appears in your output, or not all fields are displayed, you should increase the screen width for your command line interface display (for example, using the width line configuration command or the terminal width EXEC mode command).
Examples The following example shows sample output for the show ip sla monitor enhanced-history collection-statistics command. The output of this command will vary depending on the type of IP SLAs operation.
Router# show ip sla monitor enhanced-history collection-statistics 1
Entry number: 1Aggregation Interval: 900
Bucket Index: 1Aggregation start time 00:15:00.003 UTC Thur May 1 2003Target Address: Number of failed operations due to a Disconnect: 0Number of failed operations due to a Timeout: 0Number of failed operations due to a Busy: 0Number of failed operations due to a No Connection: 0Number of failed operations due to an Internal Error: 0Number of failed operations due to a Sequence Error: 0Number of failed operations due to a Verify Error: 0...
Table 17 describes the significant fields shown in the display.
Related Commands
Table 17 show ip sla monitor enhanced-history collection-statistics Field Descriptions
Field Description
Aggregation Interval The number of seconds the operation runs for each enhanced history bucket. For example, a value of 900 indicates that statistics were gathered for 15 minutes before the next bucket was created.
Bucket Index The number identifying the collection bucket. The number of buckets is set using the enhanced-history IP SLA monitor configuration command.
Command Description
ip sla monitor Allows configuration of IP SLA operations by entering IP SLA monitor configuration mode for the specified operation number.
show ip sla monitor enhanced-history distribution-statistics
Displays enhanced history distribution statistics for IP SLAs operations in tabular format.
show ip sla monitor statistics Displays the current operational status and statistics of all IP SLAs operations or a specified operation.
show ip sla monitor statistics aggregated
Displays the aggregated statistical errors and distribution information for all IP SLAs operations or a specified operation.
SLA-51Cisco IOS IP SLAs Command Reference
Release 12.2SX

show ip sla monitor enhanced-history distribution-statistics
show ip sla monitor enhanced-history distribution-statistics
Note Effective with Cisco IOS Release 12.4(4)T, the show ip sla monitor enhanced-history distribution-statistics command is replaced by the show ip sla enhanced-history distribution-statistics command. See the show ip sla enhanced-history distribution-statistics command for more information.
To display enhanced history distribution statistics for Cisco IOS IP Service Level Agreements (SLAs) operations in tabular format, use the show ip sla monitor enhanced-history distribution-statistics command in user EXEC or privileged EXEC mode.
show ip sla monitor enhanced-history distribution-statistics [operation-number [interval seconds]]
Syntax Description
Command Modes User EXECPrivileged EXEC
Command History
Usage Guidelines The distribution statistics consist of the following:
• The sum of completion times (used to calculate the mean)
• The sum of the completion times squared (used to calculate standard deviation)
• The maximum and minimum completion times
• The number of completed attempts
You can also use the following commands to display additional statistics or history information, or to view the status of the operation:
• show ip sla monitor enhanced-history collection-statistics
operation-number (Optional) Number of the operation for which enhanced history statistics is displayed.
interval seconds (Optional) Displays enhanced history distribution statistics for only the specified aggregation interval for only the specified operation.
Release Modification
12.3(14)T This command was introduced.
12.4(4)T This command was replaced by the show ip sla enhanced-history distribution-statistics command.
12.2(31)SB2 This command was integrated into Cisco IOS Release 12.2(31)SB2. This command replaces the show rtr enhanced-history distribution-statistics command.
12.2(33)SXH This command was integrated into Cisco IOS Release 12.2(33)SXH.
SLA-52Cisco IOS IP SLAs Command Reference
Release 12.2SX

show ip sla monitor enhanced-history distribution-statistics
• show ip sla monitor statistics
• show ip sla monitor statistics aggregated
Tip If the letter n appears in your output, or not all fields are displayed, you should increase the screen width for your command line interface display (for example, using the width line configuration command or the terminal width EXEC mode command).
Examples The following is sample output from the show ip sla monitor enhanced-history distribution-statistics command. The fields are defined at the beginning of the output for the command. RTT means round-trip time.
Router# show ip sla monitor enhanced-history distribution-statistics 3
Point by point Enhanced History
Entry = Entry NumberInt = Aggregation Interval (seconds)BucI = Bucket IndexStartT = Aggregation Start TimePth = Path indexHop = Hop in path indexComps = Operations completedOvrTh = Operations completed over thresholdsSumCmp = Sum of RTT (milliseconds)SumCmp2L = Sum of RTT squared low 32 bits (milliseconds)SumCmp2H = Sum of RTT squared high 32 bits (milliseconds)TMax = RTT maximum (milliseconds)TMin = RTT minimum (milliseconds)
Entry Int BucI StartT Pth Hop Comps OvrTh SumCmp SumCmp2L SumCmp2H TMax TMin3 900 1 257850000 1 1 3 0 43 617 0 15 143 900 2 258750002 1 1 3 0 45 677 0 16 143 900 3 259650000 1 1 3 0 44 646 0 15 143 900 4 260550002 1 1 3 0 42 594 0 15 123 900 5 261450003 1 1 3 0 42 590 0 15 133 900 6 262350001 1 1 3 0 46 706 0 16 153 900 7 263250003 1 1 3 0 46 708 0 16 14...
The time elapsed between BucketIndex 1 (started at 257,850,000) and BucketIndex 2 (started at 258,750,002) in this example is 900,002 milliseconds, or 900 seconds.
Table 18 describes the significant fields shown in the display.
SLA-53Cisco IOS IP SLAs Command Reference
Release 12.2SX
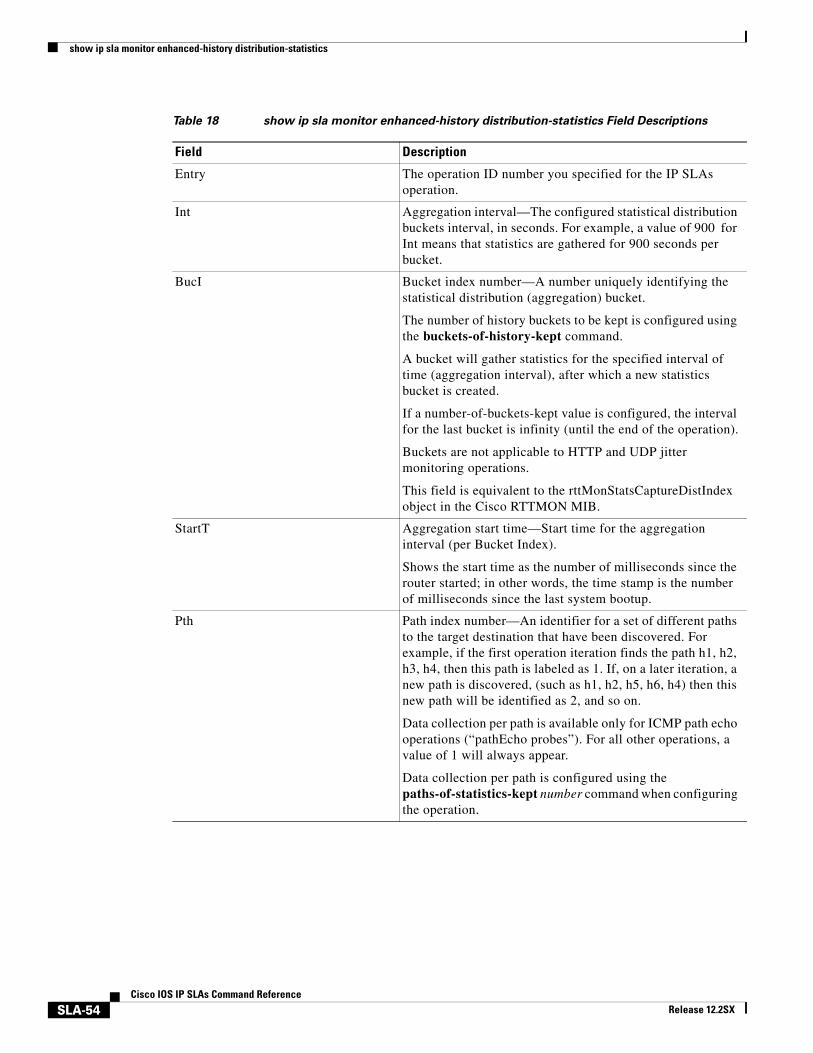
show ip sla monitor enhanced-history distribution-statistics
Table 18 show ip sla monitor enhanced-history distribution-statistics Field Descriptions
Field Description
Entry The operation ID number you specified for the IP SLAs operation.
Int Aggregation interval—The configured statistical distribution buckets interval, in seconds. For example, a value of 900 for Int means that statistics are gathered for 900 seconds per bucket.
BucI Bucket index number—A number uniquely identifying the statistical distribution (aggregation) bucket.
The number of history buckets to be kept is configured using the buckets-of-history-kept command.
A bucket will gather statistics for the specified interval of time (aggregation interval), after which a new statistics bucket is created.
If a number-of-buckets-kept value is configured, the interval for the last bucket is infinity (until the end of the operation).
Buckets are not applicable to HTTP and UDP jitter monitoring operations.
This field is equivalent to the rttMonStatsCaptureDistIndex object in the Cisco RTTMON MIB.
StartT Aggregation start time—Start time for the aggregation interval (per Bucket Index).
Shows the start time as the number of milliseconds since the router started; in other words, the time stamp is the number of milliseconds since the last system bootup.
Pth Path index number—An identifier for a set of different paths to the target destination that have been discovered. For example, if the first operation iteration finds the path h1, h2, h3, h4, then this path is labeled as 1. If, on a later iteration, a new path is discovered, (such as h1, h2, h5, h6, h4) then this new path will be identified as 2, and so on.
Data collection per path is available only for ICMP path echo operations (“pathEcho probes”). For all other operations, a value of 1 will always appear.
Data collection per path is configured using the paths-of-statistics-kept number command when configuring the operation.
SLA-54Cisco IOS IP SLAs Command Reference
Release 12.2SX

show ip sla monitor enhanced-history distribution-statistics
Hop Hop Index Number—Statistics data per hop. A hop is data transmission between two points in a path (for example, from device h2 to device h3).
Data collection per hop is available only for ICMP path echo operations (“pathEcho probes”). For all other operations, a value of “1” will always appear.
Data collection per hop is configured using the hops-of-statistics-kept number command when configuring the operation.
This field is equivalent to the rrttMonStatsCaptureHopIndex object in the Cisco RTTMON MIB.
Comps Completions—The number of round-trip time operations that have completed without an error and without timing out, per bucket index.
This object has the special behavior as defined by the ROLLOVER NOTE in the DESCRIPTION of the Cisco Rttmon MIB object.
SumCmp Sum of completed operation times (1)—The total of all round-trip time values for all successful operations in the row, in milliseconds.
SumCmp2L Sum of the squares of completed operation times (2), Low-Order—The sum of the square roots of round-trip times for operations that were successfully measured, in milliseconds; displays the low-order 32 bits of the value only.
• 32 low-order bits and 32 high-order bits are ordered in unsigned 64-bit integers (Int64) as follows:
-------------------------------------------------
| High-order 32 bits | Low-order 32 bits |
-------------------------------------------------
• The “SumCmp2” values are split into “high-order” and “low-order” numbers because of limitations of Simple Network Management Protocol (SNMP). The maximum value allowed for an SNMP object is 4,294,967,295 (the Gauge32 limit).
If the sum of the square roots for your operation exceeds this value, then the “high-order” value will be utilized. (For example, the number 4,294,967,296 would have all low-order bits as 0, and the right-most high-order bit would be 1).
• The low-order value (SumCmp2L) appears first in the output because in most cases, the value will be less than 4,294,967,295, which means that the value of SumCmp2H will appear as zero.
Table 18 show ip sla monitor enhanced-history distribution-statistics Field Descriptions
Field Description
SLA-55Cisco IOS IP SLAs Command Reference
Release 12.2SX

show ip sla monitor enhanced-history distribution-statistics
Related Commands
SumCmp2H Sum of the squares of completed operation times (2), High-Order—The high-order 32 bits of the accumulated squares of completion times (in milliseconds) of operations that completed successfully.
TMax Round-trip time, maximum—The highest recorded round-trip time, in milliseconds, per aggregation interval.
TMin Round-trip time, minimum—The lowest recorded round-trip time, in milliseconds, per aggregation interval.
Table 18 show ip sla monitor enhanced-history distribution-statistics Field Descriptions
Field Description
Command Description
ip sla monitor Allows configuration of IP SLA operations by entering IP SLA monitor configuration mode for the specified operation number.
show ip sla monitor enhanced-history collection-statistics
Displays enhanced history statistics for all collected history buckets for the specified IP SLAs operation.
show ip sla monitor statistics Displays the current operational status and statistics of all IP SLAs operations or a specified operation.
show ip sla monitor statistics aggregated
Displays the aggregated statistical errors and distribution information for all IP SLAs operations or a specified operation.
SLA-56Cisco IOS IP SLAs Command Reference
Release 12.2SX

show ip sla monitor group schedule
show ip sla monitor group schedule
Note Effective with Cisco IOS Release 12.4(4)T, the show ip sla monitor group schedule command is replaced by the show ip sla group schedule command. See the show ip sla group schedule command for more information.
To display the group schedule details for Cisco IOS IP Service Level Agreements (SLAs) operations, use the show ip sla monitor group schedule command in user EXEC or privileged EXEC mode.
show ip sla monitor group schedule [group-operation-number]
Syntax Description
Command Modes User EXECPrivileged EXEC
Command History
Examples The following is sample output from the show ip sla monitor group schedule command that shows information about group (multiple) scheduling. The last line in the example indicates that the IP SLAs operations are multiple scheduled (TRUE):
Router# show ip sla monitor group schedule
Multi-Scheduling Configuration:Group Entry Number: 1Probes to be scheduled: 2,3,4,9-30,89Schedule period :60Group operation frequency: 30Multi-scheduled: TRUE
The following is sample output from the show ip sla monitor group schedule command that shows information about group (multiple) scheduling, with the frequency value the same as the schedule period value, the life value as 3600 seconds, and the ageout value as never:
Router# show ip sla monitor group scheduleGroup Entry Number: 1Probes to be scheduled: 3,4,6-10Total number of probes: 7Schedule period: 20Group operation frequency: Equals schedule periodStatus of entry (SNMP RowStatus): Active
group-operation-number (Optional) Number of the IP SLAs group operation to display.
Release Modification
12.3(14)T This command was introduced.
12.4(4)T This command was replaced by the show ip sla group schedule command.
12.2(31)SB2 This command was integrated into Cisco IOS Release 12.2(31)SB2. This command replaces the show rtr group schedule command.
12.2(33)SXH This command was integrated into Cisco IOS Release 12.2(33)SXH.
SLA-57Cisco IOS IP SLAs Command Reference
Release 12.2SX

show ip sla monitor group schedule
Next Scheduled Start Time: Start Time already passedLife (seconds): 3600Entry Ageout (seconds): never
Table 19 describes the significant fields shown in the displays.
Related Commands
Table 19 show ip sla monitor group schedule Field Descriptions
Field Description
Group Entry Number The operation group number specified for IP SLAs multiple operations scheduling.
Probes to be scheduled The operations numbers specified in the operation group 1.
Scheduled period The time (in seconds) for which the IP SLAs group is scheduled.
Group operation frequency The frequency at which each operation is started.
Multi-scheduled The value TRUE shows that group scheduling is active.
Command Description
show ip sla monitor configuration
Displays the configuration details for IP SLAs operations.
SLA-58Cisco IOS IP SLAs Command Reference
Release 12.2SX

show ip sla monitor history
show ip sla monitor history
Note Effective with Cisco IOS Release 12.4(4)T, the show ip sla monitor history command is replaced by the show ip sla history command. See the show ip sla history command for more information.
To display history collected for all Cisco IOS IP Service Level Agreements (SLAs) operations or for a specified operation, use the show ip sla monitor history command in user EXEC or privileged EXEC mode.
show ip sla monitor history [operation-number] [tabular | full]
Syntax Description
Defaults Tabular format history for all operations is displayed.
Command Modes User EXECPrivileged EXEC
Command History
Usage Guidelines Table 20 lists the Response Return values used in the output of the show ip sla monitor history command. If the default (tabular) format is used, the Response Return description is displayed as a code in the Sense column. If the full format is used, the Response Return is displayed as indicated in the Description column.
operation-number (Optional) Number of the operation for which history details is displayed.
tabular (Optional) Displays information in a column format, reducing the number of screens required to display the information. This is the default.
full (Optional) Displays all information, using identifiers next to each displayed value.
Release Modification
12.3(14)T This command was introduced.
12.4(4)T This command was replaced by the show ip sla history command.
12.2(31)SB2 This command was integrated into Cisco IOS Release 12.2(31)SB2. This command replaces the show rtr history command.
12.2(33)SXH This command was integrated into Cisco IOS Release 12.2(33)SXH.
Table 20 Response Return (Sense Column) Codes
Code Description
1 Okay.
2 Disconnected.
3 Over threshold.
SLA-59Cisco IOS IP SLAs Command Reference
Release 12.2SX

show ip sla monitor history
Examples The following is sample output from the show ip sla monitor history command in tabular format:
Router# show ip sla monitor history
Point by point History Multiple Lines per EntryLine 1Entry = Entry NumberLifeI = Life IndexBucketI = Bucket IndexSampleI = Sample IndexSampleT = Sample Start TimeCompT = Completion Time (milliseconds)Sense = Response Return Code
Line 2 has the Target AddressEntry LifeI BucketI SampleI SampleT CompT Sense2 1 1 1 17436548 16 1
AB 45 A0 16 2 1 2 1 17436551 4 1
AC 12 7 29 2 1 2 2 17436551 1 1
AC 12 5 22 2 1 2 3 17436552 4 1
AB 45 A7 22 2 1 2 4 17436552 4 1
AB 45 A0 16
Related Commands
4 Timeout.
5 Busy.
6 Not connected.
7 Dropped.
8 Sequence error.
9 Verify error.
10 Application specific.
Table 20 Response Return (Sense Column) Codes (continued)
Code Description
Command Description
show ip sla monitor configuration
Displays configuration values including all defaults for all IP SLAs operations or the specified operation.
SLA-60Cisco IOS IP SLAs Command Reference
Release 12.2SX

show ip sla monitor mpls-lsp-monitor configuration
show ip sla monitor mpls-lsp-monitor configurationTo display configuration settings for IP Service Level Agreements (SLAs) label switched path (LSP) Health Monitor operations, use the show ip sla monitor mpls-lsp-monitor configuration command in user EXEC or privileged EXEC mode.
show ip sla monitor mpls-lsp-monitor configuration [operation-number]
Syntax Description
Command Modes User EXECPrivileged EXEC
Command History
Usage Guidelines If the identification number of an LSP Health Monitor operation is not specified, configuration values for all the configured LSP Health Monitor operations will be displayed.
Examples The following is sample output from the show ip sla monitor mpls-lsp-monitor configuration command:
Router# show ip sla monitor mpls-lsp-monitor configuration 1
Entry Number : 1Modification time : *12:18:21.830 PDT Fri Aug 19 2005Operation Type : echoVrf Name : ipsla-vrf-allTag : EXP Value : 0Timeout(ms) : 1000Threshold(ms) : 5000Frequency(sec) : Equals schedule periodLSP Selector : 127.0.0.1ScanInterval(min) : 1Delete Scan Factor : 1Operations List : 100001-100003Schedule Period(sec): 60Request size : 100Start Time : Start Time already passedSNMP RowStatus : ActiveTTL value : 255Reply Mode : ipv4Reply Dscp Bits : Secondary Frequency : Enabled on Timeout Value(sec) : 10
operation-number (Optional) Number of the LSP Health Monitor operation for which the details will be displayed.
Release Modification
12.2(31)SB2 This command was introduced. This command replaces the show rtr mpls-lsp-monitor configuration command.
12.2(33)SXH This command was integrated into Cisco IOS Release 12.2(33)SXH.
SLA-61Cisco IOS IP SLAs Command Reference
Release 12.2SX

show ip sla monitor mpls-lsp-monitor configuration
Reaction Configs : Reaction : connectionLoss Threshold Type : Consecutive Threshold Count : 3 Action Type : Trap Only Reaction : timeout Threshold Type : Consecutive Threshold Count : 3 Action Type : Trap Only
The following is sample output from the show ip sla monitor mpls-lsp-monitor configuration command when the LSP discovery option is configured:
Router# show ip sla monitor mpls-lsp-monitor configuration 100
Entry Number : 100Modification time : *21:50:16.411 GMT Tue Jun 20 2006Operation Type : echoVrf Name : saa-vrf-allTag : EXP Value : 0Timeout(ms) : 5000Threshold(ms) : 50Frequency(sec) : Equals schedule periodScanInterval(min) : 1Delete Scan Factor : 1Operations List : 100002Schedule Period(sec): 30Request size : 100Start Time : Start Time already passedSNMP RowStatus : ActiveTTL value : 255Reply Mode : ipv4Reply Dscp Bits : Path Discover : Enable Maximum sessions : 1 Session Timeout(seconds) : 120 Base LSP Selector : 127.0.0.1 Echo Timeout(seconds) : 5 Send Interval(msec) : 0 Label Shimming Mode : force-explicit-null Number of Stats Hours : 2 Scan Period(minutes) : 3Secondary Frequency : Enabled on Connection Loss and Timeout Value(sec) : 5Reaction Configs : Reaction : Lpd Group Retry Number : 3 Action Type : Trap Only
Table 21 describes the significant fields shown in the displays.
Table 21 show ip sla monitor mpls-lsp-monitor configuration Field Descriptions
Field Description
Entry Number Identification number for the LSP Health Monitor operation.
Operation Type Type of IP SLAs operation configured by the LSP Health Monitor operation.
SLA-62Cisco IOS IP SLAs Command Reference
Release 12.2SX
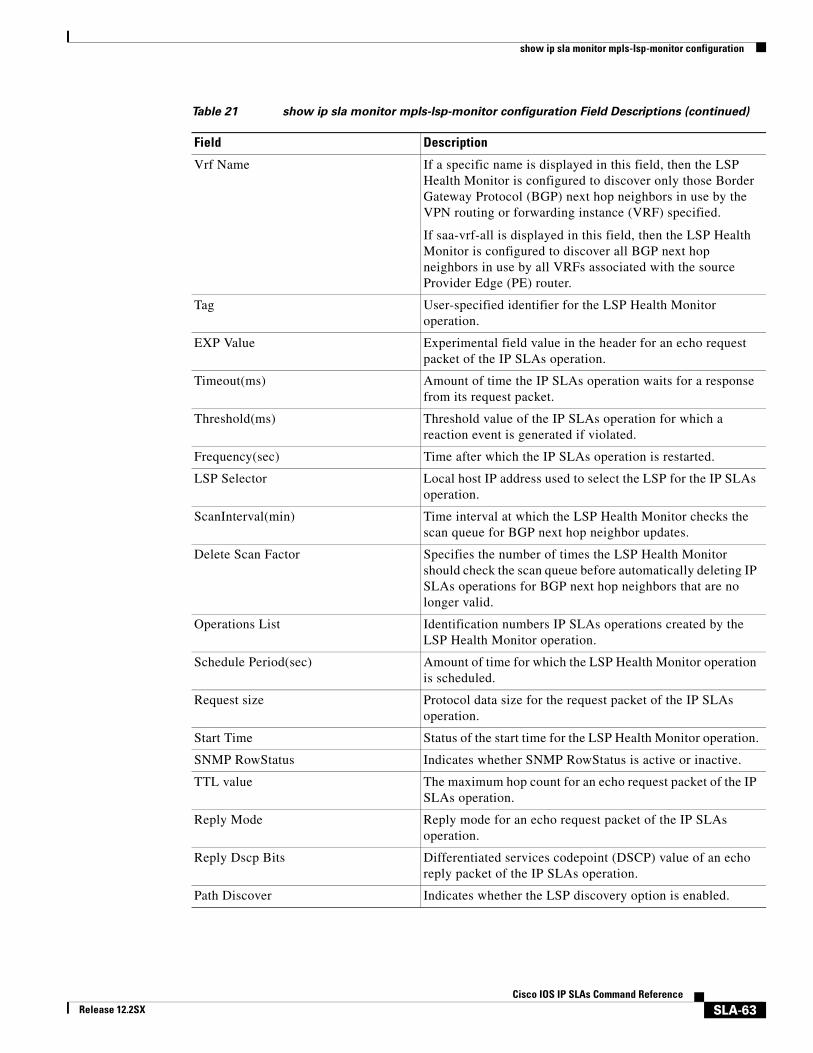
show ip sla monitor mpls-lsp-monitor configuration
Vrf Name If a specific name is displayed in this field, then the LSP Health Monitor is configured to discover only those Border Gateway Protocol (BGP) next hop neighbors in use by the VPN routing or forwarding instance (VRF) specified.
If saa-vrf-all is displayed in this field, then the LSP Health Monitor is configured to discover all BGP next hop neighbors in use by all VRFs associated with the source Provider Edge (PE) router.
Tag User-specified identifier for the LSP Health Monitor operation.
EXP Value Experimental field value in the header for an echo request packet of the IP SLAs operation.
Timeout(ms) Amount of time the IP SLAs operation waits for a response from its request packet.
Threshold(ms) Threshold value of the IP SLAs operation for which a reaction event is generated if violated.
Frequency(sec) Time after which the IP SLAs operation is restarted.
LSP Selector Local host IP address used to select the LSP for the IP SLAs operation.
ScanInterval(min) Time interval at which the LSP Health Monitor checks the scan queue for BGP next hop neighbor updates.
Delete Scan Factor Specifies the number of times the LSP Health Monitor should check the scan queue before automatically deleting IP SLAs operations for BGP next hop neighbors that are no longer valid.
Operations List Identification numbers IP SLAs operations created by the LSP Health Monitor operation.
Schedule Period(sec) Amount of time for which the LSP Health Monitor operation is scheduled.
Request size Protocol data size for the request packet of the IP SLAs operation.
Start Time Status of the start time for the LSP Health Monitor operation.
SNMP RowStatus Indicates whether SNMP RowStatus is active or inactive.
TTL value The maximum hop count for an echo request packet of the IP SLAs operation.
Reply Mode Reply mode for an echo request packet of the IP SLAs operation.
Reply Dscp Bits Differentiated services codepoint (DSCP) value of an echo reply packet of the IP SLAs operation.
Path Discover Indicates whether the LSP discovery option is enabled.
Table 21 show ip sla monitor mpls-lsp-monitor configuration Field Descriptions (continued)
Field Description
SLA-63Cisco IOS IP SLAs Command Reference
Release 12.2SX

show ip sla monitor mpls-lsp-monitor configuration
Related Commands
Maximum sessions Maximum number of BGP next hop neighbors that can be concurrently undergoing LSP discovery for a single LSP Health Monitor operation.
Session Timeout (seconds) The amount of time the LSP discovery process waits for a response to its LSP discovery request for a particular BGP next hop neighbor.
Base LSP Selector The base IP address used to select the LSPs of the LSP discovery groups.
Echo Timeout (seconds) The amount of time the LSP discovery process waits for a response to its echo request packets.
Send Interval (msec) The time interval (in milliseconds) between MPLS echo requests that are sent as part of the LSP discovery process.
Label Shimming Mode Indicates whether the MPLS explicit null label option is enabled for the echo request packets.
Number of Stats Hours The number of hours for which LSP discovery group statistics are maintained.
Scan Period (minutes) The amount of time after which the LSP discovery process can restart.
Secondary Frequency Reaction condition that will enable the secondary frequency option.
Value(sec) Secondary frequency value.
Reaction Configs The configured proactive threshold monitoring settings for the IP SLAs operation.
Reaction Reaction condition being monitored.
Retry Number Indicates the number of times the equal-cost multipaths belonging to an LSP discovery group are retested when a reaction condition is detected.
Threshold Type Specifies when an action should be performed as a result of a reaction event.
Threshold Count The number of times a reaction condition can occur before an action should be performed.
Action Type Type of action that should be performed as a result of a reaction event.
Table 21 show ip sla monitor mpls-lsp-monitor configuration Field Descriptions (continued)
Field Description
Command Description
auto ip sla mpls-lsp-monitor
Begins configuration for an IP SLAs LSP Health Monitor operation and enters auto IP SLA MPLS configuration mode.
SLA-64Cisco IOS IP SLAs Command Reference
Release 12.2SX

show ip sla monitor mpls-lsp-monitor configuration
auto ip sla mpls-lsp-monitor reaction-configuration
Configures proactive threshold monitoring parameters for an IP SLAs LSP Health Monitor operation.
auto ip sla mpls-lsp-monitor schedule
Configures the scheduling parameters for an IP SLAs LSP Health Monitor operation.
Command Description
SLA-65Cisco IOS IP SLAs Command Reference
Release 12.2SX
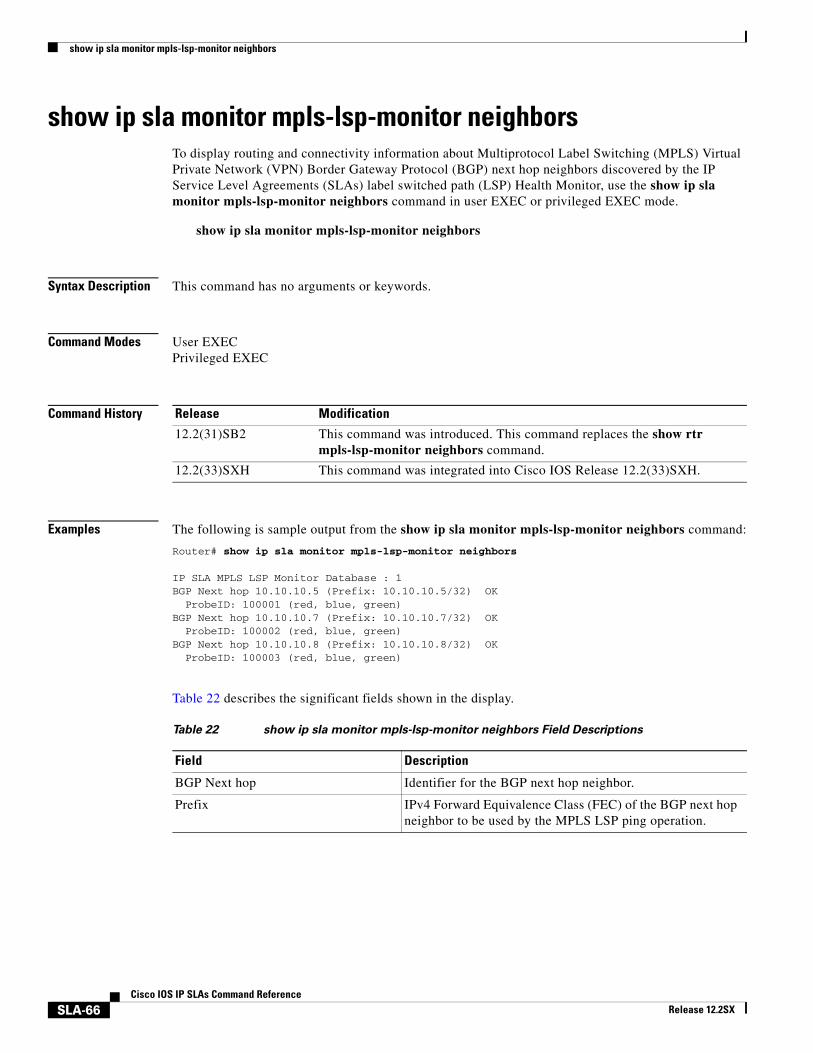
show ip sla monitor mpls-lsp-monitor neighbors
show ip sla monitor mpls-lsp-monitor neighborsTo display routing and connectivity information about Multiprotocol Label Switching (MPLS) Virtual Private Network (VPN) Border Gateway Protocol (BGP) next hop neighbors discovered by the IP Service Level Agreements (SLAs) label switched path (LSP) Health Monitor, use the show ip sla monitor mpls-lsp-monitor neighbors command in user EXEC or privileged EXEC mode.
show ip sla monitor mpls-lsp-monitor neighbors
Syntax Description This command has no arguments or keywords.
Command Modes User EXECPrivileged EXEC
Command History
Examples The following is sample output from the show ip sla monitor mpls-lsp-monitor neighbors command:
Router# show ip sla monitor mpls-lsp-monitor neighbors
IP SLA MPLS LSP Monitor Database : 1BGP Next hop 10.10.10.5 (Prefix: 10.10.10.5/32) OK ProbeID: 100001 (red, blue, green)BGP Next hop 10.10.10.7 (Prefix: 10.10.10.7/32) OK ProbeID: 100002 (red, blue, green)BGP Next hop 10.10.10.8 (Prefix: 10.10.10.8/32) OK ProbeID: 100003 (red, blue, green)
Table 22 describes the significant fields shown in the display.
Release Modification
12.2(31)SB2 This command was introduced. This command replaces the show rtr mpls-lsp-monitor neighbors command.
12.2(33)SXH This command was integrated into Cisco IOS Release 12.2(33)SXH.
Table 22 show ip sla monitor mpls-lsp-monitor neighbors Field Descriptions
Field Description
BGP Next hop Identifier for the BGP next hop neighbor.
Prefix IPv4 Forward Equivalence Class (FEC) of the BGP next hop neighbor to be used by the MPLS LSP ping operation.
SLA-66Cisco IOS IP SLAs Command Reference
Release 12.2SX

show ip sla monitor mpls-lsp-monitor neighbors
Related Commands
ProbeID The identification number of the IP SLAs operation. The names of the VPN routing or forwarding instances (VRFs) that contain routing entries for the specified BGP next hop neighbor are listed in parentheses.
OK LSP ping or LSP traceroute connectivity status between the source Provider Edge (PE) router and specified BGP next hop neighbor. Connectivity status can be the following:
• OK—Successful reply.
• ConnectionLoss—Reply is from a device that is not egress for the Forward Equivalence Class (FEC).
• Timeout—Echo request timeout.
• Unknown—State of LSP is not known.
Table 22 show ip sla monitor mpls-lsp-monitor neighbors Field Descriptions (continued)
Field Description
Command Description
auto ip sla mpls-lsp-monitor
Begins configuration for an IP SLAs LSP Health Monitor operation and enters auto IP SLA MPLS configuration mode.
SLA-67Cisco IOS IP SLAs Command Reference
Release 12.2SX

show ip sla monitor mpls-lsp-monitor scan-queue
show ip sla monitor mpls-lsp-monitor scan-queueTo display information about adding or deleting Border Gateway Protocol (BGP) next hop neighbors from a particular Multiprotocol Label Switching (MPLS) Virtual Private Network (VPN) of an IP Service Level Agreements (SLAs) LSP Health Monitor operation, use the show ip sla monitor mpls-lsp-monitor scan-queue command in user EXEC or privileged EXEC mode.
show ip sla monitor mpls-lsp-monitor scan-queue operation-number
Syntax Description
Command Modes User EXECPrivileged EXEC
Command History
Examples The following is sample output from the show ip sla monitor mpls-lsp-monitor scan-queue command:
Router# show ip sla monitor mpls-lsp-monitor scan-queue 1
Next scan Time after: 23 SecsNext Delete scan Time after: 83 Secs
BGP Next hop Prefix vrf Add/Delete?10.10.10.8 10.10.10.8/32 red Add10.10.10.8 10.10.10.8/32 blue Add10.10.10.8 10.10.10.8/32 green Add
Table 23 describes the significant fields shown in the display.
operation-number Number of the LSP Health Monitor operation for which the details will be displayed.
Release Modification
12.2(31)SB2 This command was introduced. This command replaces the show rtr mpls-lsp-monitor scan-queue command.
12.2(33)SXH This command was integrated into Cisco IOS Release 12.2(33)SXH.
SLA-68Cisco IOS IP SLAs Command Reference
Release 12.2SX

show ip sla monitor mpls-lsp-monitor scan-queue
Related Commands
Table 23 show ip sla monitor mpls-lsp-monitor scan-queue Field Descriptions
Field Description
Next scan Time after Amount of time left before the LSP Health Monitor checks the scan queue for information about adding BGP next hop neighbors to a particular VPN. At the start of each scan time, IP SLAs operations are created for all newly discovered neighbors.
Next Delete scan Time after Amount of time left before the LSP Health Monitor checks the scan queue for information about deleting BGP next hop neighbors from a particular VPN. At the start of each delete scan time, IP SLAs operations are deleted for neighbors that are no longer valid.
BGP Next hop Identifier for the BGP next hop neighbor.
Prefix IPv4 Forward Equivalence Class (FEC) of the BGP next hop neighbor to be used by the MPLS LSP ping operation.
vrf Name of the VPN routing or forwarding instance (VRF) that contains a routing entry for the specified BGP next hop neighbor.
Add/Delete Indicates that the specified BGP next hop neighbor will be added to or removed from the specified VPN.
Command Description
auto ip sla mpls-lsp-monitor
Begins configuration for an IP SLAs LSP Health Monitor operation and enters auto IP SLA MPLS configuration mode.
delete-scan-factor Specifies the number of times the LSP Health Monitor should check the scan queue before automatically deleting IP SLAs operations for BGP next hop neighbors that are no longer valid.
mpls discovery vpn interval
Specifies the time interval at which routing entries that are no longer valid are removed from the BGP next hop neighbor discovery database of an MPLS VPN.
scan-interval Specifies the time interval (in minutes) at which the LSP Health Monitor checks the scan queue for BGP next hop neighbor updates.
SLA-69Cisco IOS IP SLAs Command Reference
Release 12.2SX
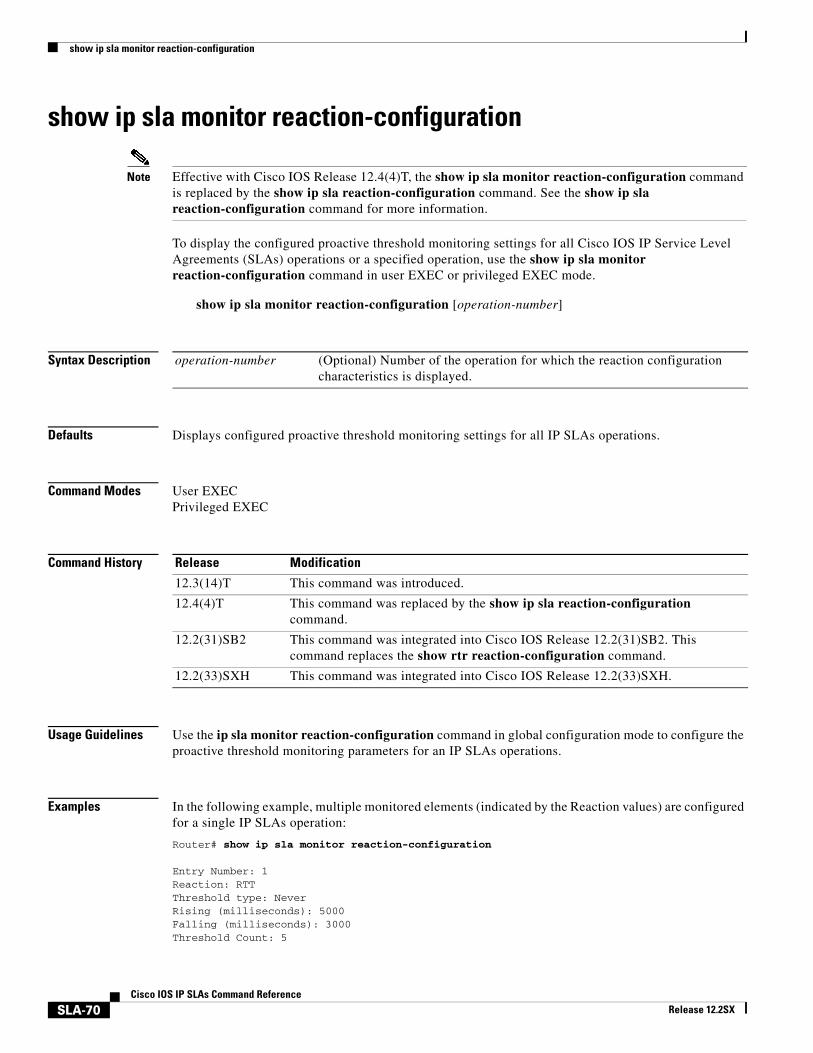
show ip sla monitor reaction-configuration
show ip sla monitor reaction-configuration
Note Effective with Cisco IOS Release 12.4(4)T, the show ip sla monitor reaction-configuration command is replaced by the show ip sla reaction-configuration command. See the show ip sla reaction-configuration command for more information.
To display the configured proactive threshold monitoring settings for all Cisco IOS IP Service Level Agreements (SLAs) operations or a specified operation, use the show ip sla monitor reaction-configuration command in user EXEC or privileged EXEC mode.
show ip sla monitor reaction-configuration [operation-number]
Syntax Description
Defaults Displays configured proactive threshold monitoring settings for all IP SLAs operations.
Command Modes User EXECPrivileged EXEC
Command History
Usage Guidelines Use the ip sla monitor reaction-configuration command in global configuration mode to configure the proactive threshold monitoring parameters for an IP SLAs operations.
Examples In the following example, multiple monitored elements (indicated by the Reaction values) are configured for a single IP SLAs operation:
Router# show ip sla monitor reaction-configuration
Entry Number: 1Reaction: RTTThreshold type: NeverRising (milliseconds): 5000Falling (milliseconds): 3000Threshold Count: 5
operation-number (Optional) Number of the operation for which the reaction configuration characteristics is displayed.
Release Modification
12.3(14)T This command was introduced.
12.4(4)T This command was replaced by the show ip sla reaction-configuration command.
12.2(31)SB2 This command was integrated into Cisco IOS Release 12.2(31)SB2. This command replaces the show rtr reaction-configuration command.
12.2(33)SXH This command was integrated into Cisco IOS Release 12.2(33)SXH.
SLA-70Cisco IOS IP SLAs Command Reference
Release 12.2SX

show ip sla monitor reaction-configuration
Threshold Count2: 5Action Type: None
Reaction: jitterDSAvgThreshold type: averageRising (milliseconds): 5Falling (milliseconds): 3Threshold Count: 5Threshold Count2: 5Action Type: triggerOnly
Reaction: jitterDSAvgThreshold type: immediateRising (milliseconds): 5Falling (milliseconds): 3Threshold Count: 5Threshold Count2: 5Action Type: trapOnly
Reaction: PacketLossSD Threshold type: immediateRising (milliseconds): 5Threshold Falling (milliseconds): 3Threshold Count: 5Threshold Count2: 5Action Type: trapOnly
Table 24 describes the significant fields shown in the display.
Table 24 show ip sla monitor reaction-configuration Field Descriptions
Field Description
Reaction The monitored element configured for the specified IP SLAs operation.
Corresponds to the react {connectionLoss | jitterAvg | jitterDSAvg | jitterSDAvg | mos | PacketLossDS | PacketLossSD | rtt | timeout | verifyError} syntax in the ip sla monitor reaction-configuration command.
Threshold type The configured threshold type.
Corresponds to the threshold-type {never | immediate | consecutive | xofy | average} syntax in the ip sla monitor reaction-configuration command.
Rising (milliseconds) The upper-threshold value.
Corresponds to the threshold-value upper-threshold lower-threshold syntax in the ip sla monitor reaction-configuration command.
Falling (milliseconds) The lower-threshold value.
Corresponds to the threshold-value upper-threshold lower-threshold syntax in the ip sla monitor reaction-configuration command.
Threshold Count The x-value in the xofy threshold type, or the number-of-measurements value for the average threshold type.
SLA-71Cisco IOS IP SLAs Command Reference
Release 12.2SX
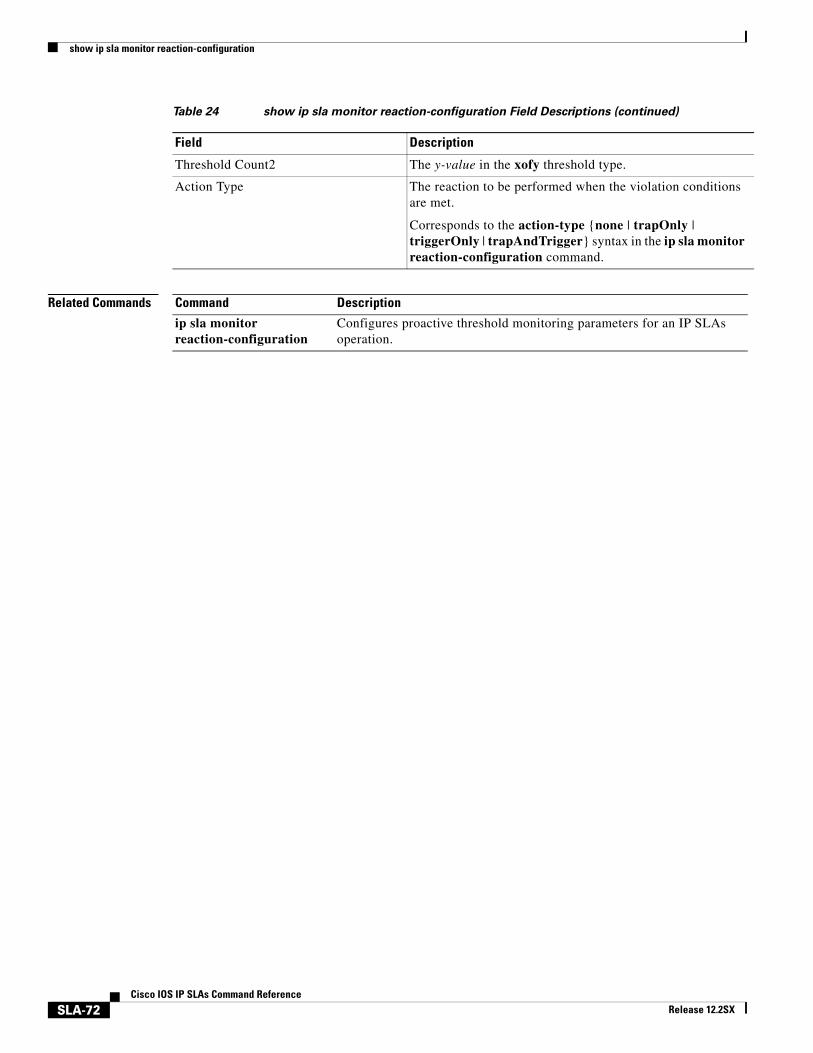
show ip sla monitor reaction-configuration
Related Commands
Threshold Count2 The y-value in the xofy threshold type.
Action Type The reaction to be performed when the violation conditions are met.
Corresponds to the action-type {none | trapOnly | triggerOnly | trapAndTrigger} syntax in the ip sla monitor reaction-configuration command.
Table 24 show ip sla monitor reaction-configuration Field Descriptions (continued)
Field Description
Command Description
ip sla monitor reaction-configuration
Configures proactive threshold monitoring parameters for an IP SLAs operation.
SLA-72Cisco IOS IP SLAs Command Reference
Release 12.2SX

show ip sla monitor reaction-trigger
show ip sla monitor reaction-trigger
Note Effective with Cisco IOS Release 12.4(4)T, the show ip sla monitor reaction-trigger command is replaced by the show ip sla reaction-trigger command. See the show ip sla reaction-trigger command for more information.
To display the reaction trigger information for all Cisco IOS IP Service Level Agreements (SLAs) operations or the specified operation, use the show ip sla monitor reaction-trigger command in user EXEC or privileged EXEC mode.
show ip sla monitor reaction-trigger [operation-number]
Syntax Description
Command Modes User EXECPrivileged EXEC
Command History
Usage Guidelines Use the show ip sla monitor reaction-trigger command to display the configuration status and operational state of target operations that will be triggered as defined with the ip sla monitor reaction-configuration global configuration command.
Examples The following is sample output from the show ip sla monitor reaction-trigger command:
Router# show ip sla monitor reaction-trigger 1
Reaction TableEntry Number: 1Target Entry Number: 2Status of Entry (SNMP RowStatus): activeOperational State: pending
Related Commands
operation-number (Optional) Number of the IP SLAs operation to display.
Release Modification
12.3(14)T This command was introduced.
12.4(4)T This command was replaced by the show ip sla reaction-trigger command.
12.2(31)SB2 This command was integrated into Cisco IOS Release 12.2(31)SB2. This command replaces the show rtr reaction-trigger command.
12.2(33)SXH This command was integrated into Cisco IOS Release 12.2(33)SXH.
Command Description
show ip sla monitor configuration
Displays configuration values including all defaults for all IP SLAs operations or the specified operation.
SLA-73Cisco IOS IP SLAs Command Reference
Release 12.2SX

show ip sla monitor responder
show ip sla monitor responder
Note Effective with Cisco IOS Release 12.4(4)T, the show ip sla monitor responder command is replaced by the show ip sla responder command. See the show ip sla responder command for more information.
To display information about the Cisco IOS IP Service Level Agreements (SLAs) Responder, use the show ip sla monitor responder command in user EXEC or privileged EXEC mode.
show ip sla monitor responder
Syntax Description This command has no arguments or keywords.
Command Modes User EXECPrivileged EXEC
Command History
Usage Guidelines Use the show ip sla monitor responder command to display information about recent sources of IP SLAs control messages, such as who has sent recent control messages and who has sent invalid control messages.
Examples The following is sample output from the show ip sla monitor responder command:
Router# show ip sla monitor responder
IP SLA Monitor Responder is: EnabledNumber of control message received: 19 Number of errors: 1Recent sources:
10.0.0.1 [19:11:49.035 UTC Sat Dec 2 1995]10.0.0.1 [19:10:49.023 UTC Sat Dec 2 1995]10.0.0.1 [19:09:48.707 UTC Sat Dec 2 1995]10.0.0.1 [19:08:48.687 UTC Sat Dec 2 1995]10.0.0.1 [19:07:48.671 UTC Sat Dec 2 1995]
Recent error sources:10.0.0.1 [19:10:49.023 UTC Sat Dec 2 1995] RTT_AUTH_FAIL
Related Commands
Release Modification
12.3(14)T This command was introduced.
12.4(4)T This command was replaced by the show ip sla responder command.
12.2(31)SB2 This command was integrated into Cisco IOS Release 12.2(31)SB2. This command replaces the show rtr responder command.
12.2(33)SXH This command was integrated into Cisco IOS Release 12.2(33)SXH.
SLA-74Cisco IOS IP SLAs Command Reference
Release 12.2SX

show ip sla monitor responder
Command Description
show ip sla monitor configuration
Displays configuration values for IP SLAs operations.
SLA-75Cisco IOS IP SLAs Command Reference
Release 12.2SX

show ip sla monitor statistics
show ip sla monitor statistics
Note Effective with Cisco IOS Release 12.4(4)T, the show ip sla monitor statistics command is replaced by the show ip sla statistics command. See the show ip sla statistics command for more information.
To display the current operational status and statistics of all Cisco IOS IP Service Level Agreements (SLAs) operations or a specified operation, use the show ip sla monitor statistics command in user EXEC or privileged EXEC mode.
show ip sla monitor statistics [operation-number] [details]
Syntax Description
Defaults Displays output for all running IP SLAs operations.
Command Modes User EXECPrivileged EXEC
Command History
Usage Guidelines Use the show ip sla monitor statistics command to display the current state of IP SLAs operations, including how much life the operation has left, whether the operation is active, and the completion time. The output will also include the monitoring data returned for the last (most recently completed) operation.
Examples The following is sample output from the show ip sla monitor statistics command:
Router# show ip sla monitor statistics
Current Operational StateEntry Number: 3Modification Time: *22:15:43.000 UTC Sun Feb 11 2001Diagnostics Text:Last Time this Entry was Reset: NeverNumber of Octets in use by this Entry: 1332
operation-number (Optional) Number of the operation for which operational status and statistics are displayed.
details (Optional) Operational status and statistics are displayed in greater detail.
Release Modification
12.3(14)T This command was introduced.
12.4(4)T This command was replaced by the show ip sla statistics command.
12.2(31)SB2 This command was integrated into Cisco IOS Release 12.2(31)SB2. This command replaces the show rtr operational-state command.
12.2(33)SXH This command was integrated into Cisco IOS Release 12.2(33)SXH.
SLA-76Cisco IOS IP SLAs Command Reference
Release 12.2SX
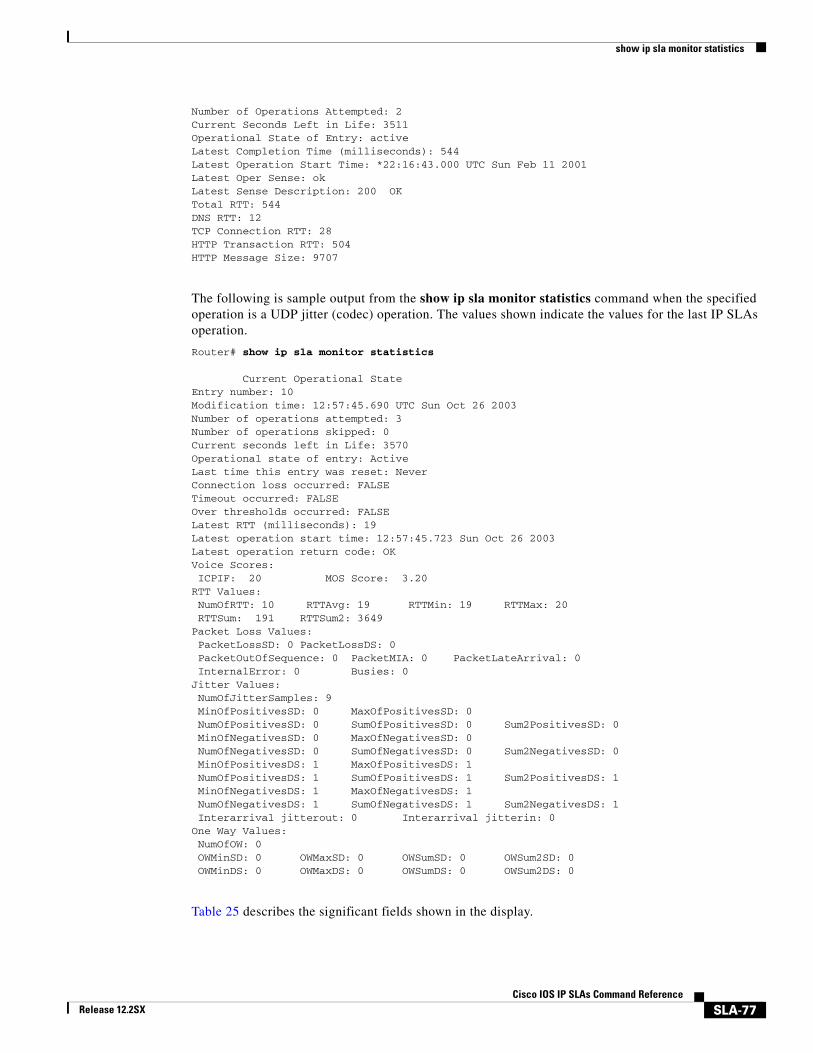
show ip sla monitor statistics
Number of Operations Attempted: 2Current Seconds Left in Life: 3511Operational State of Entry: activeLatest Completion Time (milliseconds): 544Latest Operation Start Time: *22:16:43.000 UTC Sun Feb 11 2001Latest Oper Sense: okLatest Sense Description: 200 OKTotal RTT: 544DNS RTT: 12TCP Connection RTT: 28HTTP Transaction RTT: 504HTTP Message Size: 9707
The following is sample output from the show ip sla monitor statistics command when the specified operation is a UDP jitter (codec) operation. The values shown indicate the values for the last IP SLAs operation.
Router# show ip sla monitor statistics
Current Operational StateEntry number: 10Modification time: 12:57:45.690 UTC Sun Oct 26 2003Number of operations attempted: 3Number of operations skipped: 0Current seconds left in Life: 3570Operational state of entry: ActiveLast time this entry was reset: NeverConnection loss occurred: FALSETimeout occurred: FALSEOver thresholds occurred: FALSELatest RTT (milliseconds): 19Latest operation start time: 12:57:45.723 Sun Oct 26 2003Latest operation return code: OKVoice Scores:ICPIF: 20 MOS Score: 3.20
RTT Values:NumOfRTT: 10 RTTAvg: 19 RTTMin: 19 RTTMax: 20RTTSum: 191 RTTSum2: 3649
Packet Loss Values:PacketLossSD: 0 PacketLossDS: 0PacketOutOfSequence: 0 PacketMIA: 0 PacketLateArrival: 0InternalError: 0 Busies: 0
Jitter Values:NumOfJitterSamples: 9MinOfPositivesSD: 0 MaxOfPositivesSD: 0NumOfPositivesSD: 0 SumOfPositivesSD: 0 Sum2PositivesSD: 0MinOfNegativesSD: 0 MaxOfNegativesSD: 0NumOfNegativesSD: 0 SumOfNegativesSD: 0 Sum2NegativesSD: 0MinOfPositivesDS: 1 MaxOfPositivesDS: 1NumOfPositivesDS: 1 SumOfPositivesDS: 1 Sum2PositivesDS: 1MinOfNegativesDS: 1 MaxOfNegativesDS: 1NumOfNegativesDS: 1 SumOfNegativesDS: 1 Sum2NegativesDS: 1Interarrival jitterout: 0 Interarrival jitterin: 0
One Way Values:NumOfOW: 0OWMinSD: 0 OWMaxSD: 0 OWSumSD: 0 OWSum2SD: 0OWMinDS: 0 OWMaxDS: 0 OWSumDS: 0 OWSum2DS: 0
Table 25 describes the significant fields shown in the display.
SLA-77Cisco IOS IP SLAs Command Reference
Release 12.2SX

show ip sla monitor statistics
Table 25 show ip sla monitor statistics Field Descriptions
Field Description
Voice Scores Indicates that Voice over IP statistics appear on the following lines. Voice score data is computed when the operation type is configured as type jitter (codec).
ICPIF The Calculated Planning Impairment Factor (ICPIF) value for the operation. The ICPIF value is computed by IP SLAs using the formula Icpif = Io + Iq + Idte + Idd + Ie – A, where
• The values for Io, Iq, and Idte are set to zero.
• The value Idd is computed based on the measured one-way delay.
• The value Ie is computed based on the measured packet loss.
• The value of A is specified by the user.
ICPIF values are expressed in a typical range of 5 (very low impairment) to 55 (very high impairment). ICPIF values numerically lower than 20 are generally considered “adequate.”
Note This value is intended only for relative comparisons, and may not match ICPIF values generated using alternate methods.
MOS Score The estimated Mean Opinion Score (Conversational Quality, Estimated) for the latest iteration of the operation. The MOS-CQE is computed by IP SLAs as a function of the ICPIF.
MOS values are expressed as a number from 1 (1.00) to 5 (5.00), with 5 being the highest level of quality, and 1 being the lowest level of quality. A MOS value of 0 (zero) indicates that MOS data could not be generated for the operation.
RTT Values Indicates that round-trip-time statistics appear on the following lines.
NumOfRTT The number of successful round-trips.
RTTSum The sum of all successful round-trip values (in milliseconds).
RTTSum2 The sum of squares of those round-trip values (in milliseconds).
PacketLossSD The number of packets lost from source to destination.
PacketLossDS The number of packets lost from destination to source.
PacketOutOfSequence The number of packets returned out of order.
SLA-78Cisco IOS IP SLAs Command Reference
Release 12.2SX

show ip sla monitor statistics
PacketMIA The number of packets lost where the direction (SD/DS) cannot be determined.
PacketLateArrival The number of packets that arrived after the timeout.
InternalError The number of times an operation could not be started due to other internal failures.
Busies The number of times this operation could not be started because the previously scheduled run was not finished.
Jitter Values: Indicates that jitter statistics appear on the following lines. Jitter is interpacket delay variance.
NumOfJitterSamples The number of jitter samples collected. This is the number of samples that are used to calculate the following jitter statistics.
MinOfPositivesSDMaxOfPositivesSD
The minimum and maximum positive jitter values from source to destination, in milliseconds.
NumOfPositivesSD The number of jitter values from source to destination that are positive (that is, network latency increases for two consecutive test packets).
SumOfPositivesSD The sum of those positive values (in milliseconds).
Sum2PositivesSD The sum of squares of those positive values.
MinOfNegativesSDMaxOfNegativesSD
The minimum and maximum negative jitter values from source to destination. The absolute value is given.
NumOfNegativesSD The number of jitter values from source to destination that are negative (that is, network latency decreases for two consecutive test packets).
SumOfNegativesSD The sum of those values.
Sum2NegativesSD The sum of the squares of those values.
Interarrival jitterout The source-to-destination (SD) jitter value calculation, as defined in RFC 1889.
Interarrival jitterin The destination-to-source (DS) jitter value calculation, as defined in RFC 1889.
One Way Values Indicates that one-way measurement statistics appear on the following lines.
One Way (OW) values are the amount of time required for the packet to travel from the source router to the target router (SD) or from the target router to the source router (DS).
Table 25 show ip sla monitor statistics Field Descriptions (continued)
Field Description
SLA-79Cisco IOS IP SLAs Command Reference
Release 12.2SX

show ip sla monitor statistics
Related Commands
NumOfOW Number of successful one-way time measurements.
OWMinSD Minimum time (in milliseconds) from the source to the destination.
OWMaxSD Maximum time (in milliseconds) from the source to the destination.
OWSumSD Sum of the OWMinSD and OWMaxSD values.
OWSum2SD Sum of the squares of the OWMinSD and OWMaxSD values.
Table 25 show ip sla monitor statistics Field Descriptions (continued)
Field Description
Command Description
show ip sla monitor configuration
Displays configuration values including all defaults for all IP SLAs operations or the specified operation.
SLA-80Cisco IOS IP SLAs Command Reference
Release 12.2SX

show ip sla monitor statistics aggregated
show ip sla monitor statistics aggregated
Note Effective with Cisco IOS Release 12.4(4)T, the show ip sla monitor statistics aggregated command is replaced by the show ip sla statistics aggregated command. See the show ip sla statistics aggregated command for more information.
To display the aggregated statistical errors and distribution information for all Cisco IOS IP Service Level Agreements (SLAs) operations or a specified operation, use the show ip sla monitor statistics aggregated command in user EXEC or privileged EXEC mode.
show ip sla monitor statistics aggregated [operation-number] [details]
Syntax Description
Command Modes User EXECPrivileged EXEC
Command History
Usage Guidelines Use this command to display information such as the number of failed operations and the failure reason. The distributions statistics consist of the following:
• The sum of completion times (used to calculate the mean)
• The sum of the completion times squared (used to calculate standard deviation)
• The maximum and minimum completion time
• The number of completed attempts
This command shows information collected over the past two hours, unless you specify a different amount of time using the hours-of-statistics-kept command.
Note This command does not support the IP SLAs ICMP path jitter operation.
operation-number (Optional) Number of the IP SLAs operation to display.
details (Optional) Aggregated statistical information is displayed in greater detail. Distribution information is included when this keyword is specified.
Release Modification
12.4(2)T This command was introduced.
12.4(4)T This command was replaced by the show ip sla statistics aggregated command.
12.2(31)SB2 This command was integrated into Cisco IOS Release 12.2(31)SB2.
12.2(33)SXH This command was integrated into Cisco IOS Release 12.2(33)SXH.
SLA-81Cisco IOS IP SLAs Command Reference
Release 12.2SX

show ip sla monitor statistics aggregated
Examples The following sections show sample output from the show ip sla monitor statistics aggregated and show ip sla monitor statistics aggregated details commands for different IP SLAs operations.
Output for HTTP Operations
The following example shows output from the show ip sla monitor statistics aggregated and show ip sla monitor statistics aggregated details commands when the specified operation is a Hypertext Transfer Protocol (HTTP) operation:
Router# show ip sla monitor statistics aggregated 1
Round trip time (RTT) Index 3DNS RTT: 3004 msTCP Connection RTT: 16 msHTTP Transaction RTT: 84 msNumber of successes: 0Number of failures: 1
Router# show ip sla monitor statistics aggregated 1 details
Round trip time (RTT) Index 3DNS RTT: 3004TCP Connection RTT: 0HTTP Transaction RTT: 0HTTP time to first byte: 0DNS TimeOut: 0TCP TimeOut: 0Transaction TimeOut: 0DNS Error: 0TCP Error: 0Number of successes: 0Number of failures: 1Failed Operations due to over threshold: 0Failed Operations due to Disconnect/TimeOut/Busy/No Connection: 0/0/0/0Failed Operations due to Internal/Sequence/Verify Error: 1/0/0Distribution Statistics:Bucket Range: 0-9 ms: Avg. Latency: 0 ms Percent of Total Completions for this range: 0% Number of Completions/Sum of Latency: 0/0/0Sum of RTT squared low 32 Bits/ Sum of RTT squared high 32 Bits: 0/0Bucket Range: 10-19 ms: Avg. Latency: 0 ms Percent of Total Completions for this range: 0% Number of Completions/Sum of Latency: 0/0/0Sum of RTT squared low 32 Bits/ Sum of RTT squared high 32 Bits: 0/0Bucket Range: >20 ms: Avg. Latency: 0 ms Percent of Total Completions for this range: 0% Number of Completions/Sum of Latency: 0/0/0Sum of RTT squared low 32 Bits/ Sum of RTT squared high 32 Bits: 0/0
Output for UDP Jitter Operations
The following is sample output from the show ip sla monitor statistics aggregated and show ip sla monitor statistics aggregated details commands when the specified operation is a User Datagram Protocol (UDP) jitter operation:
Router# show ip sla monitor statistics aggregated 2
Round trip time (RTT) Index 7RTT Values Number Of RTT: 10
SLA-82Cisco IOS IP SLAs Command Reference
Release 12.2SX

show ip sla monitor statistics aggregated
RTT Min/Avg/Max: 1/1/2 msLatency one-way time milliseconds Number of Latency one-way Samples: 0 Source to Destination Latency one way Latency Min/Avg/Max: 0/0/0 ms Destination to source Latency one way Min/Avg/Max: 0/0/0 msJitter time milliseconds Number of Jitter Samples: 9 Source to Destination Jitter Min/Avg/Max: 1/1/1 ms Destination to Source Jitter Min/Avg/Max: 1/1/1 msPacket Loss Values Loss Source to Destination: 0 Loss Destination to Source: 0 Out Of Sequence: 0 Tail Drop: 0 Packet Late Arrival: 0Number of successes: 1Number of failures: 1
Router# show ip sla monitor statistics aggregated 2 details
Round trip time (RTT) Index 7RTT Values Number Of RTT: 10 RTT Min/Avg/Max: 1/1/1 msLatency one-way time milliseconds Number of Latency one-way Samples: 0 Source to Destination Latency one way Min/Avg/Max: 0/0/0 ms Destination to Source Latency one way Min/Avg/Max: 0/0/0 ms Source to Destination Latency one way Sum/Sum2: 0/0 Destination to Source Latency one way Sum/Sum2: 0/0Jitter time milliseconds Number of Jitter Samples: 9 Source to Destination Jitter Min/Avg/Max: 1/1/1 ms Destination to Source Jitter Min/Avg/Max: 1/1/1 ms Source to destination positive jitter Min/Avg/Max: 1/1/1 ms Source to destination positive jitter Number/Sum/Sum2: 1/1/1 Source to destination negative jitter Min/Avg/Max: 1/1/1 ms Source to destination negative jitter Number/Sum/Sum2: 1/1/1 Destination to Source positive jitter Min/Avg/Max: 1/1/1 ms Destination to Source positive jitter Number/Sum/Sum2: 2/2/2 Destination to Source negative jitter Min/Avg/Max: 1/1/1 ms Destination to Source negative jitter Number/Sum/Sum2: 2/2/2 Interarrival jitterout: 0 Interarrival jitterin: 0Packet Loss Values Loss Source to Destination: 0 Loss Destination to Source: 0 Out Of Sequence: 0 Tail Drop: 0 Packet Late Arrival: 0Number of successes: 3Number of failures: 1Failed Operations due to over threshold: 0Failed Operations due to Disconnect/TimeOut/Busy/No Connection: 0/23/0/0Failed Operations due to Internal/Sequence/Verify Error: 0/0/0Distribution Statistics:Bucket Range: 0-9 ms: Avg. Latency: 0 ms Percent of Total Completions for this range: 0% Number of Completions/Sum of Latency: 0/0/0Sum of RTT squared low 32 Bits/ Sum of RTT squared high 32 Bits: 0/0Bucket Range: 10-19 ms: Avg. Latency: 0 ms Percent of Total Completions for this range: 0% Number of Completions/Sum of Latency: 0/0/0Sum of RTT squared low 32 Bits/ Sum of RTT squared high 32 Bits: 0/0Bucket Range: >20 ms: Avg. Latency: 0 ms Percent of Total Completions for this range: 0% Number of Completions/Sum of Latency: 0/0/0Sum of RTT squared low 32 Bits/ Sum of RTT squared high 32 Bits: 0/0
SLA-83Cisco IOS IP SLAs Command Reference
Release 12.2SX

show ip sla monitor statistics aggregated
Output for ICMP Echo Operations
The following is sample output from the show ip sla monitor statistics aggregated and show ip sla monitor statistics aggregated details commands when the specified operation is an Internet Control Message Protocol (ICMP) echo operation:
Router# show ip sla monitor statistics aggregated 3
Round trip time (RTT)Index 3Start Time Index: 05:31:12.896 PST Wed Sep 3 2003RTT Values Number Of RTT: 0 RTT Min/Avg/Max: 0/0/0 msNumber of successes: 0Number of failures: 21
Router# show ip sla monitor statistics aggregated 3 details
Round trip time (RTT)Index 3Start Time Index: 05:31:12.897 PST Wed Sep 3 2003RTT Values Number Of RTT: 0 RTT Min/Avg/Max: 0/0/0 msNumber of successes: 0Number of failures: 23Failed Operations due to over threshold: 0Failed Operations due to Disconnect/TimeOut/Busy/No Connection: 0/23/0/0Failed Operations due to Internal/Sequence/Verify Error: 0/0/0Distribution Statistics:Bucket Range: 0-9 ms: Avg. Latency: 0 ms Percent of Total Completions for this range: 0% Number of Completions/Sum of Latency: 0/0/0Sum of RTT squared low 32 Bits/ Sum of RTT squared high 32 Bits: 0/0Bucket Range: 10-19 ms: Avg. Latency: 0 ms Percent of Total Completions for this range: 0% Number of Completions/Sum of Latency: 0/0/0Sum of RTT squared low 32 Bits/ Sum of RTT squared high 32 Bits: 0/0Bucket Range: >20 ms: Avg. Latency: 0 ms Percent of Total Completions for this range: 0% Number of Completions/Sum of Latency: 0/0/0Sum of RTT squared low 32 Bits/ Sum of RTT squared high 32 Bits: 0/0
Output for TCP Connect, DNS, FTP, DHCP, and UDP Echo Operations
The following is sample output from the show ip sla monitor statistics aggregated and show ip sla monitor statistics aggregated details commands when the specified operation is a Transmission Control Protocol (TCP) connect, Domain Name System (DNS), File Transfer Protocol (FTP), Dynamic Host Configuration Protocol (DHCP), or UDP echo operation:
Router# show ip sla monitor statistics aggregated 3
Round trip time (RTT)Index 3Start Time Index: 05:31:12.896 PST Wed Sep 3 2003Number of successes: 0Number of failures: 21
Router# show ip sla monitor statistics aggregated 3 details
Round trip time (RTT)Index 3Start Time Index: 05:31:12.897 PST Wed Sep 3 2003Number of successes: 0
SLA-84Cisco IOS IP SLAs Command Reference
Release 12.2SX

show ip sla monitor statistics aggregated
Number of failures: 23Failed Operations due to over threshold: 0Failed Operations due to Disconnect/TimeOut/Busy/No Connection: 0/23/0/0Failed Operations due to Internal/Sequence/Verify Error: 0/0/0Distribution Statistics:Bucket Range: 0-9 ms: Avg. Latency: 0 ms Percent of Total Completions for this range: 0% Number of Completions/Sum of Latency: 0/0/0Sum of RTT squared low 32 Bits/ Sum of RTT squared high 32 Bits: 0/0Bucket Range: 10-19 ms: Avg. Latency: 0 ms Percent of Total Completions for this range: 0% Number of Completions/Sum of Latency: 0/0/0Sum of RTT squared low 32 Bits/ Sum of RTT squared high 32 Bits: 0/0Bucket Range: >20 ms: Avg. Latency: 0 ms Percent of Total Completions for this range: 0% Number of Completions/Sum of Latency: 0/0/0Sum of RTT squared low 32 Bits/ Sum of RTT squared high 32 Bits: 0/0
Output for ICMP Path Echo Operations
The following is sample output from the show ip sla monitor statistics aggregated and show ip sla monitor statistics aggregated details commands when the specified operation is an ICMP path echo operation:
Router# show ip sla monitor statistics aggregated 3
Round trip time (RTT) Index 3Start Time Index: 05:31:12.896 PST Wed Sep 3 2003Path Index: 1Hop in Path Index: 1Number of successes: 0Number of failures: 21
Round trip time (RTT) Index 3Start Time Index: 05:31:12.896 PST Wed Sep 3 2003Path Index: 2Hop in Path Index: 1Number of successes: 0Number of failures: 21
Round trip time (RTT) Index 3Start Time Index: 05:31:12.896 PST Wed Sep 3 2003Path Index: 2Hop in Path Index: 2Number of successes: 0Number of failures: 21
Round trip time (RTT) Index 3Start Time Index: 05:31:12.896 PST Wed Sep 3 2003Path Index: 2Hop in Path Index: 3Number of successes: 0Number of failures: 21...
Router# show ip sla monitor statistics aggregated 3 details
Round trip time (RTT) Index 3Start Time Index: 05:31:12.897 PST Wed Sep 3 2003
SLA-85Cisco IOS IP SLAs Command Reference
Release 12.2SX

show ip sla monitor statistics aggregated
Path Index: 1Hop in Path Index: 1Number of successes: 0Number of failures: 21Failed Operations due to over threshold: 0Failed Operations due to Disconnect/TimeOut/Busy/No Connection: 0/21/0/0Failed Operations due to Internal/Sequence/Verify Error: 0/0/0Target Address: 10.4.23.44Distribution Statistics:Bucket Range: 0-9 ms: Avg. Latency: 0 ms Percent of Total Completions for this range: 0% Number of Completions/Sum of Latency: 0/0/0Sum of RTT squared low 32 Bits/ Sum of RTT squared high 32 Bits: 0/0Bucket Range: 10-19 ms: Avg. Latency: 0 ms Percent of Total Completions for this range: 0% Number of Completions/Sum of Latency: 0/0/0Sum of RTT squared low 32 Bits/ Sum of RTT squared high 32 Bits: 0/0Bucket Range: >20 ms: Avg. Latency: 0 ms Percent of Total Completions for this range: 0% Number of Completions/Sum of Latency: 0/0/0Sum of RTT squared low 32 Bits/ Sum of RTT squared high 32 Bits: 0/0
Round trip time (RTT) Index 3Start Time Index: 05:31:12.897 PST Wed Sep 3 2003Path Index: 2Hop in Path Index: 1Number of successes: 0Number of failures: 21Failed Operations due to over threshold: 0Failed Operations due to Disconnect/TimeOut/Busy/No Connection: 0/21/0/0Failed Operations due to Internal/Sequence/Verify Error: 0/0/0Target Address: 10.4.23.44Distribution Statistics:Bucket Range: 0-9 ms: Avg. Latency: 0 ms Percent of Total Completions for this range: 0% Number of Completions/Sum of Latency: 0/0/0Sum of RTT squared low 32 Bits/ Sum of RTT squared high 32 Bits: 0/0Bucket Range: 10-19 ms: Avg. Latency: 0 ms Percent of Total Completions for this range: 0% Number of Completions/Sum of Latency: 0/0/0Sum of RTT squared low 32 Bits/ Sum of RTT squared high 32 Bits: 0/0Bucket Range: >20 ms: Avg. Latency: 0 ms Percent of Total Completions for this range: 0% Number of Completions/Sum of Latency: 0/0/0Sum of RTT squared low 32 Bits/ Sum of RTT squared high 32 Bits: 0/0
Round trip time (RTT) Index 3Start Time Index: 05:31:12.897 PST Wed Sep 3 2003Path Index: 2Hop in Path Index: 2Number of successes: 0Number of failures: 21Failed Operations due to over threshold: 0Failed Operations due to Disconnect/TimeOut/Busy/No Connection: 0/21/0/0Failed Operations due to Internal/Sequence/Verify Error: 0/0/0Target Address: 10.4.23.44Distribution Statistics:Bucket Range: 0-9 ms:
SLA-86Cisco IOS IP SLAs Command Reference
Release 12.2SX

show ip sla monitor statistics aggregated
Avg. Latency: 0 ms Percent of Total Completions for this range: 0% Number of Completions/Sum of Latency: 0/0/0Sum of RTT squared low 32 Bits/ Sum of RTT squared high 32 Bits: 0/0Bucket Range: 10-19 ms: Avg. Latency: 0 ms Percent of Total Completions for this range: 0% Number of Completions/Sum of Latency: 0/0/0Sum of RTT squared low 32 Bits/ Sum of RTT squared high 32 Bits: 0/0Bucket Range: >20 ms: Avg. Latency: 0 ms Percent of Total Completions for this range: 0% Number of Completions/Sum of Latency: 0/0/0Sum of RTT squared low 32 Bits/ Sum of RTT squared high 32 Bits: 0/0
Round trip time (RTT) Index 3Start Time Index: 05:31:12.897 PST Wed Sep 3 2003Path Index: 2Hop in Path Index: 3Number of successes: 0Number of failures: 21Failed Operations due to over threshold: 0Failed Operations due to Disconnect/TimeOut/Busy/No Connection: 0/21/0/0Failed Operations due to Internal/Sequence/Verify Error: 0/0/0Target Address: 10.4.23.44Distribution Statistics:Bucket Range: 0-9 ms: Avg. Latency: 0 ms Percent of Total Completions for this range: 0% Number of Completions/Sum of Latency: 0/0/0Sum of RTT squared low 32 Bits/ Sum of RTT squared high 32 Bits: 0/0Bucket Range: 10-19 ms: Avg. Latency: 0 ms Percent of Total Completions for this range: 0% Number of Completions/Sum of Latency: 0/0/0Sum of RTT squared low 32 Bits/ Sum of RTT squared high 32 Bits: 0/0Bucket Range: >20 ms: Avg. Latency: 0 ms Percent of Total Completions for this range: 0% Number of Completions/Sum of Latency: 0/0/0Sum of RTT squared low 32 Bits/ Sum of RTT squared high 32 Bits: 0/0...
Related Commands Command Description
hours-of-statistics-kept Sets the number of hours for which statistics are maintained for the IP SLAs operation.
show ip sla monitor configuration
Displays configuration values including all defaults for all IP SLAs operations or the specified operation.
SLA-87Cisco IOS IP SLAs Command Reference
Release 12.2SX

show ip sla monitor totals-statistics
show ip sla monitor totals-statistics
Note Effective with Cisco IOS Release 12.4(2)T, the show ip sla monitor totals-statistics command is replaced by the show ip sla monitor statistics aggregated command. See the show ip sla statistics aggregated command for more information.
To display the total statistical values (accumulation of error counts and completions) for all Cisco IOS IP Service Level Agreements (SLAs) operations or the specified operation, use the show ip sla monitor totals-statistics command in user EXEC or privileged EXEC mode.
show ip sla monitor totals-statistics [number] [tabular | full]
Syntax Description
Defaults Full format for all operations
Command Modes User EXECPrivileged EXEC
Command History
Usage Guidelines The total statistics consist of the following items:
• The operation number
• The start time of the current hour of statistics
• The age of the current hour of statistics
• The number of attempted operations
You can also use the show ip sla monitor distributions-statistics and show ip sla monitor collection-statistics commands to display additional statistical information.
number (Optional) Number of the IP SLAs operation to display.
tabular (Optional) Display information in a column format, reducing the number of screens required to display the information.
full (Optional) Display all information, using identifiers next to each displayed value. This is the default.
Release Modification
12.3(14)T This command was introduced.
12.4(2)T This command was replaced by the show ip sla monitor statistics aggregated command.
12.2(31)SB2 This command was integrated into Cisco IOS Release 12.2(31)SB2. This command replaces the show rtr totals-statistics command.
12.2(33)SXH This command was integrated into Cisco IOS Release 12.2(33)SXH.
SLA-88Cisco IOS IP SLAs Command Reference
Release 12.2SX
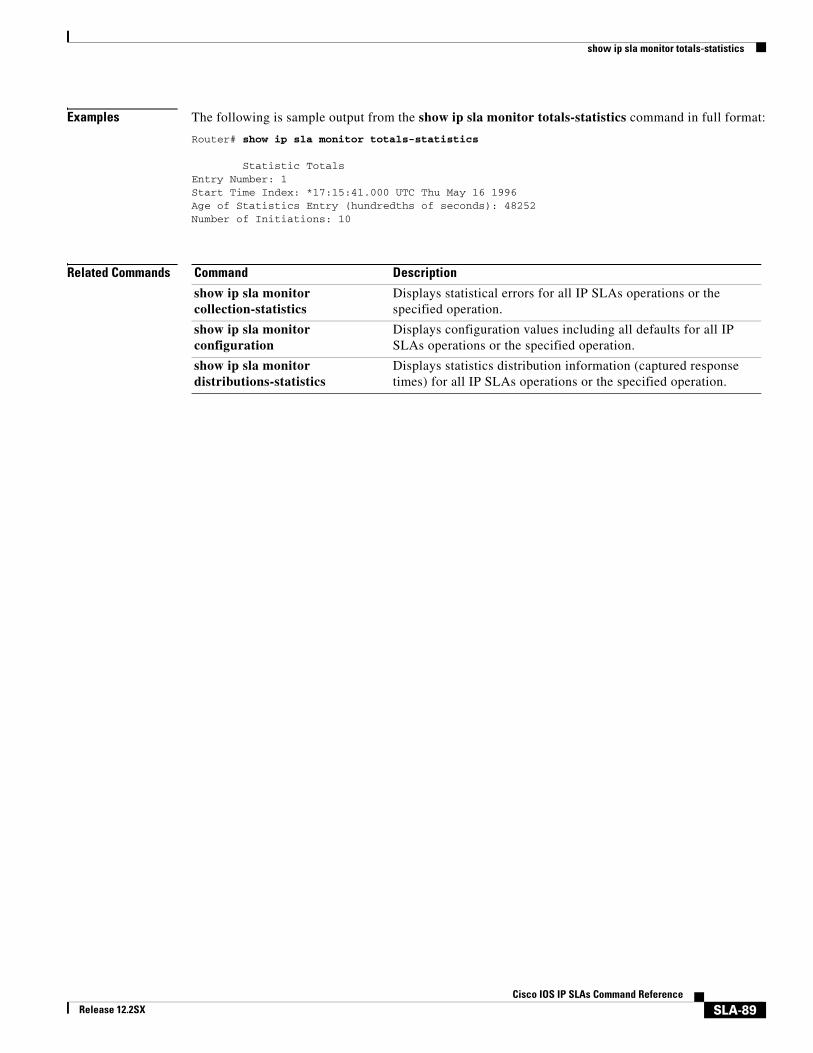
show ip sla monitor totals-statistics
Examples The following is sample output from the show ip sla monitor totals-statistics command in full format:
Router# show ip sla monitor totals-statistics
Statistic TotalsEntry Number: 1Start Time Index: *17:15:41.000 UTC Thu May 16 1996Age of Statistics Entry (hundredths of seconds): 48252Number of Initiations: 10
Related Commands Command Description
show ip sla monitor collection-statistics
Displays statistical errors for all IP SLAs operations or the specified operation.
show ip sla monitor configuration
Displays configuration values including all defaults for all IP SLAs operations or the specified operation.
show ip sla monitor distributions-statistics
Displays statistics distribution information (captured response times) for all IP SLAs operations or the specified operation.
SLA-89Cisco IOS IP SLAs Command Reference
Release 12.2SX

show mpls discovery vpn
show mpls discovery vpnTo display routing information relating to the Multiprotocol Label Switching (MPLS) Virtual Private Network (VPN) Border Gateway Protocol (BGP) next hop neighbor discovery process, use the show mpls discovery vpn command in user EXEC or privileged EXEC mode.
show mpls discovery vpn
Syntax Description This command has no arguments or keywords.
Command Modes User EXECPrivileged EXEC
Command History
Examples The following is sample output from the show mpls discovery vpn command:
Router# show mpls discovery vpn
Refresh interval set to 60 seconds.Next refresh in 46 seconds
Next hop 10.10.10.5 (Prefix: 10.10.10.5/32) in use by: red, blue, green
Next hop 10.10.10.7 (Prefix: 10.10.10.7/32) in use by: red, blue, green
Next hop 10.10.10.8 (Prefix: 10.10.10.8/32) in use by: red, blue, green
Table 26 describes the fields shown in the display.
Release Modification
12.2(27)SBC This command was introduced.
12.4(6)T This command was integrated into Cisco IOS Release 12.4(6)T.
12.2(33)SRA This command was integrated into Cisco IOS Release 12.2(33)SRA.
12.0(32)SY This command was integrated into Cisco IOS Release 12.0(32)SY.
12.2(31)SB2 This command was integrated into Cisco IOS Release 12.2(31)SB2.
12.2(33)SXH This command was integrated into Cisco IOS Release 12.2(33)SXH.
Table 26 show mpls discovery vpn Field Descriptions
Field Description
Refresh interval The time interval at which routing entries that are no longer valid are removed from the BGP next hop neighbor discovery database. The default time interval is 300 seconds.
Next refresh The amount of time left before the next refresh interval starts.
SLA-90Cisco IOS IP SLAs Command Reference
Release 12.2SX

show mpls discovery vpn
Related Commands
Next hop Identifier for the BGP next hop neighbor.
Prefix IPv4 Forward Equivalence Class (FEC) of the BGP next hop neighbor to be used by the MPLS LSP ping operation.
in use by Names of the VPN routing and forwarding (VRF) instances that contain routing entries for the specified BGP next hop neighbor.
Table 26 show mpls discovery vpn Field Descriptions (continued)
Field Description
Command Description
mpls discovery vpn interval
Specifies the time interval at which routing entries that are no longer valid are removed from the BGP next hop neighbor discovery database of an MPLS VPN.
mpls discovery vpn next-hop
Enables the MPLS VPN BGP next hop neighbor discovery process.
SLA-91Cisco IOS IP SLAs Command Reference
Release 12.2SX

statistics-distribution-interval
statistics-distribution-interval
Note Effective with Cisco IOS Releases 12.4(4)T and 12.2(33)SRB, the statistics-distribution-interval command is replaced by the history statistics-distribution-interval command. See the history statistics-distribution-interval command for more information.
To set the time interval for each statistics distribution kept for a Cisco IOS IP Service Level Agreements (SLAs) operation, use the statistics-distribution-interval command in the appropriate submode of IP SLA monitor configuration mode. To return to the default value, use the no form of this command.
statistics-distribution-interval milliseconds
no statistics-distribution-interval
Syntax Description
Defaults 20 ms
Command Modes DHCP configuration (config-sla-monitor-dhcp)DLSw configuration (config-sla-monitor-dlsw)DNS configuration (config-sla-monitor-dns)FTP configuration (config-sla-monitor-ftp)HTTP configuration (config-sla-monitor-http)ICMP echo configuration (config-sla-monitor-echo)ICMP path echo configuration (config-sla-monitor-pathEcho)ICMP path jitter configuration (config-sla-monitor-pathJitter)TCP connect configuration (config-sla-monitor-tcp)UDP echo configuration (config-sla-monitor-udp)UDP jitter configuration (config-sla-monitor-jitter)VoIP configuration (config-sla-monitor-voip)
Command History
milliseconds Number of milliseconds (ms) used for each statistics distribution kept. The default is 20.
Release Modification
11.2 This command was introduced.
12.4(4)T This command was replaced by the history statistics-distribution-interval command.
12.2(33)SRB This command was replaced by the history statistics-distribution-interval command.
12.2SX This command is supported in the Cisco IOS Release 12.2SX train. Support in a specific 12.2SX release of this train depends on your feature set, platform, and platform hardware.
SLA-92Cisco IOS IP SLAs Command Reference
Release 12.2SX

statistics-distribution-interval
Usage Guidelines In most situations, you do not need to change the time interval for each statistics distribution or number of distributions kept. Only change these parameters when distributions are needed, for example, when performing statistical modeling of your network. To set the number of statistics distributions kept, use the distributions-of-statistics-kept command.
Note You must configure the type of IP SLAs operation (such as User Datagram Protocol [UDP] jitter or Internet Control Message Protocol [ICMP] echo) before you can configure any of the other parameters of the operation.
Examples In the following example, the statistics distribution is set to five and the distribution interval is set to 10 ms for IP SLAs ICMP echo operation 1. Consequently, the first distribution will contain statistics from 0 to 9 ms, the second distribution will contain statistics from 10 to 19 ms, the third distribution will contain statistics from 20 to 29 ms, the fourth distribution will contain statistics from 30 to 39 ms, and the fifth distribution will contain statistics from 40 ms to infinity.
ip sla monitor 1type echo protocol ipIcmpEcho 172.16.161.21distributions-of-statistics-kept 5statistics-distribution-interval 10
!ip sla monitor schedule 1 life forever start-time now
Related Commands Command Description
distributions-of-statistics-kept Sets the number of statistics distributions kept per hop during the IP SLAs operation’s lifetime.
hops-of-statistics-kept Sets the number of hops for which statistics are maintained per path for the IP SLAs operation.
hours-of-statistics-kept Sets the number of hours for which statistics are maintained for the IP SLAs operation.
ip sla monitor Begins configuration for an IP SLAs operation and enters IP SLA monitor configuration mode.
paths-of-statistics-kept Sets the number of paths for which statistics are maintained per hour for the IP SLAs operation.
SLA-93Cisco IOS IP SLAs Command Reference
Release 12.2SX

statistics-distribution-interval
SLA-94Cisco IOS IP SLAs Command Reference
Release 12.2SX