
SKF @ptitude Observer
336
User manual Copyright 2017 by SKF Group All rights reserved. SKF Condition Monitoring Center – Luleå Aurorum 30, 977 75 Luleå, Sweden Telephone: +46 (0) 31 337 10 00, Fax: +46 (0) 920 134 40 SKF @ptitude Observer User Manual Part No. 32170900-EN Revision N Observer 10.2 WARNING! Read this manual before using this product. Failure to follow the instructions and safety precautions in this manual can result in serious injury, damage to the product, or incorrect readings. Keep this manual in a safe location for future reference.
-
Upload
khangminh22 -
Category
Documents
-
view
0 -
download
0
Transcript of SKF @ptitude Observer
User manual
Copyright 2017 by SKF Group
All rights reserved.
SKF Condition Monitoring Center – Luleå
Aurorum 30, 977 75 Luleå, Sweden
Telephone: +46 (0) 31 337 10 00, Fax: +46 (0) 920 134 40
SKF @ptitude Observer
User Manual Part No. 32170900-EN
Revision N
Observer 10.2
WARNING! Read this manual before using this product. Failure to follow the instructions and safety precautions in this manual can result in serious injury, damage to the product, or incorrect readings. Keep this manual in a safe location for future reference.
SKF Group
® SKF is a registered trademark of the SKF Group.
All other trademarks are the property of their respective owners.
© SKF 2017
The contents of this publication are the copyright of the publisher and may not be reproduced (even
extracts) unless prior written permission is granted. Every care has been taken to ensure the accuracy of
the information contained in this publication but no liability can be accepted for any loss or damage whether
direct, indirect or consequential arising out of the use of the information contained herein. SKF reserves the
right to alter any part of this publication without prior notice.
Patents: US 4,768,380 • US 5,633,811 • US 5,679,900 • US 5,845,230 • US 5,852,351 •
US 5,854,553 • US 5,854,994 • US 5,870,699 • US 5,907,491 • US 5,992,237 • US 6,006,164 •
US 6,124,692 • US 6,138,078 • US 6,199,422 • US 6,202,491 • US 6,275,781 • US 6,301,514 •
US 6,437,692 • US 6,489,884 • US 6,513,386 • US 6,633,822 • US 6,789,025 • US 6,792,360 •
US 7,103,511 • US 7,697,492 • WO/2003/048714
Product Support – Contact Information
Product Support – To request a Return Authorization, Product Calibration or a Product Support Plan, use
the web page links for direct contact and support.
Product Sales - For information on purchasing condition monitoring products, services or customer
support, contact your local SKF sales office.
General Product Information
For general product information (i.e., product data sheet, accessories catalog, etc.), visit the Condition
Monitoring Products page on SKF.com and select the appropriate product link.
Technical Support Group
Discuss/review issues of specific interest with maintenance and reliability specialists from around the world
at the SKF Knowledge Centre.
For technical support, contact [email protected] for customers in Europe, Middle East and Africa.
Telephone +46 (0) 31 337 65 00
or [email protected] for customers in North America, South America and Asia.
Telephone +1 800 523 7514
Telephone in Latin America +55 11 4448 8620
Product Registration
Please take a moment to register your product at www.skf.com/cm/register to receive exclusive benefits
offered only to our registered customers, including receiving technical support, tracking your proof of
ownership, and staying informed about upgrades and special offers. (Please visit our website for more
details on these benefits.)
Tell us how we’re doing! It’s important that you’re satisfied with the quality of our product user manuals. We appreciate your feedback; if you have comments or suggestions for improvement, please tell us how we’re doing!
021617dc
@ptitude Observer 10.2, Revision N TOC - 1 User Manual
Table of Contents
Introduction 1
Communication Possibilities ..................................... 1-4
Remote Monitoring Possibilities .............................. 1-5
Network Connectivity Requirements ...................... 1-5
Technical Specification 2
Hardware Connectivity .............................................. 2-1
Data Processing .......................................................... 2-1
Configuration Features ............................................. 2-1
Analysis Features ....................................................... 2-2
User Interfaces ........................................................... 2-3
Graphic Displays ......................................................... 2-3
Alarm ............................................................................ 2-4
Report........................................................................... 2-5
System Integrity ......................................................... 2-5
Getting Started 3
Database Connection ................................................. 3-1
Logon............................................................................ 3-1
Change Language Feature ............................... 3-2
Switching User Type at Logon ......................... 3-2
DASHBOARD ............................................................... 3-3
System Configuration 4
Building a Hierarchy View ........................................ 4-2
Database .............................................................. 4-3
Node ..................................................................... 4-4
Machine ................................................................ 4-4
Sub Machine........................................................ 4-6
Measurement Point ........................................... 4-6
Creating IMx/MasCon Devices and Channels ........ 4-7
Create Device ...................................................... 4-8
Edit ...................................................................... 4-22
Delete ................................................................. 4-22
Copy .................................................................... 4-22
Synchronize ....................................................... 4-22
Restart ................................................................ 4-23
Set Time............................................................. 4-23
TOC - 2 @ptitude Observer 10.2, Revision N User Manual
Connections ....................................................... 4-23
Measurement Points ....................................... 4-24
Connect .............................................................. 4-25
IP Configuration ................................................ 4-25
4-20 mA Output ............................................... 4-25
Firmware ........................................................... 4-26
Analogue Channels .......................................... 4-27
Digital Channels ................................................ 4-30
Machine Properties .......................................... 4-31
Creating OPC Server and OPC Channels ............. 4-38
Internal OPC Server ......................................... 4-39
External OPC Servers ...................................... 4-40
OPC Server Status Tag Value ........................ 4-43
Setting up Measurement Points and Alarms ...... 4-44
Measurement Points ....................................... 4-45
General Tab ....................................................... 4-48
Acquisition Tab ................................................. 4-51
Operating and Storage Conditions Tab ........ 4-58
Shaft Properties Tab ....................................... 4-63
Monitoring Tab ................................................. 4-64
Adaptive Alarming Tab .................................... 4-70
Transient Tab .................................................... 4-71
Observer Display Options Tab ........................ 4-72
About Multiple Gating Points.......................... 4-73
Configuring Runout Compensation ............... 4-85
Calibrating Shaft Centerline Graph ............... 4-86
Machine Parts ........................................................... 4-87
Setting up Process Overview ................................. 4-90
Machine Copy Wizard .............................................. 4-93
Using the Machine Copy Wizard .................... 4-94
Multiple Point Update Wizard ................................ 4-97
Using the Multiple Point Update Wizard ...... 4-98
System Operation 5
Startup View ............................................................... 5-1
Tree View ..................................................................... 5-1
Hierarchy View .................................................... 5-1
System View ...................................................... 5-10
Workspace ......................................................... 5-11
Diagram View .................................................... 5-12
Protection View................................................. 5-13
Graphic Displays and Tools .................................... 5-27
Graphic Features .............................................. 5-27
Graph Settings .................................................. 5-28
Tools for Graph Display ................................... 5-31
Spectra ............................................................... 5-33
Full Spectrum Form ......................................... 5-35
Time Waveform ................................................ 5-37
Phase .................................................................. 5-38
@ptitude Observer 10.2, Revision N TOC - 3 User Manual
Full Spectrum Phase Form ............................. 5-40
History ................................................................ 5-41
Full Spectrum History Form ........................... 5-42
3D Plot ............................................................... 5-45
Full Spectrum 3D Plot ..................................... 5-46
Topology ............................................................ 5-47
Full Spectrum Topology Graph ...................... 5-49
Orbit .................................................................... 5-50
Profile ................................................................. 5-52
Gear Inspector .................................................. 5-53
Trend .................................................................. 5-54
Bode.................................................................... 5-55
Trend List .......................................................... 5-56
Multi trend ......................................................... 5-57
Diagnosis ............................................................ 5-65
Polar ................................................................... 5-68
Shaft Centerline ................................................ 5-69
Combination Plots ............................................ 5-70
Event Capture ................................................... 5-73
Buffer ......................................................................... 5-83
Notes .......................................................................... 5-86
Configuring a Note ........................................... 5-87
Event Cases ............................................................... 5-88
Editing an Existing Event Case Report ......... 5-90
Maintenance Planner .............................................. 5-92
Measurement Date .................................................. 5-93
Menu Items 6
File ................................................................................ 6-1
Manage Databases ............................................. 6-1
Add External Database ...................................... 6-3
Remove External Database .............................. 6-4
Report ................................................................... 6-4
Log Off .................................................................. 6-6
Exit ........................................................................ 6-6
Edit ................................................................................ 6-7
Multiple Point Update Wizard .......................... 6-7
Workspace ........................................................... 6-7
Copy Node ........................................................... 6-8
Paste ..................................................................... 6-9
Notes .................................................................... 6-9
Event Cases ......................................................... 6-9
User Preferences ................................................ 6-9
Properties .......................................................... 6-17
Show ........................................................................... 6-17
Tree View ........................................................... 6-18
Filter.................................................................... 6-18
Hierarchy ........................................................... 6-19
System ............................................................... 6-19
TOC - 4 @ptitude Observer 10.2, Revision N User Manual
Workspace ......................................................... 6-19
Diagram View .................................................... 6-19
Protection View................................................. 6-19
Alarm List .......................................................... 6-19
System Alarm ................................................... 6-20
Maintenance Overview .................................... 6-20
Message Center ................................................ 6-20
Refresh ............................................................... 6-20
DASHBOARD ..................................................... 6-21
Database .................................................................... 6-21
Security Roles ................................................... 6-21
Users ................................................................... 6-26
Database Information ...................................... 6-31
System Log ........................................................ 6-32
IMx-M Sync History ......................................... 6-33
Pictures .............................................................. 6-33
Diagnoses .......................................................... 6-34
Libraries ............................................................. 6-42
Export ................................................................. 6-48
Import ................................................................. 6-49
Alarm Group ...................................................... 6-50
Measurement Groups ...................................... 6-51
Configuring a Transient Measurement
Group ............................................................ 6-55
Configuring an Event Capture Group ........... 6-58
Options ............................................................... 6-69
Delete Data ........................................................ 6-77
Data Miner ......................................................... 6-77
On-line ....................................................................... 6-77
IMx/MasCon Devices ........................................ 6-77
OPC Servers ...................................................... 6-77
Monitor Service Viewer ................................... 6-77
Balancing ........................................................... 6-78
Event Log ........................................................... 6-81
Portables .................................................................... 6-83
Microlog Analyzer ............................................. 6-83
Coded Notes ...................................................... 6-84
Window ...................................................................... 6-85
Cascade .............................................................. 6-85
Tile Vertically ..................................................... 6-85
Tile Horizontally ................................................ 6-85
Close All .............................................................. 6-85
Help ............................................................................ 6-85
Contents ............................................................. 6-85
Search ................................................................ 6-85
Enter New License Key ................................... 6-86
News in Observer ............................................. 6-86
SKF Online Repository ..................................... 6-86
SKF CMC Homepage ........................................ 6-88
@ptitude Observer 10.2, Revision N TOC - 5 User Manual
SKF Reliability Forum ...................................... 6-88
About .................................................................. 6-89
What to Expect When Using Event Capture A
Minimum Time Between IMx Reboot and
Beginning an Event Capture ............................... A-1
Incomplete Pre and Post Data ................................. A-2
Incomplete Pre Data .......................................... A-2
Incomplete Post Data ........................................ A-3
Active Range ............................................................... A-5
Network Interruptions During an Event Capture . A-5
Signals Outside Cable Fault Detection
Thresholds ............................................................. A-6
Miscellaneous .............................................................. A-6
Summary of Tools in the Toolbar B
Observer Tools ............................................................ B-1
Primary Toolbar ................................................. B-1
Navigation Toolbar ............................................. B-2
Measurements Toolbar ..................................... B-2
Plots Toolbar ....................................................... B-3
Graph Display Toolbar ....................................... B-4
Plot Tools Toolbar .............................................. B-5
End User License Agreement C
Index

@ptitude Observer 10.2, Revision N 1 - 1 User Manual
1
Introduction
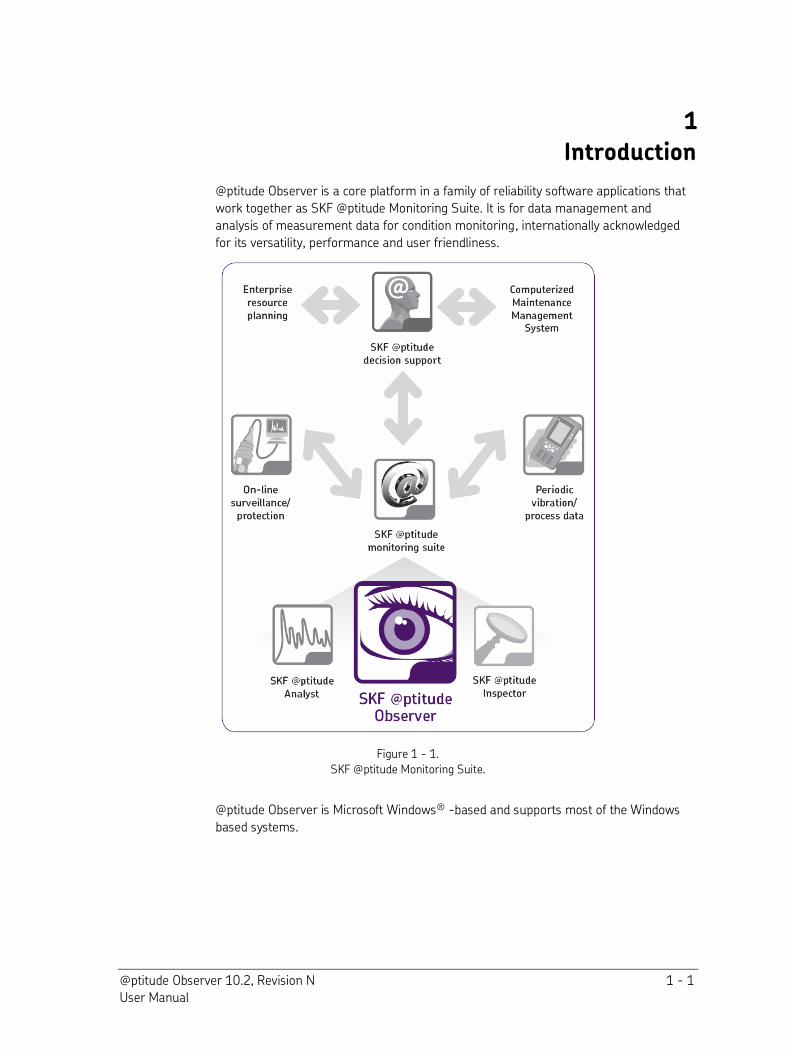
@ptitude Observer is a core platform in a family of reliability software applications that
work together as SKF @ptitude Monitoring Suite. It is for data management and
analysis of measurement data for condition monitoring, internationally acknowledged
for its versatility, performance and user friendliness.
Figure 1 - 1.
SKF @ptitude Monitoring Suite.
@ptitude Observer is Microsoft Windows® -based and supports most of the Windows
based systems.
Introduction
Communication Possibilities
1 - 2 @ptitude Observer 10.2, Revision N User Manual
@ptitude Observer supports the following data acquisition devices (DADs):
MasCon16
MasCon16R
MasCon48
MasCon48P
IMx-8
IMx-B
IMx-C
IMx-M
IMx-P
IMx-R
IMx-S
IMx-T
IMx-W, WindCon
Microlog CMVA series
Microlog CMXA 50
Microlog AX
Microlog GX
RB06
Introduction
Communication Possibilities
@ptitude Observer 10.2, Revision N 1 - 3 User Manual
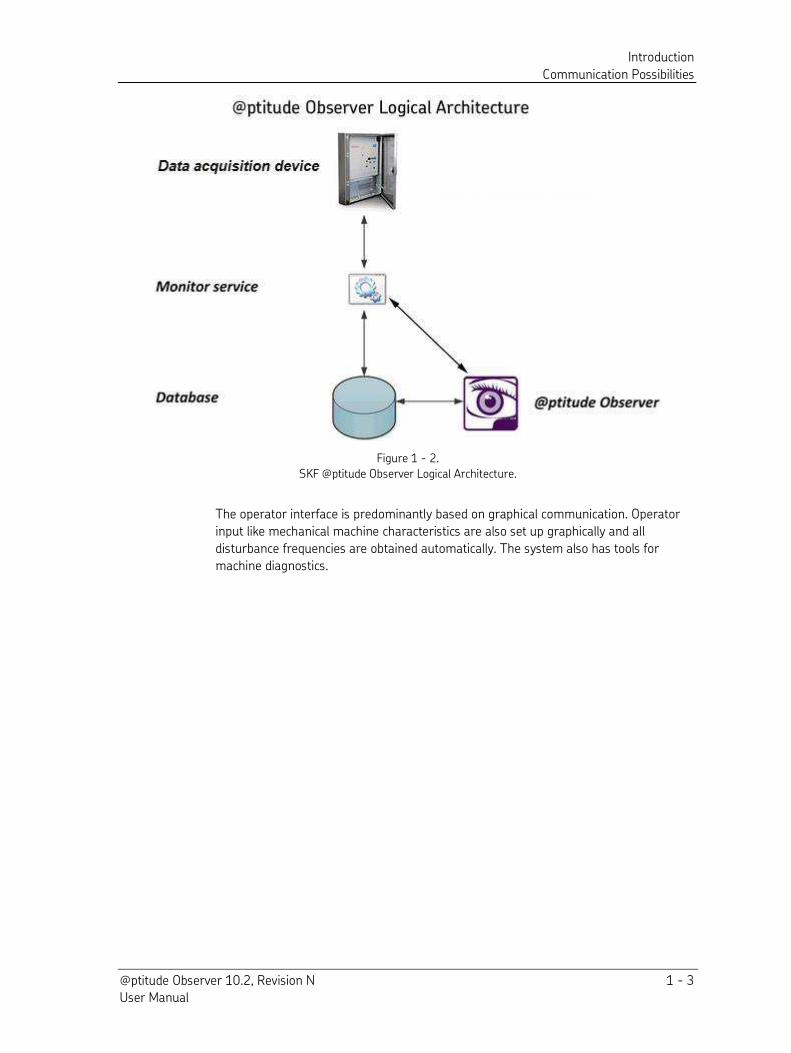
Figure 1 - 2.
SKF @ptitude Observer Logical Architecture.
The operator interface is predominantly based on graphical communication. Operator
input like mechanical machine characteristics are also set up graphically and all
disturbance frequencies are obtained automatically. The system also has tools for
machine diagnostics.
Introduction
Communication Possibilities
1 - 4 @ptitude Observer 10.2, Revision N User Manual
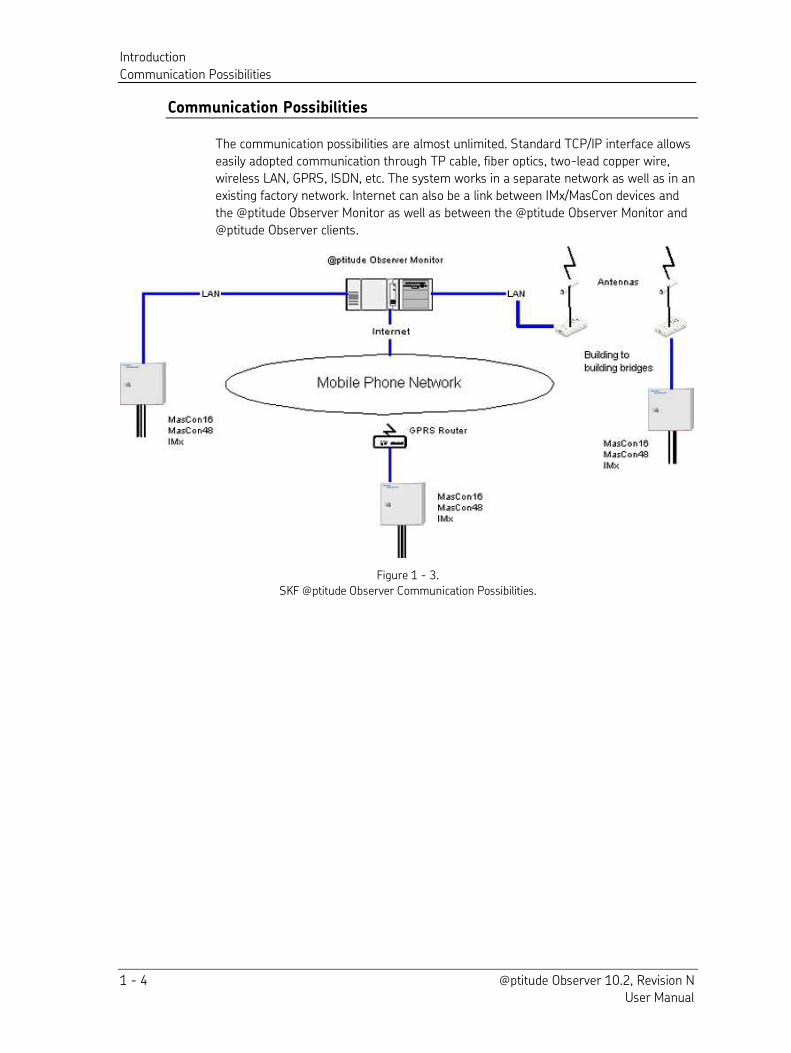
Communication Possibilities
The communication possibilities are almost unlimited. Standard TCP/IP interface allows
easily adopted communication through TP cable, fiber optics, two-lead copper wire,
wireless LAN, GPRS, ISDN, etc. The system works in a separate network as well as in an
existing factory network. Internet can also be a link between IMx/MasCon devices and
the @ptitude Observer Monitor as well as between the @ptitude Observer Monitor and
@ptitude Observer clients.
Figure 1 - 3.
SKF @ptitude Observer Communication Possibilities.
Introduction
Remote Monitoring Possibilities
@ptitude Observer 10.2, Revision N 1 - 5 User Manual
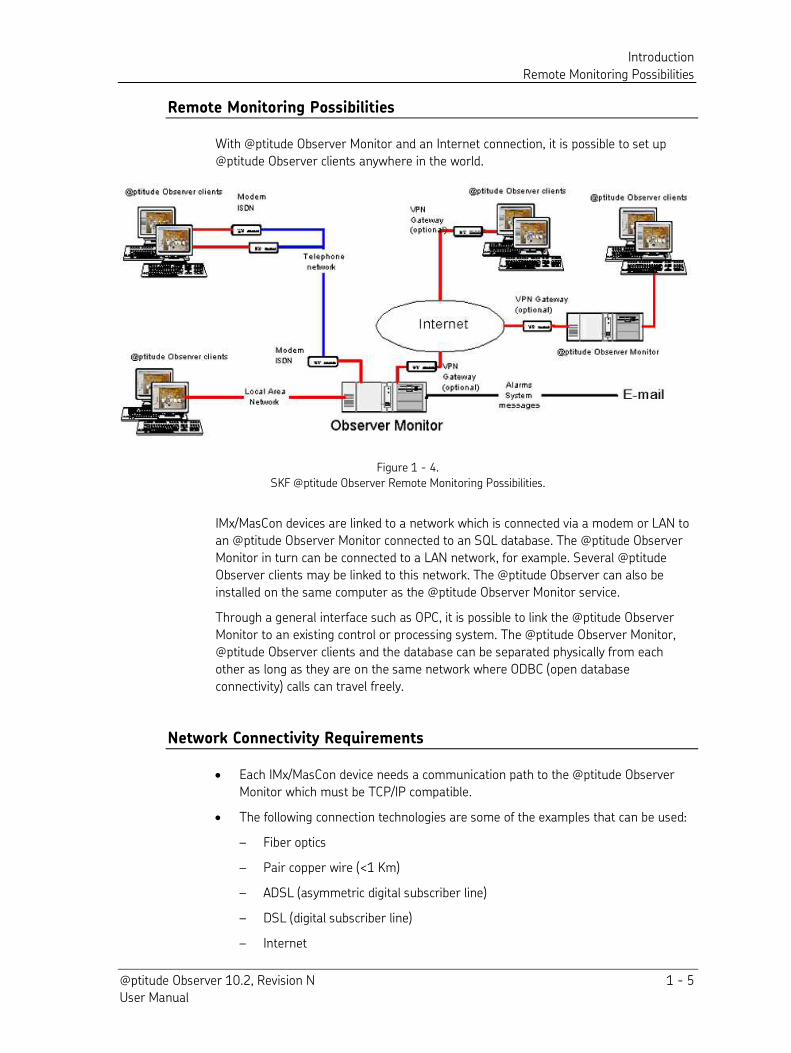
Remote Monitoring Possibilities
With @ptitude Observer Monitor and an Internet connection, it is possible to set up
@ptitude Observer clients anywhere in the world.
Figure 1 - 4.
SKF @ptitude Observer Remote Monitoring Possibilities.
IMx/MasCon devices are linked to a network which is connected via a modem or LAN to
an @ptitude Observer Monitor connected to an SQL database. The @ptitude Observer
Monitor in turn can be connected to a LAN network, for example. Several @ptitude
Observer clients may be linked to this network. The @ptitude Observer can also be
installed on the same computer as the @ptitude Observer Monitor service.
Through a general interface such as OPC, it is possible to link the @ptitude Observer
Monitor to an existing control or processing system. The @ptitude Observer Monitor,
@ptitude Observer clients and the database can be separated physically from each
other as long as they are on the same network where ODBC (open database
connectivity) calls can travel freely.
Network Connectivity Requirements
Each IMx/MasCon device needs a communication path to the @ptitude Observer
Monitor which must be TCP/IP compatible.
The following connection technologies are some of the examples that can be used:
– Fiber optics
– Pair copper wire (<1 Km)
– ADSL (asymmetric digital subscriber line)
– DSL (digital subscriber line)
– Internet
Introduction
Network Connectivity Requirements
1 - 6 @ptitude Observer 10.2, Revision N User Manual
– 128K ISDN (integrated services digital network) dial-up connection
– GPRS (general pocket radio services)
– Standard Ethernet network
Important - An on-line condition monitoring system like IMx/MasCon together with @ptitude
Observer can be successfully operated only on an installed and tested network infrastructure. Even though the IMx/MasCon devices as well as the @ptitude Observer Monitor are equipped with several fault tolerant routines and procedures, they can ultimately be only as reliable and effective as the network to which they are connected.
@ptitude Observer 10.2, Revision N 2 - 1 User Manual
2
Technical Specification
Hardware Connectivity
IMx is a series of on-line monitoring systems with dynamic/static inputs, digital inputs
and digital outputs with simultaneous measurement on all channels up to 40 kHz in one
19", 6 U rack. The available number of inputs and outputs varies depending on the type
of the data acquisition device.
MasCon16 is an on-line monitoring system with 16 dynamic/static inputs, 2 digital
inputs, 4 digital outputs.
MasCon48 is an on-line monitoring system with 48 channels and 4 configurable
interface cards, also available as a portable device.
SKF Microlog Analyzer is a portable data collector for single or multi channel
measurements.
Data Processing
On-line data acquisition from IMx/MasCon (Ethernet, TCP/IP).
On-line process data through OPC (object linking and embedding for process
control).
Configuration Features
Hardware interface settings for each IMx/MasCon device are configured by means
of alarm hysteresis and types of interface cards. Each channel of the hardware is
configured by the type of signal, gain, BIAS voltage limits, and correction factors for
run-out and linearity.
Measurement points. The following are the measurement point types that can be
configured.
Dynamic based measurement points
– Dynamic
– Dynamic, AEE
– Dynamic, Envelope
– Dynamic, Process
– Harmonic
– SEE® (spectral emitted energy)
– Time Waveform Analysis
– Time Waveform Analysis, AEE
Technical Specification
Analysis Features
2 - 2 @ptitude Observer 10.2, Revision N User Manual
Trend based measurement points
– Counter
– Counter rate
– Data tagging
– Derived
– Derived point
– Digital
– Gear inspector
– HFD (high frequency domain)
– OPC (object linking and embedding for process control)
– Process
– Running hours
– Shaft centerline
– Speed
– Speed from spectra
– Time difference
– Torsion
Analysis Features
FFT (fast Fourier transform) analysis is the classic way of analyzing vibration data
where the vibration signal is shown as a function of frequency. Frequency ranges from
0 to 10 Hz up to 0 to 40 kHz and resolutions from 100 to 6 400 lines can be used.
DPE (digital peak enveloping) analysis is an excellent method to detect small impulses
such as bearing defect in a noisy environment.
Bearing database stores geometrical data from approximately 20 000 different
bearings from several different manufactures. It is used for automatic defect frequency
calculation.
Machine diagnostics expert system uses a rule based diagnostic system for automatic
frequency analysis which gives clear text messages regarding fault type.
Graphic tool for machine data setup is used to define all mechanical data for defect
frequency calculation as well as machine diagnostics. The whole drive chain is set up
graphically by using drag and drop from a machine component toolbox.
Run-up/Coast down occurs when a machine is started or stopped. At such occurrences
the system can be configured to store transient data according to the user defined
conditions, like speed variations, set for the actual measurement group. During
transients separate alarm conditions can be applied.
Time waveform analysis is a smart detection of time waveform signature pattern in
order to identify and prevent errors that would normally not be detected by FFT
analysis. The algorithms included are crest factor, kurtosis and skewness. Advanced
analysis can be performed with the event capture capability of continuous pre and post
Technical Specification
User Interfaces
@ptitude Observer 10.2, Revision N 2 - 3 User Manual
data capture. The captured time waveforms enable detailed analysis of both very low
(mechanical) and very high (electrical or generator related) oscillations.
Balancing is the on-line balancing of machines especially designed for turbines with 15
planes and 5 states with a maximum of 40 measurement points simultaneously.
Order tracking analysis is an efficient way to analyze machines with variable speed.
Order tracking analyzes the speed measured on each shaft revolution as a means of
adjusting the number of samples taken for that revolution. This process keeps the
number of samples per revolution identical regardless of shaft speed.
User Interfaces
Hierarchy view shows machines and their measurement points in a tree structured
hierarchy with corresponding status for each object. The hierarchy can display data
from several databases at the same time.
System view shows the status from a hardware point of view which is based on
IMx/MasCon devices, sensors and measurement points. It also shows communication
status.
Workspace is a hierarchy view of user selected machine(s). It is an individual work
space to keep track of only the machines for which the user is responsible. A workspace
can span only one single database.
Diagram view saves all the settings of a graphic diagram including selection of
measurement points as well as buffer settings. This is to be able to have predefined
views of the data.
Protection view presents an overview of all the Protection devices and their status. It is
also possible to synchronize the settings with the Protection device.
Graphic Displays
Any graphic display can be set in live mode and be updated whenever possible. The
update rate is determined by the setup and time involved in capturing the actual data.
Spectra shows the vibration amplitude as a function of frequency.
Time waveform shows the vibration magnitude as a function of time and gives you
the possibility to listen to the signal if a sound card has been installed in the
computer.
Phase displays the binary representation of phase data for the time waveform from
-180 to 180 degrees.
History displays historical data in a combined plot for spectra, time waveform and
phase.
3D Plot illustrates vibration spectra or envelopes as a function of time, shaft speed,
power, temperature, torque or any other DC parameter.
Topology illustrates frequency spectra versus speed or time by using color
separation.
Technical Specification
Alarm
2 - 4 @ptitude Observer 10.2, Revision N User Manual
Orbit displays the shaft orbital movement by using signals from two
perpendicularly mounted transducers.
Profile uses triggered acceleration time signal data to represent an un-roundness
of any circular object.
Gear inspector is used to visualize the impact energy as a function of shaft/gear
revolutions.
Trend shows vibration amplitude/phase or process data as a function of time,
speed or other process data.
Bode plot shows any type of data such as vibration amplitude/phase or process
data as a function of speed.
Trend list shows vibration amplitude/phase or process data as a function of time,
speed or other process data as Trend but in a list.
Multi trend overlays data from several measurement sources in a combined trend
and bar graph. It is also possible to view data as a function of any of the other
selected points.
Diagnosis shows the built-in prognostic and historic fault detection algorithm
calculations.
Polar shows the vibration signal at 1, 2, 3 and 4 times the shaft speed in the
complex domain.
Shaft centerline displays shaft movement inside a bearing.
Combination plots facilitates the analysis by combining displays into one graph
showing related data.
Event Capture is a measurement of a limited time waveform that can be used for
continuous pre and post data capture.
Alarm
There are a variety of alarm features such as level alarm, trend alarm, vector alarm,
diagnostics alarm, and circle alarm. Upon alarm, notifications can be automatically sent
to the designated user(s) by e-mail or SMS (short message service).
Speed dependent alarm conditions can be up to 15 primary alarms for each
measurement point. These alarms can be at a fixed frequency, fixed frequency
range, speed dependent frequency or speed dependent frequency range.
Speed or load dependent alarm level can be fixed or set as a function of shaft
speed or any DC measurement point for each alarm level. For each alarm condition
there are two alarm levels for vibration measurement points and four alarm levels
for DC measurement points.
Class dependent alarms (for Dynamic and Dynamic Envelope points only) can be
enabled as alarms dependent on the two Multiple Gating Point operating classes.
This disables other alarms. Refer to Enable class dependent alarms for details.
Technical Specification
Report
@ptitude Observer 10.2, Revision N 2 - 5 User Manual
Alarm group can be created if a user wishes to collect data from other
measurement points. When an alarm is raised the measurement data at that
measurement point is saved in the database. If one of the measurement points in
the alarm group generates an alarm, data on all the measurement points in that
alarm group will be saved.
Report
PDF-based and Word reports containing alarm lists, notes, manual conclusions, trend
data, diagnosis reports and condition monitoring statistics can be produced by Report
Wizard.
System Integrity
System alarms via e-mail or SMS messages.
User defined system privileges and preferences for each individual user.
Database management tool for database backup and database replication.
Automatic hardware serial number verification.
Error logs.
Tracking of TCP/IP communication package errors.
Hardware sequence number tracking.
Missing data alarm

@ptitude Observer 10.2, Revision N 3 - 1 User Manual
3
Getting Started
To start @ptitude Observer, first select a language at "Select language" screen.
If you have not registered your copy of @ptitude Observer yet, the "Unregistered version
of Observer" screen will appear for you to take a necessary action.
If you click the Enter license key button the License Key screen appears for you to
enter the license key. You may continue the session by clicking the Continue
unregistered button. However, you will be prompted by the Enter license key screen
from time to time throughout the session until you register the product.
Note that once you have selected a language and entered the license key, the selected
language and the license key are saved and you will not be required to enter them
again. The next time you start @ptitude Observer you will be prompted to select a
database to be connected.
Database Connection
In order to run @ptitude Observer, a database must be connected. Refer to Manage
Databases under File in Menu Items section.
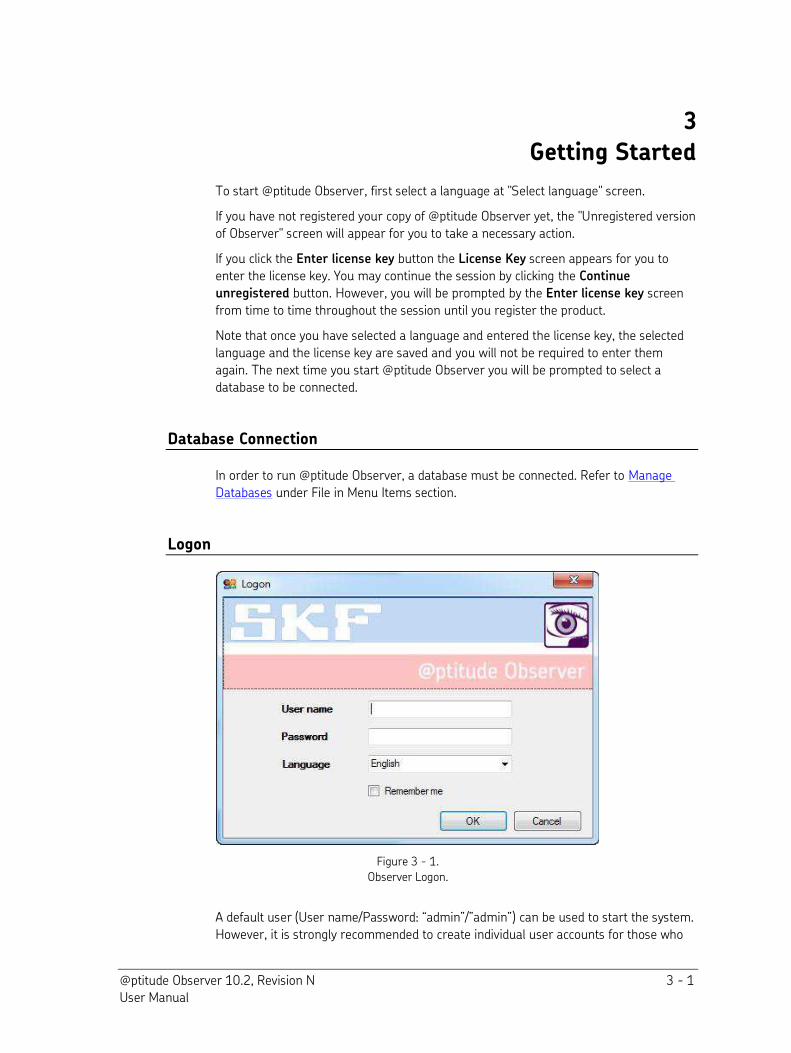
Logon
Figure 3 - 1.
Observer Logon.
A default user (User name/Password: “admin”/”admin”) can be used to start the system.
However, it is strongly recommended to create individual user accounts for those who
Getting Started
Logon
3 - 2 @ptitude Observer 10.2, Revision N User Manual
have the access to the system. It is necessary to have individual user accounts and
rights in order to keep track of configuration changes.
The system will remember the user name and the password if the Remember me
checkbox is marked.
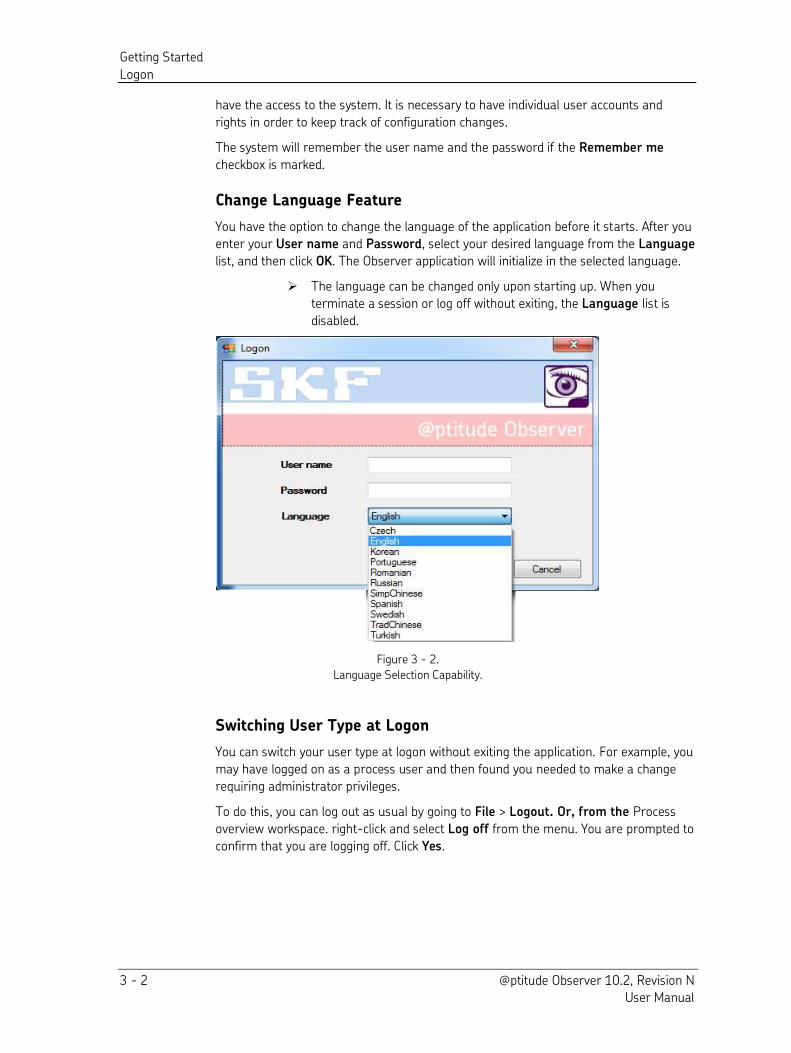
Change Language Feature
You have the option to change the language of the application before it starts. After you
enter your User name and Password, select your desired language from the Language
list, and then click OK. The Observer application will initialize in the selected language.
The language can be changed only upon starting up. When you
terminate a session or log off without exiting, the Language list is
disabled.
Figure 3 - 2.
Language Selection Capability.
Switching User Type at Logon
You can switch your user type at logon without exiting the application. For example, you
may have logged on as a process user and then found you needed to make a change
requiring administrator privileges.
To do this, you can log out as usual by going to File > Logout. Or, from the Process
overview workspace. right-click and select Log off from the menu. You are prompted to
confirm that you are logging off. Click Yes.
Getting Started
DASHBOARD
@ptitude Observer 10.2, Revision N 3 - 3 User Manual
Figure 3 - 3.
Log off confirmation.
You are then logged off and the Logon dialog opens automatically. Log on as a different
type of user, such as Admin, to perform your tasks.
DASHBOARD
After a successful logon, the "DASHBOARD" screen will provide Notifications, News Feed
and Message Center interfaces.
Refer to Dashboard under Show in Menu Items section.

@ptitude Observer 10.2, Revision N 4 - 1 User Manual
4
System Configuration
This chapter describes the configuration of @ptitude Observer, how to get the analysis
work started quickly and how @ptitude Observer works as a condition monitoring
system.
The configuration of @ptitude Observer is usually performed when the system is
installed, however changes can be easily made.
Prior to analyzing measurement data, @ptitude Observer must be configured according
to the particular plant and its machinery. It is important that all machine parts as well as
measurement points are located at the correct positions.
Guidance for System Installations
Regular backup of the database is normal practice. Backup intervals and methods are
governed by the specific needs of each instance. It is a best practice to create a full
backup before any major upgrade of the @ptitude Observer.
Databases with many attached IMx devices will grow rapidly. For a new database it is
advised to initially utilize less than 75% of the maximum capacity to allow for future
expansion.
Experience shows that grouping devices by customer or by wind farm leads to
databases with less IMx systems.
Recommended System Configurations
To get a system up and running properly the following system configurations should be
covered.
Build a hierarchy view by creating necessary plants, mills and machines in order
to organize your condition monitoring system.
Define hardware devices such as input boards, sensors, signal characteristics, etc.
for each device and channel.
Define machine parts by defining the drive line for each machine. All shafts,
bearings, gear wheels, drive belts, impellers along with other machine parts, are
connected to a drive line. Based on these inputs the system can calculate all defect
frequencies within the whole machine.
Set up measurement points and alarms in order to get the data into the system.
For on-line systems such as MasCon, you can define multiple measurement points
per channel if needed.
Build a process overview on on-line condition monitoring systems which can
allow you to view live data as they are coming in. IMx/MasCon devices allow you to
measure and send data faster than other on-line data acquisition devices. @ptitude
Observer enables the creation of user defined displays with measurement points
and links to other displays on top of graphic pictures like drawings, digital photos,
etc.
System Configuration
Building a Hierarchy View
4 - 2 @ptitude Observer 10.2, Revision N User Manual
Building a Hierarchy View
The idea behind the hierarchy view is to achieve a logical grouping of all the
measurements and their positions related to one another.
The hierarchy view consists of the following attributes:
Database
Node
Machine
Sub machine
Meas. point
Event capture groups also display in the hierarchy view. The event capture group
supports limited time waveform points and continuous pre and post data capture. Each
IMx unit can have only one event capture group, which will display before other points in
the machine’s hierarchy. Event capture measurement points display as children of the event capture group. Refer to Measurement Groups for information about the creation
and configuration of event capture groups.
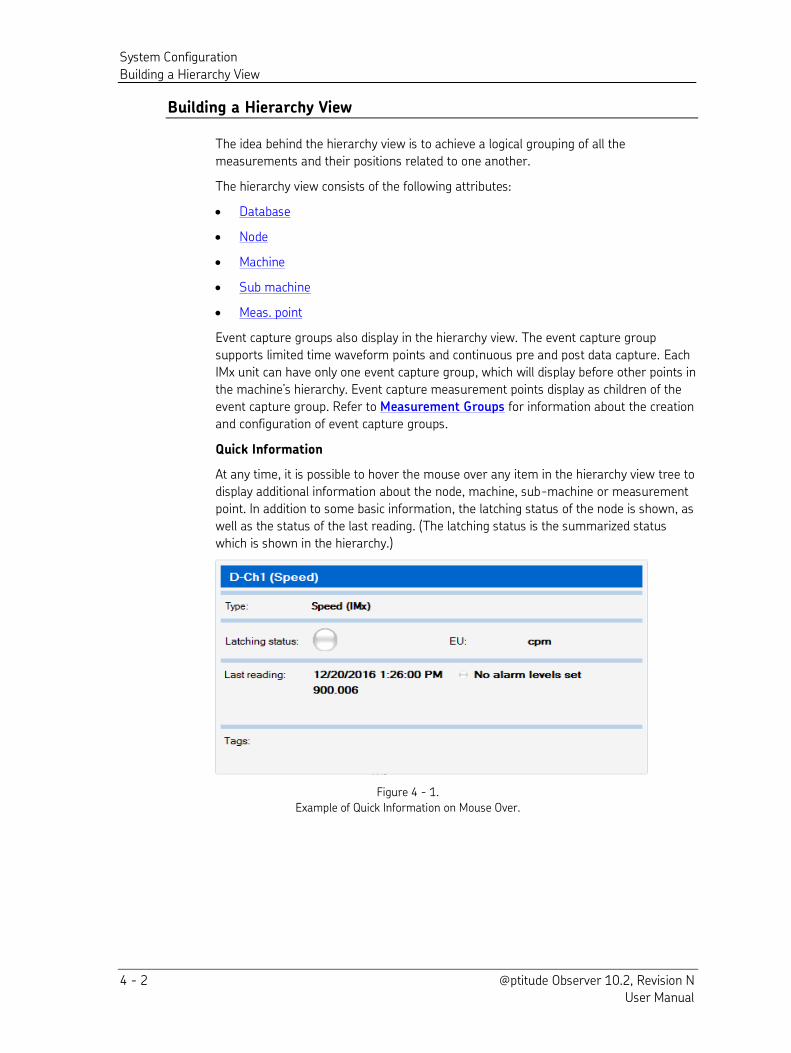
Quick Information
At any time, it is possible to hover the mouse over any item in the hierarchy view tree to
display additional information about the node, machine, sub-machine or measurement
point. In addition to some basic information, the latching status of the node is shown, as
well as the status of the last reading. (The latching status is the summarized status
which is shown in the hierarchy.)
Figure 4 - 1.
Example of Quick Information on Mouse Over.
System Configuration
Building a Hierarchy View
@ptitude Observer 10.2, Revision N 4 - 3 User Manual
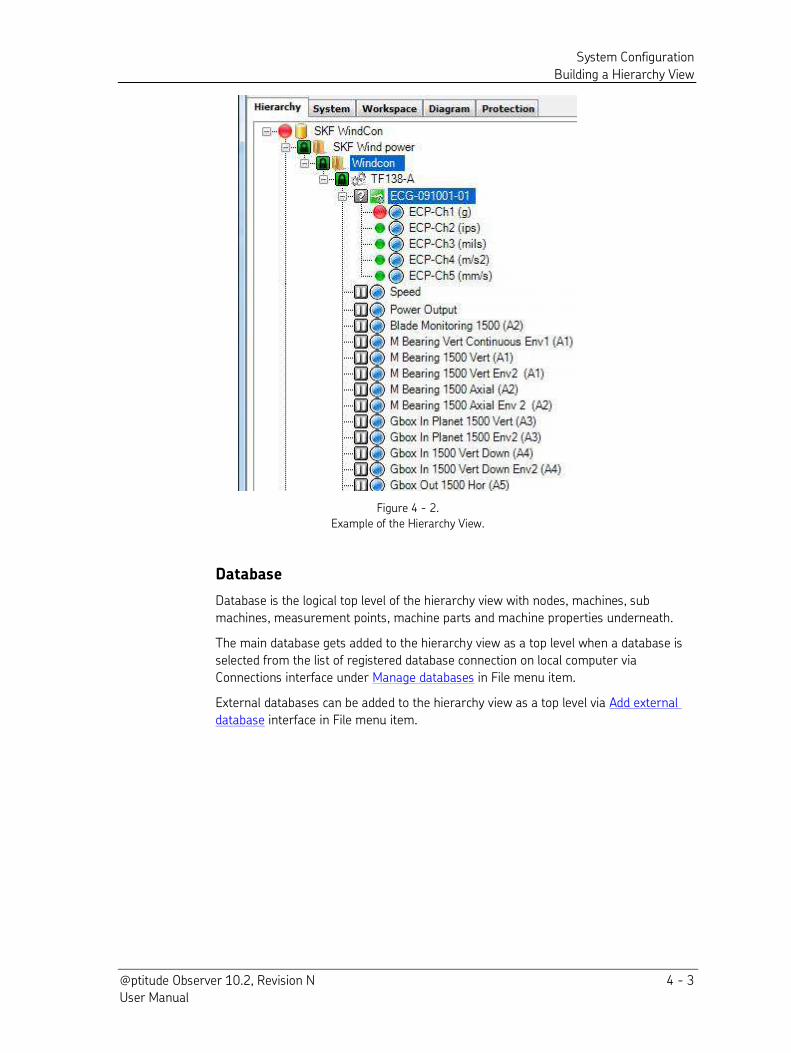
Figure 4 - 2.
Example of the Hierarchy View.
Database
Database is the logical top level of the hierarchy view with nodes, machines, sub
machines, measurement points, machine parts and machine properties underneath.
The main database gets added to the hierarchy view as a top level when a database is
selected from the list of registered database connection on local computer via
Connections interface under Manage databases in File menu item.
External databases can be added to the hierarchy view as a top level via Add external
database interface in File menu item.
System Configuration
Building a Hierarchy View
4 - 4 @ptitude Observer 10.2, Revision N User Manual
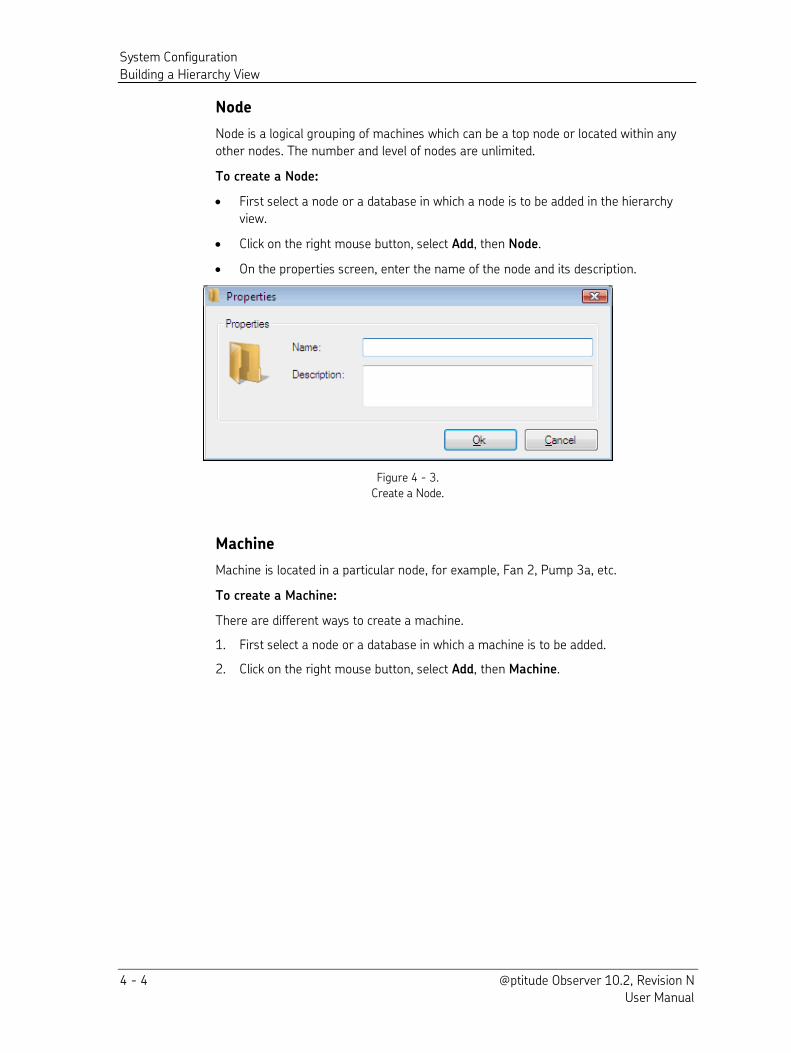
Node
Node is a logical grouping of machines which can be a top node or located within any
other nodes. The number and level of nodes are unlimited.
To create a Node:
First select a node or a database in which a node is to be added in the hierarchy
view.
Click on the right mouse button, select Add, then Node.
On the properties screen, enter the name of the node and its description.
Figure 4 - 3.
Create a Node.
Machine
Machine is located in a particular node, for example, Fan 2, Pump 3a, etc.
To create a Machine:
There are different ways to create a machine.
1. First select a node or a database in which a machine is to be added.
2. Click on the right mouse button, select Add, then Machine.
System Configuration
Building a Hierarchy View
@ptitude Observer 10.2, Revision N 4 - 5 User Manual
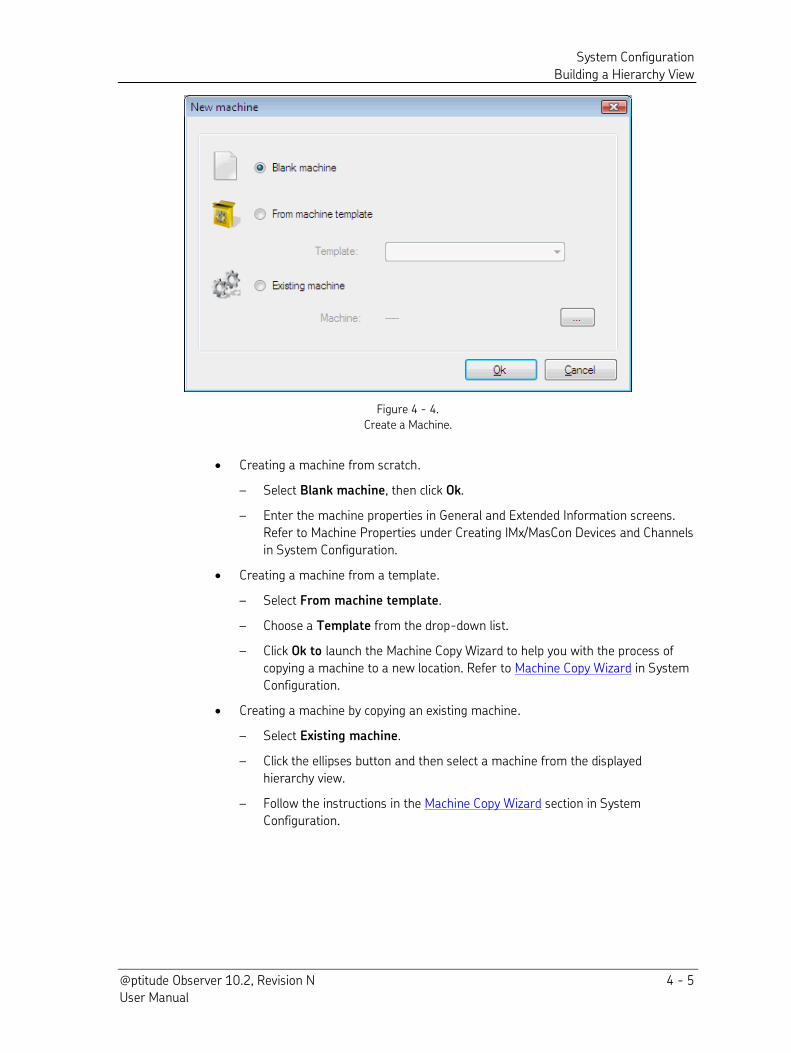
Figure 4 - 4.
Create a Machine.
Creating a machine from scratch.
– Select Blank machine, then click Ok.
– Enter the machine properties in General and Extended Information screens.
Refer to Machine Properties under Creating IMx/MasCon Devices and Channels
in System Configuration.
Creating a machine from a template.
– Select From machine template.
– Choose a Template from the drop-down list.
– Click Ok to launch the Machine Copy Wizard to help you with the process of
copying a machine to a new location. Refer to Machine Copy Wizard in System
Configuration.
Creating a machine by copying an existing machine.
– Select Existing machine.
– Click the ellipses button and then select a machine from the displayed
hierarchy view.
– Follow the instructions in the Machine Copy Wizard section in System
Configuration.
System Configuration
Building a Hierarchy View
4 - 6 @ptitude Observer 10.2, Revision N User Manual
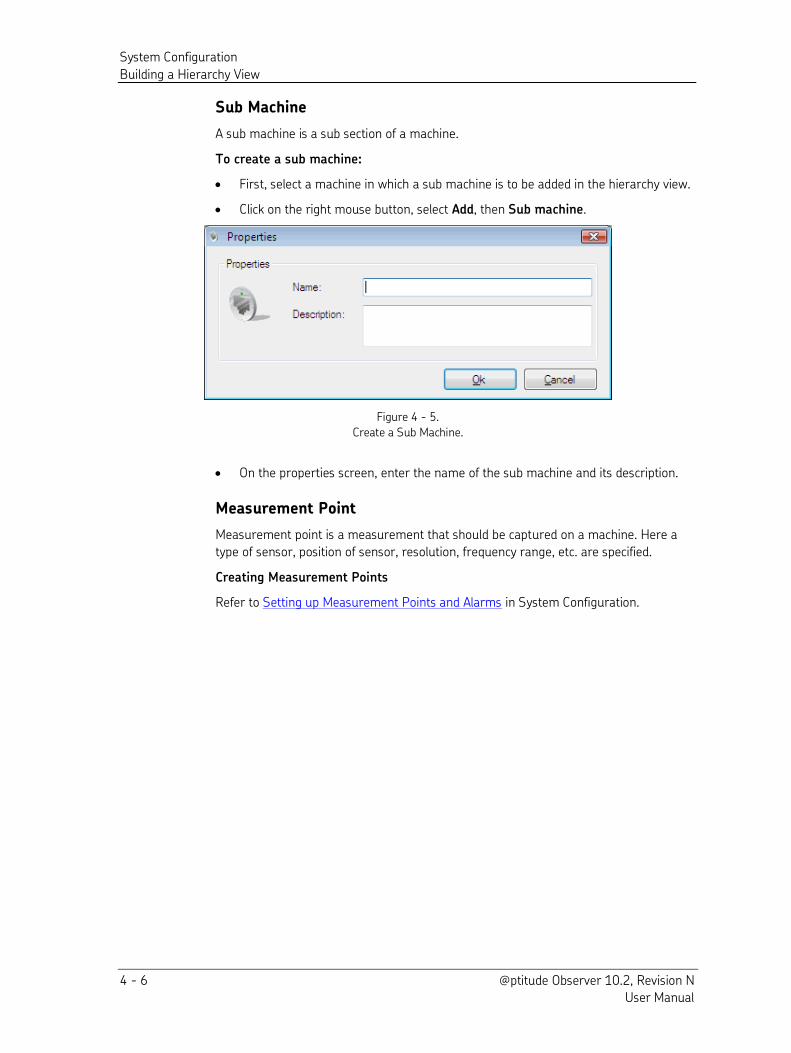
Sub Machine
A sub machine is a sub section of a machine.
To create a sub machine:
First, select a machine in which a sub machine is to be added in the hierarchy view.
Click on the right mouse button, select Add, then Sub machine.
Figure 4 - 5.
Create a Sub Machine.
On the properties screen, enter the name of the sub machine and its description.
Measurement Point
Measurement point is a measurement that should be captured on a machine. Here a
type of sensor, position of sensor, resolution, frequency range, etc. are specified.
Creating Measurement Points
Refer to Setting up Measurement Points and Alarms in System Configuration.
System Configuration
Creating IMx/MasCon Devices and Channels
@ptitude Observer 10.2, Revision N 4 - 7 User Manual
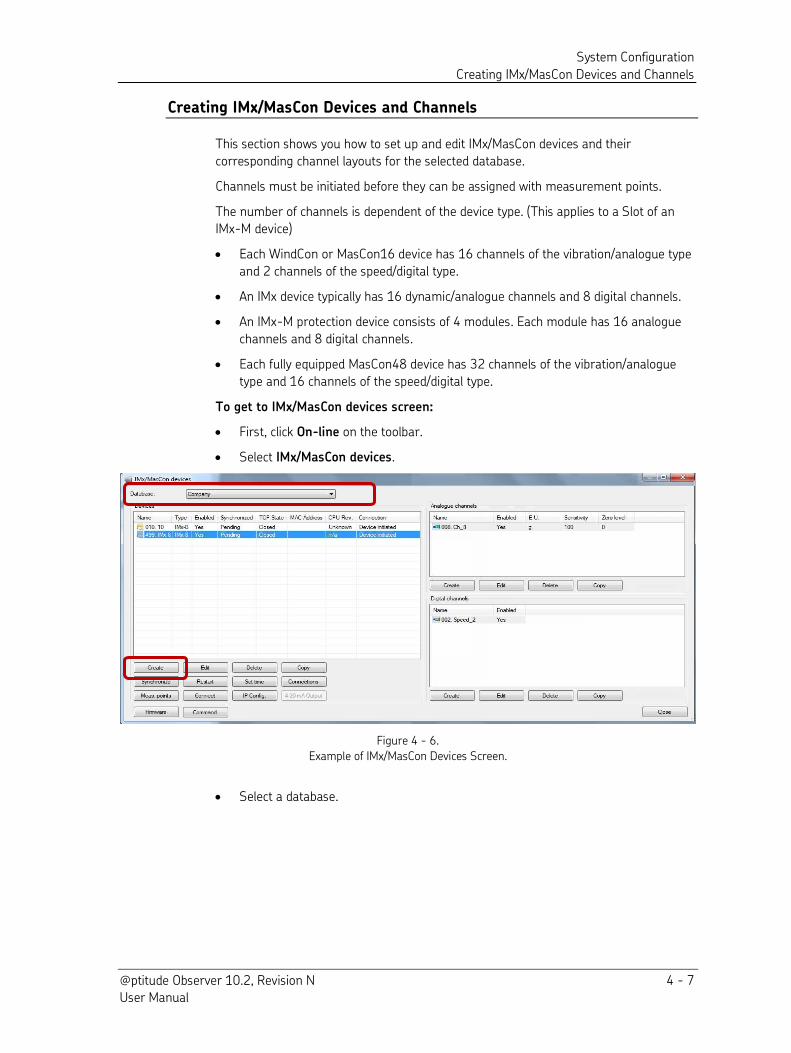
Creating IMx/MasCon Devices and Channels
This section shows you how to set up and edit IMx/MasCon devices and their
corresponding channel layouts for the selected database.
Channels must be initiated before they can be assigned with measurement points.
The number of channels is dependent of the device type. (This applies to a Slot of an
IMx-M device)
Each WindCon or MasCon16 device has 16 channels of the vibration/analogue type
and 2 channels of the speed/digital type.
An IMx device typically has 16 dynamic/analogue channels and 8 digital channels.
An IMx-M protection device consists of 4 modules. Each module has 16 analogue
channels and 8 digital channels.
Each fully equipped MasCon48 device has 32 channels of the vibration/analogue
type and 16 channels of the speed/digital type.
To get to IMx/MasCon devices screen:
First, click On-line on the toolbar.
Select IMx/MasCon devices.
Figure 4 - 6.
Example of IMx/MasCon Devices Screen.
Select a database.
System Configuration
Creating IMx/MasCon Devices and Channels
4 - 8 @ptitude Observer 10.2, Revision N User Manual
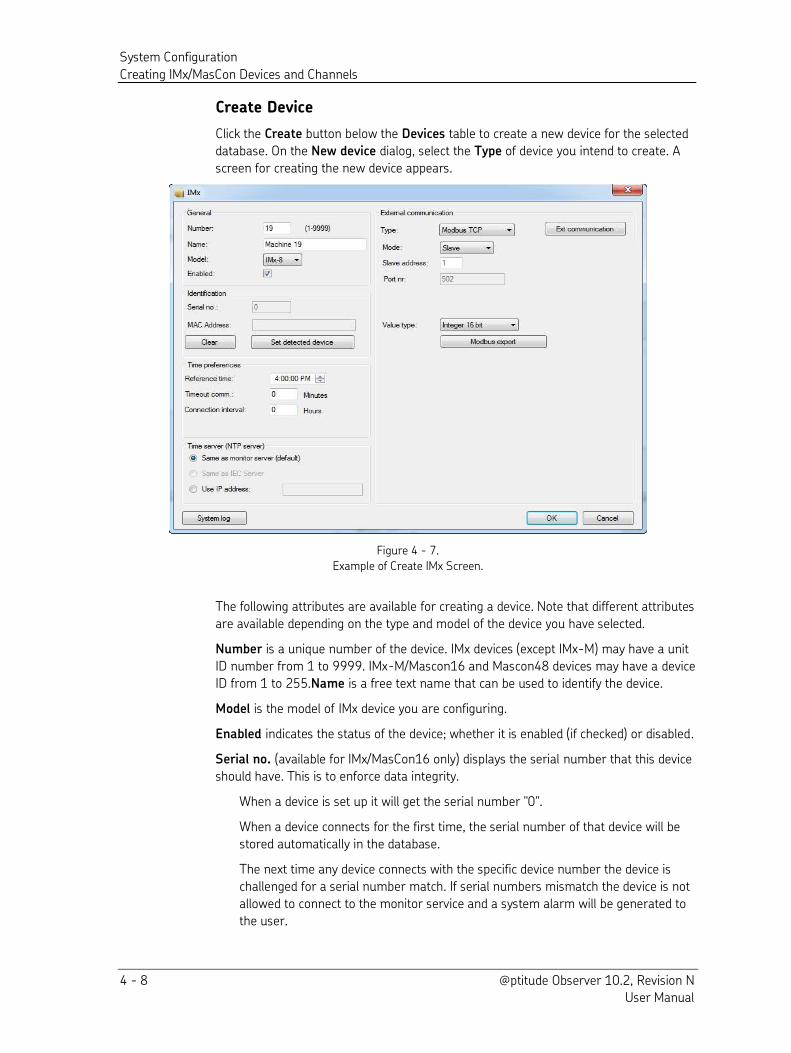
Create Device
Click the Create button below the Devices table to create a new device for the selected
database. On the New device dialog, select the Type of device you intend to create. A
screen for creating the new device appears.
Figure 4 - 7.
Example of Create IMx Screen.
The following attributes are available for creating a device. Note that different attributes
are available depending on the type and model of the device you have selected.
Number is a unique number of the device. IMx devices (except IMx-M) may have a unit
ID number from 1 to 9999. IMx-M/Mascon16 and Mascon48 devices may have a device
ID from 1 to 255.Name is a free text name that can be used to identify the device.
Model is the model of IMx device you are configuring.
Enabled indicates the status of the device; whether it is enabled (if checked) or disabled.
Serial no. (available for IMx/MasCon16 only) displays the serial number that this device
should have. This is to enforce data integrity.
When a device is set up it will get the serial number "0".
When a device connects for the first time, the serial number of that device will be
stored automatically in the database.
The next time any device connects with the specific device number the device is
challenged for a serial number match. If serial numbers mismatch the device is not
allowed to connect to the monitor service and a system alarm will be generated to
the user.
System Configuration
Creating IMx/MasCon Devices and Channels
@ptitude Observer 10.2, Revision N 4 - 9 User Manual
If the device is replaced or the CPU board of the device is replaced it is necessary
that the serial number is reset by clicking the reset button.
MAC Address displays the MAC address of the unit stored in Observer. With firmware
v5.907 or later, the MAC address, IMx model and memory size of the device are
detected automatically when the device connects to Monitor and Observer.
The MAC address and memory size (CPU Rev) will be stored in
Observer if it does not already exist. The CPU Rev is stored as
“Higher than v1.48” if the SDRAM-size is 64 MB and “Lower than v1.48” if the SDRAM-size is 32 MB. When Monitor generates a
configuration, it checks if the configuration needs the newer
“Higher than v1.48” CPU type. If there is a mismatch; a system alarm will be sent to Observer informing the user of this and a
popup with the text "Invalid Device Configuration" will be
displayed in Observer.
When an IMx device connects to Monitor and Observer, Monitor compares its MAC
address and model to what is configured in Observer. If there is a mismatch, a system
alarm in Observer informs the user. The alarm contains the MAC address or Model that
the device sent. The connection is terminated when there is mismatch of the MAC
address or Model.
Clear – click the Clear button to clear both the stored serial number and the MAC
address of the unit in Observer. The Clear button also clears any association with any
device that has been assigned through the Set detected device function.
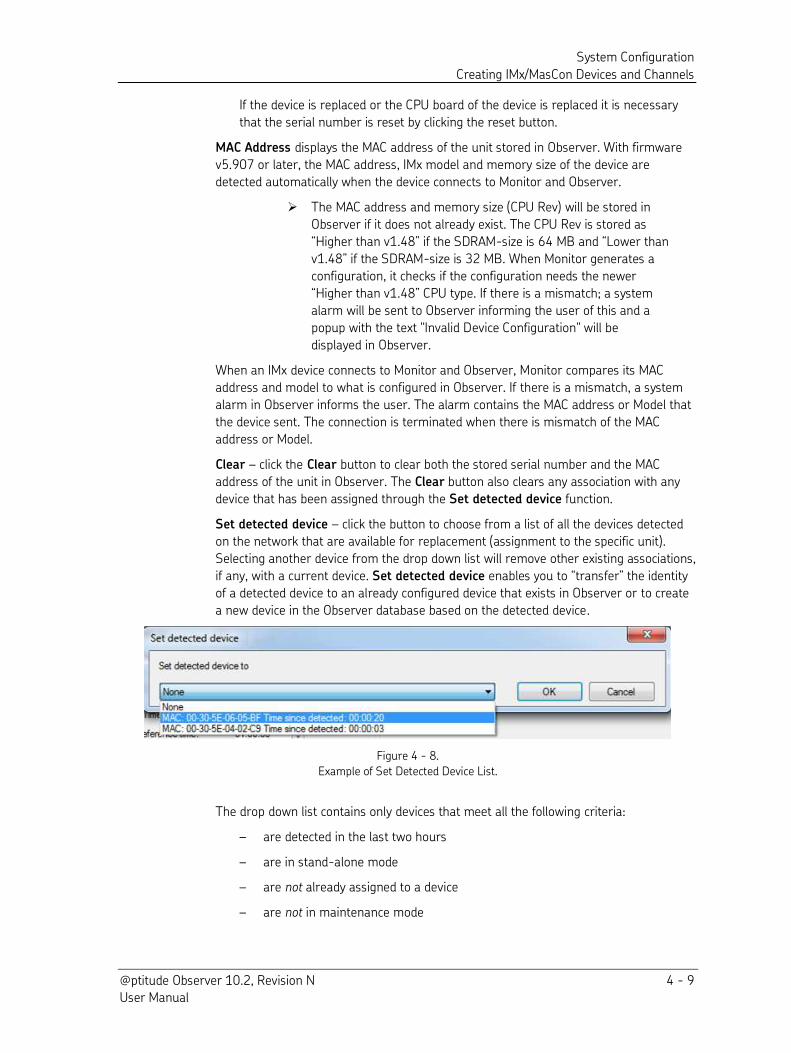
Set detected device – click the button to choose from a list of all the devices detected
on the network that are available for replacement (assignment to the specific unit).
Selecting another device from the drop down list will remove other existing associations,
if any, with a current device. Set detected device enables you to “transfer” the identity of a detected device to an already configured device that exists in Observer or to create
a new device in the Observer database based on the detected device.
Figure 4 - 8.
Example of Set Detected Device List.
The drop down list contains only devices that meet all the following criteria:
– are detected in the last two hours
– are in stand-alone mode
– are not already assigned to a device
– are not in maintenance mode
System Configuration
Creating IMx/MasCon Devices and Channels
4 - 10 @ptitude Observer 10.2, Revision N User Manual
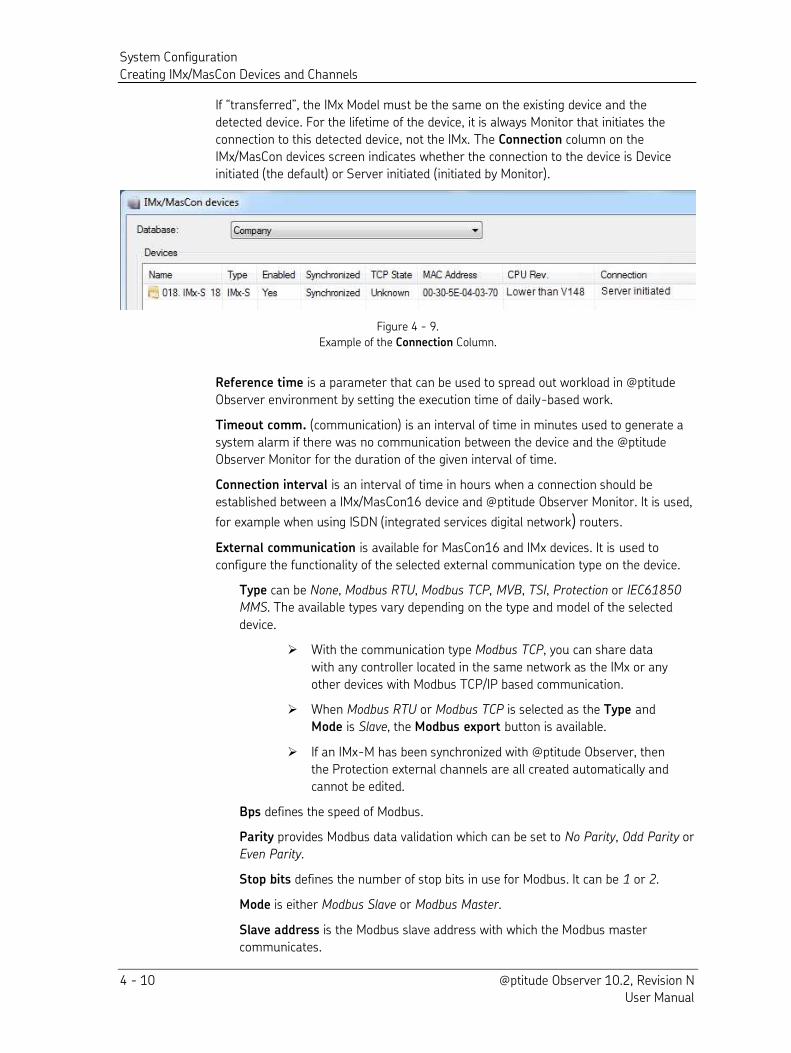
If “transferred”, the IMx Model must be the same on the existing device and the
detected device. For the lifetime of the device, it is always Monitor that initiates the
connection to this detected device, not the IMx. The Connection column on the
IMx/MasCon devices screen indicates whether the connection to the device is Device
initiated (the default) or Server initiated (initiated by Monitor).
Figure 4 - 9.
Example of the Connection Column.
Reference time is a parameter that can be used to spread out workload in @ptitude
Observer environment by setting the execution time of daily-based work.
Timeout comm. (communication) is an interval of time in minutes used to generate a
system alarm if there was no communication between the device and the @ptitude
Observer Monitor for the duration of the given interval of time.
Connection interval is an interval of time in hours when a connection should be
established between a IMx/MasCon16 device and @ptitude Observer Monitor. It is used,
for example when using ISDN (integrated services digital network) routers.
External communication is available for MasCon16 and IMx devices. It is used to
configure the functionality of the selected external communication type on the device.
Type can be None, Modbus RTU, Modbus TCP, MVB, TSI, Protection or IEC61850
MMS. The available types vary depending on the type and model of the selected
device.
With the communication type Modbus TCP, you can share data
with any controller located in the same network as the IMx or any
other devices with Modbus TCP/IP based communication. When Modbus RTU or Modbus TCP is selected as the Type and
Mode is Slave, the Modbus export button is available.
If an IMx-M has been synchronized with @ptitude Observer, then
the Protection external channels are all created automatically and
cannot be edited.
Bps defines the speed of Modbus.
Parity provides Modbus data validation which can be set to No Parity, Odd Parity or
Even Parity.
Stop bits defines the number of stop bits in use for Modbus. It can be 1 or 2.
Mode is either Modbus Slave or Modbus Master.
Slave address is the Modbus slave address with which the Modbus master
communicates.
System Configuration
Creating IMx/MasCon Devices and Channels
@ptitude Observer 10.2, Revision N 4 - 11 User Manual
Value type is either Integer 16 bit or Float 32 bits.
Byte order specifies how to read the bytes in the client unit (IMx).
TCP/IP address specifies the IP address of the desired target device.
Port nr is the standard port for the Modbus TCP/IP protocol.
Parameter is application specific and is required only for MVB, TSI and Protection
types.
External communication button – click the button to set up other types of
communications direct from the IMx to external systems/sensors.
Interface card is a hardware configuration card which is required for MasCon48 only.
Four different cards can be selected and each card has 8 channels.
AC/DC 25 V: for analogue inputs, for example when a device is equipped with
Bentley probes.
AC/DC 15 V: for analogue inputs, for example when a device is equipped with
accelerometers.
DC: for a device with temperature and pressure sensors.
DC Isol (isolated): for a device with an external signal such as an input motor load.
Time server (NTP server) enables you to configure the Time server (NTP server) for
an IMx device. NTP stands for Network Time Protocol, which is an Internet protocol
used to synchronize computer clocks to a specified time service. (See figure below.)
Same as monitor server (default) uses the NTP Server parameters specified in
the network configuration file downloaded through the serial interface. See time
synchronization thresholds for details about setting up threshold alarms.
Same as IEC Server If you select this option, you must identify the IEC server you
want to use. In the External communication section, select the Type as IEC61850
MMS. Next, check Client Enabled. Enter the Server address, which is the IP
address of the IEC Server.
Use IP address enables you to configure the IMx device’s NTP IP address to use the same NTP service as the machines (turbines) it is monitoring.
For example, IMx A is monitoring Machine 1. Machine 1 is an NTP client of an
external NTP service. If you enter the NTP server address of IMx A to point to the
same NTP service as Machine 1, the timestamps from Machine 1 and IMx A will be
aligned. See time synchronization thresholds for details about setting up
threshold alarms.
System log is a record containing all the historical configuration changes made to the
device.
Edit TSI Config is available for IMx-R devices only. It allows you to configure IMx-R TSI
part and MVB. For more information, refer to "IMx-R User Manual."
System Configuration
Creating IMx/MasCon Devices and Channels
4 - 12 @ptitude Observer 10.2, Revision N User Manual
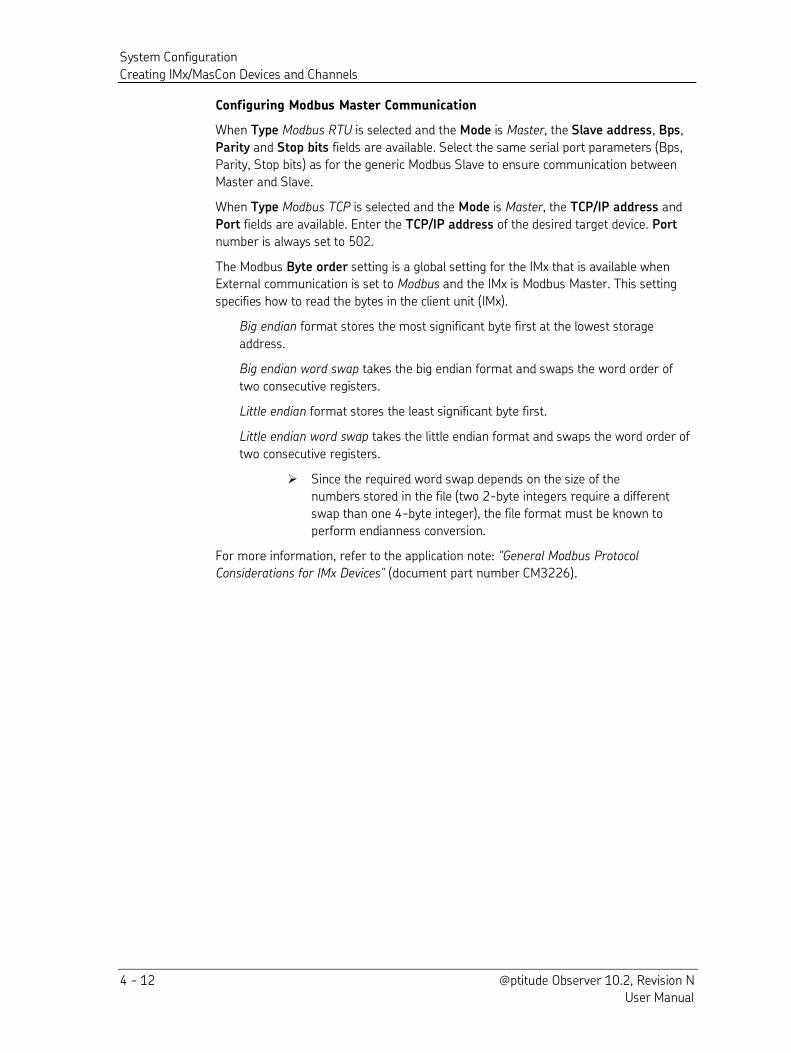
Configuring Modbus Master Communication
When Type Modbus RTU is selected and the Mode is Master, the Slave address, Bps,
Parity and Stop bits fields are available. Select the same serial port parameters (Bps,
Parity, Stop bits) as for the generic Modbus Slave to ensure communication between
Master and Slave.
When Type Modbus TCP is selected and the Mode is Master, the TCP/IP address and
Port fields are available. Enter the TCP/IP address of the desired target device. Port
number is always set to 502.
The Modbus Byte order setting is a global setting for the IMx that is available when External communication is set to Modbus and the IMx is Modbus Master. This setting
specifies how to read the bytes in the client unit (IMx).
Big endian format stores the most significant byte first at the lowest storage
address.
Big endian word swap takes the big endian format and swaps the word order of
two consecutive registers.
Little endian format stores the least significant byte first.
Little endian word swap takes the little endian format and swaps the word order of
two consecutive registers.
Since the required word swap depends on the size of the
numbers stored in the file (two 2-byte integers require a different
swap than one 4-byte integer), the file format must be known to
perform endianness conversion.
For more information, refer to the application note: "General Modbus Protocol
Considerations for IMx Devices" (document part number CM3226).
System Configuration
Creating IMx/MasCon Devices and Channels
@ptitude Observer 10.2, Revision N 4 - 13 User Manual
Figure 4 - 10.
Example of IMx with Communication Mode Modbus Master.
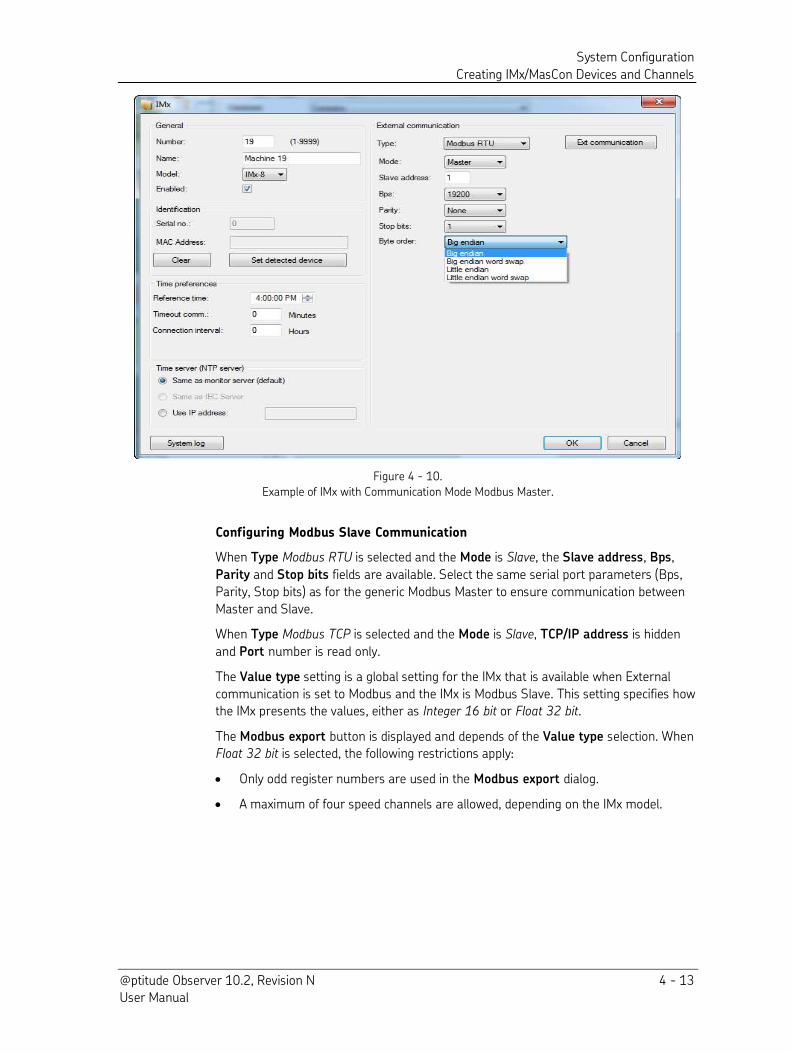
Configuring Modbus Slave Communication
When Type Modbus RTU is selected and the Mode is Slave, the Slave address, Bps,
Parity and Stop bits fields are available. Select the same serial port parameters (Bps,
Parity, Stop bits) as for the generic Modbus Master to ensure communication between
Master and Slave.
When Type Modbus TCP is selected and the Mode is Slave, TCP/IP address is hidden
and Port number is read only.
The Value type setting is a global setting for the IMx that is available when External
communication is set to Modbus and the IMx is Modbus Slave. This setting specifies how the IMx presents the values, either as Integer 16 bit or Float 32 bit.
The Modbus export button is displayed and depends of the Value type selection. When Float 32 bit is selected, the following restrictions apply:
Only odd register numbers are used in the Modbus export dialog.
A maximum of four speed channels are allowed, depending on the IMx model.
System Configuration
Creating IMx/MasCon Devices and Channels
4 - 14 @ptitude Observer 10.2, Revision N User Manual
Figure 4 - 11.
Example of IMx with Communication Mode Modbus Slave.
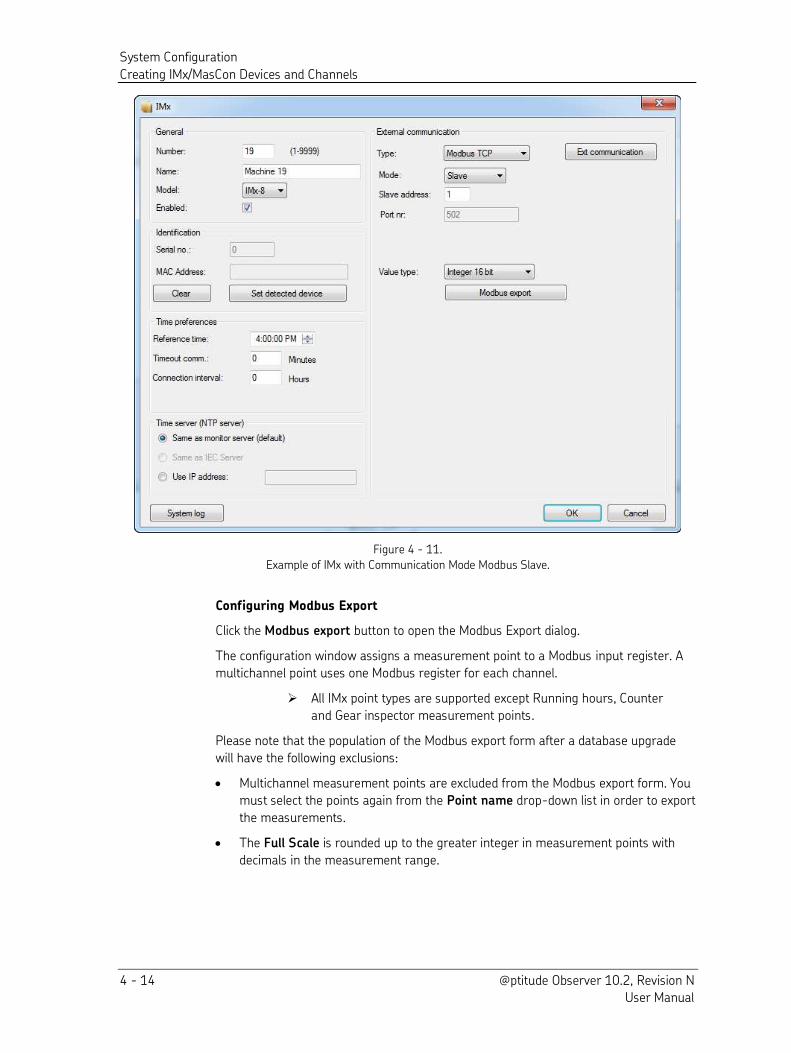
Configuring Modbus Export
Click the Modbus export button to open the Modbus Export dialog.
The configuration window assigns a measurement point to a Modbus input register. A
multichannel point uses one Modbus register for each channel.
All IMx point types are supported except Running hours, Counter
and Gear inspector measurement points.
Please note that the population of the Modbus export form after a database upgrade
will have the following exclusions:
Multichannel measurement points are excluded from the Modbus export form. You
must select the points again from the Point name drop-down list in order to export
the measurements.
The Full Scale is rounded up to the greater integer in measurement points with
decimals in the measurement range.
System Configuration
Creating IMx/MasCon Devices and Channels
@ptitude Observer 10.2, Revision N 4 - 15 User Manual
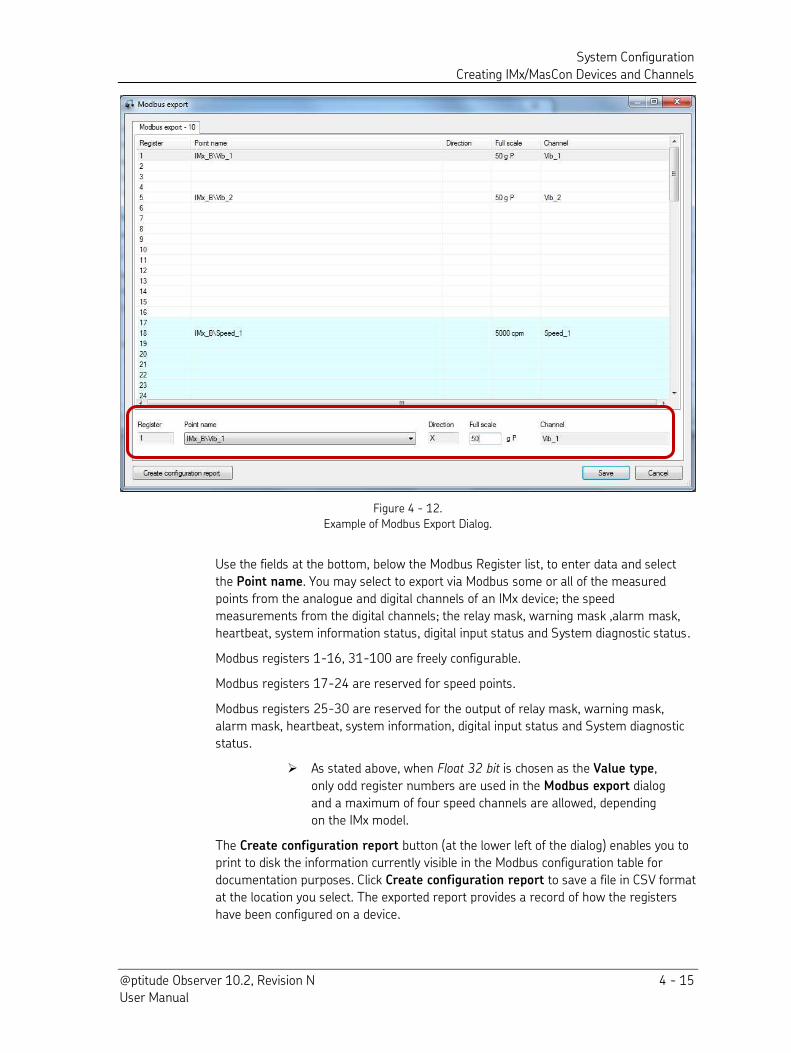
Figure 4 - 12.
Example of Modbus Export Dialog.
Use the fields at the bottom, below the Modbus Register list, to enter data and select
the Point name. You may select to export via Modbus some or all of the measured
points from the analogue and digital channels of an IMx device; the speed
measurements from the digital channels; the relay mask, warning mask ,alarm mask,
heartbeat, system information status, digital input status and System diagnostic status.
Modbus registers 1-16, 31-100 are freely configurable.
Modbus registers 17-24 are reserved for speed points.
Modbus registers 25-30 are reserved for the output of relay mask, warning mask,
alarm mask, heartbeat, system information, digital input status and System diagnostic
status.
As stated above, when Float 32 bit is chosen as the Value type,
only odd register numbers are used in the Modbus export dialog
and a maximum of four speed channels are allowed, depending
on the IMx model.
The Create configuration report button (at the lower left of the dialog) enables you to
print to disk the information currently visible in the Modbus configuration table for
documentation purposes. Click Create configuration report to save a file in CSV format
at the location you select. The exported report provides a record of how the registers
have been configured on a device.
System Configuration
Creating IMx/MasCon Devices and Channels
4 - 16 @ptitude Observer 10.2, Revision N User Manual
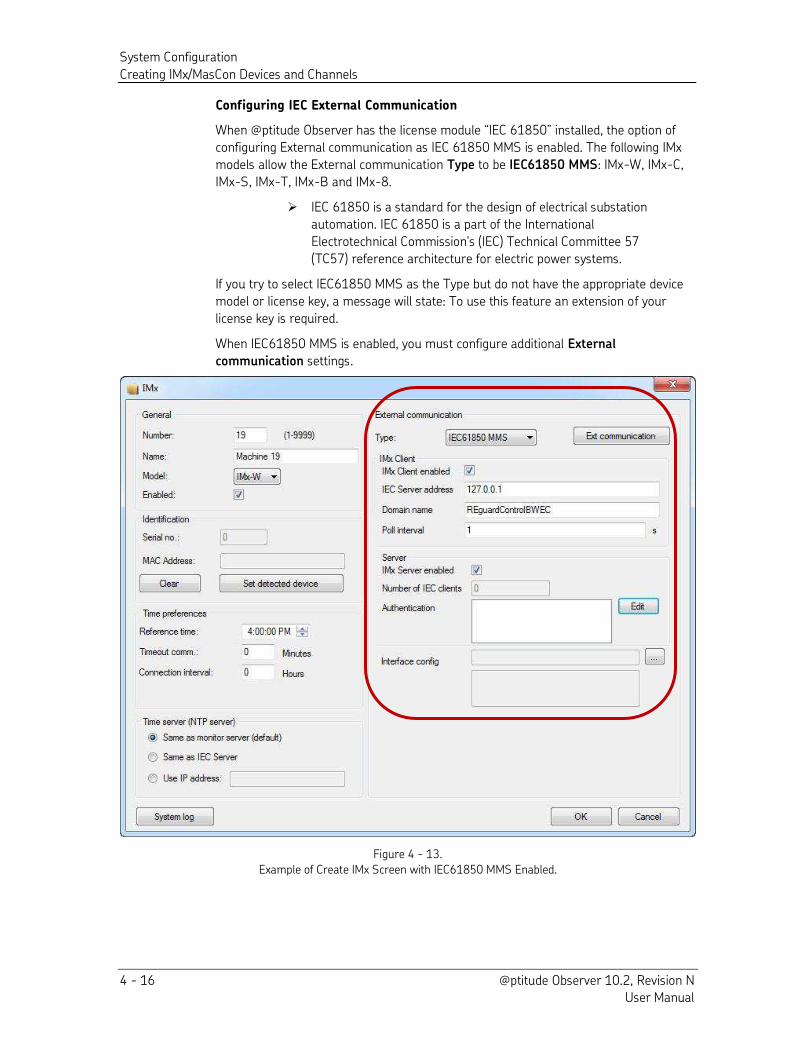
Configuring IEC External Communication
When @ptitude Observer has the license module “IEC 61850” installed, the option of configuring External communication as IEC 61850 MMS is enabled. The following IMx
models allow the External communication Type to be IEC61850 MMS: IMx-W, IMx-C,
IMx-S, IMx-T, IMx-B and IMx-8.
IEC 61850 is a standard for the design of electrical substation
automation. IEC 61850 is a part of the International
Electrotechnical Commission's (IEC) Technical Committee 57
(TC57) reference architecture for electric power systems.
If you try to select IEC61850 MMS as the Type but do not have the appropriate device
model or license key, a message will state: To use this feature an extension of your
license key is required.
When IEC61850 MMS is enabled, you must configure additional External
communication settings.
Figure 4 - 13.
Example of Create IMx Screen with IEC61850 MMS Enabled.
System Configuration
Creating IMx/MasCon Devices and Channels
@ptitude Observer 10.2, Revision N 4 - 17 User Manual
Set up the IMx to communicate as a Client, requesting data from the IEC controller
server:
– Select (check) the IMx Client enabled checkbox to enable the IMx to
communicate with the applicable IEC controller as a client.
– Enter the IEC controller IP address in the IEC Server address text box.
– Enter the IEC controller Domain name.
– Enter the frequency, in seconds, with which the IMx will ask for data from the
IEC controller in the Poll interval text box.
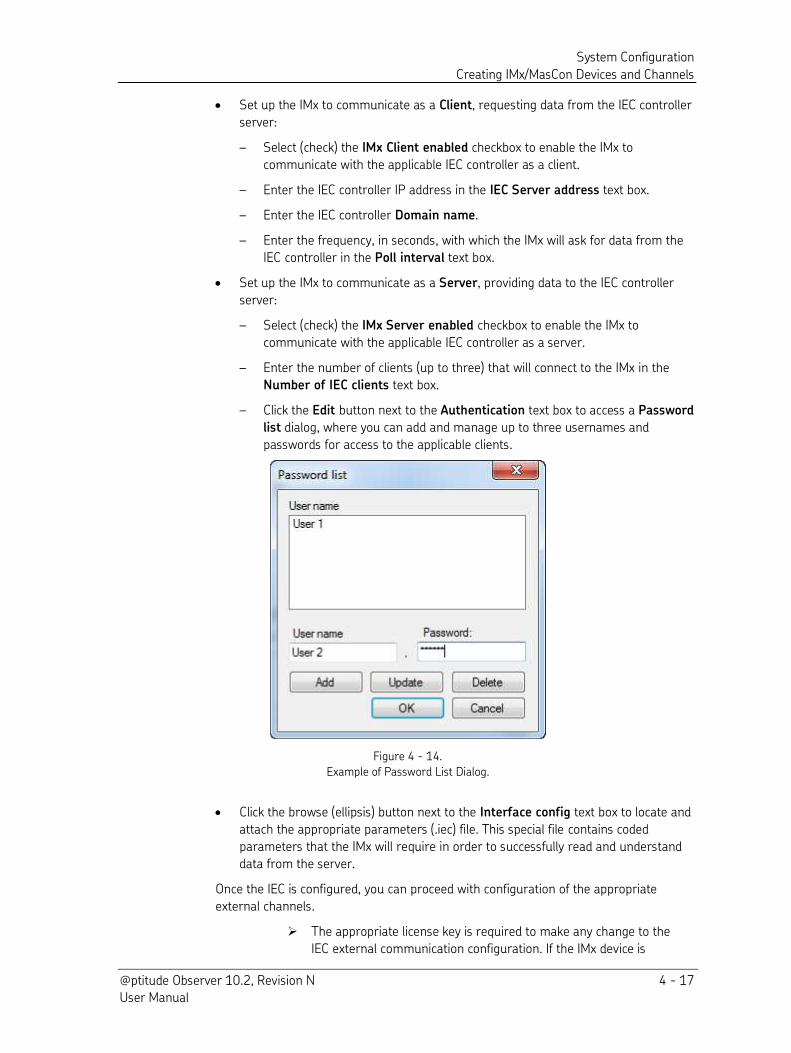
Set up the IMx to communicate as a Server, providing data to the IEC controller
server:
– Select (check) the IMx Server enabled checkbox to enable the IMx to
communicate with the applicable IEC controller as a server.
– Enter the number of clients (up to three) that will connect to the IMx in the
Number of IEC clients text box.
– Click the Edit button next to the Authentication text box to access a Password
list dialog, where you can add and manage up to three usernames and
passwords for access to the applicable clients.
Figure 4 - 14.
Example of Password List Dialog.
Click the browse (ellipsis) button next to the Interface config text box to locate and
attach the appropriate parameters (.iec) file. This special file contains coded
parameters that the IMx will require in order to successfully read and understand
data from the server.
Once the IEC is configured, you can proceed with configuration of the appropriate
external channels.
The appropriate license key is required to make any change to the
IEC external communication configuration. If the IMx device is
System Configuration
Creating IMx/MasCon Devices and Channels
4 - 18 @ptitude Observer 10.2, Revision N User Manual
already configured for IEC external communication but you do not
have the appropriate license key, the external communication
fields shown in the figure below will be read only.
Configuring External Channels
The external channel setup window is made for all types of IMx devices and all types of
external communication so the layout of setup differs depending on what DAD is used
and how external communication is configured.
Modbus - Supports 32 external channels. Makes no difference between
analogue/digital (do not use the same external channel in both types because
they cannot be configured differently).
IEC61850 - Supports 32 external analogue channels.
Protection - Supports both analogue and digital at the same time: 40 analog and
8 digital channels. All are created automatically.
IMx-R and RB06 TSI - Support both analogue and digital at the same time: 32
analog and 4 digital channels.
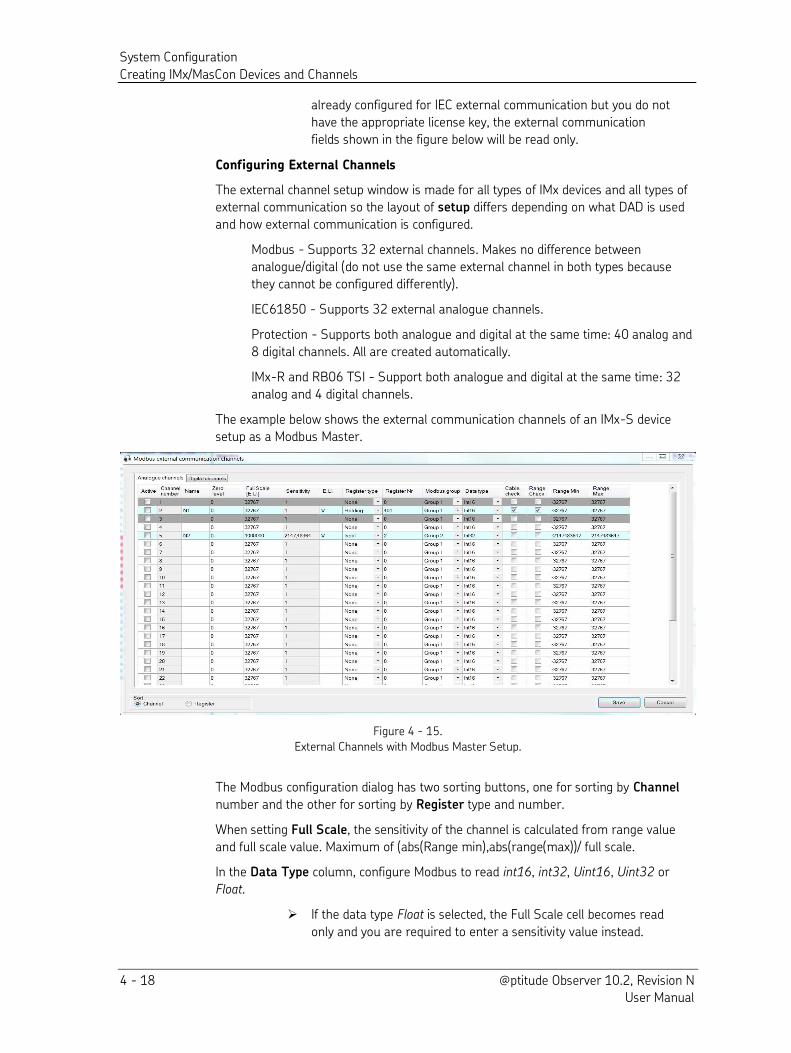
The example below shows the external communication channels of an IMx-S device
setup as a Modbus Master.
Figure 4 - 15.
External Channels with Modbus Master Setup.
The Modbus configuration dialog has two sorting buttons, one for sorting by Channel
number and the other for sorting by Register type and number.
When setting Full Scale, the sensitivity of the channel is calculated from range value
and full scale value. Maximum of (abs(Range min),abs(range(max))/ full scale.
In the Data Type column, configure Modbus to read int16, int32, Uint16, Uint32 or
Float.
If the data type Float is selected, the Full Scale cell becomes read
only and you are required to enter a sensitivity value instead.
System Configuration
Creating IMx/MasCon Devices and Channels
@ptitude Observer 10.2, Revision N 4 - 19 User Manual
When Cable check or Range check are not enabled with a checkmark, the Range Min
and Range Max are ignored.
Modbus Group can be applied to the Modbus registers. This grouping is used to
optimize the Modbus transfer and avoid unreadable registers.
IMx firmware can handle up to three Modbus groups, each one with a maximum size of
125 registers. Make sure to select a different Modbus group if the configured channels
exceed this number. For example:
Ch1 > Holding > Reg Nr. 101 => Group 1
Ch13 > Holding > Reg Nr. 201 => Group 1
Ch26 > Holding > Reg Nr. 409 => Group 2
Ch27 > Input > Reg Nr. 150 => Group 3
A group cannot contain both holding and input register types.
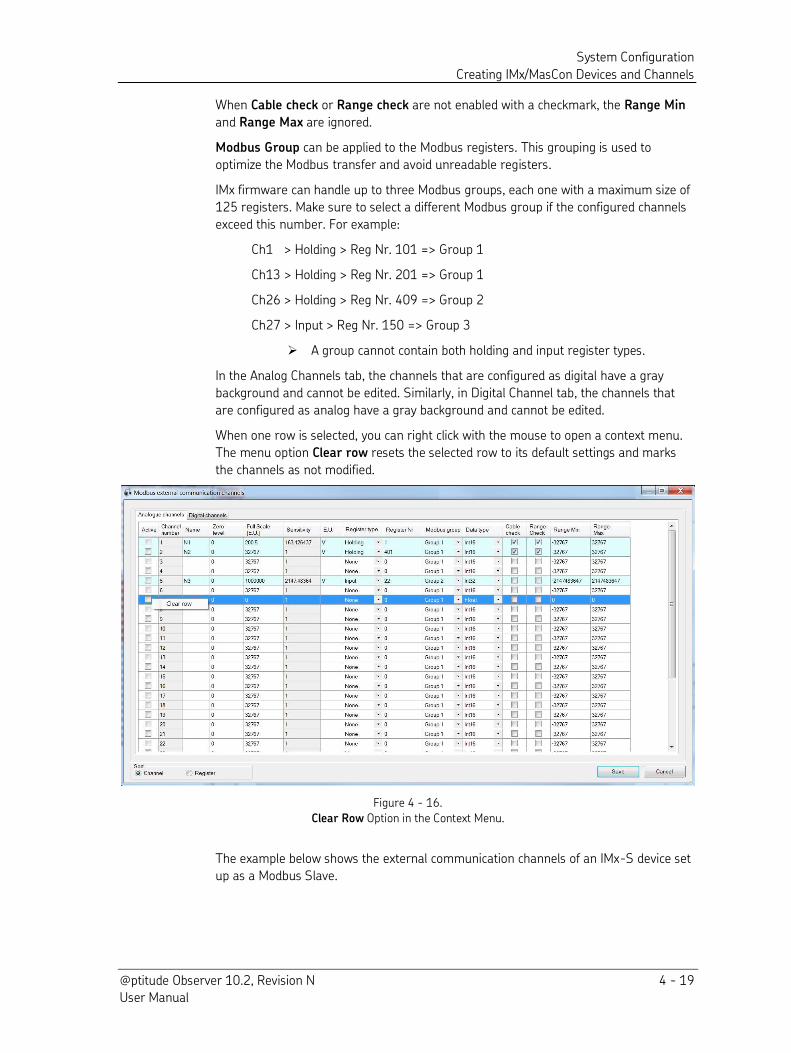
In the Analog Channels tab, the channels that are configured as digital have a gray
background and cannot be edited. Similarly, in Digital Channel tab, the channels that
are configured as analog have a gray background and cannot be edited.
When one row is selected, you can right click with the mouse to open a context menu.
The menu option Clear row resets the selected row to its default settings and marks
the channels as not modified.
Figure 4 - 16.
Clear Row Option in the Context Menu.
The example below shows the external communication channels of an IMx-S device set
up as a Modbus Slave.
System Configuration
Creating IMx/MasCon Devices and Channels
4 - 20 @ptitude Observer 10.2, Revision N User Manual
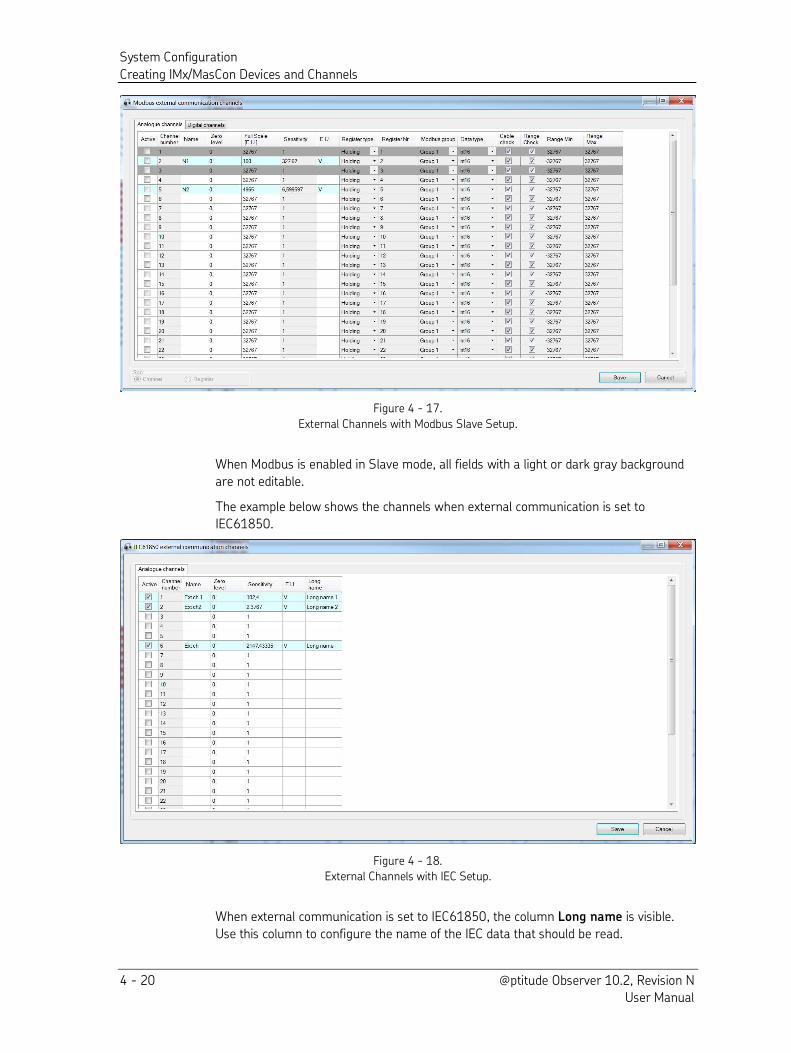
Figure 4 - 17.
External Channels with Modbus Slave Setup.
When Modbus is enabled in Slave mode, all fields with a light or dark gray background
are not editable.
The example below shows the channels when external communication is set to
IEC61850.
Figure 4 - 18.
External Channels with IEC Setup.
When external communication is set to IEC61850, the column Long name is visible.
Use this column to configure the name of the IEC data that should be read.
System Configuration
Creating IMx/MasCon Devices and Channels
@ptitude Observer 10.2, Revision N 4 - 21 User Manual
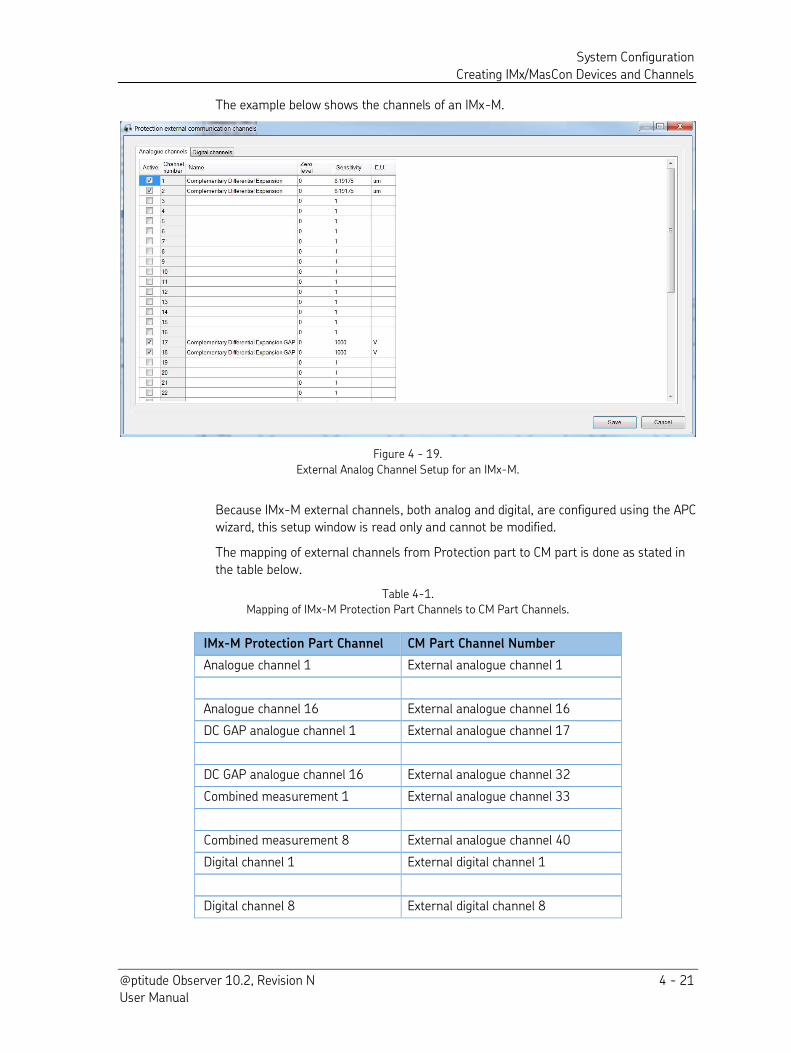
The example below shows the channels of an IMx-M.
Figure 4 - 19.
External Analog Channel Setup for an IMx-M.
Because IMx-M external channels, both analog and digital, are configured using the APC
wizard, this setup window is read only and cannot be modified.
The mapping of external channels from Protection part to CM part is done as stated in
the table below.
Table 4-1.
Mapping of IMx-M Protection Part Channels to CM Part Channels.
IMx-M Protection Part Channel CM Part Channel Number
Analogue channel 1 External analogue channel 1
Analogue channel 16 External analogue channel 16
DC GAP analogue channel 1 External analogue channel 17
DC GAP analogue channel 16 External analogue channel 32
Combined measurement 1 External analogue channel 33
Combined measurement 8 External analogue channel 40
Digital channel 1 External digital channel 1
Digital channel 8 External digital channel 8
System Configuration
Creating IMx/MasCon Devices and Channels
4 - 22 @ptitude Observer 10.2, Revision N User Manual
Edit
Edit function allows you to change settings of an existing device of the selected
database. The definitions of attributes are the same as in Create Device. You may edit
any settings except Number field.
The following attribute is available only for Edit function:
Convert to IMx converts an existing MaxCon16 to an IMx device.
Note that after the conversion, the device type cannot be
reversed.
Delete
Delete function allows you to delete an existing device of the selected database.
However, before a device can be deleted, all the attached measurement points and
channels to the device must be deleted first.
Copy
Copy function enables you to copy all the settings of an existing device to a new device.
However, you must select a unique device number for the new device from the list of
system generated numbers.
Synchronize
Synchronize function enables you to synchronize the IMx/MasCon device of the selected
database by sending a newly generated, complete setup file from the local database
where setup changes are stored to a remote device such as a remote controlled
IMx/MasCon16 device. The transmission is done by the @ptitude Observer Monitor
service. If this fails because of an error or a lack of time, then the IMx/MasCon device
will be indicated as not synchronized. Not synchronized means that the system is yet to
download the newer setup to the device.
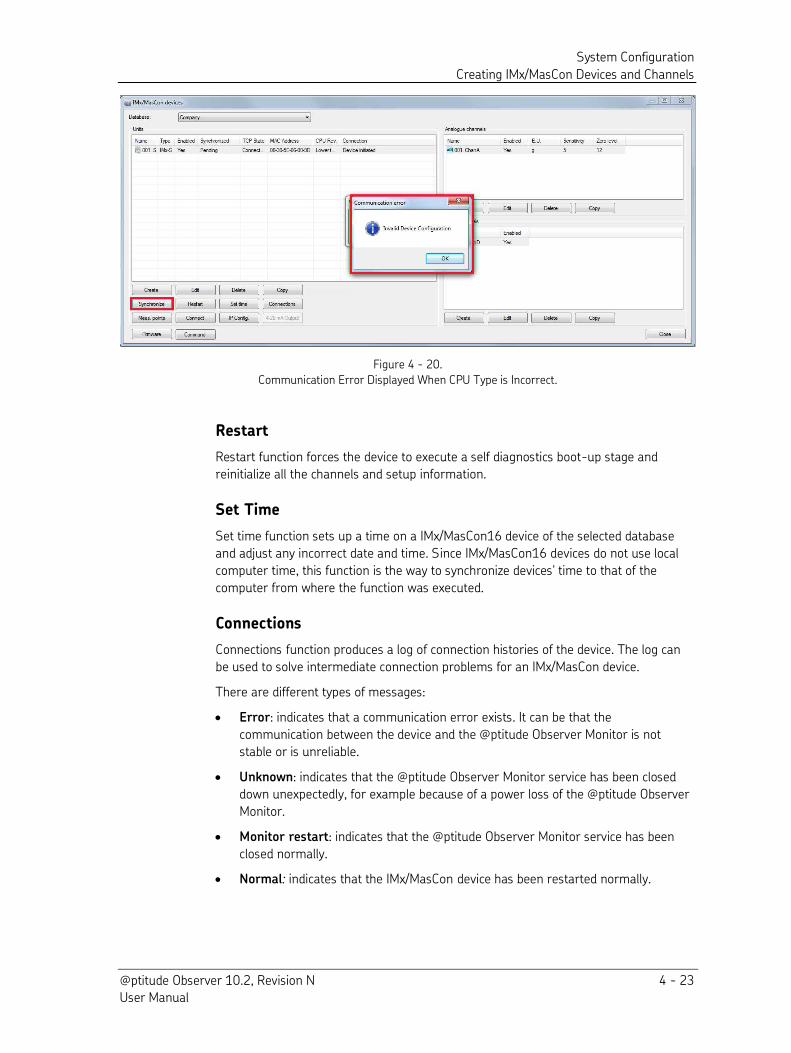
When you click Synchronize, Monitor generates a configuration and it checks whether
the configuration needs the newer CPU type. If so; a system alarm is sent to Observer
and Observer then displays a communication error stating “Invalid Device Configuration”.
System Configuration
Creating IMx/MasCon Devices and Channels
@ptitude Observer 10.2, Revision N 4 - 23 User Manual
Figure 4 - 20.
Communication Error Displayed When CPU Type is Incorrect.
Restart
Restart function forces the device to execute a self diagnostics boot-up stage and
reinitialize all the channels and setup information.
Set Time
Set time function sets up a time on a IMx/MasCon16 device of the selected database
and adjust any incorrect date and time. Since IMx/MasCon16 devices do not use local
computer time, this function is the way to synchronize devices' time to that of the
computer from where the function was executed.
Connections
Connections function produces a log of connection histories of the device. The log can
be used to solve intermediate connection problems for an IMx/MasCon device.
There are different types of messages:
Error: indicates that a communication error exists. It can be that the
communication between the device and the @ptitude Observer Monitor is not
stable or is unreliable.
Unknown: indicates that the @ptitude Observer Monitor service has been closed
down unexpectedly, for example because of a power loss of the @ptitude Observer
Monitor.
Monitor restart: indicates that the @ptitude Observer Monitor service has been
closed normally.
Normal: indicates that the IMx/MasCon device has been restarted normally.
System Configuration
Creating IMx/MasCon Devices and Channels
4 - 24 @ptitude Observer 10.2, Revision N User Manual
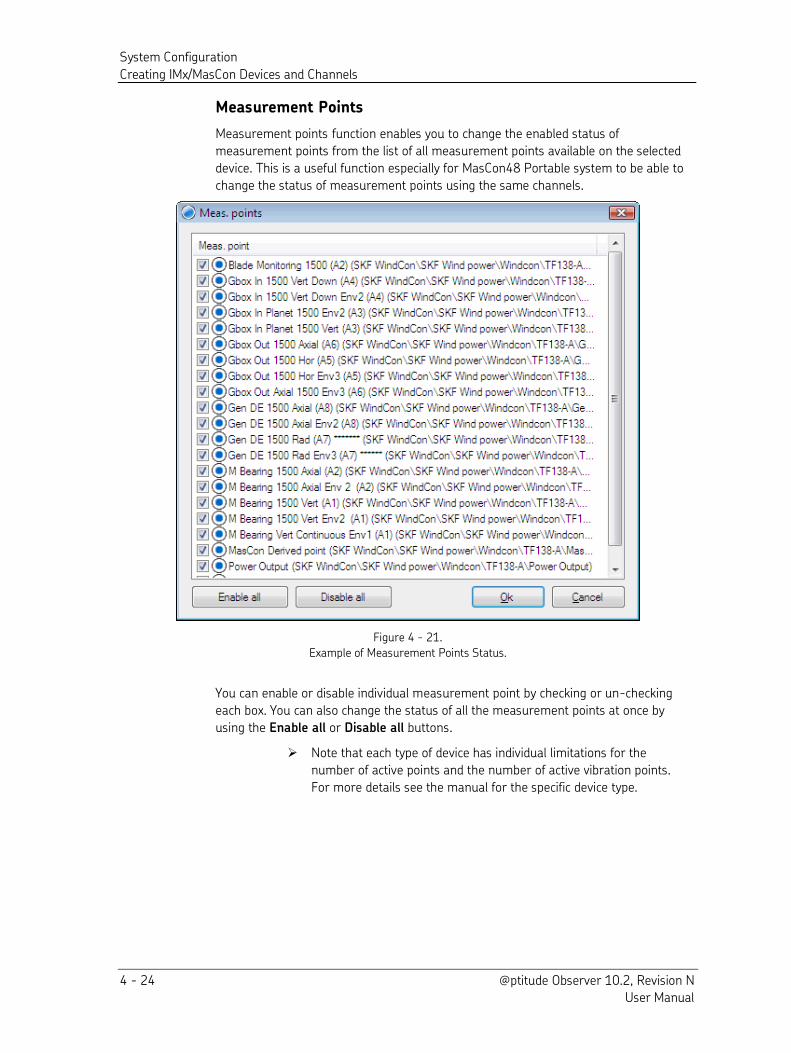
Measurement Points
Measurement points function enables you to change the enabled status of
measurement points from the list of all measurement points available on the selected
device. This is a useful function especially for MasCon48 Portable system to be able to
change the status of measurement points using the same channels.
Figure 4 - 21.
Example of Measurement Points Status.
You can enable or disable individual measurement point by checking or un-checking
each box. You can also change the status of all the measurement points at once by
using the Enable all or Disable all buttons.
Note that each type of device has individual limitations for the
number of active points and the number of active vibration points.
For more details see the manual for the specific device type.
System Configuration
Creating IMx/MasCon Devices and Channels
@ptitude Observer 10.2, Revision N 4 - 25 User Manual
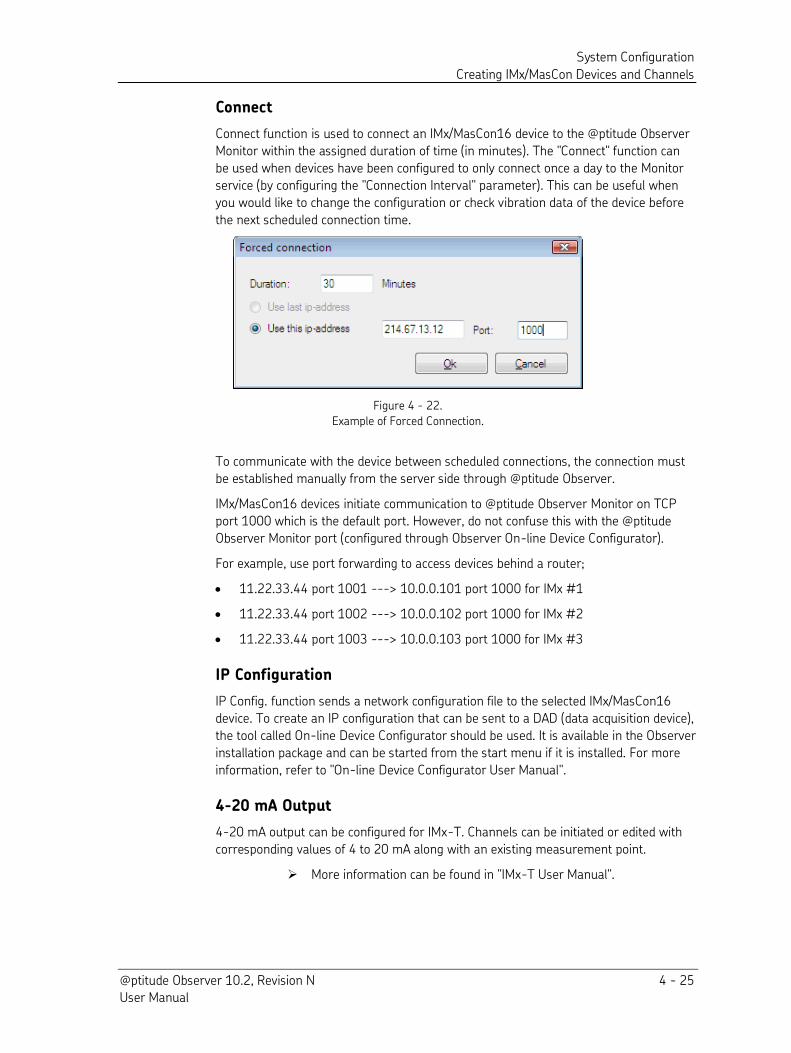
Connect
Connect function is used to connect an IMx/MasCon16 device to the @ptitude Observer
Monitor within the assigned duration of time (in minutes). The "Connect" function can
be used when devices have been configured to only connect once a day to the Monitor
service (by configuring the "Connection Interval" parameter). This can be useful when
you would like to change the configuration or check vibration data of the device before
the next scheduled connection time.
Figure 4 - 22.
Example of Forced Connection.
To communicate with the device between scheduled connections, the connection must
be established manually from the server side through @ptitude Observer.
IMx/MasCon16 devices initiate communication to @ptitude Observer Monitor on TCP
port 1000 which is the default port. However, do not confuse this with the @ptitude
Observer Monitor port (configured through Observer On-line Device Configurator).
For example, use port forwarding to access devices behind a router;
11.22.33.44 port 1001 ---> 10.0.0.101 port 1000 for IMx #1
11.22.33.44 port 1002 ---> 10.0.0.102 port 1000 for IMx #2
11.22.33.44 port 1003 ---> 10.0.0.103 port 1000 for IMx #3
IP Configuration
IP Config. function sends a network configuration file to the selected IMx/MasCon16
device. To create an IP configuration that can be sent to a DAD (data acquisition device),
the tool called On-line Device Configurator should be used. It is available in the Observer
installation package and can be started from the start menu if it is installed. For more
information, refer to "On-line Device Configurator User Manual".
4-20 mA Output
4-20 mA output can be configured for IMx-T. Channels can be initiated or edited with
corresponding values of 4 to 20 mA along with an existing measurement point.
More information can be found in "IMx-T User Manual".
System Configuration
Creating IMx/MasCon Devices and Channels
4 - 26 @ptitude Observer 10.2, Revision N User Manual
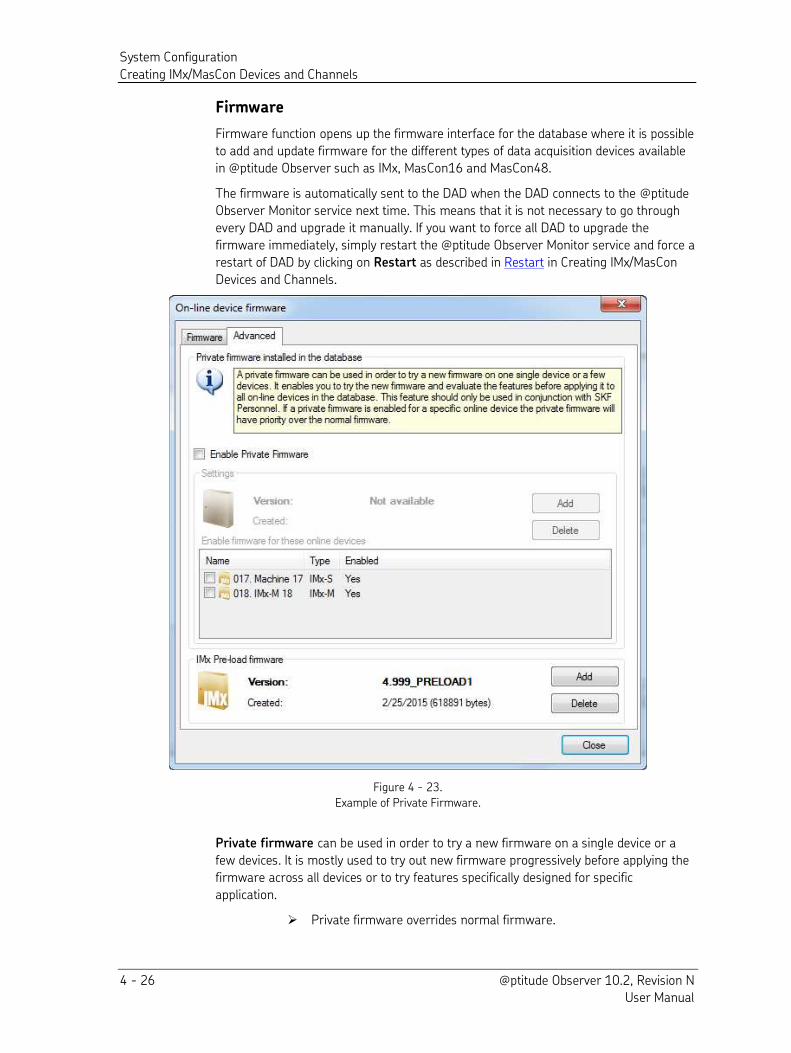
Firmware
Firmware function opens up the firmware interface for the database where it is possible
to add and update firmware for the different types of data acquisition devices available
in @ptitude Observer such as IMx, MasCon16 and MasCon48.
The firmware is automatically sent to the DAD when the DAD connects to the @ptitude
Observer Monitor service next time. This means that it is not necessary to go through
every DAD and upgrade it manually. If you want to force all DAD to upgrade the
firmware immediately, simply restart the @ptitude Observer Monitor service and force a
restart of DAD by clicking on Restart as described in Restart in Creating IMx/MasCon
Devices and Channels.
Figure 4 - 23.
Example of Private Firmware.
Private firmware can be used in order to try a new firmware on a single device or a
few devices. It is mostly used to try out new firmware progressively before applying the
firmware across all devices or to try features specifically designed for specific
application.
Private firmware overrides normal firmware.
System Configuration
Creating IMx/MasCon Devices and Channels
@ptitude Observer 10.2, Revision N 4 - 27 User Manual
In order to utilize this interface, Enable Private Firmware box has to be checked. Once
the box is checked, private firmware settings can be added or deleted for the selected
online devices.
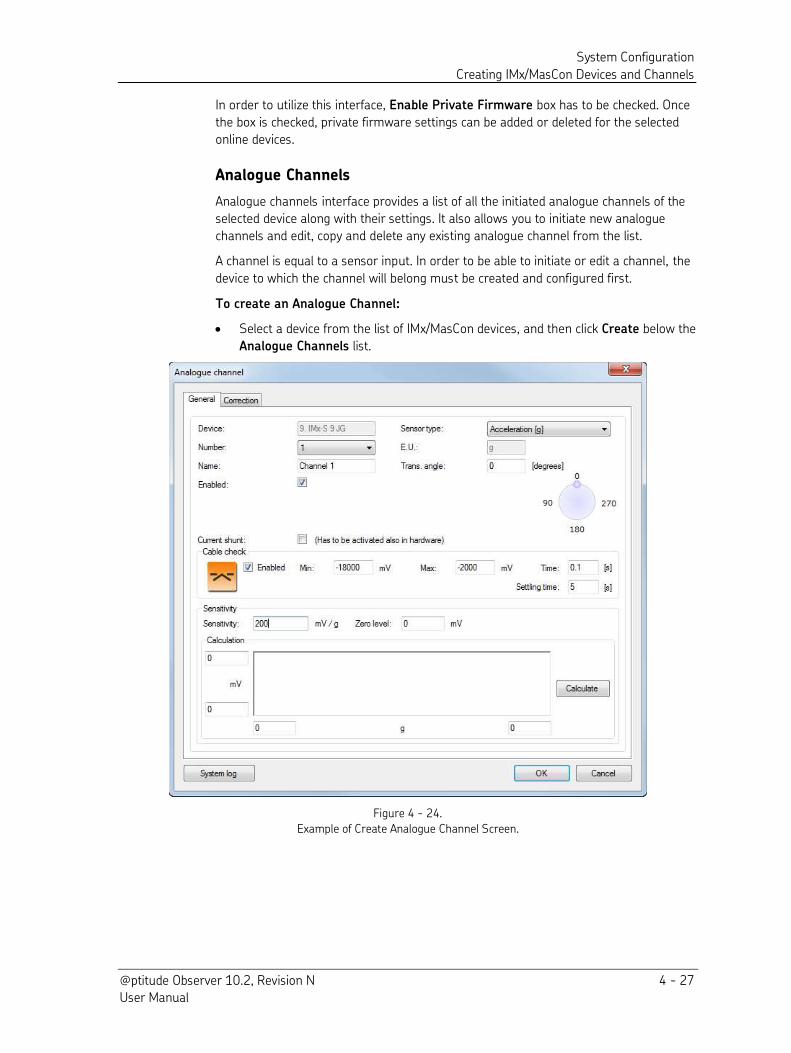
Analogue Channels
Analogue channels interface provides a list of all the initiated analogue channels of the
selected device along with their settings. It also allows you to initiate new analogue
channels and edit, copy and delete any existing analogue channel from the list.
A channel is equal to a sensor input. In order to be able to initiate or edit a channel, the
device to which the channel will belong must be created and configured first.
To create an Analogue Channel:
Select a device from the list of IMx/MasCon devices, and then click Create below the
Analogue Channels list.
Figure 4 - 24.
Example of Create Analogue Channel Screen.
System Configuration
Creating IMx/MasCon Devices and Channels
4 - 28 @ptitude Observer 10.2, Revision N User Manual
General Tab
Device is the name of the selected device (not editable).
Number is a unique number for the physical input channel on the device you would
like to configure.
Name of the channel can be used as a reference by the software.
Enabled indicates the status of the channel whether it is enabled or disabled.
IEC Long Name is where you enter the channel’s data source reference excluding domain name for IEC-enabled devices.
Isolated is used for external signals such as measuring process parameters for
MasCon16 device's channels 15 and 16.
ICP Current feed indicates whether you would like the IMx-W / IMx-T device to
drive the probe or not (normally on accelerometers only). For MasCon48 devices,
this is done by dip switches on each channel on the vibration/analogue card.
Sensor type is a sensor signal type which can be selected from the drop-down list.
E.U. (Engineering Unit) is a measurement unit which can be set only if sensor signal is set to Other, for example, a pressure sensor.
Trans. angle is the angle of the sensor mounted on a device, relative to twelve
o'clock.
Current shunt is available for IMx-W device's channel 15 and 16, IMx-T, IMx-S,
and IMx-M. If a resistor of 220 ohm is added to a channel input, check this field in
order to display the correct input device of a particular channel.
Cable check will raise a system alarm from a cable fault if the signal goes outside
of the range.
Enabled: Check the box to allow the system to perform a cable check on the
channel before a measurement is taken.
Min: The minimum output range of the sensor.
Max: The maximum output range of the sensor.
Time: The duration of the cable check measurement.
Settling time: Upon detecting a sensor bias output voltage (BOV) out of range
and entering a cable fault alarm status, the duration for which the IMx will
remain in this status once sensor power is restored. A configured Settling time
can prevent false alarms in case the sensor's actual settling time extends
beyond the measurement time and alarm hysteresis. The Settling time feature
also helps IMx ignore drifting signals from broken sensors that may
erroneously enter the proper BOV range.
The Settling time value must be between “0” and “60” seconds.
The default is 1 second.
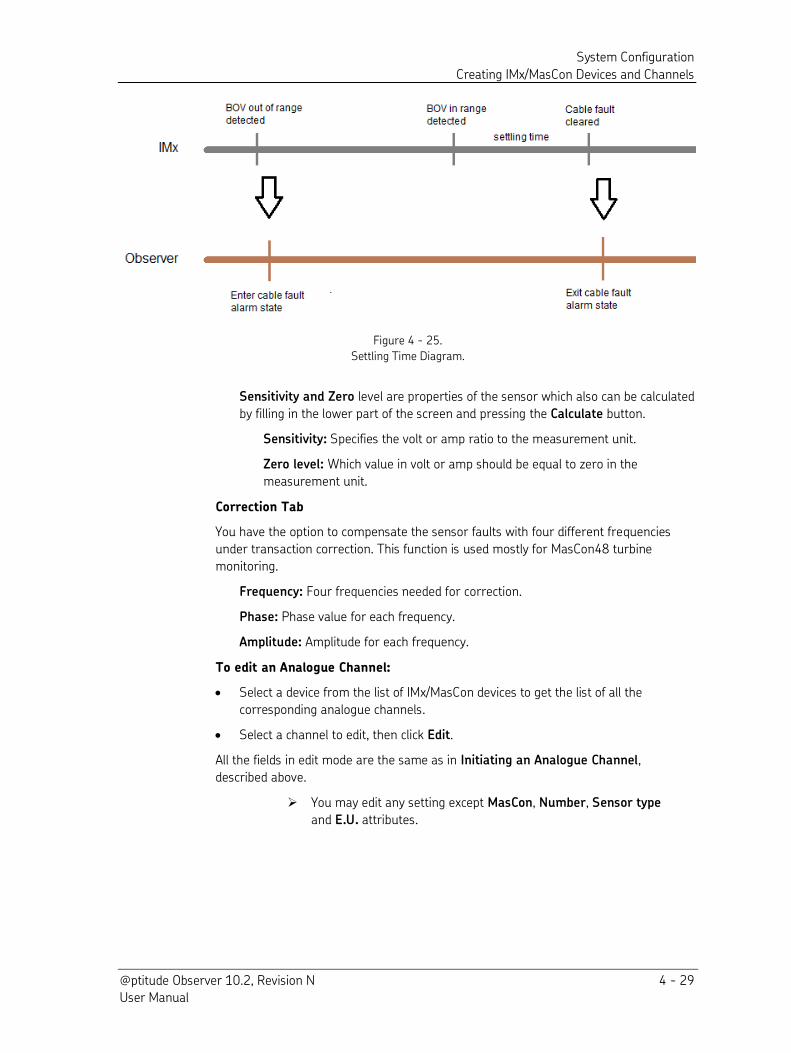
System Configuration
Creating IMx/MasCon Devices and Channels
@ptitude Observer 10.2, Revision N 4 - 29 User Manual
Figure 4 - 25.
Settling Time Diagram.
Sensitivity and Zero level are properties of the sensor which also can be calculated
by filling in the lower part of the screen and pressing the Calculate button.
Sensitivity: Specifies the volt or amp ratio to the measurement unit.
Zero level: Which value in volt or amp should be equal to zero in the
measurement unit.
Correction Tab
You have the option to compensate the sensor faults with four different frequencies
under transaction correction. This function is used mostly for MasCon48 turbine
monitoring.
Frequency: Four frequencies needed for correction.
Phase: Phase value for each frequency.
Amplitude: Amplitude for each frequency.
To edit an Analogue Channel:
Select a device from the list of IMx/MasCon devices to get the list of all the
corresponding analogue channels.
Select a channel to edit, then click Edit.
All the fields in edit mode are the same as in Initiating an Analogue Channel,
described above.
You may edit any setting except MasCon, Number, Sensor type
and E.U. attributes.
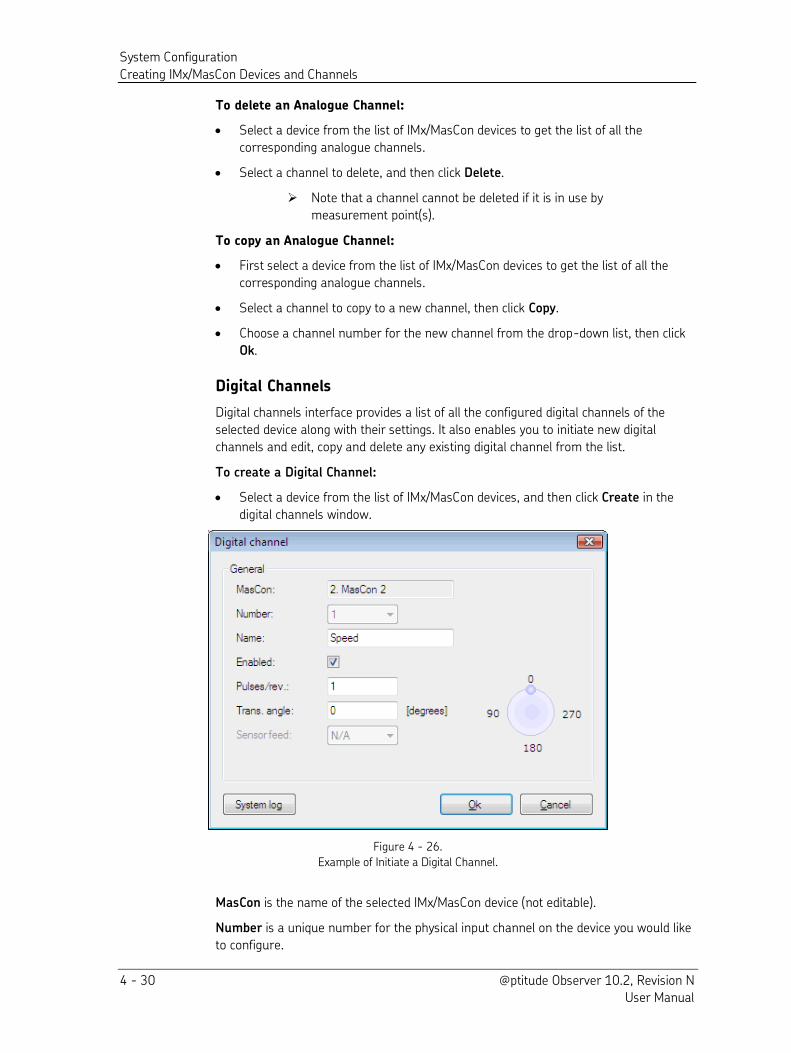
System Configuration
Creating IMx/MasCon Devices and Channels
4 - 30 @ptitude Observer 10.2, Revision N User Manual
To delete an Analogue Channel:
Select a device from the list of IMx/MasCon devices to get the list of all the
corresponding analogue channels.
Select a channel to delete, and then click Delete.
Note that a channel cannot be deleted if it is in use by
measurement point(s).
To copy an Analogue Channel:
First select a device from the list of IMx/MasCon devices to get the list of all the
corresponding analogue channels.
Select a channel to copy to a new channel, then click Copy.
Choose a channel number for the new channel from the drop-down list, then click
Ok.
Digital Channels
Digital channels interface provides a list of all the configured digital channels of the
selected device along with their settings. It also enables you to initiate new digital
channels and edit, copy and delete any existing digital channel from the list.
To create a Digital Channel:
Select a device from the list of IMx/MasCon devices, and then click Create in the
digital channels window.
Figure 4 - 26.
Example of Initiate a Digital Channel.
MasCon is the name of the selected IMx/MasCon device (not editable).
Number is a unique number for the physical input channel on the device you would like
to configure.
System Configuration
Creating IMx/MasCon Devices and Channels
@ptitude Observer 10.2, Revision N 4 - 31 User Manual
Name is the name of the channel which the software can use as a reference.
Enabled indicates the status of the channel whether it is enabled or disabled. Enabled
status activates the channel for measurement points.
Pulses/rev. is the number of pulses this sensor receives per shaft revolution.
Trans. angle is the angle of the sensor mounted, relative to twelve o'clock.
Sensor feed indicates whether to do a sensor feed or not.
To edit a Digital Channel:
First select a device from the list of IMx/MasCon devices to get the list of all the
corresponding digital channels.
Select a channel to edit, and then click Edit.
All the fields in edit mode are the same as in Initiating a Digital Channel, described
above.
You may edit any setting except MasCon and Number attributes.
To delete a Digital Channel:
First select a device from the list of IMx/MasCon devices to get the list of all the
corresponding digital channels.
Select a channel to delete, then click Delete.
Note that a channel cannot be deleted if it is in use by
measurement point(s).
To copy a Digital Channel:
Select a device from the list of IMx/MasCon devices to get the list of all the
corresponding digital channels.
Select an existing channel to copy to a new channel, then click Copy.
Choose a channel number for the new channel from the drop-down list, then click
Ok.
Machine Properties
Setting up machine data can be done at the machine properties screen. This
information is only text based and is not used by analysis tools in @ptitude Observer.
However, this information can be included in reports and other printouts.
To get to machine properties screen, perform one of the following options:
Create a machine from scratch. Refer to Machine under Building a Hierarchy View
in System Configuration.
Click the right mouse button on a machine in the hierarchy view, then select
Properties.
Select a machine in the hierarchy view first, click Edit on the toolbar, then select
Properties.
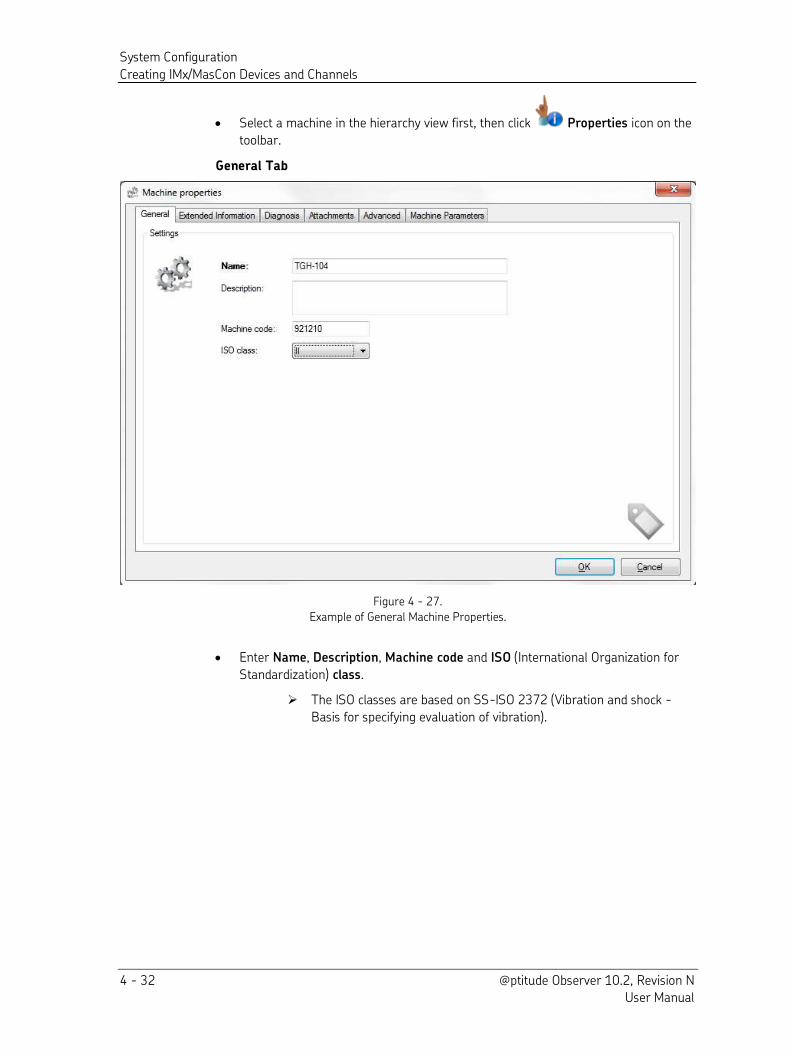
System Configuration
Creating IMx/MasCon Devices and Channels
4 - 32 @ptitude Observer 10.2, Revision N User Manual
Select a machine in the hierarchy view first, then click Properties icon on the
toolbar.
General Tab
Figure 4 - 27.
Example of General Machine Properties.
Enter Name, Description, Machine code and ISO (International Organization for
Standardization) class.
The ISO classes are based on SS-ISO 2372 (Vibration and shock -
Basis for specifying evaluation of vibration).
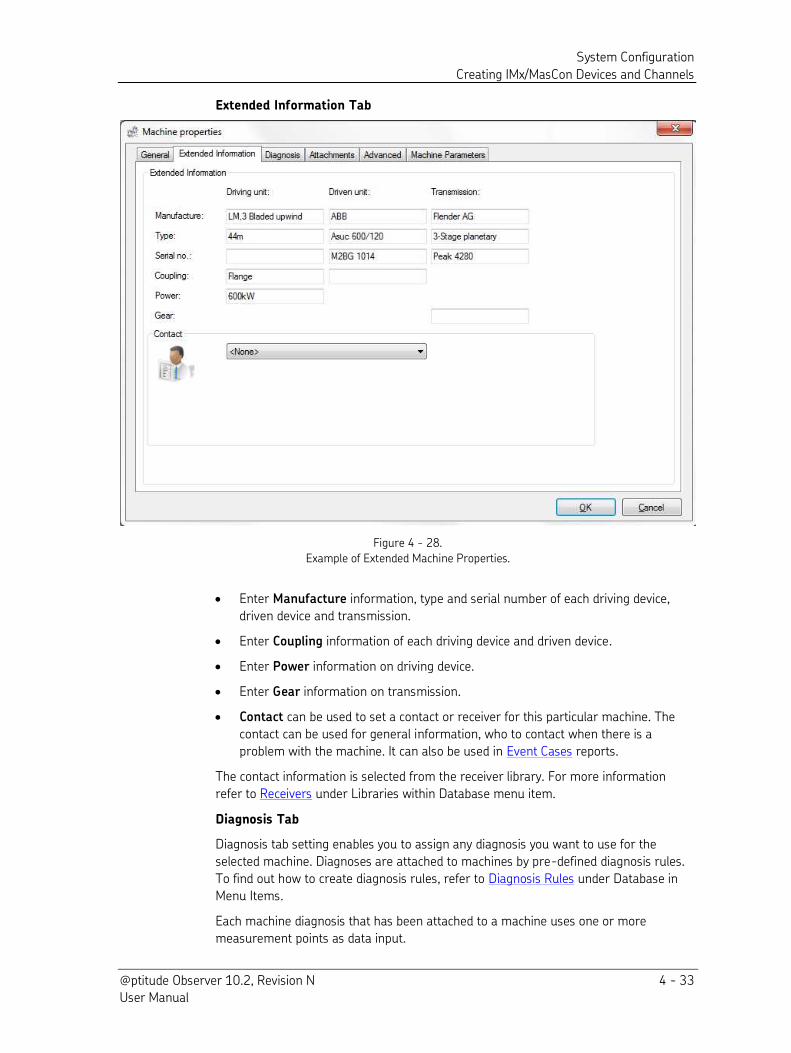
System Configuration
Creating IMx/MasCon Devices and Channels
@ptitude Observer 10.2, Revision N 4 - 33 User Manual
Extended Information Tab
Figure 4 - 28.
Example of Extended Machine Properties.
Enter Manufacture information, type and serial number of each driving device,
driven device and transmission.
Enter Coupling information of each driving device and driven device.
Enter Power information on driving device.
Enter Gear information on transmission.
Contact can be used to set a contact or receiver for this particular machine. The
contact can be used for general information, who to contact when there is a
problem with the machine. It can also be used in Event Cases reports.
The contact information is selected from the receiver library. For more information
refer to Receivers under Libraries within Database menu item.
Diagnosis Tab
Diagnosis tab setting enables you to assign any diagnosis you want to use for the
selected machine. Diagnoses are attached to machines by pre-defined diagnosis rules.
To find out how to create diagnosis rules, refer to Diagnosis Rules under Database in
Menu Items.
Each machine diagnosis that has been attached to a machine uses one or more
measurement points as data input.
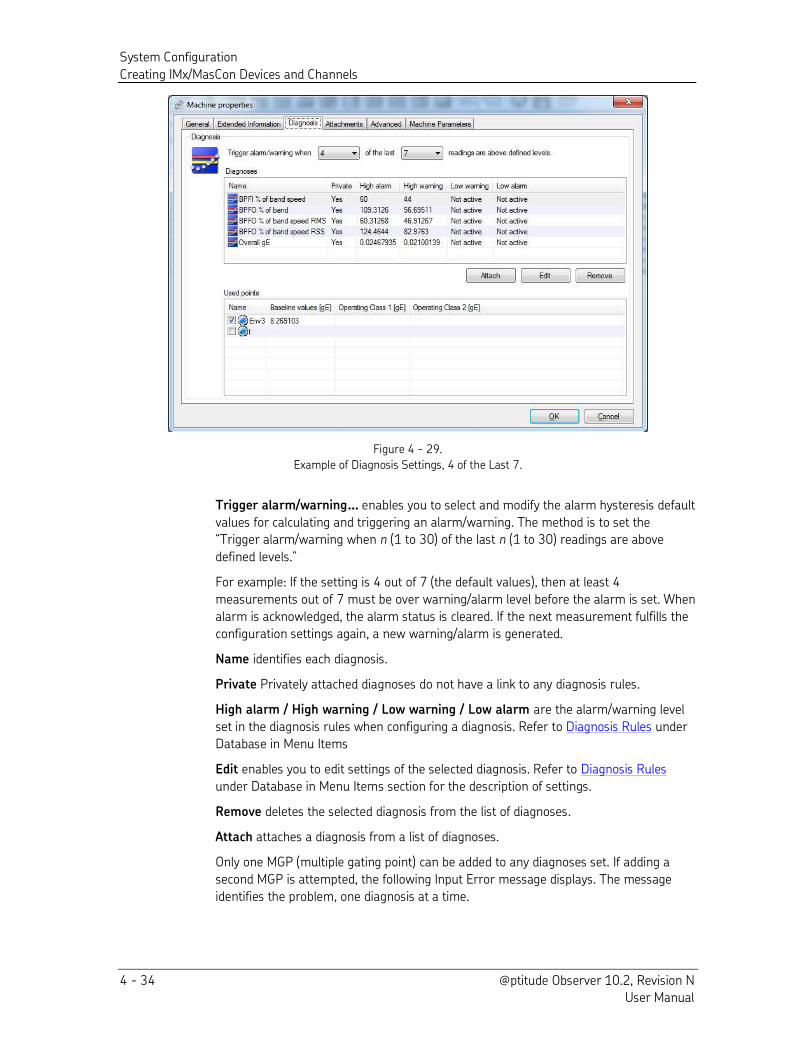
System Configuration
Creating IMx/MasCon Devices and Channels
4 - 34 @ptitude Observer 10.2, Revision N User Manual
Figure 4 - 29.
Example of Diagnosis Settings, 4 of the Last 7.
Trigger alarm/warning… enables you to select and modify the alarm hysteresis default
values for calculating and triggering an alarm/warning. The method is to set the “Trigger alarm/warning when n (1 to 30) of the last n (1 to 30) readings are above
defined levels.” For example: If the setting is 4 out of 7 (the default values), then at least 4
measurements out of 7 must be over warning/alarm level before the alarm is set. When
alarm is acknowledged, the alarm status is cleared. If the next measurement fulfills the
configuration settings again, a new warning/alarm is generated.
Name identifies each diagnosis.
Private Privately attached diagnoses do not have a link to any diagnosis rules.
High alarm / High warning / Low warning / Low alarm are the alarm/warning level
set in the diagnosis rules when configuring a diagnosis. Refer to Diagnosis Rules under
Database in Menu Items
Edit enables you to edit settings of the selected diagnosis. Refer to Diagnosis Rules
under Database in Menu Items section for the description of settings.
Remove deletes the selected diagnosis from the list of diagnoses.
Attach attaches a diagnosis from a list of diagnoses.
Only one MGP (multiple gating point) can be added to any diagnoses set. If adding a
second MGP is attempted, the following Input Error message displays. The message
identifies the problem, one diagnosis at a time.
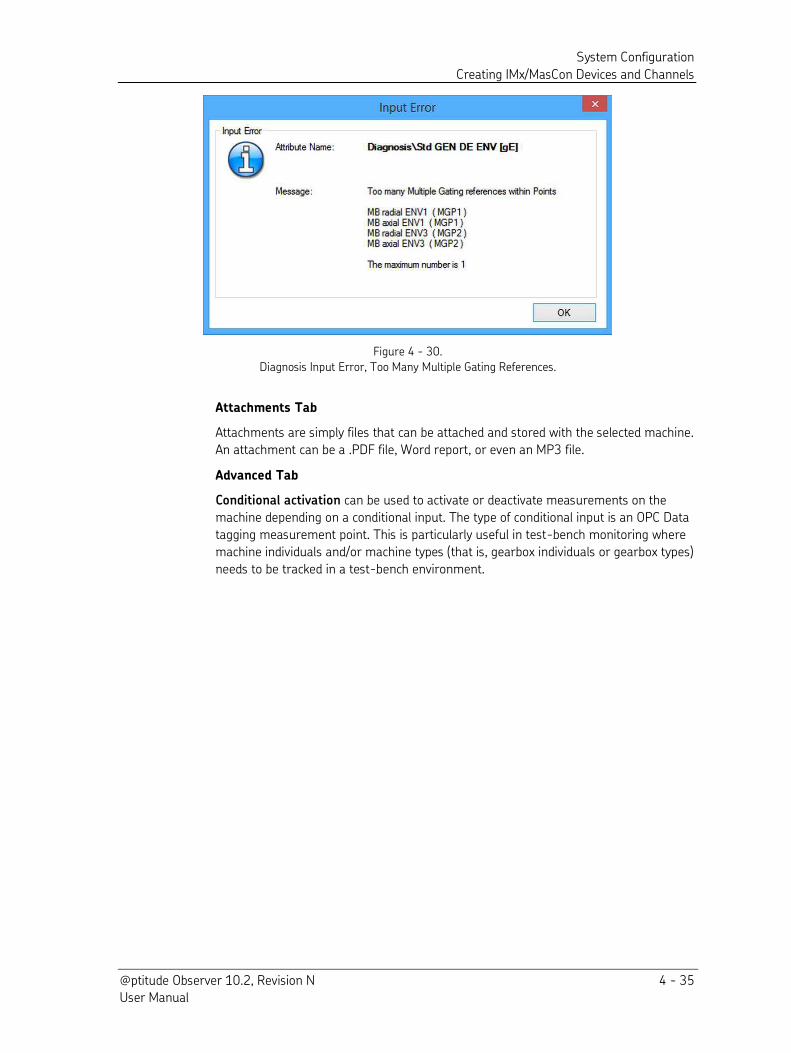
System Configuration
Creating IMx/MasCon Devices and Channels
@ptitude Observer 10.2, Revision N 4 - 35 User Manual
Figure 4 - 30.
Diagnosis Input Error, Too Many Multiple Gating References.
Attachments Tab
Attachments are simply files that can be attached and stored with the selected machine.
An attachment can be a .PDF file, Word report, or even an MP3 file.
Advanced Tab
Conditional activation can be used to activate or deactivate measurements on the
machine depending on a conditional input. The type of conditional input is an OPC Data
tagging measurement point. This is particularly useful in test-bench monitoring where
machine individuals and/or machine types (that is, gearbox individuals or gearbox types)
needs to be tracked in a test-bench environment.
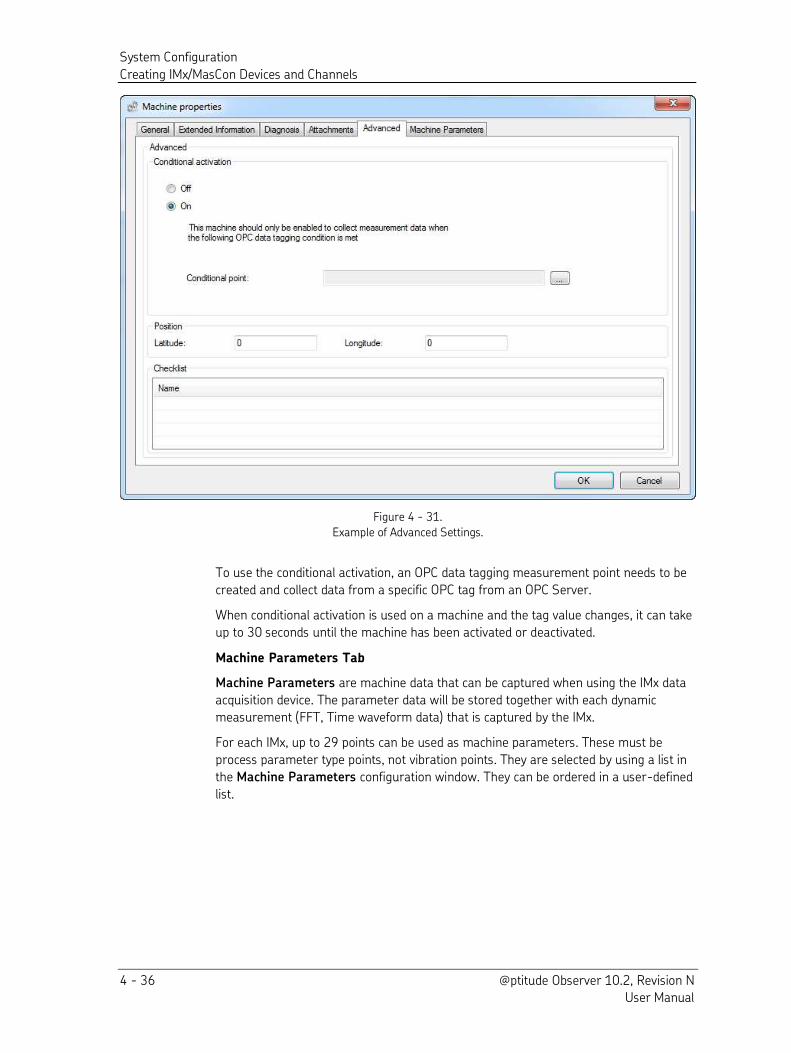
System Configuration
Creating IMx/MasCon Devices and Channels
4 - 36 @ptitude Observer 10.2, Revision N User Manual
Figure 4 - 31.
Example of Advanced Settings.
To use the conditional activation, an OPC data tagging measurement point needs to be
created and collect data from a specific OPC tag from an OPC Server.
When conditional activation is used on a machine and the tag value changes, it can take
up to 30 seconds until the machine has been activated or deactivated.
Machine Parameters Tab
Machine Parameters are machine data that can be captured when using the IMx data
acquisition device. The parameter data will be stored together with each dynamic
measurement (FFT, Time waveform data) that is captured by the IMx.
For each IMx, up to 29 points can be used as machine parameters. These must be
process parameter type points, not vibration points. They are selected by using a list in
the Machine Parameters configuration window. They can be ordered in a user-defined
list.
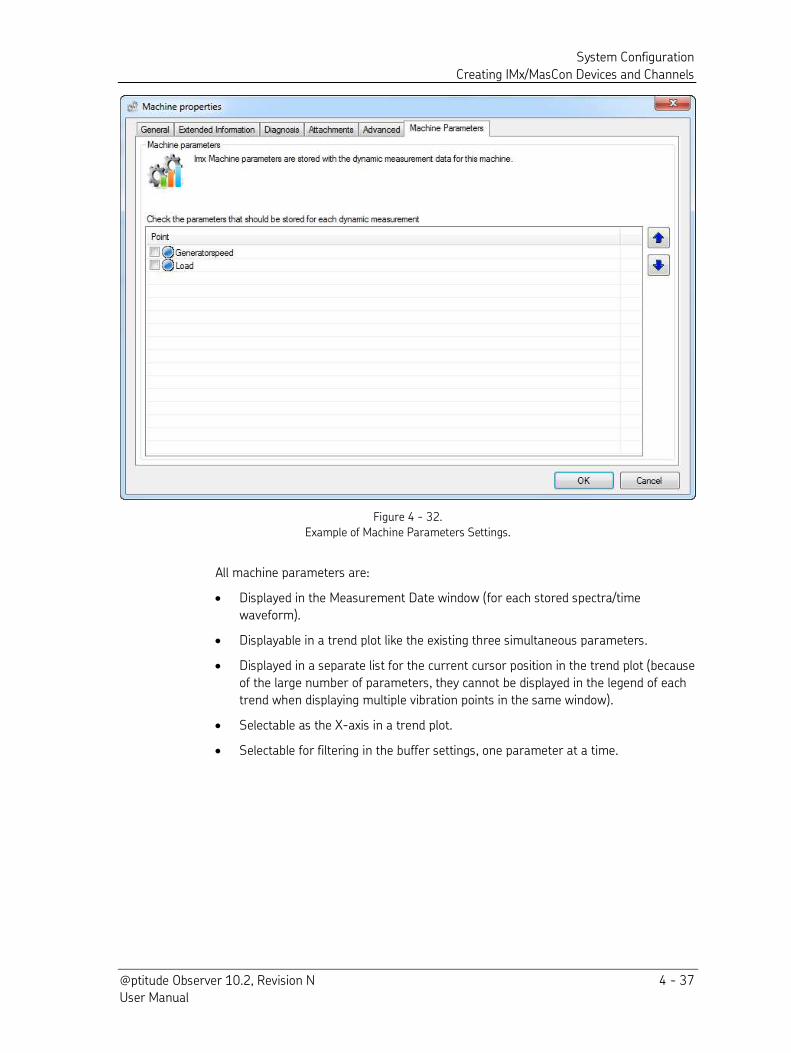
System Configuration
Creating IMx/MasCon Devices and Channels
@ptitude Observer 10.2, Revision N 4 - 37 User Manual
Figure 4 - 32.
Example of Machine Parameters Settings.
All machine parameters are:
Displayed in the Measurement Date window (for each stored spectra/time
waveform).
Displayable in a trend plot like the existing three simultaneous parameters.
Displayed in a separate list for the current cursor position in the trend plot (because
of the large number of parameters, they cannot be displayed in the legend of each
trend when displaying multiple vibration points in the same window).
Selectable as the X-axis in a trend plot.
Selectable for filtering in the buffer settings, one parameter at a time.
System Configuration
Creating OPC Server and OPC Channels
4 - 38 @ptitude Observer 10.2, Revision N User Manual
Creating OPC Server and OPC Channels
OPC stands for object linking and embedding (OLE) for process control. It is an open,
flexible, and plug-and-play software communication standard for modular software
inter-operability in the automation industry. OPC is a specification that has been
developed by a team of more than 120 different companies to produce an efficient
specification for data/information standardization.
OPC server enables software, such as @ptitude Observer, to route its data to OPC
server. In return, OPC server stores and shares data that are from all the OPC clients.
Generally there are two different generations of OPC, OPC (which is generally referred
to as Standard OPC) and OPC UA.
There are two ways of working with OPC in conjunction with SKF @ptitude Observer.
Using the Internal Built-in OPC Server. In the @ptitude Observer Monitoring Suite,
there is a built-in OPC UA Server in the monitor service component. It can, if
enabled, automatically publish all data that @ptitude Observer system captures.
Using External OPC Servers
To be able to use OPC servers in @ptitude Observer, you need to set up a configuration
for the available OPC servers in the @ptitude Observer, so that the @ptitude Observer
Monitor service can recognize the OPC servers.
Not only can the @ptitude Observer Monitor handle IMx/MasCon devices, but it can also
be the logical data gatherer/distributor for OPC. Therefore, you do not have to have the
@ptitude Observer running in order to use OPC in your application. However, you do
need to set up OPC servers and OPC channels in the @ptitude Observer while the
@ptitude Observer Monitor is connected to the @ptitude Observer.
The following steps are an overview of the procedure using external OPC servers:
1. Install your OPC server and set up tags correctly according to your OPC manual.
2. In @ptitude Observer, create a connection to OPC server by adding OPC server as
shown in Adding an OPC Server, below.
3. In @ptitude Observer, create OPC channels to the OPC server you created in step 2 by adding OPC channels as shown in Creating OPC Channels, below.
Warning: When using DBCS (double byte character set) operating systems, both the OPC server and the @ptitude Observer Monitor computer have to use DBCS. DBCS is the character set used by Korean, Chinese, Japanese Windows, etc.
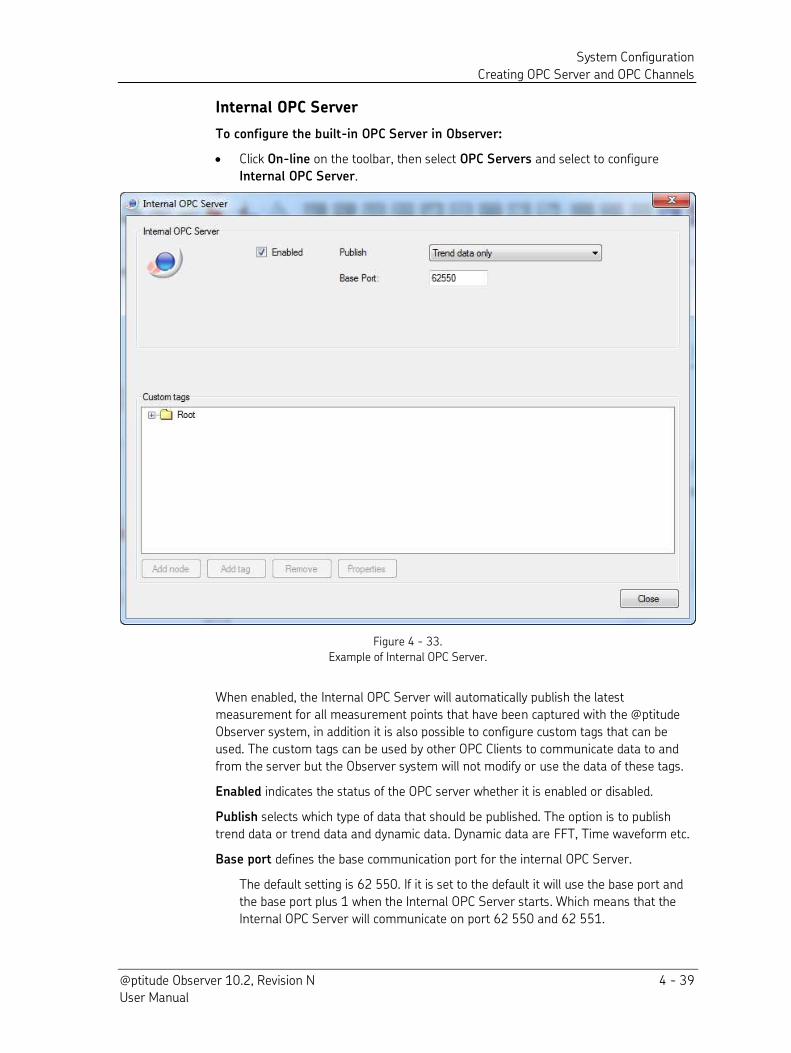
System Configuration
Creating OPC Server and OPC Channels
@ptitude Observer 10.2, Revision N 4 - 39 User Manual
Internal OPC Server
To configure the built-in OPC Server in Observer:
Click On-line on the toolbar, then select OPC Servers and select to configure
Internal OPC Server.
Figure 4 - 33.
Example of Internal OPC Server.
When enabled, the Internal OPC Server will automatically publish the latest
measurement for all measurement points that have been captured with the @ptitude
Observer system, in addition it is also possible to configure custom tags that can be
used. The custom tags can be used by other OPC Clients to communicate data to and
from the server but the Observer system will not modify or use the data of these tags.
Enabled indicates the status of the OPC server whether it is enabled or disabled.
Publish selects which type of data that should be published. The option is to publish
trend data or trend data and dynamic data. Dynamic data are FFT, Time waveform etc.
Base port defines the base communication port for the internal OPC Server.
The default setting is 62 550. If it is set to the default it will use the base port and
the base port plus 1 when the Internal OPC Server starts. Which means that the
Internal OPC Server will communicate on port 62 550 and 62 551.
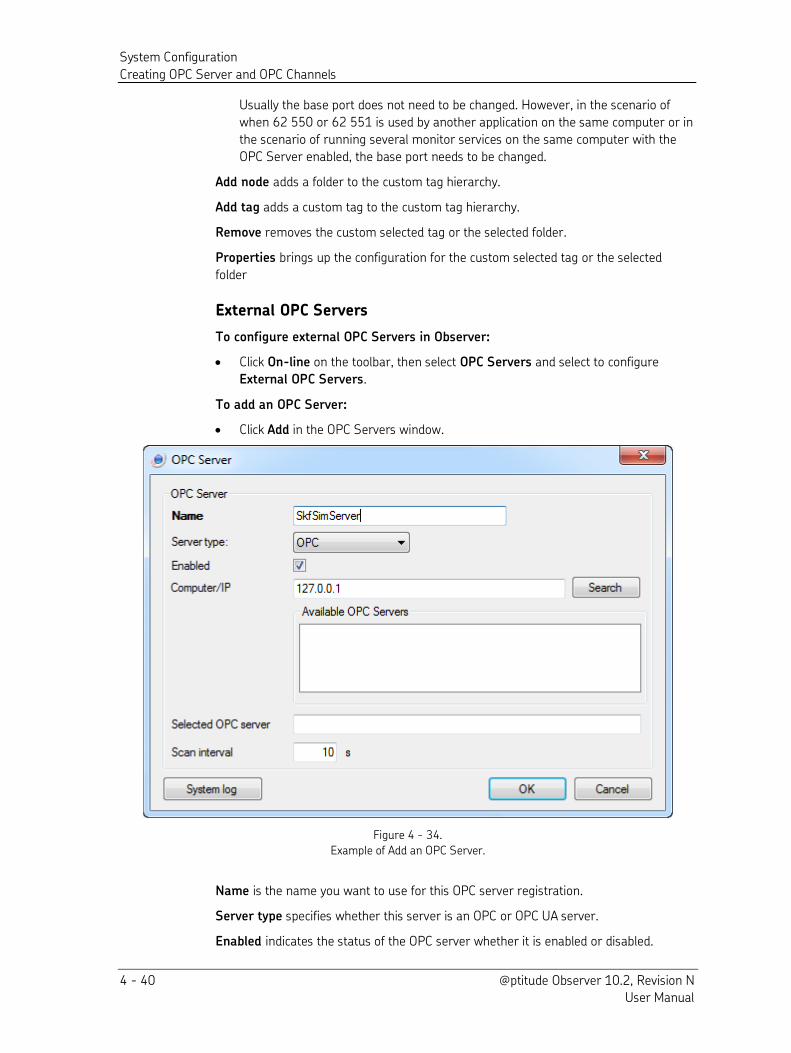
System Configuration
Creating OPC Server and OPC Channels
4 - 40 @ptitude Observer 10.2, Revision N User Manual
Usually the base port does not need to be changed. However, in the scenario of
when 62 550 or 62 551 is used by another application on the same computer or in
the scenario of running several monitor services on the same computer with the
OPC Server enabled, the base port needs to be changed.
Add node adds a folder to the custom tag hierarchy.
Add tag adds a custom tag to the custom tag hierarchy.
Remove removes the custom selected tag or the selected folder.
Properties brings up the configuration for the custom selected tag or the selected
folder
External OPC Servers
To configure external OPC Servers in Observer:
Click On-line on the toolbar, then select OPC Servers and select to configure
External OPC Servers.
To add an OPC Server:
Click Add in the OPC Servers window.
Figure 4 - 34.
Example of Add an OPC Server.
Name is the name you want to use for this OPC server registration.
Server type specifies whether this server is an OPC or OPC UA server.
Enabled indicates the status of the OPC server whether it is enabled or disabled.
System Configuration
Creating OPC Server and OPC Channels
@ptitude Observer 10.2, Revision N 4 - 41 User Manual
Computer/IP is the computer name or IP number for which the OPC server is located.
Search gets a list of OPC servers on a specified computer for the @ptitude Observer
Monitor.
Available OPC Servers lists the OPC Servers found when clicking the "Search" button.
Selected OPC server is the pre-defined name of the OPC server that you are using
which is not editable.
Scan interval is the scan time interval in seconds. The @ptitude Observer Monitor uses
it to scan the OPC server for current values. Default is 10 seconds which means that the
@ptitude Observer Monitor checks for the current values of the OPC server every ten
seconds.
System log is a configuration log containing all the setup activities which can be useful
when investigating or tracking changes made during the setup.
To edit an OPC Server:
Click Edit in the OPC servers window. The settings available for editing an OPC
server are the same as in Adding an OPC Server from above.
To remove an OPC Server:
Select an OPC server from the list of OPC servers
Click Remove in the OPC servers window to remove the OPC server from the list.
To create OPC Channels:
Select an OPC server you wish to use from the list of OPC servers.
Click Add in OPC channels window.
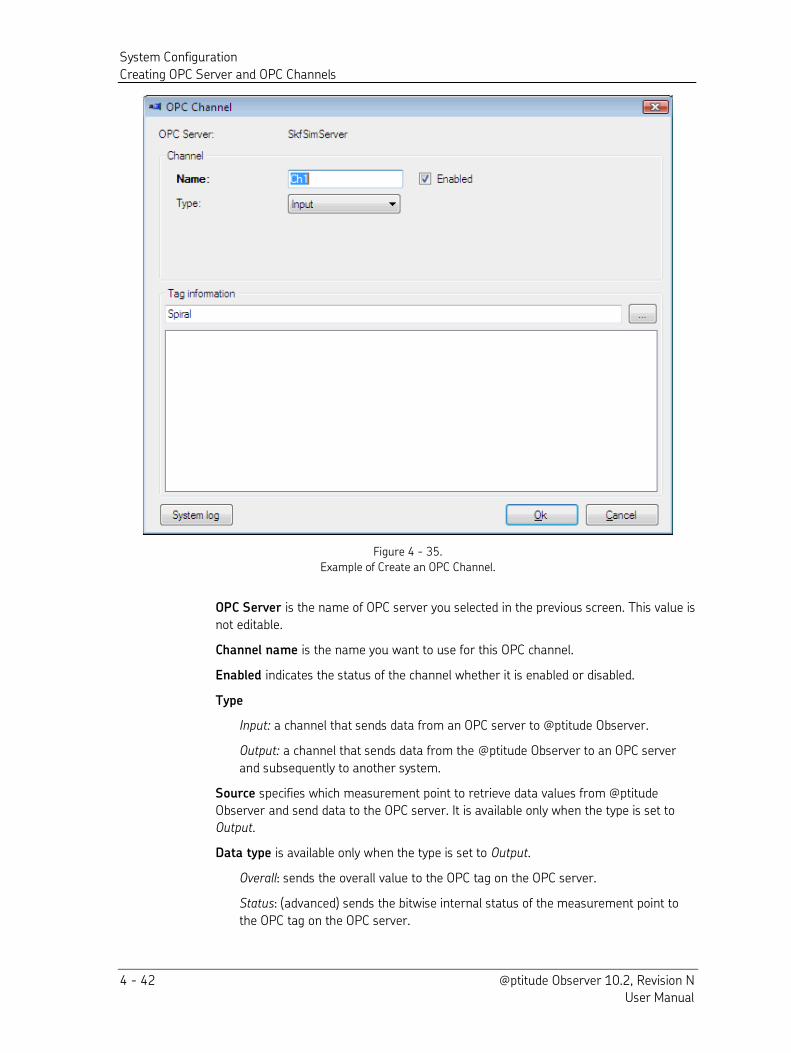
System Configuration
Creating OPC Server and OPC Channels
4 - 42 @ptitude Observer 10.2, Revision N User Manual
Figure 4 - 35.
Example of Create an OPC Channel.
OPC Server is the name of OPC server you selected in the previous screen. This value is
not editable.
Channel name is the name you want to use for this OPC channel.
Enabled indicates the status of the channel whether it is enabled or disabled.
Type
Input: a channel that sends data from an OPC server to @ptitude Observer.
Output: a channel that sends data from the @ptitude Observer to an OPC server
and subsequently to another system.
Source specifies which measurement point to retrieve data values from @ptitude
Observer and send data to the OPC server. It is available only when the type is set to Output.
Data type is available only when the type is set to Output.
Overall: sends the overall value to the OPC tag on the OPC server.
Status: (advanced) sends the bitwise internal status of the measurement point to
the OPC tag on the OPC server.
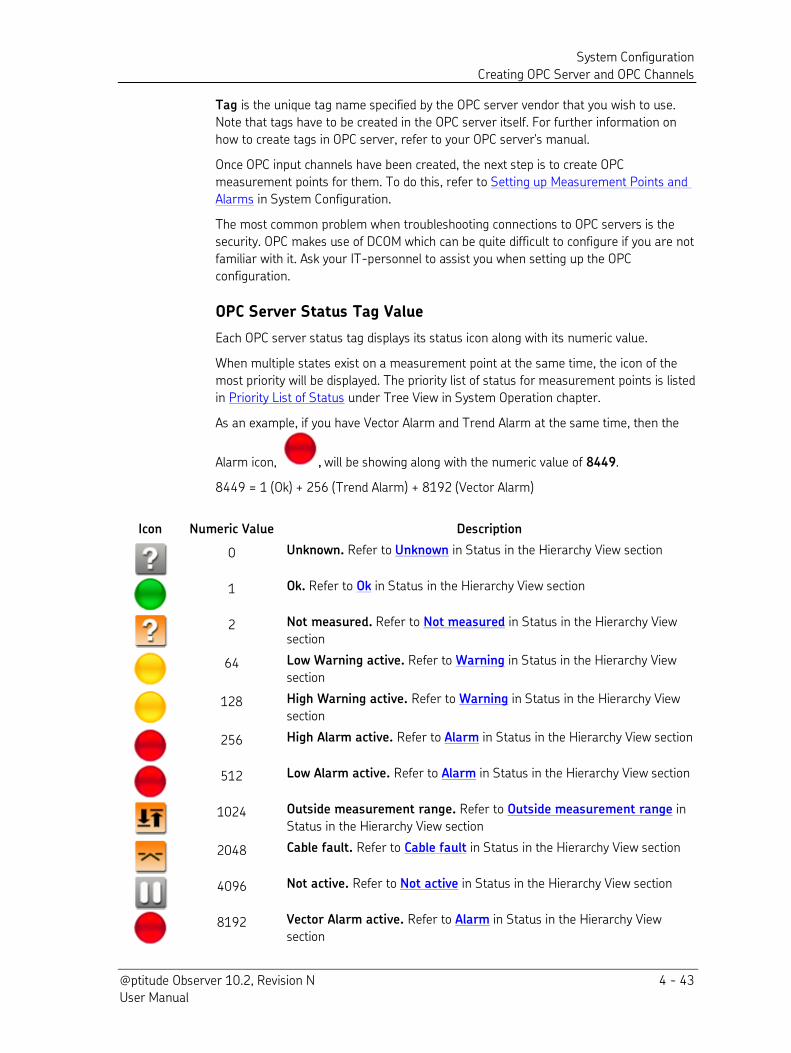
System Configuration
Creating OPC Server and OPC Channels
@ptitude Observer 10.2, Revision N 4 - 43 User Manual
Tag is the unique tag name specified by the OPC server vendor that you wish to use.
Note that tags have to be created in the OPC server itself. For further information on
how to create tags in OPC server, refer to your OPC server's manual.
Once OPC input channels have been created, the next step is to create OPC
measurement points for them. To do this, refer to Setting up Measurement Points and
Alarms in System Configuration.
The most common problem when troubleshooting connections to OPC servers is the
security. OPC makes use of DCOM which can be quite difficult to configure if you are not
familiar with it. Ask your IT-personnel to assist you when setting up the OPC
configuration.
OPC Server Status Tag Value
Each OPC server status tag displays its status icon along with its numeric value.
When multiple states exist on a measurement point at the same time, the icon of the
most priority will be displayed. The priority list of status for measurement points is listed
in Priority List of Status under Tree View in System Operation chapter.
As an example, if you have Vector Alarm and Trend Alarm at the same time, then the
Alarm icon, , will be showing along with the numeric value of 8449.
8449 = 1 (Ok) + 256 (Trend Alarm) + 8192 (Vector Alarm)
Icon Numeric Value Description
0 Unknown. Refer to Unknown in Status in the Hierarchy View section
1 Ok. Refer to Ok in Status in the Hierarchy View section
2 Not measured. Refer to Not measured in Status in the Hierarchy View
section
64 Low Warning active. Refer to Warning in Status in the Hierarchy View
section
128 High Warning active. Refer to Warning in Status in the Hierarchy View
section
256 High Alarm active. Refer to Alarm in Status in the Hierarchy View section
512 Low Alarm active. Refer to Alarm in Status in the Hierarchy View section
1024 Outside measurement range. Refer to Outside measurement range in
Status in the Hierarchy View section
2048 Cable fault. Refer to Cable fault in Status in the Hierarchy View section
4096 Not active. Refer to Not active in Status in the Hierarchy View section
8192 Vector Alarm active. Refer to Alarm in Status in the Hierarchy View
section
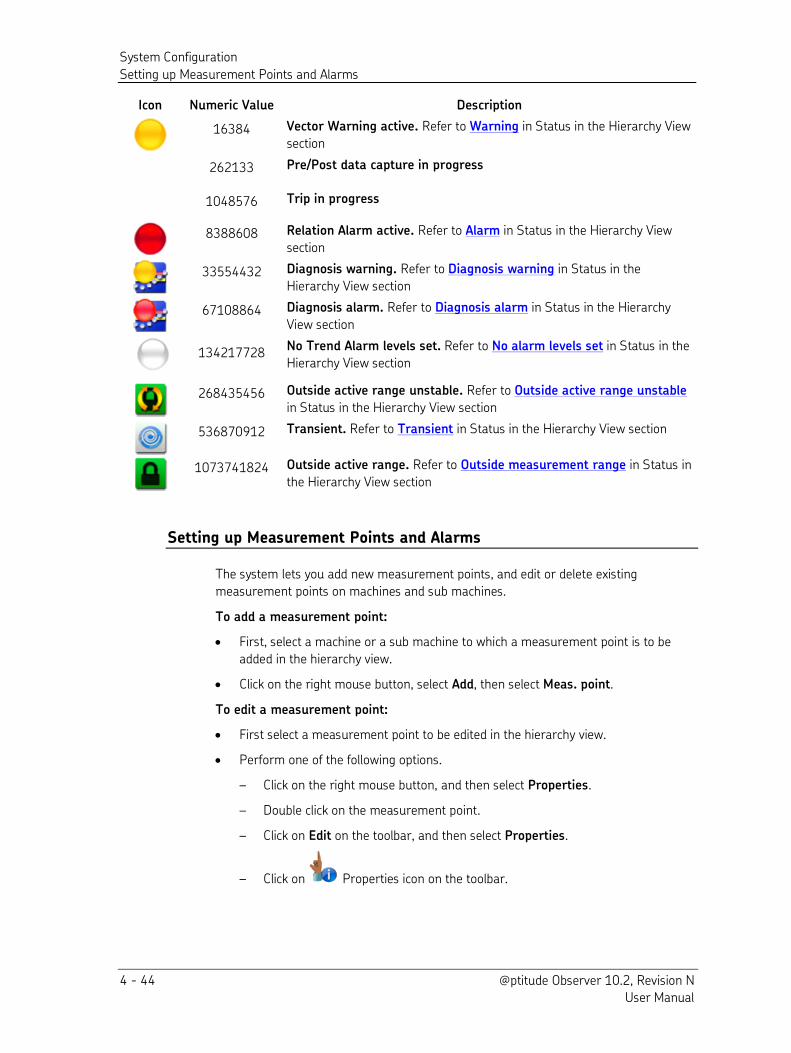
System Configuration
Setting up Measurement Points and Alarms
4 - 44 @ptitude Observer 10.2, Revision N User Manual
Icon Numeric Value Description
16384 Vector Warning active. Refer to Warning in Status in the Hierarchy View
section
262133 Pre/Post data capture in progress
1048576 Trip in progress
8388608 Relation Alarm active. Refer to Alarm in Status in the Hierarchy View
section
33554432 Diagnosis warning. Refer to Diagnosis warning in Status in the
Hierarchy View section
67108864 Diagnosis alarm. Refer to Diagnosis alarm in Status in the Hierarchy
View section
134217728
No Trend Alarm levels set. Refer to No alarm levels set in Status in the
Hierarchy View section
268435456 Outside active range unstable. Refer to Outside active range unstable
in Status in the Hierarchy View section
536870912 Transient. Refer to Transient in Status in the Hierarchy View section
1073741824 Outside active range. Refer to Outside measurement range in Status in
the Hierarchy View section
Setting up Measurement Points and Alarms
The system lets you add new measurement points, and edit or delete existing
measurement points on machines and sub machines.
To add a measurement point:
First, select a machine or a sub machine to which a measurement point is to be
added in the hierarchy view.
Click on the right mouse button, select Add, then select Meas. point.
To edit a measurement point:
First select a measurement point to be edited in the hierarchy view.
Perform one of the following options.
– Click on the right mouse button, and then select Properties.
– Double click on the measurement point.
– Click on Edit on the toolbar, and then select Properties.
– Click on Properties icon on the toolbar.
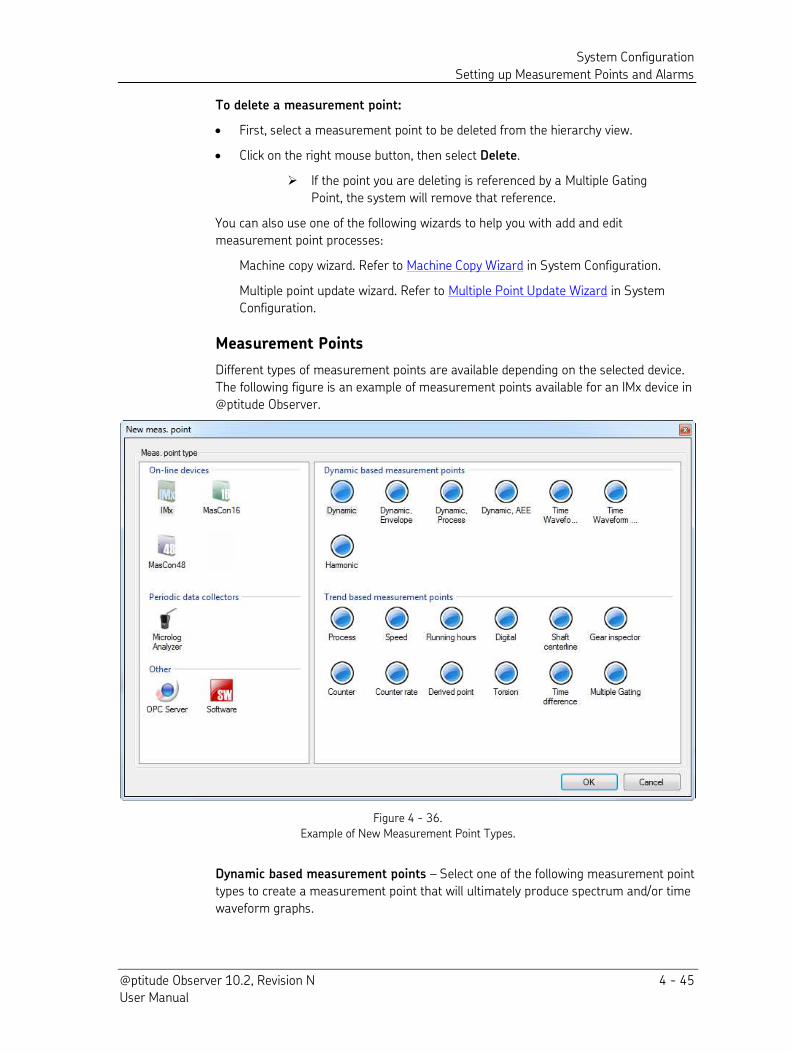
System Configuration
Setting up Measurement Points and Alarms
@ptitude Observer 10.2, Revision N 4 - 45 User Manual
To delete a measurement point:
First, select a measurement point to be deleted from the hierarchy view.
Click on the right mouse button, then select Delete.
If the point you are deleting is referenced by a Multiple Gating
Point, the system will remove that reference.
You can also use one of the following wizards to help you with add and edit
measurement point processes:
Machine copy wizard. Refer to Machine Copy Wizard in System Configuration.
Multiple point update wizard. Refer to Multiple Point Update Wizard in System
Configuration.
Measurement Points
Different types of measurement points are available depending on the selected device.
The following figure is an example of measurement points available for an IMx device in
@ptitude Observer.
Figure 4 - 36.
Example of New Measurement Point Types.
Dynamic based measurement points – Select one of the following measurement point
types to create a measurement point that will ultimately produce spectrum and/or time
waveform graphs.
System Configuration
Setting up Measurement Points and Alarms
4 - 46 @ptitude Observer 10.2, Revision N User Manual
Dynamic is a measurement of a dynamic signal such as vibration sensors, AC
current, or any other dynamic signal that could change at a frequency faster than
0,1 Hz.
Dynamic, Envelope is a measurement of repetitive frequencies. It is used to detect
and monitor repetitive frequencies, such as bearing failure detection and
monitoring.
Dynamic, Process is a measurement similar to the Dynamic measurement point,
but instead of a vibration signal, it uses an analogue sensor for the measurement.
For example, it can be used for motor current analysis.
Dynamic, AEE is a measurement of an acoustic emission signal.
Time Waveform Analysis is a measurement of the time waveform and applies
algorithms such as crest, kurtosis, and skewness in order to detect failures
Time Waveform Analysis, AEE is same as Time Waveform Analysis but used for
acoustic emission signal.
Harmonic is a measurement of a dynamic signal with vibration sensors or Eddy
Current Probes such as vibration monitoring on turbines.
SEE® (spectral emitted energy) is designed especially for measuring high
frequencies for Microlog CMVA series only. It requires a special sensor kit.
Trend based measurement points – Select one of the following measurement point
types to create a measurement point that will ultimately produce trend graphs.
Process is a measurement of a static/process signal such as load sensors,
temperature sensors, pressure, flow or any other static signal.
Speed is a measurement of the rotational speed of a shaft. It is used to measure
rotational speed of a shaft with a speed sensor.
Running hours is a measurement point for IMx/MasCon devices. It provides an
effective usage for Observer's Maintenance Planner feature. It keeps track of
running hours of a machine.
Digital is a measurement of an input that reacts like a digital signal for
IMx/MasCon48 devices. This means that the input signal basically has only two
states: a digital 1 and a digital 0 or relay closed and relay opened. A digital
measurement point can be used to control when to take trend vibration data and
when to take spectrum data.
Shaft centerline is a measurement that uses information from two radial
displacement sensors located in the same axial position 60 to 120 degrees from
each other in IMx devices.
Gear inspector is useful when analyzing impact energy as a function of shaft/gear
revolutions in wind turbines.
Counter is a measurement that counts digital pulse changes which produces a
value with the total amount of digital value changes. It can be reset and the value
will start from zero again. It is currently available for IMx/MasCon16devices only.
System Configuration
Setting up Measurement Points and Alarms
@ptitude Observer 10.2, Revision N 4 - 47 User Manual
Counter rate creates a new measurement that counts pulses per second, minute,
hour, day or week on a digital channel. This measurement point can be used to
measure a particle counter.
Derived point is a calculation measurement point which does not use any sensor in
IMx/MasCon16 devices. Instead, it takes other measurement points to calculate the
result to trend.
Torsion is a measurement of the torsion of a shaft using two digital channels for
IMx/MasCon48 devices.
Time difference is a measurement of the time difference between two digital
pulses of IMx/MasCon48 devices.
Multiple Gating, Process is a measurement that references values from up to five
other points and then performs a logical evaluation on the current measurements
to determine if the IMx should take measurements. Each reference point has two
distinct gating conditions, Operating Class 1 or Operating Class 2, with the point
output determined by which set of the two gating conditions is set to TRUE. These
reference measurements can include process, speed, and digital measurements.
HFD (high frequency domain) is a vibration type of measurement that is similar to
envelope measurement but produces only an overall value for Microlog Analyzer
only.
OPC is a measurement that is used when the system requires data from an
external system with help of an OPC Server.
Before you start configuring OPC measurement point, make sure
that you have completed the setup for OPC server and OPC
channels. If not, refer to Creating OPC Server and OPC Channels
in System Configuration.
Data tagging is used to track down material related or characteristic related data.
You can mark measurements with a specific tag such as paper quality, motor
brand, revision number or any other property of a machine. Data can be tagged
manually with Software data tagging point or automatically by OPC data tagging
points.
Speed from spectra is a manual speed measurement point with static value.
Derived is a general measurement point that is also called @ptitude Observer
derived measurement point. A derived measurement is a calculation point that uses
other measurement points to calculate what to trend. For example, you can trend
the sum of all vibrations of a machine or the average efficiency of four different
turbines. The @ptitude Observer derived measurement can take data from
IMx/MasCon and OPC measurement points. The measurement value is calculated
in the @ptitude Observer Monitor every 10 seconds.
Protection is a measurement point displaying data from the IMx-M Protection
Module. These points can't be created manually in Observer but are created in the
IMx-M Manager software. These point types can however be edited in Observer
with the limitation that only a few of the parameters on the point properties can be
changed. Most of the properties cannot be changed. The Protection points are
connected to external channels for the IMx-M and are created in the Observer
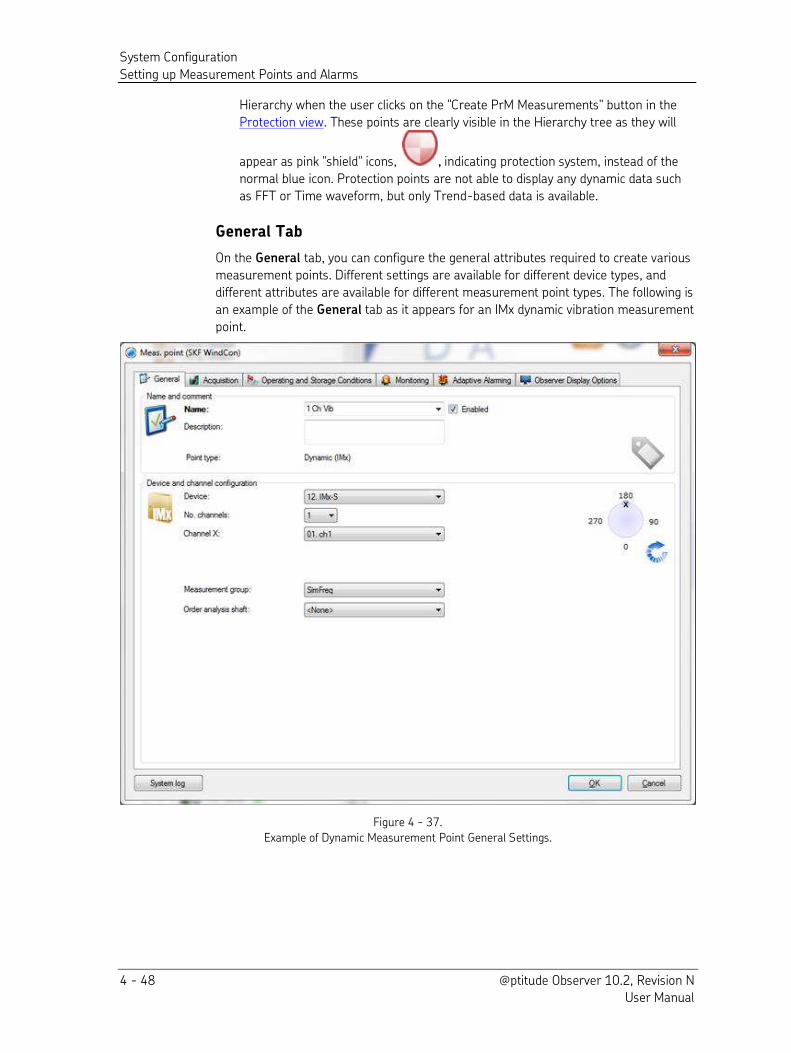
System Configuration
Setting up Measurement Points and Alarms
4 - 48 @ptitude Observer 10.2, Revision N User Manual
Hierarchy when the user clicks on the "Create PrM Measurements" button in the
Protection view. These points are clearly visible in the Hierarchy tree as they will
appear as pink "shield" icons, , indicating protection system, instead of the
normal blue icon. Protection points are not able to display any dynamic data such
as FFT or Time waveform, but only Trend-based data is available.
General Tab
On the General tab, you can configure the general attributes required to create various
measurement points. Different settings are available for different device types, and
different attributes are available for different measurement point types. The following is
an example of the General tab as it appears for an IMx dynamic vibration measurement
point.
Figure 4 - 37.
Example of Dynamic Measurement Point General Settings.
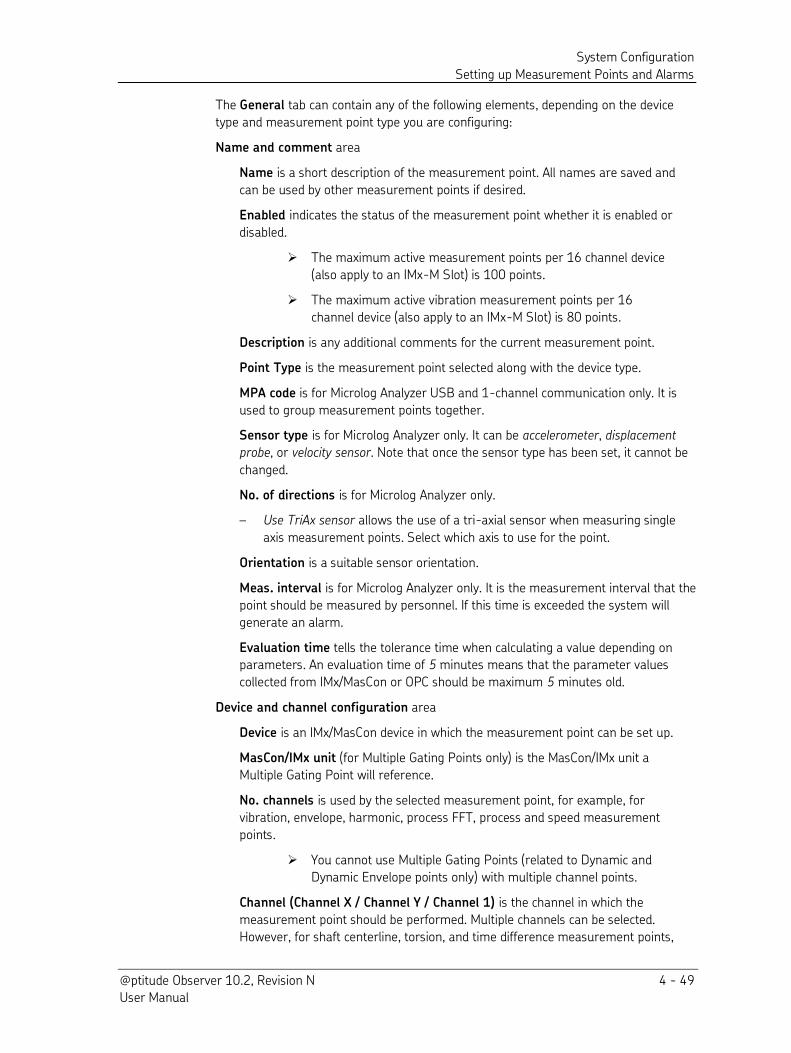
System Configuration
Setting up Measurement Points and Alarms
@ptitude Observer 10.2, Revision N 4 - 49 User Manual
The General tab can contain any of the following elements, depending on the device
type and measurement point type you are configuring:
Name and comment area
Name is a short description of the measurement point. All names are saved and
can be used by other measurement points if desired.
Enabled indicates the status of the measurement point whether it is enabled or
disabled.
The maximum active measurement points per 16 channel device
(also apply to an IMx-M Slot) is 100 points.
The maximum active vibration measurement points per 16
channel device (also apply to an IMx-M Slot) is 80 points.
Description is any additional comments for the current measurement point.
Point Type is the measurement point selected along with the device type.
MPA code is for Microlog Analyzer USB and 1-channel communication only. It is
used to group measurement points together.
Sensor type is for Microlog Analyzer only. It can be accelerometer, displacement
probe, or velocity sensor. Note that once the sensor type has been set, it cannot be
changed.
No. of directions is for Microlog Analyzer only.
– Use TriAx sensor allows the use of a tri-axial sensor when measuring single
axis measurement points. Select which axis to use for the point.
Orientation is a suitable sensor orientation.
Meas. interval is for Microlog Analyzer only. It is the measurement interval that the
point should be measured by personnel. If this time is exceeded the system will
generate an alarm.
Evaluation time tells the tolerance time when calculating a value depending on parameters. An evaluation time of 5 minutes means that the parameter values
collected from IMx/MasCon or OPC should be maximum 5 minutes old.
Device and channel configuration area
Device is an IMx/MasCon device in which the measurement point can be set up.
MasCon/IMx unit (for Multiple Gating Points only) is the MasCon/IMx unit a
Multiple Gating Point will reference.
No. channels is used by the selected measurement point, for example, for
vibration, envelope, harmonic, process FFT, process and speed measurement
points.
You cannot use Multiple Gating Points (related to Dynamic and
Dynamic Envelope points only) with multiple channel points.
Channel (Channel X / Channel Y / Channel 1) is the channel in which the
measurement point should be performed. Multiple channels can be selected.
However, for shaft centerline, torsion, and time difference measurement points,
System Configuration
Setting up Measurement Points and Alarms
4 - 50 @ptitude Observer 10.2, Revision N User Manual
two different channels must be selected. Note that speed channels must be
configured in IMx/MasCon units before you are able to select one here.
Trigg channel is the trigger channel which can be used for speed and torsion
measurement points. This can be used if channels have more than one pulse per
revolution in order to start the measurements at the same position every time.
Note that a trigger channel must be selected for condition monitoring on turbines.
Measurement group is a logical grouping of measurement points that should
collect data at the same time and synchronously on a specific IMx/MasCon device.
Setting up measurement groups is described in Measurement Groups under
Database in Menu Items
Order analysis shaft is the shaft on the machine that should be used for order
analysis in the spectrum, history and 3D plot.
Rotation direction indicates the rotational direction for vibration measurement points, clockwise, counter- clockwise, or both.
Cable check is an alternate source for the cable check since the channel of this
measurement point does not have the option to verify a status of the bias.
OPC Server and channel settings area (for OPC measurement points only)
Note that in order to send data from the @ptitude Observer to an OPC server, a
setup of an OPC measurement point is not required. Instead, this is completed
through OPC channel setup.
OPC server is a pre-configured OPC server which you wish to use for this
measurement point.
OPC channel is a channel in which you wish to be connected.
DAD is required for OPC server.
Channel is a channel in which you wish to be connected.
Data tagging group enables you to select a data tagging group from the drop
down list. Data tagging group is created through Data tagging group interface
under Library\Database in Menu Items.
Source area (for Software, Data tagging measurement points only)
Data tagging group enables you to select a data tagging group from the drop
down list. Data tagging group is created through Data tagging group interface
under Library\Database in Menu Items.
System log is a configuration log of all the changes made to the measurement point.
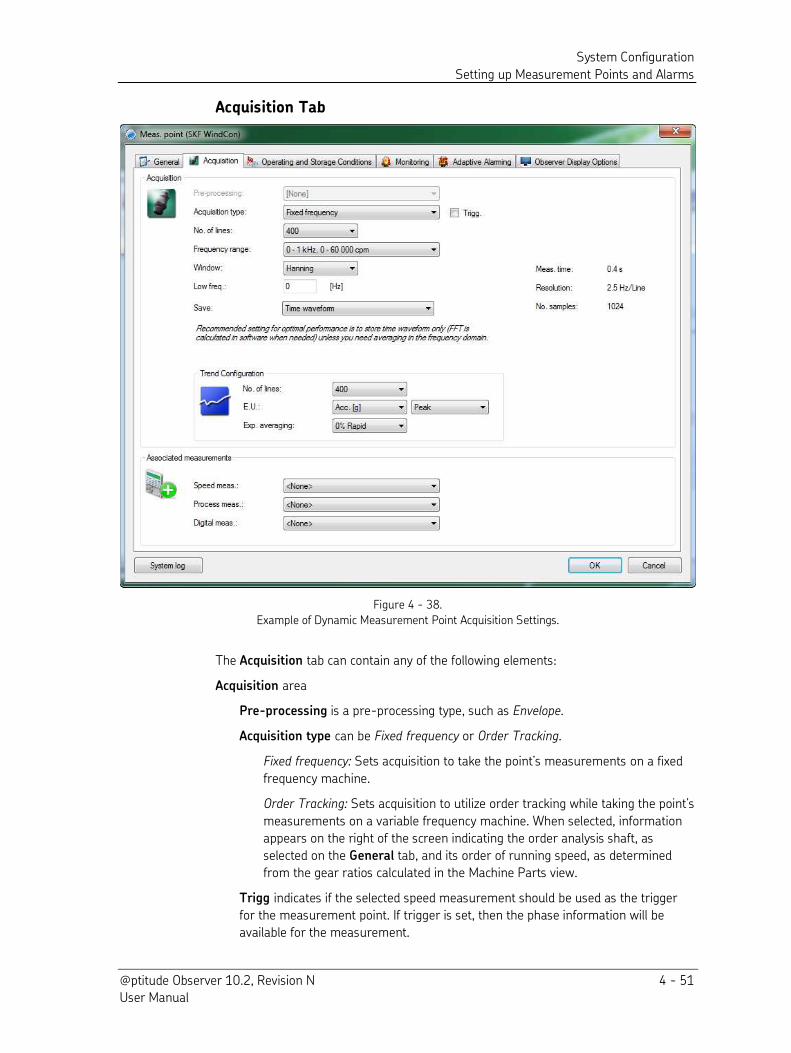
System Configuration
Setting up Measurement Points and Alarms
@ptitude Observer 10.2, Revision N 4 - 51 User Manual
Acquisition Tab
Figure 4 - 38.
Example of Dynamic Measurement Point Acquisition Settings.
The Acquisition tab can contain any of the following elements:
Acquisition area
Pre-processing is a pre-processing type, such as Envelope.
Acquisition type can be Fixed frequency or Order Tracking.
Fixed frequency: Sets acquisition to take the point’s measurements on a fixed
frequency machine.
Order Tracking: Sets acquisition to utilize order tracking while taking the point’s measurements on a variable frequency machine. When selected, information
appears on the right of the screen indicating the order analysis shaft, as
selected on the General tab, and its order of running speed, as determined
from the gear ratios calculated in the Machine Parts view.
Trigg indicates if the selected speed measurement should be used as the trigger
for the measurement point. If trigger is set, then the phase information will be
available for the measurement.
System Configuration
Setting up Measurement Points and Alarms
4 - 52 @ptitude Observer 10.2, Revision N User Manual
No. of lines is the number of lines needed to construct the FFT (Fast Fourier
Transform).
Frequency range is the maximum frequency for the FFT or time waveform. You may select a frequency range from the drop-down list or select Custom option to
enter the end frequency in Hz. The end frequency can be between 5 and 40 000
Hz in integer numbers only.
Window is the window type for the FFT which can be Hanning or Uniform.
Low freq is the low frequency cutoff which can be used as a filter to limit unwanted peaks or "ski slopes" at the start of the FFT. For example, setting this value to 5 will
zero out all values between 0 and 5 Hz in the FFT.
Save determines which format of the captured data should be stored in the system.
Storing time waveform only is the recommended setting. Observer will on the fly
calculate and display the FFT based on the time waveform when clicking the
spectra button.
Meas. time describes the current measurement time calculated with the currently
selected number of lines and frequency range.
Resolution describes the current resolution calculated with the currently selected
frequency range and number of lines.
No. samples is the number of samples needed to construct the time waveform.
Shaft 1 shows the calculated orders of running speed compared to the designated
order analysis shaft.
Sampling revolutions indicate how many revolutions the trend value should be
based on for shaft centerline measurements only.
Max time is the time allowed for measuring a trend value for shaft centerline
measurements only. If it takes longer time than the specified time to measure the
desired sampling revolutions, the trend value will still be calculated and stored.
Formula area
Parameters are used by the formula for derived point measurements. There are two types of parameters, Constant and Trend.
Constant: this value never changes. It can be custom created here by assigning
parameter's name, setting the type to constant and assigning any numeric
value.
Trend: another measurement point value in the system. It can also be custom
created here by assigning parameter's name, setting the type to trend, and
selecting a measurement point from the system as the source. The source
selected here must be from the same IMx/MasCon device.
Formula is the calculation formula using the assigned parameters from above for
derived point measurement. The normal calculation methods (+ , - ,* ,/ ,^ ,( , ) ) and
mathematical functions are available to build a formula.
Check verifies if @ptitude Observer and @ptitude Observer Monitor can understand
the formula entered. This is also done automatically when you click Ok as well.
System Configuration
Setting up Measurement Points and Alarms
@ptitude Observer 10.2, Revision N 4 - 53 User Manual
Trend Configuration area
No. of lines is the number of lines needed to construct the FFT (Fast Fourier
Transform).
E.U. (Engineering Unit) is the engineering unit in which this measurement is to be displayed. If the scale factor is set to 1, then E.U. will be set to degrees. However, if
the measurement point is a counter rate, this acts as a user editable text field. See
Time Unit, below.
Scale factor is used if you want to have a different scale factor than the engineering unit (E.U.) of degrees. The default is 1.
Time unit is available for counter rate measurement points only. It can be pulses of
seconds, minutes, hours, days or weeks. Note that for counter rate measurement
points, E.U. is a user entered text that will be displayed on graph only. Which
means that it will not effect the measurement at all. The text should reflect the
selected time unit, for example if time unit is selected as Seconds, E.U. should be
changed to Pulses/second.
Resettable sets whether or not the measurement point's value can be set to zero
or not. It is available for count measurement points only.
Unit is the unit on which the trend measurement should be performed.
Scaling defines how the trend values should be calculated and stored in the
database.
Counter type sets the calculation method that should be used for this counter
measurement point.
Pulses: The value collected is added to the previous value. This is a normal
counter.
Stops: Each time a value is collected, the previous value is incremented by one
(1).
Pulses between stops: The value collected is the value used. This can be used,
for example measuring the distance between two train stations if an IMx has
been fitted on a train.
Exp.averaging (exponential averaging) is a setting to perform an automatic trend
curve smoothing or to stop the system from giving alarms when intermittent
disturbances occur.
The function applies the following formula:
new calculated = measured * (1 - exp value) + last calculated * exp value
Compensate for speed is available for "running hours" measurement points only.
It compensates the running speed of a machine by comparing the active speed of
the machine against a nominal speed of the machine. The Nominal speed of the
machine is entered by the user.
For example, if the active speed of the machine is 1 000 cpm and the nominal
speed is set to 2 000 cpm, then after the machine has been run for two hours,
because of the difference between the active speed and the nominal speed, the
running hours value will be one hour instead of two hours.
System Configuration
Setting up Measurement Points and Alarms
4 - 54 @ptitude Observer 10.2, Revision N User Manual
Compensate for load is available for "Running hours" measurement points only. It
enables a compensation for the active load or any other process signal compared to
a Nominal load value entered by the user. Compensate for load works the same
way as Compensate for speed.
Spectra source is the measurement point where that maximum amplitude is being
searched to get the speed reading.
Min. speed / Max. speed is the start and stop search range of the spectra source.
Machine part can be a gear or a shaft that helps to get more precise speed reading
by using its fault frequency.
Speed is the running speed in rpm (revolution per minute).
Deviation is the percentage the speed can vary during the measurement of the
machine. This is used in the diagnosis calculation when obtaining the fault
frequencies. It sets the search range of frequencies for the diagnosis calculation.
Deviation time tells the tolerance time when calculating a value depending on
parameters. A deviation time of 5 minutes means that the parameter values
collected from IMx/MasCon or OPC should be a maximum of 5 minutes old.
Associated Measurements area
Speed meas. is a speed measurement point to which the currently selected
measurement point should be connected/linked. The selected speed measurement
point will be taken with the current measurement point's data.
Speed controlled sampling indicates whether to use speed controlled sampling or
not. If it is checked, then all the samples during one revolution of the shaft will be
used to calculate the average position of the shaft. If unchecked, then the samples
during 0,1 second will be used to calculate the average position of the shaft. It is
used to get a better reading of the shaft position. Therefore, for measuring the
shaft position it is strongly recommended to enable this field.
Process meas. is a process measurement point to which the current measurement
point should be connected/linked. The selected process measurement point will be
taken with the current measurement point's data.
Digital meas. is a digital or Multiple Gating measurement point to which the
current measurement point should be connected/linked. The selected digital or
Multiple Gating measurement point will be taken with the current measurement
point's data.
If the current measurement point is a Dynamic or Dynamic Envelope point, then all
Multiple Gating Points assigned to the same IMx as the current point appear in the
Digital meas. drop-down list.
To successfully set up the current measurement point to be
referenced by a Multiple Gating Point, the No. channels value on
the General tab must equal 1.
Settings area (for Microlog Analyzer only)
E.U. is the engineering unit in which this measurement is to be displayed.
Scaling is used to change the display scaling (detection) of the measurement.
System Configuration
Setting up Measurement Points and Alarms
@ptitude Observer 10.2, Revision N 4 - 55 User Manual
Pulses/rev. is the number of pulses the device receives per shaft revolution.
Full scale is used to scale the values.
Full scale, Env. is used to scale the values for Envelope.
Full scale, Veloc. is used to scale the values for Velocity.
Full scale, Temp. is used to scale the values for Temperature.
Zero level is the value that should be equal to zero in the measurement unit.
Sensitivity specifies the sensor sensitivity.
Envelope filter is a pre-processing type such as Envelope, for an example.
ICP current feed indicates whether the sensor is fed with current or not.
Frequency type can be Fixed freq. range or Order tracking.
No. of lines is for the FFT taken for extracting trend values.
Save specifies what kind of data that should be collected and stored. Choose between FFT, Time waveform or both. Data called FFT and Phase are also available
for order tracking.
Window can be Uniform, Hanning or Flattop.
Speed sets a static speed value that will be stored with the measurement.
End freq. is the highest frequency that should be measured.
Low freq. is the lowest frequency that should be measured.
No. of averages is the number of measurements the Microlog Analyzer should
measure in order to get the average reading by combining all measurements. However, this number is ignored if the averaging is Off.
Averaging is a type of averaging method which the system has to perform on the
data before it is stored to the database.
Speed meas. point allows you to select a speed measurement point which will be
measured and the value will be stored as the speed for this measurement point.
This overrides the static speed setting.
Order analysis shaft is the shaft on the machine that should be used for order
analysis in the spectrum, history and 3D plot.
General Settings area (for Multiple Gating Points only)
Use – Select whether the MGP will base its evaluation on one or two operating classifications (classes). When Both Classes is selected, you can set two different
gate ranges for each of the five reference points (on the Class 1 gating and Class 2
gating sub-tabs). When Single Class is selected, you can set a single gate range for
each of the five reference points (on the Class 1 gating sub-tab).
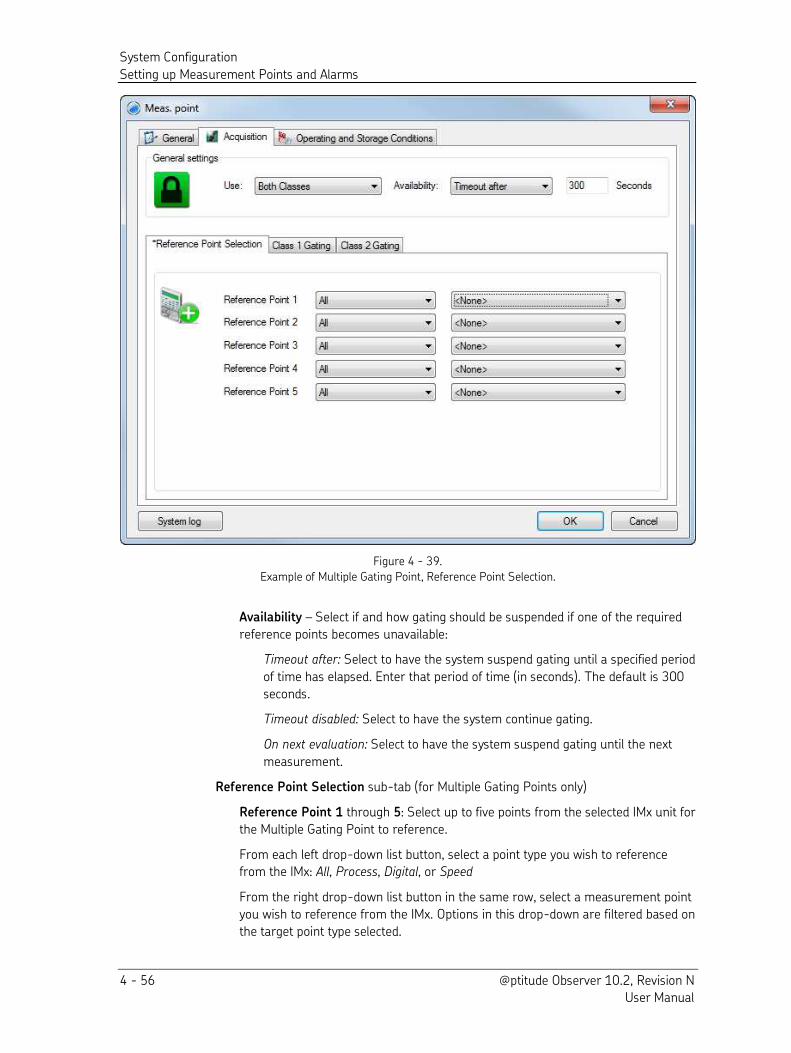
System Configuration
Setting up Measurement Points and Alarms
4 - 56 @ptitude Observer 10.2, Revision N User Manual
Figure 4 - 39.
Example of Multiple Gating Point, Reference Point Selection.
Availability – Select if and how gating should be suspended if one of the required
reference points becomes unavailable:
Timeout after: Select to have the system suspend gating until a specified period
of time has elapsed. Enter that period of time (in seconds). The default is 300
seconds.
Timeout disabled: Select to have the system continue gating.
On next evaluation: Select to have the system suspend gating until the next
measurement.
Reference Point Selection sub-tab (for Multiple Gating Points only)
Reference Point 1 through 5: Select up to five points from the selected IMx unit for
the Multiple Gating Point to reference.
From each left drop-down list button, select a point type you wish to reference from the IMx: All, Process, Digital, or Speed
From the right drop-down list button in the same row, select a measurement point
you wish to reference from the IMx. Options in this drop-down are filtered based on
the target point type selected.
System Configuration
Setting up Measurement Points and Alarms
@ptitude Observer 10.2, Revision N 4 - 57 User Manual
Class 1 gating and Class 2 gating sub-tabs (for Multiple Gating Points only) are
enabled for each operating classification set up on the Options dialog’s Data tab (one or two classes only).
Settling Time – Enter the number of seconds, upon entering a cable fault alarm
status, for which Observer will remain in this status once sensor power is restored,
given the applicable operating class. The class’s gating output is enabled only when all required conditions have been met for this period. The default is 1 second.
Reference Point 1 through 5 sub-tabs display the measurements selected (on the
Reference Point Selection sub-tab) for each reference point. These sub-tabs are
enabled for assigned reference points only.
Absolute condition: The gating parameter range. Select (check) the Min checkbox
and then enter a value to set a minimum Absolute condition. Select (check) the
Max checkbox and then enter a value to set a maximum Absolute condition.
Delta condition: The accepted range, during measurement, of gating parameter
change. Use this setting to force the system to take data when the operating mode
of the machine is stable, thus ensuring capture of accurate and trustworthy data.
Select (check) the Min checkbox and then enter a value to set a minimum Delta
condition (permitted change). Select (check) the Max checkbox and then enter a
value to set a maximum Delta condition (permitted change).
Period: Amount of time, in seconds (up to 60), for which the system must check the
Delta Condition thresholds.
Important - One or more of the reference point gating ranges (conditions) must be different between two classes.
System log is a configuration log of all the changes made to the measurement point.
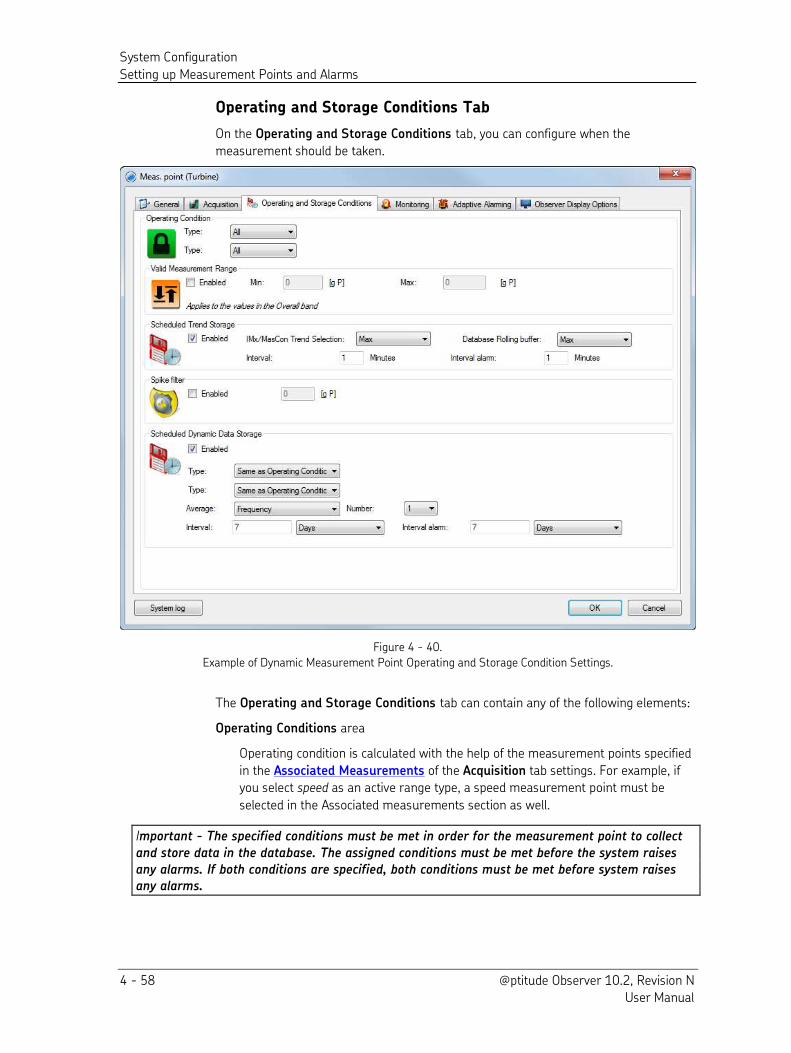
System Configuration
Setting up Measurement Points and Alarms
4 - 58 @ptitude Observer 10.2, Revision N User Manual
Operating and Storage Conditions Tab
On the Operating and Storage Conditions tab, you can configure when the
measurement should be taken.
Figure 4 - 40.
Example of Dynamic Measurement Point Operating and Storage Condition Settings.
The Operating and Storage Conditions tab can contain any of the following elements:
Operating Conditions area
Operating condition is calculated with the help of the measurement points specified
in the Associated Measurements of the Acquisition tab settings. For example, if you select speed as an active range type, a speed measurement point must be
selected in the Associated measurements section as well.
Important - The specified conditions must be met in order for the measurement point to collect
and store data in the database. The assigned conditions must be met before the system raises any alarms. If both conditions are specified, both conditions must be met before system raises any alarms.
System Configuration
Setting up Measurement Points and Alarms
@ptitude Observer 10.2, Revision N 4 - 59 User Manual
Type is the type of gating which can be set to one of the following values:
All: means that the active range check is disabled. In other words, the active
range that the measurement point is using is all values.
Speed: means that the active range check is determined by the speed
measurement point readings selected in the Associated Measurements of the
Acquisition tab settings.
Process: means that the active range check is determined by the process
measurement point readings selected in the Associated Measurements of the
Acquisition tab settings.
Digital: means that the active range check is determined by the digital
measurement point readings selected in the Associated Measurements of the
Acquisition tab settings.
Condition is the gating parameter range with minimum and maximum values.
(For Dynamic and Dynamic Envelope points only) If the Type selected is Digital and the Digital Measurement selected on the
Acquisition tab is a Multiple Gating Point, then this drop-down
list box will allow you to select one or both of the operating
classes established for that Multiple Gating Point. Once you have
selected one or both of the operating classes, the Enable class
dependent alarms checkbox on the Monitoring tab becomes
enabled but remains deselected (unchecked) by default.
Max allowed delta is maximum accepted change of the gating parameter during
the measurement. Use this setting to force the system to take data when the
operating mode of the machine is stable which may be the only way to capture the
accurate and trustworthy data.
This is an important setting when performing a process measurement point on
variable speed machines. This is not important for a speed measurement point. It
depends on your application. For example, for measuring bearing temperature, this
function can be deactivated by setting it to 0.
Valid Measurement Range area
You can force the system to take data only when the amplitude reading is at a certain
level by assigning a minimum and a maximum value of the measurement range. If the
measured value is outside the measurement range, then the system alarm will be
generated instead of an alarm on the measurement point.
System alarms are displayed in the system view, or system alarm window from the icon
bar, instead of in the alarm list. For example, if the range is set to 0 to 300 °C and the
temperature sensor output is above 300 °C, then this value will be treated as an
unrealistic value and the IMx/MasCon system will generate a system alarm in the system alarm list instead of in the alarm list. The cause of this alarm could be a bad
earth connection or surrounding interference that disturbs the output signal from the
sensor.
Enabled is the status of this measurement range, enabled or disabled.
Min. is the minimum value of the measurement range.
System Configuration
Setting up Measurement Points and Alarms
4 - 60 @ptitude Observer 10.2, Revision N User Manual
Max. is the maximum value of the measurement range.
Scheduled Trend Storage area
Enabled box allows you to enable or disable the Scheduled Trend Storage function.
IMx/MasCon Trend Selection defines which measured values to keep during the
storage Interval (as the device is constantly measuring during the time period set
for the interval).
Max: Keeps the maximum value for the entire storage interval period.
Min: Keeps the minimum value for the entire storage interval period.
First: Keeps the first value measured in the storage interval period.
Average: (IMx only) Keeps the calculated average value for the storage interval
period.
Database Rolling buffer determines which trend value to keep as data is being
thinned out by the rolling buffer feature in the monitor service.
Max: Keeps the maximum value for the time period.
Min: Keeps the minimum value for the time period.
First: Keeps the first value for the time period.
Interval is the desired interval for data capturing which depends on the application.
The selection made here affects how fast data has to be moved from short term
buffers to long term buffers in the database.
There are four different buffers in the @ptitude Observer database, a minute
buffer, an hour buffer, a day buffer and a week buffer.
In each buffer 3 000 values can be stored as default. For example, if the
measurement interval is set to 1 minute, the length of the minute buffer will be 3
000 minutes (50 hours). As more data comes in, values are move to the hour
buffer. For a specific hour, all values in the minute buffer are analyzed and the
system will move one of the values during this time period to the hour buffer. This
logic works same for the hour to day buffer, and so on. The default of 3 000 values
for each buffer can be configured in the @ptitude Observer Monitor service.
The type of the value to be moved from one buffer to the next is determined by the
Database Rolling buffer field in the Scheduled Trend Storage, above.
Interval alarm is the desired interval for data capturing when the level is in
warning or alarm condition.
Exception based storage is a setting of what to store if the trended values
changes.
Save determines which format of the captured data should be stored in the system.
Store (Delta) checkbox – Select (check) to set the system to capture and store
measurement trend data whenever there is a change in condition.
To disable interval based trend storage, enter a zero in the
Interval text box.
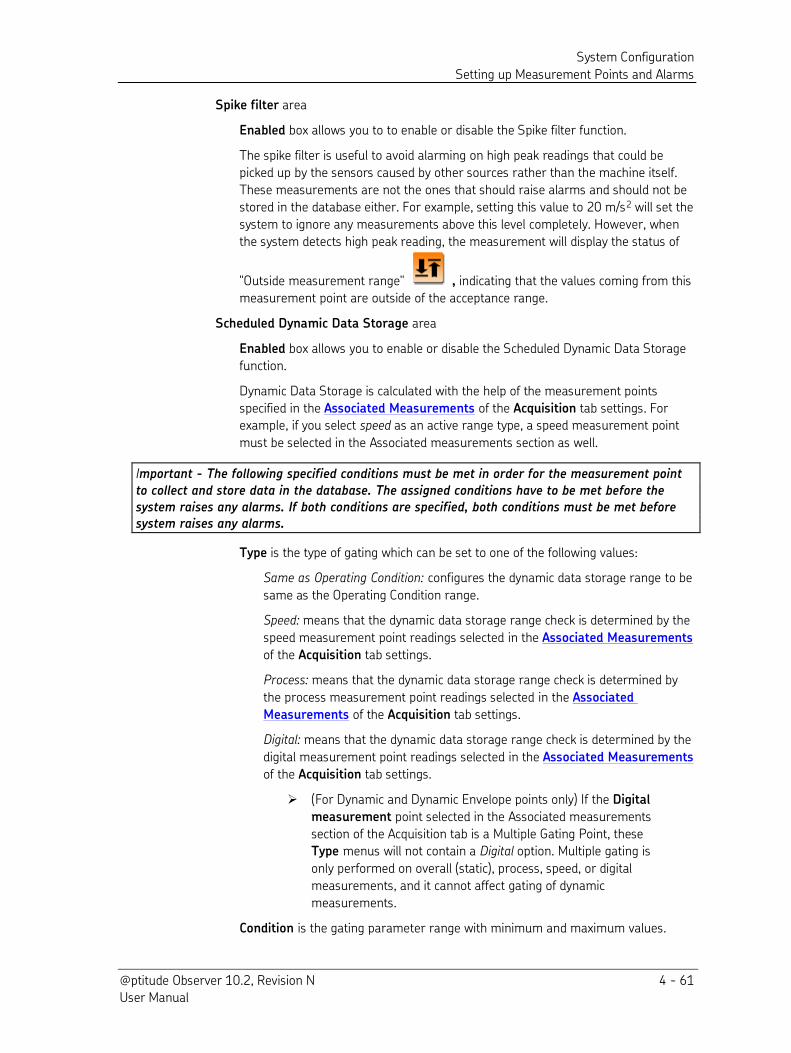
System Configuration
Setting up Measurement Points and Alarms
@ptitude Observer 10.2, Revision N 4 - 61 User Manual
Spike filter area
Enabled box allows you to to enable or disable the Spike filter function.
The spike filter is useful to avoid alarming on high peak readings that could be
picked up by the sensors caused by other sources rather than the machine itself.
These measurements are not the ones that should raise alarms and should not be
stored in the database either. For example, setting this value to 20 m/s2 will set the
system to ignore any measurements above this level completely. However, when
the system detects high peak reading, the measurement will display the status of
"Outside measurement range" , indicating that the values coming from this
measurement point are outside of the acceptance range.
Scheduled Dynamic Data Storage area
Enabled box allows you to enable or disable the Scheduled Dynamic Data Storage
function.
Dynamic Data Storage is calculated with the help of the measurement points
specified in the Associated Measurements of the Acquisition tab settings. For example, if you select speed as an active range type, a speed measurement point
must be selected in the Associated measurements section as well.
Important - The following specified conditions must be met in order for the measurement point
to collect and store data in the database. The assigned conditions have to be met before the system raises any alarms. If both conditions are specified, both conditions must be met before system raises any alarms.
Type is the type of gating which can be set to one of the following values:
Same as Operating Condition: configures the dynamic data storage range to be
same as the Operating Condition range.
Speed: means that the dynamic data storage range check is determined by the
speed measurement point readings selected in the Associated Measurements
of the Acquisition tab settings.
Process: means that the dynamic data storage range check is determined by
the process measurement point readings selected in the Associated
Measurements of the Acquisition tab settings.
Digital: means that the dynamic data storage range check is determined by the
digital measurement point readings selected in the Associated Measurements
of the Acquisition tab settings.
(For Dynamic and Dynamic Envelope points only) If the Digital
measurement point selected in the Associated measurements
section of the Acquisition tab is a Multiple Gating Point, these Type menus will not contain a Digital option. Multiple gating is
only performed on overall (static), process, speed, or digital
measurements, and it cannot affect gating of dynamic
measurements.
Condition is the gating parameter range with minimum and maximum values.
System Configuration
Setting up Measurement Points and Alarms
4 - 62 @ptitude Observer 10.2, Revision N User Manual
Max allowed delta is maximum accepted change of the gating parameter during
the measurement. Use this setting to force the system to take data when the
operating mode of the machine is stable which may be the only way to capture the
accurate and trustworthy data.
This is an important setting when performing a process measurement point on
variable speed machines. This is not important for a speed measurement point.
It depends on your application. For example, for measuring bearing temperature,
this function can be deactivated by setting it to 0.
Average is a type of averaging which the system has to perform on the data before
they are stored to the database. For example, for FFT if you select frequency for the average and 4 for the number,
the MasCon/WinCon device will take 4 FFT's, average them and store the averaged
FFT in the database. If you select time synchronous for average, the device will filter
out vibrations that are not synchronous to the speed of the shaft where vibration
data are taken. Note that the trigger speed measurement indication, Trigg. has to
be set in the Associated Measurements of the Acquisition tab settings.
Number is the number of averages that should be taken for the specified average
type selected from the above.
Interval is the desired interval for data capturing. It depends on the application.
Interval alarm is the desired interval for data capturing when the level is in
warning or alarm condition.
System log is a configuration log of all the changes made to the measurement point.
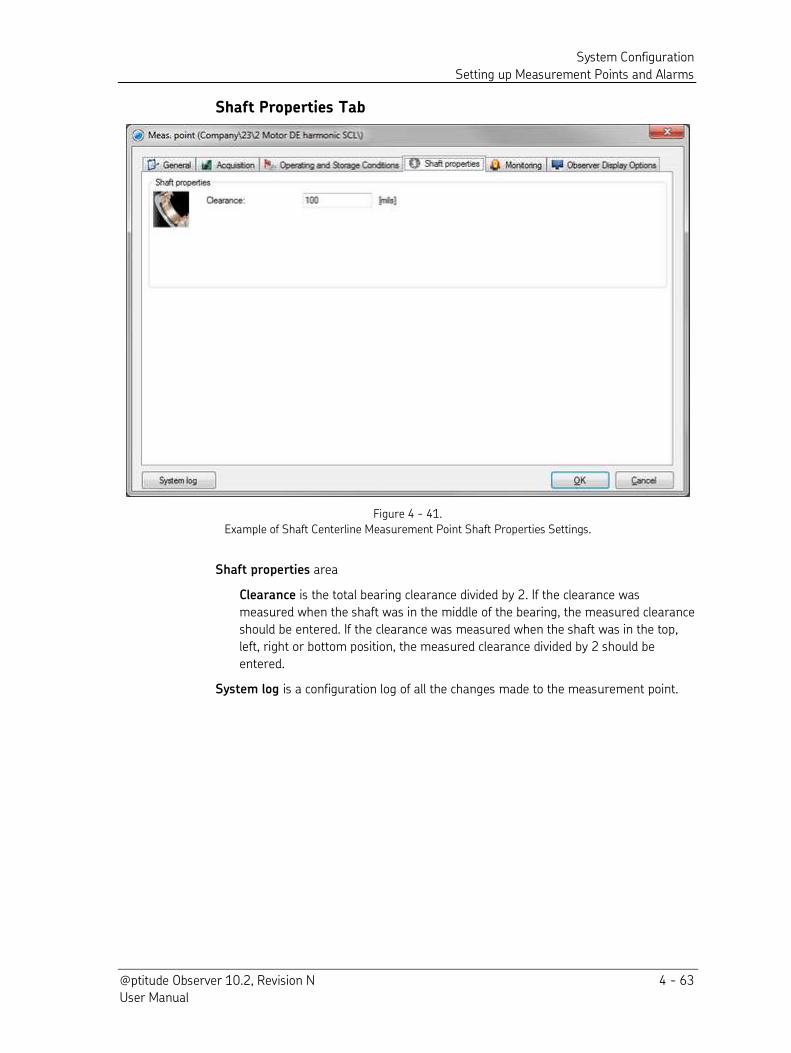
System Configuration
Setting up Measurement Points and Alarms
@ptitude Observer 10.2, Revision N 4 - 63 User Manual
Shaft Properties Tab
Figure 4 - 41.
Example of Shaft Centerline Measurement Point Shaft Properties Settings.
Shaft properties area
Clearance is the total bearing clearance divided by 2. If the clearance was
measured when the shaft was in the middle of the bearing, the measured clearance
should be entered. If the clearance was measured when the shaft was in the top,
left, right or bottom position, the measured clearance divided by 2 should be
entered.
System log is a configuration log of all the changes made to the measurement point.
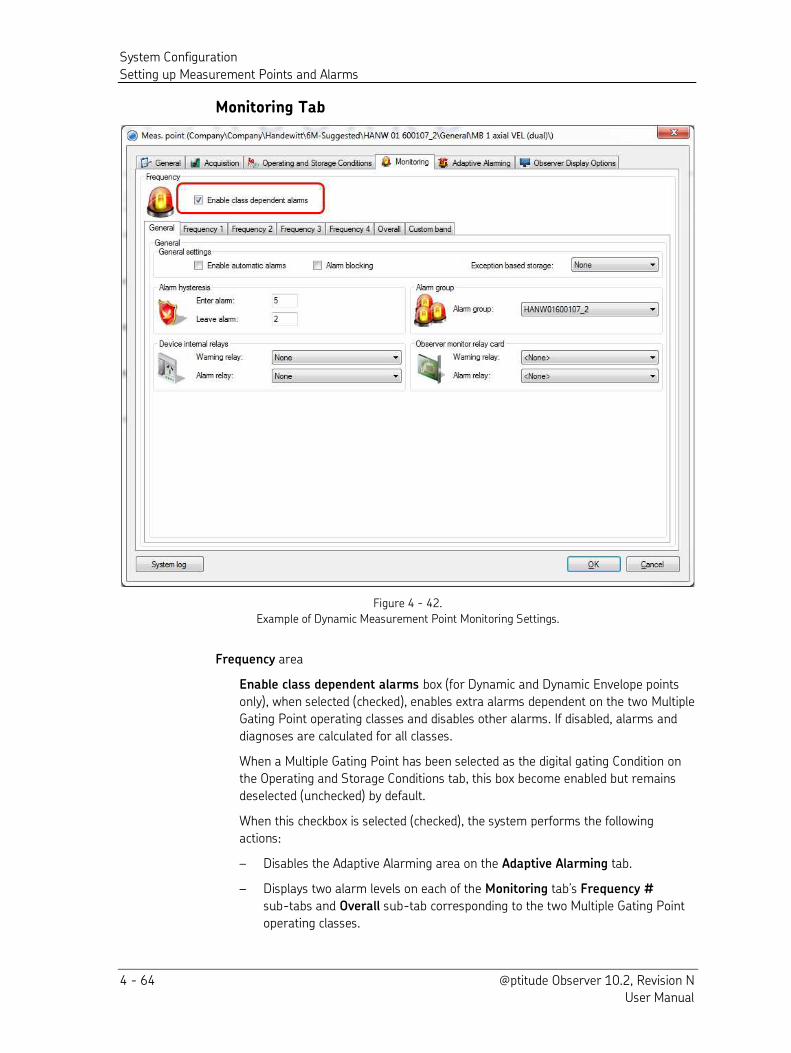
System Configuration
Setting up Measurement Points and Alarms
4 - 64 @ptitude Observer 10.2, Revision N User Manual
Monitoring Tab
Figure 4 - 42.
Example of Dynamic Measurement Point Monitoring Settings.
Frequency area
Enable class dependent alarms box (for Dynamic and Dynamic Envelope points
only), when selected (checked), enables extra alarms dependent on the two Multiple
Gating Point operating classes and disables other alarms. If disabled, alarms and
diagnoses are calculated for all classes.
When a Multiple Gating Point has been selected as the digital gating Condition on
the Operating and Storage Conditions tab, this box become enabled but remains
deselected (unchecked) by default.
When this checkbox is selected (checked), the system performs the following
actions:
– Disables the Adaptive Alarming area on the Adaptive Alarming tab.
– Displays two alarm levels on each of the Monitoring tab’s Frequency #
sub-tabs and Overall sub-tab corresponding to the two Multiple Gating Point
operating classes.
System Configuration
Setting up Measurement Points and Alarms
@ptitude Observer 10.2, Revision N 4 - 65 User Manual
– Disables the Level ctrl checkbox on each of the Monitoring tab’s Frequency #
sub-tabs and Overall sub-tab.
– Disables the Store Delta text box on each of the Monitoring tab’s Frequency
# sub-tabs and Overall sub-tab.
– Disables the Monitoring tab’s Custom Bands sub-tab.
General sub-tab, General settings area
Enable automatic alarms checkbox enables the automatic alarm functionality
when checked.
Automatic alarm enables the measurement point to use automatic levels for the
selected active trend alarms. The system will automatically calculate the alarm and
warning level after a minimum specific number of historical values have been
stored in the database.
For Microlog Analyzer measurement points, the minimum number of trend values
to calculate the automatic alarm levels is five and it will be based on a maximum of
40 measurements. For IMx/MasCon measurement points, the minimum number of
trend values to calculate the automatic alarm levels is 20 and it will be based on a
maximum of 100 measurements.
The calculation algorithm uses a specific number of standard deviations from the
average level to determine the warning level. The number of standard deviations is
determined by Auto alarm setting on the Thresholds tab for Options under
Database in Menu Items. To determine the alarm level the system uses twice as
many standard deviations as for the calculation for the warning level.
When a new trend value is stored in the database, the system always checks if new
automatic alarm levels should be set for the measurement point. Once they are set,
they will not be recalculated again unless the user specifically resets the automatic
alarm levels by editing the measurement point properties or by right-clicking in the
hierarchy and selecting Reset the automatic alarm levels.
When the system has calculated the warning and alarm levels for the active alarms
on a measurement point, the measurement point properties will be updated with
the new levels, and the system log for the measurement point will be updated as
well.
When a new measurement point is created by copying an existing measurement
point with the automatic alarm enabled, the alarm level of the new measurement
point will be set to 0. The automatic alarm for the new measurement point will be
calculated when enough data have been stored for the new measurement point.
Automatic alarm cannot be combined with adaptive alarm.
Alarm blocking is a setting that makes it possible to temporarily disable the alarm
check.
Store delta makes the system to store data if the change of the trended value
(since the last store) exceeds the Store delta value.
Exception based storage is a setting of what to store if the trended values
changes.
System Configuration
Setting up Measurement Points and Alarms
4 - 66 @ptitude Observer 10.2, Revision N User Manual
General sub-tab, Alarm area
This section is to set up the alarm levels for the measurement. Individual alarms can be
disabled as applicable.
High alarm is the status of high alarm which can be enabled or disabled.
High warning is the status of high warning which can be enabled or disabled.
Low warning is the status of low warning which can be enabled or disabled.
Low alarm is the status of low alarm which can be enabled or disabled
Condition triggers the alarm to be raised. The options are none, opened and closed.
General sub-tab, Alarm hysteresis area
This section controls how many times a value can be over and under the alarm limits
before @ptitude Observer goes into or releases the alarm state.
Enter alarm is the number of consecutive measurements that have to be over the
alarm level before an alarm is reported. Default is set to 2.
Leave alarm is the number of times that a value has to be under the alarm level
before @ptitude Observer releases the alarm state. Default is set to 5.
General sub-tab, Alarm group area
It is a setting that makes the system to store data for all the members in the group if
one of the member triggers alarm.
General sub-tab, Device internal relays area
Warning relay on the WindCon/IMx/MasCon device is used when a warning level is
reached. It can be used to trip the machine upon warning.
Alarm relay on the WindCon/IMx/MasCon device is used when an alarm level is
reached. It can be used to trip the machine upon alarm.
General sub-tab, Vector alarming area
Type is a selection of alarm type in the complex plane. This setting can be either
Circular or Sector.
Frequency # sub-tab
Type is the type of frequency band or time waveform component to monitor.
For frequency:
Fixed frequency: monitors a specific frequency with a search area around in
order to trend.
Speed following: monitors specific frequencies related to the speed of the
machine when machine speed varies. It is possible to set up to monitor a
specific gear on the selected machine part by choosing a machine part from the
drop down list.
System Configuration
Setting up Measurement Points and Alarms
@ptitude Observer 10.2, Revision N 4 - 67 User Manual
# x N sub-tab
Level ctrl. triggers the alarm levels to be automatically adjusted according to the
settings and curve information provided in Adaptive Alarming Tab in Setting up
Measurement Points and Alarms.
Channel X Enabled enables the Channel X.
Channel X Warning level / Alarm level sets up normal level alarm warning and
alarm for trends 1 x N, 2 x N, 3 x N and 4 x N.
Overall sub-tab
This section is used for an overall measurement by setting up the system to
display/calculate the value.
Type specifies the method to use to calculate the overall.
Frequency band means that the overall will be calculated from a defined band
on the frequency domain.
TruePtP means that the overall will be calculated from the time waveform
(true peak-peak) and then scaled to RMS, peak or peak-peak (=no scaling)
according to the Trend Configuration settings in the Acquisition tab.
None means the overall is not calculated.
Name is the name of the alarm for the measurement point.
Start is the start frequency of the frequency band to monitor.
Stop is the end frequency of the frequency band to monitor.
Level ctrl. triggers the alarm levels to be automatically adjusted according to the
settings and curve information provided in Adaptive Alarming Tab under Setting up
Measurement Points and Alarms in System Configuration.
Relation indicates a percentage, which means that the system will trigger an alarm if the ratio exceeds the number set in this field. The ratio is calculated by (Total - 1
x N - 2 x N - 3 x N - 4 x N) / Total. Relation alarm monitors the frequencies in
between the frequencies: 1 ´ N, 2 ´ N, 3 ´ N and 4 ´ N, for example, sub
harmonics.
Alarm - Warning level/Alarm level is the warning level/alarm level of the Channel X
alarm.
Custom band sub-tab
Band is the band number.
Name is the name of the band.
Type is the type of frequency or time waveform component to monitor:
Fixed frequency monitors a specific frequency with a search area around in
order to trend.
Frequency band means that the overall will be calculated from a defined band
on the frequency domain.
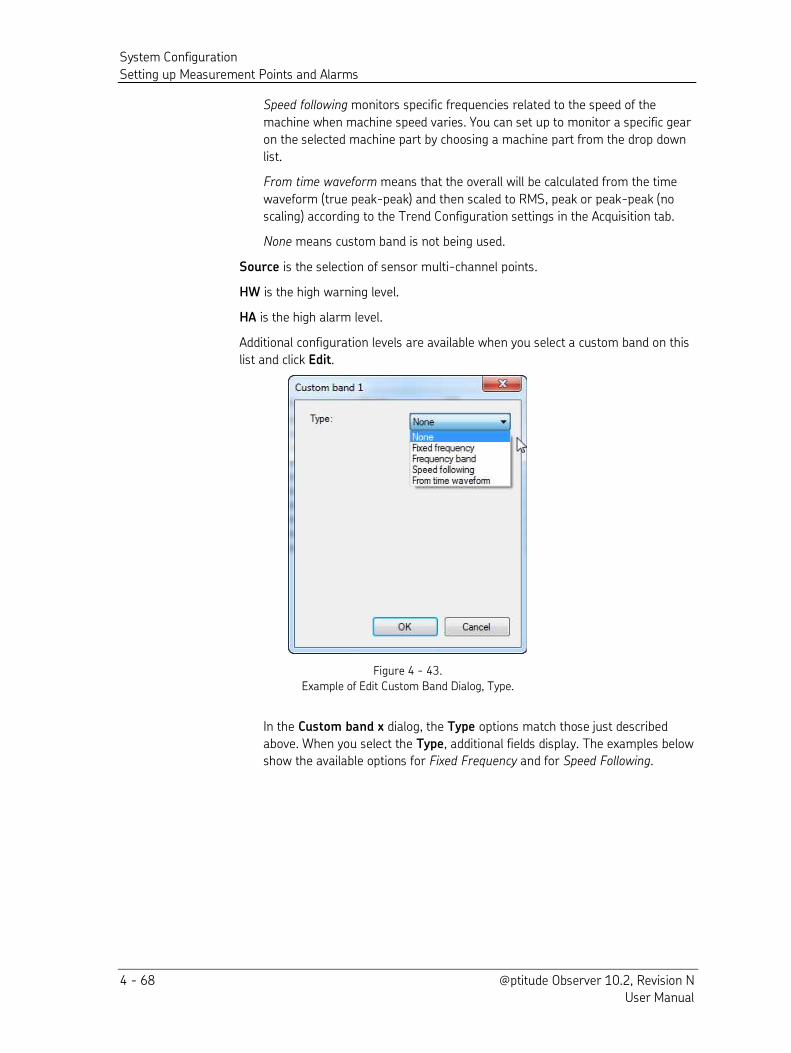
System Configuration
Setting up Measurement Points and Alarms
4 - 68 @ptitude Observer 10.2, Revision N User Manual
Speed following monitors specific frequencies related to the speed of the
machine when machine speed varies. You can set up to monitor a specific gear
on the selected machine part by choosing a machine part from the drop down
list.
From time waveform means that the overall will be calculated from the time
waveform (true peak-peak) and then scaled to RMS, peak or peak-peak (no
scaling) according to the Trend Configuration settings in the Acquisition tab.
None means custom band is not being used.
Source is the selection of sensor multi-channel points.
HW is the high warning level.
HA is the high alarm level.
Additional configuration levels are available when you select a custom band on this
list and click Edit.
Figure 4 - 43.
Example of Edit Custom Band Dialog, Type.
In the Custom band x dialog, the Type options match those just described
above. When you select the Type, additional fields display. The examples below show the available options for Fixed Frequency and for Speed Following.
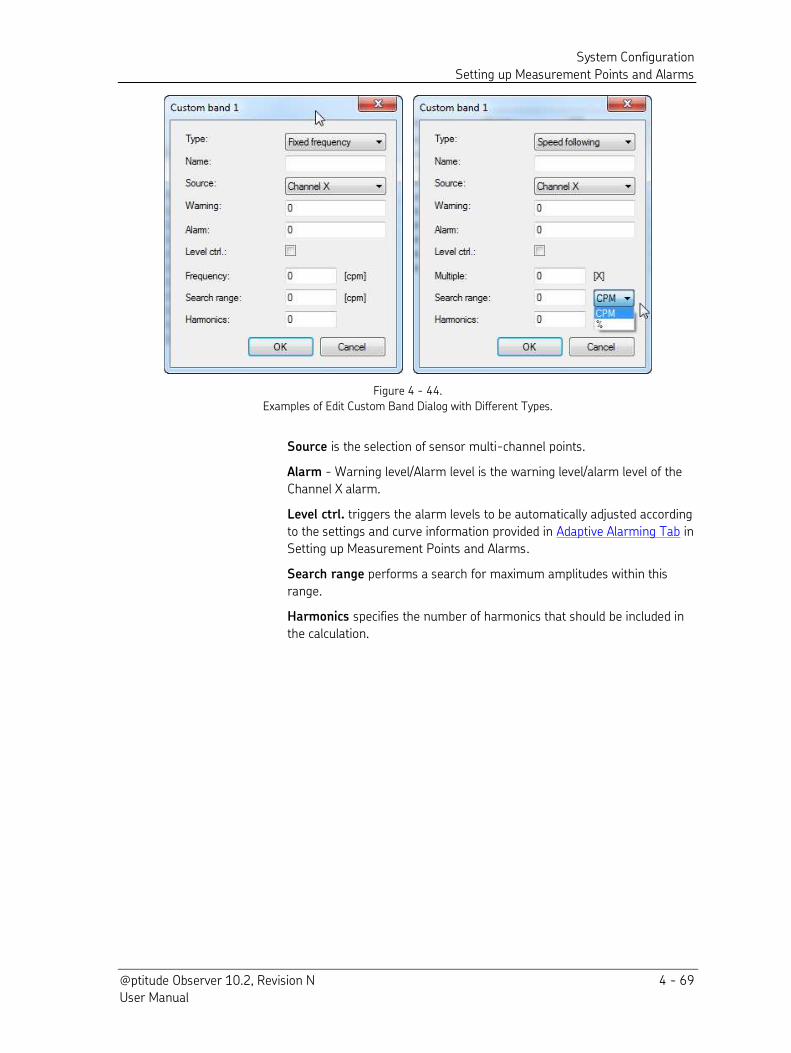
System Configuration
Setting up Measurement Points and Alarms
@ptitude Observer 10.2, Revision N 4 - 69 User Manual
Figure 4 - 44.
Examples of Edit Custom Band Dialog with Different Types.
Source is the selection of sensor multi-channel points.
Alarm - Warning level/Alarm level is the warning level/alarm level of the
Channel X alarm.
Level ctrl. triggers the alarm levels to be automatically adjusted according
to the settings and curve information provided in Adaptive Alarming Tab in
Setting up Measurement Points and Alarms.
Search range performs a search for maximum amplitudes within this
range.
Harmonics specifies the number of harmonics that should be included in
the calculation.
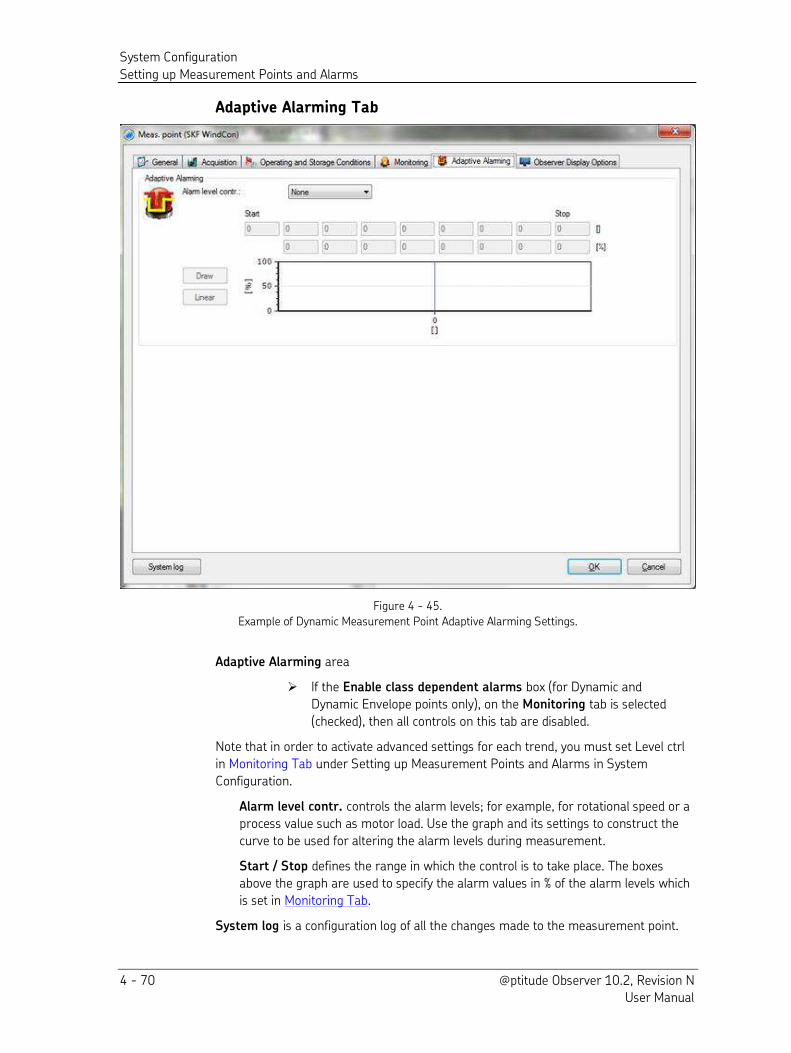
System Configuration
Setting up Measurement Points and Alarms
4 - 70 @ptitude Observer 10.2, Revision N User Manual
Adaptive Alarming Tab
Figure 4 - 45.
Example of Dynamic Measurement Point Adaptive Alarming Settings.
Adaptive Alarming area
If the Enable class dependent alarms box (for Dynamic and
Dynamic Envelope points only), on the Monitoring tab is selected
(checked), then all controls on this tab are disabled.
Note that in order to activate advanced settings for each trend, you must set Level ctrl
in Monitoring Tab under Setting up Measurement Points and Alarms in System
Configuration.
Alarm level contr. controls the alarm levels; for example, for rotational speed or a
process value such as motor load. Use the graph and its settings to construct the
curve to be used for altering the alarm levels during measurement.
Start / Stop defines the range in which the control is to take place. The boxes
above the graph are used to specify the alarm values in % of the alarm levels which
is set in Monitoring Tab.
System log is a configuration log of all the changes made to the measurement point.
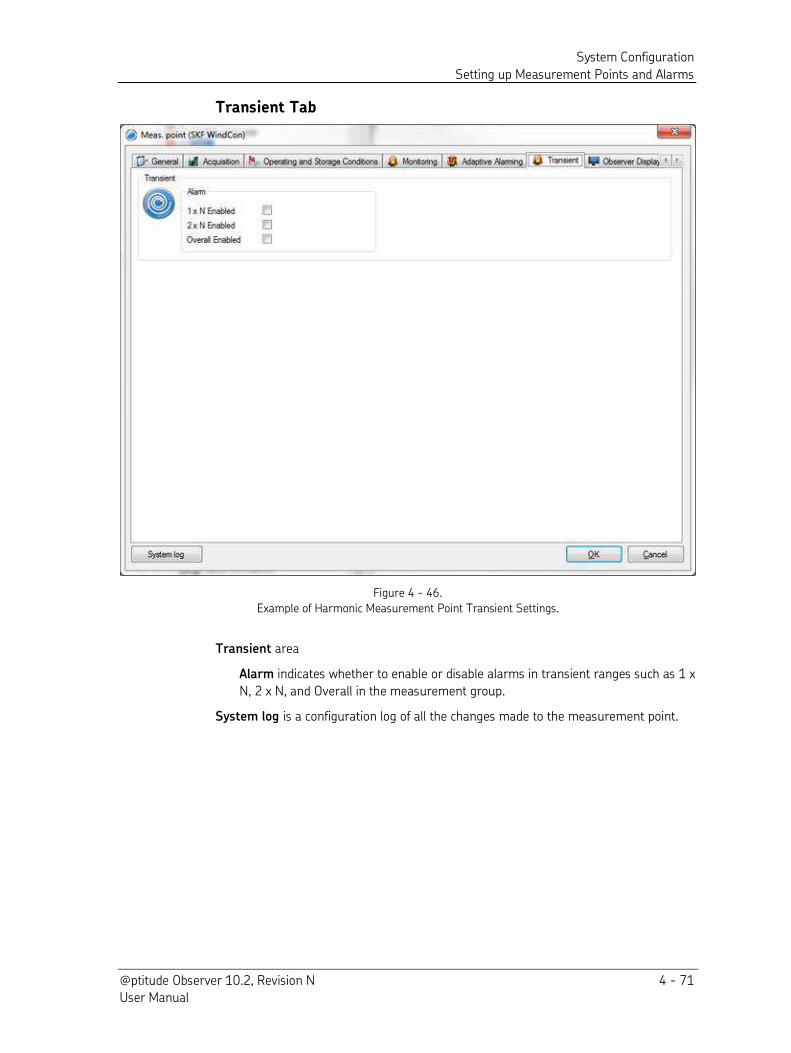
System Configuration
Setting up Measurement Points and Alarms
@ptitude Observer 10.2, Revision N 4 - 71 User Manual
Transient Tab
Figure 4 - 46.
Example of Harmonic Measurement Point Transient Settings.
Transient area
Alarm indicates whether to enable or disable alarms in transient ranges such as 1 x
N, 2 x N, and Overall in the measurement group.
System log is a configuration log of all the changes made to the measurement point.
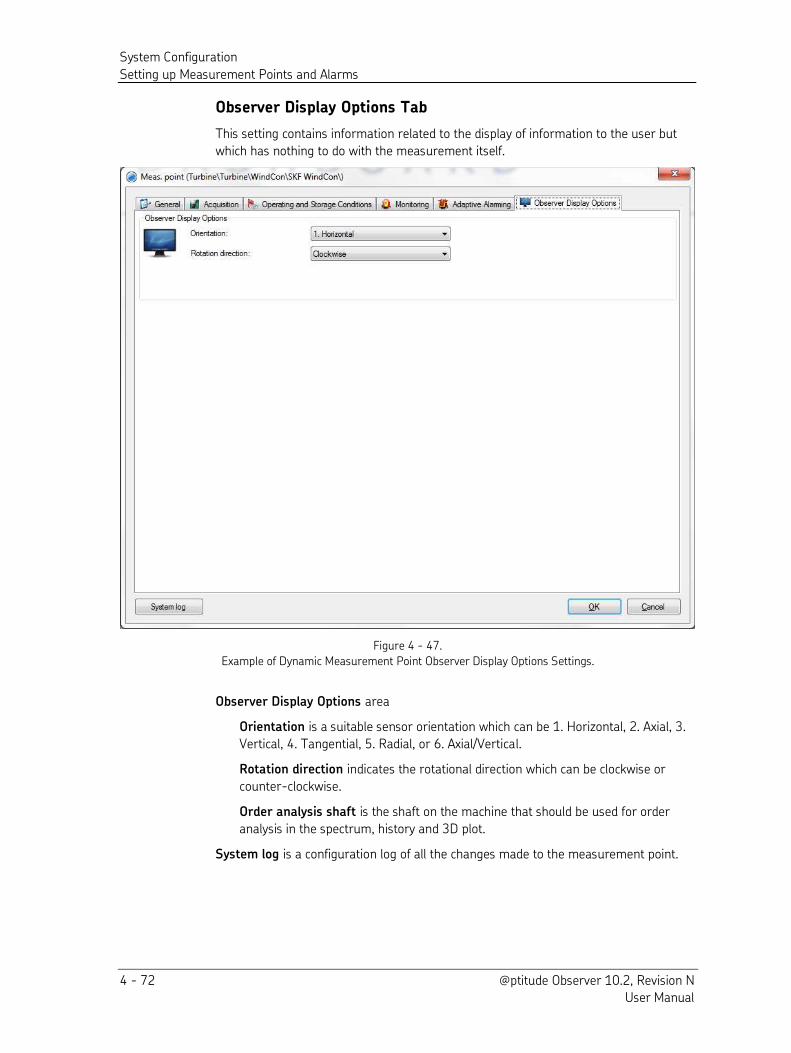
System Configuration
Setting up Measurement Points and Alarms
4 - 72 @ptitude Observer 10.2, Revision N User Manual
Observer Display Options Tab
This setting contains information related to the display of information to the user but
which has nothing to do with the measurement itself.
Figure 4 - 47.
Example of Dynamic Measurement Point Observer Display Options Settings.
Observer Display Options area
Orientation is a suitable sensor orientation which can be 1. Horizontal, 2. Axial, 3.
Vertical, 4. Tangential, 5. Radial, or 6. Axial/Vertical.
Rotation direction indicates the rotational direction which can be clockwise or
counter-clockwise.
Order analysis shaft is the shaft on the machine that should be used for order
analysis in the spectrum, history and 3D plot.
System log is a configuration log of all the changes made to the measurement point.
System Configuration
Setting up Measurement Points and Alarms
@ptitude Observer 10.2, Revision N 4 - 73 User Manual
About Multiple Gating Points
A Multiple Gating Point (MGP) is an @ptitude Observer measurement that references
values from up to five other points and then performs a logical evaluation on the
current measurements to determine if the IMx should take measurements. Each
reference point has two distinct gating conditions, Operating Class 1 or Operating Class
2, with the point output determined by which set of the two gating conditions is set to
TRUE. These reference measurements can include process, speed, and digital
measurements.
The display name of the operating classes can be edited on Database > Options, Data
tab.
To create an MGP:
Within the Hierarchy view, right-click on the machine or sub machine to which you
intend to add the MGP and select Add > Meas. point from the resulting context
menu. The New meas. point screen appears.
Click on the IMx device option on the left side of the screen.
The measurement point type options available vary depending on
the device selected.
Click on the Multiple Gating, Process measurement point option and click OK (or
double-click on the Multiple Gating, Process option). A new Meas. point screen
appears with the General tab displayed.
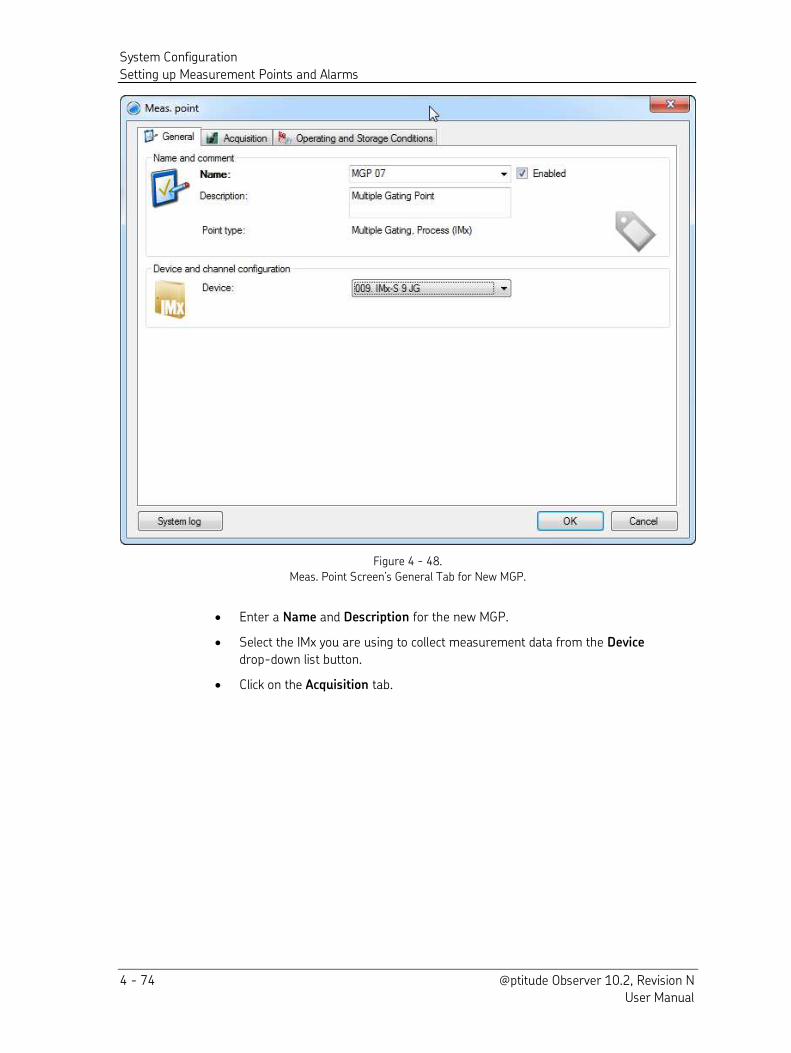
System Configuration
Setting up Measurement Points and Alarms
4 - 74 @ptitude Observer 10.2, Revision N User Manual
Figure 4 - 48.
Meas. Point Screen’s General Tab for New MGP.
Enter a Name and Description for the new MGP.
Select the IMx you are using to collect measurement data from the Device
drop-down list button.
Click on the Acquisition tab.
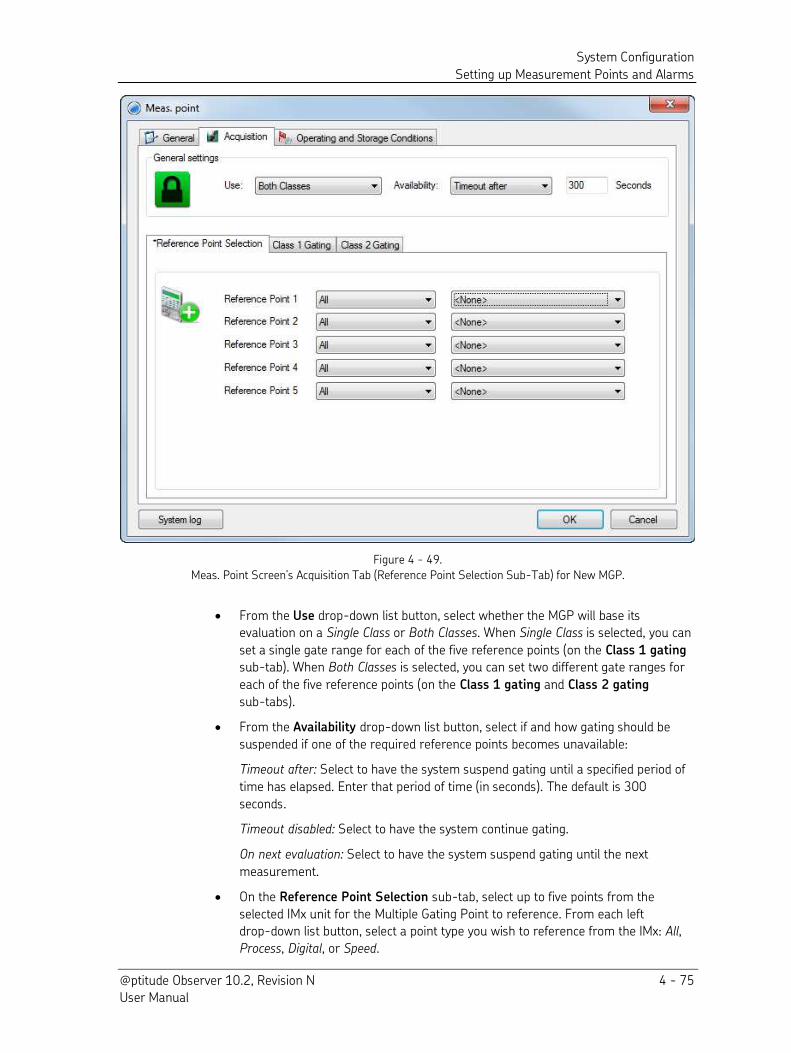
System Configuration
Setting up Measurement Points and Alarms
@ptitude Observer 10.2, Revision N 4 - 75 User Manual
Figure 4 - 49.
Meas. Point Screen’s Acquisition Tab (Reference Point Selection Sub-Tab) for New MGP.
From the Use drop-down list button, select whether the MGP will base its evaluation on a Single Class or Both Classes. When Single Class is selected, you can
set a single gate range for each of the five reference points (on the Class 1 gating sub-tab). When Both Classes is selected, you can set two different gate ranges for
each of the five reference points (on the Class 1 gating and Class 2 gating
sub-tabs).
From the Availability drop-down list button, select if and how gating should be
suspended if one of the required reference points becomes unavailable:
Timeout after: Select to have the system suspend gating until a specified period of
time has elapsed. Enter that period of time (in seconds). The default is 300
seconds.
Timeout disabled: Select to have the system continue gating.
On next evaluation: Select to have the system suspend gating until the next
measurement.
On the Reference Point Selection sub-tab, select up to five points from the
selected IMx unit for the Multiple Gating Point to reference. From each left drop-down list button, select a point type you wish to reference from the IMx: All,
Process, Digital, or Speed.
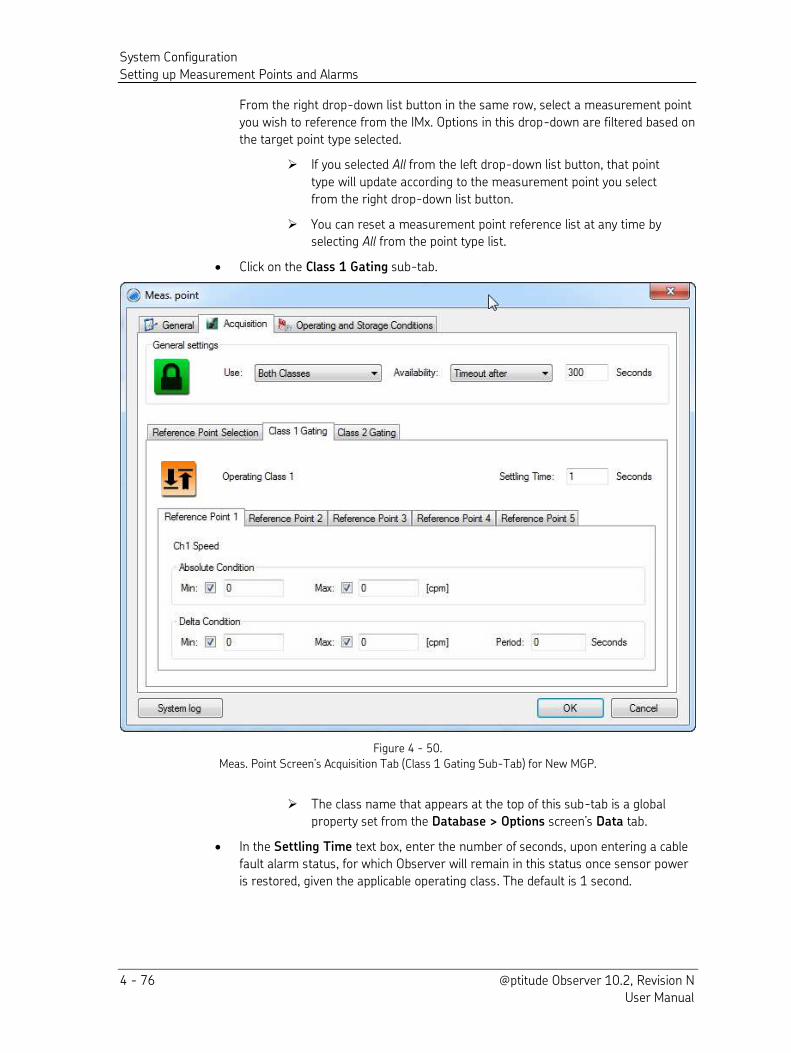
System Configuration
Setting up Measurement Points and Alarms
4 - 76 @ptitude Observer 10.2, Revision N User Manual
From the right drop-down list button in the same row, select a measurement point
you wish to reference from the IMx. Options in this drop-down are filtered based on
the target point type selected.
If you selected All from the left drop-down list button, that point
type will update according to the measurement point you select
from the right drop-down list button.
You can reset a measurement point reference list at any time by selecting All from the point type list.
Click on the Class 1 Gating sub-tab.
Figure 4 - 50.
Meas. Point Screen’s Acquisition Tab (Class 1 Gating Sub-Tab) for New MGP.
The class name that appears at the top of this sub-tab is a global
property set from the Database > Options screen’s Data tab.
In the Settling Time text box, enter the number of seconds, upon entering a cable
fault alarm status, for which Observer will remain in this status once sensor power
is restored, given the applicable operating class. The default is 1 second.
System Configuration
Setting up Measurement Points and Alarms
@ptitude Observer 10.2, Revision N 4 - 77 User Manual
On the Reference Point 1 sub-tab, select the gating conditions for that reference
point:
– Select (check) the Min and/or Max checkbox(es) and then enter a value or
values to set an Absolute condition gating parameter range.
If either value must be a negative number, include a minus sign
(-) before the number.
If both Min and Max are selected, the gating parameter range
falls between the two. If either is not selected, the range extends
infinitely in that direction.
– Select (check) the Min and/or Max checkbox(es) and then enter a value or
values to set a Delta condition permitted parameter change range.
If either value must be a negative number, include a minus sign
(-) before the number.
If both Min and Max are selected, the accepted gating parameter
change range falls between the two. If either is not selected, the
range extends infinitely in that direction. If neither is selected,
there is no accepted gating parameter change range.
– Enter the Period, in seconds (up to 60), for which the system must check the
Delta Condition thresholds.
Delta Condition Period is disabled if both the Min and Max
checkboxes are deselected (unchecked).
Continue selecting gating conditions for the other reference points on their
respective tabs, as appropriate.
These sub-tabs are enabled for assigned reference points only.
If appropriate, click on the Class 2 Gating tab to assign a Settling Time and select
gating conditions for the reference points, for that class.
Important - One or more of the reference point gating ranges (conditions) must be different between two classes.
Digital point example, Acquisition tab
You may want to have digital point gating in one class but not in the other class. A
Condition checkbox is provided for each Reference Point sub-tab on the Class 1
Gating and Class 2 Gating tabs.
When the Condition checkbox is not selected, the condition is excluded from the MGP
evaluation without de-referencing the digital point in the Reference Point Selection tab.
When the Condition checkbox is selected, a drop down combo box displays to its right, with the options Open or Closed for the digital parameter.
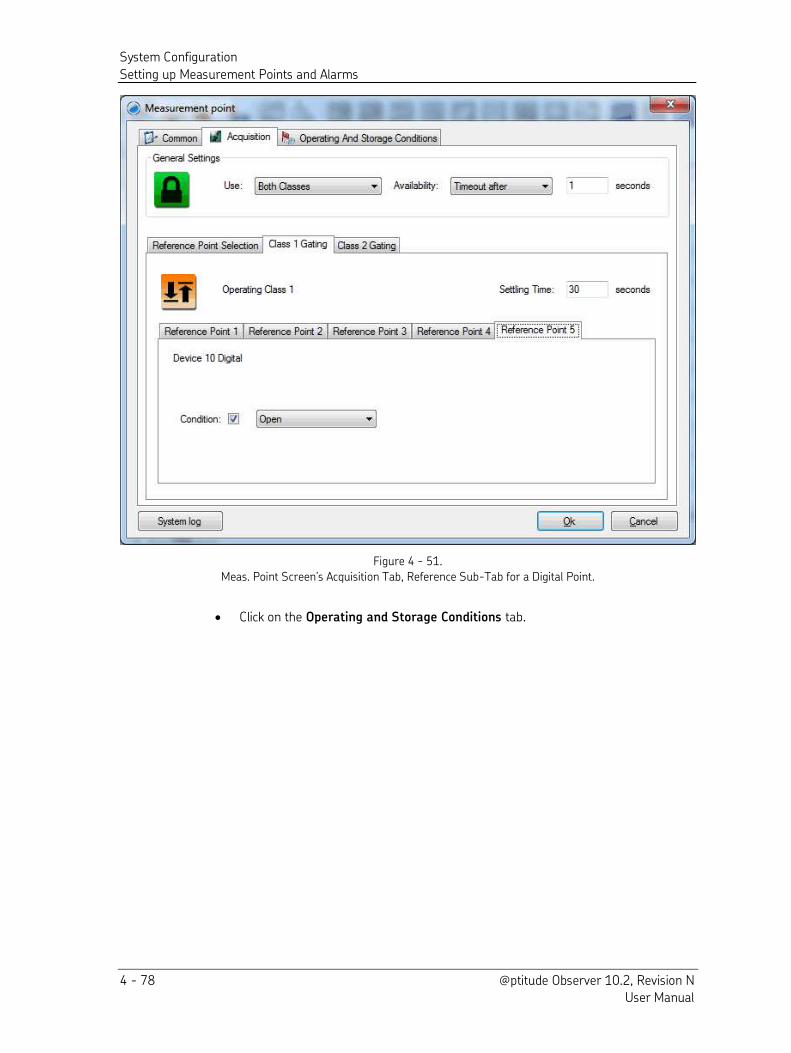
System Configuration
Setting up Measurement Points and Alarms
4 - 78 @ptitude Observer 10.2, Revision N User Manual
Figure 4 - 51.
Meas. Point Screen’s Acquisition Tab, Reference Sub-Tab for a Digital Point.
Click on the Operating and Storage Conditions tab.
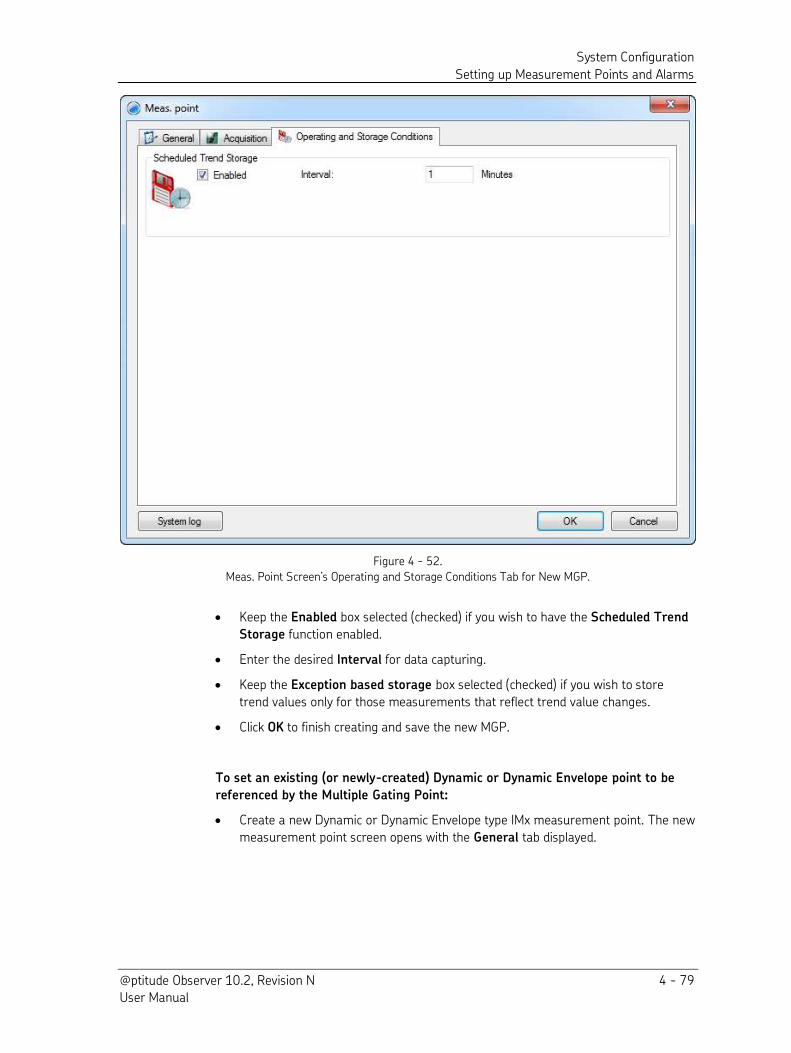
System Configuration
Setting up Measurement Points and Alarms
@ptitude Observer 10.2, Revision N 4 - 79 User Manual
Figure 4 - 52.
Meas. Point Screen’s Operating and Storage Conditions Tab for New MGP.
Keep the Enabled box selected (checked) if you wish to have the Scheduled Trend
Storage function enabled.
Enter the desired Interval for data capturing.
Keep the Exception based storage box selected (checked) if you wish to store
trend values only for those measurements that reflect trend value changes.
Click OK to finish creating and save the new MGP.
To set an existing (or newly-created) Dynamic or Dynamic Envelope point to be
referenced by the Multiple Gating Point:
Create a new Dynamic or Dynamic Envelope type IMx measurement point. The new
measurement point screen opens with the General tab displayed.
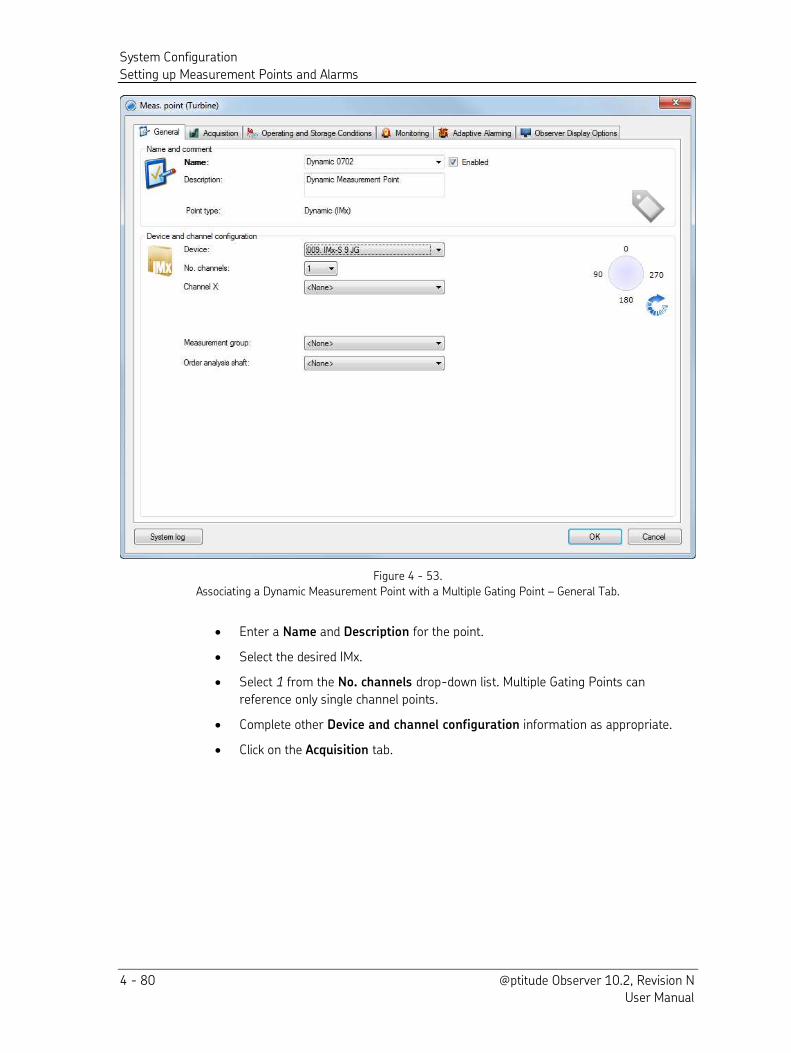
System Configuration
Setting up Measurement Points and Alarms
4 - 80 @ptitude Observer 10.2, Revision N User Manual
Figure 4 - 53.
Associating a Dynamic Measurement Point with a Multiple Gating Point – General Tab.
Enter a Name and Description for the point.
Select the desired IMx.
Select 1 from the No. channels drop-down list. Multiple Gating Points can
reference only single channel points.
Complete other Device and channel configuration information as appropriate.
Click on the Acquisition tab.
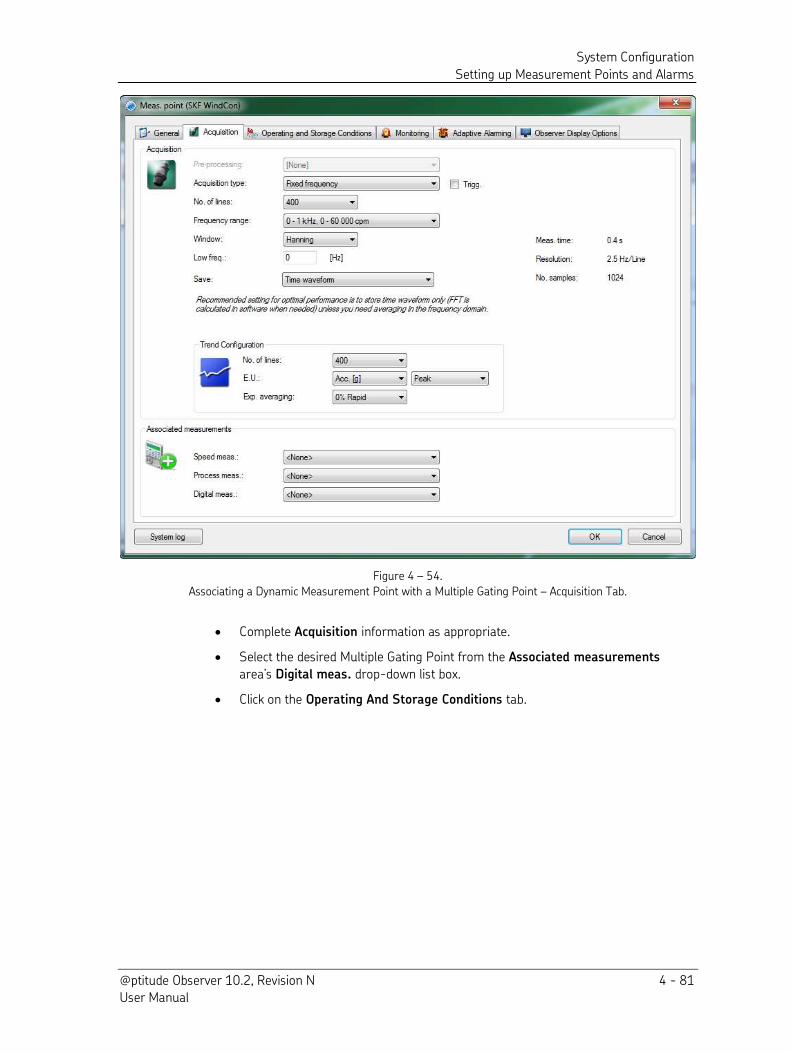
System Configuration
Setting up Measurement Points and Alarms
@ptitude Observer 10.2, Revision N 4 - 81 User Manual
Figure 4 – 54.
Associating a Dynamic Measurement Point with a Multiple Gating Point – Acquisition Tab.
Complete Acquisition information as appropriate.
Select the desired Multiple Gating Point from the Associated measurements
area’s Digital meas. drop-down list box.
Click on the Operating And Storage Conditions tab.
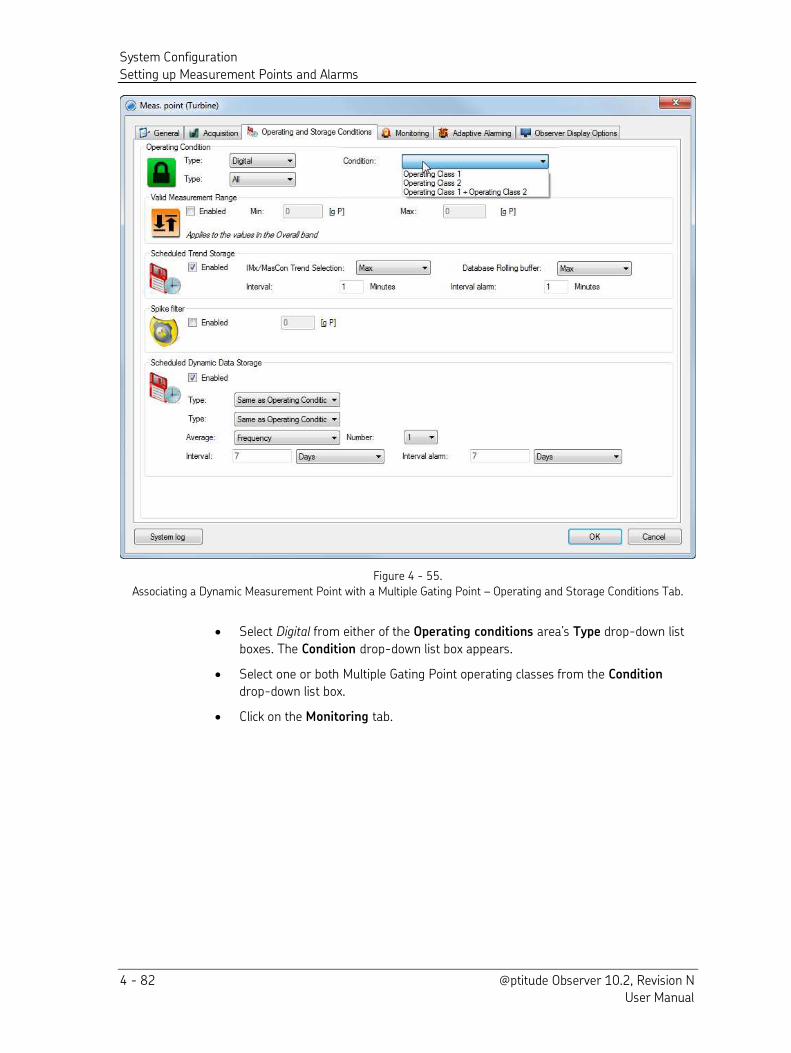
System Configuration
Setting up Measurement Points and Alarms
4 - 82 @ptitude Observer 10.2, Revision N User Manual
Figure 4 - 55.
Associating a Dynamic Measurement Point with a Multiple Gating Point – Operating and Storage Conditions Tab.
Select Digital from either of the Operating conditions area’s Type drop-down list
boxes. The Condition drop-down list box appears.
Select one or both Multiple Gating Point operating classes from the Condition
drop-down list box.
Click on the Monitoring tab.
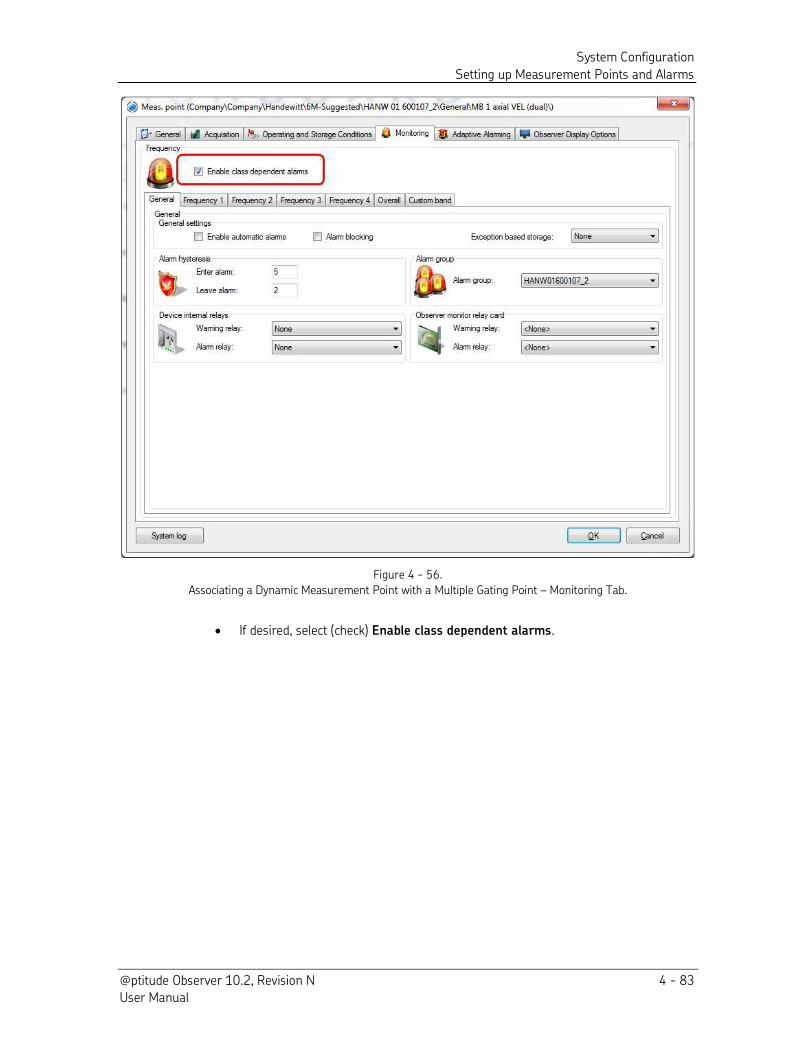
System Configuration
Setting up Measurement Points and Alarms
@ptitude Observer 10.2, Revision N 4 - 83 User Manual
Figure 4 - 56.
Associating a Dynamic Measurement Point with a Multiple Gating Point – Monitoring Tab.
If desired, select (check) Enable class dependent alarms.
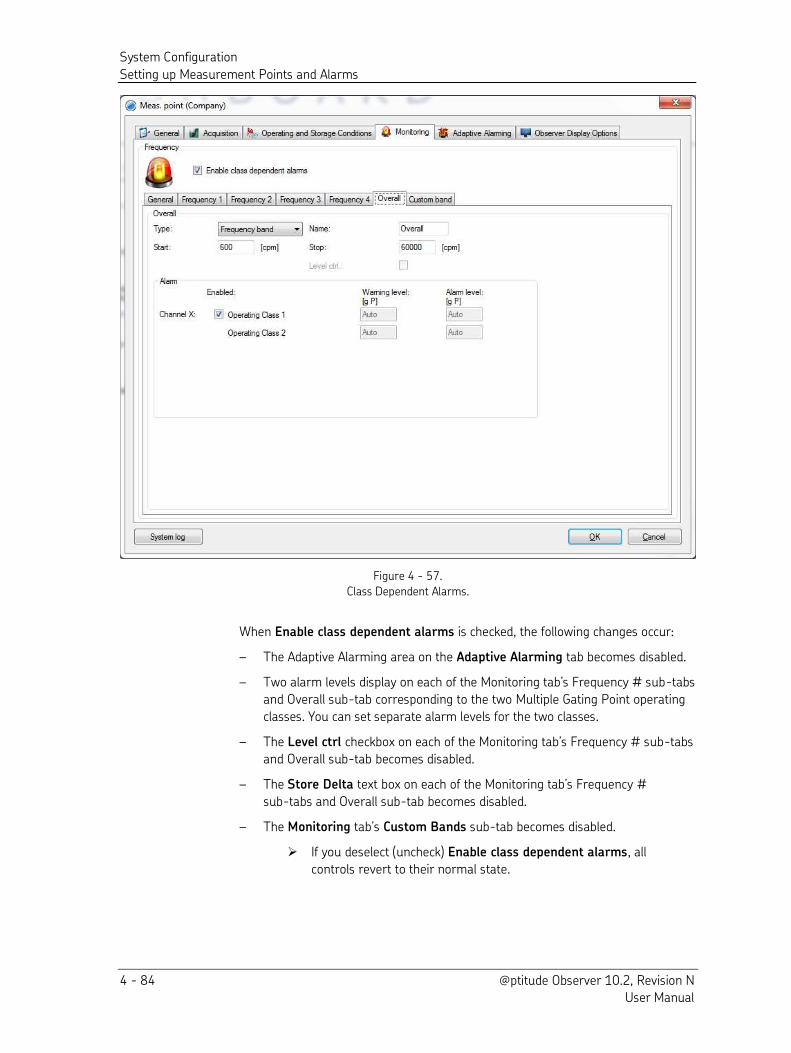
System Configuration
Setting up Measurement Points and Alarms
4 - 84 @ptitude Observer 10.2, Revision N User Manual
Figure 4 - 57.
Class Dependent Alarms.
When Enable class dependent alarms is checked, the following changes occur:
– The Adaptive Alarming area on the Adaptive Alarming tab becomes disabled.
– Two alarm levels display on each of the Monitoring tab’s Frequency # sub-tabs
and Overall sub-tab corresponding to the two Multiple Gating Point operating
classes. You can set separate alarm levels for the two classes.
– The Level ctrl checkbox on each of the Monitoring tab’s Frequency # sub-tabs
and Overall sub-tab becomes disabled.
– The Store Delta text box on each of the Monitoring tab’s Frequency #
sub-tabs and Overall sub-tab becomes disabled.
– The Monitoring tab’s Custom Bands sub-tab becomes disabled.
If you deselect (uncheck) Enable class dependent alarms, all
controls revert to their normal state.
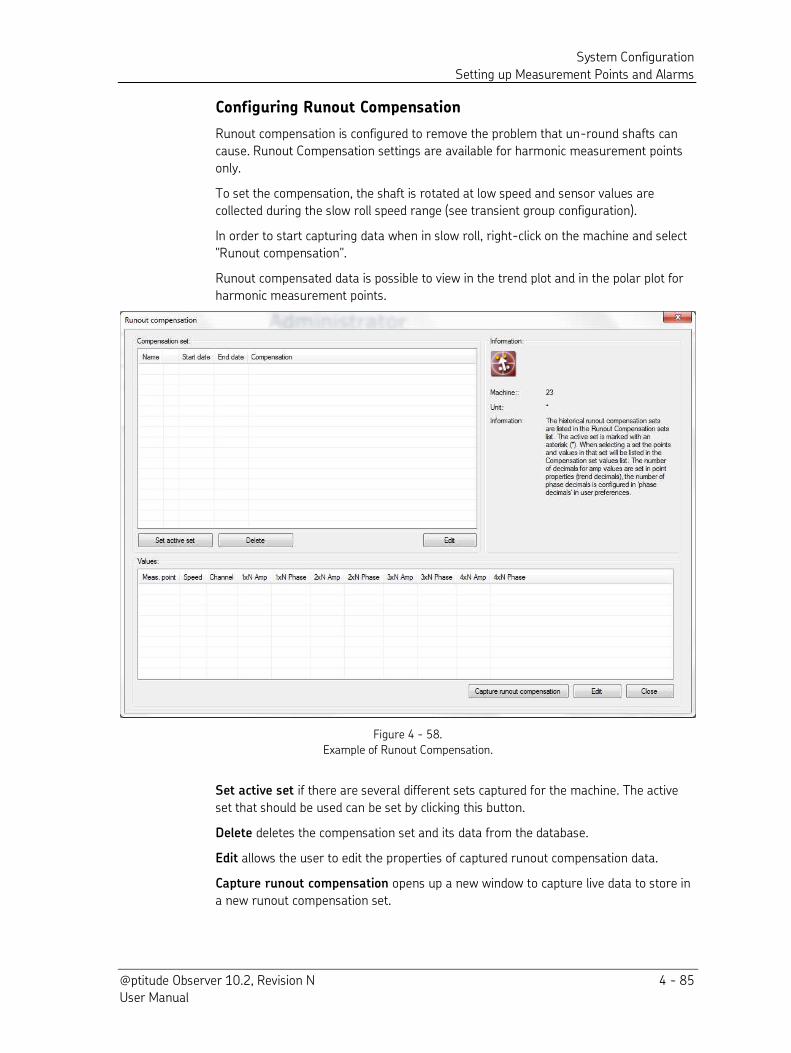
System Configuration
Setting up Measurement Points and Alarms
@ptitude Observer 10.2, Revision N 4 - 85 User Manual
Configuring Runout Compensation
Runout compensation is configured to remove the problem that un-round shafts can
cause. Runout Compensation settings are available for harmonic measurement points
only.
To set the compensation, the shaft is rotated at low speed and sensor values are
collected during the slow roll speed range (see transient group configuration).
In order to start capturing data when in slow roll, right-click on the machine and select
"Runout compensation".
Runout compensated data is possible to view in the trend plot and in the polar plot for
harmonic measurement points.
Figure 4 - 58.
Example of Runout Compensation.
Set active set if there are several different sets captured for the machine. The active
set that should be used can be set by clicking this button.
Delete deletes the compensation set and its data from the database.
Edit allows the user to edit the properties of captured runout compensation data.
Capture runout compensation opens up a new window to capture live data to store in
a new runout compensation set.
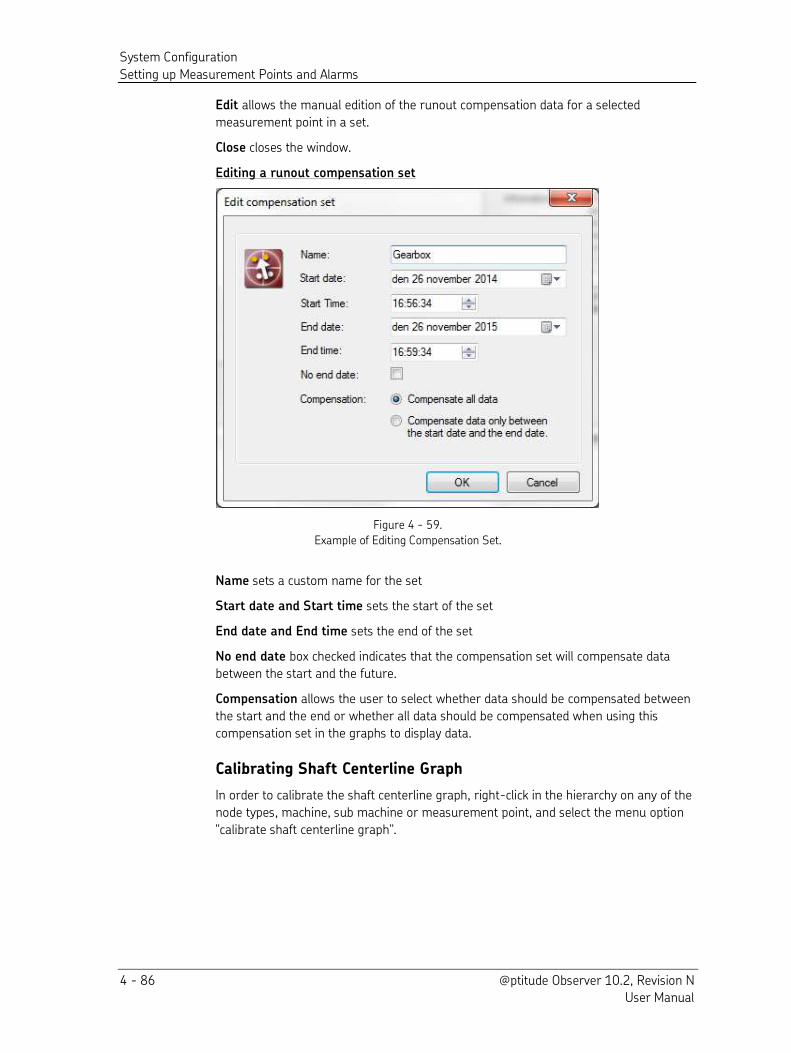
System Configuration
Setting up Measurement Points and Alarms
4 - 86 @ptitude Observer 10.2, Revision N User Manual
Edit allows the manual edition of the runout compensation data for a selected
measurement point in a set.
Close closes the window.
Editing a runout compensation set
Figure 4 - 59.
Example of Editing Compensation Set.
Name sets a custom name for the set
Start date and Start time sets the start of the set
End date and End time sets the end of the set
No end date box checked indicates that the compensation set will compensate data
between the start and the future.
Compensation allows the user to select whether data should be compensated between
the start and the end or whether all data should be compensated when using this
compensation set in the graphs to display data.
Calibrating Shaft Centerline Graph
In order to calibrate the shaft centerline graph, right-click in the hierarchy on any of the
node types, machine, sub machine or measurement point, and select the menu option
"calibrate shaft centerline graph".
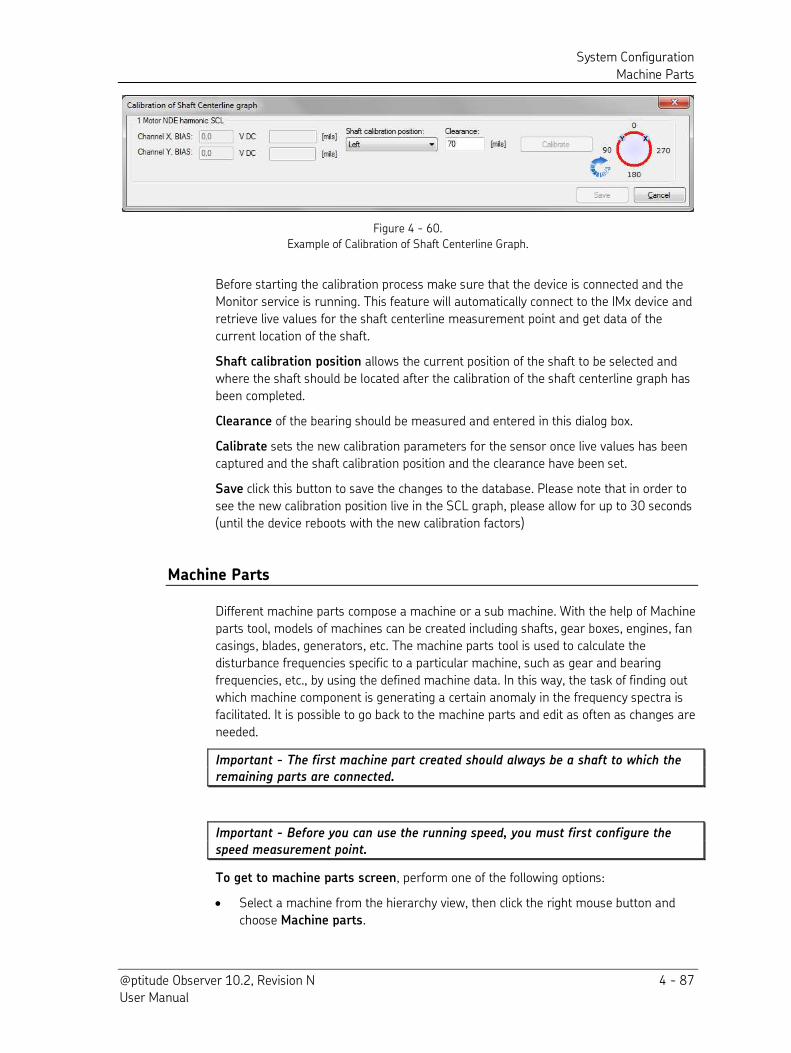
System Configuration
Machine Parts
@ptitude Observer 10.2, Revision N 4 - 87 User Manual
Figure 4 - 60.
Example of Calibration of Shaft Centerline Graph.
Before starting the calibration process make sure that the device is connected and the
Monitor service is running. This feature will automatically connect to the IMx device and
retrieve live values for the shaft centerline measurement point and get data of the
current location of the shaft.
Shaft calibration position allows the current position of the shaft to be selected and
where the shaft should be located after the calibration of the shaft centerline graph has
been completed.
Clearance of the bearing should be measured and entered in this dialog box.
Calibrate sets the new calibration parameters for the sensor once live values has been
captured and the shaft calibration position and the clearance have been set.
Save click this button to save the changes to the database. Please note that in order to
see the new calibration position live in the SCL graph, please allow for up to 30 seconds
(until the device reboots with the new calibration factors)
Machine Parts
Different machine parts compose a machine or a sub machine. With the help of Machine
parts tool, models of machines can be created including shafts, gear boxes, engines, fan
casings, blades, generators, etc. The machine parts tool is used to calculate the
disturbance frequencies specific to a particular machine, such as gear and bearing
frequencies, etc., by using the defined machine data. In this way, the task of finding out
which machine component is generating a certain anomaly in the frequency spectra is
facilitated. It is possible to go back to the machine parts and edit as often as changes are
needed.
Important - The first machine part created should always be a shaft to which the remaining parts are connected.
Important - Before you can use the running speed, you must first configure the
speed measurement point.
To get to machine parts screen, perform one of the following options:
Select a machine from the hierarchy view, then click the right mouse button and
choose Machine parts.
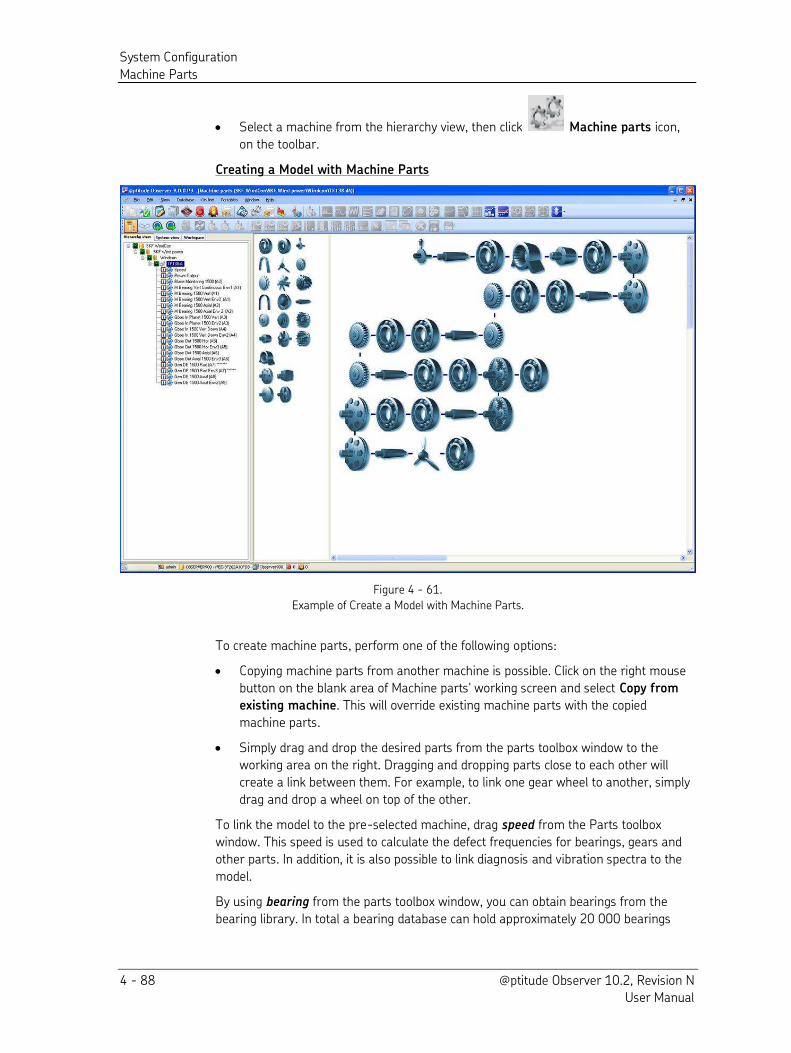
System Configuration
Machine Parts
4 - 88 @ptitude Observer 10.2, Revision N User Manual
Select a machine from the hierarchy view, then click Machine parts icon,
on the toolbar.
Creating a Model with Machine Parts
Figure 4 - 61.
Example of Create a Model with Machine Parts.
To create machine parts, perform one of the following options:
Copying machine parts from another machine is possible. Click on the right mouse
button on the blank area of Machine parts' working screen and select Copy from
existing machine. This will override existing machine parts with the copied
machine parts.
Simply drag and drop the desired parts from the parts toolbox window to the
working area on the right. Dragging and dropping parts close to each other will
create a link between them. For example, to link one gear wheel to another, simply
drag and drop a wheel on top of the other.
To link the model to the pre-selected machine, drag speed from the Parts toolbox
window. This speed is used to calculate the defect frequencies for bearings, gears and
other parts. In addition, it is also possible to link diagnosis and vibration spectra to the
model.
By using bearing from the parts toolbox window, you can obtain bearings from the
bearing library. In total a bearing database can hold approximately 20 000 bearings
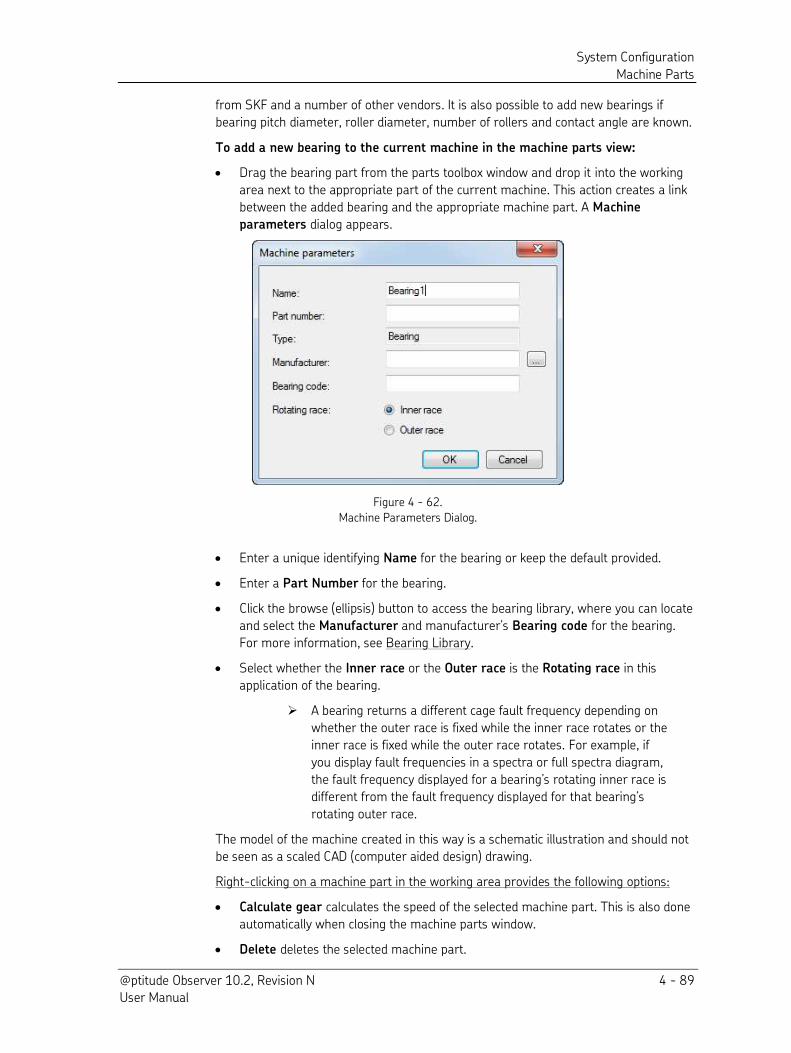
System Configuration
Machine Parts
@ptitude Observer 10.2, Revision N 4 - 89 User Manual
from SKF and a number of other vendors. It is also possible to add new bearings if
bearing pitch diameter, roller diameter, number of rollers and contact angle are known.
To add a new bearing to the current machine in the machine parts view:
Drag the bearing part from the parts toolbox window and drop it into the working
area next to the appropriate part of the current machine. This action creates a link
between the added bearing and the appropriate machine part. A Machine
parameters dialog appears.
Figure 4 - 62.
Machine Parameters Dialog.
Enter a unique identifying Name for the bearing or keep the default provided.
Enter a Part Number for the bearing.
Click the browse (ellipsis) button to access the bearing library, where you can locate
and select the Manufacturer and manufacturer’s Bearing code for the bearing.
For more information, see Bearing Library.
Select whether the Inner race or the Outer race is the Rotating race in this
application of the bearing.
A bearing returns a different cage fault frequency depending on
whether the outer race is fixed while the inner race rotates or the
inner race is fixed while the outer race rotates. For example, if
you display fault frequencies in a spectra or full spectra diagram,
the fault frequency displayed for a bearing’s rotating inner race is different from the fault frequency displayed for that bearing’s rotating outer race.
The model of the machine created in this way is a schematic illustration and should not
be seen as a scaled CAD (computer aided design) drawing.
Right-clicking on a machine part in the working area provides the following options:
Calculate gear calculates the speed of the selected machine part. This is also done
automatically when closing the machine parts window.
Delete deletes the selected machine part.
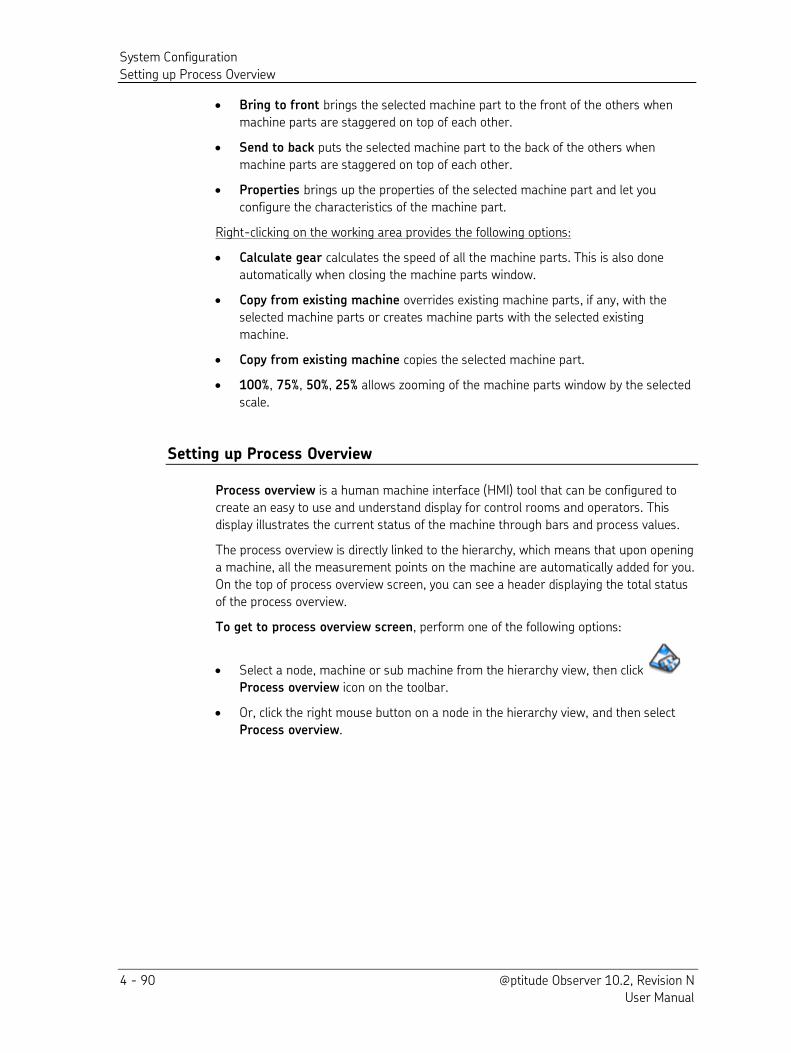
System Configuration
Setting up Process Overview
4 - 90 @ptitude Observer 10.2, Revision N User Manual
Bring to front brings the selected machine part to the front of the others when
machine parts are staggered on top of each other.
Send to back puts the selected machine part to the back of the others when
machine parts are staggered on top of each other.
Properties brings up the properties of the selected machine part and let you
configure the characteristics of the machine part.
Right-clicking on the working area provides the following options:
Calculate gear calculates the speed of all the machine parts. This is also done
automatically when closing the machine parts window.
Copy from existing machine overrides existing machine parts, if any, with the
selected machine parts or creates machine parts with the selected existing
machine.
Copy from existing machine copies the selected machine part.
100%, 75%, 50%, 25% allows zooming of the machine parts window by the selected
scale.
Setting up Process Overview
Process overview is a human machine interface (HMI) tool that can be configured to
create an easy to use and understand display for control rooms and operators. This
display illustrates the current status of the machine through bars and process values.
The process overview is directly linked to the hierarchy, which means that upon opening
a machine, all the measurement points on the machine are automatically added for you.
On the top of process overview screen, you can see a header displaying the total status
of the process overview.
To get to process overview screen, perform one of the following options:
Select a node, machine or sub machine from the hierarchy view, then click
Process overview icon on the toolbar.
Or, click the right mouse button on a node in the hierarchy view, and then select
Process overview.
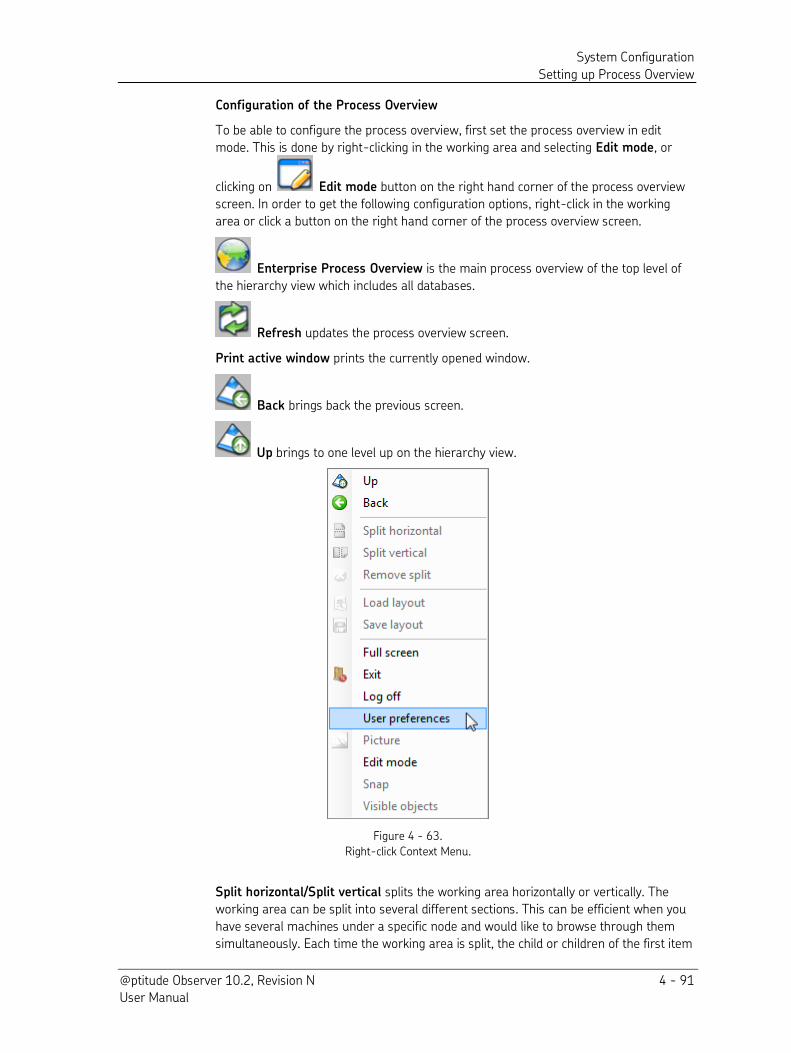
System Configuration
Setting up Process Overview
@ptitude Observer 10.2, Revision N 4 - 91 User Manual
Configuration of the Process Overview
To be able to configure the process overview, first set the process overview in edit
mode. This is done by right-clicking in the working area and selecting Edit mode, or
clicking on Edit mode button on the right hand corner of the process overview
screen. In order to get the following configuration options, right-click in the working
area or click a button on the right hand corner of the process overview screen.
Enterprise Process Overview is the main process overview of the top level of
the hierarchy view which includes all databases.
Refresh updates the process overview screen.
Print active window prints the currently opened window.
Back brings back the previous screen.
Up brings to one level up on the hierarchy view.
Figure 4 - 63.
Right-click Context Menu.
Split horizontal/Split vertical splits the working area horizontally or vertically. The
working area can be split into several different sections. This can be efficient when you
have several machines under a specific node and would like to browse through them
simultaneously. Each time the working area is split, the child or children of the first item
System Configuration
Setting up Process Overview
4 - 92 @ptitude Observer 10.2, Revision N User Manual
of the screen in where the split command was issued appear in the newly opened
screen.
Remove split removes split screen(s).
Load layout loads a layout from the layout list.
Save layout enables you to save, delete or rename an item from the layout list.
Full screen toggles between full screen mode and partial screen mode.
Exit ends process view.
Log off enables you to switch your user type at logon without exiting the application.
You can log off and the Logon dialog opens automatically. Log on as a different type of
user, such as Admin, to perform your tasks. Error! Bookmark not defined.
User preferences opens the User Preferences interface where you can edit the Process
Overview features to show large icon sizes and change the background and foreground
(text) colors.
Picture exports picture(s) from the pictures list.
Edit mode toggles back and forth between edit mode and non-edit mode.
Snap snaps items to a hidden grid when dragging them.
Visible objects determines which points to display.
Editing a Measurement Point in the Working Area
You can also manipulate the items in the process overview working area during the edit
mode by clicking right mouse button on an item.
Diagram enables you to choose an associated diagram to plot.
Properties configures how the measurement point is displayed by editing the following
fields.
Name is name of the selected measurement point which is displayed when
choosing Name as Text.
Short name is the user configured name which is displayed when choosing Short
name as Text.
Type is the display type that determines which type to represent the data. The
options vary depending on the type of measurement point.
Text determines how the text of the item in the process overview will be displayed.
Name: displays the full length of the measurement point.
Short name: displays the customized short name for the measurement point.
None: displays no name. Instead, it displays the icon.
Width enables you to enter the value of width manually, instead of changing it with
the mouse.
System Configuration
Machine Copy Wizard
@ptitude Observer 10.2, Revision N 4 - 93 User Manual
Height enables you to enter the value of height manually, instead of changing it
with the mouse.
Show values determines which components of the measurement point should be
displayed in graph.
Visible checkbox is used to enable/disable the display of the selected measurement
point.
Show EU checkbox enables you to show or hide the engineering units in all of the
different graph types it is possible to show in the process overview. The default
value is checked, meaning the engineering units are displayed. When you uncheck
the box to hide the engineering units, the engineering units will display only as
mouse over information (a tooltip).
Event Log opens up a window with the event log for the selected measurement point.
Machine Copy Wizard
The machine copy wizard is a guide that helps you to copy a machine with all the
machine information from an existing machine to a new machine.
Note that the wizard cannot overwrite already existing channel settings on an existing
device. It can however, create a new IMx/MasCon device for you. Therefore, you do not
need to create an IMx/MasCon device before you launch the wizard.
The following data can be copied:
Machine specific information
Machine parts
IMx/MasCon devices
Channel configuration
Online measurement points
Offline measurement points
Diagnosis
Process overview information
Measurement group
To open the machine copy wizard, perform one of the following options:
Click the right mouse button on a node in the hierarchy view and select Add,
Machine, then select From machine template.
Click the right mouse button on a node in the hierarchy view and select Add,
Machine, then select Existing machine.
Select a machine in the hierarchy view first, then click Edit on the toolbar and select
Copy node.
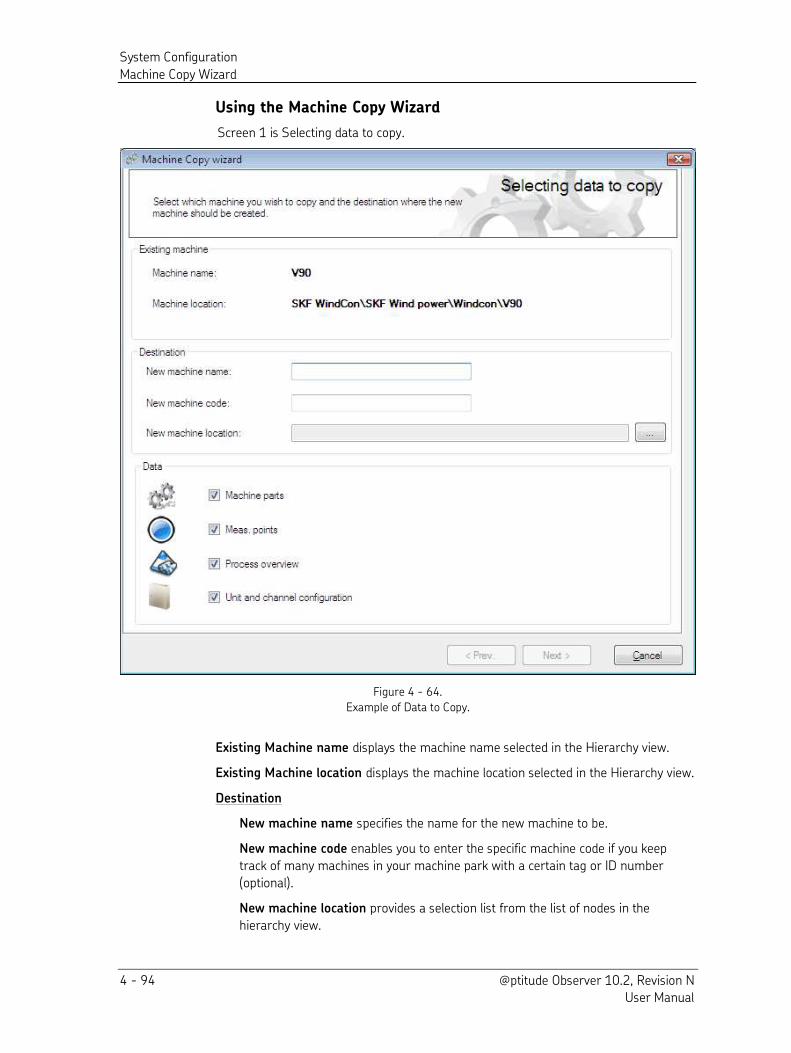
System Configuration
Machine Copy Wizard
4 - 94 @ptitude Observer 10.2, Revision N User Manual
Using the Machine Copy Wizard
Screen 1 is Selecting data to copy.
Figure 4 - 64.
Example of Data to Copy.
Existing Machine name displays the machine name selected in the Hierarchy view.
Existing Machine location displays the machine location selected in the Hierarchy view.
Destination
New machine name specifies the name for the new machine to be.
New machine code enables you to enter the specific machine code if you keep
track of many machines in your machine park with a certain tag or ID number
(optional).
New machine location provides a selection list from the list of nodes in the
hierarchy view.
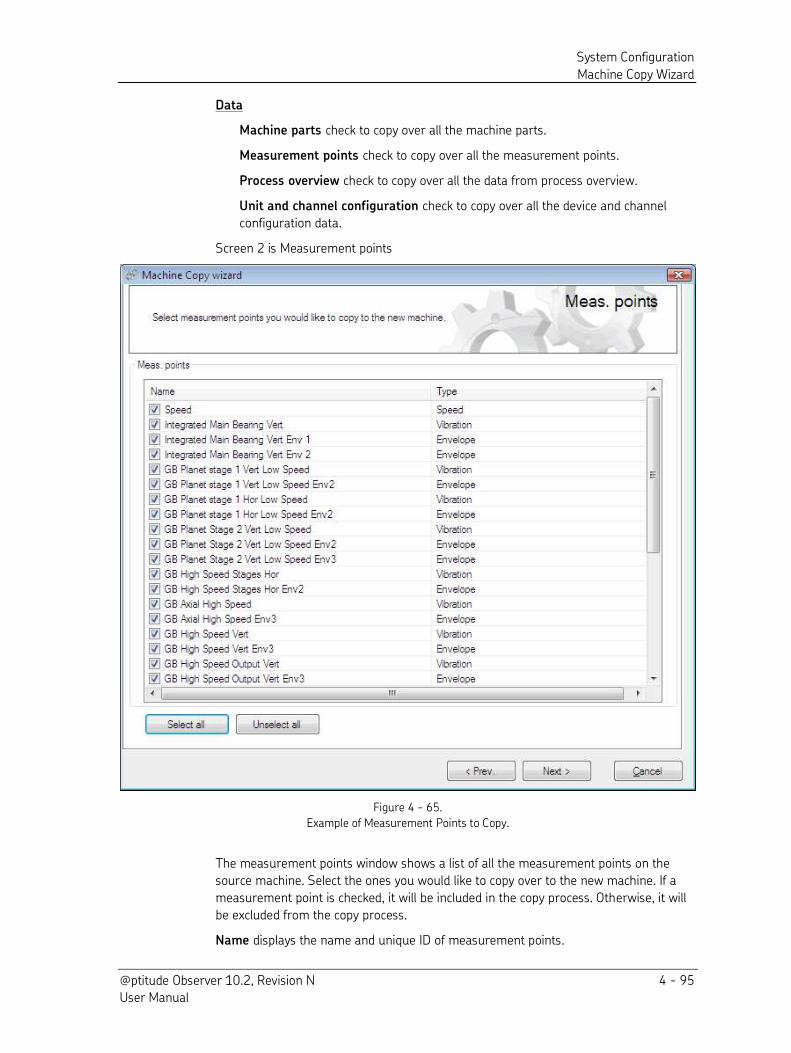
System Configuration
Machine Copy Wizard
@ptitude Observer 10.2, Revision N 4 - 95 User Manual
Data
Machine parts check to copy over all the machine parts.
Measurement points check to copy over all the measurement points.
Process overview check to copy over all the data from process overview.
Unit and channel configuration check to copy over all the device and channel
configuration data.
Screen 2 is Measurement points
Figure 4 - 65.
Example of Measurement Points to Copy.
The measurement points window shows a list of all the measurement points on the
source machine. Select the ones you would like to copy over to the new machine. If a
measurement point is checked, it will be included in the copy process. Otherwise, it will
be excluded from the copy process.
Name displays the name and unique ID of measurement points.
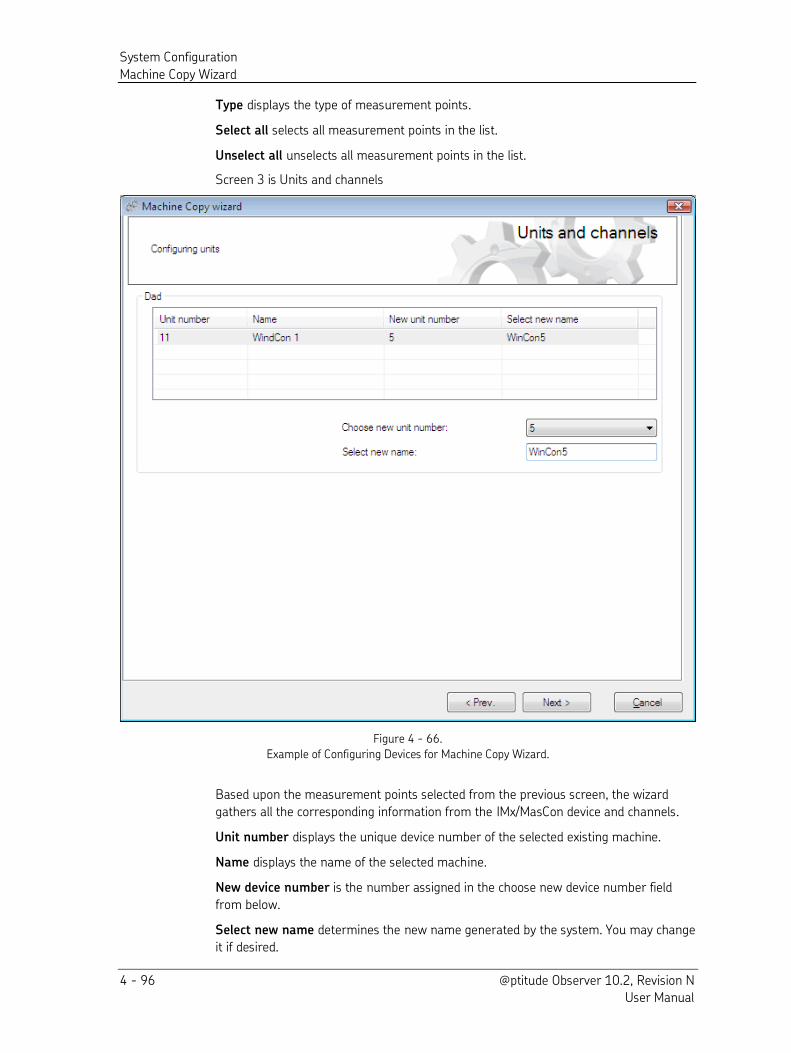
System Configuration
Machine Copy Wizard
4 - 96 @ptitude Observer 10.2, Revision N User Manual
Type displays the type of measurement points.
Select all selects all measurement points in the list.
Unselect all unselects all measurement points in the list.
Screen 3 is Units and channels
Figure 4 - 66.
Example of Configuring Devices for Machine Copy Wizard.
Based upon the measurement points selected from the previous screen, the wizard
gathers all the corresponding information from the IMx/MasCon device and channels.
Unit number displays the unique device number of the selected existing machine.
Name displays the name of the selected machine.
New device number is the number assigned in the choose new device number field
from below.
Select new name determines the new name generated by the system. You may change
it if desired.
System Configuration
Multiple Point Update Wizard
@ptitude Observer 10.2, Revision N 4 - 97 User Manual
Choose new device number select a unique device number from the list.
Screen 4 is Finish. Click Finish to save the changes made.
Screen 5 is Summary. It displays the details, and enables you to print the summary.
Example Scenario
You have a wind turbine with one IMx/MasCon system with measuring data. If you
would like to add a second wind turbine to your @ptitude Observer database, you can
copy the entire setup of your existing wind turbine to the new one by using the machine
copy wizard. The only thing you need to do is to choose a new device number and name
for the new IMx/MasCon device which will be asked by the wizard.
Multiple Point Update Wizard
The multiple point update wizard is a tool for updating several measurement points
with one or several properties. It can be anything from a simple edit such as changing
an active status on a few measurement points in a machine, to more complex edits
such as updating a frequency range and number of lines on all IMx/MasCon vibration
measurement points in the entire database. You can filter out specific measurement
point types based on the selection of your choice.
To open the multiple point update wizard:
To update a certain set of measurement points:
1. First select a database, a node, a machine or a sub machine in which these
points reside in the hierarchy view. 2. Click Edit on the toolbar, then select Multiple point update wizard.
To update all the measurement points in all the databases:
– There is no need to select any node. Click on Edit on the toolbar, then select
Multiple point update wizard. In the Wizard, select All measurement point
in all databases.
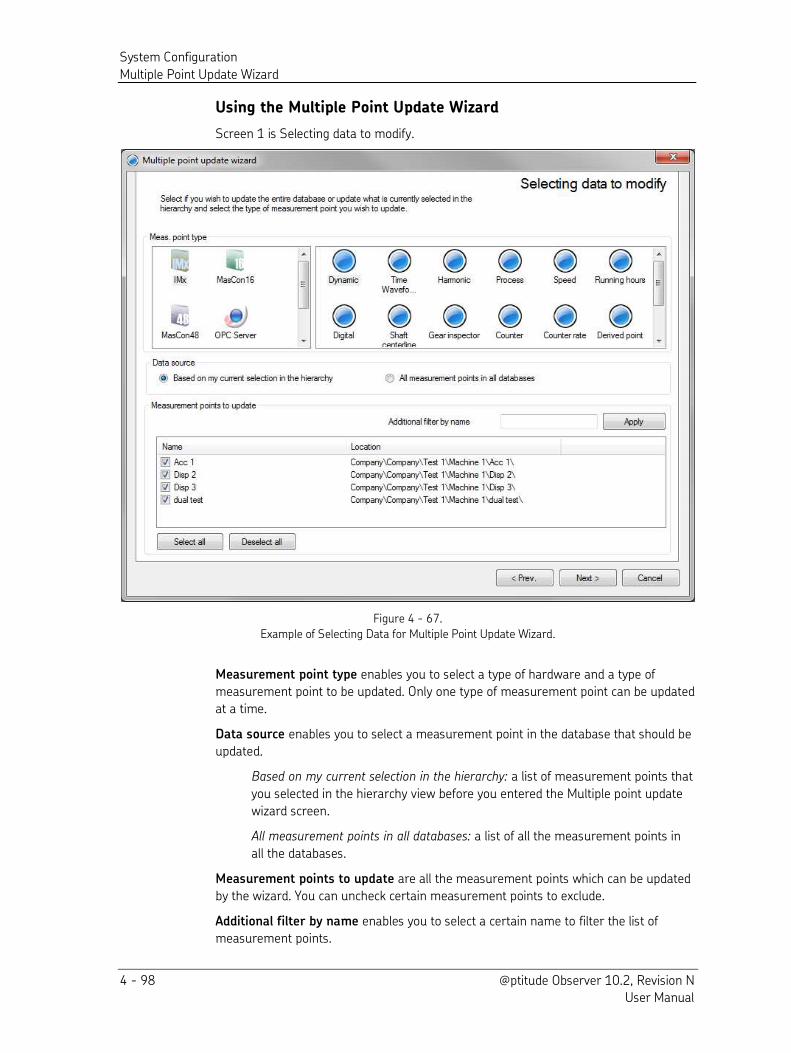
System Configuration
Multiple Point Update Wizard
4 - 98 @ptitude Observer 10.2, Revision N User Manual
Using the Multiple Point Update Wizard
Screen 1 is Selecting data to modify.
Figure 4 - 67.
Example of Selecting Data for Multiple Point Update Wizard.
Measurement point type enables you to select a type of hardware and a type of
measurement point to be updated. Only one type of measurement point can be updated
at a time.
Data source enables you to select a measurement point in the database that should be
updated.
Based on my current selection in the hierarchy: a list of measurement points that
you selected in the hierarchy view before you entered the Multiple point update
wizard screen.
All measurement points in all databases: a list of all the measurement points in
all the databases.
Measurement points to update are all the measurement points which can be updated
by the wizard. You can uncheck certain measurement points to exclude.
Additional filter by name enables you to select a certain name to filter the list of
measurement points.
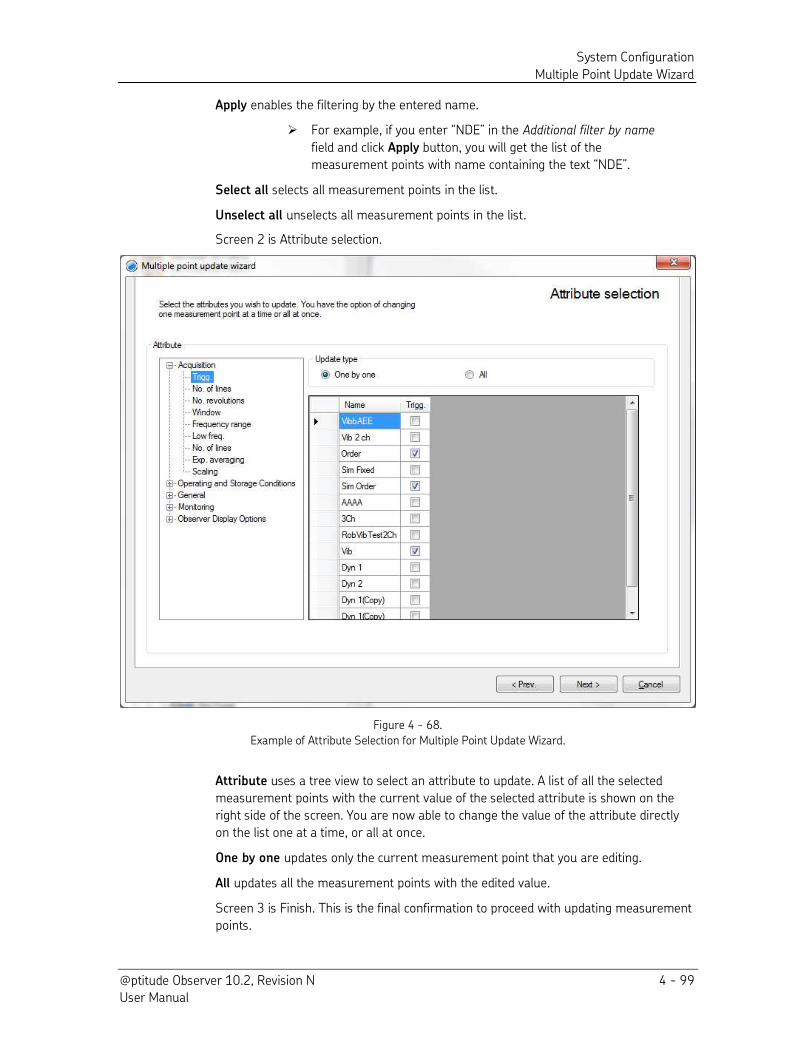
System Configuration
Multiple Point Update Wizard
@ptitude Observer 10.2, Revision N 4 - 99 User Manual
Apply enables the filtering by the entered name.
For example, if you enter “NDE” in the Additional filter by name
field and click Apply button, you will get the list of the
measurement points with name containing the text “NDE”. Select all selects all measurement points in the list.
Unselect all unselects all measurement points in the list.
Screen 2 is Attribute selection.
Figure 4 - 68.
Example of Attribute Selection for Multiple Point Update Wizard.
Attribute uses a tree view to select an attribute to update. A list of all the selected
measurement points with the current value of the selected attribute is shown on the
right side of the screen. You are now able to change the value of the attribute directly
on the list one at a time, or all at once.
One by one updates only the current measurement point that you are editing.
All updates all the measurement points with the edited value.
Screen 3 is Finish. This is the final confirmation to proceed with updating measurement
points.

System Configuration
Multiple Point Update Wizard
4 - 100 @ptitude Observer 10.2, Revision N User Manual
When you click Finish, the wizard starts saving the configuration and you cannot undo
any changes made.
Screen 4 is Summary. Summary gives you the list of how many measurement points
were updated and how many measurement points could not be updated. If there were any measurement points could not be updated, the reasons are stated in the Details
section.
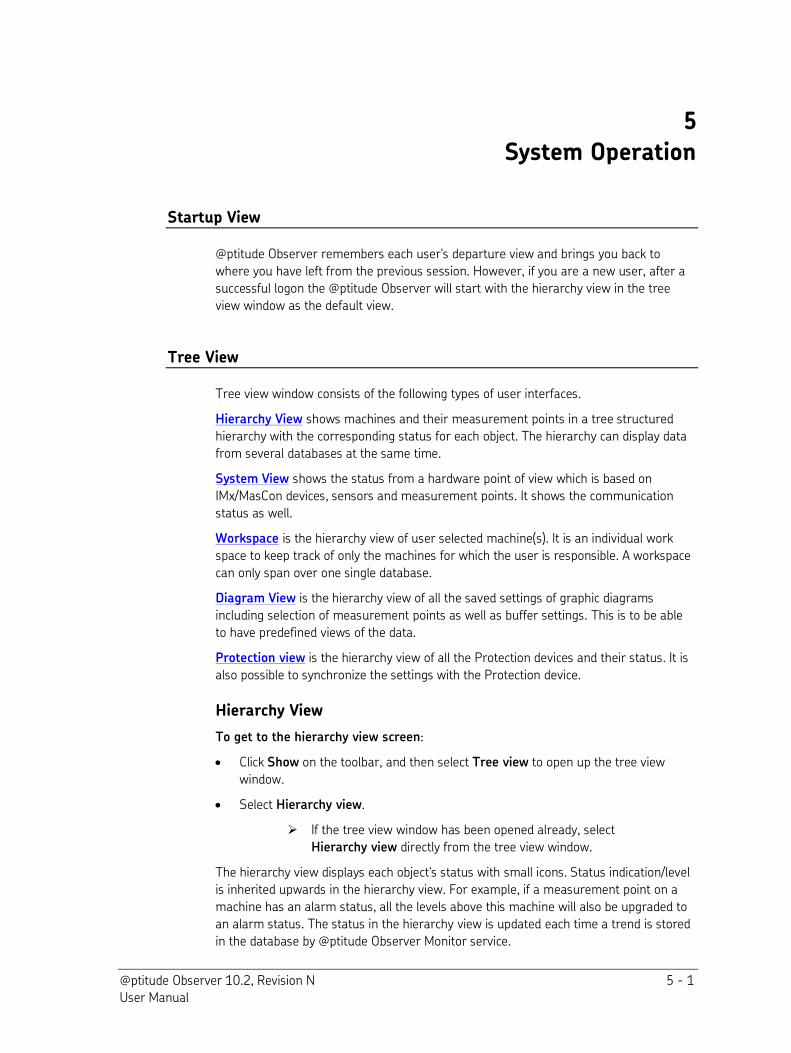
@ptitude Observer 10.2, Revision N 5 - 1 User Manual
5
System Operation
Startup View
@ptitude Observer remembers each user's departure view and brings you back to
where you have left from the previous session. However, if you are a new user, after a
successful logon the @ptitude Observer will start with the hierarchy view in the tree
view window as the default view.
Tree View
Tree view window consists of the following types of user interfaces.
Hierarchy View shows machines and their measurement points in a tree structured
hierarchy with the corresponding status for each object. The hierarchy can display data
from several databases at the same time.
System View shows the status from a hardware point of view which is based on
IMx/MasCon devices, sensors and measurement points. It shows the communication
status as well.
Workspace is the hierarchy view of user selected machine(s). It is an individual work
space to keep track of only the machines for which the user is responsible. A workspace
can only span over one single database.
Diagram View is the hierarchy view of all the saved settings of graphic diagrams
including selection of measurement points as well as buffer settings. This is to be able
to have predefined views of the data.
Protection view is the hierarchy view of all the Protection devices and their status. It is
also possible to synchronize the settings with the Protection device.
Hierarchy View
To get to the hierarchy view screen:
Click Show on the toolbar, and then select Tree view to open up the tree view
window.
Select Hierarchy view.
If the tree view window has been opened already, select
Hierarchy view directly from the tree view window.
The hierarchy view displays each object's status with small icons. Status indication/level
is inherited upwards in the hierarchy view. For example, if a measurement point on a
machine has an alarm status, all the levels above this machine will also be upgraded to
an alarm status. The status in the hierarchy view is updated each time a trend is stored
in the database by @ptitude Observer Monitor service.
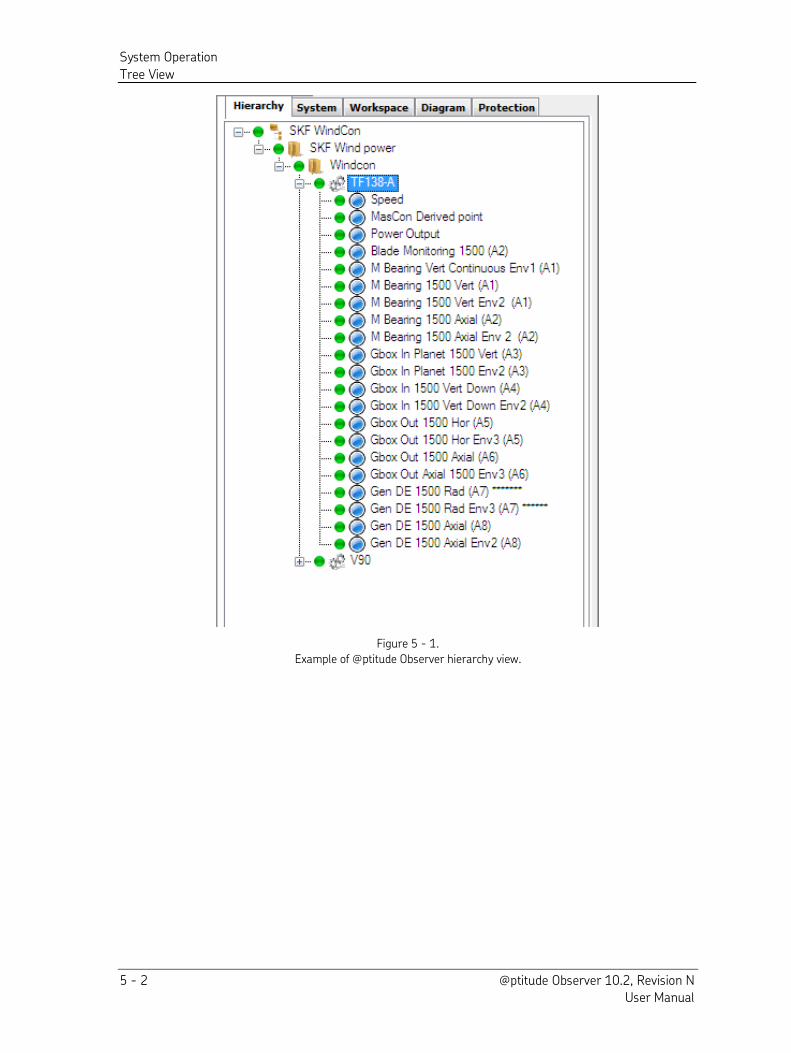
System Operation
Tree View
5 - 2 @ptitude Observer 10.2, Revision N User Manual
Figure 5 - 1.
Example of @ptitude Observer hierarchy view.
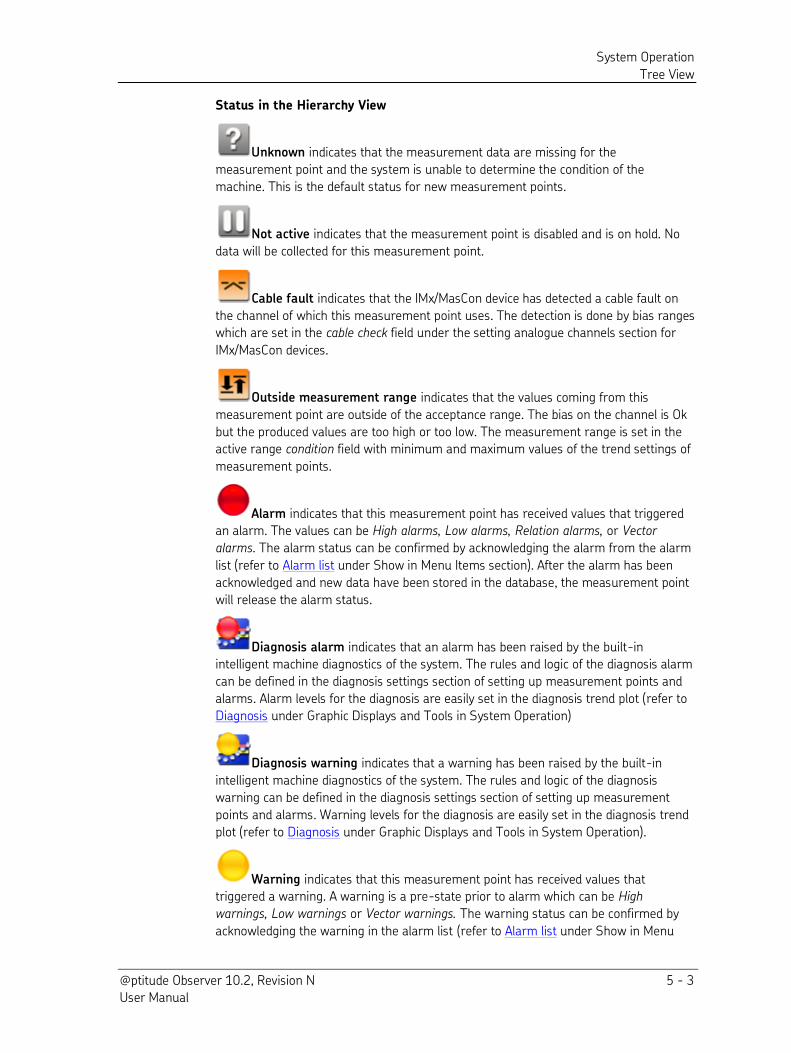
System Operation
Tree View
@ptitude Observer 10.2, Revision N 5 - 3 User Manual
Status in the Hierarchy View
Unknown indicates that the measurement data are missing for the
measurement point and the system is unable to determine the condition of the
machine. This is the default status for new measurement points.
Not active indicates that the measurement point is disabled and is on hold. No
data will be collected for this measurement point.
Cable fault indicates that the IMx/MasCon device has detected a cable fault on
the channel of which this measurement point uses. The detection is done by bias ranges which are set in the cable check field under the setting analogue channels section for
IMx/MasCon devices.
Outside measurement range indicates that the values coming from this
measurement point are outside of the acceptance range. The bias on the channel is Ok
but the produced values are too high or too low. The measurement range is set in the active range condition field with minimum and maximum values of the trend settings of
measurement points.
Alarm indicates that this measurement point has received values that triggered an alarm. The values can be High alarms, Low alarms, Relation alarms, or Vector
alarms. The alarm status can be confirmed by acknowledging the alarm from the alarm
list (refer to Alarm list under Show in Menu Items section). After the alarm has been
acknowledged and new data have been stored in the database, the measurement point
will release the alarm status.
Diagnosis alarm indicates that an alarm has been raised by the built-in intelligent machine diagnostics of the system. The rules and logic of the diagnosis alarm
can be defined in the diagnosis settings section of setting up measurement points and
alarms. Alarm levels for the diagnosis are easily set in the diagnosis trend plot (refer to
Diagnosis under Graphic Displays and Tools in System Operation)
Diagnosis warning indicates that a warning has been raised by the built-in
intelligent machine diagnostics of the system. The rules and logic of the diagnosis
warning can be defined in the diagnosis settings section of setting up measurement
points and alarms. Warning levels for the diagnosis are easily set in the diagnosis trend
plot (refer to Diagnosis under Graphic Displays and Tools in System Operation).
Warning indicates that this measurement point has received values that triggered a warning. A warning is a pre-state prior to alarm which can be High
warnings, Low warnings or Vector warnings. The warning status can be confirmed by
acknowledging the warning in the alarm list (refer to Alarm list under Show in Menu
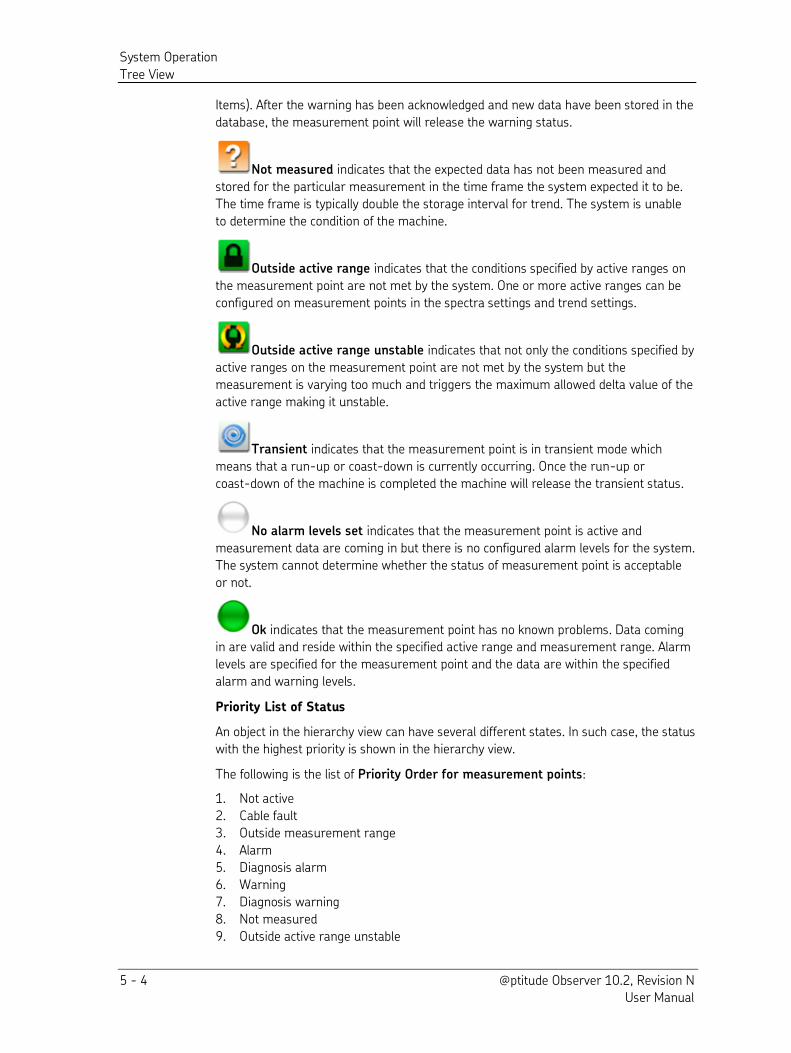
System Operation
Tree View
5 - 4 @ptitude Observer 10.2, Revision N User Manual
Items). After the warning has been acknowledged and new data have been stored in the
database, the measurement point will release the warning status.
Not measured indicates that the expected data has not been measured and
stored for the particular measurement in the time frame the system expected it to be.
The time frame is typically double the storage interval for trend. The system is unable
to determine the condition of the machine.
Outside active range indicates that the conditions specified by active ranges on
the measurement point are not met by the system. One or more active ranges can be
configured on measurement points in the spectra settings and trend settings.
Outside active range unstable indicates that not only the conditions specified by
active ranges on the measurement point are not met by the system but the
measurement is varying too much and triggers the maximum allowed delta value of the
active range making it unstable.
Transient indicates that the measurement point is in transient mode which
means that a run-up or coast-down is currently occurring. Once the run-up or
coast-down of the machine is completed the machine will release the transient status.
No alarm levels set indicates that the measurement point is active and
measurement data are coming in but there is no configured alarm levels for the system.
The system cannot determine whether the status of measurement point is acceptable
or not.
Ok indicates that the measurement point has no known problems. Data coming in are valid and reside within the specified active range and measurement range. Alarm
levels are specified for the measurement point and the data are within the specified
alarm and warning levels.
Priority List of Status
An object in the hierarchy view can have several different states. In such case, the status
with the highest priority is shown in the hierarchy view.
The following is the list of Priority Order for measurement points:
1. Not active 2. Cable fault 3. Outside measurement range 4. Alarm 5. Diagnosis alarm 6. Warning 7. Diagnosis warning 8. Not measured 9. Outside active range unstable
System Operation
Tree View
@ptitude Observer 10.2, Revision N 5 - 5 User Manual
10. Outside active range 11. Transient 12. No alarm levels set 13. Ok
The following is the list of Priority Order for all the others such as a database, node,
machine and sub machine:
1. Alarm 2. Diagnosis alarm 3. Warning 4. Diagnosis warning 5. Cable fault 6. Outside measurement range 7. Not measured 8. Transient 9. Outside active range unstable 10. Outside active range 11. OK 12. No alarm levels set 13. Not active
Configuration Mode Indicators
The nodes in the database can have different configuration mode indicators set
depending on the validity of the current node or if the configuration of the specific node
or measurement point is not configured within the @ptitude Observer software. If there
is a configuration mode indicator set for a node or measurement point the normal icon
displayed for the node will be replaced by one of the following icons:
Obsolete indicates that this node or measurement point is obsolete and is no
longer valid for capturing data. The Observer system can set nodes to this status when
nodes needs to be retained in the system because they contain measurement data that
can be analyzed but the conditions of the system has changed in such a way that the
specific node is no longer valid to capture data with. If an Obsoleted node is no longer
needed, the user can choose to delete the node and its data permanently.
Protection indicates that this node or measurement point is configured by the
external software IMx-M Manager. Only minor changes to the point or node properties
can be done within Observer. Changing the configuration for this particular node is
needs to be done in IMx-M Manager and be re-imported to Observer through the
Protection View.
Interfaces Available on Database Level
These functions are accessible by right-clicking on a database.
Add enables you to add a node or a machine. Refer to Node or Machine under Building
a Hierarchy View in System Configuration section.
System Operation
Tree View
5 - 6 @ptitude Observer 10.2, Revision N User Manual
Process overview enables you to create user defined mimic displays with
measurement points and links to other displays on top of graphic pictures like drawings,
digital photos, etc. Refer to Process Overview in System Configuration section.
Report generates documents that contain text based information as well as diagrams
and pictures of selected data. Refer to Report under File in Menu Items.
Event log displays all the events of IMx-M and IMx-R devices of the specified database.
Refer to Event Log under On-line in Menu Items.
Configure enables you to configure the following functions for the selected database.
Reset automatic alarm levels for trend
Reset automatic alarm levels for diagnosis
Recalculate diagnoses
Disable all measurement points
Enable all measurement points
Block alarm on all measurement points
Remove alarm blocking on all measurement points
Tools enables you to configure the following settings.
Update graph settings of many measurement points at the same time for the
database.
Refresh updates the current hierarchy view with the new status, if any.
Properties enables you to edit the properties of the selected database.
Interfaces Available on Node Level
These are accessible by right-clicking on a node.
Add enables you to add a node or a machine. Refer to Node or Machine under Building
a Hierarchy View in System Configuration section.
Process overview enables you to create user defined mimic displays with
measurement points and links to other displays on top of graphic pictures like drawings,
digital photos, etc. Refer to Process Overview in System Configuration section.
Report generates documents that contain text based information as well as diagrams
and pictures of selected data. Refer to Report under File in Menu Items.
Event log displays all the events of the selected node of IMx-M or IMx-R device. Refer
to Event Log under On-line in Menu Items.
Delete deletes the selected node.
Configure enables you to configure the following functions for the selected node.
Reset automatic alarm levels for trend
Reset automatic alarm levels for diagnosis
Recalculate diagnoses
Disable all measurement points
System Operation
Tree View
@ptitude Observer 10.2, Revision N 5 - 7 User Manual
Enable all measurement points
Block alarm on all measurement points
Remove alarm blocking on all measurement points
Tools enables you to configure the following settings.
Update graph settings of many measurement points at the same time for the
current selection in the hierarchy.
Refresh updates the current hierarchy view with the new status, if any.
Properties enables you to edit the properties of the selected node.
Interfaces Available on Machine Level
These are accessible by right-clicking on a machine.
Add enables you to add a measurement point, a sub machine or an event capture
group. Refer to Meas. Points or Sub Machine under Building a Hierarchy View in the
System Configuration section. Refer to Configuring an Event Capture Group under
Database > Measurement Groups in the Menu Items section.
Process overview enables you to create user defined mimic displays with
measurement points and links to other displays on top of graphic pictures like drawings,
digital photos, etc. Refer to Process Overview in System Configuration section.
Machine parts enables you to compose the selected machine using different machine
parts. Refer to Defining Machine Parts in System Configuration.
Report generates documents that contain text based information as well as diagrams
and pictures of selected data. Refer to Report under File in Menu Items section.
Runout Compensation captures runout compensation data for the specific machine.
Refer to Runout Compensation under Setting up Measurement Points and Alarms in
System Configuration section.
Event log displays all the events of the selected machine of IMx-M or IMx-R device.
Refer to Event Log under On-line in Menu Items.
Maintenance planner keeps track of maintenance tasks. Refer to Maintenance Planner
in System Operation section.
Copy enables you to copy the selected machine to a new location. Refer to Machine
Copy Wizard in System Configuration section.
Paste pastes the sub machine or a measurement point that you just copied in the
selected machine.
Delete deletes the selected machine.
If the machine you are deleting includes points referenced by a
Multiple Gating Point, the system will remove those references.
If the machine you are deleting includes an event capture group,
the system will remove the group and its related measurement
points.
System Operation
Tree View
5 - 8 @ptitude Observer 10.2, Revision N User Manual
Tools enables you to configure the following settings.
Update graph settings of many measurement points at the same time based on
the current selection in the hierarchy or for the database.
Generate machine template opens a dialog for generating a Machine template of
the selected machine.
Configure enables you to configure the following functions for the selected machine.
Reset automatic alarm levels for trend
Reset automatic alarm levels for diagnosis
Recalculate diagnoses
Disable all measurement points
Enable all measurement points
Block alarm on all measurement points
Remove alarm blocking on all measurement points
Add note adds a note for the selected machine or sub machine. Refer to Notes in
System Operation section.
Calibrate shaft centerline graph connects to the IMx device and retrieves live values
for the shaft centerline measurement point and gets data of the current location of the
shaft. Refer to Calibrating Shaft Centerline Graph in System Configuration section.
Add event case adds a document report, information and history regarding a specific
event tied to the selected machine. Refer to Event Cases in System Operation section.
Add attachment attaches any file to the selected machine. Refer to Machine Properties
under Creating IMx/MasCon Devices and Channels.
Tag categorizes the selected machine with a specifically defined tag from the Tag
Library.
Refresh updates the current hierarchy view with the new status, if any.
Properties enables you to edit the properties of the selected machine.
Interfaces Available on Sub Machine Level
These are accessible by right-clicking on a sub machine.
Add enables you to add a measurement point. Refer to Meas. Points under Building a
Hierarchy View in System Configuration section.
Process overview enables you to create user defined mimic displays with
measurement points and links to other displays on top of graphic pictures like drawings,
digital photos, etc. Refer to Process Overview in System Configuration section.
Report generates documents that contain text based information as well as diagrams
and pictures of selected data. Refer to Report under File in Menu Items section.
Event log displays all the events of the selected sub machine of IMx-M or IMx-R device.
Refer to Event Log under On-line in Menu Items.
Copy enables you to copy the selected sub machine to a new location directly.
System Operation
Tree View
@ptitude Observer 10.2, Revision N 5 - 9 User Manual
Paste pastes a measurement point that you just copied in the selected sub machine.
Delete deletes the selected sub machine.
If the sub machine you are deleting includes points referenced by
a Multiple Gating Point, the system will remove those references.
Trend automatic alarm levels for the selected sub machine.
Diagnose automatic alarm levels for the selected sub machine.
Recalculate diagnoses for the selected sub machine.
Update graph settings of many measurement points at the same time for the selected
sub machine.
Add note adds a note for the selected machine or sub machine. Refer to Notes in
System Operation section.
Calibrate shaft centerline graph connects to the IMx device and retrieves live values
for the shaft centerline measurement point and gets data of the current location of the
shaft. Refer to Calibrating Shaft Centerline Graph in System Configuration section.
Tag categorizes the selected sub machine with a specifically defined tag from the Tag
Library
Refresh updates the current hierarchy view with the new status, if any.
Properties enables you to edit the properties of the selected sub machine.
Interfaces Available on Meas. Point level
These are accessible by right-clicking on a measurement point.
Diagram enables you to select and access to a graph display of the measurement point.
Report generates documents that contain text based information as well as diagrams
and pictures of selected data. Refer to Report under File in Menu Items section.
Event log displays all the events of the selected measurement point of IMx-M or IMx-R
device. Refer to Event Log under On-line in Menu Items.
Copy the selected measurement point.
Paste the copied measurement point to a new location.
Delete the selected measurement point.
If the point you are deleting is referenced by a Multiple Gating
Point, the system will remove that reference.
Reset automatic alarm levels for trend for the selected measurement point.
Reset automatic alarm levels for diagnosis for the selected measurement point.
Recalculate diagnoses of the selected measurement point.
Add note for the selected measurement point. Refer to Notes in System Operation
section.
Tag enables you to categorize the selected measurement point with a specifically
defined tag from the Tag Library
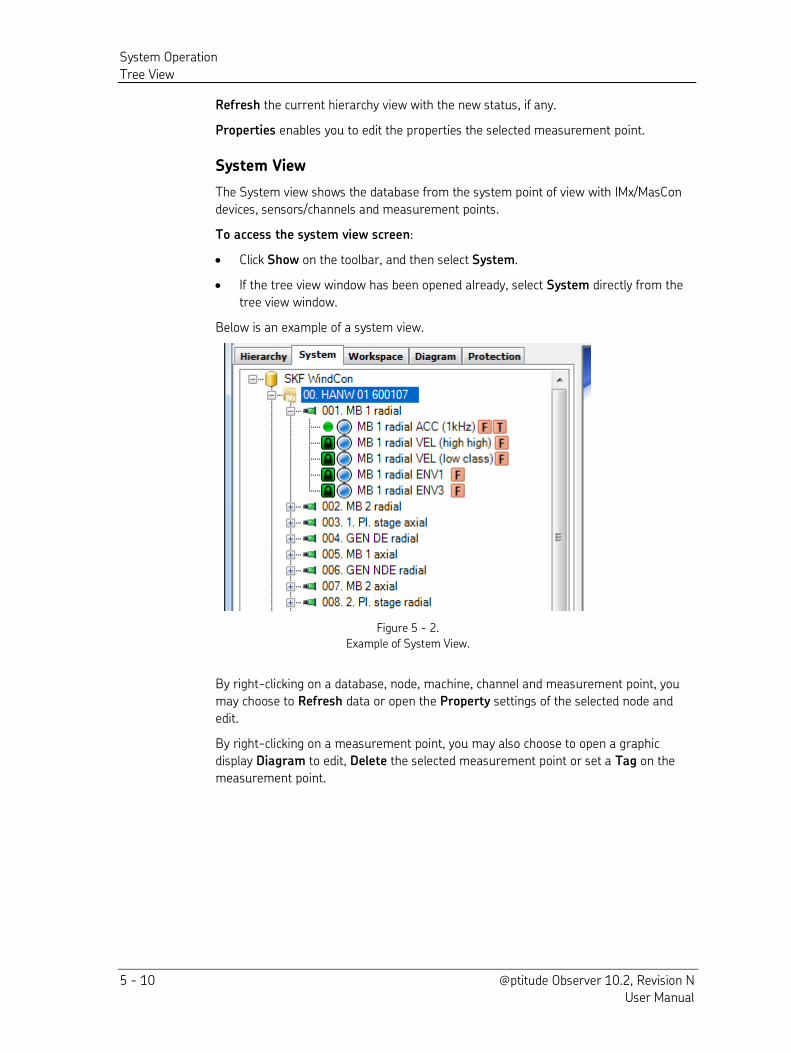
System Operation
Tree View
5 - 10 @ptitude Observer 10.2, Revision N User Manual
Refresh the current hierarchy view with the new status, if any.
Properties enables you to edit the properties the selected measurement point.
System View
The System view shows the database from the system point of view with IMx/MasCon
devices, sensors/channels and measurement points.
To access the system view screen:
Click Show on the toolbar, and then select System.
If the tree view window has been opened already, select System directly from the
tree view window.
Below is an example of a system view.
Figure 5 - 2.
Example of System View.
By right-clicking on a database, node, machine, channel and measurement point, you
may choose to Refresh data or open the Property settings of the selected node and
edit.
By right-clicking on a measurement point, you may also choose to open a graphic
display Diagram to edit, Delete the selected measurement point or set a Tag on the
measurement point.
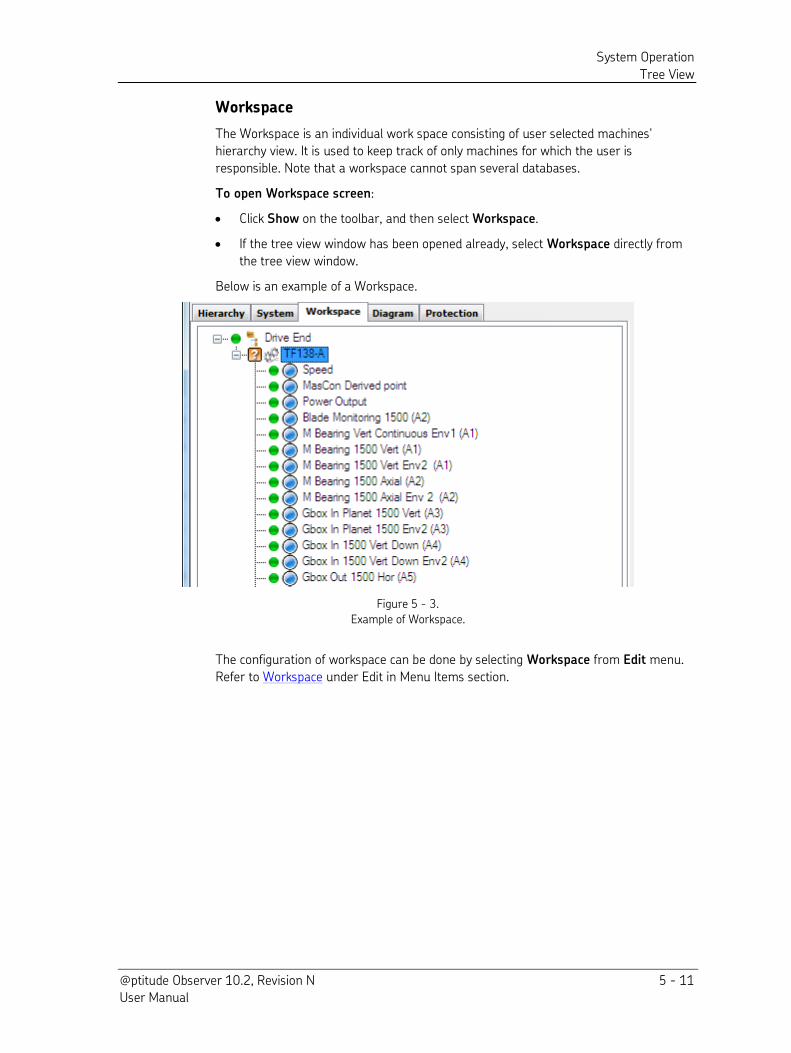
System Operation
Tree View
@ptitude Observer 10.2, Revision N 5 - 11 User Manual
Workspace
The Workspace is an individual work space consisting of user selected machines'
hierarchy view. It is used to keep track of only machines for which the user is
responsible. Note that a workspace cannot span several databases.
To open Workspace screen:
Click Show on the toolbar, and then select Workspace.
If the tree view window has been opened already, select Workspace directly from
the tree view window.
Below is an example of a Workspace.
Figure 5 - 3.
Example of Workspace.
The configuration of workspace can be done by selecting Workspace from Edit menu.
Refer to Workspace under Edit in Menu Items section.
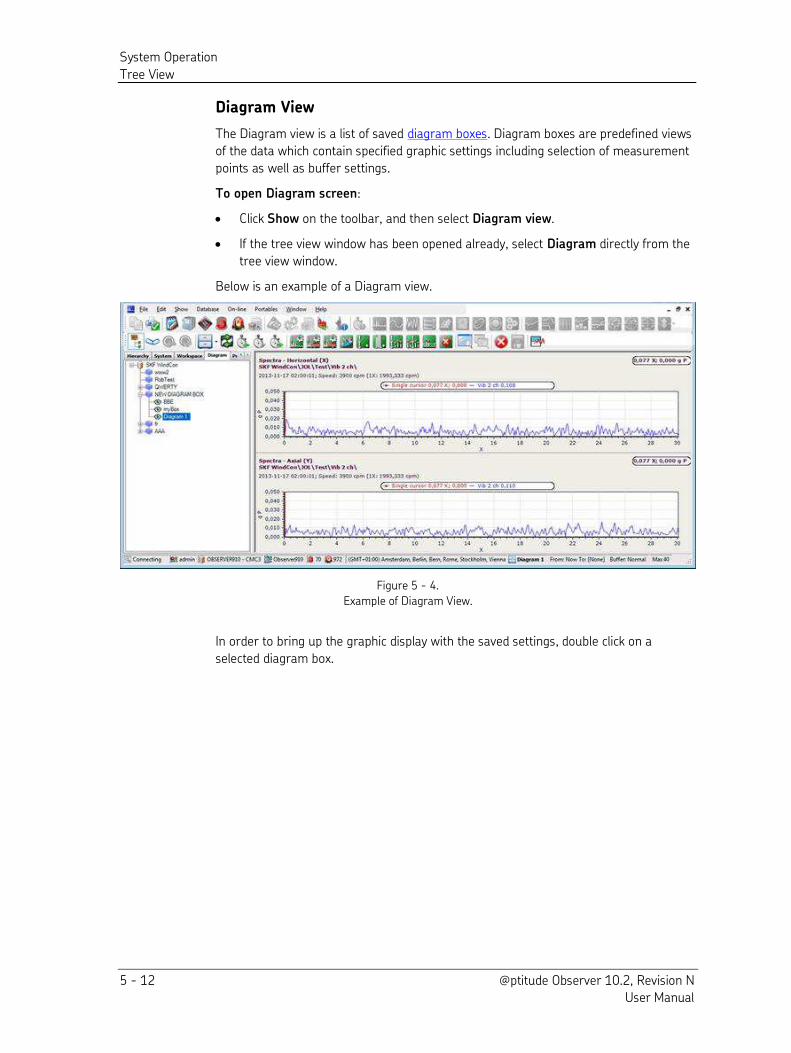
System Operation
Tree View
5 - 12 @ptitude Observer 10.2, Revision N User Manual
Diagram View
The Diagram view is a list of saved diagram boxes. Diagram boxes are predefined views
of the data which contain specified graphic settings including selection of measurement
points as well as buffer settings.
To open Diagram screen:
Click Show on the toolbar, and then select Diagram view.
If the tree view window has been opened already, select Diagram directly from the
tree view window.
Below is an example of a Diagram view.
Figure 5 - 4.
Example of Diagram View.
In order to bring up the graphic display with the saved settings, double click on a
selected diagram box.
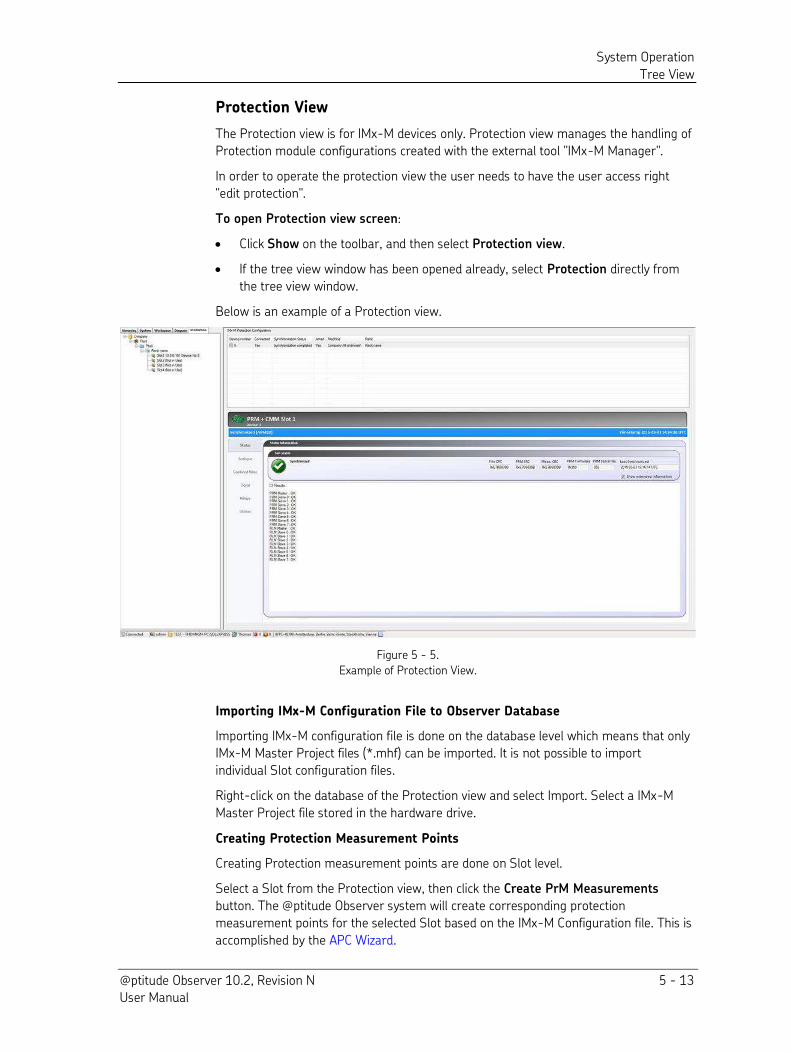
System Operation
Tree View
@ptitude Observer 10.2, Revision N 5 - 13 User Manual
Protection View
The Protection view is for IMx-M devices only. Protection view manages the handling of
Protection module configurations created with the external tool "IMx-M Manager".
In order to operate the protection view the user needs to have the user access right
"edit protection".
To open Protection view screen:
Click Show on the toolbar, and then select Protection view.
If the tree view window has been opened already, select Protection directly from
the tree view window.
Below is an example of a Protection view.
Figure 5 - 5.
Example of Protection View.
Importing IMx-M Configuration File to Observer Database
Importing IMx-M configuration file is done on the database level which means that only
IMx-M Master Project files (*.mhf) can be imported. It is not possible to import
individual Slot configuration files.
Right-click on the database of the Protection view and select Import. Select a IMx-M
Master Project file stored in the hardware drive.
Creating Protection Measurement Points
Creating Protection measurement points are done on Slot level.
Select a Slot from the Protection view, then click the Create PrM Measurements
button. The @ptitude Observer system will create corresponding protection
measurement points for the selected Slot based on the IMx-M Configuration file. This is
accomplished by the APC Wizard.
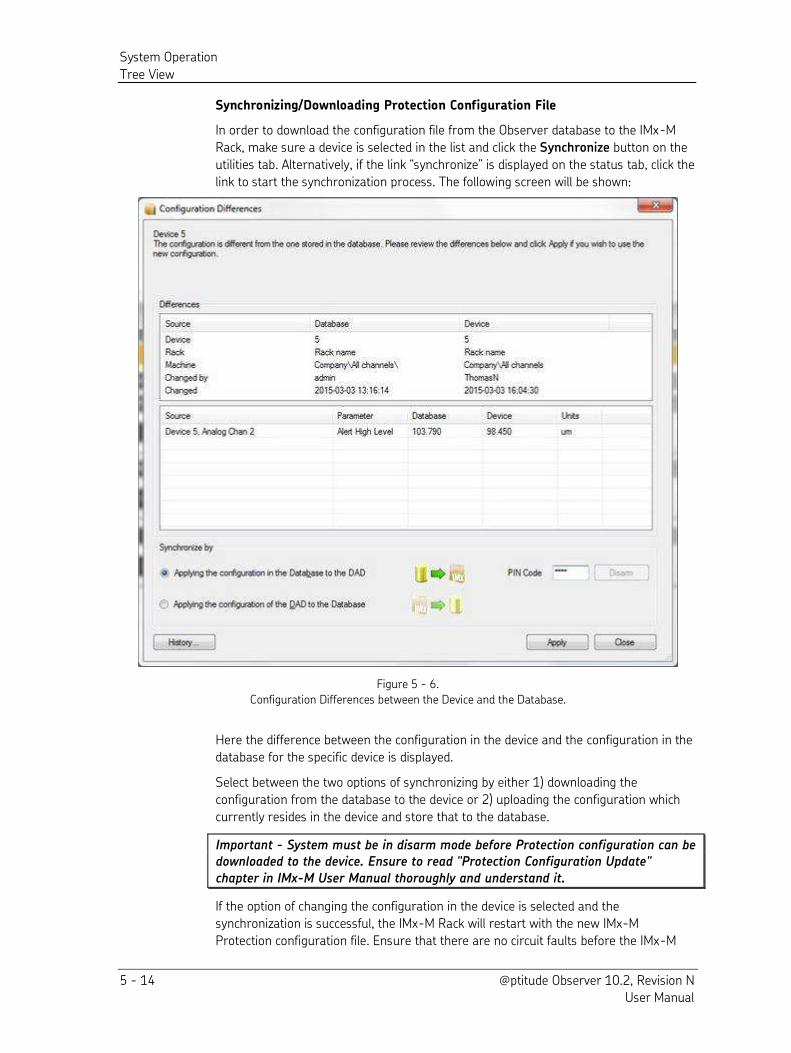
System Operation
Tree View
5 - 14 @ptitude Observer 10.2, Revision N User Manual
Synchronizing/Downloading Protection Configuration File
In order to download the configuration file from the Observer database to the IMx-M
Rack, make sure a device is selected in the list and click the Synchronize button on the
utilities tab. Alternatively, if the link “synchronize” is displayed on the status tab, click the
link to start the synchronization process. The following screen will be shown:
Figure 5 - 6.
Configuration Differences between the Device and the Database.
Here the difference between the configuration in the device and the configuration in the
database for the specific device is displayed.
Select between the two options of synchronizing by either 1) downloading the
configuration from the database to the device or 2) uploading the configuration which
currently resides in the device and store that to the database.
Important - System must be in disarm mode before Protection configuration can be downloaded to the device. Ensure to read "Protection Configuration Update"
chapter in IMx-M User Manual thoroughly and understand it.
If the option of changing the configuration in the device is selected and the
synchronization is successful, the IMx-M Rack will restart with the new IMx-M
Protection configuration file. Ensure that there are no circuit faults before the IMx-M
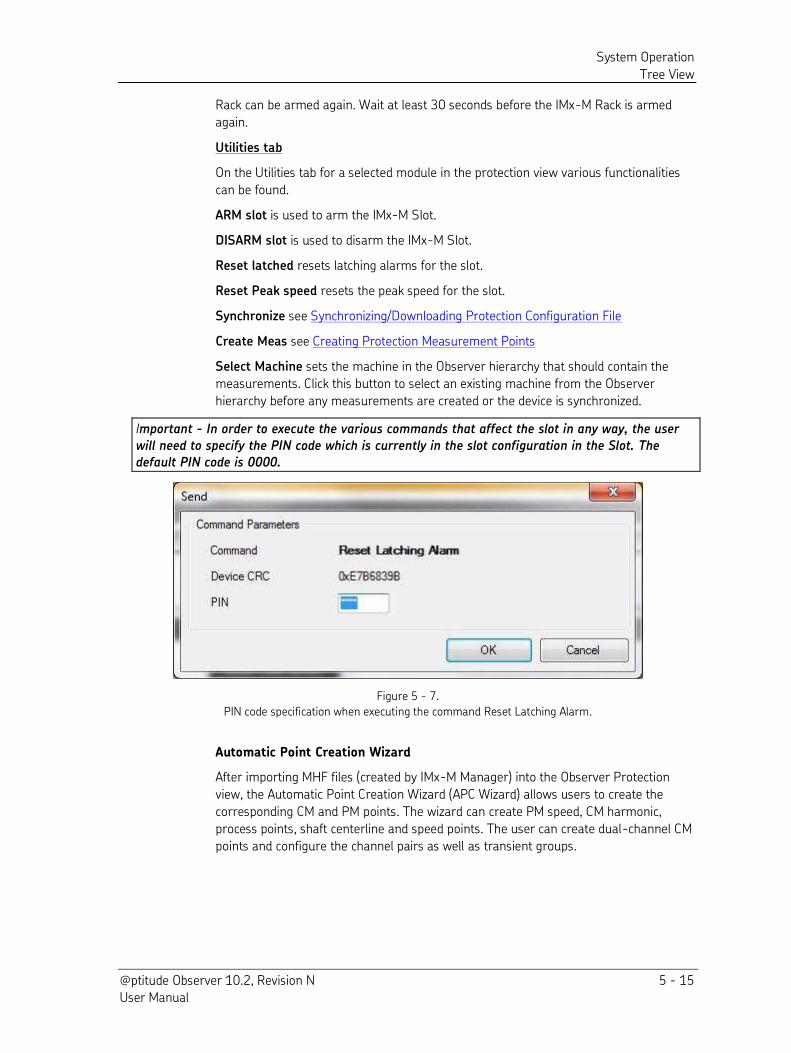
System Operation
Tree View
@ptitude Observer 10.2, Revision N 5 - 15 User Manual
Rack can be armed again. Wait at least 30 seconds before the IMx-M Rack is armed
again.
Utilities tab
On the Utilities tab for a selected module in the protection view various functionalities
can be found.
ARM slot is used to arm the IMx-M Slot.
DISARM slot is used to disarm the IMx-M Slot.
Reset latched resets latching alarms for the slot.
Reset Peak speed resets the peak speed for the slot.
Synchronize see Synchronizing/Downloading Protection Configuration File
Create Meas see Creating Protection Measurement Points
Select Machine sets the machine in the Observer hierarchy that should contain the
measurements. Click this button to select an existing machine from the Observer
hierarchy before any measurements are created or the device is synchronized.
Important - In order to execute the various commands that affect the slot in any way, the user
will need to specify the PIN code which is currently in the slot configuration in the Slot. The default PIN code is 0000.
Figure 5 - 7.
PIN code specification when executing the command Reset Latching Alarm.
Automatic Point Creation Wizard
After importing MHF files (created by IMx-M Manager) into the Observer Protection
view, the Automatic Point Creation Wizard (APC Wizard) allows users to create the
corresponding CM and PM points. The wizard can create PM speed, CM harmonic,
process points, shaft centerline and speed points. The user can create dual-channel CM
points and configure the channel pairs as well as transient groups.
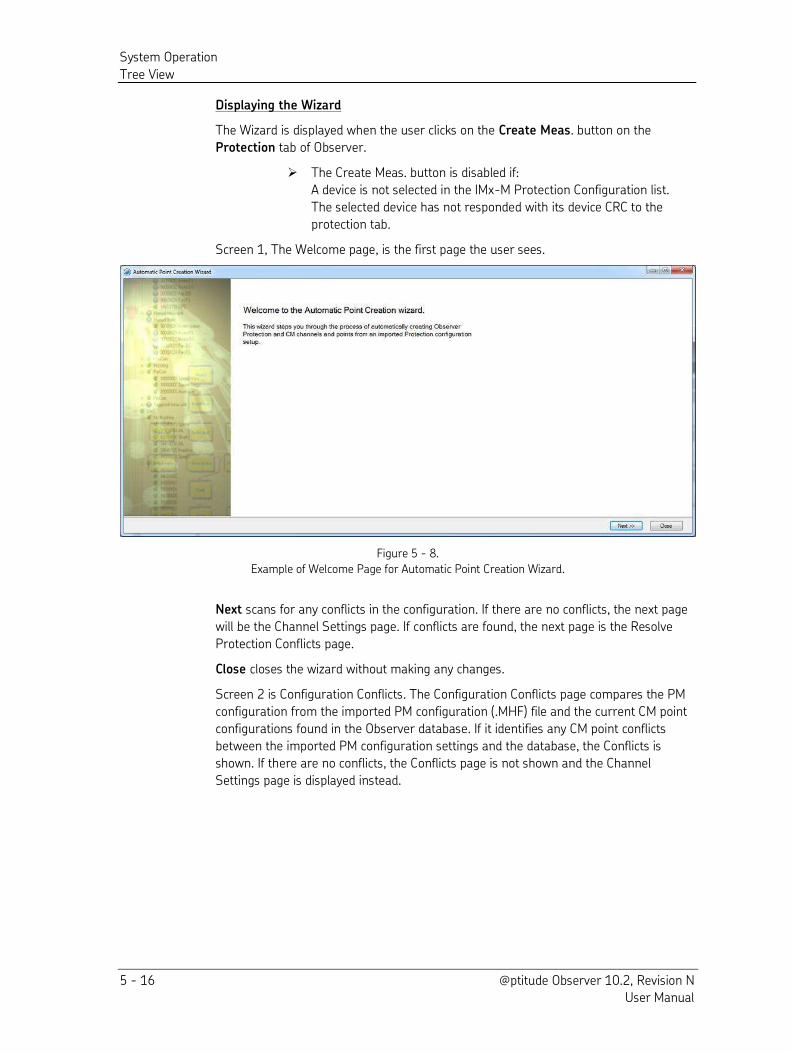
System Operation
Tree View
5 - 16 @ptitude Observer 10.2, Revision N User Manual
Displaying the Wizard
The Wizard is displayed when the user clicks on the Create Meas. button on the
Protection tab of Observer.
The Create Meas. button is disabled if:
A device is not selected in the IMx-M Protection Configuration list.
The selected device has not responded with its device CRC to the
protection tab.
Screen 1, The Welcome page, is the first page the user sees.
Figure 5 - 8.
Example of Welcome Page for Automatic Point Creation Wizard.
Next scans for any conflicts in the configuration. If there are no conflicts, the next page
will be the Channel Settings page. If conflicts are found, the next page is the Resolve
Protection Conflicts page.
Close closes the wizard without making any changes.
Screen 2 is Configuration Conflicts. The Configuration Conflicts page compares the PM
configuration from the imported PM configuration (.MHF) file and the current CM point
configurations found in the Observer database. If it identifies any CM point conflicts
between the imported PM configuration settings and the database, the Conflicts is
shown. If there are no conflicts, the Conflicts page is not shown and the Channel
Settings page is displayed instead.
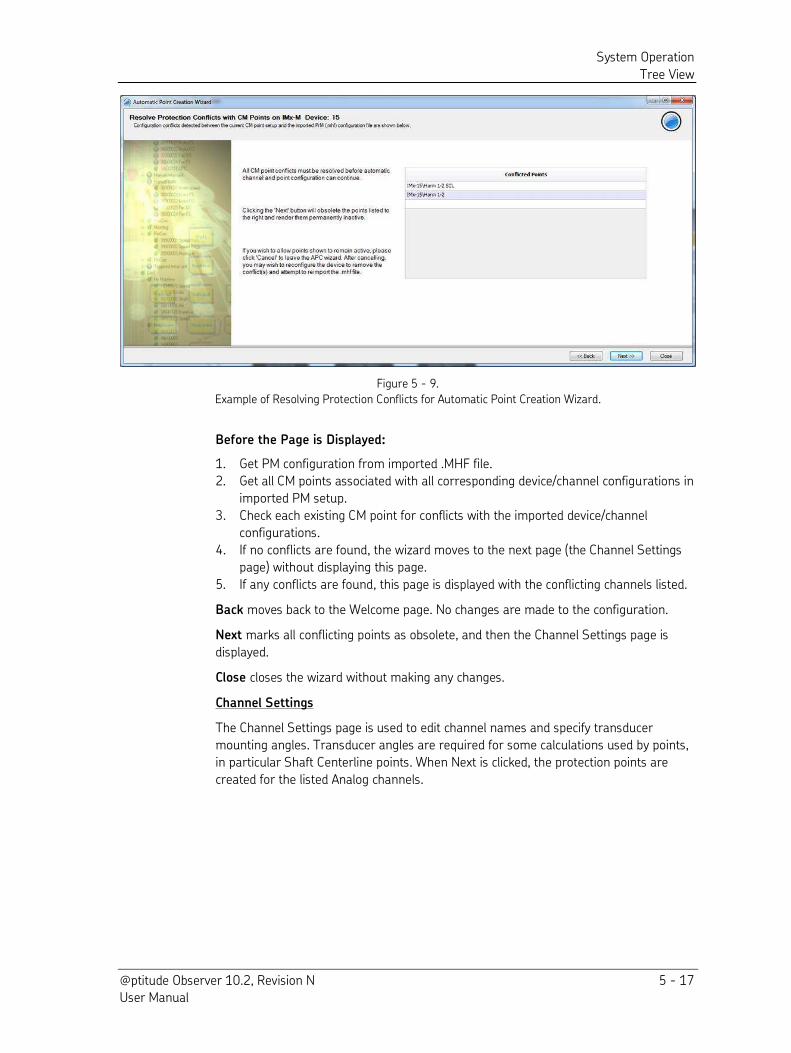
System Operation
Tree View
@ptitude Observer 10.2, Revision N 5 - 17 User Manual
Figure 5 - 9.
Example of Resolving Protection Conflicts for Automatic Point Creation Wizard.
Before the Page is Displayed:
1. Get PM configuration from imported .MHF file. 2. Get all CM points associated with all corresponding device/channel configurations in
imported PM setup. 3. Check each existing CM point for conflicts with the imported device/channel
configurations. 4. If no conflicts are found, the wizard moves to the next page (the Channel Settings
page) without displaying this page. 5. If any conflicts are found, this page is displayed with the conflicting channels listed.
Back moves back to the Welcome page. No changes are made to the configuration.
Next marks all conflicting points as obsolete, and then the Channel Settings page is
displayed.
Close closes the wizard without making any changes.
Channel Settings
The Channel Settings page is used to edit channel names and specify transducer
mounting angles. Transducer angles are required for some calculations used by points,
in particular Shaft Centerline points. When Next is clicked, the protection points are
created for the listed Analog channels.
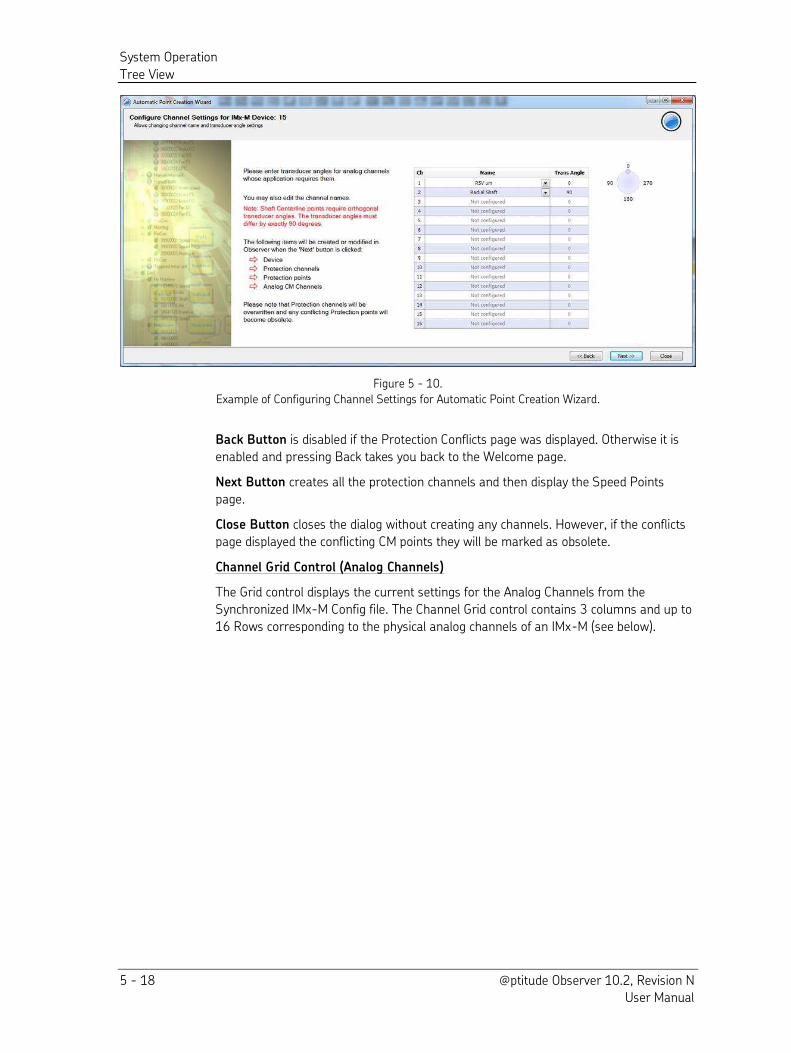
System Operation
Tree View
5 - 18 @ptitude Observer 10.2, Revision N User Manual
Figure 5 - 10.
Example of Configuring Channel Settings for Automatic Point Creation Wizard.
Back Button is disabled if the Protection Conflicts page was displayed. Otherwise it is
enabled and pressing Back takes you back to the Welcome page.
Next Button creates all the protection channels and then display the Speed Points
page.
Close Button closes the dialog without creating any channels. However, if the conflicts
page displayed the conflicting CM points they will be marked as obsolete.
Channel Grid Control (Analog Channels)
The Grid control displays the current settings for the Analog Channels from the
Synchronized IMx-M Config file. The Channel Grid control contains 3 columns and up to
16 Rows corresponding to the physical analog channels of an IMx-M (see below).
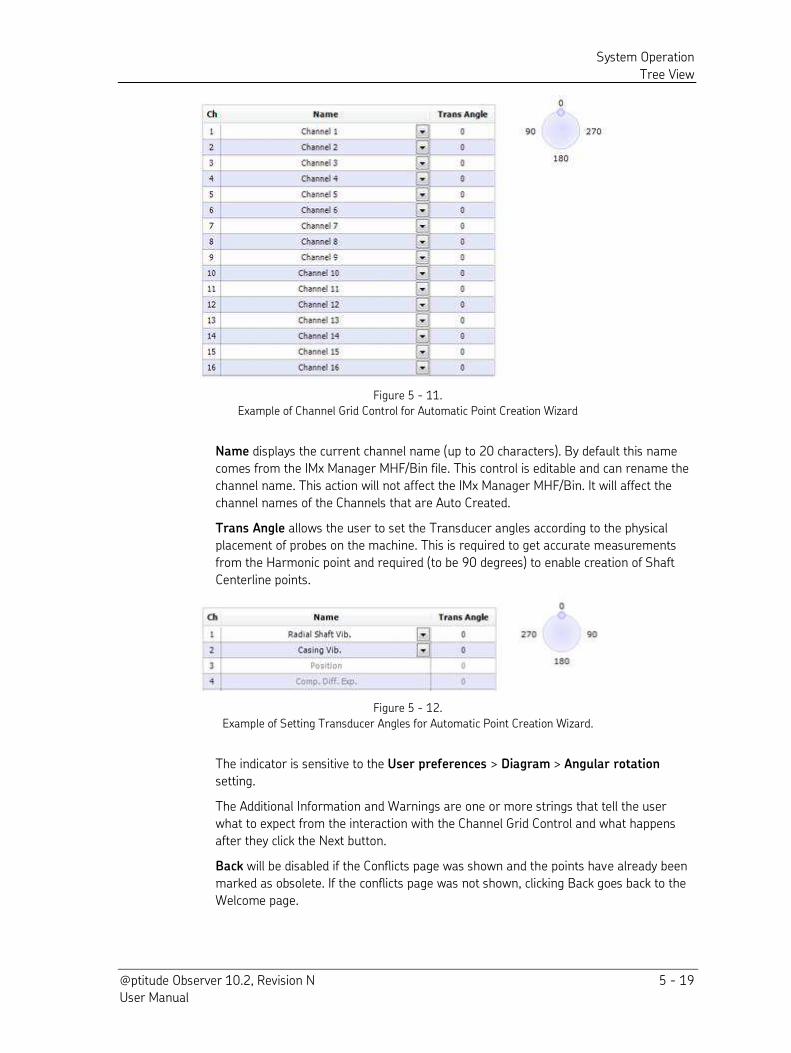
System Operation
Tree View
@ptitude Observer 10.2, Revision N 5 - 19 User Manual
Figure 5 - 11.
Example of Channel Grid Control for Automatic Point Creation Wizard
Name displays the current channel name (up to 20 characters). By default this name
comes from the IMx Manager MHF/Bin file. This control is editable and can rename the
channel name. This action will not affect the IMx Manager MHF/Bin. It will affect the
channel names of the Channels that are Auto Created.
Trans Angle allows the user to set the Transducer angles according to the physical
placement of probes on the machine. This is required to get accurate measurements
from the Harmonic point and required (to be 90 degrees) to enable creation of Shaft
Centerline points.
Figure 5 - 12.
Example of Setting Transducer Angles for Automatic Point Creation Wizard.
The indicator is sensitive to the User preferences > Diagram > Angular rotation
setting.
The Additional Information and Warnings are one or more strings that tell the user
what to expect from the interaction with the Channel Grid Control and what happens
after they click the Next button.
Back will be disabled if the Conflicts page was shown and the points have already been
marked as obsolete. If the conflicts page was not shown, clicking Back goes back to the
Welcome page.
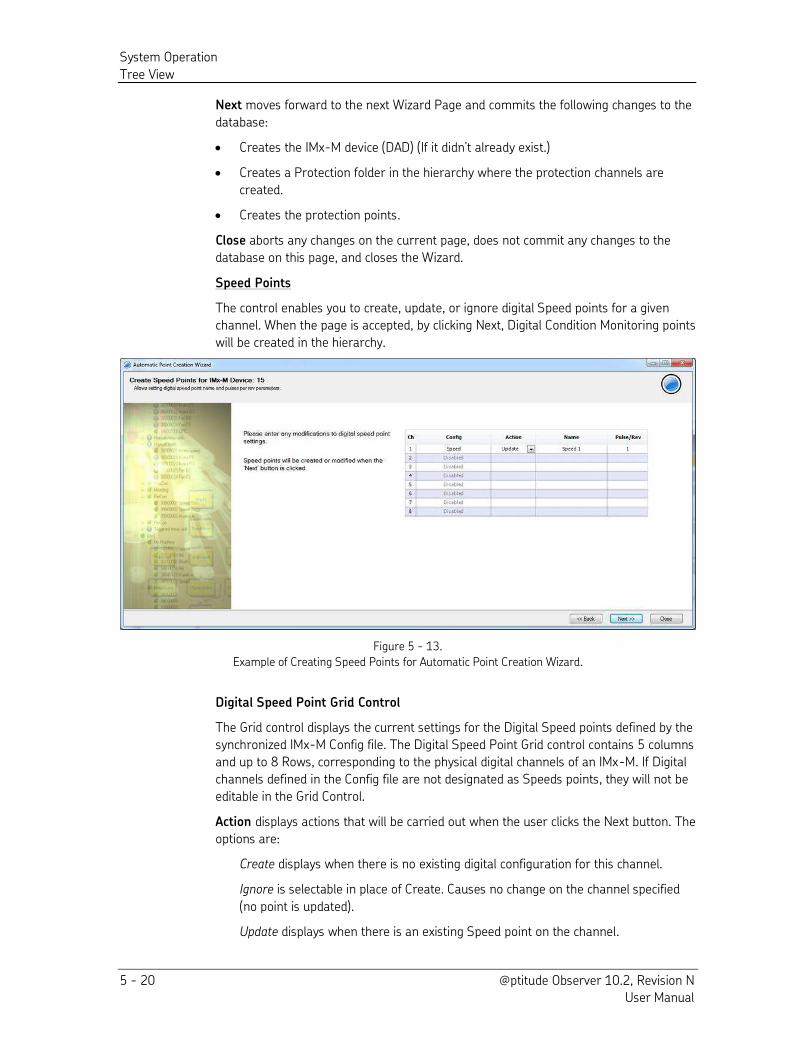
System Operation
Tree View
5 - 20 @ptitude Observer 10.2, Revision N User Manual
Next moves forward to the next Wizard Page and commits the following changes to the
database:
Creates the IMx-M device (DAD) (If it didn’t already exist.)
Creates a Protection folder in the hierarchy where the protection channels are
created.
Creates the protection points.
Close aborts any changes on the current page, does not commit any changes to the
database on this page, and closes the Wizard.
Speed Points
The control enables you to create, update, or ignore digital Speed points for a given
channel. When the page is accepted, by clicking Next, Digital Condition Monitoring points
will be created in the hierarchy.
Figure 5 - 13.
Example of Creating Speed Points for Automatic Point Creation Wizard.
Digital Speed Point Grid Control
The Grid control displays the current settings for the Digital Speed points defined by the
synchronized IMx-M Config file. The Digital Speed Point Grid control contains 5 columns
and up to 8 Rows, corresponding to the physical digital channels of an IMx-M. If Digital
channels defined in the Config file are not designated as Speeds points, they will not be
editable in the Grid Control.
Action displays actions that will be carried out when the user clicks the Next button. The
options are:
Create displays when there is no existing digital configuration for this channel.
Ignore is selectable in place of Create. Causes no change on the channel specified
(no point is updated).
Update displays when there is an existing Speed point on the channel.
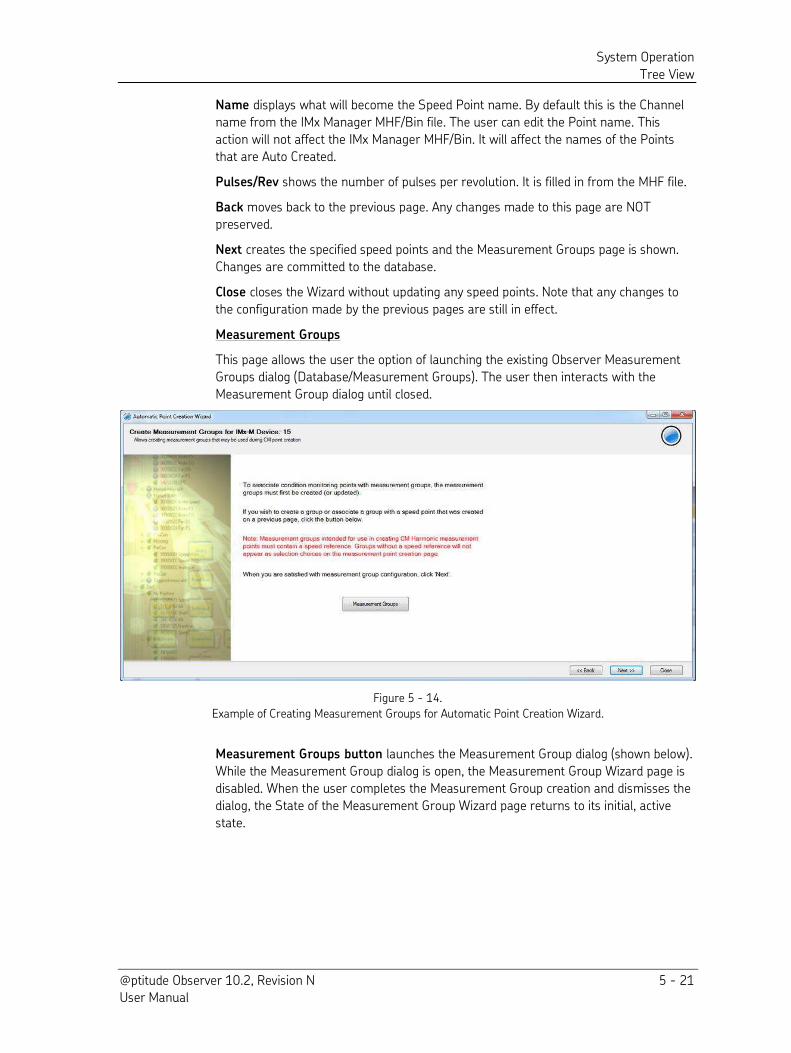
System Operation
Tree View
@ptitude Observer 10.2, Revision N 5 - 21 User Manual
Name displays what will become the Speed Point name. By default this is the Channel
name from the IMx Manager MHF/Bin file. The user can edit the Point name. This
action will not affect the IMx Manager MHF/Bin. It will affect the names of the Points
that are Auto Created.
Pulses/Rev shows the number of pulses per revolution. It is filled in from the MHF file.
Back moves back to the previous page. Any changes made to this page are NOT
preserved.
Next creates the specified speed points and the Measurement Groups page is shown.
Changes are committed to the database.
Close closes the Wizard without updating any speed points. Note that any changes to
the configuration made by the previous pages are still in effect.
Measurement Groups
This page allows the user the option of launching the existing Observer Measurement
Groups dialog (Database/Measurement Groups). The user then interacts with the
Measurement Group dialog until closed.
Figure 5 - 14.
Example of Creating Measurement Groups for Automatic Point Creation Wizard.
Measurement Groups button launches the Measurement Group dialog (shown below).
While the Measurement Group dialog is open, the Measurement Group Wizard page is
disabled. When the user completes the Measurement Group creation and dismisses the
dialog, the State of the Measurement Group Wizard page returns to its initial, active
state.
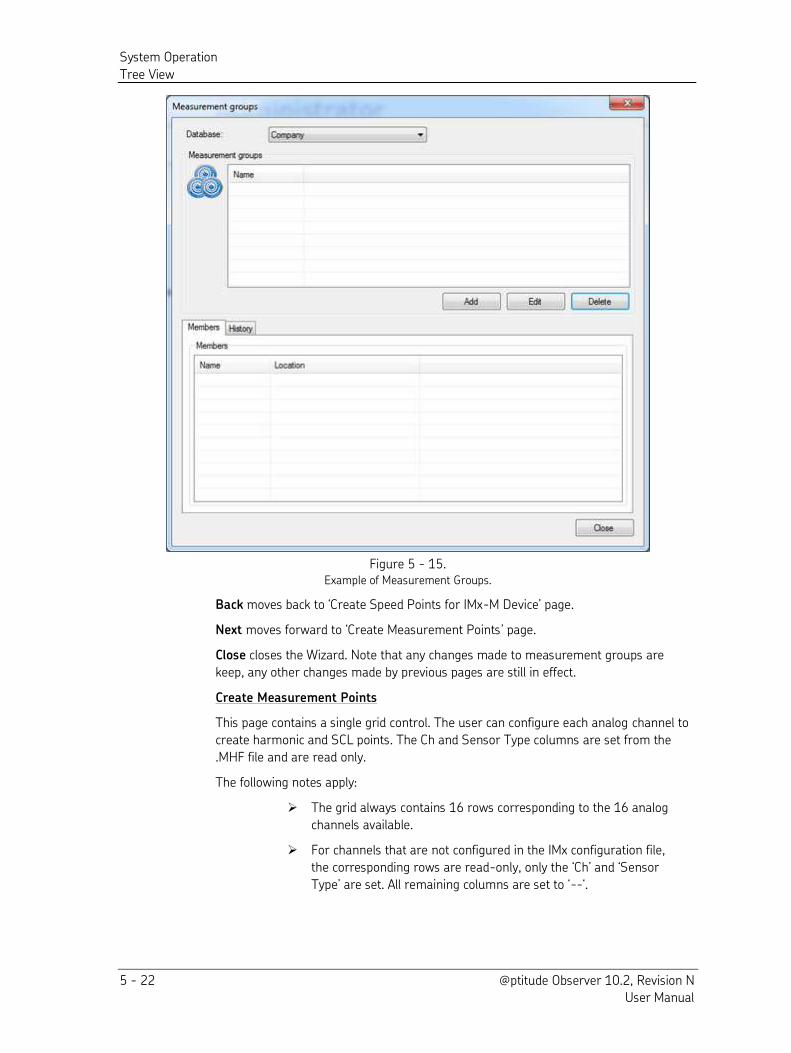
System Operation
Tree View
5 - 22 @ptitude Observer 10.2, Revision N User Manual
Figure 5 - 15. Example of Measurement Groups.
Back moves back to ‘Create Speed Points for IMx-M Device’ page. Next moves forward to ‘Create Measurement Points’ page. Close closes the Wizard. Note that any changes made to measurement groups are
keep, any other changes made by previous pages are still in effect.
Create Measurement Points
This page contains a single grid control. The user can configure each analog channel to
create harmonic and SCL points. The Ch and Sensor Type columns are set from the
.MHF file and are read only.
The following notes apply:
The grid always contains 16 rows corresponding to the 16 analog
channels available.
For channels that are not configured in the IMx configuration file,
the corresponding rows are read-only, only the ‘Ch’ and ‘Sensor Type’ are set. All remaining columns are set to ‘--‘.
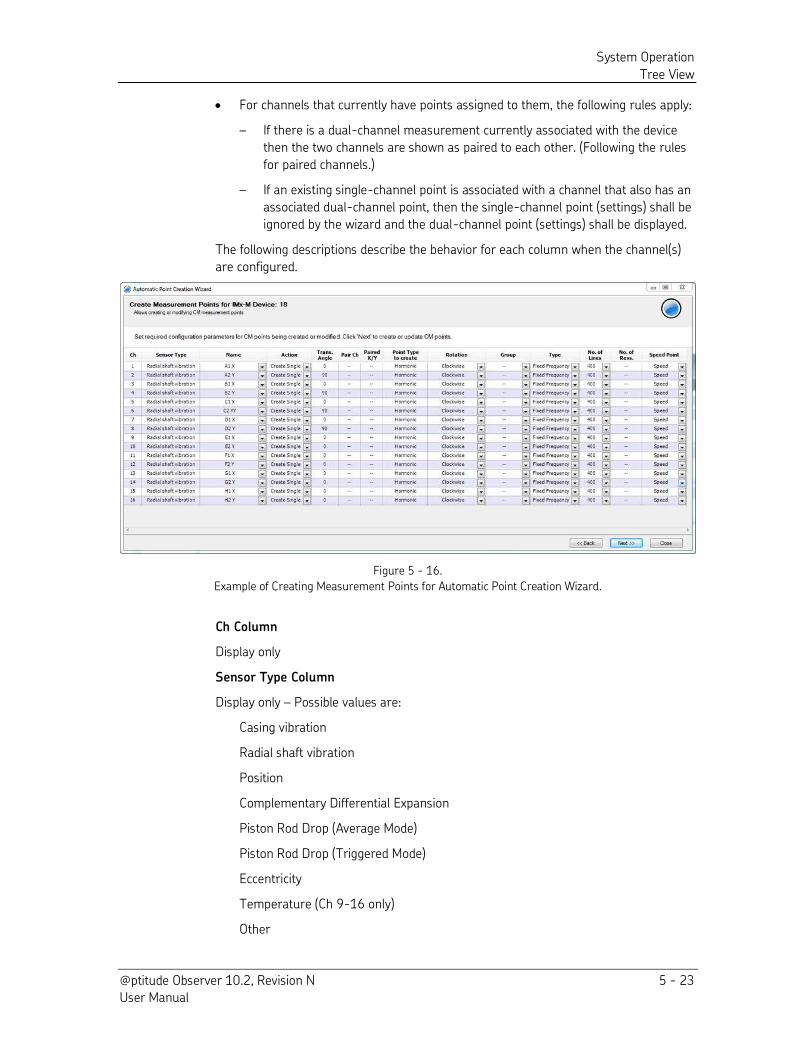
System Operation
Tree View
@ptitude Observer 10.2, Revision N 5 - 23 User Manual
For channels that currently have points assigned to them, the following rules apply:
– If there is a dual-channel measurement currently associated with the device
then the two channels are shown as paired to each other. (Following the rules
for paired channels.)
– If an existing single-channel point is associated with a channel that also has an
associated dual-channel point, then the single-channel point (settings) shall be
ignored by the wizard and the dual-channel point (settings) shall be displayed.
The following descriptions describe the behavior for each column when the channel(s)
are configured.
Figure 5 - 16.
Example of Creating Measurement Points for Automatic Point Creation Wizard.
Ch Column
Display only
Sensor Type Column
Display only – Possible values are:
Casing vibration
Radial shaft vibration
Position
Complementary Differential Expansion
Piston Rod Drop (Average Mode)
Piston Rod Drop (Triggered Mode)
Eccentricity
Temperature (Ch 9-16 only)
Other
System Operation
Tree View
5 - 24 @ptitude Observer 10.2, Revision N User Manual
If sensor type is not Casing Vibration or Radial shaft vibration:
All columns except Sensor type and Action are dashed out
All columns are disabled
Name Column
This column can be edited and also has a drop down menu that contains from 1 to 3
names. The names are:
The channel name from the Channel Settings page.
The channel name as defined in the database if the channel is being updated.
The channel name defined in the MHF file.
The control enables you to edit the name of the CM point. It is alpha-numeric with a
max length of 45 chars.
Note: If ‘Point Type to create’ is ‘Harmonic+SCL’ the harmonic point name will be the same as the content of this cell. The SCL point name will be the contents of the cell +
‘-SCL’.
If no name is supplied in the MHF file, then the default channel name will be the ‘Sensor type’ value (‘Casing vibration’ or ‘Radial shaft vibration’ Action Column
If a CM point is defined on this channel, then the control will be read only and the label
will be ‘Update’, otherwise ‘Create Single’ If a CM point is currently configured on this channel (or channel pair), then the control is
read-only and the value will be ‘Update’. Otherwise the options are ‘Create Dual’, ‘Create Single’ and ‘Ignore’.
Note, if ‘Ignore’ is selected, when the cell loses focus and all the values for this row (except ‘Ch’ and ‘Action’) become ‘--‘. The only field that can be edited is ‘Action’. If ‘Create Dual’ is selected both ‘Pair Ch’ and ‘Paired X/Y’ columns will be editable.
Otherwise, the columns are disabled.
Transducer Angle Column
Current transducer angle. Pulled from Channel Settings page.
Pair Channel Column
This defines the coupling between the channels. When a channel is selected, the
corresponding row shall become read only and the ‘Action’ of the paired row shall become ‘--‘. Conversely, if a row is de-selected in this control, its (formerly) paired channel shall
become re-enabled with saved values.
Paired X/Y Column
This enables you to set which channel shall be the ‘X’ and which shall be the ‘Y’. See picture below.
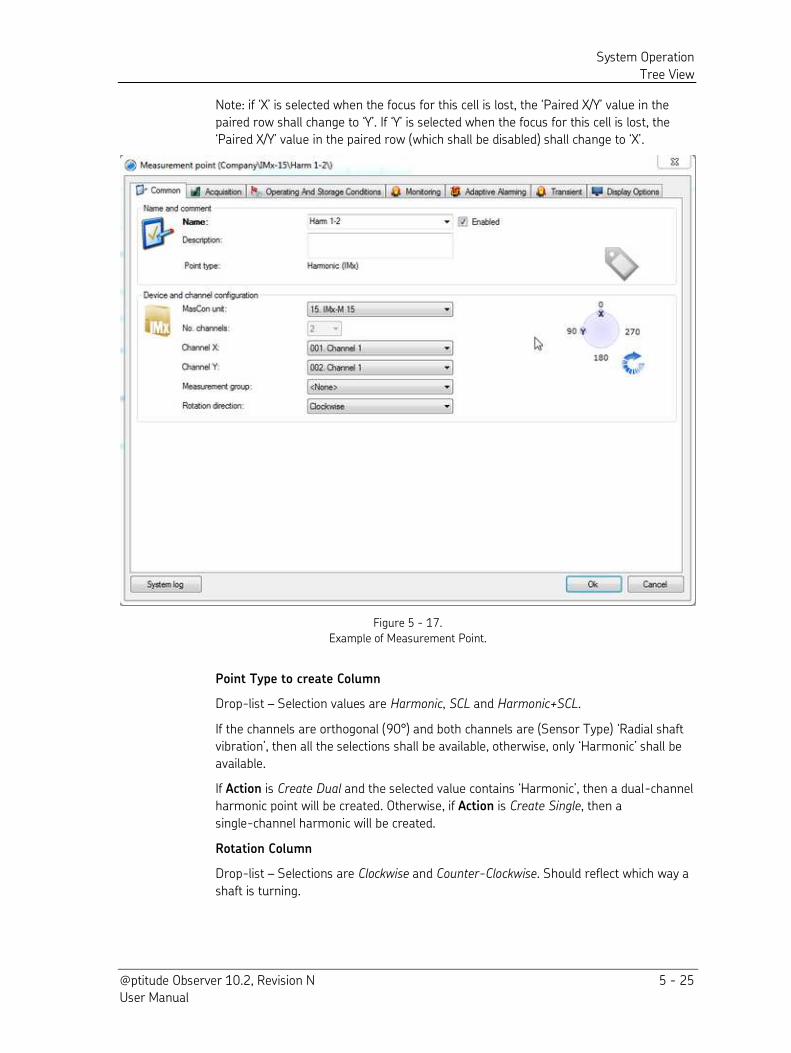
System Operation
Tree View
@ptitude Observer 10.2, Revision N 5 - 25 User Manual
Note: if ‘X’ is selected when the focus for this cell is lost, the ‘Paired X/Y’ value in the paired row shall change to ‘Y’. If ‘Y’ is selected when the focus for this cell is lost, the ‘Paired X/Y’ value in the paired row (which shall be disabled) shall change to ‘X’.
Figure 5 - 17.
Example of Measurement Point.
Point Type to create Column
Drop-list – Selection values are Harmonic, SCL and Harmonic+SCL.
If the channels are orthogonal (90°) and both channels are (Sensor Type) ‘Radial shaft vibration’, then all the selections shall be available, otherwise, only ‘Harmonic’ shall be available.
If Action is Create Dual and the selected value contains ‘Harmonic’, then a dual-channel
harmonic point will be created. Otherwise, if Action is Create Single, then a
single-channel harmonic will be created.
Rotation Column
Drop-list – Selections are Clockwise and Counter-Clockwise. Should reflect which way a
shaft is turning.
System Operation
Tree View
5 - 26 @ptitude Observer 10.2, Revision N User Manual
Group Column
When the point is created, it shall be placed in the group selected. Note, when a group is
selected and the cell loses focus, ‘Acq. Type’, ‘Speed Point’ and ‘No. of Lines’ shall reflect the group’s corresponding property values and become read-only. Conversely, if the
user selects ‘-‘, the 3 columns shall become editable with each cell’s default value. Type Column
Drop-list – Selections are Fixed Frequency and Order Track.
Editable if no group is selected. Otherwise, the group’s value shall be selected and this control shall be read-only until the Group value is (re)set to ‘-‘. Number of Lines Column
The selected value shall become the Acquisition No. of lines value (on the Acquisition
tab) for the CM point created from this row.
When a new Number of Lines is selected, the Number of Revs is changed if the existing
value is not valid for the new number of lines.
Number of Revolutions Column
Allows the user to set the number of lines for ‘Order Track’ points. Editable if no group is selected and ‘Acq. Type’ is ‘Order Track’. If Acq. Type is not Order Track, set to ‘--'.
Speed Point Column
Drop-list – Selections are all CM speed points available on this DAD, some of which may
have been created on a previous page.
Editable if no group is selected. Otherwise, the group’s value shall be selected and this control shall be read-only until the Group value is (re)set to ‘-‘. Updating Current Points
For any channel that is currently configured and is compatible, the Action field will be Update and the field will be read-only.
Dual Channel Points
If a dual channel point is currently configured and is compatible with the new
configuration then the page will display the settings for the paired channels, regardless
if there are other single channel points configured on the same channel.
The Point Type will be either SCL or Harmonic, if the point is an SCL or harmonic point.
If there are multiple dual channel points configured (both SCL and Harmonic), the Point
Type will be Harmonic+SCL.
Single Channel Points
If a single channel point is currently configured and is compatible with the new
configuration then the page will display the settings for the single channel. If there is a
dual channel point configured on the same channel, the dual channel point settings will
be displayed.
Back moves back to Create Measurement Groups page.
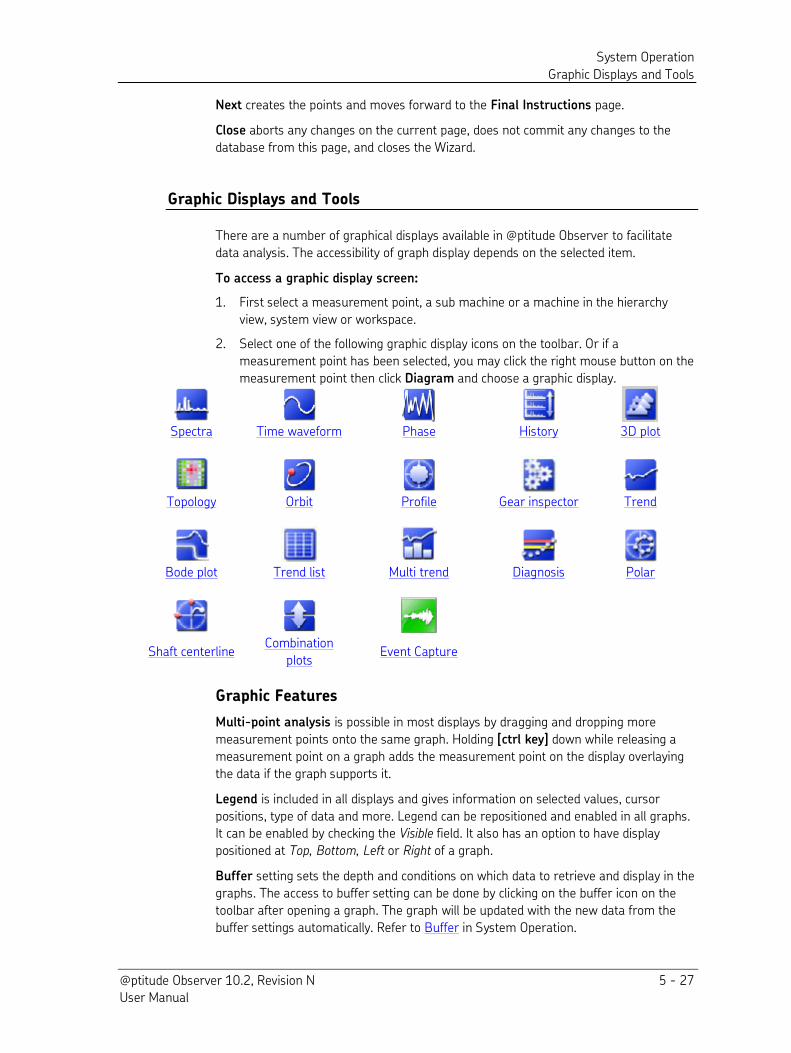
System Operation
Graphic Displays and Tools
@ptitude Observer 10.2, Revision N 5 - 27 User Manual
Next creates the points and moves forward to the Final Instructions page.
Close aborts any changes on the current page, does not commit any changes to the
database from this page, and closes the Wizard.
Graphic Displays and Tools
There are a number of graphical displays available in @ptitude Observer to facilitate
data analysis. The accessibility of graph display depends on the selected item.
To access a graphic display screen:
1. First select a measurement point, a sub machine or a machine in the hierarchy
view, system view or workspace.
2. Select one of the following graphic display icons on the toolbar. Or if a
measurement point has been selected, you may click the right mouse button on the
measurement point then click Diagram and choose a graphic display.
Spectra Time waveform Phase History 3D plot
Topology Orbit Profile Gear inspector Trend
Bode plot Trend list Multi trend Diagnosis Polar
Shaft centerline Combination
plots Event Capture
Graphic Features
Multi-point analysis is possible in most displays by dragging and dropping more
measurement points onto the same graph. Holding [ctrl key] down while releasing a
measurement point on a graph adds the measurement point on the display overlaying
the data if the graph supports it.
Legend is included in all displays and gives information on selected values, cursor
positions, type of data and more. Legend can be repositioned and enabled in all graphs. It can be enabled by checking the Visible field. It also has an option to have display
positioned at Top, Bottom, Left or Right of a graph.
Buffer setting sets the depth and conditions on which data to retrieve and display in the
graphs. The access to buffer setting can be done by clicking on the buffer icon on the
toolbar after opening a graph. The graph will be updated with the new data from the
buffer settings automatically. Refer to Buffer in System Operation.
System Operation
Graphic Displays and Tools
5 - 28 @ptitude Observer 10.2, Revision N User Manual
Graph Settings
To access graphic settings:
Click on the right mouse button on the graphic display screen, then select an option
from the pop-up menu.
It is also possible to update graphic settings of many measurement points at the
same time by right-clicking on a node or a machine in the hierarchy view, then
selecting Tools, and then Update graph settings.
Some edited graph settings can be saved on the measurement point while the others
are only temporary changes. When you modify certain settings within any one of the
following graph types for a single point, the system will automatically save your
modifications as your preferred settings for that graph and point. The next time you
access the same graph for the same point, the graph will retain any applicable
preferences you have set.
Graph types that save your preferences/modifications include:
Multi-Trend Spectra
Orbit Time Waveform
Shaft Centerline Trend
Graph settings that will be saved, where applicable, for the above graphs (specifically,
graph type/point type pairs) include the following:
Direction Legend Visible/Alignment Show phase
Display style Line style Start/stop markers
Frequency unit Mode Title Checkboxes
Invert rotation direction Set speed X axis
Invert view position Shaft cycle time Y axis
3D settings enables you to edit zoom, rotation and elevation scales for 3D plots.
Add cursor adds available cursors (markers) one at a time in the graph temporarily.
Descriptions of available cursors can be found in Tools for Graph Display section below.
Alarm circles hides/shows alarm circles for polar types of plots. One warning circle
(yellow) and one alarm circle (red) is drawn.
Annotations can be added as temporary notes for the current graph. They can be
useful for printouts of the current graph or screenshots. To add an annotation, right-
click on the graph and select the menu item Annotation/Add. A text box appears on the
top left corner. To edit the text in the text box, double click the text box. To end editing,
click the ESC key on the keyboard. Click the mouse and drag the annotation where you
want it to be placed.
Auto alarm is available for diagnosis display only. It is based on the data in the graph
which configures the alarm settings for the built-in intelligent diagnostic system.
Copy is available on all graphs in @ptitude Observer. It creates a screenshot of the
graph and puts it in the clipboard.
System Operation
Graphic Displays and Tools
@ptitude Observer 10.2, Revision N 5 - 29 User Manual
Correlation tolerance is available for the multi trend plot only. Correlation tolerance
sets the tolerance how far apart correlated measurements can be in order for them to
be drawn. Valid values can be set to Exact or ranging from 1 second up to 1 hour.
Curve fitting applies an approximation of a curve fit to the data currently displayed in
the plot. Options are 1st Degree, 2nd Degree, 3rd Degree and None.
DiagX enables you select machine parts that have the selected frequency from a list.
This edit is temporary. See DiagX in Tools for Graph Display below.
Exclude from diagnosis calculation excludes an FFT from diagnosis.
Export is available on all graphs in @ptitude Observer. It brings up an Export dialog
where you can select data to export in several different formats, including Excel and text
files.
Frequency unit switches the frequency unit between Hz, cpm and Order. The change
made to frequency unit can be saved on the measurement point.
Fault frequencies brings up a dialog where the user can choose machine parts from
the machine that the user is currently analyzing. When one or more machine parts are
selected, the frequencies for them are drawn in the graph. In this way the user can
clearly see if any of the machine parts are rendering high readings. The frequencies
displayed for the machine parts are automatically calculated by the running speed.
Go to [Double click] for diagnosis display, toggle back and forth between the main
diagnosis screen and the one graph selected. Go to [Double click] for history display to
open up the selected history in full screen mode.
Inverted enables you to change the sign of all data in the plot.
Legend sets the preferred position of the legend. Refer to Graphic Features for detailed
information. A general position of legend can be set for all graph displays at User
Preferences under Edit in Main Item.
Line style specifies the style of line to graph temporarily. The available line styles are Line, Point, and Line and point.
Listen to time waveform lets you listen to time waveform if you have installed a sound
card in your computer.
Markers enables you to add markers by [shift+click] or remove the nearest marker by
[ctrl+click] temporarily.
Max scale provides a list of of pre-defined maximum scale settings to select temporarily. Selecting auto will cause the system to select the most appropriate
maximum scale setting for the current data.
Min scale – provides a list of pre-defined minimum scale settings to select temporarily. Selecting auto will cause the system to select the most appropriate minimum scale
setting for the current data.
Mode is available for history graphic display only. You can change the mode temporarily
between spectra, time waveform, phase, spectra/time waveform, and spectra/time
waveform/phase.
Noise reduction sets the noise reduction level in percentage.
System Operation
Graphic Displays and Tools
5 - 30 @ptitude Observer 10.2, Revision N User Manual
Palette steps is available for gear inspector graphical display only. It indicates the total
number of different colors used for the display.
Reference stores the current active measurement in the graph as reference data for
the active measurement point, or clears the existing reference data. When setting a
measurement as a reference, the measurement will automatically be set with the Keep
forever flag. Keep forever flag can be edited in Meas. date interface. The reference data
are shown in the background of this graph every time data are displayed for this
measurement point.
Remove DC gives you the option to include the DC part as well as the AC part.
Normally, you remove the DC part of the signal when showing time waveform data.
Runout compensation is used to remove the problem that un-round shafts register
the shape of the shaft as vibration.
Save to Diagram Box saves the current graph settings under an assigned name. For
detailed information refer to Diagram View under Tree View in System Operation.
Scale enables you to select a value from the list of pre-defined scale settings. Selecting Auto will cause the system to select the most appropriate scale setting for the currently
displayed data. In most graphs, the mouse wheel can be used to increase or decrease
the max scale. The change made to scale can be saved on the measurement point.
Scale type switches between Lin (linear) and Log (logarithmic) scale. If Log is selected,
then the system will use the number of decades as the scale. Number of decades in
logarithmic scale is set in User Preferences interface under Edit in Menu Items section.
The change made to scale type can be saved on the measurement point.
Scaling changes how to display the scaling (detection) of the measurement temporarily. Scaling options are peak, PtP (peak to peak) or Rms. The scaling of the measurement
point is set back to the original value when you are done with the particular graph.
Sectors is available for gear inspector graphical display only. It indicates the number of
gear sectors. The default is 360 which means that there are 360 sectors of 1 degree
wide each where as if 180 was chosen, there are 180 sectors of 2 degrees wide each.
Set Speed enables manual adjustment for the speed reading of the current
measurement displayed in the Spectra plot.
Shaft is available for profile display only. It can be selected to determine for which shaft
the profile should be calculated.
Shaft Cycle time is available for Orbit plot only. Select from Tacho shaft, Order analysis
shaft or custom speed.
Show phase is available for trend graphic display only. It brings up the phase graphic
display on a split screen.
Show pulses is set by default which displays pulses in the graph. It can be unset if
needed.
Show values displays the values in 3D plots.
Start/stop markers hides/shows the start and stop markers for displays. The markers
typically show the first and the last value drawn in the graph.
Type enables you to select a certain type of orbit graph to display.
System Operation
Graphic Displays and Tools
@ptitude Observer 10.2, Revision N 5 - 31 User Manual
Unit is the measurement unit of the data displayed which can be changed temporarily.
Changes can be made between velocity, acceleration and displacement. The unit of the
measurement point is set back to the original value when you are done with the
particular graph.
X-axis changes the x-axis value to date/time, speed, process, or values temporarily. For
multi trend plot, it is also possible to set the x-axis to another measurement point which
will correlate the measurements of measurement points with each other.
Y-axis changes the y-axis value to amplitude or percent temporarily.
Z-axis is available for 3D plot only. Change the z-axis value to date/time, speed,
process, or even spreading temporarily.
Zero padding allows you to use zero padding temporarily.
Tools for Graph Display
There are a vast number of tools available in the graphs to facilitate data analysis. The
tools appear as green icons located on the toolbar.
Fault frequencies brings up a dialog where a user can choose machine parts
from the machine that the user is currently analyzing. When one or more machine parts
are selected, the frequencies for them are drawn in the graph. In this way the user can
clearly see if any of the machine parts are rendering high readings. The frequencies
displayed for the machine parts are automatically calculated by the running speed.
Previous fault frequency moves the active cursor to the previous machine part. [ctrl+right arrow key] also moves the active cursor to the previous machine part.
Next Fault frequency moves the active cursor to the next machine part.
[ctrl+left arrow key] also moves the active cursor to the next machine part.
DiagX is an intelligent part of the system build-in diagnostic system. To use it,
select a frequency in the graph that looks interesting and click DiagX button. A dialog
will appear listing all the machine parts and the probability that the selected frequency
including harmonics belong to a specific machine part. It is an easy way to find out
which part of the machine causes a high peak at a specific frequency. DiagX feature also
works for sideband and band cursors.
Single cursor adds a single cursor to the graph. Once a single cursor has been
added, you can switch between cursors by clicking on them which makes cursors active.
A single cursor can be moved with the [left arrow key] or [right arrow key]. [shift+left
arrow key] or [shift+right arrow key] causes a cursor move in bigger steps.
Band cursor adds a band cursor to the graph. It allows, by dragging the handles
of the band, to position and resize the band freely. A single band cursor can be moved
System Operation
Graphic Displays and Tools
5 - 32 @ptitude Observer 10.2, Revision N User Manual
with [left arrow key] or [right arrow key]. [shift+left arrow key] or [shift+right
arrow key] causes a cursor move in bigger steps.
A band cursor has three handles at the top of the band:
First handle: makes the band cursor bigger or smaller by clicking and dragging.
Third handle: makes the band cursor bigger or smaller by clicking and dragging.
Middle handle: repositions the band by clicking and dragging.
Harmonics produces a harmonic cursor of the currently selected frequency. This
cursor can also be moved with [shift key] or [ctrl key] in combination with [left arrow
key] and [right arrow key] or by clicking and dragging with the mouse. Harmonic
cursors can be between 10 and 200 which can be set in User Preferences in Edit menu
item.
Sidebands inserts a side band marker, marking 5 side bands below and 5 above
an X marker. There are two modes of a side band marker:
First mode: is the default mode. X is selected. The arrow keys allow you to move
the sideband marker but keep its size.
Second mode: is set by selecting -1 to -5 or 1 to 5. The arrow keys allow you to
resize the side band cursor.
Amplitude peaks cursor displays the highest peaks in the graph. It consists of a
horizontal line stretching across the graph. The horizontal line is movable in the vertical
axis by clicking and dragging the line. Peaks found above this line are marked with a
number.
Select measurement date enables you to select a date to see the
measurements from that date. Double clicking on a date refreshes the graph with the
data from the selected date.
Clear clears the graph of all tools, cursors and other custom markers that have
been added.
Zoom is available on almost all graphs. It zooms in only once at a time. Once the graph has been zoomed in, the graph is no longer in the zoom mode. You must
re-instate zoom mode by clicking the zoom icon each time you want to zoom in. Click
and drag the mouse button to the desired area. It is also possible to scroll the zoomed
graph while pressing [shift key], click and drag the mouse.
Zoom out brings a graph back to its original size.
System Operation
Graphic Displays and Tools
@ptitude Observer 10.2, Revision N 5 - 33 User Manual
Delete deletes a measurement from the database. Spectra, time waveform and
phase are considered as a single measurement, which means that deleting a spectra
will also delete the corresponding time waveform and phase data, if there are any.
Save saves the current live measurement from the graph to the database. The measurement will be marked with the storage reason manual because it was manually
saved and not by the time based schedule.
Live reads data immediately from the measurement point(s), and displays the
data in the graph. In order to get live data, a connection to the @ptitude Observer
Monitor computer has to be established. @ptitude Observer sends a request to
@ptitude Observer Monitor which redirects the request to the correct IMx/MasCon
device which then collects the data and sends it back through the reversed path.
Spectra
Use this icon to generate spectra display of a selected measurement point.
Spectra display show the vibration amplitude as a function of frequency. Regardless of
the input signal type, the amplitude can be shown in acceleration (m/s2 or g), velocity
(mm/s or ips) or displacement (um or mils) using a linear or logarithmic amplitude scale.
All defect frequencies for the whole machine are automatically calculated and can be
easily displayed in a plot as vertical bars.
Harmonics according to defect frequencies or any other frequency can be displayed by
an automatic fitting function. The spectra can be zoomed easily to any frequency range
inside the original spectra. Auto scaling or fixed scales can be applied, and the frequency
scale can be either Hz, cpm, or order.
In addition, spectra display supports the zero padding which can be used to more easily
identify specific peaks in the FFT. With a simple right-click, it is possible to set the data
currently displayed in this graph as reference data for the future.
Below is an example of spectra display of binary data type with overlay data and live
data.

System Operation
Graphic Displays and Tools
5 - 34 @ptitude Observer 10.2, Revision N User Manual
Figure 5 - 18.
Example of Spectra Display.
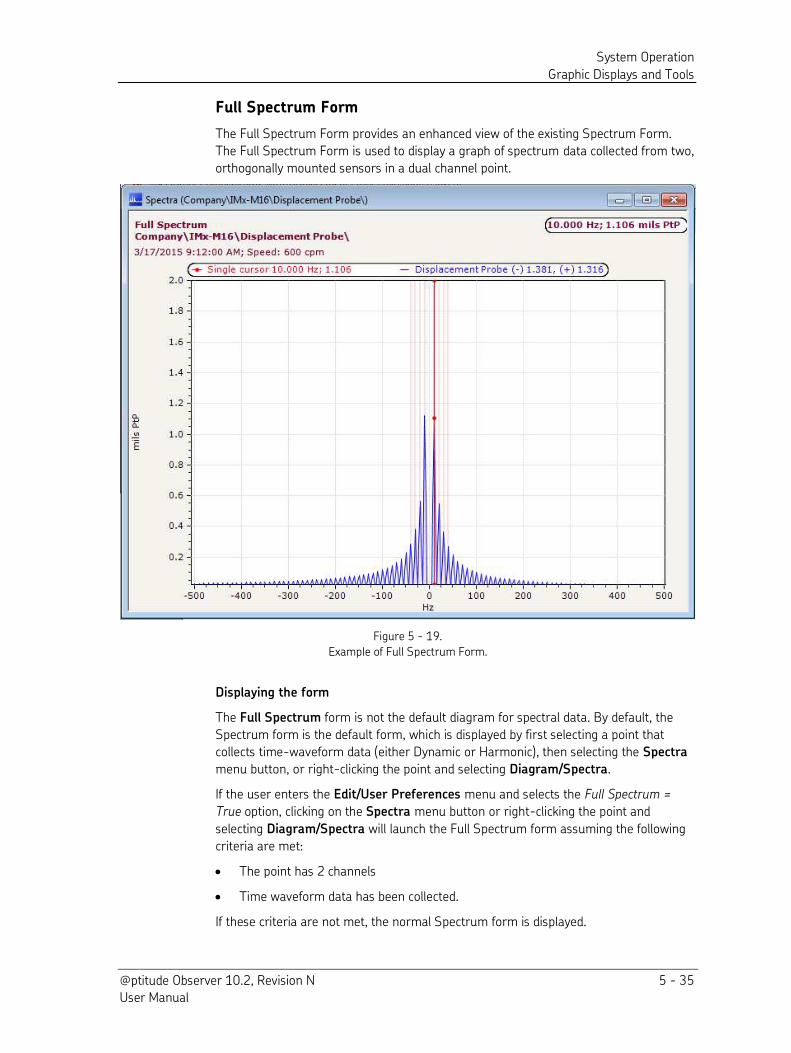
System Operation
Graphic Displays and Tools
@ptitude Observer 10.2, Revision N 5 - 35 User Manual
Full Spectrum Form
The Full Spectrum Form provides an enhanced view of the existing Spectrum Form.
The Full Spectrum Form is used to display a graph of spectrum data collected from two,
orthogonally mounted sensors in a dual channel point.
Figure 5 - 19.
Example of Full Spectrum Form.
Displaying the form
The Full Spectrum form is not the default diagram for spectral data. By default, the
Spectrum form is the default form, which is displayed by first selecting a point that
collects time-waveform data (either Dynamic or Harmonic), then selecting the Spectra
menu button, or right-clicking the point and selecting Diagram/Spectra.
If the user enters the Edit/User Preferences menu and selects the Full Spectrum =
True option, clicking on the Spectra menu button or right-clicking the point and
selecting Diagram/Spectra will launch the Full Spectrum form assuming the following
criteria are met:
The point has 2 channels
Time waveform data has been collected.
If these criteria are not met, the normal Spectrum form is displayed.
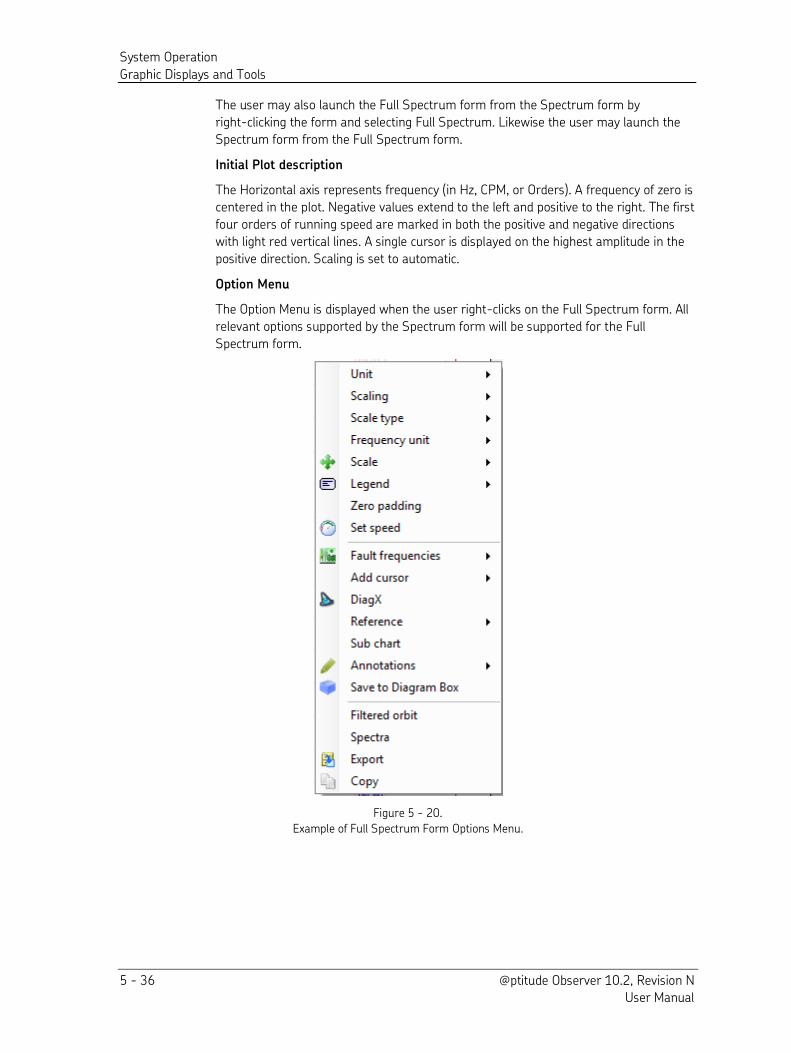
System Operation
Graphic Displays and Tools
5 - 36 @ptitude Observer 10.2, Revision N User Manual
The user may also launch the Full Spectrum form from the Spectrum form by
right-clicking the form and selecting Full Spectrum. Likewise the user may launch the
Spectrum form from the Full Spectrum form.
Initial Plot description
The Horizontal axis represents frequency (in Hz, CPM, or Orders). A frequency of zero is
centered in the plot. Negative values extend to the left and positive to the right. The first
four orders of running speed are marked in both the positive and negative directions
with light red vertical lines. A single cursor is displayed on the highest amplitude in the
positive direction. Scaling is set to automatic.
Option Menu
The Option Menu is displayed when the user right-clicks on the Full Spectrum form. All
relevant options supported by the Spectrum form will be supported for the Full
Spectrum form.
Figure 5 - 20.
Example of Full Spectrum Form Options Menu.
System Operation
Graphic Displays and Tools
@ptitude Observer 10.2, Revision N 5 - 37 User Manual
Time Waveform
Use this icon to generate a time waveform display of a selected measurement.
Time waveform display shows the vibration magnitude as a function of time. Regardless
of the signal type the amplitude can be shown in acceleration (m/s2 or g), velocity
(mm/s or ips) or displacement (µm or mils). If the measurement on display is triggered
using a digital input, the tacho pulses are shown automatically making it easier to track
each revolution.
The time waveform can be easily zoomed and the scaling can be done automatically or
manually.
By a simple right-click on the mouse, the user can listen to the time waveform using the
computer speakers and can detect, by listening to the sound of the machine, abnormal
sounds. Listen function of time waveform is opened in an external window. Here, speed
and length of the time waveform can be modified while listening. It can also be played
back.
The figure below is an example of time waveform display of binary data type with
overlay data and live data.
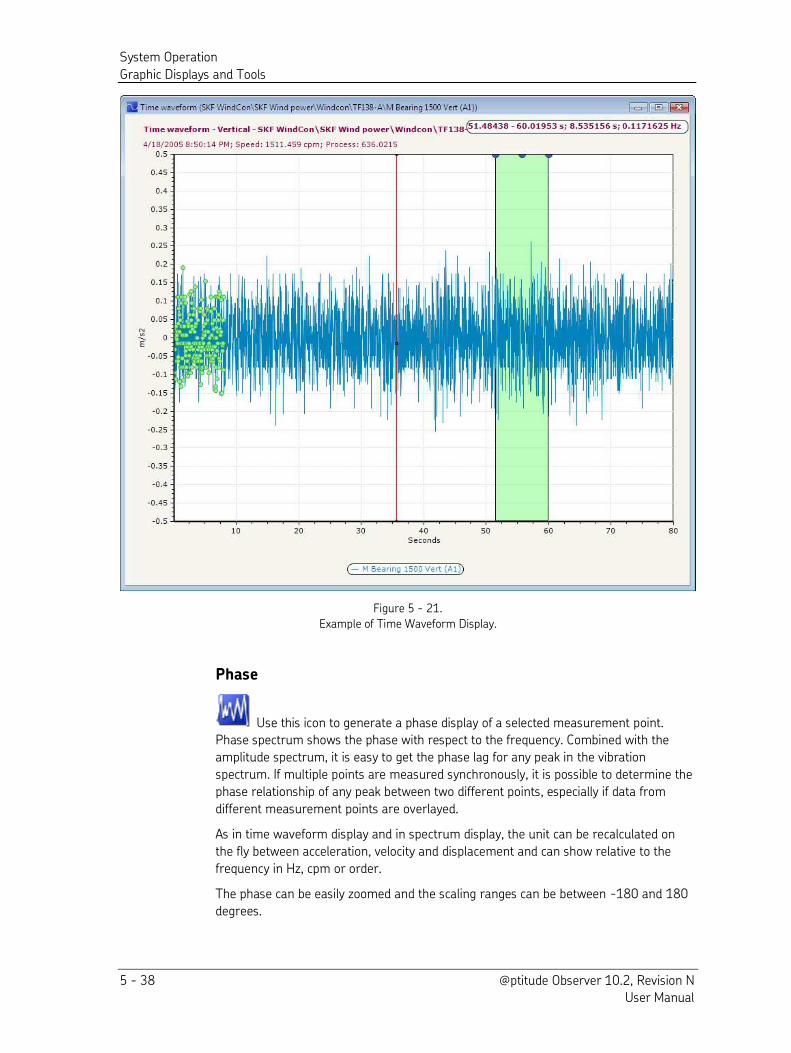
System Operation
Graphic Displays and Tools
5 - 38 @ptitude Observer 10.2, Revision N User Manual
Figure 5 - 21.
Example of Time Waveform Display.
Phase
Use this icon to generate a phase display of a selected measurement point. Phase spectrum shows the phase with respect to the frequency. Combined with the
amplitude spectrum, it is easy to get the phase lag for any peak in the vibration
spectrum. If multiple points are measured synchronously, it is possible to determine the
phase relationship of any peak between two different points, especially if data from
different measurement points are overlayed.
As in time waveform display and in spectrum display, the unit can be recalculated on
the fly between acceleration, velocity and displacement and can show relative to the
frequency in Hz, cpm or order.
The phase can be easily zoomed and the scaling ranges can be between -180 and 180
degrees.
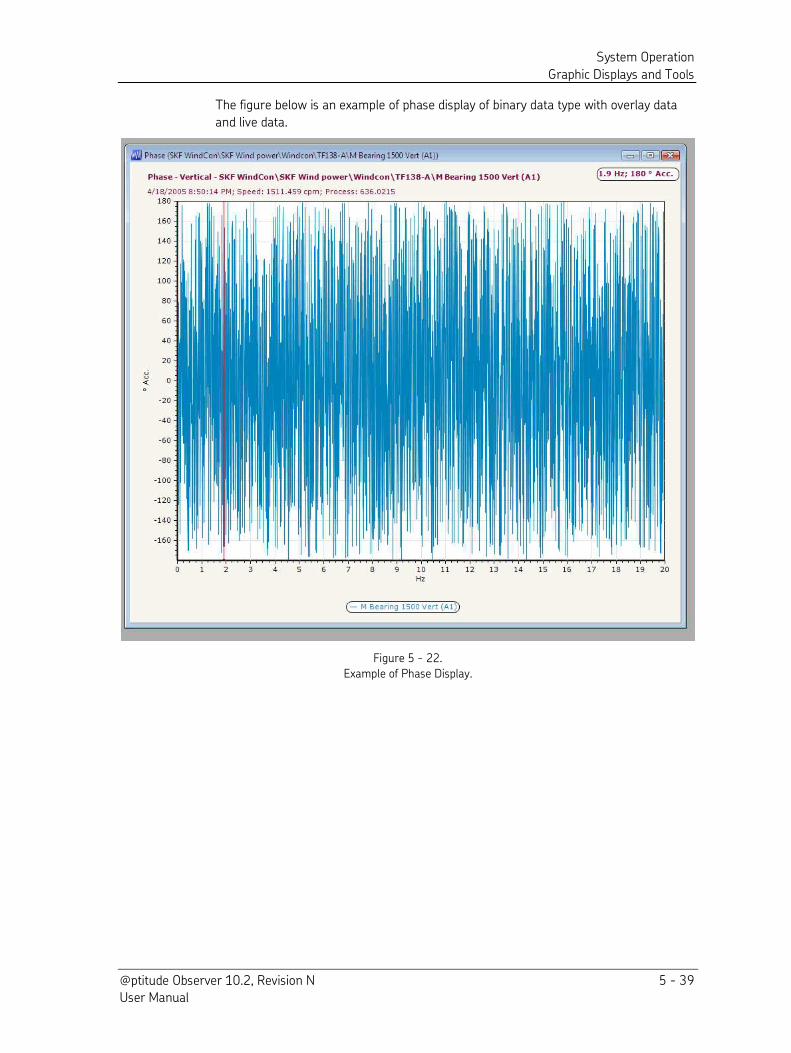
System Operation
Graphic Displays and Tools
@ptitude Observer 10.2, Revision N 5 - 39 User Manual
The figure below is an example of phase display of binary data type with overlay data
and live data.
Figure 5 - 22.
Example of Phase Display.
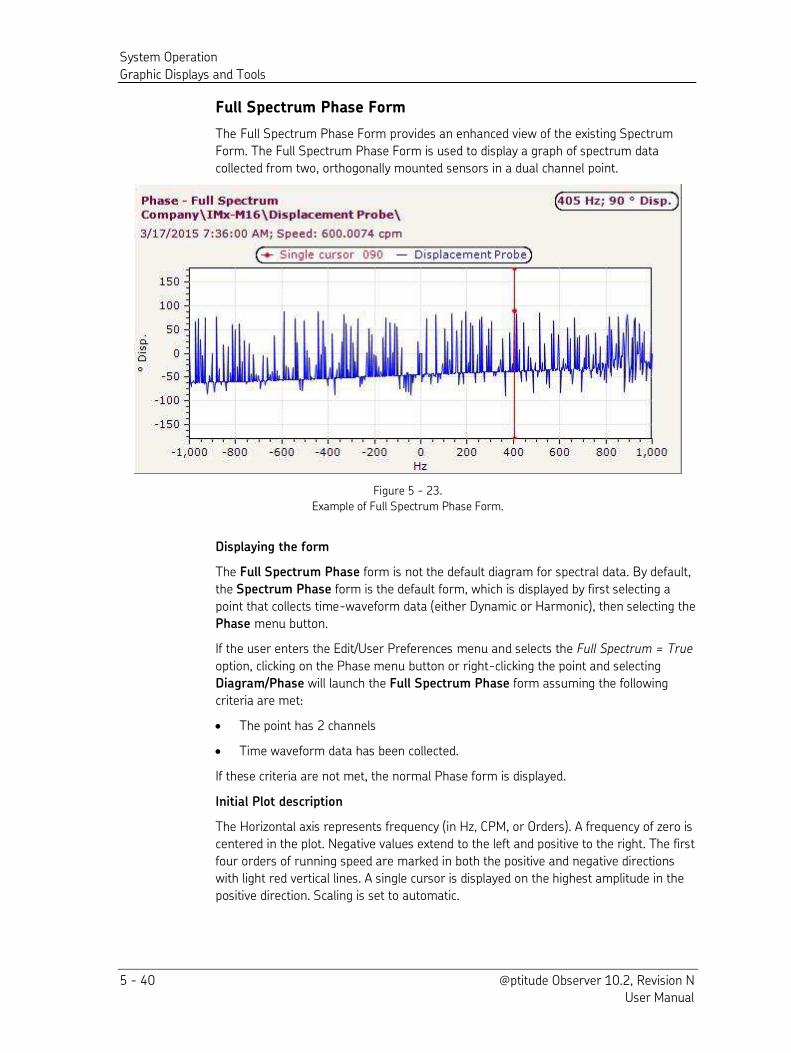
System Operation
Graphic Displays and Tools
5 - 40 @ptitude Observer 10.2, Revision N User Manual
Full Spectrum Phase Form
The Full Spectrum Phase Form provides an enhanced view of the existing Spectrum
Form. The Full Spectrum Phase Form is used to display a graph of spectrum data
collected from two, orthogonally mounted sensors in a dual channel point.
Figure 5 - 23.
Example of Full Spectrum Phase Form.
Displaying the form
The Full Spectrum Phase form is not the default diagram for spectral data. By default,
the Spectrum Phase form is the default form, which is displayed by first selecting a
point that collects time-waveform data (either Dynamic or Harmonic), then selecting the
Phase menu button.
If the user enters the Edit/User Preferences menu and selects the Full Spectrum = True
option, clicking on the Phase menu button or right-clicking the point and selecting
Diagram/Phase will launch the Full Spectrum Phase form assuming the following
criteria are met:
The point has 2 channels
Time waveform data has been collected.
If these criteria are not met, the normal Phase form is displayed.
Initial Plot description
The Horizontal axis represents frequency (in Hz, CPM, or Orders). A frequency of zero is
centered in the plot. Negative values extend to the left and positive to the right. The first
four orders of running speed are marked in both the positive and negative directions
with light red vertical lines. A single cursor is displayed on the highest amplitude in the
positive direction. Scaling is set to automatic.
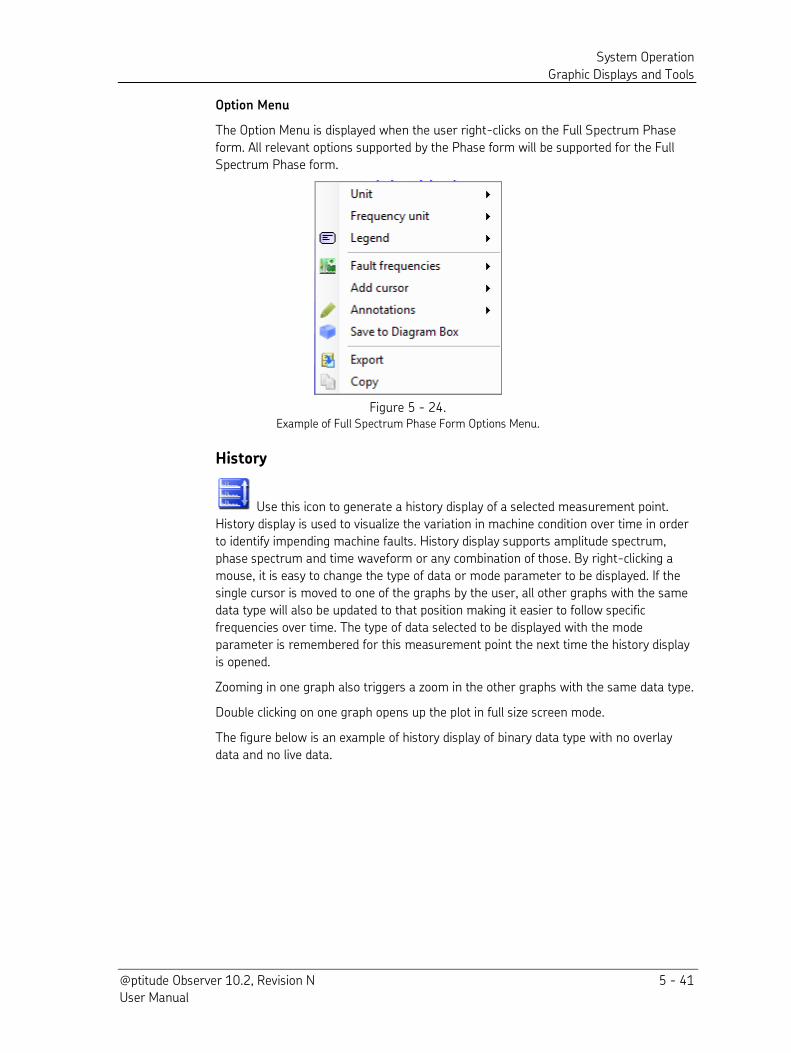
System Operation
Graphic Displays and Tools
@ptitude Observer 10.2, Revision N 5 - 41 User Manual
Option Menu
The Option Menu is displayed when the user right-clicks on the Full Spectrum Phase
form. All relevant options supported by the Phase form will be supported for the Full
Spectrum Phase form.
Figure 5 - 24. Example of Full Spectrum Phase Form Options Menu.
History
Use this icon to generate a history display of a selected measurement point.
History display is used to visualize the variation in machine condition over time in order
to identify impending machine faults. History display supports amplitude spectrum,
phase spectrum and time waveform or any combination of those. By right-clicking a
mouse, it is easy to change the type of data or mode parameter to be displayed. If the
single cursor is moved to one of the graphs by the user, all other graphs with the same
data type will also be updated to that position making it easier to follow specific
frequencies over time. The type of data selected to be displayed with the mode
parameter is remembered for this measurement point the next time the history display
is opened.
Zooming in one graph also triggers a zoom in the other graphs with the same data type.
Double clicking on one graph opens up the plot in full size screen mode.
The figure below is an example of history display of binary data type with no overlay
data and no live data.
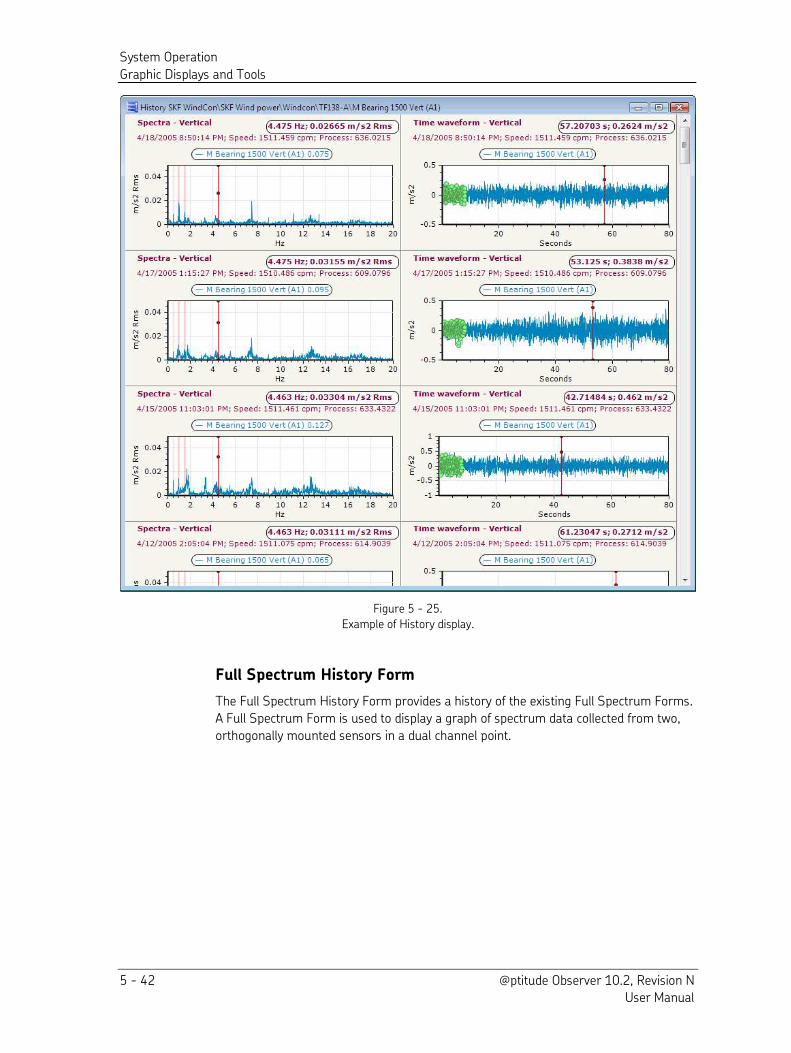
System Operation
Graphic Displays and Tools
5 - 42 @ptitude Observer 10.2, Revision N User Manual
Figure 5 - 25.
Example of History display.
Full Spectrum History Form
The Full Spectrum History Form provides a history of the existing Full Spectrum Forms.
A Full Spectrum Form is used to display a graph of spectrum data collected from two,
orthogonally mounted sensors in a dual channel point.
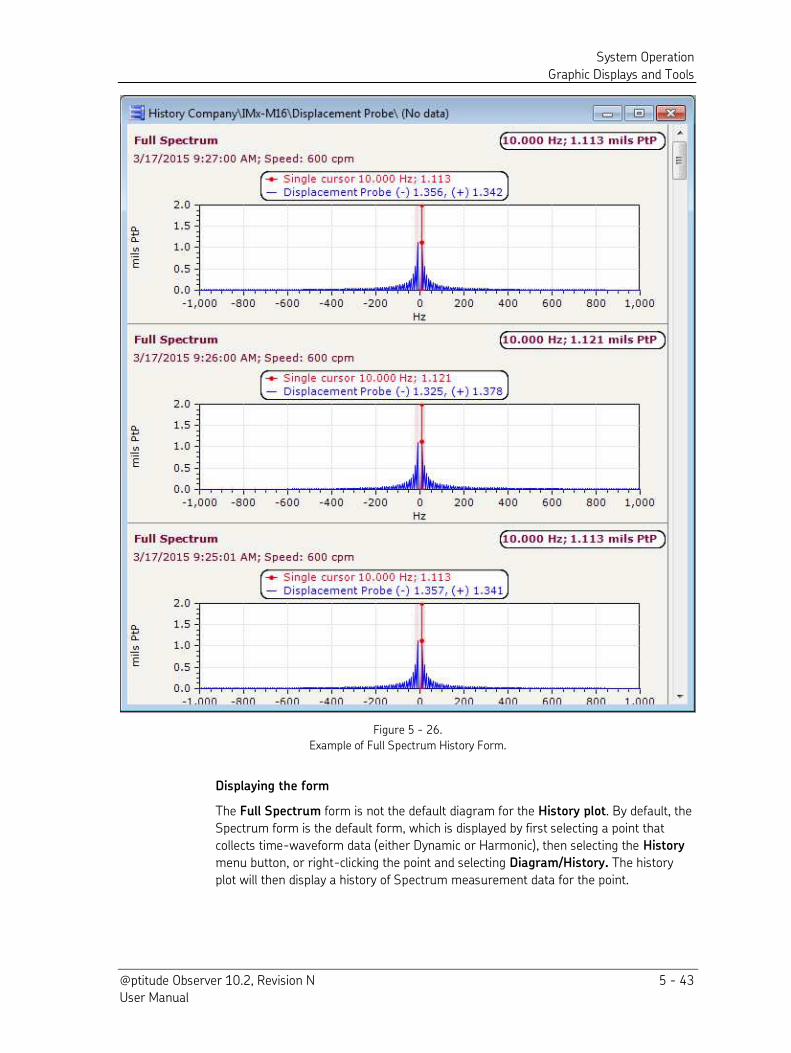
System Operation
Graphic Displays and Tools
@ptitude Observer 10.2, Revision N 5 - 43 User Manual
Figure 5 - 26.
Example of Full Spectrum History Form.
Displaying the form
The Full Spectrum form is not the default diagram for the History plot. By default, the
Spectrum form is the default form, which is displayed by first selecting a point that
collects time-waveform data (either Dynamic or Harmonic), then selecting the History
menu button, or right-clicking the point and selecting Diagram/History. The history
plot will then display a history of Spectrum measurement data for the point.
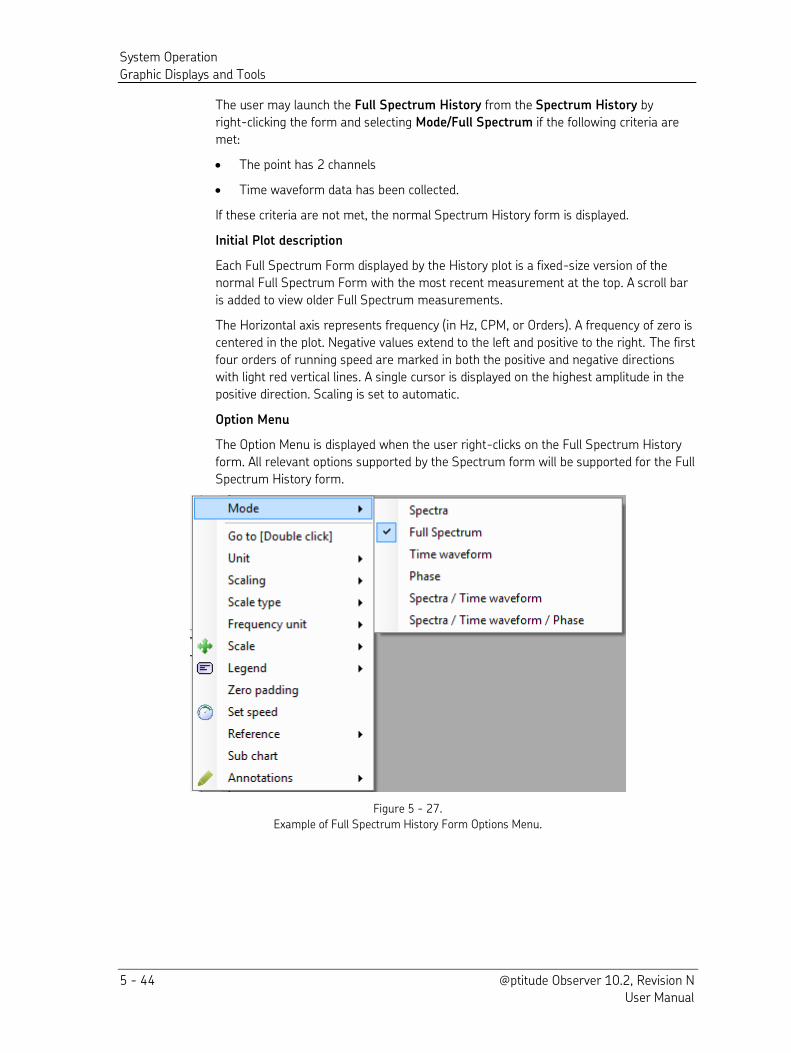
System Operation
Graphic Displays and Tools
5 - 44 @ptitude Observer 10.2, Revision N User Manual
The user may launch the Full Spectrum History from the Spectrum History by
right-clicking the form and selecting Mode/Full Spectrum if the following criteria are
met:
The point has 2 channels
Time waveform data has been collected.
If these criteria are not met, the normal Spectrum History form is displayed.
Initial Plot description
Each Full Spectrum Form displayed by the History plot is a fixed-size version of the
normal Full Spectrum Form with the most recent measurement at the top. A scroll bar
is added to view older Full Spectrum measurements.
The Horizontal axis represents frequency (in Hz, CPM, or Orders). A frequency of zero is
centered in the plot. Negative values extend to the left and positive to the right. The first
four orders of running speed are marked in both the positive and negative directions
with light red vertical lines. A single cursor is displayed on the highest amplitude in the
positive direction. Scaling is set to automatic.
Option Menu
The Option Menu is displayed when the user right-clicks on the Full Spectrum History
form. All relevant options supported by the Spectrum form will be supported for the Full
Spectrum History form.
Figure 5 - 27.
Example of Full Spectrum History Form Options Menu.
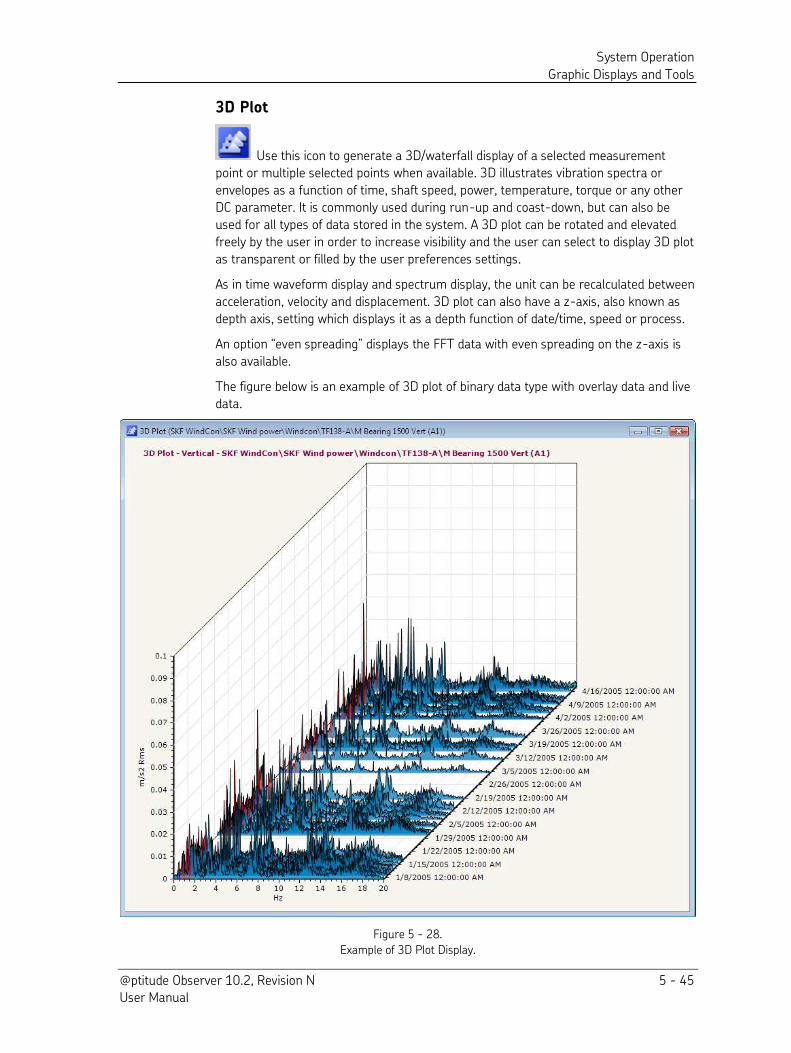
System Operation
Graphic Displays and Tools
@ptitude Observer 10.2, Revision N 5 - 45 User Manual
3D Plot
Use this icon to generate a 3D/waterfall display of a selected measurement
point or multiple selected points when available. 3D illustrates vibration spectra or
envelopes as a function of time, shaft speed, power, temperature, torque or any other
DC parameter. It is commonly used during run-up and coast-down, but can also be
used for all types of data stored in the system. A 3D plot can be rotated and elevated
freely by the user in order to increase visibility and the user can select to display 3D plot
as transparent or filled by the user preferences settings.
As in time waveform display and spectrum display, the unit can be recalculated between
acceleration, velocity and displacement. 3D plot can also have a z-axis, also known as
depth axis, setting which displays it as a depth function of date/time, speed or process.
An option “even spreading” displays the FFT data with even spreading on the z-axis is
also available.
The figure below is an example of 3D plot of binary data type with overlay data and live
data.
Figure 5 - 28.
Example of 3D Plot Display.
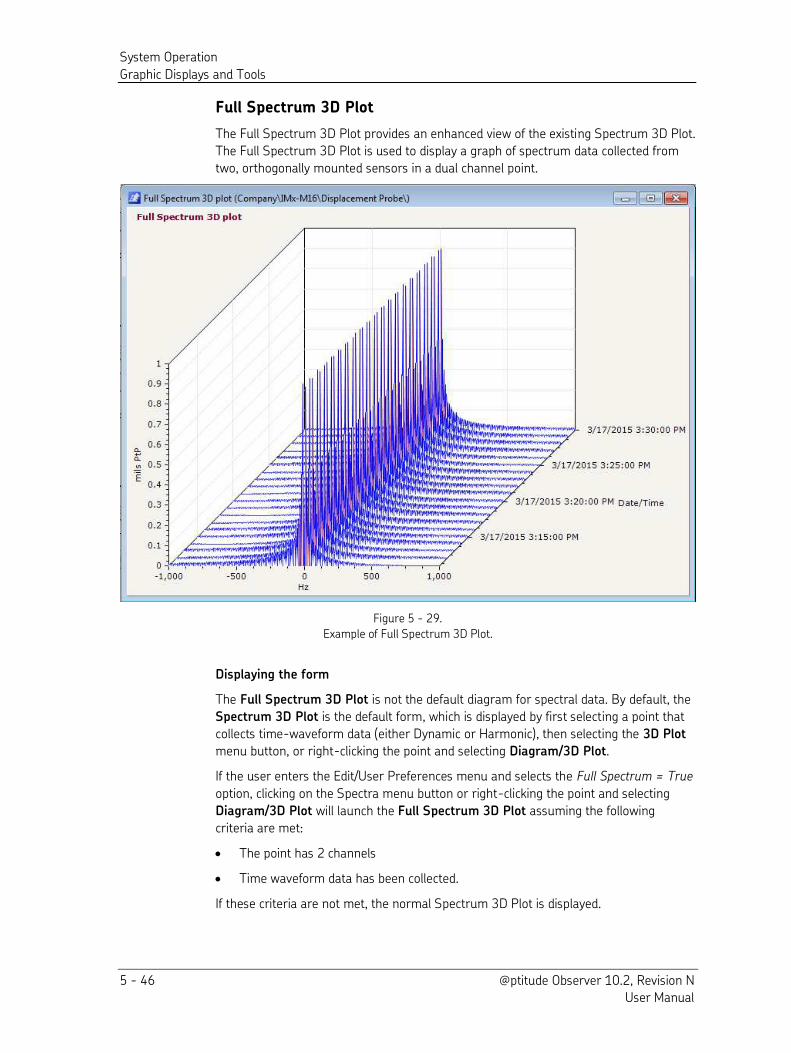
System Operation
Graphic Displays and Tools
5 - 46 @ptitude Observer 10.2, Revision N User Manual
Full Spectrum 3D Plot
The Full Spectrum 3D Plot provides an enhanced view of the existing Spectrum 3D Plot.
The Full Spectrum 3D Plot is used to display a graph of spectrum data collected from
two, orthogonally mounted sensors in a dual channel point.
Figure 5 - 29.
Example of Full Spectrum 3D Plot.
Displaying the form
The Full Spectrum 3D Plot is not the default diagram for spectral data. By default, the
Spectrum 3D Plot is the default form, which is displayed by first selecting a point that
collects time-waveform data (either Dynamic or Harmonic), then selecting the 3D Plot
menu button, or right-clicking the point and selecting Diagram/3D Plot.
If the user enters the Edit/User Preferences menu and selects the Full Spectrum = True
option, clicking on the Spectra menu button or right-clicking the point and selecting
Diagram/3D Plot will launch the Full Spectrum 3D Plot assuming the following
criteria are met:
The point has 2 channels
Time waveform data has been collected.
If these criteria are not met, the normal Spectrum 3D Plot is displayed.
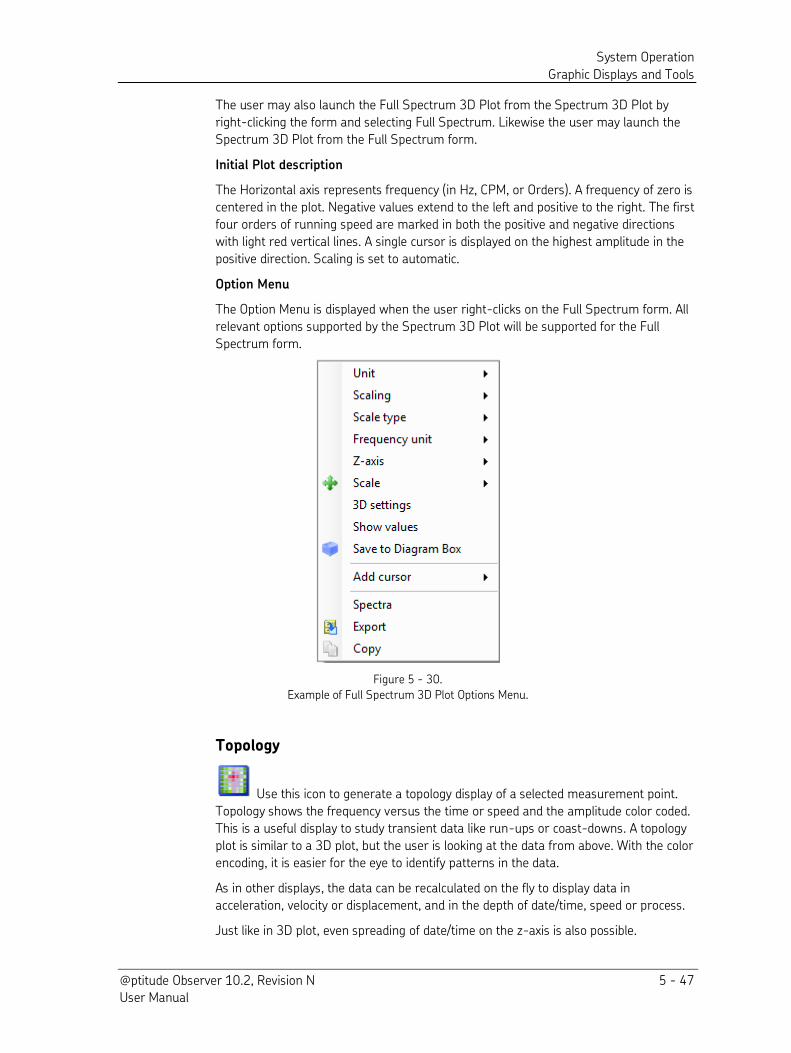
System Operation
Graphic Displays and Tools
@ptitude Observer 10.2, Revision N 5 - 47 User Manual
The user may also launch the Full Spectrum 3D Plot from the Spectrum 3D Plot by
right-clicking the form and selecting Full Spectrum. Likewise the user may launch the
Spectrum 3D Plot from the Full Spectrum form.
Initial Plot description
The Horizontal axis represents frequency (in Hz, CPM, or Orders). A frequency of zero is
centered in the plot. Negative values extend to the left and positive to the right. The first
four orders of running speed are marked in both the positive and negative directions
with light red vertical lines. A single cursor is displayed on the highest amplitude in the
positive direction. Scaling is set to automatic.
Option Menu
The Option Menu is displayed when the user right-clicks on the Full Spectrum form. All
relevant options supported by the Spectrum 3D Plot will be supported for the Full
Spectrum form.
Figure 5 - 30.
Example of Full Spectrum 3D Plot Options Menu.
Topology
Use this icon to generate a topology display of a selected measurement point.
Topology shows the frequency versus the time or speed and the amplitude color coded.
This is a useful display to study transient data like run-ups or coast-downs. A topology
plot is similar to a 3D plot, but the user is looking at the data from above. With the color
encoding, it is easier for the eye to identify patterns in the data.
As in other displays, the data can be recalculated on the fly to display data in
acceleration, velocity or displacement, and in the depth of date/time, speed or process.
Just like in 3D plot, even spreading of date/time on the z-axis is also possible.
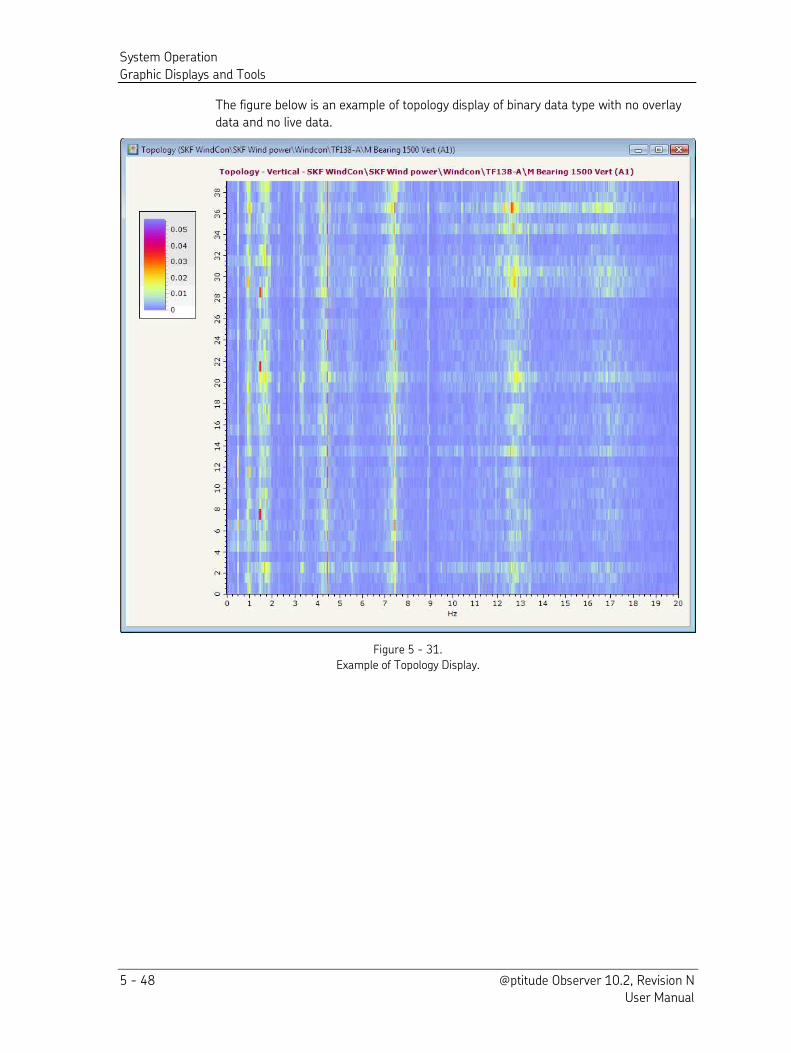
System Operation
Graphic Displays and Tools
5 - 48 @ptitude Observer 10.2, Revision N User Manual
The figure below is an example of topology display of binary data type with no overlay
data and no live data.
Figure 5 - 31.
Example of Topology Display.
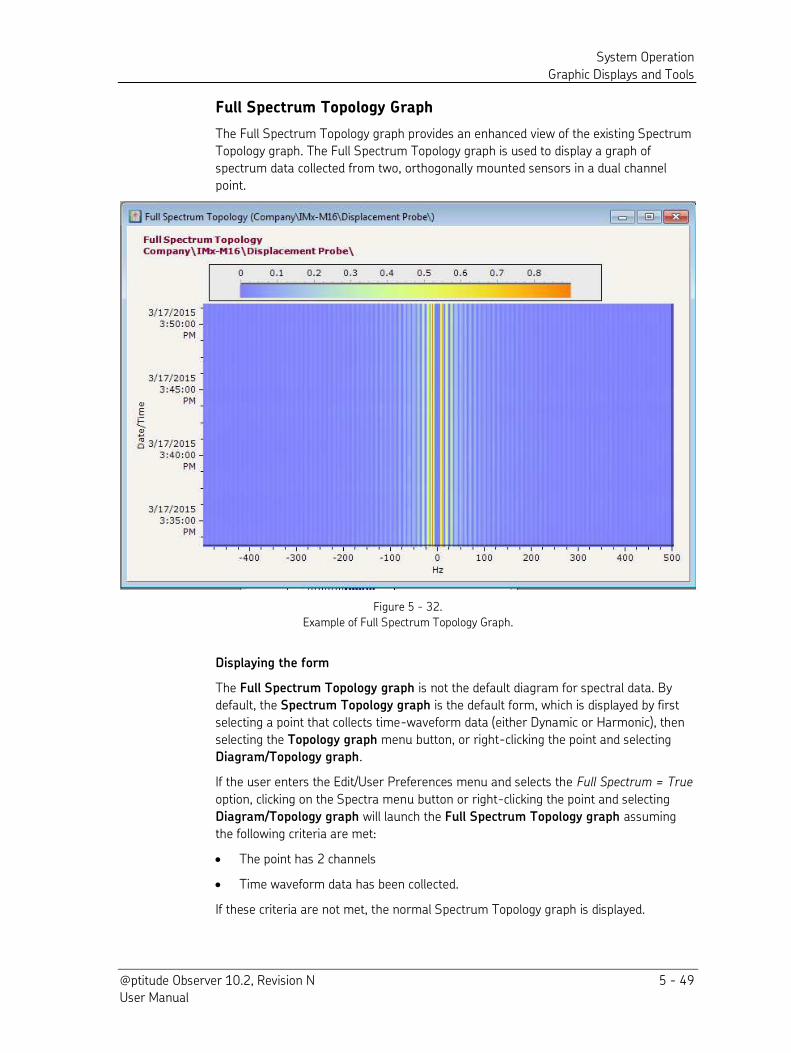
System Operation
Graphic Displays and Tools
@ptitude Observer 10.2, Revision N 5 - 49 User Manual
Full Spectrum Topology Graph
The Full Spectrum Topology graph provides an enhanced view of the existing Spectrum
Topology graph. The Full Spectrum Topology graph is used to display a graph of
spectrum data collected from two, orthogonally mounted sensors in a dual channel
point.
Figure 5 - 32.
Example of Full Spectrum Topology Graph.
Displaying the form
The Full Spectrum Topology graph is not the default diagram for spectral data. By
default, the Spectrum Topology graph is the default form, which is displayed by first
selecting a point that collects time-waveform data (either Dynamic or Harmonic), then
selecting the Topology graph menu button, or right-clicking the point and selecting
Diagram/Topology graph.
If the user enters the Edit/User Preferences menu and selects the Full Spectrum = True
option, clicking on the Spectra menu button or right-clicking the point and selecting
Diagram/Topology graph will launch the Full Spectrum Topology graph assuming
the following criteria are met:
The point has 2 channels
Time waveform data has been collected.
If these criteria are not met, the normal Spectrum Topology graph is displayed.
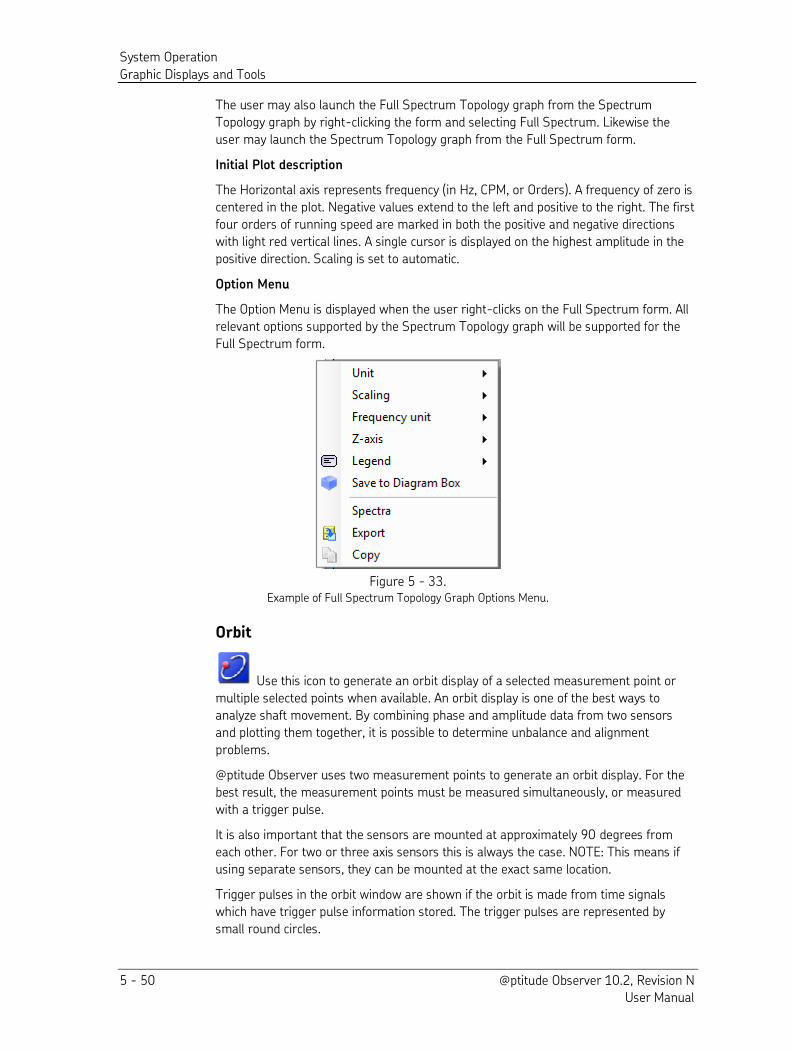
System Operation
Graphic Displays and Tools
5 - 50 @ptitude Observer 10.2, Revision N User Manual
The user may also launch the Full Spectrum Topology graph from the Spectrum
Topology graph by right-clicking the form and selecting Full Spectrum. Likewise the
user may launch the Spectrum Topology graph from the Full Spectrum form.
Initial Plot description
The Horizontal axis represents frequency (in Hz, CPM, or Orders). A frequency of zero is
centered in the plot. Negative values extend to the left and positive to the right. The first
four orders of running speed are marked in both the positive and negative directions
with light red vertical lines. A single cursor is displayed on the highest amplitude in the
positive direction. Scaling is set to automatic.
Option Menu
The Option Menu is displayed when the user right-clicks on the Full Spectrum form. All
relevant options supported by the Spectrum Topology graph will be supported for the
Full Spectrum form.
Figure 5 - 33. Example of Full Spectrum Topology Graph Options Menu.
Orbit
Use this icon to generate an orbit display of a selected measurement point or
multiple selected points when available. An orbit display is one of the best ways to
analyze shaft movement. By combining phase and amplitude data from two sensors
and plotting them together, it is possible to determine unbalance and alignment
problems.
@ptitude Observer uses two measurement points to generate an orbit display. For the
best result, the measurement points must be measured simultaneously, or measured
with a trigger pulse.
It is also important that the sensors are mounted at approximately 90 degrees from
each other. For two or three axis sensors this is always the case. NOTE: This means if
using separate sensors, they can be mounted at the exact same location.
Trigger pulses in the orbit window are shown if the orbit is made from time signals
which have trigger pulse information stored. The trigger pulses are represented by
small round circles.
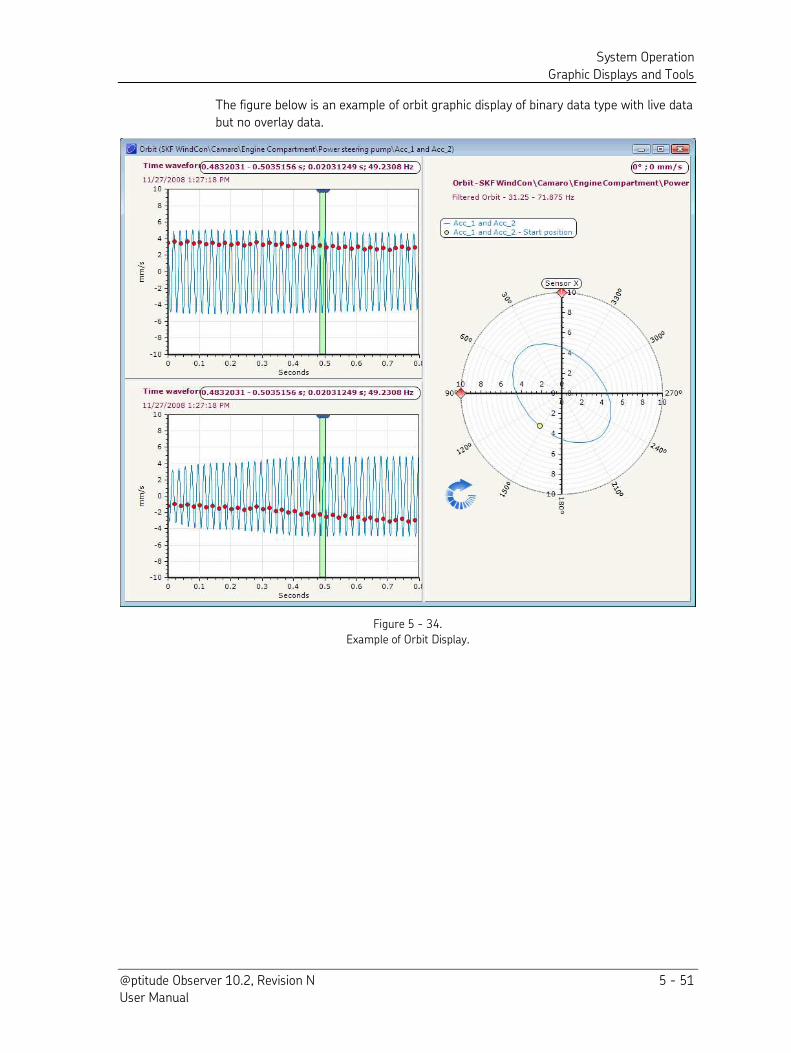
System Operation
Graphic Displays and Tools
@ptitude Observer 10.2, Revision N 5 - 51 User Manual
The figure below is an example of orbit graphic display of binary data type with live data
but no overlay data.
Figure 5 - 34.
Example of Orbit Display.
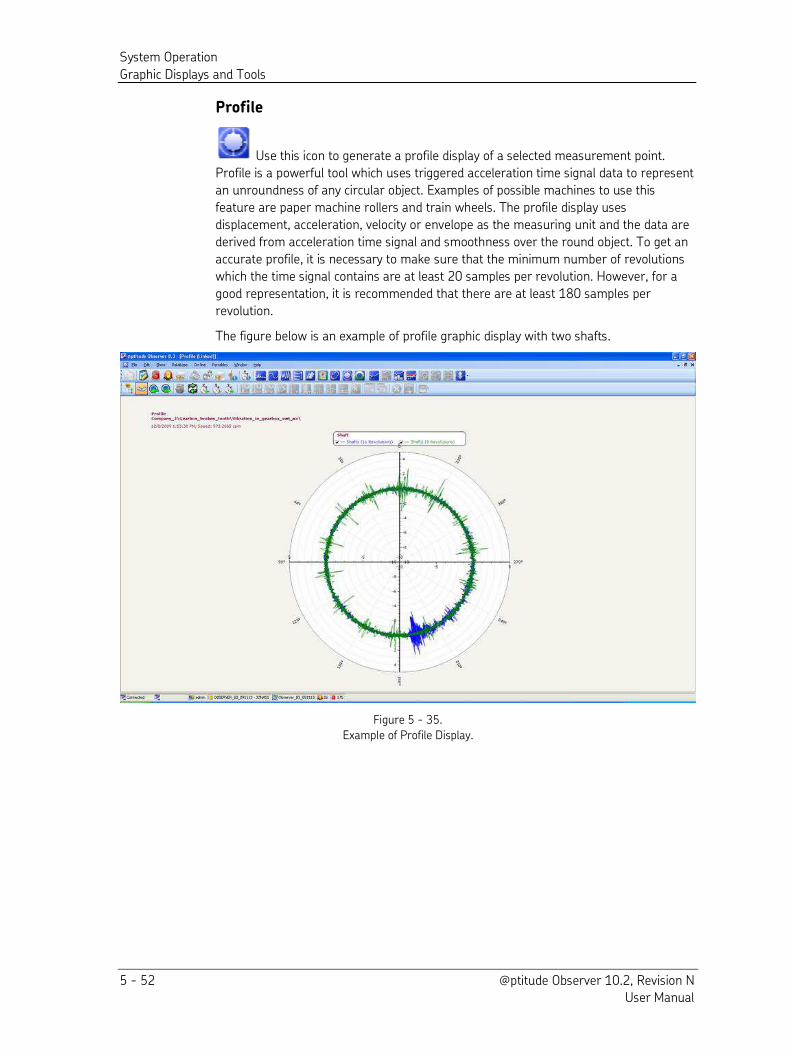
System Operation
Graphic Displays and Tools
5 - 52 @ptitude Observer 10.2, Revision N User Manual
Profile
Use this icon to generate a profile display of a selected measurement point.
Profile is a powerful tool which uses triggered acceleration time signal data to represent
an unroundness of any circular object. Examples of possible machines to use this
feature are paper machine rollers and train wheels. The profile display uses
displacement, acceleration, velocity or envelope as the measuring unit and the data are
derived from acceleration time signal and smoothness over the round object. To get an
accurate profile, it is necessary to make sure that the minimum number of revolutions
which the time signal contains are at least 20 samples per revolution. However, for a
good representation, it is recommended that there are at least 180 samples per
revolution.
The figure below is an example of profile graphic display with two shafts.
Figure 5 - 35.
Example of Profile Display.
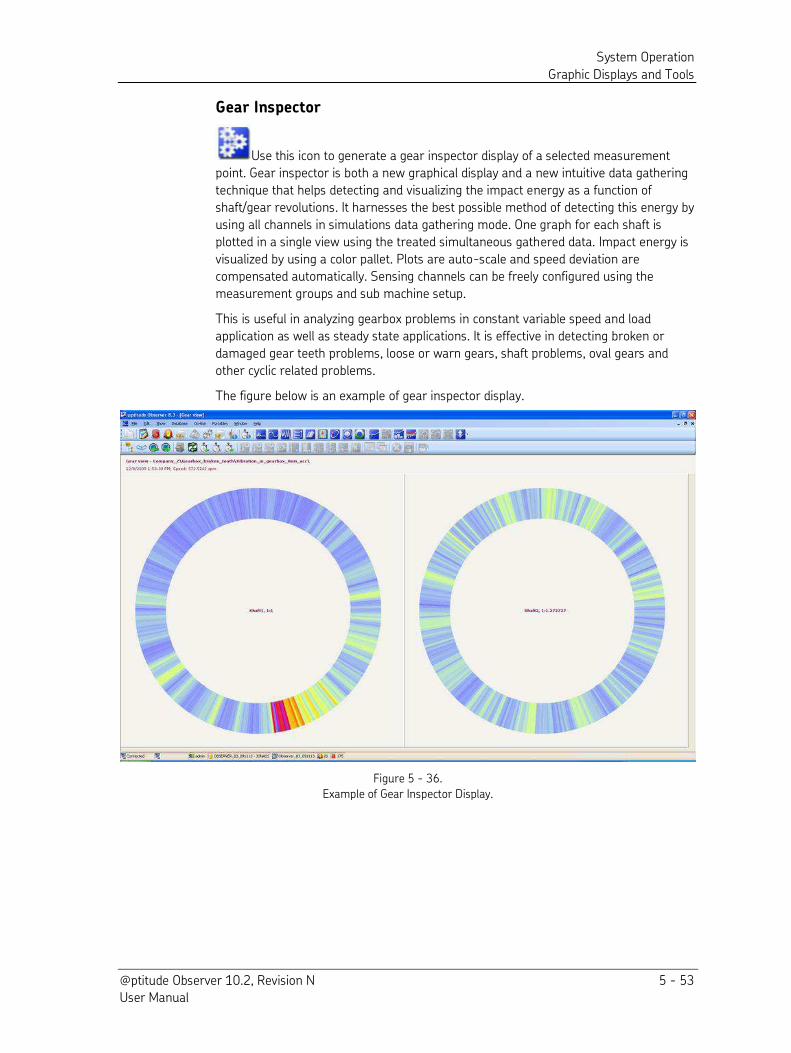
System Operation
Graphic Displays and Tools
@ptitude Observer 10.2, Revision N 5 - 53 User Manual
Gear Inspector
Use this icon to generate a gear inspector display of a selected measurement
point. Gear inspector is both a new graphical display and a new intuitive data gathering
technique that helps detecting and visualizing the impact energy as a function of
shaft/gear revolutions. It harnesses the best possible method of detecting this energy by
using all channels in simulations data gathering mode. One graph for each shaft is
plotted in a single view using the treated simultaneous gathered data. Impact energy is
visualized by using a color pallet. Plots are auto-scale and speed deviation are
compensated automatically. Sensing channels can be freely configured using the
measurement groups and sub machine setup.
This is useful in analyzing gearbox problems in constant variable speed and load
application as well as steady state applications. It is effective in detecting broken or
damaged gear teeth problems, loose or warn gears, shaft problems, oval gears and
other cyclic related problems.
The figure below is an example of gear inspector display.
Figure 5 - 36.
Example of Gear Inspector Display.
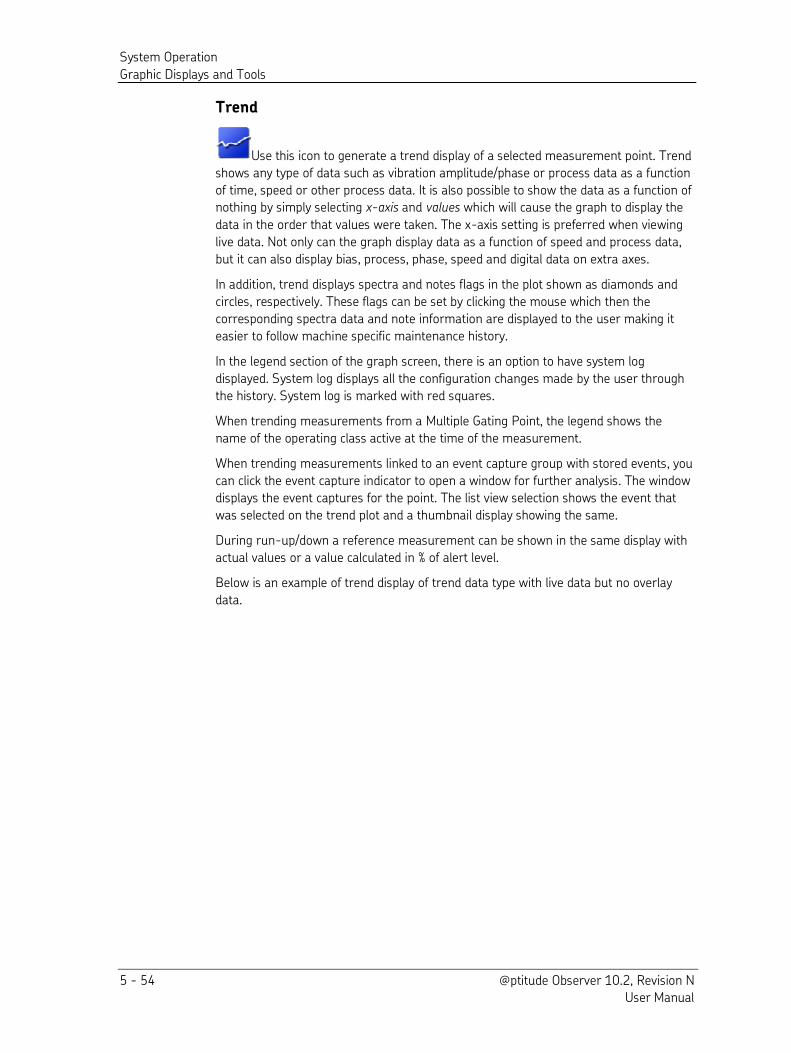
System Operation
Graphic Displays and Tools
5 - 54 @ptitude Observer 10.2, Revision N User Manual
Trend
Use this icon to generate a trend display of a selected measurement point. Trend
shows any type of data such as vibration amplitude/phase or process data as a function
of time, speed or other process data. It is also possible to show the data as a function of nothing by simply selecting x-axis and values which will cause the graph to display the
data in the order that values were taken. The x-axis setting is preferred when viewing
live data. Not only can the graph display data as a function of speed and process data,
but it can also display bias, process, phase, speed and digital data on extra axes.
In addition, trend displays spectra and notes flags in the plot shown as diamonds and
circles, respectively. These flags can be set by clicking the mouse which then the
corresponding spectra data and note information are displayed to the user making it
easier to follow machine specific maintenance history.
In the legend section of the graph screen, there is an option to have system log
displayed. System log displays all the configuration changes made by the user through
the history. System log is marked with red squares.
When trending measurements from a Multiple Gating Point, the legend shows the
name of the operating class active at the time of the measurement.
When trending measurements linked to an event capture group with stored events, you
can click the event capture indicator to open a window for further analysis. The window
displays the event captures for the point. The list view selection shows the event that
was selected on the trend plot and a thumbnail display showing the same.
During run-up/down a reference measurement can be shown in the same display with
actual values or a value calculated in % of alert level.
Below is an example of trend display of trend data type with live data but no overlay
data.
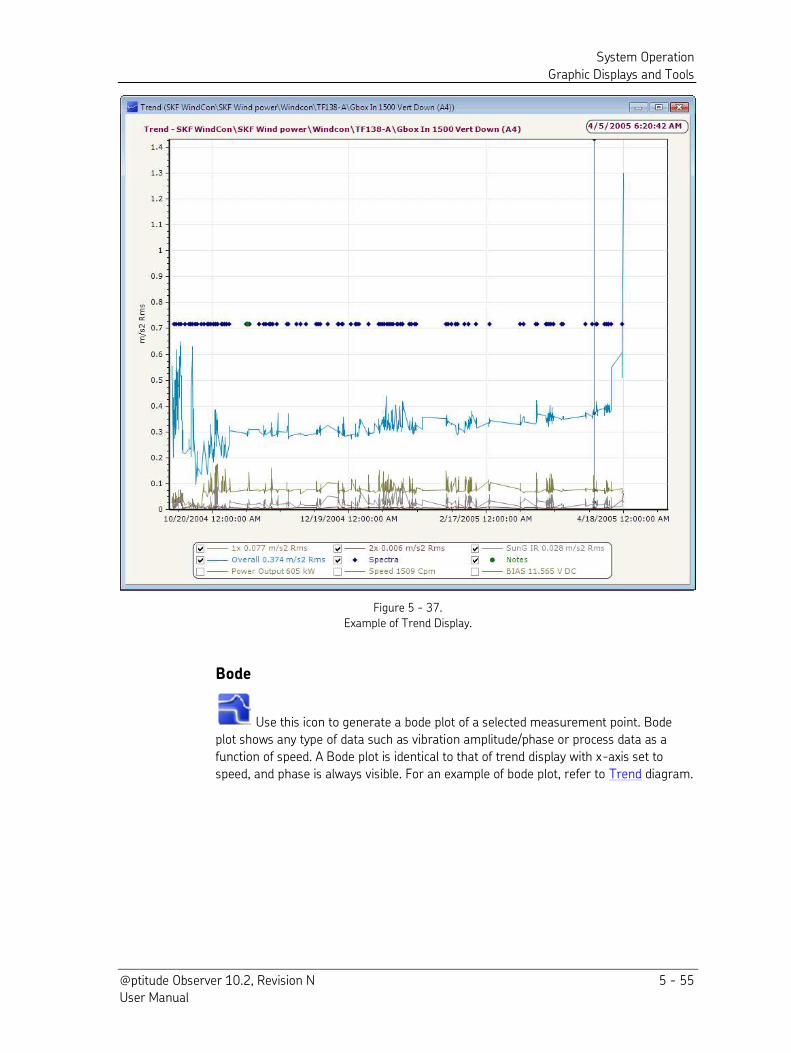
System Operation
Graphic Displays and Tools
@ptitude Observer 10.2, Revision N 5 - 55 User Manual
Figure 5 - 37.
Example of Trend Display.
Bode
Use this icon to generate a bode plot of a selected measurement point. Bode
plot shows any type of data such as vibration amplitude/phase or process data as a
function of speed. A Bode plot is identical to that of trend display with x-axis set to
speed, and phase is always visible. For an example of bode plot, refer to Trend diagram.
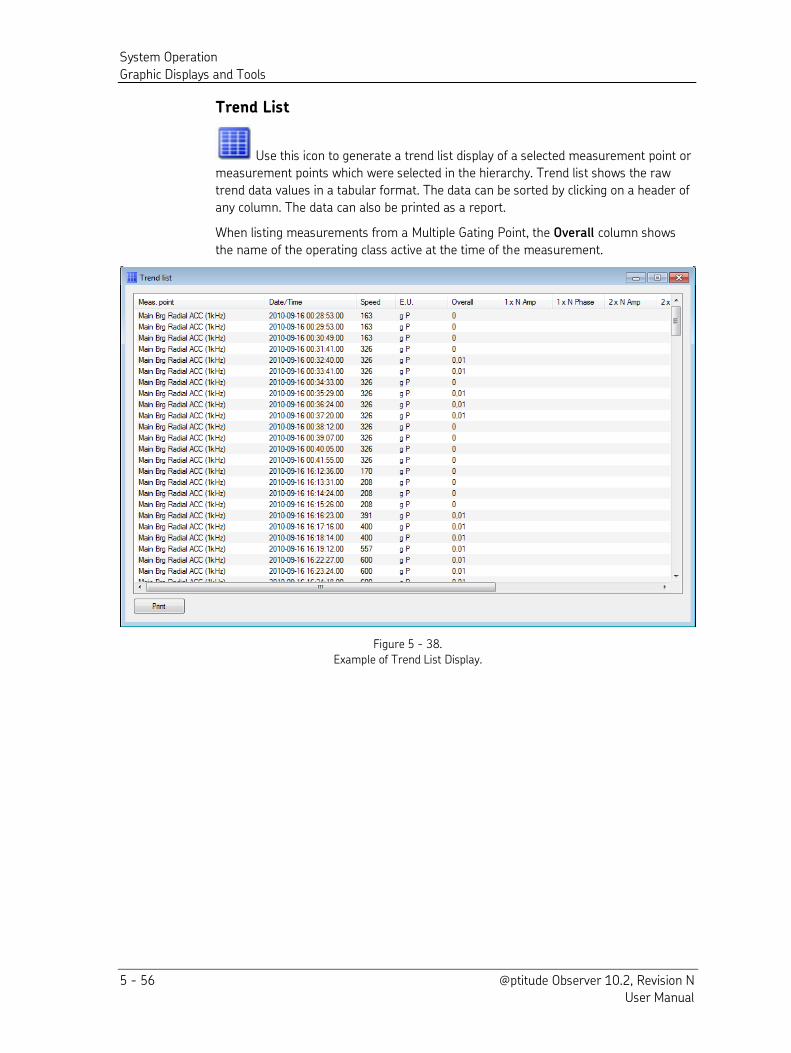
System Operation
Graphic Displays and Tools
5 - 56 @ptitude Observer 10.2, Revision N User Manual
Trend List
Use this icon to generate a trend list display of a selected measurement point or
measurement points which were selected in the hierarchy. Trend list shows the raw
trend data values in a tabular format. The data can be sorted by clicking on a header of
any column. The data can also be printed as a report.
When listing measurements from a Multiple Gating Point, the Overall column shows
the name of the operating class active at the time of the measurement.
Figure 5 - 38.
Example of Trend List Display.
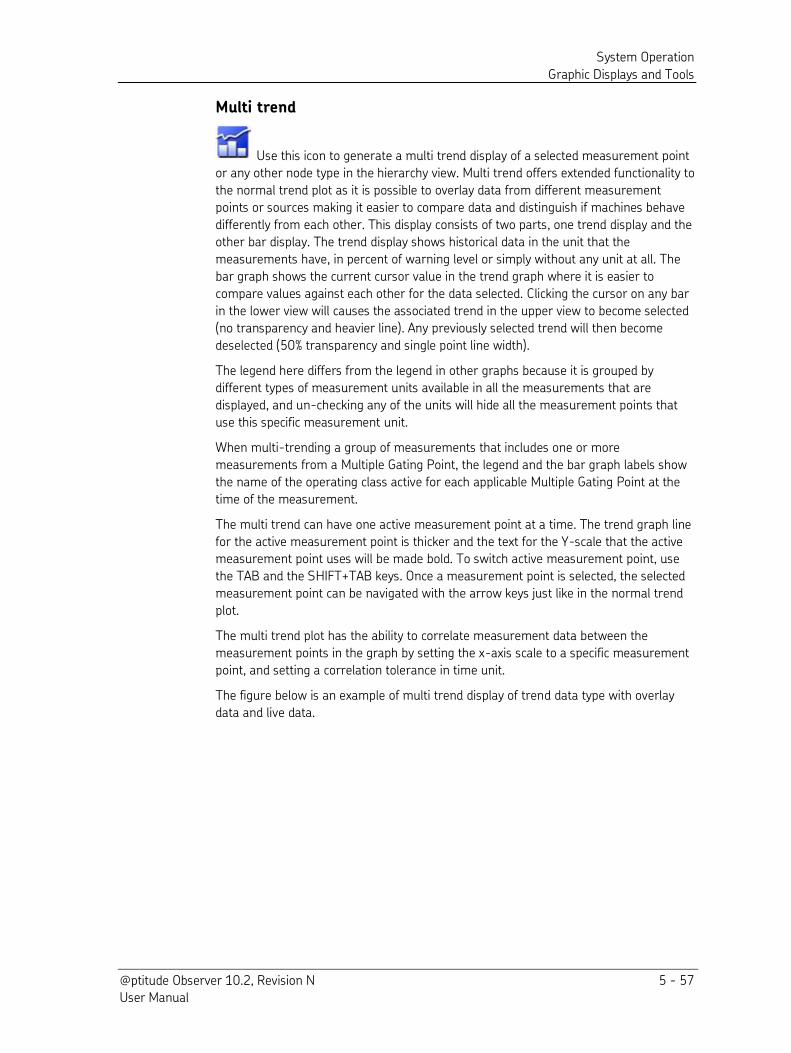
System Operation
Graphic Displays and Tools
@ptitude Observer 10.2, Revision N 5 - 57 User Manual
Multi trend
Use this icon to generate a multi trend display of a selected measurement point
or any other node type in the hierarchy view. Multi trend offers extended functionality to
the normal trend plot as it is possible to overlay data from different measurement
points or sources making it easier to compare data and distinguish if machines behave
differently from each other. This display consists of two parts, one trend display and the
other bar display. The trend display shows historical data in the unit that the
measurements have, in percent of warning level or simply without any unit at all. The
bar graph shows the current cursor value in the trend graph where it is easier to
compare values against each other for the data selected. Clicking the cursor on any bar
in the lower view will causes the associated trend in the upper view to become selected
(no transparency and heavier line). Any previously selected trend will then become
deselected (50% transparency and single point line width).
The legend here differs from the legend in other graphs because it is grouped by
different types of measurement units available in all the measurements that are
displayed, and un-checking any of the units will hide all the measurement points that
use this specific measurement unit.
When multi-trending a group of measurements that includes one or more
measurements from a Multiple Gating Point, the legend and the bar graph labels show
the name of the operating class active for each applicable Multiple Gating Point at the
time of the measurement.
The multi trend can have one active measurement point at a time. The trend graph line
for the active measurement point is thicker and the text for the Y-scale that the active measurement point uses will be made bold. To switch active measurement point, use
the TAB and the SHIFT+TAB keys. Once a measurement point is selected, the selected
measurement point can be navigated with the arrow keys just like in the normal trend
plot.
The multi trend plot has the ability to correlate measurement data between the
measurement points in the graph by setting the x-axis scale to a specific measurement
point, and setting a correlation tolerance in time unit.
The figure below is an example of multi trend display of trend data type with overlay
data and live data.
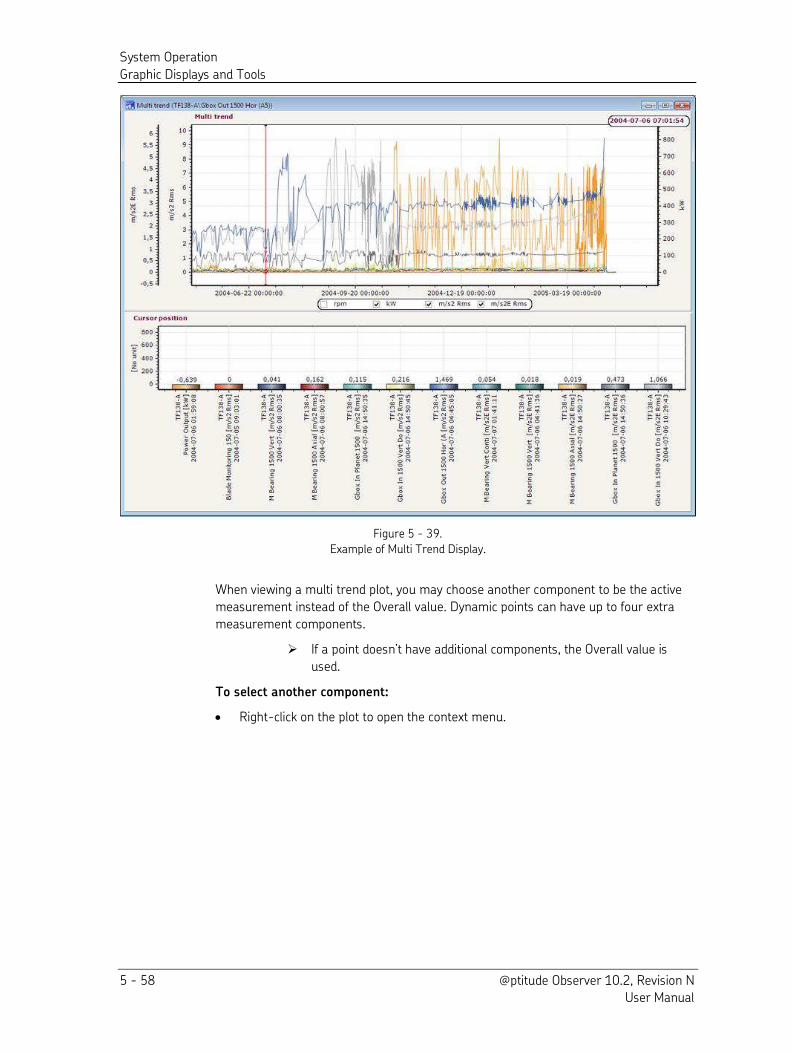
System Operation
Graphic Displays and Tools
5 - 58 @ptitude Observer 10.2, Revision N User Manual
Figure 5 - 39.
Example of Multi Trend Display.
When viewing a multi trend plot, you may choose another component to be the active
measurement instead of the Overall value. Dynamic points can have up to four extra
measurement components.
If a point doesn’t have additional components, the Overall value is used.
To select another component:
Right-click on the plot to open the context menu.
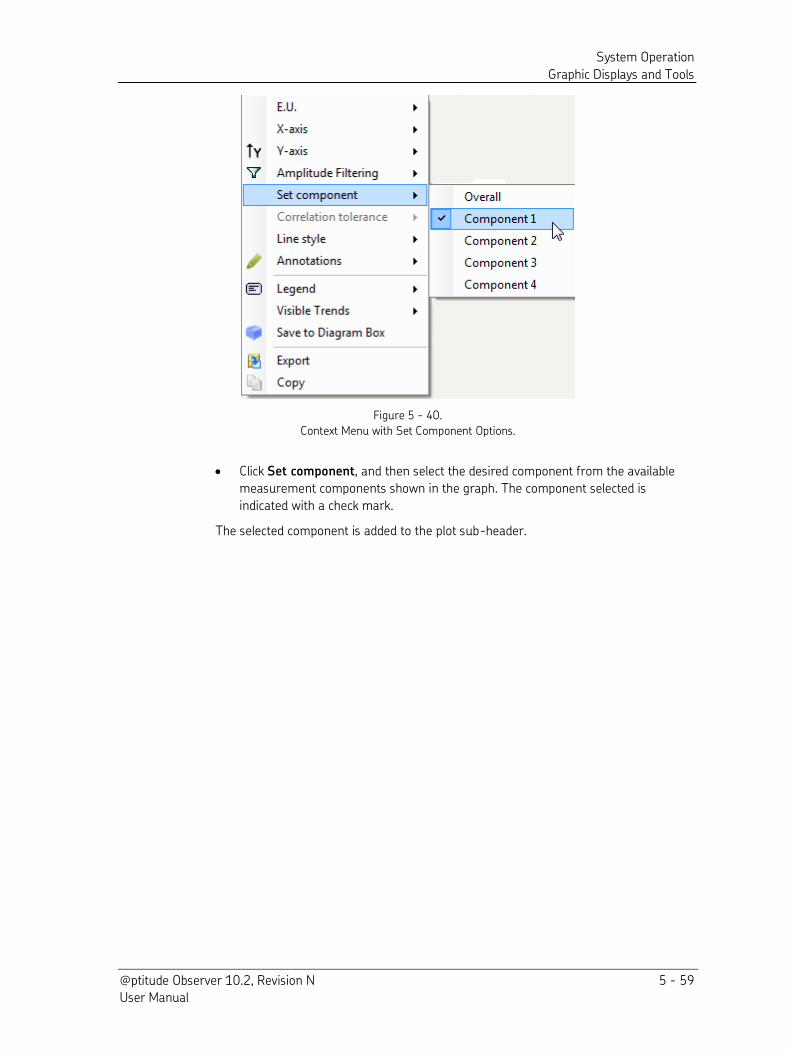
System Operation
Graphic Displays and Tools
@ptitude Observer 10.2, Revision N 5 - 59 User Manual
Figure 5 - 40.
Context Menu with Set Component Options.
Click Set component, and then select the desired component from the available
measurement components shown in the graph. The component selected is
indicated with a check mark.
The selected component is added to the plot sub-header.
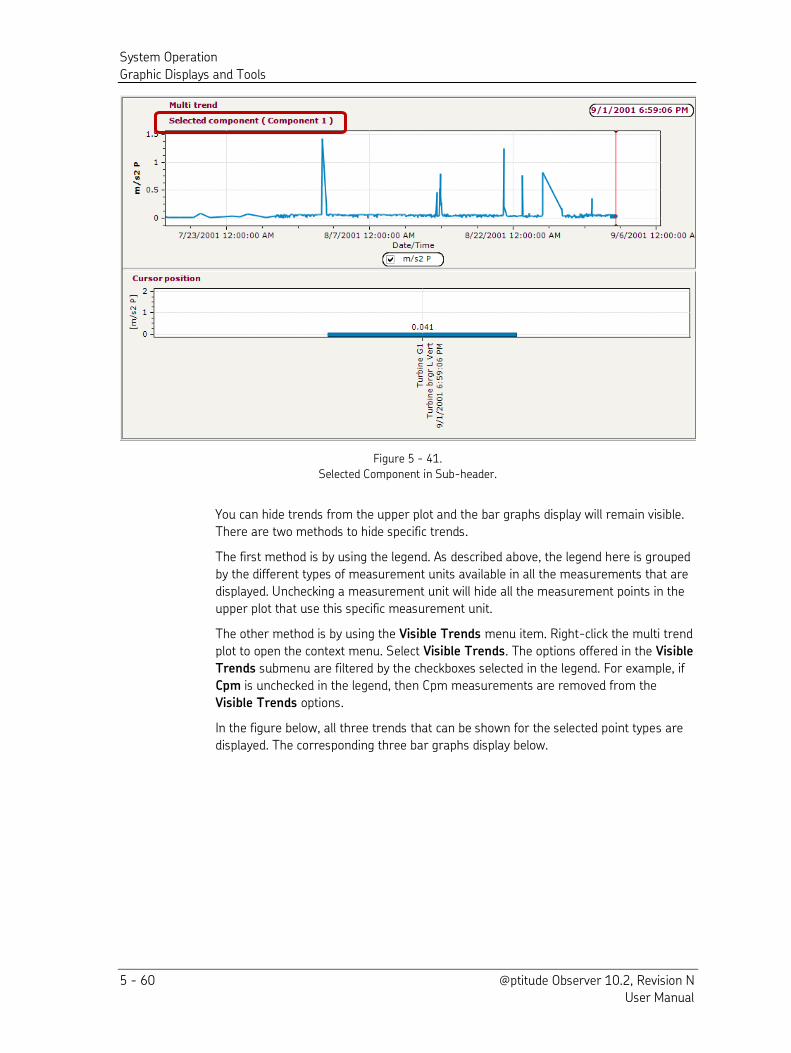
System Operation
Graphic Displays and Tools
5 - 60 @ptitude Observer 10.2, Revision N User Manual
Figure 5 - 41.
Selected Component in Sub-header.
You can hide trends from the upper plot and the bar graphs display will remain visible.
There are two methods to hide specific trends.
The first method is by using the legend. As described above, the legend here is grouped
by the different types of measurement units available in all the measurements that are
displayed. Unchecking a measurement unit will hide all the measurement points in the
upper plot that use this specific measurement unit.
The other method is by using the Visible Trends menu item. Right-click the multi trend
plot to open the context menu. Select Visible Trends. The options offered in the Visible
Trends submenu are filtered by the checkboxes selected in the legend. For example, if
Cpm is unchecked in the legend, then Cpm measurements are removed from the
Visible Trends options.
In the figure below, all three trends that can be shown for the selected point types are
displayed. The corresponding three bar graphs display below.
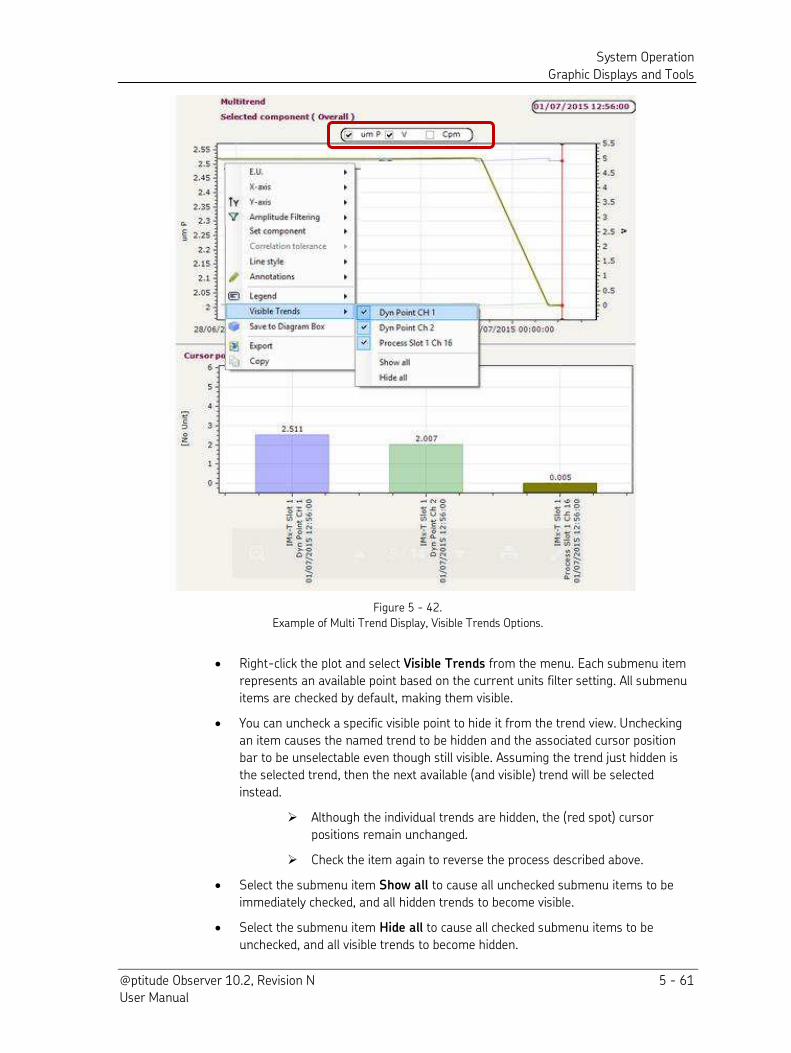
System Operation
Graphic Displays and Tools
@ptitude Observer 10.2, Revision N 5 - 61 User Manual
Figure 5 - 42.
Example of Multi Trend Display, Visible Trends Options.
Right-click the plot and select Visible Trends from the menu. Each submenu item
represents an available point based on the current units filter setting. All submenu
items are checked by default, making them visible.
You can uncheck a specific visible point to hide it from the trend view. Unchecking
an item causes the named trend to be hidden and the associated cursor position
bar to be unselectable even though still visible. Assuming the trend just hidden is
the selected trend, then the next available (and visible) trend will be selected
instead.
Although the individual trends are hidden, the (red spot) cursor
positions remain unchanged.
Check the item again to reverse the process described above.
Select the submenu item Show all to cause all unchecked submenu items to be
immediately checked, and all hidden trends to become visible.
Select the submenu item Hide all to cause all checked submenu items to be
unchecked, and all visible trends to become hidden.
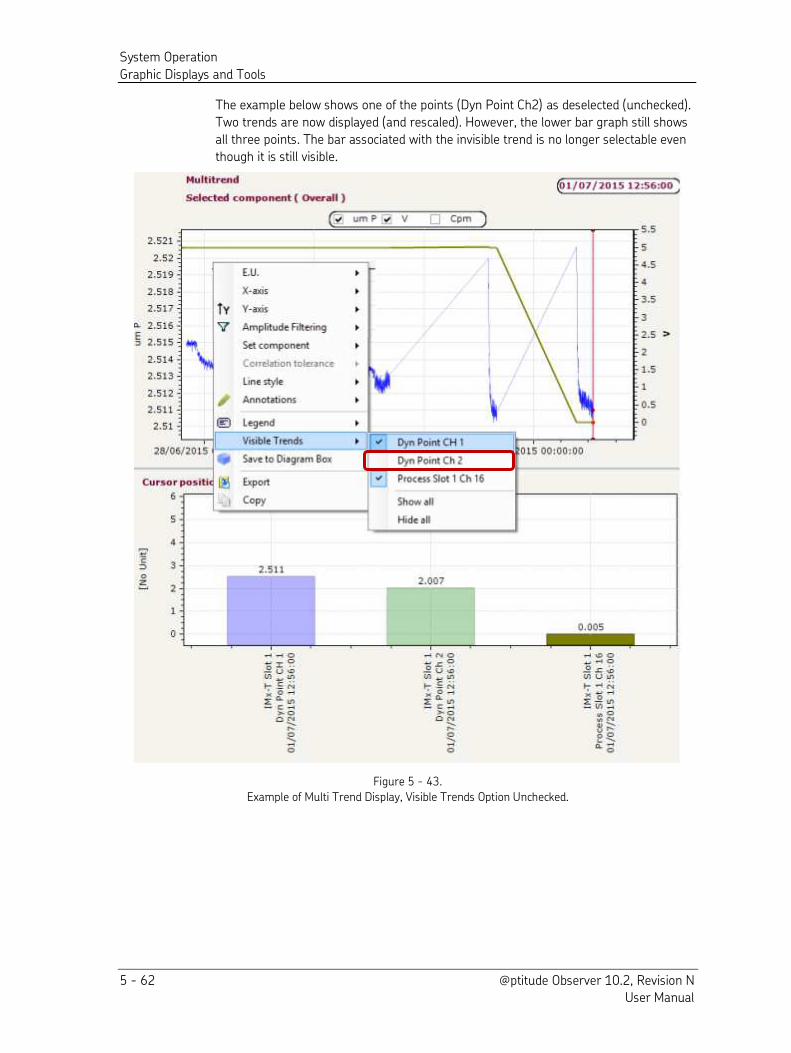
System Operation
Graphic Displays and Tools
5 - 62 @ptitude Observer 10.2, Revision N User Manual
The example below shows one of the points (Dyn Point Ch2) as deselected (unchecked).
Two trends are now displayed (and rescaled). However, the lower bar graph still shows
all three points. The bar associated with the invisible trend is no longer selectable even
though it is still visible.
Figure 5 - 43.
Example of Multi Trend Display, Visible Trends Option Unchecked.
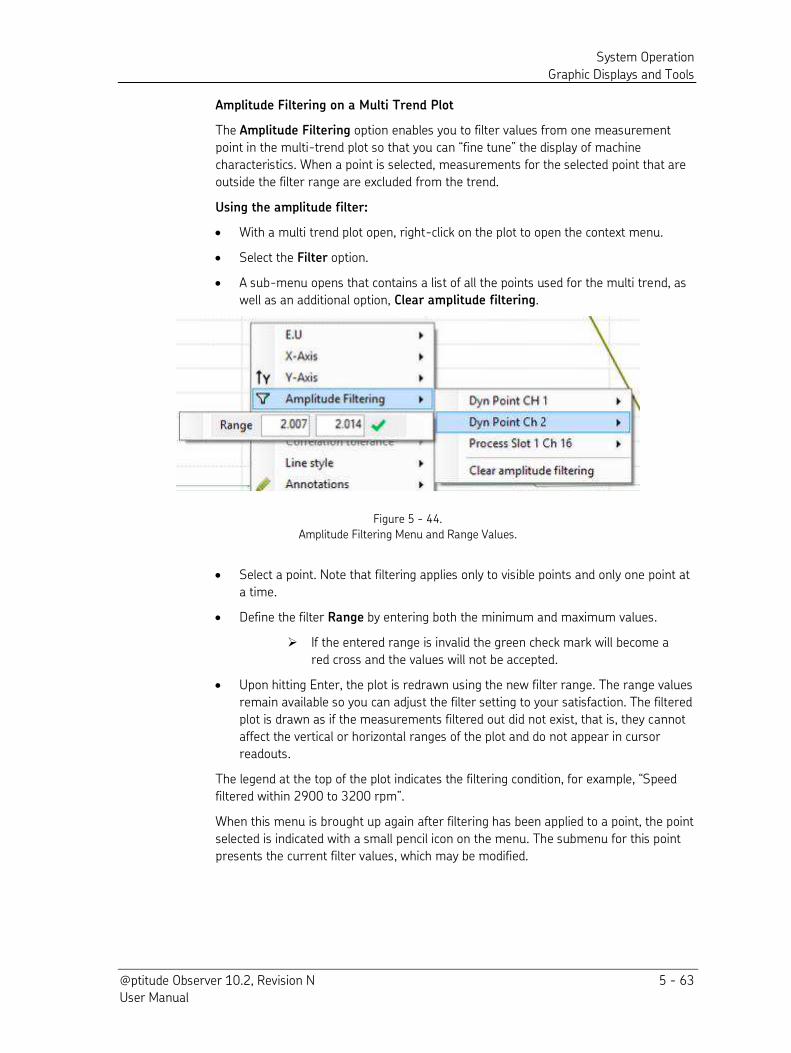
System Operation
Graphic Displays and Tools
@ptitude Observer 10.2, Revision N 5 - 63 User Manual
Amplitude Filtering on a Multi Trend Plot
The Amplitude Filtering option enables you to filter values from one measurement
point in the multi-trend plot so that you can “fine tune” the display of machine
characteristics. When a point is selected, measurements for the selected point that are
outside the filter range are excluded from the trend.
Using the amplitude filter:
With a multi trend plot open, right-click on the plot to open the context menu.
Select the Filter option.
A sub-menu opens that contains a list of all the points used for the multi trend, as
well as an additional option, Clear amplitude filtering.
Figure 5 - 44.
Amplitude Filtering Menu and Range Values.
Select a point. Note that filtering applies only to visible points and only one point at
a time.
Define the filter Range by entering both the minimum and maximum values.
If the entered range is invalid the green check mark will become a
red cross and the values will not be accepted.
Upon hitting Enter, the plot is redrawn using the new filter range. The range values
remain available so you can adjust the filter setting to your satisfaction. The filtered
plot is drawn as if the measurements filtered out did not exist, that is, they cannot
affect the vertical or horizontal ranges of the plot and do not appear in cursor
readouts.
The legend at the top of the plot indicates the filtering condition, for example, “Speed filtered within 2900 to 3200 rpm”. When this menu is brought up again after filtering has been applied to a point, the point
selected is indicated with a small pencil icon on the menu. The submenu for this point
presents the current filter values, which may be modified.
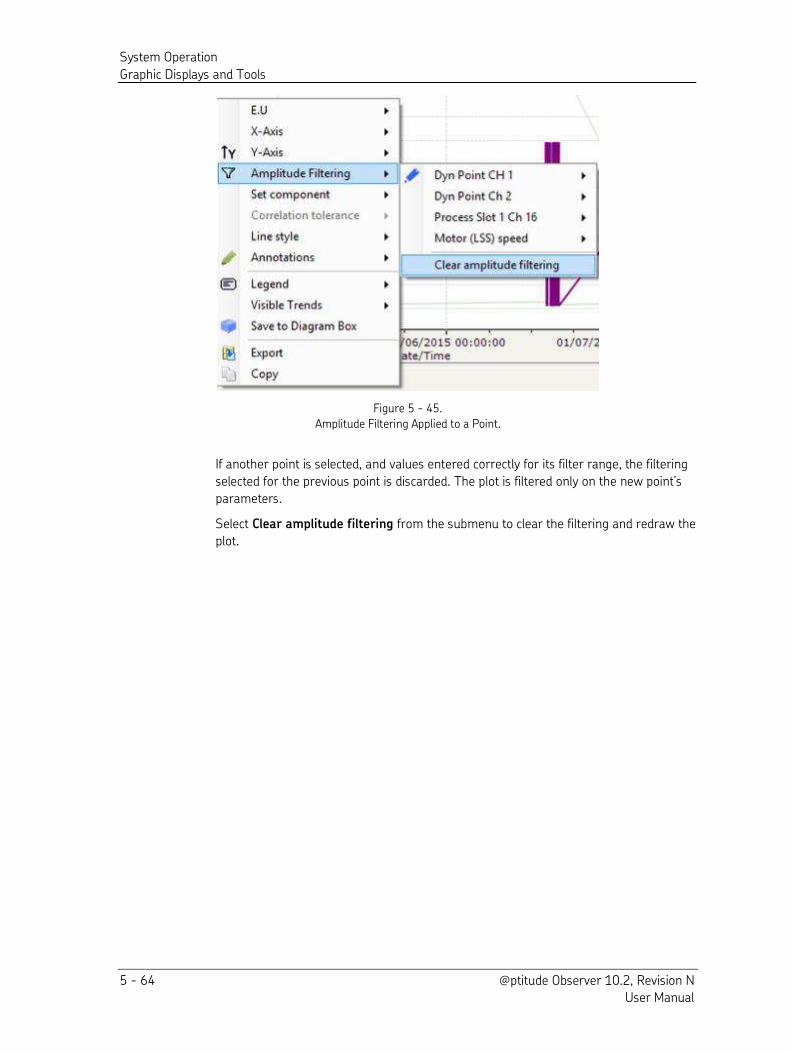
System Operation
Graphic Displays and Tools
5 - 64 @ptitude Observer 10.2, Revision N User Manual
Figure 5 - 45.
Amplitude Filtering Applied to a Point.
If another point is selected, and values entered correctly for its filter range, the filtering
selected for the previous point is discarded. The plot is filtered only on the new point’s parameters.
Select Clear amplitude filtering from the submenu to clear the filtering and redraw the
plot.
System Operation
Graphic Displays and Tools
@ptitude Observer 10.2, Revision N 5 - 65 User Manual
Diagnosis
Use this icon to generate a diagnosis display of a selected measurement point.
This will open the diagnosis display for the measurement point and will display all the
attached diagnoses.
The @ptitude Observer Machine Diagnosis is a powerful tool to display and follow the
progression of machine faults. Sophisticated diagnosis rules can be applied using defect
frequencies of the whole machine with individual alarm level for each measurement
point and for each type of fault. Diagnosis diagram shows calculated diagnosis
parameters over time related to the alarm level. There are many types of built-in
diagnoses available to the user in order to detect specific common machine faults like
misalignment, cavitation, mechanical looseness, electrical faults and more.
In the diagnosis display, all the different diagnoses attached to a measurement point are
shown in the trend-type of display, and calculated based on spectrum data stored in the
database. This means that diagnosis can be attached and recalculated even after the
measurements have been stored to the database.
The figure below is an example of diagnosis display of binary data type with no overlay
data and no live data.
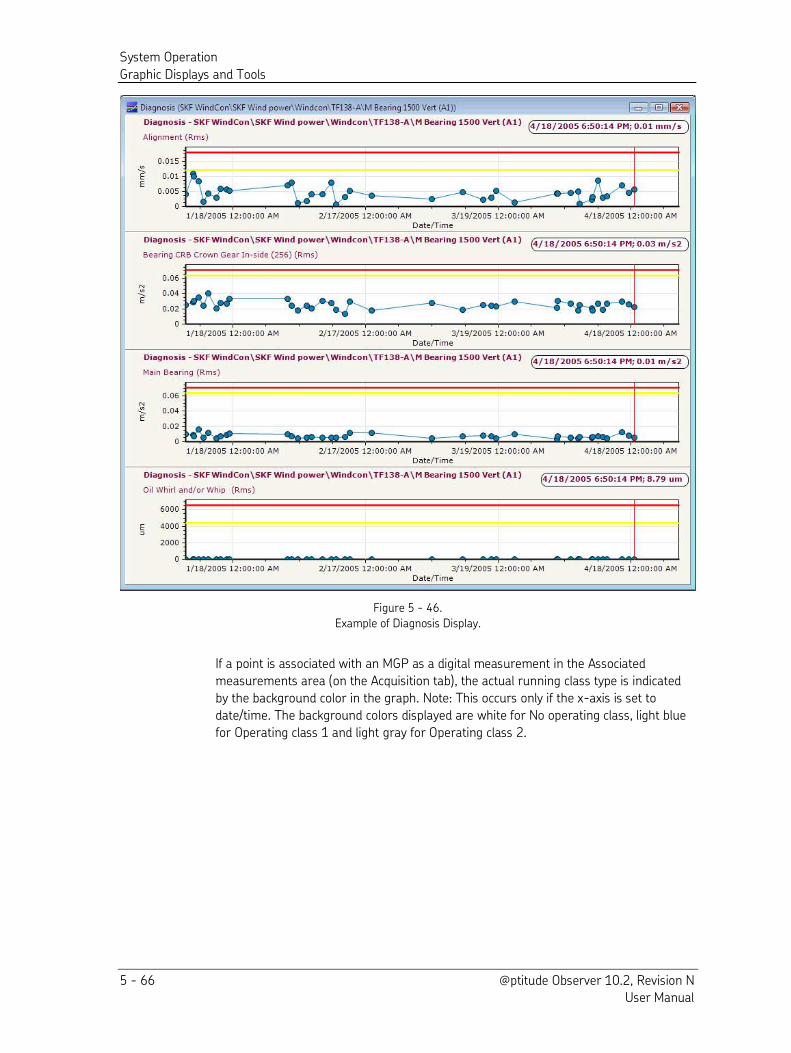
System Operation
Graphic Displays and Tools
5 - 66 @ptitude Observer 10.2, Revision N User Manual
Figure 5 - 46.
Example of Diagnosis Display.
If a point is associated with an MGP as a digital measurement in the Associated
measurements area (on the Acquisition tab), the actual running class type is indicated
by the background color in the graph. Note: This occurs only if the x-axis is set to
date/time. The background colors displayed are white for No operating class, light blue
for Operating class 1 and light gray for Operating class 2.
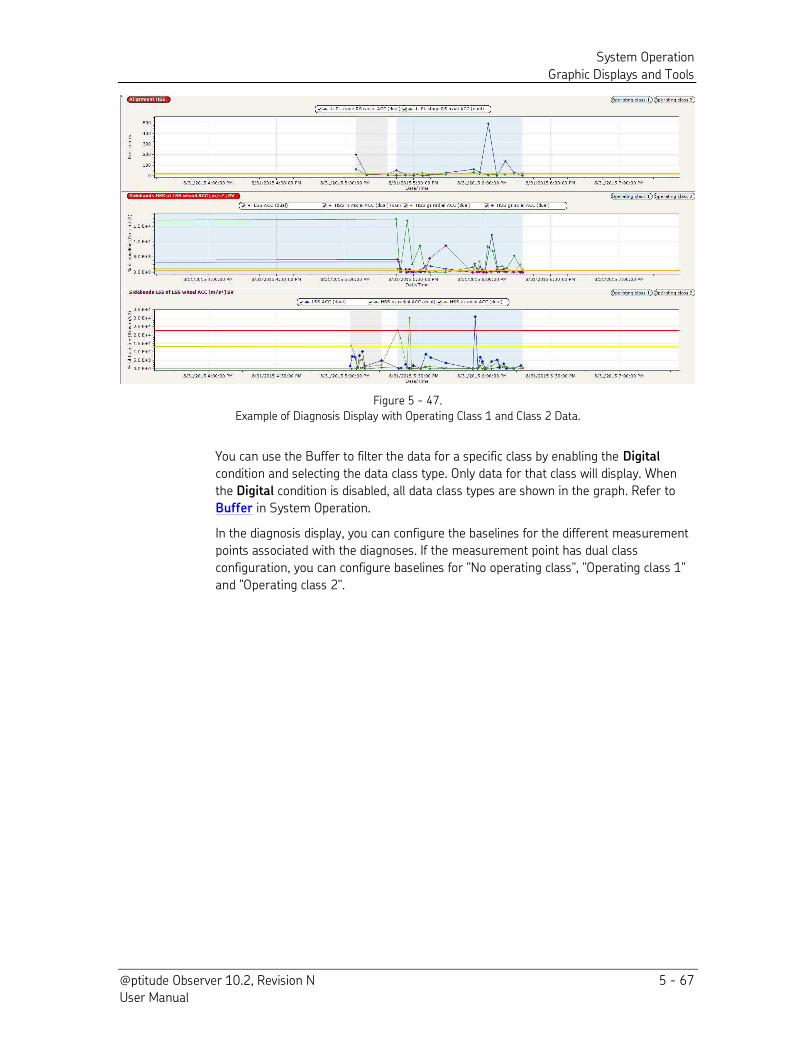
System Operation
Graphic Displays and Tools
@ptitude Observer 10.2, Revision N 5 - 67 User Manual
Figure 5 - 47.
Example of Diagnosis Display with Operating Class 1 and Class 2 Data.
You can use the Buffer to filter the data for a specific class by enabling the Digital
condition and selecting the data class type. Only data for that class will display. When
the Digital condition is disabled, all data class types are shown in the graph. Refer to
Buffer in System Operation.
In the diagnosis display, you can configure the baselines for the different measurement
points associated with the diagnoses. If the measurement point has dual class
configuration, you can configure baselines for "No operating class", "Operating class 1"
and "Operating class 2".
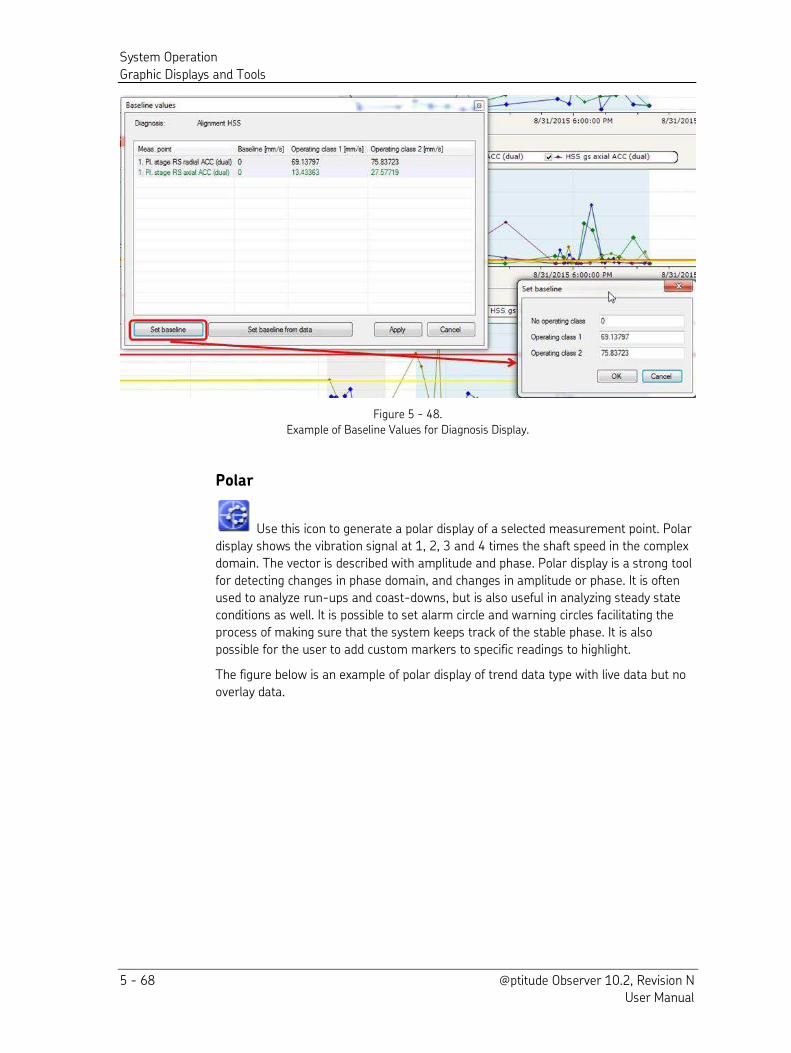
System Operation
Graphic Displays and Tools
5 - 68 @ptitude Observer 10.2, Revision N User Manual
Figure 5 - 48.
Example of Baseline Values for Diagnosis Display.
Polar
Use this icon to generate a polar display of a selected measurement point. Polar
display shows the vibration signal at 1, 2, 3 and 4 times the shaft speed in the complex
domain. The vector is described with amplitude and phase. Polar display is a strong tool
for detecting changes in phase domain, and changes in amplitude or phase. It is often
used to analyze run-ups and coast-downs, but is also useful in analyzing steady state
conditions as well. It is possible to set alarm circle and warning circles facilitating the
process of making sure that the system keeps track of the stable phase. It is also
possible for the user to add custom markers to specific readings to highlight.
The figure below is an example of polar display of trend data type with live data but no
overlay data.
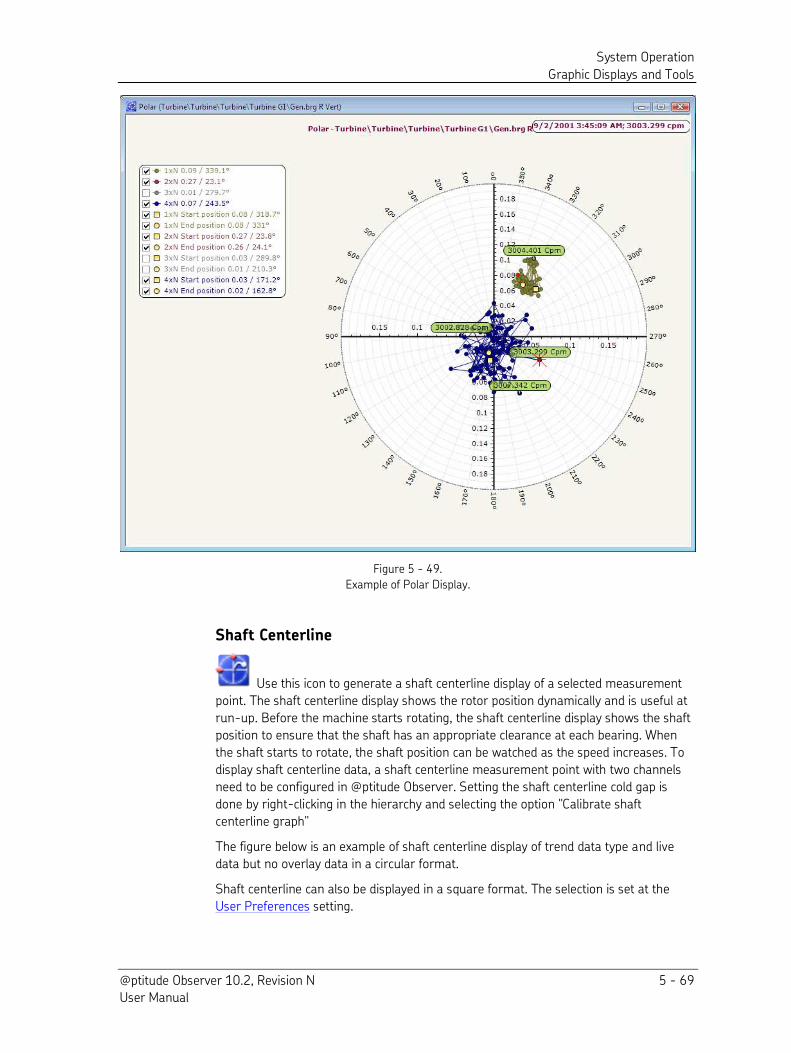
System Operation
Graphic Displays and Tools
@ptitude Observer 10.2, Revision N 5 - 69 User Manual
Figure 5 - 49.
Example of Polar Display.
Shaft Centerline
Use this icon to generate a shaft centerline display of a selected measurement
point. The shaft centerline display shows the rotor position dynamically and is useful at
run-up. Before the machine starts rotating, the shaft centerline display shows the shaft
position to ensure that the shaft has an appropriate clearance at each bearing. When
the shaft starts to rotate, the shaft position can be watched as the speed increases. To
display shaft centerline data, a shaft centerline measurement point with two channels
need to be configured in @ptitude Observer. Setting the shaft centerline cold gap is
done by right-clicking in the hierarchy and selecting the option "Calibrate shaft
centerline graph"
The figure below is an example of shaft centerline display of trend data type and live
data but no overlay data in a circular format.
Shaft centerline can also be displayed in a square format. The selection is set at the
User Preferences setting.
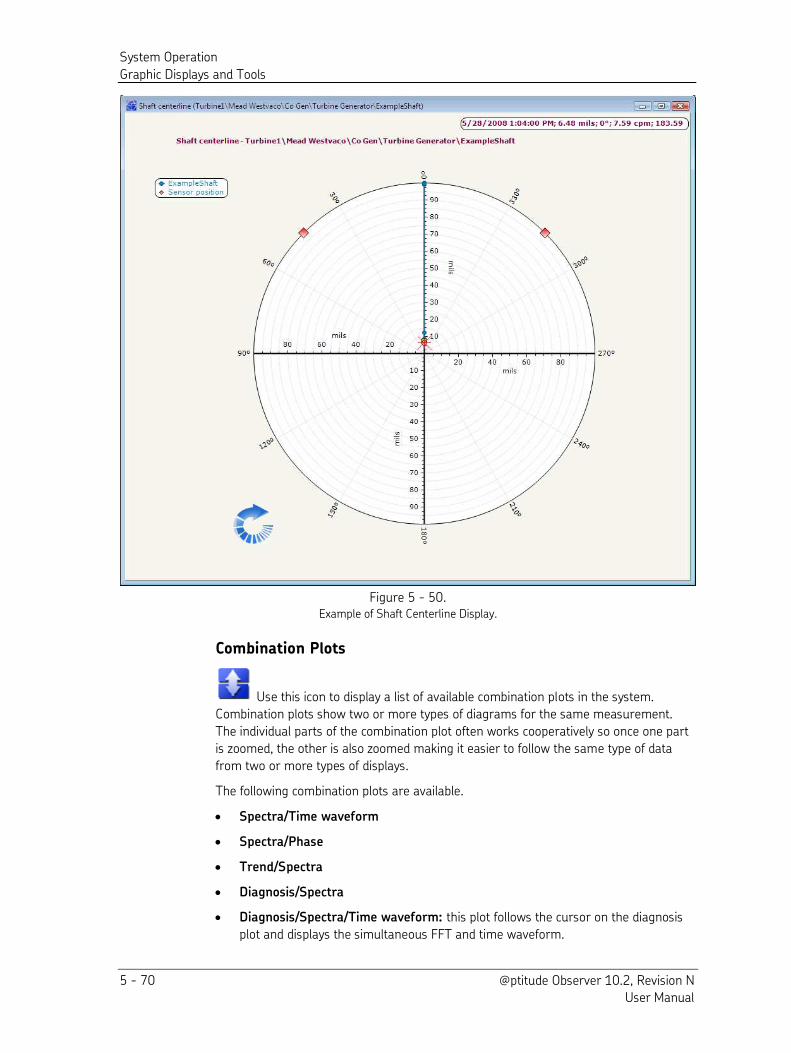
System Operation
Graphic Displays and Tools
5 - 70 @ptitude Observer 10.2, Revision N User Manual
Figure 5 - 50. Example of Shaft Centerline Display.
Combination Plots
Use this icon to display a list of available combination plots in the system.
Combination plots show two or more types of diagrams for the same measurement.
The individual parts of the combination plot often works cooperatively so once one part
is zoomed, the other is also zoomed making it easier to follow the same type of data
from two or more types of displays.
The following combination plots are available.
Spectra/Time waveform
Spectra/Phase
Trend/Spectra
Diagnosis/Spectra
Diagnosis/Spectra/Time waveform: this plot follows the cursor on the diagnosis
plot and displays the simultaneous FFT and time waveform.
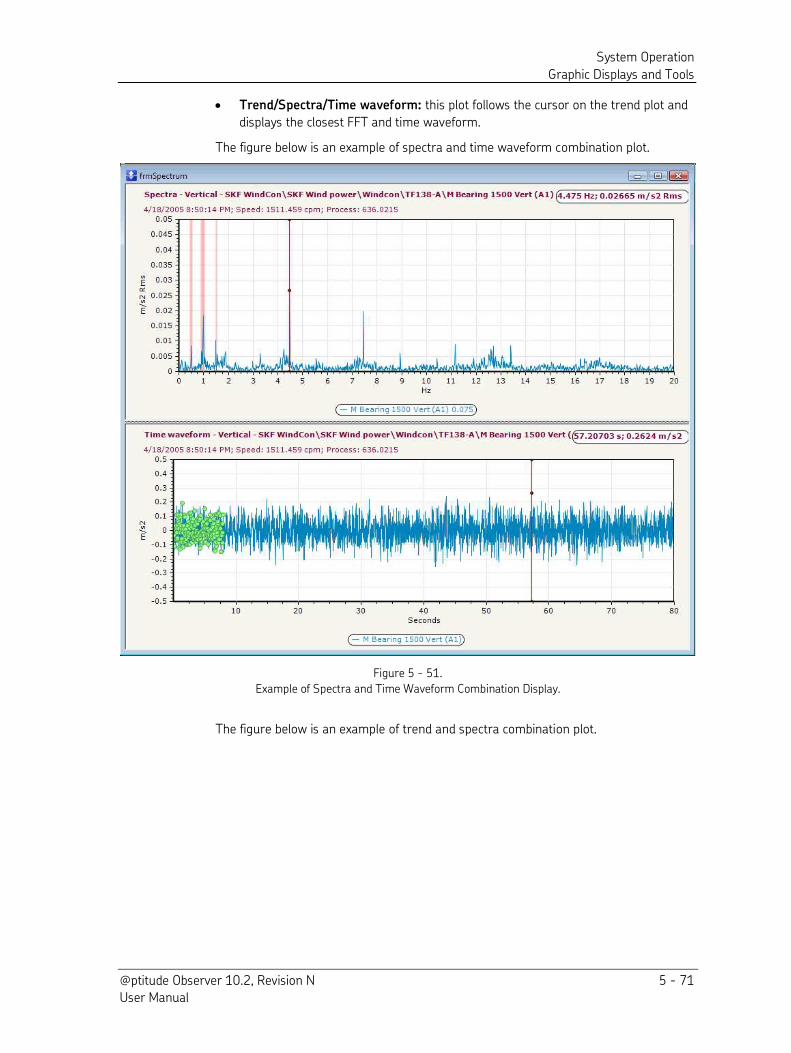
System Operation
Graphic Displays and Tools
@ptitude Observer 10.2, Revision N 5 - 71 User Manual
Trend/Spectra/Time waveform: this plot follows the cursor on the trend plot and
displays the closest FFT and time waveform.
The figure below is an example of spectra and time waveform combination plot.
Figure 5 - 51.
Example of Spectra and Time Waveform Combination Display.
The figure below is an example of trend and spectra combination plot.
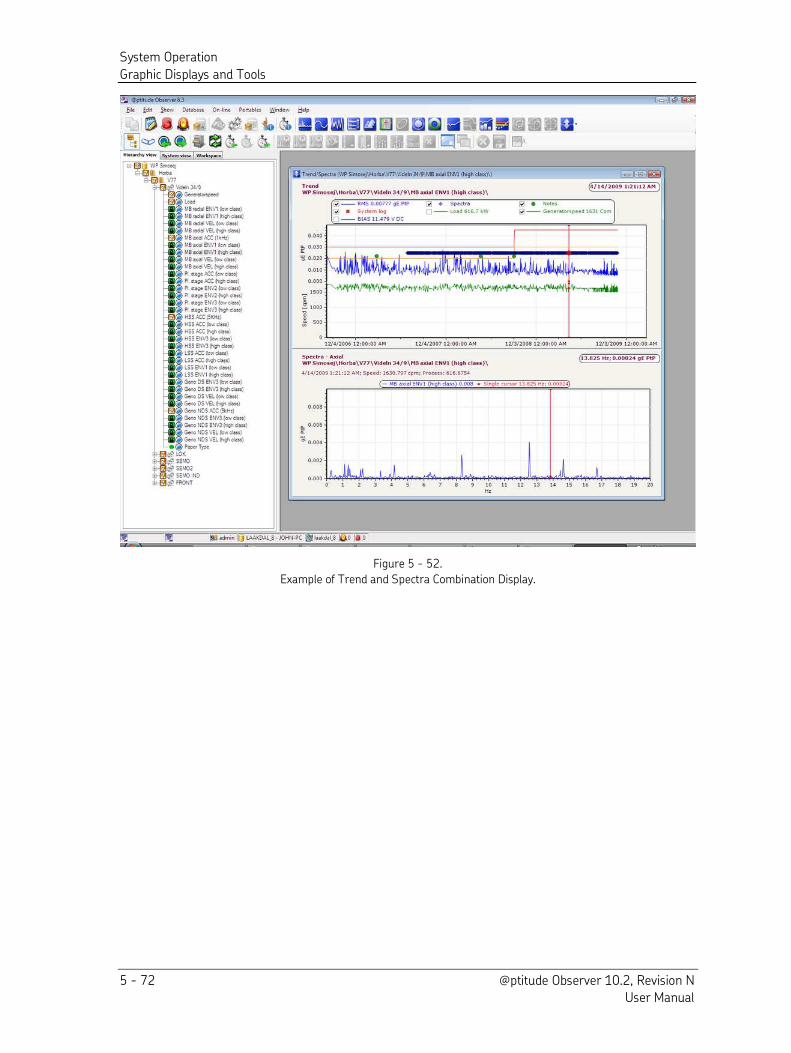
System Operation
Graphic Displays and Tools
5 - 72 @ptitude Observer 10.2, Revision N User Manual
Figure 5 - 52.
Example of Trend and Spectra Combination Display.
System Operation
Graphic Displays and Tools
@ptitude Observer 10.2, Revision N 5 - 73 User Manual
Event Capture
Event capture provides the capability to configure event capture groups with pre and post data capture. The captured time waveforms enable detailed analysis of both
very low (mechanical) and very high (electrical or generator related) oscillations. Normal
measurements taken at different sampling frequencies continue to operate as usual
while a time waveform is collected.
Event captures can be triggered by the following:
An alarm in the event capture group triggers event capture (for simple alarms).
An alarm in the same alarm group as the event capture group triggers event
capture (for complex alarms).
Clicking the Capture button triggers a manual event capture.
IEC status codes configured for event capture.
The following plots are available from the Event capture overview.
Event Capture TimeWaveform - the true peak-peak is calculated from the time
waveform.
Event Capture 3D – shows spectrum graphs taken from successive measurement
values in the selected continuous time waveform capture. The z-axis represents
time intervals in the event capture from which spectrum graphs were generated.
The following section describes working with the event capture graph displays. For details about the behavior of the event capture function, refer to Appendix A, What to
Expect When Using Event Capture in this user manual.
Displaying the form from the hierarchy
From the hierarchy tree view, highlight an event capture group. The Event capture
view tool in the toolbar is enabled.
Click the Event capture view tool to launch the Event capture view.
OR
Right-click an event capture group, and then select Diagram.
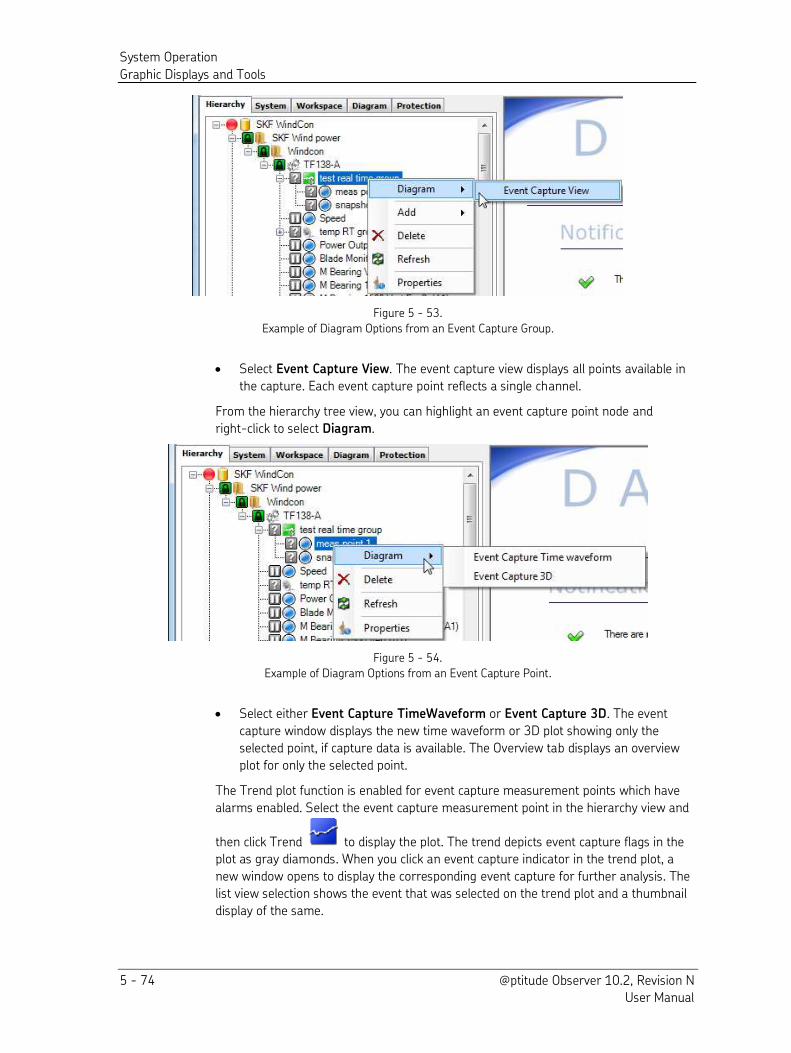
System Operation
Graphic Displays and Tools
5 - 74 @ptitude Observer 10.2, Revision N User Manual
Figure 5 - 53.
Example of Diagram Options from an Event Capture Group.
Select Event Capture View. The event capture view displays all points available in
the capture. Each event capture point reflects a single channel.
From the hierarchy tree view, you can highlight an event capture point node and
right-click to select Diagram.
Figure 5 - 54.
Example of Diagram Options from an Event Capture Point.
Select either Event Capture TimeWaveform or Event Capture 3D. The event
capture window displays the new time waveform or 3D plot showing only the
selected point, if capture data is available. The Overview tab displays an overview
plot for only the selected point.
The Trend plot function is enabled for event capture measurement points which have
alarms enabled. Select the event capture measurement point in the hierarchy view and
then click Trend to display the plot. The trend depicts event capture flags in the plot as gray diamonds. When you click an event capture indicator in the trend plot, a
new window opens to display the corresponding event capture for further analysis. The
list view selection shows the event that was selected on the trend plot and a thumbnail
display of the same.
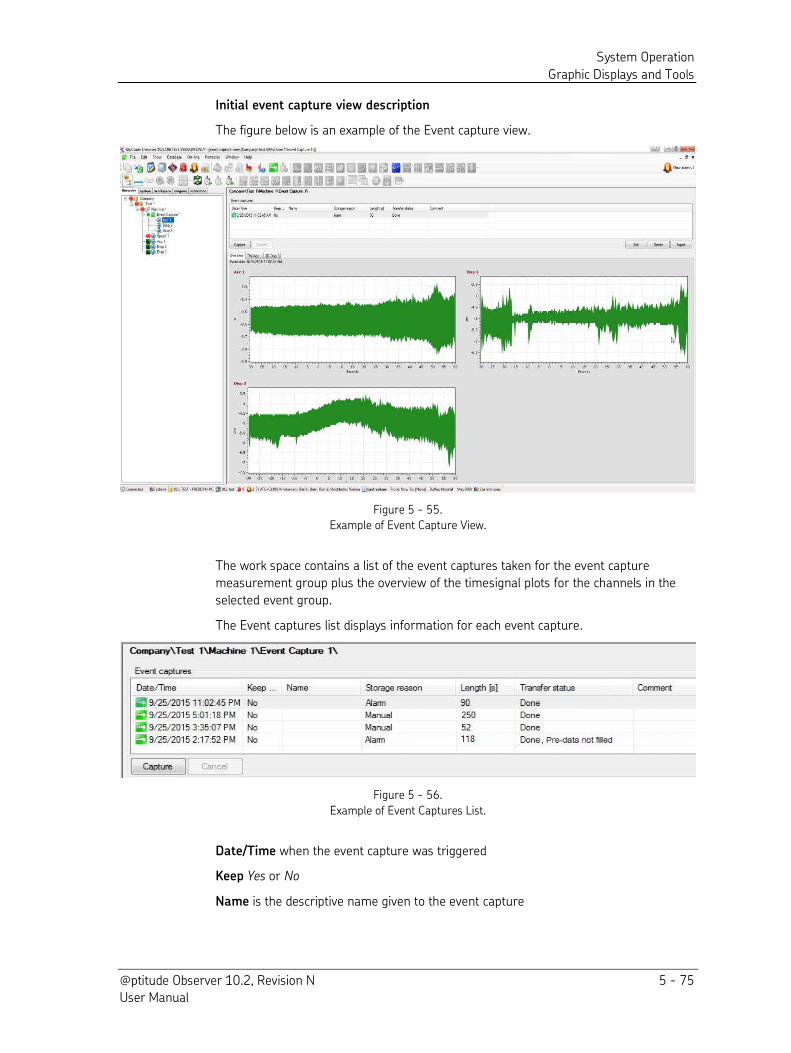
System Operation
Graphic Displays and Tools
@ptitude Observer 10.2, Revision N 5 - 75 User Manual
Initial event capture view description
The figure below is an example of the Event capture view.
Figure 5 - 55.
Example of Event Capture View.
The work space contains a list of the event captures taken for the event capture
measurement group plus the overview of the timesignal plots for the channels in the
selected event group.
The Event captures list displays information for each event capture.
Figure 5 - 56.
Example of Event Captures List.
Date/Time when the event capture was triggered
Keep Yes or No
Name is the descriptive name given to the event capture
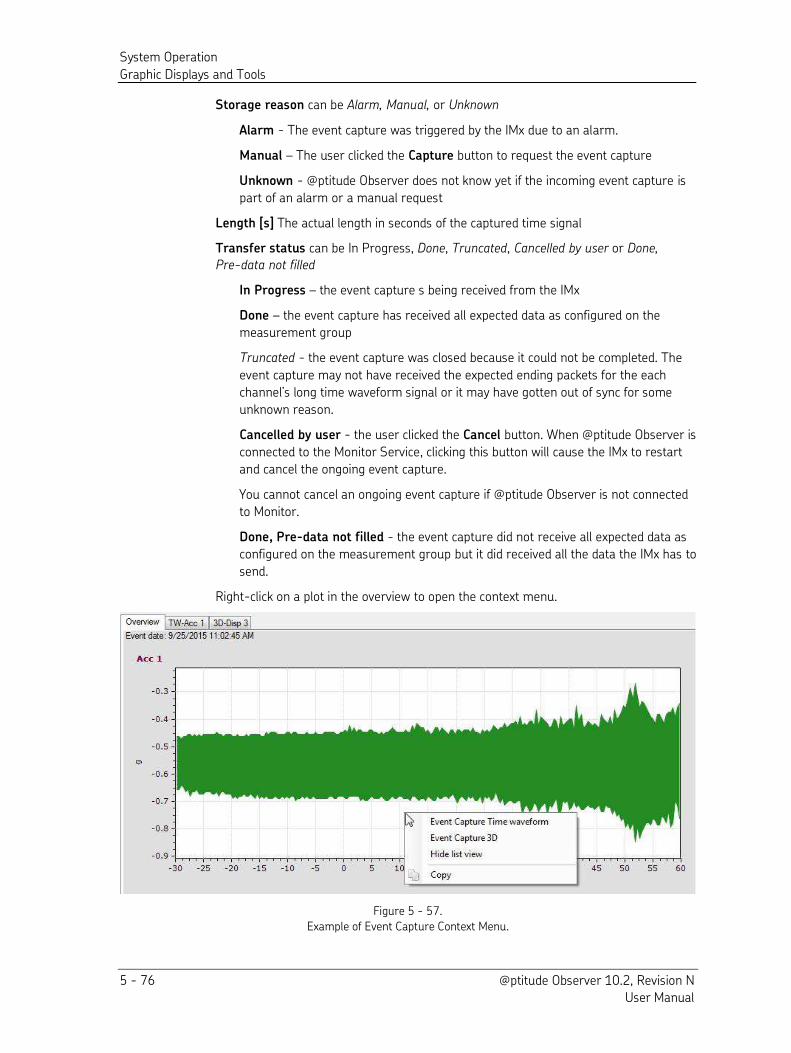
System Operation
Graphic Displays and Tools
5 - 76 @ptitude Observer 10.2, Revision N User Manual
Storage reason can be Alarm, Manual, or Unknown
Alarm - The event capture was triggered by the IMx due to an alarm.
Manual – The user clicked the Capture button to request the event capture
Unknown - @ptitude Observer does not know yet if the incoming event capture is
part of an alarm or a manual request
Length [s] The actual length in seconds of the captured time signal
Transfer status can be In Progress, Done, Truncated, Cancelled by user or Done,
Pre-data not filled
In Progress – the event capture s being received from the IMx
Done – the event capture has received all expected data as configured on the
measurement group
Truncated - the event capture was closed because it could not be completed. The
event capture may not have received the expected ending packets for the each
channel’s long time waveform signal or it may have gotten out of sync for some unknown reason.
Cancelled by user - the user clicked the Cancel button. When @ptitude Observer is
connected to the Monitor Service, clicking this button will cause the IMx to restart
and cancel the ongoing event capture.
You cannot cancel an ongoing event capture if @ptitude Observer is not connected
to Monitor.
Done, Pre-data not filled - the event capture did not receive all expected data as
configured on the measurement group but it did received all the data the IMx has to
send.
Right-click on a plot in the overview to open the context menu.
Figure 5 - 57.
Example of Event Capture Context Menu.
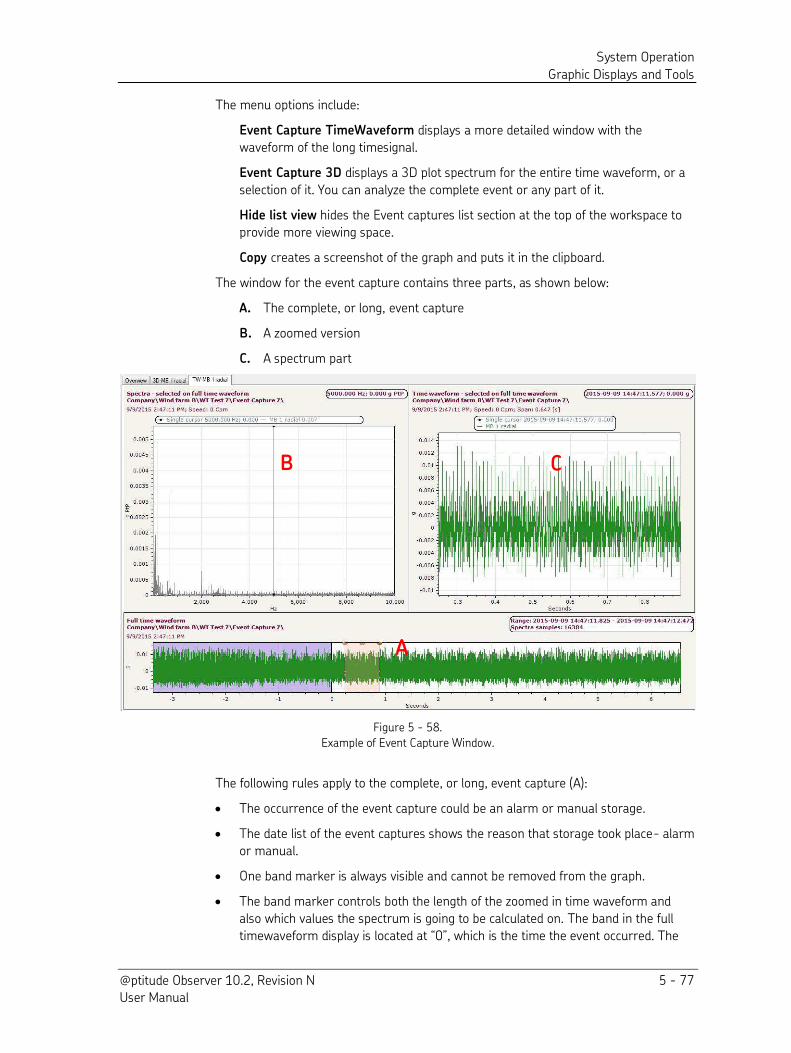
System Operation
Graphic Displays and Tools
@ptitude Observer 10.2, Revision N 5 - 77 User Manual
The menu options include:
Event Capture TimeWaveform displays a more detailed window with the
waveform of the long timesignal.
Event Capture 3D displays a 3D plot spectrum for the entire time waveform, or a
selection of it. You can analyze the complete event or any part of it.
Hide list view hides the Event captures list section at the top of the workspace to
provide more viewing space.
Copy creates a screenshot of the graph and puts it in the clipboard.
The window for the event capture contains three parts, as shown below:
A. The complete, or long, event capture
B. A zoomed version
C. A spectrum part
Figure 5 - 58.
Example of Event Capture Window.
The following rules apply to the complete, or long, event capture (A):
The occurrence of the event capture could be an alarm or manual storage.
The date list of the event captures shows the reason that storage took place- alarm
or manual.
One band marker is always visible and cannot be removed from the graph.
The band marker controls both the length of the zoomed in time waveform and
also which values the spectrum is going to be calculated on. The band in the full
timewaveform display is located at “0”, which is the time the event occurred. The
A
B C
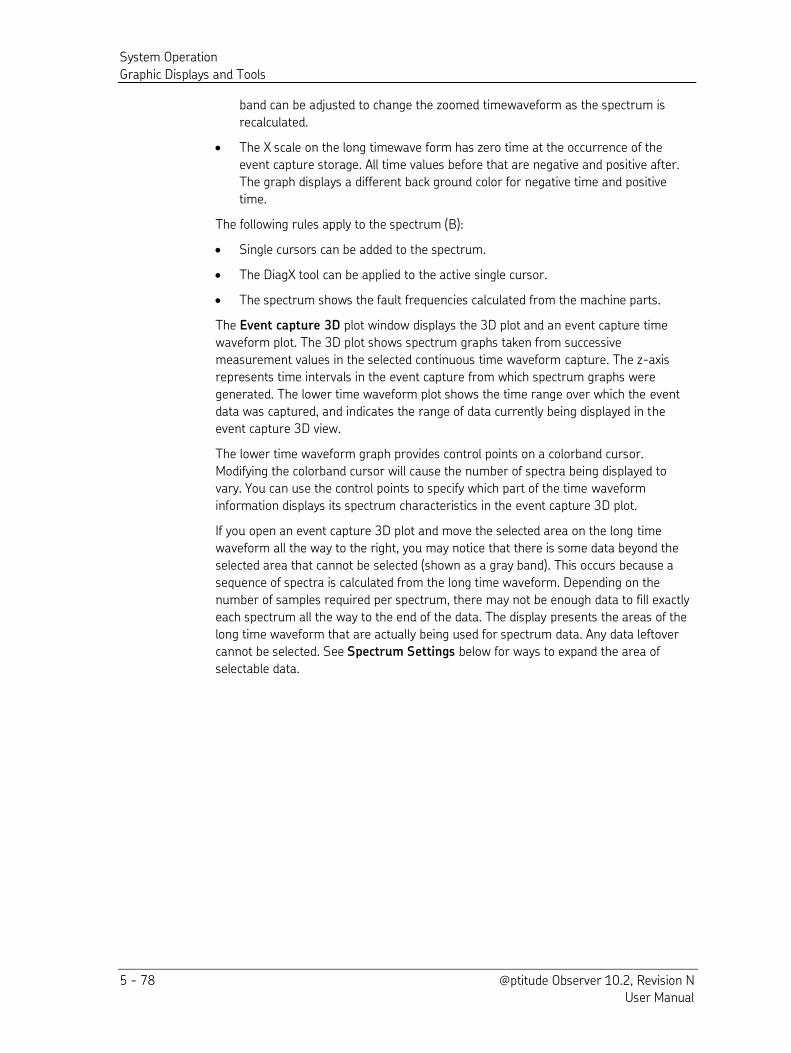
System Operation
Graphic Displays and Tools
5 - 78 @ptitude Observer 10.2, Revision N User Manual
band can be adjusted to change the zoomed timewaveform as the spectrum is
recalculated.
The X scale on the long timewave form has zero time at the occurrence of the
event capture storage. All time values before that are negative and positive after.
The graph displays a different back ground color for negative time and positive
time.
The following rules apply to the spectrum (B):
Single cursors can be added to the spectrum.
The DiagX tool can be applied to the active single cursor.
The spectrum shows the fault frequencies calculated from the machine parts.
The Event capture 3D plot window displays the 3D plot and an event capture time
waveform plot. The 3D plot shows spectrum graphs taken from successive
measurement values in the selected continuous time waveform capture. The z-axis
represents time intervals in the event capture from which spectrum graphs were
generated. The lower time waveform plot shows the time range over which the event
data was captured, and indicates the range of data currently being displayed in the
event capture 3D view.
The lower time waveform graph provides control points on a colorband cursor.
Modifying the colorband cursor will cause the number of spectra being displayed to
vary. You can use the control points to specify which part of the time waveform
information displays its spectrum characteristics in the event capture 3D plot.
If you open an event capture 3D plot and move the selected area on the long time
waveform all the way to the right, you may notice that there is some data beyond the
selected area that cannot be selected (shown as a gray band). This occurs because a
sequence of spectra is calculated from the long time waveform. Depending on the
number of samples required per spectrum, there may not be enough data to fill exactly
each spectrum all the way to the end of the data. The display presents the areas of the
long time waveform that are actually being used for spectrum data. Any data leftover
cannot be selected. See Spectrum Settings below for ways to expand the area of
selectable data.
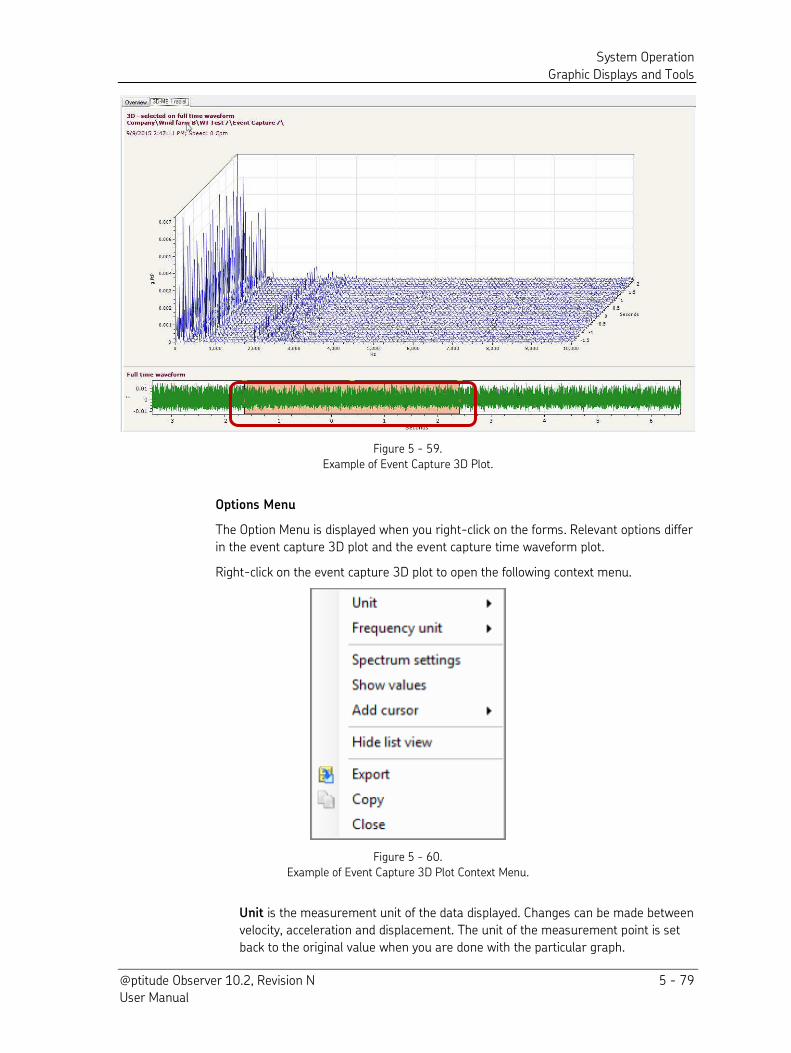
System Operation
Graphic Displays and Tools
@ptitude Observer 10.2, Revision N 5 - 79 User Manual
Figure 5 - 59.
Example of Event Capture 3D Plot.
Options Menu
The Option Menu is displayed when you right-click on the forms. Relevant options differ
in the event capture 3D plot and the event capture time waveform plot.
Right-click on the event capture 3D plot to open the following context menu.
Figure 5 - 60.
Example of Event Capture 3D Plot Context Menu.
Unit is the measurement unit of the data displayed. Changes can be made between
velocity, acceleration and displacement. The unit of the measurement point is set
back to the original value when you are done with the particular graph.
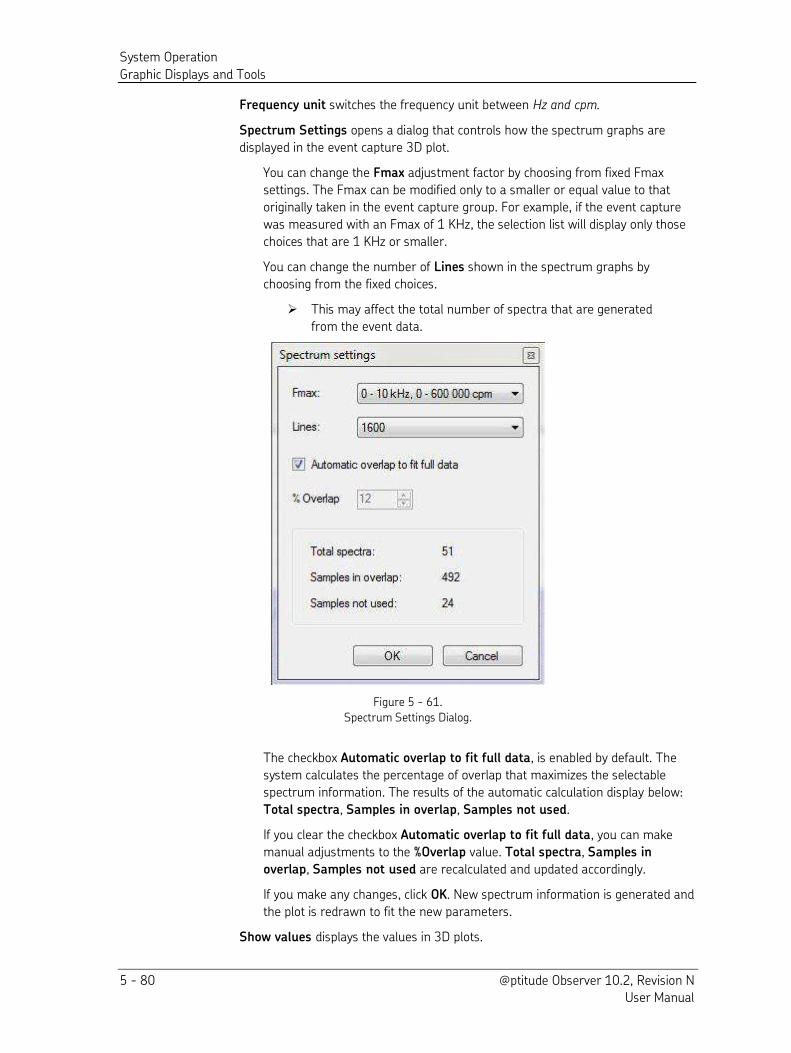
System Operation
Graphic Displays and Tools
5 - 80 @ptitude Observer 10.2, Revision N User Manual
Frequency unit switches the frequency unit between Hz and cpm.
Spectrum Settings opens a dialog that controls how the spectrum graphs are
displayed in the event capture 3D plot.
You can change the Fmax adjustment factor by choosing from fixed Fmax
settings. The Fmax can be modified only to a smaller or equal value to that
originally taken in the event capture group. For example, if the event capture
was measured with an Fmax of 1 KHz, the selection list will display only those
choices that are 1 KHz or smaller.
You can change the number of Lines shown in the spectrum graphs by
choosing from the fixed choices.
This may affect the total number of spectra that are generated
from the event data.
Figure 5 - 61.
Spectrum Settings Dialog.
The checkbox Automatic overlap to fit full data, is enabled by default. The
system calculates the percentage of overlap that maximizes the selectable
spectrum information. The results of the automatic calculation display below:
Total spectra, Samples in overlap, Samples not used.
If you clear the checkbox Automatic overlap to fit full data, you can make
manual adjustments to the %Overlap value. Total spectra, Samples in
overlap, Samples not used are recalculated and updated accordingly.
If you make any changes, click OK. New spectrum information is generated and
the plot is redrawn to fit the new parameters.
Show values displays the values in 3D plots.
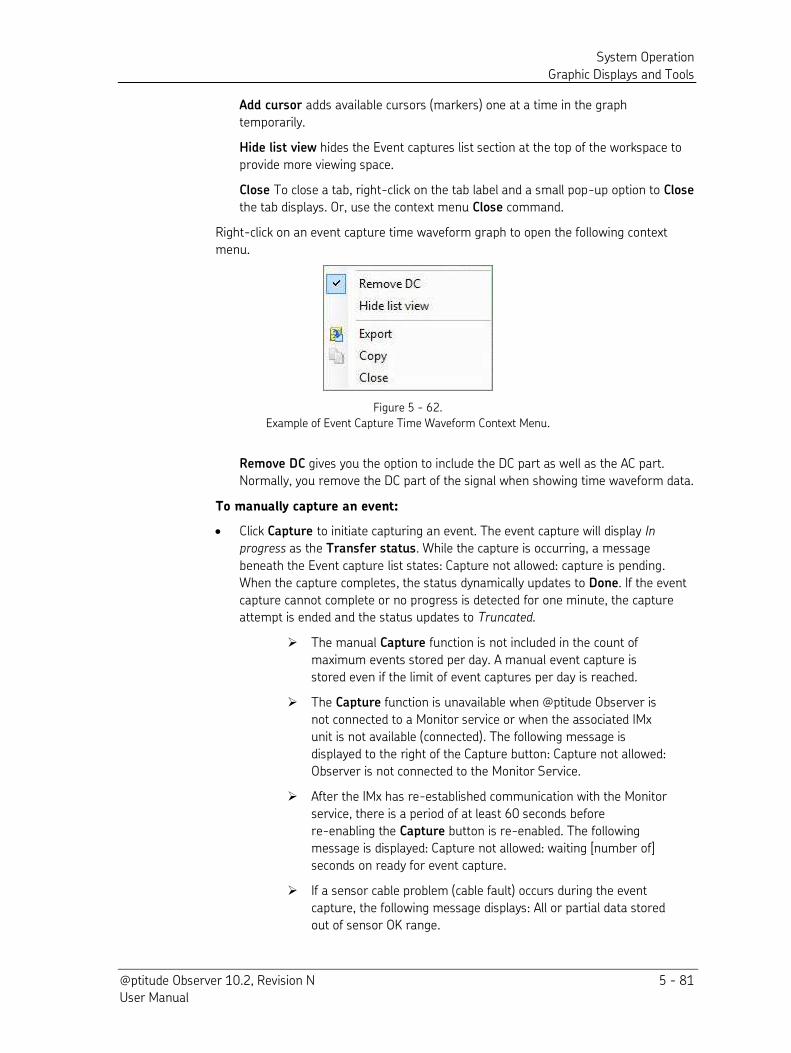
System Operation
Graphic Displays and Tools
@ptitude Observer 10.2, Revision N 5 - 81 User Manual
Add cursor adds available cursors (markers) one at a time in the graph
temporarily.
Hide list view hides the Event captures list section at the top of the workspace to
provide more viewing space.
Close To close a tab, right-click on the tab label and a small pop-up option to Close
the tab displays. Or, use the context menu Close command.
Right-click on an event capture time waveform graph to open the following context
menu.
Figure 5 - 62.
Example of Event Capture Time Waveform Context Menu.
Remove DC gives you the option to include the DC part as well as the AC part.
Normally, you remove the DC part of the signal when showing time waveform data.
To manually capture an event:
Click Capture to initiate capturing an event. The event capture will display In
progress as the Transfer status. While the capture is occurring, a message
beneath the Event capture list states: Capture not allowed: capture is pending.
When the capture completes, the status dynamically updates to Done. If the event
capture cannot complete or no progress is detected for one minute, the capture attempt is ended and the status updates to Truncated.
The manual Capture function is not included in the count of
maximum events stored per day. A manual event capture is
stored even if the limit of event captures per day is reached.
The Capture function is unavailable when @ptitude Observer is
not connected to a Monitor service or when the associated IMx
unit is not available (connected). The following message is
displayed to the right of the Capture button: Capture not allowed:
Observer is not connected to the Monitor Service.
After the IMx has re-established communication with the Monitor
service, there is a period of at least 60 seconds before
re-enabling the Capture button is re-enabled. The following
message is displayed: Capture not allowed: waiting [number of]
seconds on ready for event capture.
If a sensor cable problem (cable fault) occurs during the event
capture, the following message displays: All or partial data stored
out of sensor OK range.
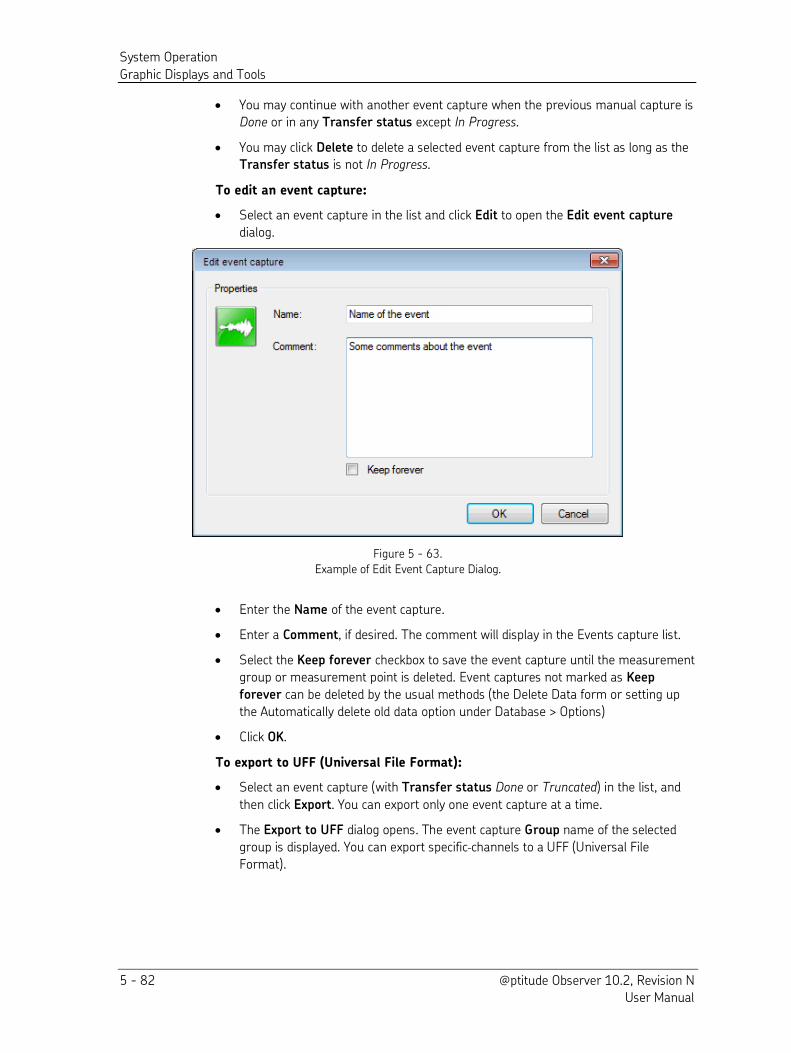
System Operation
Graphic Displays and Tools
5 - 82 @ptitude Observer 10.2, Revision N User Manual
You may continue with another event capture when the previous manual capture is Done or in any Transfer status except In Progress.
You may click Delete to delete a selected event capture from the list as long as the Transfer status is not In Progress.
To edit an event capture:
Select an event capture in the list and click Edit to open the Edit event capture
dialog.
Figure 5 - 63.
Example of Edit Event Capture Dialog.
Enter the Name of the event capture.
Enter a Comment, if desired. The comment will display in the Events capture list.
Select the Keep forever checkbox to save the event capture until the measurement
group or measurement point is deleted. Event captures not marked as Keep
forever can be deleted by the usual methods (the Delete Data form or setting up
the Automatically delete old data option under Database > Options)
Click OK.
To export to UFF (Universal File Format):
Select an event capture (with Transfer status Done or Truncated) in the list, and
then click Export. You can export only one event capture at a time.
The Export to UFF dialog opens. The event capture Group name of the selected
group is displayed. You can export specific channels to a UFF (Universal File
Format).
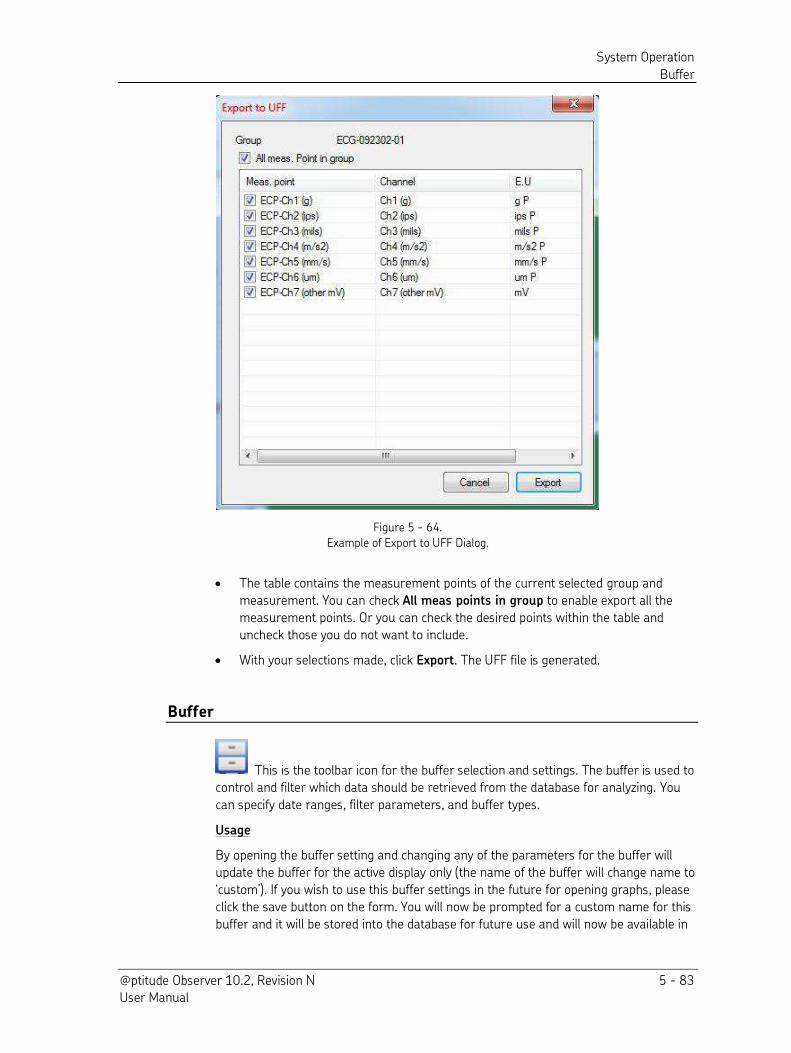
System Operation
Buffer
@ptitude Observer 10.2, Revision N 5 - 83 User Manual
Figure 5 - 64.
Example of Export to UFF Dialog.
The table contains the measurement points of the current selected group and
measurement. You can check All meas points in group to enable export all the
measurement points. Or you can check the desired points within the table and
uncheck those you do not want to include.
With your selections made, click Export. The UFF file is generated.
Buffer
This is the toolbar icon for the buffer selection and settings. The buffer is used to
control and filter which data should be retrieved from the database for analyzing. You
can specify date ranges, filter parameters, and buffer types.
Usage
By opening the buffer setting and changing any of the parameters for the buffer will
update the buffer for the active display only (the name of the buffer will change name to
‘custom’). If you wish to use this buffer settings in the future for opening graphs, please click the save button on the form. You will now be prompted for a custom name for this
buffer and it will be stored into the database for future use and will now be available in
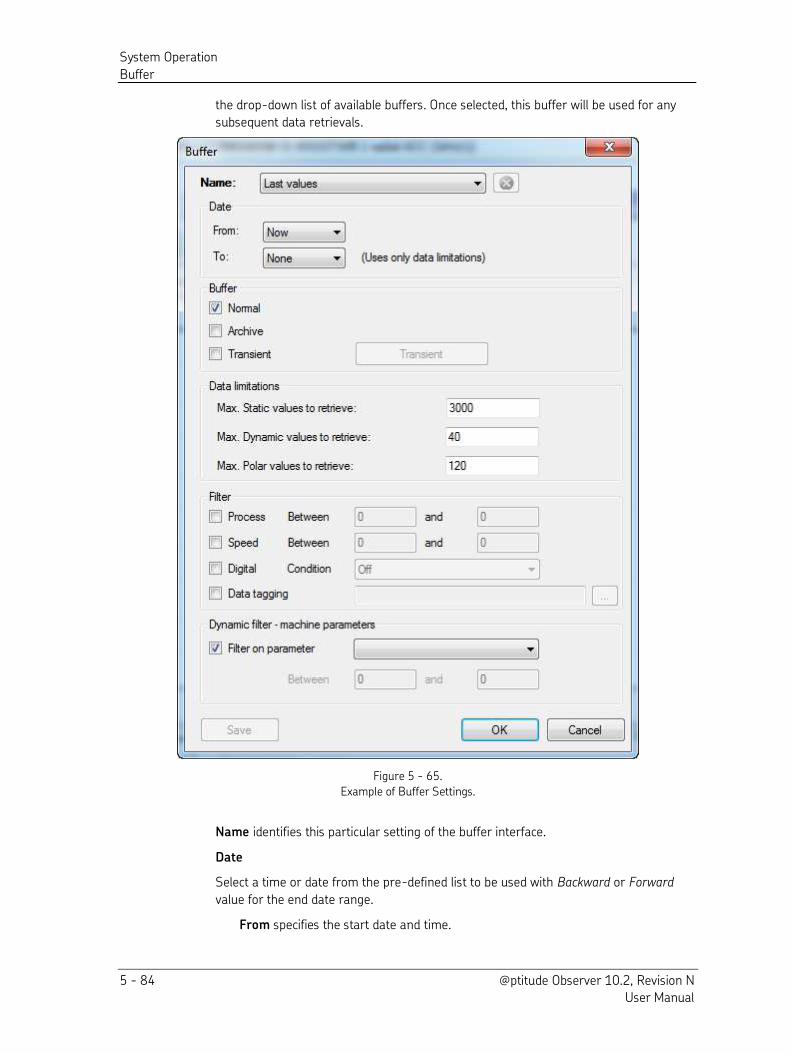
System Operation
Buffer
5 - 84 @ptitude Observer 10.2, Revision N User Manual
the drop-down list of available buffers. Once selected, this buffer will be used for any
subsequent data retrievals.
Figure 5 - 65.
Example of Buffer Settings.
Name identifies this particular setting of the buffer interface.
Date
Select a time or date from the pre-defined list to be used with Backward or Forward
value for the end date range.
From specifies the start date and time.
System Operation
Buffer
@ptitude Observer 10.2, Revision N 5 - 85 User Manual
To specifies the range of end date and time.
None
Now: specifies the current date and time for the end range.
Time: a specific time to define the end range.
Backward: specifies a date range backward in time relative to the start time.
The pre-defined dates may be used for this option.
Forward: specifies a date range forward in time relative to the start time.
Buffer
It specifies from which buffer to collect the data.
Normal: refers to the data stored in the rolling buffer. The type of data and the
storage interval are set in Operating and Storage Conditions Tab settings when
creating a measurement point.
Archive: refers to the data stored in a special buffer called archive. This buffer
stores one measurement data every 10 minutes. It can hold up to 80 000
measurement data which are equivalent to data collected in 1½years. The type of
data and the storage interval are set in trend setting when creating a measurement
point.
Transient: refers to the data captured during transient. Therefore, for this type of
buffer, a specific transient of a measurement group must be selected.
Data limitations
Data limitations allow the user to enter the amount of maximum values (Static,
Dynamic and Polar) that should be retrieved.
Filter
Process allows filtering of process readings such as temperature and load. This is
applicable only if the measurement point had an associated process point
configured.
Speed allows filtering of speed readings. This is applicable only if the measurement
point had an associated speed point configured.
Digital allows filtering of digital input on or off and filtering by the operating
classes. This is applicable if the measurement point had an associated digital point
configured.
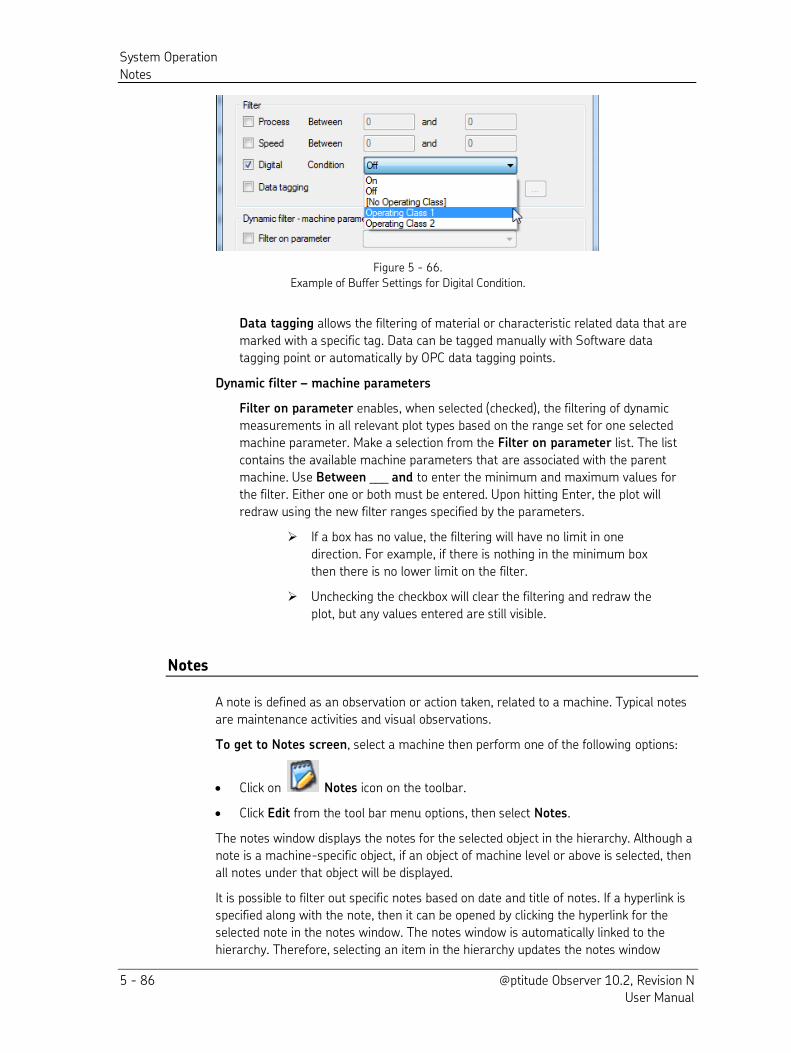
System Operation
Notes
5 - 86 @ptitude Observer 10.2, Revision N User Manual
Figure 5 - 66.
Example of Buffer Settings for Digital Condition.
Data tagging allows the filtering of material or characteristic related data that are
marked with a specific tag. Data can be tagged manually with Software data
tagging point or automatically by OPC data tagging points.
Dynamic filter – machine parameters
Filter on parameter enables, when selected (checked), the filtering of dynamic
measurements in all relevant plot types based on the range set for one selected
machine parameter. Make a selection from the Filter on parameter list. The list
contains the available machine parameters that are associated with the parent
machine. Use Between ___ and to enter the minimum and maximum values for
the filter. Either one or both must be entered. Upon hitting Enter, the plot will
redraw using the new filter ranges specified by the parameters.
If a box has no value, the filtering will have no limit in one
direction. For example, if there is nothing in the minimum box
then there is no lower limit on the filter.
Unchecking the checkbox will clear the filtering and redraw the
plot, but any values entered are still visible.
Notes
A note is defined as an observation or action taken, related to a machine. Typical notes
are maintenance activities and visual observations.
To get to Notes screen, select a machine then perform one of the following options:
Click on Notes icon on the toolbar.
Click Edit from the tool bar menu options, then select Notes.
The notes window displays the notes for the selected object in the hierarchy. Although a
note is a machine-specific object, if an object of machine level or above is selected, then
all notes under that object will be displayed.
It is possible to filter out specific notes based on date and title of notes. If a hyperlink is
specified along with the note, then it can be opened by clicking the hyperlink for the
selected note in the notes window. The notes window is automatically linked to the
hierarchy. Therefore, selecting an item in the hierarchy updates the notes window
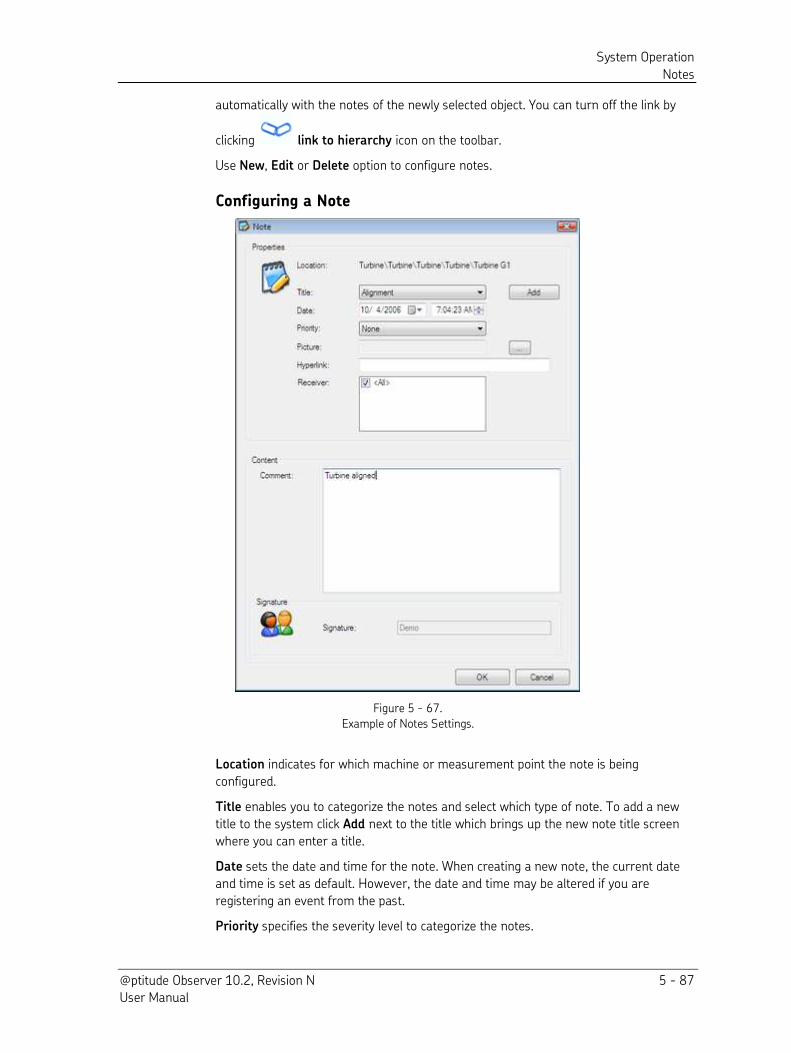
System Operation
Notes
@ptitude Observer 10.2, Revision N 5 - 87 User Manual
automatically with the notes of the newly selected object. You can turn off the link by
clicking link to hierarchy icon on the toolbar.
Use New, Edit or Delete option to configure notes.
Configuring a Note
Figure 5 - 67.
Example of Notes Settings.
Location indicates for which machine or measurement point the note is being
configured.
Title enables you to categorize the notes and select which type of note. To add a new
title to the system click Add next to the title which brings up the new note title screen
where you can enter a title.
Date sets the date and time for the note. When creating a new note, the current date
and time is set as default. However, the date and time may be altered if you are
registering an event from the past.
Priority specifies the severity level to categorize the notes.
System Operation
Event Cases
5 - 88 @ptitude Observer 10.2, Revision N User Manual
Picture is a picture in the database associated with the note.
Hyperlink is a document or webpage associated with the note where more information
regarding the note can be found. This document or hyperlink can be accessed from the
notes list window by clicking the hyperlink of the selected note.
Receiver specifies which group of users to receive the note. Groups are created by
Receivers interface in Libraries under Database.
Comment is the information text or content of the note.
Signature is the person who created the note.
Event Cases
Event cases can be created in the Observer system in order to keep track and
document reports, information and history regarding a specific event tied to a specific
machine.
New event cases can be created on machine level:
Right-click on a machine from the hierarchy view then choose Add Event case.
or select a machine, click the Event cases icon on the tool bar, then click the New
button on the Event cases window.
The event cases window displays the event case reports for the selected object in the
hierarchy. Although event cases are machine-specific, if an object of machine level or
above is selected, then all event case reports under that object will be displayed.
Reports can be created to inform a customer or a department of actions that need to
be taken care of regarding the event.
The reports are stored to the event case and can be reviewed and followed-up at a later
time. The report is editable until the report is released by setting the status of the
report to “released”. Each report in the event case can produce a document at any time in word or .pdf
format which can automatically be sent as en email and/or stored as an attachment on
the machine.
A report contains a number of assessments which typically are used to inform
customers or internal departments of important information by the data analysts in
Observer. An assessment consists of an assessment text and a recommendation how to
handle the information detected in the assessment.
A severity level can be set in the form of a “classification level” and the assessment can be tied to a specific machine part if desired.
To the assessments, pictures can be added which will also be printed in the document
that can be produced from a report. These pictures are typically screen shots of graphs
in Observer indicating a defect or problem of some kind, but any picture can be added.
Event case report layouts define how the documents should look like. For more
information, see Report Library.
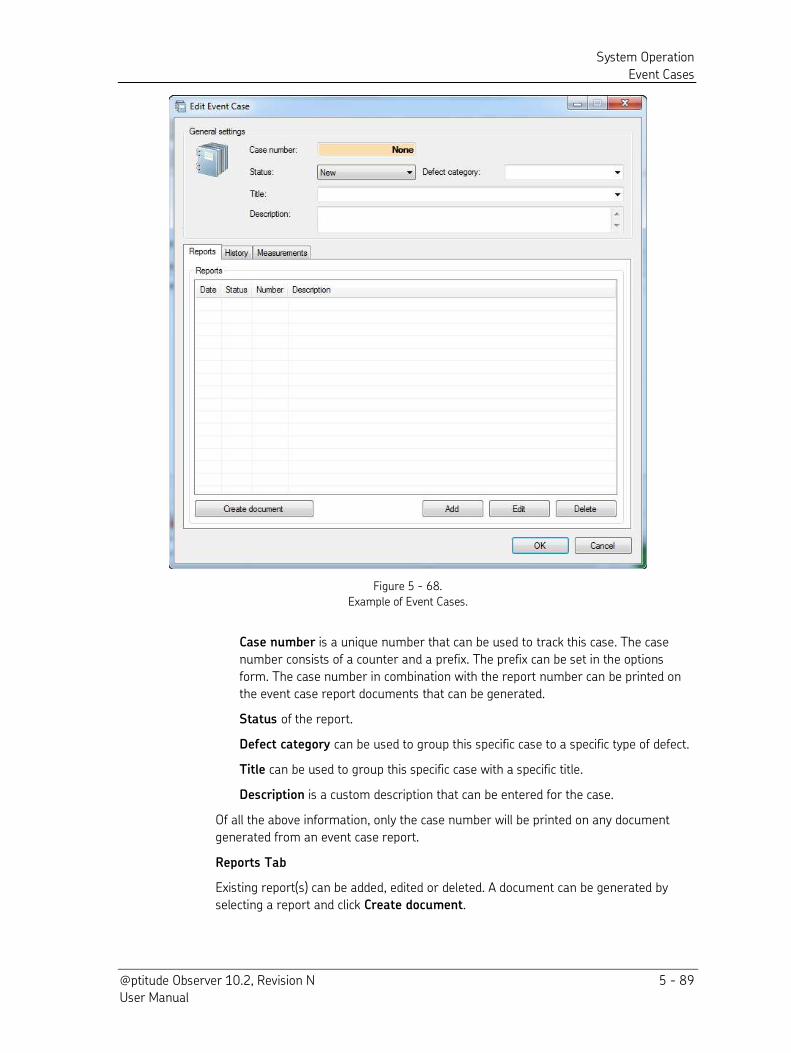
System Operation
Event Cases
@ptitude Observer 10.2, Revision N 5 - 89 User Manual
Figure 5 - 68.
Example of Event Cases.
Case number is a unique number that can be used to track this case. The case
number consists of a counter and a prefix. The prefix can be set in the options
form. The case number in combination with the report number can be printed on
the event case report documents that can be generated.
Status of the report.
Defect category can be used to group this specific case to a specific type of defect.
Title can be used to group this specific case with a specific title.
Description is a custom description that can be entered for the case.
Of all the above information, only the case number will be printed on any document
generated from an event case report.
Reports Tab
Existing report(s) can be added, edited or deleted. A document can be generated by
selecting a report and click Create document.
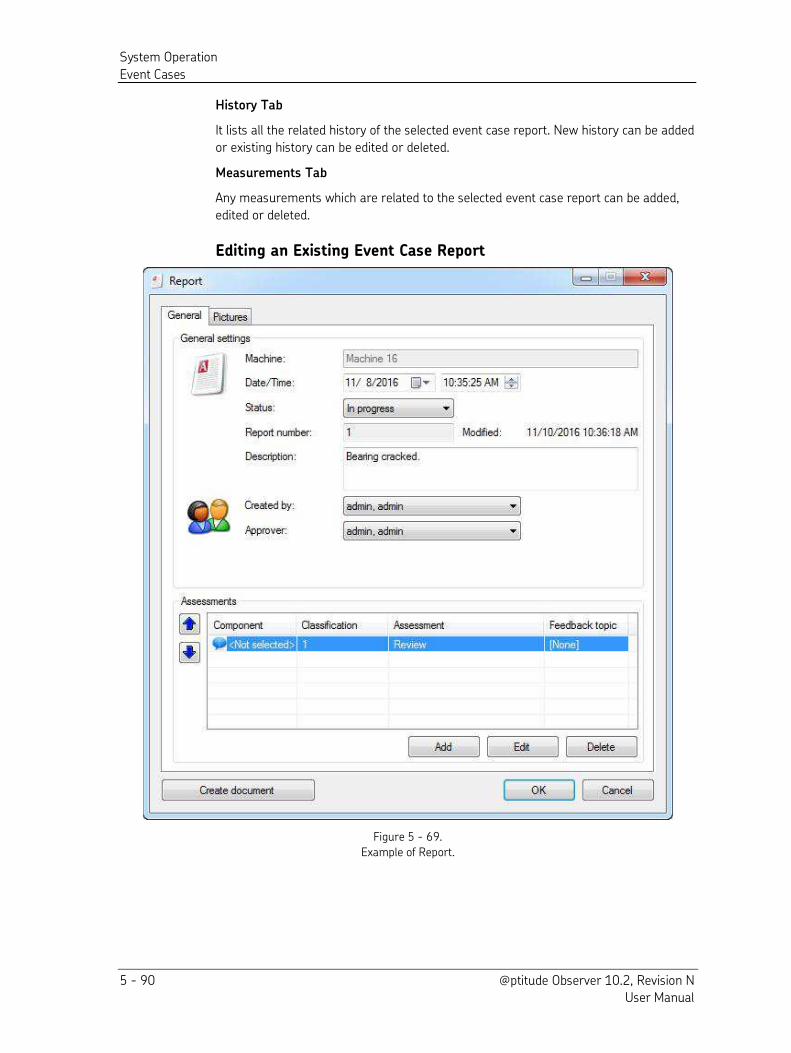
System Operation
Event Cases
5 - 90 @ptitude Observer 10.2, Revision N User Manual
History Tab
It lists all the related history of the selected event case report. New history can be added
or existing history can be edited or deleted.
Measurements Tab
Any measurements which are related to the selected event case report can be added,
edited or deleted.
Editing an Existing Event Case Report
Figure 5 - 69.
Example of Report.
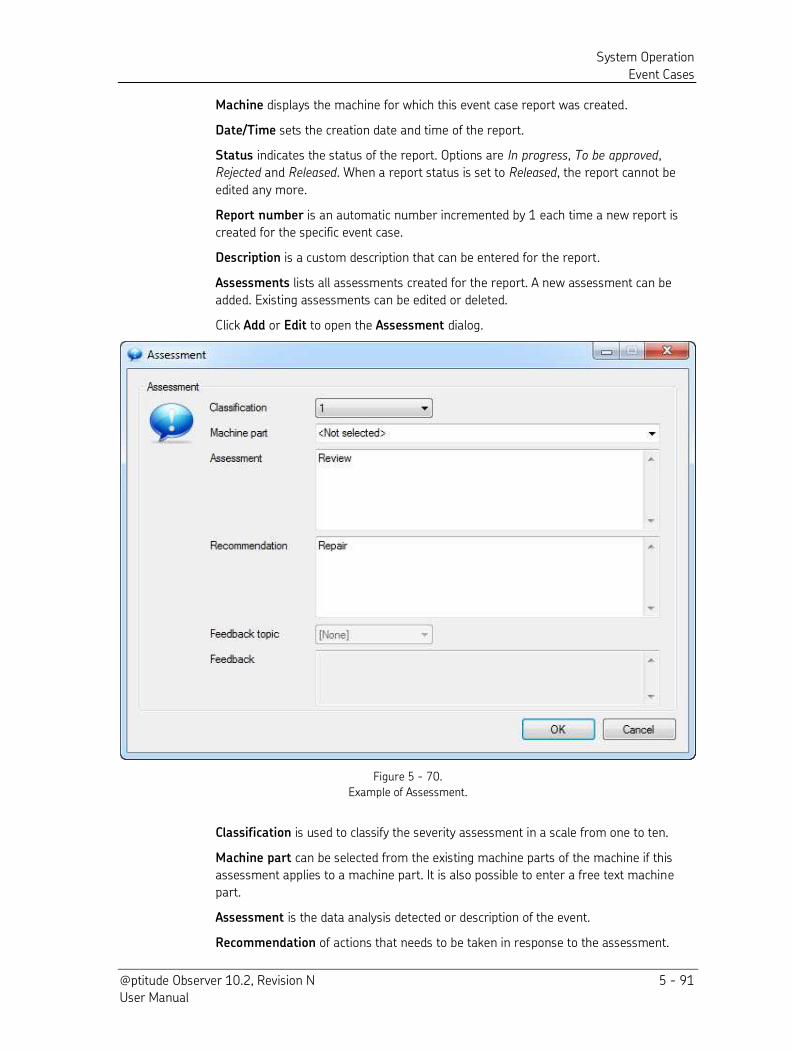
System Operation
Event Cases
@ptitude Observer 10.2, Revision N 5 - 91 User Manual
Machine displays the machine for which this event case report was created.
Date/Time sets the creation date and time of the report.
Status indicates the status of the report. Options are In progress, To be approved,
Rejected and Released. When a report status is set to Released, the report cannot be
edited any more.
Report number is an automatic number incremented by 1 each time a new report is
created for the specific event case.
Description is a custom description that can be entered for the report.
Assessments lists all assessments created for the report. A new assessment can be
added. Existing assessments can be edited or deleted.
Click Add or Edit to open the Assessment dialog.
Figure 5 - 70.
Example of Assessment.
Classification is used to classify the severity assessment in a scale from one to ten.
Machine part can be selected from the existing machine parts of the machine if this
assessment applies to a machine part. It is also possible to enter a free text machine
part.
Assessment is the data analysis detected or description of the event.
Recommendation of actions that needs to be taken in response to the assessment.
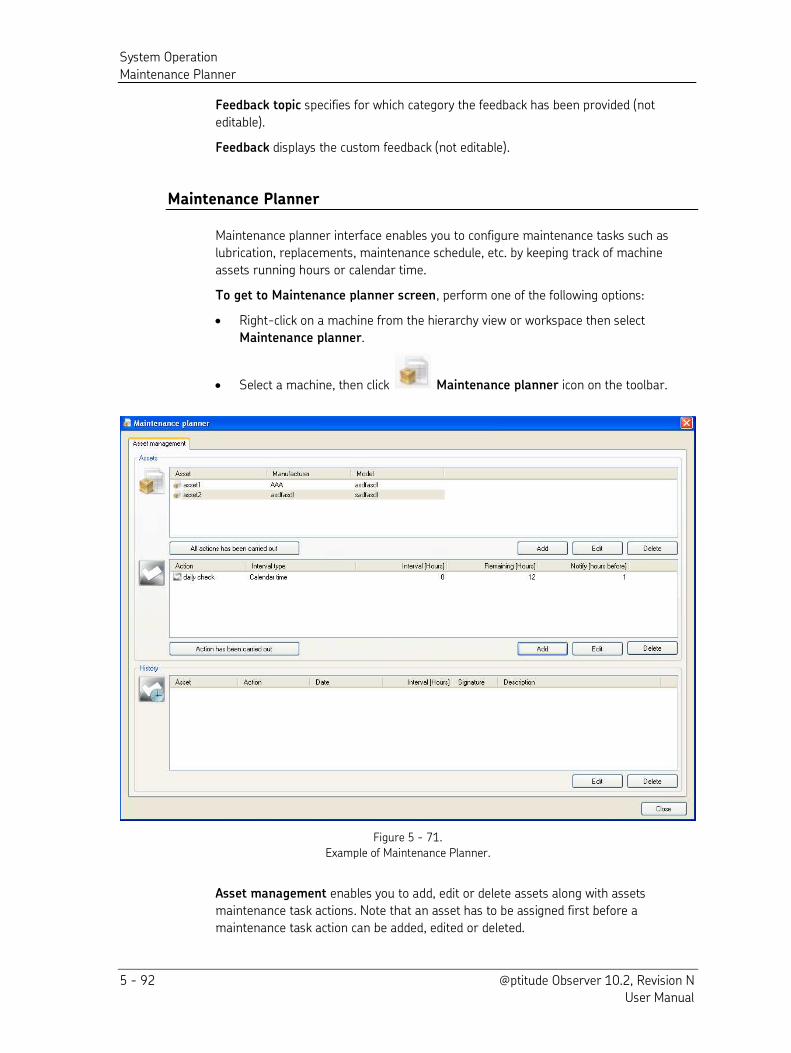
System Operation
Maintenance Planner
5 - 92 @ptitude Observer 10.2, Revision N User Manual
Feedback topic specifies for which category the feedback has been provided (not
editable).
Feedback displays the custom feedback (not editable).
Maintenance Planner
Maintenance planner interface enables you to configure maintenance tasks such as
lubrication, replacements, maintenance schedule, etc. by keeping track of machine
assets running hours or calendar time.
To get to Maintenance planner screen, perform one of the following options:
Right-click on a machine from the hierarchy view or workspace then select
Maintenance planner.
Select a machine, then click Maintenance planner icon on the toolbar.
Figure 5 - 71.
Example of Maintenance Planner.
Asset management enables you to add, edit or delete assets along with assets
maintenance task actions. Note that an asset has to be assigned first before a
maintenance task action can be added, edited or deleted.
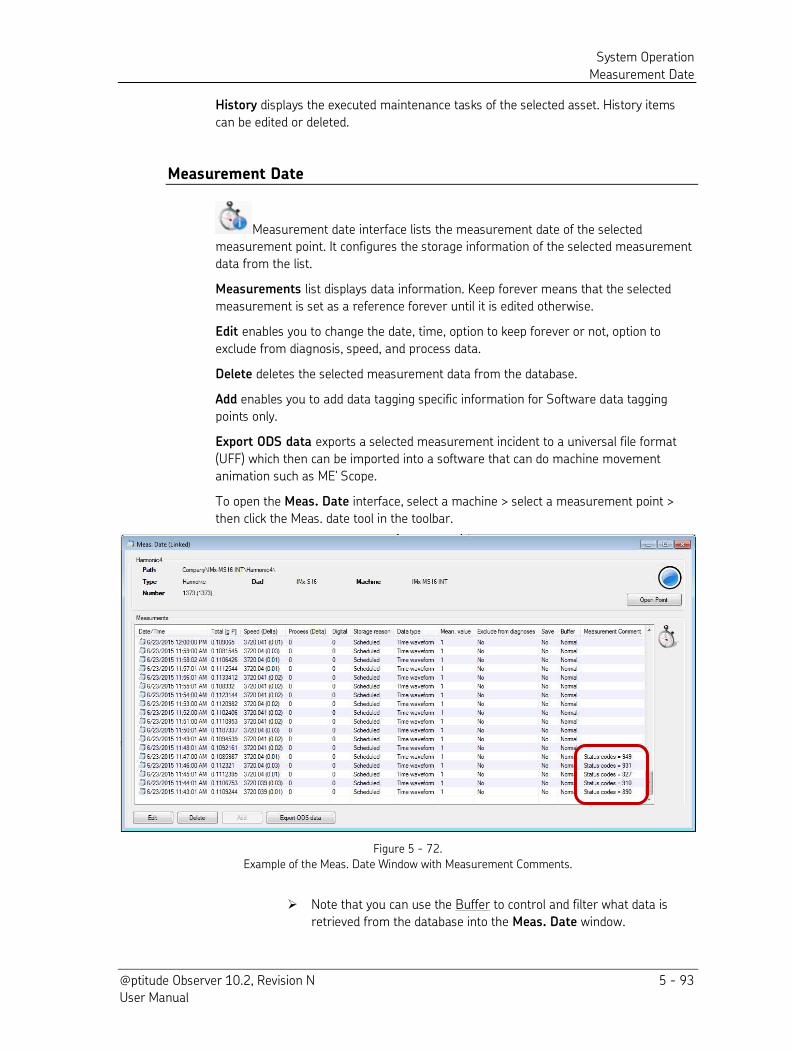
System Operation
Measurement Date
@ptitude Observer 10.2, Revision N 5 - 93 User Manual
History displays the executed maintenance tasks of the selected asset. History items
can be edited or deleted.
Measurement Date
Measurement date interface lists the measurement date of the selected measurement point. It configures the storage information of the selected measurement
data from the list.
Measurements list displays data information. Keep forever means that the selected
measurement is set as a reference forever until it is edited otherwise.
Edit enables you to change the date, time, option to keep forever or not, option to
exclude from diagnosis, speed, and process data.
Delete deletes the selected measurement data from the database.
Add enables you to add data tagging specific information for Software data tagging
points only.
Export ODS data exports a selected measurement incident to a universal file format
(UFF) which then can be imported into a software that can do machine movement
animation such as ME' Scope.
To open the Meas. Date interface, select a machine > select a measurement point >
then click the Meas. date tool in the toolbar.
Figure 5 - 72.
Example of the Meas. Date Window with Measurement Comments.
Note that you can use the Buffer to control and filter what data is
retrieved from the database into the Meas. Date window.
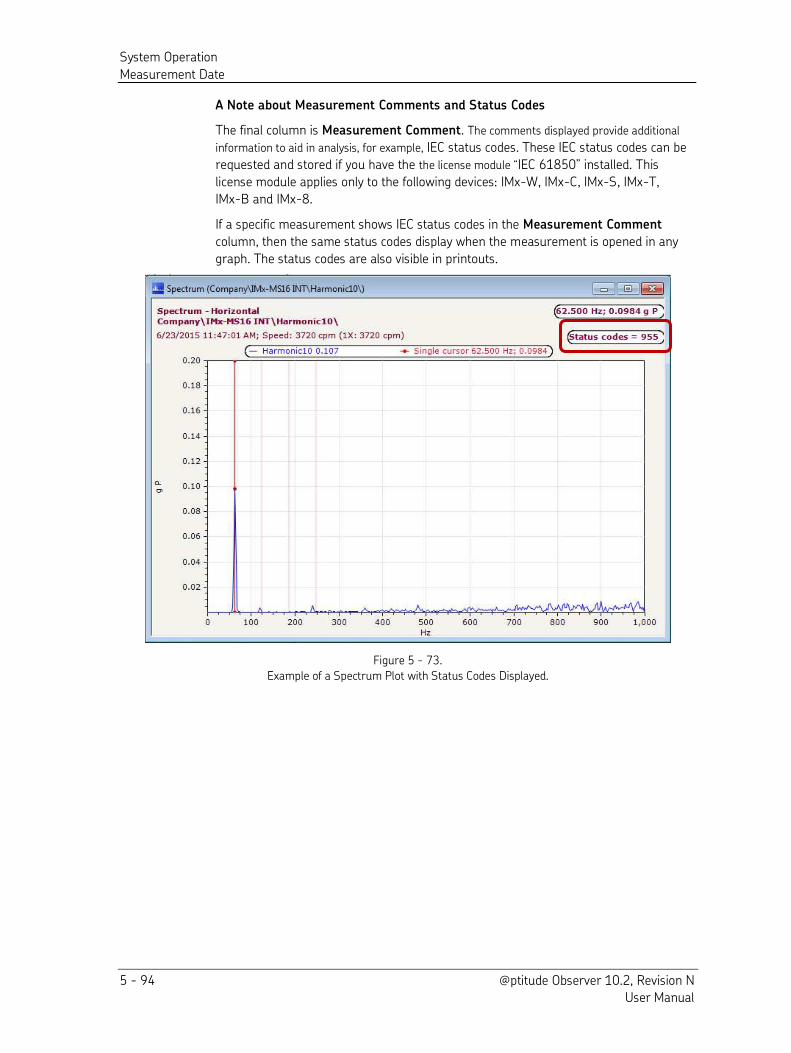
System Operation
Measurement Date
5 - 94 @ptitude Observer 10.2, Revision N User Manual
A Note about Measurement Comments and Status Codes
The final column is Measurement Comment. The comments displayed provide additional
information to aid in analysis, for example, IEC status codes. These IEC status codes can be
requested and stored if you have the the license module “IEC 61850” installed. This
license module applies only to the following devices: IMx-W, IMx-C, IMx-S, IMx-T,
IMx-B and IMx-8.
If a specific measurement shows IEC status codes in the Measurement Comment
column, then the same status codes display when the measurement is opened in any
graph. The status codes are also visible in printouts.
Figure 5 - 73.
Example of a Spectrum Plot with Status Codes Displayed.
@ptitude Observer 10.2, Revision N 6 - 1 User Manual
6
Menu Items
The following are the menu items available in @ptitude Observer.
File
Edit
Show
Database
On-line
Portables
Window
Help
File
File menu provides the following interfaces.
Manage databases
Add external database
Remove external database
Report
Log off
Exit
Manage Databases
Manage databases interface provides the ability to connect to a database or jump from
one database to another within @ptitude Observer without leaving the current log-on
session. This is an important asset when you have to analyze data spread over several
databases. You may add a new database and edit or remove an existing database.
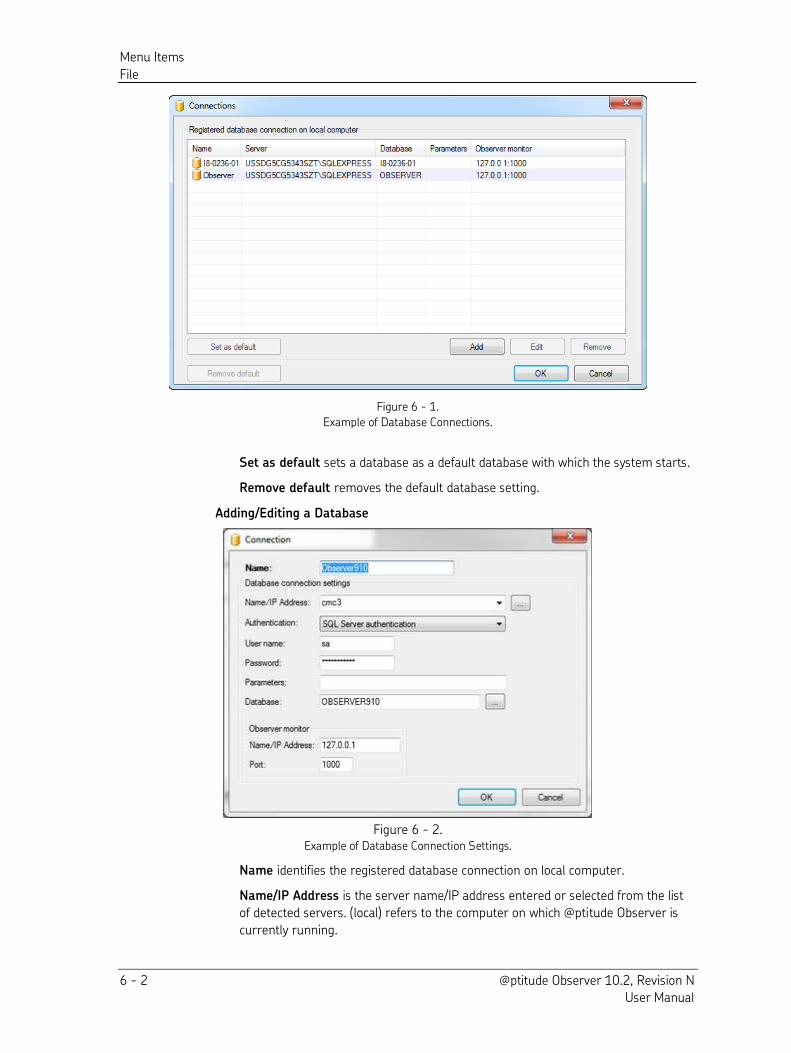
Menu Items
File
6 - 2 @ptitude Observer 10.2, Revision N User Manual
Figure 6 - 1.
Example of Database Connections.
Set as default sets a database as a default database with which the system starts.
Remove default removes the default database setting.
Adding/Editing a Database
Figure 6 - 2. Example of Database Connection Settings.
Name identifies the registered database connection on local computer.
Name/IP Address is the server name/IP address entered or selected from the list
of detected servers. (local) refers to the computer on which @ptitude Observer is
currently running.
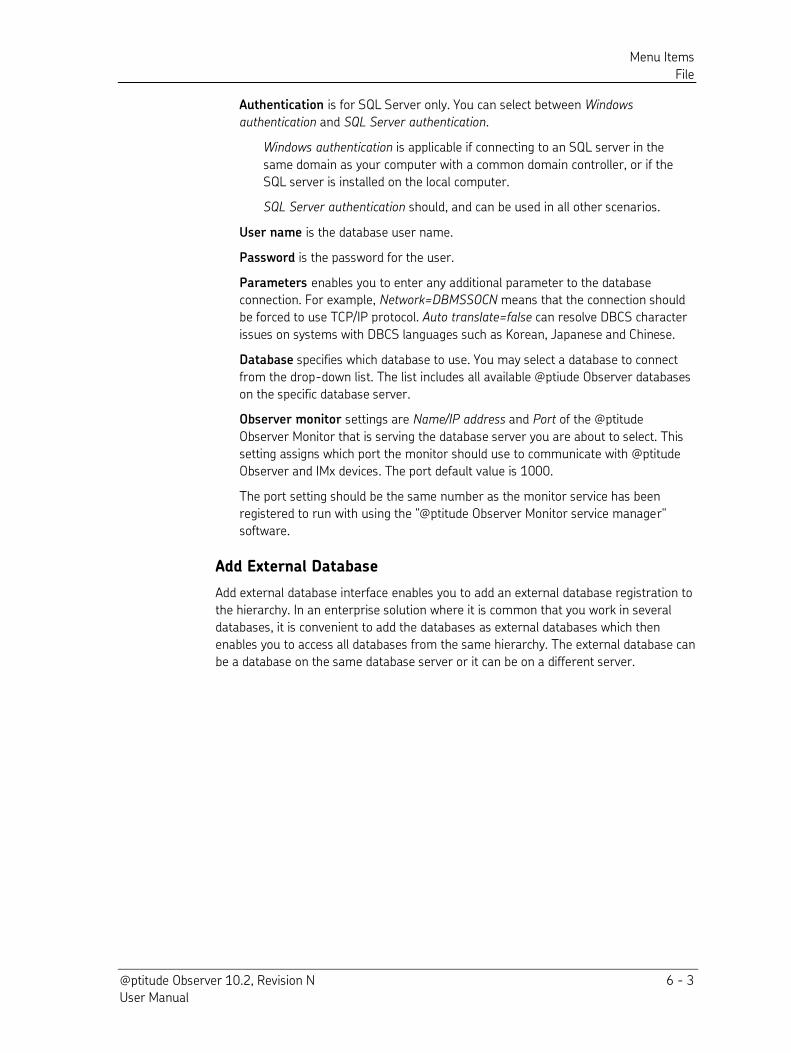
Menu Items
File
@ptitude Observer 10.2, Revision N 6 - 3 User Manual
Authentication is for SQL Server only. You can select between Windows
authentication and SQL Server authentication.
Windows authentication is applicable if connecting to an SQL server in the
same domain as your computer with a common domain controller, or if the
SQL server is installed on the local computer.
SQL Server authentication should, and can be used in all other scenarios.
User name is the database user name.
Password is the password for the user.
Parameters enables you to enter any additional parameter to the database connection. For example, Network=DBMSSOCN means that the connection should
be forced to use TCP/IP protocol. Auto translate=false can resolve DBCS character
issues on systems with DBCS languages such as Korean, Japanese and Chinese.
Database specifies which database to use. You may select a database to connect
from the drop-down list. The list includes all available @ptiude Observer databases
on the specific database server.
Observer monitor settings are Name/IP address and Port of the @ptitude
Observer Monitor that is serving the database server you are about to select. This
setting assigns which port the monitor should use to communicate with @ptitude
Observer and IMx devices. The port default value is 1000.
The port setting should be the same number as the monitor service has been
registered to run with using the "@ptitude Observer Monitor service manager"
software.
Add External Database
Add external database interface enables you to add an external database registration to
the hierarchy. In an enterprise solution where it is common that you work in several
databases, it is convenient to add the databases as external databases which then
enables you to access all databases from the same hierarchy. The external database can
be a database on the same database server or it can be on a different server.
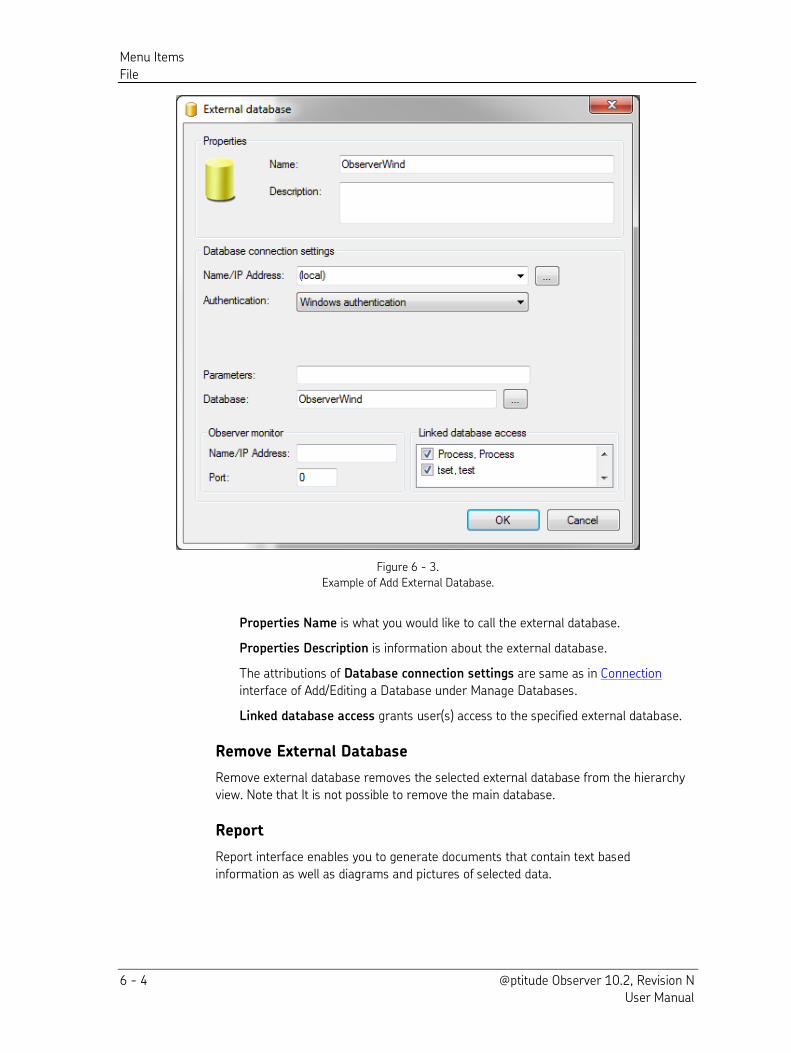
Menu Items
File
6 - 4 @ptitude Observer 10.2, Revision N User Manual
Figure 6 - 3.
Example of Add External Database.
Properties Name is what you would like to call the external database.
Properties Description is information about the external database.
The attributions of Database connection settings are same as in Connection
interface of Add/Editing a Database under Manage Databases.
Linked database access grants user(s) access to the specified external database.
Remove External Database
Remove external database removes the selected external database from the hierarchy
view. Note that It is not possible to remove the main database.
Report
Report interface enables you to generate documents that contain text based
information as well as diagrams and pictures of selected data.
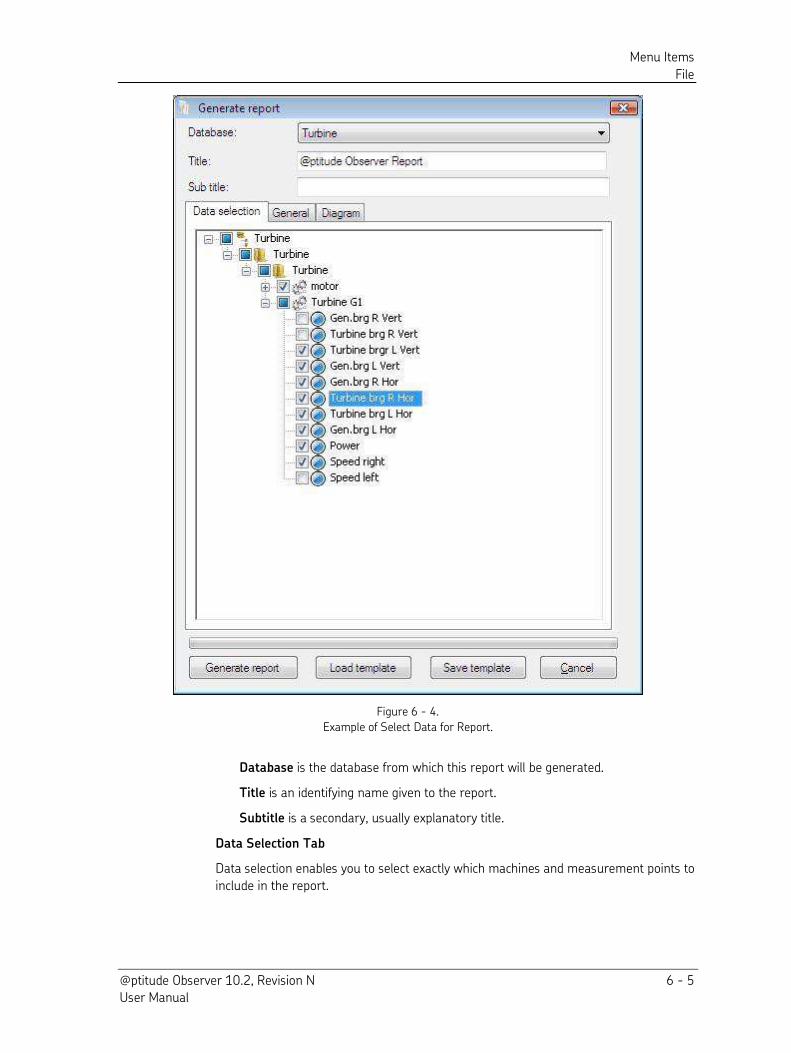
Menu Items
File
@ptitude Observer 10.2, Revision N 6 - 5 User Manual
Figure 6 - 4.
Example of Select Data for Report.
Database is the database from which this report will be generated.
Title is an identifying name given to the report.
Subtitle is a secondary, usually explanatory title.
Data Selection Tab
Data selection enables you to select exactly which machines and measurement points to
include in the report.
Menu Items
File
6 - 6 @ptitude Observer 10.2, Revision N User Manual
General Tab
General sets formatting rules for the report and to select types of machine information
that should be included. Different types of lists, like alarm lists can also be included.
Content prints the “Table of contents” at the beginning of the report, if checked.
Machine data prints the extended machine information for each machine included
in the report, if checked.
Notes includes all the notes related to the selected machines during the date/time
range entered, if checked.
Overall level includes the overall value list related to the selected measurement
points from the date/time entered, if checked.
Alarm list includes alarm information related to the selected measurement points
during the date/time range entered according to the filtering option and status
option, if checked.
Page break between machines forces a page break on the printout between
machines, if checked.
Show report automatically when generating shows the report in the selected
format after the creation of the report has been finished, if checked.
Send report to printer sends the report immediately to a printer after it has been
created, if checked.
Keep temporary files keeps all the temporary files required for the creation of the
report including pictures, if checked.
Diagram Tab
Diagram allows you to select desired graph settings to be included in the report along
with date or value range.
Load template loads report settings.
Save template saves report settings you have created as a template.
Log Off
Log off logs the current user off and allows another user to log on to the system.
Exit
Exit stops the current system session.
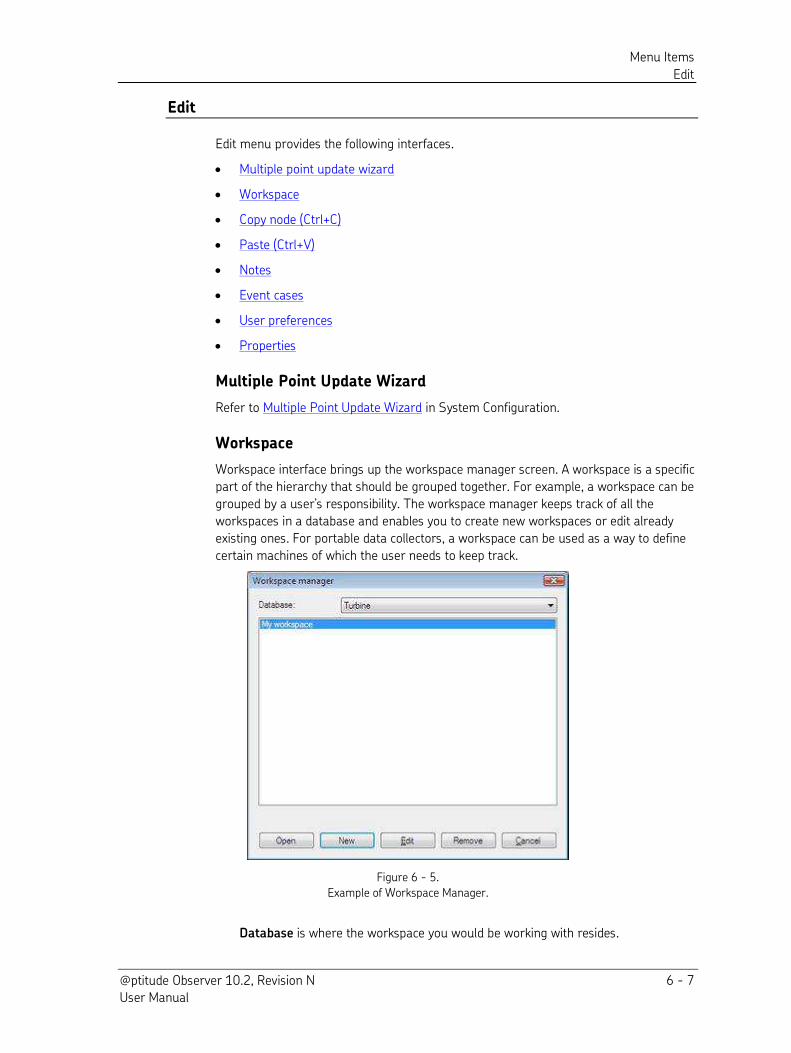
Menu Items
Edit
@ptitude Observer 10.2, Revision N 6 - 7 User Manual
Edit
Edit menu provides the following interfaces.
Multiple point update wizard
Workspace
Copy node (Ctrl+C)
Paste (Ctrl+V)
Notes
Event cases
User preferences
Properties
Multiple Point Update Wizard
Refer to Multiple Point Update Wizard in System Configuration.
Workspace
Workspace interface brings up the workspace manager screen. A workspace is a specific
part of the hierarchy that should be grouped together. For example, a workspace can be
grouped by a user’s responsibility. The workspace manager keeps track of all the workspaces in a database and enables you to create new workspaces or edit already
existing ones. For portable data collectors, a workspace can be used as a way to define
certain machines of which the user needs to keep track.
Figure 6 - 5.
Example of Workspace Manager.
Database is where the workspace you would be working with resides.
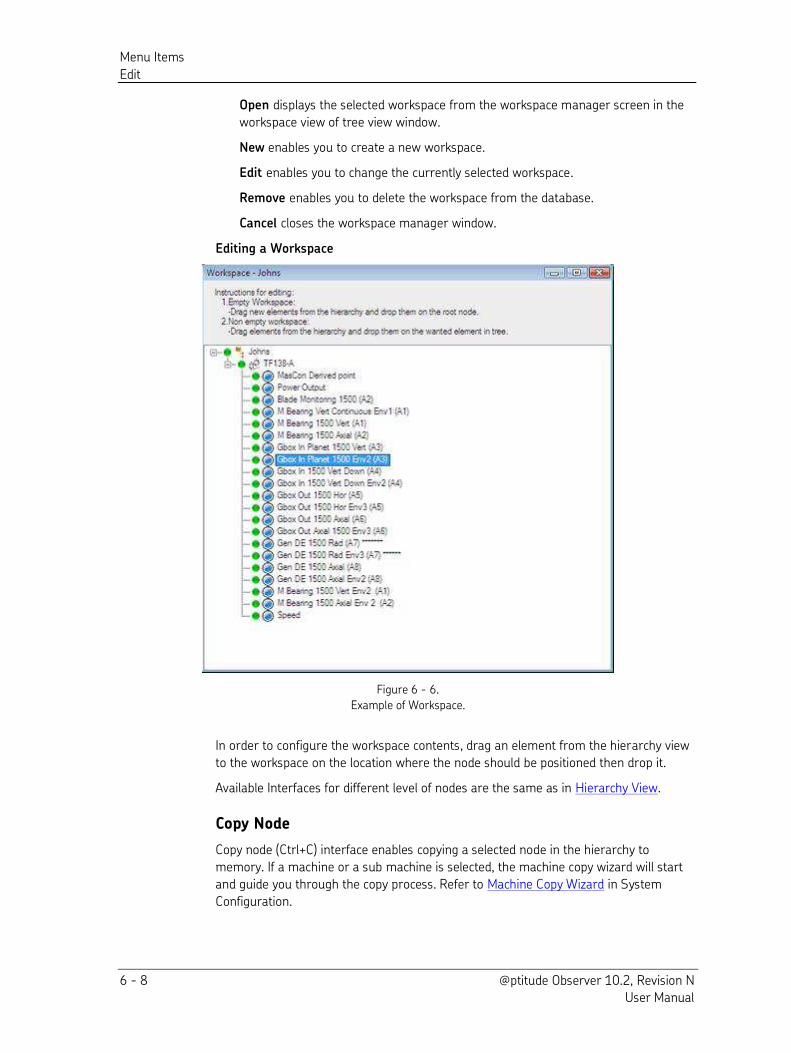
Menu Items
Edit
6 - 8 @ptitude Observer 10.2, Revision N User Manual
Open displays the selected workspace from the workspace manager screen in the
workspace view of tree view window.
New enables you to create a new workspace.
Edit enables you to change the currently selected workspace.
Remove enables you to delete the workspace from the database.
Cancel closes the workspace manager window.
Editing a Workspace
Figure 6 - 6.
Example of Workspace.
In order to configure the workspace contents, drag an element from the hierarchy view
to the workspace on the location where the node should be positioned then drop it.
Available Interfaces for different level of nodes are the same as in Hierarchy View.
Copy Node
Copy node (Ctrl+C) interface enables copying a selected node in the hierarchy to
memory. If a machine or a sub machine is selected, the machine copy wizard will start
and guide you through the copy process. Refer to Machine Copy Wizard in System
Configuration.
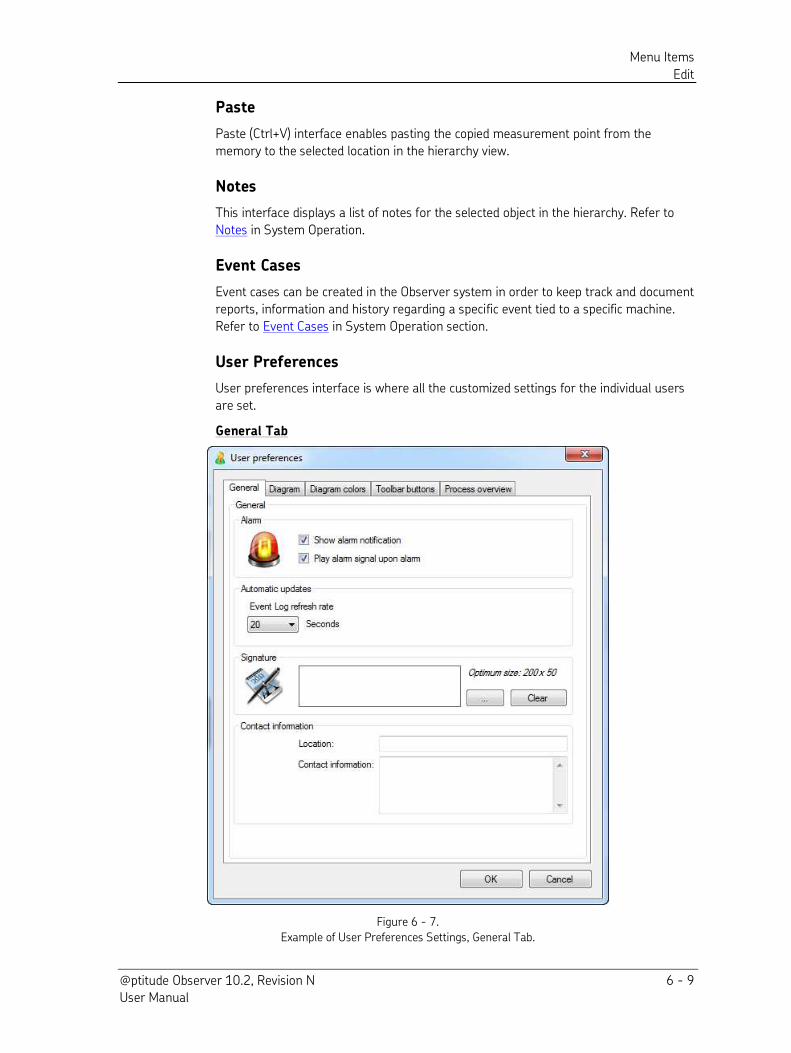
Menu Items
Edit
@ptitude Observer 10.2, Revision N 6 - 9 User Manual
Paste
Paste (Ctrl+V) interface enables pasting the copied measurement point from the
memory to the selected location in the hierarchy view.
Notes
This interface displays a list of notes for the selected object in the hierarchy. Refer to
Notes in System Operation.
Event Cases
Event cases can be created in the Observer system in order to keep track and document
reports, information and history regarding a specific event tied to a specific machine.
Refer to Event Cases in System Operation section.
User Preferences
User preferences interface is where all the customized settings for the individual users
are set.
General Tab
Figure 6 - 7.
Example of User Preferences Settings, General Tab.
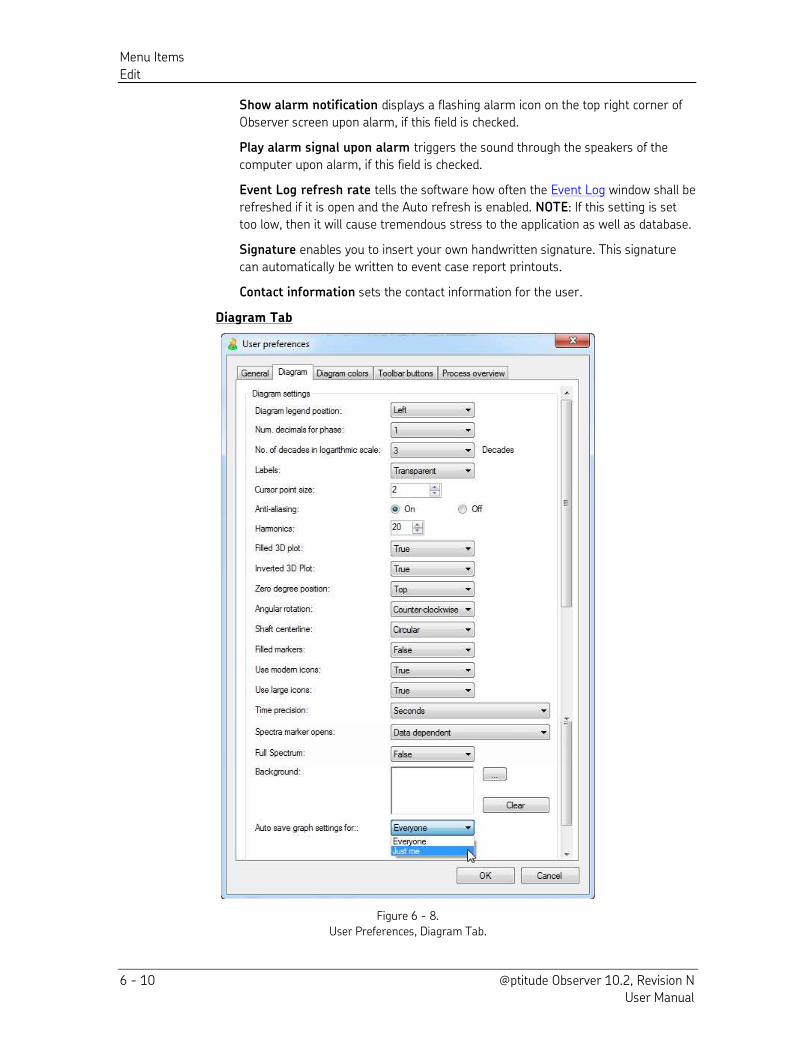
Menu Items
Edit
6 - 10 @ptitude Observer 10.2, Revision N User Manual
Show alarm notification displays a flashing alarm icon on the top right corner of
Observer screen upon alarm, if this field is checked.
Play alarm signal upon alarm triggers the sound through the speakers of the
computer upon alarm, if this field is checked.
Event Log refresh rate tells the software how often the Event Log window shall be
refreshed if it is open and the Auto refresh is enabled. NOTE: If this setting is set
too low, then it will cause tremendous stress to the application as well as database.
Signature enables you to insert your own handwritten signature. This signature
can automatically be written to event case report printouts.
Contact information sets the contact information for the user.
Diagram Tab
Figure 6 - 8.
User Preferences, Diagram Tab.
Menu Items
Edit
@ptitude Observer 10.2, Revision N 6 - 11 User Manual
Diagram legend position sets the preferred position of the legend available in
most graphs. Note that different legend positions are available for different types of
graphs. If the specified position is not available for a specific graph, then the
software will choose and appropriate position for you automatically.
Num. decimals for phase sets the number of decimals to display for phase in the
Trend, Polar and Trend List graphic displays.
No. of decades in logarithmic scale changes the way the logarithmic scale works
for graphs. It can be between 2 and 5 decades.
Labels determines how to display labels in graphs. Labels can be set to be
displayed as transparent as well.
Cursor point size sets the size of the cursor points for single cursors and other
tools mostly for the phase spectrum and time waveform graphs.
Anti-aliasing determines if graphs should be displayed with smoothing (anti-aliasing) On or Off. Some users prefer to display graphics in any application as
anti-aliased. However, in order to analyze data sometimes it is easier to detect a
problem with anti-aliasing off.
Harmonics sets the number of harmonics for the harmonic cursor. It can be
between 10 and 200.
Filled 3D plot
True fills the spectrum area as shown in the 3D plot graph display.
False makes the areas transparent.
Inverted 3D Plot inverts the depth scale of the 3D plot.
Zero degree position is the position of 0° in Polar type plots.
Angular rotation determines which direction of the angle increase in Polar type
plots.
Shaft centerline determines if the shaft centerline plot should be visualized in
circular or square format.
Filled markers shows the point markers as filled or transparent in some diagrams
True shows the point markers as filled in some graphic displays.
False shows the point markers transparent in some graphic displays.
Use modern icons shows modern icons if checked True. Otherwise older versions
of icons are displayed.
True displays modern icons.
False displays older version of icons.
Use large icons shows bigger icons if checked True. Otherwise, the system displays
small icons.
Time precision sets the detailed level of the second fraction of the time in the plots.
Spectra marker opens sets which the preferred plot type to open when the user
clicks the left mouse button a ‘diamond’ marker in the trend plot. If the specific
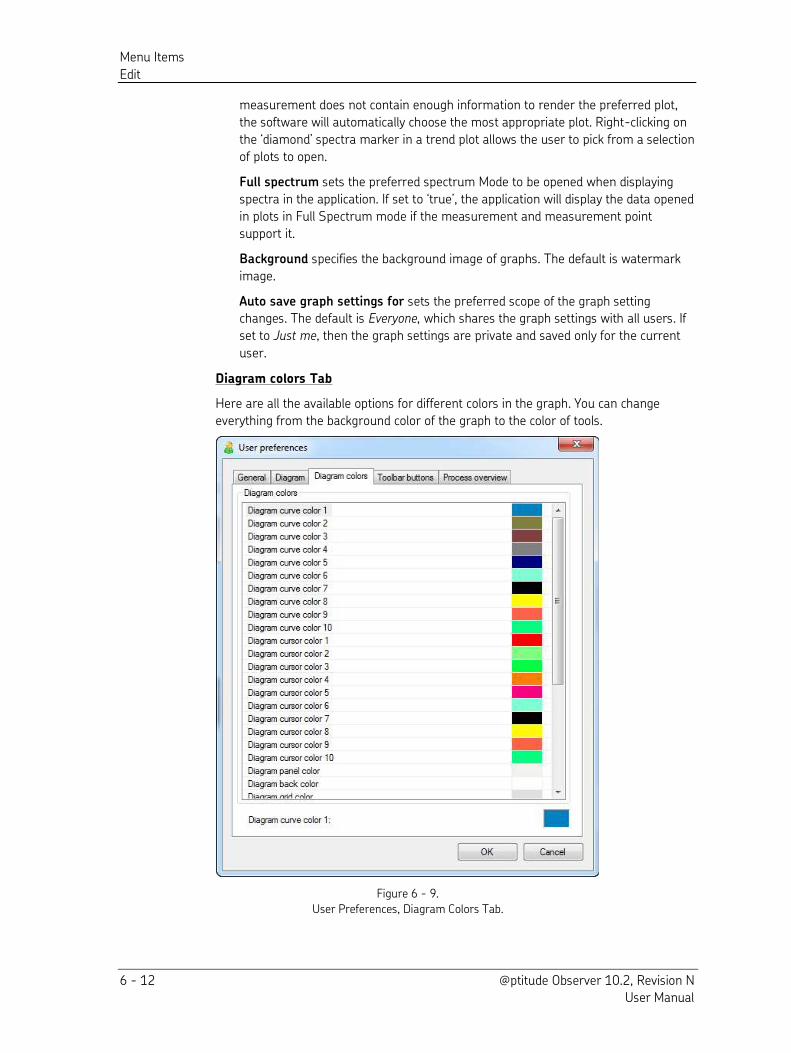
Menu Items
Edit
6 - 12 @ptitude Observer 10.2, Revision N User Manual
measurement does not contain enough information to render the preferred plot,
the software will automatically choose the most appropriate plot. Right-clicking on
the ‘diamond’ spectra marker in a trend plot allows the user to pick from a selection of plots to open.
Full spectrum sets the preferred spectrum Mode to be opened when displaying
spectra in the application. If set to ‘true’, the application will display the data opened in plots in Full Spectrum mode if the measurement and measurement point
support it.
Background specifies the background image of graphs. The default is watermark
image.
Auto save graph settings for sets the preferred scope of the graph setting changes. The default is Everyone, which shares the graph settings with all users. If
set to Just me, then the graph settings are private and saved only for the current
user.
Diagram colors Tab
Here are all the available options for different colors in the graph. You can change
everything from the background color of the graph to the color of tools.
Figure 6 - 9.
User Preferences, Diagram Colors Tab.
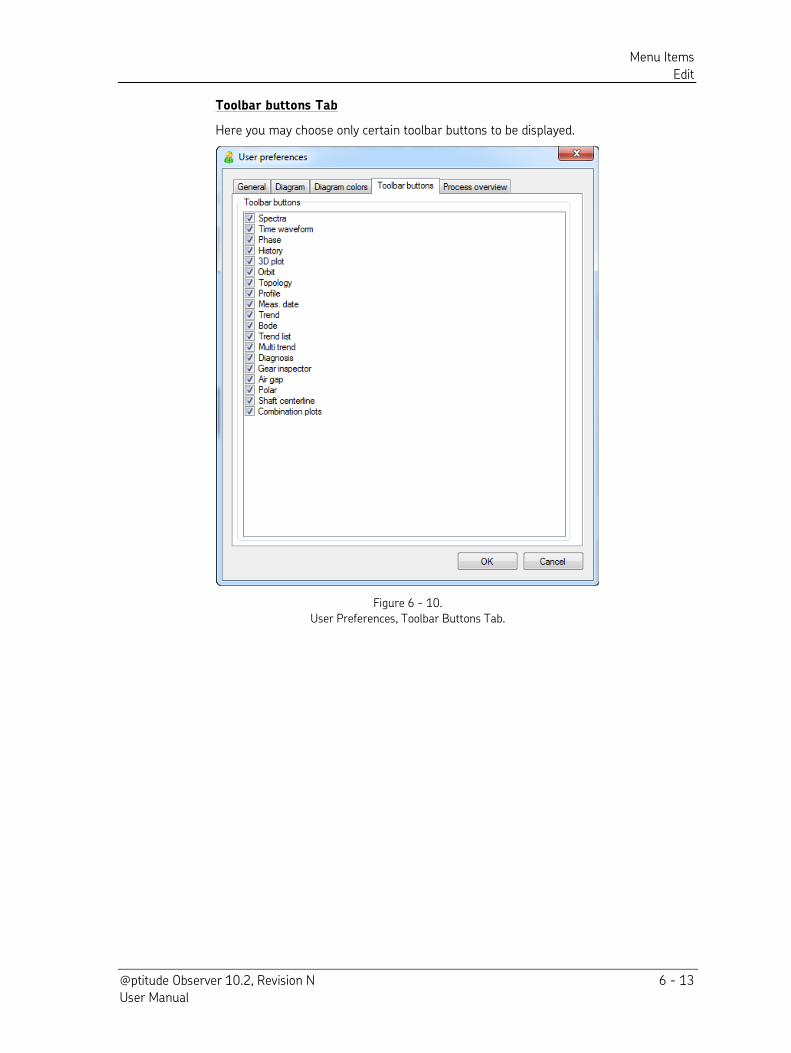
Menu Items
Edit
@ptitude Observer 10.2, Revision N 6 - 13 User Manual
Toolbar buttons Tab
Here you may choose only certain toolbar buttons to be displayed.
Figure 6 - 10.
User Preferences, Toolbar Buttons Tab.
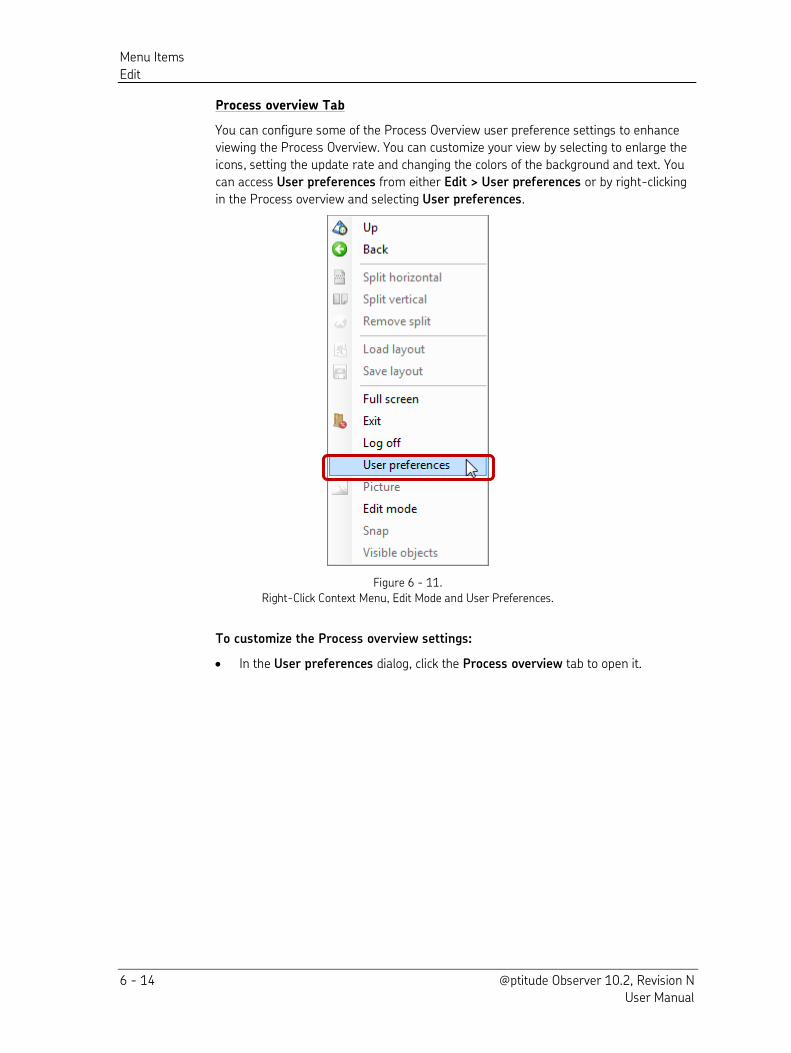
Menu Items
Edit
6 - 14 @ptitude Observer 10.2, Revision N User Manual
Process overview Tab
You can configure some of the Process Overview user preference settings to enhance
viewing the Process Overview. You can customize your view by selecting to enlarge the
icons, setting the update rate and changing the colors of the background and text. You
can access User preferences from either Edit > User preferences or by right-clicking
in the Process overview and selecting User preferences.
Figure 6 - 11.
Right-Click Context Menu, Edit Mode and User Preferences.
To customize the Process overview settings:
In the User preferences dialog, click the Process overview tab to open it.
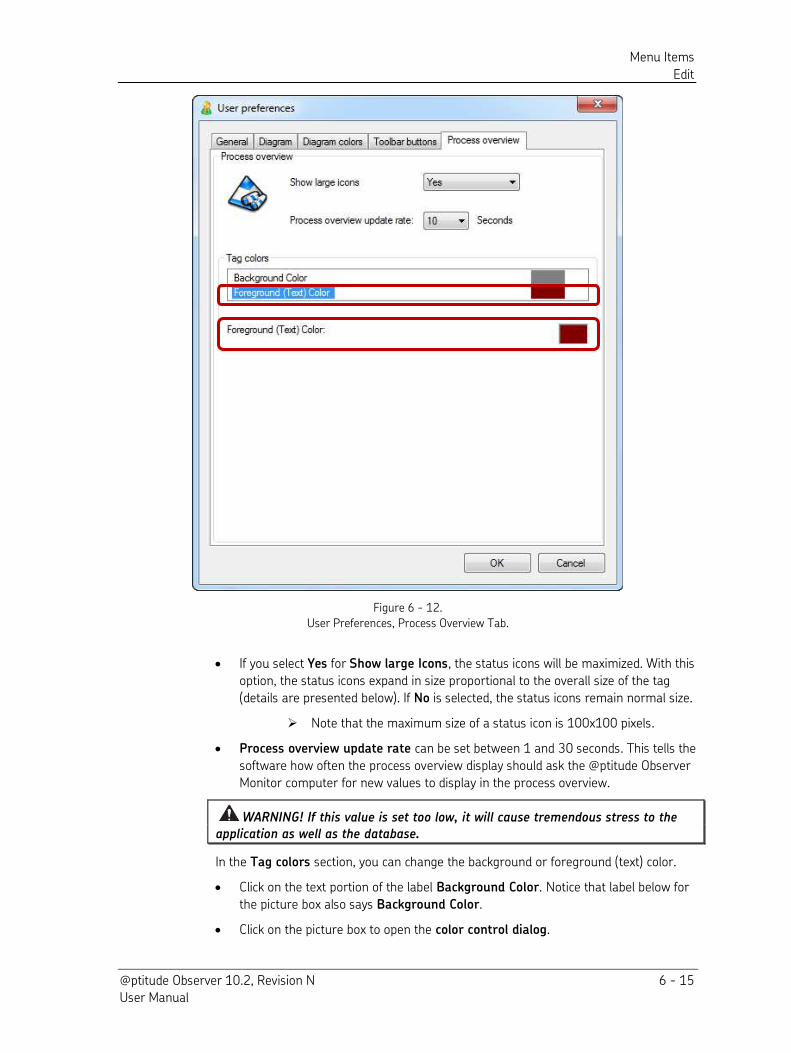
Menu Items
Edit
@ptitude Observer 10.2, Revision N 6 - 15 User Manual
Figure 6 - 12.
User Preferences, Process Overview Tab.
If you select Yes for Show large Icons, the status icons will be maximized. With this
option, the status icons expand in size proportional to the overall size of the tag
(details are presented below). If No is selected, the status icons remain normal size.
Note that the maximum size of a status icon is 100x100 pixels.
Process overview update rate can be set between 1 and 30 seconds. This tells the
software how often the process overview display should ask the @ptitude Observer
Monitor computer for new values to display in the process overview.
WARNING! If this value is set too low, it will cause tremendous stress to the application as well as the database.
In the Tag colors section, you can change the background or foreground (text) color.
Click on the text portion of the label Background Color. Notice that label below for
the picture box also says Background Color.
Click on the picture box to open the color control dialog.
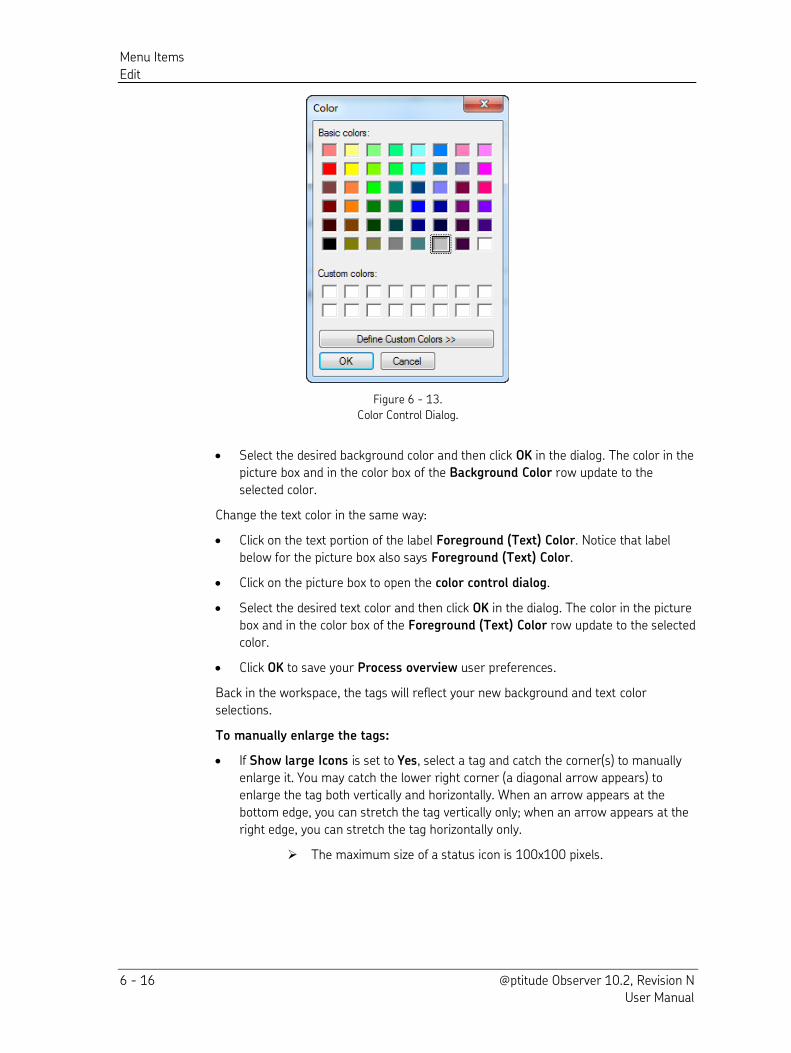
Menu Items
Edit
6 - 16 @ptitude Observer 10.2, Revision N User Manual
Figure 6 - 13.
Color Control Dialog.
Select the desired background color and then click OK in the dialog. The color in the
picture box and in the color box of the Background Color row update to the
selected color.
Change the text color in the same way:
Click on the text portion of the label Foreground (Text) Color. Notice that label
below for the picture box also says Foreground (Text) Color.
Click on the picture box to open the color control dialog.
Select the desired text color and then click OK in the dialog. The color in the picture
box and in the color box of the Foreground (Text) Color row update to the selected
color.
Click OK to save your Process overview user preferences.
Back in the workspace, the tags will reflect your new background and text color
selections.
To manually enlarge the tags:
If Show large Icons is set to Yes, select a tag and catch the corner(s) to manually
enlarge it. You may catch the lower right corner (a diagonal arrow appears) to
enlarge the tag both vertically and horizontally. When an arrow appears at the
bottom edge, you can stretch the tag vertically only; when an arrow appears at the
right edge, you can stretch the tag horizontally only.
The maximum size of a status icon is 100x100 pixels.
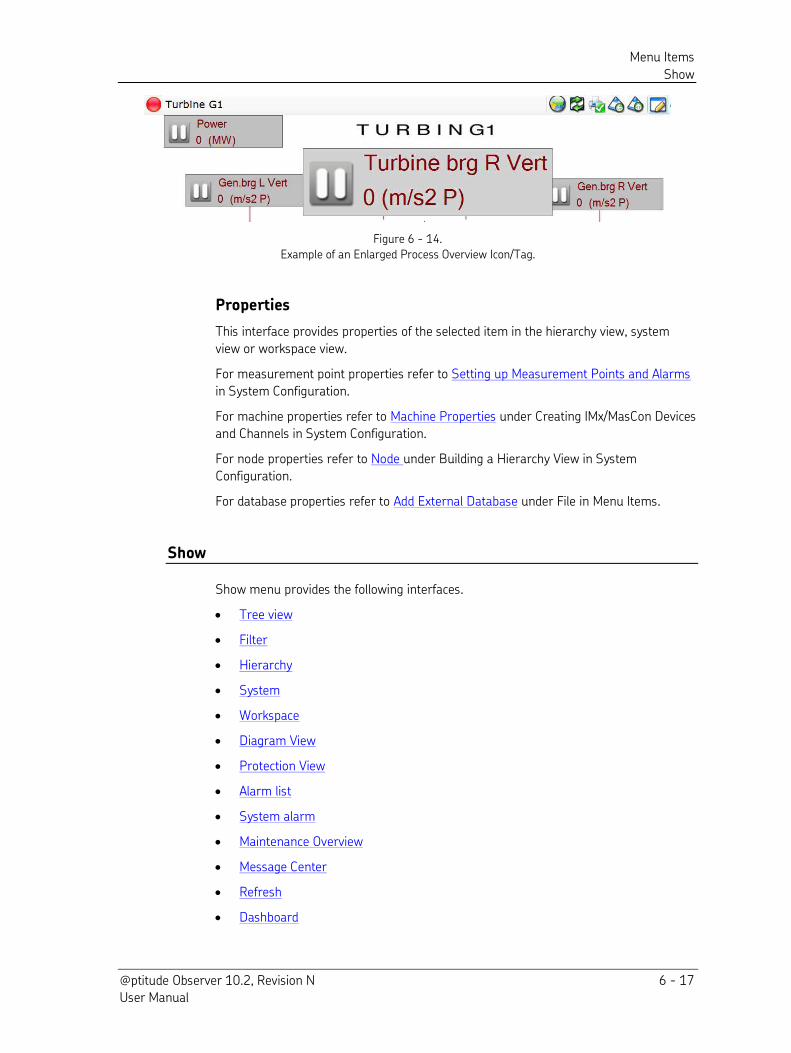
Menu Items
Show
@ptitude Observer 10.2, Revision N 6 - 17 User Manual
Figure 6 - 14.
Example of an Enlarged Process Overview Icon/Tag.
Properties
This interface provides properties of the selected item in the hierarchy view, system
view or workspace view.
For measurement point properties refer to Setting up Measurement Points and Alarms
in System Configuration.
For machine properties refer to Machine Properties under Creating IMx/MasCon Devices
and Channels in System Configuration.
For node properties refer to Node under Building a Hierarchy View in System
Configuration.
For database properties refer to Add External Database under File in Menu Items.
Show
Show menu provides the following interfaces.
Tree view
Filter
Hierarchy
System
Workspace
Diagram View
Protection View
Alarm list
System alarm
Maintenance Overview
Message Center
Refresh
Dashboard
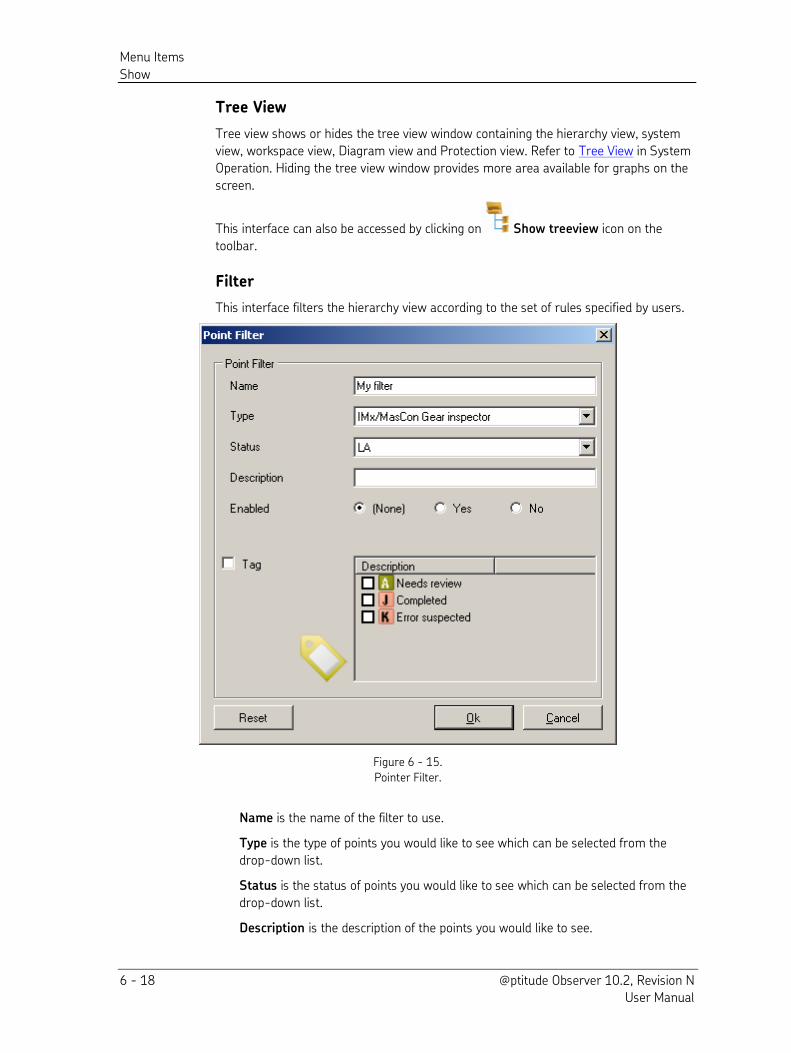
Menu Items
Show
6 - 18 @ptitude Observer 10.2, Revision N User Manual
Tree View
Tree view shows or hides the tree view window containing the hierarchy view, system
view, workspace view, Diagram view and Protection view. Refer to Tree View in System
Operation. Hiding the tree view window provides more area available for graphs on the
screen.
This interface can also be accessed by clicking on Show treeview icon on the
toolbar.
Filter
This interface filters the hierarchy view according to the set of rules specified by users.
Figure 6 - 15.
Pointer Filter.
Name is the name of the filter to use.
Type is the type of points you would like to see which can be selected from the
drop-down list.
Status is the status of points you would like to see which can be selected from the
drop-down list.
Description is the description of the points you would like to see.
Menu Items
Show
@ptitude Observer 10.2, Revision N 6 - 19 User Manual
Enabled displays points according to the value you decided.
None displays all the points regardless of whether they are enabled or disabled.
Yes displays only the points which are enabled.
No displays only the points which are disabled.
Tag is used to filter by the selected tag(s). Reset sets filter settings back to the system generated settings.
Hierarchy
Hierarchy view brings up the hierarchy view in the tree view window. Refer to Hierarchy
View under Tree View in System Operation.
System
System brings up the system view in the tree view window. Refer to System View under
Tree View in System Operation.
Workspace
Workspace brings up the workspace in the tree view window. Refer to Workspace under
Tree View in System Operation.
Diagram View
Diagram View brings up the hierarchical view of saved diagram boxes in the tree view
window. Refer to Diagram View under Tree View in System Operation.
Protection View
Protection View brings up the IMx-M Protection configuration hierarchy view in the tree
view window. Refer to Protection View under Tree View in System Operation.
Alarm List
Alarm list interface brings up the alarm list for the selected item in the hierarchy view
and displays all the alarms under this item and sub-items in the alarm list. The alarm
list can also be opened by clicking on Alarm list icon on the toolbar.
By default the alarm list is linked to the hierarchy view. Therefore, the alarm list gets
refreshed every time a new node is selected in the hierarchy view. The link status is indicated by [Alarm list(Linked)] keyword on the top of the screen. The link can be
turned off by clicking on link to hierarchy icon on the toolbar.
Menu Items
Show
6 - 20 @ptitude Observer 10.2, Revision N User Manual
Filter
Not acknowledged: the alarms that have not been recognized and not analyzed
by any user yet.
Acknowledged: the alarms that have been acknowledged by any user.
None: all alarms regardless of the acknowledgement status.
Acknowledge all acknowledges all the alarms.
Acknowledge acknowledges only the selected alarm(s).
Refresh reloads the alarm list.
Print prints the alarm list.
Alarm list can be sorted by any column.
System Alarm
The System alarm interface shows measurements out of range and system related
alarms such as defective sensors, cables, etc. In addition, the @ptitude Observer
Monitor startups and a loss of contact between MasCon device and the @ptitude
Observer Monitor are registered as well. This is a good place to start for troubleshooting
a hardware error.
System alarms are categorized into ‘Normal’ system alarms and ‘critical’ system alarms.
The critical system alarms are more severe and require more attention from the user
than normal system alarms. If a critical system alarm is registered in the system, the
system alarm icon in the toolbar will start blinking drawing the user’s attention. Upon
opening the system alarm list, and additional list will be displayed in the top listing the
critical system alarm.
System alarm list can be sorted by any column. The attributes of the system alarm
settings are the same as in Alarm List, above.
Maintenance Overview
Maintenance overview interface enables review of the maintenance tasks
scheduled in the future. You can review the maintenance tasks whether they have been
notified but not yet executed, or they are overdue. The description on how to set
maintenance tasks is found in Maintenance Planner under System Operation section.
Message Center
Message Center interface enables the user to send/receive messages to/from other
users within Observer. This can be a helpful tool for those who work in the same
database to notify and communicate with each other.
Refresh
This interface forces to refresh the hierarchy view, system view or workspace view.
Refresh can also be accessed by clicking on Refresh icon on the toolbar.
Menu Items
Database
@ptitude Observer 10.2, Revision N 6 - 21 User Manual
DASHBOARD
"DASHBOARD" screen provides Notifications, News Feed and Message Center interfaces
which can be navigated by clicking on icons on the upper right-hand corner of the
dashboard screen.
Notifications displays if there are any notifications of which the user should be
aware.
News Feed informs users of new features in the currently released version. It is
also accessible via News in Observer under Help menu tab.
Message Center enables the user to send/receive messages to/from other users
within Observer. It is also accessible via Message Center under Show menu tab.
First time access to Dashboard displays Notifications.
The subsequent access to Dashboard displays one of three above interfaces that has
been accessed most recently.
Database
Database menu provides the following interfaces.
Security Roles
Users
Database information
System log
IMx-M sync history
Pictures
Diagnoses
Libraries
Export
Import
Alarm group
Measurement groups
Options
Delete data
Data miner
Security Roles
Security roles are pre-configured groupings of user rights. User rights are privileges of
the user. Privileges are assigned by the system according to the role.
In the Security roles dialog, select a Security Role Name from the list of standard roles.
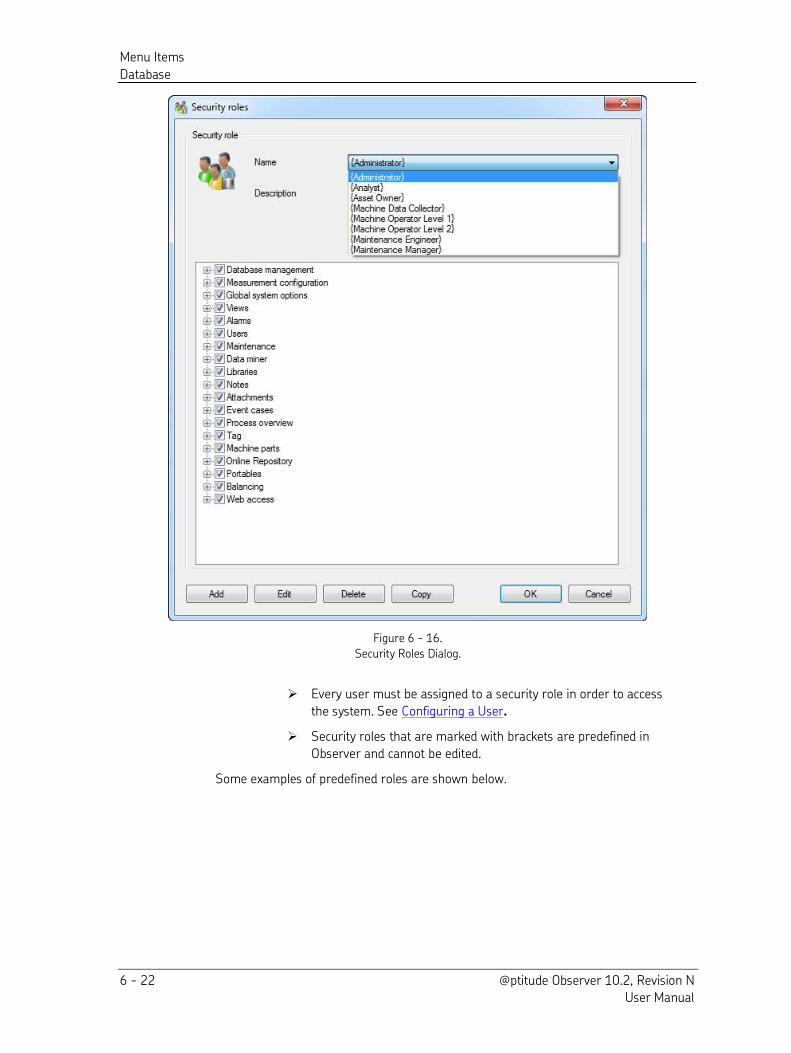
Menu Items
Database
6 - 22 @ptitude Observer 10.2, Revision N User Manual
Figure 6 - 16.
Security Roles Dialog.
Every user must be assigned to a security role in order to access
the system. See Configuring a User.
Security roles that are marked with brackets are predefined in
Observer and cannot be edited.
Some examples of predefined roles are shown below.
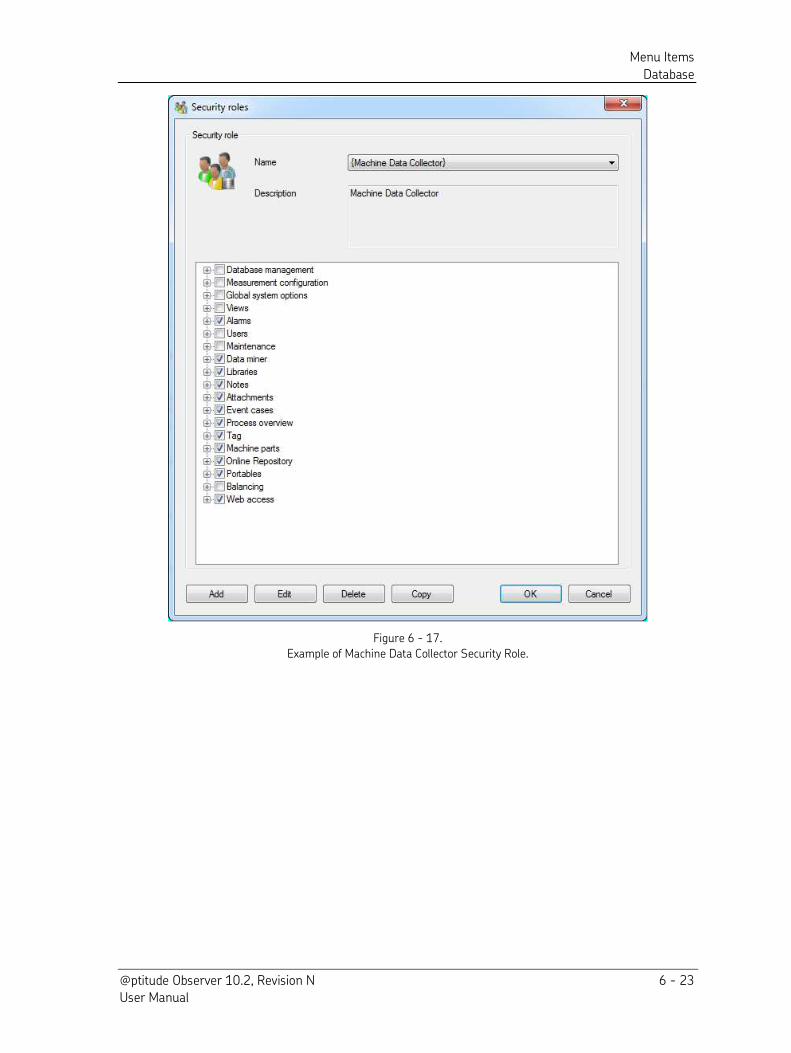
Menu Items
Database
@ptitude Observer 10.2, Revision N 6 - 23 User Manual
Figure 6 - 17.
Example of Machine Data Collector Security Role.
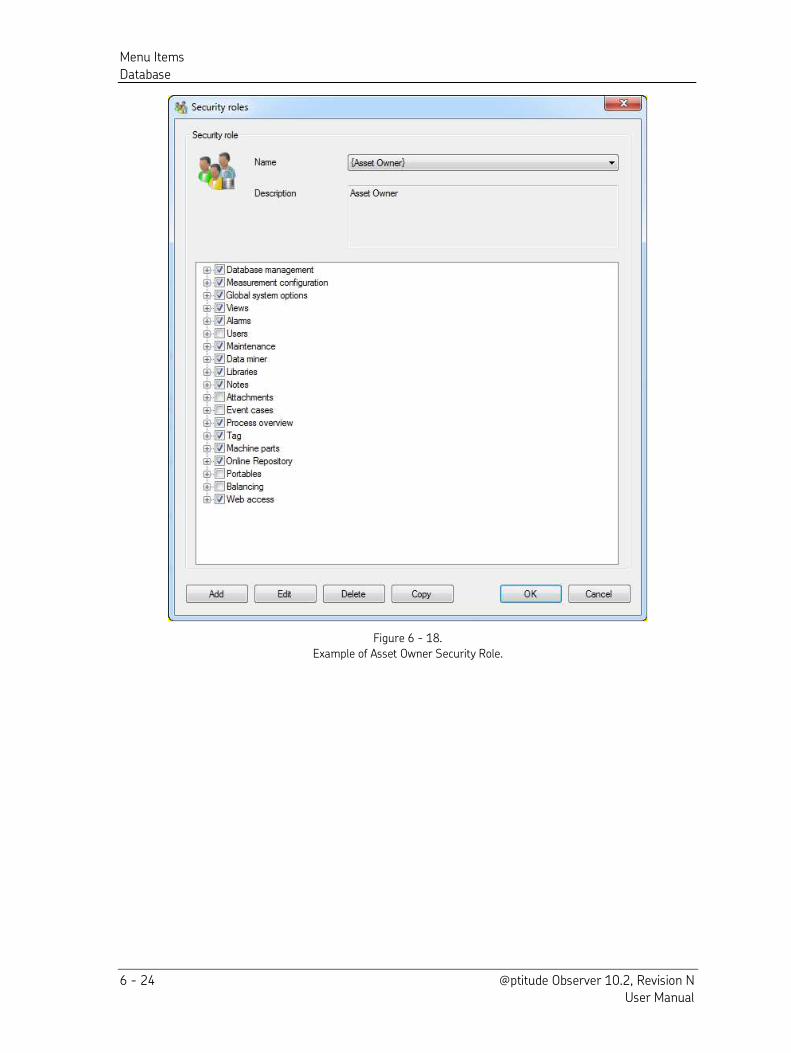
Menu Items
Database
6 - 24 @ptitude Observer 10.2, Revision N User Manual
Figure 6 - 18.
Example of Asset Owner Security Role.
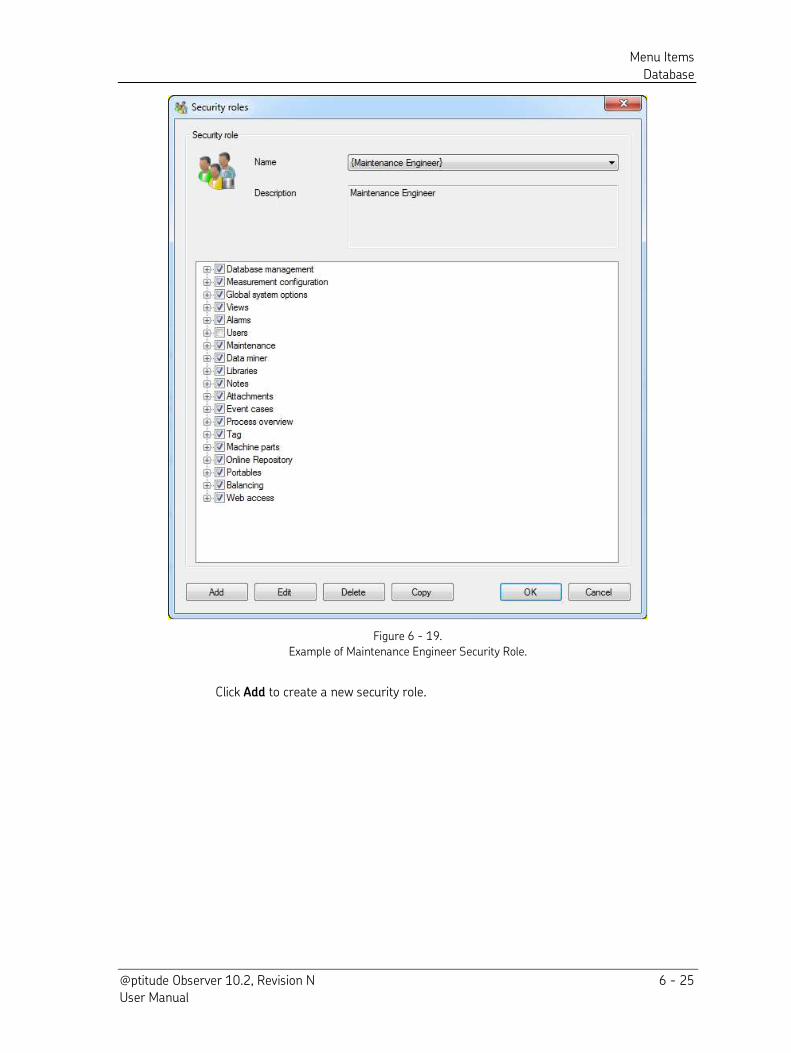
Menu Items
Database
@ptitude Observer 10.2, Revision N 6 - 25 User Manual
Figure 6 - 19.
Example of Maintenance Engineer Security Role.
Click Add to create a new security role.
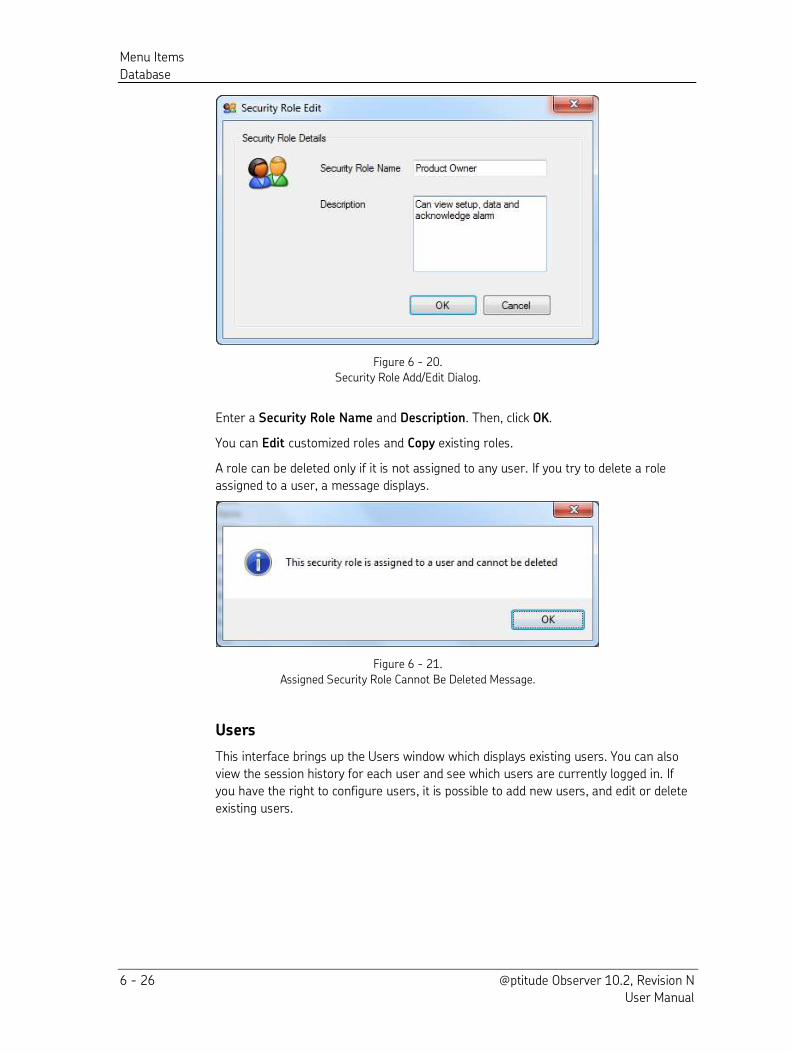
Menu Items
Database
6 - 26 @ptitude Observer 10.2, Revision N User Manual
Figure 6 - 20.
Security Role Add/Edit Dialog.
Enter a Security Role Name and Description. Then, click OK.
You can Edit customized roles and Copy existing roles.
A role can be deleted only if it is not assigned to any user. If you try to delete a role
assigned to a user, a message displays.
Figure 6 - 21.
Assigned Security Role Cannot Be Deleted Message.
Users
This interface brings up the Users window which displays existing users. You can also
view the session history for each user and see which users are currently logged in. If
you have the right to configure users, it is possible to add new users, and edit or delete
existing users.
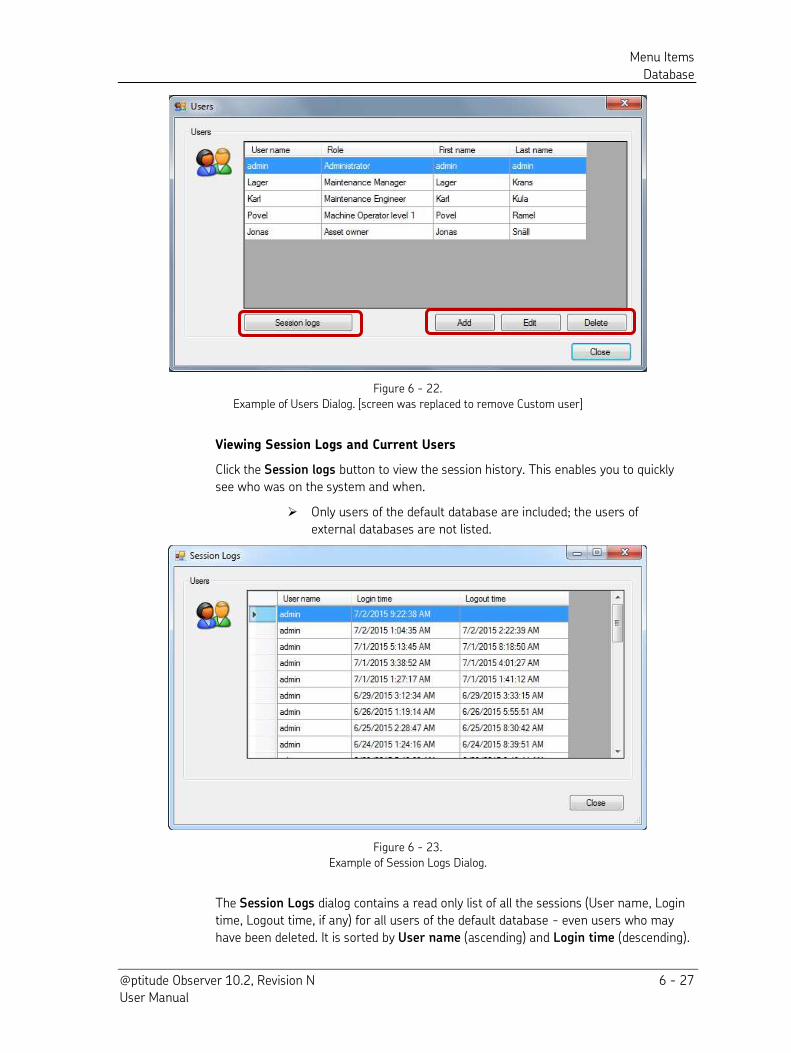
Menu Items
Database
@ptitude Observer 10.2, Revision N 6 - 27 User Manual
Figure 6 - 22.
Example of Users Dialog. [screen was replaced to remove Custom user]
Viewing Session Logs and Current Users
Click the Session logs button to view the session history. This enables you to quickly
see who was on the system and when.
Only users of the default database are included; the users of
external databases are not listed.
Figure 6 - 23.
Example of Session Logs Dialog.
The Session Logs dialog contains a read only list of all the sessions (User name, Login
time, Logout time, if any) for all users of the default database - even users who may
have been deleted. It is sorted by User name (ascending) and Login time (descending).
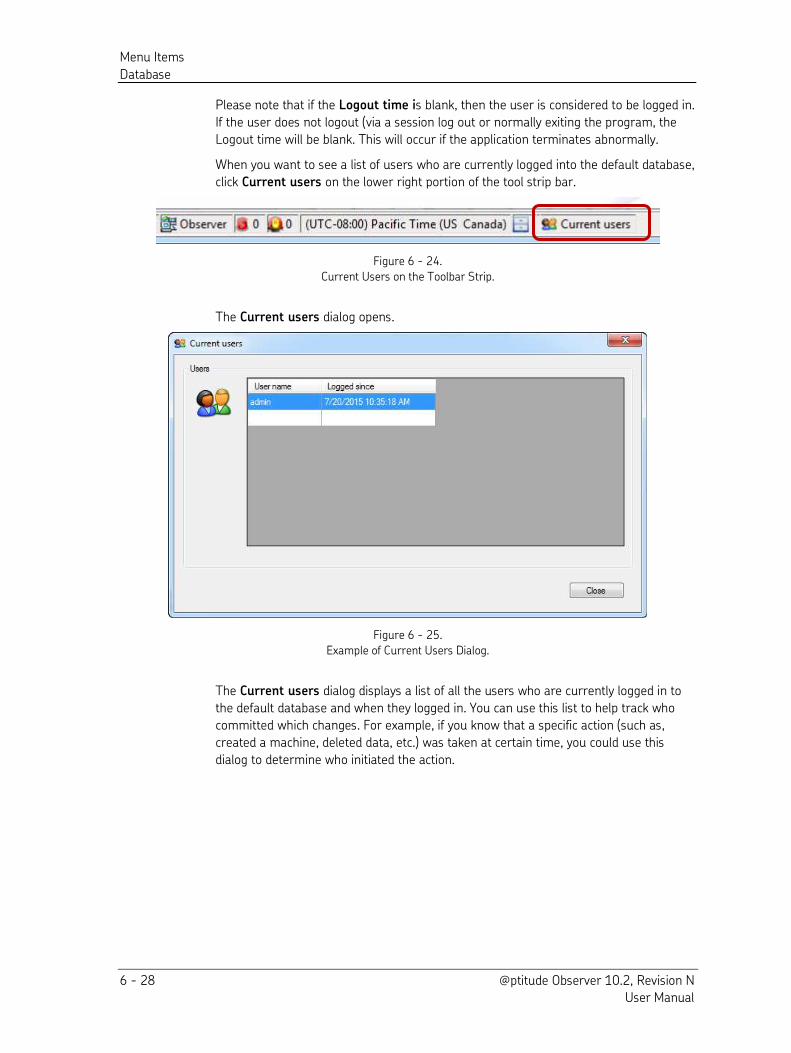
Menu Items
Database
6 - 28 @ptitude Observer 10.2, Revision N User Manual
Please note that if the Logout time is blank, then the user is considered to be logged in.
If the user does not logout (via a session log out or normally exiting the program, the
Logout time will be blank. This will occur if the application terminates abnormally.
When you want to see a list of users who are currently logged into the default database,
click Current users on the lower right portion of the tool strip bar.
Figure 6 - 24.
Current Users on the Toolbar Strip.
The Current users dialog opens.
Figure 6 - 25.
Example of Current Users Dialog.
The Current users dialog displays a list of all the users who are currently logged in to
the default database and when they logged in. You can use this list to help track who
committed which changes. For example, if you know that a specific action (such as,
created a machine, deleted data, etc.) was taken at certain time, you could use this
dialog to determine who initiated the action.
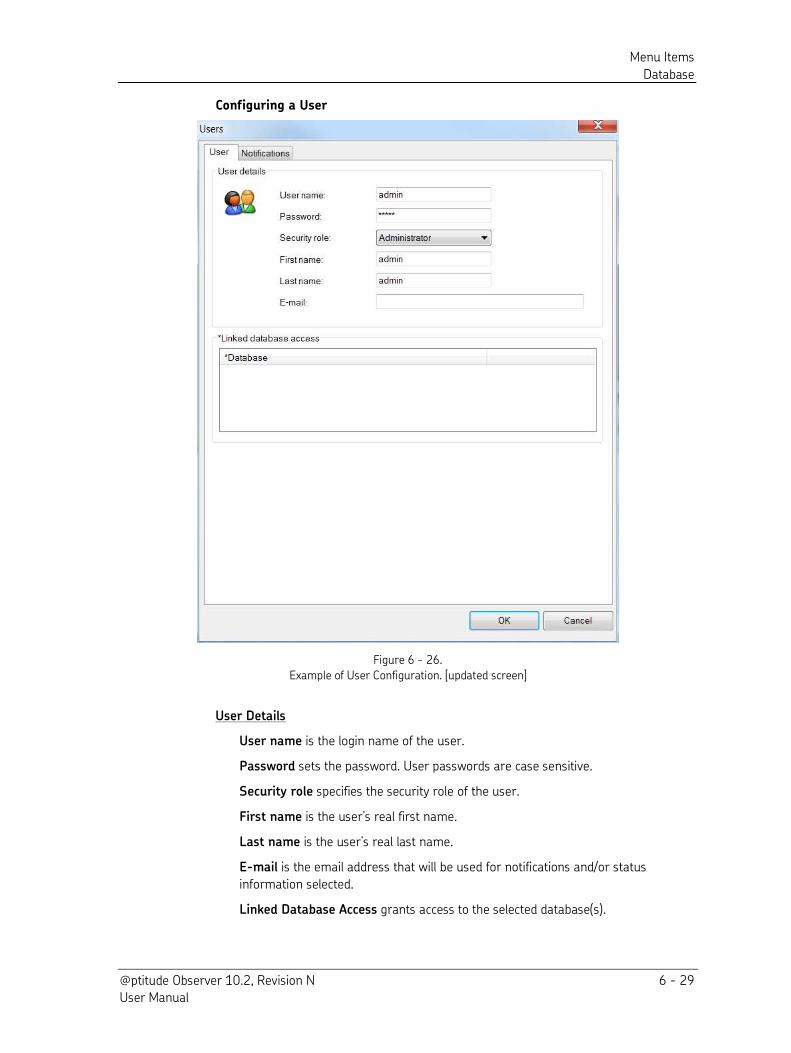
Menu Items
Database
@ptitude Observer 10.2, Revision N 6 - 29 User Manual
Configuring a User
Figure 6 - 26.
Example of User Configuration. [updated screen]
User Details
User name is the login name of the user.
Password sets the password. User passwords are case sensitive.
Security role specifies the security role of the user.
First name is the user’s real first name.
Last name is the user’s real last name.
E-mail is the email address that will be used for notifications and/or status
information selected.
Linked Database Access grants access to the selected database(s).
Menu Items
Database
6 - 30 @ptitude Observer 10.2, Revision N User Manual
Notifications Tab
Send Alarm notifications lets the user receive periodic emails about alarms
whenever alarms are available at a system configurable interval. The alarm report
interval is set at E-mail settings tab within Options interface under Database.
Send System alarm notifications lets the user receive periodic emails about
system alarms whenever system alarms are available at a system configurable
interval. The alarm report interval is set at E-mail settings tab within Options
interface under Database.
Send Monitor service status information lets the user receive periodic emails
about the condition and status of the monitor service in addition to database
condition. The status report interval is set at E-mail settings tab within Options
interface under Database.
Format offers three different types:
HTML can be used if your email provider supports displaying HTML emails.
Plain sends the email as plain text completely unformatted.
Truncated minimizes the size of the email which in turn contains less details in
the email. This is especially useful if your emails are forwarded to a mobile
phone as SMS.
Use Custom Topic is a specific topic which will be used whenever the system
delivers the selected notification(s) to the user. This is useful when a user has en
email provider who offers a phone number recognition as the topic, for example
"+46 070 XXXX XXXX". In such case, if the use sets the Custom Topic to "+46 070
XXXX XXXX", the email notification(s) will be automatically forwarded to the
specified number as SMS.
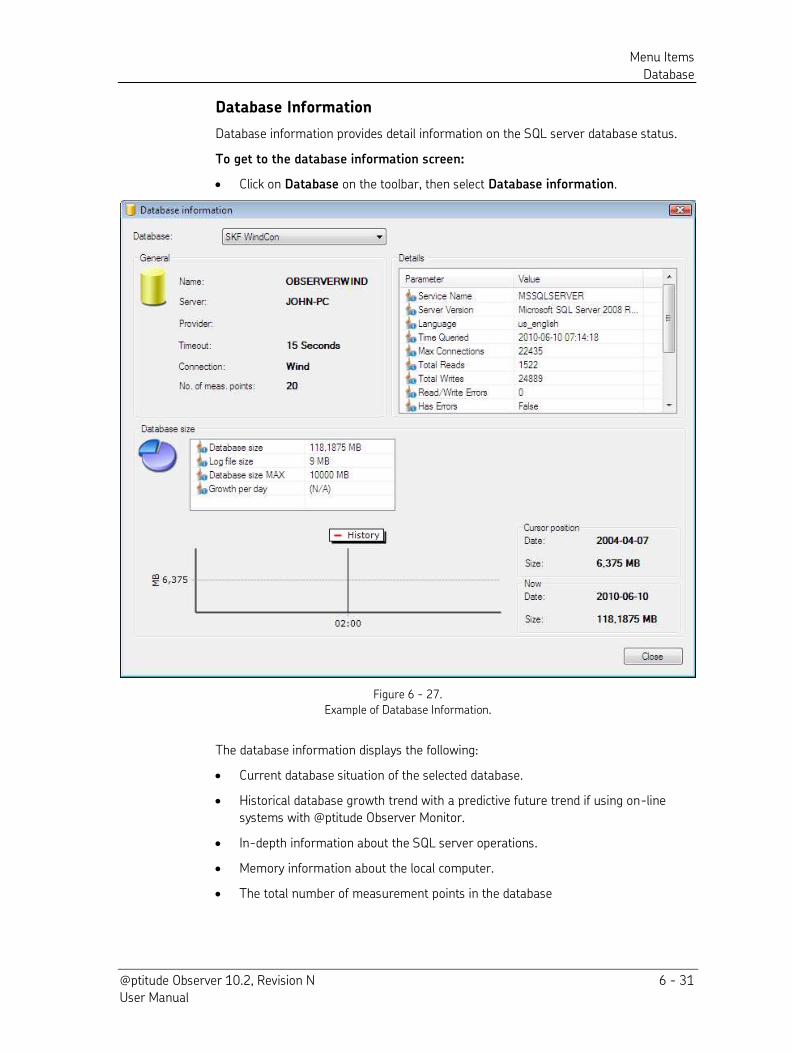
Menu Items
Database
@ptitude Observer 10.2, Revision N 6 - 31 User Manual
Database Information
Database information provides detail information on the SQL server database status.
To get to the database information screen:
Click on Database on the toolbar, then select Database information.
Figure 6 - 27.
Example of Database Information.
The database information displays the following:
Current database situation of the selected database.
Historical database growth trend with a predictive future trend if using on-line
systems with @ptitude Observer Monitor.
In-depth information about the SQL server operations.
Memory information about the local computer.
The total number of measurement points in the database
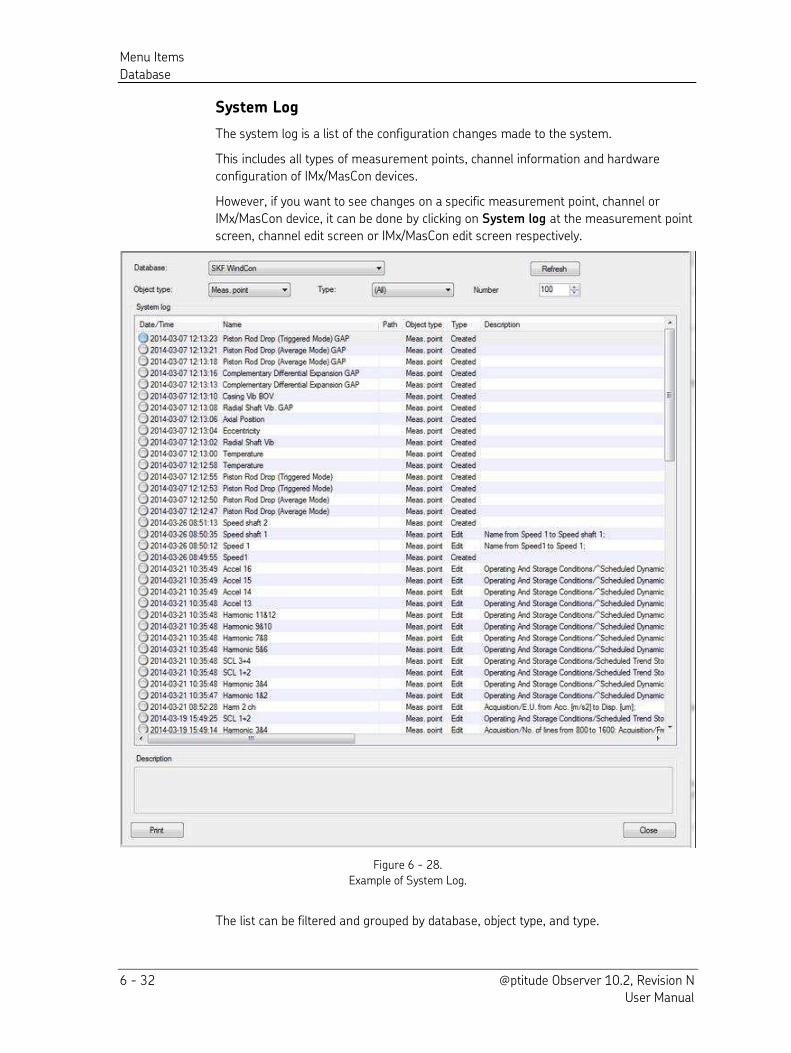
Menu Items
Database
6 - 32 @ptitude Observer 10.2, Revision N User Manual
System Log
The system log is a list of the configuration changes made to the system.
This includes all types of measurement points, channel information and hardware
configuration of IMx/MasCon devices.
However, if you want to see changes on a specific measurement point, channel or
IMx/MasCon device, it can be done by clicking on System log at the measurement point
screen, channel edit screen or IMx/MasCon edit screen respectively.
Figure 6 - 28.
Example of System Log.
The list can be filtered and grouped by database, object type, and type.
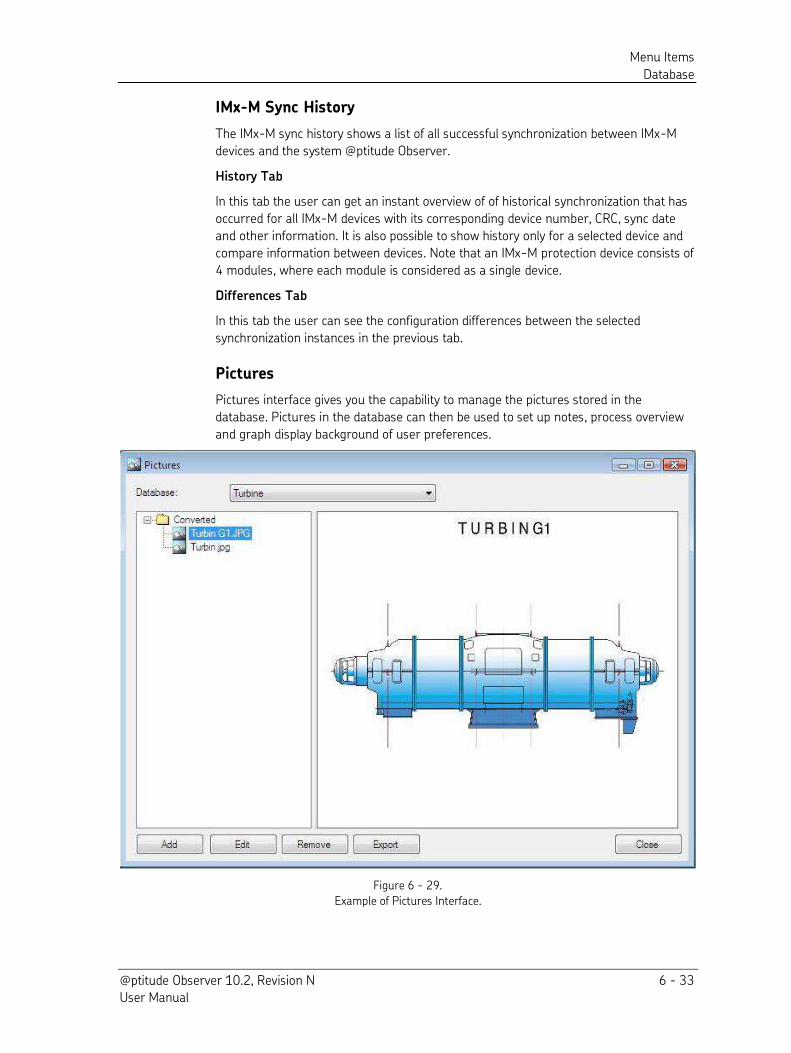
Menu Items
Database
@ptitude Observer 10.2, Revision N 6 - 33 User Manual
IMx-M Sync History
The IMx-M sync history shows a list of all successful synchronization between IMx-M
devices and the system @ptitude Observer.
History Tab
In this tab the user can get an instant overview of of historical synchronization that has
occurred for all IMx-M devices with its corresponding device number, CRC, sync date
and other information. It is also possible to show history only for a selected device and
compare information between devices. Note that an IMx-M protection device consists of
4 modules, where each module is considered as a single device.
Differences Tab
In this tab the user can see the configuration differences between the selected
synchronization instances in the previous tab.
Pictures
Pictures interface gives you the capability to manage the pictures stored in the
database. Pictures in the database can then be used to set up notes, process overview
and graph display background of user preferences.
Figure 6 - 29.
Example of Pictures Interface.
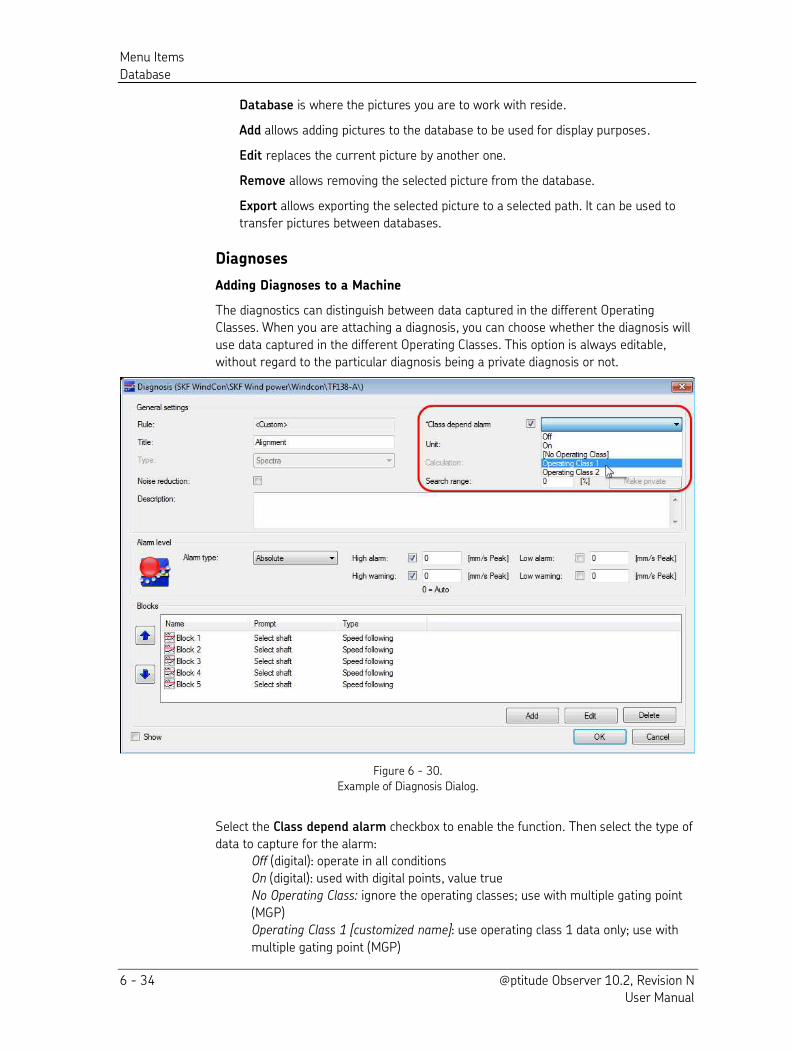
Menu Items
Database
6 - 34 @ptitude Observer 10.2, Revision N User Manual
Database is where the pictures you are to work with reside.
Add allows adding pictures to the database to be used for display purposes.
Edit replaces the current picture by another one.
Remove allows removing the selected picture from the database.
Export allows exporting the selected picture to a selected path. It can be used to
transfer pictures between databases.
Diagnoses
Adding Diagnoses to a Machine
The diagnostics can distinguish between data captured in the different Operating
Classes. When you are attaching a diagnosis, you can choose whether the diagnosis will
use data captured in the different Operating Classes. This option is always editable,
without regard to the particular diagnosis being a private diagnosis or not.
Figure 6 - 30.
Example of Diagnosis Dialog.
Select the Class depend alarm checkbox to enable the function. Then select the type of
data to capture for the alarm: Off (digital): operate in all conditions
On (digital): used with digital points, value true
No Operating Class: ignore the operating classes; use with multiple gating point
(MGP) Operating Class 1 [customized name]: use operating class 1 data only; use with
multiple gating point (MGP)
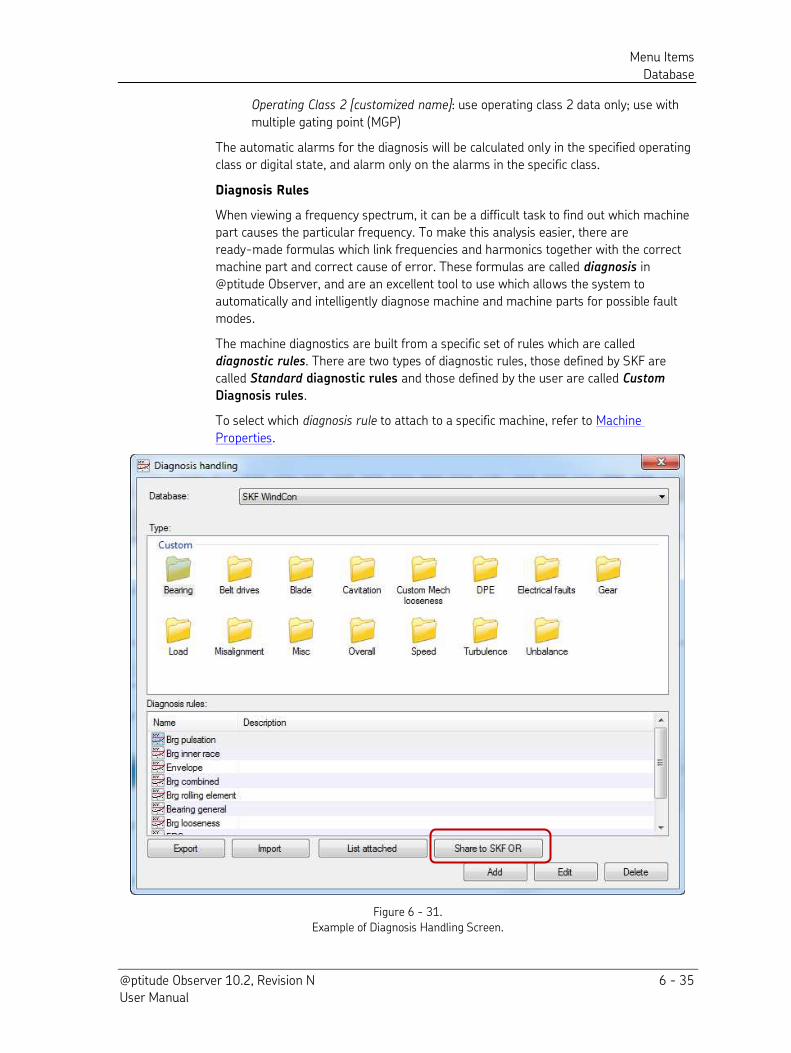
Menu Items
Database
@ptitude Observer 10.2, Revision N 6 - 35 User Manual
Operating Class 2 [customized name]: use operating class 2 data only; use with
multiple gating point (MGP)
The automatic alarms for the diagnosis will be calculated only in the specified operating
class or digital state, and alarm only on the alarms in the specific class.
Diagnosis Rules
When viewing a frequency spectrum, it can be a difficult task to find out which machine
part causes the particular frequency. To make this analysis easier, there are
ready-made formulas which link frequencies and harmonics together with the correct
machine part and correct cause of error. These formulas are called diagnosis in
@ptitude Observer, and are an excellent tool to use which allows the system to
automatically and intelligently diagnose machine and machine parts for possible fault
modes.
The machine diagnostics are built from a specific set of rules which are called
diagnostic rules. There are two types of diagnostic rules, those defined by SKF are
called Standard diagnostic rules and those defined by the user are called Custom
Diagnosis rules.
To select which diagnosis rule to attach to a specific machine, refer to Machine
Properties.
Figure 6 - 31.
Example of Diagnosis Handling Screen.
Menu Items
Database
6 - 36 @ptitude Observer 10.2, Revision N User Manual
Export enables you to save the selected diagnosis to a local file.
Import allows import of a previously exported diagnostic rule.
List attached displays a list of any attached diagnosis in the system built from the
selected diagnostic rule.
Share to SKF OR allows you to share the selected diagnosis rule to SKF Online
Repository Users. Only custom diagnosis rules can be shared.
Add / Edit / Delete enables you to create/ change configuration / delete a diagnosis
with user defined rules.
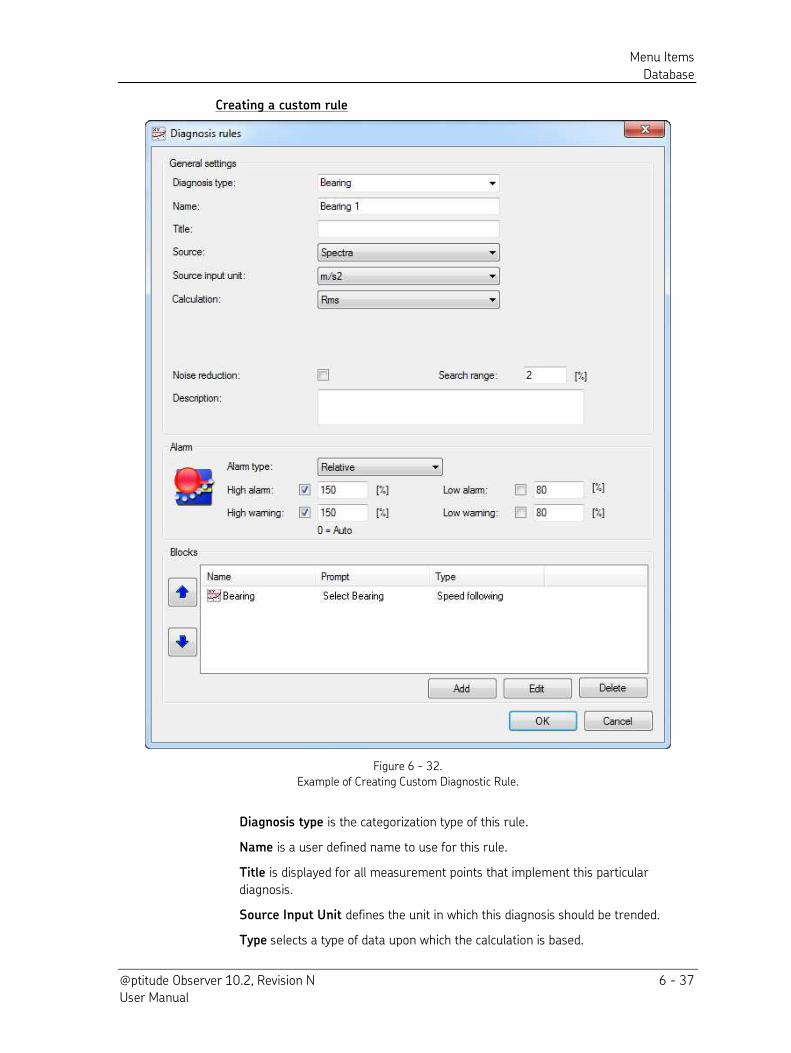
Menu Items
Database
@ptitude Observer 10.2, Revision N 6 - 37 User Manual
Creating a custom rule
Figure 6 - 32.
Example of Creating Custom Diagnostic Rule.
Diagnosis type is the categorization type of this rule.
Name is a user defined name to use for this rule.
Title is displayed for all measurement points that implement this particular
diagnosis.
Source Input Unit defines the unit in which this diagnosis should be trended.
Type selects a type of data upon which the calculation is based.
Menu Items
Database
6 - 38 @ptitude Observer 10.2, Revision N User Manual
Calculation:
Rms calculates the Rms value for the selected frequencies.
Sum calculates the sum of the selected frequencies.
% of Overall calculates the Rms of the selected frequencies and divides it by the
overall.
Peaks counts the number of peaks in the selected frequencies.
Frequency finder finds the highest peak and trends its frequency.
% band overall takes the value calculated from Blocks (described below) and
divides it by the value calculated for the selected band, showing the result in %. The Alarm type may be either Absolute or Relative.
% speed following band takes the Block calculation result and divides it by the
calculated value to get the relative % value. The Alarm type must be Absolute.
Frequency range for the calculation must also be set when using % band overall or
% speed following band. For % speed following band, the frequency range is the
speed following entered as a multiple of the speed.
RMS/RSS specifies the calculation type to use with % band overall or % speed
following band. All added Blocks are calculated using either the selected RMS (root
mean squared) or RSS (root sum squared) method. Both methods use the same
Rms formula, but the RMS method uses one spectrum line for the peaks in the
Block, where the RSS method calculates peaks with spectra lines line -1 to line +1
around the peak so that three spectra lines are used.
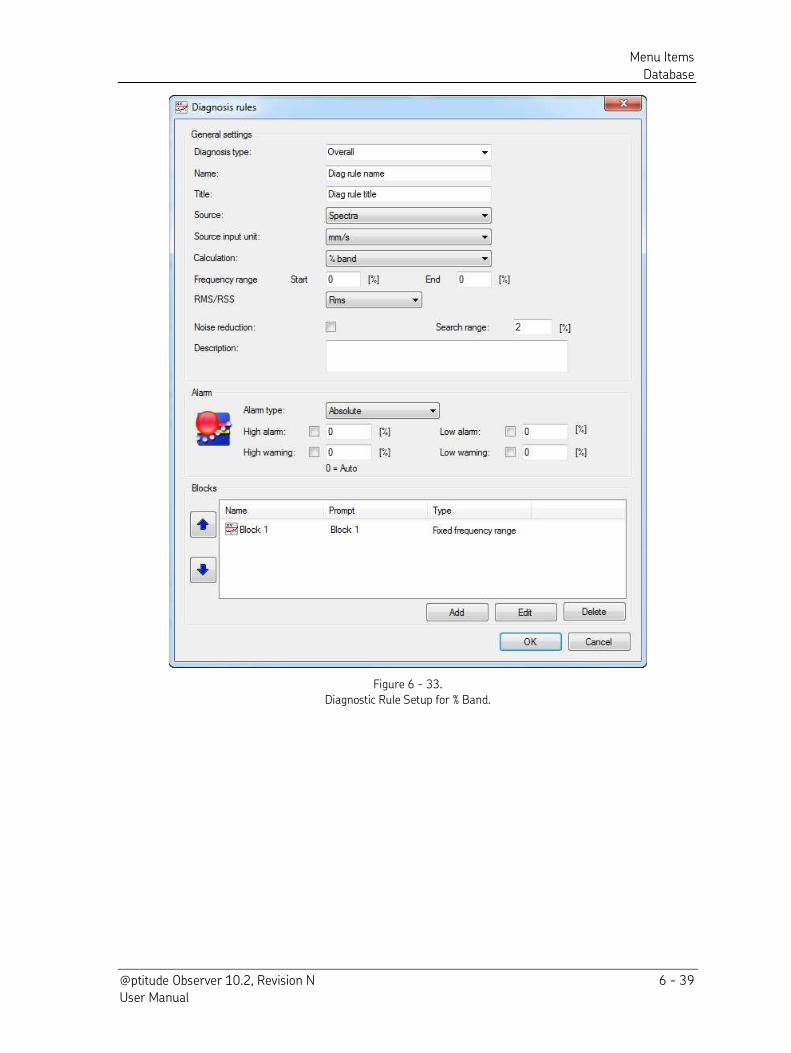
Menu Items
Database
@ptitude Observer 10.2, Revision N 6 - 39 User Manual
Figure 6 - 33.
Diagnostic Rule Setup for % Band.
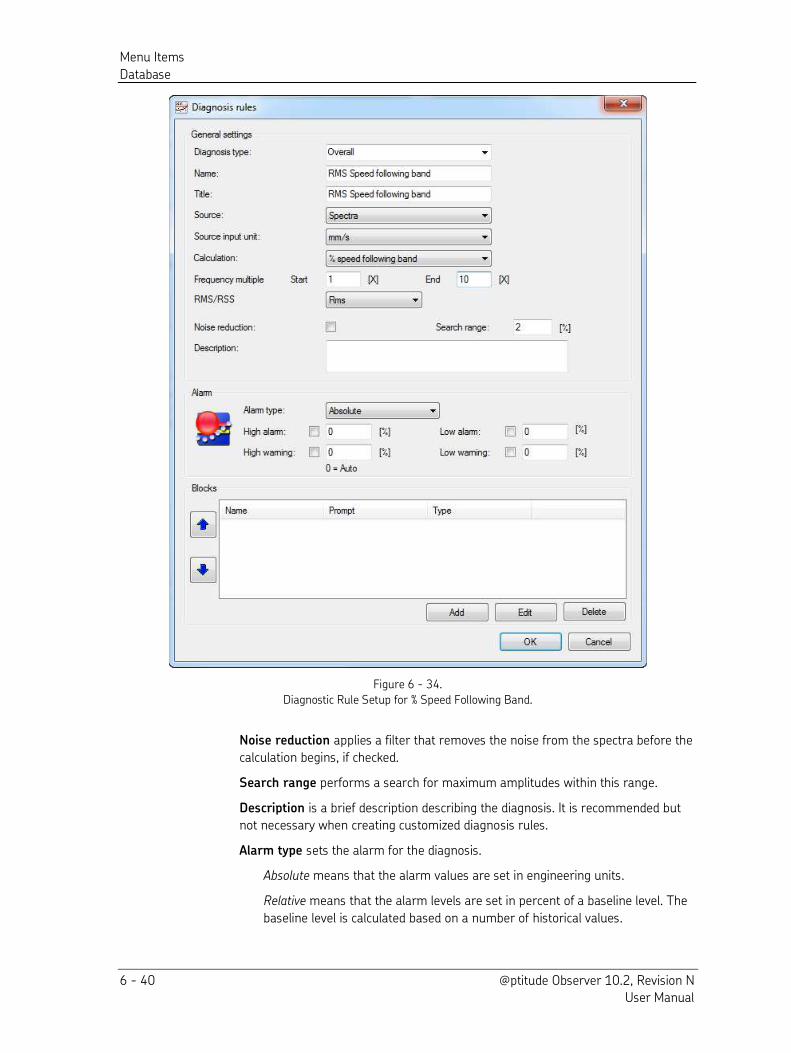
Menu Items
Database
6 - 40 @ptitude Observer 10.2, Revision N User Manual
Figure 6 - 34.
Diagnostic Rule Setup for % Speed Following Band.
Noise reduction applies a filter that removes the noise from the spectra before the
calculation begins, if checked.
Search range performs a search for maximum amplitudes within this range.
Description is a brief description describing the diagnosis. It is recommended but
not necessary when creating customized diagnosis rules.
Alarm type sets the alarm for the diagnosis.
Absolute means that the alarm values are set in engineering units.
Relative means that the alarm levels are set in percent of a baseline level. The
baseline level is calculated based on a number of historical values.
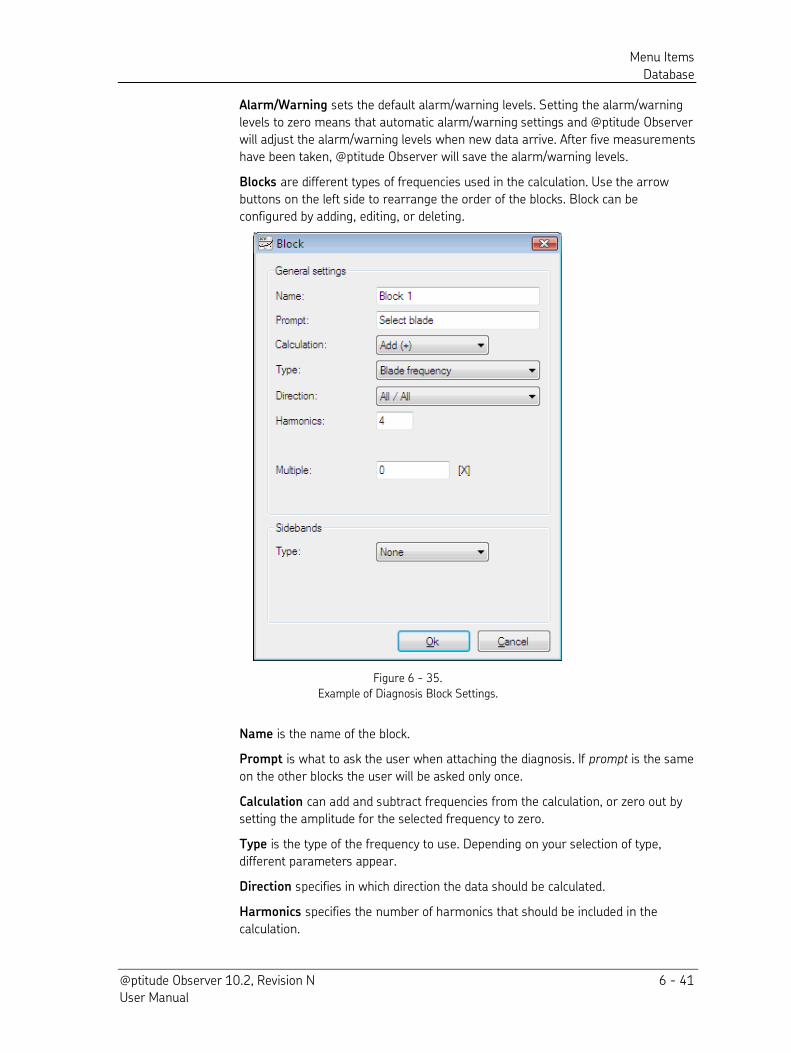
Menu Items
Database
@ptitude Observer 10.2, Revision N 6 - 41 User Manual
Alarm/Warning sets the default alarm/warning levels. Setting the alarm/warning
levels to zero means that automatic alarm/warning settings and @ptitude Observer
will adjust the alarm/warning levels when new data arrive. After five measurements
have been taken, @ptitude Observer will save the alarm/warning levels.
Blocks are different types of frequencies used in the calculation. Use the arrow
buttons on the left side to rearrange the order of the blocks. Block can be
configured by adding, editing, or deleting.
Figure 6 - 35.
Example of Diagnosis Block Settings.
Name is the name of the block.
Prompt is what to ask the user when attaching the diagnosis. If prompt is the same
on the other blocks the user will be asked only once.
Calculation can add and subtract frequencies from the calculation, or zero out by
setting the amplitude for the selected frequency to zero.
Type is the type of the frequency to use. Depending on your selection of type,
different parameters appear.
Direction specifies in which direction the data should be calculated.
Harmonics specifies the number of harmonics that should be included in the
calculation.
Menu Items
Database
6 - 42 @ptitude Observer 10.2, Revision N User Manual
Multiple is the number to multiply the frequency. Default is 1.
Frequency specifies the frequency in cpm (cycle per minute) that should be
monitored.
Sidebands Type selects the sidebands type.
List Diagnoses That Need Attention
This interface lists all attached diagnoses that are incorrectly configured for the entire
database. There are a few reasons why this could happen and one of the most common
reasons is that a machine part that a specific diagnostic are using for its calculation, has
been deleted or replaced from the machine. The system does not know how to calculate
the diagnostics and now it is flagged as a diagnosis that needs attention by the user.
Click on the edit button to reconfigure any diagnosis that needs attention.
Libraries
Libraries interface has the following functions available.
Bearing library
Report library
Receivers
Tag library
Data tagging group
Machine template library
Create machine template
Bearing Library
Bearing library allows you to edit an @ptitude Observer bearing database and find
information on any of the listed bearings. When building machine parts, the system only
allows for the selection of a bearing available within a database. However, you can add
user defined bearings to the system.
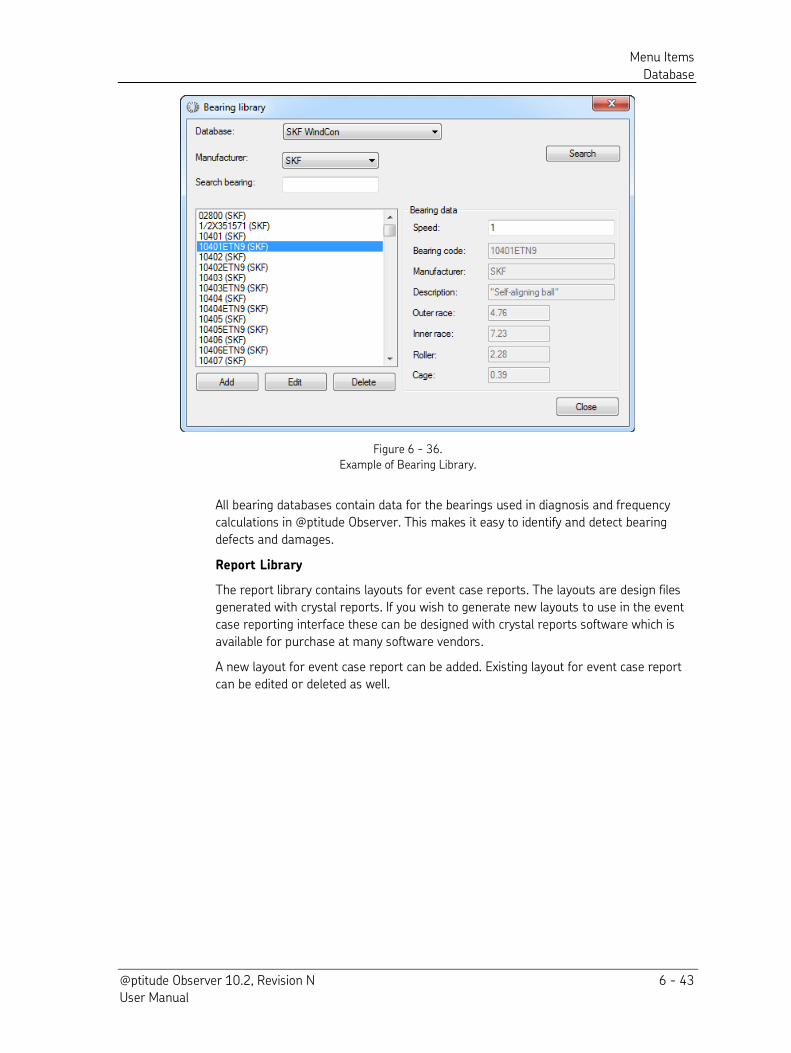
Menu Items
Database
@ptitude Observer 10.2, Revision N 6 - 43 User Manual
Figure 6 - 36.
Example of Bearing Library.
All bearing databases contain data for the bearings used in diagnosis and frequency
calculations in @ptitude Observer. This makes it easy to identify and detect bearing
defects and damages.
Report Library
The report library contains layouts for event case reports. The layouts are design files
generated with crystal reports. If you wish to generate new layouts to use in the event
case reporting interface these can be designed with crystal reports software which is
available for purchase at many software vendors.
A new layout for event case report can be added. Existing layout for event case report
can be edited or deleted as well.
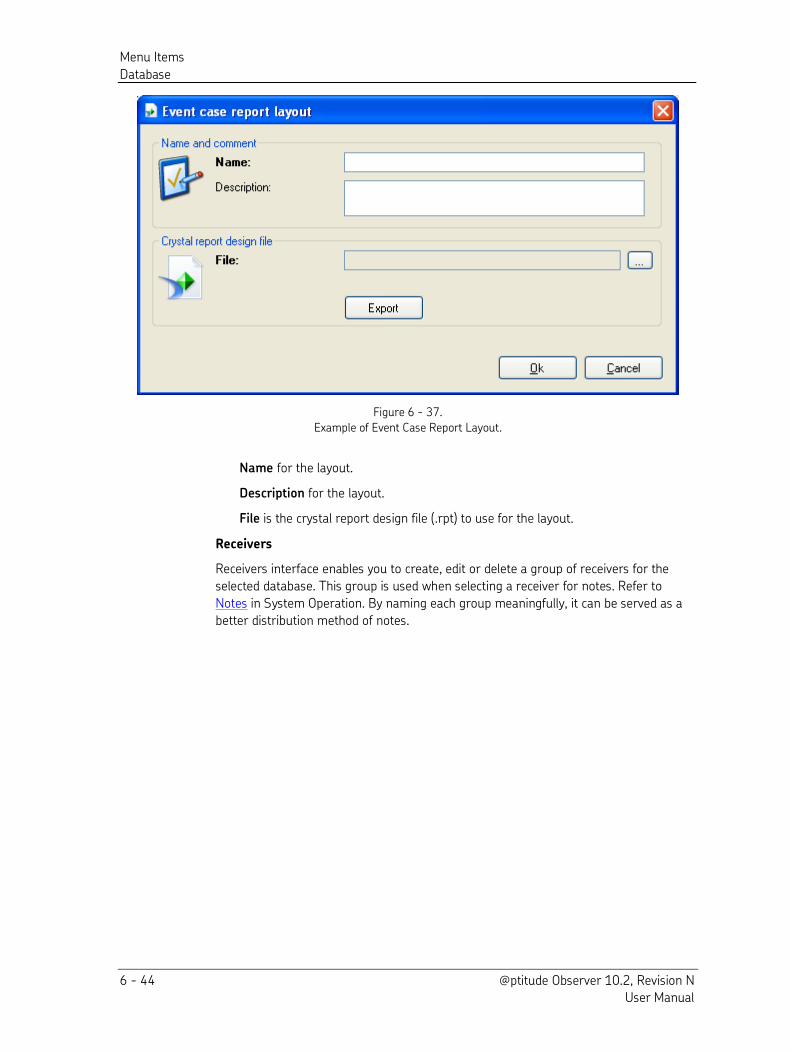
Menu Items
Database
6 - 44 @ptitude Observer 10.2, Revision N User Manual
Figure 6 - 37.
Example of Event Case Report Layout.
Name for the layout.
Description for the layout.
File is the crystal report design file (.rpt) to use for the layout.
Receivers
Receivers interface enables you to create, edit or delete a group of receivers for the
selected database. This group is used when selecting a receiver for notes. Refer to
Notes in System Operation. By naming each group meaningfully, it can be served as a
better distribution method of notes.
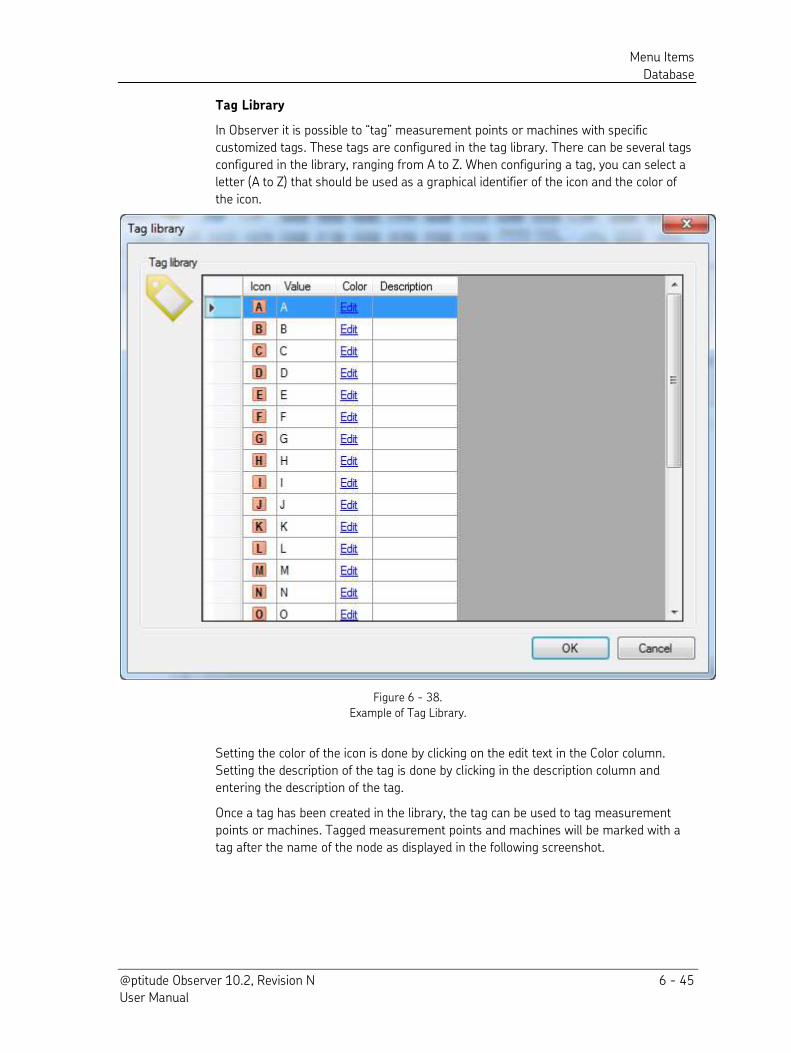
Menu Items
Database
@ptitude Observer 10.2, Revision N 6 - 45 User Manual
Tag Library
In Observer it is possible to “tag” measurement points or machines with specific customized tags. These tags are configured in the tag library. There can be several tags
configured in the library, ranging from A to Z. When configuring a tag, you can select a
letter (A to Z) that should be used as a graphical identifier of the icon and the color of
the icon.
Figure 6 - 38.
Example of Tag Library.
Setting the color of the icon is done by clicking on the edit text in the Color column.
Setting the description of the tag is done by clicking in the description column and
entering the description of the tag.
Once a tag has been created in the library, the tag can be used to tag measurement
points or machines. Tagged measurement points and machines will be marked with a
tag after the name of the node as displayed in the following screenshot.
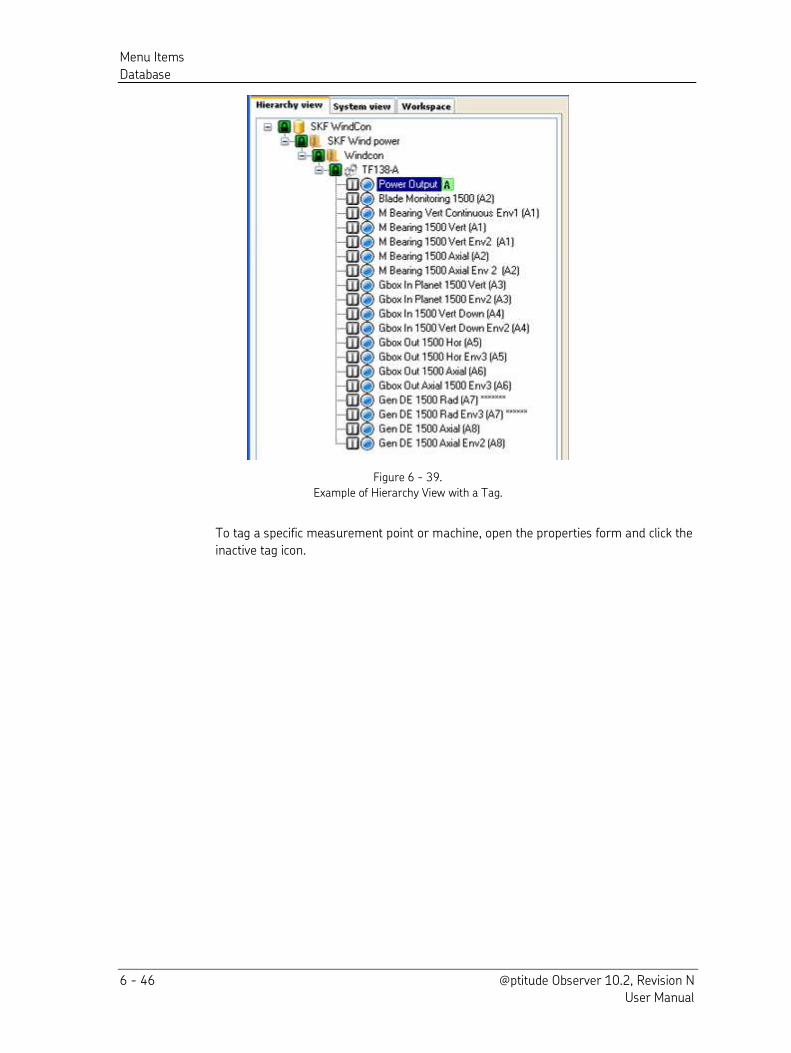
Menu Items
Database
6 - 46 @ptitude Observer 10.2, Revision N User Manual
Figure 6 - 39.
Example of Hierarchy View with a Tag.
To tag a specific measurement point or machine, open the properties form and click the
inactive tag icon.
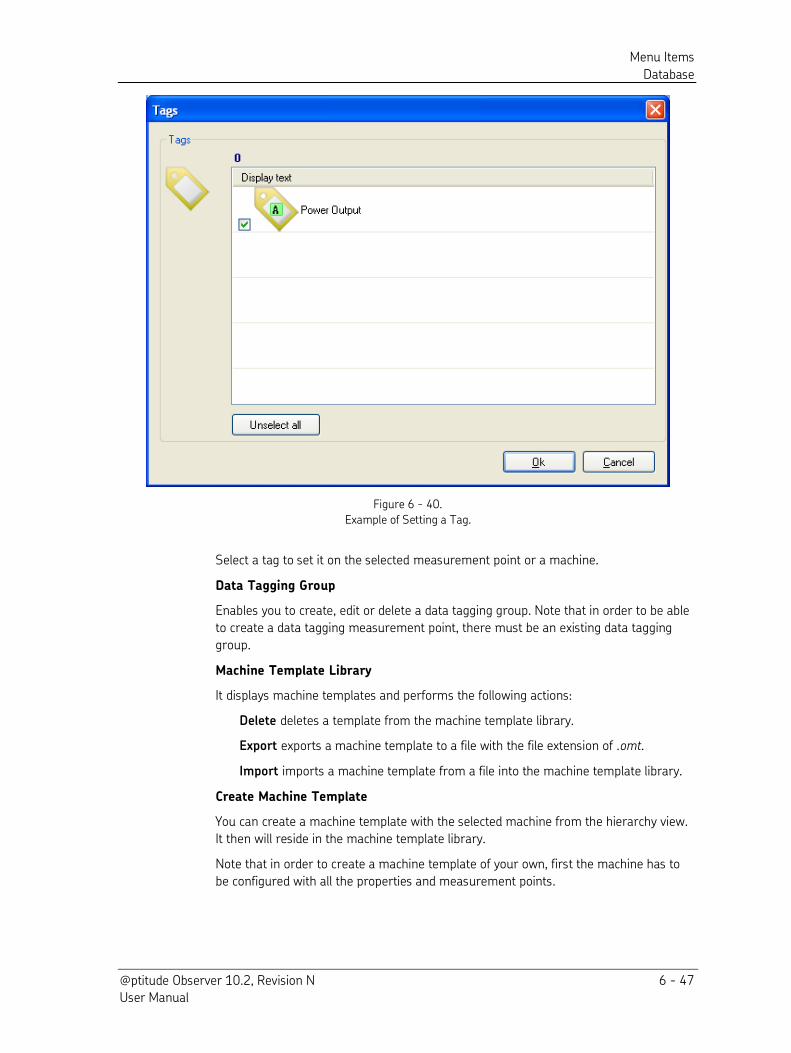
Menu Items
Database
@ptitude Observer 10.2, Revision N 6 - 47 User Manual
Figure 6 - 40.
Example of Setting a Tag.
Select a tag to set it on the selected measurement point or a machine.
Data Tagging Group
Enables you to create, edit or delete a data tagging group. Note that in order to be able
to create a data tagging measurement point, there must be an existing data tagging
group.
Machine Template Library
It displays machine templates and performs the following actions:
Delete deletes a template from the machine template library.
Export exports a machine template to a file with the file extension of .omt.
Import imports a machine template from a file into the machine template library.
Create Machine Template
You can create a machine template with the selected machine from the hierarchy view.
It then will reside in the machine template library.
Note that in order to create a machine template of your own, first the machine has to
be configured with all the properties and measurement points.
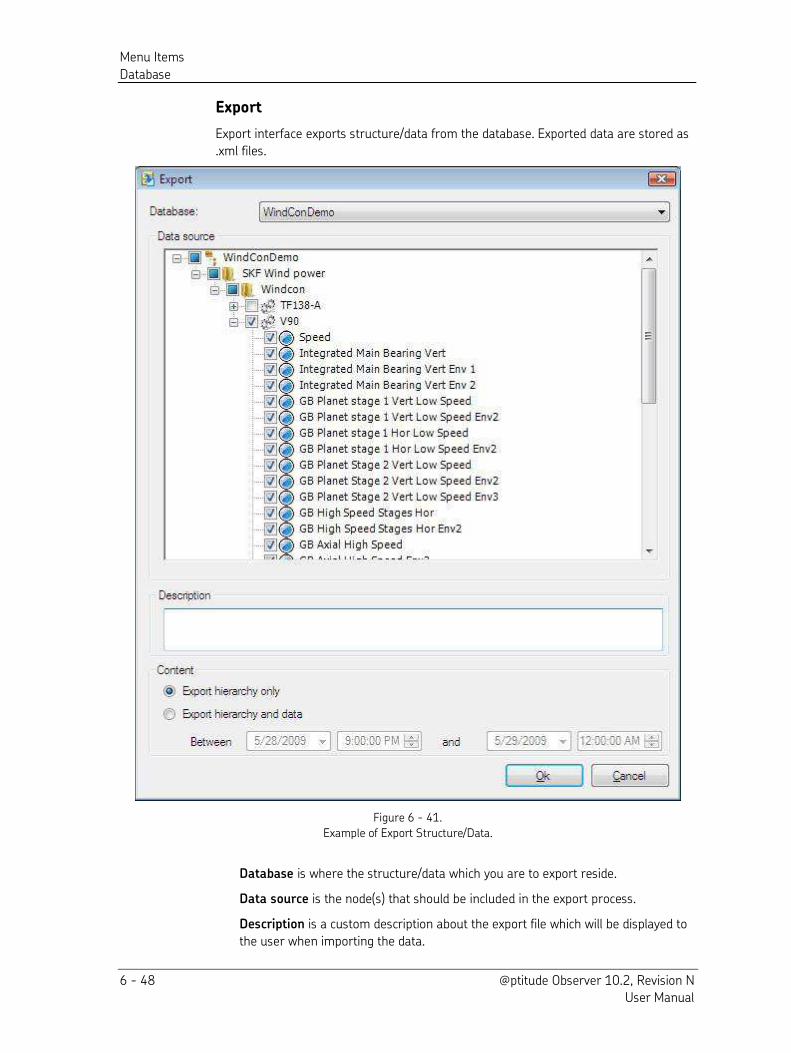
Menu Items
Database
6 - 48 @ptitude Observer 10.2, Revision N User Manual
Export
Export interface exports structure/data from the database. Exported data are stored as
.xml files.
Figure 6 - 41.
Example of Export Structure/Data.
Database is where the structure/data which you are to export reside.
Data source is the node(s) that should be included in the export process.
Description is a custom description about the export file which will be displayed to
the user when importing the data.
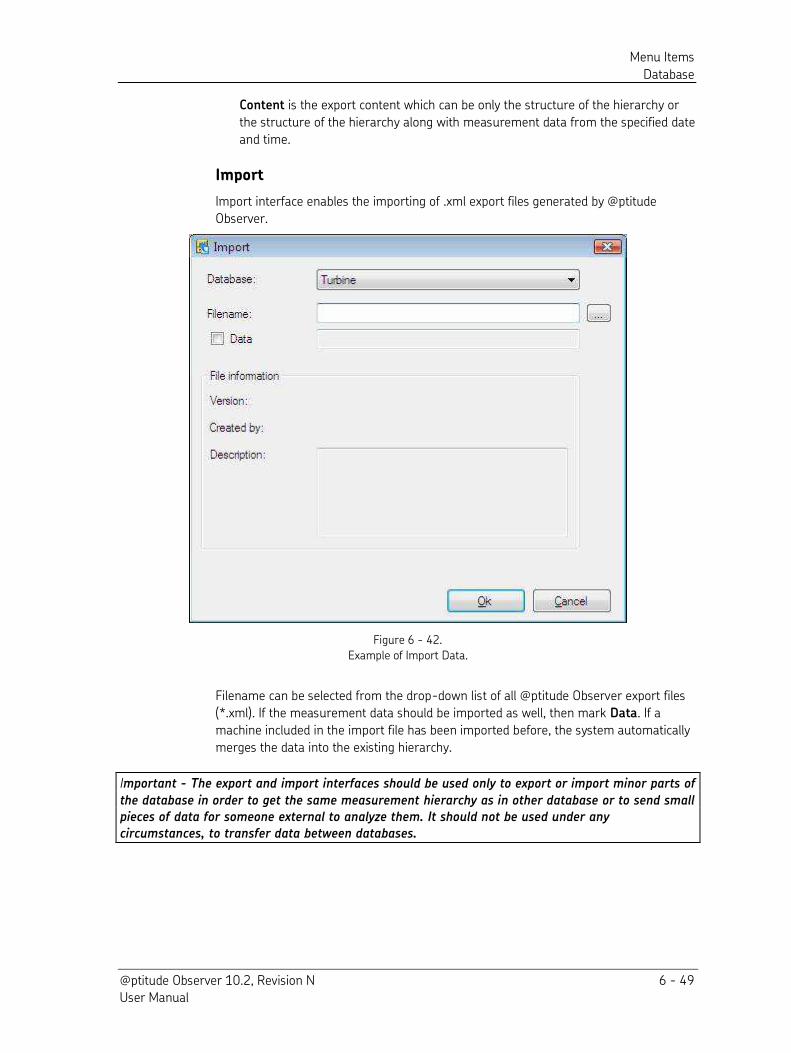
Menu Items
Database
@ptitude Observer 10.2, Revision N 6 - 49 User Manual
Content is the export content which can be only the structure of the hierarchy or
the structure of the hierarchy along with measurement data from the specified date
and time.
Import
Import interface enables the importing of .xml export files generated by @ptitude
Observer.
Figure 6 - 42.
Example of Import Data.
Filename can be selected from the drop-down list of all @ptitude Observer export files
(*.xml). If the measurement data should be imported as well, then mark Data. If a
machine included in the import file has been imported before, the system automatically
merges the data into the existing hierarchy.
Important - The export and import interfaces should be used only to export or import minor parts of
the database in order to get the same measurement hierarchy as in other database or to send small pieces of data for someone external to analyze them. It should not be used under any circumstances, to transfer data between databases.
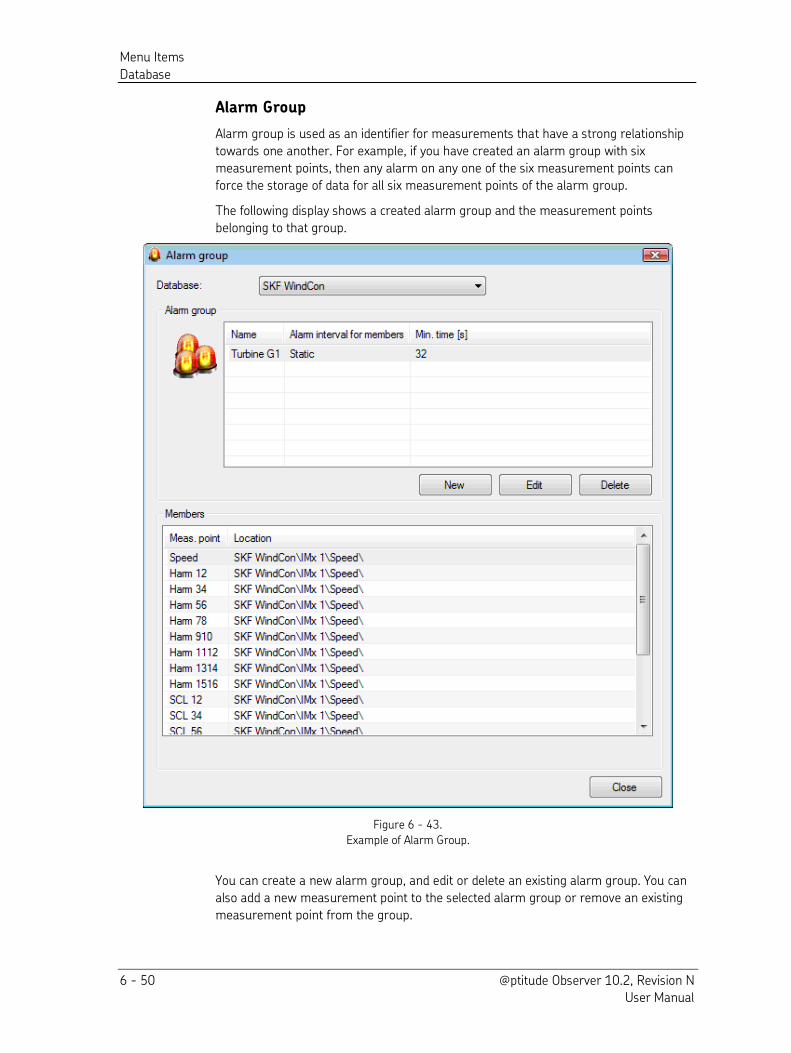
Menu Items
Database
6 - 50 @ptitude Observer 10.2, Revision N User Manual
Alarm Group
Alarm group is used as an identifier for measurements that have a strong relationship
towards one another. For example, if you have created an alarm group with six
measurement points, then any alarm on any one of the six measurement points can
force the storage of data for all six measurement points of the alarm group.
The following display shows a created alarm group and the measurement points
belonging to that group.
Figure 6 - 43.
Example of Alarm Group.
You can create a new alarm group, and edit or delete an existing alarm group. You can
also add a new measurement point to the selected alarm group or remove an existing
measurement point from the group.
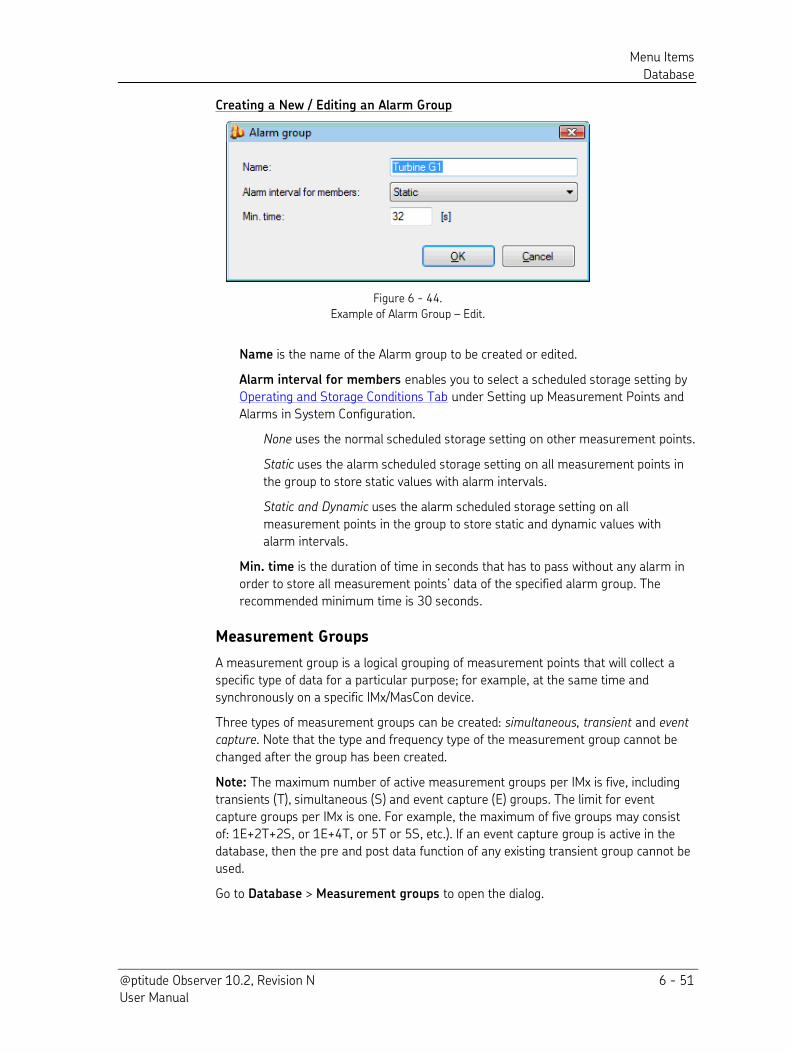
Menu Items
Database
@ptitude Observer 10.2, Revision N 6 - 51 User Manual
Creating a New / Editing an Alarm Group
Figure 6 - 44.
Example of Alarm Group – Edit.
Name is the name of the Alarm group to be created or edited.
Alarm interval for members enables you to select a scheduled storage setting by
Operating and Storage Conditions Tab under Setting up Measurement Points and
Alarms in System Configuration.
None uses the normal scheduled storage setting on other measurement points.
Static uses the alarm scheduled storage setting on all measurement points in
the group to store static values with alarm intervals.
Static and Dynamic uses the alarm scheduled storage setting on all
measurement points in the group to store static and dynamic values with
alarm intervals.
Min. time is the duration of time in seconds that has to pass without any alarm in
order to store all measurement points’ data of the specified alarm group. The
recommended minimum time is 30 seconds.
Measurement Groups
A measurement group is a logical grouping of measurement points that will collect a
specific type of data for a particular purpose; for example, at the same time and
synchronously on a specific IMx/MasCon device.
Three types of measurement groups can be created: simultaneous, transient and event
capture. Note that the type and frequency type of the measurement group cannot be
changed after the group has been created.
Note: The maximum number of active measurement groups per IMx is five, including
transients (T), simultaneous (S) and event capture (E) groups. The limit for event
capture groups per IMx is one. For example, the maximum of five groups may consist
of: 1E+2T+2S, or 1E+4T, or 5T or 5S, etc.). If an event capture group is active in the
database, then the pre and post data function of any existing transient group cannot be
used.
Go to Database > Measurement groups to open the dialog.
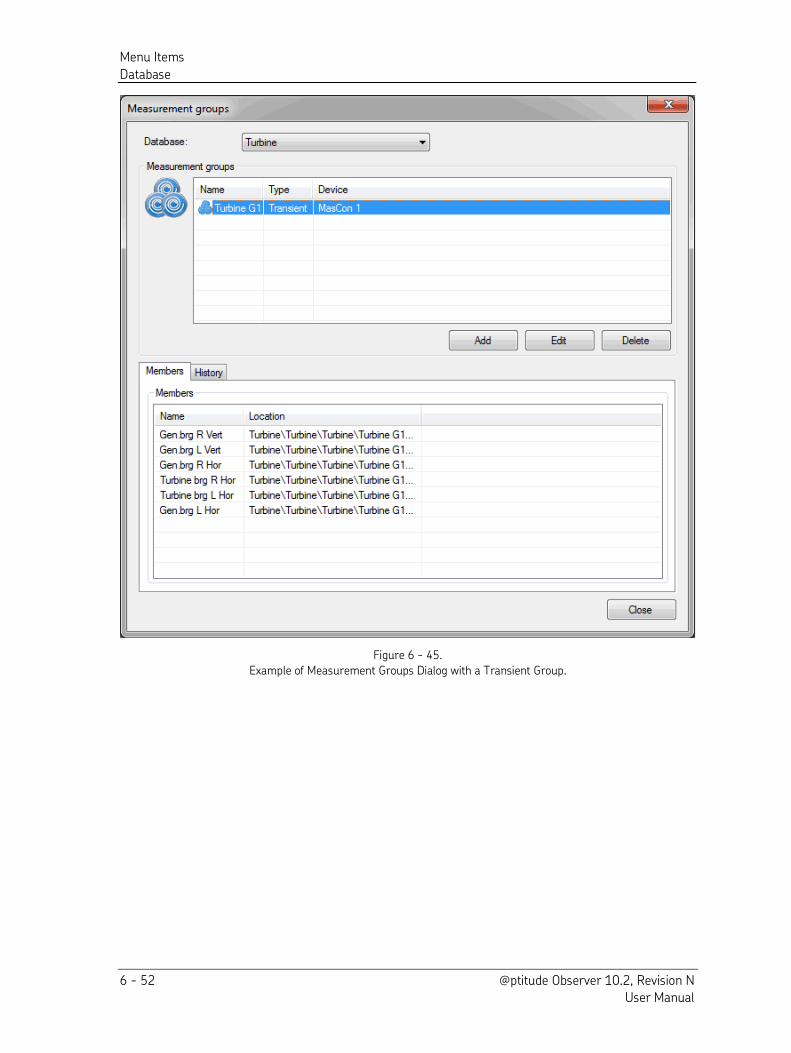
Menu Items
Database
6 - 52 @ptitude Observer 10.2, Revision N User Manual
Figure 6 - 45.
Example of Measurement Groups Dialog with a Transient Group.
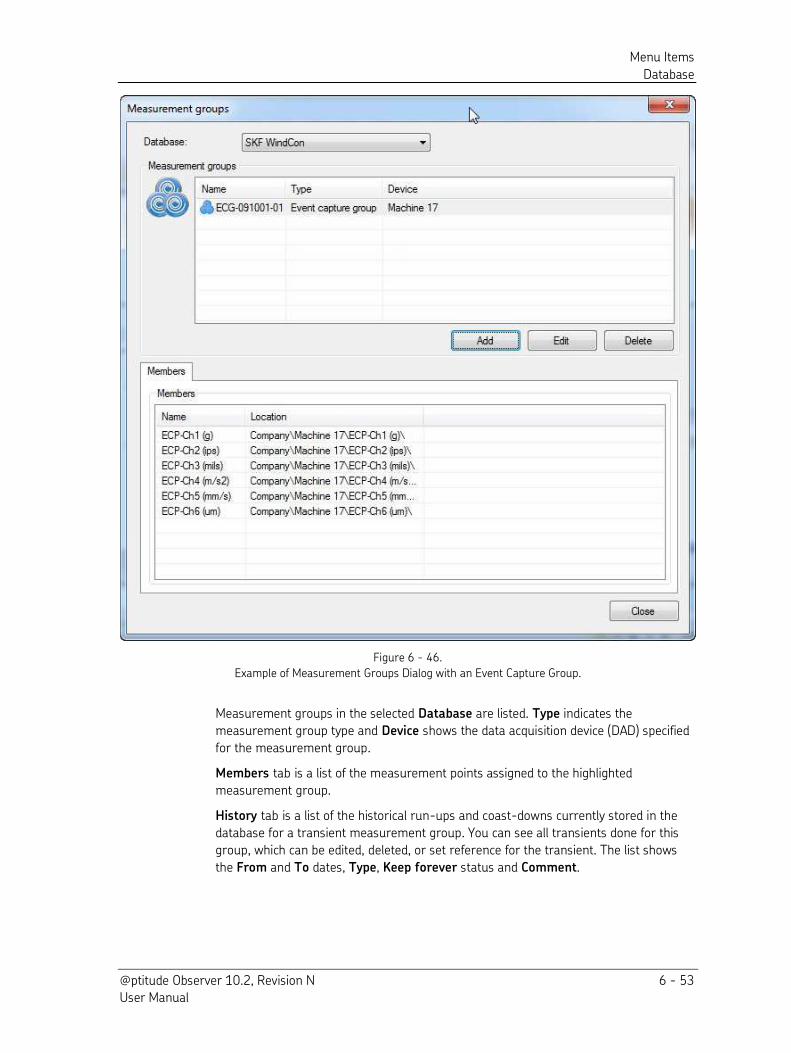
Menu Items
Database
@ptitude Observer 10.2, Revision N 6 - 53 User Manual
Figure 6 - 46.
Example of Measurement Groups Dialog with an Event Capture Group.
Measurement groups in the selected Database are listed. Type indicates the
measurement group type and Device shows the data acquisition device (DAD) specified
for the measurement group.
Members tab is a list of the measurement points assigned to the highlighted
measurement group.
History tab is a list of the historical run-ups and coast-downs currently stored in the
database for a transient measurement group. You can see all transients done for this
group, which can be edited, deleted, or set reference for the transient. The list shows
the From and To dates, Type, Keep forever status and Comment.
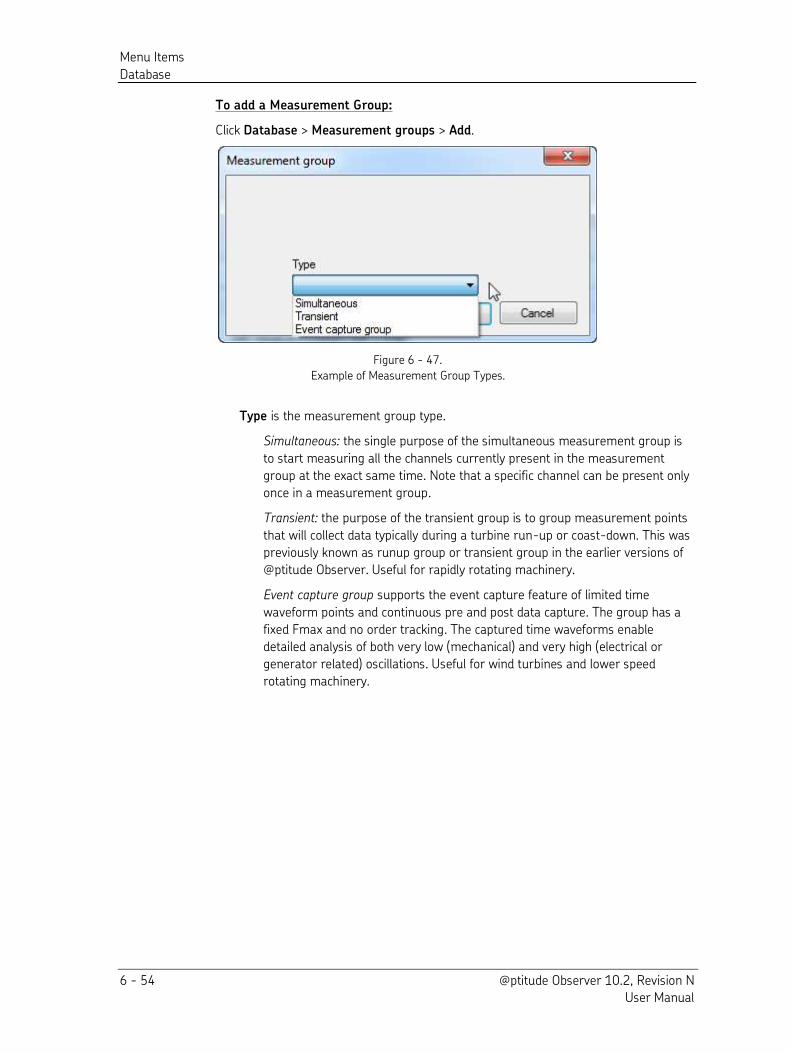
Menu Items
Database
6 - 54 @ptitude Observer 10.2, Revision N User Manual
To add a Measurement Group:
Click Database > Measurement groups > Add.
Figure 6 - 47.
Example of Measurement Group Types.
Type is the measurement group type.
Simultaneous: the single purpose of the simultaneous measurement group is
to start measuring all the channels currently present in the measurement
group at the exact same time. Note that a specific channel can be present only
once in a measurement group.
Transient: the purpose of the transient group is to group measurement points
that will collect data typically during a turbine run-up or coast-down. This was
previously known as runup group or transient group in the earlier versions of
@ptitude Observer. Useful for rapidly rotating machinery.
Event capture group supports the event capture feature of limited time
waveform points and continuous pre and post data capture. The group has a
fixed Fmax and no order tracking. The captured time waveforms enable
detailed analysis of both very low (mechanical) and very high (electrical or
generator related) oscillations. Useful for wind turbines and lower speed
rotating machinery.
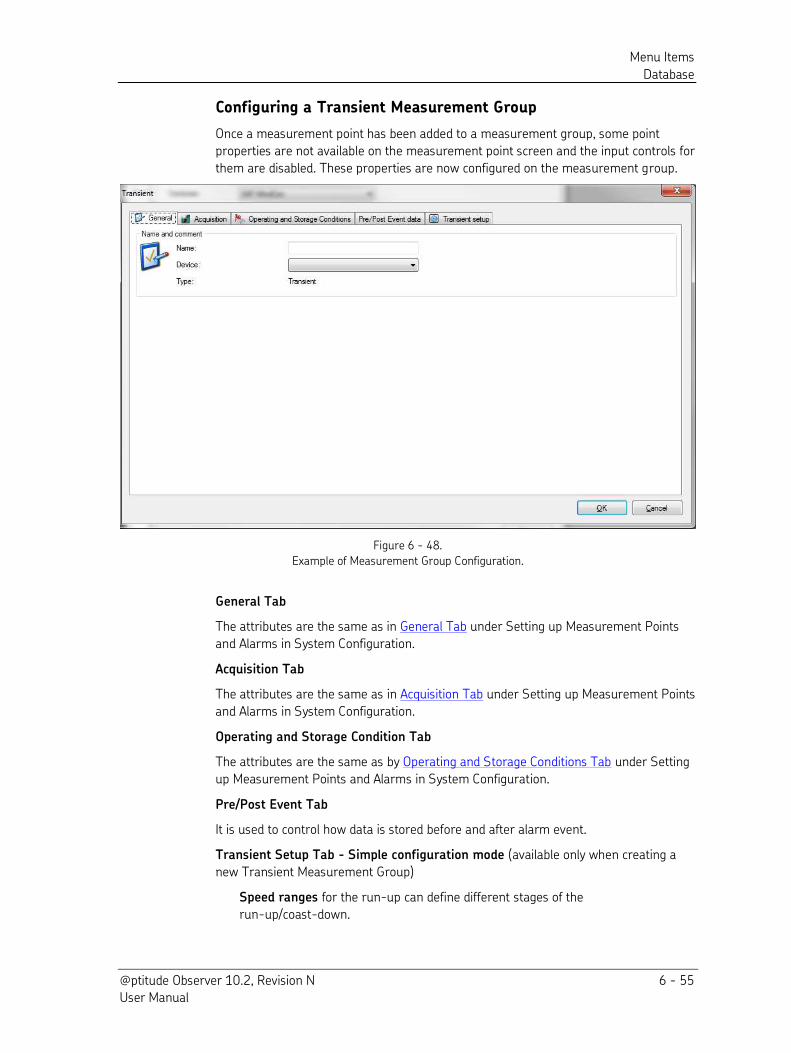
Menu Items
Database
@ptitude Observer 10.2, Revision N 6 - 55 User Manual
Configuring a Transient Measurement Group
Once a measurement point has been added to a measurement group, some point
properties are not available on the measurement point screen and the input controls for
them are disabled. These properties are now configured on the measurement group.
Figure 6 - 48.
Example of Measurement Group Configuration.
General Tab
The attributes are the same as in General Tab under Setting up Measurement Points
and Alarms in System Configuration.
Acquisition Tab
The attributes are the same as in Acquisition Tab under Setting up Measurement Points
and Alarms in System Configuration.
Operating and Storage Condition Tab
The attributes are the same as by Operating and Storage Conditions Tab under Setting
up Measurement Points and Alarms in System Configuration.
Pre/Post Event Tab
It is used to control how data is stored before and after alarm event.
Transient Setup Tab - Simple configuration mode (available only when creating a
new Transient Measurement Group)
Speed ranges for the run-up can define different stages of the
run-up/coast-down.
Menu Items
Database
6 - 56 @ptitude Observer 10.2, Revision N User Manual
Static data storage
Delta CPM is the setting for maximum speed change before storing static
values.
Delta time is the setting for maximum time before storing static values.
Dynamic data storage
Delta CPM is the setting for maximum speed change before storing dynamic
values.
Delta time is the setting for maximum time before storing dynamic values.
Transient state timeout specifies how long the transient will remain in transient
state for the specified timeout when moving from transient state to normal state.
Transient closure time is the time to remain in the transient after reaching
primary steady state.
Transient Setup Tab - Advanced configuration mode (available only when creating a
new Transient Measurement Group)
Transient state timeout specifies how long the transient will remain in transient
state for the specified timeout when moving from transient state to normal state.
Transient closure time is the timeout used before closing the transient and set its
final type.
Rpm min (cpm) indicates the lower rpm (revolution per minute) limit for each
range.
Rpm max (cpm) indicates the higher rpm (revolution per minute) limit for each
range.
State defines whether this is a constant state or a run-up/down state.
Delta Trend (cpm) indicates the number of cycles per minute between storage of
trend values. If this parameter is not reached within one minute, a trend will be
stored.
Mean harm. (No. revolutions) indicates the number of revolutions of the shaft on
which the mean value of the presented trend is based on.
Max. time (s) is the maximum time between the storage of trend values.
Delta FFT (cpm) indicates the required change in speed between each spectra
storage.
Max. time FFT (s) is the maximum time between the storage of FFT values.
Classification of Transients When Opening a Transient:
When transient data arrives at the monitor service, the monitor service will change if
there is an active transient in progress for that measurement point. If not, a new
transient is started and classified as following:
If the speed reading is in a transient range that has no other ranges above it, it is
classified as “Overspeed in progress”.
Menu Items
Database
@ptitude Observer 10.2, Revision N 6 - 57 User Manual
If the reading is in another transient range and in the lower half of that range, it is
classified as “Run-up in progress”. If the reading is in another transient range and in the higher half of that range, it is
classified as “Coast-down in progress”. Classification of Transients When Closing a Transient
After the “Transient closure time” has elapsed without new transient values the
transient will be closed. The state of the transient is then changed as:
If it was classified as “Overspeed in progress” and the last reading stored also was in the overspeed range the classification is changed to “Overspeed”.
If it was classified as “Overspeed in progress” and the last reading stored was outside of the overspeed range the classification is changed to “Overspeed –
Coast-down”. If it was classified as “Run-up in progress” and the last speed reading was in the
upper half of its speed range it is classified as “Run-up”. If it was classified as “Run-up in progress” and the last speed reading was in the
lower half of its speed range it is classified as “Run-up aborted”. If it was classified as “Coast-down in progress” and the last speed reading was in
the upper half of its speed range it is classified as “Coast-down aborted”. If it was classified as “Coast-down in progress” and the last speed reading was in
the lower half of its speed range it is classified as “Coast-down”. To add a measurement point to a transient measurement group:
1. Select a measurement point in the hierarchy view.
2. Go to General tab settings screen of Measurement point via Properties command.
If you need a help accessing the screen, refer to To edit a measurement point in
Setting up Measurement Points and Alarms.
3. Select the IMx/MasCon device to which this point is assigned.
4. Select a Measurement group to use from the drop-down list of measurement
groups.
Optimal Settings for Transient Group
The following recommendations are to optimize the performance of a transient group.
Use only vibration measurement points of Harmonic type.
Do not use other dynamic measurement points in the same IMx device regardless
of whether they are on different channels or not. Unrelated "slow points" should be
in a separate IMx (16-channel) device.
In dynamic data setting, select Save Time waveform only. Spectra is calculated
from the waveform automatically. The setting applies for all dynamic data (for
example, alarm/delta) but is placed in the "scheduled dynamic data storage" box.
When using order-tracking, keep number of revolutions and maximum frequency
as low as required.
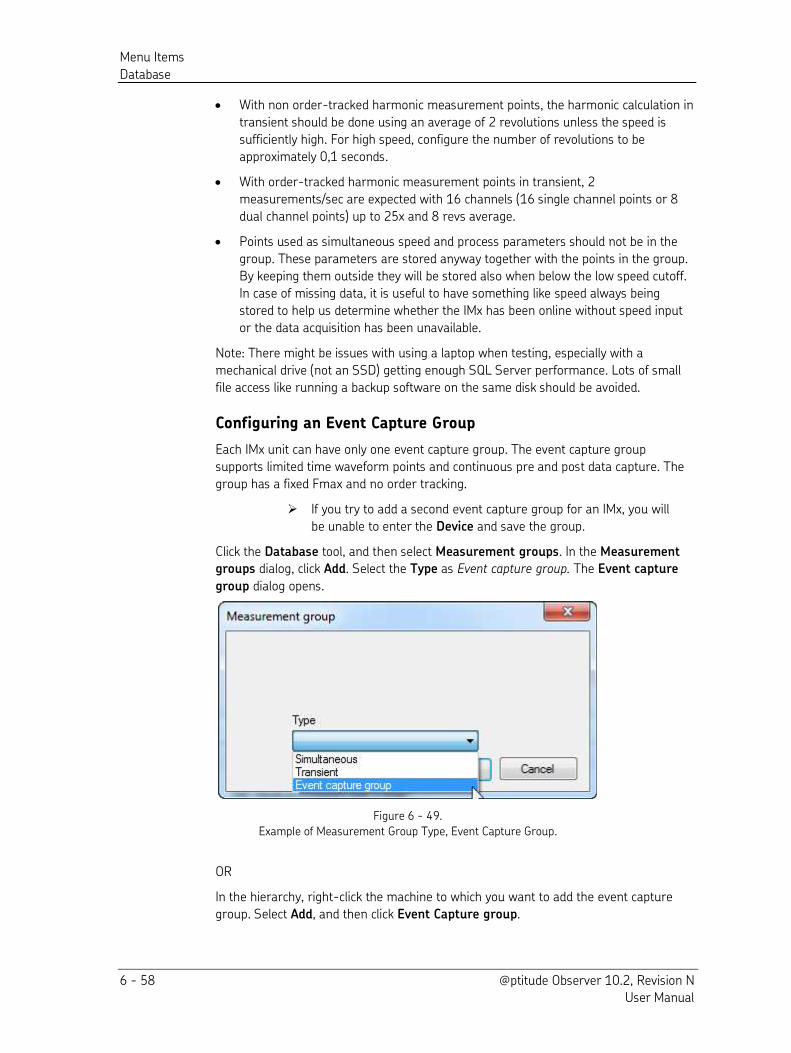
Menu Items
Database
6 - 58 @ptitude Observer 10.2, Revision N User Manual
With non order-tracked harmonic measurement points, the harmonic calculation in
transient should be done using an average of 2 revolutions unless the speed is
sufficiently high. For high speed, configure the number of revolutions to be
approximately 0,1 seconds.
With order-tracked harmonic measurement points in transient, 2
measurements/sec are expected with 16 channels (16 single channel points or 8
dual channel points) up to 25x and 8 revs average.
Points used as simultaneous speed and process parameters should not be in the
group. These parameters are stored anyway together with the points in the group.
By keeping them outside they will be stored also when below the low speed cutoff.
In case of missing data, it is useful to have something like speed always being
stored to help us determine whether the IMx has been online without speed input
or the data acquisition has been unavailable.
Note: There might be issues with using a laptop when testing, especially with a
mechanical drive (not an SSD) getting enough SQL Server performance. Lots of small
file access like running a backup software on the same disk should be avoided.
Configuring an Event Capture Group
Each IMx unit can have only one event capture group. The event capture group
supports limited time waveform points and continuous pre and post data capture. The
group has a fixed Fmax and no order tracking.
If you try to add a second event capture group for an IMx, you will
be unable to enter the Device and save the group.
Click the Database tool, and then select Measurement groups. In the Measurement
groups dialog, click Add. Select the Type as Event capture group. The Event capture
group dialog opens.
Figure 6 - 49.
Example of Measurement Group Type, Event Capture Group.
OR
In the hierarchy, right-click the machine to which you want to add the event capture
group. Select Add, and then click Event Capture group.
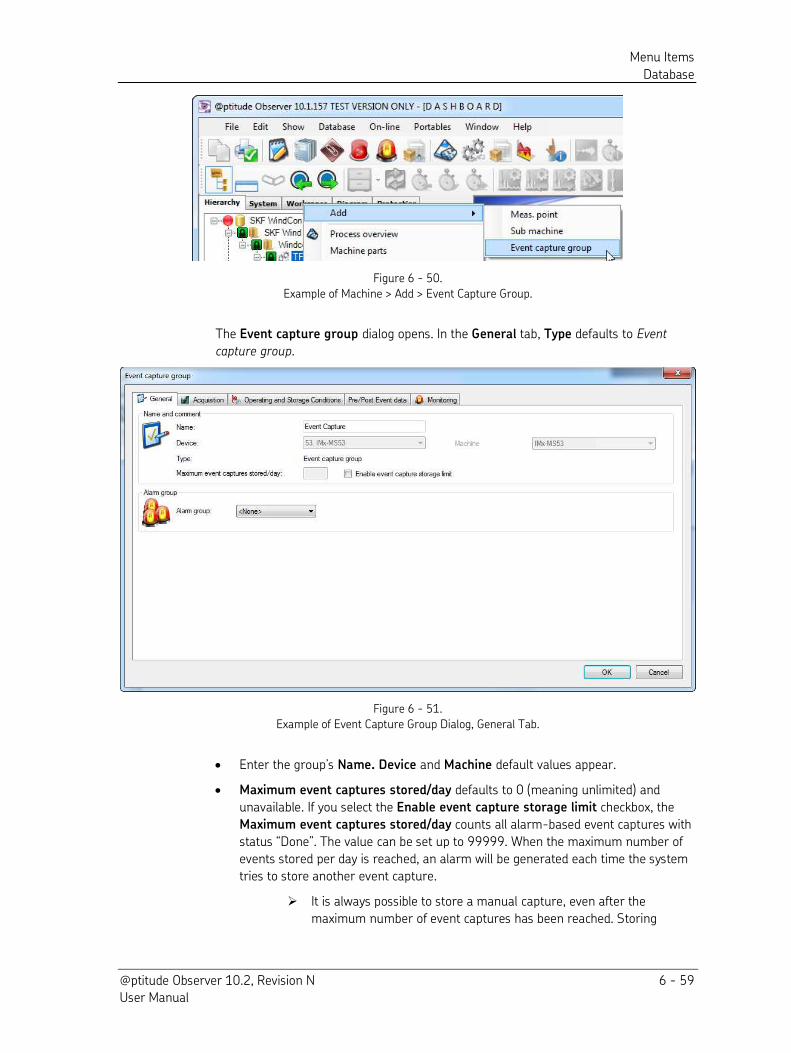
Menu Items
Database
@ptitude Observer 10.2, Revision N 6 - 59 User Manual
Figure 6 - 50.
Example of Machine > Add > Event Capture Group.
The Event capture group dialog opens. In the General tab, Type defaults to Event
capture group.
Figure 6 - 51.
Example of Event Capture Group Dialog, General Tab.
Enter the group’s Name. Device and Machine default values appear.
Maximum event captures stored/day defaults to 0 (meaning unlimited) and
unavailable. If you select the Enable event capture storage limit checkbox, the
Maximum event captures stored/day counts all alarm-based event captures with
status “Done”. The value can be set up to 99999. When the maximum number of
events stored per day is reached, an alarm will be generated each time the system
tries to store another event capture.
It is always possible to store a manual capture, even after the
maximum number of event captures has been reached. Storing
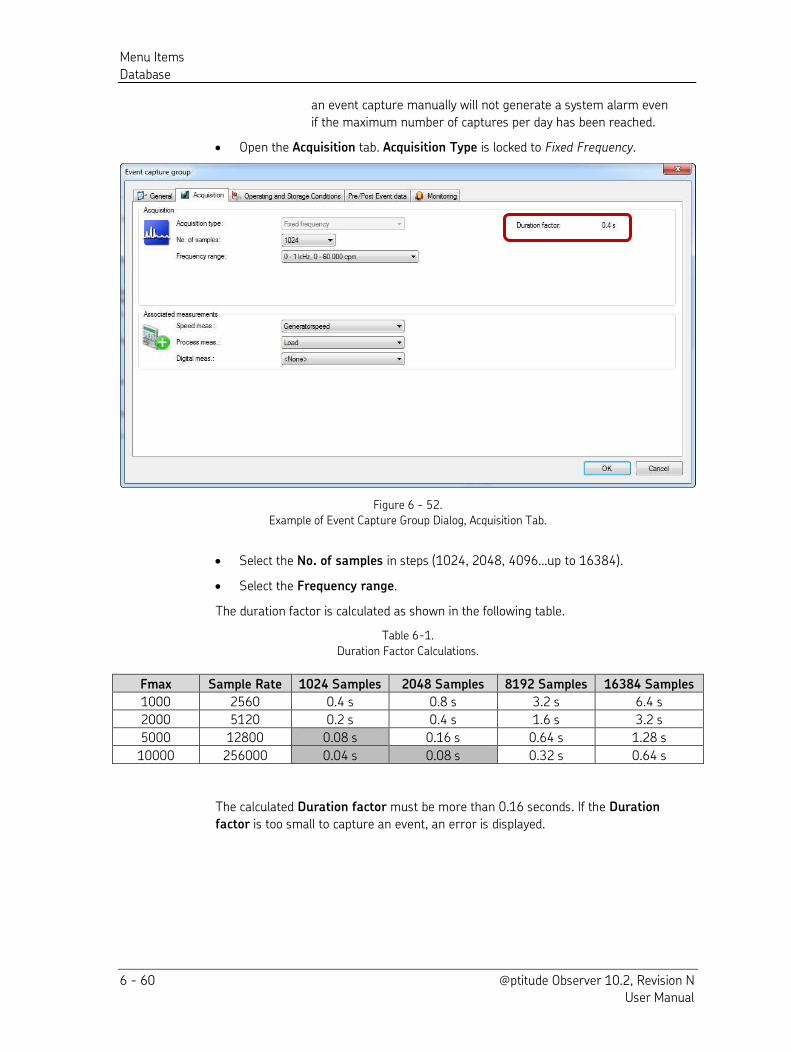
Menu Items
Database
6 - 60 @ptitude Observer 10.2, Revision N User Manual
an event capture manually will not generate a system alarm even
if the maximum number of captures per day has been reached.
Open the Acquisition tab. Acquisition Type is locked to Fixed Frequency.
Figure 6 - 52.
Example of Event Capture Group Dialog, Acquisition Tab.
Select the No. of samples in steps (1024, 2048, 4096…up to 16384). Select the Frequency range.
The duration factor is calculated as shown in the following table.
Table 6-1.
Duration Factor Calculations.
Fmax Sample Rate 1024 Samples 2048 Samples 8192 Samples 16384 Samples
1000 2560 0.4 s 0.8 s 3.2 s 6.4 s
2000 5120 0.2 s 0.4 s 1.6 s 3.2 s
5000 12800 0.08 s 0.16 s 0.64 s 1.28 s
10000 256000 0.04 s 0.08 s 0.32 s 0.64 s
The calculated Duration factor must be more than 0.16 seconds. If the Duration
factor is too small to capture an event, an error is displayed.
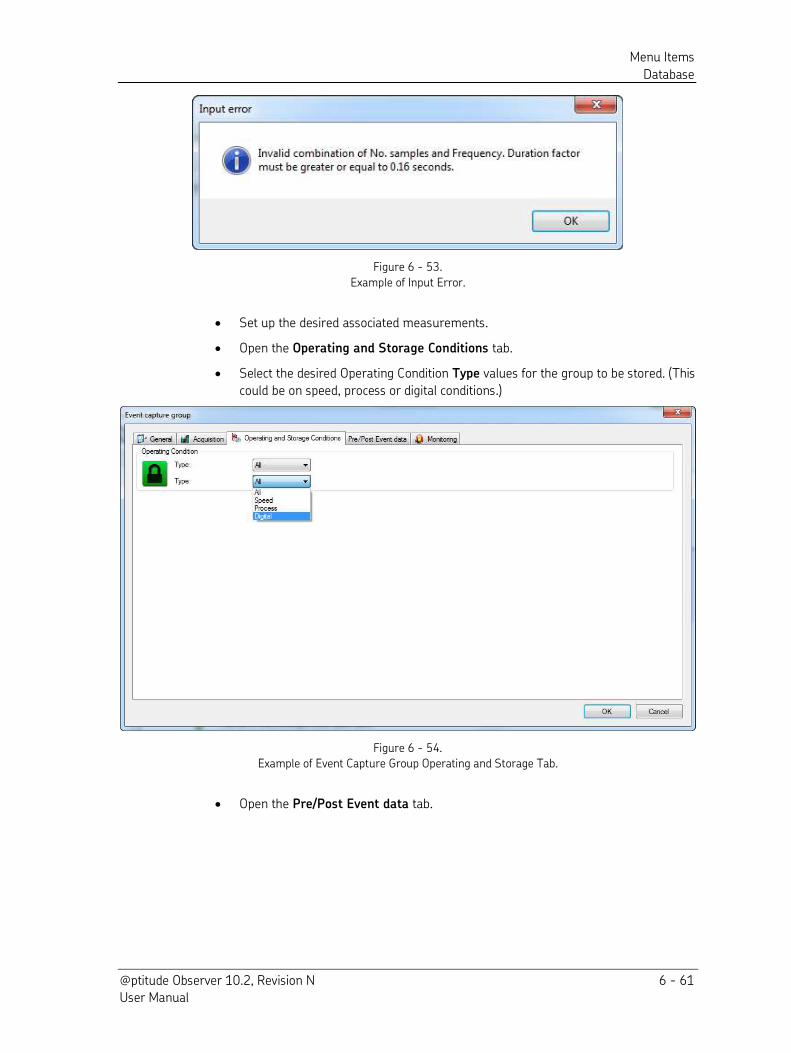
Menu Items
Database
@ptitude Observer 10.2, Revision N 6 - 61 User Manual
Figure 6 - 53.
Example of Input Error.
Set up the desired associated measurements.
Open the Operating and Storage Conditions tab.
Select the desired Operating Condition Type values for the group to be stored. (This
could be on speed, process or digital conditions.)
Figure 6 - 54.
Example of Event Capture Group Operating and Storage Tab.
Open the Pre/Post Event data tab.
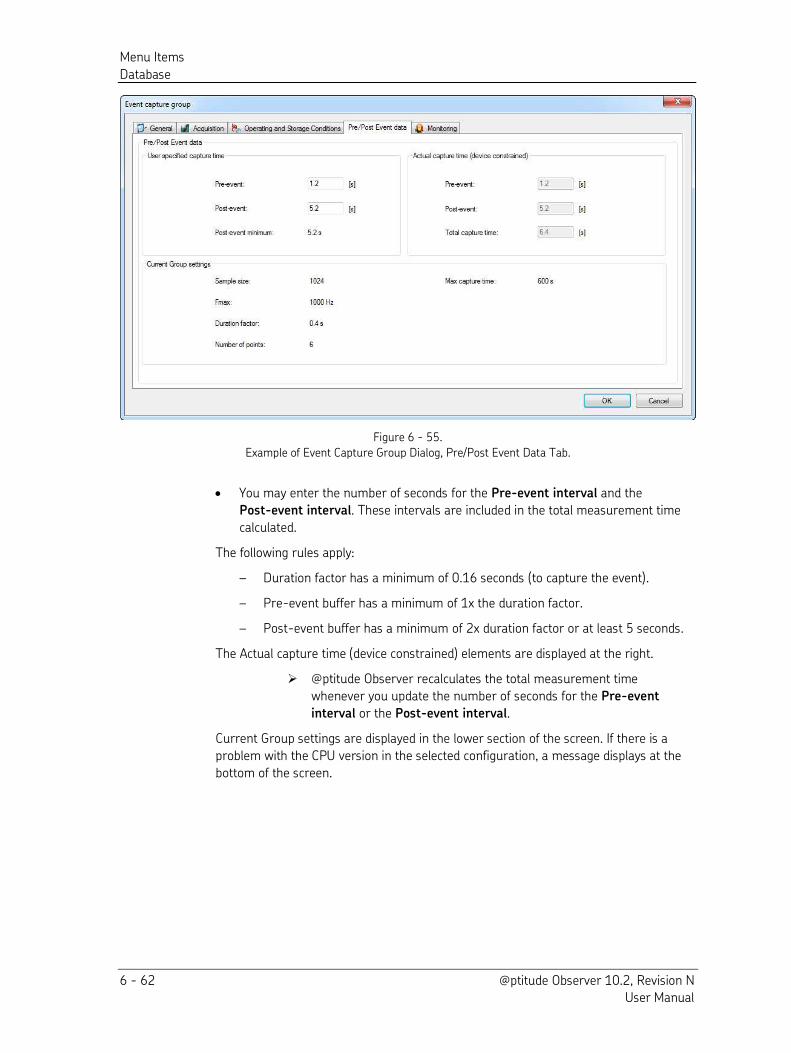
Menu Items
Database
6 - 62 @ptitude Observer 10.2, Revision N User Manual
Figure 6 - 55.
Example of Event Capture Group Dialog, Pre/Post Event Data Tab.
You may enter the number of seconds for the Pre-event interval and the
Post-event interval. These intervals are included in the total measurement time
calculated.
The following rules apply:
– Duration factor has a minimum of 0.16 seconds (to capture the event).
– Pre-event buffer has a minimum of 1x the duration factor.
– Post-event buffer has a minimum of 2x duration factor or at least 5 seconds.
The Actual capture time (device constrained) elements are displayed at the right.
@ptitude Observer recalculates the total measurement time
whenever you update the number of seconds for the Pre-event
interval or the Post-event interval.
Current Group settings are displayed in the lower section of the screen. If there is a
problem with the CPU version in the selected configuration, a message displays at the
bottom of the screen.
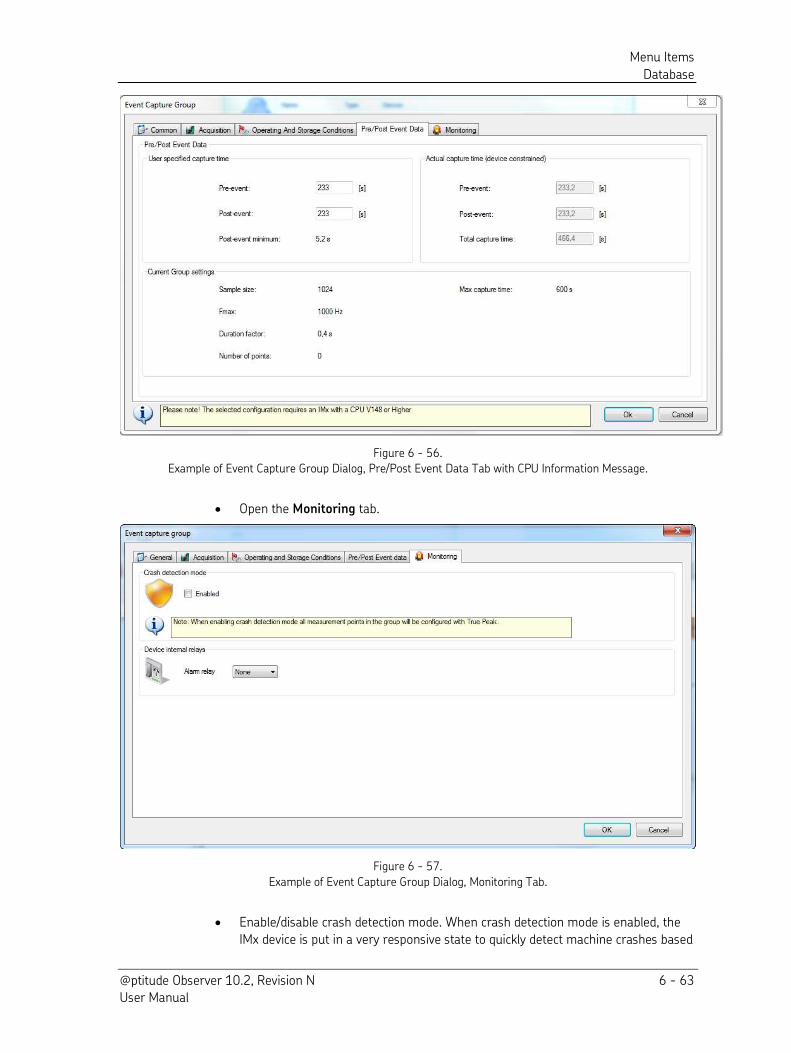
Menu Items
Database
@ptitude Observer 10.2, Revision N 6 - 63 User Manual
Figure 6 - 56.
Example of Event Capture Group Dialog, Pre/Post Event Data Tab with CPU Information Message.
Open the Monitoring tab.
Figure 6 - 57.
Example of Event Capture Group Dialog, Monitoring Tab.
Enable/disable crash detection mode. When crash detection mode is enabled, the
IMx device is put in a very responsive state to quickly detect machine crashes based
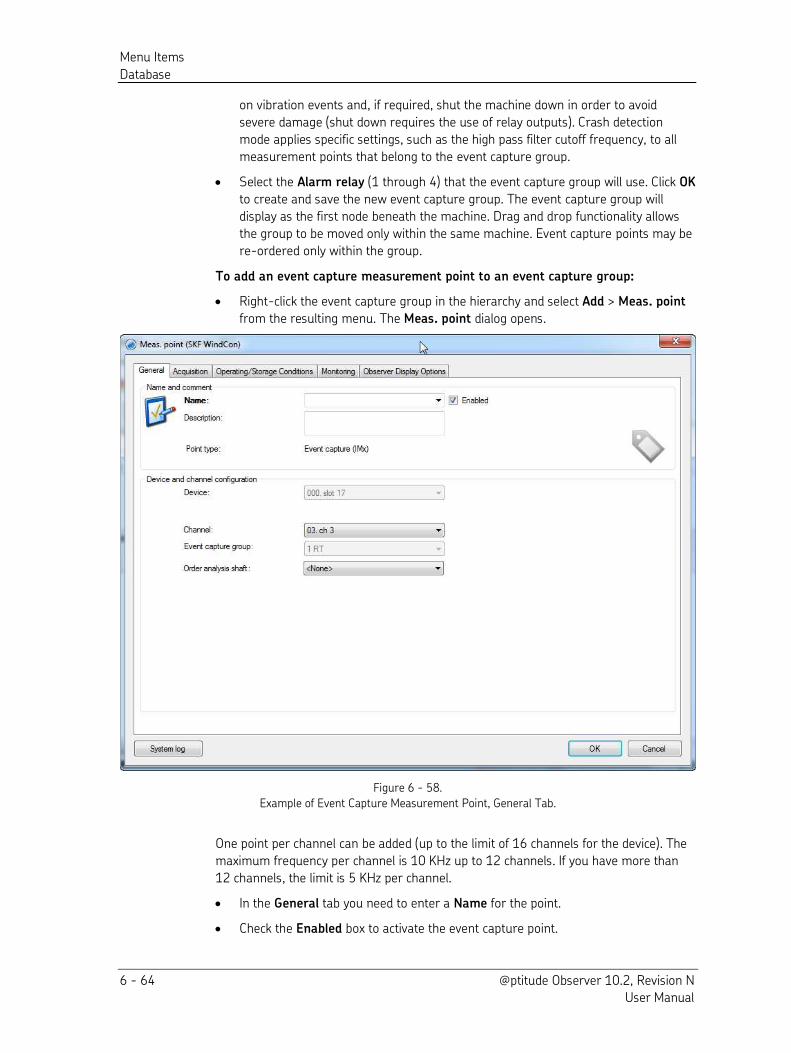
Menu Items
Database
6 - 64 @ptitude Observer 10.2, Revision N User Manual
on vibration events and, if required, shut the machine down in order to avoid
severe damage (shut down requires the use of relay outputs). Crash detection
mode applies specific settings, such as the high pass filter cutoff frequency, to all
measurement points that belong to the event capture group.
Select the Alarm relay (1 through 4) that the event capture group will use. Click OK
to create and save the new event capture group. The event capture group will
display as the first node beneath the machine. Drag and drop functionality allows
the group to be moved only within the same machine. Event capture points may be
re-ordered only within the group.
To add an event capture measurement point to an event capture group:
Right-click the event capture group in the hierarchy and select Add > Meas. point
from the resulting menu. The Meas. point dialog opens.
Figure 6 - 58.
Example of Event Capture Measurement Point, General Tab.
One point per channel can be added (up to the limit of 16 channels for the device). The
maximum frequency per channel is 10 KHz up to 12 channels. If you have more than
12 channels, the limit is 5 KHz per channel.
In the General tab you need to enter a Name for the point.
Check the Enabled box to activate the event capture point.
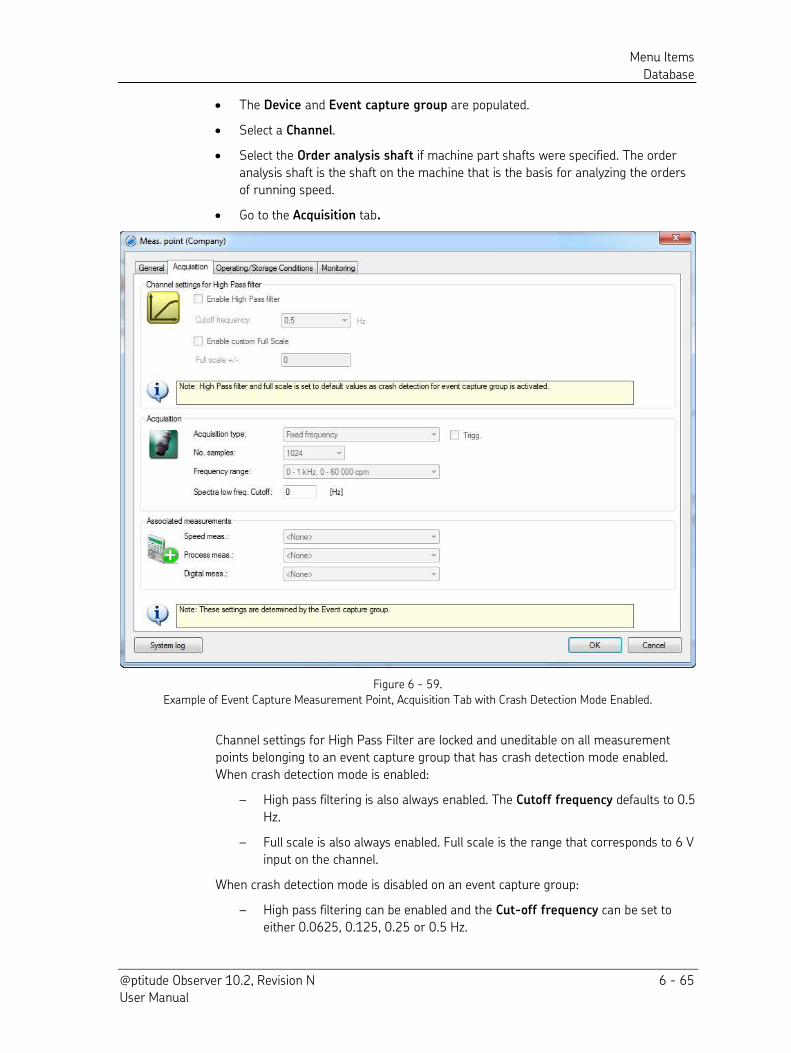
Menu Items
Database
@ptitude Observer 10.2, Revision N 6 - 65 User Manual
The Device and Event capture group are populated.
Select a Channel.
Select the Order analysis shaft if machine part shafts were specified. The order
analysis shaft is the shaft on the machine that is the basis for analyzing the orders
of running speed.
Go to the Acquisition tab.
Figure 6 - 59.
Example of Event Capture Measurement Point, Acquisition Tab with Crash Detection Mode Enabled.
Channel settings for High Pass Filter are locked and uneditable on all measurement
points belonging to an event capture group that has crash detection mode enabled.
When crash detection mode is enabled:
– High pass filtering is also always enabled. The Cutoff frequency defaults to 0.5
Hz.
– Full scale is also always enabled. Full scale is the range that corresponds to 6 V
input on the channel.
When crash detection mode is disabled on an event capture group:
– High pass filtering can be enabled and the Cut-off frequency can be set to
either 0.0625, 0.125, 0.25 or 0.5 Hz.
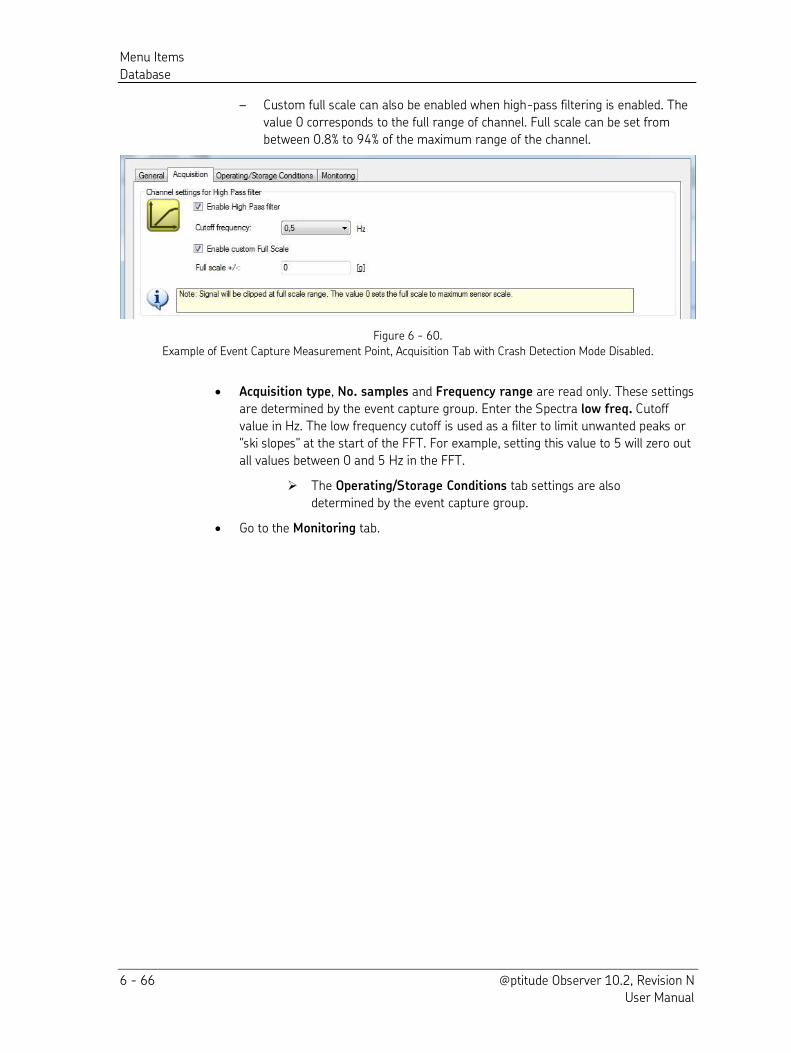
Menu Items
Database
6 - 66 @ptitude Observer 10.2, Revision N User Manual
– Custom full scale can also be enabled when high-pass filtering is enabled. The
value 0 corresponds to the full range of channel. Full scale can be set from
between 0.8% to 94% of the maximum range of the channel.
Figure 6 - 60.
Example of Event Capture Measurement Point, Acquisition Tab with Crash Detection Mode Disabled.
Acquisition type, No. samples and Frequency range are read only. These settings
are determined by the event capture group. Enter the Spectra low freq. Cutoff
value in Hz. The low frequency cutoff is used as a filter to limit unwanted peaks or
"ski slopes" at the start of the FFT. For example, setting this value to 5 will zero out
all values between 0 and 5 Hz in the FFT.
The Operating/Storage Conditions tab settings are also
determined by the event capture group.
Go to the Monitoring tab.
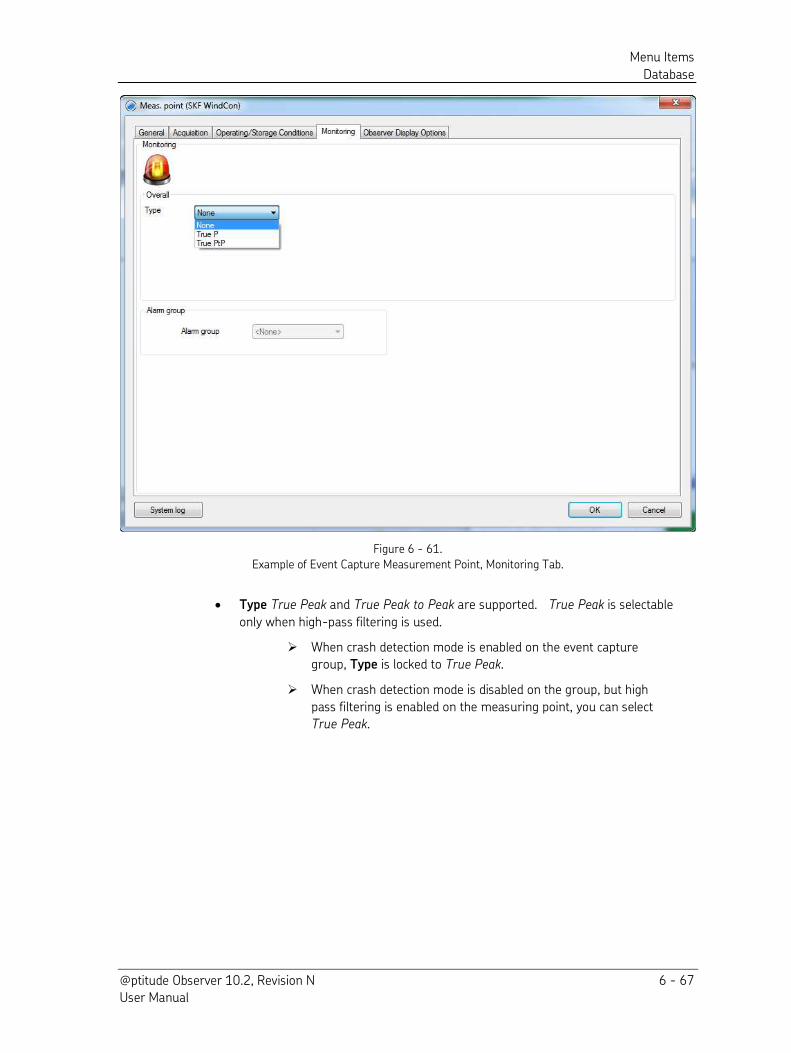
Menu Items
Database
@ptitude Observer 10.2, Revision N 6 - 67 User Manual
Figure 6 - 61.
Example of Event Capture Measurement Point, Monitoring Tab.
Type True Peak and True Peak to Peak are supported. True Peak is selectable
only when high-pass filtering is used.
When crash detection mode is enabled on the event capture group, Type is locked to True Peak.
When crash detection mode is disabled on the group, but high
pass filtering is enabled on the measuring point, you can select True Peak.
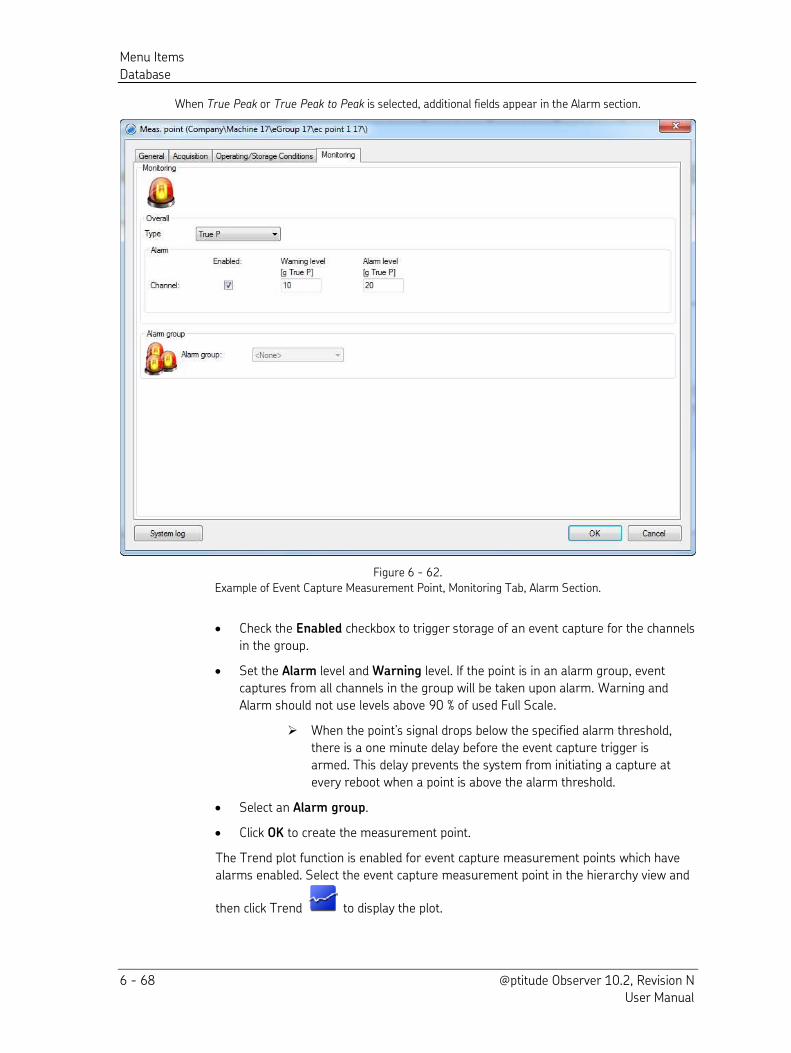
Menu Items
Database
6 - 68 @ptitude Observer 10.2, Revision N User Manual
When True Peak or True Peak to Peak is selected, additional fields appear in the Alarm section.
Figure 6 - 62.
Example of Event Capture Measurement Point, Monitoring Tab, Alarm Section.
Check the Enabled checkbox to trigger storage of an event capture for the channels
in the group.
Set the Alarm level and Warning level. If the point is in an alarm group, event
captures from all channels in the group will be taken upon alarm. Warning and
Alarm should not use levels above 90 % of used Full Scale.
When the point’s signal drops below the specified alarm threshold, there is a one minute delay before the event capture trigger is
armed. This delay prevents the system from initiating a capture at
every reboot when a point is above the alarm threshold.
Select an Alarm group.
Click OK to create the measurement point.
The Trend plot function is enabled for event capture measurement points which have
alarms enabled. Select the event capture measurement point in the hierarchy view and
then click Trend to display the plot.
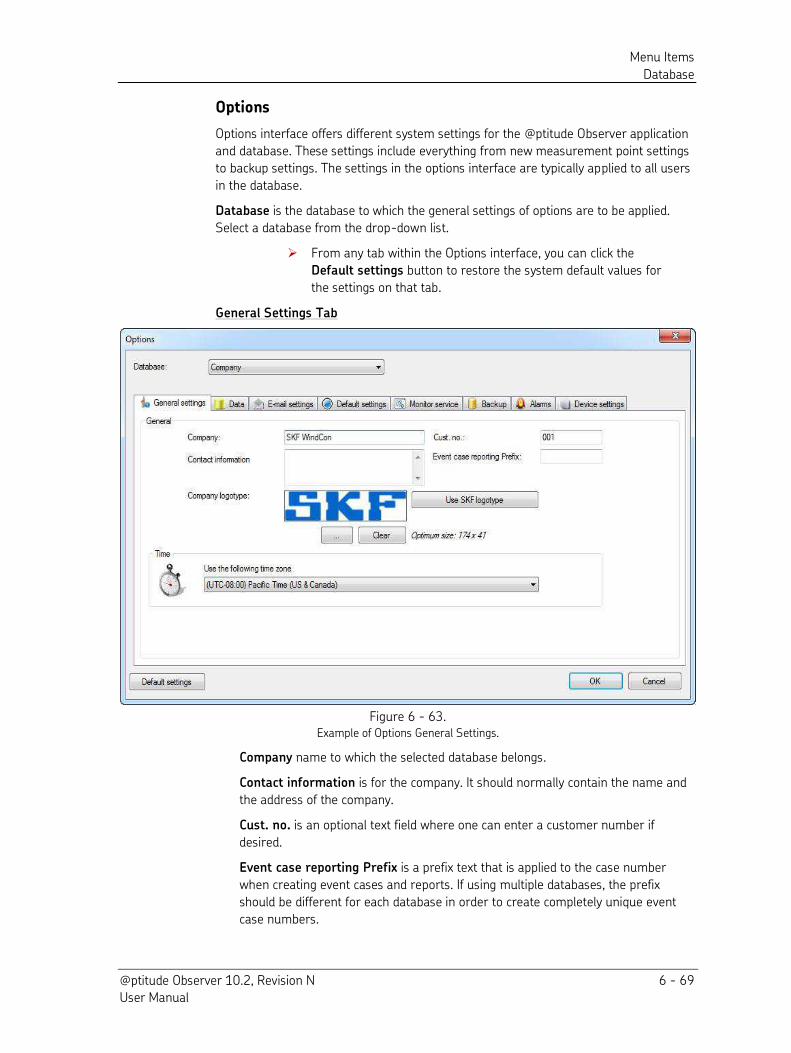
Menu Items
Database
@ptitude Observer 10.2, Revision N 6 - 69 User Manual
Options
Options interface offers different system settings for the @ptitude Observer application
and database. These settings include everything from new measurement point settings
to backup settings. The settings in the options interface are typically applied to all users
in the database.
Database is the database to which the general settings of options are to be applied.
Select a database from the drop-down list.
From any tab within the Options interface, you can click the
Default settings button to restore the system default values for
the settings on that tab.
General Settings Tab
Figure 6 - 63. Example of Options General Settings.
Company name to which the selected database belongs.
Contact information is for the company. It should normally contain the name and
the address of the company.
Cust. no. is an optional text field where one can enter a customer number if
desired.
Event case reporting Prefix is a prefix text that is applied to the case number
when creating event cases and reports. If using multiple databases, the prefix
should be different for each database in order to create completely unique event
case numbers.
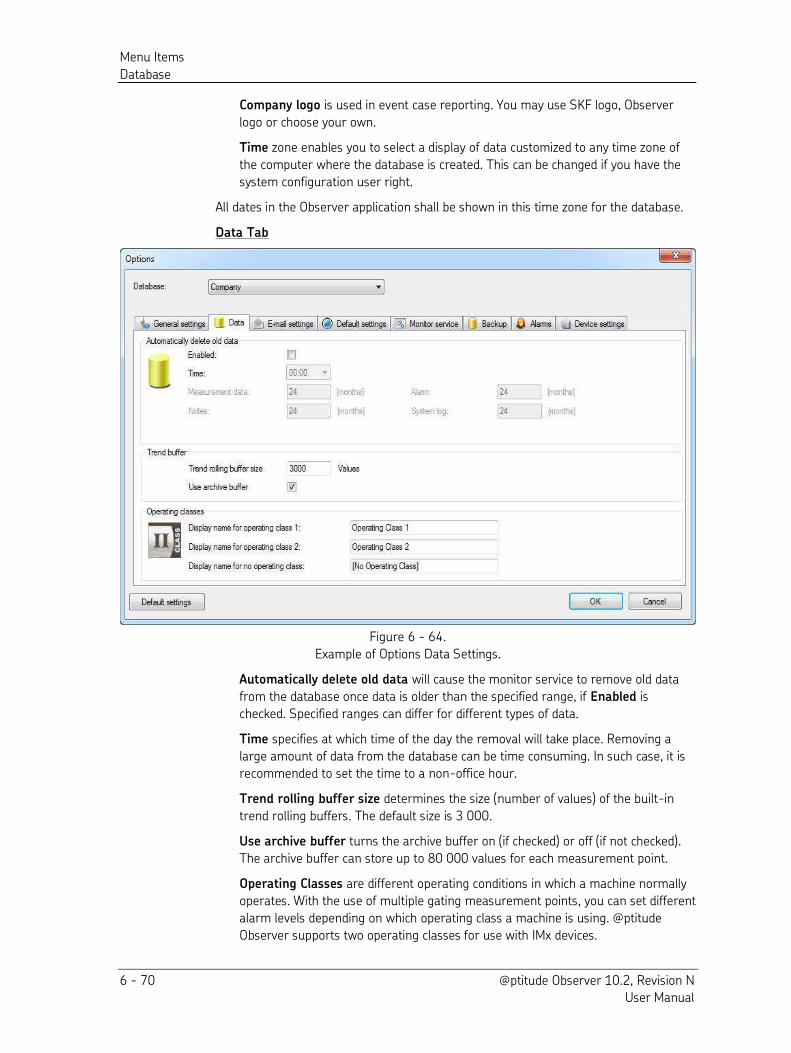
Menu Items
Database
6 - 70 @ptitude Observer 10.2, Revision N User Manual
Company logo is used in event case reporting. You may use SKF logo, Observer
logo or choose your own.
Time zone enables you to select a display of data customized to any time zone of
the computer where the database is created. This can be changed if you have the
system configuration user right.
All dates in the Observer application shall be shown in this time zone for the database.
Data Tab
Figure 6 - 64.
Example of Options Data Settings.
Automatically delete old data will cause the monitor service to remove old data
from the database once data is older than the specified range, if Enabled is
checked. Specified ranges can differ for different types of data.
Time specifies at which time of the day the removal will take place. Removing a
large amount of data from the database can be time consuming. In such case, it is
recommended to set the time to a non-office hour.
Trend rolling buffer size determines the size (number of values) of the built-in
trend rolling buffers. The default size is 3 000.
Use archive buffer turns the archive buffer on (if checked) or off (if not checked).
The archive buffer can store up to 80 000 values for each measurement point.
Operating Classes are different operating conditions in which a machine normally
operates. With the use of multiple gating measurement points, you can set different
alarm levels depending on which operating class a machine is using. @ptitude
Observer supports two operating classes for use with IMx devices.
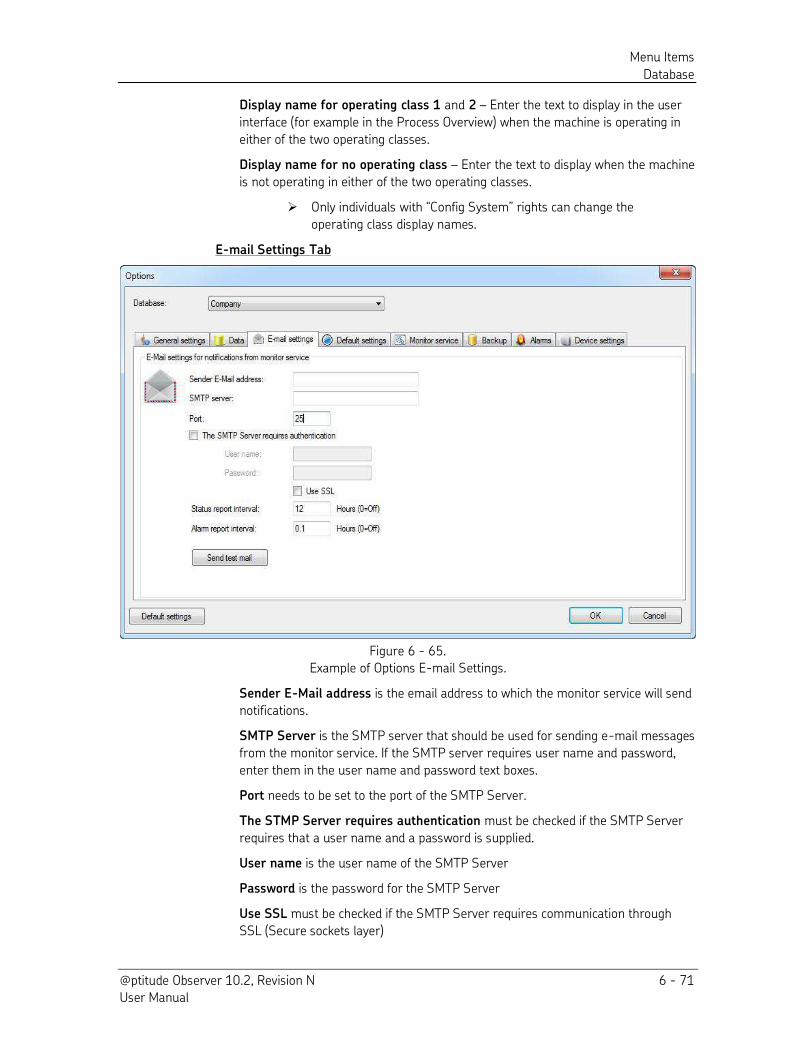
Menu Items
Database
@ptitude Observer 10.2, Revision N 6 - 71 User Manual
Display name for operating class 1 and 2 – Enter the text to display in the user
interface (for example in the Process Overview) when the machine is operating in
either of the two operating classes.
Display name for no operating class – Enter the text to display when the machine
is not operating in either of the two operating classes.
Only individuals with “Config System” rights can change the operating class display names.
E-mail Settings Tab
Figure 6 - 65. Example of Options E-mail Settings.
Sender E-Mail address is the email address to which the monitor service will send
notifications.
SMTP Server is the SMTP server that should be used for sending e-mail messages
from the monitor service. If the SMTP server requires user name and password,
enter them in the user name and password text boxes.
Port needs to be set to the port of the SMTP Server.
The STMP Server requires authentication must be checked if the SMTP Server
requires that a user name and a password is supplied.
User name is the user name of the SMTP Server
Password is the password for the SMTP Server
Use SSL must be checked if the SMTP Server requires communication through
SSL (Secure sockets layer)
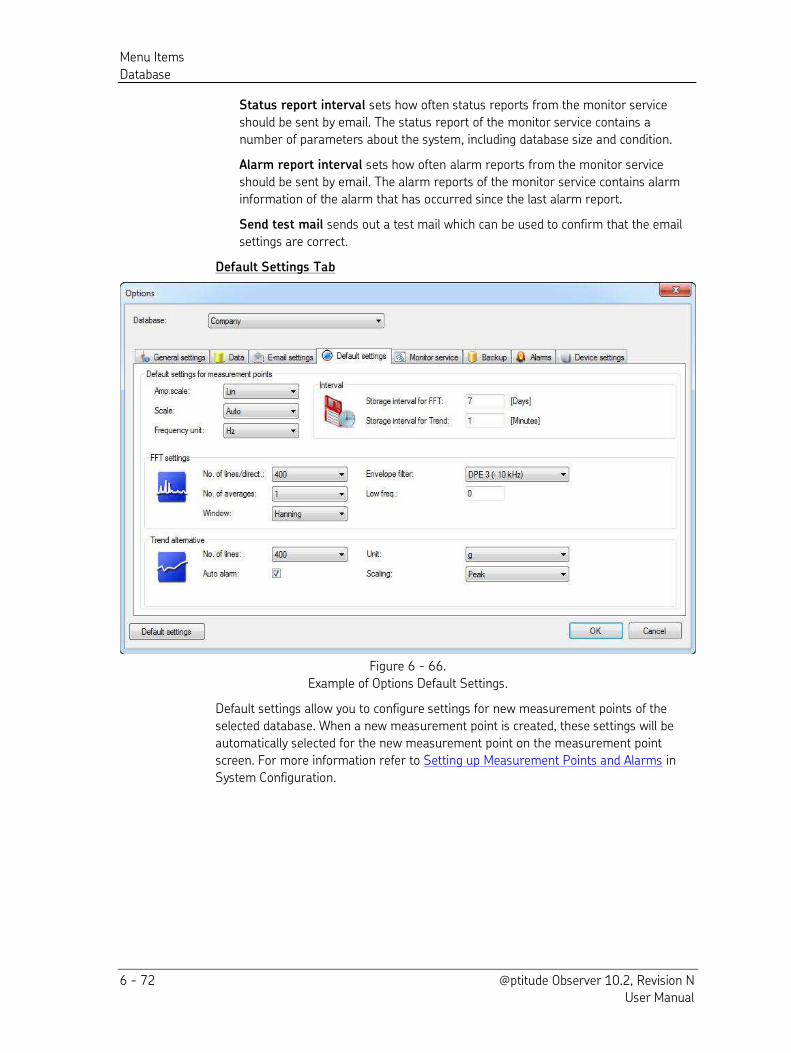
Menu Items
Database
6 - 72 @ptitude Observer 10.2, Revision N User Manual
Status report interval sets how often status reports from the monitor service
should be sent by email. The status report of the monitor service contains a
number of parameters about the system, including database size and condition.
Alarm report interval sets how often alarm reports from the monitor service
should be sent by email. The alarm reports of the monitor service contains alarm
information of the alarm that has occurred since the last alarm report.
Send test mail sends out a test mail which can be used to confirm that the email
settings are correct.
Default Settings Tab
Figure 6 - 66.
Example of Options Default Settings.
Default settings allow you to configure settings for new measurement points of the
selected database. When a new measurement point is created, these settings will be
automatically selected for the new measurement point on the measurement point
screen. For more information refer to Setting up Measurement Points and Alarms in
System Configuration.
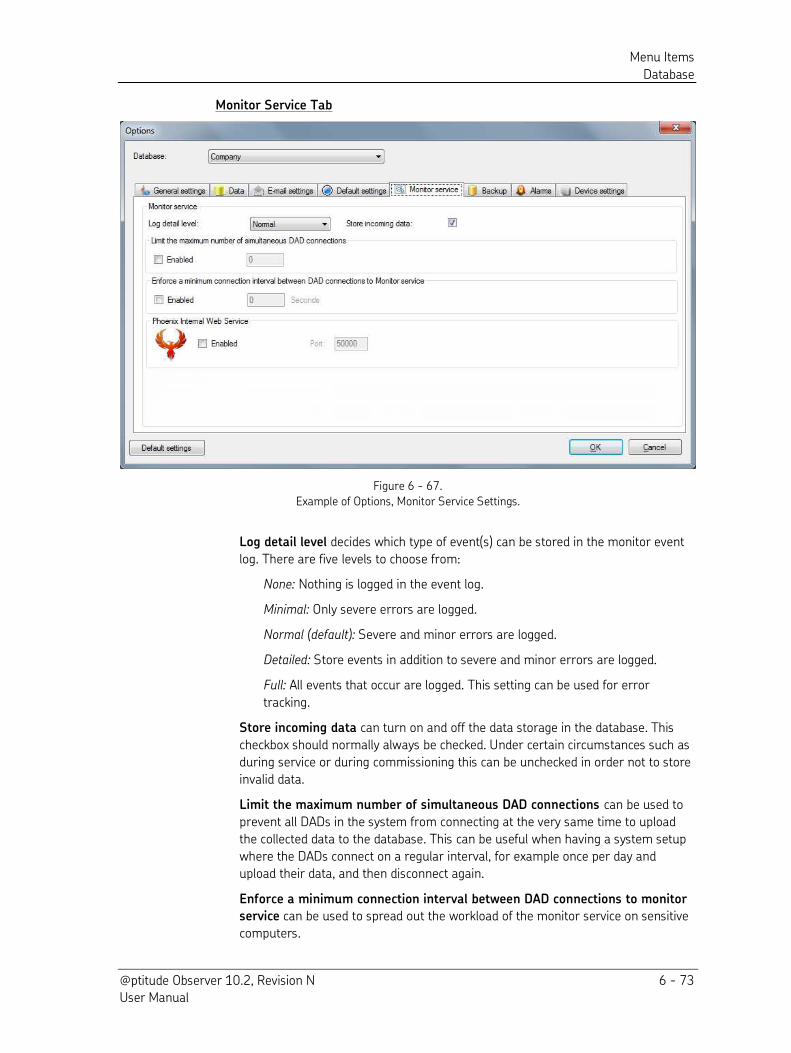
Menu Items
Database
@ptitude Observer 10.2, Revision N 6 - 73 User Manual
Monitor Service Tab
Figure 6 - 67.
Example of Options, Monitor Service Settings.
Log detail level decides which type of event(s) can be stored in the monitor event
log. There are five levels to choose from:
None: Nothing is logged in the event log.
Minimal: Only severe errors are logged.
Normal (default): Severe and minor errors are logged.
Detailed: Store events in addition to severe and minor errors are logged.
Full: All events that occur are logged. This setting can be used for error
tracking.
Store incoming data can turn on and off the data storage in the database. This
checkbox should normally always be checked. Under certain circumstances such as
during service or during commissioning this can be unchecked in order not to store
invalid data.
Limit the maximum number of simultaneous DAD connections can be used to
prevent all DADs in the system from connecting at the very same time to upload
the collected data to the database. This can be useful when having a system setup
where the DADs connect on a regular interval, for example once per day and
upload their data, and then disconnect again.
Enforce a minimum connection interval between DAD connections to monitor
service can be used to spread out the workload of the monitor service on sensitive
computers.
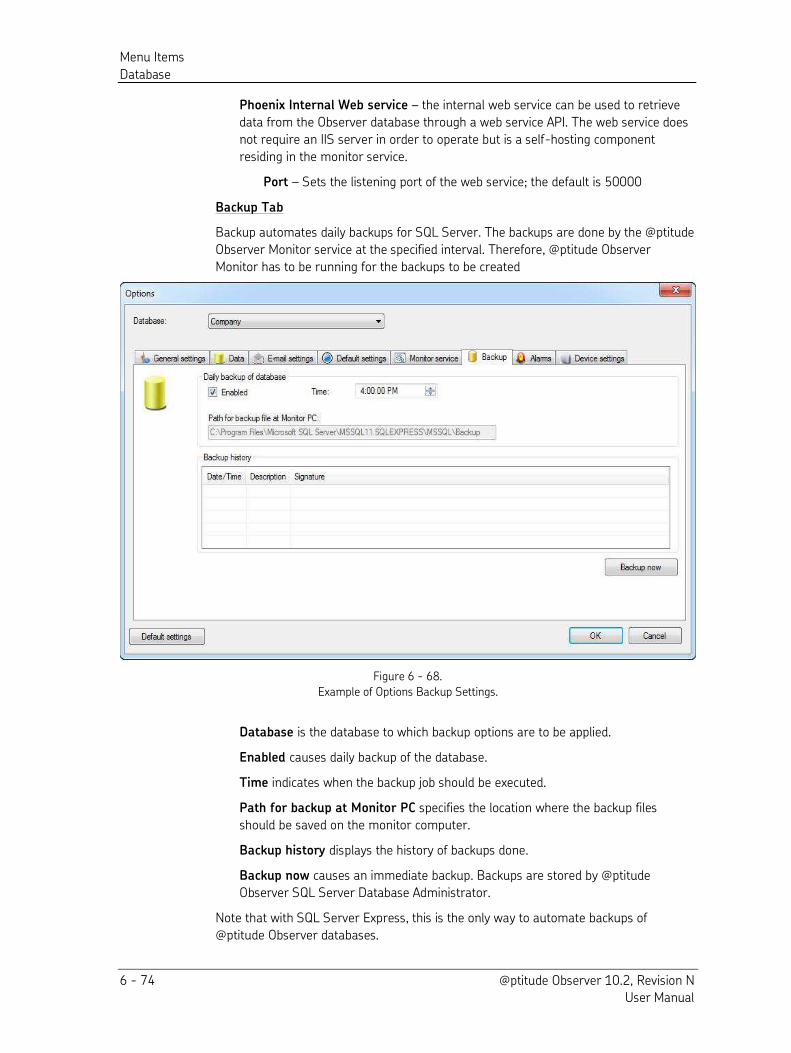
Menu Items
Database
6 - 74 @ptitude Observer 10.2, Revision N User Manual
Phoenix Internal Web service – the internal web service can be used to retrieve
data from the Observer database through a web service API. The web service does
not require an IIS server in order to operate but is a self-hosting component
residing in the monitor service.
Port – Sets the listening port of the web service; the default is 50000
Backup Tab
Backup automates daily backups for SQL Server. The backups are done by the @ptitude
Observer Monitor service at the specified interval. Therefore, @ptitude Observer
Monitor has to be running for the backups to be created
Figure 6 - 68.
Example of Options Backup Settings.
Database is the database to which backup options are to be applied.
Enabled causes daily backup of the database.
Time indicates when the backup job should be executed.
Path for backup at Monitor PC specifies the location where the backup files
should be saved on the monitor computer.
Backup history displays the history of backups done.
Backup now causes an immediate backup. Backups are stored by @ptitude
Observer SQL Server Database Administrator.
Note that with SQL Server Express, this is the only way to automate backups of
@ptitude Observer databases.
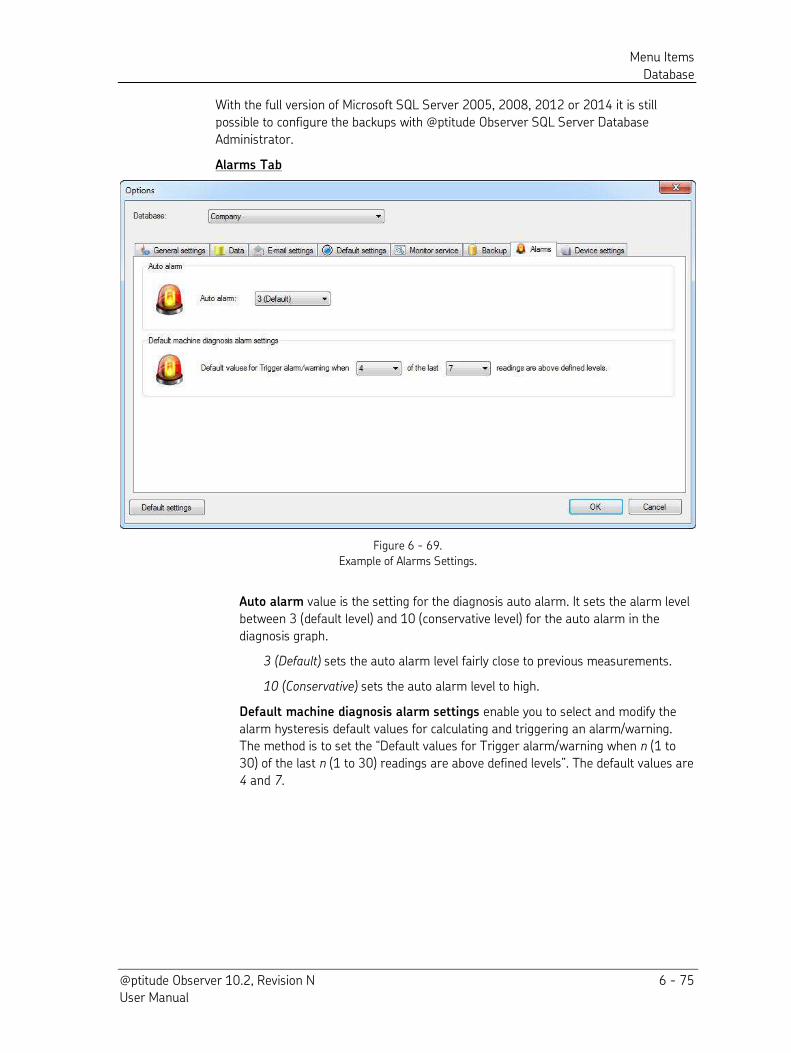
Menu Items
Database
@ptitude Observer 10.2, Revision N 6 - 75 User Manual
With the full version of Microsoft SQL Server 2005, 2008, 2012 or 2014 it is still
possible to configure the backups with @ptitude Observer SQL Server Database
Administrator.
Alarms Tab
Figure 6 - 69.
Example of Alarms Settings.
Auto alarm value is the setting for the diagnosis auto alarm. It sets the alarm level
between 3 (default level) and 10 (conservative level) for the auto alarm in the
diagnosis graph.
3 (Default) sets the auto alarm level fairly close to previous measurements.
10 (Conservative) sets the auto alarm level to high.
Default machine diagnosis alarm settings enable you to select and modify the
alarm hysteresis default values for calculating and triggering an alarm/warning. The method is to set the “Default values for Trigger alarm/warning when n (1 to
30) of the last n (1 to 30) readings are above defined levels”. The default values are
4 and 7.
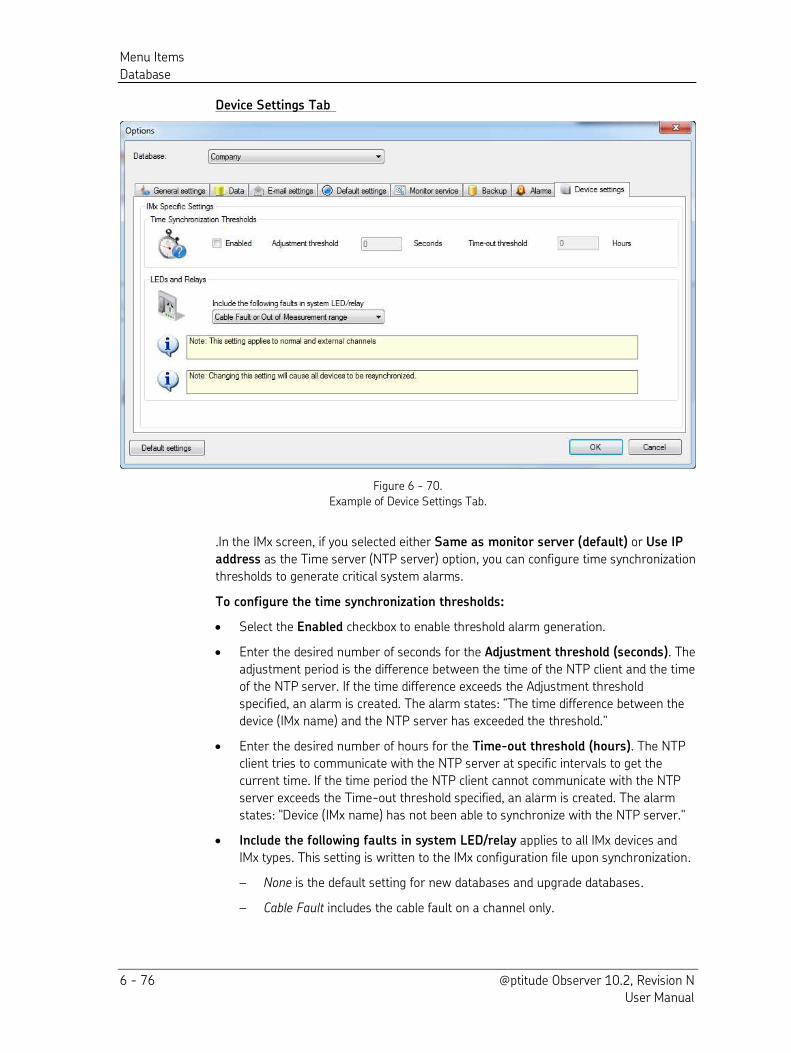
Menu Items
Database
6 - 76 @ptitude Observer 10.2, Revision N User Manual
Device Settings Tab
Figure 6 - 70.
Example of Device Settings Tab.
.In the IMx screen, if you selected either Same as monitor server (default) or Use IP
address as the Time server (NTP server) option, you can configure time synchronization
thresholds to generate critical system alarms.
To configure the time synchronization thresholds:
Select the Enabled checkbox to enable threshold alarm generation.
Enter the desired number of seconds for the Adjustment threshold (seconds). The
adjustment period is the difference between the time of the NTP client and the time
of the NTP server. If the time difference exceeds the Adjustment threshold
specified, an alarm is created. The alarm states: “The time difference between the device (IMx name) and the NTP server has exceeded the threshold."
Enter the desired number of hours for the Time-out threshold (hours). The NTP
client tries to communicate with the NTP server at specific intervals to get the
current time. If the time period the NTP client cannot communicate with the NTP
server exceeds the Time-out threshold specified, an alarm is created. The alarm
states: "Device (IMx name) has not been able to synchronize with the NTP server."
Include the following faults in system LED/relay applies to all IMx devices and
IMx types. This setting is written to the IMx configuration file upon synchronization.
– None is the default setting for new databases and upgrade databases.
– Cable Fault includes the cable fault on a channel only.
Menu Items
On-line
@ptitude Observer 10.2, Revision N 6 - 77 User Manual
– Cable fault or out of measurement range includes the cable fault on a channel
or a measurement point out of range in the system fault LED and Relay.
If this setting is changed, then all IMx devices in the database will
be synchronized automatically by the Monitor service.
Delete Data
Delete data interface allows you to delete measurement data based on certain criteria
or filter settings for the selected database.
Data Miner
The data miner interface is a statistical producing facility that allows for complex data
mining from the Observer database which can be shown in three different formats;
table, trend and bar.
This interface makes it possible to compare measurement points, machines or even
specific diagnosis between each other.
Expert users can also design their own statistical views and, if approved, the statistical
views can also be shared with other Observer users around the world through SKF
Online Repository (SKF OR).
In order to create your own statistical views you need to have a very good
understanding of the Observer database structure.
On-line
The On-line menu provides the following interfaces.
IMx/MasCon Devices
OPC servers
Monitor Service Viewer
Balancing
Event log
IMx/MasCon Devices
This interface brings up the IMx/MasCon devices screen. Refer to Creating IMx/MasCon
Devices and Channels in System Configuration.
OPC Servers
OPC Servers interface brings up the OPC Servers and channel settings screen. Refer to
Creating OPC Servers and Channels in System Configuration.
Monitor Service Viewer
The monitor service viewer can be used to view the interface of the monitor service
remotely from Observer. It is possible to view all events occurring in the service in
Menu Items
On-line
6 - 78 @ptitude Observer 10.2, Revision N User Manual
addition to the database status, DAD status, OPC status and number of clients currently
connected.
Balancing
On-line balancing is a tool for multiple plane balancing designed especially for turbines.
However, it is just as efficient to use on smaller machineries. The on-line balancing in
@ptitude Observer uses IMx, MasCon16/48 devices harmonic measurement points as
the data collector because of its supreme simultaneous measurement capability.
On-line balancing supports maximum of 15 planes over 5 states with up to 40
measurement points.
For a successful balancing, first the phase must be stable, and it should be possible to
make changes on the actual speed range under run-up/down group. Polar plot can be
used to determine if the phase is stable. If the phase is not stable, the problem is not
only unbalance but also can be something else. Therefore, in such case further normal
analysis of the machine is required. On a horizontal machine with laying shafts, the best
balancing direction is the weakest direction.
In order to have an accurate balancing analysis of a machine, it should be certain that
the problem lies within the unbalance characteristics. The following are some of the
examples of unbalance characteristics.
Bearing problems
Bearing slip
Misalignment
Weak foundation
Balancing interface has the following functions.
Balance
ICM (influence coefficient matrix)
Balance
Follow the steps described below in order to have an accurate balancing analysis of a
machine.
Step 1: Choose an ICM (influence coefficient matrix) of the selected database you would
like to use. ICMs are created via ICM interface.
The list of ICMs are shown by names and dates created. ICM contains the necessary
information about the machines behavior needed to eliminate unbalance which is stored
in the database for new on-line balancing in the future.
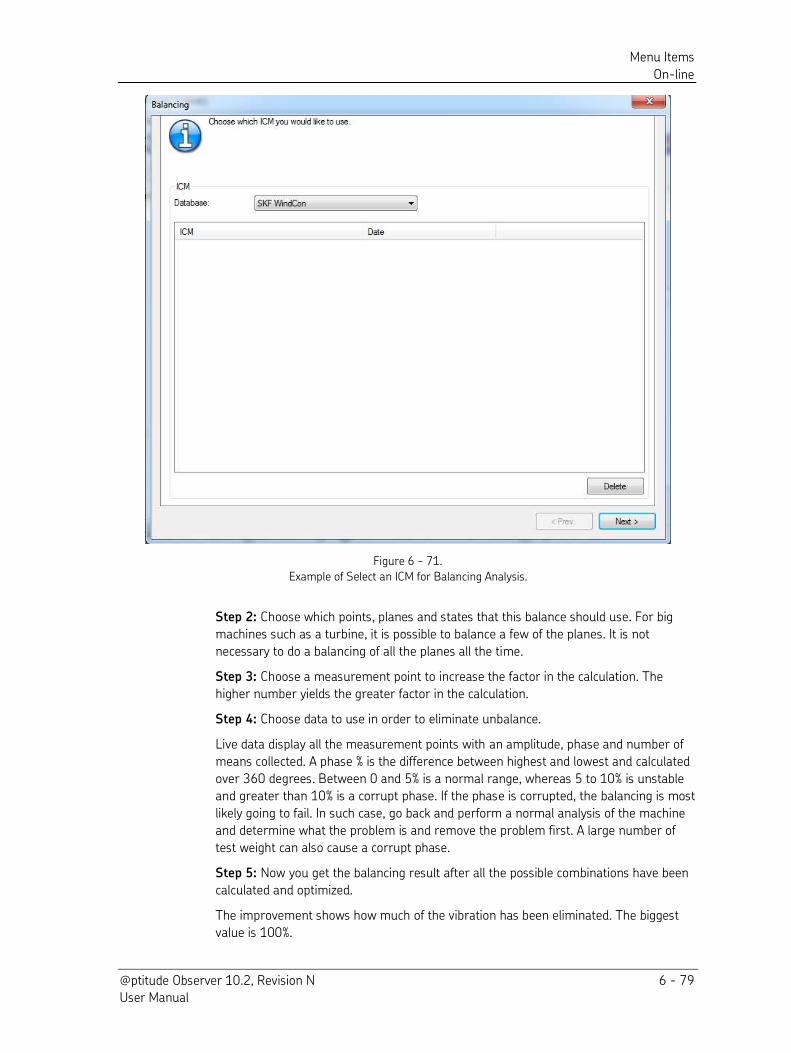
Menu Items
On-line
@ptitude Observer 10.2, Revision N 6 - 79 User Manual
Figure 6 - 71.
Example of Select an ICM for Balancing Analysis.
Step 2: Choose which points, planes and states that this balance should use. For big
machines such as a turbine, it is possible to balance a few of the planes. It is not
necessary to do a balancing of all the planes all the time.
Step 3: Choose a measurement point to increase the factor in the calculation. The
higher number yields the greater factor in the calculation.
Step 4: Choose data to use in order to eliminate unbalance.
Live data display all the measurement points with an amplitude, phase and number of
means collected. A phase % is the difference between highest and lowest and calculated
over 360 degrees. Between 0 and 5% is a normal range, whereas 5 to 10% is unstable
and greater than 10% is a corrupt phase. If the phase is corrupted, the balancing is most
likely going to fail. In such case, go back and perform a normal analysis of the machine
and determine what the problem is and remove the problem first. A large number of
test weight can also cause a corrupt phase.
Step 5: Now you get the balancing result after all the possible combinations have been
calculated and optimized.
The improvement shows how much of the vibration has been eliminated. The biggest
value is 100%.
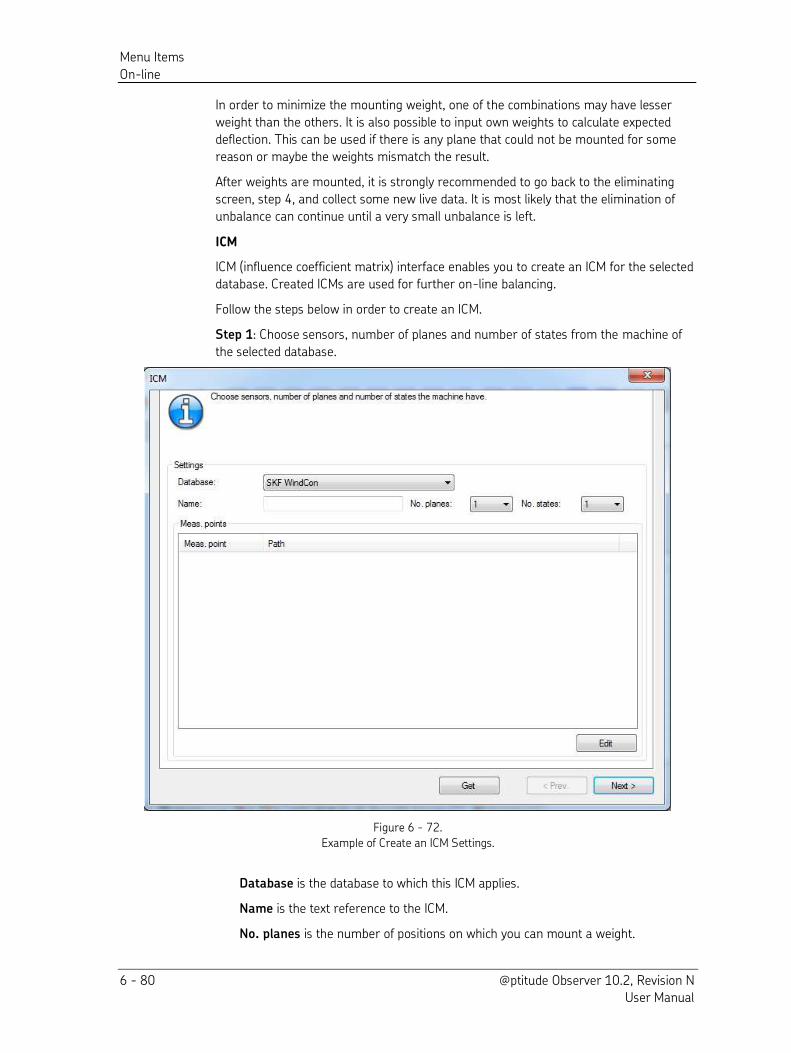
Menu Items
On-line
6 - 80 @ptitude Observer 10.2, Revision N User Manual
In order to minimize the mounting weight, one of the combinations may have lesser
weight than the others. It is also possible to input own weights to calculate expected
deflection. This can be used if there is any plane that could not be mounted for some
reason or maybe the weights mismatch the result.
After weights are mounted, it is strongly recommended to go back to the eliminating
screen, step 4, and collect some new live data. It is most likely that the elimination of
unbalance can continue until a very small unbalance is left.
ICM
ICM (influence coefficient matrix) interface enables you to create an ICM for the selected
database. Created ICMs are used for further on-line balancing.
Follow the steps below in order to create an ICM.
Step 1: Choose sensors, number of planes and number of states from the machine of
the selected database.
Figure 6 - 72.
Example of Create an ICM Settings.
Database is the database to which this ICM applies.
Name is the text reference to the ICM.
No. planes is the number of positions on which you can mount a weight.
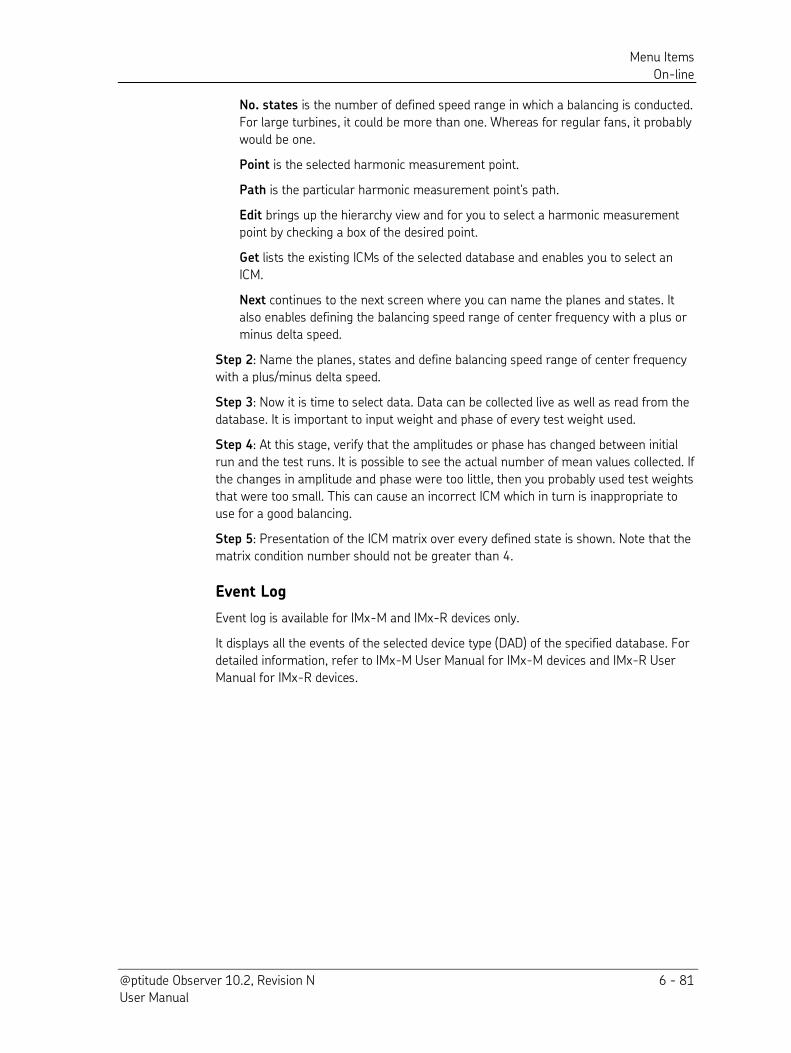
Menu Items
On-line
@ptitude Observer 10.2, Revision N 6 - 81 User Manual
No. states is the number of defined speed range in which a balancing is conducted.
For large turbines, it could be more than one. Whereas for regular fans, it probably
would be one.
Point is the selected harmonic measurement point.
Path is the particular harmonic measurement point's path.
Edit brings up the hierarchy view and for you to select a harmonic measurement
point by checking a box of the desired point.
Get lists the existing ICMs of the selected database and enables you to select an
ICM.
Next continues to the next screen where you can name the planes and states. It
also enables defining the balancing speed range of center frequency with a plus or
minus delta speed.
Step 2: Name the planes, states and define balancing speed range of center frequency
with a plus/minus delta speed.
Step 3: Now it is time to select data. Data can be collected live as well as read from the
database. It is important to input weight and phase of every test weight used.
Step 4: At this stage, verify that the amplitudes or phase has changed between initial
run and the test runs. It is possible to see the actual number of mean values collected. If
the changes in amplitude and phase were too little, then you probably used test weights
that were too small. This can cause an incorrect ICM which in turn is inappropriate to
use for a good balancing.
Step 5: Presentation of the ICM matrix over every defined state is shown. Note that the
matrix condition number should not be greater than 4.
Event Log
Event log is available for IMx-M and IMx-R devices only.
It displays all the events of the selected device type (DAD) of the specified database. For
detailed information, refer to IMx-M User Manual for IMx-M devices and IMx-R User
Manual for IMx-R devices.
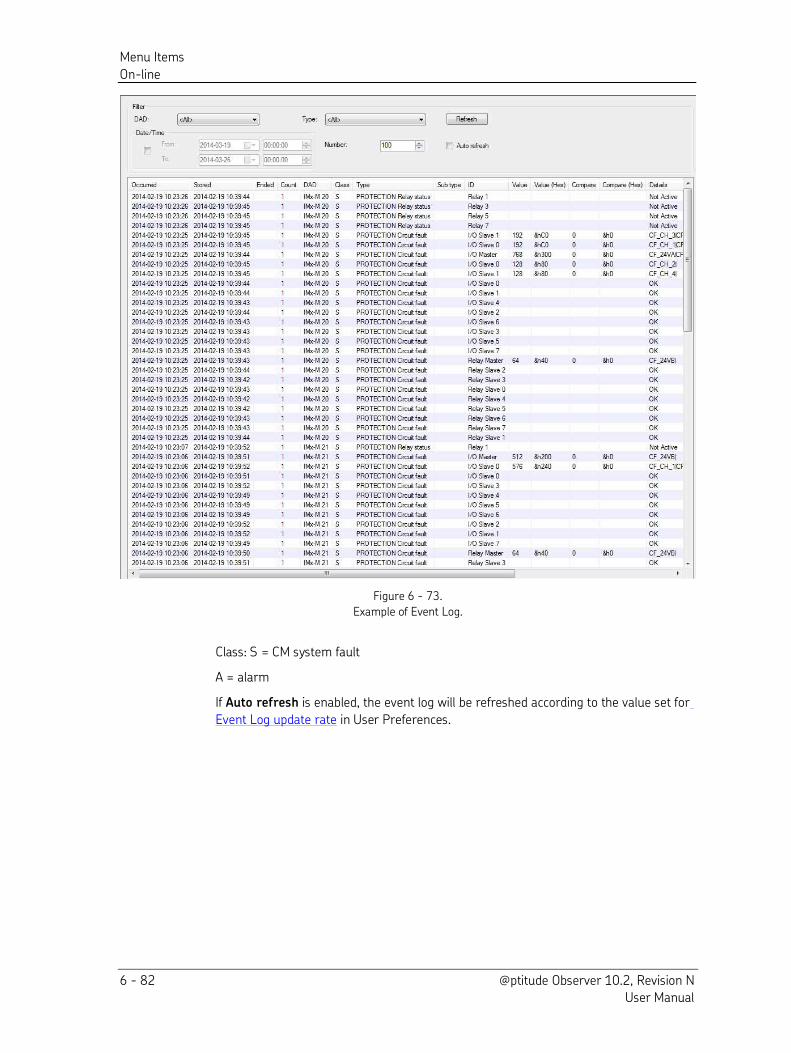
Menu Items
On-line
6 - 82 @ptitude Observer 10.2, Revision N User Manual
Figure 6 - 73.
Example of Event Log.
Class: S = CM system fault
A = alarm
If Auto refresh is enabled, the event log will be refreshed according to the value set for
Event Log update rate in User Preferences.
Menu Items
Portables
@ptitude Observer 10.2, Revision N 6 - 83 User Manual
Portables
Portables menu provides the following interfaces.
Microlog Analyzer
Coded notes
Microlog Analyzer
Interface for Microlog Analyzer consists of four different settings where users can
execute different actions. Upon opening Microlog Analyzer screen, @ptitude Observer
automatically tries to get the status of the connected Microlog Analyzer.
Status
The status setting shows information retrieved from the Microlog Analyzer, such as
firmware version, current date/time, total number of points stored currently, total
amount of free memory, temperature inside the device and battery voltage.
Status retrieves the status from the connected Microlog Analyzer.
Clear removes all routes and data from the memory of the connected Microlog
Analyzer.
Reset deletes all the data from the existing routes on the connected Microlog
Analyzer. For Microlog Analyzer USB communication only, the clock is set to the PC
internal clock.
Download
Figure 6 - 74.
Example of @ptitude Observer Download Routes to Microlog Analyzer.
The download setting is used to download routes to the Microlog Analyzer. It is possible
to download a section of the hierarchy as a route or a workspace as a route.

Menu Items
Portables
6 - 84 @ptitude Observer 10.2, Revision N User Manual
Hierarchy name specifies a custom name for the route that will be assigned when
the selected portion of the hierarchy is downloaded to the Microlog Analyzer. It is
available for the hierarchy setting only.
Print prints the selected hierarchy or workspace as a route list.
Download starts the download of the Microlog Analyzer.
Upload
The upload setting is used to transfer the data collected by Microlog Analyzer and save
the data in the @ptitude Observer database.
Non route enables you to upload data that are not route-based. Non-route is also
known as brute force.
Upload measurement history uploads the history of measurement points for USB
communication only.
Reset deletes all data on the specified route, but keeps the route information so the
route can be measured again.
Remove deletes the specified route and all data on the route. In order to measure
the route again, the route has to be downloaded again to the Microlog Analyzer.
Upload uploads the selected route and stored the data in the @ptitude Observer
database.
Communication
The communication setting is used to change the settings as how to communicate with
the Microlog Analyzer. These settings will be saved until the next time you open the
communication settings.
Type can be USB or Serial.
Port is required for the serial type only. It specifies which port to use for serial
communication.
Baud rate is also required for the serial type only. It specifies which speed to use
for serial communication. The default is 115200.
Coded Notes
Coded notes interface enables you to configure the coded notes that should be sent to
the Microlog Analyzer device when downloading routes. A coded note is a
pre-configured comment to apply to a certain measurement.
Menu Items
Window
@ptitude Observer 10.2, Revision N 6 - 85 User Manual
Window
Window menu item provides the following interfaces.
Cascade
Tile Vertically
Tile Horizontally
Close all
Cascade
Cascade interface organizes all opened windows in a cascade.
Tile Vertically
Tile vertically interface arranges all opened windows vertically.
Tile Horizontally
Tile Horizontally interface arranges all opened windows horizontally.
Close All
Close closes all the opened windows.
Help
Help menu provides the following interfaces.
Contents (F1)
Search
Enter new license key
News in Observer
SKF Online Repository
SKF CMC Homepage
SKF Reliability Forum
About
Contents
Contents interface opens up the help file for @ptitude Observer.
Search
Search interface opens up the @ptitude Observer help file in search mode.
Menu Items
Help
6 - 86 @ptitude Observer 10.2, Revision N User Manual
Enter New License Key
A new license key is required if a new upgrade to the @ptitude Observer service suite
has been purchased. The software has to be restarted after the registration. Refer to
Getting Started.
News in Observer
News in Observer contains information on the new features in the currently released
version.
SKF Online Repository
Through the SKF Online Repository (SKF OR) it is possible to share application logic and
system design with other @ptitude Observer users.
Currently it is possible to share bearing information, machine templates, data miner
views and custom diagnosis rules.
When adding a new bearing to the system, it is possible to share this bearing
information to other observer users. After the submission has been approved, other
users will automatically receive a notification the next time they start their @ptitude
Observer system that a new bearing is available and they can choose to automatically
install in their bearing database.
The same logic applies to machine templates, data miner views and custom diagnosis
rules.
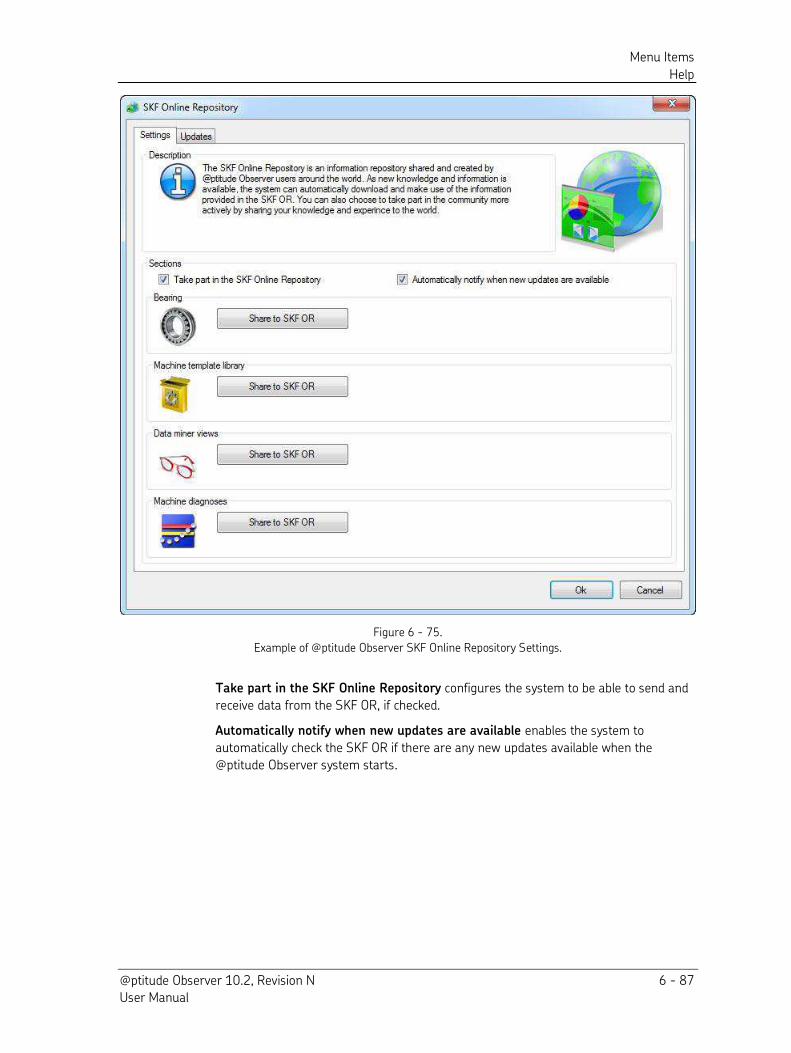
Menu Items
Help
@ptitude Observer 10.2, Revision N 6 - 87 User Manual
Figure 6 - 75.
Example of @ptitude Observer SKF Online Repository Settings.
Take part in the SKF Online Repository configures the system to be able to send and
receive data from the SKF OR, if checked.
Automatically notify when new updates are available enables the system to
automatically check the SKF OR if there are any new updates available when the
@ptitude Observer system starts.
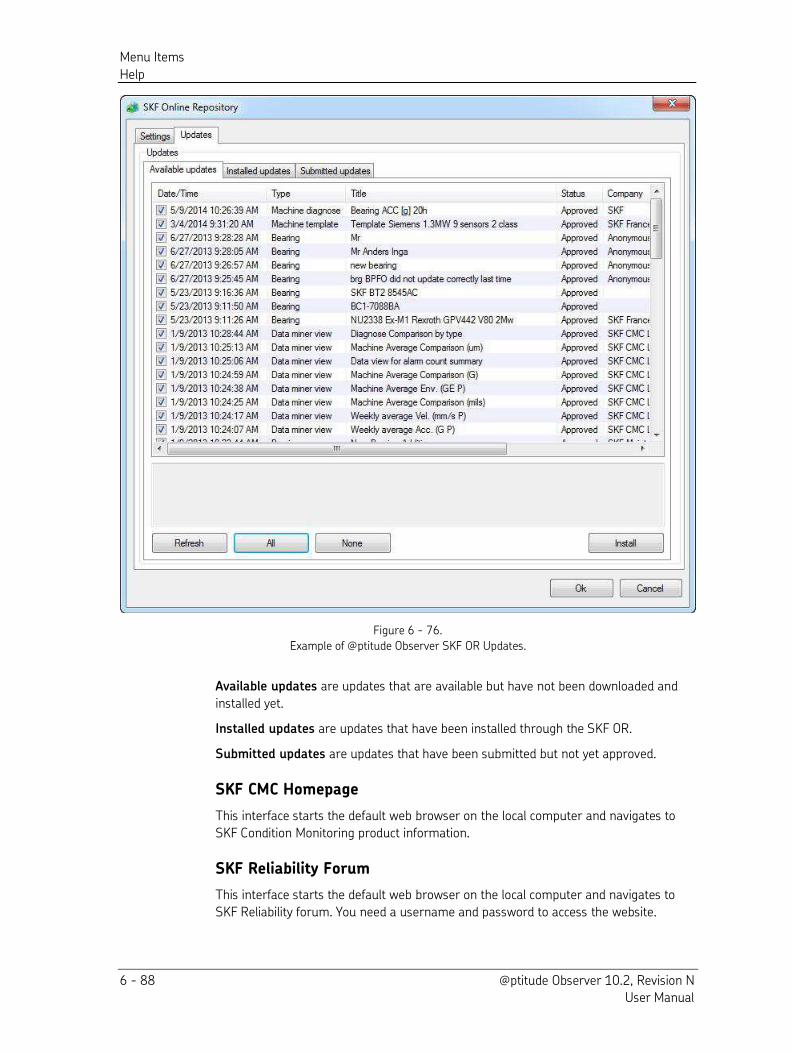
Menu Items
Help
6 - 88 @ptitude Observer 10.2, Revision N User Manual
Figure 6 - 76.
Example of @ptitude Observer SKF OR Updates.
Available updates are updates that are available but have not been downloaded and
installed yet.
Installed updates are updates that have been installed through the SKF OR.
Submitted updates are updates that have been submitted but not yet approved.
SKF CMC Homepage
This interface starts the default web browser on the local computer and navigates to
SKF Condition Monitoring product information.
SKF Reliability Forum
This interface starts the default web browser on the local computer and navigates to
SKF Reliability forum. You need a username and password to access the website.
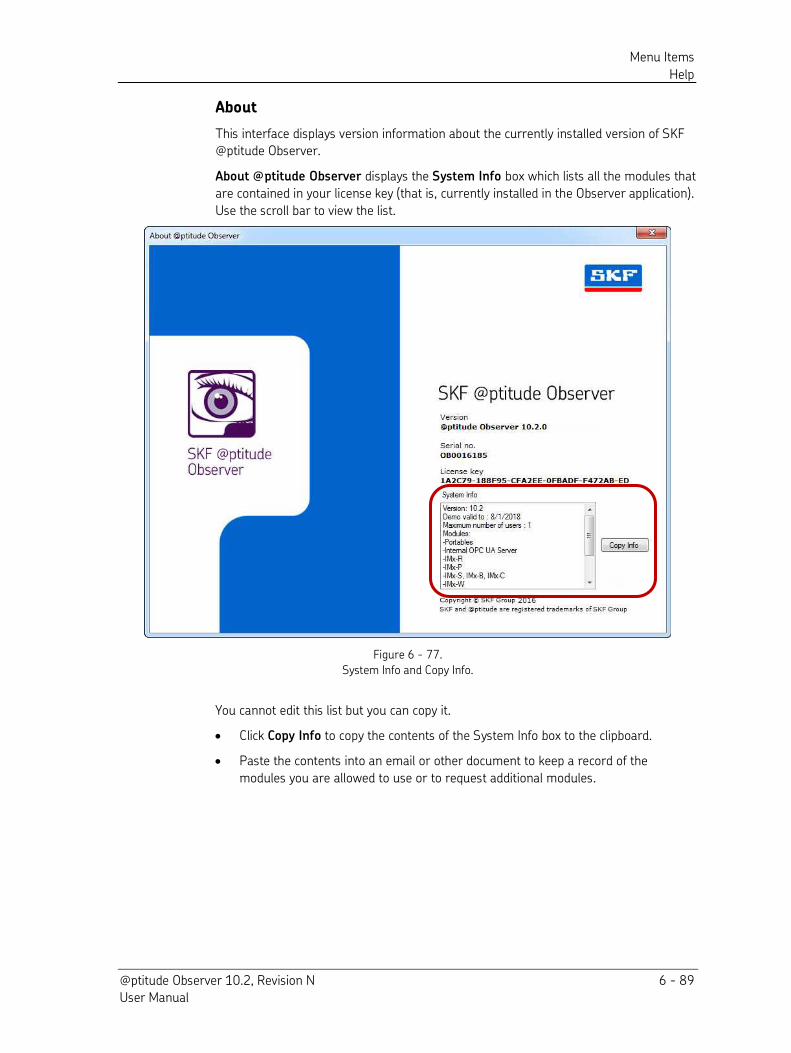
Menu Items
Help
@ptitude Observer 10.2, Revision N 6 - 89 User Manual
About
This interface displays version information about the currently installed version of SKF @ptitude Observer.
About @ptitude Observer displays the System Info box which lists all the modules that
are contained in your license key (that is, currently installed in the Observer application).
Use the scroll bar to view the list.
Figure 6 - 77.
System Info and Copy Info.
You cannot edit this list but you can copy it.
Click Copy Info to copy the contents of the System Info box to the clipboard.
Paste the contents into an email or other document to keep a record of the
modules you are allowed to use or to request additional modules.

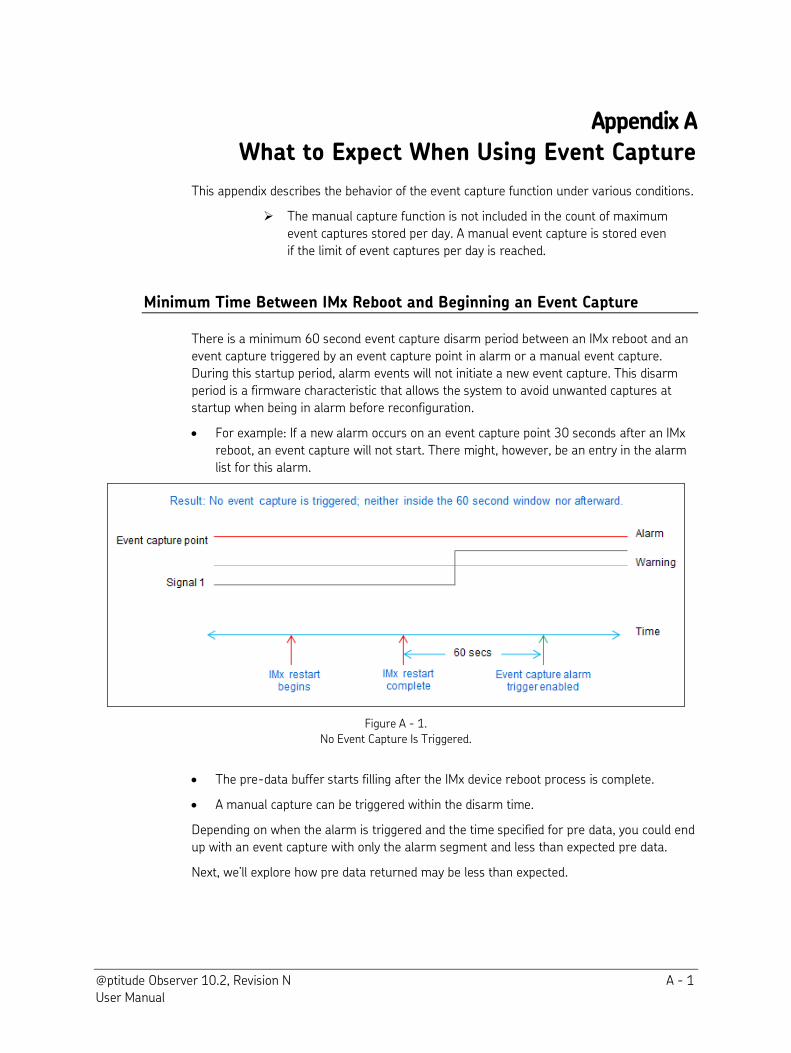
@ptitude Observer 10.2, Revision N A - 1 User Manual
Appendix A
What to Expect When Using Event Capture
This appendix describes the behavior of the event capture function under various conditions.
The manual capture function is not included in the count of maximum
event captures stored per day. A manual event capture is stored even
if the limit of event captures per day is reached.
Minimum Time Between IMx Reboot and Beginning an Event Capture
There is a minimum 60 second event capture disarm period between an IMx reboot and an
event capture triggered by an event capture point in alarm or a manual event capture.
During this startup period, alarm events will not initiate a new event capture. This disarm
period is a firmware characteristic that allows the system to avoid unwanted captures at
startup when being in alarm before reconfiguration.
For example: If a new alarm occurs on an event capture point 30 seconds after an IMx
reboot, an event capture will not start. There might, however, be an entry in the alarm
list for this alarm.
Figure A - 1.
No Event Capture Is Triggered.
The pre-data buffer starts filling after the IMx device reboot process is complete.
A manual capture can be triggered within the disarm time.
Depending on when the alarm is triggered and the time specified for pre data, you could end
up with an event capture with only the alarm segment and less than expected pre data.
Next, we’ll explore how pre data returned may be less than expected.
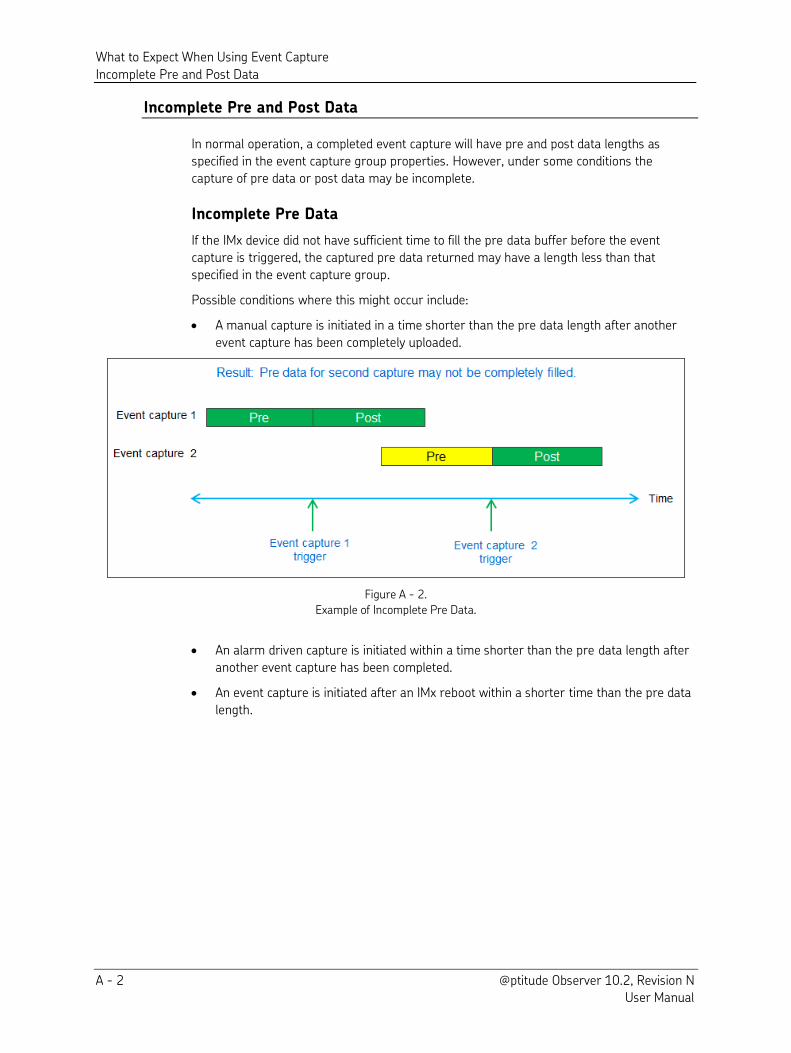
What to Expect When Using Event Capture
Incomplete Pre and Post Data
A - 2 @ptitude Observer 10.2, Revision N User Manual
Incomplete Pre and Post Data
In normal operation, a completed event capture will have pre and post data lengths as
specified in the event capture group properties. However, under some conditions the
capture of pre data or post data may be incomplete.
Incomplete Pre Data
If the IMx device did not have sufficient time to fill the pre data buffer before the event
capture is triggered, the captured pre data returned may have a length less than that
specified in the event capture group.
Possible conditions where this might occur include:
A manual capture is initiated in a time shorter than the pre data length after another
event capture has been completely uploaded.
Figure A - 2.
Example of Incomplete Pre Data.
An alarm driven capture is initiated within a time shorter than the pre data length after
another event capture has been completed.
An event capture is initiated after an IMx reboot within a shorter time than the pre data
length.
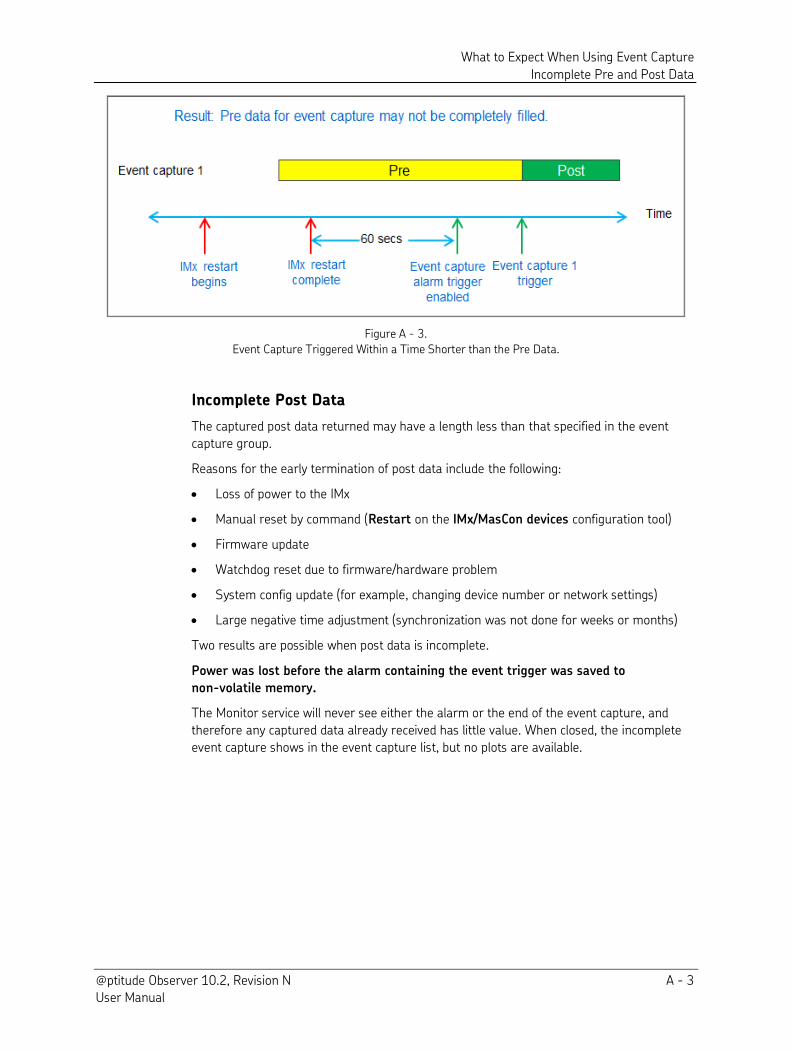
What to Expect When Using Event Capture
Incomplete Pre and Post Data
@ptitude Observer 10.2, Revision N A - 3 User Manual
Figure A - 3.
Event Capture Triggered Within a Time Shorter than the Pre Data.
Incomplete Post Data
The captured post data returned may have a length less than that specified in the event
capture group.
Reasons for the early termination of post data include the following:
Loss of power to the IMx
Manual reset by command (Restart on the IMx/MasCon devices configuration tool)
Firmware update
Watchdog reset due to firmware/hardware problem
System config update (for example, changing device number or network settings)
Large negative time adjustment (synchronization was not done for weeks or months)
Two results are possible when post data is incomplete.
Power was lost before the alarm containing the event trigger was saved to
non-volatile memory.
The Monitor service will never see either the alarm or the end of the event capture, and
therefore any captured data already received has little value. When closed, the incomplete
event capture shows in the event capture list, but no plots are available.
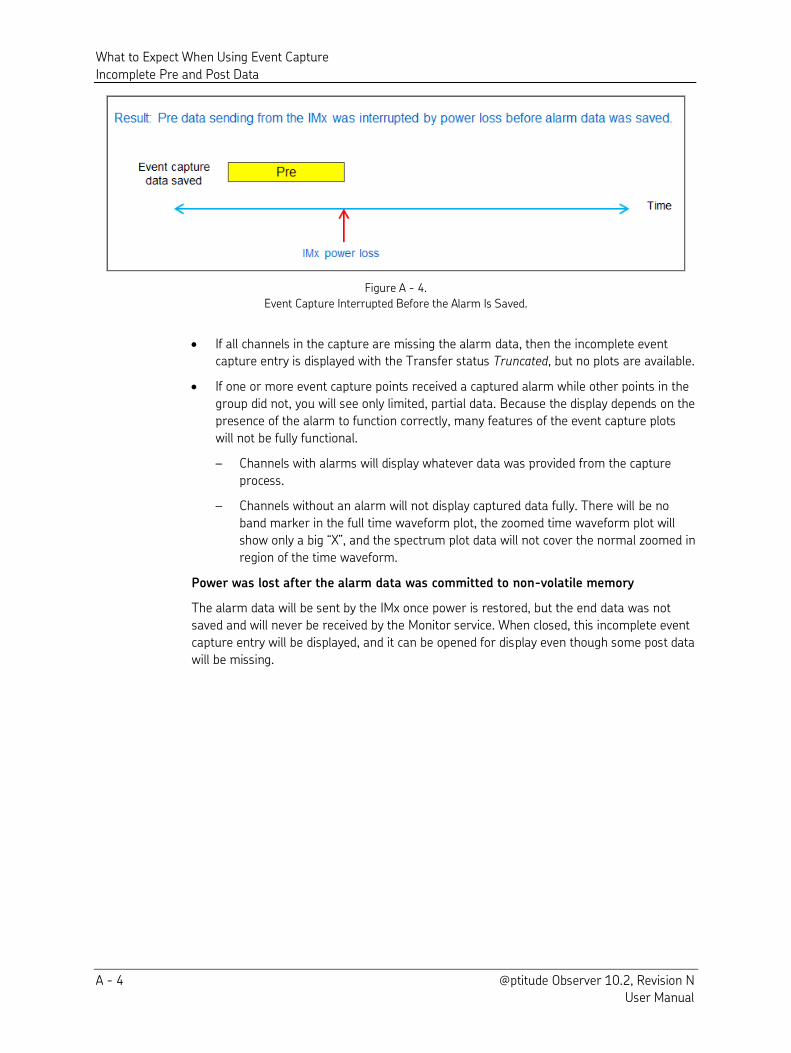
What to Expect When Using Event Capture
Incomplete Pre and Post Data
A - 4 @ptitude Observer 10.2, Revision N User Manual
Figure A - 4.
Event Capture Interrupted Before the Alarm Is Saved.
If all channels in the capture are missing the alarm data, then the incomplete event capture entry is displayed with the Transfer status Truncated, but no plots are available.
If one or more event capture points received a captured alarm while other points in the
group did not, you will see only limited, partial data. Because the display depends on the
presence of the alarm to function correctly, many features of the event capture plots
will not be fully functional.
– Channels with alarms will display whatever data was provided from the capture
process.
– Channels without an alarm will not display captured data fully. There will be no
band marker in the full time waveform plot, the zoomed time waveform plot will
show only a big “X”, and the spectrum plot data will not cover the normal zoomed in region of the time waveform.
Power was lost after the alarm data was committed to non-volatile memory
The alarm data will be sent by the IMx once power is restored, but the end data was not
saved and will never be received by the Monitor service. When closed, this incomplete event
capture entry will be displayed, and it can be opened for display even though some post data
will be missing.
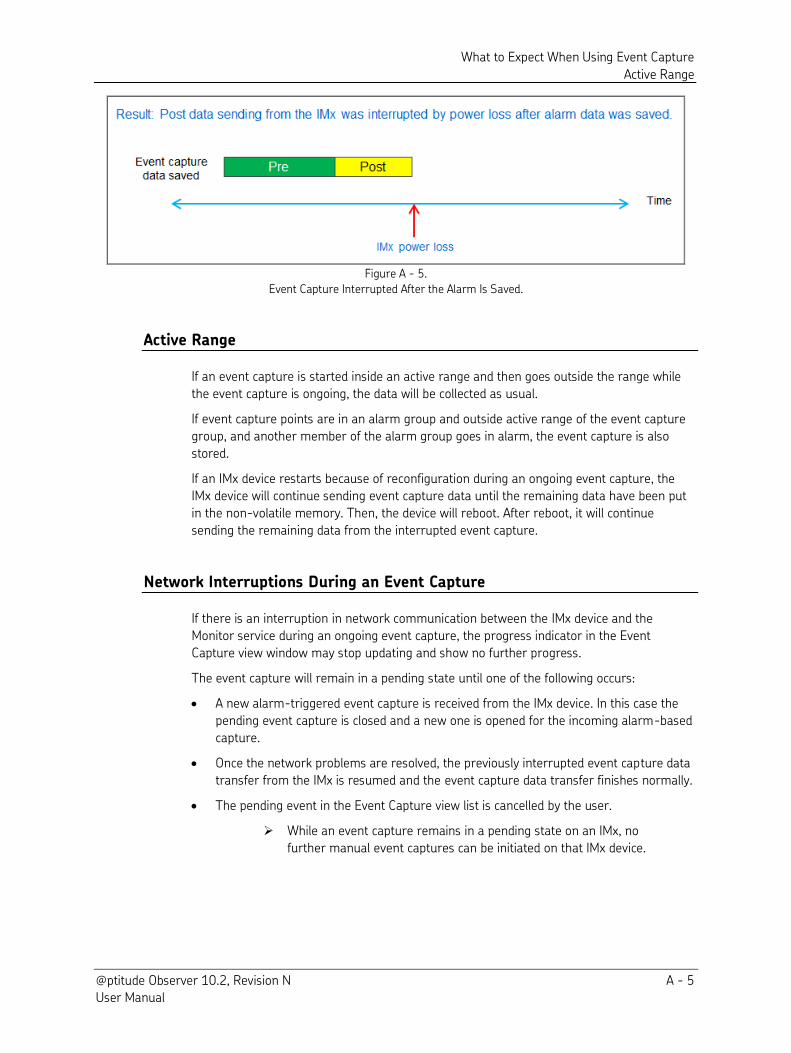
What to Expect When Using Event Capture
Active Range
@ptitude Observer 10.2, Revision N A - 5 User Manual
Figure A - 5.
Event Capture Interrupted After the Alarm Is Saved.
Active Range
If an event capture is started inside an active range and then goes outside the range while
the event capture is ongoing, the data will be collected as usual.
If event capture points are in an alarm group and outside active range of the event capture
group, and another member of the alarm group goes in alarm, the event capture is also
stored.
If an IMx device restarts because of reconfiguration during an ongoing event capture, the
IMx device will continue sending event capture data until the remaining data have been put
in the non-volatile memory. Then, the device will reboot. After reboot, it will continue
sending the remaining data from the interrupted event capture.
Network Interruptions During an Event Capture
If there is an interruption in network communication between the IMx device and the
Monitor service during an ongoing event capture, the progress indicator in the Event
Capture view window may stop updating and show no further progress.
The event capture will remain in a pending state until one of the following occurs:
A new alarm-triggered event capture is received from the IMx device. In this case the
pending event capture is closed and a new one is opened for the incoming alarm-based
capture.
Once the network problems are resolved, the previously interrupted event capture data
transfer from the IMx is resumed and the event capture data transfer finishes normally.
The pending event in the Event Capture view list is cancelled by the user.
While an event capture remains in a pending state on an IMx, no
further manual event captures can be initiated on that IMx device.
What to Expect When Using Event Capture
Signals Outside Cable Fault Detection Thresholds
A - 6 @ptitude Observer 10.2, Revision N User Manual
Signals Outside Cable Fault Detection Thresholds
Event capture signal levels that are detected to be outside cable fault threshold levels will
continue to be collected and stored in the event capture data.
The cable fault threshold values used for determining the presence of
cable fault issues are those currently stored for the individual IMx
channels.
When viewing data in either the event capture time waveform plot or event capture 3D plot,
where any captured measurements have been found to be outside cable fault threshold
limits, a warning message is displayed in the plot indicating a possible problem with the
data.
Miscellaneous
If the pre data received is less than the total quantity of pre data expected, the Transfer status in the Event Capture list is Done, Pre-data not filled. This indicates that the Monitor
has received all the data the IMx has to send, but the pre-buffer was not filled when the
event capture was triggered due to one of the reasons stated above.
Stopping the Monitor service and restarting it while an event capture is ongoing does not
affect the storage of event capture data. The IMx will pick up the data after the Monitor
service and the IMx device have reconnected.
The date in the alarm list for the first event capture point in alarm matches the event
capture date and also the 0 point in the event capture graph. If you have several event
capture points, some might have a slightly later date/time.
When an IMx device restarts during an ongoing event capture
The IMx device will continue sending event capture data until the remaining data is put in
the non-volatile memory, and then it will reboot. After reboot, the device will continue
sending the remaining data from the interrupted event capture.
Alarm event capture triggered during a manual event capture
If a manual event capture is ongoing, the IMx event capture is locked, meaning that if you
trigger an alarm on the event capture point it will continue sending the manual event
capture data.
If a manual capture is in progress it will finish, and no other event capture is stored.
However, if you have an alarm group in alarm, a second overlapped alarm event capture
may be stored.
Changing alarm state during an alarm event capture
If an event capture starts with warning level and the amplitudes increase to alarm level
while the event capture is ongoing, only one event capture is stored.
The alarm list will display dual alarms for both warning and alarm
states.
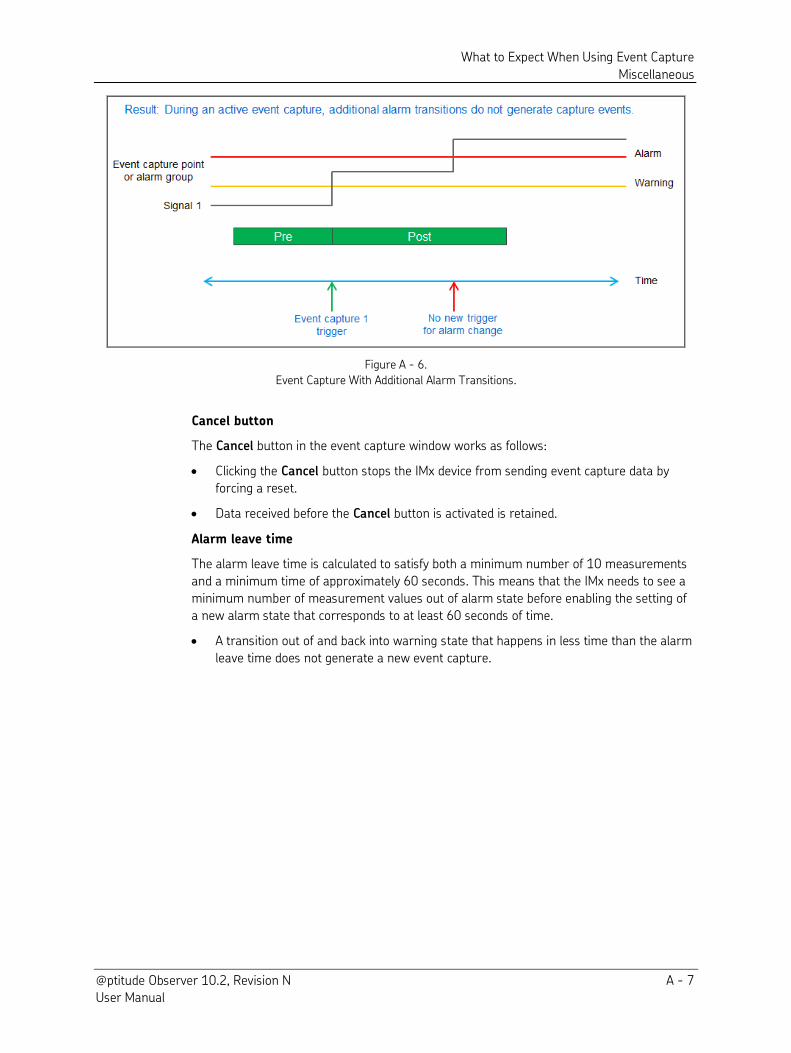
What to Expect When Using Event Capture
Miscellaneous
@ptitude Observer 10.2, Revision N A - 7 User Manual
Figure A - 6.
Event Capture With Additional Alarm Transitions.
Cancel button
The Cancel button in the event capture window works as follows:
Clicking the Cancel button stops the IMx device from sending event capture data by
forcing a reset.
Data received before the Cancel button is activated is retained.
Alarm leave time
The alarm leave time is calculated to satisfy both a minimum number of 10 measurements
and a minimum time of approximately 60 seconds. This means that the IMx needs to see a
minimum number of measurement values out of alarm state before enabling the setting of
a new alarm state that corresponds to at least 60 seconds of time.
A transition out of and back into warning state that happens in less time than the alarm
leave time does not generate a new event capture.
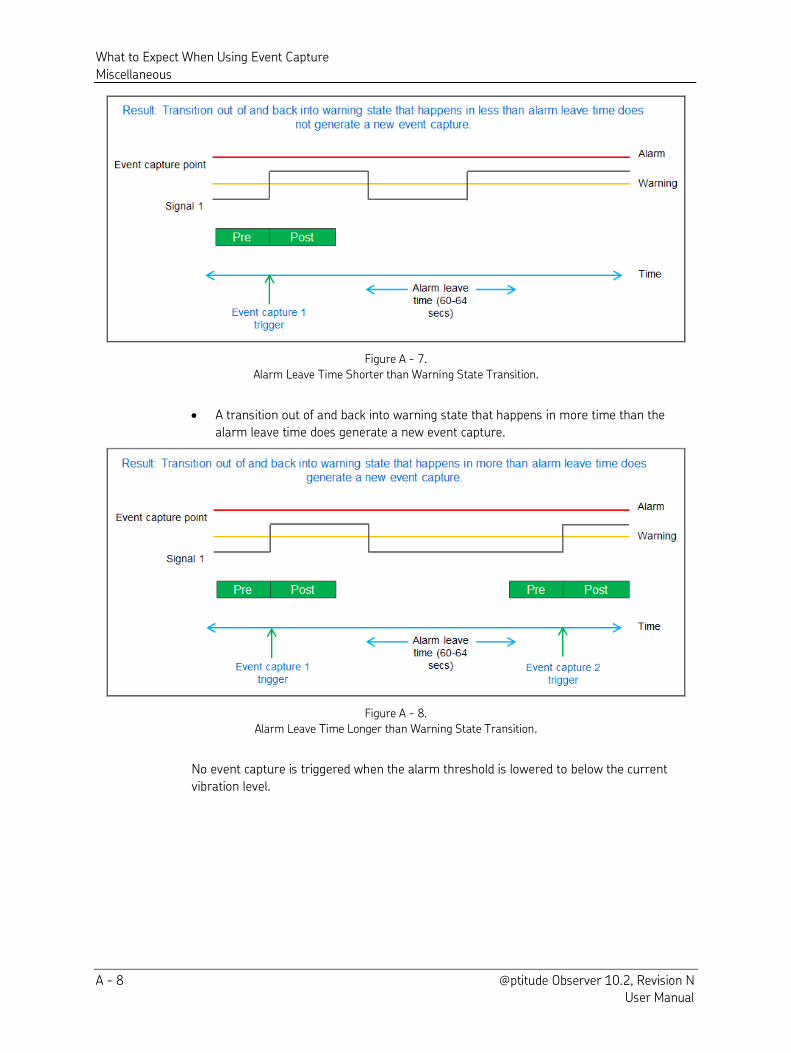
What to Expect When Using Event Capture
Miscellaneous
A - 8 @ptitude Observer 10.2, Revision N User Manual
Figure A - 7.
Alarm Leave Time Shorter than Warning State Transition.
A transition out of and back into warning state that happens in more time than the
alarm leave time does generate a new event capture.
Figure A - 8.
Alarm Leave Time Longer than Warning State Transition.
No event capture is triggered when the alarm threshold is lowered to below the current
vibration level.
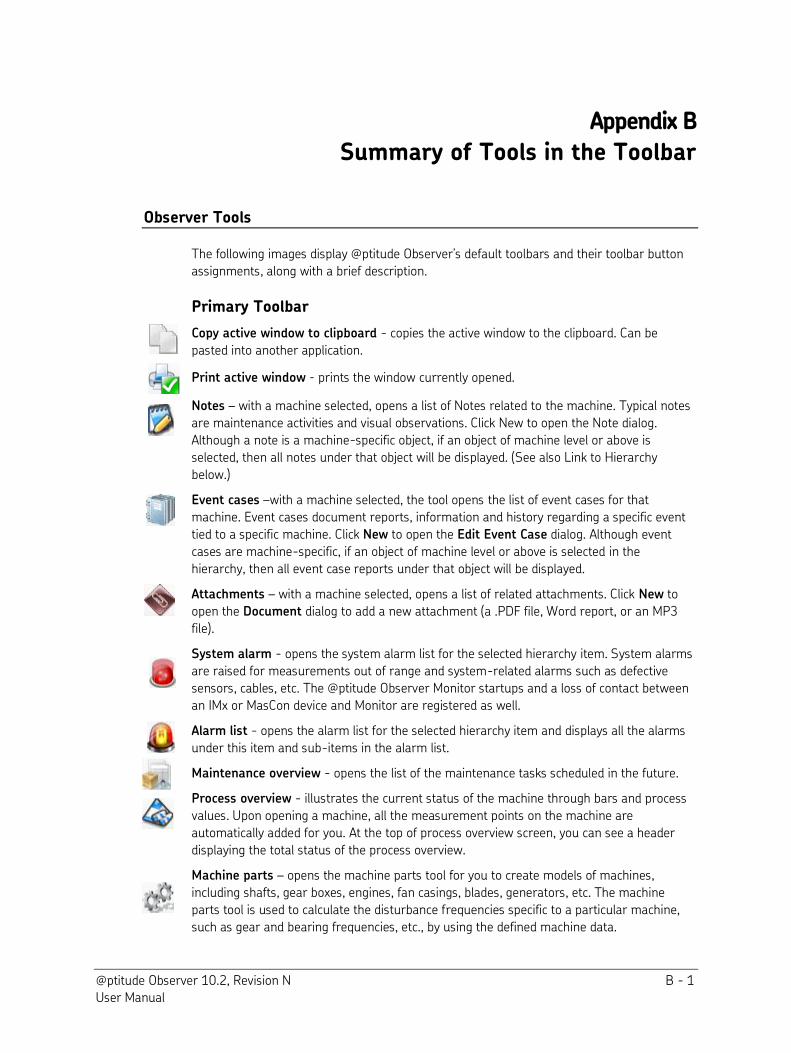
@ptitude Observer 10.2, Revision N B - 1 User Manual
Appendix B
Summary of Tools in the Toolbar
Observer Tools
The following images display @ptitude Observer’s default toolbars and their toolbar button assignments, along with a brief description.
Primary Toolbar
Copy active window to clipboard - copies the active window to the clipboard. Can be
pasted into another application.
Print active window - prints the window currently opened.
Notes – with a machine selected, opens a list of Notes related to the machine. Typical notes
are maintenance activities and visual observations. Click New to open the Note dialog.
Although a note is a machine-specific object, if an object of machine level or above is
selected, then all notes under that object will be displayed. (See also Link to Hierarchy
below.)
Event cases –with a machine selected, the tool opens the list of event cases for that
machine. Event cases document reports, information and history regarding a specific event
tied to a specific machine. Click New to open the Edit Event Case dialog. Although event
cases are machine-specific, if an object of machine level or above is selected in the
hierarchy, then all event case reports under that object will be displayed.
Attachments – with a machine selected, opens a list of related attachments. Click New to
open the Document dialog to add a new attachment (a .PDF file, Word report, or an MP3
file).
System alarm - opens the system alarm list for the selected hierarchy item. System alarms
are raised for measurements out of range and system-related alarms such as defective
sensors, cables, etc. The @ptitude Observer Monitor startups and a loss of contact between
an IMx or MasCon device and Monitor are registered as well.
Alarm list - opens the alarm list for the selected hierarchy item and displays all the alarms
under this item and sub-items in the alarm list.
Maintenance overview - opens the list of the maintenance tasks scheduled in the future.
Process overview - illustrates the current status of the machine through bars and process
values. Upon opening a machine, all the measurement points on the machine are
automatically added for you. At the top of process overview screen, you can see a header
displaying the total status of the process overview.
Machine parts – opens the machine parts tool for you to create models of machines,
including shafts, gear boxes, engines, fan casings, blades, generators, etc. The machine
parts tool is used to calculate the disturbance frequencies specific to a particular machine,
such as gear and bearing frequencies, etc., by using the defined machine data.
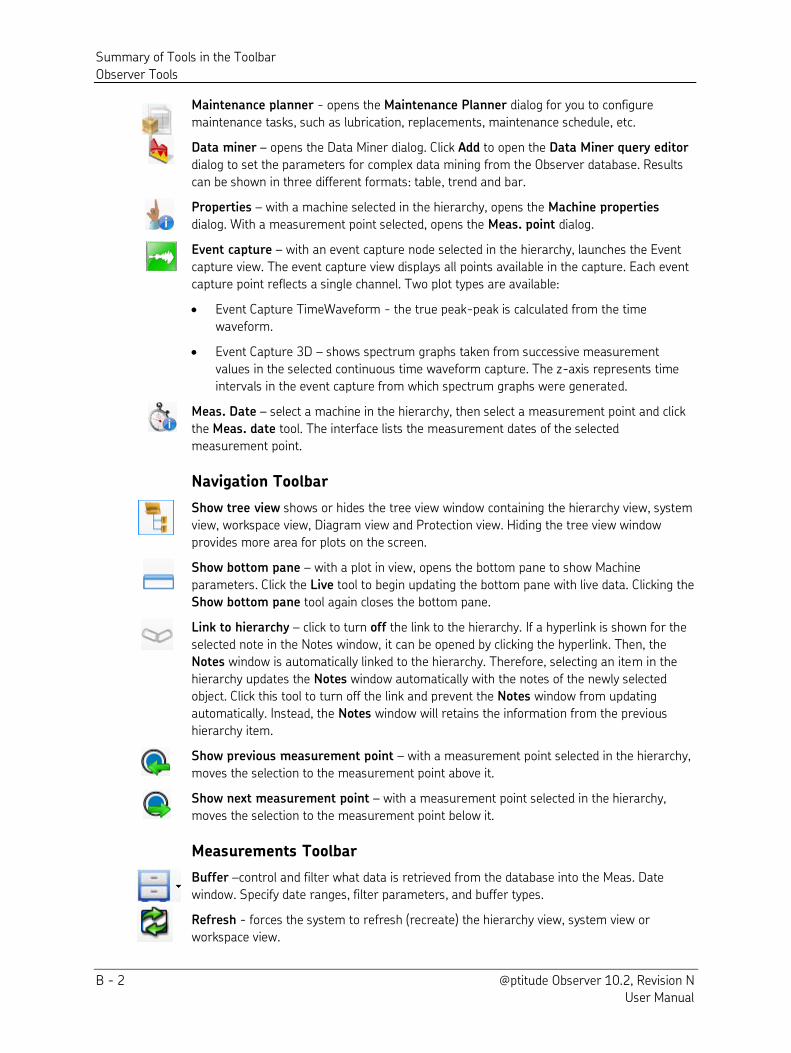
Summary of Tools in the Toolbar
Observer Tools
B - 2 @ptitude Observer 10.2, Revision N User Manual
Maintenance planner - opens the Maintenance Planner dialog for you to configure
maintenance tasks, such as lubrication, replacements, maintenance schedule, etc.
Data miner – opens the Data Miner dialog. Click Add to open the Data Miner query editor
dialog to set the parameters for complex data mining from the Observer database. Results
can be shown in three different formats: table, trend and bar.
Properties – with a machine selected in the hierarchy, opens the Machine properties
dialog. With a measurement point selected, opens the Meas. point dialog.
Event capture – with an event capture node selected in the hierarchy, launches the Event
capture view. The event capture view displays all points available in the capture. Each event
capture point reflects a single channel. Two plot types are available:
Event Capture TimeWaveform - the true peak-peak is calculated from the time
waveform.
Event Capture 3D – shows spectrum graphs taken from successive measurement
values in the selected continuous time waveform capture. The z-axis represents time
intervals in the event capture from which spectrum graphs were generated.
Meas. Date – select a machine in the hierarchy, then select a measurement point and click
the Meas. date tool. The interface lists the measurement dates of the selected
measurement point.
Navigation Toolbar
Show tree view shows or hides the tree view window containing the hierarchy view, system
view, workspace view, Diagram view and Protection view. Hiding the tree view window
provides more area for plots on the screen.
Show bottom pane – with a plot in view, opens the bottom pane to show Machine
parameters. Click the Live tool to begin updating the bottom pane with live data. Clicking the
Show bottom pane tool again closes the bottom pane.
Link to hierarchy – click to turn off the link to the hierarchy. If a hyperlink is shown for the
selected note in the Notes window, it can be opened by clicking the hyperlink. Then, the
Notes window is automatically linked to the hierarchy. Therefore, selecting an item in the
hierarchy updates the Notes window automatically with the notes of the newly selected
object. Click this tool to turn off the link and prevent the Notes window from updating
automatically. Instead, the Notes window will retains the information from the previous
hierarchy item.
Show previous measurement point – with a measurement point selected in the hierarchy,
moves the selection to the measurement point above it.
Show next measurement point – with a measurement point selected in the hierarchy,
moves the selection to the measurement point below it.
Measurements Toolbar
Buffer –control and filter what data is retrieved from the database into the Meas. Date
window. Specify date ranges, filter parameters, and buffer types.
Refresh - forces the system to refresh (recreate) the hierarchy view, system view or
workspace view.
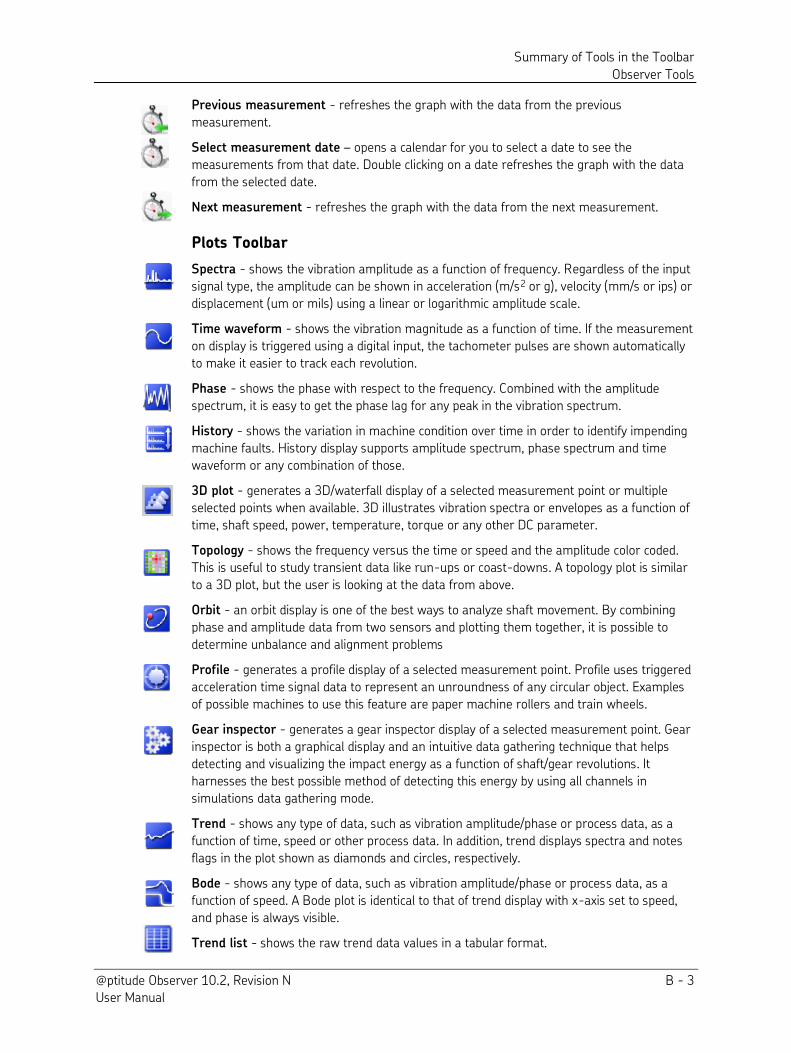
Summary of Tools in the Toolbar
Observer Tools
@ptitude Observer 10.2, Revision N B - 3 User Manual
Previous measurement - refreshes the graph with the data from the previous
measurement.
Select measurement date – opens a calendar for you to select a date to see the
measurements from that date. Double clicking on a date refreshes the graph with the data
from the selected date.
Next measurement - refreshes the graph with the data from the next measurement.
Plots Toolbar
Spectra - shows the vibration amplitude as a function of frequency. Regardless of the input
signal type, the amplitude can be shown in acceleration (m/s2 or g), velocity (mm/s or ips) or
displacement (um or mils) using a linear or logarithmic amplitude scale.
Time waveform - shows the vibration magnitude as a function of time. If the measurement
on display is triggered using a digital input, the tachometer pulses are shown automatically
to make it easier to track each revolution.
Phase - shows the phase with respect to the frequency. Combined with the amplitude
spectrum, it is easy to get the phase lag for any peak in the vibration spectrum.
History - shows the variation in machine condition over time in order to identify impending
machine faults. History display supports amplitude spectrum, phase spectrum and time
waveform or any combination of those.
3D plot - generates a 3D/waterfall display of a selected measurement point or multiple
selected points when available. 3D illustrates vibration spectra or envelopes as a function of
time, shaft speed, power, temperature, torque or any other DC parameter.
Topology - shows the frequency versus the time or speed and the amplitude color coded.
This is useful to study transient data like run-ups or coast-downs. A topology plot is similar
to a 3D plot, but the user is looking at the data from above.
Orbit - an orbit display is one of the best ways to analyze shaft movement. By combining
phase and amplitude data from two sensors and plotting them together, it is possible to
determine unbalance and alignment problems
Profile - generates a profile display of a selected measurement point. Profile uses triggered
acceleration time signal data to represent an unroundness of any circular object. Examples
of possible machines to use this feature are paper machine rollers and train wheels.
Gear inspector - generates a gear inspector display of a selected measurement point. Gear
inspector is both a graphical display and an intuitive data gathering technique that helps
detecting and visualizing the impact energy as a function of shaft/gear revolutions. It
harnesses the best possible method of detecting this energy by using all channels in
simulations data gathering mode.
Trend - shows any type of data, such as vibration amplitude/phase or process data, as a
function of time, speed or other process data. In addition, trend displays spectra and notes
flags in the plot shown as diamonds and circles, respectively.
Bode - shows any type of data, such as vibration amplitude/phase or process data, as a
function of speed. A Bode plot is identical to that of trend display with x-axis set to speed,
and phase is always visible.
Trend list - shows the raw trend data values in a tabular format.
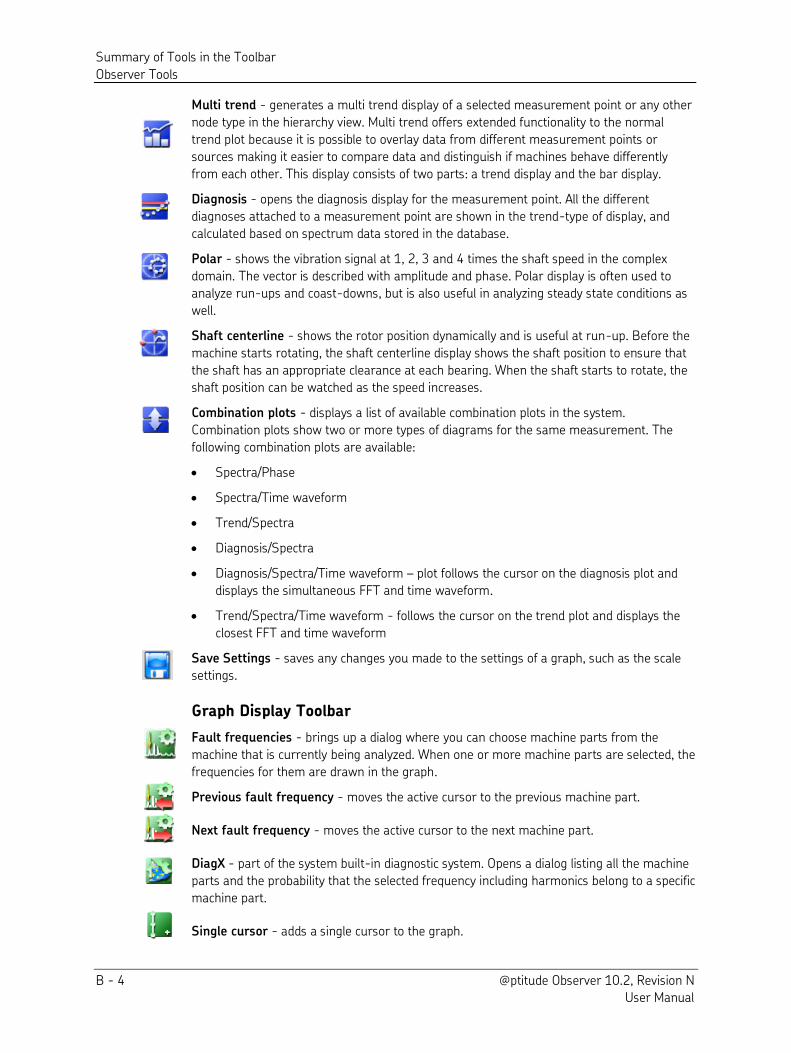
Summary of Tools in the Toolbar
Observer Tools
B - 4 @ptitude Observer 10.2, Revision N User Manual
Multi trend - generates a multi trend display of a selected measurement point or any other
node type in the hierarchy view. Multi trend offers extended functionality to the normal
trend plot because it is possible to overlay data from different measurement points or
sources making it easier to compare data and distinguish if machines behave differently
from each other. This display consists of two parts: a trend display and the bar display.
Diagnosis - opens the diagnosis display for the measurement point. All the different
diagnoses attached to a measurement point are shown in the trend-type of display, and
calculated based on spectrum data stored in the database.
Polar - shows the vibration signal at 1, 2, 3 and 4 times the shaft speed in the complex
domain. The vector is described with amplitude and phase. Polar display is often used to
analyze run-ups and coast-downs, but is also useful in analyzing steady state conditions as
well.
Shaft centerline - shows the rotor position dynamically and is useful at run-up. Before the
machine starts rotating, the shaft centerline display shows the shaft position to ensure that
the shaft has an appropriate clearance at each bearing. When the shaft starts to rotate, the
shaft position can be watched as the speed increases.
Combination plots - displays a list of available combination plots in the system.
Combination plots show two or more types of diagrams for the same measurement. The
following combination plots are available:
Spectra/Phase
Spectra/Time waveform
Trend/Spectra
Diagnosis/Spectra
Diagnosis/Spectra/Time waveform – plot follows the cursor on the diagnosis plot and
displays the simultaneous FFT and time waveform.
Trend/Spectra/Time waveform - follows the cursor on the trend plot and displays the
closest FFT and time waveform
Save Settings - saves any changes you made to the settings of a graph, such as the scale
settings.
Graph Display Toolbar
Fault frequencies - brings up a dialog where you can choose machine parts from the
machine that is currently being analyzed. When one or more machine parts are selected, the
frequencies for them are drawn in the graph.
Previous fault frequency - moves the active cursor to the previous machine part.
Next fault frequency - moves the active cursor to the next machine part.
DiagX - part of the system built-in diagnostic system. Opens a dialog listing all the machine
parts and the probability that the selected frequency including harmonics belong to a specific
machine part.
Single cursor - adds a single cursor to the graph.
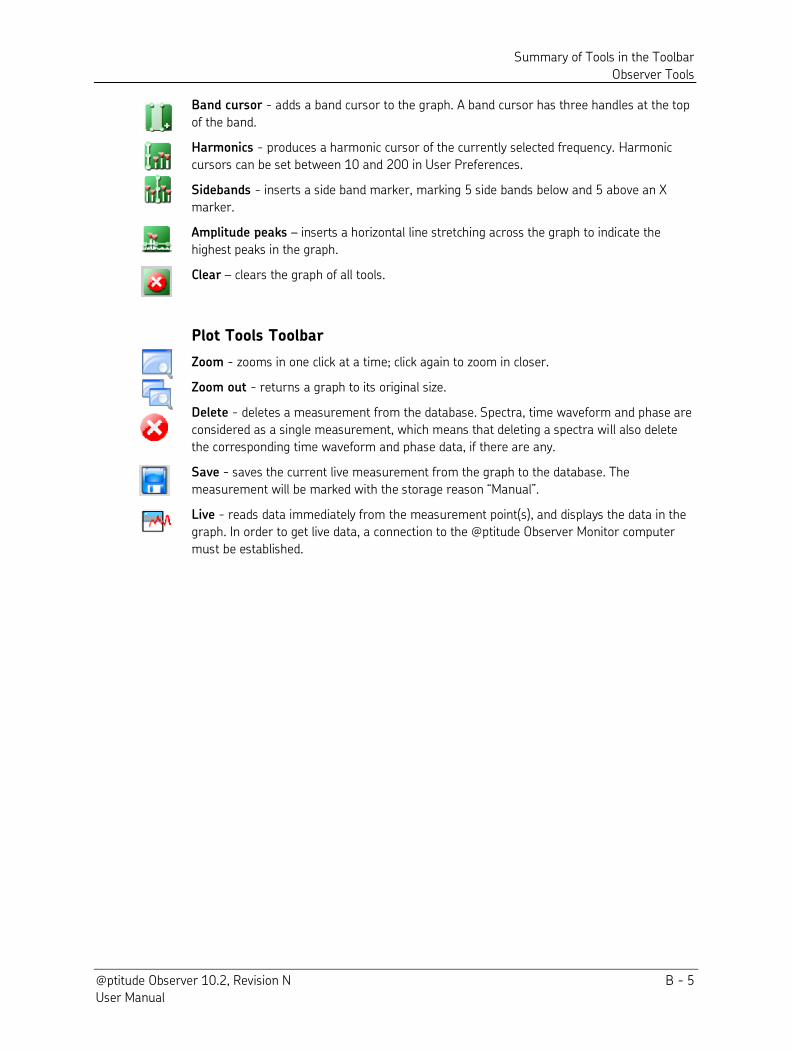
Summary of Tools in the Toolbar
Observer Tools
@ptitude Observer 10.2, Revision N B - 5 User Manual
Band cursor - adds a band cursor to the graph. A band cursor has three handles at the top
of the band.
Harmonics - produces a harmonic cursor of the currently selected frequency. Harmonic
cursors can be set between 10 and 200 in User Preferences.
Sidebands - inserts a side band marker, marking 5 side bands below and 5 above an X
marker.
Amplitude peaks – inserts a horizontal line stretching across the graph to indicate the
highest peaks in the graph.
Clear – clears the graph of all tools.
Plot Tools Toolbar
Zoom - zooms in one click at a time; click again to zoom in closer.
Zoom out - returns a graph to its original size.
Delete - deletes a measurement from the database. Spectra, time waveform and phase are
considered as a single measurement, which means that deleting a spectra will also delete
the corresponding time waveform and phase data, if there are any.
Save - saves the current live measurement from the graph to the database. The
measurement will be marked with the storage reason “Manual”. Live - reads data immediately from the measurement point(s), and displays the data in the
graph. In order to get live data, a connection to the @ptitude Observer Monitor computer
must be established.

@ptitude Observer 10.2, Revision N C - 1 User Manual
Appendix C
End User License
Agreement
THIS END-USER LICENSE AGREEMENT (this
“Agreement”) is entered into by and between SKF USA Inc. and/or SKF Condition Monitoring Center
AB (hereinafter referred to collectively as the
“Licensor”) and any person or business that executes this Agreement by clicking the “I agree” icon at the end of this Agreement or by accessing,
using, or installing the Software (“Licensee” or “You”). Licensor and Licensee shall be referred to collectively in this Agreement as the Parties.
BY CLICKING THE ACCEPTANCE BUTTON OR
ACCESSING, USING, OR INSTALLING THE
SOFTWARE, OR ANY PART THEREOF, YOU
EXPRESSLY AGREE TO BE BOUND BY ALL OF
THE TERMS OF THIS AGREEMENT. IF YOU DO
NOT AGREE TO ALL OF THE TERMS OF THIS
AGREEMENT, THE BUTTON INDICATING
NON-ACCEPTANCE MUST BE SELECTED, AND
YOU MAY NOT ACCESS, USE, OR INSTALL ANY
PART OF THE SOFTWARE.
1. DEFINITIONS
(a) Derivative Works. The Term
“Derivative Works” shall have the same meaning as set forth in the U.S.
Copyright Act, as amended from time to
time, in title 17 of the United States
Code.
(b) Effective Date. The term “Effective Date” shall mean the date on which Licensee assents to the terms of this
Agreement by clicking the “I agree” button at the bottom of this Agreement.
(c) Intellectual Property Rights. The
term Intellectual Property Rights shall
mean all rights arising or protectable
under the copyright, trademark, patent,
or trade secrets laws of the United
States or any other nation, including all
rights associated with the protection of
computer programs and/or source code.
(d) Person. The term “Person” shall mean an individual, a partnership, a company,
a corporation, an association, a joint
stock company, a trust, a joint venture,
an unincorporated organization, or a
governmental entity (or any department,
agency, or political subdivision thereof).
(e) Software. The term “Software” shall mean the software application entitled
Software for Wireless Monitoring
System V/T, SKF @ptitude Analyst, SKF
@ptitude Inspector, SKF @ptitude
Observer, SKF @ptitude Decision
Support or any other software within
the SKF @ptitude family suite, which is
an application developed, owned,
marketed, and licensed by Licensor.
The term Software shall include the
object code of Software for Wireless
Monitoring System V/T, SKF @ptitude
Analyst, SKF @ptitude Inspector, SKF
@ptitude Observer, SKF @ptitude
Decision Support or any other object
code within the SKF @ptitude family
suite and any and all user manuals, or
other technical documentation, authored
by Licensor in connection with Software
for Wireless Monitoring System V/T,
SKF @ptitude Analyst, SKF @ptitude
Inspector, SKF @ptitude Observer, SKF
@ptitude Decision Support or any other
software within the SKF @ptitude family.
The term “Software” includes any corrections, bug fixes, enhancements,
releases, updates, upgrades, or other
modifications, including custom
modifications, to Software for Wireless
Monitoring System V/T, SKF @ptitude
Analyst, SKF @ptitude Inspector, SKF
@ptitude Observer, SKF @ptitude
Decision Support or any other software
within the SKF @ptitude family suite and
any and all user manuals. The term
Software also includes any
C - 2 @ptitude Observer 10.2, Revision N User Manual
supplemental, add-on, or plug-in
software code provided to Licensee in
the course of receiving Product Support
Plan services from Licensor. The term
Software shall not be construed to
include the source code for Software for
Wireless Monitoring System V/T, SKF
@ptitude Analyst, SKF @ptitude
Inspector, SKF @ptitude Observer, SKF
@ptitude Decision Support or any other
software within the SKF @ptitude family
suite. 2. LICENSE
(a) Grant of License. Licensor grants
Licensee, pursuant to the terms and
conditions of this Agreement, a
non-exclusive, non-transferable, and
revocable license to use the Software in
strict accordance with the terms and
conditions of this Agreement, including
any concurrent use, network or other
limitations set forth in subsection (b)
below. All rights not specifically granted
by Licensor under this Agreement are
retained by Licensor and withheld from
Licensee.
(b) Installation and Use Rights. Licensee
shall use the Software only on its
internal computer equipment, whether
such equipment is owned, leased, or
rented, at the Licensee’s principal business office. The following
paragraphs govern your installation and
use rights with regard to the Software,
depending on the type of license you
have obtained from Licensor.
(i) If you obtained a stand-alone
license of the Software, you may
install one (1) copy of the
Software on one (1) computer
residing in your principal
business office.
(ii) If you obtained a network license
of the Software, you may install
one (1) copy of the Software on
as many networked clients
(workstations) as authorized by
your network license, as set
forth more particularly in the
applicable purchase order or
other ordering documents
memorializing your license
acquisition; provided, however,
that all network clients
(workstations) are connected to
a single licensed database
residing in your principal
business office.
(iii) If you obtained a network license
of the Software, you may
connect to multiple licensed
databases, you may install the
database-dedicated clients up to
the total number of networked
clients acquired by you under
the applicable purchase order or
other ordering documents
memorializing your license
acquisition.
(c) Other Conditions of Use. Licensor
understands and agrees that the
Software works in conjunction and is
compatible with database software
licensed to you by Microsoft or Oracle.
Upon installation of the Software, the
Software may detect an installed
database software application from
Oracle or Microsoft, and if so, the
Software will be fully installed. If no
installed database software application
from Oracle or Microsoft is detected,
the Software will not install until such
time as Licensee installs a valid and
Software compatible copy of an Oracle
database or a Microsoft SQL Server
database and consents to the license
terms of such database software
application. If Licensee does not agree
to the terms of the the Oracle database
license or the Microsoft SQL Server
license, or if the Licensee fails to install
such database software, the Software
@ptitude Observer 10.2, Revision N C - 3 User Manual
will not work. Licensee is responsible
for maintaining a valid database license
in accordance with the Oracle or
Microsoft license agreement (which
ever is applicable) at all times.
(d) Restrictions on Use. Licensee may
use the Software only for its internal
business purposes and on the identified
equipment on which the Software was
first installed or for which it is
otherwise licensed; provided, however,
that Licensee may temporarily use the
Software on a back-up system in the
event that the primary licensed system
is inoperative or test system not used
for production but solely for the
purposes of testing the Software.
Licensee may not use the Software for
any other purpose. Licensee shall not:
(i) permit any parent, subsidiaries,
affiliated entities or third parties
to use the Software;
(ii) use the Software in the
operation of a service bureau;
(iii) allow access to the Software
through any workstations
located outside of Licensee’s principal business offices;
(iv) rent, resell, lease, timeshare or
lend the Software to any Person;
(v) sublicense, assign, or transfer
the Software or this license for
the Software to any Person;
(vi) reproduce, distribute, or publicly
display the Software;
(vii) make the Software accessible to
any Person by any means,
including posting on a web site
or through other distribution
mechanisms over the Internet;
(viii) reverse assemble, disassemble,
reverse engineer, reverse
compile, decompile, or otherwise
translate the Software or
prepare Derivative Works based
on the Software;
(ix) place, reproduce, or make
available the Software on
Licensee’s computer network if Licensee is only authorized by
this Agreement to operate the
Software on a single
workstation;
(x) exceed at any given point in time
the total number of network
clients authorized by the
applicable purchase order or
ordering document to use or
access the Software;
(xi) edit or modify the Software
except as expressly authorized
by Licensor, including altering,
deleting, or obscuring any
proprietary rights notices
embedded in or affixed to the
Software;
(xii) use the Software in any manner
that disparages Licensor,
Microsoft, or Oracle, or use the
Software in a way that infringes
the Intellectual Property Rights
of the foregoing parties; or
(xiii) use the Software in a manner
that violates any federal, state,
or local law, rule or regulation,
or use the Software to violate
the rights of any third party, or
use the Software to promote
pornography, hatred, or racism.
(e) Copies. Licensee, solely to enable it to
use the Software, may make one
archival copy of the Software’s computer program, provided that the copy shall
include Licensor’s copyright and any other proprietary notices. The
C - 4 @ptitude Observer 10.2, Revision N User Manual
Software delivered by Licensor to
Licensee and the archival copy shall be
stored at Licensee’s principal business office. If you purchased a network
license of the Software, you may install
one additional copy of the Software on
your network for the limited purpose of
testing the Software’s operation. Except for the limited reproduction
rights set forth in this paragraph,
Licensee shall have no other right to
copy, in whole or in part, the Software.
Any copy of the Software made by
Licensee is the exclusive property of
Licensor.
(f) Modifications. Licensee agrees that
only Licensor shall have the right to
alter, maintain, enhance or otherwise
modify the Software.
(g) Protection of Software. Licensee
agrees that it will take action by
instruction, written agreement, or
otherwise as appropriate with any
person permitted access to the Software
to enable Licensee to comply with its
obligations hereunder. Licensee shall
maintain records of the number and
location of all copies of Software.
Licensee shall not provide, permit access
to or use of, or otherwise make available
any Software in any form without
Licensor’s prior written agreement, except to Licensee’s employees for purposes specifically authorized by this
Agreement. Licensee understands and
agrees that the source code for the
Software is a valuable copyright and
contains valuable trade secrets of
Licensor. Licensee agrees not to
discover or attempt to discover, or assist
or permit any Person to discover or
attempt to discover, by any means
whatsoever the source code of the
Software.
(h) Licensor’s Audit Rights. Licensor shall
possess the right to audit Licensee’s use
of the Software to determine
compliance with this Agreement
(hereinafter referred to as “Licensor’s
Audit Rights”). Licensor’s Audit Rights shall be exercised in accordance with the
following paragraphs:
(i) Notice of Audit. Licensor shall
provide Licensee with at least
five (5) calendar days advance
written notice of its intent to
exercise the Licensor’s Audit Rights.
(ii) Conduct of Audit. The audit
conducted by Licensor shall
consist of a physical review of
the computer hardware,
software, and middleware
operated by Licensee at its
principal business office and any
other office for which Licensor,
in its sole and arbitrary
discretion, deems an audit
appropriate. Licensee shall
provide Licensor with
unrestricted access to its
computer hardware, software,
and middleware in connection
with any audit conducted by
Licensor.
(iii) Costs of Audit. If Licensor’s audit uncovers a violation of this
Agreement by Licensee,
Licensee shall pay all costs and
expenses incurred by Licensor in
exercising the Licensor Audit
Rights, including, without
limitation, all attorneys’ fees and agent fees incurred by Licensor.
If Licensor concludes that no
violation of this License
Agreement has occurred,
Licensor shall bear all costs and
expenses incurred in exercising
the Licensor Audit Rights. If
Licensee obstructs, restricts, or
otherwise prevents Licensor
from conducting a full and
@ptitude Observer 10.2, Revision N C - 5 User Manual
unrestricted audit, Licensee shall
bear all costs and expenses,
including attorneys’ fees, incurred by Licensor in enforcing
this Section 2(h) before any
court or judicial tribunal. (iv) Frequency of Audits.
Licensor’s Audit Rights shall be
exercised no more than two (2)
times in any one calendar year.
(i) Validity of Intellectual Property
Rights. In any action, dispute,
controversy, or lawsuit arising out of or
related to this Agreement, Licensee shall
not contest the validity of Licensor’s Intellectual Property Rights related to
the Software. Licensee hereby agrees
that it has had an opportunity to
investigate the validity of Licensor’s Intellectual Property Rights, and
acknowledges that Licensor’s Intellectual Property Rights related to the Software
are valid and enforceable.
(j) Material Terms and Conditions.
Licensee specifically agrees that each of
the terms and conditions of this Section
2 are material and that failure of
Licensee to comply with these terms
and conditions shall constitute sufficient
cause for Licensor to terminate this
Agreement and the license granted
hereunder immediately and without an
opportunity to cure. This subsection
2(j) shall not be construed to preclude,
or in any way effect, a finding of
materiality with respect to any other
provision of this Agreement.
3. LICENSE FEE
The applicable licensee fees will be set forth in
the quote issued to Licensee by Licensor or
otherwise established in the applicable
purchase order or other ordering documents
memorializing your license acquisition.
4. OWNERSHIP
(a) Title. Licensee understands and
agrees that Licensor owns all Intellectual
Property Rights related to the Software,
including custom modifications to the
Software, whether made by Licensor or
any third party. Licensee agrees that
this Agreement effects a license, not a
sale, of the Software and that the first
sale doctrine, as codified in 17 U.S.C. §
109, does not apply to the transaction
effected by this Agreement.
(b) Transfers. Under no circumstances
shall Licensee sell, license, sublicense,
publish, display, distribute, assign, or
otherwise transfer (hereinafter referred
to collectively as a “Transfer”) to a third party the Software or any copy thereof,
in whole or in part, without Licensor’s prior written consent. Any Transfer
effected in violation of this Section 4(b)
shall be void ab initio and of no force or
effect.
5. MAINTENANCE AND SUPPORT
Licensor may provide you with support
services related to the Software called
Product Support Plan (“PSP”) services. Use of PSP is governed by the policies and
programs described in the PSP literature or
other material from Licensor’s Product Support Department (hereinafter referred to
as the “PSP Policies”) that may be updated by Licensor from time to time. If you select and
pay for PSP, the PSP Policies shall be
specifically incorporated into this Agreement
by this reference. Licensee acknowledges
that Licensor may use any technical
information provided by Licensee in the
course of receiving PSP services for Licensor’s business purposes, including for product
support and development. Licensor will not
utilize such technical information in a manner
that identifies Licensee. 6. CONFIDENTIAL INFORMATION
Licensee agrees that the Software contains
proprietary information, including trade
C - 6 @ptitude Observer 10.2, Revision N User Manual
secrets, know-how and confidential
information (hereinafter referred to
collectively as the “Confidential Information”), that is the exclusive property of Licensor.
During the period this Agreement is in effect
and at all times after its termination, Licensee
and its employees and agents shall maintain
the confidentiality of the Confidential
Information and shall not sell, license, publish,
display, distribute, disclose or otherwise make
available the Confidential Information to any
Person nor use the Confidential Information
except as authorized by this Agreement.
Licensee shall not disclose the Confidential
Information concerning the Software,
including any flow charts, logic diagrams, user
manuals and screens, to persons not an
employee of Licensee without the prior
written consent of Licensor. 7. LIMITED WARRANTIES
(a) Licensor warrants that the Software will
perform substantially in accordance with
its documentation for a period of 180
days from the date of shipment of the
Software; provided, however, that the
foregoing warranty only applies if: (i)
Licensee makes Licensor aware of any
defect with the Software within seven
(7) days after the occurrence of the
defect; (ii) Licensee has paid all amounts
due under this Agreement; and (iii)
Licensee has not breached any provision
of this Agreement. The foregoing
warranty does not apply in the event
that: (i) the Software and documentation
have been subject to misuse, neglect,
alteration, modification, customization,
improper installation, and/or
unauthorized repair; (ii) the Software or
any associated software or equipment
have not been properly maintained in
accordance with applicable specifications
and industry standards or have been
maintained in unsuitable environmental
conditions; or (iii) Licensee has used the
Software in conjunction with other
equipment, hardware, software, or other
technology that created an adverse
impact on the operation, functioning, or
performance of the Software.
(b) EXCEPT AS SET FORTH IN THIS
SECTION 7 AND TO THE EXTENT
PERMITTED BY APPLICABLE LAW, ALL
EXPRESS AND/OR IMPLIED
WARRANTIES OR CONDITIONS,
INCLUDING BUT NOT LIMITED TO
IMPLIED WARRANTIES OR CONDITIONS
OF MERCHANTABILITY,
MERCHANTABILITY OF A COMPUTER
PROGRAM, INFORMATIONAL CONTENT,
SYSTEM INTEGRATION, FITNESS FOR A
PARTICULAR PURPOSE, AND
NON-INFRINGEMENT, ARE HEREBY
DISCLAIMED AND EXCLUDED BY
LICENSOR.
(c) The remedies set forth in this Section 7
are the exclusive remedies available to
Licensee for any problem in the
performance of the Software.
8. LIMITATIONS ON LIABILITY
(a) Limitations and Exclusions. IN NO
EVENT WILL LICENSOR BE LIABLE TO
LICENSEE FOR ANY DIRECT, INDIRECT,
INCIDENTAL, CONSEQUENTIAL,
PUNITIVE OR OTHER SPECIAL
DAMAGES, LOST PROFITS, OR LOSS OF
INFORMATION SUFFERED BY LICENSEE
ARISING OUT OF OR RELATED TO THIS
AGREEMENT OR THE USE OF THE
SOFTWARE, FOR ALL CAUSES OF
ACTION OF ANY KIND (INCLUDING
TORT, CONTRACT, NEGLIGENCE,
STRICT LIABILITY, BREACH OF
WARRANTY OR CONDITION, AND
STATUTORY) EVEN IF LICENSOR HAS
BEEN ADVISED OF THE POSSIBILITY
OF SUCH DAMAGES. THE PRECEDING
EXCLUSION AND DISCLAIMER OF
DAMAGES SHALL APPLY TO ALL
CLAIMS MADE BY LICENSEE RELATED
TO OR ARISING OUT OF LICENSEE’s USE OF THE SOFTWARE, INCLUDING,
BUT NOT LIMITED TO, CLAIMS
ALLEGING THAT THE SOFTWARE, OR
@ptitude Observer 10.2, Revision N C - 7 User Manual
ANY COMPONENT THEREOF, FAILED
OF ITS ESSENTIAL PURPOSE OR
FAILED IN SOME OTHER RESPECT.
(b) Acknowledgment. Licensee agrees
that the limitations of liability and
disclaimers of warranty set forth in this
Agreement will apply regardless of
whether Licensor has tendered delivery
of the Software or Licensee has
accepted the Software. Licensee
acknowledges that Licensor has set its
prices and entered into this Agreement
in reliance on the disclaimers of
warranty and the limitations and
exclusions of liability set forth in this
Agreement and that the same form an
essential basis of the bargain between
the Parties.
9. TERM AND TERMINATION
(a) Term. This Agreement shall
commence on the Effective Date and
shall continue in existence until it is
terminated in accordance with Section
9(b) below.
(b) Termination. Licensor may terminate
this Agreement and the license
conveyed hereunder in the event that
Licensee breaches any provision, term,
condition, or limitation set forth in this
Agreement, including but not limited to
the license restrictions set forth in
Section 2(d) of this Agreement.
(c) Effect of Termination. Within ten (10)
days after termination of this Agreement
and the license granted hereunder,
Licensee shall return to Licensor, at
Licensee’s expense, the Software and all copies thereof, and deliver to Licensor a
certification, in writing signed by an
officer of Licensee, that all copies of the
Software have been returned to
Licensor and that Licensee has
discontinued its use of the Software.
10. ASSIGNMENT
Licensee shall not assign or otherwise
transfer the Software or this Agreement to
anyone, including any parent, subsidiaries,
affiliated entities or third Parties, or as part
of the sale of any portion of its business, or
pursuant to any merger, consolidation or
reorganization, without Licensor’s prior written consent. Any assignment or
transfer effected in violation of this Section
10 shall be void ab initio and of no force or
effect. 11. FORCE MAJEURE
Neither party shall be in default or otherwise
liable for any delay in or failure of its
performance under this Agreement if such
delay or failure arises by any reason beyond
its reasonable control, including any act of
God, any acts of the common enemy, the
elements, earthquakes, floods, fires,
epidemics, riots, failures or delay in
transportation or communications;
provided, however, that lack of funds shall
not be deemed to be a reason beyond a
party’s reasonable control. The Parties will promptly inform and consult with each other
as to any of the above causes that in their
judgment may or could be the cause of a
delay in the performance of this Agreement. 12. NOTICES
All notices under this Agreement are to be
delivered by depositing the notice in the mail,
using registered mail, return receipt
requested, to the party’s last known principal business address or to any other address as
the party may designate by providing notice.
The notice shall be deemed delivered four (4)
days after the notice’s deposit in the mail, if such notice has been sent by registered mail.
13. CHOICE OF LAW
This Agreement (including all Exhibits),
including its formation, execution,
interpretation, and performance, and the
rights and obligations of the Parties
hereunder, shall be governed by and
construed in accordance with the laws of the
Commonwealth of Pennsylvania, without
C - 8 @ptitude Observer 10.2, Revision N User Manual
regard to any conflicts of law (or choice of
law) principles thereof. 14. CONSENT TO JURISDICTION
In the event that either party initiates
litigation relating to or arising out of this
Agreement, Licensor and Licensee
irrevocably submit to the exclusive
jurisdiction of the state or federal court in or
for Philadelphia, Pennsylvania for the
purposes of any suit, action or other
proceeding relating to arising out of this
Agreement or any transaction contemplated
hereby or thereby (“Legal Proceedings”). Licensee further agree that service of any
process, summons, notice, or document by
U.S. registered mail to such Party’s respective address shall be effective service
of process for any Legal Proceeding.
Licensor and Licensee irrevocably and
unconditionally waive any objection to
personal jurisdiction and/or the laying of
venue of any Legal Proceeding in the state
or federal court in or for Philadelphia,
Pennsylvania, and hereby further irrevocably
and unconditionally agree not to plead,
argue, or claim in any such court that any
Legal Proceeding brought in any such court
has been brought in an inconvenient forum
and otherwise waive any and all objections to
the forum. 15. EXPORT CONTROLS
Licensee shall not export or reexport, directly
or indirectly, the Software without complying
with the export controls imposed by the
United States Export Administration Act of
1979, as amended (or any future U.S. export
control legislation) and the regulations
promulgated thereunder. 16. GOVERNMENT END USERS
If Licensee is acquiring the Software for or
on behalf of a subdivision of the U.S. federal
government, this Section 16 shall apply.
The Software was developed completely at
private expense, is existing computer
software, is a trade secret for all purposes of
the Freedom of Information Act, is
“restricted computer software” and in all
respects proprietary data belonging solely to
Licensor, and all rights are reserved under
the copyright laws of the United States.
Use, duplication, or disclosure by the
Government is subject to restricted rights as
set forth in subparagraphs (a) through (d) of
the Commercial Computer Software
Restricted Rights clause at FAR 52.227-19,
or for DoD units, the restrictions as set forth
in subparagraph (c)(1)(ii) of the Rights in
Technical Data and Computer Software
clause at DFARS 252.227-7013. 17. TRADEMARKS
Licensee agrees that SKF @ptitude Analyst,
SKF @ptitude Inspector, SKF @ptitude
Observer, SKF @ptitude Decision Support or
any other software within the SKF @ptitude
family suite and the trade dress, logos and
other designations of source used by
Licensor to identify the Software are
trademarks or registered trademarks of
Licensor. Licensee shall not use Licensor’s trademarks or service marks without the
prior written consent of Licensor. If the
Software contains any active links to web
sites, you agree to maintain such active links
and not redirect or modify them. 18. GENERAL PROVISIONS
(a) Complete Agreement. The Parties
agree that this Agreement is the
complete and exclusive statement of
the agreement between the Parties,
which supersedes and merges all prior
proposals, understandings and all other
agreements, oral or written, between
the Parties relating to the use of the
Software.
(b) Amendment. This Agreement may
not be modified, altered or amended
except by written instrument duly
executed by both Parties. Any
purchase orders or other ordering
documents issued to Licensee by
Licensor shall not have the effect of
amending or modifying this Agreement,
and shall only serve to memorialize the
@ptitude Observer 10.2, Revision N C - 9 User Manual
number of licenses or products ordered
by Licensee. In the event of a conflict
between the PSP Policies and this
Agreement, the terms of this
Agreement shall control.
(c) Waiver. The waiver or failure of
either party to exercise in any respect
any right provided for in this
Agreement shall not be deemed a
waiver of any further right under this
Agreement.
(d) Severability. If any provision of this
Agreement is invalid, illegal or
unenforceable under any applicable
statute or rule of law, it is to that
extent to be deemed omitted. The
remainder of the Agreement shall be
valid and enforceable to the maximum
extent possible.
(e) Read and Understood. Each party
acknowledges that it has read and
understands this Agreement and
agrees to be bound by its terms.
(f) Limitations Period. No action arising
under, or related to, this Agreement,
may be brought by either party against
the other more than two (2) years after
the cause of action accrues, unless the
cause of action involves death or
personal injury.
(g) Attorneys’ Fees. In the event any
litigation is brought by either party in
connection with this Agreement, the
prevailing party in such litigation will be
entitled to recover from the other party
all the costs, reasonable attorneys’ fees, and other expenses incurred by
such prevailing party in the litigation.
(h) Authorized Representative. The
person installing or using the Software
on behalf of Licensee represents and
warrants that he or she is legally
authorized to bind Licensee and
commit Licensee to the terms of this
Agreement.
(i) Injunctive Relief. Licensee agrees
that Licensor may suffer irreparable
harm as a result of a violation of
Sections 2, 4, 6, 10, 15, and 17 of this
Agreement and that monetary
damages in such event would be
substantial and inadequate to
compensate Licensor. Consequently,
Licensor shall be entitled to seek and
obtain, in addition to such other
monetary relief as may be recoverable
at law or in equity, such injunctive
other equitable relief as may be
necessary to restrain any threatened,
continuing, or further breach by
Licensee without showing or proving
actual damages sustained by Licensor
and without posting a bond.
CM-F0176 (Revision F, January 2011)

@ptitude Observer 10.2, Revision N Index - 1 User Manual
Index
@
@ptitude Monitoring Suite 1-1
3
3D 5-45
A
adding pictures 6-33
advanced vibration-analyzing tool 5-65
alarm 2-4, 5-54, 5-65, 6-50
alarm group 2-5, 6-50
alarm, automatic 4-65
amplitude filtering 5-63
analogue channel 4-27
analysis features 2-2
annotations 5-28
associated measurements 4-54
auto alarm 6-75
auto save graph settings, everyone or just me
6-12
automatic alarm 4-65
Automatic Point Creation (APC) wizard 5-15
B
background 6-12, 6-14, 6-33
balancing 6-78
band cursor 5-32
band marker 5-77
baseline values,diagnosis 5-67
bearing defect frequencies 5-33
BOV 4-28, 5-54
buffer 5-67, 5-83
C
centerline 4-46, 4-52, 4-86, 5-17, 5-19, 5-69
channel 4-7, 5-10
class 1 gating, class 2 gating 4-47, 4-55, 4-57,
4-75, 5-66, 6-71
clear 5-32
coded note 6-84
cold gap 5-69
combination plot 5-70
conditional activation 4-35
configuration changes 6-32
configure users 6-26
connect function 4-25
connection history 4-23
connection log 4-23
copy 5-28
copy active window tool B-1
copy machine 4-93
correlation tolerance 5-29
create IMx/MasCon units and channels 4-7
cursor 5-28, 5-33
curve fitting 5-29
custom band 4-67
D
dashboard 6-21
data acquisition device (DAD) 1-2, 4-26
data miner 6-77
data miner tool B-2
data tagging 4-47, 5-86
data tagging group 4-50, 6-47
database 4-3
database information 6-31
delete data 6-77
delete data automatically 6-70
device settings tab 6-76
device, create 4-8
diagnosis display 5-65
diagnosis rules 5-65, 6-35
diagnosis tab 4-33
diagram view 5-12
DiagX 5-29, 5-31
digital channel 4-30
DPE (digital peak enveloping) 2-2
E
elevation 5-28, 5-45
event capture
export to UFF 5-82
manual capture 5-81
measurement point 6-64
plots 5-73
event capture behavior A-1
event capture group 4-2, 6-54, 6-58
event case reports 5-88
event cases 5-88
Index - 2 @ptitude Observer 10.2, Revision N User Manual
event cases tool B-1
event log 6-81
export data 5-29, 5-93, 6-48
external channel 4-18
external database 6-3
F
fault frequencies 5-29, 5-31
FFT 4-36, 4-52, 4-62, 5-33
FFT (fast Fourier transform) 2-2
filter on machine parameter 5-86
filtering 5-83
firmware 4-26
frequency unit 5-29
G
gear 4-87, 5-53
gear inspector 5-53
gearbox 4-87, 5-53
generate report 6-4
getting started 3-1
go to 5-29
graph settings 5-28
graphic displays 5-27
graphics 5-27
H
hardware connectivity 2-1
harmonic cursor 5-32
harmonic measurement point 4-85, 5-24,
6-58, 6-78
harmonics 5-32, 5-33, 6-35
hierarchy view 4-2, 5-1
hierarchy view status icons 5-3
historical display 5-41
history 5-41, 5-45
I
IEC external communication 4-16
IEC status codes 5-94
import data 5-13, 6-49
IMx/MasCon 4-7, 5-10, 6-32
inverted 5-29
K
keep forever flag 5-30, 5-82
L
language change feature 3-2
legend 5-27, 5-29
libraries 6-42
license key 3-1, 6-86
line style 5-29
link to hierarchy tool B-2
listen to time waveform 5-29
log off
process overview 4-92
switch user type 4-92
log off, switch user type 3-2
logical architecture 1-3
logon 3-1
change language 3-2
switch user type 3-2, 4-92
M
machine 5-1
machine copy wizard 4-93
machine parameters 4-36
machine parts 4-87
machine properties 4-31
machine template 6-47
machine, create 4-4
maintenance planner 5-92
manage databases interface 6-1
markers 5-29
max scale 5-29
measurement date 5-93
measurement group 6-51
measurement point 4-24, 4-45
add edit delete 4-44
measurement point, dynamic 4-45
measurement point, trend 4-46
Microlog Analyzer 2-1, 4-47, 4-49, 4-54, 6-83
min scale 5-29
modbus export 4-14
modbus master communication 4-12
modbus slave communication 4-13
mode 5-29
monitor service viewer 6-78
multi trend 5-57
multiple gating point (MGP) 4-47, 4-49, 4-55,
4-73, 5-57
multiple point update wizard 4-97
@ptitude Observer 10.2, Revision N Index - 3 User Manual
N
network connectivity requirements 1-5
node 4-4
noise reduction 5-29
notes 5-86
notes tool B-1
O
on-line 4-7
OPC 4-38, 5-10
OPC channel 4-38
OPC server 4-38
external 4-40
internal 4-39
status tag 4-43
operating and storage conditions 4-58
orbit 5-50
P
palette steps 5-30
phase 5-33
picture 6-33
play sound 5-37
point 5-1
point settings 4-97
polar 5-68, B-4
print active window tool B-1
process overview 4-90
profile 5-52, B-3
protection view 5-13
R
raw 5-37
reference 5-30
remote monitoring possibilities 1-5
remove DC 5-30, 5-81
restart 4-23
roles 6-21
rotation 5-45
roundness 5-52, B-3
runout compensation 4-85, 5-30
S
save to diagram box 5-30
scale 5-30, 5-33
scale type 5-30
scaling 5-30
scheduled dynamic data storage 4-61
sectors 5-30
security roles 6-21
SEE 4-46
sensor 4-7, 5-69
set component 5-59
set speed 5-30
set time 4-23
settling time 4-28
shaft 4-87, 5-30, 5-53, 5-69
shaft centerline 4-46, 4-52, 4-86, 5-17, 5-19,
5-69
shaft cycle time 5-30
show bottom pane tool B-2
show phase 5-30
show pulses 5-30
show tree view tool B-2
show values 5-30
side band marker 5-32
sidebands 5-32
simultaneous data sampling 6-50
simultaneous measurement group 6-54
single cursor 5-31
sound card 5-37
spectra 5-33
spike filter 4-61
start/stop markers 5-30
status, hierarchy view 5-3
status, OPC server 4-43
sub machine, create 4-6
switch user type at logon 3-2
synchronize 4-22, 4-23
system configuration 4-1
system log 6-32
system view 5-10
T
tag 4-38
teeth 5-53
time signal 5-33
time signal display 5-41
time synchronization thresholds 6-76
time waveform 5-33, 5-37
toolbars B-1
topology 5-47
transducer angle 4-28, 4-31, 5-17, 5-19,
5-69
transient group 6-54, 6-57
trend 5-54
Index - 4 @ptitude Observer 10.2, Revision N User Manual
U
unit 5-31
unroundness 5-52, B-3
user preferences 6-9
user preferences, process overview settings
6-14
user rights 6-21
users 6-26
users rights 6-26
V
visible trend 5-60
W
warning 5-54, 5-65, 6-50
waterfall 5-45
wheel 5-52, B-3
wizard
machine copy 4-93
multiple point update 4-97
workspace manager 6-7
workspace view 5-11
X
x-axis 5-31
Y
y-axis 5-31
Z
z-axis 5-31
zero padding 5-31
zoom 5-32, 5-45, 5-54