Size and Determinants of Capital Structure in the Greek Manufacturing Sector
16
International Review of Applied Economics, Vol. 18, No. 2, 247–262, April 2004 ISSN 0269-2171 print; ISSN 1465-3486 online/04/020247-16 © 2004 Taylor & Francis Ltd. DOI: 10.1080/0269217042000186714 Size and Determinants of Capital Structure in the Greek Manufacturing Sector F. VOULGARIS*, D. ASTERIOU** & G. AGIOMIRGIANAKIS*** *Technological Educational Institute of Crete, Greece; **City University, London, UK; ***Hellenic Open University and City University, London, UK Taylor and Francis Ltd CIRA100106.sgm 10.1080/026921704200018714 International Review of Applied Economics 0269-2171 (print)/1465-3486 (online) Original Article 2004 Taylor & Francis Ltd 18 2 000000April 2004 GeorgeAgiomirgianakis Hellenic Open UniversitySahtouri 16 and Agiou AndreouPatrasGreece +30-2610-361495 +30-2610-361410 [email protected] ABSTRACT Increasing competition in the European Union (EU) and world markets affects the Greek manufacturing sector. Capital structure is essential for the survival, growth and performance of a firm. There has been a growing interest worldwide in identi- fying the factors associated with debt leverage. However, nothing has been done so far in contrasting small and medium sized enterprises (SMEs) and large sized enterprises (LSEs) on these aspects. SMEs are very important in the Greek manufacturing sector for employ- ment and growth. Empirical studies show that capital structure and the factors affecting it vary with firm size. In this paper we investigate the determinants of capital structure of Greek manufacturing firms and formulate some policy implications that may improve the financial performance of the sector. Our study utilizes panel data of two random samples, one for SMEs and another for LSEs. The findings show that profitability is a major deter- minant of capital structure for both size groups. However, efficient assets management and assets growth are found essential for the debt structure of LSEs as opposed to efficiency of current assets, size, sales growth and high fixed assets, which were found to affect substan- tially the credibility of SMEs. In an era of increasing globalization, the findings imply that Greek SMEs should focus their efforts on (a) increasing their cash flow capacity through better assets management and achievement of higher exports and (b) ensuring good bank relations, but at the same time, turn to alternative forms of financing. Greek LSEs should adopt strategies that will lead to the improvement of their competitiveness and securing new forms of financing. Government policy measures aiming at structural changes and economic efficiency should be designed clearly depending upon its targets: SMEs need poli- cies that will encourage information exchange and co-operation in local and foreign markets and use of e-business, as well as, financial assistance. On the other hand, LSEs should be supported by policies aimed at new high-technology investments, entrance of new firms and foreign investments in the country, tax alleviation and increase of R&D and training expenditures. The upgrading and transparency of the capital market in Greece is expected to improve the capital structure of Greek manufacturing firms. KEY WORDS: Capital structure; industry study; manufacturing; dynamic panel data; non-linear regression analysis Correspondence Address: George Agiomirgianakis, Hellenic Open University, Sahtouri 16 and Agiou Andreou, Patras, Greece. Tel: +30-2610-361495; Fax +30-2610-361410; Email: [email protected]
-
Upload
independent -
Category
Documents
-
view
2 -
download
0
Transcript of Size and Determinants of Capital Structure in the Greek Manufacturing Sector

International Review of Applied Economics,Vol. 18, No. 2, 247–262, April 2004
ISSN 0269-2171 print; ISSN 1465-3486 online/04/020247-16 © 2004 Taylor & Francis Ltd.DOI: 10.1080/0269217042000186714
Size and Determinants of Capital Structure in the Greek Manufacturing Sector
F. VOULGARIS*, D. ASTERIOU** & G. AGIOMIRGIANAKIS***
*Technological Educational Institute of Crete, Greece; **City University, London, UK; ***Hellenic Open University and City University, London, UKTaylor and Francis LtdCIRA100106.sgm10.1080/026921704200018714International Review of Applied Economics0269-2171 (print)/1465-3486 (online)Original Article2004Taylor & Francis Ltd182000000April 2004GeorgeAgiomirgianakisHellenic Open UniversitySahtouri 16 and Agiou [email protected]
ABSTRACT Increasing competition in the European Union (EU) and world marketsaffects the Greek manufacturing sector. Capital structure is essential for the survival,growth and performance of a firm. There has been a growing interest worldwide in identi-fying the factors associated with debt leverage. However, nothing has been done so far incontrasting small and medium sized enterprises (SMEs) and large sized enterprises (LSEs)on these aspects. SMEs are very important in the Greek manufacturing sector for employ-ment and growth. Empirical studies show that capital structure and the factors affecting itvary with firm size. In this paper we investigate the determinants of capital structure ofGreek manufacturing firms and formulate some policy implications that may improve thefinancial performance of the sector. Our study utilizes panel data of two random samples,one for SMEs and another for LSEs. The findings show that profitability is a major deter-minant of capital structure for both size groups. However, efficient assets management andassets growth are found essential for the debt structure of LSEs as opposed to efficiency ofcurrent assets, size, sales growth and high fixed assets, which were found to affect substan-tially the credibility of SMEs. In an era of increasing globalization, the findings imply thatGreek SMEs should focus their efforts on (a) increasing their cash flow capacity throughbetter assets management and achievement of higher exports and (b) ensuring good bankrelations, but at the same time, turn to alternative forms of financing. Greek LSEs shouldadopt strategies that will lead to the improvement of their competitiveness and securingnew forms of financing. Government policy measures aiming at structural changes andeconomic efficiency should be designed clearly depending upon its targets: SMEs need poli-cies that will encourage information exchange and co-operation in local and foreignmarkets and use of e-business, as well as, financial assistance. On the other hand, LSEsshould be supported by policies aimed at new high-technology investments, entrance of newfirms and foreign investments in the country, tax alleviation and increase of R&D andtraining expenditures. The upgrading and transparency of the capital market in Greece isexpected to improve the capital structure of Greek manufacturing firms.
KEY WORDS: Capital structure; industry study; manufacturing; dynamic panel data; non-linear regression analysis
Correspondence Address: George Agiomirgianakis, Hellenic Open University, Sahtouri 16 and AgiouAndreou, Patras, Greece.Tel: +30-2610-361495; Fax +30-2610-361410; Email: [email protected]
248 D. Asteriou et al.
Introduction
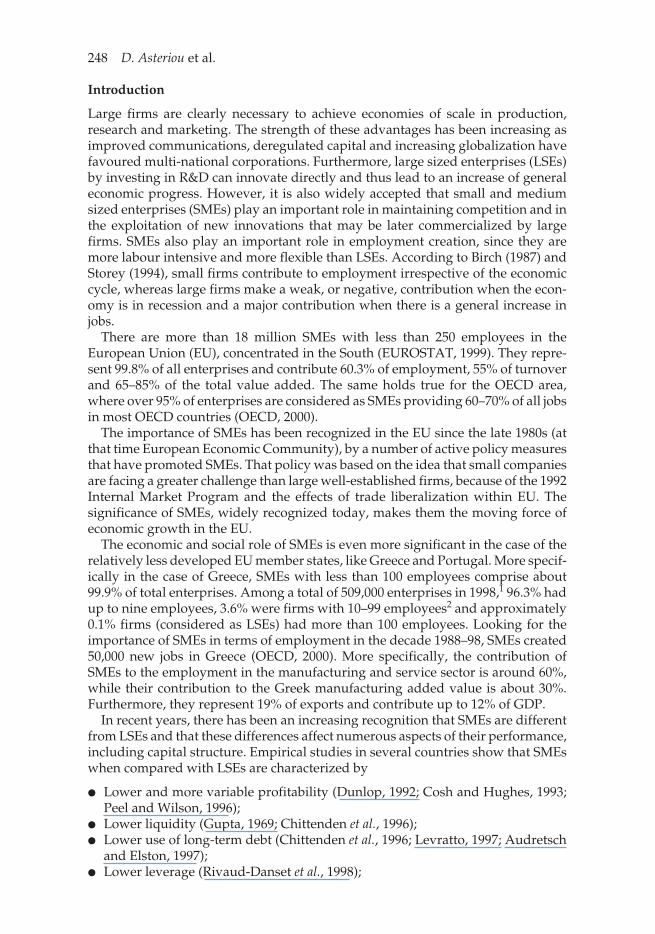
Large firms are clearly necessary to achieve economies of scale in production,research and marketing. The strength of these advantages has been increasing asimproved communications, deregulated capital and increasing globalization havefavoured multi-national corporations. Furthermore, large sized enterprises (LSEs)by investing in R&D can innovate directly and thus lead to an increase of generaleconomic progress. However, it is also widely accepted that small and mediumsized enterprises (SMEs) play an important role in maintaining competition and inthe exploitation of new innovations that may be later commercialized by largefirms. SMEs also play an important role in employment creation, since they aremore labour intensive and more flexible than LSEs. According to Birch (1987) andStorey (1994), small firms contribute to employment irrespective of the economiccycle, whereas large firms make a weak, or negative, contribution when the econ-omy is in recession and a major contribution when there is a general increase injobs.
There are more than 18 million SMEs with less than 250 employees in theEuropean Union (EU), concentrated in the South (EUROSTAT, 1999). They repre-sent 99.8% of all enterprises and contribute 60.3% of employment, 55% of turnoverand 65–85% of the total value added. The same holds true for the OECD area,where over 95% of enterprises are considered as SMEs providing 60–70% of all jobsin most OECD countries (OECD, 2000).
The importance of SMEs has been recognized in the EU since the late 1980s (atthat time European Economic Community), by a number of active policy measuresthat have promoted SMEs. That policy was based on the idea that small companiesare facing a greater challenge than large well-established firms, because of the 1992Internal Market Program and the effects of trade liberalization within EU. Thesignificance of SMEs, widely recognized today, makes them the moving force ofeconomic growth in the EU.
The economic and social role of SMEs is even more significant in the case of therelatively less developed EU member states, like Greece and Portugal. More specif-ically in the case of Greece, SMEs with less than 100 employees comprise about99.9% of total enterprises. Among a total of 509,000 enterprises in 1998,1 96.3% hadup to nine employees, 3.6% were firms with 10–99 employees2 and approximately0.1% firms (considered as LSEs) had more than 100 employees. Looking for theimportance of SMEs in terms of employment in the decade 1988–98, SMEs created50,000 new jobs in Greece (OECD, 2000). More specifically, the contribution ofSMEs to the employment in the manufacturing and service sector is around 60%,while their contribution to the Greek manufacturing added value is about 30%.Furthermore, they represent 19% of exports and contribute up to 12% of GDP.
In recent years, there has been an increasing recognition that SMEs are differentfrom LSEs and that these differences affect numerous aspects of their performance,including capital structure. Empirical studies in several countries show that SMEswhen compared with LSEs are characterized by
● Lower and more variable profitability (Dunlop, 1992; Cosh and Hughes, 1993;Peel and Wilson, 1996);
● Lower liquidity (Gupta, 1969; Chittenden et al., 1996);● Lower use of long-term debt (Chittenden et al., 1996; Levratto, 1997; Audretsch
and Elston, 1997);● Lower leverage (Rivaud-Danset et al., 1998);

Size and Determinants of Capital Structure 249
● Higher short-term debt (Tamari, 1980; Cosh and Hughes, 1993; Rivaud-Dansetet al., 1998).
Capital structure, a crucial aspect in a firm’s performance, has occupied financialresearchers for a long time. Following Modigliani and Miller (1958) perfect capitalmarket propositions, many theories on the capital structure of the firm were devel-oped, which can be classified into three categories: (1) tax based theories, (2)agency cost theories and (3) asymmetric information theories. None of the abovetheories, however, makes distinction between small and large firms.
The paper focuses on detecting similarities and differences on the factors affect-ing gearing between both size groups. Theoretical and most empirical capitalstructure research has focused on the large business sector.
There is no doubt that both LSEs and SMEs are important for the developmentof the Greek economy. Greece’s accession in the EU, the entrance of Euro, the aboli-tion of import tariffs and export subsidies, the liberalization of the banking sector,the increasing globalization and the development of e-commerce have caused asharp increase in competition in Greek firms, especially in the manufacturingsector. Greek firms must be competitive in order to survive, but first they have tobe financially sound. Capital structure is essential to the financial performance andsurvival of a firm.
Existing literature on the capital structure of Greek firms has not investigated sofar the role of the firm size and the factors associated with it. The importance of thispaper is that, in a critical period for Greece, it investigates the factors that influencetheir capital structure. The theory of finance on capital structure is empiricallytested separately on Greek SMEs and LSEs by developing models containing thefactors that are expected to influence debt ratios. A comparison is given and policymeasures are formulated accordingly. The classification of firms into SMEs andLSEs will help in designing more appropriate and effective policies that will induceexpansion of each type of firm and a more harmonious cooperation among them.
Theories based on the tax advantages offered by debt argue that those firms withhigher profits should use more debt, thus substituting debt for equity to takeadvantage of the interest induced tax shields (Modigliani and Miller, 1963). Thisactually results in a trade-off between tax gains and increased bankruptcy cost,which will tend to increase the firms’ cost of capital.
Agency cost theories, the Pecking Order Framework (POF) proposed by Myers(1984), suggest that firms finance their tangible assets growth, first by use of inter-nally generated funds, second by debt and last by external equity issue, the reasonbeing the cost. Internal funds are considered cheap and not subject to outsideinterference resulting in a negative correlation between profitability and debt.Myers (1977) suggests a negative correlation between assets promising growthand debt leverage owing to the high risk of those investments, which lenders areunwilling to undertake. Long-term debt is therefore substituted by short-term debtresulting in a positive correlation of short-term debt and assets growth. On theother hand, a number of studies (see e.g. Jensen, 1986; Agarwal and Jayaraman,1994; Jaggi and Gul, 1999; Filbeck and Gorman, 2000) show a positive relationshipbetween asset productivity and debt.
Asymmetric information implies that there is positive correlation between debtand asset structure (high fixed assets ratio, high reliance on inventory, etc.) (Binksand Ennew, 1996). Leverage, defined as the amount of foreign capital (liabilities) acompany has on its balance sheet, is expected to grow with size, particularly if the

250 D. Asteriou et al.
legal protection of the lender is high. The findings of Rivaud-Danset et al. (1998)support that bankruptcy regulations, the accounting and financing practices of acountry, as well as the bank–firm relationship are among the determinants of afirm’s capital structure. The national financial features differ from country to coun-try, but they are also found to have a greater influence on small firms. Empiricaldata show that the capital structure of LSEs tends to be more homogeneous.
Although the above-mentioned theories did not make a distinction betweenSMEs and LSEs, Myers’ POF theory and the asymmetric information theoryprovide insights into variations in the capital structure. The ‘close’ nature of mostSMEs makes the problems of information asymmetry more severe for them, caus-ing lenders to rely particularly heavily on collateral to mitigate those problems.Furthermore, the issue of external equity is considered to be more expensive for anSME, also resulting in a loss of control of the enterprise by the original owner–manager. Other empirical studies (Gupta, 1969; Bates, 1971; Titman and Wessels,1988; Ang, 1991; Petersen and Rajan, 1995; Chittenden et al., 1996) suggest thatthere are differences in the capital structure between SMEs and LSEs and that debtstructure is a function of certain firm characteristics such as size, profitability, assetstructure, collateral, liquidity, age, access to capital markets, risk and growth.
The small size of Greek SMEs (an average of three employees per firm3) gener-ates financial problems because of limited equity capital and also limited access tobank financing, especially to long-term funds and venture capital. Their low cred-ibility in addition to their small size is often attributed to high asymmetric infor-mation costs between lenders and firms, as well as to the lack of collateral. Theabove conditions faced by Greek SMEs have resulted in a chronic problem ofaccess to financing. On the other hand, the liberalization of the banking sector,started in 1982 and continuing until 1991 (Provopoulos and Kapopoulos, 2001), ledto a relaxation of bank regulations and restraints and made the allocation of fundsmore competitive resulting in a differential treatment between SMEs and LSEs infavour of large firms. In addition to this, large Greek firms were able to borrowdirectly from international capital markets. The end result was for SMEs to feelmore the credit restraint, which was reflected in their high short-term bankborrowing. (For an excellent review of the above issues, see KEPE (1989) andLiargovas (1998).) Based on the theory and empirical evidence, we attempted toformulate testable propositions concerning the level of debt in SMEs and LSEs.
The hypotheses tested are:
● size is positively related to gearing;● asset structure (acting as collateral) is positively related to gearing;● profitability is negatively related to gearing;● growth is positively related to gearing;● stock level is positively correlated to gearing;● receivables are positively correlated to gearing.
The paper is organized as follows. The next section describes the data and meth-odology used and the following section provides the empirical results of the study.Finally, the last section draws conclusions and suggests policy measures.
Methodology
Our study is based on financial data collected from the balance sheets and incomestatements of 143 SMEs and 75 LSEs separately. The firms in both samples were
Size and Determinants of Capital Structure 251
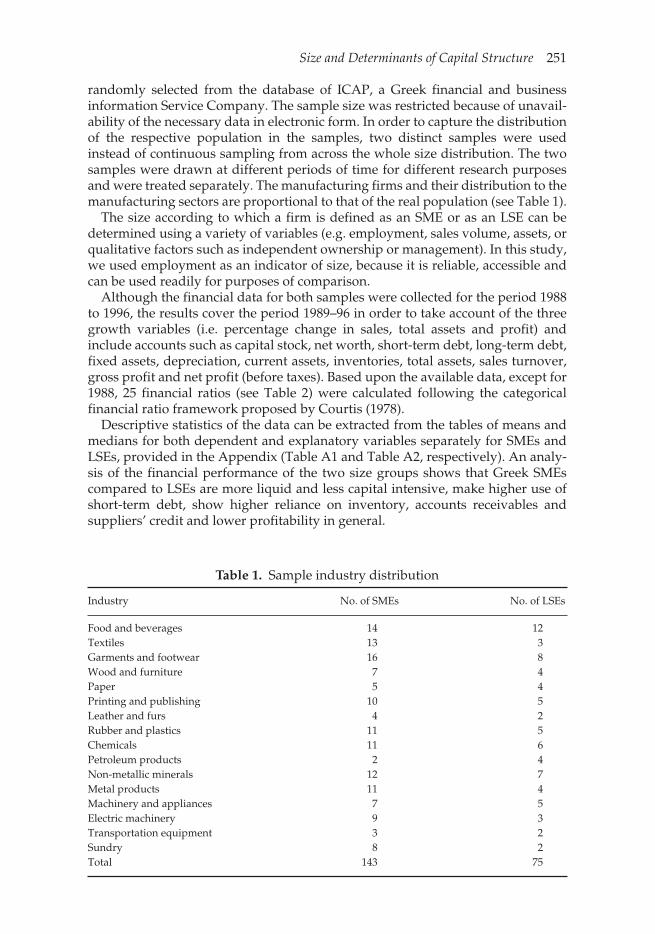
randomly selected from the database of ICAP, a Greek financial and businessinformation Service Company. The sample size was restricted because of unavail-ability of the necessary data in electronic form. In order to capture the distributionof the respective population in the samples, two distinct samples were usedinstead of continuous sampling from across the whole size distribution. The twosamples were drawn at different periods of time for different research purposesand were treated separately. The manufacturing firms and their distribution to themanufacturing sectors are proportional to that of the real population (see Table 1).
The size according to which a firm is defined as an SME or as an LSE can bedetermined using a variety of variables (e.g. employment, sales volume, assets, orqualitative factors such as independent ownership or management). In this study,we used employment as an indicator of size, because it is reliable, accessible andcan be used readily for purposes of comparison.
Although the financial data for both samples were collected for the period 1988to 1996, the results cover the period 1989–96 in order to take account of the threegrowth variables (i.e. percentage change in sales, total assets and profit) andinclude accounts such as capital stock, net worth, short-term debt, long-term debt,fixed assets, depreciation, current assets, inventories, total assets, sales turnover,gross profit and net profit (before taxes). Based upon the available data, except for1988, 25 financial ratios (see Table 2) were calculated following the categoricalfinancial ratio framework proposed by Courtis (1978).
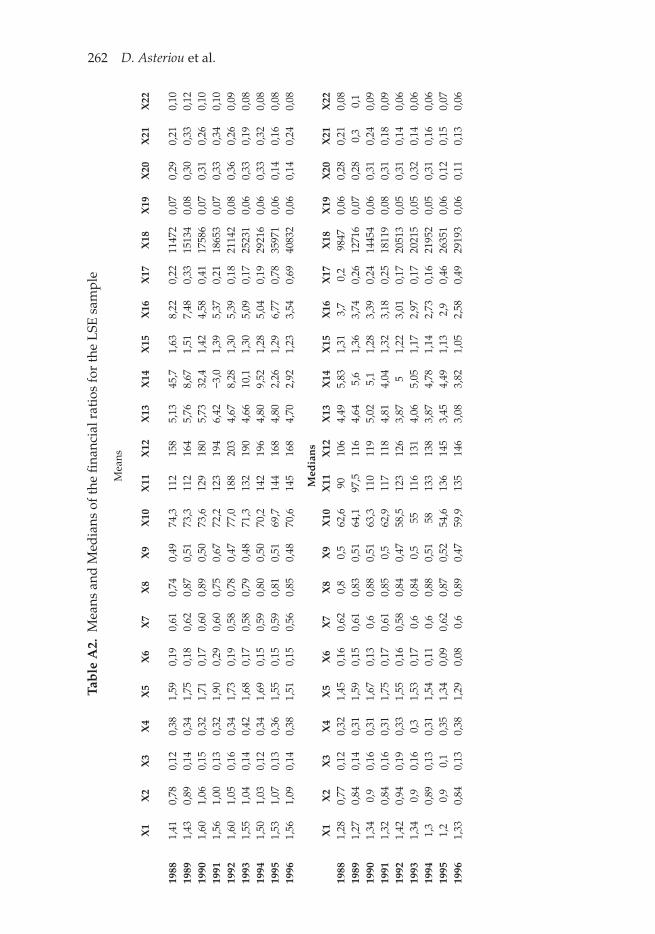
Descriptive statistics of the data can be extracted from the tables of means andmedians for both dependent and explanatory variables separately for SMEs andLSEs, provided in the Appendix (Table A1 and Table A2, respectively). An analy-sis of the financial performance of the two size groups shows that Greek SMEscompared to LSEs are more liquid and less capital intensive, make higher use ofshort-term debt, show higher reliance on inventory, accounts receivables andsuppliers’ credit and lower profitability in general.
Table 1. Sample industry distribution
Industry No. of SMEs No. of LSEs
Food and beverages 14 12Textiles 13 3Garments and footwear 16 8Wood and furniture 7 4Paper 5 4Printing and publishing 10 5Leather and furs 4 2Rubber and plastics 11 5Chemicals 11 6Petroleum products 2 4Non-metallic minerals 12 7Metal products 11 4Machinery and appliances 7 5Electric machinery 9 3Transportation equipment 3 2Sundry 8 2Total 143 75

252 D. Asteriou et al.
Along the lines suggested by Van der Wijst (1990), we adopted a general form ofthe empirical model given by
(1)
where, Yit is the variable to be explained (short run and long run debt, as well astotal debt and return to equity), Sit denotes size variable (in our case total assets),DCit is defined as depreciation charges over total costs, ASit is asset structure(given by fixed over total assets ratio), ITit is the inventory turnover, Xit is a set ofother explanatory variables, i is an index for firm, t is an index for time, b denotesthe coefficient to be estimated while finally uit is the disturbance term. The vari-ables DC, AS and IT are divided by their sample average values, so that the coeffi-cient b2 can be interpreted as the scale adjusted debt ratio.
Y b b S DC AS IT b X uit it itb
itb
itb
l l it itl
k
= + +=∑1 2 6
1
3 4 5 (exp ),
Table 2. Financial ratios selected for the regression analysis
Class Ratio
1. Solvency(a) Short-term liquidity X1 Current assets to current debt
X2 Quick assets to current debtX3 Net working capital to total assets
(b) Long-term liquidity X5 Long-term debt plus net worth to net fixed assets
2. Managerial performance(a) Asset-equity structure X4 Net fixed assets to total assets
X6 Long-term debt to total debtX7 Total debt to total assetsX9 Short-term debt to total assetsX8 Net worth to long-term capital
(b) Inventory X10 Inventory × 360 to sales(c) Credit policy X11 Creditors × 360 to sales
X12 Accounts payable × 360 to sales(d) Administration X18 Sales to number of employees
3. Profitability(a) Capital turnover X13 Sales to net fixed assets
X14 Sales to net working capitalX15 Sales to total assetsX16 Sales to net worth
(b) Profit margin X17 Net profit to gross profitX19 Net profit to salesX20 Gross profit to sales
(c) Return on investment X21 Net profit to net worth
X22 Net profit to total assets
4. GrowthX23 Percentage change in sales
X24 Percentage change in total assets
X25 Percentage change in net profits
Size and Determinants of Capital Structure 253
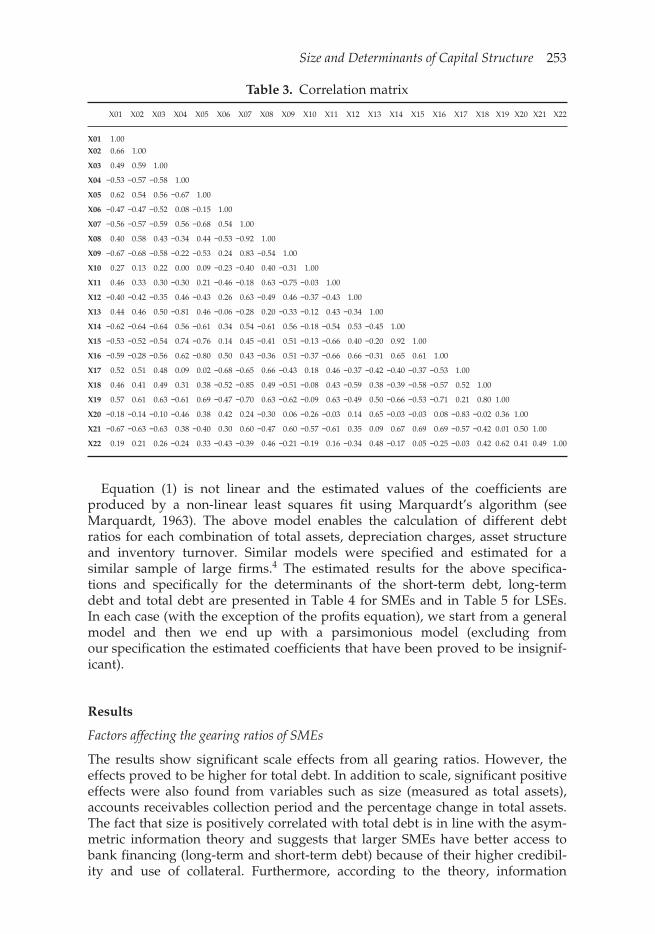
Equation (1) is not linear and the estimated values of the coefficients areproduced by a non-linear least squares fit using Marquardt’s algorithm (seeMarquardt, 1963). The above model enables the calculation of different debtratios for each combination of total assets, depreciation charges, asset structureand inventory turnover. Similar models were specified and estimated for asimilar sample of large firms.4 The estimated results for the above specifica-tions and specifically for the determinants of the short-term debt, long-termdebt and total debt are presented in Table 4 for SMEs and in Table 5 for LSEs.In each case (with the exception of the profits equation), we start from a generalmodel and then we end up with a parsimonious model (excluding fromour specification the estimated coefficients that have been proved to be insignif-icant).
Results
Factors affecting the gearing ratios of SMEs
The results show significant scale effects from all gearing ratios. However, theeffects proved to be higher for total debt. In addition to scale, significant positiveeffects were also found from variables such as size (measured as total assets),accounts receivables collection period and the percentage change in total assets.The fact that size is positively correlated with total debt is in line with the asym-metric information theory and suggests that larger SMEs have better access tobank financing (long-term and short-term debt) because of their higher credibil-ity and use of collateral. Furthermore, according to the theory, information
Table 3. Correlation matrix
X01 X02 X03 X04 X05 X06 X07 X08 X09 X10 X11 X12 X13 X14 X15 X16 X17 X18 X19 X20 X21 X22
X01 1.00X02 0.66 1.00
X03 0.49 0.59 1.00
X04 −0.53 −0.57 −0.58 1.00
X05 0.62 0.54 0.56 −0.67 1.00
X06 −0.47 −0.47 −0.52 0.08 −0.15 1.00
X07 −0.56 −0.57 −0.59 0.56 −0.68 0.54 1.00
X08 0.40 0.58 0.43 −0.34 0.44 −0.53 −0.92 1.00
X09 −0.67 −0.68 −0.58 −0.22 −0.53 0.24 0.83 −0.54 1.00
X10 0.27 0.13 0.22 0.00 0.09 −0.23 −0.40 0.40 −0.31 1.00
X11 0.46 0.33 0.30 −0.30 0.21 −0.46 −0.18 0.63 −0.75 −0.03 1.00
X12 −0.40 −0.42 −0.35 0.46 −0.43 0.26 0.63 −0.49 0.46 −0.37 −0.43 1.00
X13 0.44 0.46 0.50 −0.81 0.46 −0.06 −0.28 0.20 −0.33 −0.12 0.43 −0.34 1.00
X14 −0.62 −0.64 −0.64 0.56 −0.61 0.34 0.54 −0.61 0.56 −0.18 −0.54 0.53 −0.45 1.00
X15 −0.53 −0.52 −0.54 0.74 −0.76 0.14 0.45 −0.41 0.51 −0.13 −0.66 0.40 −0.20 0.92 1.00
X16 −0.59 −0.28 −0.56 0.62 −0.80 0.50 0.43 −0.36 0.51 −0.37 −0.66 0.66 −0.31 0.65 0.61 1.00
X17 0.52 0.51 0.48 0.09 0.02 −0.68 −0.65 0.66 −0.43 0.18 0.46 −0.37 −0.42 −0.40 −0.37 −0.53 1.00
X18 0.46 0.41 0.49 0.31 0.38 −0.52 −0.85 0.49 −0.51 −0.08 0.43 −0.59 0.38 −0.39 −0.58 −0.57 0.52 1.00
X19 0.57 0.61 0.63 −0.61 0.69 −0.47 −0.70 0.63 −0.62 −0.09 0.63 −0.49 0.50 −0.66 −0.53 −0.71 0.21 0.80 1.00
X20 −0.18 −0.14 −0.10 −0.46 0.38 0.42 0.24 −0.30 0.06 −0.26 −0.03 0.14 0.65 −0.03 −0.03 0.08 −0.83 −0.02 0.36 1.00
X21 −0.67 −0.63 −0.63 0.38 −0.40 0.30 0.60 −0.47 0.60 −0.57 −0.61 0.35 0.09 0.67 0.69 0.69 −0.57 −0.42 0.01 0.50 1.00
X22 0.19 0.21 0.26 −0.24 0.33 −0.43 −0.39 0.46 −0.21 −0.19 0.16 −0.34 0.48 −0.17 0.05 −0.25 −0.03 0.42 0.62 0.41 0.49 1.00

254 D. Asteriou et al.
Table 4. Estimation results for the determinants of the Greek SMEs (number of firms: 132; Years: 8 (1989–96); number of observations: 1136)
Reg 1 Reg 2 Reg 3 Reg 4 Reg 5 Reg 6
Dependent variable → Total debt/total Assets Short-term debt/total assets
Long-term debt/total debt
Intercept 0.655(20.91)*
0.656(21.24)*
0.407(25.0)*
0.406(26.1)*
0.169(12.6)*
0.170(12.7)*
Size 0.073(9.30)*
0.071(9.25)*
0.08(8.71)*
0.084(8.88)*
0.02(2.3)*
0.02(2.3)*
Liquidity proxy I current assets/short-term debt
— —
— —
−0.023(−13.6)*
−0.023(−13.62)*
0.02(6.41)*
0.018(11.6)*
Liquidity proxy II quick ratio −0.003(−1.57)
— —
— —
— —
−0.003(−0.92)
— —
Net working capital/total assets
−0.616(−17.66)*
−0.631(−18.9)*
— —
——
— —
— —
Asset structure net fixed assets/total assets
— —
— —
0.214(2.72)*
0.345(3.21)*
0.03(3.71)*
0.04(4.15)*
Avg. inventory period −0.0002(−1.99)*
−0.0002(−2.10)*
−0.00008(−0.04)
— —
−0.0007(−4.2)*
−0.0006(−4.7)*
Accounts receivable collection period
0.00001(8.56)*
0.0001(8.64)*
0.00005(2.1)*
0.00004(2.00)*
— —
— —
Fixed assets turnover 0.00003(1.39)
— —
— —
— —
−0.0002(−0.65)
— —
Net working capital turnover 0.00002(1.65)
— —
— —
— —
— —
— —
Interest rate proxy — —
— —
— —
— —
— —
— —
Efficiency proxy Sales/No. of employees
−0.00002(−1.27)
——
0.00006(2.35)*
0.00006(2.32)*
−0.0009(−3.6)*
−0.0008(−3.5)*
Net profit/sales 0.028(1.02)
— —
0.056(1.62)
— —
−0.105(−3.3)*
−0.08(−3.3)*
Net profit/net worth — —
— —
— —
— —
−0.006(−1.03)
— —
Net profit/total assets −0.520(−9.63)*
−0.484(−10.5)*
−0.653(−10.4)*
−0.654(−10.5)*
0.061(1.06)
— —
Sales (% change) 0.00005(0.68)
— —
−0.00008(−0.93)
— —
0.0002(2.91)*
0.0002(3.03)*
Total assets (% change) 0.0011(5.98)*
0.0011(6.15)*
0.0011(4.88)*
0.0011(4.80)*
— —
— —
Net profit (% change) −0.00003(−1.29)
−0.00006(−1.31)
— —
— —
——
——
R2 0.48 0.49 0.27 0.27 0.14 0.14
Notes: The estimation results are produced by a non-linear least squares fit using the Marquardt’s algo-rithm. Estimated t-statistics are printed beneath the estimated coefficients in parenthesis.*Indicates the t-statistics that give statistically significant estimates for 5%% level.

Size and Determinants of Capital Structure 255
asymmetry and moral hazard are greater for small firms, especially in the caseof Greece, because of lack of financial disclosure and their owner-managernature. The high cost of financing in Greece during the period in question accen-tuates the problem of access to financing of micro and small firms. On the otherhand, strict monetary and fiscal policy regulations mostly affect those smallenterprises that have little or no reputation and no long-standing bank relationsand which are charged with higher interest rates than large firms. This concurswith findings from other studies (see e.g. Titman and Wessels, 1988; Ang, 1991;Petersen & Rajan, 1995; Mira, 2002).
We also observe positive relationships between size and both long-term andshort-term debt.
Accounts receivables collection period has a significant positive impact onshort-term financing (see regression 4, Table 4) and since short-term debt consti-tutes the major component of total debt in SMEs in Greece, it also relates positivelywith total debt leverage. This positive correlation is explained by the fact thatSMEs make extensive use of relaxed credit terms as a way to promote their sales.According to financial theory and empirical evidence from the EU (Austria,Germany, Italy, Portugal, UK, France and Greece), SMEs turn to short-term debtto finance their increased working capital requirements due to restricted access tolong-term financing (Chittenden and Bragg, 1996).
Growth, measured as percentage change in total assets, was found to signifi-cantly affect total debt through higher use of short-term debt (see Table 4). This isalso along the lines of Myers’ agency cost and POF theory. Fast growing SMEs lacksufficient earnings to finance their financing needs. Furthermore, difficult access tothe capital market and to long-term borrowing results in higher use of short-termdebt in spite of the maturity matching principle of finance.
Although with a negative sign in all regressions, asset profitability (measured asnet profit before tax over total assets) was found to have a significant effect onshort-term and total debt gearing ratios. The negative correlation is explained bythe POF, which seems to be more relevant for small firms, since both the cost ofdebt and external equity are higher for them. It should be noted that during the
Table 5. Estimation results for the determinants of the Greek LSEs
Dependent variable
VariableX7 (Total debt/
total assets)X9 (Short-term debt/
total assets)X6 (Long-term
debt/total debt)
Constant 0.503 (17.91)* 0.336 (3.87)* 0.114 (2.47)*Net profit/sales −0.536 (−6.84)* −1.009 (−2.88)* −0.274 (−1.42)Gross profit/sales 0.039 (1.03) 0.233 (1.28) 0.612 (6.08)*Net fixed assets/total assets 0.006 (0.30) −0.029 (−0.31) 0.017 (0.33)Sales/total assets 0.069 (4.98)* 0.128 (2.89)* −0.051 (−2.24)*Sales (% change) 0.00007 (0.82) 0.000007 (0.02) −0.0003 (−0.98)Total assets (% change) 0.0003 (4.69)* 0.0006 (1.64) −0.0007 (−3.01)*Net profit (% change) −0.000004 (−1.26) −0.000007 (−0.36) −0.000004 (−0.36)R2 0.809 0.14 0.15Adjusted R2 0.807 0.13 0.14
*Denotes statistical significance for the 95%% level.Sample: 1988–96, T=9, T=75; Total panel (T × N) observations: 675.

256 D. Asteriou et al.
period under study, Greek firms were facing very high interest rates. A negativerelationship between gearing and profitability was also found in other empiricalresearch (see e.g. Kaplan and Urwitz, 1979; Kester, 1986; Van der Wijst and Turik,1993; Chittenden et al., 1996; Michaelas et al., 1999; Mira, 2002; Guha-Khasnobisand Bhaduri, 2002).
In line with the POF theory, a proxy for liquidity (net working capital/totalassets) was found to have a significant negative effect on total debt leverage ratio.Net working capital means long-term funds, which in the case of SMEs consistsmainly of a company’s own funs (i.e. profit and capital).
Although other findings show a positive correlation of stock level and gearingratios, the average inventory period variable here is found to be significant butwith a negative impact on total debt and long-term debt. The explanation of this isthat the build up of inventories in most cases in the Greek industry is related withinefficient management and therefore risky investments for banks.
The results indicate that size and a higher fixed-asset component are positivelyassociated with higher short-term as well as long-term debt. These findingssuggest that the larger a company and the more collateral it can provide in termsof fixed assets, the more the risks of information asymmetry are reduced and themore credit becomes available to small firms in Greece. This concurs with earlierresearch (Michaelas et al., 1999), although it is relevant only for long-term debt inother studies (see e.g. Van der Wijst, 1990; Van der Wijst and Thurik, 1993; Mira,2002).
Higher employee sales productivity and higher total assets growth are found toaffect short-term borrowing, indicating the importance of labour productivity andshort-term debt for Greek manufacturing SMEs. Empirical studies across countriesalso indicate the importance of short-term financing for small firms.
Finally, from the regression coefficient of the long-term debt model, we observethe existence of positive scale effects indicating the barriers to long-term financingfaced by smaller firms. Positive and significant effects on long-term debt were alsofound from liquidity, assets structure (fixed assets/total assets) and sales growthas expected (Korfiatis, 2001). As with the other gearing ratios, long-term debt is alsonegatively related to profitability and employee efficiency variables and the inven-tory build up. A detailed analysis of results can be found in Voulgaris et al. (2000).
Factors affecting gearing ratios of LSEs
The results of the regression models applied on the sample of large manufacturingfirms are shown in Table 5. The regression model allows for differences in thebehaviour of different firms and among different years assuming non-homogene-ity among sectors. As can be seen in Table 5, the regression coefficients found to besignificant are:
● Net profit (before tax)/sales for total debt, long-term and short-term debt;● Total assets growth for total debt;● Total assets turnover for both total debt and long-term debt;● Gross profit/sales for long-term debt.
The results also show that there are significant scale effects in all gearing ratiosfor LSEs as well.
As expected, net profitability is negatively correlated to both total debt and long-term debt in line with Myers’ POF theory. This suggests that large firms in Greece

Size and Determinants of Capital Structure 257
prefer to use retained profits in financing their needs and they use debt only whenadditional finance is essential. Here, the trade-off theory does not hold. It is inter-esting to note that profitability affects the maturity structure of debt. Thusalthough both gross and net profit margins are significant determinants of long-term debt, none of them seems to affect short-term borrowing. Gross profit marginis considered as an indicator of a manufacturing firm’s competitiveness and itsability to manage effectively its production costs. Consequently, higher grossprofit margins increase a firm’s credibility for long-term financing.
Total assets turnover affects positively total borrowing of LSEs but negativelylong-term financing. The positive correlation is explained by Jensen’s ‘free cashflow’ hypothesis, which states that under a high debt burden, firms are compelledto use their assets efficiently in order to pay interest payments (Filbeck andGorman, 2000). Furthermore, the period under study is characterized by tightmonetary policy in Greece that forced even large corporations to economize on theuse of available resources. The negative correlation with long-term debt couldmean that large manufacturing firms with low total assets turnover are basicallycapital-intensive firms with high added value, which need higher amount of long-term debt to finance their assets.
Assets growth affects positively total debt but has no significant effect on long-term or short-term debt. This indicates that fast growing firms use borrowed fundsto finance their high financing needs. Given the higher cost of equity issue, in linewith the POF theory, LSEs are likely to issue more debt (short-term or long-termdebt).
Conclusions
Aspects of a firm’s financial performance, which relate significantly with its capitaland debt structure, are investigated in this paper. The research covered the Greekmanufacturing sector, utilizing panel data of LSEs and SMEs samples. The find-ings suggest that there exist differences in the determinants of capital structureamong the two size groups. We find that for both SMEs and LSEs:
● debt increases with size;● debt correlates negatively with profitability as indicated by the pecking order
framework theory;● growth (measured as total assets increase) results in higher use of total debt,
basically through higher short-term debt.
The differences between the two types of firms are summarized in the following:
● The inventory and accounts receivables build up are found as determinants ofdebt only for SMEs. In the case of Greece, banks are reluctant to lend firms thatshow high inventory accumulation considering that as a sign of inefficientmanagement.
● Liquidity does not affect LSEs’ debt leverage, as opposed to SMEs.● Size of fixed assets and employee productivity are not shown as significant
determinants of LSEs’ capital structure, as in SMEs.● Productivity of assets does not affect the amount of financial liabilities of SMEs,
as it does for LSEs.● Higher profit margins were found to induce higher use of short-term debt only
for SMEs.

258 D. Asteriou et al.
Policy implications
Based on the findings of this study, we could suggest certain policy measures,which would help Greek manufacturing firms to obtain an optimal capital struc-ture. Specifically, the attitude of banks towards small sized firms should bechanged so that they provide easier access to long-term bank financing. In the caseof investments in new technology, state guarantees should be also provided. SMEsshould be acquainted with the new financial instruments like factoring, forfeiting,leasing and venture capital financing. They should be urged to use them tosupport their growth without increasing their debt burden to unacceptable levels.This will result in a decreased reliance of SMEs on short-term financing, which inmost cases increases financial costs for SMEs and lowers their profitability.
Since higher profits are negatively related to debt, measures could also bedirected towards a decrease of tax rates, especially for the small-size firms. Thiswill facilitate cash flow generating ability and self-financing, resulting in a health-ier debt structure.
Enactment of rules that will allow transparency of operations in the Greek stockmarket and a healthier development of the newly established capital market forSMEs will assist Greek firms into achieving a stronger capital structure. Further-more, establishment of good and steady bank–firm relations is of outmost impor-tance for SMEs and a prerequisite for ensuring adequate financing.
Finally, SMEs should place emphasis on hiring personnel specialized on inven-tory management and logistics, or train existing personnel on such matters, inorder to improve asset management and profitability. The expected outcome islower debt on their balance sheets. LSEs should be also supported by policiesfocusing on incentives for investments in new technology that will increase theircompetitiveness and their cash generating ability.
Increased competition in the EU integrated and global markets is expected tolower profit margins. Incentives for modernization plants and training of employ-ees on new technologies and contemporary managerial techniques will help bothGreek SMEs and LSEs to grow without heavy reliance on debt. Also, measurestowards simplifying administrative procedures, reducing paperwork, deregula-tion of markets and restriction of the public sector could substantially improve theefficiency of the Greek firms.
Acknowledgement
We wish to convey our thanks to an anonymous referee for pointing out a numberof useful clarifications and improvements to the original text in a constructive way.
Notes
1. 1998 Census.2. The classification system of SMEs and LSEs in Greece is based on the number of employees. Thus,
an SME is defined by EOMMEX (2000) as a firm having at most 100 employees on the averageduring the previous three years and an average annual turnover of less than or equal to 800 millionGRD during the same period. Firms with more than 100 employees and more than 800 million GRDturnover are considered LSEs. The relevant EU criterion for SMEs is up to 250 employees and anannual turnover not exceeding 40 million.
3. Here, by average we refer to the median value.4. In order to examine the possible degree of collinearity among our variables, we have obtained the
correlation matrix of dependent and independent variables we report in Table 3. As we observe in

Size and Determinants of Capital Structure 259
Table 3 the correlation coefficients are not sufficiently large to cause collinearity problems in ourestimated models.
References
Agarwal, A. & Jayaraman, N. (1994) The dividend policies of all-equity firms: a direct test of free cashflow theory, Managerial and Decision Economics, 15, pp. 139–148.
Ang, J. S. (1991) Small business uniqueness and the theory of financial management, Journal of SmallBusiness Finance, 1(1), pp. 1–13.
Audretsch, D. & Elston, J. (1997) Financing the German Mittelstand, Small Business Economics, 9,pp. 97–110.
Bates, J. (1971) The Financing of Small Business (London: Sweet and Maxwell).Binks, M. & Ennew, C. (1996) Growing firms and the credit constraint, Small Business Economics, 8, pp.
17–26.Birch, D. L. (1987) Job Creation in America: How our Smallest Companies Put the Most People to Work (New
York: The Free Press).Chittenden, F. & Bragg, R. (1996) Trade credit, cashflow and SMEs in the U.K., Germany and France,
International Small Business Journal, 16(1), pp. 22–35.Chittenden, F., Hall, G. & Hutchinson, P. (1996) Small firm growth, access to capital markets and
financial structure, a review of issues and an empirical investigation, Small Business Economics, 8,pp. 59–67.
Cosh, A. & Hughes, A. (1993) Size, financial structure and profitability: U.K. companies in the 1980’s,Working Paper, Small Business Research Center, University of Cambridge.
Courtis, K. J. (1978) Modeling a financial ratio categoric framework, Journal of Finance and Accounting,(Summer), pp. 219–223.
Dunlop, W. (1992) Small vs. large firms in Australian manufacturing, Small Business Economics, 4,pp. 45–58.
EOMMEX (2000) National policies for Greek SMEs, EOMMEX studies, Greece.EUROSTAT (1999) Statistics in focus, SME Statistics.Filbeck, G. & Gorman, R. (2000) Capital structure and asset utilization: the case of resource intensive
Industries, Resource Policy, 26(4), pp. 211–218.Gupta, M. C. (1969) The effects of size, growth and industry on the financial structure of manufacturing
companies, Journal of Finance, 24, pp. 517–529.Guha-Khasnobis, B. & Bhaduri, S. (2002) Determinants of capital structure in India (1990–1998): a
dynamic panel data approach, Journal of Economic Integration, 17(4), pp. 761–776.Jaggi, B. & Gul, F. (1999) An analysis of joint effects of investment opportunity set, free cash flows and
size on corporate debt policy, Review of Quantitative Finance and Accounting, 12, pp. 371–381.Jensen, M. C. (1986) Agency costs of free cash flow, corporate finance, and takeovers, American Economic
Review, 76, pp. 323–329.Kaplan, R. & Urwitz, G. (1979) Statistical models of bond ratings: a methodological inquiry, Journal of
Business, 52, pp. 231–261.KEPE (Center of Economic Planning and Research) (1989) Small and medium sized enterprises (SMEs).
Reports for the Program 1988–1992 (in Greek).Kester, W. C. (1986) Capital and ownership structure: a comparison of United States and Japanese
manufacturing corporations, Financial Management, (5 Spring), pp. 5–16.Korfiatis, Ch. (2001) The great bet of industrial competition, Vima, 12 August 2001, Sunday edition,
pp. B10–11 (in Greek).Levratto, N. (1997) Small firms finance in France, Small Business Economics, 8, pp. 279–295.Liargovas, P. (1998) The White Paper on Growth, Competitiveness and Employment and Greek small and
medium sized enterprises, Small Business Economics, 11, pp. 201–214.Marquardt, D. (1963) An algorithm for least squares estimation of non-linear parameters, Journal of
Social Industrial and Applied Mathematics, 11, pp. 431–441.Michaelas, N., Chittenden, F. & Poutsiouris, P. (1999) Financial policy and capital structure choice
in U.K. SMEs: empirical evidence from company panel data, Small Business Economics, 12,pp. 113–130.
Mira, S. F. (2002) On capital structure in the small and medium enterprises: the Spanish case, Institutode Estudios Europeos, Universidad San Pablo–CEU, No. 2, March.
Modigliani, F. & Miller, M. (1958) The cost of capital, corporation finance and the theory of investment,American Economic Review, 48, pp. 261–297.
260 D. Asteriou et al.
Modigliani, F. & Miller, M. H. (1963) Corporate income taxes and the cost of capital: a correction, TheAmerican Economic Review, 53(2), pp. 433–443.
Myers, S. C. (1977) The determinants of corporate borrowing, Journal of Financial Economics, 5,pp. 147–175.
Myers, S. C. (1984) The capital structure puzzle, Journal of Finance, 34(3), pp. 575–592.OECD (2000) The OECD Small and Medium Enterprise Outlook, 2000 edition (Paris: OECD).Peel, M. J. & Wilson, N. (1996) Working capital and financial management practices in the small firm
sector, International Small Business Journal, 14(2), pp. 52–67.Petersen, M. A. & Rajan, R. G. (1995) The effect of credit market competition on lending relationships,
Quarterly Journal of Economics, 110, pp. 407–443.Provopoulos, G. & Kapopoulos, P. (2001) The Dynamics of the Greek Financial System (Athens: Kritiki) (in
Greek).Rivaud-Danset, R., Dubocage, E. & Salais, R. (1998) Comparison between the financial structure of SME
versus large enterprise using the BACH data base, Université Paris–Nord, Faculté de SciencesEconomiques, June.
Storey, D. J. (1994) Understanding the Small Business Sector (London: Routledge).Tamari, M. (1980) The financial structure of the small firm—an international comparison of corpo-
rate accounts in the U.S.A., France, U. K., Israel and Japan, American Journal of Small Business, 4,pp. 20–34.
Titman, S. & Wessels, R. (1988) The determinants of capital structure choice, Journal of Finance, 43(1),pp. 1–19.
Van der Wijst, N. (1990) Modelling interfirm comparisons in small business, Omega International Journalof Management Science, 18(2), pp. 123–129.
Van der Wijst, N. & Turik, R. (1993) Determinants of small firms debt ratios: an analysis of retail paneldata, Small Business Economics, 5, pp. 55–65.
Voulgaris, F., Asteriou, D. & Agiomirgianakis, G. (2000) Financial development and financial structureof industrial SMEs: the case of Greece, European Research Studies, 3(3–4), pp. 95–109.

Size and Determinants of Capital Structure 261
Tab
le A
1.M
eans
and
Med
ians
of t
he fi
nanc
ial r
atio
s fo
r th
e SM
E s
ampl
e
Mea
ns
X1
X2
X3
X4
X5
X6
X7
X8
X9
X10
X11
X12
X13
X14
X15
X16
X17
X18
X19
X20
X21
X22
1988
1,95
1,20
0,19
0,36
2,76
0,21
0,57
0,82
0,46
99,4
122,
215
6,4
10,7
6,9
1,36
5,53
0,09
1016
80,
030,
250,
160,
0619
892,
011,
280,
190,
352,
770,
210,
570,
810,
4610
2,9
120,
215
6,4
9,1
3,4
1,37
2,27
0,14
1123
90,
040,
250,
190,
0619
902,
421,
480,
200,
342,
310,
200,
570,
830,
4710
1,7
123,
615
0,4
7,1
4,5
1,37
4,19
4,43
1223
70,
030,
250,
030,
0519
912,
561,
400,
190,
332,
440,
180,
580,
860,
4810
2,3
121,
315
6,5
7,9
76,3
1,42
3,67
0,13
1402
10,
020,
250,
130,
0519
922,
161,
220,
170,
353,
180,
160,
540,
700,
4592
,311
8,9
155,
411
,8−2
,61,
302,
840,
0817
296
0,02
0,28
0,27
0,04
1993
1,68
1,08
0,17
0,35
11,3
90,
140,
550,
860,
4811
6,5
157,
020
7,1
50,0
50,6
1,18
4,00
−0,0
318
208
0,04
0,29
0,09
0,06
1994
1,92
1,30
0,18
0,37
2,81
0,14
0,57
0,86
0,49
106,
120
3,7
190,
98,
922
,91,
163,
920,
0722
626
0,04
0,23
0,10
0,05
1995
2,30
1,60
0,21
0,34
3,80
0,12
0,56
0,87
0,48
123,
227
6,0
241,
611
,4−7
,61,
164,
03−1
,45
2436
70,
260,
230,
120,
0519
962,
161,
520,
190,
392,
910,
130,
520,
900,
4621
2,6
237,
424
5,9
9,0
2,6
1,07
2,76
0,04
2382
80,
000,
230,
080,
03
Med
ian
sX
1X
2X
3X
4X
5X
6X
7X
8X
9X
10X
11X
12X
13X
14X
15X
16X
17X
18X
19X
20X
21X
2219
881,
410,
850,
180,
361,
520,
120,
570,
860,
4569
,310
3,3
123,
63,
594,
541,
152,
940,
1464
580,
030,
230,
100,
0419
891,
380,
860,
180,
361,
530,
110,
580,
870,
4664
,910
3,9
114,
23,
624,
801,
232,
930,
1875
800,
040,
210,
120,
0519
901,
420,
850,
180,
351,
570,
130,
590,
870,
4767
,510
4,5
121,
33,
914,
511,
233,
020,
1488
200,
030,
220,
090,
0419
911,
450,
890,
210,
321,
690,
090,
570,
910,
4862
,310
6,2
116,
44,
054,
081,
273,
310,
1894
810,
040,
240,
130,
0519
921,
380,
860,
170,
341,
480,
070,
560,
930,
4462
,910
9,5
130,
03,
524,
471,
162,
710,
1612
361
0,03
0,23
0,08
0,04
1993
1,34
0,90
0,15
0,35
1,42
0,06
0,56
0,93
0,46
62,7
132,
014
4,1
3,34
4,84
1,12
2,72
0,14
1318
40,
030,
260,
100,
0319
941,
410,
890,
190,
321,
550,
050,
580,
940,
4570
,613
9,0
148,
23,
243,
861,
022,
500,
1315
442
0,03
0,23
0,08
0,03
1995
1,42
0,95
0,20
0,28
1,58
0,05
0,60
0,95
0,49
71,7
147,
614
9,7
3,92
3,60
1,05
2,69
0,18
1620
40,
040,
220,
110,
0419
961,
410,
900,
180,
311,
490,
040,
520,
950,
4664
,016
2,5
158,
63,
023,
100,
912,
080,
1817
022
0,03
0,21
0,06
0,03
Ap
pen
dix
262 D. Asteriou et al.
Tab
le A
2.M
eans
and
Med
ians
of t
he fi
nanc
ial r
atio
s fo
r th
e L
SE s
ampl
e
Mea
ns
X1
X2
X3
X4
X5
X6
X7
X8
X9
X10
X11
X12
X13
X14
X15
X16
X17
X18
X19
X20
X21
X22
1988
1,41
0,78
0,12
0,38
1,59
0,19
0,61
0,74
0,49
74,3
112
158
5,13
45,7
1,63
8,22
0,22
1147
20,
070,
290,
210,
1019
891,
430,
890,
140,
341,
750,
180,
620,
870,
5173
,311
216
45,
768,
671,
517,
480,
3315
134
0,08
0,30
0,33
0,12
1990
1,60
1,06
0,15
0,32
1,71
0,17
0,60
0,89
0,50
73,6
129
180
5,73
32,4
1,42
4,58
0,41
1758
60,
070,
310,
260,
1019
911,
561,
000,
130,
321,
900,
290,
600,
750,
6772
,212
319
46,
42−3
,01,
395,
370,
2118
653
0,07
0,33
0,34
0,10
1992
1,60
1,05
0,16
0,34
1,73
0,19
0,58
0,78
0,47
77,0
188
203
4,67
8,28
1,30
5,39
0,18
2114
20,
080,
360,
260,
0919
931,
551,
040,
140,
421,
680,
170,
580,
790,
4871
,313
219
04,
6610
,11,
305,
090,
1725
231
0,06
0,33
0,19
0,08
1994
1,50
1,03
0,12
0,34
1,69
0,15
0,59
0,80
0,50
70,2
142
196
4,80
9,52
1,28
5,04
0,19
2921
60,
060,
330,
320,
0819
951,
531,
070,
130,
361,
550,
150,
590,
810,
5169
,714
416
84,
802,
261,
296,
770,
7835
971
0,06
0,14
0,16
0,08
1996
1,56
1,09
0,14
0,38
1,51
0,15
0,56
0,85
0,48
70,6
145
168
4,70
2,92
1,23
3,54
0,69
4083
20,
060,
140,
240,
08
Med
ian
sX
1X
2X
3X
4X
5X
6X
7X
8X
9X
10X
11X
12X
13X
14X
15X
16X
17X
18X
19X
20X
21X
2219
881,
280,
770,
120,
321,
450,
160,
620,
80,
562
,690
106
4,49
5,83
1,31
3,7
0,2
9847
0,06
0,28
0,21
0,08
1989
1,27
0,84
0,14
0,31
1,59
0,15
0,61
0,83
0,51
64,1
97,5
116
4,64
5,6
1,36
3,74
0,26
1271
60,
070,
280,
30,
119
901,
340,
90,
160,
311,
670,
130,
60,
880,
5163
,311
011
95,
025,
11,
283,
390,
2414
454
0,06
0,31
0,24
0,09
1991
1,32
0,84
0,16
0,31
1,75
0,17
0,61
0,85
0,5
62,9
117
118
4,81
4,04
1,32
3,18
0,25
1811
90,
080,
310,
180,
0919
921,
420,
940,
190,
331,
550,
160,
580,
840,
4758
,512
312
63,
875
1,22
3,01
0,17
2051
30,
050,
310,
140,
0619
931,
340,
90,
160,
31,
530,
170,
60,
840,
555
116
131
4,06
5,05
1,17
2,97
0,17
2021
50,
050,
320,
140,
0619
941,
30,
890,
130,
311,
540,
110,
60,
880,
5158
133
138
3,87
4,78
1,14
2,73
0,16
2195
20,
050,
310,
160,
0619
951,
20,
90,
10,
351,
340,
090,
620,
870,
5254
,613
614
53,
454,
491,
132,
90,
4626
351
0,06
0,12
0,15
0,07
1996
1,33
0,84
0,13
0,38
1,29
0,08
0,6
0,89
0,47
59,9
135
146
3,08
3,82
1,05
2,58
0,49
2919
30,
060,
110,
130,
06