Sixty-Seven Years of Land-Use Change in Southern Costa Rica
17
RESEARCH ARTICLE Sixty-Seven Years of Land-Use Change in Southern Costa Rica Rakan A. Zahawi 1 *, Guillermo Duran 2 , Urs Kormann 3 1 Las Cruces Biological Station, Organization for Tropical Studies, Apartado 73–8257, San Vito de Coto Brus, Costa Rica, 2 Centro de Recursos Hídricos para Centroamérica y el Caribe, Universidad Nacional de Costa Rica, Sede Chorotega, Liberia, Costa Rica, 3 Department of Agroecology, University of Goettingen, Grisebachstr. 6, D-37077, Goettingen, Germany * [email protected] Abstract Habitat loss and fragmentation of forests are among the biggest threats to biodiversity and associated ecosystem services in tropical landscapes. We use the vicinity of the Las Cru- ces Biological Station in southern Costa Rica as a regional case study to document seven decades of land-use change in one of the most intensively studied sites in the Neotropics. Though the premontane wet forest was largely intact in 1947, a wave of immigration in 1952 initiated rapid changes over a short period. Overall forest cover was reduced during each time interval analyzed (1947–1960, 1960–1980, 1980–1997, 1997–2014), although the vast majority of forest loss (>90%) occurred during the first two time intervals (1947–1960, 1960–1980) with an annual deforestation rate of 2.14% and 3.86%, respectively. The rate dropped to <2% thereafter and has been offset by forest recovery in fallow areas more recently, but overall forest cover has continued to decline. Approximately 27.9% of the study area is forested currently. Concomitantly, the region shifted from a single contiguous forest to a series of progressively smaller forest fragments with each successive survey. A strong reduction in the amount of core habitat was paralleled by an increased proportion of edge habitat, due to the irregular shape of many forest fragments. Structural connectivity, however, remains high, with an expansive network of >100 km of linear strips of vegetation within a 3 km radius of the station, which may facilitate landscape-level movement for some species. Despite the extent of forest loss, a substantial number of regional landscape-level studies over the past two decades have demonstrated the persistence of many groups of organisms such as birds and mammals. Nonetheless, the continued decline in the quantity and quality of remaining habitat (~30% of remaining forest is secondary), as well as the threat of an extinction debt (or time lag in species loss), may result in the extirpation of addi- tional species if more proactive conservation measures are not taken to reverse current trends–a pattern that reflects many other tropical regions the world over. PLOS ONE | DOI:10.1371/journal.pone.0143554 November 23, 2015 1 / 17 OPEN ACCESS Citation: Zahawi RA, Duran G, Kormann U (2015) Sixty-Seven Years of Land-Use Change in Southern Costa Rica. PLoS ONE 10(11): e0143554. doi:10.1371/journal.pone.0143554 Editor: Govindhaswamy Umapathy, Centre for Cellular and Molecular Biology, INDIA Received: August 10, 2015 Accepted: November 5, 2015 Published: November 23, 2015 Copyright: © 2015 Zahawi et al. This is an open access article distributed under the terms of the Creative Commons Attribution License, which permits unrestricted use, distribution, and reproduction in any medium, provided the original author and source are credited. Data Availability Statement: All shape files and supporting information are available at the following DOI location: http://dx.doi.org/10.5281/zenodo.31893. Funding: The Organization for Tropical Studies provided funds for data analysis and data acquisition (RZ). The Deutsche Forschungsgemeinschaft provided financial assistance for data analysis (UK). Competing Interests: The authors have declared that no competing interests exist.
-
Upload
khangminh22 -
Category
Documents
-
view
0 -
download
0
Transcript of Sixty-Seven Years of Land-Use Change in Southern Costa Rica

RESEARCH ARTICLE
Sixty-Seven Years of Land-Use Change inSouthern Costa RicaRakan A. Zahawi1*, Guillermo Duran2, Urs Kormann3
1 Las Cruces Biological Station, Organization for Tropical Studies, Apartado 73–8257, San Vito de CotoBrus, Costa Rica, 2 Centro de Recursos Hídricos para Centroamérica y el Caribe, Universidad Nacional deCosta Rica, Sede Chorotega, Liberia, Costa Rica, 3 Department of Agroecology, University of Goettingen,Grisebachstr. 6, D-37077, Goettingen, Germany
AbstractHabitat loss and fragmentation of forests are among the biggest threats to biodiversity and
associated ecosystem services in tropical landscapes. We use the vicinity of the Las Cru-
ces Biological Station in southern Costa Rica as a regional case study to document seven
decades of land-use change in one of the most intensively studied sites in the Neotropics.
Though the premontane wet forest was largely intact in 1947, a wave of immigration in 1952
initiated rapid changes over a short period. Overall forest cover was reduced during each
time interval analyzed (1947–1960, 1960–1980, 1980–1997, 1997–2014), although the
vast majority of forest loss (>90%) occurred during the first two time intervals (1947–1960,
1960–1980) with an annual deforestation rate of 2.14% and 3.86%, respectively. The rate
dropped to <2% thereafter and has been offset by forest recovery in fallow areas more
recently, but overall forest cover has continued to decline. Approximately 27.9% of the
study area is forested currently. Concomitantly, the region shifted from a single contiguous
forest to a series of progressively smaller forest fragments with each successive survey. A
strong reduction in the amount of core habitat was paralleled by an increased proportion of
edge habitat, due to the irregular shape of many forest fragments. Structural connectivity,
however, remains high, with an expansive network of >100 km of linear strips of vegetation
within a 3 km radius of the station, which may facilitate landscape-level movement for some
species. Despite the extent of forest loss, a substantial number of regional landscape-level
studies over the past two decades have demonstrated the persistence of many groups of
organisms such as birds and mammals. Nonetheless, the continued decline in the quantity
and quality of remaining habitat (~30% of remaining forest is secondary), as well as the
threat of an extinction debt (or time lag in species loss), may result in the extirpation of addi-
tional species if more proactive conservation measures are not taken to reverse current
trends–a pattern that reflects many other tropical regions the world over.
PLOS ONE | DOI:10.1371/journal.pone.0143554 November 23, 2015 1 / 17
OPEN ACCESS
Citation: Zahawi RA, Duran G, Kormann U (2015)Sixty-Seven Years of Land-Use Change in SouthernCosta Rica. PLoS ONE 10(11): e0143554.doi:10.1371/journal.pone.0143554
Editor: Govindhaswamy Umapathy, Centre forCellular and Molecular Biology, INDIA
Received: August 10, 2015
Accepted: November 5, 2015
Published: November 23, 2015
Copyright: © 2015 Zahawi et al. This is an openaccess article distributed under the terms of theCreative Commons Attribution License, which permitsunrestricted use, distribution, and reproduction in anymedium, provided the original author and source arecredited.
Data Availability Statement: All shape files andsupporting information are available at the followingDOI location: http://dx.doi.org/10.5281/zenodo.31893.
Funding: The Organization for Tropical Studiesprovided funds for data analysis and data acquisition(RZ). The Deutsche Forschungsgemeinschaftprovided financial assistance for data analysis (UK).
Competing Interests: The authors have declaredthat no competing interests exist.

IntroductionForested land is being cleared across the globe, leading not only to the loss of habitat and forestfragmentation, but subsequent detrimental effects on biodiversity, associated ecosystem func-tioning, and climate change e.g., [1–4]. Primarily driven by the rising demand for agriculturaland forest products [5–7], this process is particularly pronounced in tropical landscapes, whichare the biodiversity strongholds of the world [8]. Some studies estimate that up to 36% of tropi-cal and subtropical forests that are present today could disappear by 2050 [9], with inherentimpacts to biodiversity [10].
Although there are detailed indices for loss of forest cover at both the global and countrylevel e.g., [11–13], few studies examine land use conversion at finer spatial scales (e.g.,<1000km2) and over longer time spans, but see [14, 15]. This is surprising given that the functionalityof remaining habitat–including landscape-scale forest cover, patch size, and connectivity–arecritical for understanding small-scale shifts in patterns of biodiversity, and determining theprovision of ecosystem services in human-altered landscapes at the local level. Most such stud-ies conclude that forest cover is essential for the maintenance of biodiversity e.g., [16–20], andwith extensive field sampling predictive models can be developed for groups such as birds thatare based on the amount of remaining forest in a given area [21].
Determining change in land use over time is especially important in heavily researchedareas where it can serve to bolster the results of projects that have been conducted. For exam-ple, the Las Cruces Biological Station (LCBS) in southern Costa Rica, where this study isfocused, forms part of the Mesoamerican biodiversity hotspot [8] and has been a hub for tropi-cal research for over 50 years with more than 900 attributed publications. The LCBS reserve isone of the largest forest fragments in the area protecting ~365 ha of habitat, most of which isclassified as primary forest. Many researchers work on a landscape-level scale in the vicinity ofthe reserve, where changes in the land use of the area have directly impacted the type of studiesundertaken and skewed the majority of research to a more applied focus. For example, studieshave documented depauperate species communities in small forest fragments [20, 22, 23];impacts of forest fragmentation on fauna [19, 20, 24]; shifts in herpetofauna composition rela-tive to climate change [25]; and the impacts of fragmentation and isolation on the genetic pop-ulation dynamics of trees [26]. Most of these studies have restricted their analyses to theimpacts of current forest cover on biodiversity parameters, largely ignoring the importance ofthe legacy effect of previous forest configurations [27] in part because such data were lacking.This could prove deceptive as extinction debts, or the gradual loss of biodiversity as a result ofdeforestation, can take several decades or longer to transpire [28]. Furthermore, despite thedemonstrated capacity for forests to recover in this region after persistent pre-columbian dis-turbance [29, 30], the extent of clearing in recent times is unprecedented. Accordingly, thelong-term stability of remaining forested habitats in these areas is unclear making it essential toquantify recent historical parameters that can help evaluate how prior and present forest covermay impact biodiversity in the future.
Here we quantify a regional case study of land use change over a sixty-seven year period(1947–2014) using aerial photographs and satellite images taken of Coto Brus county in south-ern Costa Rica. Colonization of this part of Costa Rica occurred relatively late (1940s) and theregion soon faced an increasing influx of migrants in the mid 1950s with the settlement ofpost-WWII Italian refugees in the area [31]. To promote settlement by the Italians, the CostaRican government set aside 10,000 ha for colonization, which required clearing of substantialtracts of forest habitat. The development led to a boom in the county’s population growth overthe next decade, that resulted in most land being converted from forest to shade-grown coffeeproduction, and most farmers became heavily dependent on coffee agriculture for subsistence
Land-Use Change in Southern Costa Rica
PLOS ONE | DOI:10.1371/journal.pone.0143554 November 23, 2015 2 / 17

[32, 33]. Clearing of forest was also encouraged as a practice in Costa Rica, as in many otherparts of tropical America, as a means to lay initial ownership claims to a property [34].
Our goal in this study is to characterize the historical and concurrent forest cover in theregional area surrounding LCBS over this sixty-seven year period. In particular, we: (1) assessthe change in forest cover by comparing forest attributes over time (age, number, and size offorest patches); and (2) characterize historical and current forest landscapes using a suite ofderived parameters (forest structural connectivity, amount of forest edge, and amount of inte-rior or core forest) to generate a historical forest context for this part of Costa Rica that is criti-cal to furthering our understanding of biodiversity patterns and shifts in the present andfuture.
Materials and Methods
Study areaThe study area encompasses a 13 km radius centered at the Las Cruces Biological Station(LCBS; 8° 47' 7”N; 82° 57' 32”W) in Coto Brus county, southern Costa Rica (Fig 1). The arearanges in elevation from ~100–1500 m a.s.l. (based on the Shuttle Radar Topography Missiondigital elevation model), however, an elevation cutoff of>700 m.a.s.l. was selected as lowlandforest has been subjected to different historical selection pressures [31] than the mid-elevationhabitat surrounding the field station. Land to the east of the field station that is on the Panama-nian side of the border (~8 km away) was also excluded, as it would also be subject to the selec-tive pressures and historic events of that country (Fig 1). The remaining area, amounting to atotal of 32,076 ha (320 km2), is classified as a tropical premontane wet forest zone [35], andreceives a mean annual rainfall of 3.5–4 m with a pronounced dry season from December toMarch. Mean annual temperature at LCBS is ~21°C. No permission was required to conductthis study as all information was obtained from purchased/open access aerial images and/orsatellite flyovers. No endangered or protected species were involved in this study.
Images and orthorectificationFive time slices were analyzed based on the available set of aerial imagery: 1947 (B&W), 1960(B&W), 1980 (B&W), 1997 (true color) and a set of high-resolution Google images taken in2014 (Table 1). When last accessed (September 2015), Google imagery had 8.0% of the studyarea covered with lower resolution images. This region falls entirely under the Ngöbe indige-nous reserve at the western edge of the study area, a remote and rugged area with no roadaccess and where forest cover has not changed significantly during the period of this study.Accordingly, these areas were replaced with orthophotos taken in 2005; all analyses were con-ducted on this combined set of images, which we hereafter refer to as 2014.
Aerial photographs for the years 1947, 1960, 1980 and 1997 were acquired from the Organi-zation for Tropical Studies GIS Lab and the Instituto Geográfico Nacional of Costa Rica. Theorthorectification process was done first on the 1997 set of images and used the current1:50,000 and 1:25,000 Costa Rican cartography to identify geographical reference points. Theset of 1997 orthophotos was used as a reference set to orthorectify remaining years with theexception of 1947 images. The orthorectification process and all other geospatial analyses weredone on the CRTM05 spatial reference system and the resulting orthophotos had a 2m cellsize. The largest Root Mean Square error (RMSE) of the orthorectification of these three timeslices of aerial photographs was 15 m. Orthophotos of 2005 were accessed through the CentroNacional de Información Territorial Web Map Service of the Costa Rican government andwere displayed together with Google imagery on QGIS (version 2; http://qgis.osgeo.org) usingthe OpenLayers plugin.
Land-Use Change in Southern Costa Rica
PLOS ONE | DOI:10.1371/journal.pone.0143554 November 23, 2015 3 / 17

Given the lack of information on flight parameters, and the expansive forest coverage in 1947photographs, images were georeferenced and built into a mosaic using river basins and the fewforest clearings that had a similar shape in the 1960 flyover. The 1947 set of images did not coverthe whole study area, having empty areas without photographs that represented ˜12.1% of theanalysis extent. However, these areas could be classified as forested given that forest was present
Fig 1. Map of Costa Rica indicating the location of the study area. Areas highlighted in brown were excluded from analyses because they were below the700 m elevation cutoff, or were located in neighboring Panama.
doi:10.1371/journal.pone.0143554.g001
Land-Use Change in Southern Costa Rica
PLOS ONE | DOI:10.1371/journal.pone.0143554 November 23, 2015 4 / 17
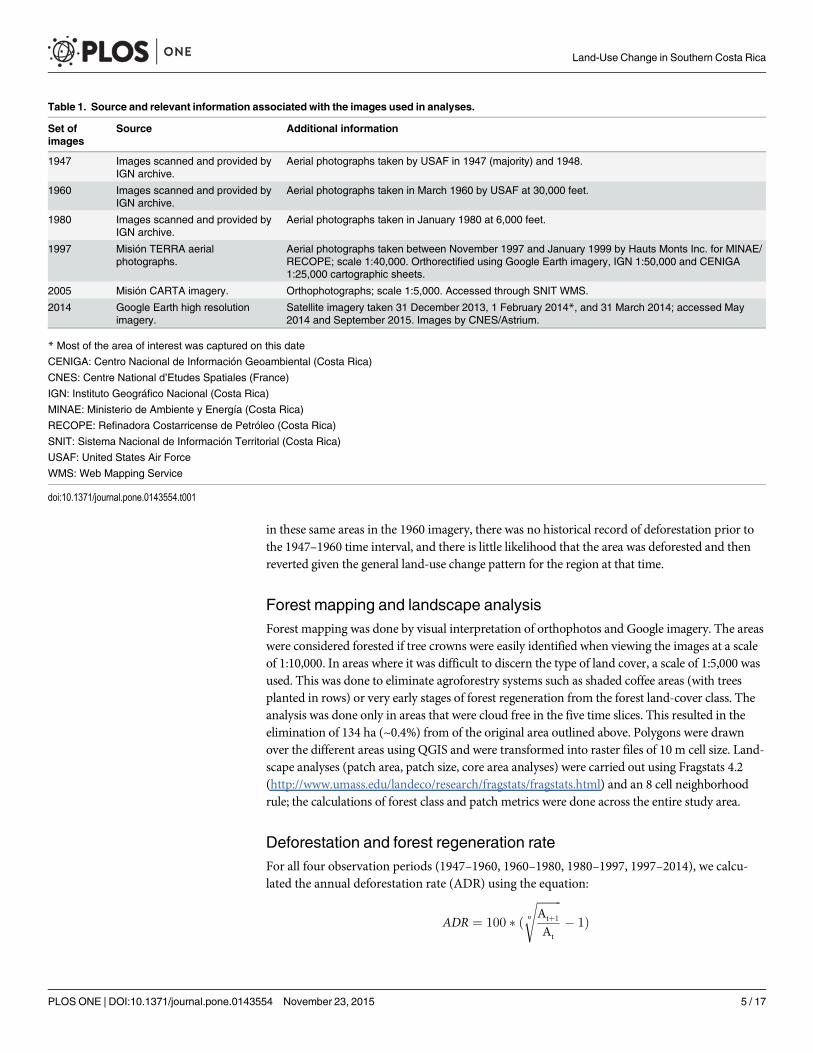
in these same areas in the 1960 imagery, there was no historical record of deforestation prior tothe 1947–1960 time interval, and there is little likelihood that the area was deforested and thenreverted given the general land-use change pattern for the region at that time.
Forest mapping and landscape analysisForest mapping was done by visual interpretation of orthophotos and Google imagery. The areaswere considered forested if tree crowns were easily identified when viewing the images at a scaleof 1:10,000. In areas where it was difficult to discern the type of land cover, a scale of 1:5,000 wasused. This was done to eliminate agroforestry systems such as shaded coffee areas (with treesplanted in rows) or very early stages of forest regeneration from the forest land-cover class. Theanalysis was done only in areas that were cloud free in the five time slices. This resulted in theelimination of 134 ha (~0.4%) from of the original area outlined above. Polygons were drawnover the different areas using QGIS and were transformed into raster files of 10 m cell size. Land-scape analyses (patch area, patch size, core area analyses) were carried out using Fragstats 4.2(http://www.umass.edu/landeco/research/fragstats/fragstats.html) and an 8 cell neighborhoodrule; the calculations of forest class and patch metrics were done across the entire study area.
Deforestation and forest regeneration rateFor all four observation periods (1947–1960, 1960–1980, 1980–1997, 1997–2014), we calcu-lated the annual deforestation rate (ADR) using the equation:
ADR ¼ 100 � ðffiffiffiffiffiffiffiffiffiAtþ1
At
n
s� 1Þ
Table 1. Source and relevant information associated with the images used in analyses.
Set ofimages
Source Additional information
1947 Images scanned and provided byIGN archive.
Aerial photographs taken by USAF in 1947 (majority) and 1948.
1960 Images scanned and provided byIGN archive.
Aerial photographs taken in March 1960 by USAF at 30,000 feet.
1980 Images scanned and provided byIGN archive.
Aerial photographs taken in January 1980 at 6,000 feet.
1997 Misión TERRA aerialphotographs.
Aerial photographs taken between November 1997 and January 1999 by Hauts Monts Inc. for MINAE/RECOPE; scale 1:40,000. Orthorectified using Google Earth imagery, IGN 1:50,000 and CENIGA1:25,000 cartographic sheets.
2005 Misión CARTA imagery. Orthophotographs; scale 1:5,000. Accessed through SNIT WMS.
2014 Google Earth high resolutionimagery.
Satellite imagery taken 31 December 2013, 1 February 2014*, and 31 March 2014; accessed May2014 and September 2015. Images by CNES/Astrium.
* Most of the area of interest was captured on this date
CENIGA: Centro Nacional de Información Geoambiental (Costa Rica)
CNES: Centre National d’Etudes Spatiales (France)
IGN: Instituto Geográfico Nacional (Costa Rica)
MINAE: Ministerio de Ambiente y Energía (Costa Rica)
RECOPE: Refinadora Costarricense de Petróleo (Costa Rica)
SNIT: Sistema Nacional de Información Territorial (Costa Rica)
USAF: United States Air Force
WMS: Web Mapping Service
doi:10.1371/journal.pone.0143554.t001
Land-Use Change in Southern Costa Rica
PLOS ONE | DOI:10.1371/journal.pone.0143554 November 23, 2015 5 / 17

where At is the overall forest area at the beginning of a time period; At+1 is the overall forestedarea, excluding regeneration, at the end of a given time period; n is the duration of the periodin years, and ADR the mean annual deforestation rate measured as a percentage. For the 2005/2014 time slice we used 2014 to determine the number of years as most of the study area (92%)was covered by this set of imagery.
Some forest regeneration occurred in the study area during the latter three time intervals.Accordingly we determined the annual reforestation rate (ARR) for three observation periods(1960–1980, 1980–1997, 1997–2014), defined as the amount of forest that has grown oncleared land during a given time period (t to t+1). We used the same equation as above to cal-culate ARR, using the overall deforested area at the beginning of a time period as At, and At
minus the newly reforested area at the end of the time period as At+1.
Structural connectivity analysisUsing a 3 km buffer around the perimeter of the Las Cruces reserve as a subsample (~5867.25ha total area analyzed), all live fences [36], small riverine corridors, and other tree coveredareas (those that were not previously considered forest due to their small size) were mapped todetermine fragment connectivity using the 2014 Google imagery, and viewed at a scale of1:5,000 sensu [37], (S1 Fig). For larger tree-covered areas such as shaded coffee systems orearly stages of forest regeneration with a few tree canopies present, a straight line was drawnthrough the middle of the area; if an area was connected to other strips of vegetation the lineswere considered to branch from the middle. The total length of all lines or strips of vegetationwas determined, as well as the total length of strips that connect any two or more forestpatches, strips that are connected to a single forest patch, and strips that are completelyisolated.
Results
Landscape changeTotal forest cover in the study region declined by 71.6% from ~31,489 ha in 1947, to ~8,951 hain 2014; roughly 27.9% of the study area is forested at present (Table 2, Fig 2). Most deforesta-tion occurred between 1960–1980 with an ADR of 3.86% (Fig 2); the rate was lower during thefirst time interval evaluated (2.14%). Although deforestation continued to occur, the rate slo-wed considerably during the later 1980–1997 period (ADR = 1.06%) but increased in 1997–2014 with an ADR = 1.89%. Almost all forest cover loss (>90%) occurred during the first twotime intervals (Table 2).
Concomitantly, forest patch size shifted from a large single area (1947, and to a lesser extent1960), to a number of progressively smaller forest patches (Fig 2). The majority of these patches
Table 2. Changes in various forest patch metrics during the sixty seven-year time period of the study.
1947 1960 1980 1997 2014
Forest cover (ha) 31,489 23,761 10,925 9,901 8,951
Forest cover (%) 98.2 74.1 34.1 30.9 27.9
Total length of edge (km) 104.13 1033.34 1233.20 1184.45 1435.88
Area-weighted mean distance between patches (m) N/A 22.93 46.79 44.60 53.28
Area-weighted mean of patch size (m2) N/A N/A 2,342 2,245 1,915
N/A–Not Applicable.
Due to the unbroken expanse of forested area in these years, certain calculations were not possible.
doi:10.1371/journal.pone.0143554.t002
Land-Use Change in Southern Costa Rica
PLOS ONE | DOI:10.1371/journal.pone.0143554 November 23, 2015 6 / 17

are in the 0.1–1 and 1–10 ha size classes today (Fig 3A). Notable remaining patches include theNgöbe indigenous reserve (western portion of the study area) and the LCBS reserve. Fragmen-tation continued to occur after 1980, but it was on a considerably lesser scale and fewer shiftsin the categorization of patch sizes are notable (Fig 3A), although the area-weighted mean ofpatch size continued to decline (Table 2). Similarly, core areas of forest habitat (using a 100 medge impact criteria) declined over time, from a singular large area to progressively smallerpatches (Fig 2, Fig 3B). Strikingly, the number of core forest patches (Fig 3B) is far fewer thanthe total number of forest patches (Fig 3A) as many are irregular and consequently fall intosmaller size classes, or are entirely dropped from the census as they lack a core area. Viewedalternately, the proximity of forest habitat to an edge was essentially inverted between 1947and 2014 with more than two thirds of remaining forest habitat today located<100 m from aforest edge (Fig 4).
Cumulative area of forest habitat and core forest area habitat (using the same 100 m dis-tance to edge criteria) show similar patterns over time (Fig 3C and 3D). However, the cumula-tive amount of core area (Fig 3C) as compared to overall forest area (Fig 3D) is substantiallylower from 1960 onward. A marked reduction in the amount of habitat present in large areas isnotable between 1960 and 1980, as well as a sharp reduction in overall forested habitat area.Not surprisingly, the amount of edge habitat increased significantly from a little over 100 kmin 1947 to more than 1,000 km in 1960 (Table 2). Although edge habitat continued to increase
Fig 2. Land use change at five time slices showing extent of forested and non-forested habitat in a 13 km radius around the Las Cruces BiologicalStation. Land <700 m in elevation was excluded from the analysis (SW region, largely), as was land that fell on the Panamanian side of the border (East).
doi:10.1371/journal.pone.0143554.g002
Land-Use Change in Southern Costa Rica
PLOS ONE | DOI:10.1371/journal.pone.0143554 November 23, 2015 7 / 17

in subsequent time periods, increments were more moderated. Nonetheless, the moderateincrease in edge habitat between 1960 and 1980 masks the ‘inversion’ of habitat from a primar-ily forested region (1960) to a highly fragmented one (1980) where the predominant habitat inthe landscape is now agricultural land (Fig 2).
Forest regenerationMost of the extant forest cover (8,951 ha) is old growth that was present before 1947 (Fig 3E).However, some new forest regenerated during the latter three time intervals and helped offsetoverall forest loss (Fig 5). Overall forest cover loss was offset by 602 ha of secondary growthduring 1960–1980 with an annual reforestation rate (ARR) of 0.38%, by 2,186 ha from 1980–1999 (ARR = 0.60%) and by 1,802 ha (ARR = 0.47%) for the most recent time interval. Theincrease in new forest habitat in the latter two sampling periods also created some largerpatches of secondary forest (10–100 ha size class; Fig 3E). Whereas secondary forest accountedfor only 5.5% of overall forest cover in 1980, by 2014 this proportion had increased to fully30.5% (2,731 ha; Fig 5). As of 2014, old growth forest covered only 19.4% of its historicalexpanse.
Fig 3. Land use change parameters over five time slices arranged by size class.Column (A) number of patches of forest in each size class; (B) numberof core patches (using a 100 m edge buffer) in each size class; (C) cumulative forest area grouped by size class; (D) cumulative core forest area (using a 100m edge buffer) grouped by size class; and (E) age classification of forest patches present in 2014 and grouped by size class.
doi:10.1371/journal.pone.0143554.g003
Land-Use Change in Southern Costa Rica
PLOS ONE | DOI:10.1371/journal.pone.0143554 November 23, 2015 8 / 17

Structural connectivityThe mean distance between forest patches in the study area doubled between 1960 and 2014(Table 2). Despite the increasing degree of isolation, and the extent of forest fragmentation, anetwork of 503 linear strips of vegetation was quantified in the 3 km radius surrounding LCBSin the 2014 survey totaling 102,099 linear meters. Of these strips, 19.8% connected two, ormore, patches of forest to each other and 45.3% were attached to one patch of forest. Of the155 forest patches found in this subsampled area, fifty-three (34.1%) were interconnected bylinear strips of vegetation.
DiscussionThe analysis of a seven-decade long trajectory revealed that approximately four fifths of theoriginal forest cover has been lost during this time period. Most loss occurred during the firstthree decades. We characterized the historical and current forest landscapes and documentednot only a 10-fold increase in the number of forest fragments, but also strong shifts towardssmaller size classes with most of the remaining forest habitat impacted by edge effects. Overallforest loss has been offset by natural regeneration, particularly in the most recent time period;however, fully 30% of remaining habitat is now classified as secondary forest.
Habitat loss and fragmentation are consistently associated with a decline in biodiversity andthe provision of ecosystem services [28, 38]. Despite the scale of forest loss in the study area,
Fig 4. Proportion of forest area remaining grouped by year and distance to nearest forest edge.
doi:10.1371/journal.pone.0143554.g004
Land-Use Change in Southern Costa Rica
PLOS ONE | DOI:10.1371/journal.pone.0143554 November 23, 2015 9 / 17

however, there is a perhaps surprisingly high degree of biodiversity present for a number of dif-ferent groups e.g., [17, 39–41]. A key factor in maintaining this diversity is the presence of theLas Cruces reserve. For example, avian mark and recapture studies have shown that forest spe-cies have a higher probability of survival in the LCBS fragment as compared to smaller forestfragments [19, 22], and communities in smaller fragments are less stable, due to higher coloni-zation levels, which maintain smaller fragments in a constant state of flux [42]. Some frugivoresmake additional use of the matrix surrounding LCBS for foraging, although to do so, speciesspend a much greater proportion of their time in the remaining old-growth trees that dot thelandscape [43]. Others maintain a genetically diverse population by using of the network of for-est fragments, as demonstrated for the White-ruffed Manakin [44]. Nonetheless, loss of habitat,and conversion to agriculture does lead to a decline in phylogenetic diversity among birds over-all–and this is particularly exacerbated under high-intensity agriculture [16].
Fig 5. Extant secondary forest cover in 2014 classified by age.Old growth forest (> 67 years) is also depicted. Note that there was no evidence of forestregeneration during the 1947–1960 time interval; accordingly, there are only three forest regeneration classifications.
doi:10.1371/journal.pone.0143554.g005
Land-Use Change in Southern Costa Rica
PLOS ONE | DOI:10.1371/journal.pone.0143554 November 23, 2015 10 / 17

We found a high degree of structural connectivity in the immediate area surrounding theLas Cruces reserve, with more that 100 km of fencerows and riparian strips in a 3 km radius.This landscape feature helps maintain regional biodiversity, providing connectivity for birds[45, 46], and expands the foraging range for many species e.g., [47]. Many other studies in trop-ical regions have demonstrated similar results for vertebrates e.g., [48–50], but also for beetles[51]. That said, the current distance weighted mean of ~53 m between forest fragments is sub-stantial for some species, given for example that many forest understory birds rarely crossclearings>30 m even with some measure of connectivity [52]. Using extensive field mist netsampling data in our region, researchers have been able to develop models that can estimateabundance and richness of bird fauna based on such precise land-cover variables [21, 53].Other fauna, such as reptiles and amphibians, also benefit from this expanded network–increasing their effective habitat by more than an order of magnitude [54]. Nonetheless, two-thirds of forest fragments in this sub-survey were isolated, leaving room for improvement oran opportunity for increased connectivity through additional fencerow plantings e.g., [37, 49].
Several studies in this area have examined the implications of forest fragmentation withrespect to the impact on ecosystem services. Karp et al. [55] demonstrated how birds canincrease the yield of agricultural crops by reducing infestation of pests–and showed that thiseffect was stronger in farms that had some degree of adjacent forest habitat. In turn, Hadleyand Betts [45] showed that the movement of a hummingbird species across this fragmentedlandscape was restricted to riparian strips–a finding that has strong implications for plant polli-nation and seed set [20]. Brosi et al. [56] examined the spatial ecology of bees, and although nodifference was found in diversity or abundance across different habitat types, a striking differ-ence was found in composition, with dominance by the alien honeybee Apis mellifera in pas-tures and social stingless bees adjacent to forest patches. Such disparities could have long-termimplications for the pollination success of plants in these habitats, with a corresponding impacton bee populations in the area. Interestingly, Euglossine bee abundance is positively relatedwith increasing fragment size, and richness and abundance are positively associated with theamount of fragment edge–likely due to their highly mobility among fragments [23].
Land-use change in southern Costa RicaDuring the time frame considered, the study region lost almost three quarters of its forestedhabitat. Not only was there wide-scale land conversion and habitat loss, but remaining forestedareas were reduced to progressively smaller patches and the predominance of secondary forestincreased. This pattern occurred in many other parts of the country [13, 57], but is not uniqueto Costa Rica–for example, Cayuela et al. [14] documented land-use change in the highlands ofChiapas over a 25 year period and noted an almost 50% decrease in forest cover along with aconcomitant ~200% increase in the number of forest fragments in the area. They also noted amajor decrease in the size of patches, from a primarily singular large fragment to progressivelysmaller ones.
Most deforestation in our study area occurred during the first two time intervals examined(1947–1960, 1960–1980); the latter interval coincides with the peak wave of deforestation thatoccurred in Costa Rica during the 1970s [58, 59]. Deforestation in Costa Rica during this peakperiod was geared primarily towards the establishment of cattle pastures. It was driven by aseries of complex factors including population growth, international market economics (espe-cially beef production), and settlement encouragement through government incentives [57–60]. In Coto Brus, however, most of the early deforestation (1950s and 1960s) was gearedtoward coffee production or simply to help secure land tenure claims, rather than beef produc-tion, in part due to the excellent potential for coffee cultivation and high yields compared to
Land-Use Change in Southern Costa Rica
PLOS ONE | DOI:10.1371/journal.pone.0143554 November 23, 2015 11 / 17

the rest of the country [34], but also due to the degree of isolation from the rest of the countryand poor road infrastructure [31]. Although coffee was the principal agricultural commodityfor the county for the most of the latter half of the 20th century, land under pasture cultivationcontinued to increase in the 1970s and 1980s as access to markets improved [31, 61].
Active measures to bring deforestation under control on a national level increased in thelate 1970s and 1980s with the establishment of the national parks system, a series of forestrylaws designed to regulate and discourage tree felling, and the cessation of pro-squatter laws;changes in market economics for the country also contributed [58, 62]. Although these newlaws may have impacted deforestation rates in Coto Brus, forest loss continued to occur but ona somewhat more reduced scale, as most forest had already been cleared by the time they cameinto effect.
The failure to renew the International Coffee Agreement in 1989 led the collapse of the cof-fee market in the early 1990s, and Coto Brus was one of the areas to suffer the most [32, 33].Farmers that remained switched to other forms of agriculture, particularly cattle production asthis required minimal financial investment, but also to other crops. Unfortunately high annualrainfall coupled with steep slopes do not lend themselves to cattle production and result in con-siderable soil degradation and loss of topsoil as has occurred in the older pastures in the studyarea [63].
Forest regeneration helped offset deforestation values, especially during the most recenttime interval. Most of the recent recovery occurred in fallowed coffee fields [32]. Some formeragricultural lands were also left to recover once secured in reserves (e.g., land acquisitions byLCBS and other private landowners) and was incentivized by strong changes in forest policylaw in the 1990s, which affected recovery in other parts of Costa Rica as well [62]. Interestingly,overall deforestation outpaced reforestation in all time intervals evaluated, even though theprovince of Puntarenas (to which the study area belongs) registered a net increase in forestcover for the last two decades [62]. Indeed, Costa Rica saw a net increase in reforestation ofmoist forest during the same time period and the highest such increase for Central America[64]. Future predictions of land use are, nonetheless, hard to discern given the complex interac-tions between local and distant drivers of land-use change in an ever more connected economy[65].
Evaluating the impact of current land-use distribution on biodiversityThe continued fragmentation of remaining habitat and the increased area of edge habitat canlead to a decline in species richness and composition of trees e.g., [66], reduce sexual reproduc-tion in animal-pollinated plants [44], and even impact the phylogenetic diversity of remainingindividuals along a forest edge [67]. At Las Cruces, fragmentation has skewed the phylogeneticcomposition of future tree generations of Symphonia globulifera due to the dominance of a fewisolated reproductive individuals, creating a potential regional genetic bottleneck [26]; similarresults of inbreeding in other tree species have been documented in other studies in Costa Rica[68]. Shifts in tree community composition have also been noted at Las Cruces and may bedriven by subtle changes in climate or long-term edge effects (Zahawi unpublished data). Mostremaining habitat in the study area is<100 m from a forest edge, a condition that applies tomore than 20% of the worlds’ forests today [69] and a cause for major concern as most edgeeffects operate in this range [70]. Tree mortality is particularly elevated up to 100 m from anedge [71], with strong negative effects up to 300 m for large canopy trees (>60 cm DBH) [72]that provide important ecological services such as fruit production and carbon storage.
Despite the resilience of most regional fauna to the sharp reduction in forest habitat, thereare considerable concerns for the region. First, the shift in land use toward greater reliance on
Land-Use Change in Southern Costa Rica
PLOS ONE | DOI:10.1371/journal.pone.0143554 November 23, 2015 12 / 17

pastoral agriculture [32] could reduce the degree of habitat permeability for forest-dependentspecies to move between forest patches. Numerous studies have shown that pasture is a partic-ularly poor habitat for fauna e.g., [73] and most animals actively avoid entering such areas. Fur-thermore, almost one third of remaining habitat is now classified as secondary forest, whichdoes not support the same species composition as that found in mature forest. Second, whereasresilience of species has been shown to be strong, the threat of an extinction debt for most spe-cies is far greater when regional forest cover is reduced to less than 30% [74], as is the case inthis study area. This effect is likely exacerbated for species that are particularly sensitive to edgehabitat and rely on greatly reduced core areas due to the irregular shape of forest fragments[75]. Indeed, some evidence for an extinction debt in this area is already emerging (Bettsunpublished data), reflecting results found for similar habitats in other regions [1]. Third, sub-tle changes in climate are also causing distinct shifts in community composition, as demon-strated in a 42-year resurvey of frogs in the Las Cruces reserve [25]. Such shifts are of particularconcern in fragmented landscapes where the ability of certain groups of fauna to migrate tomore favorable environments is impeded by habitat discontinuity.
Although reversing all the current threats to biodiversity and ecosystem services in the areamay not be possible, assisting in the recovery of strategic habitat areas, either through activerestoration or passive natural regeneration, would help offset the threat of extinction debts fordifferent groups of organisms. Furthermore, continued protection and buffering of the largerforest fragments that are scattered in this landscape matrix is essential, as most studies havedemonstrated the disproportionate role that they play in the conservation of regionalbiodiversity.
Supporting InformationS1 Fig. Structural connectivity in a 3 km radius around the Las Cruces Biological Station.(EPS)
AcknowledgmentsWe would like to thank Yerlyn Blanco and Rafael Moreno-Sanchez for help in acquiring andoverseeing orthorectification of images; we thank Erik Ahl, Michael Brown, Kara Collier, Mar-yam Karimi, Jonathan Alexander Key, Andrew McSherry, Adam Satushek, Morgan Schneider,Kim Swartwout, and James Tobler at the University of Colorado, Denver for assistance inimage orthorectification. We thank Víctor Milla for orthorectification and mosaic work of1947 images. We would like to thank Matt Betts, Chase Mendenhall, and Leighton Reid forhelpful comments and suggestions on an earlier version of this manuscript; we would also liketo thank the excellent comments and edits made by Sally Horn, Erin Lindquist, and one anony-mous reviewer during the review process.
Author ContributionsConceived and designed the experiments: RZ UK. Analyzed the data: GD. Wrote the paper: RZGD UK.
References1. Metzger JP, Martensen AC, Dixo M, Bernacci LC, Ribeiro MC, Teixeira AMG, et al. Time-lag in biologi-
cal responses to landscape changes in a highly dynamic Atlantic forest region. Biological Conservation.2009; 142(6):1166–77. doi: 10.1016/j.biocon.2009.01.033 PMID: WOS:000266154000005.
Land-Use Change in Southern Costa Rica
PLOS ONE | DOI:10.1371/journal.pone.0143554 November 23, 2015 13 / 17
2. Pardini R, Bueno AD, Gardner TA, Prado PI, Metzger JP. Beyond the Fragmentation ThresholdHypothesis: Regime Shifts in Biodiversity Across Fragmented Landscapes. Plos One. 2010; 5(10). doi:10.1371/journal.pone.0013666 PMID: WOS:000283537000035.
3. Ceballos G, Ehrlich PR, Barnosky AD, García A, Pringle RM, Palmer TM. Accelerated modern human–induced species losses: Entering the sixth mass extinction. Science Advances. 2015;1(5).
4. Gloor M, Gatti L, Brienen R, Feldpausch TR, Phillips OL, Miller J, et al. The carbon balance of SouthAmerica: a review of the status, decadal trends and main determinants. Biogeosciences. 2012; 9(12):5407–30. doi: 10.5194/bg-9-5407-2012 PMID: BCI:BCI201300134133.
5. Dirzo R, Young HS, Galetti M, Ceballos G, Isaac NJB, Collen B. Defaunation in the Anthropocene. Sci-ence. 2014; 345(6195):401–6. doi: 10.1126/science.1251817 PMID: WOS:000339655100031.
6. Gibbs HK, Rausch L, Munger J, Schelly I, Morton DC, Noojipady P, et al. Brazil's Soy Moratorium. Sci-ence. 2015; 347(6220):377–8. doi: 10.1126/science.aaa0181 PMID: 25613879
7. Foley JA, DeFries R, Asner GP, Barford C, Bonan G, Carpenter SR, et al. Global consequences of landuse. Science. 2005; 309(5734):570–4. doi: 10.1126/science.1111772 PMID: WOS:000230735200036.
8. Myers N, Mittermeier RA, Mittermeier CG, da Fonseca GAB, Kent J. Biodiversity hotspots for conserva-tion priorities. Nature. 2000; 403(6772):853–8. doi: 10.1038/35002501 PMID:WOS:000085559200046.
9. Wright SJ. The future of tropical forests. In: Ostfeld RS, Schlesinger WH, editors. Year in Ecology andConservation Biology 2010. Annals of the New York Academy of Sciences. 11952010. p. 1–27.
10. Gibson L, Lee TM, Koh LP, Brook BW, Gardner TA, Barlow J, et al. Primary forests are irreplaceable forsustaining tropical biodiversity. Nature. 2011; 478(7369):378–+. doi: 10.1038/nature10425 PMID:WOS:000296021100044.
11. FAO. Global Forest Resources Assessment 2010. 2010 Contract No.: 163.
12. Lindquist EJ, D'Annunzio R, Gerrard A, MacDicken K, Achard F, Beuchle R, et al. Global forest land-use change 1990–2005. Rome: FAO, 2012 Contract No.: 169.
13. Sader SA, Joyce AT. Deforestation rates and trends in Costa Rica. Biotropica. 1988; 20(1):11–9.
14. Cayuela L, Benayas JMR, Echeverria C. Clearance and fragmentation of tropical montane forests inthe Highlands of Chiapas, Mexico (1975–2000). Forest Ecology and Management. 2006; 226(1–3):208–18. doi: 10.1016/j.foreco.2006.01.047 PMID: ISI:000237138400022.
15. Killeen TJ, Guerra A, Calzada M, Correa L, Calderon V, Soria L, et al. Total Historical Land-UseChange in Eastern Bolivia: Who, Where, When, and HowMuch? Ecology and Society. 2008; 13(1):27.PMID: WOS:000261176100037.
16. Frishkoff LO, Karp DS, M'Gonigle LK, Mendenhall CD, Zook J, Kremen C, et al. Loss of avian phyloge-netic diversity in neotropical agricultural systems. Science. 2014; 345(6202):1343–6. doi: 10.1126/science.1254610 PMID: WOS:000341483800064.
17. Mendenhall CD, Karp DS, Meyer CFJ, Hadly EA, Daily GC. Predicting biodiversity change and avertingcollapse in agricultural landscapes. Nature. 2014; 509(7499):213–7. doi: 10.1038/nature13139 PMID:WOS:000335454300036.
18. Reid JL, Mendenhall CD, Rosales JA, Zahawi RA, Holl KD. Landscape Context Mediates Avian HabitatChoice in Tropical Forest Restoration. Plos One. 2014; 9(3). doi: 10.1371/journal.pone.0090573 PMID:WOS:000332475500069.
19. Ruiz-Gutierrez V, Gavin TA, Dhondt AA. Habitat fragmentation lowers survival of a tropical forest bird.Ecological Applications. 2008; 18(4):838–46. PMID: ISI:000256243200003.
20. Hadley AS, Frey SJK, RobinsonWD, Kress WJ, Betts MG. Tropical forest fragmentation limits pollina-tion of a keystone under story herb. Ecology. 2014; 95(8):2202–12. PMID: WOS:000340215900018.
21. Mendenhall CD, Sekercioglu CH, Brenes FO, Ehrlich PR, Daily GC. Predictive model for sustaining bio-diversity in tropical countryside. Proceedings of the National Academy of Sciences of the United Statesof America. 2011; 108(39):16313–6. doi: 10.1073/pnas.1111687108 PMID: WOS:000295255300040.
22. Sekercioglu CH, Ehrlich PR, Daily GC, Aygen D, Goehring D, Sandi RF. Disappearance of insectivo-rous birds from tropical forest fragments. Proceedings of the National Academy of Sciences of theUnited States of America. 2002; 99(1):263–7. PMID: ISI:000173233300049.
23. Brosi BJ. The effects of forest fragmentation on euglossine bee communities (Hymenoptera: Apidae:Euglossini). Biological Conservation. 2009; 142(2):414–23. doi: 10.1016/j.biocon.2008.11.003 PMID:ISI:000263303600017.
24. Schlaepfer MA, Gavin TA. Edge effects on lizards and frogs in tropical forest fragments. ConservationBiology. 2001; 15(4):1079–90. PMID: ISI:000170179600034.
Land-Use Change in Southern Costa Rica
PLOS ONE | DOI:10.1371/journal.pone.0143554 November 23, 2015 14 / 17

25. Ryan MJ, Fuller MM, Scott NJ, Cook JA, Poe S, Willink B, et al. Individualistic Population Responses ofFive Frog Species in Two Changing Tropical Environments over Time. Plos One. 2014; 9(5). doi: 10.1371/journal.pone.0098351 PMID: WOS:000338101500051.
26. Aldrich PR, Hamrick JL. Reproductive Dominance of Pasture Trees in a Fragmented Tropical ForestMosaic. Science1998. p. 103–5.
27. Ewers RM, Didham RK, PearseWD, Lefebvre V, Rosa IMD, Carreiras JMB, et al. Using landscape his-tory to predict biodiversity patterns in fragmented landscapes. Ecology Letters. 2013; 16(10):1221–33.doi: 10.1111/ele.12160 PMID: WOS:000324313600001.
28. Haddad NM, Brudvig LA, Clobert J, Davies KF, Gonzalez A, Holt RD, et al. Habitat fragmentation andits lasting impact on Earth’s ecosystems. Science Advances. 2015; 1(2).
29. Anchukaitis KJ, Horn SP. A 2000-year reconstruction of forest disturbance from southern Pacific CostaRica. Palaeogeography Palaeoclimatology Palaeoecology. 2005; 221(1–2):35–54. PMID:ISI:000229499700003.
30. Clement RM, Horn SP. Pre-Columbian land-use history in Costa Rica: a 3000-year record of forestclearance, agriculture and fires from Laguna Zoncho. Holocene. 2001; 11(4):419–26. PMID:ISI:000169351000004.
31. Manger WF. Colonization on the southern frontier of Costa Rica: a historical-cultural perspective: Mich-igan State University; 1992.
32. Babin N. The Coffee Crisis, Fair Trade, and Agroecological Transformation: Impacts on Land-UseChange in Costa Rica. Agroecology and Sustainable Food Systems. 2015; 39(1):99–129. doi: 10.1080/21683565.2014.960549
33. Rickert E. Environmental effects of the coffee crisis: a case study of land use and avian communities inAgua Buena, Costa Rica [M.S.]. Olympia, Washington: Evergreen State College; 2005.
34. EdelmanM, SeligsonMA. Land inequality—A comparison of census-data and property records in twen-tieth-century southern Costa Rica. Hispanic American Historical Review. 1994; 74(3):445–91. doi: 10.2307/2517892 PMID: WOS:A1994PC18500002.
35. Holdridge LR, GrenkeWC, HathewayWH, Liang T, Tosi JA Jr. Forest environments in tropical lifezones: a pilot study. Oxford: Pergamon Press; 1971.
36. Sauer JD. Living fences in Costa Rican agriculture. Turrialba. 1979; 29(4):255–61. PMID: WOS:A1979JF61300004.
37. Leon MC, Harvey CA. Live fences and landscape connectivity in a neotropical agricultural landscape.Agroforestry Systems. 2006; 68(1):15–26. doi: 10.1007/s10457-005-5831-5 PMID:ISI:000240613500002.
38. Fahrig L. Effects of habitat fragmentation on biodiversity. Annual Review of Ecology Evolution and Sys-tematics. 2003; 34:487–515. doi: 10.1146/annurev.ecolsys.34.011802.132419 PMID:WOS:000220102000018.
39. Daily GC, Ehrlich PR, Sanchez-Azofeifa GA. Countryside biogeography: Use of human-dominatedhabitats by the avifauna of southern Costa Rica. Ecological Applications. 2001; 11(1):1–13. PMID:ISI:000166749100001.
40. Pacheco J, Ceballos G, Daily GC, Ehrlich PR, Suzan G, Rodriguez-Herrera B, et al. Diversity, naturalhistory and conservation of mammals from San Vito de Coto Brus, Costa Rica. Revista De BiologiaTropical. 2006; 54(1):219–40. PMID: ISI:000243514100022.
41. Santos-Barrera G, Pacheco J, Mendoza-Quijano F, Bolanos F, Chaves G, Daily GC, et al. Diversity,natural history and conservation of amphibians and reptiles from the San Vito Region, southwesternCosta Rica. Revista De Biologia Tropical. 2008; 56(2):755–78. PMID: ISI:000259618700027.
42. Borgella R, Gavin TA. Avian community dynamics in a fragmented tropical landscape. Ecological Appli-cations. 2005; 15(3):1062–73. PMID: ISI:000229723400022.
43. Sekercioglu CH, Loarie SR, Brenes FO, Ehrlich PR, Daily GC. Persistence of forest birds in the CostaRican agricultural countryside. Conservation Biology. 2007; 21(2):482–94. PMID:ISI:000245438200024.
44. Barnett JR, Ruiz-Gutierrez V, Coulon A, Lovette IJ. Weak genetic structuring indicates ongoing geneflow acrossWhite-ruffed Manakin (Corapipo altera) populations in a highly fragmented Costa Rica land-scape. Conservation Genetics. 2008; 9(6):1403–12. doi: 10.1007/s10592-007-9463-3 PMID:ISI:000260539800001.
45. Hadley AS, Betts MG. Tropical deforestation alters hummingbird movement patterns. Biol Lett. 2009; 5(2):207–10. doi: 10.1098/rsbl.2008.0691 PMID: ISI:000264371900019.
46. Volpe NL, Hadley AS, RobinsonWD, Betts MG. Functional connectivity experiments reflect routinemovement behavior of a tropical hummingbird species. Ecological Applications. 2014; 24(8):2122–31.doi: 10.1890/13-2168.1 PMID: WOS:000346005400018.
Land-Use Change in Southern Costa Rica
PLOS ONE | DOI:10.1371/journal.pone.0143554 November 23, 2015 15 / 17
47. Hughes JB, Daily GC, Ehrlich PR. Conservation of tropical forest birds in countryside habitats. EcologyLetters. 2002; 5(1):121–9. PMID: ISI:000175032800016.
48. Estrada A, Coates-Estrada R. Bat species richness in live fences and in corridors of residual rain forestvegetation at Los Tuxtlas, Mexico. Ecography. 2001; 24(1):94–102. PMID: ISI:000167992100010.
49. Estrada A, Cammarano P, Coates-Estrada R. Bird species richness in vegetation fences and in stripsof residual rain forest vegetation at Los Tuxtlas, Mexico. Biodiversity and Conservation. 2000; 9(10):1399–416.
50. Pulido-Santacruz P, Renjifo LM. Live fences as tools for biodiversity conservation: a study case withbirds and plants. Agroforestry Systems. 2011; 81(1):15–30. doi: 10.1007/s10457-010-9331-x PMID:WOS:000284953600002.
51. Diaz A, Galante E, Favila ME. The effect of the landscape matrix on the distribution of dung and carrionbeetles in a fragmented tropical rain forest. Journal of Insect Science. 2010; 10. PMID: 20673066. doi:10.1673/031.010.8101
52. Laurance SGW, Stouffer PC, LauranceWE. Effects of road clearings on movement patterns of under-story rainforest birds in central Amazonia. Conservation Biology. 2004; 18(4):1099–109. doi: 10.1111/j.1523-1739.2004.00268.x PMID: WOS:000222979400030.
53. Lindell CA, Chomentowski WH, Zook JR, Kaiser SA. Generalizability of neotropical bird abundanceand richness models. Animal Conservation. 2006; 9(4):445–55. PMID: ISI:000241386700015.
54. Mendenhall CD, Frishkoff LO, Santos-Barrera G, Pacheco J, Mesfun E, Quijano FM, et al. Countrysidebiogeography of Neotropical reptiles and amphibians. Ecology. 2014; 95(4):856–70. doi: 10.1890/12-2017.1 PMID: WOS:000334573600007.
55. Karp DS, Mendenhall CD, Sandi RF, Chaumont N, Ehrlich PR, Hadly EA, et al. Forest bolsters birdabundance, pest control and coffee yield. Ecology Letters. 2013; 16(11):1339–47. doi: 10.1111/ele.12173 PMID: WOS:000325976500002.
56. Brosi BJ, Daily GC, Ehrlich PR. Bee community shifts with landscape context in a tropical countryside.Ecological Applications. 2007; 17(2):418–30. PMID: ISI:000245744200011.
57. Sanchez-Azofeifa GA. Chapter 16—Land Use and Cover Change in Costa Rica: A Geographic Per-spective. In: Leclerc CASHLP, editor. Quantifying Sustainable Development. San Diego: AcademicPress; 2000. p. 473–501.
58. Brockett CD, Gottfried RR. State policies and the preservation of forest cover: Lessons from contrastingpublic-policy regimes in Costa Rica. Latin American Research Review. 2002; 37(1):7–40. PMID:ISI:000174045800002
59. Rosero-Bixby L, Palloni A. Population and Deforestation in Costa Rica. Population and Environment.1998; 20(2):149–85. doi: 10.1023/A:1023319327838
60. Harrison S. Population-growth, land-use and deforestation in Costa Rica, 1950–1984. Interciencia.1991; 16(2):83–93. PMID: WOS:A1991FF89200006.
61. Cole-Christensen D. A place in the rain forest. Austin: University of Texas Press; 1997. 243 p.
62. Calvo-Alvarado J, McLennan B, Sánchez-Azofeifa A, Garvin T. Deforestation and forest restoration inGuanacaste, Costa Rica: Putting conservation policies in context. Forest Ecology and Management.2009; 258(6):931–40. http://dx.doi.org/10.1016/j.foreco.2008.10.035.
63. Huth T, Porder S, Chaves J, Whiteside JH. Soil Carbon and Nutrient Changes Associated with Defores-tation for Pasture in Southern Costa Rica. Biotropica. 2012; 44(5):661–7. doi: 10.1111/j.1744-7429.2012.00863.x PMID: WOS:000308403400011.
64. Aide TM, Clark ML, Grau HR, López-Carr D, Levy MA, Redo D, et al. Deforestation and reforestation ofLatin America and the Caribbean (2001–2010). Biotropica. 2013; 45(2):262–71. doi: 10.1111/j.1744-7429.2012.00908.x
65. Meyfroidt P, Lambin EF, Erb KH, Hertel TW. Globalization of land use: distant drivers of land changeand geographic displacement of land use. Current Opinion in Environmental Sustainability. 2013; 5(5):438–44. doi: 10.1016/j.cosust.2013.04.003 PMID: WOS:000325843700002.
66. LauranceWF, Nascimento HEM, Laurance SG, Andrade A, Ribeiro J, Giraldo JP, et al. Rapid decay oftree-community composition in Amazonian forest fragments. Proceedings of the National Academy ofSciences of the United States of America. 2006; 103(50):19010–4. doi: 10.1073/pnas.0609048103PMID: ISI:000242884200026.
67. Santos BA, Arroyo-Rodriguez V, Moreno CE, Tabarelli M. Edge-Related Loss of Tree PhylogeneticDiversity in the Severely Fragmented Brazilian Atlantic Forest. Plos One. 2010; 5(9). e12625 doi: 10.1371/journal.pone.0012625 PMID: ISI:000281687100008.
68. Fuchs EJ, Lobo JA, Quesada M. Effects of forest fragmentation and flowering phenology on the repro-ductive success and mating patterns of the tropical dry forest tree Pachira quinata. Conservation Biol-ogy. 2003; 17(1):149–57. doi: 10.1046/j.1523-1739.2003.01140.x PMID: WOS:000180846200019.
Land-Use Change in Southern Costa Rica
PLOS ONE | DOI:10.1371/journal.pone.0143554 November 23, 2015 16 / 17

69. Austin GT, Haddad NM, Méndez C, Sisk TD, Murphy DD, Launer AE, et al. Annotated checklist of thebutterflies of the Tikal National Park area of Guatemala. Tropical Lepidoptera1996. p. 21–37.
70. LauranceWF, Lovejoy TE, Vasconcelos HL, Bruna EM, Didham RK, Stouffer PC, et al. Ecosystemdecay of Amazonian forest fragments: A 22-year investigation. Conservation Biology2002. p. 605–18.
71. LauranceWF, Laurance SG, Ferreira LV, RankindeMerona JM, Gascon C, Lovejoy TE. Biomass col-lapse in Amazonian forest fragments. Science. 1997; 278(5340):1117–8. doi: 10.1126/science.278.5340.1117 PMID: WOS:A1997YE65200050.
72. LauranceWF, Delamonica P, Laurance SG, Vasconcelos HL, Lovejoy TE. Conservation—Rainforestfragmentation kills big trees. Nature. 2000; 404(6780):836–. doi: 10.1038/35009032 PMID:WOS:000086625000034.
73. Estrada A, CoatesEstrada R, Meritt DA. Anthropogenic landscape changes and avian diversity at LosTuxtlas, Mexico. Biodiversity and Conservation. 1997; 6(1):19–43. PMID: ISI:A1997WL15900002.
74. Banks-Leite C, Pardini R, Tambosi LR, PearseWD, Bueno AA, Bruscagin RT, et al. Using ecologicalthresholds to evaluate the costs and benefits of set-asides in a biodiversity hotspot. Science. 2014; 345(6200):1041–5. doi: 10.1126/science.1255768 PMID: WOS:000340870900037.
75. Ewers RM, Didham RK. The effect of fragment shape and species' sensitivity to habitat edges on ani-mal population size. Conservation Biology. 2007; 21(4):926–36. doi: 10.1111/j.1523-1739.2007.00720.x PMID: WOS:000248401200014.
Land-Use Change in Southern Costa Rica
PLOS ONE | DOI:10.1371/journal.pone.0143554 November 23, 2015 17 / 17