Six Sigma Implementation in UK Manufacturing SMEs - STAX
397
Six Sigma Implementation in UK Manufacturing SMEs: An Exploratory Research MANEESH KUMAR Thesis submitted for the Degree of PhD 2010 DEPARTMENT OF DESIGN MANUFACTURE AND ENGINEERING MANAGEMENT UNIVERSITY OF STRATHCLYDE GLASGOW, UK
-
Upload
khangminh22 -
Category
Documents
-
view
1 -
download
0
Transcript of Six Sigma Implementation in UK Manufacturing SMEs - STAX

Six Sigma Implementation in UK
Manufacturing SMEs: An Exploratory
Research
MANEESH KUMAR
Thesis submitted for the Degree of PhD
2010
DEPARTMENT OF DESIGN MANUFACTURE AND ENGINEERING MANAGEMENT
UNIVERSITY OF STRATHCLYDE
GLASGOW, UK

Maneesh Kumar ii
Declaration of Authenticity and Author Rights
This thesis is the result of the author’s original research. It has been composed by the
author and has not been previously submitted for examination which has led to the
award of a degree
The copyright of this thesis belongs to the author under the terms of the United
Kingdom Copyrights Acts as qualified by the University of Strathclyde Regulation 3.50.
Due acknowledgement must always be made of the use of any material contained in,
or derived from, this thesis.
Signed:
Date:

Maneesh Kumar iii
Dedication
To my dear son ‘Ayush’ & my wife ‘Manisha’
You both brought sunshine and happiness to my life

Maneesh Kumar iv
Acknowledgements
It would have been impossible to complete this thesis without the help and support of
various individuals.
I wish to express my deep appreciation and sincere gratitude to my supervisor Prof.
Jiju Antony for all his patience, invaluable guidance, and support throughout my PhD.
His encouragement throughout my PhD journey has given me the confidence to
develop both my professional knowledge and career. I am indebted to Prof. Umit S.
Bititci, whose comments and suggestions have improved the quality of my thesis. I am
also thankful to the University of Strathclyde for providing me with the scholarship to
pursue my doctoral research and which made this thesis possible.
I would like to express my gratitude to all the industrial collaborators and government
bodies for participating in this research and giving me the opportunity to achieve the
research goal.
I am also grateful to my friends Marisa Smith, Aylin Ates, Catherine McGuire, Rizal,
and the rest of my colleagues who have helped me with their inspirational
contributions and constructive feedback and support. My thanks go to Elsie Horobin,
at Edinburgh Napier University, for proof-reading my thesis within a very short span of
time.
I am indebted to all my family members, especially my parents - Narendra Pratap
Singh, Pramila Singh, for their continued patience, and encouragement during my stay
at Strathclyde. Finally, I am so grateful to my dear wife Manisha, who had lived the
roller-coaster ride of the PhD with me, encouraged and supported me every day,
demonstrated understanding and patience to respond to my ever changing
temperament during the PhD journey. This thesis would not have been possible
without your patience, support, and understanding throughout this journey.
I am eternally grateful to you all

Maneesh Kumar v
Abstract
Though the benefits of Six Sigma were widely reported in many large organizations, research had shown its implementation in the UK small and medium-sized enterprises (SMEs) was still less evident. The aim of this exploratory research was to assess the status of Six Sigma implementation in the UK manufacturing SMEs and thereby develop a customized practical framework to facilitate successful implementation of Six Sigma in SMEs. A mixed method approach of survey and multiple case studies during three phases of research was adopted to achieve the aim of the research by answering the following key research questions (RQs): RQ1: What makes SMEs different from large organizations?; RQ2: What are the critical differences in quality management practices of Six Sigma and non-Six Sigma SMEs?; RQ3: What are the critical success factors and barriers to implementation of Six Sigma in SMEs?; RQ4: Does the performance of Six Sigma firms differ from non-Six Sigma firms?; RQ5: How to assess the readiness of a SME to embark on Six Sigma journey?. The adoption of a mixed method approach not only facilitated in answering the five RQs and but also addressed the quality research criteria of reliability and validity for this research.
This exploratory research had made some significant contributions to the theory and practice of Six Sigma research in SMEs. This is among very few studies in quality management (QM) literature that presents the differences in the characteristics of SMEs and large organizations through the lens of small business growth models. It also identified the similarities in the critical success factors (CSFs) stated for small business growth and for the implementation of continuous improvement (CI) initiatives in SMEs. The research dispels the myth that Six Sigma implementation is limited to large organizations only. The empirical research had indicated successful implementation of Six Sigma in SMEs of sizes ranging from 35 to 240 headcount. A well-designed quality management system (QMS) based on the principles of ISO 9000 could be the foundation to embark on Six Sigma journey. Networking with government bodies or academic institutions and the role of middle managers were identified as two new factors for successful implementation of Six Sigma in SMEs. This was among very few studies that compared and identified significant differences in the performance of Six Sigma SMEs compared to non-Six Sigma SMEs. The Six Sigma firms out-classed non-Six Sigma firms with respect to the nine performance metrics established from the literature.
The two key practical contributions of this doctoral research were the construction of a Six Sigma Readiness Index (SSRI) and a customized Six Sigma framework for SMEs based on the findings from empirical research and literature. The SSRI can assess SME preparedness for Six Sigma implementation. The proposed framework would help SMEs to get started with Six Sigma implementation. The readiness index and framework were tested in three SMEs to assess its robustness and validity. The generalisability of the findings was limited due to the smaller sample size of participating firms from the UK manufacturing sector only. Future research will expand the scope of the study by focusing on global SMEs (manufacturing and services) and conducting exploratory and explanatory research on Six Sigma implementation in SMEs. The author will also test the proposed SSRI and the framework for further refinement and validity.
Maneesh Kumar vi
Table of Contents
Declaration of Authenticity and Author Rights .......................................................................... ii Dedication ............................................................................................................................... iii Acknowledgements ................................................................................................................. iv Abstract .................................................................................................................................... v Table of Contents .................................................................................................................... vi List of Figures .......................................................................................................................... x List of Tables .......................................................................................................................... xii Keywords ............................................................................................................................... xv Chapter 1 Introduction 1.0. Introduction ..................................................................................................................... 17 1.1. Point of Departure ........................................................................................................... 17 1.2. Research Aims and Questions ........................................................................................ 20 1.3. Scope of Research .......................................................................................................... 22 1.4. Structure ......................................................................................................................... 23 1.5. Summary ......................................................................................................................... 25 Chapter 2 Introduction to SMEs 2.0. Introduction ..................................................................................................................... 26 2.1. Definition of SMEs ........................................................................................................... 26 2.2. SMEs contribution to World Economy ............................................................................. 29 2.3. Understanding the growth of small firms.......................................................................... 32 2.4. SMEs characteristics and comparison with large organizations ....................................... 39
2.4.1. Leadership ................................................................................................................ 40 2.4.2. Management Style .................................................................................................... 41 2.4.3. Strategic Planning ..................................................................................................... 41 2.4.4. Structure ................................................................................................................... 42 2.4.5. System and Procedures ............................................................................................ 42 2.4.6. Human Resources .................................................................................................... 43 2.4.7. Market and Customer Focus ..................................................................................... 43 2.4.8. Operational Improvement ......................................................................................... 44 2.4.9. Innovation ................................................................................................................. 45 2.4.10. Networking .............................................................................................................. 46
2.5. Summary ......................................................................................................................... 50 Chapter 3 Quality Initiatives in SMEs-A review of literature 3.0. Introduction ..................................................................................................................... 52 3.1. Scope of review ............................................................................................................... 52 3.2. Evolution of Six Sigma .................................................................................................... 53
3.2.1.Definition of Six Sigma ............................................................................................... 56 3.2.2. Characteristics of Six Sigma ..................................................................................... 57 3.2.3. Six Sigma Problem Solving Methodology ................................................................. 58 3.2.4. Six Sigma versus TQM ............................................................................................. 60 3.2.5. Six Sigma versus Lean Manufacturing ...................................................................... 62 3.2.6. Common myths of Six Sigma .................................................................................... 64 3.2.7. Benefits from Six Sigma ............................................................................................ 65 3.2.8. Critique of Six Sigma and Agenda for Future Research ............................................ 66
3.3. Six Sigma in SMEs- A review of Literature ...................................................................... 70 3.4. Quality Management Practices in SMEs.......................................................................... 74
3.4.1. ISO 9000 certification – Is it useful for SME? : An overview ...................................... 78 3.5. Critical Success Factors and Challenges to implementation ............................................ 83
3.5.1. Critical Success Factors ........................................................................................... 83 3.5.2. Challenges and Barriers to implementation of CI initiatives ....................................... 87
3.6. Impact of CI initiative on Organizational Performance ..................................................... 90
Maneesh Kumar vii
3.7. Quality Management Maturity Models and Frameworks– A Review ................................ 98 3.7.1. Assessing organizational readiness for CI journey through Maturity Model lens ....... 99 3.7.2. A review of common maturity models for CI/ TQM implementation ......................... 101 3.7.3. Background Research on quality frameworks for SMEs.......................................... 106
3.7.3.1. What constitute a good framework? ................................................................. 106 3.7.3.2. Critique of quality management frameworks and models for SMEs .................. 107
3.8. Summary ....................................................................................................................... 121 Chapter 4 Research Paradigms 4.0. Introduction ................................................................................................................... 123 4.1. The Research Process .................................................................................................. 123 4.2. Research purpose and questions .................................................................................. 125 4.3. Research Paradigms ..................................................................................................... 127
4.3.1. Basic assumptions of the main paradigms .............................................................. 129 4.3.2. Debates confronting Positivist and Phenomenological paradigms .......................... 130 4.3.3. Inductive and Deductive Research Approach ......................................................... 133
4.4. Implications of Research Philosophy and Approach on this study ................................. 136 4.5. Summary ....................................................................................................................... 137 Chapter 5 Research Design 5.0. Introduction ................................................................................................................... 138 5.1. What is Research Design? ............................................................................................ 138 5.2. Research Strategies ...................................................................................................... 140
5.2.1. Quantitative and Qualitative Research .................................................................... 140 5.2.1.1. Mixed-Method Research .................................................................................. 142
5.2.2. Survey .................................................................................................................... 145 5.2.2.1. Types of Survey research ................................................................................. 146 5.2.2.2. Sample Frame Selection .................................................................................. 148 5.2.2.3. Questionnaire layout and field pre-test ............................................................. 150 5.2.2.4 Response rate ................................................................................................... 155
5.2.3. Case Study ............................................................................................................. 156 5.2.3.1. Type of Case Study .......................................................................................... 158 5.2.3.2. Case Study Sample Selection .......................................................................... 160 5.2.3.3. Unit of Analysis ................................................................................................ 163 5.2.3.4. Data Collection Method .................................................................................... 164 5.2.3.5. Qualitative Data Analysis .................................................................................. 168 5.2.3.6. Ethical issues ................................................................................................... 171
5.2.4. Methodology used in the third phase of research .................................................... 172 5.2.5. Experiment ............................................................................................................. 172 5.2.6. Grounded Theory .................................................................................................... 173 5.2.7. Ethnography ........................................................................................................... 173 5.2.8. Action Research ..................................................................................................... 174 5.2.9. Rationale for the choice of Research Strategy ........................................................ 174
5.3. Criteria for judging the Quality of Research Design ....................................................... 175 5.4. Summary ....................................................................................................................... 177 Chapter 6 Survey Data Analysis 6.0. Introduction ................................................................................................................... 178 6.1. Demographic Information .............................................................................................. 178 6.2. Quality Management Practices in SMEs........................................................................ 182
6.2.1. History of Quality Initiatives in SMEs ....................................................................... 182 6.2.2. Existence of quality department and problem solving team in SMEs....................... 183 6.2.3. Methods of knowledge transfer to employees ......................................................... 186 6.2.4. Customer focused measures in the firm .................................................................. 188 6.2.5. Factors defining the strategic objective (s) of the firm ............................................. 189 6.2.6. Reasons for not implementing Six Sigma in SMEs ................................................. 190
6.3. Critical Success Factors (CSFs) and Impediment study ................................................ 191 6.3.1. Critical Success Factors study ................................................................................ 191

Maneesh Kumar viii
6.3.2. Impeding factors in implementation of quality initiatives in SMEs ............................ 194 6.4. Performance of SSS and NSSS: A comparison ............................................................. 195 6.5. Summary ....................................................................................................................... 197 Chapter 7 Case Study Analysis 7.0. Introduction ................................................................................................................... 199 7.1. Findings from Six Sigma firms ....................................................................................... 199
7.1.1. Demographic Details of Six Sigma SMEs ............................................................... 199 7.1.2. Quality Management Practices in SMEs ................................................................. 202
7.1.2.1. History of Quality Initiatives .............................................................................. 202 7.1.2.2. ISO 9000 as a foundation to embark on Six Sigma .......................................... 206 7.1.2.3. Motivation to implement Quality Initiative(s)...................................................... 208 7.1.2.4. Organizational Infrastructure ............................................................................ 212 7.1.2.5. Quality tools and techniques usage .................................................................. 215
7.1.3. Critical Success Factors and Barriers ..................................................................... 218 7.1.3.1. Critical Success Factors (CSFs) ....................................................................... 218 7.1.3.2. Challenges faced in the implementation of Six Sigma ...................................... 225
7.1.4. Impact of Six Sigma on Organizational Performance .............................................. 229 7.1.4.1. Soft Benefits observed in sample firms ............................................................. 230 7.1.4.2. Hard Benefits observed in sample firms ........................................................... 232
7.2. Findings from Non- Six Sigma firms .............................................................................. 237 7.2.1. Demographic Details of non-Six Sigma SMEs ........................................................ 237 7.2.2. Quality Management Practices in SMEs ................................................................. 238
7.2.2.1. History of Quality Initiatives .............................................................................. 238 7.2.2.2. Motivation to embark on ISO 9000 and other quality initiative(s) ...................... 240 7.2.2.3. Organizational Infrastructure ............................................................................ 243 7.2.2.4. Quality Tools and Techniques usage ............................................................... 245
7.2.3. Critical Success Factors (CSFs) and Barriers ......................................................... 247 7.2.3.1. Factors critical to success of quality program ................................................... 247 7.2.3.2. Key challenges faced in implementing quality programs .................................. 249
7.2.4. Impact of Quality Initiative on Organizational Performance ..................................... 251 7.3. Findings from Practitioner interviews ............................................................................. 258
7.3.1. Quality Management Practices in SMEs ................................................................. 258 7.3.1.1. SMEs perception of ISO 9000 .......................................................................... 258 7.3.1.2. Current status of Six Sigma implementation in SMEs ....................................... 259 7.3.1.3. Could Six Sigma be the solution to ailing manufacturing companies in UK? ..... 260 7.3.1.4. Knowledge and usage of tools and techniques of CI ........................................ 261
7.3.2. CSFs and challenges in implementation of CI initiatives in SMEs ........................... 261 7.3.2.1. CSFs for implementation of CI initiatives in SMEs ............................................ 261 7.3.2.2. Challenges faced in the implementation of CI initiatives in SMEs ..................... 263
7.3.3. Performance metrics used in SMEs ........................................................................ 263 7.4. Differences between SMEs and Large organization ...................................................... 266 7.5. Six Sigma Readiness Index........................................................................................... 268 7.6. Summary ....................................................................................................................... 271 Chapter 8 Discussion of Key Findings 8.0. Introduction ................................................................................................................... 274 8.1. SMEs vs. Large Organizations ...................................................................................... 274 8.2. Quality Management Practices in SMEs........................................................................ 276 8.3. Critical Success factors and Barriers ............................................................................. 282 8.4. Impact on Organizational Performance ......................................................................... 285 8.5. Summary ....................................................................................................................... 288 Chapter 9 Readiness Index and Implementation Framework 9. 0. Introduction .................................................................................................................. 290 9.1. Six Sigma Readiness Index........................................................................................... 290
9.1.1. Introduction to Six Sigma Readiness Index ............................................................. 290 9.1.2. Criteria to measure the Six Sigma Readiness Index ............................................... 291

Maneesh Kumar ix
9.1.3. Scoring criteria for the Six Sigma Readiness Index ................................................. 296 9.2. Evaluating SMEs Readiness for Six Sigma ................................................................... 297
9.2.1. Interpretation of Leadership score in three firms ..................................................... 300 9.2.2. Interpretation of Measurement and Processes score in three firms ......................... 301 9.2.3. Interpretation of People Management score in three firms ...................................... 303 9.2.4. Interpretation of Systems and Control score in three firms ...................................... 304 9.2.5. Interpretation of Customer Focus score in three firms ............................................. 305
9.3. A final thought on Six Sigma Readiness Index .............................................................. 306 9.4. Six Sigma Implementation Framework for SMEs ........................................................... 307
9.4.1. Phase 1- Prepare .................................................................................................... 311 9.4.2. Phase 2- Initialize ................................................................................................... 314 9.4.3. Phase 3- Institutionalize .......................................................................................... 318 9.4.4. Phase 4- Sustain .................................................................................................... 320
9.5. Summary ....................................................................................................................... 322 Chapter 10 Conclusion 10.0. Introduction ................................................................................................................. 324 10.1. Key Findings from Empirical Research ........................................................................ 325 10.2. Quality of Research ..................................................................................................... 329
10.2.1. Research Quality criteria for Survey Research...................................................... 330 10.2.2. Research Quality criteria for Case Study Research .............................................. 331 10.2.3. Contribution to theory/ knowledge ......................................................................... 332 10.2.4. Contribution to practice ......................................................................................... 334
10.3. Agenda for future research .......................................................................................... 336 10.3.1. Limitations of the research .................................................................................... 336 10.3.2. Future research directions .................................................................................... 337
10.4. Critical Reflection ........................................................................................................ 339 References.......................................................................................................................... 344 Appendices......................................................................................................................... 372

Maneesh Kumar x
List of Figures
Figure 1.1 Funnel illustrating the scope of doctoral research
Figure 2.1 The tipping point in a state framework for growth of firms
Figure 2.2 Critical success factors for the growth of small businesses
Figure 3.1 Four key stages in the evolution of quality management
Figure 3.2 The five step methodology of Six Sigma
Figure 3.3 Comparison of popularity of Six Sigma and TQM
Figure 3.4 Agenda for future research in Six Sigma
Figure 3.5 Characteristics of firms in the quality evolutionary process
Figure 3.6 Levels of TQM adoption
Figure 3.7 Stages in the evolution of Continuous Improvement
Figure 3.8 A conceptual framework for TQM implementation in SMEs
Figure 3.9 Quality Integrated management model
Figure 3.10 A conceptual framework for Quality model development for SMEs
Figure 3.11 Framework for benchmarking implementation in SMEs
Figure 3.12 BPI framework for SMEs
Figure 4.1 The research process
Figure 4.2 Comparison of inductive and deductive research approach
Figure 4.3 The logic of the research process
Figure 5.1 The position of research design with research process flowchart
Figure 5.2 Visual presentation of the research design used by the researcher
Figure 5.3 Interview Protocol used for case study data collection
Figure 6.1 Location of sample SMEs within UK
Figure 6.2 A clustered bar chart plot of size against company's annual turnover
Figure 6.3 Existence of quality department within SMEs
Figure 6.4 Existence of problem solving teams in SMEs
Figure 6.5 Measures used to capture voice of customers
Figure 6.6 Factors defining the strategic objective (s) of the firm
Figure 6.7 Barriers to implementation of Quality Initiatives in SMEs
Figure 7.1 D’s six-step process for Continuous Improvement
Figure 7.2 Six Sigma readiness factor voted by conference delegates
Figure 8.1 Usage of basic tools
Figure 8.2 Usage of tools within OTT category
Figure 8.3 The role of QMS and Lean to facilitate Six Sigma implementation in SMEs
Figure 8.4 Overall benefits from implementation of quality program in SMEs
Figure 9.1 SMEs readiness score against leadership dimension
Figure 9.2 SMEs readiness score against measurement and processes dimension
Maneesh Kumar xi
Figure 9.3 SMEs readiness score against people management dimension
Figure 9.4 SMEs readiness score against systems and control dimension
Figure 9.5 SMEs readiness score against customer focus dimension
Figure 9.6 A five phase framework for Six Sigma implementation in SMEs
Figure 9.7 A 12 step approach in the five phase Six Sigma framework for SMEs

Maneesh Kumar xii
List of Tables
Table 2.1 Definition of small firms as per Bolton Committee report
Table 2.2 European Commission definition of SMEs
Table 2.3 Contribution of SMEs to world economy
Table 2.4 Determinants of small business growth from descriptive approach
Table 2.5 Determinants of small business growth from deterministic approach
Table 2.6 Critical differences between SMEs and large organizations
Table 3.1 Differences between Six Sigma and Lean manufacturing
Table 3.2 Motivation, CSFs, impediments, and benefits of ISO 9000 certification
Table 3.3 Critical success factors of CI initiatives in SMEs
Table 3.4 A review of impact of CI initiatives on organizational performance
Table 3.5 Factors included within three major quality awards
Table 3.6 Review of quality management frameworks and models for SMEs
Table 4.1 Matching research questions and purpose
Table 4.2 Assumptions of the two main paradigms
Table 4.3 Paradigm position on selected issues in social science research
Table 5.1 Critical differences between qualitative and quantitative research strategies
Table 5.2 Critical differences in the three types of survey research
Table 5.3 Data collection methods for survey research
Table 5.4 Key facts from survey response
Table 5.5 Comparing survey and case study based research strategies
Table 5.6 Case study types and its link with this research
Table 5.7 Selection criteria established to select the case study sample
Table 5.8 Characteristic of the participating firms in case study research
Table 5.9 Strengths and weaknesses of the data collection techniques
Table 5.10 Differences between types of interviews
Table 5.11 Reliability and validity in case research
Table 5.12 Link between research question and research strategy
Table 6.1 Industry Specialization of sample firms
Table 6.2 Chi-Square test between size of firm and its annual turnover
Table 6.3 History of quality initiatives in SMEs
Table 6.4 Chi-Square test between size / type of firm and existence of quality department
Table 6.5 Team review meetings in participating firms
Table 6.6 Knowledge Transfer Mechanism in SSS and NSSS
Table 6.7 KT mechanism against type/size of firm
Table 6.8 Customer focused measure in SSS and NSSS
Table 6.9 Reasons for not implementing Six Sigma in SMEs

Maneesh Kumar xiii
Table 6.10 Gap analysis of CSFs of Quality Practices in SMEs
Table 6.11 CSFs study against size of the firm
Table 6.12 Comparison of CSFs between SSS and NSSS
Table 6.13 Performance Indicators comparison against size of firms
Table 6.14 Impact of quality initiatives on the firm performance
Table 7.1 Company demographic details
Table 7.2 History of quality initiatives in case study companies
Table 7.3 Reasons for failure of quality initiatives in case study companies
Table 7.4 Reasons to embark on CI initiative or certification system
Table 7.5 Organizational infrastructure in Six Sigma SMEs
Table 7.6 Tools and techniques perceived to be currently used in sample SMEs
Table 7.7 Factors critical to the success of Six Sigma initiative in sample firms
Table 7.8 Relative positioning of firm’s with respect to CSFs
Table 7.9 Challenges faced by firms to implement and sustain Six Sigma initiative
Table 7.10 Hard and soft benefits realized by firms after implementing Six Sigma
Table 7.11 Soft Benefits realized by firms after Six Sigma implementation
Table 7.12 Benefits from Lean implementation in ‘A’
Table 7.13 Impact on the business from Six Sigma implementation in ‘A’
Table 7.14 Evaluation of firm’s performance against the performance indicators
Table 7.15 Summary of key findings from the Six Sigma firms
Table 7.16 Demographic details of the non-Six Sigma firms
Table 7.17 History of quality initiatives in the non-Six Sigma SMEs
Table 7.18 Reasons to embark on CI initiative or certification system
Table 7.19 Organizational infrastructure to support QM practices in SMEs
Table 7.20 Tools and techniques currently used in non-Six Sigma SMEs
Table 7.21 CSFs of quality programs in the non-Six Sigma firms
Table 7.22 Key challenges faced by NSSS firms to implement QP
Table 7.23 Hard and soft benefits realised by NSSS after implementing QP
Table 7.24 Benefits realised by H after Lean implementation
Table 7.25 KPIs used and monitored by G
Table 7.26 Impact of QP on performance of NSSS
Table 7.27 Summary of key findings from the non-Six Sigma firms
Table 7.28 Summary of key findings from practitioners’ interviews
Table 7.29 Summary of readiness factors listed by participating firms
Table 7.30 Critical incidents during implementation of quality initiative(s) in SMEs
Table 8.1 Application of CSFs identified from case study analysis
Table 9.1 The key constituents of Six Sigma Readiness Index

Maneesh Kumar xiv
Table 9.2 Demographic details of firms participating in Readiness exercise
Table 9.3 SMEs score against the Readiness Index criteria
Table 9.4 Main factors driving the need for Six Sigma
Table 9.5 Responsibilities and performance measures of top management
Table 10.1 Quality criteria for this doctoral research
Table 10.2 The novel contributions of this doctoral research
Maneesh Kumar xv
Keywords
AHP Analytical Hierarchy Process
AQA Australian Quality Award
BB Black Belts
BEM Business Excellence Model
BPR Business process re-engineering
BQF British Quality Foundation
BRC British Retail Consortium
BSI British Standard Institute
CI Continuous Improvement
CIP Continuous Improvement Process
COPQ Cost of Poor Quality
CSFs Critical Success Factors
CTQ Critical to Quality Characteristic
D & B Dun & Bradstreet
DFSS Design for Six Sigma
DMAIC Define-Measure-Analyze-Improve-Control
DoE Design of Experiment
DTI Department of Trade and Industry
EC European Commission
EFQM European Foundation for Quality Management
EMS Environmental Management System
EQA European Quality Award
EQMS Enterprise Quality Management System
ERP Enterprise Resource Planning
EU European Union
FD Finance Director
FMEA Failure Mode and Effect Analysis
GB Green Belts
GDP Gross Domestic Product
IIP Investors in People
ISO International Organisation for Standardisation
ISSSP International Society of Six Sigma Professionals
JIT Just-in-Time
KI Key Ingredients
KPIs Key Performance Indicators
KT Knowledge Transfer
KTP Knowledge Transfer Partnership
MAS Manufacturing Advisory Services
MBNQA Malcolm Baldrige National Quality Award
MD Managing Director
MI Manufacturing Institute
MNC Multi National Corporation
Maneesh Kumar xvi
NEPA North East Productivity Alliance
NSSS Non-Six Sigma SMEs
OECD Organization for Economic Co-operation and Development
OEE Overall Equipment Effectiveness
OEMs Original Equipment Manufacturers
OTIF On Time In Full
OTT Other Tools and Techniques
PCB Printed Circuit Board
PMS Performance Measurement System
QFD Quality Function Deployment
QI Quality Initiatives
QP Quality Program
QM Quality Management
QMS Quality Management System
R&D Research and Development
RQs Research Questions
SBA Small Business Administration
SC21 21st Century Supply Chains
SCM Supply Chain Management
SCORE The SME Collaborative Research scheme
SEEKIT Scottish Executive Expertise, Knowledge & Innovation Transfer programme
SMAS Scottish Manufacturing Advisory Services
SMEs Small and Medium Sized Enterprises
SPC Statistical Process Control
SPSS statistical package for social sciences
SQM Strategic Quality Management
SSRI Six Sigma Readiness Index
SSS Six Sigma SMEs
TOC Theory of Constraints
TPM Total Productive Maintenance
TPS Toyota Production System
TQM Total Quality Management
VOC Voice of Customer
VSM Value Stream Mapping
YB Yellow belts
Chapter 1: Introduction
Maneesh Kumar 17
Chapter 1
Introduction
1.0. Introduction
This chapter introduces the topic and key research questions to be explored to assess
the status of Six Sigma implementation in the UK manufacturing small and medium-
sized enterprises (SMEs). The motivation to pursue research in the area of Six Sigma
dates back to the author’s engineering days when he got an opportunity to be involved
in a Six Sigma project at a major automobile manufacturer in India. This project
exposed the author to the disciplined methodology of Six Sigma that resolved a
chronic problem of the organization and resulted in significant bottom-line savings. To
further explore the efficacy of the Six Sigma business improvement initiative, the
author decided to pursue higher studies in the UK and fortunately obtained a
scholarship to undertake his Masters in Research Program at the Glasgow
Caledonian University. It was during his Masters Dissertation that the author was
exposed to the emerging area of Six Sigma application in SMEs in the UK. The author
was involved in a three months project, as a part of his Masters Dissertation, in a local
manufacturing SME to explore the feasibility of Six Sigma application in the SME
environment. It was interesting to observe that characteristics of SMEs were different
from large organizations and thus any quality improvement frameworks or models
required customization for its application in a SME environment. The pilot study
motivated the author to pursue doctoral research in this unexplored area and develop
a customized framework for Six Sigma implementation in SMEs. The next section
explains the background to the study and the rationale for pursuing research on Six
Sigma implementation in SMEs.
1.1. Point of Departure
The two decades had witnessed an explosion of research into the role of SMEs within
a national and global context, resulting in a considerable body of academic literature
and thinking (Lloyd-Reason and Sear, 2007). SMEs constitute the bulk of enterprises
in all economies of the world and contribute significantly to the private sector output

Chapter 1: Introduction
Maneesh Kumar 18
and employment (Lee, 1998; Antony et al., 2008; Kumar, 2007). Though the
awareness of the contribution of SMEs is now widespread, their importance is still
often underestimated (North et al., 1998).
There had been an implicit assumption that organizational theories, models, and
conceptual frameworks developed in large organizations were relevant and directly
applicable to SMEs (Tonge, 2001). There are indeed significant differences between
SMEs and their large counterparts (Penrose, 1959; Storey, 1994; Ghobadian and
Gallear, 1996) in the way they run their business and embraces theories and models
proposed by academics or practitioners (Kumar et al., 2006). More details on
economic contribution of SMEs to the world economy and its differences with large
organizations were discussed in Chapter 2.
In recent years, thinking about quality issues has spawned a host of quality
management strategies. The changing needs of the stakeholder, economic pressures
and developing technology is imposing pressure on organizations worldwide to
significantly modify the way they do things, thus driving their businesses towards more
rapid change (Oakland and Tanner, 2006). In an attempt to manage change, many
large organizations have pursued formalised change programmes or quality initiatives
such as Six Sigma, Lean, Total Quality Management (TQM) that had significant
impact on the bottom-line and the working culture of organizations. Moving into the
21st century, a new management strategy proposed by Motorola in the mid-1980s
called Six Sigma, brought revolution in the industry worldwide and became the long
term business strategy to achieve competitive advantage and to excel in operations
excellence (Snee and Hoerl, 2003). Six Sigma provided business executives and
leaders the strategy, methodology, infrastructure, tools and techniques to change the
way businesses were run (Antony et al., 2008). As quoted by a leading quality expert:
“Six Sigma has been very successful-perhaps the most successful business
improvement strategy of the last 50 years” (Montgomery, 2005).
Six Sigma has evolved significantly and has continued to expand since its inception at
Motorola in the mid-1980s to improve the process performance, enhance business
profitability and increase customer satisfaction (Antony, 2008a). Six Sigma was
considered as one of the most effective improvement initiative in multinational
organizations such as GE, Motorola, Honeywell, Bombardier, ABB, Sony, to name a
few from the long list, with its adoption showing an upward trend (Snee, 2004; Desai,

Chapter 1: Introduction
Maneesh Kumar 19
2006). The research on the ‘quality’ efforts / initiatives in SMEs compared to large
firms is limited (Kuratko et al., 2001). The few articles that do appear on SMEs tend to
be conceptual with little empirical findings. Continuous improvement (CI) programs like
Six Sigma do not appear to be easily understood or interpreted by SMEs, which may
be a significant contributor to its low implementation (Antony et al., 2005).
The issue of whether quality management programs can be effectively utilised by
SMEs remains uncertain (Husband, 1997). Common quality models, such as quality
systems and certifications, were adopted by some SMEs, though the rate of
implementation was lower than in larger organisations (Brown and Wiele, 1995;
Terziovski et al., 1997). More holistic quality management initiatives, such as TQM
also appears to exhibit low implementation rate (Ghobadian and Gallear, 1996; Wiele
and Brown, 1998). It was suspected that the poor adoption of quality management
initiatives in SMEs was due to multiple and complex reasons, not just the often-stated
impediments of cost, time and relative impacts (Gome, 1996). Chapter 3 included
detailed information on the application and impact of CI initiatives in SMEs. In spite of
a number of Six Sigma success stories in large organizations, many SMEs are yet to
be convinced of benefits from the introduction, development, implementation and
deployment of Six Sigma within their business functions (Antony et al., 2005, 2008;
Antony, 2008b; Kumar, 2007).
The rationale for selecting SMEs as a subject matter of investigation was two-fold.
First, SMEs constitute the bulk of enterprise with the major contribution to private
sector output and employment in all economies of the world (Lin, 1999; Antony et al.,
2005, 2008; Kumar, 2007). Secondly, due to growing importance of supply chain
issues and pressure from original equipment manufacturers (OEMs) to improve the
quality of products or services have forced SMEs to embark on initiatives like Six
Sigma (Antony et al., 2005, 2008). Large firms were focusing on their core processes/
products that provided competitive advantage and outsourced other processes
/products manufacturing to their supply chain partners, i.e. in most cases SMEs.
SMEs play a key role in supply chain management (SCM) as they participate in value
creation activities: supply raw materials, manufacture products, and distribute finished
goods to customers (Hong and Jeong, 2006).
Moreover, other reason to consider the implementation of Six Sigma in SMEs was
because SMEs implementing ISO 9000 and TQM faced challenge to improve their
Chapter 1: Introduction
Maneesh Kumar 20
performance level (Deas, 2004). SMEs view quality systems such as ISO 9000 as the
destination of the achievement of quality. However, this trend is also common in many
large organizations as well. In fact, quality improvement is always meant to be a
journey rather than mere destination. It is imperative for SMEs to understand the
application of process improvement strategies from their larger counterparts and
continuously strive for process excellence by implementing initiatives like Lean and
Six Sigma. It is in the best interests of all SME stakeholders, whether employees,
customers or suppliers, to adopt the best management practice in order to compete in
today’s global marketplace (Kumar, 2007; Antony, 2008b).
As Six Sigma was more widely recognized as a route to business excellence in many
large organizations, they have realized the need for involvement and training of their
suppliers (i.e. SMEs) in Six Sigma to have significant financial-benefits for both parties
(Antony, 2008b). In order to explore the practicality of Six Sigma implementation within
the UK manufacturing SMEs, this research attempts to answer key research questions
discussed in the next section.
1.2. Research Aims and Questions
There is paucity of literature on the application of Six Sigma in SMEs. To date, very
few seminal works were reported in the literature. SMEs being the backbone of any
developed economy need to embrace new business strategies like Six Sigma that
may have significant impact on their bottom-line results and bring about cultural
transformation within their organisation. The aim of this research was to assess the
status of Six Sigma implementation in UK manufacturing SMEs and thereby develop a
customized practical framework to facilitate successful implementation of Six Sigma in
SMEs. This can be realised by first understanding the critical differences between
SMEs and large organizations followed by exploratory research on the status of the
Six Sigma implementation in SMEs. The aforementioned aim can be achieved by
answering the following research questions (RQs).
Chapter 1: Introduction
Maneesh Kumar 21
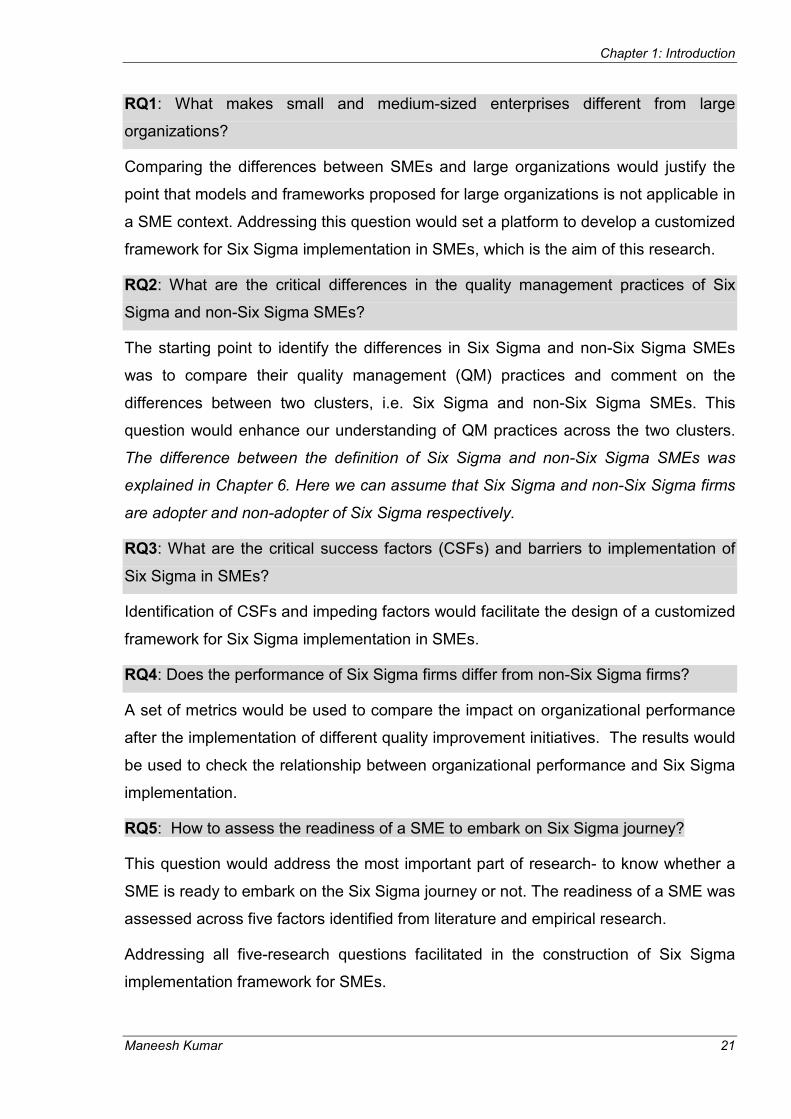
RQ1: What makes small and medium-sized enterprises different from large
organizations?
Comparing the differences between SMEs and large organizations would justify the
point that models and frameworks proposed for large organizations is not applicable in
a SME context. Addressing this question would set a platform to develop a customized
framework for Six Sigma implementation in SMEs, which is the aim of this research.
RQ2: What are the critical differences in the quality management practices of Six
Sigma and non-Six Sigma SMEs?
The starting point to identify the differences in Six Sigma and non-Six Sigma SMEs
was to compare their quality management (QM) practices and comment on the
differences between two clusters, i.e. Six Sigma and non-Six Sigma SMEs. This
question would enhance our understanding of QM practices across the two clusters.
The difference between the definition of Six Sigma and non-Six Sigma SMEs was
explained in Chapter 6. Here we can assume that Six Sigma and non-Six Sigma firms
are adopter and non-adopter of Six Sigma respectively.
RQ3: What are the critical success factors (CSFs) and barriers to implementation of
Six Sigma in SMEs?
Identification of CSFs and impeding factors would facilitate the design of a customized
framework for Six Sigma implementation in SMEs.
RQ4: Does the performance of Six Sigma firms differ from non-Six Sigma firms?
A set of metrics would be used to compare the impact on organizational performance
after the implementation of different quality improvement initiatives. The results would
be used to check the relationship between organizational performance and Six Sigma
implementation.
RQ5: How to assess the readiness of a SME to embark on Six Sigma journey?
This question would address the most important part of research- to know whether a
SME is ready to embark on the Six Sigma journey or not. The readiness of a SME was
assessed across five factors identified from literature and empirical research.
Addressing all five-research questions facilitated in the construction of Six Sigma
implementation framework for SMEs.
Maneesh Kumar
1.3. Scope of Research
Similar to industrial projects, doctoral research also requires very
understanding of project management skills to finish the project on time. It is not only
important to narrow down the research focus but also to understand the resources at
your disposal (time, money, and technical capability) to address the key res
questions. The author started with a very ambitious goal, i.e. boiling the ocean project,
of including global SMEs in the study and conducts
status of Six Sigma implementation in SMEs. More understanding of the resea
methodology and resources available during the period of study facilitated in
narrowing down the research focus to European SMEs and further down to UK SMEs,
as demonstrated in figure 1.1.
Figure 1.1:
Due to critical differences in the characteristics of manufacturing and service sector,
the author further narrowed down the focus of study to the UK manufacturing SMEs.
CI initiatives like Lean, TQM, and Six Sigma originated in large manufacturing
organizations and its application are still less evident in UK service organizations as
compared to large manufacturing organizations (Antony, 2004
2007). Therefore, the probability of application of the aforementioned initiatives is
likely to be found more in manufacturing SMEs as compared to service SMEs. This
fact was also confirmed in a pilot study conducted by Antony
1.3. Scope of Research
Similar to industrial projects, doctoral research also requires very
understanding of project management skills to finish the project on time. It is not only
important to narrow down the research focus but also to understand the resources at
your disposal (time, money, and technical capability) to address the key res
author started with a very ambitious goal, i.e. boiling the ocean project,
of including global SMEs in the study and conducts a global survey to understand the
status of Six Sigma implementation in SMEs. More understanding of the resea
methodology and resources available during the period of study facilitated in
narrowing down the research focus to European SMEs and further down to UK SMEs,
as demonstrated in figure 1.1.
Figure 1.1: Funnel illustrating the scope of doctoral resear
Due to critical differences in the characteristics of manufacturing and service sector,
the author further narrowed down the focus of study to the UK manufacturing SMEs.
CI initiatives like Lean, TQM, and Six Sigma originated in large manufacturing
nizations and its application are still less evident in UK service organizations as
compared to large manufacturing organizations (Antony, 2004
2007). Therefore, the probability of application of the aforementioned initiatives is
ely to be found more in manufacturing SMEs as compared to service SMEs. This
fact was also confirmed in a pilot study conducted by Antony
UK Manufacturing SMEs
UK SMEs
European SMEs
Global SMEs
Chapter 1: Introduction
22
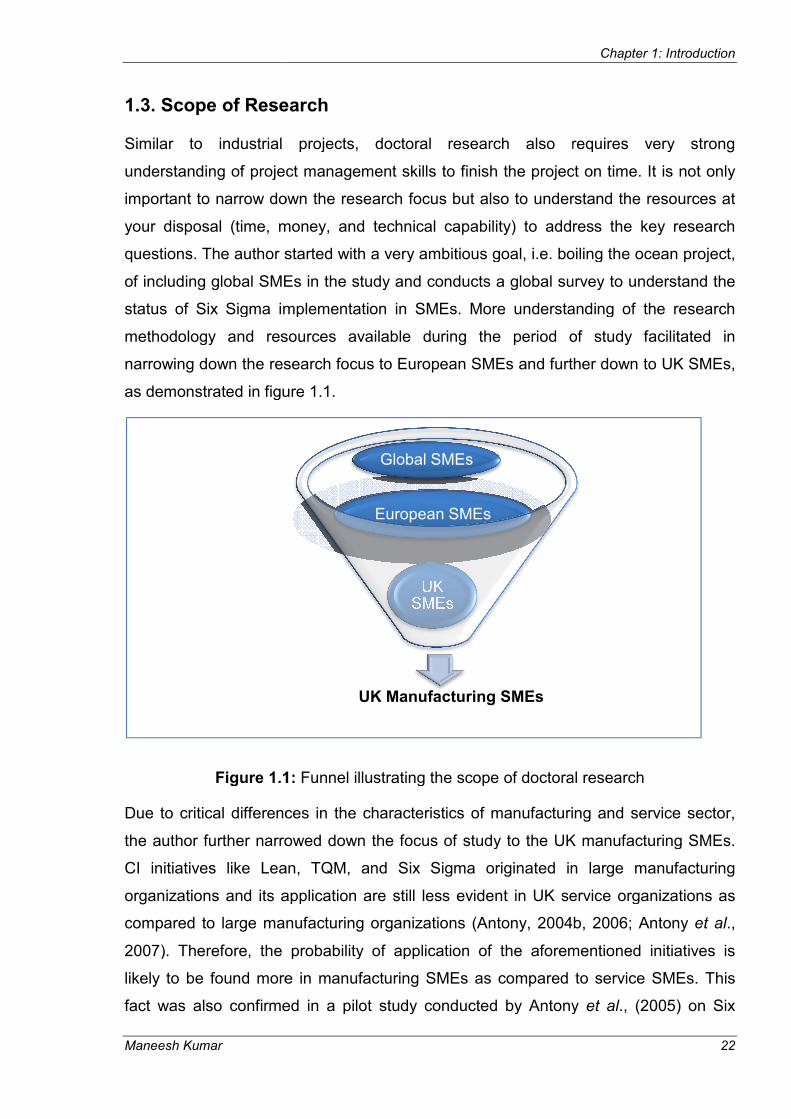
Similar to industrial projects, doctoral research also requires very strong
understanding of project management skills to finish the project on time. It is not only
important to narrow down the research focus but also to understand the resources at
your disposal (time, money, and technical capability) to address the key research
author started with a very ambitious goal, i.e. boiling the ocean project,
a global survey to understand the
status of Six Sigma implementation in SMEs. More understanding of the research
methodology and resources available during the period of study facilitated in
narrowing down the research focus to European SMEs and further down to UK SMEs,
Funnel illustrating the scope of doctoral research
Due to critical differences in the characteristics of manufacturing and service sector,
the author further narrowed down the focus of study to the UK manufacturing SMEs.
CI initiatives like Lean, TQM, and Six Sigma originated in large manufacturing
nizations and its application are still less evident in UK service organizations as
b, 2006; Antony et al.,
2007). Therefore, the probability of application of the aforementioned initiatives is
ely to be found more in manufacturing SMEs as compared to service SMEs. This
fact was also confirmed in a pilot study conducted by Antony et al., (2005) on Six

Chapter 1: Introduction
Maneesh Kumar 23
Sigma implementation in the UK SMEs. Micro enterprises (headcount less than 10)
were also excluded from the study as their characteristics, structure, and operations
differ significantly from SMEs. The constraint of time and monetary support was
another reason for narrowing down the focus to the UK manufacturing SMEs only.
The purpose of this research was to identify SMEs implementing Six Sigma and
perform a comparative analysis with non-Six Sigma firms [includes SMEs
implementing TQM, Kaizen, and having certification such as ISO 9000] with respect to
the quality management practices existing within SMEs. The study aimed to identify
differences in quality management practices and organizational performance, if it
exists, between Six Sigma and non-Six Sigma firms. However, no attempts were
made to compare the findings of the research with existing literature on Six Sigma
implementation in larger organizations. The research also attempts to demystify the
statement – ‘Six Sigma is only for large organizations’.
1.4. Structure
The structure of the Dissertation is as follows:
Chapter 1 gives an outline of research, motivation to conduct this research,
background of the study, establishing research aims and questions, and defining the
scope of research.
Chapter 2 includes review of literature on the growth cycle of small firms, and factors
critical to the growth of SMEs. This chapter helps in formulation of the first research
question (RQ1) and partly attempts to address the question towards the end of the
chapter by comparing differences in characteristics of SMEs against large
organizations
Chapter 3 starts with an introduction to the CI journey and narrows the focus to
discussion on Six Sigma and its applicability in a SME environment. This was followed
by extensive review of literature on quality management practices in SMEs; CSFs and
barriers to implementation of CI initiatives; impact of CI initiatives on the performance
of SMEs; CI maturity models; and CI frameworks for SMEs. This chapter helps in the
formulation of RQ2-RQ5.

Chapter 1: Introduction
Maneesh Kumar 24
The purpose of Chapter 4 and Chapter 5 was to understand the research philosophy
and research strategies appropriate to this research. Rationale for the choice of
particular philosophies, approaches, strategies, data collection methods and quality
criteria were addressed in the aforementioned chapters. The two chapters also
included discussion on design of the survey instrument and case-study questionnaire
to address the research questions established in chapter 1.
Chapter 6 presents the analysis of the survey instrument using SPSS 15.0 and
Microsoft Excel worksheet. The author focuses more on descriptive statistics to
explicate the findings, though inferential statistics were also used occasionally to
establish the association or relationship between two variables. This chapter partly
addresses questions RQ2-RQ4 and sets the platform to conduct multiple case studies
in selected SMEs.
Chapter 7 outlines the findings from the multiple case studies conducted in ten UK
manufacturing SMEs, and semi-structured interviews conducted with practitioners of
Scottish Manufacturing Advisory Services (SMAS), Manufacturing Advisory Services
(MAS) in England, and Manufacturing Institute (MI) in Manchester. The findings
highlight the critical differences in quality management practices of Six Sigma firms
compared to non-Six Sigma firms. This chapter also addresses questions RQ1-RQ5.
Chapter 8 includes cross-case analysis of ten case study firms. Findings were
compared with the first phase of research and with the literature. The discussion of
key findings from empirical research compared with the literature facilitated in the
development of Six Sigma Readiness Index (SSRI) and customized framework for Six
Sigma implementation in SMEs, discussed in chapter 9.
The author proposes a SSRI (RQ5) and a customized framework for Six Sigma
implementation in SMEs in Chapter 9. The index and framework were designed by
comparing the findings from the primary and secondary research.
The thesis concludes in Chapter 10, where the key findings from the study were
summarized; contribution to theory and practice illustrated; and recommendation
made for future research in this area.

Chapter 1: Introduction
Maneesh Kumar 25
1.5. Summary
The chapter starts with the introduction to the author’s background and motivation to
pursue the research on Six Sigma implementation in SMEs. Reviewing the literature
and regular discussion with the author’s supervisor facilitated in formulating five
research questions to address the research aim established in Section 1.2, i.e. the aim
of this research is to assess the status of Six Sigma implementation in UK
manufacturing SMEs and thereby develop a customized practical framework to
facilitate successful implementation of Six Sigma in SMEs. The scope of the research
was clearly defined by taking into account the resources and time-frame available to
finish the doctoral study. The structure of the dissertation was also illustrated and brief
explanations on the contents on ten chapters were provided. The next chapter
discusses the growth of small firms and their critical differences with large
organizations.

Chapter 2: Introduction to SMEs
Maneesh Kumar 26
Chapter 2
Introduction to SMEs
2.0. Introduction
The last two decades have witnessed an explosion in researching the role of SMEs in
the global economy, which has resulted in a significant body of academic literature
and thinking (Lloyd-Reason and Sear, 2007). However, models and theories proposed
by academics for SMEs were fragmented and atomised, poorly addressing the
solutions to problems that businesses actually encounter (Aldrich and Martinez, 2001).
SMEs form the backbone of the European Economy (European Commission, 2003)
and represent the fastest growing sector of the economy. Their role is vital to promote
entrepreneurial spirit and innovation in the European Union (EU) and thus crucial to
ensure EU competitiveness. They support numerous large companies and institutions
and therefore have a great bearing on the economy as a whole.
This chapter reviews the definition of SMEs, its economic contribution, understanding
the growth of small firms and its comparison with large businesses.
2.1. Definition of SMEs
SMEs are defined as non-subsidiary independent firms, employing less than a given
number of employees (OECD, 2000). This number varies across the globe. As defined
by the Bolton Committee in its 1971 report on small firms: small firm is an independent
business, managed by its owner or part-owner and having a small market share
(Lukacs, 2005). The report also recognised that size is relevant to sector and it is
appropriate to define size by number of employees in some sectors but more
appropriate to use turnover in others. In different sectors, the Bolton committee
provided different definitions based on the criteria of head count, sales turnover,
physical assets, and ownership (as shown in table 2.1). This definition received
several criticisms as it created confusion in understanding the compatibility between
the ‘economic’ and ‘statistical’ definition of SMEs. Though the definition states that
small business is managed by its owner or part owners, it is strongly argued that a

Chapter 2: Introduction to SMEs
Maneesh Kumar 27
business with 200 employees would not have any formal management structure for
decisions making.
Table 2.1: Definition of small firms as per Bolton Committee report
Sector Definition
Manufacturing < 200 employees
Construction }
<25 employees
Mining and quarrying
Retailing }
Turnover of £50,000 or less
Miscellaneous Services
Motor trades Turnover of £100,000 or less
Wholesale trades Turnover of £200,000 or less
Road Transport Five Vehicles or less
Catering All excluding multiples and brewery-managed houses
Source: Bolton, 1971
Despite governments and many of the multinational organisations targeting this group
for special financial business support, there was no single definition for a SME either
nationally or internationally. The European Union (EU) definition of SMEs had the
upper threshold limit of 250 employees. However some countries set the limit as 200
employees, other countries like US considers SMEs to include fewer than 500
employees.
In the USA, the definition of small business is set by a government department called
the Small Business Administration (SBA) Size Standards Office. SBA provides
different size standard between different industries, for e.g. in manufacturing and
mining industries, SMEs encompasses less than 500 employees, whereas the
wholesale trade industries should have less than 100 workers to be classified as
SMEs. Canada and Mexico use the same definition for enterprises in the
manufacturing sector. In some countries the definition of SMEs varies depending on
the industry to which the enterprise belongs, e.g. in Hong Kong, a manufacturing SME
has fewer than 100 employees and a non-manufacturing SME has fewer than 50
Chapter 2: Introduction to SMEs
Maneesh Kumar 28
employees; in Mexico the upper limit is 500 employees for the industrial sector and
100 employees for commercial and service sectors. In Japan, SMEs are defined as
follows: enterprises in the mining, manufacturing, transportation and construction
industries with less than 300 employees; enterprises in the wholesaling industry with
less than 100 employees; enterprises in the retail industry and service industries with
less than 50 employees. In countries like Russia, there is no clear definition of SMEs.
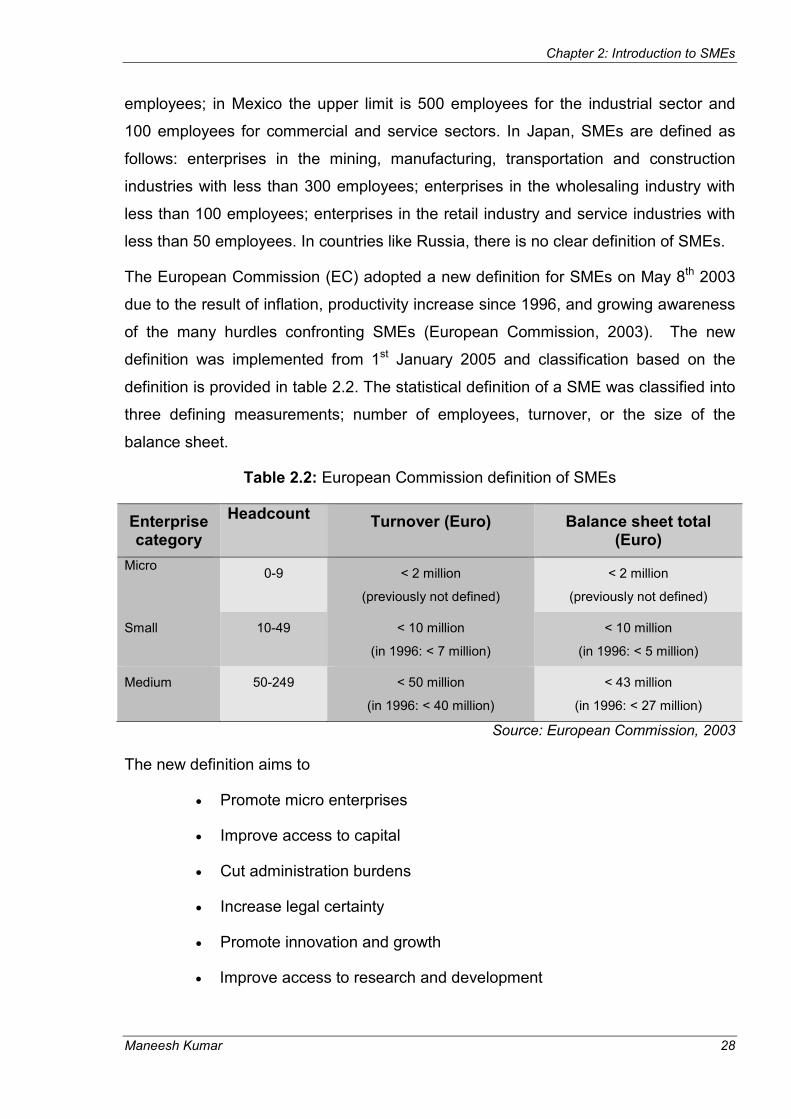
The European Commission (EC) adopted a new definition for SMEs on May 8th 2003
due to the result of inflation, productivity increase since 1996, and growing awareness
of the many hurdles confronting SMEs (European Commission, 2003). The new
definition was implemented from 1st January 2005 and classification based on the
definition is provided in table 2.2. The statistical definition of a SME was classified into
three defining measurements; number of employees, turnover, or the size of the
balance sheet.
Table 2.2: European Commission definition of SMEs
Enterprise category
Headcount Turnover (Euro) Balance sheet total
(Euro)
Micro 0-9 < 2 million
(previously not defined)
< 2 million
(previously not defined)
Small 10-49 < 10 million
(in 1996: < 7 million)
< 10 million
(in 1996: < 5 million)
Medium 50-249 < 50 million
(in 1996: < 40 million)
< 43 million
(in 1996: < 27 million)
Source: European Commission, 2003
The new definition aims to
• Promote micro enterprises
• Improve access to capital
• Cut administration burdens
• Increase legal certainty
• Promote innovation and growth
• Improve access to research and development
Chapter 2: Introduction to SMEs
Maneesh Kumar 29
In the UK, sections 382 and 465 of the Companies Act 2006 define SMEs as follows:
a small company has a turnover of not more than £5.6 million, a balance sheet total of
not more than £2.8 million and employing not more than 50 people; a medium-sized
company has a turnover of not more than £22.8 million, a balance sheet total of not
more than £11.4 million and not more than 250 employees.
To adhere to one common definition of SME, this research considers an organization
to be an SME if it has less than 250 employees as stated by EC (2003) and
Department of Trade and Industry (DTI) (2006). However, other constraints of annual
turnover or balance sheet are also considered important by the author and were
included in the definition, as presented in table 2.2. Since this research is focused on
manufacturing SMEs, the quantity seems to fit with EC or DTI definition of SMEs. One
of the limitations of varying SMEs definition was performing data analysis if a global
survey on different aspects of SMEs was conducted. A company with 499 employees
would certainly have different constraints as compared to SME with 49 employees.
There would be a difference in organizational infrastructure, decision making,
management style, resources available, interaction with customers and suppliers, to
name a few, when performing a comparative global study on SMEs.
2.2. SMEs contribution to World Economy
SMEs play a vital role in the economic structure of almost every country. Its
contribution to world economy can be gauged from the information provided in table
2.3. In terms of number of enterprises, US has the highest number of SMEs (25.82
million in 2005) followed by Russia (8.73 million in 2003) and Japan (5.64 million in
2004). The percentage contribution in terms of the number of enterprises exceeds
more than 90 % in almost every country. In European Union, SMEs are economically
important with 98% of an estimated 19.6 million enterprises defined as SMEs. The
statistics in table 2.3 clearly indicate the importance of SMEs in the economic growth
of any country. According to the recent survey by Small Business Service (SBS), an
agency of the Department of Trade and Industry (DTI) in the UK, out of 4.5 million
business enterprises, 99.9% were SMEs [99.3% were small (0-49) with only 0.6 %
(27,000) of medium sized (50-249)] and 0.1% (6000) were large companies (DTI,
2006).

Chapter 2: Introduction to SMEs
Maneesh Kumar 30
Table 2.3: Contribution of SMEs to world economy
Item Country/ Region
Industry
No. of Employees
Non-Agricultural sector of SMEs
SMEs
Share of Total Sales
Turnover
% share of all
Enterprises
% share of total
employment
UK (2006) All Sector 250 99.9% 58.9% 51.9%
European Union (2006)
All Sector 250 99.8% 67.1% 52%
USA (2006) Manufacturing 500 99.9% 50.9% 50.7%
Australia (2004)
Manufacturing 200 95% 47% -
Canada (2005)
Manufacturing 500 99.7% 64.0% -
Mexico (2006) Manufacturing 500 99% 72% 52%
Japan (2004) Manufacturing 300 98.94% 79.56% 48.20% (2002)
Wholesale 100
Retail & Service 50
South Korea (2004)
Manufacturing, Mining,
Construction and transportation
300 99.8% 86.5% NA
Large wholesalers,
hotels, information processing companies
300
Others 100-200
Taiwan (2006) Manufacturing, Mining,
Construction and transportation
200 97.77% 76.66% 29.84%
Other Industries 50
Malaysia (2006)
Manufacturing 150 99.20% 31.3%, manufacturing
32%
Services 50
Thailand (2003)
Manufacturing & Services
200 99.8% 67.6% 47.91 %
Wholesaling 50
Retailing 30
Singapore (2003)
Manufacturing & Services
200 99.67% 69.10% 75.68%
Sources: UK: Department of Trade and Industry, /www.sbs.gov.uk/ European Union: Eurostat Website: http://ec.europa.eu/eurostat/

Chapter 2: Introduction to SMEs
Maneesh Kumar 31
USA: Small Business Administration, /www.sba.gov/advo/ Australia: Department of Industry, Tourism and Resources, /www.industry.gov.au/
Canada: Department of Industry, /strategis.ic.gc.ca/ Mexico: SMEs in Mexico, Issues and Policies, OECD 2007
Japan: Statistics Bureau, /www.stat.go.jp/ South Korea: Small and Medium Business Administration, /www.smba.go.kr/
Taiwan: White Paper on Small and Medium Enterprises in Taiwan, consecutive years. Malaysia: Small and Medium Industries Development Corporation, /www.smidec.gov.my/
Thailand: Office of SMEs Promotion, /cms.sme.go.th/ Singapore: Ministry of Trade and Industry, /www.mti.gov.sg/
In the UK, SMEs economic significance and contribution in generating income and
sustaining employment has been widely recognised by the government and policy
makers (Jayawarna et al., 2003). In terms of employment and annual turnover, SMEs
account for 58.9 % and 51.9% respectively and had an estimated combined turnover
of £2600 billion (DTI, 2006). At the start of 2005, out of 4.3 million enterprises, the
number of SMEs in the manufacturing sector was 332,130 (97.3% were small and
2.2% medium-sized enterprises). In terms of turnover and employment within the
manufacturing sector, SMEs contributed to 35.5% of annual turnover and provided
employment to 54.2% of population (DTI, 2006).
SMEs in the European Union provided jobs to 67.1% of employees and more than half
(52%) of private sector turnover (EUROSTAT, 2003). As presented in table 2.3, the
contribution of SMEs in the countries like Japan, South Korea, Taiwan, Malaysia, and
Singapore are significant in terms of employment and turnover. In most of these
countries, SMEs contribution to employment is more than 60% (higher than the
western part of the world). However, the turnover varies from as low as 29.84%
(Taiwan) to as high as 75.68% (Singapore). In the Organization for Economic Co-
operation and Development (OECD) Countries, SMEs represent over 95% of
enterprises in each of the 30 member countries and generate over half of private
sector turnover (OECD, 2003). 99% of all enterprises in China are SMEs, providing
employment to 75% of total workforce (China's Services SMEs, 2002).
In can be concluded from the above discussion that the success of SMEs will have
everlasting impact on the competitiveness of the knowledge-based economy in the
world, ensuring sustainable economic growth, creating more and better jobs, and
developing greater social cohesion.

Chapter 2: Introduction to SMEs
Maneesh Kumar 32
2.3. Understanding the growth of small firms
SMEs are the backbone of the modern economy, contributing significantly to gross
domestic product (GDP) and job creation of any developed or developing countries.
Yet, it is startling that theoretical and empirical understanding of the characteristics
and growth pattern of these firms remains somewhat fuzzy (Phelps et al., 2007; Dobbs
and Hamilton, 2007; Levie and Hay, 1998; Storey, 1994). The purpose of reviewing
the growth models for small businesses was to identify the key characteristics of the
firm as it metamorphoses into a large organization. The identification of key attributes
would facilitate in commenting on what makes small firms different from their larger
counterparts. The review would also identify the critical success factors (CSFs) driving
the growth of small firms and their transition into large organizations. The CSFs of
small business growth would be compared with the CSFs of CI initiatives in SMEs to
identify the similarities or differences in the listed factors. If a small business is
growing and exhibiting the CSFs of growth, it may be the indication that they are also
ready for embarking on CI journey, provided the CSFs of CI matches with the CSFs of
small business growth.
The first attempt towards the development of general theory of the growth of firms was
addressed by the economist Edith Penrose in 1959. Penrose (1959) clearly defined
what we mean by ‘firm’ and provided a detailed treatment of the various aspects of the
growth process in the firm, drawing out the theoretical implications for economists of a
more realistic view of the business world. The researcher clearly distinguished
between the characteristics of small firms and large firms and points out - “the
differences in the administrative structure of the very small and the very large firms are
so great that in many ways it is hard to see that the two species are of the same
genus……we cannot define a caterpillar and then use the same definition for a
butterfly”. This led to the emergence of the first research question that seeks to
understand the critical differences in the characteristics of SMEs compared to large
organizations.
RQ1: What makes SMEs different from large organizations?
The exposition of Penrose encouraged researchers to investigate the stages of
metamorphosis associated with the firm’s growth. The term ‘growth’ is defined by
researchers using measures such as sales (Barringer et al., 2005; Delmar et al., 2003;

Chapter 2: Introduction to SMEs
Maneesh Kumar 33
North and Smallbone, 2000; Smallbone et al., 1995), headcount or employment
(Delmar et al., 2003; Davidsson and Delmar, 1997; Freel and Robson, 2004; North
and Smallbone, 2000), financial growth (Becchetti and Trovato, 2002; Pena, 2002;
Orser et al., 2000), and total assets (Carpenter and Peterson, 2002). Empirical
research in the past has tried to explain the phenomenon of small business growth.
Summaries of important reviews of the literature on life cycle or growth of small firms
can be found in Dobbs and Hamilton (2007), Phelps et al (2007), Levie and Hay
(1998), Hanks et al (1993), and Gibb and Davies (1990). It was also identified from
literature that not all small firms want to grow as the owner of small firms prefers
status–quo and control over entire organization.
Dobbs and Hamilton (2007) classified the approaches to study the life cycle of small
business into six broad categories: stochastic; descriptive; evolutionary; resource-
based; learning; and deterministic. For the purpose of this research, the review is
limited to only three approaches, i.e. descriptive, deterministic and learning
approaches, to identify and understand the critical factors affecting the transition of
small firms into large organizations, rather than understanding ‘how’ the transition
occurs in all the categories discussed by Dobbs and Hamilton (2007). The details of
the descriptive and deterministic approaches were provided in Appendix I. The author
has included discussion on one of the approaches proposed by Dobbs and Hamilton
(2007), i.e. learning approach, to study the life cycle of small business. The learning
approach takes into account the role of operational improvement in the growth of small
business, which was previously not included in any of the growth models study
(Phelps et al., 2007).
The factors identified as critical to the growth of small firms from descriptive and
deterministic approaches are listed in table 2.4 and table 2.5. Concluding from the
review of descriptive stage models, determinants of small business growth, as listed in
table 2.4 are: strong leadership; management commitment; strategic planning; formal
organizational structure; focus on human resources; information planning and control
mechanism; and flexibility. Several factors critical to the growth of firms from the
deterministic approach were identified and listed in table 2.5. Organizational structure,
planning, communication, strategy, top-management decision making, management
style, resources, rewards, organizational size and age were the common factors
emerging from the review process.

Chapter 2: Introduction to SMEs
Maneesh Kumar 34
Table 2.4: Determinants of small business growth from descriptive approach
Lippitt and Schmidt (1967)
Steinmetz (1969)
Greiner (1972,1998)
Churchill and Lewis (1983)
Quinn and Cameron (1983)
Scott and Bruce (1987)
Factors considered imperative during the growth process
Leadership
Goal Setting
Communication of goals and objectives
Planning
Systematic control
Flexibility
Team decision-making
Management Style
Return on Investment
Size of firm
Assets
Owner Status
Leadership style
Management Focus
Organizational Structure
Leadership Style
Control System
Management Reward Emphasis
Owner’s strategic, managerial and operational abilities
Extent of formal systems
Information, Planning and Control mechanism
Strategic planning
Owner’s involvement in the business.
Matching of business and personal goals
People
Planning and goal Setting
Marshalling resources
Communication & Information management
Elaboration of structure
Formalization of rules
Flexibility
People
Role of top management
Management style
Organization structure
Product and market research
Systems and controls
Major sources of finance
Cash generation
Major Investment
Product-market issues

Chapter 2: Introduction to SMEs
Maneesh Kumar 35
Table 2.5: Determinants of small business growth from deterministic approach
Smith et al (1985)
Kazanjian (1988)
Gupta and Chin (1993)
Hanks et al (1993)
Mitra and Pingali (1999)
Shim et al (2000)
Barringer et al (2005)
Factors considered imperative during the growth process
Organizational Structure
Communication process
Planning
Top-level decision making
Organizational age and size
Organizational growth rate
Reward system
Resource
Technology
Formal structure
Process and planning
Leadership from CEO
Strategy making
Environment focus
Structure
Communication
Process and Planning
Top-level decision making
Organizational age and size
Innovation
Formal policies and procedures
Communication
Organizational structure
Rewards and incentive
Planning.
Top-level decision making
Customer focus
Customer base (number of customers)
Management Style
Managerial capability
Managerial orientation (long-term vs. short term)
Managerial goals (immediate vs. long-term)
Business Strategy (low-risk vs. high risk)
Human resource policy
Resource Management
Human resource focus
Management style
Top-management decision making
Formal operational business system
Entrepreneurial talent
Customer Knowledge
Tertiary education
Mission statement
Commitment to growth
Inter-organizational relationship
Industry experience of founder
Financial incentives

Maneesh Kumar
The learning approach
absorb and use new knowledge (i.e. absorptive capacity) in resolving the challenges
or barriers faced during the transition, termed as crisis point / revolution/ tipping point
(Cohen and Levinthal, 1990; Zahra and George, 2003; Bessant
Macpherson, 2005; Phelps
models discussed in descriptive approaches (
framework for the growth of firms, as shown in figure 2.1 below.
Figure 2.1: The tipping point in a state framew
Unlike stage framework, state framework does not predict sequence of stages
characterized by increasing size and age, as observed in the stage models. The state
framework consists of two elements: tip
firms; absorptive capacity
knowledge in resolving the challenges presented by tipping points (Phelps
2007). From the work of Phelps
growth of firms were-
Chapter 2: Introduction to SMEs
learning approach takes into consideration the capability of an organization to
e new knowledge (i.e. absorptive capacity) in resolving the challenges
or barriers faced during the transition, termed as crisis point / revolution/ tipping point
(Cohen and Levinthal, 1990; Zahra and George, 2003; Bessant
helps et al., 2007). Phelps et al (2007) criticized the stage
models discussed in descriptive approaches (Appendix I) and proposed a ‘state’
framework for the growth of firms, as shown in figure 2.1 below.
The tipping point in a state framework for growth of firms
(Source: Phelps et al., 2007)
Unlike stage framework, state framework does not predict sequence of stages
characterized by increasing size and age, as observed in the stage models. The state
framework consists of two elements: tipping point- describes the problems faced by
firms; absorptive capacity- describes the firm’s ability to absorb and use new
knowledge in resolving the challenges presented by tipping points (Phelps
2007). From the work of Phelps et al (2007), the six critical factors responsible for the
- Strategy; Formal system; People management; Obtaining
Chapter 2: Introduction to SMEs
36
takes into consideration the capability of an organization to
e new knowledge (i.e. absorptive capacity) in resolving the challenges
or barriers faced during the transition, termed as crisis point / revolution/ tipping point
(Cohen and Levinthal, 1990; Zahra and George, 2003; Bessant et al., 2005;
(2007) criticized the stage
ppendix I) and proposed a ‘state’
framework for the growth of firms, as shown in figure 2.1 below.
ork for growth of firms
(Source: Phelps et al., 2007)
Unlike stage framework, state framework does not predict sequence of stages
characterized by increasing size and age, as observed in the stage models. The state
describes the problems faced by
describes the firm’s ability to absorb and use new
knowledge in resolving the challenges presented by tipping points (Phelps et al.,
x critical factors responsible for the
Strategy; Formal system; People management; Obtaining
Chapter 2: Introduction to SMEs
Maneesh Kumar 37
finance; Operational improvement; and Market entry. Operational improvement was a
new factor that emerged from this study and was not discussed previously in the stage
models (can be observed from table 2.4 and table 2.5). There exists a research gap
concerning the lack of understanding and knowledge on the types of operational
improvements that are of specific value for growing SMEs. The author doctoral
research on feasibility study of CI initiatives in SMEs attempts to bridge the existing
gap by addressing the different alternatives available for SMEs to improve their
operational performance.
Phelps et al (2007) states that there is no standard sequence of stages or problems
and the growing firms will encounter a basic set of key issues, i.e. tipping point, at
some point in the life cycle. Similar to the CI maturity model that describes a
organization moving from no formal CI structure to full CI [learning organization]
(Bessant and Caffyn, 1997), Phelps et al (2007) proposed a series of possible learning
states that the growing firm may occupy, i.e. ignorance, awareness, knowledge, and
implementation, as shown in figure 2.1. Interventions are required at each state,
internally or externally, for firms to raise their absorptive capacity and ascend from the
state of ignorance to state of implementation with respect to each tipping point. For
more information on the framework, please refer to Phelps et al (2007). The strength
of this model over the stage model was that it does not predict the point/time when the
organization would experience a crisis. The model rather states that the tipping point
would be experienced during the growth period (any point of time as the firm grows
into a large organization) of small firms and interventions were required to overcome
the crisis.
The key to growth within the learning perspective was the acquisition of external
knowledge (Cohen and Levinthal, 1990; Zahra and George, 2003) to become aware of
key issues a firm faces and provide solutions to successfully traverse through the
crises and challenges generated at the tipping point (Bessant et al., 2005; Phelps et
al., 2007). The emphasis here is on entrepreneurs or firms’ acquisition of external
knowledge, their ability to recognize the value of new information, assimilating it, and
applying it to commercial ends to allow their business to grow. One of the limitations of
the model was testing its robustness with large number of SMEs and to further
develop the understanding of firm’s absorptive capacity, tipping points and
interventions required to get growing firms successfully through the tipping points.
Chapter 2: Introduction to SMEs
Maneesh Kumar 38
Factors identified as critical in explaining the growth of firms were also reported by
Dobbs and Hamilton (2007) and Storey (1994), after a thorough review of literature.
Critical factors that have a positive impact on the growth of firms as identified in the
study were: commitment and motivation of the owner(s); availability of financial
resources; employee skill level; collaboration and networking; experience and
education of the entrepreneur; management recruitment; management experience;
planning; market adjustment; new product introduction; and technological
sophistication. A firm’s age and size had a negative impact on a firm’s growth, i.e.
young or small firm grow faster than mature or large firms. Factors such as workforce
training and the size of the founding team had a mixed effect on a firm’s growth. For
more information please refer to Dobbs and Hamilton (2007) and Storey (1994).
Taking cue from the key findings of the aforementioned three approaches,
characteristics of SMEs were explained in reference to the identified critical factors
from the literature. Factors critical to the growth of small firms were depicted in the
cause and effect diagram in figure 2.2. In the figure 2.2, the effect is ‘the growth of
small firms’ and the causes of growth are ‘the critical factors’ governing the growth as
identified from the literature.
The common critical factors identified from the literature on small business growth are:
leadership, management style, strategic planning, organizational structure, systems
and procedures, human resources, market & customer focus and operational
improvement. Surprisingly, the last two factors were not commonly cited in the
literature, which plays a vital role in the growth of firms (Mitra and Pingali, 1999; Shim
et al., 2000; Barringer et al., 2005; Phelps et al., 2007). Any CI initiative like Lean or
Six Sigma begins and ends with the customer and emphasises on improving the
organizational performance (Antony and Banuelas, 2002).
The three approaches to small business growth failed to take into account other
factors such as innovation (Rothwell, 1989; Nooteboom, 1994; Birchall et al., 1996;
Vossen, 1998; Karlsson and Olsson, 1998; McAdam and Armstrong, 2001;
Humphreys et al., 2005; Laforet and Tann, 2006) and networking (Ostgaard and
Birley, 1994; Barbosa and Fuller, 2007; Mazzarol, 2007; Chen and Huang, 2004),
which play an important role in small business growth in the era of globalization. As
customer’s demand changes quickly, firms need to be flexible and innovative in
manufacturing customized products or delivering customized services to their

Chapter 2: Introduction to SMEs
Maneesh Kumar 39
customers. Networking is equally critical for small firms to mitigate the effect of limited
resources in the growth of firm. As the author’s research is focused on implementation
of Six Sigma in SMEs, it is imperative to identify the critical factors that ensure the
successful implementation of Six Sigma. The identification of critical factors of small
business growth was used to compare with findings from the empirical research in
Chapter 8.
Figure 2.2: Critical success factors for the growth of small businesses
Based on the aforementioned CSFs, the next section will discuss the key
characteristics of SMEs with respect to each factor and its comparison with large
organizations. The review in the next section also includes literature on CI initiatives
implementation in SMEs along with the growth cycle of small firms. Quality
management literature was introduced in discussion where the CSFs of small
business growth matched with those proposed for quality management
implementation in SMEs. Commonality in the CSFs of small business growth and
implementation of CI initiatives in SMEs can be drawn from the literature review in
chapter 3.
2.4. SMEs characteristics and comparison with large organizations
The characteristics of SMEs were discussed in relation to the identified CSFs from the
literature, as presented in the table 2.6. Table 2.6 also focus on the changes observed
in these factors as the small firm matures into a large organization. Each dimension of

Chapter 2: Introduction to SMEs
Maneesh Kumar 40
business growth i.e. CSFs, varies in its characteristics as the firm grows from small to
large business. The characteristics of SMEs and their differences with large
organizations in relation to each critical factor were briefly discussed in this section.
2.4.1. Leadership
The factor identified to be of most importance to the survival and growth of small firms
in the UK was the capabilities and skills of the owner / entrepreneur (Carter et al.,
2000: 7). Before discussing the importance of leadership qualities of entrepreneurs in
small firms, an introduction to the characteristics of entrepreneurs was briefly
discussed. It was stated that entrepreneurs were the energizers of small businesses,
possessing typical characteristics such as total commitment to the business and
strong belief (Dewhurst and Burns, 1993); opportunity-driven (Penrose, 1959);
innovators (Dewhurst and Burns, 1993; Soderquist et al., 1997; McAdam and
Armstrong, 2001; Laforet and Tann, 2006); versatile with a natural need for
achievement (Dewhurst and Burns, 1993); and risk takers (Soderquist et al., 1997;
McAdam and Armstrong, 2001). In the research undertaken by Storey (1994) to
understand the growth of small firms, entrepreneurial factors identified as having a
positive impact on the growth of firms were motivation, education, management
experience (before starting the business), number of founders, and functional skills.
Some of the aforementioned traits of entrepreneurs were also required to demonstrate
strong leadership.
A SME success often hinge on its owner’s leadership skills characterised by unity of
ownership, management, liability and risk. However, the majority of owners of small
firms lack the necessary administrative skills and therefore managerial culture was
almost absent (Greiner, 1972; Churchill and Lewis, 1983; Scott and Bruce, 1987;
Wessel and Burcher, 2004; Garengo et al., 2005a). The general finding in SMEs was
lack of time available for the leader to undertake anything other than operational
activities (Garengo et al., 2005a). Due to flat organizational structure and limited
resources, the ownership and management of day-to-day operational activities rest
with the owner / leader in SMEs compared to larger organisations where leadership is
shared to a greater extent, dispersed and institutionalised. The ability of the leader to
free him/her from mundane operational concerns and to focus on the longer-term

Chapter 2: Introduction to SMEs
Maneesh Kumar 41
strategic future of the organisation was seen as a key challenge in SMEs (Ghobadian
and Gallear, 1996; Garengo et al., 2005a).
2.4.2. Management Style
The management in small businesses were mostly through direct supervision or
supervised supervision by owner(s)/manager(s) as compared to delegation or
decentralization of responsibilities to employees as witnessed in large firms (Greiner,
1972, 1998; Churchill and Lewis, 1983; Scott and Bruce, 1987). Control by the owner/
manager of everything may stifle the growth process in small firms. Understanding
management of small firms was an essential component in perceiving the relationship
between ownership and decision making, managerial styles, organizational structure
and culture, and pattern of business development (Beaver and Prince, 2004).
Due to the flat structure of SMEs, the owner/ manager have a good understanding of
operational issues, processes, customer needs, and are more likely to be involved
with the customers (Ghobadian and Gallear, 1996; Cagliano et al., 2001; Youssef et
al., 2002; Deros et al., 2006). Top management in the large organization was far
removed from the point of delivery due to division of function, labour, and creation of
multiple level of authority (Ghobadian and Gallear, 1997; Beaver and Prince, 2004).
The ownership of large firms was usually distanced from its management and control,
which was not evident in the majority of SMEs. Large organizations were usually
bureaucratic, relying on formalization of behaviour and delegation of responsibilities at
the department/functional level to achieve co-ordination.
2.4.3. Strategic Planning
A critical appraisal of strategic planning literature on SMEs (Shrader et al., 1989;
Baker et al., 1993; Berry, 1998; Barnes, 2002; Sum et al., 2004; Beaver and Prince,
2004) suggests that strategic activities were informal, intuitive, invisible, and often owe
more to a speedy response than an in-depth analysis (as demonstrated in large firms).
Management decision in SMEs is often based on imprecise information and subject to
fluctuation. This may be attributed to the volatile and short-term nature of
contemporary markets encompassing the SME. SMEs exist in uncertain and dynamic

Chapter 2: Introduction to SMEs
Maneesh Kumar 42
environment, where innovation, flexibility, and responsiveness may be vital for
survival. Strategic planning is often viewed as inappropriate. In such firms, the
strategic process was emergent and instinctive rather than fixed and regulated as in
many large firms. This approach was more appropriate and efficient for SMEs to
deploy when integrating their business activities with the competitive environment
(Beaver and Prince, 2004). Owners-managers in SMEs were driven more by survival
and independence than by growth and business development (Storey, 1994; Burns
and Dewhurst, 1996). In such cases, focus on niche strategies was considered to be
more realistic for small firms, owning to their inherent resource disadvantages (Curran
and Blackburn, 1994; Tolentino, 2000). The strategic planning employed by a firm was
contingent upon its stage of development and this activity may evolve and become
more formal and sophisticated over the life-cycle of the business (Greiner, 1972; Scott
and Bruce, 1987; Storey, 1994; Berry, 1998; Phelps et al., 2007).
2.4.4. Structure
SMEs have flat organizational structure, i.e. fewer levels of management, and fewer
departmental interfaces promoting a flexible work environment (Shea and Gobeli,
1995; Ghobadian and Gallear, 1996, 1997). Faster communication, quick decision
making process, faster implementation, and less resistance to change were some
advantages of the flat structure for SMEs compared to their larger counterparts. Large
organizations have higher degree of formalization, standardization, and specialization
compared to the organic nature of small firms, i.e. absence of standardization and the
prevalence of loose and informal working relationships (Yusof and Aspinwall, 2000 a,
b; Youssef et al., 2002; Garengo et al., 2005a; Deros et al., 2006). Tidd et al. (2001)
strongly argued that flat organizational structure and streamlined business processes
were good in short-term to have an efficient and productive business, though in the
long-term this would not promote the development of innovative products or services,
and thereby was sidelined to respond to ever changing market and technology.
2.4.5. System and Procedures
The extent of formal systems in small firms ranges from minimal/non-existent to basic
level compared to large firms, where they have mature and formally established
Chapter 2: Introduction to SMEs
Maneesh Kumar 43
systems and procedures in place (Churchill and Lewis, 1983; Scott and Bruce, 1987;
Ghobadian and Gallear, 1996; Yusof and Aspinwall, 2000a, b; Deros et al., 2006).
Simple bookkeeping or eyeball/ personal control were characteristics of the small firm,
which transforms to a formal control system and management by objectives as the
firm grows larger. The simple processes in SMEs allowed flexibility, encouraged
innovation, and speedy response to customer needs/ demands (Deros et al., 2006).
Though the SME have the advantage of flexible and adaptable processes, they still
use the informal evaluation, control and reporting procedures; thus promoting
decisions based on gut-feeling.
2.4.6. Human Resources
It is easier in the SME environment to educate and train employees due to the smaller
workforce compared to their larger counterparts. The time required to cascade training
to shop-floor employees was very much shorter. However, due to scarcity of
resources (intellectual capital, human resources, and financial capability) or facilities to
deliver effective programs (Yusof and Aspinwal, 2000 a; Thomas and Webb, 2003;
Wessel and Burcher, 2004), SMEs struggled to allocate sufficient funds for training
despite training needs of employees being identified (Lee and Oakes, 1995;
Ghobadian and Gallear, 1996; McAdam, 2000). Because of the limited resources,
there may be a problem to find out the time for training as every employee has a key
role (often many) (Moreno-Luzon, 1993). Training and staff development in SMEs was
more likely to be adhoc and small scale compared to the planned and large scale
training in larger firms. High personal authority, commitment and responsibility of the
owners in SMEs may create cohesions and enhance a common purpose among the
workforce to ensure the job gets done (Yusof and Aspinwall, 2000 a, b; Youssef et al.,
2002; Deros et al., 2006). The evaluation, reward and reporting system was simpler in
SMEs and the individual normally can see the results of their endeavours.
2.4.7. Market and Customer Focus
Research in the USA and Europe (Ghobadian and Gallear, 1996, 1997; Haksever,
1996; Yusof and Aspinwall, 2000 a, b; Youssef et al., 2002; Garengo et al., 2005a, b;
Deros et al., 2006) have clearly shown that SMEs are more responsive to market

Chapter 2: Introduction to SMEs
Maneesh Kumar 44
needs, more adaptable to change, and more innovative in their ability to meet
customer needs (Haksever, 1996; Moreno-Luzon, 1993; McAdam and Armstrong,
2001). SMEs are very close to their products and customers that allow faster
information flow between customers and the company, creating an increased sense of
responsibility. Many successful SMEs deliberately choose to exploit a particular
market segment where they can either specialize in quality improvements not offered
by large firms or attain a cost advantage by offering a particular expertise or
specialized knowledge (Beaver and Prince, 2004). SMEs are normally dependent on a
small customer base (in a local or regional market) with limited external contacts. On
the contrary, larger firms have a wide span of activities dispersed externally with
greater scope for a large customer base.
2.4.8. Operational Improvement
As defined by Phelps et al. (2007), operational improvement signifies “a move from ‘if
it ain’t broke don’t fix it’ towards an awareness and understanding of process
capabilities and the implementation of best practices oriented towards efficiency gains
and avoidance of error”. Implementation of best-in-class management practices such
as TQM, Lean, Six Sigma, and Kaizen, to name a few, in large organizations is well
documented and cited in literature (Banuelas and Antony, 2002; Antony et al., 2005).
However, existing evidence suggests that SMEs were slower to adopt such formalized
management practices due to lack of understanding of system, lack of resources and
knowledge, and short-term strategic planning (Garengo et al., 2005b; Kumar, 2007;
Phelps et al.,2007; Antony et al., 2008). The understanding of operational
improvement activities and its measurement will force small firms to do strategic
planning, implement solutions, and identify gaps between the company’s current
performance and its objectives.
Fact-based management using the concept of performance measurement system
(PMS) is particularly imperative for supporting managerial development required in
SMEs to manage increasing complexity (Garengo et al., 2005b). Implementation of
PMS (very rarely observed practice within small firms, where the majority of decisions
were based on gut-feeling rather than data collection and analysis) could support
decision-making processes in SMEs and facilitate them to improve their management

Chapter 2: Introduction to SMEs
Maneesh Kumar 45
processes, strategic control, and support the culture of continuous improvement
(Barnes et al., 1998; Neely, 2000; Garengo et al., 2005b; Phelps et al., 2007).
2.4.9. Innovation
Innovation is a key source of competitive advantage for organizations, as cited in
several research studies. There are different schools of thought that have debated the
relative merits of small and large firms with respect to innovation (Rothwell, 1989;
Nooteboom, 1994; Vossen, 1998; Hallberg, 2003; Tidd et al, 2001) and have reached
diametrically opposite conclusions. Hallberg (2003) study clearly stated that SMEs
have an edge over large organizations with respect to innovation, while Tidd et al
(2001) argues that SMEs were not always more innovative.
The relative advantage of large firms lies mostly in making use of their
resources/economies of scale and good external networking, while SMEs are
relatively strong in innovation where effects of scale are not important as compared to
their behavioural attributes including entrepreneurial dynamism, efficient network co-
operation, flexibility, proximity to market demands, and motivation (Rothwell, 1989;
Nooteboom, 1994; Birchall et al., 1996; Vossen, 1998; Karlsson and Olsson, 1998).
Some of the other reasons cited in the literature that promotes innovation in small
firms were increasing global competition, demand from customer for cost reduction,
input from their own research & development (R&D) department (Soderquist et al.,
1997; Birchall et al., 1996) and firms having a history of successful CI initiatives, which
build a successful innovative culture (McAdam et al., 1998; McAdam and Armstrong,
2001). Research had demonstrated that SMEs conducted R&D more efficiently
compared to their larger counterparts, who may be more R&D intensive but less
efficient (Vossen, 1998; Acs and Audretsch, 1990; Nooteboom, 1994; Soderquist et al,
1997).
Summarising the findings from the past research, factors identified as critical to SMEs
innovative performance were entrepreneurial dynamism, commitment of CEOs/
owners (Rothwell, 1983, 1989; Nooteboom, 1994; Birchall et al., 1996;Vossen, 1998;
McAdam et al., 2000; Humphreys et al., 2005); corporate culture (Oakey and
Cooper, 1991; Dogson and Rothwell, 1991; Laforet and Tann, 2006); innovation linked
to strategic business plan (Soderquist et al., 1997; Laforet and Tann, 2006); efficient
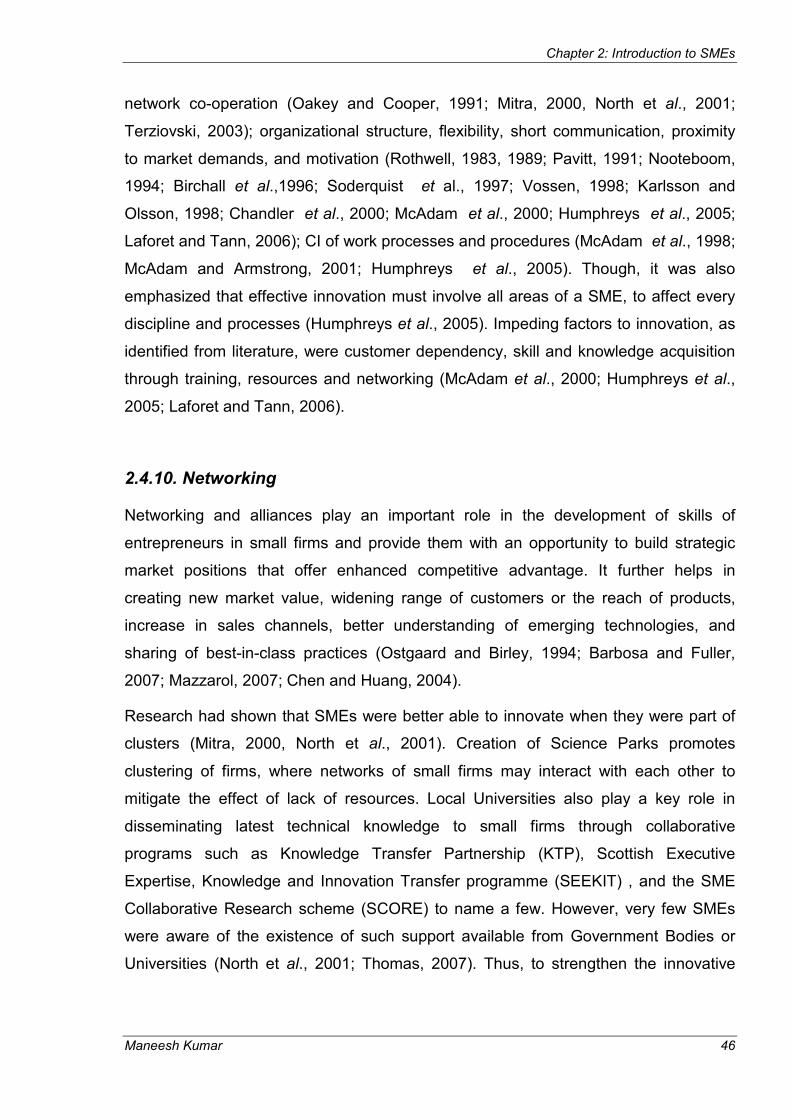
Chapter 2: Introduction to SMEs
Maneesh Kumar 46
network co-operation (Oakey and Cooper, 1991; Mitra, 2000, North et al., 2001;
Terziovski, 2003); organizational structure, flexibility, short communication, proximity
to market demands, and motivation (Rothwell, 1983, 1989; Pavitt, 1991; Nooteboom,
1994; Birchall et al.,1996; Soderquist et al., 1997; Vossen, 1998; Karlsson and
Olsson, 1998; Chandler et al., 2000; McAdam et al., 2000; Humphreys et al., 2005;
Laforet and Tann, 2006); CI of work processes and procedures (McAdam et al., 1998;
McAdam and Armstrong, 2001; Humphreys et al., 2005). Though, it was also
emphasized that effective innovation must involve all areas of a SME, to affect every
discipline and processes (Humphreys et al., 2005). Impeding factors to innovation, as
identified from literature, were customer dependency, skill and knowledge acquisition
through training, resources and networking (McAdam et al., 2000; Humphreys et al.,
2005; Laforet and Tann, 2006).
2.4.10. Networking
Networking and alliances play an important role in the development of skills of
entrepreneurs in small firms and provide them with an opportunity to build strategic
market positions that offer enhanced competitive advantage. It further helps in
creating new market value, widening range of customers or the reach of products,
increase in sales channels, better understanding of emerging technologies, and
sharing of best-in-class practices (Ostgaard and Birley, 1994; Barbosa and Fuller,
2007; Mazzarol, 2007; Chen and Huang, 2004).
Research had shown that SMEs were better able to innovate when they were part of
clusters (Mitra, 2000, North et al., 2001). Creation of Science Parks promotes
clustering of firms, where networks of small firms may interact with each other to
mitigate the effect of lack of resources. Local Universities also play a key role in
disseminating latest technical knowledge to small firms through collaborative
programs such as Knowledge Transfer Partnership (KTP), Scottish Executive
Expertise, Knowledge and Innovation Transfer programme (SEEKIT) , and the SME
Collaborative Research scheme (SCORE) to name a few. However, very few SMEs
were aware of the existence of such support available from Government Bodies or
Universities (North et al., 2001; Thomas, 2007). Thus, to strengthen the innovative
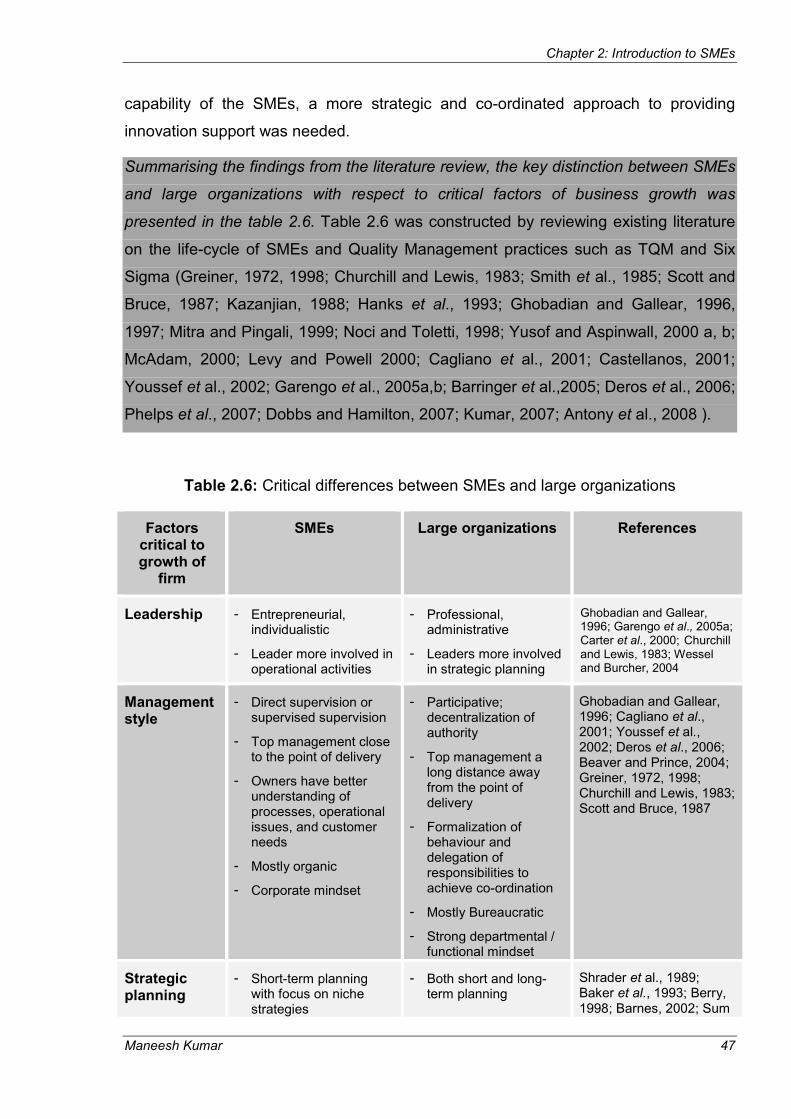
Chapter 2: Introduction to SMEs
Maneesh Kumar 47
capability of the SMEs, a more strategic and co-ordinated approach to providing
innovation support was needed.
Summarising the findings from the literature review, the key distinction between SMEs
and large organizations with respect to critical factors of business growth was
presented in the table 2.6. Table 2.6 was constructed by reviewing existing literature
on the life-cycle of SMEs and Quality Management practices such as TQM and Six
Sigma (Greiner, 1972, 1998; Churchill and Lewis, 1983; Smith et al., 1985; Scott and
Bruce, 1987; Kazanjian, 1988; Hanks et al., 1993; Ghobadian and Gallear, 1996,
1997; Mitra and Pingali, 1999; Noci and Toletti, 1998; Yusof and Aspinwall, 2000 a, b;
McAdam, 2000; Levy and Powell 2000; Cagliano et al., 2001; Castellanos, 2001;
Youssef et al., 2002; Garengo et al., 2005a,b; Barringer et al.,2005; Deros et al., 2006;
Phelps et al., 2007; Dobbs and Hamilton, 2007; Kumar, 2007; Antony et al., 2008 ).
Table 2.6: Critical differences between SMEs and large organizations
Factors critical to growth of
firm
SMEs Large organizations References
Leadership - Entrepreneurial, individualistic
- Leader more involved in operational activities
- Professional, administrative
- Leaders more involved in strategic planning
Ghobadian and Gallear, 1996; Garengo et al., 2005a; Carter et al., 2000; Churchill and Lewis, 1983; Wessel and Burcher, 2004
Management style
- Direct supervision or supervised supervision
- Top management close to the point of delivery
- Owners have better understanding of processes, operational issues, and customer needs
- Mostly organic
- Corporate mindset
- Participative; decentralization of authority
- Top management a long distance away from the point of delivery
- Formalization of behaviour and delegation of responsibilities to achieve co-ordination
- Mostly Bureaucratic
- Strong departmental / functional mindset
Ghobadian and Gallear, 1996; Cagliano et al., 2001; Youssef et al., 2002; Deros et al., 2006; Beaver and Prince, 2004; Greiner, 1972, 1998; Churchill and Lewis, 1983; Scott and Bruce, 1987
Strategic planning
- Short-term planning with focus on niche strategies
- Both short and long-term planning
Shrader et al., 1989; Baker et al., 1993; Berry, 1998; Barnes, 2002; Sum
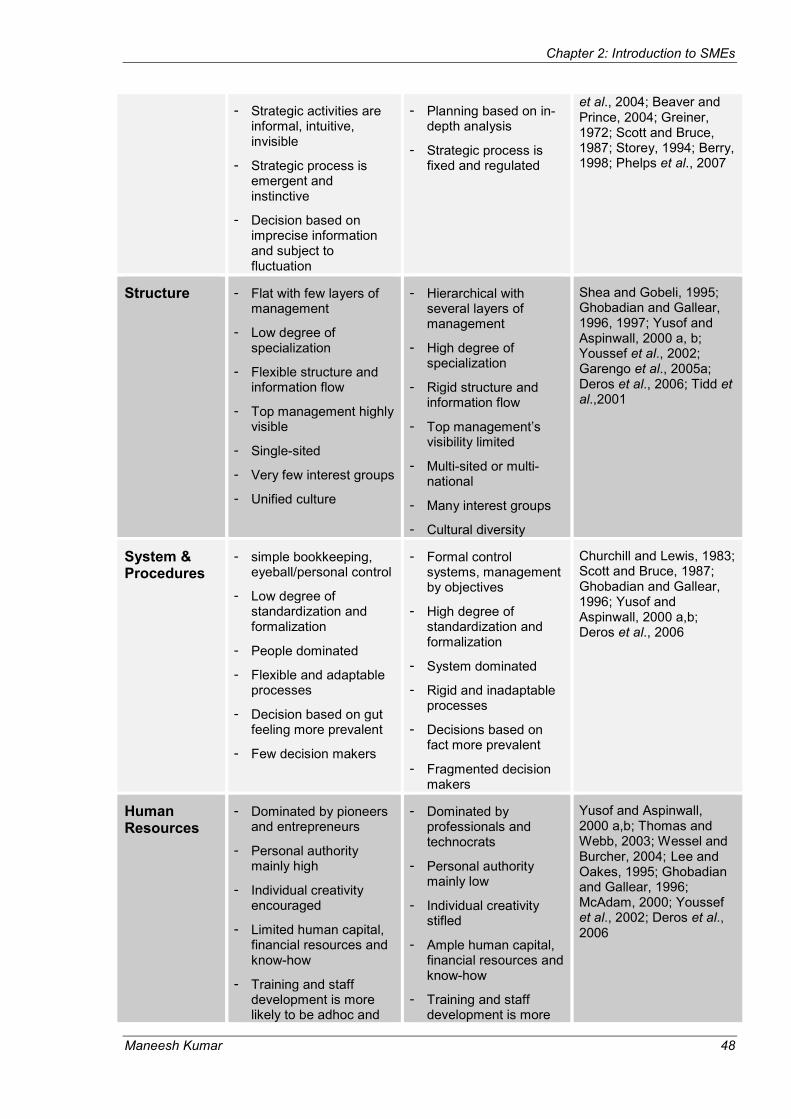
Chapter 2: Introduction to SMEs
Maneesh Kumar 48
- Strategic activities are informal, intuitive, invisible
- Strategic process is emergent and instinctive
- Decision based on imprecise information and subject to fluctuation
- Planning based on in-depth analysis
- Strategic process is fixed and regulated
et al., 2004; Beaver and Prince, 2004; Greiner, 1972; Scott and Bruce, 1987; Storey, 1994; Berry, 1998; Phelps et al., 2007
Structure - Flat with few layers of management
- Low degree of specialization
- Flexible structure and information flow
- Top management highly visible
- Single-sited
- Very few interest groups
- Unified culture
- Hierarchical with several layers of management
- High degree of specialization
- Rigid structure and information flow
- Top management’s visibility limited
- Multi-sited or multi-national
- Many interest groups
- Cultural diversity
Shea and Gobeli, 1995; Ghobadian and Gallear, 1996, 1997; Yusof and Aspinwall, 2000 a, b; Youssef et al., 2002; Garengo et al., 2005a; Deros et al., 2006; Tidd et al.,2001
System & Procedures
- simple bookkeeping, eyeball/personal control
- Low degree of standardization and formalization
- People dominated
- Flexible and adaptable processes
- Decision based on gut feeling more prevalent
- Few decision makers
- Formal control systems, management by objectives
- High degree of standardization and formalization
- System dominated
- Rigid and inadaptable processes
- Decisions based on fact more prevalent
- Fragmented decision makers
Churchill and Lewis, 1983; Scott and Bruce, 1987; Ghobadian and Gallear, 1996; Yusof and Aspinwall, 2000 a,b; Deros et al., 2006
Human Resources
- Dominated by pioneers and entrepreneurs
- Personal authority mainly high
- Individual creativity encouraged
- Limited human capital, financial resources and know-how
- Training and staff development is more likely to be adhoc and
- Dominated by professionals and technocrats
- Personal authority mainly low
- Individual creativity stifled
- Ample human capital, financial resources and know-how
- Training and staff development is more
Yusof and Aspinwall, 2000 a,b; Thomas and Webb, 2003; Wessel and Burcher, 2004; Lee and Oakes, 1995; Ghobadian and Gallear, 1996; McAdam, 2000; Youssef et al., 2002; Deros et al., 2006

Chapter 2: Introduction to SMEs
Maneesh Kumar 49
small scale
- Low incidence of unionization
- Negligible resistance to change
- More generalists, some staff may cover more than one department
- Very few internal change catalysts
likely to be planned and large scale
- High incidence of unionization
- High degree of resistance to change
- More specialist staff
- Potentially many internal change catalysts
Market & Customer focus
- Span of activities narrow
- Limited external contacts
- Limited customer base
- Wide span of activities
- Extensive external contacts
- Larger customer base
Ghobadian and Gallear, 1996, 1997; Haksever, 1996; Yusof and Aspinwall, 2000 a,b; Youssef et al., 2002; Garengo et al., 2005a,b; Deros et al., 2006; Haksever, 1996; Moreno-Luzon, 1993; McAdam and Armstrong, 2001; Beaver and Prince, 2004
Operational improvement
- Limited knowledge or understanding of operational improvement activities
- Slower to adopt such formalized management practices
- Poor understanding of performance measurement system
- Poor project-management understanding
- Process improvement based on gut feeling
- Vast knowledge or understanding of operational improvement activities
- High incidence of implementation of CI initiatives
- Better understanding of performance measurement system
- Better understanding and experience of managing complex projects
- Process improvement projects initiated based on facts and data
Garengo et al., 2005b; Kumar, 2007; Phelps et al.,2007; Antony et al., 2008; Banuelas and Antony, 2002; Antony et al., 2005; Barnes et al., 1998; Neely, 2000
Innovation - High incidence of innovation
- Innovation can represent a disproportionately large financial risk
- Inability to spread risk over a portfolio of projects
- In some area scale economies form substantial entry barrier
- Low incidence of innovation
- Ability to spread risk over portfolio of projects
- Ability to gain scale economies in R&D, production and marketing
- Research & Development (R&D) activities more
Rothwell, 1989; Nooteboom, 1994; Vossen, 1998; Hallberg, 2003; Tidd et al, 2001; Birchall et al.,1996; Karlsson and Olsson, 1998; Soderquist et al., 1997; McAdam et al., 1998; McAdam and Armstrong, 2001; Acs and Audretsch, 1990; McAdam et al., 2000; Humphreys et al., 2005;
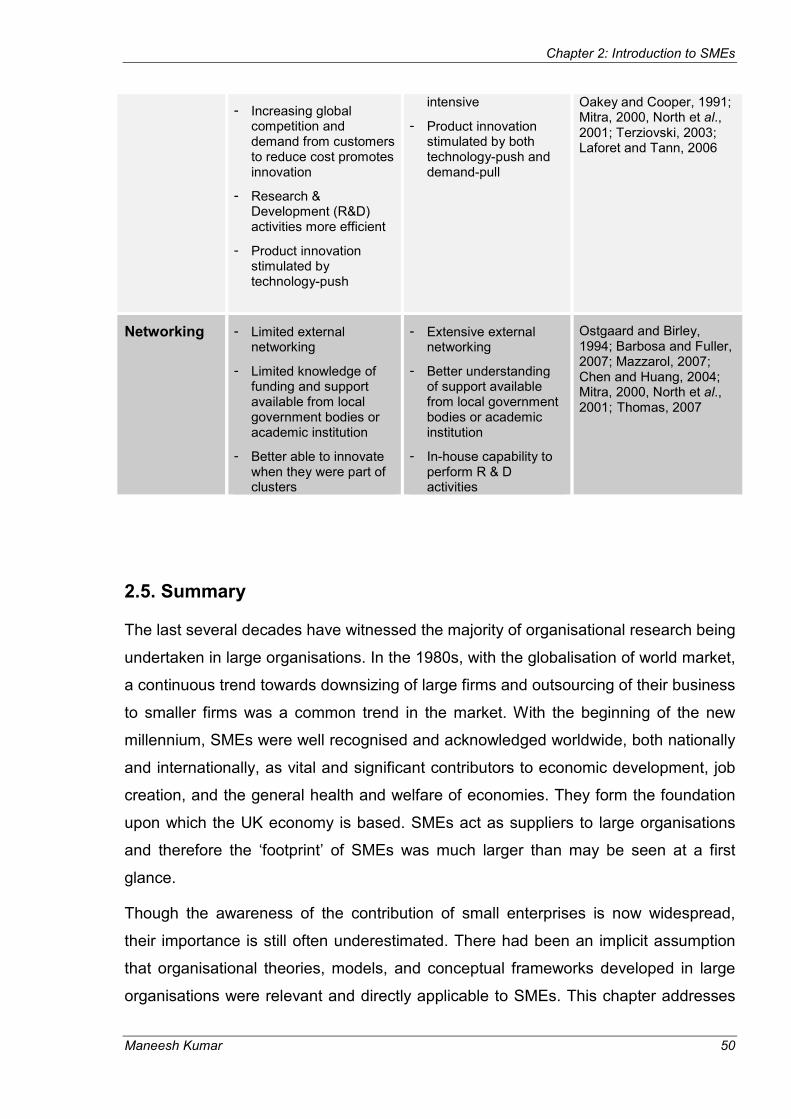
Chapter 2: Introduction to SMEs
Maneesh Kumar 50
- Increasing global competition and demand from customers to reduce cost promotes innovation
- Research & Development (R&D) activities more efficient
- Product innovation stimulated by technology-push
intensive
- Product innovation stimulated by both technology-push and demand-pull
Oakey and Cooper, 1991; Mitra, 2000, North et al., 2001; Terziovski, 2003; Laforet and Tann, 2006
Networking - Limited external networking
- Limited knowledge of funding and support available from local government bodies or academic institution
- Better able to innovate when they were part of clusters
- Extensive external networking
- Better understanding of support available from local government bodies or academic institution
- In-house capability to perform R & D activities
Ostgaard and Birley, 1994; Barbosa and Fuller, 2007; Mazzarol, 2007; Chen and Huang, 2004; Mitra, 2000, North et al., 2001; Thomas, 2007
2.5. Summary
The last several decades have witnessed the majority of organisational research being
undertaken in large organisations. In the 1980s, with the globalisation of world market,
a continuous trend towards downsizing of large firms and outsourcing of their business
to smaller firms was a common trend in the market. With the beginning of the new
millennium, SMEs were well recognised and acknowledged worldwide, both nationally
and internationally, as vital and significant contributors to economic development, job
creation, and the general health and welfare of economies. They form the foundation
upon which the UK economy is based. SMEs act as suppliers to large organisations
and therefore the ‘footprint’ of SMEs was much larger than may be seen at a first
glance.
Though the awareness of the contribution of small enterprises is now widespread,
their importance is still often underestimated. There had been an implicit assumption
that organisational theories, models, and conceptual frameworks developed in large
organisations were relevant and directly applicable to SMEs. This chapter addresses
Chapter 2: Introduction to SMEs
Maneesh Kumar 51
the critical differences between small and large organizations (i.e. RQ1) based on the
literature review on growth of small firms and implementation of initiatives like TQM
and Six Sigma in SMEs. Very few researchers in quality management literature have
explained the characteristics of small firms and their differences with large
organizations based on literature of small business growth. Understanding of the
phenomenon of small business growth and critical factors involved in the transition
phase may aid in the successful implementation of any change management
programs within the SME environment. There were significant differences between
SMEs and their large counterparts in the way they run the businesses and embrace
theories and models proposed by academics or practitioners.
The distinction between large and small firms was explained based on the ten CSFs
identified from the literature. This chapter led to the emergence of first research
question, i.e. RQ1, and also partly answers this question by reviewing the extant
literature on small business growth and key articles on CI initiatives in SMEs. The
similarity in the CSFs of small business growth and CI initiatives in SMEs indicates
that if a small business is growing and exhibiting the CSFs of growth, it may be the
indication that they are also ready for embarking on CI journey.
Chapter 3: Quality initiatives in SMEs
Maneesh Kumar 52
Chapter 3
Quality initiatives in SMEs- A review of literature
3.0. Introduction
The chapter starts with a general literature review on evolution of quality from
inspection and testing to implementation of continuous improvement initiatives like
TQM, Lean, and Six Sigma in large organizations. Chapter 2 addressed the research
question 1 (RQ1) on what makes small and medium-sized enterprises different from
large organizations by critically analyzing the literature on the life/growth-cycle of small
firms into a large business. The differences between SMEs and its larger counterpart
raised question on the applicability of frameworks/models proposed for large
organizations in a SME environment. Due to differences in the characteristic of SMEs
compared to large organizations, the working principles of framework/models should
be tailored to the needs of SMEs by taking into account constraints they experience in
running their business. The review of literature on quality management practices and
application in SME environment leads to emergence of key research questions for this
study. The next section discusses the scope of literature review.
3.1. Scope of review
The focus on quality management research in the last three decades had been on
large organizations with minimal interest in researching SMEs. This chapter
accentuates on understanding the quality management practices in SMEs by
reviewing the extant literature on the implementation of different quality initiatives (QI)
or certification system in SMEs. The discussion on application of QI in large
organizations was kept to minimum in the first part of the literature review. The review
of QI literature in SMEs lead to the identification of the research gap and generation of
another four research questions to understand the feasibility of Six Sigma application
in SME, an area least researched and reported (Antony et al., 2005, 2008; Kumar,
2007). Due to limited literature on Six Sigma application in SMEs, literature review
focused more on the application and impact of other CI initiatives such as TQM and
Lean in SMEs to generate a picture of quality management practices in SMEs. Initially,

Chapter 3: Quality initiatives in SMEs
Maneesh Kumar 53
ISO application in SMEs was omitted from the literature review as the focus of the
study was more on CI initiatives rather than certification systems. However, due to
interesting result indicating ISO being foundation to embark on Six Sigma from the
first phase of the study, the author decided to include a section on measuring the
impact on organizational performance (1) with and without ISO certification (2) TQM
(Lean) + ISO certification and only TQM initiative. To develop a Six Sigma
implementation framework for SMEs, it was imperative to review the efficacy of any
existing CI frameworks/ models proposed for SMEs
As the aim of the research and key research questions established in Chapter 1
focused on frameworks, CSFs and barriers, quality management practices, impact of
QI on performance of SMEs, the aforementioned keywords were used for searching
literature from secondary sources such as journals, conference proceedings, books,
professional magazines, and some reliable on-line sources. The databases used to
search articles on CI initiatives or certification systems in SMEs with aforementioned
keywords were Emerald, ProQuest, Ingenta, and Science Direct that have access to
thousands of journals and magazines.
3.2. Evolution of Six Sigma
Before the concepts of TQM and Six Sigma were formalised, much work had taken
place over the centuries to reach this stage. The father of scientific management, F.W.
Taylor, introduced simple inspection of finished good in late nineteenth century that
was followed by several successive phases, with the change in concept of quality
during last half-century, from compliance with specifications of a product to the entire
cycle including product design, production, sales, distribution, use, and disposal
(Crosby, 1979; Deming, 1982; Ishikawa, 1985; Feigenbaum, 1991; Payne et al.,
1996).
In the 1920’s statistical theory began to be applied effectively to quality control, and in
1924 Dr. Walter Shewhart made the first sketch of a modern control chart, and
currently it is one of the most widely discussed statistical techniques (Deming, 1986).
In the early 1950’s, quality management practices developed rapidly in Japanese
plants with the help of some notable quality gurus – Juran, Deming and Feigenbaum.

Maneesh Kumar
A lasting and continuous improvement in quality can only be achieved by directing
organizational efforts towards planning and preventing problems occurring
(Dale and Shaw, 1999). This concept leads to the next phase of quality management
development, which was
based system, which improved product and service quality and increased productivity
by placing the emphasis on product, service and process design (Dale and Shaw,
1999). The features acquired when progressing from quality control to quality
assurance were, for example, comprehensive quality assurance procedures to
increase uniformity and co
and use of quality costs (Dale and Shaw, 1999).
On the contrary, the quality revolution in the West was slow to follow, and did not
begin until the early 1980’s, when companies introduced their ow
programmes and initiatives to counter the Japanese success. A modified form of total
quality control was exported to the USA from Japan in the 1970s and later it took the
name of TQM (Feigenbaum, 1991, Ahmed and Hassan, 200
Figure 3.1: Four key stages in the evolution of quality management
The International Organisation for Standardisation (ISO) followed in 1987 with the ISO
9000 series, which became the internationally recognised standard for quality
management systems (Dale and Shaw, 1999). In early 90’s in Europe, a widely
adopted framework called “Business Excellence” or “Excellence” Model, promoted by
the European Foundation for Quality Management (EFQM), and in the UK by the
Chapter 3: Quality initiatives in SMEs
A lasting and continuous improvement in quality can only be achieved by directing
organizational efforts towards planning and preventing problems occurring
(Dale and Shaw, 1999). This concept leads to the next phase of quality management
development, which was quality assurance. Quality Assurance was a prevention
based system, which improved product and service quality and increased productivity
placing the emphasis on product, service and process design (Dale and Shaw,
1999). The features acquired when progressing from quality control to quality
assurance were, for example, comprehensive quality assurance procedures to
increase uniformity and conformity, use of seven quality control tools, and gathering
and use of quality costs (Dale and Shaw, 1999).
On the contrary, the quality revolution in the West was slow to follow, and did not
begin until the early 1980’s, when companies introduced their ow
programmes and initiatives to counter the Japanese success. A modified form of total
quality control was exported to the USA from Japan in the 1970s and later it took the
name of TQM (Feigenbaum, 1991, Ahmed and Hassan, 2003).
Four key stages in the evolution of quality management
(Source: Dale, 2003 pp. 21)
The International Organisation for Standardisation (ISO) followed in 1987 with the ISO
9000 series, which became the internationally recognised standard for quality
gement systems (Dale and Shaw, 1999). In early 90’s in Europe, a widely
adopted framework called “Business Excellence” or “Excellence” Model, promoted by
the European Foundation for Quality Management (EFQM), and in the UK by the
Chapter 3: Quality initiatives in SMEs
54
A lasting and continuous improvement in quality can only be achieved by directing
organizational efforts towards planning and preventing problems occurring at source
(Dale and Shaw, 1999). This concept leads to the next phase of quality management
. Quality Assurance was a prevention-
based system, which improved product and service quality and increased productivity
placing the emphasis on product, service and process design (Dale and Shaw,
1999). The features acquired when progressing from quality control to quality
assurance were, for example, comprehensive quality assurance procedures to
nformity, use of seven quality control tools, and gathering
On the contrary, the quality revolution in the West was slow to follow, and did not
begin until the early 1980’s, when companies introduced their own quality
programmes and initiatives to counter the Japanese success. A modified form of total
quality control was exported to the USA from Japan in the 1970s and later it took the
Four key stages in the evolution of quality management
(Source: Dale, 2003 pp. 21)
The International Organisation for Standardisation (ISO) followed in 1987 with the ISO
9000 series, which became the internationally recognised standard for quality
gement systems (Dale and Shaw, 1999). In early 90’s in Europe, a widely
adopted framework called “Business Excellence” or “Excellence” Model, promoted by
the European Foundation for Quality Management (EFQM), and in the UK by the

Chapter 3: Quality initiatives in SMEs
Maneesh Kumar 55
British Quality Foundation (BQF). Whilst Quality Awards were focus for some users,
the true measure of the EFQM Excellence Model's effectiveness was its use as a
management system and the associated growth in the key management discipline of
organisational self-assessment (Wilkes and Dale, 1998).
Moving into the 21st century, a new management strategy invented by Motorola in mid
1980s called Six Sigma, brought revolution in the industries worldwide and has
become the long term business strategy to achieve competitive advantage and to
excel in operations excellence (Snee and Hoerl, 2003; Hoerl, 2004). Six Sigma is
widely recognized as a methodology that employs statistical and non-statistical tools
and techniques to maximize an organization’s Return on Investment (ROI) through the
elimination of defects in processes.
Six Sigma has evolved significantly since its inception at Motorola, where the focus
was more on defect reduction (termed as Generation I by Harry and Crawford (2005)).
The Generation II Six Sigma, lasted from about 1994 to 2000, focused on cost
reduction and Generation III (which is currently practiced) focuses on value creation
for the enterprises (Harry and Crawford, 2005; Montgomery, 2005). The perception of
Six Sigma has changed drastically from being a statistical tool to being a company-
wide strategy for business process improvement (Antony and Banuelas, 2002; Kuei
and Madu, 2003; Goh, 2002; Zairi, 2002; McAdam et al., 2005; Montgomery, 2005;
Kumar et al., 2008). Organizations have included Six Sigma as a part of their business
strategy and in the strategic review process to become globally competitive, increase
market share, and enhance customer satisfaction (Antony and Banuelas, 2002; Kuei
and Madu, 2003; Goh, 2002; Zairi, 2002; McAdam et al., 2005).
The Six Sigma approach starts with a business strategy and ends with top-down
implementation, having significant impact on profit if successfully deployed (Keller,
2001; Adams et al., 2003). It also emphasizes on customer- centric approach to
problem solving and establishing good bottom-up /top-down communication system.
It takes us away from “intuition based decisions-what we think is wrong, to fact based
decision-what we know is wrong” (Antony and Banuelas, 2002). A number of papers
and books have been published showing the fundamentals of Six Sigma, such as,
what is Six Sigma (Ellis, 2001; Park, 2003); why do we need Six Sigma (Magnusson
et al., 2003; Haikonen et al., 2004); what makes Six Sigma different from other quality
initiatives (Snee and Hoerl, 2003; Snee, 2004; Kumar et al, 2008; Antony, 2009); Six

Chapter 3: Quality initiatives in SMEs
Maneesh Kumar 56
Sigma deployment (Mitra, 2004; Antony, 2004b); critical success factors of Six Sigma
implementation (Antony and Banuelas, 2002; Antony et al., 2005, 2007, 2008; Antony,
2004b, 2006; Kumar, 2007; Henderson and Evans, 2000; Mahanti and Antony, 2009);
Six Sigma project selection (Harry, 1998; Snee, 2000; Snee and Rodebaugh, 2002;
Kumar et al., 2009); organizational infrastructure required for implementing Six Sigma
(Hoerl, 1998; Antony, 2004b); the role of academia and university in promoting the
best-in-class practice of Six Sigma (Harry, 1998; Mitra, 2004; Kumar et al., 2008;
Antony, 2008a).
3.2.1.Definition of Six Sigma
Linderman et al (2003) defined Six Sigma in the following way: “Six Sigma is an
organized and systematic method for strategic process improvement and new product
and service development that relies on statistical methods and the scientific method to
make dramatic reduction in customer defined defect rate”. The definition accentuates
on the customer’s definition of defect and its importance while making a process
improvement or when manufacturing a product. . According to Breyfogle et al. (2001),
“Six Sigma is a team-based approach to problem solving and process improvement”.
Six Sigma’s success has been attributed to embracing it as an improvement strategy
(Antony and Banuelas, 2001; Snee, 2000), philosophy (Slack et al., 2007) and a way
of doing business (Pande and Holpp, 2002; Watson, 2001). General Electric (GE)
CEO Jack Welch described Six Sigma as "the most challenging and potentially
rewarding initiative we have ever undertaken at General Electric" (Breyfogle, 1999).
The aim of Six Sigma is to keep the distance between the process average and the
nearest tolerance limit to at least six standard deviations and thus reduce variability in
products and processes in order to prevent defects (Wiklund and Wiklund, 2002). Six
Sigma aims at achieving 3.4 defects per million opportunities (DPMO) with an
assumption that the process mean shift by as much as 1.5 standard deviation off the
target (Snee and Hoerl, 2003; Linderman et al., 2003). A defect opportunity is a
process failure that is critical to the customer (Breyfogle, 1999; Linderman et al.,
2003). The Six Sigma measure of process capability assumes that the process mean
may shift over the long-term by as much as 1.5σ, despite our best efforts to control it.
Chapter 3: Quality initiatives in SMEs
Maneesh Kumar 57
The process capability indices Cp and Cpk are used as the vehicles to characterize the
produced process quality. Six Sigma is achieved when the product specifications are
at ± 6 σ (where σ is the standard deviation of the process) and when the process
width is half the specification band. The process potential (Cp) for a Six Sigma process
would be 2 (when the process is centered) and actual process performance (Cpk)
would be 1.5 (when there is 1.5σ shift in the process mean). Considerable research
has been reported about understanding and properly interpreting the process
capability indices for stable and unknown trend pattern process (Deleryd, 1998;
Palmer and Tsui, 1999; Bothe, 1997; Gunter, 1991; Caryle et al., 2000).
Six Sigma is not just about statistics. The Six Sigma drive for defect reduction,
process improvement and customer satisfaction are based on the "statistical thinking"
paradigm, a philosophy of action and learning based on process, variation and data.
Statistical thinking provides practitioners with the means to view processes holistically.
There is a logical thought progression from process-variation-data to Define-Measure-
Analyse-Improve-Control (DMAIC) (Hare, 2005). This is contrasted with statistical
methods and theories which are primarily about variation and data and the aggregate
of statistical methods themselves (Snee, 2004; Hare, 2005).
3.2.2. Characteristics of Six Sigma
The attributes of Six Sigma that makes the quality proponents ponder its efficacy over
other quality improvement initiatives or programs, were listed below (Antony and
Banuelas, 2002; Goh,2002; Kwak and Anbari, 2004; Lee-Mortimer, 2006; Kumar et
al., 2008; Naslund, 2008):
� Framework: Existence of a framework (DMAIC) where techniques like Quality
Function Deployment (QFD), Failure Mode and Effect Analysis (FMEA), Design
of Experiment (DoE), and Statistical Process Control (SPC) are integrated into a
logical flow.
� Approach: Top-down approach starting from CEO and involving cross-functional
team from quality, sales, marketing, production, and human resource
department.

Chapter 3: Quality initiatives in SMEs
Maneesh Kumar 58
� Application: While the original goal of Six Sigma was to focus on manufacturing
operations, today marketing, purchasing, billing, invoicing, banking and
healthcare functions have also embarked on Six Sigma with the aim of
continuously reducing defects or errors and work towards perfection and thereby
achieving business excellence.
� Focus: Six Sigma applications are customer-centric, listening to the voice of
customers (VOC) and measuring it in terms of critical to quality characteristics
(CTQs) i.e. mapping the VOC into product/ service characteristics.
� Organization: In organizational terms- Six Sigma accentuates on project-by-
project feature of its implementation. Six Sigma focuses on project management
skills, project selection criteria, and project review involving the cross-functional
team.
� Result: The outcomes of Six Sigma projects are measured in financial terms that
is tangible measure of achievement which most people in the organization
understand- not just project members.
� Personnel: Six Sigma emphasizes on training, education, and certification
processes that result in Black Belts, Green Belts, and Yellow belts before
embarking on any project. Belt system (Black, Green, and Yellow) is a unique
feature of Six Sigma, creating an infrastructure to assure that performance
improvement activities have the necessary resources. They are the change
agents that act as a catalyst in institutionalizing cultural change in
organization(Pande et al., 2000; Antony et al., 2007; Kumar et al., 2008)
3.2.3. Six Sigma Problem Solving Methodology
A healthy portion of Six Sigma training involves learning the principles behind the
methodology that takes the form of projects conducted in phases generally recognized
as Define–Measure–Analyze–Improve–Control (DMAIC). The DMAIC methodology is
applied for improving the existing processes (Snee, 2004). It is not just the DMAIC
methodology which makes the application of Six Sigma successful in organizations;
rather it is the collection of tools and techniques which are integrated into DMAIC in a
sequential and rigorous manner makes the Six Sigma application successful.

Chapter 3: Quality initiatives in SMEs
Maneesh Kumar 59
Moreover, DMAIC creates a sense of urgency by emphasizing rapid project
completion in 3 to 6 months. The five step Six Sigma methodology (DMAIC) was
depicted in figure 3.2.
Figure 3.2: The five step methodology of Six Sigma (Source: Kumar, 2005)
� Define Phase: involves identifying a project’s CTQs characteristic driven by the
VOC followed by developing team charter and finally defining a high level
process map connecting the customer to the process and identifying the key
inputs and requirements.
� Measure Phase: The goal of this phase is to gather information about the
current situation, to obtain baseline data on current process performance, and
to identify problem areas.
� Analyze Phase: mainly consists of three steps: establishing process capability
with the help of capability indices, defining performance objectives by the team
benchmarking and identifying the sources of variation by performing analysis of
DEFINE
IMPROVE
ANALYZE
MEASURE
CONTROL
DEFINE
• Identify Project CTQs
• Develop Team charter
• Define process map MEASURE
• Select CTQ Characteristics
• Define Performance Standards
• Measurement System Analysis
ANALYZE
• Establish process capability
• Define performance objectives
• Identify variation sources
IMPROVE
• Screen potential causes
• Discover variable relationships
• Establish operating tolerances
CONTROL
• Sustain Result/benefits
• Share the Lessons Learnt

Chapter 3: Quality initiatives in SMEs
Maneesh Kumar 60
variance and hypothesis testing. Based on the above information, root causes
of defects and their impact on the business/ process can be identified.
� Improve: The goal of the Improve phase is to implement solutions that address
the problems (root causes) identified during the previous (Analyze) phase.
� Control: The goal of the Control phase is to put in place ongoing measures to
monitor both the process output and the factors that influence output variation,
thus ensuring that results achieved in the previous phase is sustained.
3.2.4. Six Sigma versus TQM
It is often said by engineers and managers in small and big companies that there is
nothing really new in Six Sigma compared to other quality initiatives witnessed in the
past (Antony, 2004a). Companies that have embraced Six Sigma within their working
culture previously made improvements through the use of TQM or Crosby’s Zero
Defects or Quality Circles (Walters, 2005). However, these programs obviously did not
address all of their needs. Otherwise these same organisations would not be spending
additional time and money to implement Six Sigma. The CEO of 3M, Chris Galvin,
believed that Six Sigma had changed their way of doing business: “Six Sigma is not a
program or an initiative. It is our game plan. It will challenge all of us, as a company
and in collaboration with our customers, to be the very best. Motorola was open to
sharing the risk, which allowed us to develop an outstanding partnership” (McShea et
al., 2004).
In the last few decades, there existed many programs that have purported to be the
answer to industry’s process management problems. These include zero defects,
management by objectives, quality circles, TQM and Business Process Reengineering
(BPR) (Marsh, 2000). While these initiatives enjoyed some success, in the long run
most of them were considered as a passing fad by the management and staff of
different corporations. Despite the remarkable growth of attention in quality
management system during the last two decades, the literature revealed that total
quality remains an ambiguous concept, the most important and yet least understood
subject for managers (Seddon, 1998; Hansen and Bash, 1999).

Maneesh Kumar
Deming, one of the quality Gurus of the 20
terminologically vague, stating
of TQM, you can call it, is tha
used the term, as it carries no meaning”
documented evidence of successful deployment of TQM in large and small
businesses. It was asserted that TQM was als
than it was in the early
shows the drop in publication of TQM literature in the last decade (indicating it is
waning and becoming less
large number of studies (Anjard 1998; Hansson and Klefsjo 2003; Pande
Moser and Bailey 1997; Hellsten and Klefsjo 2000) have shown that 60% to 80% of
TQM initiatives fail, or fail to show significant im
Figure 3.3:
There are three aspects of the Six Sigma strategy that are not emphasised in TQM
(Snee, 2004; Kumar
therefore places a clear focus on bottom
No Six Sigma project will be approved unless the team determines the savings
generated from it. Secondly, Six Sigma DMAIC methodology
tools and techniques in a disciplined and sequential manner (Antony, 2008a). Finally,
Six Sigma creates a powerful infrastructure for training of Champions, Master Black
Belts, Black Belts, Green Belts and Yellow Belts (
Chapter 3: Quality initiatives in SMEs
Deming, one of the quality Gurus of the 20th century, argued that TQM is
terminologically vague, stating “the trouble with total quality management, the failure
of TQM, you can call it, is that there is no such thing. It is a buzzword. I have never
used the term, as it carries no meaning” (Deming, 1994). There is still very little
documented evidence of successful deployment of TQM in large and small
It was asserted that TQM was also less visible in many businesses now
than it was in the early -1990s (Pande et al., 2000; Naslund, 2008). Figure 3.3 clearly
shows the drop in publication of TQM literature in the last decade (indicating it is
waning and becoming less-visible) and growing publication of Six Sigma literature. A
large number of studies (Anjard 1998; Hansson and Klefsjo 2003; Pande
Moser and Bailey 1997; Hellsten and Klefsjo 2000) have shown that 60% to 80% of
TQM initiatives fail, or fail to show significant impact on business performance.
Comparison of popularity of Six Sigma and TQM (Source: Naslund, 2008)
There are three aspects of the Six Sigma strategy that are not emphasised in TQM
(Snee, 2004; Kumar et al., 2008). First of all, Six Sigma
therefore places a clear focus on bottom-line business impact in hard dollar savings.
No Six Sigma project will be approved unless the team determines the savings
generated from it. Secondly, Six Sigma DMAIC methodology links
tools and techniques in a disciplined and sequential manner (Antony, 2008a). Finally,
Six Sigma creates a powerful infrastructure for training of Champions, Master Black
Belts, Black Belts, Green Belts and Yellow Belts (Snee 2004; Antony
Chapter 3: Quality initiatives in SMEs
61
century, argued that TQM is
“the trouble with total quality management, the failure
t there is no such thing. It is a buzzword. I have never
There is still very little
documented evidence of successful deployment of TQM in large and small
o less visible in many businesses now
, 2000; Naslund, 2008). Figure 3.3 clearly
shows the drop in publication of TQM literature in the last decade (indicating it is
g publication of Six Sigma literature. A
large number of studies (Anjard 1998; Hansson and Klefsjo 2003; Pande et al. 2000;
Moser and Bailey 1997; Hellsten and Klefsjo 2000) have shown that 60% to 80% of
pact on business performance.
Comparison of popularity of Six Sigma and TQM (Source: Naslund, 2008)
There are three aspects of the Six Sigma strategy that are not emphasised in TQM
., 2008). First of all, Six Sigma is result-oriented and
line business impact in hard dollar savings.
No Six Sigma project will be approved unless the team determines the savings
links the problem solving
tools and techniques in a disciplined and sequential manner (Antony, 2008a). Finally,
Six Sigma creates a powerful infrastructure for training of Champions, Master Black
Snee 2004; Antony et al., 2005;

Chapter 3: Quality initiatives in SMEs
Maneesh Kumar 62
Pande et al., 2000; Harry and Schroeder, 1999; Adams et al., 2003; Schroeder et al.,
2008). The belt system helps organizations not only to control process improvement
activities, but also at the same time creates a context that enables problem exploration
between disparate organizational members (Schroeder et al., 2008). As compared to
other quality initiatives, the cultural change in Six Sigma organisation is facilitated by
key players known as Champions and Black Belts, who act as agents to facilitate the
change. These change agents harness the power of knowledge to achieve enhanced
performance, customer satisfaction and profitability, which is what Six Sigma is all
about (Pyzdek, 2003; Brue, 2002). Companies that have deployed Six Sigma have
achieved outstanding financial results and developed disciplined, pragmatic plan and
approach for improved financial performance and growth.
3.2.5. Six Sigma versus Lean Manufacturing
Lean Manufacturing was another quality initiative proposed by Americans in response
to compete with Japanese manufacturers and its superior manufacturing techniques
(following the concept of Toyota Production System (TPS) to resolve quality problems
in their organization) as their import became serious concern to western producers
(Womack and Jones, 1994; Hines et al., 2004; Holweg, 2007). Similar to the concept
of TPS, which focuses on waste reduction through quality control, quality assurance
and respect for people (Ohno, 1988; Monden, 1983), the basic principle of Lean
Manufacturing was to reduce cost and enhance the speed of organization by
minimizing seven types of waste (overproduction, motion, transportation, inventory,
extra processing, waiting, and defect) through everyone involvement and continuous
improvement by employing practices such as Just-in-Time (JIT), cellular
manufacturing, Total Productive Maintenance (TPM), Kanban, Mistake Proofing, to
name a few (Womack et al., 1990; Bicheno, 2000; Hines et al., 2004; Kumar et al.,
2006; Shah, 2003,2007; Holweg, 2007; Slack et al., 2007).
Lean is considered to be one of the most influential initiative in manufacturing
(Womack and Jones, 1996; Fullerton et al., 2003; Shah and Ward, 2003) and its
application is expanding to service industry, particularly healthcare (Vanden Heuvel et
al., 2006; Kolberg et al., 2007), and public sector (Furterer and Elshennawy, 2005;
Sua´rez-Barraza and Ramis-Pujol ,2009). The application of Lean principles have

Chapter 3: Quality initiatives in SMEs
Maneesh Kumar 63
resulted in reduction of wastes, that drove practices such as inventory reduction,
process simplification, and identification of non-value added activities and thereby cost
reductions and customer satisfaction in many organizations (Hines et al., 2004; Shah
and Ward, 2003; Holweg and Pil, 2004; Hopp and Spearman, 2004; Browning and
Heath, 2009). As stated by Browning and Heath (2009) - “the implementation of lean
principles and practices will reduce waste ..... add to production costs, implementing
lean will therefore reduce production costs”.
Six Sigma and Lean Manufacturing are the two most popular and successful programs
espoused by the industries over the last few decades. Many companies such as
Toyota, Danaher Corporation, General Electric, Motorola and many others have
achieved impressive results by implementing either a Lean or Six Sigma
methodologies in their organisation (Antony et al., 2003; Kumar et al., 2006; Arnheiter
and Maleyeff, 2005; Bendell, 2006). Proper implementation of the two methodologies
had proven to achieve dramatic results in terms of cost, quality, and delivery by
focussing on process performance. The effective implementation of each methodology
involves top management commitment, cultural change in organisations, good
communication down the hierarchy, new approaches to production and to servicing
customers and a higher degree of training and education of employees.
However, there are some fundamental differences between the two methods that were
presented in table 3.1. It may be inferred from table 3.1 that there are some limitations
in both the approaches. Whereas, Six Sigma is closely associated with defects and
quality, Lean is linked to speed, efficiency, and waste. Lean provides tools to reduce
lead –time of any process and eliminate non-value added cost (Liker, 1998, Askin and
Goldberg 2001, Bicheno 2000). Six Sigma does not contain any tools to control lead
time (e.g. Pull System) or tools specific to the reduction of lead time (e.g. set up
reduction).
Table 3.1: Differences between Six Sigma and Lean manufacturing
Issues/ Problems/ Objectives Six Sigma Lean Mfg.
Focus on customer value stream No Yes
Focus on creating a visual workshop No Yes
Creates Standard work sheets No Yes

Chapter 3: Quality initiatives in SMEs
Maneesh Kumar 64
Attacks work-in-process inventory No Yes
Focuses on good house keeping No Yes
Process control planning and monitoring Yes No
Focuses on reducing variation and achieve uniform process outputs
Yes No
Focuses heavily on the application of statistical tools and techniques
Yes No
Employs a structured, rigorous and well planned problem solving methodology
Yes No
Attacks waste due to waiting, over processing, motion, over production, etc.
No Yes
(Adapted from Antony et al, 2003)
3.2.6. Common myths of Six Sigma
With more than two decades of successful implementation of Six Sigma
methodologies at major corporations, the success and benefits possible with Six
Sigma are well documented. Although Six Sigma initiatives have grown in popularity
due to its highly publicized reports of success, the strategy is not the panacea that
some insist, i.e. Six Sigma still has its limitations. News keeps cropping up about the
efficacy of the Six Sigma business strategy from its critics, as a management fad- a
fashion that sweeps the world with great excitement for a brief period of time, usually
less than a year, and then disappears (Swinney, 2005).
There is a pervasive perplexity and misinterpretation of what “Six Sigma” is about. Is
“Six Sigma initiative” just an old wine in a new bottle, or has it one or more important
learning points, which should be remembered and practiced (Dahlgaard and
Dahlgaard, 2006). Is Six Sigma dead, or at least waning in popularity? Is it just a ‘fad’,
which can be ignored like most other fads or should companies begin to understand
the common realities of Six Sigma? When Six Sigma was introduced to many
organisations, the initial reactions varied from a lot of enthusiasm to an absolute
scepticism, with the latter mood reflected in comments such as (Kumar et al, 2008):
1. Six Sigma is the flavour of the month

Chapter 3: Quality initiatives in SMEs
Maneesh Kumar 65
2. Six Sigma is all about Statistics
3. Six Sigma is only for manufacturing companies
4. Six Sigma works only in large organisations
5. Six Sigma is same as Total Quality Management (TQM)
6. Six Sigma requires strong infrastructure and massive training
7. Six Sigma is not cost-effective
For detailed information on the demystification of seven myths of Six Sigma, please
refer to author’s published work on ‘Common Myths of Six Sigma Demystified’ in
International Journal of Quality and Reliability Management (Kumar et al., 2008). The
article also includes discussion on sustainability issues of Six Sigma and agenda for
future research in this area. It is not possible to include the entire findings from the
study in the thesis due to word-limit constraint and moreover the focus of this research
is more on Six Sigma implementation in SMEs. The author in this research addresses
myth 4 by conducting exploratory research in the UK manufacturing SMEs.
3.2.7. Benefits from Six Sigma
The reason of Six Sigma’s popularity in the business world is because many
corporations have seen how Six Sigma generated substantial return on investment in
its implementation (Szeto and Tsang, 2005). Six Sigma has been on an incredible run
for nearly two decades, producing significant savings to the bottom-line of many large
organizations such as GE, Motorola, Honeywell, Bombardier, Boeing, Caterpillar,
Kodak, Lockheed Martin ,Sony, Texas Instrument to name a few from the long list and
resulted in millions of dollars of bottom-line savings (Henderson and Evans, 2000;
Antony, 2006; Antony et al., 2005, 2007; Kumar et al., 2006, 2008; Gutierrez et al.,
2009; Antony and Desai, 2009). It was reported that the savings achieved by Motorola
reached $1 billion in 1998 and $16 billion in 2005 (Ingle and Roe, 2002; Brett and
Queen, 2005). Dow Chemicals, which implemented Six Sigma on a corporate-wide
basis in 2000, achieved its target of $1.5 billion in cumulative EBIT (earnings before
interest and taxes) gains by the end of 2002 (Motwani et al., 2004). Volvo Cars in
Sweden have generated over 55 million euro to the bottom line from Six Sigma
programme (Magnusson et al., 2003).

Chapter 3: Quality initiatives in SMEs
Maneesh Kumar 66
Six Sigma application in service industry had grown significantly in last 6-7 years with
companies started realising benefits from its implementation in banking and financial
services, healthcare, accounting, customer services, public utilities, and even
government and non-profit organizations (Bisgaard et al., 2002; Antony, 2004b, 2006,
Antony et al, 2007; Chakrabarty and Tan, 2007; Kumar et al., 2008; Chakrabarty and
Chuan, 2009). GE Capital, the financial division of GE, was one of the first financial
institutions applying this methodology in order to increase their profitability and
customer satisfaction (Antony, 2006). After this, various financial institutions and
banks have followed such as Bank of America, Citicorp, American Express, UBS,
Lloyds TSB, HSBC, Zurich Financial, and Bank One (George, 2003). The first health-
care organization to implement Six Sigma fully into its culture was Commonwealth
Health Corp. (CHC) in partnership with General Electric (Thomerson, 2001). CHC has
realized improvements in excess of $1.2 million, improved radiology throughput by 33
per cent and decreased cost per radiology procedure by 21.5 per cent (Thomerson,
2001). Following CHC, many health-care organizations embraced the Six Sigma
challenge within their processes, examples include Mount Carmel Medical Centre
(Columbus Ohio), Charleston Area Medical Centre (WV), Palomar Pomerado Health
(San Diego, California), the University of Michigan Medical Center, and Wellmark Blue
Cross Blue Shield (CA), to name a few (Sehwail, 2003). Six Sigma continues as the
best known approach to process improvement (Snee and Hoerl 2003). It is worth
noting that Six-Sigma has a lot of air left in its sails and continues to build momentum
with no signs of letting up in the near future (Hoerl, 2004; Snee, 2004).
3.2.8. Critique of Six Sigma and Agenda for Future Research
Six Sigma, a systematic framework for quality improvement and business excellence,
has been widely publicized in recent years as the most effective means to combat
quality problems and win customer satisfaction (Goh, 2002). However, some
researchers have argued that the focus of Six Sigma has been too narrow, the
research not being well developed, and too much research has been focused on
descriptions of practice rather than on theory development that is of use to managers
and scholars (Linderman et al., 2003; Schroeder et al., 2008).

Chapter 3: Quality initiatives in SMEs
Maneesh Kumar 67
Though Six Sigma had been applied successfully in the service and voluntary sector,
still there is dearth of knowledge on the application of tools and techniques packaged
within DMAIC methodology tailored to the needs of those sectors. The linkage
between Six Sigma and organizational learning is very incoherent and requires more
justification. The type of leadership required for successful implementation of Six
Sigma is among the least explored topic in Six Sigma research that requires
considerable attention for the long-term sustainability of initiative.
The 1.5σ shift assumption was based on findings from the manufacturing industry, in
particular from Motorola and is not applicable for all type of business processes. More
research should be conducted to investigate this assumption for each type of industry
or sector (Antony, 2004a; Banuelas and Antony, 2004). The relationship between cost
of quality and the annual sales turnover of the company, proposed by Mikel Harry (as
cited in Pande et al (2000)) should be revisited. As stated by Mikel Harry, company
operating at 3σ quality level will lose 25-40% of sales turnover because of cost of poor
quality (COPQ). Again this figure was derived by research based on his initial
research in Motorola, GE and other large manufacturing firm in USA. The same
assumption is not applicable for service industry or for small businesses.
There is a paucity of literature on Six Sigma Project Selection, a topic that goes
unnoticed in most organisations, and different techniques or methodologies that can
be used for project selection, e.g. Analytical Hierarchy Process (AHP), Pugh Matrix,
Failure Mode and Effect Analysis (FMEA), Project Prioritization Matrix, Fuzzy Logic,
etc. The results from the informal poll conducted by Pande et al (2000) identified
project selection as the most critical and most commonly mishandled activity in
launching Six Sigma. This is another area which needs an immediate focus for
continued development of Six Sigma.
To prevent Six Sigma from becoming commercial tools in the pockets of few
consultants, it is imperative to develop a Six Sigma body of knowledge forum that can
define the guidelines and standardise the procedures in the certification process of
Black Belts and Green Belts. Currently, many consulting companies are offering Six
Sigma Black Belt certification without any stringent requirement of conducting a Black
Belt projects. There is a huge variation in the number of days of training for a typical
Black Belt program (normally 20 days or 4 weeks of training is required to be a Black
Belt). Consultants are offering 5-10 days of training (e.g. www.hutchins.co.uk,

Chapter 3: Quality initiatives in SMEs
Maneesh Kumar 68
www.siliconbeachtraining.co.uk, www.expertrating.com, to name a few), using a
cutting corner approach, to train a Black Belt. Six Sigma requires some heavy initial
investment to train Black Belts for executing projects. This limits SMEs from
embarking on Six Sigma journey due to resource constraints problem. Situation would
be worse in SME if a Black Belt leaves the job after becoming certified. It is thus
imperative to develop a organizational infrastructure for SMEs customized to the
needs of SMEs. The need of Black Belt in a SME environment requires further
investigation.
Six Sigma had gained momentum in the industry due to its practical approach to
problem solving and alignment to financial savings (Schroeder et al., 2008). However
from theoretical perspective, very limited research had focused on developing the
underlying theory or definition of Six Sigma and measuring its impact on quality
management theory and application (Schroeder et al., 2008; Linderman et al., 2003,
2006). Linderman et al (2003, 2006) were among the very few researchers to raise the
issues of theoretical gap in Six Sigma research and proposed a goal-theoretic
approach for strategic Six Sigma. This leads to criticism that Six Sigma is repacking of
the traditional quality management practices (Zu et al, 2008).
Here, academia can play a critical role in bridging the gap existing between the theory
and practice of Six Sigma (Linderman et al., 2003; Antony, 2004a; Mitra, 2004; Zu et
al, 2008; Schroeder et al., 2008; Kumar et al., 2008; Antony, 2008a). It has been
observed that very few universities in UK and rest of Europe are engaged in teaching
and research on Six Sigma (Antony, 2004; Antony, 2008a). This needs to be changed
in the future so that collaborative Six Sigma projects between the academic and
industrial world must be established in both engineering and business schools. Six
Sigma has made a huge impact on the industrial world, but its impact on the academic
community is limited. It will therefore be incumbent on academic fraternity to carry out
well- grounded research to explain the phenomena of Six Sigma. The academic world
has indeed a crucial role to play to bridge the gap between the theory and practice of
Six Sigma and to improve the existing methodology of Six Sigma (Antony, 2008a).
The role of Six Sigma in promoting the concept of statistical thinking for both
engineers and business leaders is imperative, which is lacking at the moment (Hare,
2005). Statistical thinking – consisting of core principles such as process, variation
and data – may be used to create a culture that should be deeply embedded in every

Chapter 3: Quality initiatives in SMEs
Maneesh Kumar 69
employee within any organisation embarking on Six Sigma. A brief overview on
agenda for future research in Six Sigma is presented in figure 3.4.
Figure 3.4: Agenda for future research in Six Sigma
Due to scant literature on Six Sigma in SMEs, author decided to explore articles
published on implementation of continuous improvement initiatives like TQM, and
Lean or certification system like ISO 9000 in SME environment. The author had
followed the work of Ghobadian and Gallear (1996, 1997) and Yusof and Aspinwall
(1999, 2000 a, b, c) throughout the doctoral research as they were among the few
authors that conducted longitudinal study in the late 1990s on TQM implementation in
the UK SMEs (similar to author’s research topic on Six Sigma implementation in the
UK SMEs). Extensive review of key articles facilitated in better understanding of
quality management practices in SMEs and identified frameworks and models of CI
proposed for and used by SMEs. Firstly, the scant literature on Six Sigma application
in SMEs was reviewed followed by reviewing literature on quality management
practices in SMEs based on implementation of TQM, Lean or ISO 9000 in SMEs.
Agenda
for future
research
Role of leadership
Six Sigma theory
1.5σ shift assumption
Six Sigma & Statistical thinking
Standardi-zation of Six
Sigma training
Integration with other initiatives
SS org. infrastruct-
ure for SMEs
Six Sigma project
selection
COPQ & annual sales
turnover relation

Chapter 3: Quality initiatives in SMEs
Maneesh Kumar 70
3.3. Six Sigma in SMEs- A review of Literature
The literature depicts that Six Sigma has been implemented with success in many
large corporations, but there is still less documented evidence of its implementation in
smaller organisations. This section reviews few articles published on Six Sigma
application in SMEs and gauge whether it has been introduced as a strategic change
initiative in SMEs or used as an operational methodology for improving process
efficiency.
Wessel and Burcher (2004) in their study identified the specific requirements for
implementation of Six Sigma in German SMEs. This study also examined how Six
Sigma needs modification to be applicable and valuable in a SME environment. This
was the first survey study of its kind to be carried out on Six Sigma in SMEs. The
study identified the lack of quality management system in majority of SMEs and only
15% of the firms were aware of Six Sigma initiative. The findings suggested to
emphasise on the following key issues- quantification of financial savings from every
single project; tracking of benefits realised from core projects over a period of time say
12 months; customized Six Sigma training program including full day awareness
training for all employees; cultural change plan designed in advance and process
management principles to be incorporated in Six Sigma program; and role of
consultants in providing training and modular services to SMEs.
Another cross-sectional study was conducted by Antony et al (2005, 2008) to assess
the current status of Six Sigma implementation in the UK SMEs. The results of the
study showed that many SMEs were not aware of Six Sigma or had the resources to
implement Six Sigma projects. Management involvement and participation, linking Six
Sigma to customers and linking Six Sigma to business strategy were the most critical
factors cited for the successful deployment of Six Sigma in SMEs. This paper had
surveyed the use of Six Sigma in SMEs and showed that those who adopt it have
reaped benefit both at strategic and operational level. If these benefits were to
increase, there needs to be greater dissemination of its benefits and the creation of
user groups that support SMEs in sharing and exchanging experiences of successful
deployment of Six Sigma, thus promoting the best-in-class practice within the user
group.
Chapter 3: Quality initiatives in SMEs
Maneesh Kumar 71
A pilot case study was conducted by author during his Master program on Six Sigma
implementation in a local SME using a case study based approach (Kumar, 2007).
Questionnaire was designed and adapted from Antony et al (2005) study and
distributed to employees working in the firm. The CSFs study showed that
management involvement and commitment was the most important factor in
successful deployment of Six Sigma. Survey result depicted that the lack of resources
and poor training/coaching are the two most important impeding factors in the
successful deployment of Six Sigma. The information gathered from the interview
showed that lack of commitment from the middle managers towards Six Sigma
program was considered as the main pitfall in the implementation process. Employees
need to be empowered to use the quality tools/techniques in their job and provided
with requisite training to apply the knowledge in the right way.
Many SMEs implemented Six Sigma at an operational level and used it as a
methodology to resolve complex problems on the shop-floor (Silen, 2000; Darshak
and Desai, 2004; Desai, 2006; Thomas and Barton, 2006; Gupta and Schultz, 2005).
Silen (2000) illustrated through a deployment of DMAIC model in a Finnish company,
the real benefits of implementing Six Sigma. The significance of the voice of the
customer and the commitment of top management as well as many other key-points
were introduced to activate and help the deployment of Six Sigma in the company. A
case study presented by Gupta and Schultz (2005) showed the benefits that an SME
can gain through successful implementation of Six Sigma. The company located in
US, achieved 30% improvement in on-time deliveries; 25% improvement in labour
efficiencies; and 5 % improvement in profits per year by successfully deploying Six
Sigma.
Darshak and Desai (2004) and Desai (2006) discussed the real life case where Six
Sigma was successfully applied at a small scale firm in India to improve one of the
core processes. The company was struggling with the increasing failures to meet
customer delivery dates. The implementation of DMAIC methodology resulted in
understanding the problem from all facets and laying out improvement through
effective analysis of the roots of the problem. A case study on Six Sigma
implementation in the UK manufacturing SME revealed the cost-effective way of
eliminating the critical-to-quality issue (Thomas and Barton, 2006). Researchers
identified the approach employed, tools and techniques used, improvement achieved

Chapter 3: Quality initiatives in SMEs
Maneesh Kumar 72
in terms of cost and quality and thus the savings generated from Six Sigma
implementation. An experimental design study was undertaken in order to identify the
optimum parameter settings for the concerned process. The application of the Six
Sigma approach achieved savings in excess of £60,000 for an initial outlay of less
than £5000 in experimental and project costs.
In all the aforementioned case studies, Six Sigma was applied only for resolving some
complex problems and was not introduced at a company-wide level. The real benefit
may be realised by SMEs if it was incrementally implemented across the business
areas. Other scant literature available on Six Sigma in SMEs was rather conceptual or
viewpoint article and lacked demonstration of research rigour through conducting
empirical / longitudinal research on the topic. Researchers and practitioners have
provided their viewpoints, based on their experience, on critical success factors of Six
Sigma or proposed a model/ framework/ step-by-step approach for implementing Six
Sigma in SMEs. A summary of their key findings were presented below.
Strong leadership and senior management commitment was identified as critical to the
success of Six Sigma program in SMEs (Antony et al, 2005, 2008; Kumar, 2007;
Tennant, 2001; Adams et al., 2003; Waxer, 2004; Spanyi and Wurtzel, 2003). In small
companies, the top management team need to be visibly supportive of every aspect of
Six Sigma initiative and they must demonstrate by their active participation,
involvement and by their actions that such support was more than lip service. Other
critical success factors proposed were customer focus, communication, cultural
change, education and training, reward and recognition, shared understanding of core
business processes, resource commitment, understanding of Six Sigma methodology;
and project prioritization and selection (Antony et al., 2005, 2008; Kumar, 2007;
Spanyi and Wurtzel, 2003; Waxer, 2004)
Resource constraint was identified as an important issue by researcher to implement
Six Sigma in a SME environment (Antony et al., 2005, 2008; Kumar, 2007; Waxer,
2004). Several alternatives were proposed to tackle the issue of resource constraints
such as use of incremental approach to implement Six Sigma in core business
processes (Kullmann, 2002) and limiting the training to Green Belt level (Gnibus and
Krull, 2003); Black Belt not required in SME environment (Rowlands, 2004)- training
more employees at Yellow Belt level to implement Six Sigma at a less cost and more
manageable pace approach (Davis, 2003); Harry and Crawford (2004) proposed a
Chapter 3: Quality initiatives in SMEs
Maneesh Kumar 73
new White Belt system to achieve quicker return on investment from Six Sigma- a
white belt will execute 12 projects in a year with potential savings of $12000 expected
from each project; and use of Porter’s value chain and five forces model along with Six
Sigma to provide strategic alignment, identifying training needs as well as prioritising
Six Sigma projects for execution (Rowlands, 2004).
Although there are “start-up” costs to the deployment including training, leadership
alignment and customer focus, a properly designed and deployed Six Sigma program
should provide ample cost benefits rather quickly, even for smaller companies (Keller,
2003; Wilson, 2004). Keller argues that Six Sigma offers many SMEs the same
benefits as larger companies: an improved bottom line. As many SMEs operate their
business processes at the ‘2 to 3 sigma quality level’, an improvement of even 1
sigma represents a huge step in improving customer satisfaction and reducing costs
(Spanyi and Wurtzel, 2003). For instance, if a customer order fulfilment process is
operating at 3 sigma quality level (i.e., 66, 800 defects per million opportunities) and if
we improve the sigma quality level to 4 sigma quality level (i.e., 6210 defects per
million opportunities), then this process would realise a 10-fold improvement in
performance. Assume each error or mistake cost $5 to fix (on average), the resulting
cost savings would be in the range of $300,000 (Kumar, 2007).
Researchers also proposed frameworks and models to facilitate Six Sigma
implementation in SMEs. All the models were based on the experience of researcher
and lacked theoretical underpinning while designing the model. None of the models
proposed below took into account the resource constraints factor and suggestion on
how to implement Six Sigma. The practical application of models / frameworks in
SME environment was not reported or published in the literature.
Schwinn (2003) proposed a new approach named Six Sigma Simplified (S3) tailored
for small organisation for an entry into the world of Six Sigma. The S3 approach
focuses on the following:
� Recognizes the need to be clear about values and assumptions.
� Recognizes that a Six Sigma approach is not always the best approach
� Starting small and minimizing the initial investment make sense
� Explicitly recognizes that a Six Sigma effort can focus on the revenue side of
the organization, as well as the cost side.
Chapter 3: Quality initiatives in SMEs
Maneesh Kumar 74
� Explicitly recognizes that any kind or size of organization or community can
benefit from Six Sigma.
Process Quality Associates (PQA), a Six Sigma and Quality Engineering training and
consulting service provider proposed a practical framework for implementation of Six
Sigma in SMEs (Process Quality Associates, 2005). To make the framework more
applicable and suitable for SMEs, the company had developed a set of CSFs, which
have been integrated into each phase of the Six Sigma methodology. Burton (2004)
proposed alternative Six Sigma deployment model that allowed SMEs to implement
Six Sigma at a pace where they can digest the methodology and achieve benefits,
without significant resource commitment and overhead structure of the traditional Six
Sigma. As a result, SMEs are sometimes able to achieve faster and more impressive
benefits than their large customers. He also recommended an 8-step methodology for
successful deployment of Six Sigma within SMEs.
3.4. Quality Management Practices in SMEs
The last fifteen years have witnessed increased focus on CI implementation in SMEs
due to their increased contribution to national economy. Many success stories of
TQM implementation in large organizations have been published in journals,
magazines, and conferences with little focus on smaller firms leading to conclusions
that TQM and the benefit it has to offer is applicable only for large businesses (Goh
and Ridgway, 1994; Shea and Gobeli, 1995). Investigating the impact of size of the
organization on TQM practices and performance, it was reported that larger firms
derive greater benefits from TQM implementation than SMEs (Fisher, 1993; Powell,
1995; Terziovski and Samson, 2000; Garvin, 1988). The reasons for the same were
attributed to long-term resource commitment and mature appreciation of TQM
philosophy by senior managers in large firms (Fisher, 1993; Terziovski and Samson,
2000). Managers in SMEs expected immediate benefits from TQM and also struggled
to allocate resources to facilitate implementation process.
In order to discover how organisation perception about TQM had changed between
1992 and1994, Witcher (1994) in collaboration with Scottish Enterprise and Scottish
Quality Network conducted a survey in Scottish companies that included both large
organisations and SMEs. A substantial slice of Scotland’s commercial life was

Chapter 3: Quality initiatives in SMEs
Maneesh Kumar 75
covered. The result of the study showed that TQM is most established in
manufacturing and large organisations. It is least established in the public sector,
services and SMEs. The main difficulties in implementing TQM were found to be
entrenched attitudes, keeping TQM going, a lack of understanding, poor resources
and leadership commitment.
Parkin and Parkin (1996) study indicated high awareness and adoption of TQM within
British SMEs as compared to UK based Japanese-owned firms. Most of the SMEs
struggled to have established formal procedures and systems such as BS5750 in
place. The biggest challenge faced by SMEs to implement TQM lies in the translation
of management strategies into employee action. Conducting case studies in 10 SMEs
on their experience of implementing TQM, Shea and Gobeli (1995) highlighted the
reasons as why SMEs embarked on TQM journey- to expand the business growth and
for marketing purpose; consistent with management style supporting QM; changing
customer expectations; employees focus; and improving poor performance of the
company. Employees were proactive in the TQM firms to prevent the errors from
occurring rather than taking action after the errors were detected.
Davig et al. (2003) conducted a survey of small manufacturing companies in
Kentucky, USA and the results of the study showed that firms were slow to embrace
the philosophy and practice of TQM. The main reason for this reluctance by smaller
firms seemed to be a lack of understanding of TQM by top management. Even the
firms implementing new quality programs in this study felt they were costly
endeavours. They simply did not believe in the concept of “quality is free”.
Anderson and Sohal (1999) investigated into TQM practices of Australian SMEs using
Australian Quality Awards (AQA) criteria and measured its impact on firms
performance. Leadership, strong customer focus, quality system, and good
information management had greatest influence on performance of the company. The
emphasis on data collection and measurement and its importance to meet customer
expectations was highlighted by SMEs. Contrasting result was reported by Goh and
Ridgway (1994) study, where only two out of thirty participating firms (majority of
SMEs implementing BS5750 and only few thing of embarking on TQM journey)
captured voice of customer and majority of them relied on customer
complaints/compliments to assess customer satisfaction and their future requirements

Chapter 3: Quality initiatives in SMEs
Maneesh Kumar 76
and expectations. Very limited training was provided to employees in direct touch with
customers.
Lee (2004) carried out an exploratory study in small Chinese manufacturing firms to
investigate the present status of TQM and its perception and development in these
small firms. It was revealed from the study that even though TQM programs were well
recognised by Chinese small firms and are willing to employ new advanced system
and technologies, their organizational structure remained traditional. Lin et al. (1999)
accessed the relationship between organizational climate and quality management
practices of Taiwanese SMEs. It was found that SMEs that tend to de-emphasize
organizational structure appear to have high-quality tendency. The study also affirmed
that high-quality tendency groups as well as low-quality-tendency groups responded
differently to organizational structure and organizational climate variables.
Management in small firms lacks theoretical knowledge on application of statistical
tools to resolve problems and fear of statistics was restraining them from embracing
tools and techniques that can have significant affect on SMEs performance (Thomas
et al., 2009; Sousa et al., 2005, 2006; Spencer and Loomba, 2001; Davig et al., 2003).
Sousa et al (2005, 2006) study reported very little understanding on the usage of tools
and techniques of CI such as SPC; graphs, process flowcharts, and check sheets
were most commonly used tools in SMEs; control charts and scatter plots were absent
from the mostly used tools category. Employees had low skills to identify, select, and
use quality tools to improve process efficiency. It gives an indication that SMEs
awareness of benefits of tools & techniques of CI or cultural change program like TQM
and Six Sigma is very limited. Manufacturing quality, price, product reliability, and
product customization were frequently used criteria in SMEs to win new orders (Sousa
et al 2005, 2006).
Spencer and Loomba (2001) examined the TQM practices employed by the smaller
manufacturing firms in American Industries. Survey results indicated that SMEs
focused on controlling the process with limited use of quality tools and techniques for
problem solving, while non-production process receiving least attention for quality
improvement. Similar findings was reported by Davig et al. (2003) that showed small
firms in US were slow to embrace the philosophy and practice of TQM and its tools
and techniques.

Chapter 3: Quality initiatives in SMEs
Maneesh Kumar 77
On the contrary, McAdam and Kelly (2002) study showed a good application of
generic benchmarking technique in SMEs (already applying business excellence
model [BEM]). The findings indicated the usefulness of benchmarking in increasing
the rate of improvement of their quality initiatives. Researchers suggested the use of
BEM as a foundation to utilize generic benchmarking in SME, which would further lead
to successful learning and continuous improvement. Generic benchmarking can help
SMEs identify strategic development needs and opportunities by getting feedback
from benchmarking organizations involved, which may have otherwise remained
unnoticed. Goh and Ridgway (1994) study reported minimal knowledge and use of
benchmarking in SMEs. Benchmarking with their competitors was not practised in
majority of the SMEs, which again showed their lack of commitment to CI.
In spite of the tangible benefits from TQM implementation in SMEs, very few firms
were adhering to complete philosophy of TQM (Shea and Gobeli, 1995; Spencer and
Loomba, 2001). SMEs struggled to perceive TQM as a philosophy and focus more on
applying tools and techniques for resolving problems at the shop-floor level. The main
reasons for TQM failure in Noci (1995) study were the result of lack of skilled
employees, financial resources, effective decision making tools, and lack of specific
goals in SMEs. Some of the reasons for less popularity of TQM implementation in
SMEs were (Wilkes and Dale, 1998) – ambiguity in the definition of TQM and
principles underpinning it not explained in the language which SMEs can understand;
many SMEs not introduced to the concept of TQM or know the efficacy of approach.
The challenge lies in integrating TQM philosophy into organizational strategic policy,
which is complex process. It was believed that TQM failure in many organizations
was the result of bad implementation strategies and processes (Hansson and Klefsjo,
2003).
Prajogo and Brown (2006) identified the decline in TQM implementation within SMEs
due to lost popularity of initiative among Australian organizations after 1998. The
reasons were attributed to lack of clarity of concept and benefit from the initiative, no
pressure on SMEs or not driven by external parties, comfortable with informal QM
practices and not preferring to adhere to any formal approach to CI, and publicity
given to TQM failure.
The decline in the use of TQM in SMEs led author to investigate into the effectiveness
of Six Sigma within SMEs environment and compare the quality management

Chapter 3: Quality initiatives in SMEs
Maneesh Kumar 78
practices in Six Sigma SMEs against non-Six Sigma SMEs. This resulted in the
emergence of following research question that required further investigation.
RQ2: What are the critical differences in quality management practices of Six Sigma
and non-Six Sigma SMEs?
The next section was included to assess the role and impact of ISO 9000 on CI
initiatives like Lean and Six Sigma. This was not the focus of study at the start of
research. The results from the first phase of study indicated a pattern emerging from
the response of 64 SMEs – ISO acting as a building block to facilitate Six Sigma
implementation. This led author to review past literature on the role of ISO in
facilitating TQM implementation.
3.4.1. ISO 9000 certification – Is it useful for SME? : An overview
ISO 9000 standard is another stream of quality management referring to series of
standards for quality management system [QMS] (Sun and Cheng, 2002). ISO was
officially formed in 1987 with delegates from 25 countries to facilitate international co-
ordination and unification of industrial standards. There had been considerable growth
in the number of ISO 9000 series certificates held by organizations. In 1999, there
were 226, 349 companies worldwide holding ISO 9000 certifications (Wiele et al.,
2000, 2001). The revised version of ISO 9000:1994, which was ISO 9001:2000 (and
now ISO 9001: 2008) focused more on CI based on PDCA improvement cycle of TQM
and incorporated eight quality management principles aligned to the principles of TQM
(Sun et al., 2004) – Leadership, people involvement, process approach, system
approach to management, continual improvement, factual approach to decision
making, mutually beneficial supplier relationship (www.iso.org). The ISO document
clearly states minimal differences in 2008 version from 2000 version. ISO9001: 2008
had been made simpler in language, easy to use, readily translatable, and compatible
with other management systems such as ISO 14001 (www.iso.org). This section
limits the discussion to ISO 9001: 2000 as author struggled to find any published peer
reviewed journal article on ISO 9001: 2008 certification by SMEs.
The main reasons for certification, as identified from literature, were driven by external
need of improving market image or pressure from competitor/customer to force
strategic change (Nwankwo, 2000; North et al., 1998; Quazi and Padibjo, 1998; Yusof
Chapter 3: Quality initiatives in SMEs
Maneesh Kumar 79
and Aspinwall, 2000a, b; Chittenden et al., 1996; McTeer and Dale, 1994, 1996;
Raynor and Porter, 1991; Mo and Chan, 1997; Noci, 1996; Lee and Oakes, 1995;
Terziovski et al., 1997; Brown et al., 1998; Lee and Palmer, 1999; Sun and Cheng,
2002; Poksinska et al., 2006). For many SMEs, QMS was perceived as a tool for
keeping and updating documentation and not a tool for managing organizational
processes (Poksinska et al., 2006). Organization with this focus would struggle to
realize improvement in product quality or market share. The real impact of such
system could only be measured if the management removed the impediments of clear
strategic intent, leadership commitment, supportive organizational arrangement
(Raynor and Porter, 1991; Brown et al, 1998).
Achieving ISO certification does not mean that an organization has a culture driven by
quality principles. Nwankwo (2000) statement clearly reflects on the aforementioned
sentence- “The main concern about the registration is metaphorically similar to
passing school exam- the result obtained may not be able to differentiate between
those who truly learned something and those who merely passed the exam by
cramming”. Quality assurance system such as ISO 9000 does not guarantee product
quality, still majority of SMEs see it as a destination to quality and end in itself (Goh
and Ridgway, 1994; Meegan and Taylor, 1998; Wiele and Brown, 1997; Wiele et al.,
2000; Seddon, 2000; Sun et al., 2004; Nwankwo, 2000). Thomas and Webb (2003)
study showed little evidence of enhanced quality products or improved effectiveness
of the internal operating structure through the implementation of formal quality
systems. SMEs also found minimal improvement in productivity, costs, wastage rate,
staff motivation, and staff retention as the result of certification (Wiele and Brown,
1997; Brown et al., 1998).
Other school of thoughts perceived improvement in product and service quality as a
result of ISO certification (Sun, 1999, 2000; McAdam and McKeown, 1999; Kanji
1998). If a company had religiously followed the basic principle of ISO 9000 and
developed procedures as prescribed in the standard, there was no need for
certification [provided there is no pressure from key customers]( McTeer and Dale,
1996). Stated by Yusof and Aspinwall (2000b) and supported by the findings of this
study – “Companies do not have to attain ISO 9000 certification if they fully
understand the true nature of a good quality assurance system”.
Chapter 3: Quality initiatives in SMEs
Maneesh Kumar 80
Typical characteristics of organizations that see certification as an opportunity to
improve internal processes were involvement and commitment of employees in
developing ISO into workable system, improved management control, raised quality
awareness among employees, improved awareness of problems within organizations,
and improved product and service quality (Wiele and Brown, 1997; Brown et al., 1998;
Terziovski et al., 1997). SMEs with this type of approach were likely to embark
successfully on the TQM journey. It is imperative to note here that benefits realised
from system was derived from the way of implementation and its operation rather than
from standard itself (Poksinska et al., 2006).
The drawback of ISO 9000 lies in the amount of paperwork and cost of getting and
maintaining certification (Goh and Ridgway, 1994; McTeer and Dale, 1996; Yusof and
Aspinwall, 2000b; Mo and Chan, 1997; Wiele and Brown, 1997; Brown et al., 1998;
Poksinska et al., 2006), increased labour and overhead costs, increased supervision,
and reduced flexibility (Chittenden et al., 1996). Nwankwo (2000) proved that the long-
term benefits from ISO 9000 for small companies may not be very important because
of their poor, passive motives for certification, and a lack of true awareness about the
standards and their potential. One of the reasons of failure of ISO 9000 or other formal
quality systems in SMEs was due to its application in multitude of different ways
resulting in significant variations in results and effectiveness experienced by SMEs
(Thomas and Webb, 2003).
ISO 9000 had helped SMEs to develop, map and standardise their business
processes; facilitate employees to understand their business processes and get better
trained to be responsible for their own processes (McTeer and Dale, 1996); retaining
the business contract, fewer customer complaints, and increasing market share
(Chittenden et al., 1996). ISO is now observed as a vehicle for CI rather than simply
administrative and bureaucratic procedures (Mulhaney et al., 2004). Reflecting on the
usefulness of ISO 9000 registration, Ghobadian and Gallear (1997) stated that
accreditation to system such as BS5750 (UK standard) or ISO 9000 facilitated SMEs
in the process of implementing TQM as it helped the participating firms in
standardization and documentation of common procedures and records. The evidence
was provided in the supporting statement from one case study firm- “Management
saw BS5750 as the best route of putting in place the required basic formal

Chapter 3: Quality initiatives in SMEs
Maneesh Kumar 81
procedures......................., it was felt BS5750 provided a good foundation from which
to launch TQM”.
Soltani and Lai (2007) conducted survey in 150 EFQM organizations (including both
SMEs and large organizations) in UK to indicate on ISO being foundation or precursor
for TQM success. Finding was also consistent with prior researchers, talking about
organizations moving beyond ISO (Taormina, 2002; Terziovski et al., 1997; Taylor,
1995; Russell, 2000; Coleman and Douglas, 2003; Kanji, 1998; Goh and Ridgway,
1994; Taylor, 1995; Ghobadian and Gallear, 1996, 1997; McTeer and Dale, 1996;
Quazi and Padibjo, 1998; Yusof and Aspinwall, 2000b; Gotzamani, 2004; Lewis et al.,
2006). Research had demonstrated the benefit of ISO certification before
implementing TQM - degree of standardization and procedural control; employees
trained to manage and control their process; establishing metrics for processes and
collecting data for measurement. Strict adherence to ISO guidelines prepares the
employees culturally to support the creation of TQM environment (Dale et al., 2007;
Dale and Boaden, 1993).
Some researchers also reported the limited understanding of SME on the relationship
between ISO registration and TQM implementation (McTeer and Dale, 1994; Lee and
Palmer, 1999). SMEs tend to implement only minimum requirements necessary for
ISO 9000 certification, with a little intention to extend their quality programmes further
(McTeer and Dale, 1994; Lee and Palmer, 1999; Williams, 1997). Too much focus on
financial performance measures, measuring customer satisfaction through customer
complaints, and lack of understanding of process of CI by top management were
identified as major obstacle for ISO certified SMEs to progress towards TQM
implementation. Wiele and Brown (1997) also observed that very few SMEs moved
beyond certification to implement initiatives like TQM. SMEs also failed to have an
integrated performance measures at all levels in the organization that can promote
proactive approach to pursuing goals of TQM. On the other hand, Sun and Cheng
(2002) findings from Norwegian SMEs indicated of significant relationship between
ISO certification and TQM practices / business performance.
Research had identified important factors for the successful implementation of ISO
9000 standards in SMEs: attitude of employees to certification system (i.e. focus on to
improve organisational performance or to satisfy external pressure), understanding
and knowledge about QMS, top management commitment, employees’ commitment

Chapter 3: Quality initiatives in SMEs
Maneesh Kumar 82
and internal communication, way the companies are using external help, the degree of
education prior to certification, development of fairly detailed plans for the
implementation, and documentation being adapted to the organisation and not to the
standard (Quazi and Padibjo, 1998; Gustafsson et al 2001; Gotzamani and Tsiotras
2002; Poksinska et al., 2006). Other critical factors for ISO success was identified
from Briscoe et al (2005) study – inculcating quality culture, breaking stumbling blocks
to ISO adoption, readiness assessment for ISO adoption; making ISO practices a part
of SME’s quality routine. Government role in supporting quality movement in
Singapore SMEs was vital in their progression from ISO 9000 towards TQM (Quazi
and Padibjo, 1998).
A brief overview of the entire discussion was presented in table 3.2.
Table 3.2: Motivation, CSFs, impediments, and benefits of ISO 9000 certification
Motivation CSFs Impediments Impact / Effects Positive Negative
Driven by external needa - to improve market image - pressure from competitor/customer
Precursor to TQMb
- Understanding of QMS by top mgmt.
c,d
- Top Mgmt commitment
c,d
- Government role
d
- Employee’s attitude and commitment towards QMS
c
- Existence of quality culture
e
- Education and training
c
- Resource constraints
f
- Too Costlyf
- Lack of top mgmt. Commitment
g
- Lack of knowledge about QMS
f,g
- Lack of strategic focus
g
Internal Benefitsb,h: -standard systems and procedures documented - increased quality awareness - better management control -Improved product quality
External Benefitsa: -improved image - marketing tool
- Increased paper work
f
- Minimal improvement in product quality
i
- Increased costf
- ISO considered as destination to quality journey
i - staff motivation
f,g
Sources: a Nwankwo (2000), North et al (1998),Yusof & Aspinwall (2000a,b),Chittenden et al(1996), McTeer & Dale(1994,1996), Noci(1996), Lee & Oakes (1995), Terziovski et al (1997), Brown et al (1998), Poksinska et al (2006);
b Taylor (1995), Ghobadian & Gallear (1997), McTeer & Dale (1996), Yusof & Aspinwall ( 2000b), Gotzamani(2004), Lewis et al (2006);
c Gustafsson et al (2001), Gotzamani and Tsiotras (2002), Poksinska et al (2006);
d Quazi and Padibjo(1998);
e Briscoe et al (2005);
f Wiele & Brown(1997), Brown et al(1998); g Gotzamani (2004),Lewis et al ( 2006);
h Huarng(1998),McTeer and Dale (1994);
i Goh and Ridgway (1994), Meegan and Taylor ( 1998), Wiele and Brown (1997), Seddon (2000), Sun et al (2004), Nwankwo ( 2000)
The aforementioned review leaves many questions about certification unanswered: for
example, Is ISO precursor to TQM / Six Sigma implementation?; Do SMEs need
certification before embarking on Six Sigma?; What is the impact of certification on the
Chapter 3: Quality initiatives in SMEs
Maneesh Kumar 83
performance of SMEs?. These questions were briefly explored in the second phase of
research, when author conducted multiple case studies in the UK manufacturing
SMEs.
3.5. Critical Success Factors and Challenges to implementation
In chapter 2, author discussed about the CSFs and key challenges faced by Small
businesses during its life cycle. Some of the commonality was observed in the CSFs
of small business growth and that of CI initiatives in SMEs (refer to Section 2.4 and
2.5 for more information). Ten CSFs were identified from the literature review process
(including some key literature on CI initiatives in SMEs) and each factor was
discussed in detail. CSFs discussion was also included while reviewing literature on
ISO application in SMEs in Section 3.4.1 and models/ frameworks proposed by
researchers in Section 3.7. To avoid repletion, this section briefly presents the key
findings from the quality management literature in SMEs on CSFs and key challenges
faced by SMEs during implementation of CI initiatives.
3.5.1. Critical Success Factors
The concept of identifying and applying CSFs to business problems is not a
revolutionary new field of work (Caralli, 2004). It dates back to the original concept of
success factors, as a basis for determining the information needs of managers,
proposed by Daniel (1961) and popularized by Rockart (1979). CSFs are those factors
which are critical to the success of any organisation, in the sense that, if objectives
associated with the factors are not achieved, the organisation will fail - perhaps
catastrophically so (Rockart, 1979). Oakland (2000, pg.26) defines CSFs as “.......a
term used to mean the most important sub goals of a business or
organization.........what must be accomplished for the mission to be achieved”. In the
context of Six Sigma project implementation, CSFs represent the essential ingredients
without which a project stands little chance of success (Antony and Banuelas, 2002).
Leadership and top management commitment was identified as the most important
core values of TQM to establish quality culture in organizations (Gunasekaran et al.,
1996; Hansson and Klefsjo, 2003; Hellsten and Klefsjo, 2000; Bergman and Klefsjo,
Chapter 3: Quality initiatives in SMEs
Maneesh Kumar 84
2003 as cited in Hansson and Klefsjo (2003)). Leadership commitment was
demonstrated by leading from the front, developing own understanding of CI
initiatives, stimulating individual values, motivating employees, breaking down
stumbling blocks and making resources available during change process. The flat
structure of SMEs increased the natural visibility of involved managers, provided they
are committed to TQM implementation, to the rest of the employees and motivated
them to accept the change (McAdam, 2000). Leadership was an important constituent
of excellence models as well as equally important for successful implementation of CI
initiatives such as TQM or Six Sigma (McAdam, 2000; Gunasekaran et al., 1996; Lin,
1999; Taylor, 1997).
Goh and Ridgway (1994) identified five pillars required for TQM implementation in
SMEs as management commitment, customer focus, quality costs, quality systems,
and CI. Moreno-Luzon (1993) reported that SMEs successful in TQM implementation
focused more on product and process innovation by having a motivated management
team with better managing skills. SMEs lack skilled workforce as compared to large
organization and thus implementation of TQM may help employees to get trained on
the tools and techniques of CI.
To understand the specific needs of SMES, an important study was undertaken by
Ghobadian and Gallear (1996, 1997), who assessed the requirements and
characteristics of large corporations versus SMEs in the UK with regard to their
advantages and disadvantages in terms of TQM. Ghobadian and Gallear (1996, 1997)
identified unique advantages possessed by SMEs in terms of effective and open
communication channels, low resistance to change, people orientation, company-wide
awareness, functional integration, and innovativeness. However, SMEs face
disadvantages in the continuous search for the improvement of the business with
quality, productivity and cost reductions as indivisible elements, as well as process
orientation, spending on training, and discipline about goals and standards. Similar
findings were reported by researchers investigating CI initiatives in SMEs (Wiele and
Brown, 1998; Yusof and Aspinwall, 2000 a, b; Shea and Gobeli, 1995; Gunasekaran
et al. 1996). These factors were also cited by proponents of Six Sigma and Lean –
they were in consensus on the role of leadership, top management commitment and a
top-down approach for implementation of Six Sigma or Lean (e.g. Antony et al., 2005,
2008; Kumar, 2007; Achanga et al., 2006).
Chapter 3: Quality initiatives in SMEs
Maneesh Kumar 85
Lee (2004) carried out an exploratory study in small Chinese manufacturing firms to
investigate the present status of TQM and its perception and development in these
small firms. The survey result was in consensus with other researchers (Ahire and
Golhar, 1996; Lee, 1998; Black and Porter, 1996; Yusof and Aspinwall, 1999, 2000a;
Rahman, 2001 a,b) with respect to critical success factors for TQM implementation:
Top management commitment; Employee Participation, supplier involvement; and
training and education.
Researchers and practitioners have proposed frameworks or guidelines for Six Sigma
deployment in SMEs (Spanyi and Wurtzel, 2003; Gupta and Schultz, 2005; Schwinn,
2003; Waxer, 2004; PQA, 2003; Andrews, 2004; Wessel and Burcher, 2004;
Rowlands, 2004; Kumar, 2007; Antony et al., 2005, 2008). The following points may
be taken into account for the successful deployment of Six Sigma in SMEs:
Leadership and Management commitment; Organizational infrastructure; Cultural
change; Education and training; Vision and plan statement; Linking Six Sigma to
customer; Linking Six Sigma to business strategy; Linking Six Sigma to employees;
Linking Six Sigma to suppliers; Communication; Understanding of Six Sigma; Project
management skills; and Project prioritization and selection.
It is noteworthy that the aforementioned critical factors have global application to
assist in the successful implementation of any major business initiatives, not just the
Six Sigma program. The identification of success factors will encourage their
consideration when companies are developing an appropriate implementation plan
(Antony and Banuelas, 2002). If any of the critical success factors is missing during
the development and implementation stages of a Six Sigma program, it would then be
the difference between a successful implementation and a waste of resources, effort,
time and money (Antony and Banuelas, 2002). The key findings on CSFs from the
literature was summarised in table 3.3. It was clearly indicated from table 3.3 that
leadership, management commitment, linking CI initiatives to employees, customers,
and business strategy, education and training, existence of QMS and measurement
system were considered critical to the success of CI initiatives in SMEs.

Chapter 3: Quality initiatives in SMEs
Maneesh Kumar 86
Table 3.3: Critical success factors of CI initiatives in SMEs
Researchers Critical Success Factors
Kum
ar
(200
7)
Anto
ny et al (2
005
,20
08)
Wessel &
Burc
her
(2004)
Yusof
& A
spin
wa
ll (1
999)
Ghoba
dia
n &
Galle
ar
(199
6)
Achan
ga et al (
20
06)
Anto
ny &
Desai (2
00
9)
Goh &
Rid
gw
ay (
1994)
Haksever
(1996)
Spe
ncer
& L
oo
mba
(200
1)
She
a &
Gobe
li (1
99
5)
Lin
(1
99
9)
Lee (
1998
, 20
04)
Rahm
an (
2001
a,b
)
Soh
ail
& H
oo
ng (
2003)
Ahir
e &
Golh
ar
(19
96)
Tannock et al (2
00
2)
Strong leadership X X X X X X X X X Senior management commitment X X X X X X X X X X X X X X Communication X X X X X Linking CI initiatives to employee X X X X X X X X X X X X X X X Cultural change X X X X X X Education & training X X X X X X X X X X X X X X X X Link CI initiatives to customer X X X X X X X X X X X X X X Project selection X X X Link CI initiatives to Business Strategy X X X X X X X X Link CI initiatives to supplier X X X X X X X X Project management skill X X X X Organizational infrastructure X X X X X X Clear Vision & Plan X X X IT & innovation X X Knowledge of CI & quality tools & techniques X X X X X X X X X X X X Existence of measurement system X X X X X X X X X X Existence of quality management system X X X X X X X X X X Rewards & recognition X X X Teamwork X X X Availability of resources X X X X

Chapter 3: Quality initiatives in SMEs
Maneesh Kumar 87
3.5.2. Challenges and Barriers to implementation of CI initiatives
The issue of whether quality management programs can be effectively utilised by
SMEs remains uncertain (Husband, 1997). Common quality models, such as quality
systems and certification, have been adopted by some SMEs, and yet the rate of
implementation is lower than larger organisations (Kumar, 2007; Antony et al., 2005,
2008; Brown and Wiele, 1995; Husband, 1997; Terziovski et al, 1997; Ramsey, 1998).
More holistic quality management initiatives, such as TQM, also appeared to exhibit
low implementation rates (Ghobadian and Gallear, 1996; Van der Wiele and Brown,
1998). It was suspected that the poor adoption of quality management initiatives in
SMEs is due to multiple and complex reasons, not just the often stated impediments of
cost, time and relative impacts (Gome, 1996). In addition, it may be that the quality
programs are being treated as an extension or separate components of a SME
business operation.
Many CI initiatives programs like Six Sigma do not appear to be easily understood or
interpreted by SMEs, which may be a significant contributor to low implementation.
There is also evidence to suggest that quality management programs are not being
taken up by SMEs for several reasons, viz:
• Difficult to distinguish between different quality programmes like Six Sigma,
TQM, ISO, EFQM and the system that suits best to their needs. SMEs are
unclear about the advantages (due to lack of knowledge) that one system has
over other (Husband, 1997; Terziovski et al, 1997; Husband and Mandal, 1999;
Yusof and Aspinwall, 1999; Kumar, 2007; Antony et al., 2008)
• SMEs believe that their existing culture and system, such as ISO 9000 is
sufficient to meet their business needs (Andrews, 2004; Yusof and Aspinwall,
1999). Senior managers in SMEs view Quality System such as ISO 9000 as the
destination of the achievement of quality (McTeer and Dale, 1994; Lee and
Palmer, 1999; Wiele and Brown, 1997). In fact, quality improvement is always
meant to be a journey rather than mere destination.
• There is very little evidence of success of Six Sigma in SMEs context. SMEs
believe that this program is another fad, fantasy or flavour of the month like
TQM and BPR (Smith et al., 1994; Andrews, 2004; Kumar, 2007; Antony et al.,
2008)
Chapter 3: Quality initiatives in SMEs
Maneesh Kumar 88
• Lack of management commitment and their misinterpretation about the time
and resources consumed for implementing Six Sigma inhibits the SMEs
initiative (Andrews, 2004; Antony et al., 2005).
• SMEs blindly view Six Sigma or TQM as a panacea for all process and quality
problems, and as a result they encounter failure in its implementation when
applying to every problem (Andrews, 2004; Thomas and Webb, 2003)
• SMEs have a misconception that Six Sigma involves lots of statistics, which is
beyond their domain (Kumar et al., 2008; Kumar, 2007; Andrews, 2004; Antony
et al., 2005).
In Parkin and Parkin (1996) study, SMEs were struggling to realize the full potential of
TQM due to failure in translating management strategies into employee action. Parkin
and Parkin (1996) stated that SMEs are conversant of the benefits of TQM but were
not willing or competent enough to implement it effectively across their organization.
As cited by Ghobadian and Gallear (1997) – “.......probably the biggest obstacle to the
introduction of TQM in SMEs is the ‘management realization’ and the ability of owner
managers to modify their behaviour and management style”. Once the top
management realizes the need for change, it is easier for SMEs to attain cultural
change than in large organizations.
TQM perception varies with firm size and planning behaviour. This was validated by
Temtime and Solomon (2002) based on survey results examining the relationships
between TQM perceptions, planning behaviour (strategic and operational), and firm
size in 57 SMEs within Ethiopia (East African Country). The findings indicate that
excessive emphasis on short-term profitability, lack of resources, business planning
and vision, and misperception of TQM practices were among the main obstacles in
adoption of a formal TQM program.
Some of the typical barriers faced by small firms in implementation processes were:
� Lack of visible leadership (Ghobadian and Gallear, 1997)
� Lack of vision, strategies and overall objectives (Lee and Oakes, 1995;
Moreno-Luzon, 1993)
� Lack of resources [human, financial, technical] (Moreno-Luzon, 1993; Lee and
Oakes, 1995; Haksever, 1996; Ghobadian and Gallear, 1996; Yusof and
Aspinwall, 2000b )

Chapter 3: Quality initiatives in SMEs
Maneesh Kumar 89
� Lack of managerial experience in quality management (Ghobadian and Gallear,
1996, 1997; Yusof and Aspinwall, 2000b)
� Focus on detection based system rather than prevention based approach
(Moreno-Luzon, 1993; Ghobadian and Gallear, 1996)
� Focus on short term gains and objectives (Moreno-Luzon, 1993; Barrier, 1992)
� Trying to achieve too much in short-time (Yusof and Aspinwall, 2000b)
� Lack of involvement of non-production staff in quality improvement (Yusof and
Aspinwall, 2000b)
� Lack of formal procedures before TQM implementation (Ghobadian and
Gallear, 1996, 1997)
� Past history of failure of different change initiatives (Ghobadian and Gallear,
1996, 1997)
� The lack of bargaining power against suppliers and lack of resources are major
hindrances encountered by them when implementing TQM programs (Lee,
2004).
� Failure to translate management strategies for TQM implementation into
employees action (Parkin and Parkin, 1996)
Resource constraints were stated as a major barrier for SMEs to embark on any
change initiatives such as TQM (Lee and Oakes, 1995; Haksever, 1996; Ghobadian
and Gallear, 1996, 1997; Yusof and Aspinwall, 2000b, 2001; Antony et al., 2008). This
often impedes SMEs manager to allocate funds for training and development of
employees or to send employees for external training (Moreno-Luzon, 1993; Lee and
Oakes, 1995). Understanding of barriers faced during CI initiative implementation may
facilitate in the development of an effective and practical framework for Six Sigma
implementation.
Literature review on CSFs and challenges in implementing initiatives like TQM led to
the emergence of third research question to identify the CSFs and challenges faced
by the UK SMEs during Six Sigma implementation.
RQ3: What are the critical success factors and barriers to implementation of Six
Sigma in SMEs?

Chapter 3: Quality initiatives in SMEs
Maneesh Kumar 90
3.6. Impact of CI initiative on Organizational Performance
Preceding sections focused on reviewing extant SMEs literature on quality
management practices, CSFs and barriers to implementation of CI initiatives or ISO
certification system and provided a useful understanding of the SMEs perception
towards CI or certification system like ISO. This section emphasised on understanding
the relationship between quality practices and organizational performance of SMEs
through review of scant literature that empirically examines the aforementioned
relationship.
In an effort to understand the usage of performance measurement system in UK and
Portuguese SMEs, Sousa et al (2005, 2006) conducted a survey involving
manufacturing and service SMEs in two countries. Findings reported from both studies
matched with other literature
� Level of use of performance measurement (PM) very low in SMEs; more focus
on financial measures; very limited focus on innovation and learning measure.
� Customer performance, employee training, delivery performance, and financial
measures were the top 4 PM criteria used by SMEs; on-time delivery, in-
process quality, unit production cost were the most important factors within PM
criteria used in SMEs.
� Very little understanding on the usage of tools & techniques of CI such as SPC;
graphs, process flowcharts, and check sheets were most commonly used tools
in SMEs; control charts and scatter plots were absent from the mostly used
tools category
� Training of employees, cost, information system currently used, and defining
new performance measures were important obstacles to the adoption of new
PM
� Employees have low skills to identify, select, use quality tools to improve
process efficiency
Yusof and Aspinwall (2000b) proposed a conceptual framework tailored to the needs
of SMEs for implementing TQM and four case studies were conducted to validate the
proposed framework (Yusof and Aspinwall 2000c). The results of the study showed
that companies embarking on any quality programme in the past perform better than
Chapter 3: Quality initiatives in SMEs
Maneesh Kumar 91
those that have not embarked on any such programme. The results of the case study
was supported by the findings of Ahmed and Hassan (2002) in Malaysian SMEs that
revealed the firms implementing TQM exceeded in performance with respect to non-
adopters of TQM.
A comparative analysis on the use of quality tools and techniques, management
practices, training to employee, performance measures, etc, between firms
implementing TQM and all the firms involved in survey was conducted by Ahmed and
Hassan (2002). It was found the firms implementing TQM exceeded in performance
with respect to each variable being used for comparison. Shea and Gobeli (1995)
identified the benefits realised from TQM implementation in 10 case study SMEs such
as increased customer satisfaction (internal & external), increased employees
retention, and improved internal processes. Similar result was observed by Spencer
and Loomba (2001) surveying the USA SMEs. TQM implementation had a positive
impact on reduction of inventory, lead-time, operating costs, and labour costs.
Conflicting results were observed while understanding the impact of TQM on firms
with and without ISO 9000 certification. Sohail and Hoong (2003) observed positive
impact of TQM on performance of ISO certified firms as compared to non-certified
firms. ISO certified firms adhered to TQM principles to certain extent, had established
systems and procedures in place, applied tools of CI to some degree, and observed
better organizational performance. Aforementioned findings were missing from the
non-certified SMEs. On the contrary, Rahman (2001a) and Taylor and Wright (2003)
study revealed no difference in performance of firms with and without certification.
Contradictory findings may be the result of different geographical location of study or
limited sample size for the project undertaken.
Length of TQM adoption had significant correlation with QM practices and
performance as observed in Prajogo and Brown (2006) and Powell (1995) study. The
findings were in consensus with Sohail and Hoong (2003) study on Malaysian SMEs.
Researchers suggested that real benefits of TQM in SMEs can only be realised by
long-term focus and commitment to initiatives. But the length of ISO adoption was
identified to have negligible correlation with QM practices and performance (Prajogo
and Brown, 2006; Rahman, 2001a,b; Taylor and Wright, 2003).
Chapter 3: Quality initiatives in SMEs
Maneesh Kumar 92
Rahman (2001a,b) made an attempt to identify the extent of TQM practices in SMEs
in Western Australia and its impact on business performance. Data analysis showed
significant multicollinearity among the parameter, which means that the bivariate
correlations between the TQM (criteria) practices and organisational performance
should be considered cautiously. From the survey result, it was inferred that
management commitment, employee involvement, and customer focus are three
important parameters affecting the organization performance in terms of revenue,
number of customer and profitability.
To explore the actual impact of quality on small business, a number of small ISO 9000
businesses were surveyed in Northern Ireland by McAdam and McKeown (1999). The
main conclusions and recommendations arising from the article were that small
businesses can benefit from implementing TQM. However, small firms implementing
TQM need to learn to be more externally focused, i.e. customer focused, to measure
the financial impact of TQM on bottom line performance and to use direct methods to
measure customer satisfaction. Overall, the research showed that small businesses in
Northern Ireland have achieved benefits from both ISO 9000 and TQM. The majority
of the businesses said that TQM was more beneficial than ISO 9000 and that both
complemented one another.
Salaheldin (2008) studied the impact of CSFs of TQM (classified into strategic,
tactical, and operational factors) on operational an organizational performance of
Qatari SMEs. Strategic factors (including top management commitment,
organizational culture, leadership, continuous improvement, quality goals and policy,
resources value addition process and benchmarking) were identified critical in
successful implementation of TQM in SMEs, matching with the viewpoints of other
researchers (Powell, 1995; Samson and Terziovski, 1999; Brah et al, 2002). The
findings also revealed the relationship, though partial, between TQM implementation
and firm performance (both operational and organizational performance) and
confirming to the findings of previous research (Demirbag et al., 2006 a,b; Sila, 2007;
Rahman, 2001; Seth and Triparthi, 2005). Strategic factors had strong impact on both
operational and organizational performance; tactical factors had strong impact on
operational performance; operational factor had strong impact on both operational and
organizational performance.

Chapter 3: Quality initiatives in SMEs
Maneesh Kumar 93
TQM practices were found to be partially correlated to quality performance in a survey
conducted on Malaysian ISO 9000:2000 certified manufacturing organizations
[including both small and large organizations] (Arumugam et al., 2008). Continual
improvement and customer focus were critical and significantly affected quality
performance of firms (Arumugam et al., 2008). Process management, information
analysis, leadership, supplier relationship, quality system improvement, and people
involvement had no significant influence on quality performance. Fact based decision
making was identified as less prevalent in ISO 9001:2000 certified organizations.
There was no comparison between small and large firms with respect to CSFs or
performance to identify the similarity/differences in the two groups.
Demirbag et al (2006a) conducted survey in Turkey textile SMEs and used structured
equation modelling to establish relationship between TQM implementation practices
and organizational performance (including both financial and non-financial measures).
Strong positive correlation was observed between non-financial measure and TQM
implementation, while partial weak relationship established between financial
measures and TQM implementation. In a similar study, Demirbag et al (2006b) tested
relationship between TQM practices, market orientation (MO), and organizational
performance. MO had a strong and positive relationship with TQM practices and
strong relationship with performance through mediating role of TQM practices.
Researchers suggested amalgamating MO with TQM practices to improve
performance of manufacturing SMEs.
Ahire et al (1996) surveyed 500 companies in USA, implementing any form of quality
system, to investigate into quality management practices in TQM and non-TQM firms.
One third of the firm perceived very limited benefit and two-thirds of the TQM / quality
system implementation program have failed to show any benefit and was ground to
halt.
The relationship between TQM and organizational performance in SMEs has been
discussed extensively in literature with mixed results. Researchers have established
positive relationship between successful implementation of TQM and organizational
performance (Moreno-Luzon, 1993; Zairi et al., 1994; Ahire and Golhar, 1996;
Hendricks and Singhal, 1997; Hendricks and Singhal, 2001; Samson and Terziovski,
1999; Lee, 2004). Other school of thoughts have questioned the actual benefit of TQM
implementation on organizational performance (Powell, 1995; Harari, 1997; Pyzdek,
Chapter 3: Quality initiatives in SMEs
Maneesh Kumar 94
1999; Antony et al., 2005; Struebing and Klaus, 1997). The reasons for less popularity
of TQM implementation in SMEs or failure of TQM were attributed to ambiguity in the
definition of TQM and principles underpinning it not explained in the language which
SMEs can understand and inappropriate implementation strategies and processes
(Wilkes and Dale, 1998). Also many SMEs were not introduced to the concept of TQM
or know the efficacy of approach. Similar findings have been reported on failure of
TQM initiatives in large organizations.
Summary of key findings from this section was presented in table 3.4. The
aforementioned discussion leads to the emergence of following research questions to
investigate in this doctoral research.
RQ4: Does the performance of Six Sigma firms differ from non-Six Sigma firms?

Chapter 3: Quality initiatives in SMEs
Maneesh Kumar 95
Table 3.4: A review of impact of CI initiatives on organizational performance
Author (Year), Country
Research Methodology used, response rate (%), type of participating
firm
Quality Initiative(s) Focused on
Key Performance Indicators
Factors affecting performance
Impact of quality initiative on firm performance (FP)
Sohail & Hoong (2003), Malaysia
Survey, 20.2%, Mfg. & Service industry
TQM firms with & without ISO 9000 certification
Several items for 6 factors listed in next column included to measure performance
Customer Mgmt. & quality satisfaction; strategic planning; leadership; information availability; employee empowerment; organizational control & performance
ISO 9000 have +ve impact on FP as compared to non-certified SMEs
Rahman (2001a) Australia
Survey, 21%, Mfg. & Service industry
TQM firms with & without ISO 9000 certification
Revenue, profitability, number of customers
Process control was the only factor (out of 10 factors) that had higher mean rating for firms with ISO certification compared to non-certified firms
No significant differences b/w ISO9000 certified and non-certified SMEs w.r.t TQM implementation & performance
Rahman (2001b), Australia
Survey, 21%, Mfg. & Service industry
TQM Revenue, profitability, number of customers
Leadership; Processes, products & services; People; Customer focus
4 factors +vely related to FP, though people & customer focus were found significant
Shea and Gobeli (1995), USA
Case Study, 10 sample firms, Mfg.+ Service + Non-profit SMEs
TQM Customer satisfaction Employee satisfaction Productivity
Customer orientation; employee empowerment; continuous improvement (though less evidence of usage of data driven actions, quality tools & techniques, structured problem solving approach)
+ve impact in terms of customer and employees satisfaction, employee retention, & improvement in internal processes & performance

Chapter 3: Quality initiatives in SMEs
Maneesh Kumar 96
Spencer & Loomba (2001), USA
Survey, 34.22%, Mfg. TQM Inventory, lead times, labour costs, operating expenses
Employee involvement; quality leadership; TQM training; use of process improvement methods; customer focus; level of quality policies & measurement; and supplier programs Still less use of problem solving methods evident in SMEs
+ve impact of TQM on all the performance criteria
Anderson and Sohal (1999), Australia
Survey, 9.23%, Mfg.+ Service industry
Studying TQM effectiveness using Australian Quality Award (AQA) framework
Organizational Performance included: cost of production or service; quality of product or service; flexibility of delivery; timeliness of delivery, and productivity improvements Business Performance included: sales; market share, employment levels; cash flow; exports; and overall competitiveness
Leadership practices was most important factor; other factors such as customer focus and quality practices had limited influence on outcome; people management, information & analysis, strategy & policy practices had no influence on outcome
Impact of TQM on organizational performance was +ve; QM practices had highest impact on overall competitiveness and least on export
Terziovski and Samson (2000), Australia & New Zealand
Survey, over 32%, Mfg. Industry Includes sample of both small and large firms
TQM (focused on studying the impact of TQM w.r.t size of the firm)
14 Organizational performance variables included from MBNQA, AQA,EQA framework
-Not discussed- Size of the firms impedes TQM implementation with larger firms deriving greater benefits from TQM than SMEs
TQM is significantly & +vely related to- customer satisfaction, employee morale, on-time delivery, productivity, cashflow, and sales growth
Prajogo and Brown (2006), Australia
Survey, 22.8%, Mfg.+ Service industry
ISO 9000 & TQM Product quality & productivity Leadership; Strategic planning; customer focus; information & analysis; people management; process management.
Length of TQM adoption significantly & +vely correlated with QM practices & performance Length of ISO adoption had negligible

Chapter 3: Quality initiatives in SMEs
Maneesh Kumar 97
All factors had an impact on performance though not tested statistically
correlation with QM practices & performance
Sousa et al (2005), Portugal
Survey, 19%, Mfg. + Service industry
TQM, Balance Scorecard, ISO, general quality practices
Productivity measures; quality performance measures; financial measures; employee training measures; measures of innovation; delivery performance measures; service measures; and other measures
-Not discussed- Very limited knowledge & low usage of tools of CI such as SPC – may be attributed to low employees skills
Impact of QI on FP not discussed; focused on the existences of PM system in SMEs; On-time delivery, in-process quality, incoming parts quality were the most cited measures used by SMEs
Sousa et al (2006), UK
Survey, 12%, Mfg. + Service industry
TQM, Balance Scorecard, ISO, general quality practices
Same as above
Level of use of PM very low due to lack of employees
training, information system currently used & defining
new PM
-Not discussed- Very limited knowledge & low usage of tools of CI such as SPC – may be attributed to low employees skills
Impact of QI on FP not discussed; focused on the existences of PM system in SMEs; Financial measures more widely used; On-time delivery, in-process quality, & unit production cost most important measures used in SME

Chapter 3: Quality initiatives in SMEs
Maneesh Kumar 98
3.7. Quality Management Maturity Models and Frameworks– A
Review
Goh and Ridgway (1994) emphasized on development of a cost-effective framework
for TQM implementation in SMEs. The idea of cost-effective framework for SMEs was
supported by other researchers as well (Yusof and Aspinwall, 2000c; Ghobadian and
Gallear, 1997; Stuart and Husband, 1999; Thomas and Webb, 2003; Hansson and
Klefsjo, 2003; McAdam, 2000; Antony et al., 2008). A sound implementation
framework for Six Sigma implementation in SMEs may facilitate a transformation in
culture from fire-fighting mode to a new culture of proactive approach, where decisions
are based on data, constant plans are made, and continuous improvement becomes a
daily norm. Moreover, it will provide a road map and direction for SMEs to implement
Six Sigma in a more comprehensive, controlled and timely manner.
Before discussing framework for CI implementation in SMEs, it was equally important
to first understand the preparedness of a SME to implement CI initiatives such as
TQM or Six Sigma. If a SME is culturally ready to implement CI initiatives, than the
customized frameworks and models proposed for SMEs are required to guide them
through the implementation process. Researchers have proposed maturity models in
the past for TQM implementation that assesses the stages or levels reached by an
organization in their CI journey and evaluate its implication for organizational
performance (Dale and Lascelles, 1997; Kaye and Dyason, 1995). The stages within
the maturity model are the characteristics and behaviours displayed by an
organization with respect to TQM implementation at one point in time (Dale and
Lascelles, 1997). In order to understand SMEs readiness for Six Sigma
implementation, the author reviewed the scant literature on the recognised TQM
maturity model and understood the characteristics of firm at different stages of
implementation process. This facilitated the author to construct a Six Sigma
Readiness Index to assess a SME readiness to embark on Six Sigma journey.
The purpose of this section was to review commonly cited models /frameworks for
quality management application in SMEs to understand the key constituents of the
frameworks/models and its application in industry to date. Business Process
Reengineering (BPR) literature was excluded from the review process as it focused
more on breakthrough improvement rather than incremental/CI. TQM frameworks/

Chapter 3: Quality initiatives in SMEs
Maneesh Kumar 99
models proposed for large organizations were not included in the review process.
Author have also omitted some articles where framework was developed based on the
combined sample of small and large firm but no distinction or comparison was made
between the two groups with respect to the application of framework. The author have
put persistent efforts to identify and review as many frameworks/models literature on
quality management application in SMEs, there may be a chance of missing/dropping
few articles from the review process.
The keywords for the search used were: {(MATURITY MODELS) AND (QUALITY)};
{(QUALITY MODELS) AND (SMEs)}; {(QUALITY FRAMEWORK) AND (SMEs)};
{(TQM FRAMEWORK) AND (SMEs)}; {(LEAN FRMAEWORK) AND (SMEs)}; {(SIX
SIGMA FRAMEWORK) AND (SMEs)}; {(TQM/ LEAN MODELS) AND (SMEs)}. The
author first reviewed those articles that were cited most in literature as identified from
reviewing extant literature on quality management applications in SMEs context.
Some of the most popular study to date on frameworks/models for TQM
implementation in SMEs were Ghobadian and Gallear (1997), Wilkes and Dale (1998),
Husband and Mandal (1999), Watts and Dale (1999), Yusof and Aspinwall (2000 b,c)
Hansson and Klefsjo (2003), Thomas and Webb (2003), and Deros et al (2006).
3.7.1. Assessing organizational readiness for CI journey through Maturity
Model lens
This section aims to identify the characteristics/ criteria that are necessary to be
present in SMEs before embarking on the journey of Six Sigma. The identification,
measurement and monitoring of characteristics/ criteria may facilitate smoother
implementation (without disruption) of Six Sigma across the organization. This can be
achieved by briefly discussing the work of quality gurus; self-assessment models, its
constituents, and applicability in SMEs environment; and finally reviewing the famous
maturity models proposed for CI/TQM implementation in organizations.
Deming (1986) 14 points for management, Crosby (1979) 14 steps for implementation
of TQM program, and Juran (1993) 10 steps to quality improvement were proposed
based on their experience as a consultants to many large organizations. The
contribution of quality Gurus to revolutionize the quality practices in large
organizations cannot be understated. Most popular self-assessment models such as
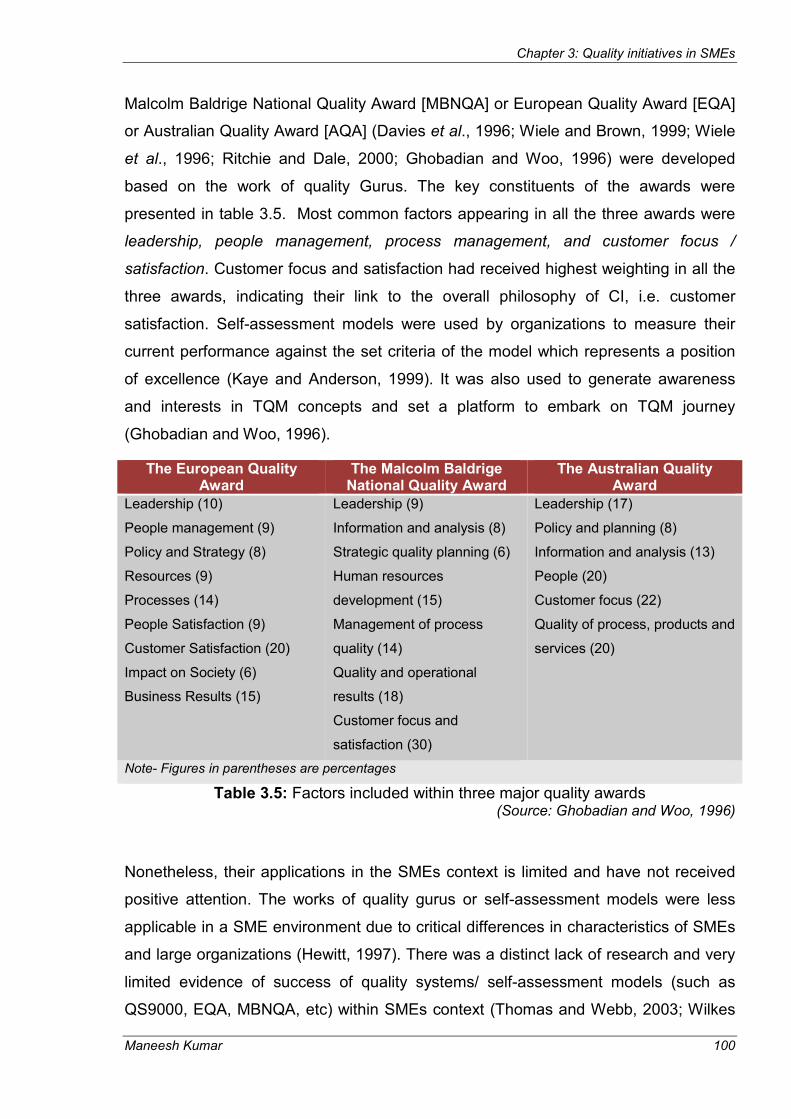
Chapter 3: Quality initiatives in SMEs
Maneesh Kumar 100
Malcolm Baldrige National Quality Award [MBNQA] or European Quality Award [EQA]
or Australian Quality Award [AQA] (Davies et al., 1996; Wiele and Brown, 1999; Wiele
et al., 1996; Ritchie and Dale, 2000; Ghobadian and Woo, 1996) were developed
based on the work of quality Gurus. The key constituents of the awards were
presented in table 3.5. Most common factors appearing in all the three awards were
leadership, people management, process management, and customer focus /
satisfaction. Customer focus and satisfaction had received highest weighting in all the
three awards, indicating their link to the overall philosophy of CI, i.e. customer
satisfaction. Self-assessment models were used by organizations to measure their
current performance against the set criteria of the model which represents a position
of excellence (Kaye and Anderson, 1999). It was also used to generate awareness
and interests in TQM concepts and set a platform to embark on TQM journey
(Ghobadian and Woo, 1996).
Table 3.5: Factors included within three major quality awards (Source: Ghobadian and Woo, 1996)
Nonetheless, their applications in the SMEs context is limited and have not received
positive attention. The works of quality gurus or self-assessment models were less
applicable in a SME environment due to critical differences in characteristics of SMEs
and large organizations (Hewitt, 1997). There was a distinct lack of research and very
limited evidence of success of quality systems/ self-assessment models (such as
QS9000, EQA, MBNQA, etc) within SMEs context (Thomas and Webb, 2003; Wilkes
The European Quality Award
The Malcolm Baldrige National Quality Award
The Australian Quality Award
Leadership (10)
People management (9)
Policy and Strategy (8)
Resources (9)
Processes (14)
People Satisfaction (9)
Customer Satisfaction (20)
Impact on Society (6)
Business Results (15)
Leadership (9)
Information and analysis (8)
Strategic quality planning (6)
Human resources
development (15)
Management of process
quality (14)
Quality and operational
results (18)
Customer focus and
satisfaction (30)
Leadership (17)
Policy and planning (8)
Information and analysis (13)
People (20)
Customer focus (22)
Quality of process, products and
services (20)
Note- Figures in parentheses are percentages
Chapter 3: Quality initiatives in SMEs
Maneesh Kumar 101
and Dale, 1998; Watts and Dale, 1999; Hewitt, 1997). The quality award models had
been used by companies either as an assessment tool to monitor their progress with
TQM implementation or enhancing their market image by competing for quality award
as a measure of TQM maturity (Yusof and Aspinwall, 2000a; Hansson and Klefsjo,
2003). It was not suited for firms beginning with the TQM journey. Once an
organization has seriously embarked on the CI journey, they can use these models to
assess their progress or maturity to CI implementation.
Many SMEs have the perception that these models add to unnecessary bureaucracy,
excessive paperwork, time-consuming and increases complexity for the managers
rather than achieving what they aim for (Watts and Dale, 1999; Wilkes and Dale
1998). Assessment models gives information on the key constituents or critical factors
of the quality initiatives (addresses ‘What’ part or focus from systems perspective).
However, SMEs need a systematic guideline or step-by-step framework (focus on
‘How to’ part) to facilitate successful implementation of initiatives like TQM, Lean, Six
Sigma. Due to short-term focus and driven by immediate imperatives, it is challenging
to generate interest in SMEs to use self-assessment with a prospect of winning an
award (Hewitt, 1997). SMEs are unlikely to experience external pressure to use self-
assessment model, until it comes from their larger counterpart in the supply chain
(Hewitt, 1997). The self-assessment models also failed to accentuate the factors that
may drive the improvement and keep the momentum between the self-assessment
checks (Kaye and Anderson, 1999).
3.7.2. A review of common maturity models for CI/ TQM implementation
The first maturity model /quality management maturity grid for CI was proposed by
Philip B Crosby in 1979 that mapped six categories (management understanding and
attitude; quality organization status; problem handling; cost of quality as % of sales,
quality improvement actions; and summation of company quality posture) behaviour
across five stages (uncertainty, awakening, enlightenment, wisdom, and certainty) of
their quality journey. It provided a good starting point for companies to assess their
maturity in the CI journey and identify the action plan to move forward to next level.
Crosby’s model missed to address issues on leadership role, employee’s
management, and focus on key stakeholders, to name a few issues. Moreover,

Maneesh Kumar
management and employees understanding and calculation of cost of quality were
very elusive and complex.
Inspired by the work of Crosby and with the evolution of TQM, researchers propos
other CI maturity models for TQM implementation covering wider characteristics /
behaviour of organizations at different stage of TQM implementation (Kaye and
Dyason, 1995; Lascelles and Dale, 1991; Dale and Lascelles, 1997; Dale and Smith,
1997; Dale et al., 1997; Bessant and Caffyn, 1997; Bessant
In an attempt to understand organizations positioning in the quality evolutionary
process, defined in five different eras of inspection, quality control, quality assurance,
strategic quality management (SQM), and beyond SQM, Kaye and Dyason (1995)
examined the characteristics of 13 organizations at various stages of their quality
initiatives. Firms were assessed against the critical factors identified from the interview
process, listed as
measurement), people management, business results, and competitive CI (external
measurement).
Figure 3.5: Characteristics of firms in the quality evolutionary process
Chapter 3: Quality initiatives in SMEs
management and employees understanding and calculation of cost of quality were
very elusive and complex.
Inspired by the work of Crosby and with the evolution of TQM, researchers propos
other CI maturity models for TQM implementation covering wider characteristics /
behaviour of organizations at different stage of TQM implementation (Kaye and
Dyason, 1995; Lascelles and Dale, 1991; Dale and Lascelles, 1997; Dale and Smith,
., 1997; Bessant and Caffyn, 1997; Bessant et al
In an attempt to understand organizations positioning in the quality evolutionary
process, defined in five different eras of inspection, quality control, quality assurance,
nagement (SQM), and beyond SQM, Kaye and Dyason (1995)
examined the characteristics of 13 organizations at various stages of their quality
initiatives. Firms were assessed against the critical factors identified from the interview
process, listed as – leadership, strategic quality orientation, CI (internal
measurement), people management, business results, and competitive CI (external
Characteristics of firms in the quality evolutionary process(Source: Kaye and Dyason, 1995)
Chapter 3: Quality initiatives in SMEs
102
management and employees understanding and calculation of cost of quality were
Inspired by the work of Crosby and with the evolution of TQM, researchers proposed
other CI maturity models for TQM implementation covering wider characteristics /
behaviour of organizations at different stage of TQM implementation (Kaye and
Dyason, 1995; Lascelles and Dale, 1991; Dale and Lascelles, 1997; Dale and Smith,
et al., 2001).
In an attempt to understand organizations positioning in the quality evolutionary
process, defined in five different eras of inspection, quality control, quality assurance,
nagement (SQM), and beyond SQM, Kaye and Dyason (1995)
examined the characteristics of 13 organizations at various stages of their quality
initiatives. Firms were assessed against the critical factors identified from the interview
ership, strategic quality orientation, CI (internal
measurement), people management, business results, and competitive CI (external
Characteristics of firms in the quality evolutionary process (Source: Kaye and Dyason, 1995)

Chapter 3: Quality initiatives in SMEs
Maneesh Kumar 103
Examining the key characteristics of each era against the CSFs (as shown in figure
3.5), it may be interpreted that positioning of the firm at era three (at least) or era four
(desirable) and motivation to move ahead to fifth era or beyond SQM (exemplar case)
reflects the firm’s commitment to CI journey. Another popular maturity model for TQM
implementation was proposed by Lascelles and Dale (1991), which was further
revisited and revised by researchers based on the comments from industrial world
(Dale and Lascelles, 1997; Dale and Smith, 1997; Dale et al., 1997). The maturity
model incorporated six different levels of TQM adoption, as shown in figure 3.6, which
was termed as: uncommitted (level1), drifters (level2), tools pushers (level3),
improvers (level4), award winners (level5), and world-class (level6). First two levels
are representatives of organization not committed to CI, lacks customer focus, operate
in fire fighting mode, decisions based on gut feeling, ISO 9000 considered as
destination to CI journey, blame culture, lack of vision, focus and understanding of
TQM implementation across organization, bureaucratic organizational structure, to
name a few. Level 2 organizations move from one-initiative to other very quickly in
response to latest trend in the market. Level 3, 4, 5 and 6 have similar characteristics
to Kaye and Dyason (1995) definition of era 2, 3, 4 and 5 respectively.
Figure 3.6: Levels of TQM adoption (Source: Dale and Lascelles, 1991, 1997)
Dale and Smith (1997) revised the original model of Dale and Lascelles (1997) by
combining drifters and tool pushers as initiators and introduced a new level termed
‘unaware’ before uncommitted to include those organization not acquainted to TQM
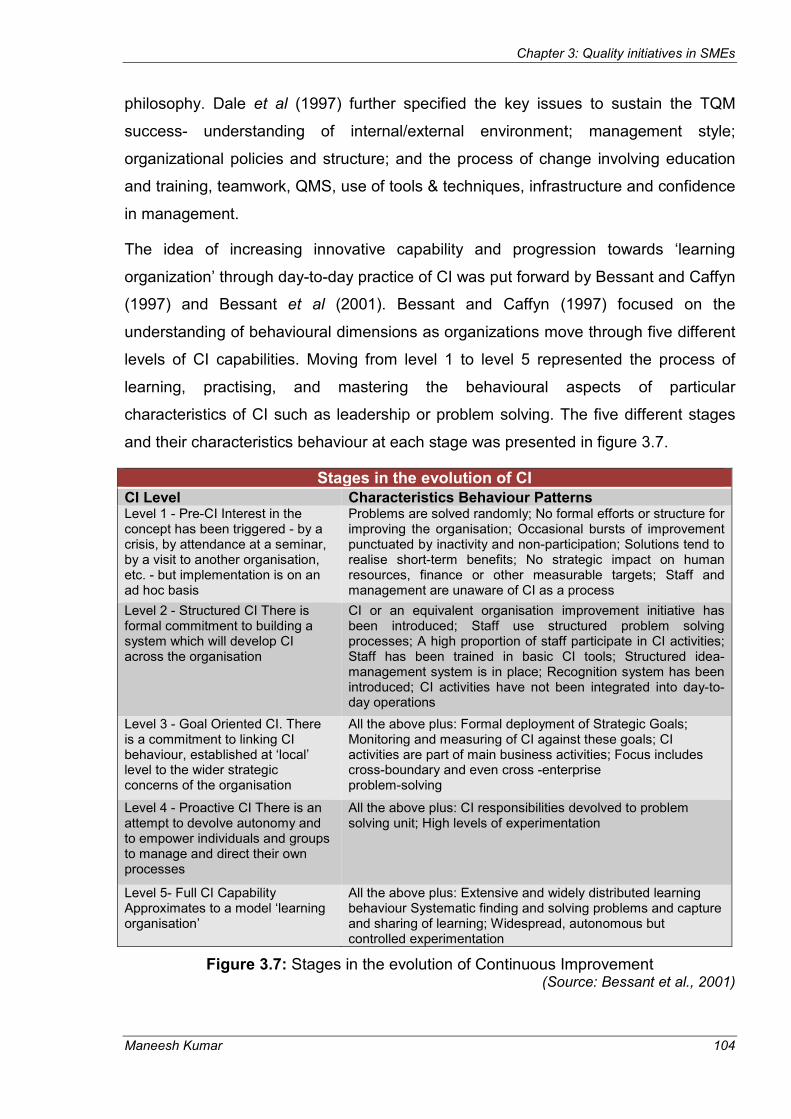
Chapter 3: Quality initiatives in SMEs
Maneesh Kumar 104
philosophy. Dale et al (1997) further specified the key issues to sustain the TQM
success- understanding of internal/external environment; management style;
organizational policies and structure; and the process of change involving education
and training, teamwork, QMS, use of tools & techniques, infrastructure and confidence
in management.
The idea of increasing innovative capability and progression towards ‘learning
organization’ through day-to-day practice of CI was put forward by Bessant and Caffyn
(1997) and Bessant et al (2001). Bessant and Caffyn (1997) focused on the
understanding of behavioural dimensions as organizations move through five different
levels of CI capabilities. Moving from level 1 to level 5 represented the process of
learning, practising, and mastering the behavioural aspects of particular
characteristics of CI such as leadership or problem solving. The five different stages
and their characteristics behaviour at each stage was presented in figure 3.7.
Stages in the evolution of CI
CI Level Characteristics Behaviour Patterns Level 1 - Pre-CI Interest in the concept has been triggered - by a crisis, by attendance at a seminar, by a visit to another organisation, etc. - but implementation is on an ad hoc basis
Problems are solved randomly; No formal efforts or structure for improving the organisation; Occasional bursts of improvement punctuated by inactivity and non-participation; Solutions tend to realise short-term benefits; No strategic impact on human resources, finance or other measurable targets; Staff and management are unaware of CI as a process
Level 2 - Structured CI There is formal commitment to building a system which will develop CI across the organisation
CI or an equivalent organisation improvement initiative has been introduced; Staff use structured problem solving processes; A high proportion of staff participate in CI activities; Staff has been trained in basic CI tools; Structured idea-management system is in place; Recognition system has been introduced; CI activities have not been integrated into day-to- day operations
Level 3 - Goal Oriented CI. There is a commitment to linking CI behaviour, established at ‘local’ level to the wider strategic concerns of the organisation
All the above plus: Formal deployment of Strategic Goals; Monitoring and measuring of CI against these goals; CI activities are part of main business activities; Focus includes cross-boundary and even cross -enterprise problem-solving
Level 4 - Proactive CI There is an attempt to devolve autonomy and to empower individuals and groups to manage and direct their own processes
All the above plus: CI responsibilities devolved to problem solving unit; High levels of experimentation
Level 5- Full CI Capability Approximates to a model ‘learning organisation’
All the above plus: Extensive and widely distributed learning behaviour Systematic finding and solving problems and capture and sharing of learning; Widespread, autonomous but controlled experimentation
Figure 3.7: Stages in the evolution of Continuous Improvement (Source: Bessant et al., 2001)
Chapter 3: Quality initiatives in SMEs
Maneesh Kumar 105
Understanding of firm own stand on CI as compared to other company can help them
to develop a plan to improve on their existing status and expand their own CI
capabilities. The review of most popular CI maturity models gave information on the
journey of an organization to excellence and how they can build an organizational
culture based on the facets of TQM. Summarising the key findings from the review of
different maturity models for CI or TQM implementation, indicates increasing maturity
of an organization through gradual progression in quality management practices and
behavioural dimensions linked to it. Maturity models provided a roadmap for an
organization to assess their weaknesses, highlight the issues which need urgent
attention, and aspire to advance to the next higher level in the CI maturity model
through addressing the identified gaps in their current practices. Organizations have
used the aforementioned models as guideline to embark on TQM journey or go
beyond that (Dale and Lascelles, 1997; Bessant et al, 2001).
Understanding and follow-up of maturity models may provide a true picture of the
firm’s performance and assess their readiness to move to the higher level of
excellence in their CI journey. Six Sigma implementation is the next stage to the total
quality journey. In Section 3.2.4, critical differences between TQM and Six Sigma were
discussed and reasons why organizations were embarking on Six Sigma.
Understanding the characteristics of Six Sigma organizations together with the
characteristics of each level of maturity models may help in assessing organizational
readiness to embark on Six Sigma, i.e. the presence of key ingredients within the
values and culture of organization to ensure successful implementation of Six Sigma.
Comprehending the characteristics underpinning different levels/stages of maturity
models may help SMEs to evaluate their own positioning in their journey to CI and
measures to implement for advancing to the next level in the maturity model. It is thus
important from SMEs perspective to assess their readiness for implementation of
initiatives like Six Sigma before starting actual implementation due to their limited
resources and skill-sets. Any wrong implementation or false start may affect their
existence in business or their commitment to the CI journey. This leads to the
surfacing of the final research questions of the doctoral dissertation.
RQ5: How to assess the readiness of a SME to embark on Six Sigma journey?
Chapter 3: Quality initiatives in SMEs
Maneesh Kumar 106
Next section included review of frameworks/ models proposed for implementation of
different quality initiatives, methods, or techniques within SMEs environment.
3.7.3. Background Research on quality frameworks for SMEs
Before the review process, it is imperative to understand the critical differences
between framework and model and what constitute a good framework. Next section
includes discussion on definition and characteristics of a framework.
3.7.3.1. What constitute a good framework?
Myriad of ‘framework’ and ‘models’ were proposed in the quality management
literature without first providing an operational definition to either of it. Researchers
have often used the two terminologies interchangeably in different contexts. Some
define framework or model through pictorial representation of diagrams, graphs, or
flowcharts, while other define it as a set of idea for one’s judgement.
Let us first have a better picture of how ‘framework’ has been defined in dictionary and
by other researchers. As defined by Cambridge Advanced Learner Dictionary (2005)
framework is “a supporting structure around which something can be built; a system of
rules, ideas or beliefs that is used to plan or decide something”. Chamber’s dictionary
(2003) defined framework as “the skeleton or outline of something”. Aalbregtse et al
(1991) defined framework in a context of getting started with TQM implementation as
being “a clear picture of the leadership goal for the organization and should present
key characteristics of the to-be style of business operations”.
A sound framework should first assess the current state of the organization, i.e. what
an organization does or trying to do, followed by analyzing the steps taken to do it in a
correct sequence (Struebing and Klaus, 1997). A transparent and explicit framework
should involve evaluating any new initiatives, proposals and recommendations with an
appraisal in terms of validity and completeness, then assigned some measure of
relative value or worth (Wilson et al, 1993). In the context of engineering and design,
Mathaisel (2005) considered a framework as a facilitator in the unification of several
disciplines in the change process to allow their combined use in the design process.
There is a higher chance of success in implementing a new framework if it is
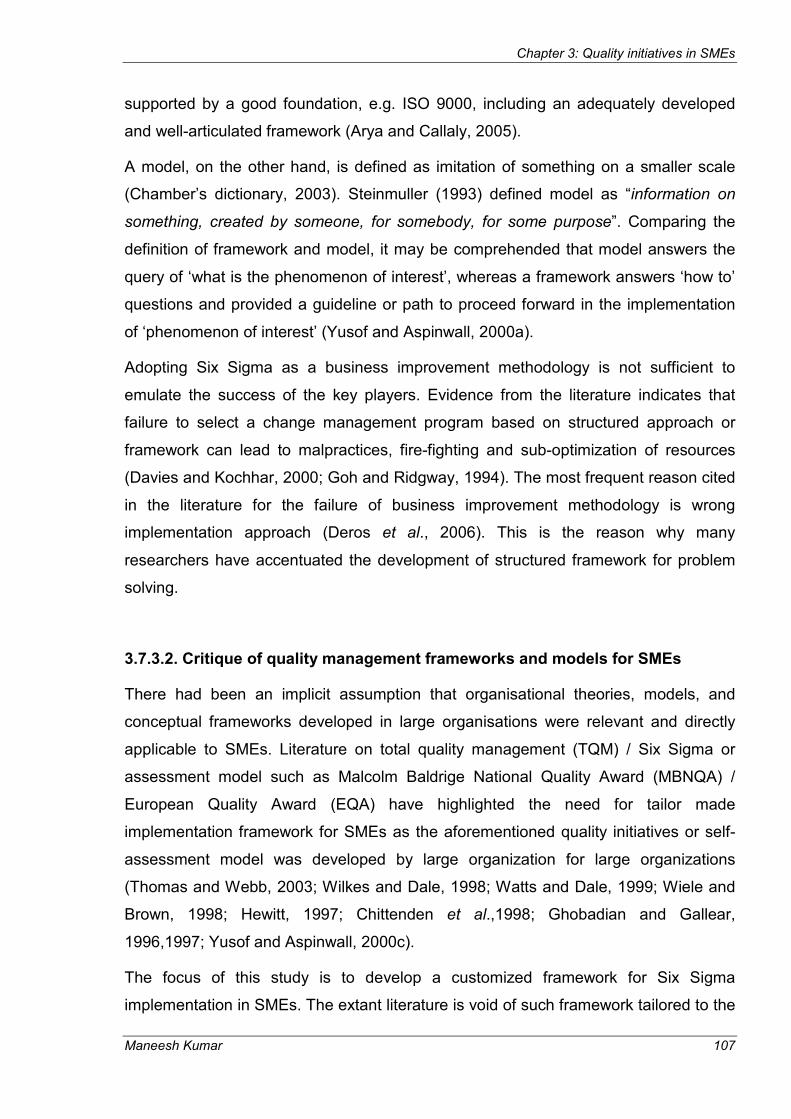
Chapter 3: Quality initiatives in SMEs
Maneesh Kumar 107
supported by a good foundation, e.g. ISO 9000, including an adequately developed
and well-articulated framework (Arya and Callaly, 2005).
A model, on the other hand, is defined as imitation of something on a smaller scale
(Chamber’s dictionary, 2003). Steinmuller (1993) defined model as “information on
something, created by someone, for somebody, for some purpose”. Comparing the
definition of framework and model, it may be comprehended that model answers the
query of ‘what is the phenomenon of interest’, whereas a framework answers ‘how to’
questions and provided a guideline or path to proceed forward in the implementation
of ‘phenomenon of interest’ (Yusof and Aspinwall, 2000a).
Adopting Six Sigma as a business improvement methodology is not sufficient to
emulate the success of the key players. Evidence from the literature indicates that
failure to select a change management program based on structured approach or
framework can lead to malpractices, fire-fighting and sub-optimization of resources
(Davies and Kochhar, 2000; Goh and Ridgway, 1994). The most frequent reason cited
in the literature for the failure of business improvement methodology is wrong
implementation approach (Deros et al., 2006). This is the reason why many
researchers have accentuated the development of structured framework for problem
solving.
3.7.3.2. Critique of quality management frameworks and models for SMEs
There had been an implicit assumption that organisational theories, models, and
conceptual frameworks developed in large organisations were relevant and directly
applicable to SMEs. Literature on total quality management (TQM) / Six Sigma or
assessment model such as Malcolm Baldrige National Quality Award (MBNQA) /
European Quality Award (EQA) have highlighted the need for tailor made
implementation framework for SMEs as the aforementioned quality initiatives or self-
assessment model was developed by large organization for large organizations
(Thomas and Webb, 2003; Wilkes and Dale, 1998; Watts and Dale, 1999; Wiele and
Brown, 1998; Hewitt, 1997; Chittenden et al.,1998; Ghobadian and Gallear,
1996,1997; Yusof and Aspinwall, 2000c).
The focus of this study is to develop a customized framework for Six Sigma
implementation in SMEs. The extant literature is void of such framework tailored to the

Chapter 3: Quality initiatives in SMEs
Maneesh Kumar 108
needs of SMEs. This led to the review of similar framework/models on other CI
initiatives such as TQM/Lean or self-assessment models/ quality management system
proposed for SMEs. The purpose of this section was to review commonly cited
models/frameworks for quality management application in SMEs to understand the
key constituents of the frameworks/models, its application in industry, and do a
critique of literature on quality frameworks/models for SMEs.
A step-by-step detailed approach to framework design can guide SMEs to successful
implementation of framework, involving their own employees rather than resorting to
external help. Researchers have used this prescriptive approach to develop TQM
frameworks for SMEs (Asher, 1992; Ghobadian and Gallear, 1997; Hansson and
Klefsjo, 2003; Ahmed et al., 2004). Asher (1992) four stages TQM implementation
framework for SMEs namely diagnostics, commitment, implementation, and review
were simple and easy for SMEs to comprehend. However, the applicability of
framework within SME context was questionable as it was based on the assumption
that data collection system to measure cost of quality and customer feedback system
in SMEs was already developed.
Ghobadian and Gallear (1997) proposed a 10 step framework for the implementation
of TQM in SMEs based on four case studies and critical review of literature. The
research findings showed that the basic concept of TQM is equally applicable in
SMEs, though the implementation method is different from large organization. The
inherent strength of SMEs provides them a vantage to apply TQM with considerable
success (Ghobadian and Gallear, 1996). Availability of resources was identified as a
major constraint in successful implementation of TQM, though this does not preclude
SMEs from TQM implementation. Management commitment, education and training,
effective communication, cross-functional teamwork, and employee empowerment
were identified as critical factors for TQM implementation.
The 10 step framework proposed by Ghobadian and Gallear (1997) provided a
sequential step-by-step approach for TQM implementation. However, authors have
missed to address the issue of resources availability to implement the framework in
SMEs, staggered TQM implementation in a pilot area against full blown
implementation, and rationale of implementing BS5750 in step 6 of the framework
rather than before TQM implementation.

Chapter 3: Quality initiatives in SMEs
Maneesh Kumar 109
The non-acceptance of EFQM model in SME environment led Watts and Dale (1999)
to develop a tailored made self-assessment model for SMEs. Self-assessment using
EFQM criteria was resource intensive, weighting of criteria not applicable to small
companies, difficult to understand and use for firms novice in self-assessment, and the
model does not provide solution to existing problems (Wilkes and Dale, 1998). The
proposed TPSBESS model seemed more flexible for SMEs as compared to original
EFQM model or revised EFQM model for SMEs (Wilkes and Dale, 1998). The revised
EFQM model for SMEs used simplified language, document reduced from 75 pages to
50 pages by dropping some sub-criteria from the 9 categories of the model (Wilkes
and Dale, 1998). There was no changes suggested in the scoring of each criteria
tailored to the needs and priority of SMEs. Based on the response of 7 case study
firms, it was realised that model is still resource intensive (in terms of personnel and
time), language used in the model still not clear to understand for SMEs and not user
friendly from SMEs perspective.
Similar study was conducted by McAdam (2000), who questioned the efficacy and
application of business excellence model (BEM) and balanced scorecard (BS) within
SMEs context. The BS and BEM required diverse skill sets for effective
implementation, which was not readily present in SME (McAdam, 2000; Ghobadian
and Gallear, 1996, 1997). These models were based on implicit assumptions of
resource availability as it was developed in large organizations (Wiele and Brown,
1998). It was also assumed that leaders and managers will be able to dedicate
considerable time in implementing the models, which is not the case in SME. The
leaders and managers, apart from time constraint, may not have sufficient knowledge
and expertise to understand and apply the complex models (Lin, 1999). SMEs are
forced to use these models, consuming their scarce resources (Ghobadian and
Gallear, 1996) and add bureaucracy (Lin, 1999; McAdam, 2000) to their inherent
flexible structure. Chittenden et al (1998) was in consensus with the aforementioned
statement stating – “these models are designed by big business for big business”.
Yusof and Aspinwall (2000c) proposed a conceptual framework, tailored to the needs
of SMEs implementing TQM, consisting of three main elements of the “quality
initiatives”, “general methodology”, and the “”central co-ordinating body”, as shown in
figure 3.8. Researchers conducted survey in the UK automotive SMEs followed by
case studies in four firms to develop a conceptual framework. The framework included
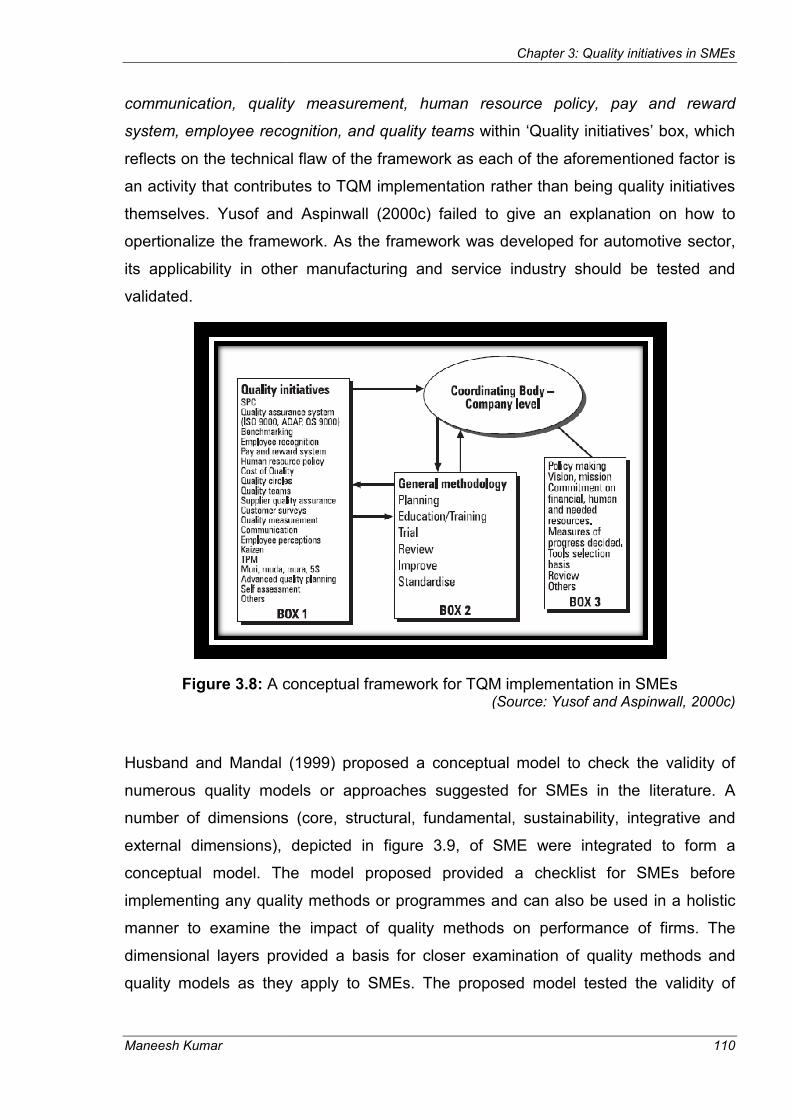
Maneesh Kumar
communication, quality measurement, human resource policy, pay and reward
system, employee recogni
reflects on the technical flaw of the framework as each of the aforementioned factor is
an activity that contributes to TQM implementation rather than being quality initiatives
themselves. Yusof and Aspinwall (2000c) failed to give an explanation on how to
opertionalize the framework. As the framework was developed for automotive sector,
its applicability in other manufacturing and service industry should be tested and
validated.
Figure 3.8: A conceptual framework for TQM implementation in SMEs
Husband and Mandal (1999) proposed a conceptual model to check the validity of
numerous quality models or approaches suggested for SMEs in the literature. A
number of dimensions (core, structural, fundamental, sustainability, integrative and
external dimensions), depicted in figure 3.9, of SME were integrated to form a
conceptual model. The model proposed provided a checklist for SMEs before
implementing any quality
manner to examine the impact of quality methods on performance of firms. The
dimensional layers provided a basis for closer examination of quality methods and
quality models as they apply to SMEs. T
Chapter 3: Quality initiatives in SMEs
communication, quality measurement, human resource policy, pay and reward
system, employee recognition, and quality teams within ‘Quality initiatives’ box, which
reflects on the technical flaw of the framework as each of the aforementioned factor is
an activity that contributes to TQM implementation rather than being quality initiatives
of and Aspinwall (2000c) failed to give an explanation on how to
opertionalize the framework. As the framework was developed for automotive sector,
its applicability in other manufacturing and service industry should be tested and
A conceptual framework for TQM implementation in SMEs(Source: Yusof and Aspinwall, 2000c)
Husband and Mandal (1999) proposed a conceptual model to check the validity of
numerous quality models or approaches suggested for SMEs in the literature. A
of dimensions (core, structural, fundamental, sustainability, integrative and
external dimensions), depicted in figure 3.9, of SME were integrated to form a
conceptual model. The model proposed provided a checklist for SMEs before
implementing any quality methods or programmes and can also be used in a holistic
manner to examine the impact of quality methods on performance of firms. The
dimensional layers provided a basis for closer examination of quality methods and
quality models as they apply to SMEs. The proposed model tested the validity of
Chapter 3: Quality initiatives in SMEs
110
communication, quality measurement, human resource policy, pay and reward
within ‘Quality initiatives’ box, which
reflects on the technical flaw of the framework as each of the aforementioned factor is
an activity that contributes to TQM implementation rather than being quality initiatives
of and Aspinwall (2000c) failed to give an explanation on how to
opertionalize the framework. As the framework was developed for automotive sector,
its applicability in other manufacturing and service industry should be tested and
A conceptual framework for TQM implementation in SMEs (Source: Yusof and Aspinwall, 2000c)
Husband and Mandal (1999) proposed a conceptual model to check the validity of
numerous quality models or approaches suggested for SMEs in the literature. A
of dimensions (core, structural, fundamental, sustainability, integrative and
external dimensions), depicted in figure 3.9, of SME were integrated to form a
conceptual model. The model proposed provided a checklist for SMEs before
methods or programmes and can also be used in a holistic
manner to examine the impact of quality methods on performance of firms. The
dimensional layers provided a basis for closer examination of quality methods and
he proposed model tested the validity of
Chapter 3: Quality initiatives in SMEs
Maneesh Kumar 111
quality methods and drew meaningful interpretations on the applicability of model to
be used by SMEs and its stakeholders.
Figure 3.9: Quality Integrated management model (Source: Husband and Mandal, 1999)
Similarly, a classification matrix was proposed by Biazzo and Bernardi (2003) for
SMEs to differentiate between different self-assessment models. The quality
integrated management model could be used to perform benchmarking and best
practice studies (Husband and Mandal, 1999), while the classification matrix (Biazzo
and Bernardi, 2003) may be used to question the meaning and substance of self-
assessment model from SMEs perspective.
Taking cue from the work of Husband and Mandal (1999), Thomas and Webb (2003)
proposed a SMEs specific framework consisting three stages of problem identification,
problem solution, and systems development, as shown in figure 3.10. The framework
was used to develop quality systems model consisting of foundation elements (SMEs
factors and dimensions, training and development, project management) integrated
with the working mechanisms of the model. The framework focused more on the
operational issues and application of statistical methods with limited discussion on
strategic issues of management commitment, resource availability to apply the
framework. Limited discussion by researchers on how to make the framework
operational taking into consideration the resources constraints faced by SMEs.

Maneesh Kumar
Figure 3.10: A conceptual framework for Quali
Hansson and Klefsjo (2003), through a multiple case study of TQM in Sweden Small
organizations, presented a core value model that incorporated three different partly
overlapping phases starting
customer orientation, and followed by process focus, fact based decisions, and
continuous improvements. The case study of nine organizations revealed that the
aforementioned core values are permeating the
start with TQM implementation. The study also confirmed the ideas of Hellsten and
Klefsjo (2000) to have suitable tools and techniques to support the core values for
establishing quality culture. The empirical finding
that hopefully will facilitate the understanding of small organizations implementation of
TQM.
Chapter 3: Quality initiatives in SMEs
A conceptual framework for Quality model development for SMEs (Source: Thomas and Webb, 2003)
Hansson and Klefsjo (2003), through a multiple case study of TQM in Sweden Small
organizations, presented a core value model that incorporated three different partly
overlapping phases starting with committed leadership, everybody’s commitment,
customer orientation, and followed by process focus, fact based decisions, and
continuous improvements. The case study of nine organizations revealed that the
aforementioned core values are permeating their organizations and they are ready to
start with TQM implementation. The study also confirmed the ideas of Hellsten and
Klefsjo (2000) to have suitable tools and techniques to support the core values for
establishing quality culture. The empirical findings created a knowledge foundation
that hopefully will facilitate the understanding of small organizations implementation of
Chapter 3: Quality initiatives in SMEs
112
ty model development for SMEs (Source: Thomas and Webb, 2003)
Hansson and Klefsjo (2003), through a multiple case study of TQM in Sweden Small
organizations, presented a core value model that incorporated three different partly
with committed leadership, everybody’s commitment,
customer orientation, and followed by process focus, fact based decisions, and
continuous improvements. The case study of nine organizations revealed that the
ir organizations and they are ready to
start with TQM implementation. The study also confirmed the ideas of Hellsten and
Klefsjo (2000) to have suitable tools and techniques to support the core values for
s created a knowledge foundation
that hopefully will facilitate the understanding of small organizations implementation of

Maneesh Kumar
Deros et al (2006) proposed a conceptual benchmarking framework based on
literature review and tested the framework in six pilot
companies. The framework, as shown in figure 3.11, was motivated from the work of
Yusof and Aspinwall (2000c) and consists of more elements than the later. Leadership
and top management commitment was considered as prerequisite to
benchmarking journey. The concepts within the framework were advised to be used
one-at-a-time depending upon the needs and resource availability of SMEs. It is easier
to start with hard performance measures to see the immediate benefits before
focusing on soft performance measures.
Figure 3.11: Framework for benchmarking implementation in SMEs
Researchers also proposed model/framework for the effective implementation of
quality techniques or methods such as JIT /5S
2000), DoE (Thomas and Webb, 2009), and TPM (Ahmed
aforementioned framework and models focused more on resolving shop
operational problems using quality tools and techniques. Such models we
integrated at the strategic level of firms. It was identified that SMEs had limited
understanding and usage of quality tools and techniques (Ahmed
Chapter 3: Quality initiatives in SMEs
(2006) proposed a conceptual benchmarking framework based on
literature review and tested the framework in six pilot automotive manufacturing
companies. The framework, as shown in figure 3.11, was motivated from the work of
Yusof and Aspinwall (2000c) and consists of more elements than the later. Leadership
and top management commitment was considered as prerequisite to
benchmarking journey. The concepts within the framework were advised to be used
time depending upon the needs and resource availability of SMEs. It is easier
to start with hard performance measures to see the immediate benefits before
ocusing on soft performance measures.
Framework for benchmarking implementation in SMEs(Source: Deros et al., 2006)
Researchers also proposed model/framework for the effective implementation of
quality techniques or methods such as JIT /5S practice/ Kanban (Gunasekaran
2000), DoE (Thomas and Webb, 2009), and TPM (Ahmed
aforementioned framework and models focused more on resolving shop
operational problems using quality tools and techniques. Such models we
integrated at the strategic level of firms. It was identified that SMEs had limited
understanding and usage of quality tools and techniques (Ahmed
Chapter 3: Quality initiatives in SMEs
113
(2006) proposed a conceptual benchmarking framework based on
automotive manufacturing
companies. The framework, as shown in figure 3.11, was motivated from the work of
Yusof and Aspinwall (2000c) and consists of more elements than the later. Leadership
and top management commitment was considered as prerequisite to embark on
benchmarking journey. The concepts within the framework were advised to be used
time depending upon the needs and resource availability of SMEs. It is easier
to start with hard performance measures to see the immediate benefits before
Framework for benchmarking implementation in SMEs (Source: Deros et al., 2006)
Researchers also proposed model/framework for the effective implementation of
anban (Gunasekaran et al.,
2000), DoE (Thomas and Webb, 2009), and TPM (Ahmed et al., 2004). The
aforementioned framework and models focused more on resolving shop-floor or
operational problems using quality tools and techniques. Such models were not
integrated at the strategic level of firms. It was identified that SMEs had limited
understanding and usage of quality tools and techniques (Ahmed et al., 2004). Similar
Chapter 3: Quality initiatives in SMEs
Maneesh Kumar 114
findings were reported in literature on the limited understanding and use of statistical
tools and techniques to benchmark or identify the state of process control within SME
business environment (Thomas and Webb, 2003; Deleryd et al., 1999; Sousa et al.,
2005, 2006).
SMEs within construction industry have slowly started embracing the concept of TQM
or quality management system to structure their systems and procedures and improve
the performance of the firm (Mackau, 2003; Chileshe, 2007). Mackau (2003)
integrated different management systems (ISO 9001 for quality, ISO 14001 for
environment, and Safety Checklist Contractors (SCC) for occupational health and
safety) to develop a new concept suitable for SMEs called integrated management
system (IMS) for construction SMEs. The IMS model enhanced the motivation and
eagerness of both CEO and employees during all phases of the project. Furthermore,
the opinion of employees showed that the certification of the IMS worked as a
motivator throughout the course of the project. Chileshe (2007) reported similar result
when investigating the relationship between critical success factors and TQM
implementation. It was observed that construction firm implementing TQM had CSFs
ingrained within organizational culture as compared to non-TQM firms. Both the
proposed model lacked instruction on how to operationalize the models. IMS seemed
more complex model from SMEs perspective as it integrated three different systems
that may demand more time to understand, follow and apply for certification.
Khan et al (2007) developed a business process improvement (BPI) framework and
performance assessment methodology (PAM) tool for UK SMEs to facilitate their
gradual progression to world class manufacturing (WCM) status through continuous
improvement and structured training. Researchers accentuated on the role of kaizen
implementation in smaller companies as it involve minimal costs and resources and
can lead to improved efficiencies and profitability in short-time (Kumar and Harms,
2004; Kinni, 1995). Kaizen can be a pre-cursor to implement initiatives like TQM
(Khan et al., 2007) in SMEs as it creates a culture of CI that allows creativity and ideas
to flourish among employees, and encourages employees to take decision in a team
environment (McAdam et al., 2000). Due to scarce resources in SMEs, Kaizen is the
tailor made methodology to make incremental improvement at minimal costs in SMEs
(Kinni, 1995). Influenced from EFQM model and PDCA cycle, Khan et al (2007)
developed a BPI framework constituting six elements namely- vision, collate and

Maneesh Kumar
measure, define and plan BPI
and support), management awareness, training and education on Kaizen, and check
the progress, shown in figure 3.12.
To assess SMEs performance, PAM tool was proposed to identify the gap between
company’s current performance against WCM concepts and best practices. The
framework developed is simple, easy to use for SMEs, and take into account
resources constraint faced by SMEs. Initiatives like Kaizen could be used for quick
wins to gain management and employ
like TQM, Lean or Six Sigma.
A table summarising the key features, methodology used in designing the
framework/models, and their limitations
note that majority of the frameworks/models proposed were designed based on
research work in UK SMEs followed by European countries such as Germany,
Chapter 3: Quality initiatives in SMEs
measure, define and plan BPI (supported by management commitment, education,
and support), management awareness, training and education on Kaizen, and check
the progress, shown in figure 3.12.
To assess SMEs performance, PAM tool was proposed to identify the gap between
rrent performance against WCM concepts and best practices. The
framework developed is simple, easy to use for SMEs, and take into account
resources constraint faced by SMEs. Initiatives like Kaizen could be used for quick
wins to gain management and employees confidence before embarking on initiatives
like TQM, Lean or Six Sigma.
Figure 3.12: BPI framework for SMEs (Source: Khan et al., 2007)
A table summarising the key features, methodology used in designing the
framework/models, and their limitations were cited in table 3.6. It was interesting to
note that majority of the frameworks/models proposed were designed based on
research work in UK SMEs followed by European countries such as Germany,
Chapter 3: Quality initiatives in SMEs
115
(supported by management commitment, education,
and support), management awareness, training and education on Kaizen, and check
To assess SMEs performance, PAM tool was proposed to identify the gap between
rrent performance against WCM concepts and best practices. The
framework developed is simple, easy to use for SMEs, and take into account
resources constraint faced by SMEs. Initiatives like Kaizen could be used for quick
ees confidence before embarking on initiatives
(Source: Khan et al., 2007)
A table summarising the key features, methodology used in designing the
were cited in table 3.6. It was interesting to
note that majority of the frameworks/models proposed were designed based on
research work in UK SMEs followed by European countries such as Germany,

Chapter 3: Quality initiatives in SMEs
Maneesh Kumar 116
Sweden, and Italy. There was no framework or model (within the literature reviewed
by author) proposed by taking into consideration USA SMEs, though a lot of empirical
research using survey and case study had been conducted on USA SMEs.
The key findings from the review of frameworks/models were presented below
� Few frameworks proposed were developed on the assumption of data
availability , customer feedback system, and strong leadership commitment,
which is not the case in many SMEs
� Majority of researchers have proposed models, influenced from EFQM or
PDCA cycle that gives information on the key constituents or critical factors of
the quality initiatives (addresses ‘What’ part or focus from systems
perspective). However, SMEs need a systematic guideline or step-by-step
framework (focus on ‘How to’ part) to facilitate successful implementation of
initiatives like TQM, Lean, Six Sigma. Only six out of seventeen frameworks
reviewed had a step-by-step structure and rest 11 was based on systems
based structure
� Very limited models/frameworks proposed on TQM/ Lean/ Six Sigma
implementation in SMEs as compared to that for large organizations in quality
management literature
� Most of the frameworks/models presented ignored the discussion on how
SMEs with their limited resources can operationalize the frameworks/models
� Understanding of history of quality initiatives in the firm, their success rate, and
leadership commitment and support in the past were not taken into
consideration while designing the implementation frameworks/models for
SMEs. Aforementioned issues will help to assess SMEs readiness to embark
on any new initiatives like TQM, Lean or Six Sigma. Very few researchers
questioned the readiness of an organization to implement initiative like Six
Sigma. If the organization is not ready culturally, any change initiatives will fail
drastically.
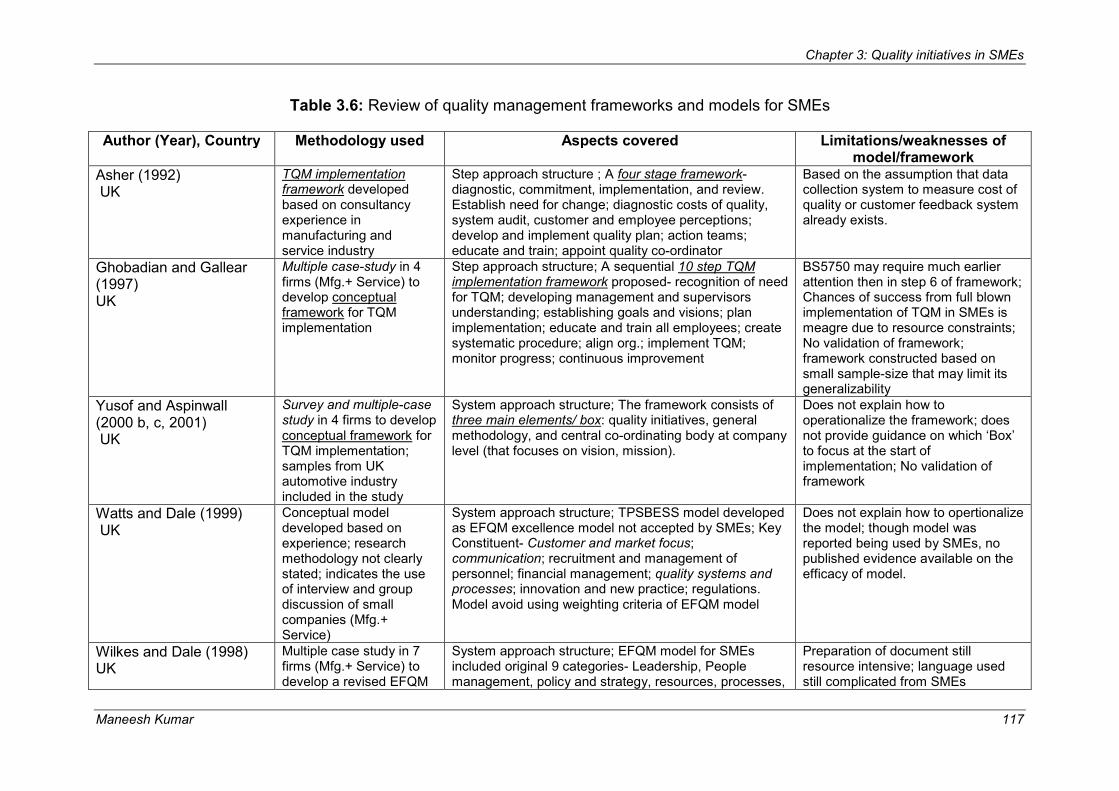
Chapter 3: Quality initiatives in SMEs
Maneesh Kumar 117
Table 3.6: Review of quality management frameworks and models for SMEs
Author (Year), Country Methodology used Aspects covered Limitations/weaknesses of model/framework
Asher (1992) UK
TQM implementation framework developed based on consultancy experience in manufacturing and service industry
Step approach structure ; A four stage framework- diagnostic, commitment, implementation, and review. Establish need for change; diagnostic costs of quality, system audit, customer and employee perceptions; develop and implement quality plan; action teams; educate and train; appoint quality co-ordinator
Based on the assumption that data collection system to measure cost of quality or customer feedback system already exists.
Ghobadian and Gallear (1997) UK
Multiple case-study in 4 firms (Mfg.+ Service) to develop conceptual framework for TQM implementation
Step approach structure; A sequential 10 step TQM implementation framework proposed- recognition of need for TQM; developing management and supervisors understanding; establishing goals and visions; plan implementation; educate and train all employees; create systematic procedure; align org.; implement TQM; monitor progress; continuous improvement
BS5750 may require much earlier attention then in step 6 of framework; Chances of success from full blown implementation of TQM in SMEs is meagre due to resource constraints; No validation of framework; framework constructed based on small sample-size that may limit its generalizability
Yusof and Aspinwall (2000 b, c, 2001) UK
Survey and multiple-case study in 4 firms to develop conceptual framework for TQM implementation; samples from UK automotive industry included in the study
System approach structure; The framework consists of three main elements/ box: quality initiatives, general methodology, and central co-ordinating body at company level (that focuses on vision, mission).
Does not explain how to operationalize the framework; does not provide guidance on which ‘Box’ to focus at the start of implementation; No validation of framework
Watts and Dale (1999) UK
Conceptual model developed based on experience; research methodology not clearly stated; indicates the use of interview and group discussion of small companies (Mfg.+ Service)
System approach structure; TPSBESS model developed as EFQM excellence model not accepted by SMEs; Key Constituent- Customer and market focus; communication; recruitment and management of personnel; financial management; quality systems and processes; innovation and new practice; regulations. Model avoid using weighting criteria of EFQM model
Does not explain how to opertionalize the model; though model was reported being used by SMEs, no published evidence available on the efficacy of model.
Wilkes and Dale (1998) UK
Multiple case study in 7 firms (Mfg.+ Service) to develop a revised EFQM
System approach structure; EFQM model for SMEs included original 9 categories- Leadership, People management, policy and strategy, resources, processes,
Preparation of document still resource intensive; language used still complicated from SMEs
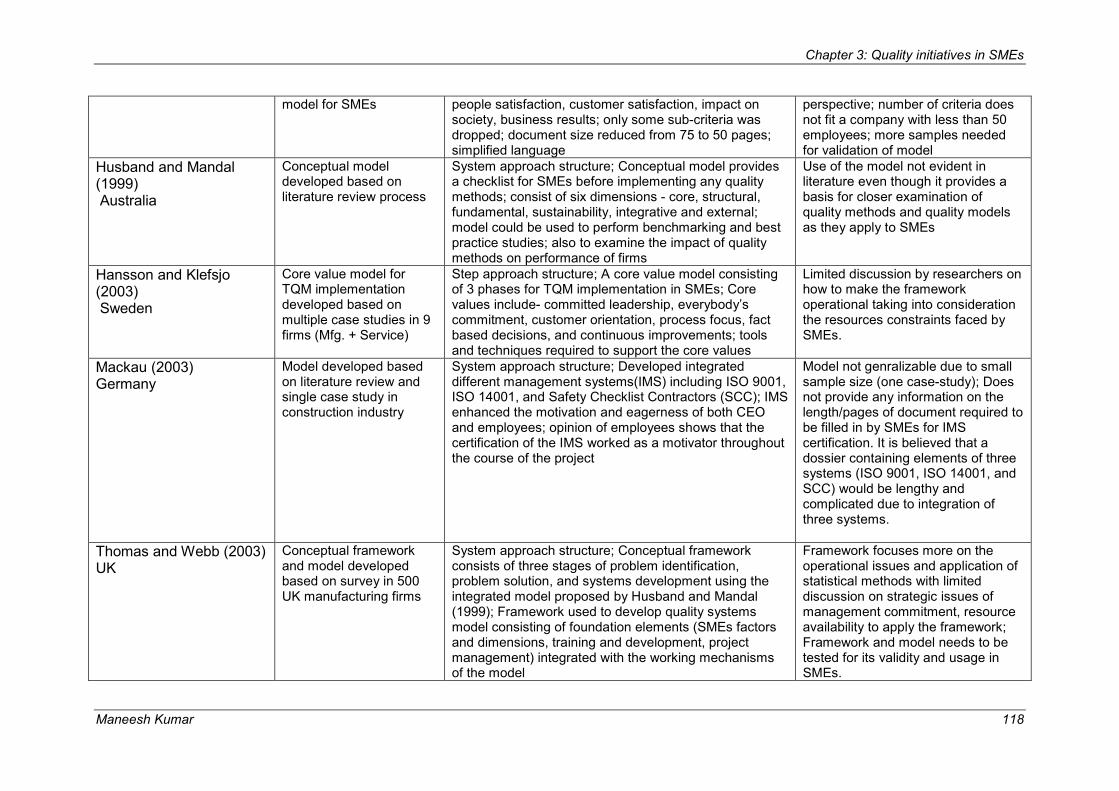
Chapter 3: Quality initiatives in SMEs
Maneesh Kumar 118
model for SMEs people satisfaction, customer satisfaction, impact on society, business results; only some sub-criteria was dropped; document size reduced from 75 to 50 pages; simplified language
perspective; number of criteria does not fit a company with less than 50 employees; more samples needed for validation of model
Husband and Mandal (1999) Australia
Conceptual model developed based on literature review process
System approach structure; Conceptual model provides a checklist for SMEs before implementing any quality methods; consist of six dimensions - core, structural, fundamental, sustainability, integrative and external; model could be used to perform benchmarking and best practice studies; also to examine the impact of quality methods on performance of firms
Use of the model not evident in literature even though it provides a basis for closer examination of quality methods and quality models as they apply to SMEs
Hansson and Klefsjo (2003) Sweden
Core value model for TQM implementation developed based on multiple case studies in 9 firms (Mfg. + Service)
Step approach structure; A core value model consisting of 3 phases for TQM implementation in SMEs; Core values include- committed leadership, everybody’s commitment, customer orientation, process focus, fact based decisions, and continuous improvements; tools and techniques required to support the core values
Limited discussion by researchers on how to make the framework operational taking into consideration the resources constraints faced by SMEs.
Mackau (2003) Germany
Model developed based on literature review and single case study in construction industry
System approach structure; Developed integrated different management systems(IMS) including ISO 9001, ISO 14001, and Safety Checklist Contractors (SCC); IMS enhanced the motivation and eagerness of both CEO and employees; opinion of employees shows that the certification of the IMS worked as a motivator throughout the course of the project
Model not genralizable due to small sample size (one case-study); Does not provide any information on the length/pages of document required to be filled in by SMEs for IMS certification. It is believed that a dossier containing elements of three systems (ISO 9001, ISO 14001, and SCC) would be lengthy and complicated due to integration of three systems.
Thomas and Webb (2003) UK
Conceptual framework and model developed based on survey in 500 UK manufacturing firms
System approach structure; Conceptual framework consists of three stages of problem identification, problem solution, and systems development using the integrated model proposed by Husband and Mandal (1999); Framework used to develop quality systems model consisting of foundation elements (SMEs factors and dimensions, training and development, project management) integrated with the working mechanisms of the model
Framework focuses more on the operational issues and application of statistical methods with limited discussion on strategic issues of management commitment, resource availability to apply the framework; Framework and model needs to be tested for its validity and usage in SMEs.
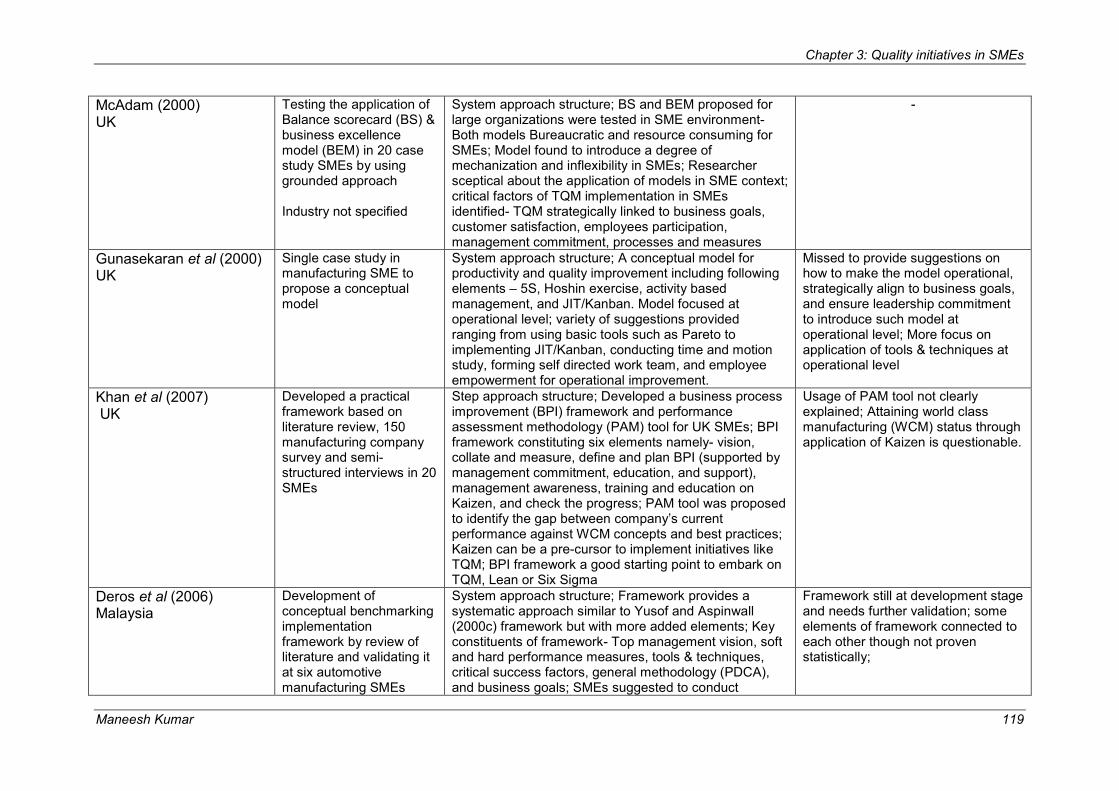
Chapter 3: Quality initiatives in SMEs
Maneesh Kumar 119
McAdam (2000) UK
Testing the application of Balance scorecard (BS) & business excellence model (BEM) in 20 case study SMEs by using grounded approach Industry not specified
System approach structure; BS and BEM proposed for large organizations were tested in SME environment- Both models Bureaucratic and resource consuming for SMEs; Model found to introduce a degree of mechanization and inflexibility in SMEs; Researcher sceptical about the application of models in SME context; critical factors of TQM implementation in SMEs identified- TQM strategically linked to business goals, customer satisfaction, employees participation, management commitment, processes and measures
-
Gunasekaran et al (2000) UK
Single case study in manufacturing SME to propose a conceptual model
System approach structure; A conceptual model for productivity and quality improvement including following elements – 5S, Hoshin exercise, activity based management, and JIT/Kanban. Model focused at operational level; variety of suggestions provided ranging from using basic tools such as Pareto to implementing JIT/Kanban, conducting time and motion study, forming self directed work team, and employee empowerment for operational improvement.
Missed to provide suggestions on how to make the model operational, strategically align to business goals, and ensure leadership commitment to introduce such model at operational level; More focus on application of tools & techniques at operational level
Khan et al (2007) UK
Developed a practical framework based on literature review, 150 manufacturing company survey and semi-structured interviews in 20 SMEs
Step approach structure; Developed a business process improvement (BPI) framework and performance assessment methodology (PAM) tool for UK SMEs; BPI framework constituting six elements namely- vision, collate and measure, define and plan BPI (supported by management commitment, education, and support), management awareness, training and education on Kaizen, and check the progress; PAM tool was proposed to identify the gap between company’s current performance against WCM concepts and best practices; Kaizen can be a pre-cursor to implement initiatives like TQM; BPI framework a good starting point to embark on TQM, Lean or Six Sigma
Usage of PAM tool not clearly explained; Attaining world class manufacturing (WCM) status through application of Kaizen is questionable.
Deros et al (2006) Malaysia
Development of conceptual benchmarking implementation framework by review of literature and validating it at six automotive manufacturing SMEs
System approach structure; Framework provides a systematic approach similar to Yusof and Aspinwall (2000c) framework but with more added elements; Key constituents of framework- Top management vision, soft and hard performance measures, tools & techniques, critical success factors, general methodology (PDCA), and business goals; SMEs suggested to conduct
Framework still at development stage and needs further validation; some elements of framework connected to each other though not proven statistically;

Chapter 3: Quality initiatives in SMEs
Maneesh Kumar 120
benchmarking on tangible measures in the start of implementation
Chileshe (2007) UK
Development of conceptual framework by surveying 63 construction SMEs in UK
System approach structure; The systematic framework for understanding of TQM incorporate- CI constructs &concepts, practices such as process management, and tools, techniques & values such as SPC; understanding & application of TQM concepts relatively new in construction industry; critical differences observed in implementation of CSFs between TQM and non-TQM organizations
No guidelines on how to operationalize the framework; still in development stage with limited application till date
Biazzo and Bernardi (2003) Italy
Development of classification and conceptual map based on literature review
System approach structure; A classification matrix was constructed to differentiate between self assessment approaches of paradigmatic , normative, situational, normative-situational and open; map will facilitate SMEs to questions the meaning and substance of self assessment model; 5 levels of self-assessment map proposed
Application is not yet evidenced in literature; complex model; Jargon used may confuse SMEs
Ahmed et al (2004) Malaysia
Development of TPM/TQM implementation methodology based on completed survey response from 63 manufacturing firms
Step approach structure; 11 steps framework for TPM implementation; Key elements of framework included- understanding of needs of TPM, setting goals, team formation, training, processing data & information, long-term plan, and CI; SMEs lacked understanding and relationship between equipment maintenance and organizational performance; limited use of basic tools of quality for problem solving
Framework needs to be tested and validated for practical usage; framework was focused more at operational level and strategic issues such as leadership and management commitment, rolling out initiative on pilot basis or across organization was not included in discussion
Thomas et al (2008) UK
Integrated Lean Six Sigma framework based on previous model proposed by Thomas and Barton (2007). Model tested in one Mfg. SME
Step approach structure; Step by step approach to Lean Six Sigma application in SME; Focused on application of tools & techniques from the start of model implementation such as 5S, value stream mapping, DOE, ANOVA to name a few; Focus on resolving problems at operational level by applying lean tools within Six Sigma DMAIC methodology
Lacks strategic focus; Model is applicable at operational level to resolve chronic problems; It is not an implementation strategy that could be deployed across organization.
Note: In this table, no frameworks were included that was proposed only for large organizations or for both large firms & SMEs due to critical
differences in characteristics of two groups; the framework/model being resource intensive & less applicable from SMEs perspective
Chapter 3: Quality initiatives in SMEs
Maneesh Kumar 121
• The important role of networking, especially with government bodies and
academic institution, in supporting the CI efforts of SMEs were not addressed in
majority of the frameworks/models.
• Few models focused on the application of tools & techniques of CI at
operational level with little focus on integration with strategic objectives of the
business. The efficacy of such models are questionable as it is softer issues
such as leadership, management commitment, cultural change that impacts the
success of any initiative rather than focusing on statistical methods or tools &
techniques. More focus should be on softer issues at the implementation stage,
thereafter hard issues such as statistics can be used for problem solving
• There was very limited discussion on how to sustain the benefits from
implementation of initiatives like TQM or Lean and facilitate SMEs to become
more resilient.
3.8. Summary
This chapter provided a brief introduction to Six Sigma, its characteristics, the DMAIC
methodology, benefits from implementation, and comparison with other CI initiatives
like TQM and Lean. The literature review identified the decline in TQM implementation
and increasing application of Six Sigma for business process improvement in
organizations. The review also indicated that Lean and Six Sigma are complementary
to each other, though it is a good idea to implement Lean first before embarking on Six
Sigma journey. The myths of Six Sigma were briefly presented followed by detailed
discussion on one of the common myths of Six Sigma, i.e. Six Sigma can be only
implemented in large organizations. The scant literature on Six Sigma in SMEs did
indicated the success of Six Sigma in SMEs context, though majority of the literature
was based on practical experience of researchers with little focus on theoretical
underpinning. This led the author to review extant literature on CI initiatives or
certification systems like ISO within the SME context.
The literature indicated difference in quality management practices in SMEs
implementing TQM and non-adopter of TQM initiatives. It was also indicated from the
literature that ISO may be the foundation to embark on the journey of TQM or Lean.
The review of literature reported mixed results (both positive and negative result) in

Chapter 3: Quality initiatives in SMEs
Maneesh Kumar 122
SMEs due to TQM implementation. Literature was devoid of any discussion on how a
SME would know their preparedness for moving to next level in their CI journey. It was
also reported that majority of existing frameworks and models failed to take into
account the constraints faced by SMEs while implementing QI in their respective firms.
The identification of gaps in literature on CI or certification systems in SMEs led to the
emergence of four research questions to be addressed in this doctoral research:
RQ2: What are the critical differences in quality management practices of Six Sigma
and non-Six Sigma SMEs?
RQ3: What are the critical success factors and barriers to implementation of Six
Sigma in SMEs?
RQ4: Does the performance of Six Sigma firms differ from non-Six Sigma firms?
RQ5: How to assess the readiness of a SME to embark on Six Sigma journey?
The next two chapters discussed the research paradigms and methods used to
answer the aforementioned RQs.

Chapter 4: Research Paradigms
Maneesh Kumar 123
Chapter 4
Research Paradigms
4.0. Introduction
The relationship between data and theory is an issue that has been hotly debated by
philosophers for many centuries. Failure to think through philosophical issues can
seriously affect the quality of management research, as they are central to the notion
of research design (Easterby-Smith et al., 2002). The understanding of philosophical
issues can help the researchers: to clarify the research design i.e. not only looking at
the evidence gathering and its interpretation, but also having the ability to answer the
basic questions being investigated in the research; to choose an appropriate design
for their work; and to identify and create designs that may be outside their past
experience (Saunders et al., 2007). This chapter gives an introduction to the research
process, followed by discussion on research purpose, research paradigm, and
research approach. This chapter is an important part of the thesis as it helps to decide
the correct choices of research paradigm based on the rationalization of research
needs.
4.1. The Research Process
Similar to manufacturing or service industry, where there is a list of activities that
comprises a process, research is often thought of as a process, i.e. a set of activities
unfolding over time (Ghauri and Grønhaug, 2002; Ates, 2008). The starting point of
research, as shown in figure 4.1, is to select the topic / phenomenon to be studied that
may be of researcher’s own interest or of the public/ organization’s interest or affecting
the government rules and regulations. A research topic is different from a research
problem – the former is broader and more general whereas a research problem is
more specific to the research context. The research purpose and questions were
discussed in Chapter 1. A brief introduction to research questions is included in the
next section to link it to the research paradigm, discussed in this chapter and to
research design discussed in Chapter 5.
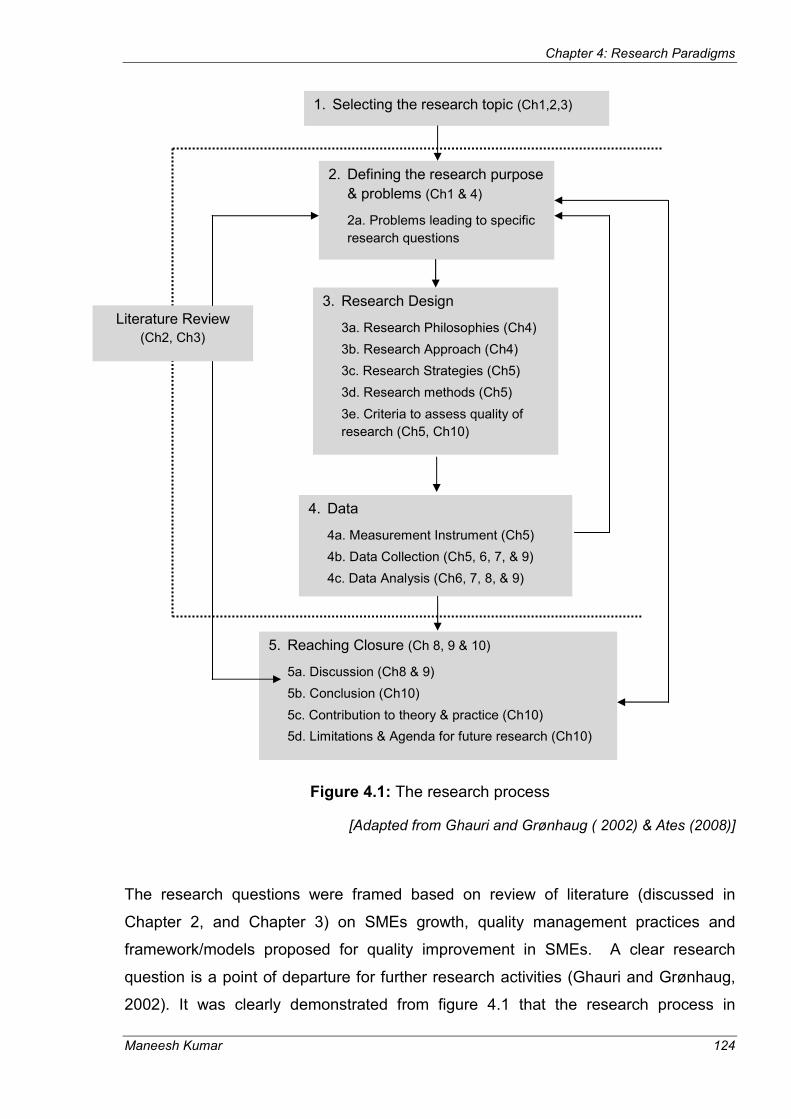
Chapter 4: Research Paradigms
Maneesh Kumar 124
Figure 4.1: The research process
[Adapted from Ghauri and Grønhaug ( 2002) & Ates (2008)]
The research questions were framed based on review of literature (discussed in
Chapter 2, and Chapter 3) on SMEs growth, quality management practices and
framework/models proposed for quality improvement in SMEs. A clear research
question is a point of departure for further research activities (Ghauri and Grønhaug,
2002). It was clearly demonstrated from figure 4.1 that the research process in
1. Selecting the research topic (Ch1,2,3)
2. Defining the research purpose
& problems (Ch1 & 4)
2a. Problems leading to specific
research questions
3. Research Design
3a. Research Philosophies (Ch4)
3b. Research Approach (Ch4)
3c. Research Strategies (Ch5)
3d. Research methods (Ch5)
3e. Criteria to assess quality of
research (Ch5, Ch10)
4. Data
4a. Measurement Instrument (Ch5)
4b. Data Collection (Ch5, 6, 7, & 9)
4c. Data Analysis (Ch6, 7, 8, & 9)
5. Reaching Closure (Ch 8, 9 & 10)
5a. Discussion (Ch8 & 9)
5b. Conclusion (Ch10)
5c. Contribution to theory & practice (Ch10)
5d. Limitations & Agenda for future research (Ch10)
Literature Review
(Ch2, Ch3)
Chapter 4: Research Paradigms
Maneesh Kumar 125
management studies was not much different from practical problem solving. It was
based on a series of activities, as shown in figure 4.1 that facilitate the construction of
new theory or test existing theory.
4.2. Research purpose and questions
Rowlands (2005) emphasized that the starting point in any research project is to
understand the nature of the research problem that leads to the choice of an
appropriate methodology. The researcher should be clear in his/her intent to conduct
the research, i.e. its purpose. The statement of purpose conveys to the researcher
what the result of the research was likely to accomplish (Marshall and Rossman,
1999:33). A clear and succinct statement may help to frame the research questions for
the project. Similar to the way that an architect needs to know the purpose of a
building before designing it (is it a bungalow, flat, office building, a factory?), the
researcher must be clear about their research purpose and research questions before
developing a research design (de Vaus, 2005:17). The relationship between the
research purpose and research questions was presented in table 4.1.
The purpose of the research may be to describe (discover), explain (develop), explore
(understand), or take action as part of the intention of the proposed study. As
discussed in Yin (2003), descriptive research focuses on ‘what, who, and where’
questions; explanatory focuses on ‘how and why’ questions; and exploratory focuses
on ‘what’ questions. Descriptive research is undertaken for the purpose of producing
accurate representation of persons, events, or situations (Saunders et al., 2007). It
emphasizes on reporting and recording elements of situations and events (Meredith et
al., 1989). The explanatory research focuses on studying a situation in order to explain
the causal relationship among variables existing within the object of study. Exploratory
research aims to seek a new insight into phenomena, ask for more detailed levels of
description with respect to the object of study, ask questions and assesses the
phenomena in a new light. The results from the preliminary descriptive research may
be used to conduct detailed study of the object, leading to further insight and
understanding (Meredith et al., 1989). Depending upon the type of research the
researcher intends to conduct, he/she can define the questions as per the general
guidelines provided in the table 4.1.

Chapter 4: Research Paradigms
Maneesh Kumar 126
Table 4.1: Matching research questions and purpose
Purpose of the study General Research Questions
Descriptive:
To document and describe the phenomenon of interest
What are the salient actions, events, beliefs, attitudes, and social structures and processes occurring in this phenomenon?
Exploratory:
To investigate little-understood phenomena
To identify or discover important categories of meaning
To generate hypotheses for further research
What is happening in this social program?
What are the salient themes, patterns, or categories of meaning for participants?
How are these patterns linked with one another?
Explanatory:
To explain the patterns related to the phenomenon in question
To identify plausible relationships shaping the phenomenon
What events, beliefs, attitudes, or policies shape this phenomenon?
How do these forces interact to result in the phenomenon?
(Adapted from: Marshall and Rossman, 1999:33)
The purpose of this study was to assess the status of Six Sigma implementation in UK
manufacturing SMEs. Six Sigma is gaining momentum as one of the most effective
business process improvement strategies among a large number of multinational
organizations. To date, the benefits of Six Sigma have primarily been realised by large
organizations and the question therefore remains how best to apply Six Sigma in a
SME context.
This research was carried out in three stages. In stage 1, an exploratory research was
undertaken to identify the quality management practices existing in UK manufacturing
SMEs. The database generated from the first phase of study was used to conduct an
exploratory study in the phase two of the research to get a better insight into the
quality management practices in selected few SMEs. The output from the first two
phases was used to construct a Six Sigma Readiness Index and a framework for
SMEs that was further tested in the third phase of the study. Thus a triangulation
approach was used to explore the practicality of Six Sigma implementation within UK
SMEs and answers the following research questions:

Chapter 4: Research Paradigms
Maneesh Kumar 127
RQ1: What makes SMEs different from large organizations?
RQ2: What are the critical differences in quality management practices of Six Sigma
and non-Six Sigma SMEs?
RQ3: What are the critical success factors and barriers to implementation of Six
Sigma in SMEs?
RQ4: Does the performance of Six Sigma firms differ from non-Six Sigma firms?
RQ5: How to assess the readiness of a SME to embark on Six Sigma journey?
These questions were derived from the literature review discussed in Chapter 2, and
Chapter 3. The answers to these questions were mapped with the findings from the
literature review to construct a practical and user friendly framework for Six Sigma
implementation in SMEs. The next section discusses the different research
philosophies and approaches applicable to management studies.
4.3. Research Paradigms
A paradigm is a basic set of beliefs about the world (Denzin and Lincoln, 2000); a set
of methods that all exhibit the same pattern or element in common (Meredith et al.,
1989); progress of scientific practice based on people’s philosophies and assumptions
about the world and the nature of knowledge (Collis and Hussey, 2003); a set of linked
assumptions, rules, and perceptions about the world which is shared by a community
of scientists investigating the world (Deshpande, 1983: 101; Gummesson, 2000).
Researchers have used the term paradigm quite loosely and interchangeably in
academic research, that may have a different meaning to different people. Burrell and
Morgan (1979) in Collis and Hussey (2003), suggests three different interpretations of
paradigm at three different levels:
- at the philosophical level, it is used to reflect a basic set of beliefs about the world
- at the social level, it is used to provide guidelines to a researcher in pursuing his / her
research
- at the technical level, it is used to specify the choice of methods and techniques
appropriate to answer the research questions or when conducting research

Chapter 4: Research Paradigms
Maneesh Kumar 128
The understanding and impact of these paradigm or philosophical issues on the
quality of management research is considered highly relevant (Amaratunga et al.,
2001; Easterby-Smith et al, 2002; Collis and Hussey, 2003; Mendibil, 2003; Lopez,
2005). Understanding of philosophical issues is useful to clarify the research design
(what, why, how questions; its interpretations; and data analysis); recognize the
suitability of designs & their choices based on research questions; use and apply a
design that may be outside the researcher’s past experience (Easterby-Smith et al,
2002).
There are a number of classifications of paradigm at the philosophical level existing in
the literature. Meredith et al (1989) highlights the dimension that shapes the
philosophical basis for research activity- rational/existential dimension. This dimension
is concerned with the nature of reality and whether there is just one reality, which is
logical and independent of the researcher, or the reality is subjective and socially
constructed. For the same dimension, researchers have used alternative terms
labelled as positivist and phenomenological (Easterby-Smith et al., 2002; Saunders et
al., 2007; Collis and Hussey, 2003; Clough and Nutbrown, 2002; Gummesson, 2000;
Gill and Johnson, 2002). Some authors have proposed intermediate dimensions
between positivist and phenomenological sides such as Axiomatic (Meredith et al.,
1989); Critical theory (Meredith et al., 1989; Healy et al., 2000); Relativist (Easterby-
Smith et al., 2002); Realist (Healy et al., 2000); Social Constructivist (Easterby-Smith
et al., 2002; Healy et al., 2000; Lincoln and Guba, 2000); Interpretivist (Meredith et
al., 1989) and Post Positivist (Lincoln and Guba, 2000) to name a few. Researchers in
the past have used the term social constructivist and Interpretivist interchangeably
within phenomenological dimensions of the research philosophy.
For the purpose of this research, the author focuses on two main research paradigms-
Positivist and Phenomenological, and these terms will be used hereafter in the
sections and chapters to follow. These two paradigms may be considered as the two
extremes of a continuum. As one move along the continuum, the characteristics and
assumptions of one dimension are gradually relaxed and replaced by those of the
other paradigms (Collis and Hussey, 2003).
Chapter 4: Research Paradigms
Maneesh Kumar 129
4.3.1. Basic assumptions of the main paradigms
Before discussing the two paradigms in detail, the author would like to introduce the
assumptions of paradigms in order to better understand the differences among them-
ontological; epistemological; axiological; and methodological (Easterby-Smith et al.,
2002; Healy et al., 2000; Collis and Hussey, 2003, Creswell, 1994; Lincoln and Guba,
2000:165). Easterby-Smith et al (2002:31) defines ontology as the assumptions we
make about the nature of reality. The key ontological question is ‘what is the form and
nature of reality and, therefore, what is there that can be known about it?’ (Mason,
2002). As stated by Collis and Hussey (2003:48), with the ontological assumptions,
the researcher must decide whether he / she considers the world as objective and
external to the researcher (Objective Ontology) or socially constructed and only
understood by examining the human actor’s interpretations and perceptions
(Subjective Ontology).
Epistemology involves inquiring into the nature of the world in the best possible way
(Easterby-Smith et al., 2002). It is concerned with what constitutes acceptable
knowledge in a field of study (Saunders et al., 2007) and involves an examination of
the relationship between the researcher and what is being researched (Collis and
Hussey, 2003). The key epistemological questions are ‘What is the relationship of the
researcher to that researched and what can be known?’ Should the researcher
remain independent of that being researched in an attempt to control bias (positivist),
or should the researcher interact with those being studied (phenomenological)?
Different epistemologies have different things to say about the aforementioned
questions and about what the status of knowledge can be (Mason, 2002). Ontological
and epistemological issues become related in the sense that the latter concerns how
human actors may go inquiring about and making sense of the former.
Axiology is a branch of philosophy that studies judgements about ‘value’ (Saunders et
al., 2007). Values reflect either the personal beliefs or feelings of a researcher
(Bryman and Bell, 2007:29). Axiology is concerned with the process of social enquiry
and is greatly influenced by the role played by human actors/ researchers in all stages
of the research process to provide credibility to the research findings. It is expected of
the social scientists to be value free and objective in their research, i.e. avoiding
intrusion and biasness in the course of research. These assumptions are commonly

Chapter 4: Research Paradigms
Maneesh Kumar 130
found in the research studies in natural sciences, but they are less convincing in social
sciences which are concerned with the activities and behaviour of people (Collis and
Hussey, 2003: 48). The key research question underpinning axiological assumptions
is ‘What is the role of values?’
Lastly, the methodological assumption is concerned with the process of the research
(Collis and Hussey, 2003). It involves combination of approaches used to enquire into
a specific situation (Easterby-Smith et al., 2002; Lincoln and Guba, 2000). It refers to
the overall approach to the research process, i.e. is the process of research deductive
(testing of hypothesis or propositions derived from the theory to better predict, explain,
and understand the phenomena of interest) or inductive (theory is generated based on
empirical research)? The key methodological question is ‘How can the researcher go
about finding out whatever he or she believes can be known?’
4.3.2. Debates confronting Positivist and Phenomenological paradigms
Approaches to research in social science evolved significantly over the course of the
twentieth century. Management research evolved from a broadly positivist approach to
the discrimination of reality (Smallbone and Quinton, 2004). Historically, the positivistic
paradigm in the social sciences was based on the approach used in the natural
sciences, such as biology, botany, and physics (Collis and Hussey, 2003; Smallbone
and Quinton, 2004).
According to the positivist paradigm, the social world is independent and exists
externally regardless of whether the researcher is aware of it and its properties are
measured through objective methods (Easterby-Smith et al., 2002; Meredith et al.,
1989; Collis and Hussey, 2003). Here, the researcher’s personality, political views and
religious beliefs do not interfere with the research results. The understanding that
researchers should always be objective in his or her work comes from this positivistic
paradigm. Thus, logical reasoning is applied to investigate the research problem under
this paradigm, with a focus on precision, objectivity, and rigour to replace hunches,
experience, and intuition.
During the last three decades, social scientists have severely criticised the positivistic
perspective and argued that social sciences deal with action and behaviour which are

Chapter 4: Research Paradigms
Maneesh Kumar 131
generated from within the human mind (Collis and Hussey, 2003; Eisenhardt, 1989;
Yin, 2003). This school of thought believes that the investigator and the object of study
are interactively linked so that findings are mutually created within the context of the
situation which shapes the inquiry (Lincoln and Guba, 2000; Denzin and Lincoln,
2000). Popper (1994) supporting the argument state that creation of immutable laws
will lead to the stagnation of theory and that theory development should be open to
criticism. The proponents of such philosophical thoughts fall under the
phenomenological paradigm. This is concerned with the understanding of human
behaviour from the researcher’s own frame of reference (Collis and Hussey, 2003).
Thus, this paradigm argues that there is not just one reality, but as many as individual
interpretations there might be (Lopez, 2005).
The basic ontological, epistemological, axiological, and methodological assumptions
underlying the two paradigms were presented in table 4.2.
Table 4.2: Assumptions of the two main paradigms
Assumptions Question Positivist Phenomenological
Ontological What is the nature of reality (truth)?
Reality is external and objective.
Reality is singular, apart from the researcher
Reality is socially constructed and subjective.
Reality is multiple as seen by observers in a study
Epistemological What is the relationship of the observer to that observed?
Observer is independent from that being researched
Observer is part of what is observed
Axiological What is the role of values?
Value-free and unbiased
Value-laden and biased
Methodological What is the process of research?
Deductive process
Static design
Context- free
Generalizations leading to prediction, explanation and understanding
Inductive process
Emerging design
Context-bound
Patterns, theories developed for understanding
(Adapted from Lincoln and Guba, 2000; Easterby-Smith et al., 2002; Creswell, 1994, Mendibil, 2003, Lopez, 2005)
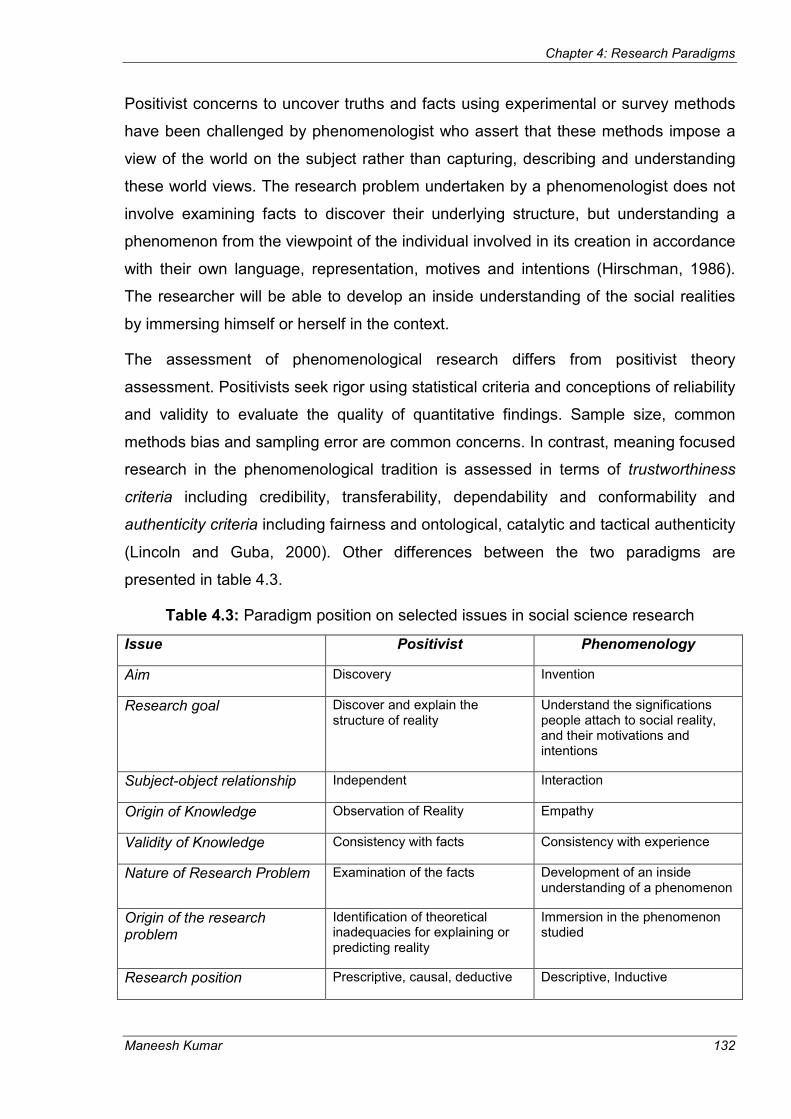
Chapter 4: Research Paradigms
Maneesh Kumar 132
Positivist concerns to uncover truths and facts using experimental or survey methods
have been challenged by phenomenologist who assert that these methods impose a
view of the world on the subject rather than capturing, describing and understanding
these world views. The research problem undertaken by a phenomenologist does not
involve examining facts to discover their underlying structure, but understanding a
phenomenon from the viewpoint of the individual involved in its creation in accordance
with their own language, representation, motives and intentions (Hirschman, 1986).
The researcher will be able to develop an inside understanding of the social realities
by immersing himself or herself in the context.
The assessment of phenomenological research differs from positivist theory
assessment. Positivists seek rigor using statistical criteria and conceptions of reliability
and validity to evaluate the quality of quantitative findings. Sample size, common
methods bias and sampling error are common concerns. In contrast, meaning focused
research in the phenomenological tradition is assessed in terms of trustworthiness
criteria including credibility, transferability, dependability and conformability and
authenticity criteria including fairness and ontological, catalytic and tactical authenticity
(Lincoln and Guba, 2000). Other differences between the two paradigms are
presented in table 4.3.
Table 4.3: Paradigm position on selected issues in social science research
Issue Positivist Phenomenology
Aim Discovery Invention
Research goal Discover and explain the structure of reality
Understand the significations people attach to social reality, and their motivations and intentions
Subject-object relationship Independent Interaction
Origin of Knowledge Observation of Reality Empathy
Validity of Knowledge Consistency with facts Consistency with experience
Nature of Research Problem Examination of the facts Development of an inside understanding of a phenomenon
Origin of the research problem
Identification of theoretical inadequacies for explaining or predicting reality
Immersion in the phenomenon studied
Research position Prescriptive, causal, deductive Descriptive, Inductive

Chapter 4: Research Paradigms
Maneesh Kumar 133
Starting points Formulation of explicit hypothesis
Meaning/ research questions
Techniques Measurement Conversation
Sample size Large Very Small
Analysis / Interpretation Verification /falsification Sense-making
Type of data analysis Statistical methods Non-statistical
Causality Cause-effect relations Not addressed
Outcomes Causality Understanding
Judgement of research quality
External validity and reliability are critical
Credibility, transferability, dependability, and confirmability
(Adapted from Easterby-Smith et al., 2002; Lincoln and Guba, 2000; Ates, 2008)
4.3.3. Inductive and Deductive Research Approach
The researchers are working with the production of theories that are going to give
knowledge of reality. To accomplish this, the researcher has to relate theory and
reality to each other. How to relate theory and reality is one of the most central
problems in all research work. There are two alternative ways of working to which the
production / testing of theory can be carried out: deductive approach and inductive
approach (Ghauri & Grønhaug, 2002; Saunders et al., 2007; Easterby-Smith et al.,
2002; Denzin and Lincoln., 2000), as shown in the figure 4.2.
In the inductive approach, based on empirical evidence we come to a conclusion or
propose a theory. However such conclusions should be treated cautiously as they are
based on some empirical observations. On the other hand, the deductive approach
uses an existing theory to test a hypothesis under different contexts / scenario. In this
case, we draw conclusions based on logical reasoning, i.e. we gather facts to confirm
or disprove a hypothesis (of relationship among variables) that was deduced from
propositions (Ghauri & Grønhaug, 2002).
The deductive approach is distinguished by researcher drawing conclusions from
general principles and existing theories. From existing theory, a hypothesis is derived
and thus it is empirically proven in the actual situation. An available theory decides
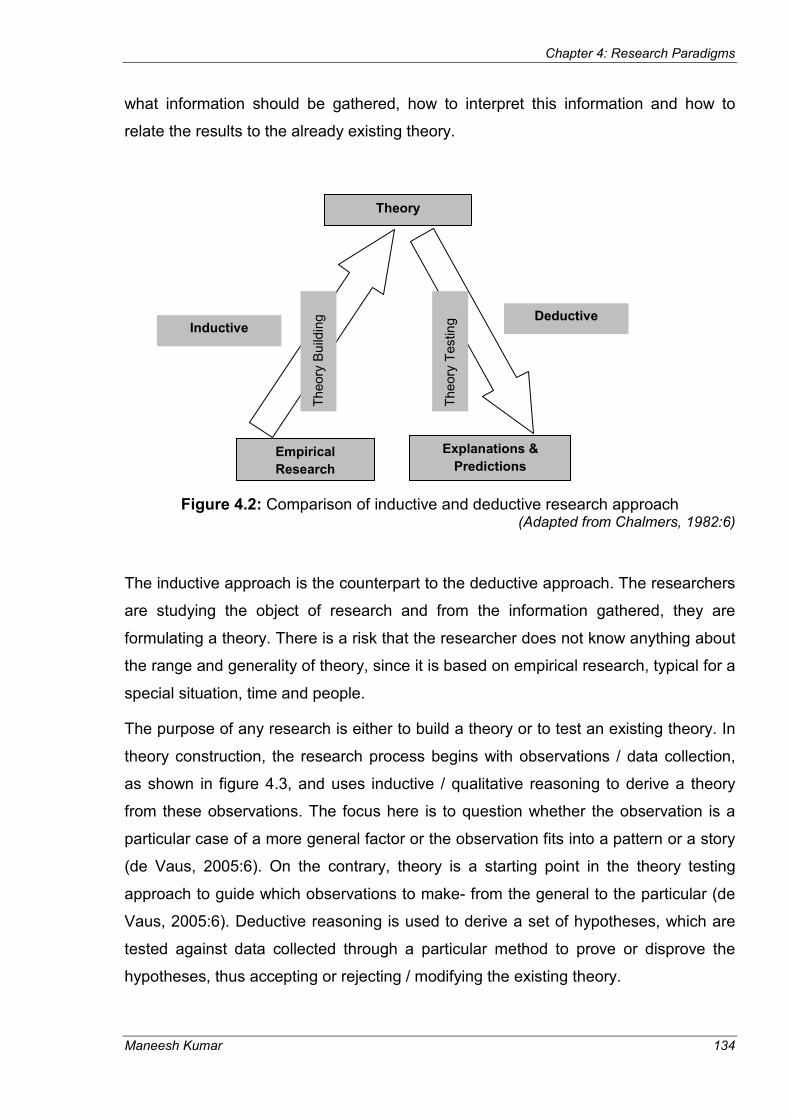
Chapter 4: Research Paradigms
Maneesh Kumar 134
what information should be gathered, how to interpret this information and how to
relate the results to the already existing theory.
Figure 4.2: Comparison of inductive and deductive research approach (Adapted from Chalmers, 1982:6)
The inductive approach is the counterpart to the deductive approach. The researchers
are studying the object of research and from the information gathered, they are
formulating a theory. There is a risk that the researcher does not know anything about
the range and generality of theory, since it is based on empirical research, typical for a
special situation, time and people.
The purpose of any research is either to build a theory or to test an existing theory. In
theory construction, the research process begins with observations / data collection,
as shown in figure 4.3, and uses inductive / qualitative reasoning to derive a theory
from these observations. The focus here is to question whether the observation is a
particular case of a more general factor or the observation fits into a pattern or a story
(de Vaus, 2005:6). On the contrary, theory is a starting point in the theory testing
approach to guide which observations to make- from the general to the particular (de
Vaus, 2005:6). Deductive reasoning is used to derive a set of hypotheses, which are
tested against data collected through a particular method to prove or disprove the
hypotheses, thus accepting or rejecting / modifying the existing theory.
Theory
Empirical
Research
Deductive
Inductive
Explanations &
Predictions
Theory
Bu
ildin
g
Theory
Testin
g

Chapter 4: Research Paradigms
Maneesh Kumar 135
Figure 4.3: The logic of the research process
(Adapted from de Vaus, 2005:8)
From figure 4.3, it can be stated that the deductive approach is best suited for
research falling within the positivist paradigm, whereas inductive approach can be
used to socially construct the reality under the phenomenological paradigm. However,
it is not prudent to comment on which paradigm is better, a trap that researchers may
fall into thinking one research approach is ‘better than other’. Each philosophy or
approach is ‘better’ for doing different things. The question that should be asked in
choosing between different paradigms or approaches is which philosophy or approach
can provide answers to the research question(s) posed by the researcher.
Combining inductive and deductive approaches in a single study is widely practiced
and accepted in many areas of social science research (Easterby-Smith et al., 2002;
Yin, 2003; Saunders et al., 2007). The evolving pluralism of research methods being
Theory
New
Theory
Develop measures,
samples, etc
Collect data
Analyse data
Implications for
propositions Propositions
Deduction
Starting point of
theory testing
Theory
Starting point of
theory building
Phenomenological
Positivist Induction

Chapter 4: Research Paradigms
Maneesh Kumar 136
used to study the problems in organizations makes multi-method research a
seemingly valuable approach. There are at least two reasons that underlie the
potential value of multiple methods. The first reason is that using multiple methods
mitigate the limitations existing in any one of the research methods. The second
reason is that multi-method research is more than using two disparate methods
(generally a quantitative and a qualitative method) in the course of your research
effort. The use of different research approaches, methods and techniques in the same
study is known as triangulation and can overcome the potential bias and sterility of a
single method approach (Collis and Hussey, 2003). Denzin and Lincoln (2000)
supporting the triangulation approach states that the use of multi-methods to study the
same phenomena by a number of researchers, if the conclusions are the same, will
lead to greater validity and reliability than a single methodological approach.
4.4. Implications of Research Philosophy and Approach on this
study
The practical reality is that research rarely falls neatly into only one philosophical
domain as discussed in the above sections. The research issue- “Six Sigma
implementation in UK manufacturing SMEs”, established in Chapter 1 and the
research purpose discussed in the section 4.2, clearly indicates that this research
does not fall on either side of the philosophical continuum. From the ontological
perspective, the exploratory research undertaken in the three phases (using survey
and case study methods) clearly follows objective ontology. In the second phase of
research, while undertaking the case studies, the researcher was an independent
observer and was seeking explanations for the quality management practices in case
study companies. The researcher was in no way trying to influence the result of the
study and remained as an independent observer throughout the research process.
From the epistemological perspective, the author adopted a triangulation of both
phenomenological and positivist paradigm, where both hard and soft data was
collected to realise the research aim. In the first phase of study, where a survey was
conducted, the epistemological stance is positivist. While in the second and third
phase of the study, the adopted case study method falls under the umbrella of
phenomenological paradigm. The author in the positivist paradigm assumed the role
Chapter 4: Research Paradigms
Maneesh Kumar 137
of an objective analyst, making detached interpretations and conducting tests about
data collected in an apparently value-free (axiology) manner (Saunders et al., 2007).
From the phenomenological perspective, knowledge and reality are socially created
and given meaning by people (Easterby-Smith et al, 2002). The author acted as a
phenomenologist in phase two and three to view the process of understanding as it
contributed to the construction of the reality. In the last two phases of the research, the
author takes into account the more sensitive aspects of research and includes value-
laden (axiology), rich data (interviews, etc.).
A triangulation approach of inductive and deductive research was undertaken from the
methodological perspective. In the first phase of the study, a survey instrument was
designed based on the existing literature/theory on quality initiatives in SMEs. The
purpose of this phase was to identify SMEs implementing different quality initiatives
and compare their quality management practices. This phase was needed to
understand the current status of Six Sigma implementation in SMEs. The second
phase was very informal and the author visited case study companies with an open
mind to understand the impact of quality initiatives on the performance of the
company. Thus, this phase falls under the category of inductive research.
4.5. Summary
This chapter discusses research from a process perspective by breaking down the
entire doctoral research into a list of activities that are undertaken in the ten chapters
of the dissertation. Understanding the purpose of the research and the nature of
research questions facilitated in identifying the nature of the research (descriptive,
explanatory, exploratory), the philosophical stance (positivist vs. phenomenology) of
the researcher, and the methodology (inductive vs. deductive) used for the research.
The next chapter discusses the research strategies and data collection methods used,
the unit of analysis, and the quality criteria for the research undertaken. At each level
of the paradigm discussed, the author adopted a triangulation approach to answer the
research questions. The exploratory study was carried out under the umbrella of
positivist and phenomenological paradigms to access the vast detail of phenomena
under study.
Chapter 5: Research Design
Maneesh Kumar 138
Chapter 5
Research Design
5.0. Introduction
The objective of this chapter was to explicate the term ‘research design’, its
relationship with different philosophical paradigms and approaches, followed by the
choice of research strategies and data collection methods adopted for this research.
The understanding of research design is imperative as it provides a well thought-out
logical and rational plan to address the research questions. The selection of
appropriate research strategy and data collection methodology for this study was
influenced by the selection of appropriate research questions and philosophical
paradigms from the previous chapter. The chapter also includes discussion on the
research quality criteria used to evaluate the overall quality of the research and
measures taken by the researcher to ensure the fulfilment of the criteria.
5.1. What is Research Design?
The role of research design in identifying the issues and planning the research is
imperative. Researchers have proposed several definitions of research design, none
of which seems complete or imparts the full range of important aspects.
“Research Design constitutes the blueprint for the collection, measurement, and
analysis of data” - Cooper and Schindler, 2006: 138.
“It is the overall plan for relating the conceptual problem to relevant and practicable
empirical research” - Ghauri & Grønhaug, 2002:47
“A Research Design provides a framework for the collection and analysis of data” -
Bryman and Bell, 2007:40
“Research Design is a logical sequence that connects the empirical data to study’s
initial research questions and, ultimately, to its conclusion” - Yin, 2003:20
“Research design is a blueprint of research dealing with at least four problems: what
questions to study; what data are relevant; what data to collect; and how to analyze
the results” - Philliber et al., 1980 cited in Yin, 2003
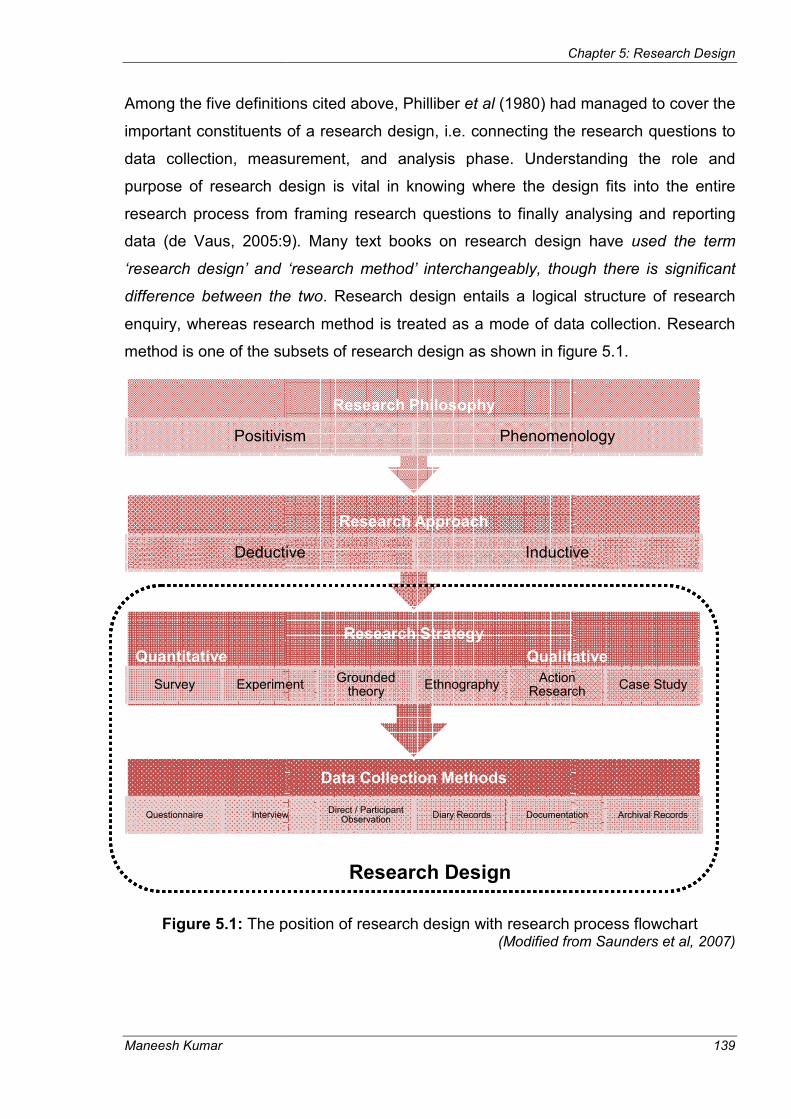
Maneesh Kumar
Among the five definitions cited above, Philliber
important constituents of a research design, i.e. connecting the research questions to
data collection, measurement, and analysis phase.
purpose of research design is vital in knowing where the design fits into the entire
research process from framing research questions to finally analysing and reporting
data (de Vaus, 2005:9).
‘research design’ and ‘research method’ interchangeably, though there is significant
difference between the two
enquiry, whereas research
method is one of the subsets of research design as shown in figure 5.1.
Figure 5.1: The position of research design with research process flowchart
Questionnaire Interview
Quantitative
Survey Experiment
Deductive
Positivism
Chapter 5: Research D
Among the five definitions cited above, Philliber et al (1980) had managed to cover the
important constituents of a research design, i.e. connecting the research questions to
ollection, measurement, and analysis phase. Understanding the role and
purpose of research design is vital in knowing where the design fits into the entire
research process from framing research questions to finally analysing and reporting
005:9). Many text books on research design have
‘research design’ and ‘research method’ interchangeably, though there is significant
difference between the two. Research design entails a logical structure of research
enquiry, whereas research method is treated as a mode of data collection. Research
method is one of the subsets of research design as shown in figure 5.1.
Research Design
The position of research design with research process flowchart (Modified from Saunders et al, 2007)
Data Collection Methods
InterviewDirect / Participant
ObservationDiary Records Documentation
Research Strategy
Qualitative
ExperimentGrounded
theoryEthnography
Action Research
Research Approach
Deductive Inductive
Research Philosophy
Positivism Phenomenology
Chapter 5: Research Design
139
(1980) had managed to cover the
important constituents of a research design, i.e. connecting the research questions to
Understanding the role and
purpose of research design is vital in knowing where the design fits into the entire
research process from framing research questions to finally analysing and reporting
Many text books on research design have used the term
‘research design’ and ‘research method’ interchangeably, though there is significant
. Research design entails a logical structure of research
method is treated as a mode of data collection. Research
method is one of the subsets of research design as shown in figure 5.1.
The position of research design with research process flowchart odified from Saunders et al, 2007)
Documentation Archival Records
Qualitative
Action Research
Case Study
Inductive
Phenomenology

Chapter 5: Research Design
Maneesh Kumar 140
The dotted line encircling the research strategy and data collection methods in figure
5.1 constitute the research design. A choice of research design reflects decisions
about the priority being given to a range of dimensions of the research process
(Bryman and Bell, 2007:40). The forthcoming sections include the following elements
of research design- research strategies (Qualitative vs. Quantitative), research
methods (data collection techniques), and research quality criteria.
5.2. Research Strategies
Research strategy refers to a general orientation to the conduct of business research
(Bryman and Bell, 2007:28). Research strategy is a systematic and orderly approach
taken towards the collection and analysis of data so that information can be obtained
to answer the research questions posed by the researcher (Jankowicz, 2005).
Research strategy is classified at two levels- level 1 takes into consideration the
quantitative and qualitative research (Bryman and Bell, 2007); and level 2 forms the
distinctive cluster of strategies such as experiments, survey, case study, ethnography,
grounded theory, and action research (Saunders et al., 2007). The author first
introduced the differences between qualitative and quantitative research and the
importance of triangulation in carrying out effective research. This was followed by
further discussion on different available strategies in business research.
5.2.1. Quantitative and Qualitative Research
The assumption underlying the quantitative research is that research designs should
be based on an objective view of the world and follows the positivist paradigm
(Easterby-Smith et al., 2002). The goal is to measure and analyze causal relationships
between variables within a value-free framework (Denzin and Lincoln, 2000).
Techniques to ensure this include randomization, blinding, highly structured protocols,
and written or orally administered questionnaires with a limited range of predetermined
responses. Sample sizes are much larger than those used in qualitative research so
that statistical methods to ensure that samples are representative can be used (Carey,
1993). Other details of quantitative research were provided in table 5.1.

Chapter 5: Research Design
Maneesh Kumar 141
Table 5:1: Critical differences between qualitative and quantitative research strategies
Qualitative Process of Research Quantitative
Understand & interpret Focus of research Describe, explain, and predict
Inductive; generation of theory Principal theoretical orientation
Deductive; testing of theory
Phenomenological Epistemological orientation
Positivism
Subjectivity (Constructivism) Ontological orientation Objectivism
Minor role; justify problem Literature used Major role to justify problem; identify questions and hypothesis
Understanding the inter-relationship of different variables
Purpose of inquiry Explanation and control
High- researchers is participant & catalyst
Researcher Involvement Limited; controlled to prevent bias
Non-probability; purposive Sample Design Probability
Small Sample Size Large
Verbal or pictorial description; non-numerical data
Data Type Mainly numerical data
Descriptive analysis by interpretation of data
Data Analysis Statistical techniques
Rely on the participants, the researcher , or the reader
Data Validation Rely on external standards such as judges, past research, statistics
Knowledge constructed Output Knowledge discovered
Analytical Generalization Statistical
Patterns of unanticipated as well as expected relationship
Research question seeks A relationship between a small number of variables
(Adopted and modified from Creswell and Clark, 2007:29; Cooper and Schindler, 2006:199; Bryman and Bell, 2007:28; Stake, 1995:37; Martinez-Hernandez, 2003:64)
In contrast, the qualitative research is based on phenomenological paradigm
(Easterby-Smith et al., 2002). The emphasis of qualitative research is on process and
meanings. Techniques used in qualitative studies include in-depth interviews, focus

Chapter 5: Research Design
Maneesh Kumar 142
group interviews and participant observations. Samples are not meant to represent
large populations. Rather, small, purposeful samples of articulate respondents are
used because they can provide important information, not because they are
representative of a larger group (Reid, 1996). The other differences between the two
strategies were presented in table 5.1.
5.2.1.1. Mixed-Method Research
The distinction between qualitative and quantitative research is subtle, with
researchers suggesting the use of different strategies and methods whenever
possible, and also occasionally move across paradigms with care (Easterby-Smith et
al., 2002; de Vaus, 2005; Martinez-Hernandez, 2003). It is not compulsory that a
specific design should use a particular method of data collection- data for any design
can be collected using any data collection method (de Vaus, 2005:9). For example, if
a type of design used for research is the case study, the data collection methods may
be questionnaire, interview, observation, analysis of documents, etc. However, there
were arguments against using mixed-method research due to two reasons- the idea
that the research method carries epistemological commitments; and the idea that
qualitative and quantitative research are two different paradigms (Easterby-Smith et
al., 2002; Smith, 1983).
The reality is that careful use of mixed-method research can help in combining the
advantages of both qualitative and quantitative methods within a single project
(Bryman and Bell, 2007, Creswell and Clark, 2007; Teddlie and Tashakkori, 2009).
The evolving pluralism of research methods being used to study the problems in
organizations makes mixed-method research a seemingly valuable approach. The
combined approach may also enhance the generalizability of the research findings
(Teddlie and Tashakkori, 2009; Creswell and Clark, 2007). Each research strategy
has limitations in addressing all aspects of validity (construct, content, and external
validity) and so triangulation using the mixed-method approach may help to maximize
the research validity (Scandura and Williams, 2000).
Analogous to blind men examining and defining the elephant in their own way, Boyer
and Swink (2008) comment on that the researcher own proximity for the methodology
they are most familiar and comfortable with governs the selection of strategy for

Chapter 5: Research Design
Maneesh Kumar 143
answering the research questions. It is imperative to set aside individual biases
towards a strategy or method for the advancement of research in operations
management. Boyer and Swink (2008) further explicate the point by the following
quote- “After all, blind men use all their senses to compensate for the lack of vision.
Why should we as researchers disparage any avenue of inquiry that will help describe
the elephant?”
Hammersley (1996) in Bryman and Bell (2007) proposed three approaches to mixed-
methods research
1. Triangulation- where the qualitative research is used to support quantitative
research findings or vice versa
2. Facilitation – refers to the use of one research strategy to aid research using
the other research strategy
3. Complementarity - refers to the use of two different research strategies to
dovetail the different aspects of an investigation.
In this research, quantitative research strategy (survey) was used to triangulate with
and facilitate the qualitative research using the case-study based strategy. Author
collected data in the first phase using a survey instrument and followed up with
interviews in the second phase to conduct an in-depth investigation into the
phenomenon of interest. The author initial intention at the start of this research was to
conduct a small survey in the first phase followed by detailed survey in the second
phase of research. However, due to low response rate in the first phase of study
discouraged the author to conduct a large scale survey in the second phase. The
purpose of conducting a large scale survey was to develop a mathematical model
using structured equation modelling. Due to low response, the author decided to
conduct a detailed qualitative study in the second phase to answer the five RQs
established at the outset of this research.
Creswell and Clark (2007) suggested the use of visual diagrams to discuss the
methods, procedure, and products of mixed methods studies. It is a useful tool to
design and communicate the complexities inherent in the mixed-methods research.
The author had used a visual diagram to explain the three phases of research using a
mixed-methodology, as depicted in figure 5.2. The notation QUAN and QUAL are
used to represent the quantitative and qualitative phase respectively.

Chapter 5: Research Design
Maneesh Kumar 144
Figure 5.2: Visual presentation of the research design used by the researcher
Phase One Phase Two Phase Three
QUAN data
collection QUAN data
analysis & results
Conduct in-
depth study
to explain
QUAN
differences
QUAL data
collection QUAL data analysis
& results
Combine the
two phase
findings to
compare with
literature
Procedures:
Exploratory survey:
64 responses from
500 samples selected
from D&B database
and Fame database
Procedures:
- Software for analysis: SPSS & Excel
- Content & Criterion validity tested
- SSS & NSSS group comparison to discuss similarity / differences in QM practices
Procedures:
- Assess the status of QM practices in SMEs
- Identify differences in QM practices of SMEs
Procedures:
Multi-case study in 10 SMEs (24 interviews), 3 practitioners interviews, 30 conference delegate responses using voting pad
Procedures:
- Data reduction technique used; use of interview protocol against identified themes
- Unit of analysis: SSS & NSSS
- Explain the findings across the theme for SS & NSS SMEs
Procedures:
- Compare & contrast findings from two phases
- Discussions of findings against literature
Procedures:
- Three SMEs selected for readiness & framework testing
- Testing Readiness & framework through interviews
QUAL & QUAN
data collection,
analysis & results
Products:
Numerical scores and
qualitative data from
open & close ended
questions
Products:
- Descriptive statistics & t-test score
- Frequency table for qualitative data
- Identified difference in QM practices of SSS & NSSS
Products:
- Specify new research questions and data collection plan
- Identify cases for follow-up study
Products:
Transcript, field notes, company report, practitioners’ viewpoints, Six Sigma experts’ opinion
Products:
- Single-case & cross-case themes discussion
- Research questions (RQ1-RQ4) addressed and discussed; RQ5 partially addressed
Products:
- Factors to assess Six Sigma readiness for SMEs identified
- A Six Sigma framework for SMEs designed
Products:
- Six Sigma Readiness Index for SMEs
- A revised practical framework for Six Sigma implementation in SMEs
SSS = Six Sigma SMEs
NSSS = non-Six Sigma SMEs

Chapter 5: Research Design
Maneesh Kumar 145
The objectivity provided by quantification in the rationalist method combined with the
qualitative understanding of the quantified factors may result in the theory building /
enhancement process that offers greater potential for enhancing new theories than
either methods alone (Meredith, 1998).
There is challenge in conducting a mixed - method research, in spite of its several
advantages. The main issues were of time and resources required to collect and
analyze the qualitative and quantitative data, and also training the researcher to have
a good understanding of both methods of data collection (Creswell and Clark, 2007).
In this research, the author had a good quantitative background and developed
understanding of qualitative data analysis in the first year of his doctoral study.
Attending several conferences, seminars at the university, and reading several
qualitative method books facilitated in grasping the concept. Moreover, the author
realised the value of mixed-method research that seems to outweigh the potential
difficulty of this approach.
5.2.2. Survey
Survey research has contributed greatly to the advancement in the operations
management area to study unstructured organizational problems and has been the
most commonly used research strategy over the last three decades (Malhotra and
Grover, 1998; Flynn et al., 1990; Meredith et al., 1989; Meredith, 1998; Voss, 1995;
Forza, 2002, Rungtusanatham et al., 2003; Boyer and Swink, 2008). Kerlinger (1986)
suggests that survey research is typified by the collection of data from a population, or
some sample drawn from it, to assess the relative incidence, distribution and
interrelationships of naturally occurring phenomena. Bryman (1988: 104) attempts a
more formal definition: “Survey research entails the collection of data on a number of
units and usually at a single juncture in time, with a view to collecting systematically a
body of quantifiable data in respect of a number of variables which are then examined
to discern patterns of association”.
Quality management being one of the key areas of research within the operations
management field, had also witnessed an explosion of survey based research in the
last two decades. Researchers have used survey as the primary strategy to
understand, assess, and resolve the issues in the area of quality management (Black
Chapter 5: Research Design
Maneesh Kumar 146
and Porter, 1996; Badri et al., 1995; Flynn et al., 1994), TQM (Ghobadian and Gallear,
1996; Yusof and Aspinwall, 1999), Lean (Achanga et al., 2006; Yusuf and Adeleye,
2002), and Six Sigma (Antony and Banuelas, 2002; Antony et al., 2005, 2008). Survey
research is the method of gathering data using an instrument composed of closed
structure or open-ended items (questions). This is perhaps the dominant form of data
collection in the social sciences, providing for efficient collection of data over broad
populations, amenable to administration in person, by telephone, or over the Internet
(Easterby-Smith et al., 2002; Saunders et al., 2007; Fowler, 2002).
5.2.2.1. Types of Survey research
There are three types of survey research, which have been used in the past to
generate theory, test theory or extend an already existing theory/ theory refinement
(Kerlinger, 1986; Malhotra and Grover, 1998; Forza, 2002). The first type can be
classified as ‘exploratory survey’, where the objective is to become more familiar by
gaining preliminary insight into the phenomenon of interest and provide the basis for
more in-depth survey. Even though the exploratory survey does not propose any
models or hypotheses, it may help to determine the concepts to be understood and
measured with respect to the phenomenon of interest and discover new facets of the
topic of interest under study (Malhotra and Grover, 1998; Forza, 2002). The data
collected through this research may be used to identify new possibilities and
dimensions of interest or uncover evidence of association among concepts.
Another type of survey research is ‘descriptive survey’ that is aimed at describing the
distribution of the phenomenon in a population, thereby ascertaining facts.
Hypotheses are formulated and tested related to common perceptions or changes
over time, thus providing useful hints for both theory building and refinement (Malhotra
and Grover, 1998; Forza, 2002). The third type of survey is the ‘explanatory (or theory
testing)’ survey research, used to explain the causal relationship between variables,
testing the adequacy of pre-defined concepts and models in relation to the
phenomena under study or testing the hypothesized linkages (i.e. positive, negative or
no relationships exist) among concepts (Malhotra and Grover, 1998; Forza, 2002). It
takes place when the knowledge about the phenomenon of interest already exists in

Chapter 5: Research Design
Maneesh Kumar 147
terms of pre-defined concept, propositions, and models. Other critical differences
between the three types of survey research are presented in table 5.2.
Table 5.2: Critical differences in the three types of survey research
Survey Type
Element/Dimensions Exploratory Descriptive Explanatory
Unit (s) of analysis Clearly defined
Clearly defined and appropriate for the research questions/ hypotheses
Clearly defined and appropriate for the research questions/ hypotheses
Respondents Representative of the unit of analysis
Representative of the unit of analysis
Representative of the unit of analysis
Research Hypothesis
Not necessary Questions clearly stated
Hypotheses clearly stated and theoretically motivated
Representativeness of sample frame
Approximation Explicit and logical argument to choose among alternatives
Explicit and logical argument to choose among alternatives
Representativeness of the sample
Not a criterion Systematic, purposive, random selection
Systematic, purposive, random selection
Sample size Sufficient to include the range of the interest phenomena
Sufficient to represent the population and conduct statistical analysis
Sufficient to test categories in the theoretical framework with statistical power
Pre-test of questionnaires
With sub-sample of the sample
With sub-sample of the sample
With sub-sample of the sample
Response rate No Minimum Greater than 50% of targeted population and study of bias
Greater than 50% of targeted population and study of bias
Data triangulation Multiple methods Not necessary Multiple methods
(Source: Forza, 2002)
For the author’s Doctoral study, an exploratory survey was used in the first phase of
research to assess the quality management (QM) practices in UK manufacturing
SMEs and to identify the adopters of Six Sigma and other quality initiatives or

Chapter 5: Research Design
Maneesh Kumar 148
certification systems. This facilitated in comparing the differences in QM practices
between Six Sigma and Non-Six Sigma SMEs (the difference between the definition of
Six Sigma and non-Six Sigma SMEs was explained in Chapter 6. Here we can
assume that Six Sigma and non-Six Sigma firms are adopter and non-adopter of Six
Sigma respectively). The identification of adopters and non-adopters of Six Sigma also
aided in selecting SMEs for conducting multiple-case studies in the second phase of
research. With Six Sigma research in SMEs being at its infancy, the exploratory
survey was the way forward to understand the key QM practices in SMEs and
discover new facets of the topic of interest under study. As discussed in section
5.2.1.1, this research espoused a mixed-method approach with survey (QUAN) being
first part of research strategy followed by conducting multiple case-studies (QUAL) to
answer the key research questions posed in Chapter 1.
5.2.2.2. Sample Frame Selection
In any research, it is imperative to define the sample and the unit of analysis at the
outset. The representativeness of any sample in a population depends on the sample
frame, sample size, and the specific design of selection procedure (Fowler, 2002;
Forza, 2002). In the case of SMEs, it is very difficult to get a comprehensive database
including all UK SMEs due to the continual birth of small business or close-up of
existing small businesses (Curran and Blackburn, 2001; Storey, 1994).
Before conducting the survey in summer 2007, author conducted a research on
existing databases of SMEs and identified those organizations having the latest details
of SMEs. The author contacted small business research centre at the University of
Warwick and the University of Cambridge to enquire about the best commercial
supplier of SME database. Up to and including 2007, these universities were actively
involved in conducting survey research on SMEs. Given the reputation of these two
universities and their research environment, their advice of procuring a database from
Dun & Bradstreet (D & B) was taken into consideration. Nonetheless, other sources
such as the DTI and Scottish Chambers of Commerce were also contacted to confirm
the authenticity of D & B. In order to generate a comprehensive sample frame, the
database from D & B was combined with a database generated from FAME. It took
nearly two months to build up a database of 5000 SMEs after filtering and removing
Chapter 5: Research Design
Maneesh Kumar 149
duplicate entries from both suppliers. The database of SMEs generated from the two
suppliers lists were based on the following criteria:
� Fit the DTI definition of SME
� UK manufacturing companies only
� Representation from Scotland, England, Wales, Northern Ireland
� Micro Enterprise excluded from the list
� Contains a valid phone number, email-id, and website
The sampling design used to select the sample may be grouped into two categories-
probabilistic (e.g. simple random sampling, systematic sampling, stratified random
sampling) and non-probabilistic sampling (e.g. convenience sampling, judgement
sampling, quota sampling). In this research, a stratified random sample of 600 SMEs
was chosen from the comprehensive sample frame to conduct the pilot study and the
actual survey. Stratified random sampling involves a random selection of ‘subject of
interest’ from each strata identified from a population based on criteria such as size,
type of industry, turnover, location, or others (Forza, 2002; Rungtusanatham et al.,
2003). This sampling strategy ensures the homogeneity within each stratum and
heterogeneity between strata. The strata defined to shortlist 600 SMEs from a
randomly generated database of 5000 SMEs included the size of industry (small and
medium-sized only) and the location of the industry (proportionate representation from
Scotland, England, Wales, and Northern Ireland).
Clearly defining the unit of analysis for each set of information required was
imperative. In most cases within quality management research, the unit of analysis is
the plant or the company. As the plant or company cannot respond to a questionnaire,
it was the individual working at different hierarchical levels (senior/middle
management level) was carefully chosen, based on their knowledge about the subject
of interest, to provide the requisite information about quality management practices in
the company (Forza, 2002, Malhotra and Grover, 1998). The survey instruments were
targeted at Managing Director/ Operations Director/ Quality Manager/ Production
Engineer working in the sample firms. A postal survey was used as a data collection
method for the pilot study and the actual survey and analyzed with the help of
Microsoft excel 2007 and the statistical package for social sciences (SPSS) 15.0
version.

Chapter 5: Research Design
Maneesh Kumar 150
5.2.2.3. Questionnaire layout and field pre-test
Before designing the questionnaire, it is important to understand the different data
collection methods existing within survey research. The selection of a single or
multiple data collection methods in combination with the key research questions
governed the design and contents of the questionnaire. Many data collection methods
exist within survey research, ranging from postal survey, telephone survey, and
internet survey to direct observation and face-to-face interviewing (Fowler and
Mangione, 1990; Fowler, 2002). There are relative merits and demerits of each
method, as demonstrated in table 5.3, and the choice of method(s) depends on its
ability to capture the requisite information in answering the research aims and
objectives.
Table 5.3: Data collection methods for survey research
Issues Questionnaire Interview
Post Drop-
off Internet Personal Phone
Are Visual Presentations Possible? Yes Yes Yes Yes No
Are Long Response Categories Possible? Yes Yes Yes ??? No
Is Privacy A Feature? Yes No No Yes ???
Is the Method Flexible? No No No Yes Yes
Are Open-ended Questions Feasible? L* No L* Yes Yes
Can You Judge Quality of Response? No ??? No Yes ???
Are High Response Rates Likely? No Yes No Yes No
Can You Explain Study in Person? No Yes No Yes No
Is It Low Cost? Yes No Yes No No
Are Staff & Facilities Needs Low? Yes No Yes No No
Does It Give Access to Dispersed Samples? Yes No Yes No No
Does Respondent Have Time to Formulate Answers?
Yes L* Yes L* L*
Is A Long Survey Feasible? Yes No L* Yes No
Is There Quick Turnaround? Yes No Yes No Yes
*L= Limited

Chapter 5: Research Design
Maneesh Kumar 151
Telephone surveys and personal interviews are expensive and time-consuming to
administer, but they permit clarification or explanation of items, reduce the number of
blank or incorrectly completed items, and may increase the response rate. Self-
administered surveys (Questionnaire survey), distributed by post or internet are less
expensive to administer than in person or telephone surveys and can provide privacy
and anonymity to respondents (Easterby-Smith et al., 2002; Saunders et al., 2007;
Fowler, 2002). However, these surveys typically yield numerous unusable or
incomplete responses and may require multiple mailings to obtain a response rate
high enough to generalize the data gathered to the whole target population. This
problem is often encountered in the author’s area of research. Even though each type
has some general advantages and disadvantages, there are exceptions to almost
every rule.
In Quality management research, researchers mostly opt for postal surveys as the
type of information required in the research area can be best gathered through a
postal survey and it is less expensive than some other survey methods. Researchers
in the past have used surveys to find CSFs in the implementation of CI programme,
establishing relations between the use of quality tools and company performance,
comparing performance of firms implementing CI programme and a non-implementer,
to check the implementation status and effectiveness of any CI programme in an
organisation, etc. (Flynn et al., 1994; Ahire and Golhar, 1996; Lee, 1998; Black and
Porter, 1996; McAdam and McKeown, 1999; Yusof and Aspinwall, 1999, 2000a;
Rahman, 2001; Antony and Banuelas, 2002; Antony et al., 2005, 2008).
The author also selected a postal survey as a data collection method for the following
reasons:
� Most commonly used data collection method while researching SMEs, though
the average response rate was low
� Low cost and less time in conducting a postal survey compared to other
methods such as face-to-face interview and telephonic surveys. There was
limited fund available to conduct the research within the restricted time span.
� Contact details of quality manager/ operations director of SMEs were not
readily available to encourage the use of other methods of data collection such
as web-based surveys or personal interviews.
Chapter 5: Research Design
Maneesh Kumar 152
� Minimize the biasness in the result by sending the questionnaire to a randomly
generated sample from a population rather than conveniently selecting SMEs
know to the author and his research team.
The survey instrument was developed based on questionnaire used in the published
literature of leading Six Sigma practitioners and academics (Antony and Banuelas,
2002; Ghobadian and Gallear, 1996, 1997; Lee and Oakes, 1995; Snee, 2004;
Wessel and Burcher, 2004; Yusof and Aspinwall, 1999, 2000a,b,c; Antony et al., 2005;
Kumar, 2007) and by means of a brainstorming session with a number of quality
professionals within the UK, who were familiar with Six Sigma and other quality
management philosophies such as TQM. The questionnaire for this survey, attached
in Appendix II, was structured into three main sections.
Section 1 included demographic questions related to the type of firm (independent vs.
part of MNC); size of the firm; annual turnover; type of manufacturing industry; position
of respondent; information on quality initiatives in SMEs and related quality
management practices such as the existence of a quality department; team for
problem solving; review meetings; education and training for employees; company’s
strategic objective; understanding the voice of customer and winning customer loyalty.
The last question in Section 1 was an open-ended question that asked SMEs reasons
for not implementing Six Sigma. Control variables such as type of firm, size of firm,
and type of quality initiatives were used to compare and contrast the differences
existing in QM practices within variables of each control group. Section 1 provided a
general overview of QM practices in UK manufacturing SMEs and facilitate in
identifying adopters and non-adopters of Six Sigma. It also provided useful information
as why SMEs were not embarking on Six Sigma. Section 1 was designed with a view
to answer RQ2 and dispels the myth of non-applicability of Six Sigma in a SME
environment.
The second section included information on 13 factors critical to the success of quality
initiatives (QI) identified from table 3.3 (CSFs of CI initiatives in SMEs) and matched
with the existing literature on Six Sigma implementation in SMEs (Wessel and
Burcher, 2004; Deas, 2004; Antony et al., 2005; Kumar, 2007). The common factors
listed in Six Sigma study and table 3.3 were extracted and incorporated in the survey
instrument. The purpose of this section was to identify the importance of CSFs in the
successful implementation of quality initiatives. CSFs were scored on a Likert scale of

Chapter 5: Research Design
Maneesh Kumar 153
1-5, with 1 being not important to 5 being very important. To measure the
implementation level of the aforementioned CSFs in the participating SMEs, a Likert
scale of 1-5 was used, where 1 is not implemented to 5 being fully implemented.
There was very limited conclusive support in the literature for choosing a five point
rating scale over other rating scales like 3 points, 6 points, or seven points (Cooper
and Schindler, 2006). Cooper and Schindler (2006) further suggested that no critical
differences existed if a scale ranging from three to seven points was used. As said by
Hasson and Arnetz (2005) – “too many response categories may lead to difficulties in
choosing and too few may not provide enough choice or sensitivity, forcing the
respondent to choose an answer that does not represent the person’s true intent”. A 5
point Likert scale seems to be the most popular choice in management and social
science research (Cooper and Schindler, 2006; Bryman and Bell, 2007). The CSFs
findings facilitated in identification of a gap in the participating SMEs with respect to
the importance and implementation level of CSFs. The intention was also to test the
difference in scoring of CSFs when compared across the control variables of type and
size of SMEs, and type of QI implemented in the participating firm. This section also
included information on the barriers encountered during implementation of quality
improvement initiatives. Respondents were asked to identify the five important
challenges they have faced in the implementation process.
The final section of the questionnaire asked about the benefits participating firms have
experienced following the implementation of QI. The metrics identified from the
literature review process were the most commonly cited/ used metrics within a SME
environment. A Likert scale of 1-5 was used to measure the performance of
participating firms, where 1 stands for negative benefit / improvement to 5 being
crucial benefit / improvement in the measure after the implementation of QI. The
performance metrics (9 factors) included in this section was divided into two groups of
strategic and operational measures respectively (Kumar, 2007; Hvolby and
Thorstenson, 2001; Beheshti and Lollar, 2003; Sila et al., 2005). The score of
participating firms was used to compare the differences, if they exist, in the
performance of Six Sigma and Non Six Sigma SMEs. Respondents were also asked
about their understanding of cost of poor quality (COPQ) and what factors it
encompasses. COPQ may be regarded as a criterion of quality performance, the
Chapter 5: Research Design
Maneesh Kumar 154
measurement of which may lead to identification of hidden factory / waste in the
organization (Dale et al., 2007).
The questionnaire was pilot tested with 100 SMEs from the sample for its content
validity, i.e. the extent to which a measurement reflects the specific intended domain
of content. A cover page introducing the key aims and objectives of the survey was
attached with the questionnaire to explicate the rationale of study to SMEs (attached
in Appendix II). The respondents were requested to provide opinions on the content of
questionnaire, design of the questions, language usage, time to complete, technical
contents and any other points missing in the questionnaire that was not addressing
the research objectives. After receiving 15 responses (15% response rate) from UK
manufacturing SMEs, some minor changes were made in Section 1 and Section 3 of
the instrument. Three questions in Section 1 were redesigned and more explanation
was provided in Section 3 to facilitate in completion of the questionnaire. Likewise, a
few technical problems encountered by respondents were also rectified. Five
questions were dropped from the instrument as it was not directly linked to the
research objectives. All the changes were made in expectation of a better response
rate. The pilot test helped in identifying redundant or poor questions and provided an
early indication of the reproducibility of the responses.
The modified survey instrument was four pages long including the cover letter. The
author intentionally designed a short survey to increase the response rate as the
literature suggests poor response rates when conducting survey in SME environment
(Ahmed et al., 2004; Sousa et al., 2006; Anderson and Sohal, 1999; Wright and
Burns, 1998; Co et al., 1998; Spencer et al., 1994). As the survey was a part of the
research strategy, the focus was more on enhancing the response rate from Six
Sigma and Non-Six Sigma firms and understanding the basic QM practices in these
participating firms. The revised questionnaire was sent to the remaining 500 SMEs in
July 2007 targeting Managing Directors, Operations Directors, Quality Managers, and
Production Engineers within the sample. A cover letter on the university letterhead
explaining the purpose of the survey and why organization participation is important to
the study, was attached along with a self-addressed return envelope and a tear-off
non-response slip. Each survey pack was provided with a unique identifier number to
track the non-responses and send a reminder message to the firm with a request for
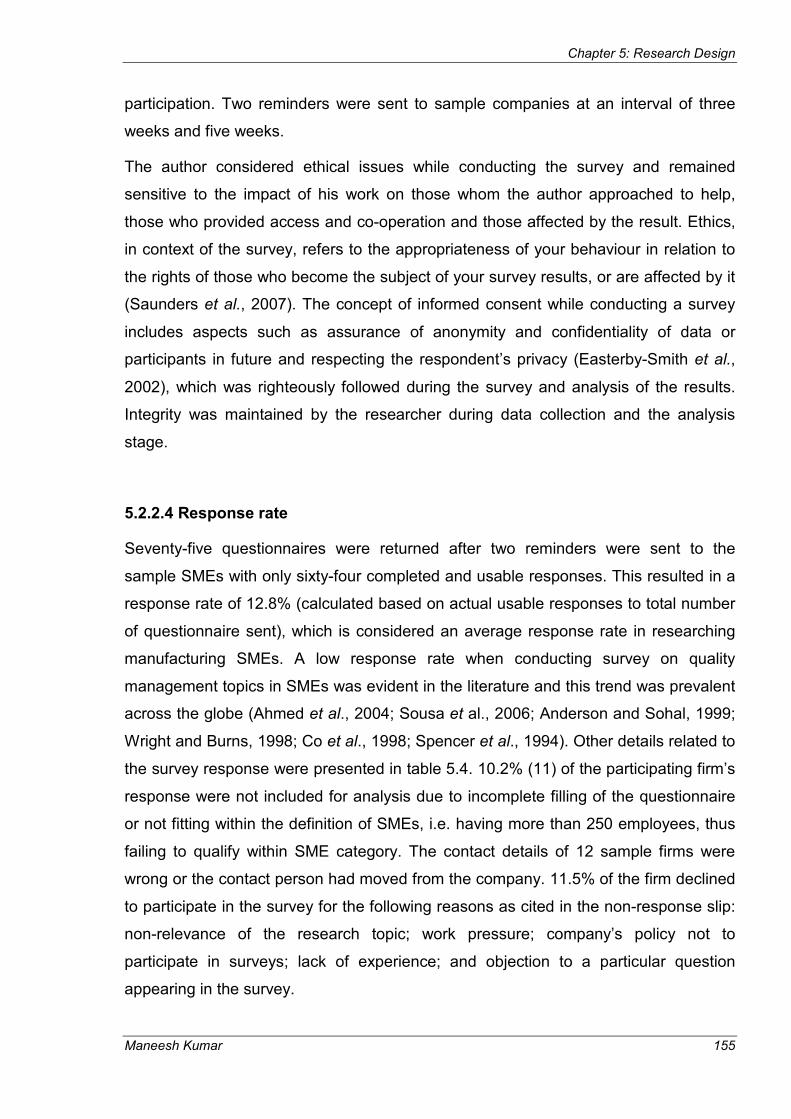
Chapter 5: Research Design
Maneesh Kumar 155
participation. Two reminders were sent to sample companies at an interval of three
weeks and five weeks.
The author considered ethical issues while conducting the survey and remained
sensitive to the impact of his work on those whom the author approached to help,
those who provided access and co-operation and those affected by the result. Ethics,
in context of the survey, refers to the appropriateness of your behaviour in relation to
the rights of those who become the subject of your survey results, or are affected by it
(Saunders et al., 2007). The concept of informed consent while conducting a survey
includes aspects such as assurance of anonymity and confidentiality of data or
participants in future and respecting the respondent’s privacy (Easterby-Smith et al.,
2002), which was righteously followed during the survey and analysis of the results.
Integrity was maintained by the researcher during data collection and the analysis
stage.
5.2.2.4 Response rate
Seventy-five questionnaires were returned after two reminders were sent to the
sample SMEs with only sixty-four completed and usable responses. This resulted in a
response rate of 12.8% (calculated based on actual usable responses to total number
of questionnaire sent), which is considered an average response rate in researching
manufacturing SMEs. A low response rate when conducting survey on quality
management topics in SMEs was evident in the literature and this trend was prevalent
across the globe (Ahmed et al., 2004; Sousa et al., 2006; Anderson and Sohal, 1999;
Wright and Burns, 1998; Co et al., 1998; Spencer et al., 1994). Other details related to
the survey response were presented in table 5.4. 10.2% (11) of the participating firm’s
response were not included for analysis due to incomplete filling of the questionnaire
or not fitting within the definition of SMEs, i.e. having more than 250 employees, thus
failing to qualify within SME category. The contact details of 12 sample firms were
wrong or the contact person had moved from the company. 11.5% of the firm declined
to participate in the survey for the following reasons as cited in the non-response slip:
non-relevance of the research topic; work pressure; company’s policy not to
participate in surveys; lack of experience; and objection to a particular question
appearing in the survey.
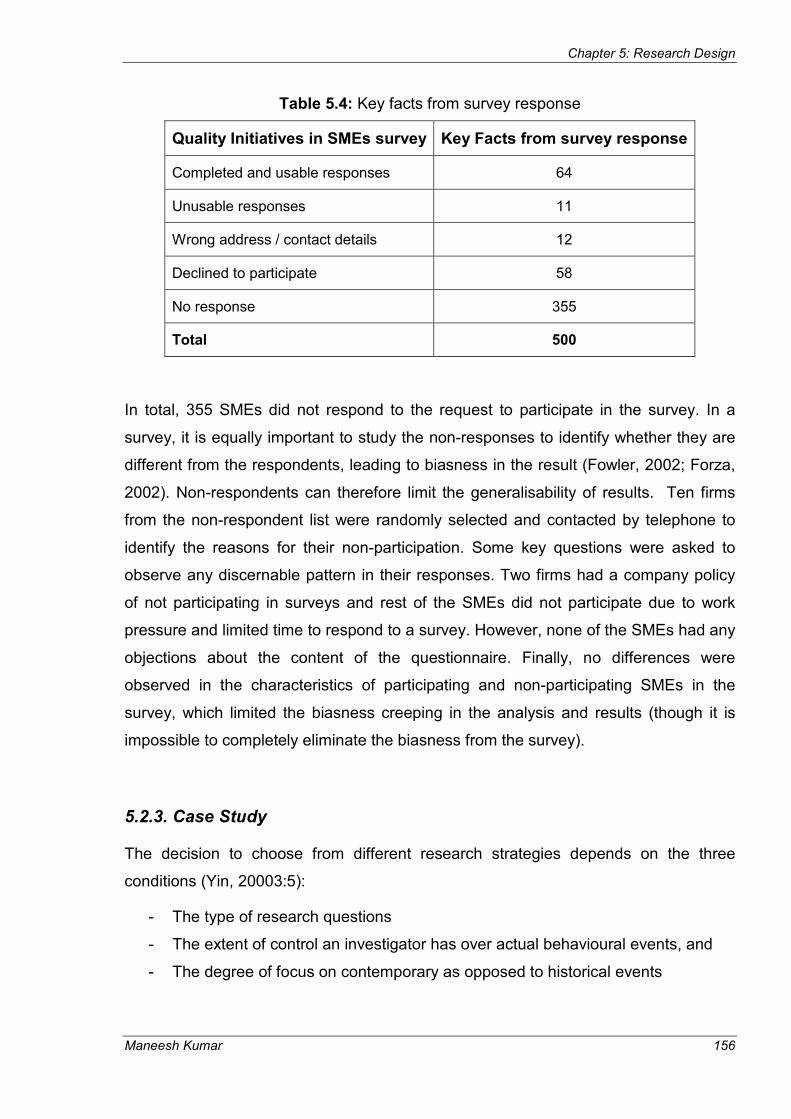
Chapter 5: Research Design
Maneesh Kumar 156
Table 5.4: Key facts from survey response
Quality Initiatives in SMEs survey Key Facts from survey response
Completed and usable responses 64
Unusable responses 11
Wrong address / contact details 12
Declined to participate 58
No response 355
Total 500
In total, 355 SMEs did not respond to the request to participate in the survey. In a
survey, it is equally important to study the non-responses to identify whether they are
different from the respondents, leading to biasness in the result (Fowler, 2002; Forza,
2002). Non-respondents can therefore limit the generalisability of results. Ten firms
from the non-respondent list were randomly selected and contacted by telephone to
identify the reasons for their non-participation. Some key questions were asked to
observe any discernable pattern in their responses. Two firms had a company policy
of not participating in surveys and rest of the SMEs did not participate due to work
pressure and limited time to respond to a survey. However, none of the SMEs had any
objections about the content of the questionnaire. Finally, no differences were
observed in the characteristics of participating and non-participating SMEs in the
survey, which limited the biasness creeping in the analysis and results (though it is
impossible to completely eliminate the biasness from the survey).
5.2.3. Case Study
The decision to choose from different research strategies depends on the three
conditions (Yin, 20003:5):
- The type of research questions
- The extent of control an investigator has over actual behavioural events, and
- The degree of focus on contemporary as opposed to historical events

Chapter 5: Research Design
Maneesh Kumar 157
Adhering to the aforementioned point, Yin (2003:13) defines the case study as “an
empirical enquiry that investigates a contemporary phenomenon within its real-life
context, especially when the boundaries between phenomenon and context are not
clearly evident”. Meredith (1998) provided another definition for case study research
especially in the context of operations management– “A case study typically uses
multiple methods and tools for data collection from a number of entities by a direct
observer(s) in a single, natural setting that considers temporal and contextual aspects
of the contemporary phenomenon under study, but without experimental controls, or
manipulations”.
Case study research includes direct observation of a contemporary event over which
the investigator has little or no control of behavioural events. However, it ensures
systematic measurement of various outcomes and processes through using multiple
sources of data [e.g. observations, interviews, and documentation] (Eisenhardt, 1989;
Voss, 1995; Meredith, 1998; Yin, 2003). The case study is also a useful strategy in the
early phase of research, where there may be no previous work for guidance (Meredith
et al., 1989) or where existing theories seems inadequate (Eisenhardt, 1989).
Comparing the use of surveys (as discussed in the previous section) and case studies
across the aforementioned conditions, it is reflected from table 5.5 that a survey is
suited for answering ‘who’ and ‘what’ questions; and ‘how’ and ‘why’ questions are
addressed using the case study strategy. If the research questions focus mainly on
‘what’ questions, then it is a justifiable rationale for conducting either an exploratory or
descriptive survey or an exploratory case study. Nonetheless, it does not limit the
researcher to ask ‘what’ questions while conducting an exploratory case study (Yin,
2003; McCutcheon and Meredith, 1993).
Table 5.5: Comparing survey and case study based research strategies
Method Form of research question posed
Requires control of behavioural events?
Having access and available resources
Application in this research
Survey Who? What? Where? How many? How much?
No Yes Yes
Case Study How? Why? No Yes Yes
(Source: Yin, 2003)

Chapter 5: Research Design
Maneesh Kumar 158
Both survey and case study can be used for theory building, theory testing, or theory
extension to answer what, how and why questions; however the emphasis of the case
study is more on theory building (answering how and why questions) and the survey
method is more appropriate for theory testing or verifying existing theory (McCutcheon
and Meredith, 1993; Meredith, 1998). McCutcheon and Meredith (1993) commented
on the suitability of the case study approach to study unfamiliar situations, where there
exists little theoretical background on the subject of interest.
Similarly in this research, there exists very little evidence in the literature on successful
implementation of Six Sigma in SMEs. By conducting case-studies in the second
phase of research, the researcher unravelled the key questions established in Chapter
1. Through the use of a case study based approach, author explored information on
the following key issues: history of quality initiatives including success and failure
stories; critical success factors and barriers to implementation; impact of quality
initiatives on the performance of the company, to name a few. The first phase of
research facilitated in identifying dichotomous and similar cases from the sample,
which were selected in the second phase of research for in-depth investigation on
quality management practices within two clusters- Six Sigma SMEs and Non-Six
Sigma SMEs. A more detailed explanation of the case study design is discussed in the
later part of this chapter.
5.2.3.1. Type of Case Study
Similar to survey research discussed in the previous section, case study may also
take the form of description, exploration or being explanatory in nature (Yin, 2003;
McCutcheon and Meredith, 1993; Voss et al., 2002). Case studies are often used to
describe hitherto unexplored phenomena or to explore the subject of interest.
Whether your research is descriptive, exploratory, or explanatory, depends on several
aspects of design; the foremost important point among them being the type of
research questions being asked by the researcher. As the research questions
established in Chapter 1 were mostly ‘what’ and ‘how’ type, the chance of adopting an
explanatory case study approach (where we are interested in establishing the cause &
effect relationship between variables) was dropped.
Chapter 5: Research Design
Maneesh Kumar 159
The first phase of the research used an exploratory survey to identify the
similarities/differences in quality management practices of two clusters- Six Sigma
SMEs and Non-Six Sigma SMEs. The second phase of research also adopted an
exploratory case study approach to uncover the aforementioned area of research and
contribute to the theory development process, the details of which were presented in
table 5.6. The findings from the exploratory case-study were used to develop
propositions and hypotheses for further study/inquiry, as discussed in Chapter 10.
Table 5.6: Case study types and its link with this research
Purpose of the study Research Question Potential Research Strategy
Exploration
Uncover areas for research and theory development
Is there something interesting enough to justify research?
In-depth case studies; Unfocused, longitudinal field study
Theory Building
Identify/describe key variables Identify linkages between variables Identify ‘why’ these relationship exist
What are the key variables?
What are the patterns or linkages between variables?
Why should these relationships exist?
Few focused case studies In-depth field studies Multi-site case studies Best-in-class case studies
Theory testing
Test the theories developed in the previous stages Predict future outcome
Are the theories we have generated able to survive the test of empirical data? Did we get the behaviour that was predicted by the theory or did we observe another unanticipated behaviour?
Experiment Quasi-experiment Multiple case studies Large-scale sample of population
Theory extension/ refinement
To better structure the theories in light of the observed results
How generalizable is the theory? Where does the theory apply?
Experiment Quasi-experiment case studies Large-scale sample of population
Source: Adopted from Voss et al (2002) and Shamsuddin (2007)
Exploration leads to development of research ideas and hypotheses. The author’s
choice of an exploratory case study is further supported by the statement from Yin

Chapter 5: Research Design
Maneesh Kumar 160
(2003; p.30) - “For yet other topics, the existing knowledgebase may be poor, and the
available literature will provide no conceptual framework or hypotheses of note. Such
a knowledge base does not lend itself to the development of good theoretical
statements, and any new empirical study is likely to assume the characteristics of an
“exploratory” study”.
Reflecting back to table 5.6, this clearly shows a mixed method approach of
exploration and theory extension / refinement being adopted by the author to achieve
the research aim established at the outset of the research.
Each of the aforementioned types of case study can further be classified as single or
multiple cases and embedded or holistic cases, giving rise to four different types of
case study: Single-holistic; single-embedded; multiple-holistic; multiple-embedded
(Yin, 2003). In the holistic design, the focus is at the systems level or global
organization as a single unit of analysis. In the case of embedded design, there are
multiple units of analysis within the same organization (e.g. different departments or
functional groups) or subjects of interest. The single case approach is preferred to test
a well formulated theory; or when the case represents an extreme or unique case; or
the case is a representative or typical case; or it is a longitudinal case (Yin, 2003). The
single case sacrifices the generalizability of the findings. This limitation is tackled by
conducting multiple cases that augments external validity and minimizes observer
biasness (Voss et al., 2002; Yin, 2003). However, there are time and resource
constraints in selecting larger samples for multiple case studies and this also affects
the in-depth investigation of cases.
In this research, the author conducted multiple – holistic case studies in ten UK
manufacturing SMEs to achieve theoretical or literal replication that leads to the
development of a Six Sigma Readiness Index and a Six Sigma Framework in the
third phase of the research. More details of sample selection and unit of analysis were
provided in the next two sections.
5.2.3.2. Case Study Sample Selection
Defining the scope of research, directly linked to research questions, is imperative
before sample selection. While exploring or building theory from case study,
replication logic rather than sampling logic is used to predict either similar results
Chapter 5: Research Design
Maneesh Kumar 161
[literal replication] or dichotomous results for predictable reasons [theoretical
replication] (Voss et al.,2002; Eisenhardt, 1989; Miles and Huberman, 1994). In
performing case study, the goal is to expand and generalize theory (analytic
generalization). Here, the cases are not treated as ‘sampling units’ (as in survey,
where statistical generalization is the preferred path) and the research is striving to
generalize a particular set of findings to broader theory. Therefore, the preferred
sample selection methods in case study are convenience sampling or purposive
sampling. The chances of using a random sample of cases are minimal while
conducting case study as the researcher focuses more on analytical generalization.
Commonalities and differences across the cases may facilitate in the theory
development that incorporates a range of conditions thought to affect the outcome of
the study (McCutcheon and Meredith, 1993). Pettigrew (1988) in Eisenhardt (1989)
pointed out to choose polar cases or extreme situations so that the subject of interest
is “transparently observable”. The idea behind theoretical sampling is to select cases
that are likely to replicate or extend the emerging theory (Eisenhardt, 1989).
There is no prescriptive rule for the number of cases deemed necessary or sufficient
while conducting case study research. Nonetheless, Yin (2003) and Eisenhardt (1989)
provided a rough guideline on the number of cases- minimum of two cases to six or
more cases depending upon inclusion of both literal and theoretical replication cases.
Eisenhardt (1989) and Meredith (1998) prescribed inclusion of 2 to 10 cases to
achieve theoretical generalization. It is advisable to include similar/exemplar cases for
literal replication and polar cases/ extreme cases for theoretical generalization. A
quote from McCutcheon and Meredith (1993) summarises the discussion on case
study samples- “Although a large and diverse set of cases can aid in such
generalization, so can a depth of understanding of a single case”. Though a case
based research is time consuming and less generalizable, it offers excellence in
establishing a foundation for follow-on research streams (Boyer and Swink, 2008).
Before commencing the sample selection for multiple case studies, selection criteria
were established based on the key research questions established at the start of the
research, the details were provided in table 5.7. In this research, the case study
samples were selected from responses collected in the first phase of the research, i.e.
survey. At the end of survey instrument, respondents were asked if they were willing
to participate in the second phase of study, i.e. case study. Twenty-five out of sixty-
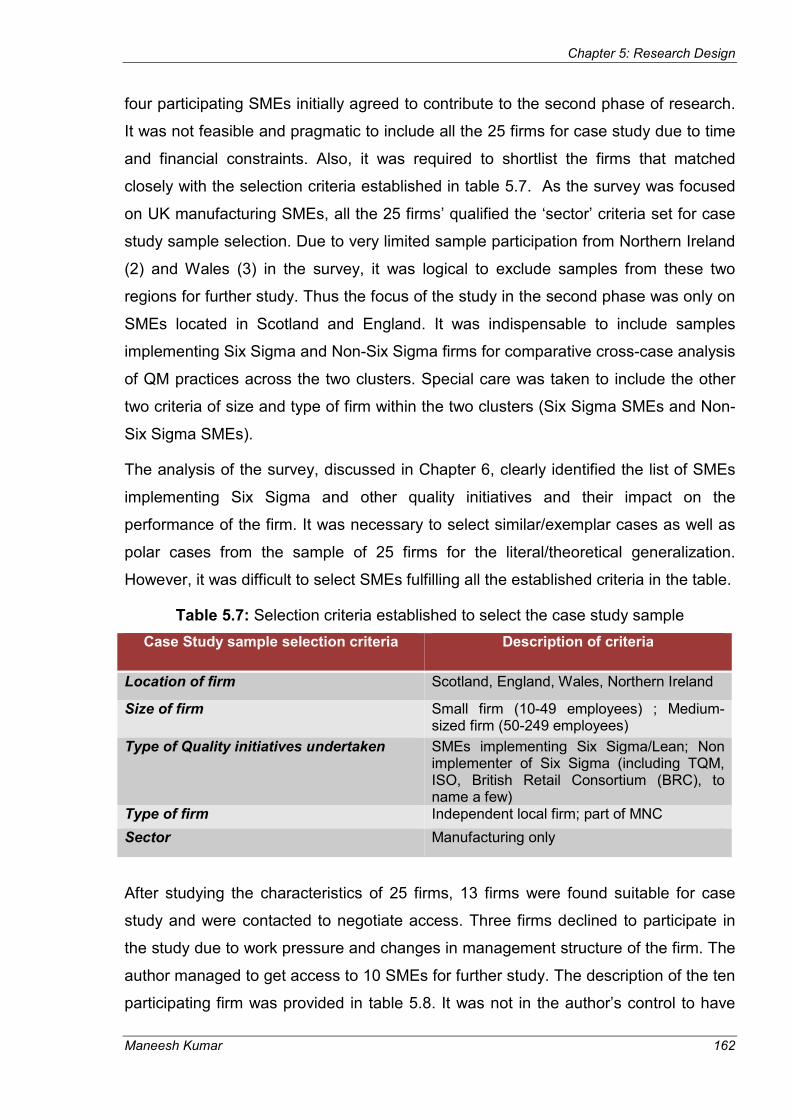
Chapter 5: Research Design
Maneesh Kumar 162
four participating SMEs initially agreed to contribute to the second phase of research.
It was not feasible and pragmatic to include all the 25 firms for case study due to time
and financial constraints. Also, it was required to shortlist the firms that matched
closely with the selection criteria established in table 5.7. As the survey was focused
on UK manufacturing SMEs, all the 25 firms’ qualified the ‘sector’ criteria set for case
study sample selection. Due to very limited sample participation from Northern Ireland
(2) and Wales (3) in the survey, it was logical to exclude samples from these two
regions for further study. Thus the focus of the study in the second phase was only on
SMEs located in Scotland and England. It was indispensable to include samples
implementing Six Sigma and Non-Six Sigma firms for comparative cross-case analysis
of QM practices across the two clusters. Special care was taken to include the other
two criteria of size and type of firm within the two clusters (Six Sigma SMEs and Non-
Six Sigma SMEs).
The analysis of the survey, discussed in Chapter 6, clearly identified the list of SMEs
implementing Six Sigma and other quality initiatives and their impact on the
performance of the firm. It was necessary to select similar/exemplar cases as well as
polar cases from the sample of 25 firms for the literal/theoretical generalization.
However, it was difficult to select SMEs fulfilling all the established criteria in the table.
Table 5.7: Selection criteria established to select the case study sample
Case Study sample selection criteria Description of criteria
Location of firm Scotland, England, Wales, Northern Ireland
Size of firm Small firm (10-49 employees) ; Medium-sized firm (50-249 employees)
Type of Quality initiatives undertaken SMEs implementing Six Sigma/Lean; Non implementer of Six Sigma (including TQM, ISO, British Retail Consortium (BRC), to name a few)
Type of firm Independent local firm; part of MNC
Sector Manufacturing only
After studying the characteristics of 25 firms, 13 firms were found suitable for case
study and were contacted to negotiate access. Three firms declined to participate in
the study due to work pressure and changes in management structure of the firm. The
author managed to get access to 10 SMEs for further study. The description of the ten
participating firm was provided in table 5.8. It was not in the author’s control to have

Chapter 5: Research Design
Maneesh Kumar 163
equal representation for each criterion, which is the most desirable case, due to the
consent from very limited number of firms to participate in the study. Special care was
taken to at least have one case within each criterion established. More information on
the position of the respondents from the 10 participating firms is discussed later in the
data collection method section.
Table 5.8: Characteristic of the participating firms in case study research
Case Study sample selection criteria Participating firms distribution
Location of firm Scotland - 6
England - 4
Size of firm Small firm - 3
Medium-sized firm - 7
Type of Quality initiatives undertaken SMEs implementing Six Sigma - 5
Non implementer of Six Sigma - 5
Type of firm Independent local firm – 7
part of MNC - 3
Sector Manufacturing only - 10
5.2.3.3. Unit of Analysis
The focus at the outset of case study should be on defining the unit of analysis, which
many researchers have struggled to define clearly in the past (Yin, 2003; 22). The unit
of analysis may vary from an individual person to departments, organizations,
decisions, programs, the implementation process, and organizational change (Yin,
2003; 23). The selection of an appropriate unit of analysis is related to the research
questions established at the commencement of the study. Ill-defined or fuzzy research
questions may lead to the wrong selection of the unit of analysis and thus conducting
a less focused case study.
In this research, the author is comparing the similarities/ differences in quality
management practices and its impact on the performance of Six Sigma SMEs and
Non-Six Sigma SMEs. Thus, the primary unit of analysis is two clusters, i.e. Six Sigma
SMEs and Non-Six Sigma SMEs. The secondary unit of analysis includes 5 case
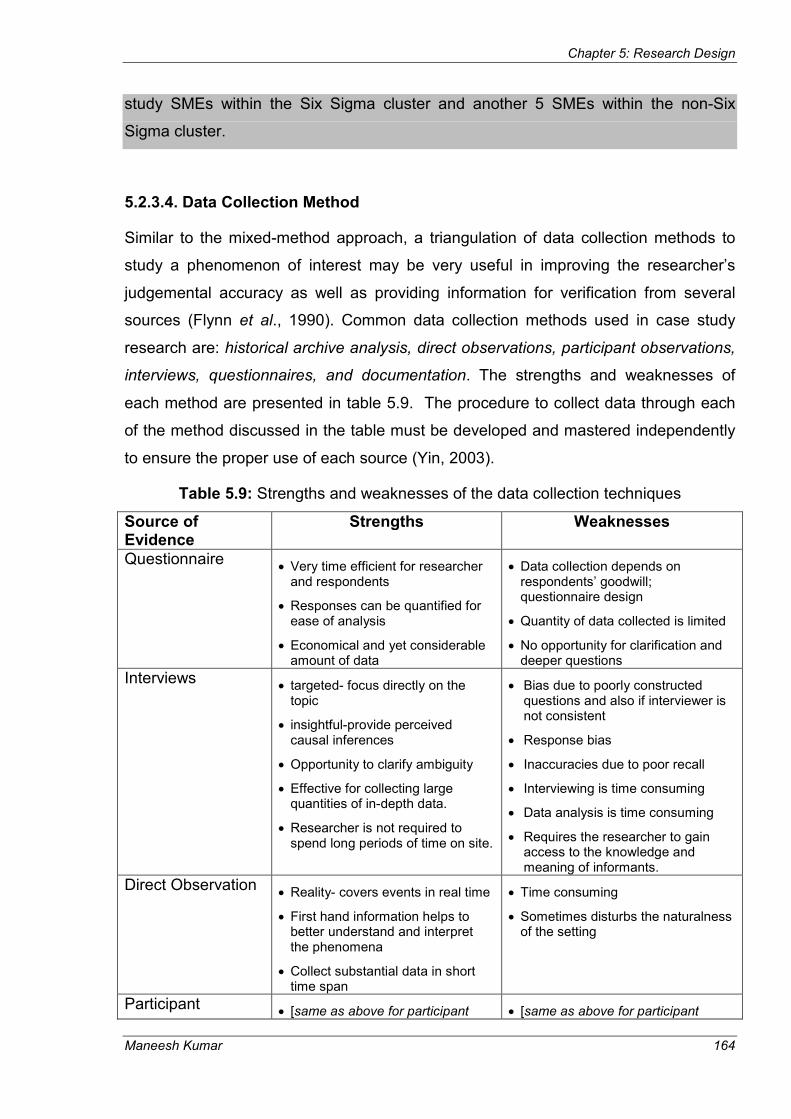
Chapter 5: Research Design
Maneesh Kumar 164
study SMEs within the Six Sigma cluster and another 5 SMEs within the non-Six
Sigma cluster.
5.2.3.4. Data Collection Method
Similar to the mixed-method approach, a triangulation of data collection methods to
study a phenomenon of interest may be very useful in improving the researcher’s
judgemental accuracy as well as providing information for verification from several
sources (Flynn et al., 1990). Common data collection methods used in case study
research are: historical archive analysis, direct observations, participant observations,
interviews, questionnaires, and documentation. The strengths and weaknesses of
each method are presented in table 5.9. The procedure to collect data through each
of the method discussed in the table must be developed and mastered independently
to ensure the proper use of each source (Yin, 2003).
Table 5.9: Strengths and weaknesses of the data collection techniques
Source of Evidence
Strengths Weaknesses
Questionnaire • Very time efficient for researcher
and respondents
• Responses can be quantified for ease of analysis
• Economical and yet considerable amount of data
• Data collection depends on respondents’ goodwill; questionnaire design
• Quantity of data collected is limited
• No opportunity for clarification and deeper questions
Interviews • targeted- focus directly on the
topic
• insightful-provide perceived causal inferences
• Opportunity to clarify ambiguity
• Effective for collecting large quantities of in-depth data.
• Researcher is not required to spend long periods of time on site.
• Bias due to poorly constructed questions and also if interviewer is not consistent
• Response bias
• Inaccuracies due to poor recall
• Interviewing is time consuming
• Data analysis is time consuming
• Requires the researcher to gain access to the knowledge and meaning of informants.
Direct Observation • Reality- covers events in real time
• First hand information helps to better understand and interpret the phenomena
• Collect substantial data in short time span
• Time consuming
• Sometimes disturbs the naturalness of the setting
Participant • [same as above for participant • [same as above for participant

Chapter 5: Research Design
Maneesh Kumar 165
Observation observations]
• Insightful into interpersonal behaviour and motives
observations]
• Bias due to investigator’s manipulation of events
Diary Records
• Get information from the perspective of the employee.
• Very appropriate during data analysis and writing up stage
• Difficulty to analyse the data
Documentation • Stable- can be reviewed
repeatedly
• Data can be traced back over time
• Cost effective way to getting the data
• Documents may be limited and unavailable
• Low reliability– reflects unknown bias of researcher
• Sometimes difficult to get access
Archival Records • [same as above for documentation]
• Precise and quantitative
• No manipulation of data is possible
• [same as above for documentation]
• Accessibility restriction due to privacy reasons
(Adopted and Modified from: Barnes, 2001; Yin 2003:86; Martinez, 2003; Shamsuddin, 2007)
Interviews are considered the best method of gathering large amount of in-depth data
in a short time span while conducting a case study (Marshal and Rossman, 1995;
Easterby-Smith et al., 2002; Yin, 2003). Depending on the purpose of the research,
the interview may take a structured format with specific questions for the interviewee
or it can be a semi-structured, open-ended type to enable interviewees to expand on
the topic they consider as important and to frame those issues in their terms to open
up new lines of enquiry (Meredith et al., 1989; Barnes, 2001; Yin, 2003; Ates, 2008).
The critical differences between structured interviews and semi-
structured/unstructured interviews are presented in table 5.10.
Table 5.10: Differences between types of interviews
Structured interviews Semi-structured/ unstructured interviews
Standardised pre-prepared questions to impose a structure
Flexible framework to open up new lines of enquiry
Easier to time and control the interview More time consuming and chances to digress away from the topic of interest
Suitable for less experienced interviewer Need for experienced interviewer who can hold an interesting conversation during the interview
Comparable data Can be difficult to compare the results
Difficult to follow-up point of interest or emerging themes
New points or emerging themes are followed up
(Source: Yin, 2003; Ates, 2008)
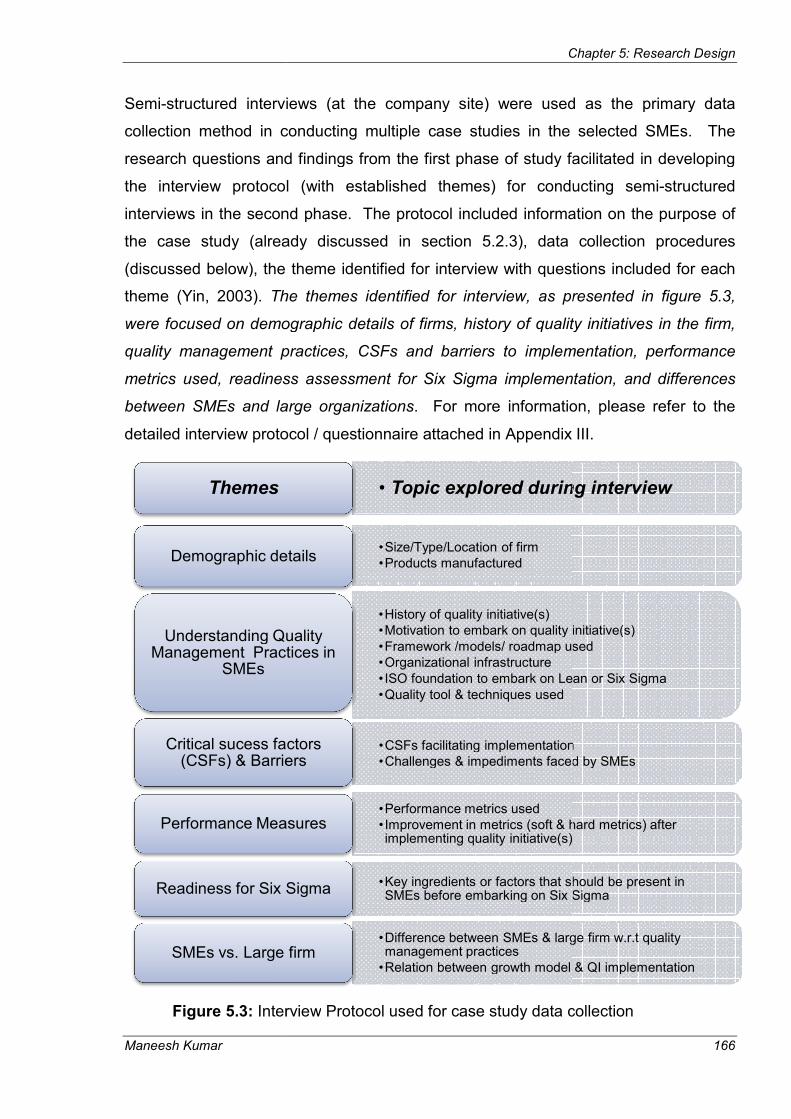
Maneesh Kumar
Semi-structured interviews (at the company site) were used as the primary data
collection method in conducting multiple case studies in the selected SMEs. The
research questions and findings from the first phase of study facilitated in developing
the interview protocol (with established themes) for conducting semi
interviews in the second
the case study (already discussed in section 5.2.3), data collection procedures
(discussed below), the theme identified for interview with questions included for each
theme (Yin, 2003). The theme
were focused on demographic details of firms, history of quality initiatives in the firm,
quality management practices, CSFs and barriers to implementation, performance
metrics used, readiness assessm
between SMEs and large organizations
detailed interview protocol / questionnaire attached in Appendix III.
Figure 5.3: Interview
Themes
Demographic details
Understanding Quality Management Practices in
SMEs
Critical sucess factors (CSFs) & Barriers
Performance Measures
Readiness for Six Sigma
SMEs vs. Large firm
Chapter 5: Research D
structured interviews (at the company site) were used as the primary data
in conducting multiple case studies in the selected SMEs. The
research questions and findings from the first phase of study facilitated in developing
the interview protocol (with established themes) for conducting semi
interviews in the second phase. The protocol included information on the purpose of
the case study (already discussed in section 5.2.3), data collection procedures
(discussed below), the theme identified for interview with questions included for each
The themes identified for interview, as presented in figure 5.3,
were focused on demographic details of firms, history of quality initiatives in the firm,
quality management practices, CSFs and barriers to implementation, performance
metrics used, readiness assessment for Six Sigma implementation, and differences
between SMEs and large organizations. For more information, please refer to the
detailed interview protocol / questionnaire attached in Appendix III.
Interview Protocol used for case study data collection
• Topic explored during interview
•Size/Type/Location of firm•Products manufacturedDemographic details
•History of quality initiative(s)•Motivation to embark on quality initiative(s)•Framework /models/ roadmap used•Organizational infrastructure• ISO foundation to embark on Lean or Six Sigma•Quality tool & techniques used
Understanding Quality Management Practices in
•CSFs facilitating implementation•Challenges & impediments faced by SMEs
Critical sucess factors (CSFs) & Barriers
•Performance metrics used • Improvement in metrics (soft & hard metrics) after implementing quality initiative(s)
Performance Measures
•Key ingredients or factors that should be present in SMEs before embarking on Six SigmaReadiness for Six Sigma
•Difference between SMEs & large firm w.r.t quality management practices
•Relation between growth model & QI implementationSMEs vs. Large firm
Chapter 5: Research Design
166
structured interviews (at the company site) were used as the primary data
in conducting multiple case studies in the selected SMEs. The
research questions and findings from the first phase of study facilitated in developing
the interview protocol (with established themes) for conducting semi-structured
phase. The protocol included information on the purpose of
the case study (already discussed in section 5.2.3), data collection procedures
(discussed below), the theme identified for interview with questions included for each
s identified for interview, as presented in figure 5.3,
were focused on demographic details of firms, history of quality initiatives in the firm,
quality management practices, CSFs and barriers to implementation, performance
ent for Six Sigma implementation, and differences
. For more information, please refer to the
detailed interview protocol / questionnaire attached in Appendix III.
ata collection
Topic explored during interview
Motivation to embark on quality initiative(s)Framework /models/ roadmap used
ISO foundation to embark on Lean or Six Sigma
CSFs facilitating implementationChallenges & impediments faced by SMEs
Improvement in metrics (soft & hard metrics) after
Key ingredients or factors that should be present in SMEs before embarking on Six Sigma
Difference between SMEs & large firm w.r.t quality
Relation between growth model & QI implementation
Chapter 5: Research Design
Maneesh Kumar 167
At least two employees were interviewed in each case study company with a
maximum of four interviews in two case study firms. Twenty-four semi-structured
interviews were conducted in the ten case study firms, with each interview lasting for
approximately ninety minutes. The position of the interviewees ranged from top
management level to middle level management, including Managing Director to
Operations/ Quality Manager, HR manager, Production/ Quality Engineer. Shop-floor
employees were excluded from the interview process as the focus of the research was
more on the implementation issues of quality initiatives, framework used for
implementation, CSFs and barriers encountered during implementation, performance
improvement after implementation, to name a few. Semi-structured interviews were
the preferred method over the structured interviews to enable the generation of new
ideas and leading questions through open discussion with the interviewees.
Data collection through interviews was enhanced by digitally recording the data rather
than meticulously taking notes that may result in loss of information. On-site interviews
facilitated data triangulation by collecting supplementary data through non-participant
observations at the company site and archival records that the company had on its
performance over the last few years. Participant observations in this case were not a
feasible option due to time and financial constraints. Interviewing multiple respondents
in an organization helped data triangulation through comparison of reports and
interpretation of various respondents transcript.
Some information on quality management practices in SMEs, CSFs and barriers to
implementation information was captured in the first phase of research through
questionnaire. The author’s intention in the interview was to capture the data on the
same theme without providing a structured questionnaire. This will minimize the
response biasness on the part of the interviewee and information gathered would
better reflect the original thoughts of respondents.
Apart from 24 interviews in 10 case study SMEs, three more interviews were
conducted with the quality management/ Lean Six Sigma practitioners from the
Manufacturing Advisory Services (MAS) in England, Manufacturing Institute (MI), and
Scottish Manufacturing Advisory Services (SMAS) to get an actual picture on the
status of quality management practices in SMEs. The reason for selecting
practitioners from was due to the following reasons:
Chapter 5: Research Design
Maneesh Kumar 168
- MAS/MI/SMAS are government funded bodies established for helping SMEs to
improve their business processes and performance
- Practitioners involved in these bodies have experience in conducting diagnostic
testing to resolve quality related issues in SMEs by providing solutions for
process improvement. The selected interviewees had an experience of
resolving quality issues in more than 100 SMEs.
- Being involved in day to day activities of SMEs, these practitioners may provide
a more accurate picture on the current status of quality management practices;
impact of initiatives like Lean and Six Sigma on the business performance;
challenges and barriers faced by SMEs in implementing different quality
initiatives; quality tools & techniques used by SMEs, to name a few.
To answer the RQ5 on Six Sigma Readiness Index, data was also collected from
delegates attending the 3rd International Conference on Six Sigma in Edinburgh on
15th -16th December 2008. Thirty delegates (including Six Sigma experts such as Prof.
D.C. Montgomery and Dr. Roger Hoerl and other delegates from industry and
academics across the globe) attending the workshop on ‘Six Sigma for SMEs’,
delivered by the author and his Director of Studies, were asked to rank the top six out
of ten CSFs (identified from the first two phases of the doctoral study), using an
electronic voting pad, that they considered important and should be present in any
organizations before they embark on the Six Sigma journey.
5.2.3.5. Qualitative Data Analysis
Qualitative data analysis could be linked to completing a jigsaw puzzle in which the
pieces represents the data (Saunders et al., 2007). Analysis of large amount of
information gathered through interview is the biggest challenge in qualitative research
(Yin, 2003; Eisenhardt, 1989). The challenge faced by the researcher is how to
condense the rich data into a format that could be convincingly comprehended by a
target audience (Easterby-Smith et al., 2002). As stated by Eisenhardt (1989)-
“Analyzing data is the heart if building theory from case studies but it is both the most
difficult and the least codified part of the process”. Miles and Huberman (1994)
provided logical guidelines for qualitative data analysis and suggested several

Chapter 5: Research Design
Maneesh Kumar 169
techniques for data presentation and analysis. Their proposed methods are being
used to date by qualitative researchers for data analysis.
Several methods for qualitative data analysis have been proposed to date that
includes content analysis, grounded theory, cognitive mapping, repertory grid, protocol
analysis, pattern matching, critical incident techniques to name a few (Easterby-Smith
et al., 2002; Miles and Huberman, 1994; Yin, 2003). Content analysis and pattern
matching are widely cited techniques for qualitative data analysis (Saunders et al.,
2007; Easterby-Smith, 2002). Content analysis facilitates in accepting or rejecting a
priori hypothesis by identifying causally linked variables. Similarly, pattern matching is
used in explanatory or descriptive case studies to establish causal relationships
between variables, thus ensuring internal validity (Eisenhardt, 1989). The software
packages such as NVIVO, NUD.IST, CAQDAS are also becoming popular for coding,
generating patterns from large amount of narrative texts collected from open-ended
interview or from historic documents (Yin, 2003). Two of the other most commonly
used and cited techniques for qualitative data analysis are - a three step proposal by
Miles and Huberman (1994): data reduction; data display; and drawing conclusions;
and a two step process proposed by Eisenhardt (1989): within- case analysis and
cross-case analysis.
In this study, no priori hypothesis was proposed or attempt made to identify causal
relationship between variables. The focus here was more on exploring and
understanding the quality management practices within two clusters, i.e. Six Sigma
SME and Non-Six Sigma SME and developing ideas/ generating hypotheses for
further research rather than establishing relationships between variables. Thus,
content analysis and pattern matching was not adopted for data analysis in this
research. This also resulted in not using software packages for generating patterns.
Other reasons for not using software packages for analysis were- interview protocol
with roughly identified themes were developed beforehand to facilitate data analysis;
and also data collected through interviews were manageable to transcribe, document
& display using the established theme within the interview protocol. The author has
used the three step technique proposed by Miles and Huberman (1994) and the two
step process proposed by Eisenhardt (1989), which is simple, comprehensive, and
most widely cited, for analyzing the interview data collected from the 10 case studies.
The aforementioned techniques were briefly presented below.
Chapter 5: Research Design
Maneesh Kumar 170
5.2.3.5.1. Data reduction
It is the first step in qualitative data analysis, where the researcher is required to
sharpen, sort, focus, discard, or organize data, accumulated through written-up field
notes or transcription, to draw a final conclusion and verify it (Miles and Huberman,
1994). It involves activities such as written summaries of cases, coding, generating
themes, making cluster or partitions, to name a few. In this research, the author
generated case study reports/ summaries based on themes identified in interview
protocol. The documentation of each case was done after each company visit so that
no important information or data was lost.
5.2.3.5.2. Data display
Miles and Huberman (1994) define display as “an organized compressed assembly of
information that permits conclusion drawing and action”. The data display helps the
audience to understand things happening within or across cases, based on which
some further actions could be taken. Few methods of data display suggested by Miles
and Huberman (1994) are charts, matrixes, tables, grid, and networks. Charts,
matrixes, and tables were used as a data display techniques to present the qualitative
data collected in the second phase of research. For more information on data display
technique, refer to Chapter 7 and Chapter 8.
5.2.3.5.3. Data analysis and drawing conclusions
Data analysis is the next step once the researcher has identified the methods of data
display. Within-case analysis is the next step in analysis followed by cross-case
analysis of participating case study firms. In within-case analysis, detailed write-ups
(case-study reports) are used to gain familiarity with each case as a stand-alone entity
(Eisenhardt, 1989). This facilitates in identification of key themes and unique findings
emerging from each case which could be used later in cross-case analysis to compare
and contrast findings across cases. Within-case analysis familiarises the researcher
with individual cases that further accelerates the cross-case analysis. In cross-case
analysis, the author compares the findings across the cases with respect to categories
or dimensions identified during the data reduction process or using the themes
developed in the interview protocol for comparison across cases. It looks into
Chapter 5: Research Design
Maneesh Kumar 171
similarities and differences between cases. It also enhances the external validity or
generalisability of the research findings (Voss et al., 2002). A minimum of two samples
are required for cross-case comparison. Based on within-case and cross-case
analysis, conclusions are drawn related to the research questions posed.
The case study design used in this study was multiple-holistic approach (discussed in
section 5.2.3.1) and primary unit of analysis was the Six Sigma firms and the non-Six
Sigma firms (discussed in section 5.2.3.3). Based on the above design and unit of
analysis, a within case analysis was conducted in the two clusters- Six Sigma firms
and non-Six Sigma firms. Within each cluster, cross–case analysis was conducted
across the five firms of each cluster. Cross case analysis was also conducted between
the clusters and findings were presented in Chapter 8.
5.2.3.6. Ethical issues
Ethics, in the context of research, refers to the appropriateness of your behaviour in
relation to rights of those who become the subject of your work, or are affected by it
(Saunders et al., 2007). The nature of business and management research is such
that one will be dependent on other people for access and the closer the research to
actual individuals in real world settings, the more likely are the ethical questions to be
raised.
Activities such as gaining access to companies, interviewing some employees,
documenting observations on-site were the key ethical issues involved in the author’s
doctoral research. An initial contract was agreed between the author and interviewees
before the commencement of each case study on maintaining the anonymity and
confidentiality of data, interviewees, and the companies in the future. During interview,
it was kept in mind that questions were structured in a way that does not invade the
privacy or hurts the sentiment of the interviewees. It was also agreed to maintain the
anonymity of the respondent / company during reporting the results. Interviewees
were also requested to review the case study report after transcription of the interview
data to agree on the content of the report. After receiving the comments and consent
from interviewees, reports were revised and used for data analysis. Interviewees
provided their consent that any findings from the case study are publishable in a
journal or magazine, provided the company /respondent was not readily identifiable.

Chapter 5: Research Design
Maneesh Kumar 172
5.2.4. Methodology used in the third phase of research
The findings from the first two phases were used in conjunction with literature to
develop a Six Sigma Readiness Index (that assesses SMEs readiness to embark on
Six Sigma journey) and a practical framework for Six Sigma implementation in SMEs.
The index and the framework was tested in three SMEs (selected from case-study
sample- two implementing Six Sigma and another non implementer of Six Sigma) by
conducting interviews with six respondents (at middle management level) from the
three firms and seeking their viewpoints on the proposed index and framework. The
suggestions from the interviewees were used to revise the index and framework.
Other types of research strategies not used in this research are briefly discussed in
the next four sections.
5.2.5. Experiment
Experiment is used to understand the causality in the quantitative research or
positivist paradigm, ensuring internal validity (Bryman and Bell, 2007; Saunders et al.,
2007). Experiment is not a common strategy within operations management research
simply because of the problem of achieving the requisite level of control in the
operations of the real world organization (Meredith et al., 1989). Some typical
experimental designs are
- Classical experimental design: where the experimental group receives treatment
and compared against a control group (which does not receive any treatment) with
regard to a dependant variable.
- Laboratory experiment: where the researcher has greater influence over the
experimental arrangements that may enhance the internal validity of the study as
compared to field experiments in real-life organizations. It is also easier to
replicate due to a greater control over the experiment.
- Quasi-experiment: in such experiments, it is not possible to randomly assign
subjects to experimental and control groups.
Chapter 5: Research Design
Maneesh Kumar 173
5.2.6. Grounded Theory
Grounded theory (GT) was discovered by Glaser and Strauss in 1967 to develop
theory from the data generated by a series of observations/fieldwork in the process of
conducting research (Saunders et al., 2007). Though the strategy follows the inductive
approach, the data collection methods used to generate theory may be the
combination of qualitative or quantitative research. GT investigates the actualities in
the real world and analyses the data with no preconceived hypothesis (Glaser &
Strauss, 1967). In the GT data analysis, concepts are searched for behind the
actualities by looking for codes, then concepts and finally categories. This strategy
requires a steady movement and comparison between concept and data, and also
requires a continuous comparison across the types of evidence to control the
conceptual level and scope of the emerging theory (Rowlands, 2005). Other key
features of GT are (Ates, 2008):
- GT focuses on how individuals interact in relation to the phenomenon under study
- Data analysis starts immediately after first set of data is collected
- The emerging concepts from the data analysis decides upon the further collection
of data
- Data collection stops when no new conceptualization emerges
5.2.7. Ethnography
Ethnography emanates from the field of anthropology and follows an inductive
approach to research (Saunders et al., 2007). A popular definition of ethnography is
found in Hammersley and Atkinson (1995: 1), who write of ethnography, "We see the
term as referring primarily to a particular method or sets of methods. In its most
characteristic form it involves the ethnographer participating, overtly or covertly, in
people's lives for an extended period of time, watching what happens, listening to
what is said, asking questions—in fact, collecting whatever data are available to throw
light on the issues that are the focus of the research”. The purpose of ethnographic
study is to interpret the cultural understanding of the population under study in the way
in which they interpret it. This increases the chance of biasness in the way
researchers comprehend the interpretation. While not inherent to the method, cross-

Chapter 5: Research Design
Maneesh Kumar 174
cultural ethnographic research runs the risk of falsely assuming that given measures
have the same meaning across cultures.
5.2.8. Action Research
Kurt Lewin, in 1946 first coined the term “action research” (Saunders et al., 2007),
defining action research as “a comparative research on the conditions and effects of
various forms of social action and research leading to social action” that uses “a spiral
of steps, each of which is composed of a circle of planning, action, and fact-finding
about the result of the action”. Since then, it had been interpreted in several ways by
management researchers. Eden and Huxham (1996) commented on the role of action
research in the theory building process, in which theory develops from the analysis
and synthesis of the data generated from a series of events as the designated issue is
confronted by the researcher (Coughlan and Coghlan, 2002), who is part of
organization within which the research and change process are taking place. Theory
generated through action research is specific to the context of action and is not aimed
at creating universal knowledge. The key differentiator between action research and
other strategies is its focus upon resolving issues and bringing change; aims at solving
problems and contributing to science; focus on holistic and contextual understanding
of phenomena; facilitate incremental theory building; and generalization takes place
through conceptualization of a particular experience and linking to the theory
(Saunders et al., 2007; Clough and Nutbrown, 2002; Mendibil, 2003, Lopez, 2005,
Shamsuddin, 2007).
5.2.9. Rationale for the choice of Research Strategy
Experiment was not used in this research due to the control required to conduct the
research and also because focus of this study was not to establish the causal relations
between factors, which is the key objective while conducting an experiment. Grounded
theory was not used as the author was using the already established theme to capture
the viewpoints of interviewees rather than collecting data and trying to identify
emerging concepts. Grounded theory may be used to study data from an exploratory
case study and to drive data collection activities within and outside the case study.
Ethnography research was not used as it is often time consuming and takes place

Chapter 5: Research Design
Maneesh Kumar 175
over an extended time period. As the objective of the study was only to understand the
quality management practices in Six Sigma and non-Six Sigma firms through use of
questionnaire and interviews; no attempt was made to bring any changes in the
practices of the participating firms, which is the goal of the ‘action research’ approach.
Hence action research was also not the preferred method for this research. After
briefly discussing each strategy and its characteristics, it can be said that mixed
method approach of survey and case study was best suited to address the key
research questions within the given time period and available resources. The survey
provided the general view of quality management practices in SMEs and the case-
study gave an opportunity to conduct an in-depth investigation into the phenomenon of
interest using data collection techniques such as the ‘questionnaire, interviews,
observation and documentation’.
5.3. Criteria for judging the Quality of Research Design
This section explains the research quality criteria used during the research design to
establish the quality of this research, i.e. ensure the reliability and validity of this
research and also to explicitly demonstrate the contribution made to the theory and
practice of Six Sigma in the SME environment. The six quality criteria identified
through the literature review process (Miles and Huberman, 1994; Stake, 1995;
Meredith, 1998; Easterby-Smith et al., 2002; Voss et al., 2002; Yin, 2003; Ates, 2008)
to establish the quality of this research are
1. Construct Validity
2. Internal Validity (for case study) / Content Validity (for survey)
3. External Validity / Generalisability
4. Reliability
5. Contribution to theory / knowledge
6. Contribution to practice
Measurement quality refers to the reliability and validity of the measurement
instruments used to collect data, particularly in the case when the researcher is
seeking to test relationships among constructs using multi-item measures of a variable
(Rungtusanatham et al., 2003; Malhotra and Grover, 1998; Voss et al., 2002, Yin,
2003). Reliability is concerned with the stability and consistency in measurement,

Chapter 5: Research Design
Maneesh Kumar 176
while validity is concerned with whether the right concept is being measured (Forza,
2002; Miles and Huberman, 1994; Saunders et al., 2007; Voss et al., 2003; Yin, 2003).
The literal meaning of the reliability and the validity tests are similar for survey and
case study approach, though the tactic used to address each criterion may vary for
case study research (as shown in table 5.11). Theoretical contribution refers to the
ability of research to link with theory (Yin, 2003; Easterby-Smith et al., 2002), whereas
practical contribution refers to usefulness, functionality, practicality of research and
how it has served the purpose (Miles and Huberman, 1994).
Table 5.11: Reliability and validity in case research
Test Case Study Tactic Phase of research in which tactic occur
Reliability � Use case study protocol
� Develop case study database
� Data collection
� Data collection
Construct validity � Use multiple sources of evidence
� Establish chain of evidence
� Have key informants review draft case study report
� Data collection
� Data collection
� Composition Internal validity
� Do pattern-matching
� Do explanation-building
� Address rival explanations
� Use logic models
� Data analysis
� Data analysis
� Data analysis
� Data analysis External validity
� Use theory in single-case studies
� Use replication logic in multiple-case studies
� Research design
� Research design
(Source: Yin, 2003, p. 34)
This research embraces a triangulation approach at both methodological level and
data collection level to enhance the reliability and validity of research. The data
analysis technique used for this research, i.e. data reduction (enhances reliability of
data collection and construct validity), data display (enhances internal validity of
analysis), within case analysis (internal validity of analysis), and cross-case analysis
(enhances the potential of generalization of the research findings) further enhanced
the quality criteria of reliability and validity for this research (Yin, 2003; Voss et al.,

Chapter 5: Research Design
Maneesh Kumar 177
2002). Chapter 10 includes discussion on how each of the aforementioned quality
criteria in table 5.11 was addressed in this doctoral research.
5.4. Summary
Research design not only governs the use of appropriate research strategy and data
collection methods but also the findings and type of conclusions drawn from this
research. Therefore, it was imperative for the author to clearly understand the concept
of research design and its impact on the findings of the research. This chapter
included discussion on different research strategies and data collection methods and
provides justification for the choice of the mixed method approach of survey and case
study for this research. Table 5.12 links the use of different strategies to answer the
research questions. The data collection methods used for this research included
survey questionnaire, semi-structured interviews in case study firms along with
company reports and data collected through on-site observations.
Table 5.12: Link between research question and research strategy
Research Questions Strategy Data Collection method(s)
Where in the thesis?
What makes SMEs different from large organizations?
Case Study Interview protocol Ch 2, 7, 8
What are the critical differences in quality management practices of Six Sigma and non-Six Sigma SMEs?
Survey Case Study
Interview protocol, Observation, Questionnaire
Ch 6, 7, 8
What are the critical success factors and barriers to implementation of Six Sigma in SMEs?
Survey Case Study
Interview protocol, Observation, Questionnaire
Ch 6,7,8
Does the performance of Six Sigma firms differ from non-Six Sigma firms?
Survey Case Study
Interview protocol, Observation, company report, Questionnaire
Ch 6,7,8
How to assess the readiness of a SME to embark on Six Sigma journey?
Case Study Viewpoints of attendees in
an International Conference
Interview protocol, Voting Pad
Ch 7,8, 9
The chapter also included discussion on design of survey instrument and interview
protocol; sample selection criteria for survey and case-studies; and research quality
criteria to establish the quality of this research. This chapter provides the base for
conducting data analysis in Chapter 6, 7, 8, and 9.

Chapter 6: Survey Data Analysis
Maneesh Kumar 178
Chapter 6
Survey Data Analysis
6.0. Introduction
This chapter presents finding from an exploratory survey conducted in the UK
manufacturing SMEs. The purpose of the survey was to identify critical differences, if it
exists, in the quality management (QM) practices of Six Sigma and Non-Six Sigma
SMEs. Analysis of survey instrument provided greater understanding of the quality
management practices in SMEs and identified firms implementing different quality
initiatives such as Lean, Six Sigma, TQM, Kaizen, or certification system like ISO
9000 or Investors in People. The data analysis was conducted in SPSS 15.0 and
excel worksheet and the results were primarily based on descriptive statistics.
However, the application of inferential statistics was not precluded from the analysis
and was used at several places to statistically identify and validate the degree of
correlations or association between different variables. The output / findings from this
phase of study were used as an input to the second phase of research when
conducting multiple-case studies in ten SMEs identified from the survey responses.
The next section presents findings from the survey with major focus on following
themes: demographic information; quality management practices in different type/size
of SMEs; critical success factors (CSFs) and barriers to implementation; and impact of
quality initiatives on performance of SMEs.
6.1. Demographic Information
The demographic details pertaining to samples companies includes information on the
type of firm (local, joint venture, or the part of multi-national corporation [MNC]);
location of the firm within the UK; type of manufacturing industry which includes 13
categories; size (small or medium); annual turnover ranging from less than £1 million
to over £50 million; and position of the respondents including CEO/ Managing
Director, departmental head, quality manager and others. For more information about
the questionnaire, please refer to Appendix II. These variables may also be termed as

Maneesh Kumar
control variables, used in later part of analysis to understand the QM practices within
sample firms. Variables such as
whether there were any significant differe
practices of a local firm as compared to a firm being part of MNC or small firms in
comparison to medium
the representation of sample across the country to
with respect to the location of the firm. The analysis of demographic details of
aforementioned variables from the survey instrument was discussed below.
Among the 64 responding SMEs, 49 firms (76.56%) were independent loca
(21.88%) firms were part of MNC and one being a joint venture company.
Geographically, majority of the SMEs were located UK wide (43 or 67.1
in figure 6.1. SMEs located UK wide had production site at one location and other
support processes such as marketing and sales, customer service located nationally.
Some of these firms were also part of MNC, operating at different locations within
UK and having diversified businesses such as automotive, aerospace,
telecommunication, etc
Figure 6.1
The distribution of 64 manufacturing firms in different type of industry was presented in
table 6.1. It can be gauged from table 6.1 that the sample was representative of
different kind of man
Chapter 6: Survey Data Analysis
control variables, used in later part of analysis to understand the QM practices within
sample firms. Variables such as type and size of firm provided useful information as
whether there were any significant differences in working culture and business
practices of a local firm as compared to a firm being part of MNC or small firms in
comparison to medium-sized firms. Moreover, it also provided useful information on
the representation of sample across the country to minimize the element of biasness
with respect to the location of the firm. The analysis of demographic details of
aforementioned variables from the survey instrument was discussed below.
Among the 64 responding SMEs, 49 firms (76.56%) were independent loca
(21.88%) firms were part of MNC and one being a joint venture company.
Geographically, majority of the SMEs were located UK wide (43 or 67.1
in figure 6.1. SMEs located UK wide had production site at one location and other
processes such as marketing and sales, customer service located nationally.
Some of these firms were also part of MNC, operating at different locations within
UK and having diversified businesses such as automotive, aerospace,
telecommunication, etc to name a few.
Figure 6.1: Location of sample SMEs within UK
The distribution of 64 manufacturing firms in different type of industry was presented in
table 6.1. It can be gauged from table 6.1 that the sample was representative of
different kind of manufacturing companies ranging from aerospace, automotive,
Chapter 6: Survey Data Analysis
179
control variables, used in later part of analysis to understand the QM practices within
provided useful information as
nces in working culture and business
practices of a local firm as compared to a firm being part of MNC or small firms in
sized firms. Moreover, it also provided useful information on
the element of biasness
with respect to the location of the firm. The analysis of demographic details of
aforementioned variables from the survey instrument was discussed below.
Among the 64 responding SMEs, 49 firms (76.56%) were independent local firms, 14
(21.88%) firms were part of MNC and one being a joint venture company.
Geographically, majority of the SMEs were located UK wide (43 or 67.1%) as depicted
in figure 6.1. SMEs located UK wide had production site at one location and other
processes such as marketing and sales, customer service located nationally.
Some of these firms were also part of MNC, operating at different locations within the
UK and having diversified businesses such as automotive, aerospace,
Location of sample SMEs within UK
The distribution of 64 manufacturing firms in different type of industry was presented in
table 6.1. It can be gauged from table 6.1 that the sample was representative of
ufacturing companies ranging from aerospace, automotive,

Chapter 6: Survey Data Analysis
Maneesh Kumar 180
electronics and semiconductors to food, paper and plastic manufacturing industry. The
other category includes manufacturer of window blinds, packaging materials, cosmetic
and toiletries; construction equipments and tools (3); and oil & gas (4).
Table 6.1: Industry Specialization of sample firms
Industry specialization Count
Automotive 3
Textiles 3
Chemical 5
Aerospace 3
Electrical 7
Pharmaceuticals 3
Printing/paper 5
Mechanical 6
Food 7
Electronics & Semiconductor 8
Others 14
One of the control variables included in the survey was size of the company, i.e. small
(< 50 employees) and medium-sized company (50-249 employees). Twenty five
percent of the respondents were in small firm category and seventy five percent
belonged to medium-sized category. This variable facilitated in exploring the
relationship between size of the firm and its impact on organizational performance. A
clustered bar chart was plotted for size of the company against its annual turnover, as
shown in figure 6.2. Out of 64 companies, 4 companies were not happy to discuss
their annual turnover and thus not plotted in the chart.
The figure shows that there was significant variation in annual turnover within each
sub group (small and medium). In order to prove it statistically and test whether there
was any association between size and annual turnover of the company, a chi-square
test was performed at 5% significance level.

Chapter 6: Survey Data Analysis
Maneesh Kumar 181
Figure 6.2: A clustered bar chart plot of size against company's annual turnover
The hypothesis proposed was
H0: There is no association between size and annual turnover of the firm (Null
hypothesis)
H1: There is significant association between size and annual turnover of the firm
(Alternate hypothesis)
The p-value in the table 6.2, i.e. 0.043, was less than 0.05, resulting in the rejection of
null hypothesis and acceptance of alternate hypothesis. Hence, the chi-square test
implies that there was significant association between the size and annual turnover of
the firm. The smaller the firm in terms of number of employees, the lesser is the
annual turnover of the company.
Table 6.2: Chi-Square test between size of firm and its annual turnover
1
12
19
2
18
43
1
0
2
4
6
8
10
12
14
16
18
20
Small (10-49) Medium (50-249)
C
o
u
n
t
No. of Employees
less than £1 m
b/w £1-£10 m
b/w £10-£20 m
b/w £20-£30 m
b/w £30-£50 m
over £50 m
Company Annual
Turnover
Value df Asymp. Sig. (2-sided)
Pearson Chi-Square 11.174(a) 5 .043
Likelihood Ratio 13.096 5 .022
Linear-by-Linear Association 7.965 1 .005
N of Valid Cases 60

Chapter 6: Survey Data Analysis
Maneesh Kumar 182
6.2. Quality Management Practices in SMEs
6.2.1. History of Quality Initiatives in SMEs
The respondents were asked to list the quality initiatives implemented in the past or
currently implemented in the firm. As depicted in table 6.3, majority of SMEs had ISO
certification in place followed by implementation of Lean, Investors in People (IIP) and
Six Sigma. Some of the SMEs had listed the implementation of two to three quality
initiatives in the past. The average duration of implementation of Lean or Six Sigma in
SMEs was 4 years that clearly indicates its limited application in a SME environment.
Table 6.3: History of quality initiatives in SMEs
Quality Initiatives Undertaken Count %
Six Sigma 10 15.6%
TQM 5 7.8%
Lean 23 35.9%
Kaizen 7 10.9%
Business process re-engineering (BPR) 1 1.6%
Theory of Constraints (TOC) 1 1.6%
ISO 9000 49 76.6%
Investors in People (IIP) 10 15.9%
European Foundation for Quality Management (EFQM) 0 0%
Others 9 14.3%
No initiative undertaken 8 12.5 %
Majority of firms that have embarked on the bandwagon of Lean and Six Sigma had
gone through the route of ISO certification in past. Further in-depth analysis revealed
that 17 out of 23 (approximately 74%) Lean firms had ISO 9000 certification in place
before embarking on Lean Journey. Another interesting outcome of the analysis
showed that 10 of these 17(59%) Lean firms have embarked on Six Sigma. This
analysis gives an indication that ISO may be the foundation or building block before
embracing Lean and Six Sigma. This trend had emerged from the analysis, though it
was not the key focus of this study. To add validity to the aforementioned statement,

Chapter 6: Survey Data Analysis
Maneesh Kumar 183
i.e. ISO as a foundation to embark on Six Sigma, author decided to further investigate
the aforementioned statement during the second phase of the study, i.e. while
conducting multiple case studies within selected SMEs.
No SMEs in the sample have implemented the European Foundation for Quality
Management (EFQM) assessment model, which further confirms the argument in the
literature that EFQM was not suitable for SMEs. From the analysis, it was found that 8
(12.5%) responding firms do not have any kind of quality improvement methodology or
systems in place. The focus in these firms was more on meeting the productivity
targets and customers’ delivery deadline. Majority of the respondents in the other
category were implementing British Retail Consortium (BRC) certification, especially
within the food industry.
In the analysis to follow, two categories were formed based on the type of quality
initiatives in SMEs. In the category one was included firms implementing the following
quality initiatives: Six Sigma and ISO certification; Lean only; Lean and ISO
certification; Lean, ISO, and Six Sigma. Second category included firms that were
implementing other initiatives or certification system such as TQM, ISO 9000, Kaizen,
BPR, TOC, or initiatives in other category such as BRC. The category one was
renamed as Six Sigma SMEs (SSS) and category two as non-Six Sigma SMEs
(NSSS) for conducting analysis in the sections to follow. The rationale behind
combining Lean and Six Sigma SMEs in one category was due to the similarity in
performance of firms implementing either/ both initiatives. Moreover, the analysis of
QM practices in both firms (such as winning customer loyalty, knowledge transfer
mechanism, company strategic objective, customer focused measures, to name a
few) yielded similar results with respect to the variables mentioned above. The second
category also included those ISO certified firms that were not implementing Lean and
Six Sigma. The category one includes 23 firms classified as SSS and category two
includes remaining firms classified as NSSS.
6.2.2. Existence of quality department and problem solving team in SMEs
The questionnaire captured information on whether SMEs have any quality
department, teams for problem solving and frequency of team meetings, training
provisions in the company, and measures used for capturing voice of customers.
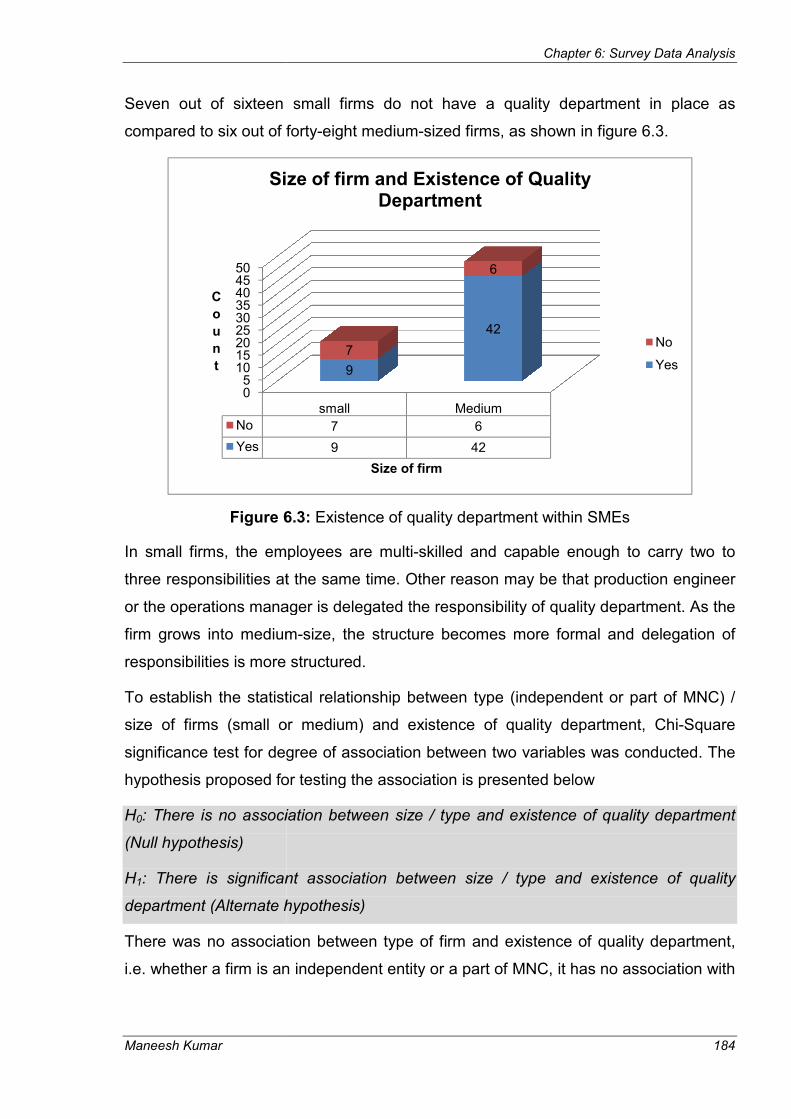
Maneesh Kumar
Seven out of sixteen small firms do not have a quality department in place as
compared to six out of forty
Figure 6.3
In small firms, the employees are multi
three responsibilities at the same time. Other reason may be that production engineer
or the operations manager is delegated the responsibilit
firm grows into medium
responsibilities is more structured.
To establish the statistical relationship between type (independent or part of MNC) /
size of firms (small or medium) and existence of quality department, Chi
significance test for degree of association between two variables was conducted. The
hypothesis proposed for testing the association is presented below
H0: There is no association between size / t
(Null hypothesis)
H1: There is significant association between size / type and existence of quality
department (Alternate hypothesis)
There was no association between type of firm and existence of quality department,
i.e. whether a firm is an independent entity or a part of MNC, it has no association with
05
101520253035404550
No
Yes
C
o
u
n
t
Size of firm and Existence of Quality
Chapter 6: Survey Data Analysis
Seven out of sixteen small firms do not have a quality department in place as
compared to six out of forty-eight medium-sized firms, as shown in figure 6.3.
Figure 6.3: Existence of quality department within SMEs
In small firms, the employees are multi-skilled and capable enough to carry two to
three responsibilities at the same time. Other reason may be that production engineer
or the operations manager is delegated the responsibility of quality department. As the
firm grows into medium-size, the structure becomes more formal and delegation of
responsibilities is more structured.
To establish the statistical relationship between type (independent or part of MNC) /
or medium) and existence of quality department, Chi
significance test for degree of association between two variables was conducted. The
hypothesis proposed for testing the association is presented below
: There is no association between size / type and existence of quality department
: There is significant association between size / type and existence of quality
department (Alternate hypothesis)
There was no association between type of firm and existence of quality department,
i.e. whether a firm is an independent entity or a part of MNC, it has no association with
small Medium
7 6
9 42
9
42
7
6
Size of firm
Size of firm and Existence of Quality Department
Chapter 6: Survey Data Analysis
184
Seven out of sixteen small firms do not have a quality department in place as
sized firms, as shown in figure 6.3.
quality department within SMEs
skilled and capable enough to carry two to
three responsibilities at the same time. Other reason may be that production engineer
y of quality department. As the
size, the structure becomes more formal and delegation of
To establish the statistical relationship between type (independent or part of MNC) /
or medium) and existence of quality department, Chi-Square
significance test for degree of association between two variables was conducted. The
hypothesis proposed for testing the association is presented below
ype and existence of quality department
: There is significant association between size / type and existence of quality
There was no association between type of firm and existence of quality department,
i.e. whether a firm is an independent entity or a part of MNC, it has no association with
Size of firm and Existence of Quality
No
Yes

Maneesh Kumar
the existence of quality department, as the p
thus rejecting the null hypothesis.
Table 6.4: Chi-Square test between size / ty
*Test conducted at 5% significance level
In the second case, it was statistical
between size of firm (small and medium
p-value (0.007) was less than 0.05. In this case, alternate hypothesis was accepted,
indicating small firms were less likely t
middle-sized firm. This was further verified from the data presented in figure 6.3. 44%
of the small firms had no quality department in place as compared to 13% of the
medium-sized firms. When asked about existence
firm, similar result was obtained from small and medium
the firms in both categories do not have team formed for problem solving activities in
the firm, as shown in figure 6.4.
Figure 6.4
Medium-sized firms held more team review meetings during a week as compared to
small firms, refer to table 6.5, for resolving mundane problems or complex problems in
C
o
u
n
t
Size of firm and existence of team for
Pearson Chi-Square (Size of firm)
Pearson Chi-Square (Type of firm)
Chapter 6: Survey Data Analysis
the existence of quality department, as the p-value (0.082) is greater than 0.05 and
thus rejecting the null hypothesis.
Square test between size / type of firm and existence of quality department
*Test conducted at 5% significance level
In the second case, it was statistically proved that significant association exist
between size of firm (small and medium-sized) and existence of quality department as
value (0.007) was less than 0.05. In this case, alternate hypothesis was accepted,
indicating small firms were less likely to have quality department as compared to
sized firm. This was further verified from the data presented in figure 6.3. 44%
of the small firms had no quality department in place as compared to 13% of the
When asked about existence of team for problem solving in the
firm, similar result was obtained from small and medium-sized category, i.e. 31% of
the firms in both categories do not have team formed for problem solving activities in
the firm, as shown in figure 6.4.
Figure 6.4: Existence of problem solving teams in SMEs
sized firms held more team review meetings during a week as compared to
small firms, refer to table 6.5, for resolving mundane problems or complex problems in
01020304050
small Medium
No 5 15
Yes 11 33
11335
15
Size of firm
Size of firm and existence of team for problem solving
Value df Asymp. Sig. (2
Square (Size of firm) 7.240 1
Square (Type of firm) 4.994 2
Chapter 6: Survey Data Analysis
185
value (0.082) is greater than 0.05 and
pe of firm and existence of quality
ly proved that significant association exist
sized) and existence of quality department as
value (0.007) was less than 0.05. In this case, alternate hypothesis was accepted,
o have quality department as compared to
sized firm. This was further verified from the data presented in figure 6.3. 44%
of the small firms had no quality department in place as compared to 13% of the
of team for problem solving in the
sized category, i.e. 31% of
the firms in both categories do not have team formed for problem solving activities in
Existence of problem solving teams in SMEs
sized firms held more team review meetings during a week as compared to
small firms, refer to table 6.5, for resolving mundane problems or complex problems in
Size of firm and existence of team for
No
Yes
Asymp. Sig. (2-sided)*
.007
.082

Chapter 6: Survey Data Analysis
Maneesh Kumar 186
the organization. However, in many cases meetings were held in small and medium-
sized firms on a weekly basis or only when problem occurred. The team meetings for
problem solving in medium-sized firms were more often and frequent than small firms.
Table 6.5: Team review meetings in participating firms
Team meeting(s) No. of Employees 10-49 50-249
% % few times/week 9% 24%
once a week 26% 23%
once/2 week 19% 11%
only when problem occurs 27% 29%
Others 19% 13%
6.2.3. Methods of knowledge transfer to employees
The detail of approaches existing within SMEs for training and knowledge transfer
(KT) to their staff was presented in table 6.6. Majority of the SMEs provided in-house
training to their employees rather than seeking external help of consultants. They also
resided on internet, books / research articles, and self-education as a medium to train
their employees. Only 17.2% firms participated in conferences/workshops/seminars
and considered it as a medium of networking and updating their knowledge on the
latest business strategies. A further analysis revealed that SSS prefer to take external
consultants help or attend conferences and workshops for enhancing their knowledge
compared to employees in NSSS.
Table 6.6: Knowledge Transfer Mechanism in SSS and NSSS
Knowledge Transfer (KT) Mechanism
All sample SMEs
Six Sigma SMEs
Non-Six Sigma SMEs
Pearson Chi-Square Sig. Test*
% usage of measures
In-house Training
Conferences
External Consultants
Internet
Self-Education
93.8%
17.2%
31.3%
14.1%
18.8%
95.7%
26.1%
43.5%
13.0%
17.4%
92.7%
12.2%
24.4%
14.6%
19.5%
0.101
0.046**
0.033**
0.110
0.105
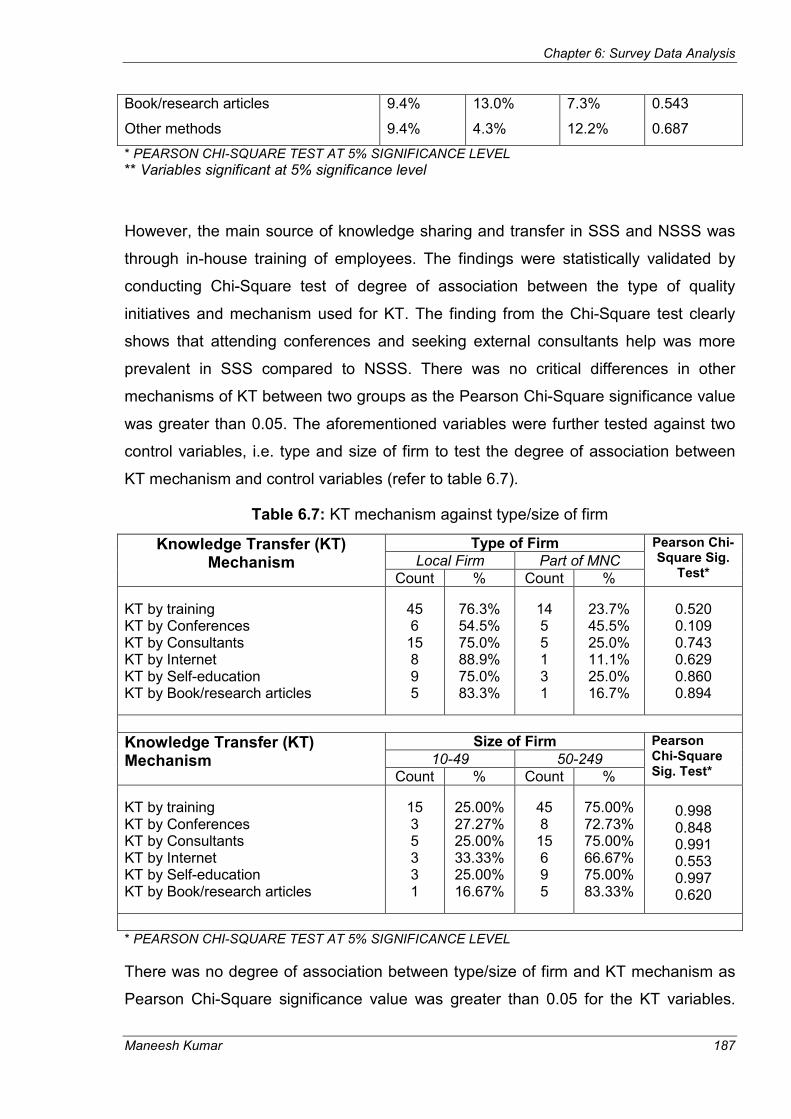
Chapter 6: Survey Data Analysis
Maneesh Kumar 187
Book/research articles
Other methods
9.4%
9.4%
13.0%
4.3%
7.3%
12.2%
0.543
0.687
* PEARSON CHI-SQUARE TEST AT 5% SIGNIFICANCE LEVEL
** Variables significant at 5% significance level
However, the main source of knowledge sharing and transfer in SSS and NSSS was
through in-house training of employees. The findings were statistically validated by
conducting Chi-Square test of degree of association between the type of quality
initiatives and mechanism used for KT. The finding from the Chi-Square test clearly
shows that attending conferences and seeking external consultants help was more
prevalent in SSS compared to NSSS. There was no critical differences in other
mechanisms of KT between two groups as the Pearson Chi-Square significance value
was greater than 0.05. The aforementioned variables were further tested against two
control variables, i.e. type and size of firm to test the degree of association between
KT mechanism and control variables (refer to table 6.7).
Table 6.7: KT mechanism against type/size of firm
Knowledge Transfer (KT) Mechanism
Type of Firm Pearson Chi-Square Sig.
Test* Local Firm Part of MNC
Count % Count %
KT by training KT by Conferences KT by Consultants KT by Internet KT by Self-education KT by Book/research articles
45 6 15 8 9 5
76.3% 54.5% 75.0% 88.9% 75.0% 83.3%
14 5 5 1 3 1
23.7% 45.5% 25.0% 11.1% 25.0% 16.7%
0.520 0.109 0.743 0.629 0.860 0.894
Knowledge Transfer (KT) Mechanism
Size of Firm Pearson Chi-Square Sig. Test*
10-49 50-249
Count % Count %
KT by training KT by Conferences KT by Consultants KT by Internet KT by Self-education KT by Book/research articles
15 3 5 3 3 1
25.00% 27.27% 25.00% 33.33% 25.00% 16.67%
45 8 15 6 9 5
75.00% 72.73% 75.00% 66.67% 75.00% 83.33%
0.998 0.848 0.991 0.553 0.997 0.620
* PEARSON CHI-SQUARE TEST AT 5% SIGNIFICANCE LEVEL
There was no degree of association between type/size of firm and KT mechanism as
Pearson Chi-Square significance value was greater than 0.05 for the KT variables.
Maneesh Kumar
Irrespective of type of quality initiatives / type of firm / size of firm, no significant
differences was observed in the KT mechanism of the participating SMEs.
6.2.4. Customer focused measures in the firm
The respondents were asked to state criteria us
of customers (VOC). Respondents were given options of multiple answers in order to
capture all the measures existing / used by SMEs to understand the customer raised
issues and problems. The results of the analysis were
the firms (89.1%) used customer complaints as a medium to understand the critical
business issues followed by criteria such as delivery time (60.9%) and customer
survey (59.4%). A comparative analysis of SSS against NSSS w
the listed factors, as presented in the table 6.8. Similar results were reported for SSS
and NSSS with respect to capturing VOC. Percentage of SSS using delivery time as
a measure differs significantly from NSSS (82.6% for
Figure 6.5
The Pearson Chi-Square significance value for delivery time was less than 0.05, which
proves the hypothesis that delivery time was more prevalent in SSS than NSSS to
capture VOC. The respondents were also asked to cite the three most important
criteria that helped the firm to win customer loyalty.
Chapter 6: Survey Data Analysis
Irrespective of type of quality initiatives / type of firm / size of firm, no significant
differences was observed in the KT mechanism of the participating SMEs.
6.2.4. Customer focused measures in the firm
The respondents were asked to state criteria used to capture and measure the voice
of customers (VOC). Respondents were given options of multiple answers in order to
capture all the measures existing / used by SMEs to understand the customer raised
issues and problems. The results of the analysis were shown is figure 6.5. Majority of
the firms (89.1%) used customer complaints as a medium to understand the critical
business issues followed by criteria such as delivery time (60.9%) and customer
survey (59.4%). A comparative analysis of SSS against NSSS w
the listed factors, as presented in the table 6.8. Similar results were reported for SSS
and NSSS with respect to capturing VOC. Percentage of SSS using delivery time as
a measure differs significantly from NSSS (82.6% for SSS against
Figure 6.5: Measures used to capture voice of customers
Square significance value for delivery time was less than 0.05, which
proves the hypothesis that delivery time was more prevalent in SSS than NSSS to
e respondents were also asked to cite the three most important
criteria that helped the firm to win customer loyalty.
Chapter 6: Survey Data Analysis
188
Irrespective of type of quality initiatives / type of firm / size of firm, no significant
differences was observed in the KT mechanism of the participating SMEs.
ed to capture and measure the voice
of customers (VOC). Respondents were given options of multiple answers in order to
capture all the measures existing / used by SMEs to understand the customer raised
shown is figure 6.5. Majority of
the firms (89.1%) used customer complaints as a medium to understand the critical
business issues followed by criteria such as delivery time (60.9%) and customer
survey (59.4%). A comparative analysis of SSS against NSSS was performed across
the listed factors, as presented in the table 6.8. Similar results were reported for SSS
and NSSS with respect to capturing VOC. Percentage of SSS using delivery time as
against 48.8% for NSSS).
Measures used to capture voice of customers
Square significance value for delivery time was less than 0.05, which
proves the hypothesis that delivery time was more prevalent in SSS than NSSS to
e respondents were also asked to cite the three most important

Chapter 6: Survey Data Analysis
Maneesh Kumar 189
Table 6.8: Customer focused measure in SSS and NSSS
Factors for Comparison Six Sigma SMEs
Non-Six Sigma SMEs*
All sample SMEs
Pearson Chi-
Square Sig. Test*
Measures to capture Voice of customer
% usage of measures
Surveys Delivery Time Customer Complaints Sales Data Repeat Business Others
69.9% 82.6% 91.3% 43.5% 43.5% 34.8%
53.7% 48.8% 87.8% 43.9% 48.8% 17.1%
89.1% 60.9% 59.4% 46.9% 43.8% 23.4%
0.223 0.035**
0.991 0.998 0.897 0.543
Criteria that helped company to win customer loyalty
% usage of measures
Manufacturing Quality Product Reliability Delivery Lead Time On-Time Delivery Wide product Range Price Others
90.9% 68.2% 27.3% 72.7% 13.6% 18.2% 13.6%
80.5% 68.3% 31.7% 43.9% 26.8% 41.5% 4.9%
84.1% 68.3% 30.2% 54.0% 22.2% 33.3% 7.9%
0.785 0.998 0.981
0. 045** 0.124 0.435 0.657
* PEARSON CHI-SQUARE TEST AT 5% SIGNIFICANCE LEVEL
** Variables significant at 5% significance level
This question was designed to gauge the importance that the company gives to its
customers and try to win their loyalty. The criteria used to win orders were divided into
seven categories and the results from the analysis showed that manufacturing quality,
product reliability, and on-time delivery of the final product were the three most
important criteria that SMEs focuses on to win customer orders. It was interesting to
observe that price of the product was given low importance as compared to
manufacturing quality and product reliability. On-time delivery was identified as the
significant variable from the Chi-Square test, refer to table 6.8, that was frequently
used measure in SSS as compared to its counterpart, i.e. NSSS. The Pearson Chi-
Square test revealed no association between the type/size of firms and VOC
measures / criteria used to win customer loyalty.
6.2.5. Factors defining the strategic objective (s) of the firm
The respondents were asked to shortlist three largest factors out of seven alternatives
available, which define the company strategic objective (s). The alternatives available

Maneesh Kumar
were profitability, flexibility, quality, market share, innovation, cost and other category.
The results from the analysis
Figure 6.6:
The three most important factors cited by the sample firms that helped them in
deciding their strategic objectives were profitability, quality, and cost.
strategic objectives with respect to the type of quality initiatives (SSS and NSSS) and
size/ type of firm revealed that profit, quality, and cost was considered as the top three
objectives irrespective of the type/size of the firm or type of QI implemented in SMEs.
Market share and innovation was not considered as important by the senior
management team to link with strategic business goals.
to the SMEs preference of maintaining status
indicated from the literature review on small business growth in Chapter 2).
imperative for the firms to be innovative in order to sustain the competition and their
existence in the global market.
6.2.6. Reasons for not implementing Six Sigma in SMEs
Large organization have been implanting and reaping the benefits of Six Sigma in the
last two decades. However, its application in SMEs is still less evident as cited in the
literature. It was important to understand the perception of Six Sigma and factors
hindering its implementation from the SMEs perspective. Firms were asked to state
the reasons for not implementing Six Sigma as an initiative to drive continuous
Innovation
Market Share
Flexibility
Company Strategic
Objective(s)
Chapter 6: Survey Data Analysis
were profitability, flexibility, quality, market share, innovation, cost and other category.
The results from the analysis were presented in figure 6.6 below.
: Factors defining the strategic objective (s) of the firm
The three most important factors cited by the sample firms that helped them in
deciding their strategic objectives were profitability, quality, and cost.
jectives with respect to the type of quality initiatives (SSS and NSSS) and
size/ type of firm revealed that profit, quality, and cost was considered as the top three
objectives irrespective of the type/size of the firm or type of QI implemented in SMEs.
arket share and innovation was not considered as important by the senior
management team to link with strategic business goals. The reason may be attributed
to the SMEs preference of maintaining status–quo and having no desire to grow (as
e literature review on small business growth in Chapter 2).
imperative for the firms to be innovative in order to sustain the competition and their
existence in the global market.
6.2.6. Reasons for not implementing Six Sigma in SMEs
tion have been implanting and reaping the benefits of Six Sigma in the
last two decades. However, its application in SMEs is still less evident as cited in the
literature. It was important to understand the perception of Six Sigma and factors
implementation from the SMEs perspective. Firms were asked to state
the reasons for not implementing Six Sigma as an initiative to drive continuous
0.00% 10.00% 20.00% 30.00%
Other
Innovation
Market Share
Flexibility
Cost
Quality
Profit
2.13%
6.38%
7.98%
9.57%
17.02%
26.60%
30.32%
percentage
Chapter 6: Survey Data Analysis
190
were profitability, flexibility, quality, market share, innovation, cost and other category.
presented in figure 6.6 below.
Factors defining the strategic objective (s) of the firm
The three most important factors cited by the sample firms that helped them in
deciding their strategic objectives were profitability, quality, and cost. Analysis of the
jectives with respect to the type of quality initiatives (SSS and NSSS) and
size/ type of firm revealed that profit, quality, and cost was considered as the top three
objectives irrespective of the type/size of the firm or type of QI implemented in SMEs.
arket share and innovation was not considered as important by the senior
The reason may be attributed
quo and having no desire to grow (as
e literature review on small business growth in Chapter 2). It is
imperative for the firms to be innovative in order to sustain the competition and their
6.2.6. Reasons for not implementing Six Sigma in SMEs
tion have been implanting and reaping the benefits of Six Sigma in the
last two decades. However, its application in SMEs is still less evident as cited in the
literature. It was important to understand the perception of Six Sigma and factors
implementation from the SMEs perspective. Firms were asked to state
the reasons for not implementing Six Sigma as an initiative to drive continuous
40.00%
26.60%
30.32%
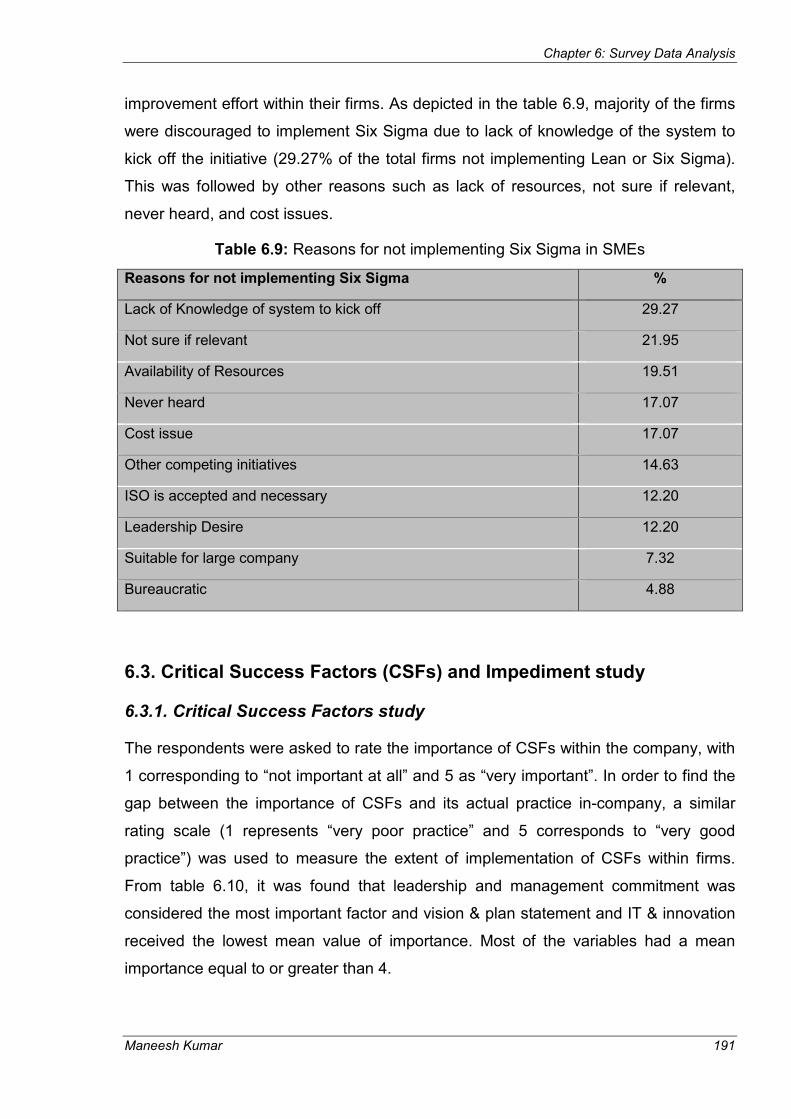
Chapter 6: Survey Data Analysis
Maneesh Kumar 191
improvement effort within their firms. As depicted in the table 6.9, majority of the firms
were discouraged to implement Six Sigma due to lack of knowledge of the system to
kick off the initiative (29.27% of the total firms not implementing Lean or Six Sigma).
This was followed by other reasons such as lack of resources, not sure if relevant,
never heard, and cost issues.
Table 6.9: Reasons for not implementing Six Sigma in SMEs
Reasons for not implementing Six Sigma %
Lack of Knowledge of system to kick off 29.27
Not sure if relevant 21.95
Availability of Resources 19.51
Never heard 17.07
Cost issue 17.07
Other competing initiatives 14.63
ISO is accepted and necessary 12.20
Leadership Desire 12.20
Suitable for large company 7.32
Bureaucratic 4.88
6.3. Critical Success Factors (CSFs) and Impediment study
6.3.1. Critical Success Factors study
The respondents were asked to rate the importance of CSFs within the company, with
1 corresponding to “not important at all” and 5 as “very important”. In order to find the
gap between the importance of CSFs and its actual practice in-company, a similar
rating scale (1 represents “very poor practice” and 5 corresponds to “very good
practice”) was used to measure the extent of implementation of CSFs within firms.
From table 6.10, it was found that leadership and management commitment was
considered the most important factor and vision & plan statement and IT & innovation
received the lowest mean value of importance. Most of the variables had a mean
importance equal to or greater than 4.

Chapter 6: Survey Data Analysis
Maneesh Kumar 192
Table 6.2: Gap analysis of CSFs of quality practices in SMEs
Critical Success Factors Importance Practice GAP Sig.*
Leadership & Mgmt commitment 4.73 3.97 0.76 0.000
Communication 4.70 3.59 1.11 0.000
Link QI^ to employee 4.44 3.36 1.08 0.000
Cultural change 4.38 3.19 1.19 0.000
Education & training 4.27 3.27 1.00 0.000
Link QI to customer 4.22 3.36 0.86 0.000
Project selection 4.19 3.22 0.97 0.000
Link QI to Business 4.14 3.28 0.86 0.000
Link QI to supplier 4.14 2.97 1.17 0.000
Project mgmt skill 4.03 3.17 0.86 0.000
Org infrastructure 3.97 3.57 0.40 0.003
Vision & Plan 3.97 3.46 0.51 0.003
IT & innovation 3.83 3.17 0.66 0.002
^ QI stands for Quality Initiative
* Test performed at 5% sig. level
On the contrary, in practice within the company, each factor was found to be less
applied with mean practice value less than 4 for all factors. Spearman Correlation
significance test was performed (at 5% significance level) to identify whether the mean
value for importance and actual practice of CSFs were statistically different from each
other. The result of the analysis showed that each factor was statistically significant in
terms of application and perceived importance of CSFs within SMEs. It may be
inferred from table 6.10 that even though the company had the quality systems or
quality initiatives in place, still huge gap existed in between importance and practice of
those CSFs, which may have an impact on the organizational performance.
The CSFs were compared against the size (type) of firm to understand the variation in
result with respect to the control factors. Table 6.11 includes the information on the
mean score of CSFs (importance and practice) against the size of firms. The score for
average importance and practice of each factor with respect to the size of firm yielded
similar result as observed in table 6.10. The Spearman Correlation test for the size of
firms revealed no significant differences between the two groups and the
aforementioned CSFs. The findings were exactly similar for other control variable, i.e.
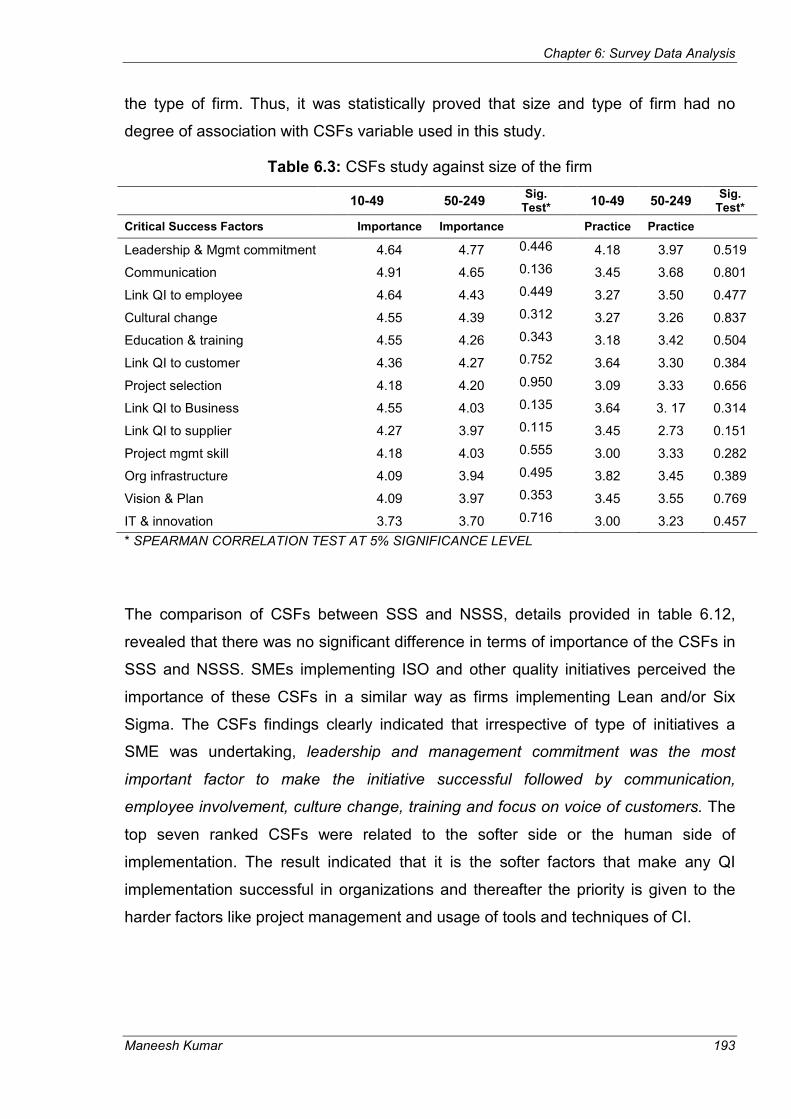
Chapter 6: Survey Data Analysis
Maneesh Kumar 193
the type of firm. Thus, it was statistically proved that size and type of firm had no
degree of association with CSFs variable used in this study.
Table 6.3: CSFs study against size of the firm
10-49 50-249 Sig. Test*
10-49 50-249
Sig. Test*
Critical Success Factors Importance Importance Practice Practice
Leadership & Mgmt commitment 4.64 4.77 0.446 4.18 3.97 0.519
Communication 4.91 4.65 0.136 3.45 3.68 0.801
Link QI to employee 4.64 4.43 0.449 3.27 3.50 0.477
Cultural change 4.55 4.39 0.312 3.27 3.26 0.837
Education & training 4.55 4.26 0.343 3.18 3.42 0.504
Link QI to customer 4.36 4.27 0.752 3.64 3.30 0.384
Project selection 4.18 4.20 0.950 3.09 3.33 0.656
Link QI to Business 4.55 4.03 0.135 3.64 3. 17 0.314
Link QI to supplier 4.27 3.97 0.115 3.45 2.73 0.151
Project mgmt skill 4.18 4.03 0.555 3.00 3.33 0.282
Org infrastructure 4.09 3.94 0.495 3.82 3.45 0.389
Vision & Plan 4.09 3.97 0.353 3.45 3.55 0.769
IT & innovation 3.73 3.70 0.716 3.00 3.23 0.457
* SPEARMAN CORRELATION TEST AT 5% SIGNIFICANCE LEVEL
The comparison of CSFs between SSS and NSSS, details provided in table 6.12,
revealed that there was no significant difference in terms of importance of the CSFs in
SSS and NSSS. SMEs implementing ISO and other quality initiatives perceived the
importance of these CSFs in a similar way as firms implementing Lean and/or Six
Sigma. The CSFs findings clearly indicated that irrespective of type of initiatives a
SME was undertaking, leadership and management commitment was the most
important factor to make the initiative successful followed by communication,
employee involvement, culture change, training and focus on voice of customers. The
top seven ranked CSFs were related to the softer side or the human side of
implementation. The result indicated that it is the softer factors that make any QI
implementation successful in organizations and thereafter the priority is given to the
harder factors like project management and usage of tools and techniques of CI.

Chapter 6: Survey Data Analysis
Maneesh Kumar 194
Table 6.4: Comparison of CSFs between SSS and NSSS
Six Sigma SMEs
Non-Six Sigma SMEs
Sig. Test*
Critical Success Factors Importance Importance
Leadership & Mgmt commitment 4.88 4.67 0.586
Communication 4.82 4.67 0. 485
Link QI to employee 4.44 4.43 0.998
Cultural change 4.41 4.37 0.991
Education & training 4.47 4.20 0.443
Link QI to customer 4.38 4.17 0.446
Project selection 4.25 4.23 0.997
Link QI to Business 4.06 4.10 0.991
Link QI to supplier 4.00 4.23 0.544
Project mgmt skill 4.00 4.10 0.787
Org infrastructure 3.71 3.97 0.633
Vision & Plan 3.94 3.83 0.885
IT & innovation 3.56 3.93 0.234
* SPEARMAN CORRELATION TEST AT 5% SIGNIFICANCE LEVEL
6.3.2. Impeding factors in implementation of quality initiatives in SMEs
Companies were asked to identify the top five inhibiting factors that were considered
as barrier to quality initiative implementation. The results of the analysis shows, refer
to figure 6.7, that about 71.2% percent of the responding firms stated that lack of
resources was one of the impeding factors to the successful introduction of a quality
initiatives in UK SME. Lack of resources covered a large number of aspects including
financial resources, human resources, time, etc. This was followed by lack of
knowledge, poor training/coaching, internal resistance, poor employee participation,
etc. Lack of resources is the most common impeding factors, as cited in the SMEs
literature on CI initiatives that deters the progress of any change management
program in SMEs. However, it was surprising that lack of top management
commitment was excluded from the list of top five impeding factors.
All the aforementioned CSFs and impediments identified from survey response were
further investigated in the second phase of study while conducting multiple case
studies in ten manufacturing SMEs.

Maneesh Kumar
Figure 6.7: Barriers to implementation of Quality Initiatives in SMEs
6.4. Performance of SSS and NSSS: A comparison
The respondents were asked to rate the benefits realized through impleme
QI using a Likert scale of 1 to 5, where 1 = negative benefit, 3= some benefit and 5 =
crucial. Table 6.13 and table 6.14 showed the degree of improvement realized on 1
scale after the implementation of QI. Score across each of the performanc
reflects the improvement made by the SME after implementing the QI
of small firms and medium sized firms were conducted against the performance
indicators to check the degree of association between the size of firm and
performance indicators, as shown in table 6.13 below.
Table 6.5: Performance Indicators comparison against size of firms
Performance Measures
Reduction in scrap rate
Reduction in cycle time
Reduction in delivery time
Increase in productivity
Reduction of cost
Poor project selection
Poor supplier involvement
Poor delegation of authority
Lack of top mgmt commitment
Changing business focus
Inadequate process control techniques
Poor employee participation
Internal resistance
Lack of knowledge
Availability of resources
Ba
rrie
rs t
o i
mp
lem
en
tati
on
of
Qu
ali
ty I
nit
iati
ve
s
Chapter 6: Survey Data Analysis
Barriers to implementation of Quality Initiatives in SMEs
6.4. Performance of SSS and NSSS: A comparison
The respondents were asked to rate the benefits realized through impleme
using a Likert scale of 1 to 5, where 1 = negative benefit, 3= some benefit and 5 =
crucial. Table 6.13 and table 6.14 showed the degree of improvement realized on 1
scale after the implementation of QI. Score across each of the performanc
reflects the improvement made by the SME after implementing the QI
of small firms and medium sized firms were conducted against the performance
indicators to check the degree of association between the size of firm and
e indicators, as shown in table 6.13 below.
Performance Indicators comparison against size of firms
No. of
Employees
10-49 50-249
Mean Mean
4.33 3.61
4.11 4.14 Reduction in delivery time 3.67 3.64
4.56 3.93
3.67 3.57
0.0% 10.0%20.0%30.0%40.0%50.0%
Poor project selection
Poor supplier involvement
Poor delegation of authority
Lack of top mgmt commitment
Changing business focus
Inadequate process control techniques
Poor employee participation
Internal resistance
Lack of training
Lack of knowledge
Availability of resources
8.90%
27.10%
28.80%
30.50%
35.60%
40.70%
45.80%
Chapter 6: Survey Data Analysis
195
Barriers to implementation of Quality Initiatives in SMEs
The respondents were asked to rate the benefits realized through implementation of
using a Likert scale of 1 to 5, where 1 = negative benefit, 3= some benefit and 5 =
crucial. Table 6.13 and table 6.14 showed the degree of improvement realized on 1-5
scale after the implementation of QI. Score across each of the performance indicator
reflects the improvement made by the SME after implementing the QI. A comparison
of small firms and medium sized firms were conducted against the performance
indicators to check the degree of association between the size of firm and
Performance Indicators comparison against size of firms
Sig. Test*
All SMEs
Mean
0.088 3.78
0.953 4.14
0.962 3.65
0.086 4.08
0.805 3.59
50.0%60.0%70.0%80.0%
40.70%
45.80%
54.20%
55.90%
59.30%
71.20%
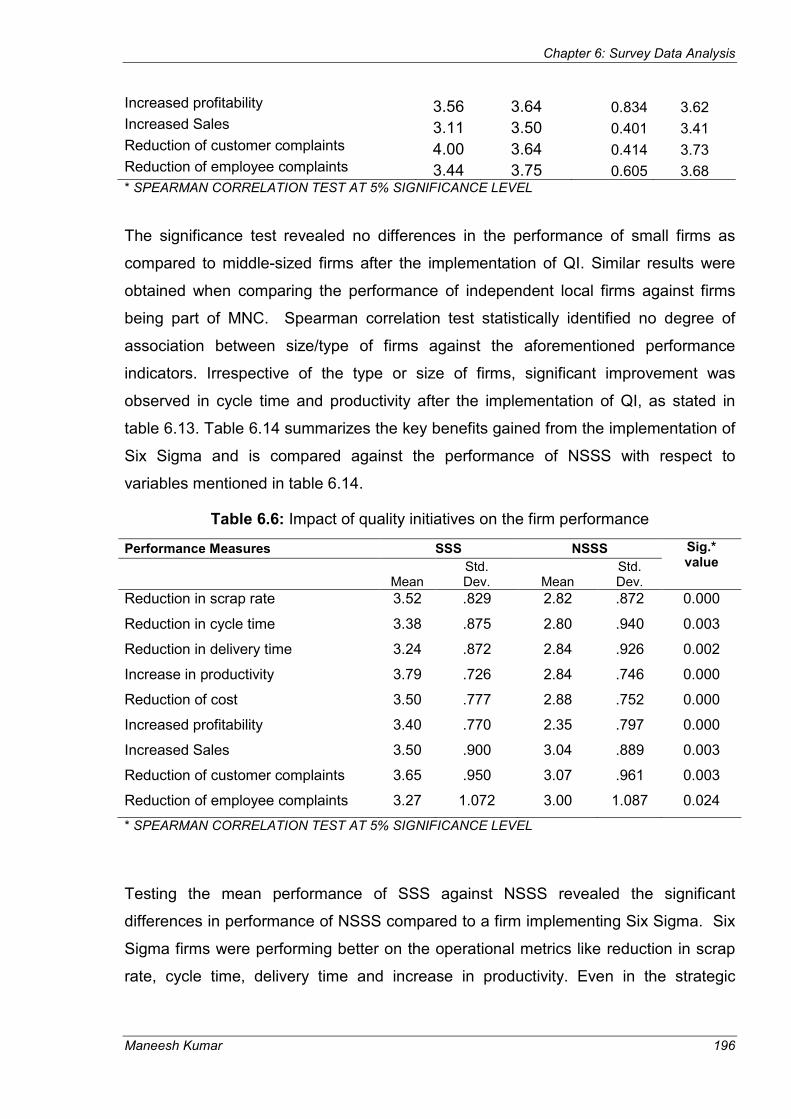
Chapter 6: Survey Data Analysis
Maneesh Kumar 196
Increased profitability 3.56 3.64 0.834 3.62 Increased Sales 3.11 3.50 0.401 3.41 Reduction of customer complaints 4.00 3.64 0.414 3.73 Reduction of employee complaints 3.44 3.75 0.605 3.68 * SPEARMAN CORRELATION TEST AT 5% SIGNIFICANCE LEVEL
The significance test revealed no differences in the performance of small firms as
compared to middle-sized firms after the implementation of QI. Similar results were
obtained when comparing the performance of independent local firms against firms
being part of MNC. Spearman correlation test statistically identified no degree of
association between size/type of firms against the aforementioned performance
indicators. Irrespective of the type or size of firms, significant improvement was
observed in cycle time and productivity after the implementation of QI, as stated in
table 6.13. Table 6.14 summarizes the key benefits gained from the implementation of
Six Sigma and is compared against the performance of NSSS with respect to
variables mentioned in table 6.14.
Table 6.6: Impact of quality initiatives on the firm performance
Performance Measures SSS NSSS Sig.* value
Mean Std. Dev. Mean
Std. Dev.
Reduction in scrap rate 3.52 .829 2.82 .872 0.000
Reduction in cycle time 3.38 .875 2.80 .940 0.003
Reduction in delivery time 3.24 .872 2.84 .926 0.002
Increase in productivity 3.79 .726 2.84 .746 0.000
Reduction of cost 3.50 .777 2.88 .752 0.000
Increased profitability 3.40 .770 2.35 .797 0.000
Increased Sales 3.50 .900 3.04 .889 0.003
Reduction of customer complaints 3.65 .950 3.07 .961 0.003
Reduction of employee complaints 3.27 1.072 3.00 1.087 0.024
* SPEARMAN CORRELATION TEST AT 5% SIGNIFICANCE LEVEL
Testing the mean performance of SSS against NSSS revealed the significant
differences in performance of NSSS compared to a firm implementing Six Sigma. Six
Sigma firms were performing better on the operational metrics like reduction in scrap
rate, cycle time, delivery time and increase in productivity. Even in the strategic
Chapter 6: Survey Data Analysis
Maneesh Kumar 197
measures of organizational performance, i.e. reduction in cost, increased profitability
and increase sales, SSS out classes NSSS.
Performance of six firms implementing only Lean out of 23 (SMEs not implementing
Six Sigma or ISO) were also recorded with respect to the variables mentioned in table
and it was revealed that the mean performance of these firms were above ISO
certified SMEs but below firms implementing Lean and Six Sigma, though not
statistically significant. This analysis gives an indication that Lean firms implementing
Six Sigma have realized more benefits compared to SMEs implementing Lean on its
own.
The participating firms were also asked about their knowledge on cost of poor quality
(COPQ) and factors they included to measure COPQ. Thirty four firms (53%) had no
understanding of COPQ and other thirty firms (47%) indicated some understanding of
COPQ. An open ended question was further asked to firms as what constitute COPQ
or the factors they considered while measuring COPQ. Most of the SMEs had very
limited knowledge of COPQ and included scrap and rework while measuring COPQ.
There were minimal differences in the understanding of COPQ between SSS and
NSSS. It can be said that COPQ is still an unexplored area in a SME environment
based on the findings of the study.
6.5. Summary
It is a myth that Six Sigma works only in large companies. Six Sigma has evolved into
a business strategy in many large organizations and its importance in SMEs is
growing everyday, as depicted from the survey results. The novelty of this chapter lies
in conducting a comparative study on the quality management practices of SSS and
NSSS, drawing value lesson for the academics, consultants, researchers and
practitioners of continuous improvement initiatives like Lean and Six Sigma. This is
among very few studies that have identified the differences in quality management
practices and performance between Six Sigma and non-Six Sigma firms.
Majority of the small firms as compared to middle-sized firms struggled to have a
quality department in place. The reason may be attributed to its informal structure and
resolving problem based on the individual gut feeling. SSS and NSSS resided on
customers complaints as the primary method to capture voice of customers followed

Chapter 6: Survey Data Analysis
Maneesh Kumar 198
by using other important criteria such as customer survey and delivery time. However,
SSS seek the help of external consultants more often for training their employees as
compared to NSSS, where in-house training was the main source of knowledge
transfer.
Profit, cost, and quality were rated as the three most important factors (independent of
size/type of firm or type of quality initiatives implemented) that defined the strategic
objectives of the firm. Three important measures used in the sample firms to win
customer loyalty were identified as manufacturing quality, product reliability, and on-
time delivery. The score of these three factors were also independent of the type/size
of firms or type of quality initiatives implemented in firms. The common reasons cited
for not implementing Six Sigma in the firms were similar to literature- lack of
knowledge of system, never heard about Six Sigma, lack of availability of resources to
implement Six Sigma, not sure if Six Sigma is relevant to their organizations, and cost
issues.
Results of the survey revealed that factors critical to success of quality initiatives were
equal in importance, irrespective of type of initiatives implemented by the firm. Strong
Leadership and management commitment are required to make any change initiatives
successful in the organization. It should also be linked to employees in terms of
training, making resources available and establishing good communication with them.
The score for operational and strategic performance metrics of SSS were higher than
NSSS, giving an indication that Six Sigma is beneficial for all types of firm, irrespective
of the size of the firm. This statement was further validated through conducting
multiple case studies in SSS and comparing its performance with NSSS, the results of
which were presented in the next chapter.
Considering the low response rate in the first phase of Doctoral research, it was
decided to perform a multi-level multiple exploratory case studies within SSS and
NSSS identified from the survey response. The case-study research facilitated in
performing an in-depth cross case analysis and identified significant differences
existing in the quality management practices of SSS and NSSS.

Chapter 7: Case Study Analysis
Maneesh Kumar 199
Chapter 7
Case Study Analysis
7.0. Introduction
The findings from ten case study firms, 3 practitioner interviews, and responses from
30 delegates attending the 3rd International Conference on Six Sigma (15th -16th
December, 2008; Edinburgh) were presented in this chapter. The primary unit of
analysis was two clusters, i.e. Six Sigma SMEs and Non-Six Sigma SMEs. The
secondary unit of analysis included 5 case study SMEs within the Six Sigma cluster
and another 5 SMEs within the non-Six Sigma cluster. Twenty-four semi-structured
interviews were conducted in the ten case study firms. The author used a three step
technique (data reduction; data display; data analysis and drawing conclusion)
proposed by Miles and Huberman (1994) and the two step process proposed by
Eisenhardt (1989), which is simple, comprehensive, and most widely cited, for
analyzing the qualitative data.
This chapter is divided into the following sections: the first section discusses findings
from Six Sigma firms; the second section includes findings from Non-Six Sigma firms;
findings from practitioner interviews were presented in the third section; the next
section included discussion on differences in SMEs and large organizations and the
Six Sigma Readiness Index based on comments from the respondents; the last
section briefly summarizes the key findings.
7.1. Findings from Six Sigma firms
7.1.1. Demographic Details of Six Sigma SMEs
Company A was established in 1984, specializing in design and manufacture of PC
data communications hardware. It employed 36 people with an annual turnover of
£3.4 million in 2007. The entire design and manufacturing was controlled at one
facility, ensuring complete control over its processes to be proactive to customer
demands. Some of its major customers included organizations ranging from banking
Chapter 7: Case Study Analysis
Maneesh Kumar 200
to government agencies to defence equipment manufacturers to name a few. The
commitment of the management team to devote 30% of the expenditure in research
and development has contributed to the development of a world-class manufacturing
facility on-site. A (Company A is denoted as A from this section onward) had won
several awards in the last two decades including the ‘European Manufacturer of the
Year’ and ‘Microsoft Tech-Ed’ awards due to its success in maintaining a growing
manufacturing capability that embraces Lean and Six Sigma.
Company B was formed in 2002 from the merger of two parent companies (each of
the parent company employed less than 50 people) in England. Presently, there were
106 employees generating an annual turnover of £5 million. B (Company B is denoted
as B from this section onward) provided precision engineered metallic sealing
solutions, from design and prototype to full volume production, and services to the
highest standards. B specializes in the design and manufacture of high temperature
metal seals, gaskets, CNC machined components and complementary products for
the aerospace, automotive and industrial sectors.
Company C is part of multi-national corporation (MNC), with it’s headquarter in the
USA, which has been a global leader in blood processing technology for more than 30
years. Company C (Company C is denoted as C from this section onward) was
established in 1994 in Scotland with 80 employees and the figure had tripled in 2008
to 240 employees. Some of C’s key products included surgical auto-transfusion
devices, surgical field blood suction systems, filter bag, and blood and patient warming
systems. C gross profit and operating income had grown since 2003 and had shown
positive signs of growth in the fiscal year 2009/2010. Core competency of the parent
company lies in manufacturing process, sales/service, and market innovation. The
parent company vision was to become global leader in blood management solutions
for their customers.
Company D, established in 1974 in Scotland, is a provider of flow measurement
equipment for the oil and gas industry and was acquired by a MNC in 2000 to
support its penetration into the gas flow measurement market. The parent
company was at the forefront of measurement technology development, for
more than 70 years, for the oil and gas industry. It relied on precision
manufacturing to ensure that specifications were met or exceeded to offer the

Chapter 7: Case Study Analysis
Maneesh Kumar 201
best quality product in the marketplace. D (Company D is denoted as D from this
section onward) currently has 105 employees with an annual turnover of £20
million. D was involved in the manufacturing of a low-volume, high-mix product
type that includes components such as meters, valves, flow-control
instruments, instrumentation and read-out equipment and process management
components.
Company E started with 11 employees in the mid 1990s before being taken over by
large Swedish engineering company in 2002. The parent company is the world leader
in handheld vibration data collection technology for condition monitoring, supplying the
major OEM's in this market. E (Company E is denoted as E from this section onward)
focused on the electronics part of the business, where they monitor the wear and
vibration of the bearings, seals and other parts of the parent company. The core
business of E was to manufacture a customized handheld rugged computer that
measured sound, noise and vibration of parts in machine to estimate their failure time.
The annual turnover of E was in the range of £1-£5 million (the company was not
happy to reveal the exact data of annual turnover). E currently has a headcount of 35
employees.
Other demographic details of the companies are provided in table 7.1. The five case
study firms are involved in different manufacturing activities ranging from electronics &
semi-conductor to mechanical and pharmaceutical industry. A and B are local
independent firms, whereas C, D, and E were a part of MNC.
Table7.1 Company demographic details
Company Manufacturing Activity
Company Type
Annual Sales Turnover
Location No. of
employees
A Electronics &
Semi-conductor
Independent £3.4 m England 36
B Mechanical Independent £5 m England 106
C Pharmaceuticals Part of MNC - Scotland 240
D Mechanical Part of MNC £20 m Scotland 105
E Electronics Part of MNC £1-£5 m Scotland 35
Chapter 7: Case Study Analysis
Maneesh Kumar 202
7.1.2. Quality Management Practices in SMEs
7.1.2.1. History of Quality Initiatives
A started with accreditation of BS 5750 in 1994 followed by ISO 9001:2000
certification in 2001. Further extending its continuous improvement (CI) journey, the
company started Lean implementation in 2001, IIP certification in 2002, and embarked
on the Six Sigma journey in 2003. The company failed to implement Lean successfully
in its first attempt in 1998 due to poor communication and no involvement of
employees at the shop-floor level. The lessons learnt from this mistake helped the
company to successfully implement Lean in 2001 by introducing it at shop-floor level.
All the employees in the company attended a one day workshop on basics of Lean
and its impact on business processes improvement. Once the employees realized the
benefits from Lean implementation and started believing in the principle of continuous
improvement, the management decided to embark on Six Sigma to tackle the variation
problems existing in their business processes. Suppliers were selected based on the
criteria of ISO 9000 and their quality of raw materials was investigated on a
continuous basis.
Before B was formed by the merger of two parent companies, it achieved AS 9100
certification required for the aerospace industry and TS 16949 certification for the
automotive industry. After the merger, the firm has acquired ISO 9001:2000
certification in 2003 followed by Lean implementation in 2005. In early 2007, Six
Sigma principles were embraced after streamlining the business functions using the
Lean concept. At the time of interview, the company had already started applying
Lean and Six Sigma principles in the administrative and finance processes. B
implemented the concept of the theory of constraints (TOC) and TQM in the past but
failed to succeed due to lack of training for shop-floor employees, poor top-down
communication, and involvement of middle managers in day to day jobs apart from
TQM/TOC implementation responsibility (for which they didn’t have time to implement
and execute projects). Similar to A, ISO 9000 was the prerequisite to become the
supplier of B.
C, being part of a successful MNC, was very cash rich and had a very healthy balance
sheet. The parent company had witnessed significant growth in its USA, European,
Asian and African markets by consistently investing resources for its research and
Chapter 7: Case Study Analysis
Maneesh Kumar 203
development (R & D), and improving the quality of its products by implementation of
initiatives like Lean and Six Sigma across all its subsidiaries including C. C went for
ISO 9000 certification in 1994 and ISO13485 for medical devices in 1997. Lean was
rolled out at company-wide level in 2000, involving everybody in the company followed
by Six Sigma implementation in 2003. ‘C’ implemented the Hoshin Kanri approach in
1996, but failed to gain management commitment and that initiative was forgotten in a
few months time after being launched. Lean was first implemented in 1998 but was
not successful as shop-floor employees were not involved. Being part of a MNC, C
does not have authority to conduct R & D exercises at their site and any simple
changes in product/process need to be approved by the parent company. They have
the authority for any operational decisions related to yield, productivity, streamlining
business processes, and taking corrective actions.
Senior management in D went for BS5750 accreditation through the British Standard
Institute (BSI) in 1991 due to the oil and gas industry driving the demand for suppliers
to be BS5750 certified followed by ISO 9000 certification in 1995. D had suggestion
boxes for improvement, where people could put their ideas in the box and if it was
considered a good idea it would be discussed in the management review meeting.
The next major change was ISO 9001: 2000 that coincided with the parent company
buying D. However after acquisition by a MNC, the quality profile of the organization
was raised significantly due to commitment from the new CEO, who was passionate
about customer focus and the quality philosophy proposed by Deming. D was to
become a System Thinking company using their newly developed six step process for
continual improvement as presented in figure 7.1, in striving to improve business
performance. Continuous improvement process (CIP) was the six step process used
within D for process improvement. D had vision and mission statement established
strategies in place that were governed by the parent company. Any training conducted
at D’s site such as product training, educational, health & safety training, to name a
few, the information was sent to the parent company. The parent company being
proponent of Lean, placed many of their technically proficient staff in Lean at D’s site
in 2004 for training their employees. The Managing Director (MD) of D was inclined
towards Lean and getting the support from the Director of the parent company hired a
Lean Champion for Lean deployment across the organization. Six Sigma was slowly
rolled out in 2006 after gaining commitment at all levels in the organization.

Maneesh Kumar
However, both the initiatives became fragmented
Champion moved to a different company
confident enough to lead the change from the front. Again, there were changes in
management structure at the corporate level in 2007. The p
more focused on financial measures
productivity by compromising
such as Lean and Six Sigma.
Figure 7.1:
D does not have any quality program for their suppliers and follow traditional
inspection methods to co
complaints using a software package provided by the parent company called
Enterprise Quality Management System (EQMS), which was very costly to use. The
software was customized for
surveys to listen to the voice of customers.
E secured ISO 9000 certification in 1998 and ISO 13485 certification for use in
medical applications in 2004. ISO 13485 ensures that all parts used meet the
specification for medical equipment. After being takeover by Swedish MNC,
involved in the development of the Six Sigma program in 2006 due to the popularity
and success of program in the parent company. The MD of
the parent company an
initiative in the company. Due to the type of product manufactured (low volume
mix), E had struggled to identify an improvement project applying Six Sigma
methodology. E was considering g
(DFSS) that may help in getting the design right first time. Thus, at the company site,
Chapter 7: Case Study Analysis
both the initiatives became fragmented in the organization after the
Champion moved to a different company and there were no other employees
ough to lead the change from the front. Again, there were changes in
management structure at the corporate level in 2007. The parent company
focused on financial measures and thus pressure was felt by
productivity by compromising quality of its product, leading to the
such as Lean and Six Sigma.
Figure 7.1: D’s six-step process for Continuous Improvement
does not have any quality program for their suppliers and follow traditional
inspection methods to control raw material/ product quality. They deal with customer
complaints using a software package provided by the parent company called
Enterprise Quality Management System (EQMS), which was very costly to use. The
software was customized for D but was not very successful. D now
surveys to listen to the voice of customers.
secured ISO 9000 certification in 1998 and ISO 13485 certification for use in
medical applications in 2004. ISO 13485 ensures that all parts used meet the
n for medical equipment. After being takeover by Swedish MNC,
development of the Six Sigma program in 2006 due to the popularity
and success of program in the parent company. The MD of E adhering to the advice of
the parent company and realizing the efficacy of the Six Sigma program, promoted the
initiative in the company. Due to the type of product manufactured (low volume
had struggled to identify an improvement project applying Six Sigma
was considering going down the route of Design for Six Sigma
(DFSS) that may help in getting the design right first time. Thus, at the company site,
Chapter 7: Case Study Analysis
204
in the organization after the Lean
and there were no other employees
ough to lead the change from the front. Again, there were changes in
arent company was now
and thus pressure was felt by D to increase
of its product, leading to the failure of initiatives
step process for Continuous Improvement
does not have any quality program for their suppliers and follow traditional
ntrol raw material/ product quality. They deal with customer
complaints using a software package provided by the parent company called
Enterprise Quality Management System (EQMS), which was very costly to use. The
now conducts customer
secured ISO 9000 certification in 1998 and ISO 13485 certification for use in
medical applications in 2004. ISO 13485 ensures that all parts used meet the
n for medical equipment. After being takeover by Swedish MNC, E got
development of the Six Sigma program in 2006 due to the popularity
adhering to the advice of
d realizing the efficacy of the Six Sigma program, promoted the
initiative in the company. Due to the type of product manufactured (low volume-high
had struggled to identify an improvement project applying Six Sigma
oing down the route of Design for Six Sigma
(DFSS) that may help in getting the design right first time. Thus, at the company site,
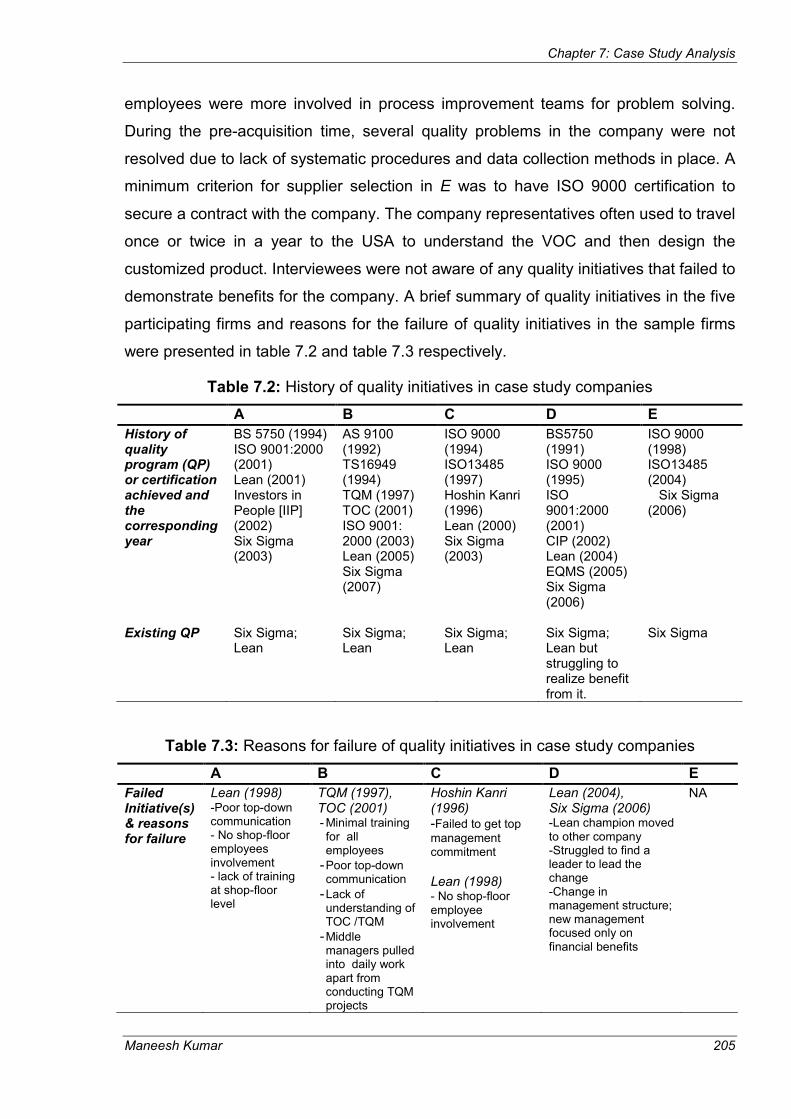
Chapter 7: Case Study Analysis
Maneesh Kumar 205
employees were more involved in process improvement teams for problem solving.
During the pre-acquisition time, several quality problems in the company were not
resolved due to lack of systematic procedures and data collection methods in place. A
minimum criterion for supplier selection in E was to have ISO 9000 certification to
secure a contract with the company. The company representatives often used to travel
once or twice in a year to the USA to understand the VOC and then design the
customized product. Interviewees were not aware of any quality initiatives that failed to
demonstrate benefits for the company. A brief summary of quality initiatives in the five
participating firms and reasons for the failure of quality initiatives in the sample firms
were presented in table 7.2 and table 7.3 respectively.
Table 7.2: History of quality initiatives in case study companies
A B C D E
History of quality program (QP) or certification achieved and the corresponding year
BS 5750 (1994) ISO 9001:2000 (2001) Lean (2001) Investors in People [IIP] (2002) Six Sigma (2003)
AS 9100 (1992) TS16949 (1994) TQM (1997) TOC (2001) ISO 9001: 2000 (2003) Lean (2005) Six Sigma (2007)
ISO 9000 (1994) ISO13485 (1997) Hoshin Kanri (1996) Lean (2000) Six Sigma (2003)
BS5750 (1991) ISO 9000 (1995) ISO 9001:2000 (2001) CIP (2002) Lean (2004) EQMS (2005) Six Sigma (2006)
ISO 9000 (1998) ISO13485 (2004) Six Sigma (2006)
Existing QP Six Sigma; Lean
Six Sigma; Lean
Six Sigma; Lean
Six Sigma; Lean but struggling to realize benefit from it.
Six Sigma
Table 7.3: Reasons for failure of quality initiatives in case study companies
A B C D E
Failed Initiative(s) & reasons for failure
Lean (1998) -Poor top-down communication - No shop-floor employees involvement - lack of training at shop-floor level
TQM (1997), TOC (2001) - Minimal training for all employees
- Poor top-down communication
- Lack of understanding of TOC /TQM
- Middle managers pulled into daily work apart from conducting TQM projects
Hoshin Kanri (1996) -Failed to get top management commitment Lean (1998) - No shop-floor employee involvement
Lean (2004), Six Sigma (2006) -Lean champion moved to other company -Struggled to find a leader to lead the change -Change in management structure; new management focused only on financial benefits
NA

Chapter 7: Case Study Analysis
Maneesh Kumar 206
Interviewees were asked whether they followed a structure/ skeleton or framework to
embark on the Six Sigma journey. None of the participating firms adhered to a
framework for Six Sigma implementation. It was rather a haphazard approach taken
by firms as a result of some funding secured (in the case of A), or support from OEMs
(in the case of B), or driven by the parent firms (in the case of C, D, and E). The
common steps followed in firms were communication from the top management on the
need for Six Sigma, training few selected employees as Black Belts (BBs) and Green
Belts (GBs), and executing a Six Sigma project in a pilot area. The benefits generated
from the project were shared with the rest of the organization to break down any
resistance for change existing in the organization and raise the awareness of the
efficacy of program. Interviewees strongly accentuated the need to develop a
customized framework tailored to the needs of SMEs for successful implementation of
Six Sigma. A structured and planned approach to implementation would facilitate long-
term sustainability of learning and benefits realised from Six Sigma. Firms commented
on the need for a Six Sigma framework that takes into account the resource
constraints issue faced by the majority of SMEs as significant initial investment is
required to develop an organizational infrastructure for Six Sigma implementation.
7.1.2.2. ISO 9000 as a foundation to embark on Six Sigma
The results of the survey conducted in the first phase of this doctoral work revealed
that out of 49 certified ISO firms, 17 firms have implemented Lean and 10 of the 17
Lean firms have gone down the route of Six Sigma. This finding implies that ISO may
be the foundation or building block before embracing Lean and Six Sigma. This was
tested by conducting interviews at senior and middle management level in the case
study companies.
From A’s perspective, ISO 9000 is one of the foundational principles to get started
with other business improvement initiatives. It does not guarantee product quality but
helps in standardizing the process and following it through. The MD of A viewed ISO
9000 as “the way of retaining and winning business. If you adopt a standard, it puts
some structure in your company, which you can make work for you, and align it to
your goal. We were better organized as to how we stored component. We had a more

Chapter 7: Case Study Analysis
Maneesh Kumar 207
formal production line, everything labelled and defined (defined assembly process,
inspection process, test process). I learnt that these standards are great enablers”.
Other senior and middle management executives opined that ISO helped the
company in establishing the structure, implementing procedures and worked as a
foundation to get started with Lean and Six Sigma. Similar findings were reported
during the interviews with executives in B, C, D, and E. The new standard ISO
9001:2000, as believed by A, B, and D eliminates the bureaucracy with more focus on
a proactive approach to data gathering and making continuous improvement. The
interviewees in A, B, C and D strongly accentuated the point of having standardized
procedures in place to understand processes and measure the process performance.
However, it is very important to train your employees on how to follow the procedures
and adhere or make amendments to it according to the needs of the customer/market.
The Quality Manager in E put stress on employee training and good design to make
effective use of such accreditation. He further stated that “ISO 9001 accreditation is
effective for keeping people working to procedures; it is good for making people aware
that there are procedures for how they do their job, procedures for how things should
happen. But at the end of the day, if the design is poor or people are not trained, no
use of such system”.
If the procedures are not formalized, employees do the same things in different ways,
creating confusion and chaos in the organization. It is almost impossible to implement
Lean or any kind of strategic improvement initiatives without having established
processes and procedures in place. Supporting the above statement, the Operations
Director of C stated that “ISO certification is the way of doing business. We need to
standardize procedure through ISO. The output from ISO made implementation of
Lean easier than it would have been if we had not had ISO certification. I think that it
makes sense to do ISO first followed by Lean and Six Sigma”.
It also depends on the maturity and existence of the firm: if it is a new business with
10-20 employees, ISO may help to establish the procedures. After documenting the
procedures, the company is in a position to define its processes, understand the
input/output, and start measuring its processes by collecting data. This is the time
when the company is ready to embark on Six Sigma.

Chapter 7: Case Study Analysis
Maneesh Kumar 208
It was also accentuated in company A, B, C and E that Lean is better for the first
round of improvement attacking the low hanging fruit to eliminate waste from the
organization. It is easier to convince management and shop-floor employees to
embrace Lean because the benefits are visible and quicker compared to Six Sigma.
Some of the basic Lean tools like 5S give a feeling of empowerment and process
ownership to shop-floor individuals as they can see the immediate benefits of standard
house-keeping practice. Once the initiative has gained the appreciation of top
management as well as shop floor employees, it is easier to implement Six Sigma to
minimize any variations existing in the process.
The motivation for certification should not only be driven by demand from customers
or markets but supported internally by the management team to have established
standard procedures and mapped processes. If it is sought for a window dressing
exercise, employees will find the initiative bureaucratic and a waste of their time.
Similar opinion was observed while interviewing the Quality Manager of D- “But the
employees looked at it as bureaucratic and time consuming. However it all boils down
to good leadership. It made people comfortable by establishing the procedure. But it
hinders innovation and creativity as you adhere to the procedure. It is not a bad thing
for the company. ISO 9000 certification was easier to achieve, however we forgot
everything once we got certification”.
The aforementioned discussion supports the finding of the survey and the proposition
that ISO may be the foundation for implementing Six Sigma. No company should
consider ISO as their destination to the quality improvement journey. The focus should
be on continuous improvement to sustain its performance in the global market. Lean
may be used in the first round of improvement to eliminate the waste followed by Six
Sigma applications to reduce the variation from the processes. However, to generalize
the findings more case studies should be conducted with SMEs implementing Lean
and Six Sigma.
7.1.2.3. Motivation to implement Quality Initiative(s)
Table 7.4 provided information on the motivation to implement CI initiatives such as
Lean and Six Sigma in the case study companies. In both A and B, the
implementation of initiatives such as Lean and Six Sigma were supported by the

Chapter 7: Case Study Analysis
Maneesh Kumar 209
Managing Directors (MD) of the companies. The MD in both firms communicated the
need by addressing the entire organization about the competitive advantages provided
by Lean and Six Sigma business strategies. The MDs were committed to keep the
business sustainable on a long-term basis, resulting in the implementation of CI
initiatives and allocating resources to drive improvements in quality, performance, and
customer satisfaction. Other reasons cited by A and B to embark on the Lean and Six
Sigma journey were presented in table 7.4. The management team in A took the view
that “if Six Sigma is good enough for GE and other world class companies, why should
we not consider it”.
Lean and Six Sigma were introduced in C, D, and E by their parent companies that
believed in the concept of CI and have realized significant benefits from the
implementation of Lean and Six Sigma. Parent companies of C and E believed in the
efficacy of Six Sigma and encouraged the management team in C and E to implement
the initiative with their financial and human resource support to train employees on
Lean Six Sigma. Due to a change in leadership at the corporate level of C in 2001, the
new CEO supported the application of Lean Six Sigma for minimizing wastes and
defects across the organization and its subsidiaries including C. With the support of
the parent company, C implemented Lean/Six Sigma across their production
department to minimize waste and defects from their processes. Six Sigma was used
as the main problem solving methodology for quality and cost improvement in C.
As E was involved in job shop production, rather than batch or mass production, they
used basic problem solving methodology for process improvement. Six Sigma was
introduced by the parent company and was only used when problem was complex
enough to be solved using basic problem solving methodology. It would have been
difficult for D and E to embark on initiatives such as Six Sigma, had it been not
financed by the parent company. This was the opinion of interviewees in D and E.
However, due to acquisition by larger firms, C, D, and, E had limited authority for
decision making regarding their R&D and strategic issues. They were empowered to
take operational improvement related decisions. The availability of resources for
training of employees was one of the advantages of being part of a MNC as
experienced by C, D, and E.
When CIP was introduced in 2002, D had support from the MD who was in regular
touch with the project champion to monitor the progress of projects. However, things
Chapter 7: Case Study Analysis
Maneesh Kumar 210
changed after he moved and the management structure changed both in D and the
parent company. Lean was implemented in D by the new management team at
corporate level and the focus shifted from standard procedures to a process
perspective. D applied the principle of Lean in supply chain; started global customer
initiative- getting in touch with customers; and established key performance indicators
(KPIs) in the strategic plan.
Lean was implemented in 2004 with no rationale provided for implementation. Five
employees were initially trained by experts from the parent company on Lean
principles before getting started with the implementation. Only the middle
management team went for the training with no participation from senior management
level. The five trained personnel were responsible for all the process improvement
activities in D and were also dragged into other day to day activities of the business.
D struggled to maintain the momentum after application of Six Sigma due to several
changes in management at the corporate level. Six Sigma was introduced in D by the
parent company in 2006 to minimize defects in their production department. A new
CEO was appointed at corporate level who believed only in the concept of Lean to a
certain extent (Six Sigma was not included in his business lexicon) and was primarily
driven by profitability and increase in market share. This resulted in the loss of
momentum of initiatives such as Lean/Six Sigma that had an immediate impact on the
defects in processes/ products and on-time delivery of the products manufactured.
Since the change of management, any investment in training on QM has completely
stopped. The existing culture of the company after the change in management
structure in 2007 is best illustrated from the following statement from the Quality
Manager in D-
“We had a change in management structure that was not supporting our framework
we followed in the past. We had different business units that were competing with
each other. The parent company was only driven by numbers and wanted the desired
results. However, they questioned us when there are customer complaints or we have
not met delivery-time promised to the customer”.
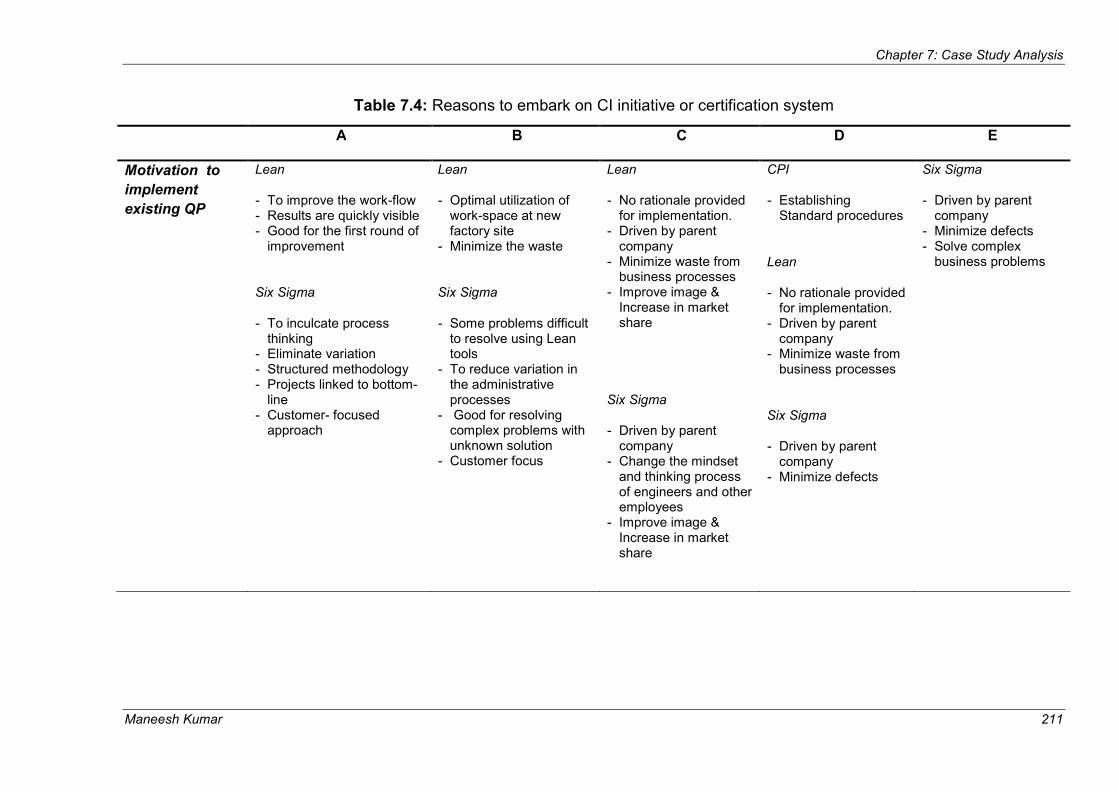
Chapter 7: Case Study Analysis
Maneesh Kumar 211
Table 7.4: Reasons to embark on CI initiative or certification system
A B C D E
Motivation to
implement
existing QP
Lean
- To improve the work-flow - Results are quickly visible - Good for the first round of
improvement
Six Sigma
- To inculcate process thinking
- Eliminate variation - Structured methodology - Projects linked to bottom-
line - Customer- focused
approach
Lean
- Optimal utilization of work-space at new factory site
- Minimize the waste
Six Sigma
- Some problems difficult to resolve using Lean tools
- To reduce variation in the administrative processes
- Good for resolving complex problems with unknown solution
- Customer focus
Lean
- No rationale provided for implementation.
- Driven by parent company
- Minimize waste from business processes
- Improve image & Increase in market share
Six Sigma
- Driven by parent company
- Change the mindset and thinking process of engineers and other employees
- Improve image & Increase in market share
CPI
- Establishing Standard procedures
Lean
- No rationale provided for implementation.
- Driven by parent company
- Minimize waste from business processes
Six Sigma
- Driven by parent company
- Minimize defects
Six Sigma
- Driven by parent company
- Minimize defects - Solve complex
business problems

Chapter 7: Case Study Analysis
Maneesh Kumar 212
7.1.2.4. Organizational Infrastructure
The term ‘organizational infrastructure’ refers to the number of trained quality
personnel responsible for implementing Lean, Six Sigma or ISO and driving CI efforts
in the company. The detailed information on organizational infrastructure existing in
the participating firms was provided in table 7.5. To test the efficacy of Lean and Six
Sigma on a pilot project, A and B trained their best people as Black Belt (BB) and
Green Belt (GB) to carry out pilot projects. A team comprising these people were
selected from cross-functional departments and were assisted by shop-floor
employees (trained as Yellow Belt [YB]) to execute projects across the business
functions.
‘A’ managed to secure funding (30% of the training cost) to get started with external
Six Sigma BB training in the first year of the Six Sigma implementation. Two of their
best employees were trained externally as BBs. BBs, took the train the trainer
approach, to provide Six Sigma YB training to the rest of their employees to raise their
awareness on the efficacy of methodology. BBs in A were responsible for executing
Six Sigma projects for a two year period and were thereafter rolled back to their
original job. This rotation policy was used to give opportunity to other skilled staff
members to undertake GB projects under the guidance of experienced BBs. This
rotation policy not only took care of their scarce human resources but also developed
an infrastructure that was capable of sustaining the learning and benefits from the
initiative on a long-term basis.
Similarly, B’s employees were trained as Green Belts from one of their customers
(original equipment manufacturer [OEM]) at a discounted price. They also managed to
get support from the DTI funded organization, North East Productivity Alliance (NEPA)
that conducted a diagnostic check for the company to identify the gaps in their process
improvement approach and suggested implementation of Lean for the first round of
process improvement. The MD hired a Lean Six Sigma facilitator, having previous
experience of implementing Lean Six Sigma in large organizations, to facilitate the
implementation of Lean/Six Sigma and develop an organizational infrastructure to
support the implementation of the initiative. The MD took the responsibility of
controlling the CI initiative which was driven by shop-floor employees to make it more
sustainable for the longer term. A Lean Six Sigma facilitator trained the rest of the
organization on the basics of two methodologies. The MD of the company showed the
Chapter 7: Case Study Analysis
Maneesh Kumar 213
commitment to the initiative by himself undertaking a GB training program and also
executing a GB project, thereby leading by example. B had started applying the
principles of Lean/Six Sigma outside manufacturing, i.e. in their administrative/ support
processes such as HR and finance.
Due to a change in management at the parent company, C implemented Six Sigma to
drive the CI effort with the support of a new and charismatic CEO from the parent
company. BB training was provided by skilled trainers from the parent company to
seven process engineers in C to implement Six Sigma within the production
department. People showing interest in BB training were given opportunity to be
trained and to execute projects. Eleven employees were also trained at GB level after
the first wave of BB training but failed to execute any projects due to lack of self
motivation and work pressure. Six Sigma was becoming endemic in C, with engineers
using its principle in their day to day work for cost and quality improvement, fact based
decisions and problem solving.
Lean was implemented in C with the help of the parent company and support from
Scottish Manufacturing Advisory Services (SMAS) practitioners. SMAS practitioners
trained engineers on Lean tools and the focus was particularly on streamlining the
production department. C had again involved SMAS practitioners in 2007 to re-launch
the Lean initiative across the business and got shop-floor employees trained on basic
lean tools such as 5S or value stream mapping (VSM). The statement from the
Operations Director in C reinforces the support they are getting from the parent
company to drive CI – “If we do recognize that we need to implement QI, we are
always backed with investment in training”.
C was developing their own capability to train the rest of the employees on Lean/Six
Sigma so that they can sustain the culture of CI on a long-term basis. The statement
below from the Quality Engineer in C further reinforces the aforementioned point –
“But from a local perspective, we are trying to develop a mentor type program, where
engineers teach Lean / Six Sigma to the rest of employees. So that we can retain the
knowledge and keep the momentum rather than relying on external consultants. One
of the experts is involved with the employees on resolving problems at the shop-floor
level, he introduces tools & techniques to the rest of the employees without directly
telling them about Six Sigma or Lean”.

Chapter 7: Case Study Analysis
Maneesh Kumar 214
The Lean/ Six Sigma implementation pattern in D and E was similar to the approach
adopted by C, i.e. implementation was facilitated with the support of the parent
company. Corporate people entrusted divisional people in D to implement Lean and
Six Sigma. The USA counterpart sent a Lean Six Sigma expert to train D’s employees
on Lean/ Six Sigma implementation. Two employees in D were trained on Lean/Six
Sigma by the corporate team as GBs and were further supported by Scottish
Enterprise (5-6 days training on Lean Six Sigma). There was 11-12 sessions on Lean
training and thereafter employees were supposed to execute projects. D was sending
10% of the employees for a higher educational degree. Due to a change in the
management structure of the parent company and appointment of a new MD, the
focus in D shifted from Lean/Six Sigma to meeting productivity targets and enhancing
profitability of the company. The focus on Six Sigma training or projects was lost and
minimal investment was made by the parent company to build the organizational
infrastructure in D to execute Lean/Six Sigma projects.
Six Sigma was implemented in E with the support of the parent company that initially
provided a one day awareness session on Six Sigma to everybody in the company.
Two process engineers were trained as GB and one middle manager was provided
DFSS training. E had cross-functional process improvement teams of 4-10 members
to brainstorm ideas and resolve the quality problems in their business processes. The
MD of E was very committed to Six Sigma, underwent Six Sigma awareness training
to become a project sponsor to support the CI effort in the organization. Again, there
was pressure from the parent company to ingrain a culture of Six Sigma thinking
within E. The next step in their CI journey was to train the best employees as BB, who
can execute projects and train other employees in E.
Even without external support and funding, the MDs in both A and B were ready to
commit resources for the training of employees as they realized that benefits
generated (both hard and soft benefits) from Six Sigma implementation outweighs the
initial investment cost. In the case of B, the training was supported by one of their key
customers at a discounted rate. In C and D, the training support was provided by
government funded bodies such as SMAS and Scottish Enterprise apart from their
parent company. Interviewees in E were not sure how they would have trained their
employees without the support of the parent company.
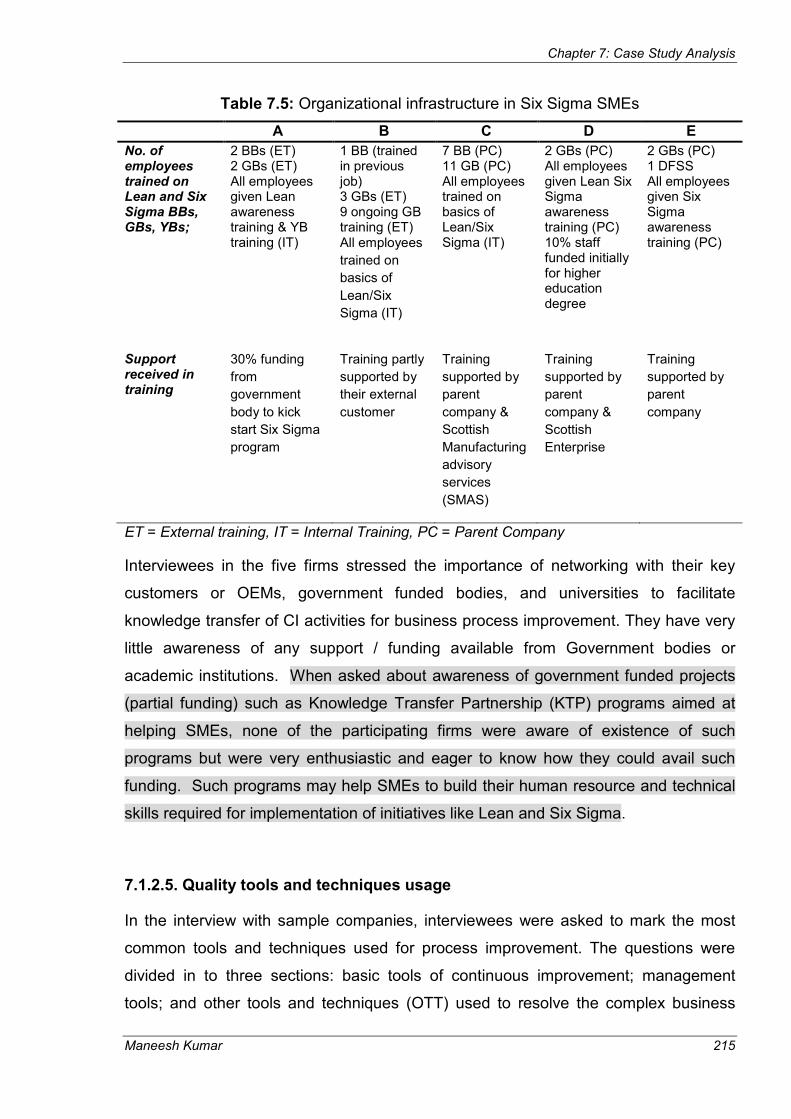
Chapter 7: Case Study Analysis
Maneesh Kumar 215
Table 7.5: Organizational infrastructure in Six Sigma SMEs
A B C D E
No. of employees trained on Lean and Six Sigma BBs, GBs, YBs;
2 BBs (ET) 2 GBs (ET) All employees given Lean awareness training & YB training (IT)
1 BB (trained in previous job) 3 GBs (ET) 9 ongoing GB training (ET) All employees
trained on
basics of
Lean/Six
Sigma (IT)
7 BB (PC) 11 GB (PC) All employees trained on basics of Lean/Six Sigma (IT)
2 GBs (PC) All employees given Lean Six Sigma awareness training (PC) 10% staff funded initially for higher education degree
2 GBs (PC) 1 DFSS All employees given Six Sigma awareness training (PC)
Support received in training
30% funding
from
government
body to kick
start Six Sigma
program
Training partly
supported by
their external
customer
Training
supported by
parent
company &
Scottish
Manufacturing
advisory
services
(SMAS)
Training
supported by
parent
company &
Scottish
Enterprise
Training
supported by
parent
company
ET = External training, IT = Internal Training, PC = Parent Company
Interviewees in the five firms stressed the importance of networking with their key
customers or OEMs, government funded bodies, and universities to facilitate
knowledge transfer of CI activities for business process improvement. They have very
little awareness of any support / funding available from Government bodies or
academic institutions. When asked about awareness of government funded projects
(partial funding) such as Knowledge Transfer Partnership (KTP) programs aimed at
helping SMEs, none of the participating firms were aware of existence of such
programs but were very enthusiastic and eager to know how they could avail such
funding. Such programs may help SMEs to build their human resource and technical
skills required for implementation of initiatives like Lean and Six Sigma.
7.1.2.5. Quality tools and techniques usage
In the interview with sample companies, interviewees were asked to mark the most
common tools and techniques used for process improvement. The questions were
divided in to three sections: basic tools of continuous improvement; management
tools; and other tools and techniques (OTT) used to resolve the complex business

Chapter 7: Case Study Analysis
Maneesh Kumar 216
problems. The details of the application of different tools and techniques were listed in
table 7.6.
All the sample firms were in the early stage of implementing Six Sigma, i.e. having
less than 5 years experience. This may have a direct implication on their usage of
tools and techniques of quality / process improvement for resolving quality related
problems in organization. The result from table 7.6 clearly reflects their inexperience in
using management tools and tools within other categories. Mostly, all the sample
firms, except D, were using basic tools of quality in day to day problem solving
activities. As stated by quality Guru, Kaoru Ishikawa (1951), 95% of the problems in
industry may be resolved using basic tools of CI. Basic tools of CI are visual tools
(similar to Lean tools like 5S and value stream mapping [VSM]), which can be used by
the average person or shop-floor employees to understand, analyze, and interpret
data for process improvement.
A, B, and C used some of the tools and techniques within the OTT category while
executing Six Sigma projects. BBs in A, B, and C were aware of the usage, usefulness
and limitations of each tool and technique. Some of the Lean tools such as 5S,
Kanban, and VSM, were used in A, B, and C for the initial round of improvement and
achieve quicker results to get buy-in from shop-floor employees as well as senior and
middle management teams. Moreover, Lean tools are visual and easier to understand
from the layman’s perspective, e.g. Kanban, 5S, VSM, as it involves less statistics and
is very simple to use. Interviewees also opined that Lean tools like 5S and VSM gives
a sense of empowerment to shop-floor employees to take decisions for their
processes and improve their work space. The improvements from application of lean
tools were quite rapid and visible, which helped in breaking down any resistance to
change by the employees. Successful application of lean tools in A, B, and C provided
a platform for implementation of Six Sigma as a culture of CI was ingrained in the
three firms through company-wide involvement in the Lean initiative.
When it comes to application of Six Sigma tools and techniques in the OTT category,
tools/ techniques such as SPC, FMEA, and regression analysis were used by majority
of the participating firms except D. Powerful techniques like DoE, Balance Scorecard,
Benchmarking, Quality Costing, QFD, hypothesis testing, TPM, were either rarely
used or not used by participating firms for resolving quality related problems.

Chapter 7: Case Study Analysis
Maneesh Kumar 217
Table 7.6: Tools and techniques perceived to be currently used in sample SMEs
D and E were struggling to use the management tools and tools within the OTT
category to drive their CI efforts. As E had implemented Six Sigma for a year only,
they have slowly started using advanced tools and techniques for Lean and Six Sigma
projects. E had used DOE to change the entire design to manufacture guidelines
across the printed circuit board (PCB), resulting in massive improvement and bottom-
line impact.
Tools & Techniques
A B C D E
Basic Tools Cause & Effect × × × × ×
Check Sheet / Tally Sheet × × × × Control Charts × × × × ×
Histogram × × × Pareto Charts × × × × ×
Scatter Diagram × × × × Process Map × × × × ×
Brainstorming × × × × ×
Management tools Affinity Diagrams × × × × × Relations Diagram × × ×
Tree Diagram × × × Matrix data analysis
Matrix diagrams Arrow diagram ×
Process decision program chart
Other tools & techniques 5S × × × ×
Kanban × × × Benchmarking ×
Balance Scorecard Statistical Process Control (SPC) × × × ×
Failure Mode and Effect Analysis (FMEA) × × × × Value Stream Mapping (VSM) × × ×
Measurement System Analysis (MSA) × × Design of Experiments (DoE) × × ×
Quality Function Deployment (QFD) Hypothesis Testing × Regression Analysis × × × × Force Field Analysis
Quality Costing × × Total Productive Maintenance ×
Mistake Proofing × ×
Chapter 7: Case Study Analysis
Maneesh Kumar 218
The reasons cited for low usage of quality tools and techniques by the interviewees in
D were lack of senior management focus on CI and limited employee understanding
on the usage of these tools and techniques. D and E rarely used any of the advanced
techniques for problem solving. It is noteworthy that all the participating firms were
very new to the implementation of Six Sigma and thus not aquatinted with or applying
advanced tools/techniques. Understanding of tools such as cost of quality or QFD is
minimal in SMEs, as revealed from the case study analysis. It raises questions on how
firms measure the VOC and translate this into technical requirements of the product.
Only B was fully utilizing the concept of quality costing to measure the process
performance across the business functions. A had recently involved the finance
department to collate quality related costs incurred by the company. The calculation of
the cost of poor quality may help A in minimizing waste from the organization by
identification of Six Sigma projects which is imperative from the customer perspective
(both internal and external). Taking account of quality costs is rarely observed in
SMEs, i.e. those cost incurred in the design, implementation, operation and
maintenance of a company’s quality management system, the cost of resources
committed to the process of continuous quality improvement plus the cost of systems
and/or product failures.
7.1.3. Critical Success Factors and Barriers
7.1.3.1. Critical Success Factors (CSFs)
In the context of Six Sigma implementation, CSFs represent the essential ingredients
without which a project stands little chance of success. Interviewees in the sample
firms were asked to identify factors they considered important for successful
implementation of Six Sigma. Factors listed as important are presented in table 7.7
and elaborated below.
Strong leadership and top management commitment
Success of any CI hinges on strong leadership and commitment from top
management to devote time, resources, and break down stumbling blocks in the
implementation process. In A, B, C, and E, the implementation of initiatives such as
Lean and Six Sigma were supported by the MD of the company. The MDs in these
firms communicated the need for the initiative by addressing the entire organization
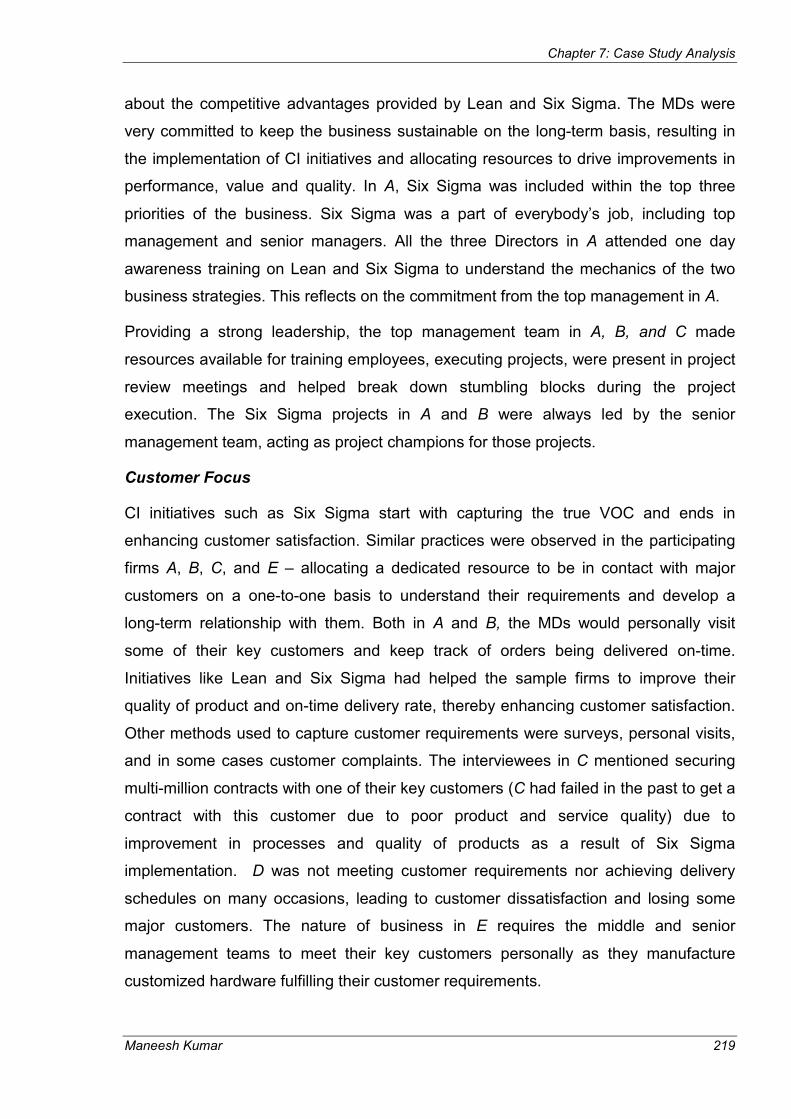
Chapter 7: Case Study Analysis
Maneesh Kumar 219
about the competitive advantages provided by Lean and Six Sigma. The MDs were
very committed to keep the business sustainable on the long-term basis, resulting in
the implementation of CI initiatives and allocating resources to drive improvements in
performance, value and quality. In A, Six Sigma was included within the top three
priorities of the business. Six Sigma was a part of everybody’s job, including top
management and senior managers. All the three Directors in A attended one day
awareness training on Lean and Six Sigma to understand the mechanics of the two
business strategies. This reflects on the commitment from the top management in A.
Providing a strong leadership, the top management team in A, B, and C made
resources available for training employees, executing projects, were present in project
review meetings and helped break down stumbling blocks during the project
execution. The Six Sigma projects in A and B were always led by the senior
management team, acting as project champions for those projects.
Customer Focus
CI initiatives such as Six Sigma start with capturing the true VOC and ends in
enhancing customer satisfaction. Similar practices were observed in the participating
firms A, B, C, and E – allocating a dedicated resource to be in contact with major
customers on a one-to-one basis to understand their requirements and develop a
long-term relationship with them. Both in A and B, the MDs would personally visit
some of their key customers and keep track of orders being delivered on-time.
Initiatives like Lean and Six Sigma had helped the sample firms to improve their
quality of product and on-time delivery rate, thereby enhancing customer satisfaction.
Other methods used to capture customer requirements were surveys, personal visits,
and in some cases customer complaints. The interviewees in C mentioned securing
multi-million contracts with one of their key customers (C had failed in the past to get a
contract with this customer due to poor product and service quality) due to
improvement in processes and quality of products as a result of Six Sigma
implementation. D was not meeting customer requirements nor achieving delivery
schedules on many occasions, leading to customer dissatisfaction and losing some
major customers. The nature of business in E requires the middle and senior
management teams to meet their key customers personally as they manufacture
customized hardware fulfilling their customer requirements.
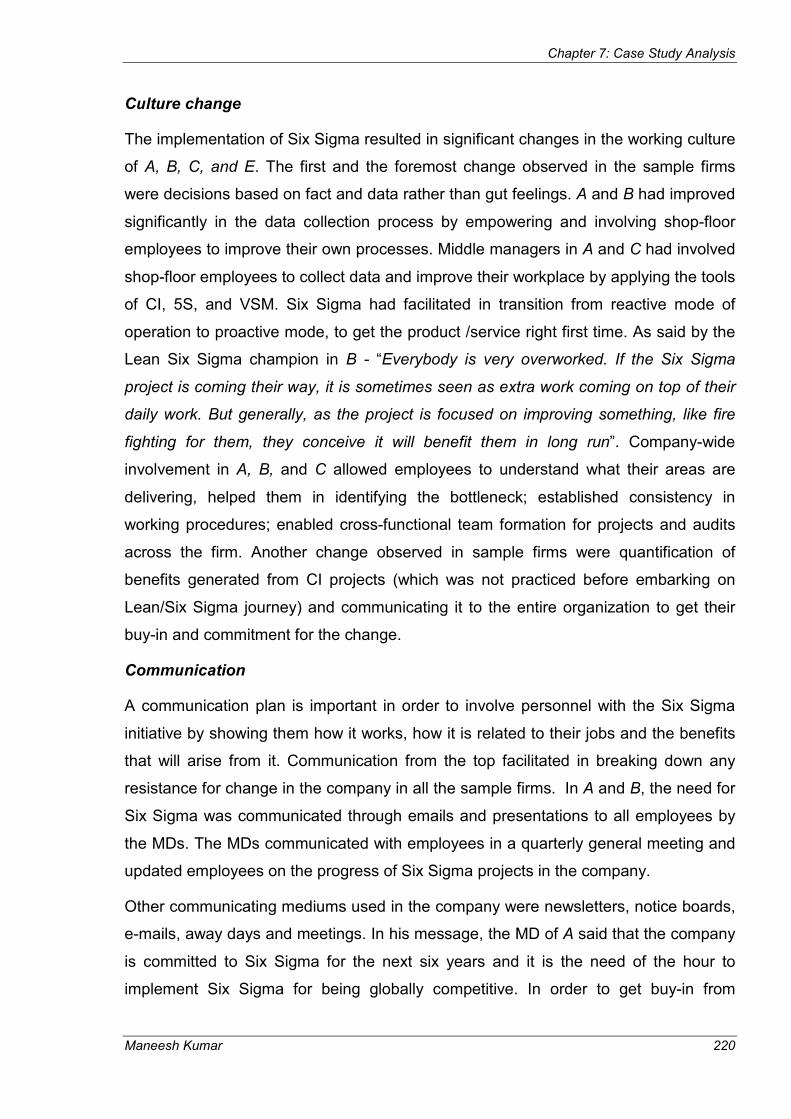
Chapter 7: Case Study Analysis
Maneesh Kumar 220
Culture change
The implementation of Six Sigma resulted in significant changes in the working culture
of A, B, C, and E. The first and the foremost change observed in the sample firms
were decisions based on fact and data rather than gut feelings. A and B had improved
significantly in the data collection process by empowering and involving shop-floor
employees to improve their own processes. Middle managers in A and C had involved
shop-floor employees to collect data and improve their workplace by applying the tools
of CI, 5S, and VSM. Six Sigma had facilitated in transition from reactive mode of
operation to proactive mode, to get the product /service right first time. As said by the
Lean Six Sigma champion in B - “Everybody is very overworked. If the Six Sigma
project is coming their way, it is sometimes seen as extra work coming on top of their
daily work. But generally, as the project is focused on improving something, like fire
fighting for them, they conceive it will benefit them in long run”. Company-wide
involvement in A, B, and C allowed employees to understand what their areas are
delivering, helped them in identifying the bottleneck; established consistency in
working procedures; enabled cross-functional team formation for projects and audits
across the firm. Another change observed in sample firms were quantification of
benefits generated from CI projects (which was not practiced before embarking on
Lean/Six Sigma journey) and communicating it to the entire organization to get their
buy-in and commitment for the change.
Communication
A communication plan is important in order to involve personnel with the Six Sigma
initiative by showing them how it works, how it is related to their jobs and the benefits
that will arise from it. Communication from the top facilitated in breaking down any
resistance for change in the company in all the sample firms. In A and B, the need for
Six Sigma was communicated through emails and presentations to all employees by
the MDs. The MDs communicated with employees in a quarterly general meeting and
updated employees on the progress of Six Sigma projects in the company.
Other communicating mediums used in the company were newsletters, notice boards,
e-mails, away days and meetings. In his message, the MD of A said that the company
is committed to Six Sigma for the next six years and it is the need of the hour to
implement Six Sigma for being globally competitive. In order to get buy-in from

Chapter 7: Case Study Analysis
Maneesh Kumar 221
employees, the MD and Finance Director (FD) in A acted as champions of pilot
projects using Six Sigma DMAIC methodology and conveyed the benefits generated
from the pilot project across the company. The commitment from the MD and other
senior management people in ‘B’ was reflected from the MD’s statement presented
below– “We try to keep the initiative live by doing the monthly audit of 5S each month.
It is done by two of our directors. We change the location of the audit. By doing that,
we maintain top level company awareness of what is happening in the business;
talking to people and understanding their difficulties; it enables and generates
awareness for everybody what is going on in the business”.
In A, B, C, and E, an email was send at the end of the Six Sigma project to brief the
rest of the employees on what happened in the project. Other communication
mediums used were notice boards, quarterly newsletters, messages displayed on TV
screen in canteen during breakfast and lunch breaks, project review meetings, and the
MD’s address to the rest of the employees from time to time. The communication
mechanisms in D were also very similar but the focus was more on productivity and
sales metrics rather than communicating information on the benefits on any CI
projects.
Commitment from middle-level management
This was the new factor, which was missing from the existing literature on CSFs of Six
Sigma and which emerged from the interview process. In A, B, and C, initially it was
difficult to convince the middle managers to get involved in Six Sigma project
execution. Team leaders were difficult to convince to release the people within their
departments for the project execution as they had to find a replacement for the person
engaged in the project. This problem was resolved involving the senior management
team and making the team leaders realize the benefits the department will have from
the success of the project. Quotes from the Lean Champion in ‘B’ further reinforces
the aforementioned point – “No resistance at the middle level management as
because of the involvement of the MD; discussing with them and letting them know the
reason as why we are doing it”. Once the benefits from the pilot project were shared
with middle level management, the resistance to change started to wane.

Chapter 7: Case Study Analysis
Maneesh Kumar 222
Employee training and involvement
Interviewees in the five firms believed that to build and sustain a culture of CI, it is
imperative to train your employees on the basics of Lean and Six Sigma and get them
involved from the inception of the quality program in the firm. As discussed in the
previous section, some of the quality initiatives failed due to minimal involvement of
shop-floor employees during the early implementation stage or lack of training and
knowledge about the initiative. Employees are the real ‘action heroes’, who are
involved in daily production/ service delivery. Training and empowerment would
facilitate employees to take decisions for their own processes and make improvement
in their processes. As observed in A, B, and C, the majority of the shop-floor
employees received one-two days introduction training on Lean/Six Sigma, were given
process ownership, and freedom to share and suggest ideas for process improvement
with their supervisors or middle management. Employee empowerment and
involvement in CI initiatives facilitated in changing the working culture in the three
firms. The Operations Director in C commented on the employees commitment to Six
Sigma program - “We have been fortunate in the business our people have been
ready not only to show their commitment but also apply their commitment. For
example, we had more than 11 volunteers opting for Six Sigma training, showing their
interest in the Six Sigma training”.
Availability of resources
To ensure the success of any initiative, it is imperative for the top management to
make resources available for the project execution. The literature reveals that SMEs
struggle with any new CI initiatives due to limited resources for training and executing
projects. Interviewees in the five sample firms were not in consensus with the findings
from the past literature and argued strongly that leadership and management
commitment to resources governs the success of any new initiative. Though
interviewees agreed that SMEs have limited resources, but development of best-in-
class practice will create some slack resources that could be used in implementation
and deployment of CI initiatives for long term sustainability. Scarcity of resources is
just an excuse from the top management not to implement quality initiatives and still
continue working in a fire-fighting mode to tackle the mundane problems rather than
being proactive in its effort to CI. ‘A’ with 36 employees had managed to roll-out Six
Sigma across the business due to strong leadership and management commitment. It
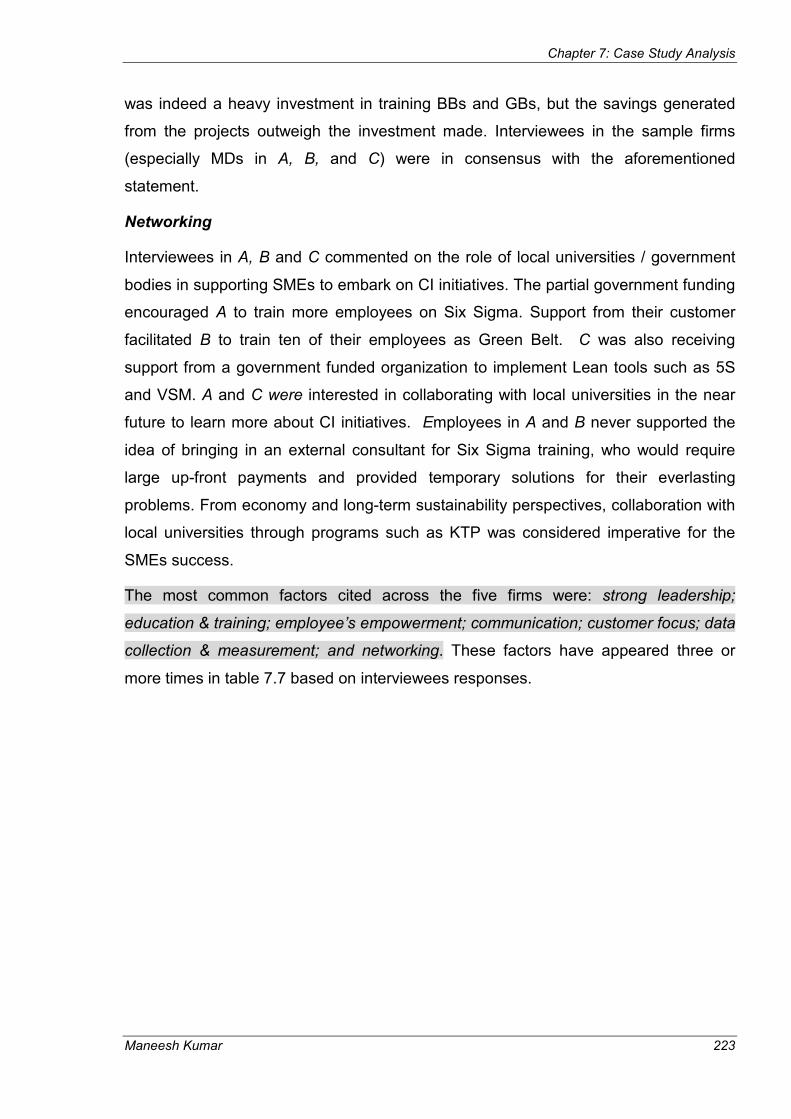
Chapter 7: Case Study Analysis
Maneesh Kumar 223
was indeed a heavy investment in training BBs and GBs, but the savings generated
from the projects outweigh the investment made. Interviewees in the sample firms
(especially MDs in A, B, and C) were in consensus with the aforementioned
statement.
Networking
Interviewees in A, B and C commented on the role of local universities / government
bodies in supporting SMEs to embark on CI initiatives. The partial government funding
encouraged A to train more employees on Six Sigma. Support from their customer
facilitated B to train ten of their employees as Green Belt. C was also receiving
support from a government funded organization to implement Lean tools such as 5S
and VSM. A and C were interested in collaborating with local universities in the near
future to learn more about CI initiatives. Employees in A and B never supported the
idea of bringing in an external consultant for Six Sigma training, who would require
large up-front payments and provided temporary solutions for their everlasting
problems. From economy and long-term sustainability perspectives, collaboration with
local universities through programs such as KTP was considered imperative for the
SMEs success.
The most common factors cited across the five firms were: strong leadership;
education & training; employee’s empowerment; communication; customer focus; data
collection & measurement; and networking. These factors have appeared three or
more times in table 7.7 based on interviewees responses.
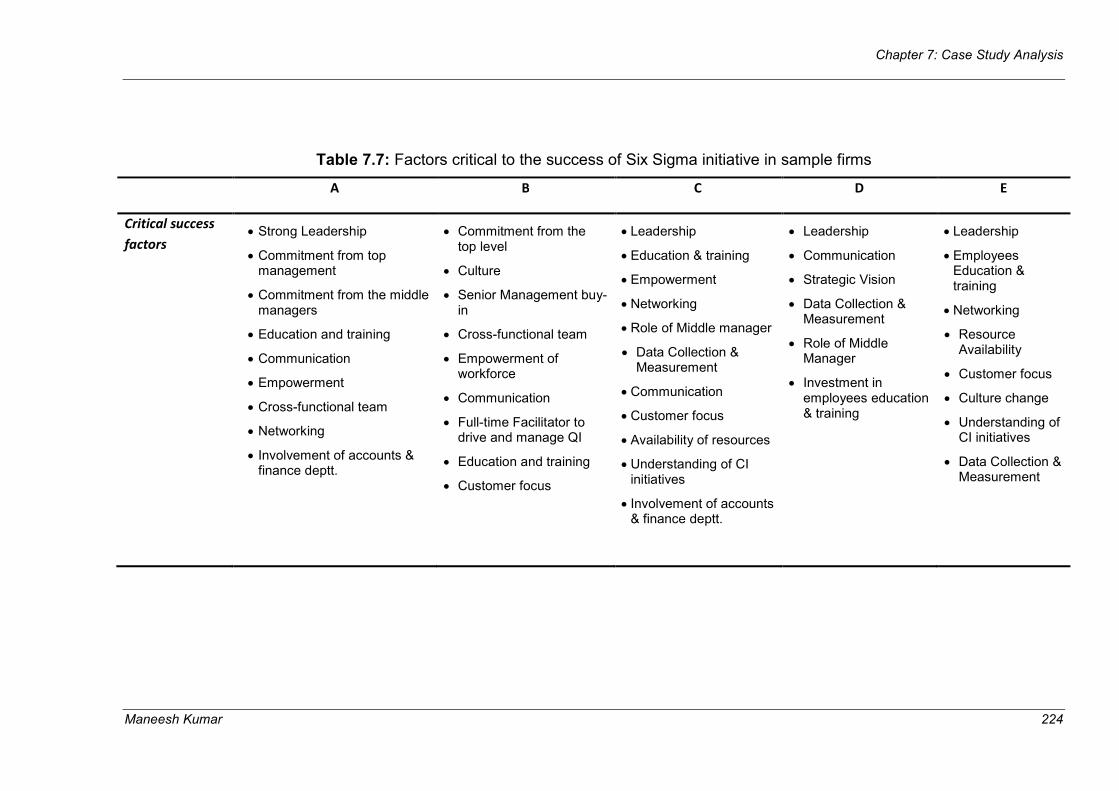
Chapter 7: Case Study Analysis
Maneesh Kumar 224
Table 7.7: Factors critical to the success of Six Sigma initiative in sample firms
A B C D E
Critical success
factors • Strong Leadership
• Commitment from top management
• Commitment from the middle managers
• Education and training
• Communication
• Empowerment
• Cross-functional team
• Networking
• Involvement of accounts & finance deptt.
• Commitment from the top level
• Culture
• Senior Management buy-in
• Cross-functional team
• Empowerment of workforce
• Communication
• Full-time Facilitator to drive and manage QI
• Education and training
• Customer focus
• Leadership
• Education & training
• Empowerment
• Networking
• Role of Middle manager
• Data Collection & Measurement
• Communication
• Customer focus
• Availability of resources
• Understanding of CI initiatives
• Involvement of accounts & finance deptt.
• Leadership
• Communication
• Strategic Vision
• Data Collection & Measurement
• Role of Middle Manager
• Investment in employees education & training
• Leadership
• Employees Education & training
• Networking
• Resource Availability
• Customer focus
• Culture change
• Understanding of CI initiatives
• Data Collection & Measurement
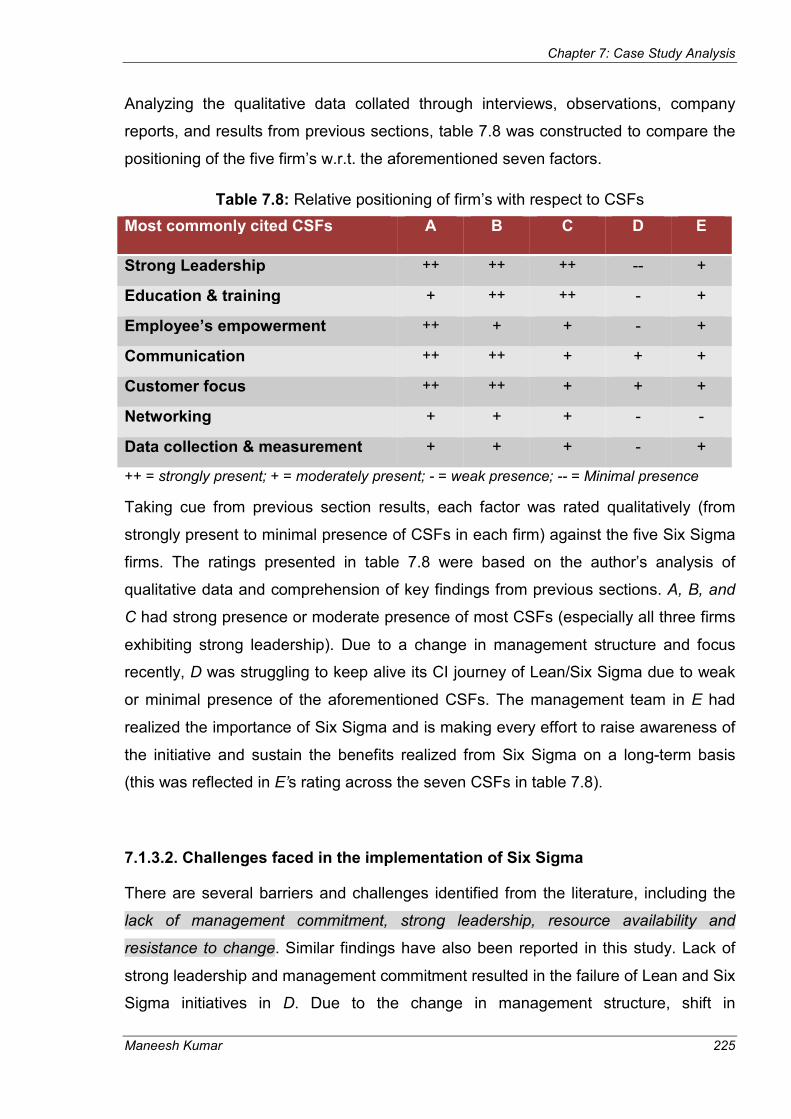
Chapter 7: Case Study Analysis
Maneesh Kumar 225
Analyzing the qualitative data collated through interviews, observations, company
reports, and results from previous sections, table 7.8 was constructed to compare the
positioning of the five firm’s w.r.t. the aforementioned seven factors.
Table 7.8: Relative positioning of firm’s with respect to CSFs
Most commonly cited CSFs A B C D E
Strong Leadership ++ ++ ++ -- +
Education & training + ++ ++ - +
Employee’s empowerment ++ + + - +
Communication ++ ++ + + +
Customer focus ++ ++ + + +
Networking + + + - -
Data collection & measurement + + + - +
++ = strongly present; + = moderately present; - = weak presence; -- = Minimal presence
Taking cue from previous section results, each factor was rated qualitatively (from
strongly present to minimal presence of CSFs in each firm) against the five Six Sigma
firms. The ratings presented in table 7.8 were based on the author’s analysis of
qualitative data and comprehension of key findings from previous sections. A, B, and
C had strong presence or moderate presence of most CSFs (especially all three firms
exhibiting strong leadership). Due to a change in management structure and focus
recently, D was struggling to keep alive its CI journey of Lean/Six Sigma due to weak
or minimal presence of the aforementioned CSFs. The management team in E had
realized the importance of Six Sigma and is making every effort to raise awareness of
the initiative and sustain the benefits realized from Six Sigma on a long-term basis
(this was reflected in E’s rating across the seven CSFs in table 7.8).
7.1.3.2. Challenges faced in the implementation of Six Sigma
There are several barriers and challenges identified from the literature, including the
lack of management commitment, strong leadership, resource availability and
resistance to change. Similar findings have also been reported in this study. Lack of
strong leadership and management commitment resulted in the failure of Lean and Six
Sigma initiatives in D. Due to the change in management structure, shift in

Chapter 7: Case Study Analysis
Maneesh Kumar 226
management focus and takeover by a MNC, the initial buy-in in Lean and Six Sigma
faded away slowly in D. Management commitment to quality in D after take over by a
MNC was considered ambivalent- on one hand they were very committed to provide
quality products to customers on time; but in fact their commitment to quality program
could be described as assigning their name to a quality policy document, attending the
annual quality management review meeting, and adhering to operational procedures.
These actions seemed to be the maximum commitment they were prepared to make.
There was no clear direction or evidence to suggest that senior and middle
management were actively committed to the concept of CI. Other four sample firms
had full support from top management as discussed in previous sections and thus the
change was smooth, moving from reactive mode to proactive mode of operation.
Another typical challenge experienced by the Black Belts was the pressure from the
Champion to roll out 2-3 projects in a year as well as undertake daily tasks. Such
projects were bound to fail due to attention being divided between daily jobs and the
Six Sigma project, which further impacts on a BB’s commitment to project execution
and completion.
A summary of key challenges faced in the sample firms are listed in table 7.9. Some of
the other challenges faced during the implementation process in the sample firms
were:
• Challenge of resource availability: All the sample firms listed time and financial
constraints as a major challenge in implementing initiatives like Six Sigma. The
time required to train employees to make sure that they have competence and full
capability to take on those quality responsibilities is very demanding. The MDs in
the sample firms expressed their concern in training their best employees as Black
Belt, which required significant time and financial resources. Thereafter, if the
Black Belt left the company for a higher position and salary (which is a common
practice observed in the industrial world), it would create a talent void in the
company and it would be difficult to reinvest in training a Black Belt again. The CI
effort was sometimes pushed back due to emergence of new priorities or lack of
resources to complete the project. The statement from the Lean Champion in B
provided a good insight into the problem of resource constraints –“There is a
resource problem. It partly depends on how profitable your business is. If you are
already achieving profit, you can commit resources for Six Sigma. Given that it

Chapter 7: Case Study Analysis
Maneesh Kumar 227
needs everybody’s’ commitment and activity and even if you are cash rich, you
still need to find time to work on it. That is not an easy thing. It depends on how
willing people are to find time to work on it out with from their normal hours”.
The biggest challenge identified was the issue of resources in the small companies
such as A and E. As Director acts as a project Champion for all Six Sigma projects in
A, which makes it difficult to find time to be available at all project review meetings. In
such scenario, A had adopted the strategy of running one project at a time to get full
commitment from the Director. One of the typical characteristics of smaller firms is the
realisation of benefits from CI initiatives in a short time period, which is not always
possible. It therefore becomes a barrier to wait and realise the outcomes in the longer
term.
• Challenge of quantifying the savings generated from Six Sigma projects: It is very
important to communicate the hard-dollar savings generated from Six Sigma
projects to buy-in commitment from senior management and the rest of the
employees. Interviewees in A, B, and E agreed that quantification of benefits from
the Six Sigma project was challenging to evaluate, especially the hard-dollar
savings in both short-term and long-term after the completion of project. The
recent involvement of the Finance Director (FD) and people from the accounts and
finance department in A and B had facilitated in quantifying the short-term and
long-term benefits generated from the project that included both the hard and soft
savings from Six Sigma and other CI projects. It was challenging to have the FD
present at all the Six Sigma project meetings. Sometimes due to the busy
schedule of the FD, there was some delay in project meetings and that is part of
reason why some projects stretches to seven or eight months.
• Challenge for conveying the reason to implement Six Sigma: Employees in any
organization see new change management initiatives as a threat to their job. It is
imperative from the management perspective to dispel this threat by addressing
all employees before embarking on any new initiative. As discussed in the
previous section, before introduction of initiatives like Lean and Six Sigma in the
sample firms, management teams held a debriefing session with employees to
explicate the need for change and how it can help them to improve efficiency and
profitability of the firm. As suggested by the MD of A, any employee layover or

Chapter 7: Case Study Analysis
Maneesh Kumar 228
redundancy program should be executed before the start of any new initiative in
the company to buy-in employee commitment and negate their job loss fear.
• Challenge of convincing the various department heads to get employees released
from their department to work on the Six Sigma projects for 4-6 months: This was
a new factor emerging from the study that was not clearly listed in the Six Sigma
literature. All the sample firms faced the challenge of convincing their middle
management team to release members from their team for off-site Six Sigma
training or involvement in Six Sigma projects for 4-6 months (as the manager has
to find cover). D failed to get the commitment from the middle management team
due to lack of support from senior management in allocating resources for
employee involvement in CI projects.
• Challenge of involving and empowering the employees: One of the typical
challenges observed in the case study firms was giving access to everybody in the
team who were potential stakeholders and allowing them to make demands of
other employees in terms of data collection, talking about procedures, identifying
waste and where the improvement could be made. A huge amount of commitment
by other stakeholders was required for the success of the initiative. Lack of
commitment from employees will lead to failure of CI efforts in the firm.
Table 7.9: Challenges faced by firms to implement and sustain Six Sigma initiative
A B C D E
Challenges
Faced by
Sample
firms
• Role of middle managers
• BB or GB getting involved in other work
• Resource availability
• Quantification of benefits from Six Sigma program
• Complacency
• Training
• Quantification of benefits from Six Sigma program
• BB staying in the company for long-term
• Employee empowerment
• Allocation of resources
• Networking opportunity
• Only training engineers on BB program
• Employee empower.
• Role of middle managers
• Change in mgmt.
• People prefer to remain in Status quo
• Lack of vision
• Lack of senior mgmt commit.
• Resource availability
• Poor training & coaching
• Job-shop production
• Quanti. of benefits
• Role of middle managers

Chapter 7: Case Study Analysis
Maneesh Kumar 229
7.1.4. Impact of Six Sigma on Organizational Performance
In order to understand the relationship between Six Sigma and organizational
performance, interviewees were requested to explicate the changes observed in the
firm after implementation of Six Sigma. The focus of enquiry was not only on the hard
benefits (e.g. increase in sales, profit, productivity, market share; decrease in scrap
rate, defects; on-time delivery etc) but also on the soft benefits (e.g. customer
satisfaction, employee satisfaction, change in thinking process, proactive measures
for problem solving, decisions based on data, understanding of CI initiatives, good top-
down communication, etc) generated from the implementation of Six Sigma initiative.
Interviewees were explained the key constituents and differences between hard and
soft benefits in order to capture detailed information on organizational performance.
The result presented in this section summarizes the collective opinion of interviewees
and the company reports of sample firms.
As discussed in the previous section, interviewees expressed difficulty in quantifying
benefits generated from the Six Sigma program due to their limited experience in
implementing and executing Six Sigma projects as well as lack of involvement of
people from finance departments. This led the author to use a qualitative technique to
measure the impact of Six Sigma on performance in sample firms. Based on
interviewees’ understanding of hard and soft benefits, they were asked to rate the
overall improvement in hard factors and soft factors after Six Sigma implementation as
‘significant improvement’ (++), ‘some improvement’ (+), ‘mixed result’ (+-), ‘no
improvement’ (-), and ‘negative improvement’ (--). It can be observed from table 7.10
that Six Sigma was ‘very effective’ in improving the organizational performance of A
and C. The MD of A stated the following while commenting on the cultural change in
his firm– “….Six Sigma person is not working alone they gather a team together in the
area of the company. The team learn so much more about their job because they see
how things work. People in the company understand more about their job, end in
doing better job…we start to get lot more buy-in …the whole company looks
together….the people on the shop floor benefited immensely from it….. ”.
Similar results were observed in B, and E, in terms of hard and soft savings generated
by firms after the implementation of the quality program. Both B and E were in the
early stages of implementing Six Sigma with less than two years of experience when
data was collected. Since the implementation of the Six Sigma program in D, their

Chapter 7: Case Study Analysis
Maneesh Kumar 230
performance has declined significantly. As discussed in earlier sections, the decline in
performance of D is due to the change in management structure and shift in focus of
top management on profitability improvement rather than enhancing customer
satisfaction. The Quality Manager in D stated that “there is nothing wrong with Six
Sigma. The decline in performance could be attributed to lack of management
commitment and focus on CI initiatives; lack of education and training opportunities for
employees”.
Table 7.10: Hard and soft benefits realized by firms after implementing Six Sigma
Improvement after Six Sigma implementation A B C D E
Hard benefits (increase in sales, profit, productivity, market share; decrease in scrap rate, defect; on-time delivery etc) ++ + ++ - +
Soft benefits (customer satisfaction, employee satisfaction, change in thinking process, proactive measures for problem solving, decisions based on data, understanding of CI initiatives, good top-down communication, etc)
++ + ++ - +
++ = significant improvement; + = some improvement; +- = mixed result; - = no improvement; -- = negative improvement
7.1.4.1. Soft Benefits observed in sample firms
It is difficult to measure soft savings from Six Sigma projects as most of the factors are
intangible to measure. A similar approach to above section was taken to get detailed
information on the soft benefits realized by firms after Six Sigma implementation.
There was significant change in the working culture of A, B, C, and E after
implementation of Six Sigma, as discussed previously in Section 7.1.3. Typical
changes observed in the sample firms were improvement in top-down and bottom-up
communication, decisions based on facts and data, investment in employee education
and training, development of metrics to monitor the performance of a process,
formation of cross-functional teams for Six Sigma projects, and in some cases
involvement of accounts and finance departments in all Six Sigma projects. The
details of soft benefits realized by sample firms were listed in table 7.11.

Chapter 7: Case Study Analysis
Maneesh Kumar 231
Table 7.11: Soft Benefits realized by firms after Six Sigma implementation
Soft Benefits A B C D E
Increase in customer satisfaction ++ + + -- +
Increase in employee satisfaction ++ + ++ - +
Decrease in employee grievances + NA + -- NA
Decision based on facts and data ++ + + +- +
Established performance metrics ++ + ++ +- +
Top-down and bottom-up communication ++ + + - +
Organizational learning through sharing of benefits and challenges experienced during projects
+ + +- - NA
Cross-functional teams for Six Sigma projects ++ ++ +- - +
Involvement of people from accounts & finance + +- ++ NA NA
Development in human capability to sustain the benefits + + NA - NA
Employee empowerment and process ownership ++ + +- - +
Investment in education & training ++ ++ ++ +- ++
Regular Internal Audit + ++ NA NA NA
Understanding & usage of CI tools & techniques for problem solving
++ + + - +-
Proactive approach to problem solving ++ ++ ++ - ++
++ = significant improvement; + = some improvement; +- = mixed result; - = no improvement; -
-= negative improvement; NA= not applicable
The results presented in table 7.11 were in consensus with table 7.10, confirming
significant/some improvement in soft factors in A, B, C, and E after Six Sigma
implementation. Firms like A and B have taken the ‘train the trainer approach’ to build
their own human capability for long-term sustainability of benefits realized from Six
Sigma implementation. On the contrary, C and E being part of a MNC don’t have
resource constraints for education and training of employees. As such, the concept of
the ‘train the trainer approach’ is at its infancy in both the firms. The Operations
Director in C had recently stressed the importance of developing their own capability
to train employees on Lean and Six Sigma for long-term sustainability of the CI
initiatives in the firm. Stressing the soft benefits from the employees’ perspective, the
Operations Director in C stated that – “The learning itself for the people involved in
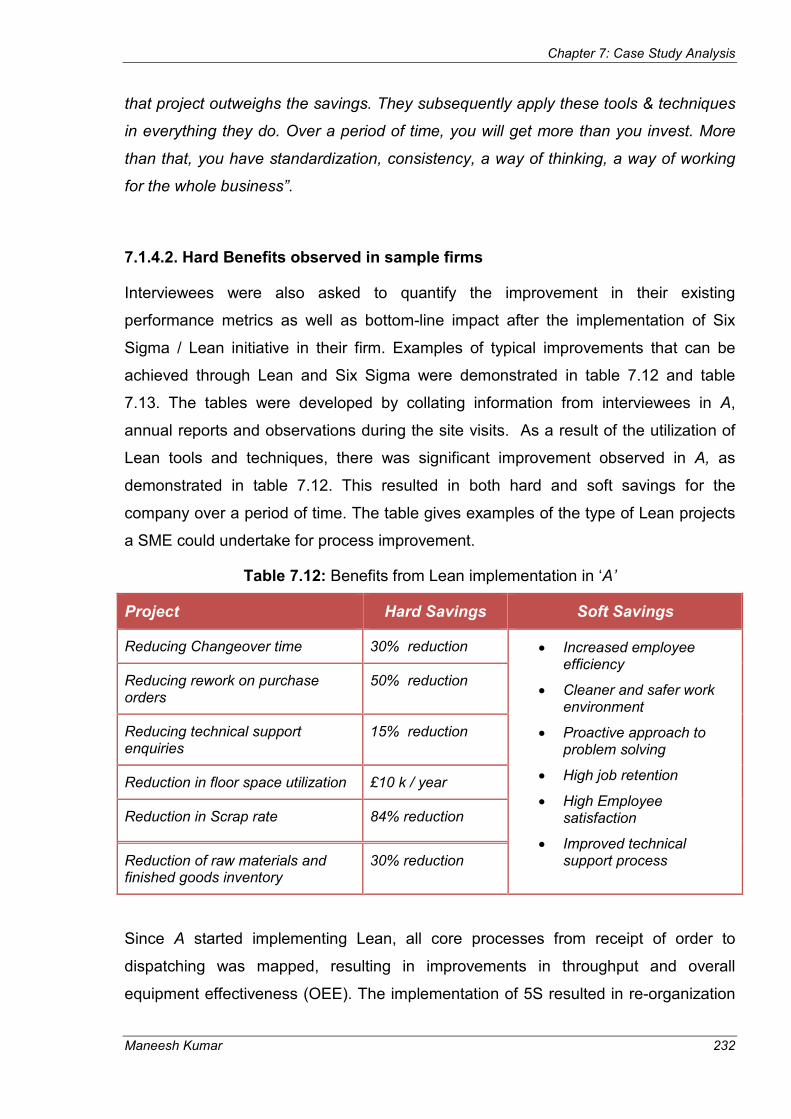
Chapter 7: Case Study Analysis
Maneesh Kumar 232
that project outweighs the savings. They subsequently apply these tools & techniques
in everything they do. Over a period of time, you will get more than you invest. More
than that, you have standardization, consistency, a way of thinking, a way of working
for the whole business”.
7.1.4.2. Hard Benefits observed in sample firms
Interviewees were also asked to quantify the improvement in their existing
performance metrics as well as bottom-line impact after the implementation of Six
Sigma / Lean initiative in their firm. Examples of typical improvements that can be
achieved through Lean and Six Sigma were demonstrated in table 7.12 and table
7.13. The tables were developed by collating information from interviewees in A,
annual reports and observations during the site visits. As a result of the utilization of
Lean tools and techniques, there was significant improvement observed in A, as
demonstrated in table 7.12. This resulted in both hard and soft savings for the
company over a period of time. The table gives examples of the type of Lean projects
a SME could undertake for process improvement.
Table 7.12: Benefits from Lean implementation in ‘A’
Project Hard Savings Soft Savings
Reducing Changeover time 30% reduction • Increased employee efficiency
• Cleaner and safer work environment
• Proactive approach to problem solving
• High job retention
• High Employee satisfaction
• Improved technical support process
Reducing rework on purchase orders
50% reduction
Reducing technical support enquiries
15% reduction
Reduction in floor space utilization £10 k / year
Reduction in Scrap rate 84% reduction
Reduction of raw materials and finished goods inventory
30% reduction
Since A started implementing Lean, all core processes from receipt of order to
dispatching was mapped, resulting in improvements in throughput and overall
equipment effectiveness (OEE). The implementation of 5S resulted in re-organization

Chapter 7: Case Study Analysis
Maneesh Kumar 233
of the manufacturing line, which in turn brought savings of over £10k per annum.
Some of the other improvements through Lean initiative were depicted in table 7.12.
Examples of Six Sigma projects executed in A and their impact on the business was
presented in table 7.13. The degree of improvement observed after implementation of
Six Sigma projects were significant, ranging from immediate improvement in OTIF by
28% to immediate reduction of solder shots (i.e. defects in printed circuit boards) by
98%. Such an improvement is massive from a SME perspective as it can utilize the
savings generated from those projects in the development of the firm as well as its
employees.
Table 7.13: Impact on the business from Six Sigma implementation in ‘A’
Project Impact on the business
Improving on time in full (OTIF) for sales order delivery
Immediate improvement by 28%
Improving raw material stock accuracy 51% reduction
Improved finished good stock accuracy 87% reduction
Reduction of solder shots Immediate reduction by 98%
Reduction of sales order defect Currently in progress
Since the implementation of Six Sigma, A had executed five projects that had
significant impact on customer satisfaction and bottom-line savings of over £180,000.
Some of the other benefits from Six Sigma projects were discussed in table 7.13.
Similarly B had finished 6 Six Sigma projects in the manufacturing area that have
resulted in savings of over £200,000. The benefit from the Lean implementation
through 8 mini projects was estimated at over £150,000. Lean Six Sigma methodology
was used in B to resolve complex problems in the manufacturing area (leading to
reduction in defect from 15% to 2%), new product development process and recently
in administrative processes. The management team had struggled to quantify benefits
from the new product development project and the projects in administrative
departments. The above savings from Lean/Six Sigma projects were the projected
tangible figures, evaluated by senior and middle management teams in A and B, with
minimal involvement of accountants or finance executives. The actual savings from

Chapter 7: Case Study Analysis
Maneesh Kumar 234
aforementioned projects would be much higher over a period of time than projected
savings. In C, Six Sigma projects have had cost benefit analysis carried out by its
accounting and finance department. The finance people continue to monitor the
benefits generated from projects on a long-term basis. Significant decrease in defects
(from 11% to 1.5%) was observed resulting in an increase in production rate, meeting
on-time delivery targets, and improved customer satisfaction. Black Belts in C have
completed 10 Six Sigma projects, with an estimated saving of £35000 per project.
Unlike many large organizations, where a typical BB project saves approximately
£75000, the savings from a BB project in SME environment may range from £30000 -
£40000 depending upon the type and annual turnover of SME. This viewpoint was
shared by interviewees in A, B, and C.
D failed to realize any hard savings from implementation of Lean and Six Sigma due
to reasons mentioned in the earlier section. Six Sigma was not included within the top
objectives of the business and there was no alignment with the strategic goals of the
company. As commented by the Quality Manager, “Lean and Six Sigma were not
integrated with D’s Quality Management System. There was no connection between
performance metrics and Six Sigma”.
E had realized improvement in customer return rates from the field by 10%, on-time
delivery by 8%, defects rate by 4% due to strict adherence to their previous quality
management efforts and implementation of Six Sigma. E had conducted one Six
Sigma project on new-product introduction process but the savings generated from the
project were not quantified at the time of interview. The other reason for not
quantifying the benefit was minimal involvement from the finance department in cost-
benefit analysis at this small company.
Interviewees in the case study companies were asked, towards the end of the
interview process, to rate on a Likert scale of 1-5 the benefits their organizations have
experienced following the implementation of quality initiatives. Table 7.14 shows the
degree of improvement realized on 1-5 scale after the implementation of Six Sigma.
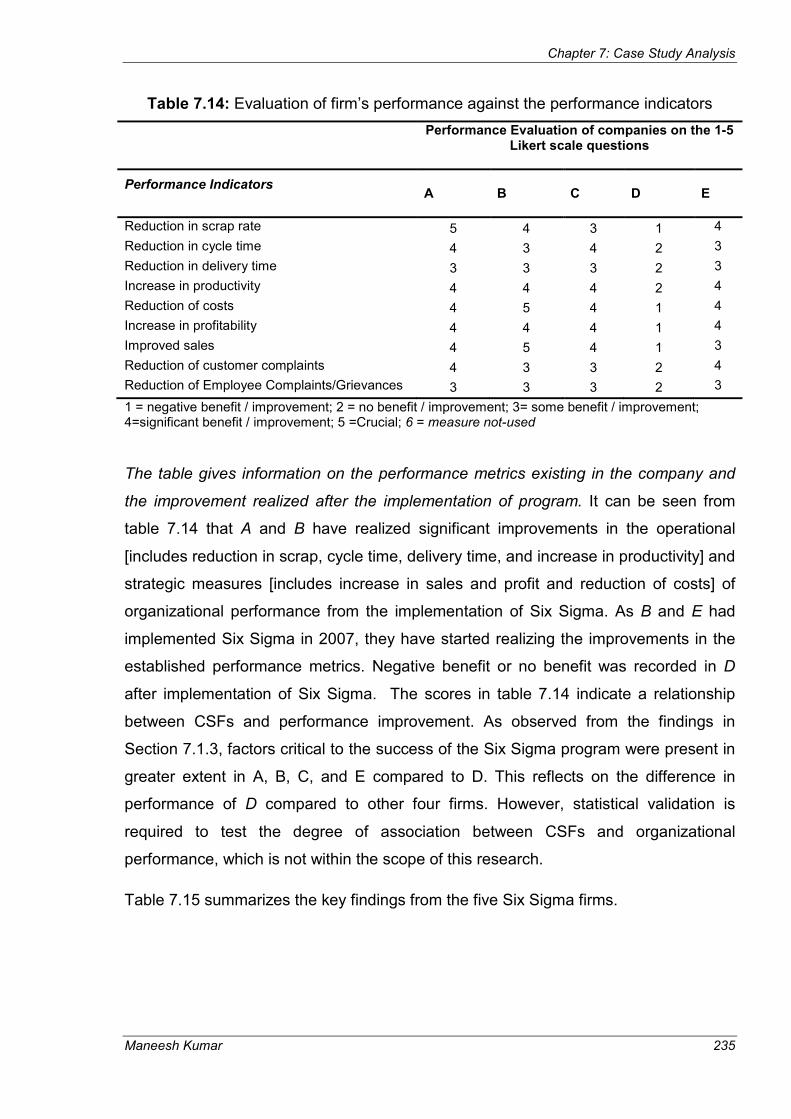
Chapter 7: Case Study Analysis
Maneesh Kumar 235
Table 7.14: Evaluation of firm’s performance against the performance indicators
Performance Evaluation of companies on the 1-5 Likert scale questions
Performance Indicators
A B C D
E
Reduction in scrap rate 5 4 3 1 4
Reduction in cycle time 4 3 4 2 3
Reduction in delivery time 3 3 3 2 3
Increase in productivity 4 4 4 2 4
Reduction of costs 4 5 4 1 4
Increase in profitability 4 4 4 1 4
Improved sales 4 5 4 1 3
Reduction of customer complaints 4 3 3 2 4
Reduction of Employee Complaints/Grievances 3 3 3 2 3
1 = negative benefit / improvement; 2 = no benefit / improvement; 3= some benefit / improvement; 4=significant benefit / improvement; 5 =Crucial; 6 = measure not-used
The table gives information on the performance metrics existing in the company and
the improvement realized after the implementation of program. It can be seen from
table 7.14 that A and B have realized significant improvements in the operational
[includes reduction in scrap, cycle time, delivery time, and increase in productivity] and
strategic measures [includes increase in sales and profit and reduction of costs] of
organizational performance from the implementation of Six Sigma. As B and E had
implemented Six Sigma in 2007, they have started realizing the improvements in the
established performance metrics. Negative benefit or no benefit was recorded in D
after implementation of Six Sigma. The scores in table 7.14 indicate a relationship
between CSFs and performance improvement. As observed from the findings in
Section 7.1.3, factors critical to the success of the Six Sigma program were present in
greater extent in A, B, C, and E compared to D. This reflects on the difference in
performance of D compared to other four firms. However, statistical validation is
required to test the degree of association between CSFs and organizational
performance, which is not within the scope of this research.
Table 7.15 summarizes the key findings from the five Six Sigma firms.
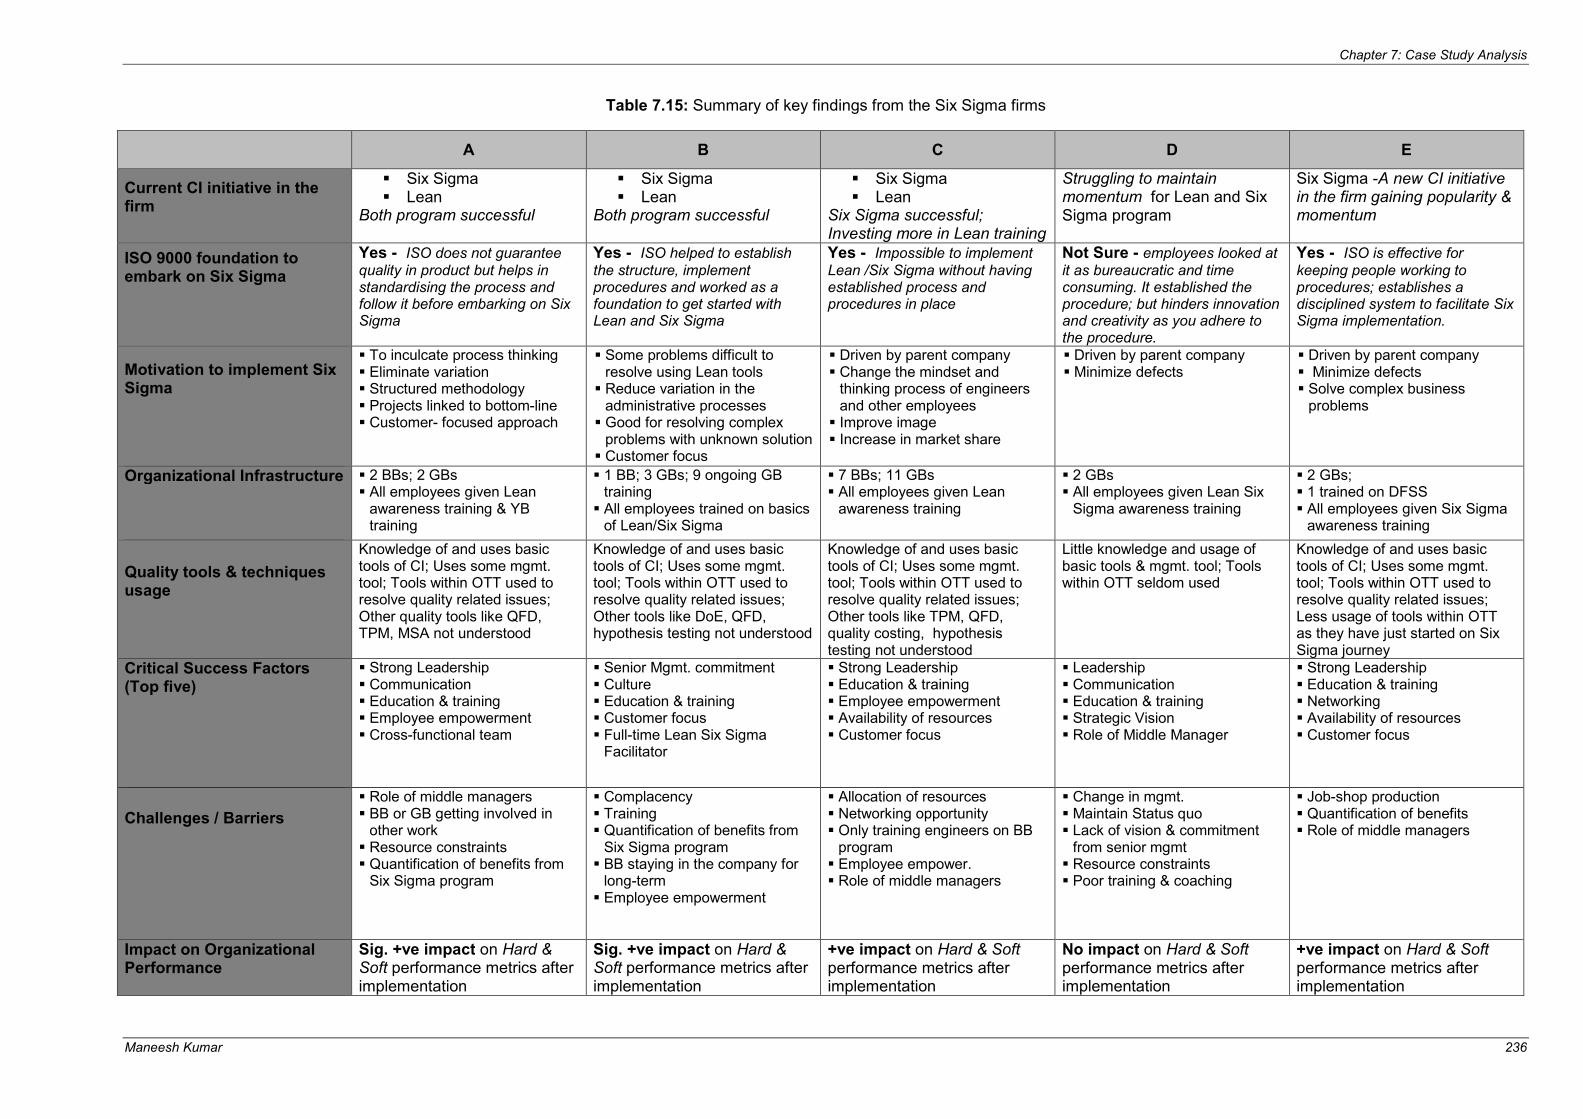
Chapter 7: Case Study Analysis
Maneesh Kumar 236
Table 7.15: Summary of key findings from the Six Sigma firms
A B C D E
Current CI initiative in the firm
� Six Sigma � Lean
Both program successful
� Six Sigma � Lean
Both program successful
� Six Sigma � Lean
Six Sigma successful; Investing more in Lean training
Struggling to maintain momentum for Lean and Six Sigma program
Six Sigma -A new CI initiative in the firm gaining popularity & momentum
ISO 9000 foundation to embark on Six Sigma
Yes - ISO does not guarantee quality in product but helps in standardising the process and follow it before embarking on Six Sigma
Yes - ISO helped to establish the structure, implement procedures and worked as a foundation to get started with Lean and Six Sigma
Yes - Impossible to implement
Lean /Six Sigma without having established process and procedures in place
Not Sure - employees looked at
it as bureaucratic and time consuming. It established the procedure; but hinders innovation and creativity as you adhere to the procedure.
Yes - ISO is effective for keeping people working to procedures; establishes a disciplined system to facilitate Six Sigma implementation.
Motivation to implement Six Sigma
� To inculcate process thinking � Eliminate variation � Structured methodology � Projects linked to bottom-line � Customer- focused approach
� Some problems difficult to resolve using Lean tools
� Reduce variation in the administrative processes
� Good for resolving complex problems with unknown solution
� Customer focus
� Driven by parent company � Change the mindset and
thinking process of engineers and other employees
� Improve image � Increase in market share
� Driven by parent company � Minimize defects
� Driven by parent company � Minimize defects � Solve complex business
problems
Organizational Infrastructure
� 2 BBs; 2 GBs � All employees given Lean
awareness training & YB training
� 1 BB; 3 GBs; 9 ongoing GB training
� All employees trained on basics of Lean/Six Sigma
� 7 BBs; 11 GBs � All employees given Lean
awareness training
� 2 GBs � All employees given Lean Six
Sigma awareness training
� 2 GBs; � 1 trained on DFSS � All employees given Six Sigma
awareness training
Quality tools & techniques usage
Knowledge of and uses basic tools of CI; Uses some mgmt. tool; Tools within OTT used to resolve quality related issues; Other quality tools like QFD, TPM, MSA not understood
Knowledge of and uses basic tools of CI; Uses some mgmt. tool; Tools within OTT used to resolve quality related issues; Other tools like DoE, QFD, hypothesis testing not understood
Knowledge of and uses basic tools of CI; Uses some mgmt. tool; Tools within OTT used to resolve quality related issues; Other tools like TPM, QFD, quality costing, hypothesis testing not understood
Little knowledge and usage of basic tools & mgmt. tool; Tools within OTT seldom used
Knowledge of and uses basic tools of CI; Uses some mgmt. tool; Tools within OTT used to resolve quality related issues; Less usage of tools within OTT as they have just started on Six Sigma journey
Critical Success Factors (Top five)
� Strong Leadership � Communication � Education & training � Employee empowerment � Cross-functional team
� Senior Mgmt. commitment � Culture � Education & training � Customer focus � Full-time Lean Six Sigma
Facilitator
� Strong Leadership � Education & training � Employee empowerment � Availability of resources � Customer focus
� Leadership � Communication � Education & training � Strategic Vision � Role of Middle Manager
� Strong Leadership � Education & training � Networking � Availability of resources � Customer focus
Challenges / Barriers
� Role of middle managers � BB or GB getting involved in
other work � Resource constraints � Quantification of benefits from
Six Sigma program
� Complacency � Training � Quantification of benefits from
Six Sigma program � BB staying in the company for
long-term � Employee empowerment
� Allocation of resources � Networking opportunity � Only training engineers on BB
program � Employee empower. � Role of middle managers
� Change in mgmt. � Maintain Status quo � Lack of vision & commitment
from senior mgmt � Resource constraints � Poor training & coaching
� Job-shop production � Quantification of benefits � Role of middle managers
Impact on Organizational Performance
Sig. +ve impact on Hard & Soft performance metrics after implementation
Sig. +ve impact on Hard & Soft performance metrics after implementation
+ve impact on Hard & Soft performance metrics after implementation
No impact on Hard & Soft performance metrics after implementation
+ve impact on Hard & Soft performance metrics after implementation
Chapter 7: Case Study Analysis
Maneesh Kumar 237
7.2. Findings from Non- Six Sigma firms
7.2.1. Demographic Details of non-Six Sigma SMEs
Company F employed 2200 employees in the late 1970s, being the sole market leader
in providing appliances for boilers and central heating. It currently employs 86 people
with an annual turnover of £6.5 million. Its products, ranging from room and hot water
thermostats to central heating programmers, represent over 60 years of excellence in
serving the domestic heating industry.
Company G was formed in 2002 after splitting from its parent company that had been
in business for nearly 70 years. The parent firm employed 300 people in 1977, and the
headcount of G after the split was 88. The company manufactures products that range
from different types of papers (including adhesives and liners), to thermally coated
tags and tickets for the food industry, airline ticketing and other packaging industries.
Company H started in 1988 with 14 employees and currently employs over 105 full-
time employees and 60 agency staff across three shifts. Its primary business is the
manufacture of toiletries products including a variety of soap tablets (250 different
products), filling of scented and aromatic oils, and perfumes in the ratio of 50: 10: 40.
It also assembles and packages the aforementioned products as gift pack for different
occasions as demanded by its key customers. Its major customers are The Body
Shop and Sainsbury.
Company I is a family owned business since 1960 within chemical industry and
employing around 190 workers (out of which 90 are full-time employees). It
manufactures chemical products for its major customers in the chemical and
pharmaceutical industries and is also responsible for warehousing and distribution of
packaged chemicals. Its efficient management of logistics operations and distribution
management has provided opportunity for it to serve most of the major names in
global chemical and pharmaceutical industries.
Company J was established in 1992 by two people and currently employees 25 full
time workers manufacturing cables and wiring harness for customers in the electronic
and aerospace industries. The company manufactures in batches, which are
repeatable, and use low volume- high mix cables. They also manufacture connectors
for different equipment, e.g. connecting one circuit board to another or connecting one
equipment type to another. Products were customized to the requirements of its major

Chapter 7: Case Study Analysis
Maneesh Kumar 238
customers and it also provided support to their customers in improving the design of
their wiring and harness.
Other demographic details of companies were provided in table 7.16.
Table 7.16: Demographic details of the non-Six Sigma firms
Company Manufacturing Activity
Company Type
Annual Sales
Turnover
Location Number of employees
F Electrical Independent £6.5 m Scotland 86
G Paper, printing& packaging
Independent £20 m Scotland 88
H Toiletries Independent £10 m Scotland 165
I Chemical Independent - England 190
J Electrical Independent £1m England 25
7.2.2. Quality Management Practices in SMEs
7.2.2.1. History of Quality Initiatives
F and G had undertaken ISO 9000 accreditations in order to sustain their businesses
in the global market. Both of these companies have existed for more than 50 years,
witnessing several changes in management, acquisition and merger into different
groups, and transition in size from large organizations falling into the SME category. F
used inspection based quality system to monitor the quality of raw materials from
suppliers. They also make sure that their suppliers have ISO 9000 certification. F had
recently started applying Lean tools such as 5S and Kanban, with the support of the
Scottish Manufacturing Advisory Services (SMAS).
G tried to launch TQM in 1994 but failed to reap the benefit as the initiative was led by
a single person, i.e. the Technical Director of the company. There was no
transferability of the learning after the retirement of the Technical Director in 1995. A
group of people who supported the initiative does not had the decision making power
to take the initiative further. After a change in management structure, G went through
ISO 9001: 2000 accreditation in 2003 to map and standardize their processes.

Chapter 7: Case Study Analysis
Maneesh Kumar 239
H secured ISO14000 accreditation in 1997, British Retail Consortium (BRC)
accreditation in 2003 and started with 5S and CAN DO practice in late 2007. H had
recently started focusing on Lean through 5S implementation across the shop-floor
and expressed interest in applying other Lean tools like Kanban and VSM in future. In
order to manage the demand schedule, H had implemented the Enterprise Resource
Planning (ERP) system and had also integrated the element of quality management
system within it to monitor information on product inspection and testing. Daily
operation meetings and monthly quality meetings were organized to monitor the
progress, discuss any quality related issues, and any other operational issues faced
by the firm on a daily and monthly basis. It had scrapped the European Union best
practices scheme for environmental performance (EMAS) in 2000, after getting started
in1999, due to the cost of certification and the time it takes to maintain the standards
(5 months).
I started its quality journey with ISO 9000:1994 certification in 1994, Investors in
People (IIP) in 1998, and re-applying for the revised version of ISO, i.e. ISO
9001:2000 accreditation in 2004. The development of standard procedures, process
maps and systems for ISO 9001:2000 was performed internally, rather than resorting
to external consultants, to develop and retain skills for long term sustainability of the
initiative. The quote from the Quality Manager further reinforces the aforementioned
point – “By doing it in-house, you learn a lot, develop skills and retain skills and are
able to sustain and transfer those skills to other parts of the department. Whereas,
inviting consultants to do the same job, fewer skills are retained in-house”.
J gained ISO 9000 certification in 1997, IIP in 1998, and AS 9100 quality standard for
aerospace industry in 2007. The company is also accredited to SC211 related to
aerospace industry. The documentation and standards required for ISO 9000
certification was achieved internally in the firm without any help from external
consultants. ISO 9000 certification facilitated J in establishing systems and procedures
required for AS9100 certification. The first step toward the Lean journey was
implementation of 5S practice across the shop-floor in 2007. J applied for EFQM 1 21st century supply chains (SC21)
This key programme is overseen by SBAC's Enterprise Excellence Board and continues the work of the Aerospace Innovation and Growth Team. SC21 aims to accelerate the competitiveness of the aerospace and defence industry. With international competition increasing, the participation of companies of all sizes throughout the UK supply chain is crucial to delivering real results from this modernisation programme.

Chapter 7: Case Study Analysis
Maneesh Kumar 240
excellence award in 2007 but withdrew the application due to the amount of time
required to complete the paper work for the application. As perceived by interviewees,
EFQM is not suited for SMEs as it is too bureaucratic and requires extensive
commitment of time and resources for award application. J also failed to implement
the Kanban system for one of their key clients in 2007 due to poor reliability of forecast
data (85% inaccurate). Table 7.17 summarizes the quality initiatives undertaken in the
case study companies to date.
Table 7.17: History of quality initiatives in the non-Six Sigma SMEs
F G H I J
History of quality program (QP) or certification achieved and the corresponding year
ISO 9000 (1993) ISO 9001:2000 (2003) Lean (2007)
ISO 9000 (1992) TQM (1994) ISO 9001:2000 (2003)
ISO14001 (1997) EMAS (2000) BRC (2003) 5S (2007)
CAN DO (2007)
ISO 9000 (1994) IIP (1998) ISO 9001:2000 (2004)
ISO 9000 (1997) IIP (1998) AS9100 (2007) SC21 (2007) 5S (2007)
Existing QP Lean ISO 9001: 2000 Lean ISO 9001: 2000 Lean
7.2.2.2. Motivation to embark on ISO 9000 and other quality initiative(s)
Interviewees were asked to comment on the statement – ‘ISO 9000 acts as a building
block before embarking on Lean / Six Sigma’, to compare with the findings from
survey (1st phase of study) and case studies in Six Sigma firms. Findings from these
two phases strongly accentuated on having a disciplined and structured processes
based on ISO standards to facilitate successful implementation of Six Sigma. Mixed
reaction was observed from the participating non-Six Sigma firms on the
aforementioned question.
The motivation behind achieving ISO certification in the sample firms was to improve
their market share and retain existing customers. However, interviewees in all the five
firms believed that accreditation also facilitated in documenting and standardizing the
procedures in place. The interviewees in the five firms strongly accentuated the point
of having standardized procedures in place to understand processes and measure the
process performance. Viewpoints of interviewees from sample firms on ISO 9000
Chapter 7: Case Study Analysis
Maneesh Kumar 241
certification matched the opinion of interviewees from Six Sigma firms (as discussed in
section 7.1.2.2).
Though H did not applied for ISO 9000 certification, they followed the skeleton of ISO
9000 to establish discipline and standard working procedures for their existing
processes. The work instructions and guidelines for specific job functions were
attached to each machine for employees operating that machine. The quotes from the
Operations Director in H provided more insight on the efficacy of the ISO 9000 QMS –
“I liked the aspects of ISO 9000 as an operational tool. I installed ISO 9000 but did not
go for accreditation as none of our customer required ISO 9000. I wrote the manual
myself, work instruction, bullet point guidelines, quality policy and procedures. We
used the bones of ISO 9000 to establish standard procedures and control system in
place”.
Interviewees in I held similar opinions to H regarding no need of having ISO 9000
certification if the business is in good shape. The quotes from the Quality Manager in I
further reinforces this point- “You do not need to have a certification to efficiently run
the business. It can affect the market share if we don’t have it. There isn’t much
advantage in having it, but there would be much disadvantage for not having it. For
any company that is run moderately well, they don’t need it”. The aforementioned
statements from H and I imply that if a firm has well established procedures and
systems and there was no pressure from external customers, one can adhere to the
guidelines of ISO 9000 for maintaining the control over systems and procedures
without resorting to the certification route.
Interviewees in G opined that it depends on the maturity of the business- whether it is
a new business or already existing for years in the market. A new business would
require ISO 9000 QMS to establish systems and standardized procedures
documented for the company. This will set the stage for the firm to define their
processes, understand the input/output, develop measurement systems and get ready
for Six Sigma implementation. ISO acts as a building block for the Six Sigma initiative
and it helps to take out some noise from the processes.
Interviewees in I also believed that the revised version of ISO 9000, i.e. ISO9001:2000
should be the starting point for any organization to embark on a CI journey. A quote
from the Quality Manager in I reflects their viewpoint on the benefits of ISO –

Chapter 7: Case Study Analysis
Maneesh Kumar 242
“Because ISO 9000 is a well understood basic system, we will go on to that first and
build our basic system. If a business is already at a level beyond the requirement and
does not have the registration, then I can see the merit of going onto the route of Lean
and Six Sigma”.
Interviewees in F, H, and J stressed having a formalized system and procedures in
place before embarking on the next stage of CI such as Lean. Interviewees in F and H
stressed establishing formalized procedures before implementing Lean tools like 5S
practice. Agreeing with the aforementioned point, the MD of J commented that – “If the
procedures are not formalized, you don’t have the data, you are not doing anything in
the same way. It is almost impossible to implement Lean or 5S or any kind of strategic
improvement without having a solid process which is documented. When 40-50
people are working on the shop-floor, if you don’t have standardized processes there
would be a chaos on the shop-floor”.
The management in F was open to new ideas of process improvement such as Lean
and Six Sigma. The company was getting support from a local government body in
implementing the concept of Lean on the shop-floor. F had started the 5S
implementation in 2007 and could visualize the dramatic improvement in shop-floor
employees work efficiency. The motivation behind 5S implementation was to efficiently
use the existing floor space, create a clean and tidy work environment and also
reduce the cost of heating the plant. Similar reasons were cited by interviewees in H
and J to implement 5S within their respective firms. It was possible to implement 5S
and ‘CAN DO’ initiative in H with the generous support of their OEM, who assisted and
guided a team from H in implementing and conducting a pilot project using the ‘CAN
DO’ system. The reason for implementing a ‘CAN DO’ initiative was listed in the
quotes from the Quality Manager- “One of our key customers introduced us to the
CAN DO initiative. We went to their factory and were trained on how to use the tool.
We saw how the tool was working and also realized why efficiency is low in our own
company. We have to run our line economically”.
Interviewees in F and H shared common viewpoints with respect to Lean
implementation in their respective firms. The management in both firms decided to be
leaner and more efficient in achieving set targets and outputs, be economical in
production and compete globally. A brief summary of the motivation to embark on QP
was presented in table 7.18.

Chapter 7: Case Study Analysis
Maneesh Kumar 243
Table 7.18: Reasons to embark on CI initiative or certification system
F G H I J
Motivation
to
implement
existing
QP
ISO 9001: 2000 - Improving
market share - Retaining
existing customer
- Standardizing the procedures
Lean - Organize the
shop-floor - Cleanliness of shop-floor
- Good control over inventory
- Minimize the floor-space utilization
ISO 9001:2000
- Pressure from market place
- Customer led rather than company led
- Holding on existing client
- Preferred supplier status
- Standardizing the procedures
Lean
- Optimal floor-utilization
- Promote culture of CI
- Easier to implement
- Quick win - Cleanliness
ISO
9001:2000
- Externally driven by customer
- Increase market share
- Documented procedures
- Preferred supplier status
AS 9000
- Requirement to be supplier of aerospace industry
- Increase in market share
Lean
- Control of inventory
- Clean workplace
- Minimize waste
- Quick win
7.2.2.3. Organizational Infrastructure
In all the five firms, the ownership and responsibility for managing product and
process quality was largely entrusted to the quality department. Shop-floor employees
were provided with basic job-related training on maintaining systems and procedures
for their own processes. Most of the job related training was provided in-house by
senior /middle managers in the sample firms. Employees in the sample firms were
multi-tasking, a typical characteristic observed in many SMEs. Opportunities for career
progression of shop-floor employees were very limited in the sample firms. Senior
Management in F allocated funding for professional development of the management
team but the facility was not utilised due to work pressure and lack of time. There
exists no formal structure in F to identify the training needs of the employees. Any
strategic or quality related training for shop-floor employees was stopped for a year in
2006 due to sickness of the training supervisor. Both the interviewees in F attended a
two day Lean Six Sigma Yellow Belt (YB) training program to understand the
methodology and assess their readiness for Lean Six Sigma implementation. A CI
team was formed recently in the production department by the interviewees to improve
the process efficiency. This team led the 5S implementation with the involvement of
shop- floor employees in the production department.

Chapter 7: Case Study Analysis
Maneesh Kumar 244
Employees in G and I were provided with basic training to document information for
their processes and follow the written standard procedures according to the
instructions provided by the internal auditor to maintain ISO 9000 certification. The
management team in G and I allocated resources for educating senior/middle
management team either through academic degree (such as MBA/ MSC) or routine
training program (mostly in-house). Two of the senior management employees in G
attended a YB training program to develop basic understanding of Lean Six Sigma
and its efficacy in improving organizational efficiency. The knowledge from the training
was not utilised to carry out CI projects due to increased work pressure and a change
in management focus, as stated by interviewees.
The management team in H was aware of the importance of employee education and
training for improving process efficiency. Any new staff go through a day induction
program, are provided with specific job related training, and their knowledge is tested
by middle-managers periodically. Employees were encouraged to enquire or seek
feedback in case any process related issues were not clear. One of the supervisors
was trained as an internal auditor to monitor that employees were adhering to
documented systems and procedures for their respective processes. A process
controller was appointed on a full-time basis to oversee the shop-floor productivity and
maintain quality standards. Dedicated supervisors for three production lines were
allocated by the management team and were empowered to take decisions related to
any process or quality issues in their production line. The Operations Director
attended a YB training program to facilitate CI activities within the production
department. In terms of understanding the VOC or being in direct contact with the key
customer, H had formed a business development department with three managers
responsible for interacting with suppliers and customers.
The management team in J have trained production employees on problem solving
exercises, 5S practice, adhering to principles of AS9100 and ISO 9000, and involve
them in day-to- day process improvement activities. Any process improvement ideas
from shop-floor employees were heard by the business development manager and
their feasibility for implementation tested if appropriate. Every month a 5S audit was
carried by the Operations Director to sustain the benefits gained from 5S
implementation. The MD of the firm allocated resources for both on-site and off-site
training of employees, e.g. half of the production employees went for a day off-site
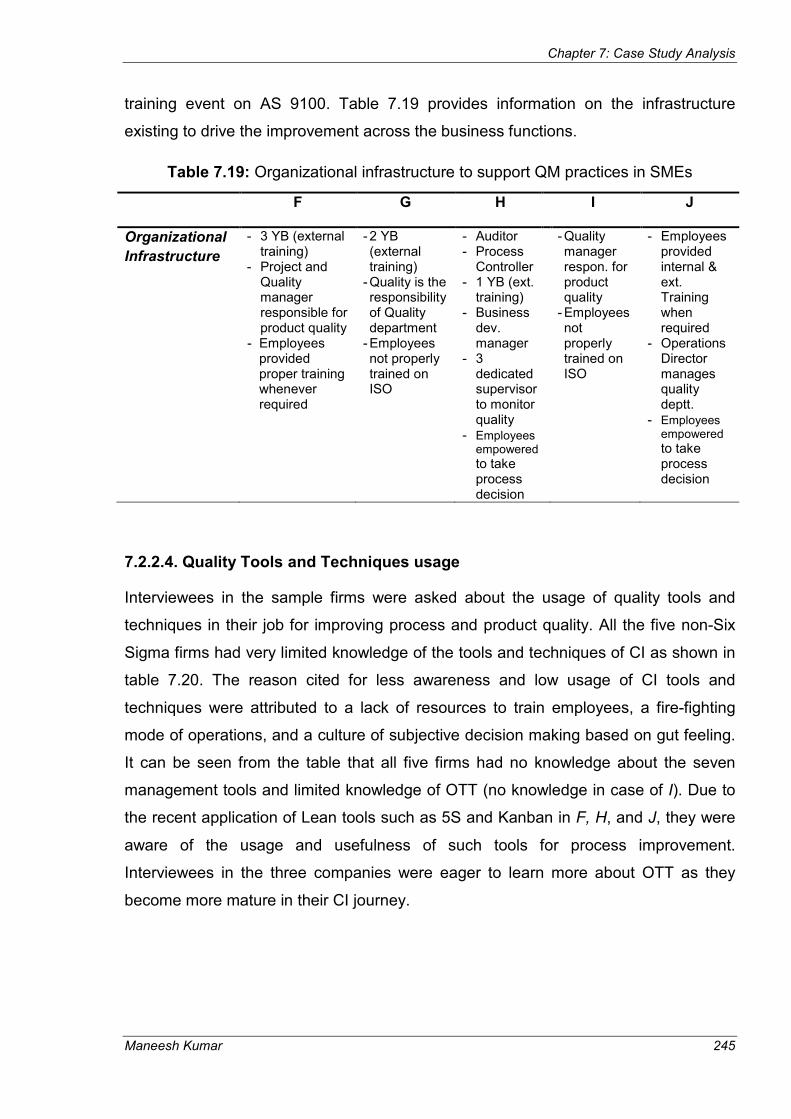
Chapter 7: Case Study Analysis
Maneesh Kumar 245
training event on AS 9100. Table 7.19 provides information on the infrastructure
existing to drive the improvement across the business functions.
Table 7.19: Organizational infrastructure to support QM practices in SMEs
F G H I J
Organizational
Infrastructure
- 3 YB (external training)
- Project and Quality manager responsible for product quality
- Employees provided proper training whenever required
- 2 YB (external training)
- Quality is the responsibility of Quality department
- Employees not properly trained on ISO
- Auditor - Process
Controller - 1 YB (ext.
training) - Business
dev. manager
- 3 dedicated supervisor to monitor quality
- Employees empowered to take process decision
- Quality manager respon. for product quality
- Employees not properly trained on ISO
- Employees provided internal & ext. Training when required
- Operations Director manages quality deptt.
- Employees empowered to take process decision
7.2.2.4. Quality Tools and Techniques usage
Interviewees in the sample firms were asked about the usage of quality tools and
techniques in their job for improving process and product quality. All the five non-Six
Sigma firms had very limited knowledge of the tools and techniques of CI as shown in
table 7.20. The reason cited for less awareness and low usage of CI tools and
techniques were attributed to a lack of resources to train employees, a fire-fighting
mode of operations, and a culture of subjective decision making based on gut feeling.
It can be seen from the table that all five firms had no knowledge about the seven
management tools and limited knowledge of OTT (no knowledge in case of I). Due to
the recent application of Lean tools such as 5S and Kanban in F, H, and J, they were
aware of the usage and usefulness of such tools for process improvement.
Interviewees in the three companies were eager to learn more about OTT as they
become more mature in their CI journey.

Chapter 7: Case Study Analysis
Maneesh Kumar 246
Table 7.20: Tools and techniques currently used in the non-Six Sigma SMEs
The management in these three firms have already started allocating resources for
employee training and awareness on the tools and techniques of CI. The limited
knowledge of OTT gives an indication that strategic and process related decisions are
based on gut feeling rather than utilising and analyzing data to make objective fact
based decisions. It is imperative for the sample firms to raise their awareness of tools
Tools & Techniques
F G H I J
Basic Tools Cause & Effect × × ×
Check Sheet / Tally Sheet × ×
Control Charts × × × ×
Histogram
Pareto Charts × ×
Scatter Diagram ×
Process Map × × × × ×
Brainstorming × × × × ×
Management tools
Affinity Diagrams
Relations Diagram
Tree Diagram
Matrix data analysis
Matrix diagrams
Arrow diagram Process decision program chart
Other tools & techniques (OTT)
5S × × ×
Kanban x ×
Benchmarking Balance Scorecard
Statistical Process Control (SPC)
Failure Mode and Effect Analysis (FMEA)
Value Stream Mapping (VSM)
Measurement System Analysis (MSA)
Design of Experiments (DoE)
Quality Function Deployment (QFD) Hypothesis Testing
Regression Analysis × ×
Force Field Analysis
Quality Costing
Total Productive Maintenance
Mistake Proofing
Chapter 7: Case Study Analysis
Maneesh Kumar 247
and techniques of CI, thus making a transition from reactive to proactive modes of
operation – where decisions are based on facts and data.
7.2.3. Critical Success Factors (CSFs) and Barriers
7.2.3.1. Factors critical to success of quality program
The improvement in market share and profitability of F was the result of change in the
management structure. The new owner of the firm was extremely talented, motivated,
and had a clear long-term strategic vision of taking the business to the next level by
inculcating the culture of CI within the organization. Top-down and bottom-up
communication improved significantly as a result of weekly management meetings to
review problems and issues or to share information. The new MD hosted quarterly
business review meetings with all employees to provide updates on the performance
of the firm and keep them apprised of any changes in the firm’s operational strategy.
At the time of interview, F was establishing a formal system for weekly meetings,
identifying training needs of employees, forming small problem solving teams, raising
employee awareness on the usage and usefulness of tools of CI, and promoting a
culture of CI in the firm.
Top management in G had communicated the need for ISO certification to employees
and considered it as the destination of their quality journey. The main focus in G was
on regular audits that helped in keeping their quality records up to date, i.e. processes
were mapped, metrics established, and data was collected for audit purposes.
Training was provided to employees as and when required. A feedback system was
developed to listen to employee suggestions/ ideas and use it to develop feasible
solutions. The employee retention rate was very high (average 8-10 years) in G as
there were opportunities for career progression from being a trainee to an operator to
a team leader and to becoming a supervisor. Career progression, salary, reward and
recognition were better compared with local industry and kept employees motivated to
improve process efficiency. The process documentation and data collection strategy
developed through ISO certification had helped F and G in measuring performance for
some of their core business processes.
Factors identified as critical, from interviewees perspective, in the successful
management of quality programs in H were commitment from the MD (showed
Chapter 7: Case Study Analysis
Maneesh Kumar 248
commitment by attending regular monthly quality meetings; being in constant touch
with heads of various departments to monitor and assess the current situation in the
firm; allocate resources for training), support from the senior management team to
facilitate any changes in the firm, employee empowerment, support from the middle
management team, strict adherence to guidelines of ISO 9000, open to new ideas or
changes for process improvement (e.g. implementation of Lean and CAN DO),
education and training of employees, and networking and support received from large
organizations or customers. The firm had witnessed advancement in the performance
of employees after attending training programs like 5S practice and the CAN DO
initiative.
The MD of I was very committed in maintaining and sustaining benefits gained from
ISO certification. He was present in every audit meeting and would scrutinise the audit
report to check employees’ adherence to guidelines of ISO 9000 QMS. He was in
constant communication with the senior managers related to quality, safety, health
and other personal issues. The management team allocated resources for educating
employees either through academic degree or routine training programs. The
communication system in the firm was very efficient in reporting problems immediately
to head of the site, who further reported it to the MD. Employee’s grievances were
analyzed on regular basis by the line manager and any serious issues identified were
resolved through the intervention of the senior management team. The interviewees
stressed on deploying quality systems and procedures at all levels in the organization
to realise improvement in efficiency across the organization.
The CSFs for implementation of any quality programs in the firm were identified and
listed by interviewees in J. It was believed that any change should be led and owned
by the MD or senior management team in the firm. The leader should develop the
critical mass that will lead the change and thereby develop confidence in the initiative
before it is rolled out across the firm. The roll-out should begin on a pilot basis
(identifying project that is simple and can be completed in a short-time period of 3-4
months) to achieve early benefit to gain organization’s confidence and belief in the
initiative. Employees should be empowered to monitor their own process and collect
data for their processes.

Chapter 7: Case Study Analysis
Maneesh Kumar 249
The interviewees opined that SMEs had the advantage of flat organizational structure
compared to large organizations that facilitated in improving top-down communication
and breaking down employee resistance to change. The role of the middle manager
was identified as being critical in introducing any change in the firm as they are more
involved in the day to day business activities compared with the top management. A
brief summary of key findings from the CSFs study in the case study firms is
presented in the table 7.21.
Table 7.21: CSFs of quality programs in the non-Six Sigma firms
F G H I J
CSFs • Leadership
• Communication
• Strategic Vision
• Data Collection & Measurement
• Role of Middle Manager
• Education & training
• Networking
• Communication
• Process documentation
• Regular audits
• Education & training
• Measurement
• Leadership
• Leadership
• Mgmt Commitment
• Education & training
• Career Progression
• Resources Allocations
• Networking
• Role of middle manager
• Intrinsic Motivation rather than externally motivated
• Measurement
• Company-wide involvement
• Leadership
• Communication
• Top Mgmt commit.
• Leadership
• Quick wins
• Data availability & measurement
• Empowerment
• Education & training
• Communication
The common factors cited across the five firms were: Leadership; communication;
education & training; Data collection & measurement; role of middle manager; and
networking. All the firms stressed the importance of networking with their OEMs or
government bodies or academic institution to enable knowledge transfer of best-in-
class practices of CI. The six common CSFs were moderately present in F, H, J and
had a weak presence in G and I. The strong/weak presence of CSFs in the
participating firms may have an impact on their organizational performance, which is
investigated in section 7.2.4.
7.2.3.2. Key challenges faced in implementing quality programs
The majority of SMEs are family businesses, with the owners/ MD having limited
formal business training or experiences from different business on the benefits of
formalised procedures and initiatives like Lean. They prefer to have greater control

Chapter 7: Case Study Analysis
Maneesh Kumar 250
over their business and tend to centralize authority to only a few senior management
executives. It is practically impossible to implement any change management initiative
in the SMEs without the support of owner /MD of the firm. Lack of long-term strategic
vision and desire for change inhibits the success on any QP in SMEs, as viewed by
the interviewees.
The MDs and the senior management teams in the sample firms have realised the
importance of initiatives such as Lean and Six Sigma but are struggling to allocate
resources and time for the same. However, interviewees believed that resource
constraints were just an excuse given by top management for not implementing any CI
initiatives like Lean in the firm. Having the right mental approach and implementing
initiatives like Lean / Six Sigma would release slack resources that could be
redeployed elsewhere in the firm for process improvement activities. The quotes from
the Quality Manager in G further reinforces the aforementioned point – “If the
management realise the business need for Six Sigma we will surely find out the time
as we have done in the past while implementing some recent certification”.
Interviewees opined that employees prefer the status quo and give the excuse that
these initiatives require lot of time and resources.
Findings from the usage of tools and techniques section clearly indicated limited
knowledge of SMEs on tools of CI for problem solving. This may be attributed to less
opportunity for education and training of employees on different CI initiatives in the
SME environment. There was no culture of having data collection methodology or
measurement systems in place to monitor the improvement in their processes against
the existing performance metrics. There was a less structured approach in sample
firms to understand and collect the VOC. The majority of the sample firms used
customer complaints as a measure to address customer requirements.
F, under the leadership of a newly appointed Director in the late 1990s experienced a
serious jolt in its CI journey. The MD believed in crisis management, was reluctant to
allocate resources for training and development of employees, and discouraged staff
who came up with new ideas for process improvement. As quoted by the Operations
Manager- “We are still suffering from the demotivation that staff developed in the
period of that MD”. One of the typical barriers encountered in F was alienation
between shop-floor employees and rest of the staff. There were separate canteens for

Chapter 7: Case Study Analysis
Maneesh Kumar 251
the staff members and shop-floor employees, which further hindered the interaction
and friendly communication between the two groups.
It was the lack of strong leadership, several changes in management, vision and
commitment from the top that was hindering the quality improvement efforts in G.
Interviewees in the sample firms felt that resource allocation was the biggest
hindrance in driving the certification effort or implementing initiatives like Lean and Six
Sigma. ISO 9000 was considered as the destination of the CI journey in the two firms,
i.e. G and I. The key challenges identified in achieving and maintaining ISO
certification in I were resistance to change from shop-floor employees, lack of
resources for education and training of employees, training and awareness of the
need for initiative to the rest of the employees, and persistence to stick to a reactive
mode of operations. Meeting of standards should be the routine part of the way
business was done and not seeing it as driven by external pressure, as was observed
in I. Other typical barriers observed in the five firms are listed in table 7.22.
Table 7.22: Key challenges faced by NSSS to implement QP
F G H I J
Challenges Faced by Sample firms
• People prefer to remain in Status quo
• Lack of vision
• Barrier between shop-floor and rest of the staff
• Change in management
• Lack of management commitment
• Poor training and coaching
• Allocation of resources
• Allocation of resources
• Networking opportunity
• Role of middle managers
• Resistance to change
• Training & awareness of QP
• ISO as destination to quality journey
• Resource availability
• Buy-in from middle managers
• Resource availability
• Awareness of different QP
• Networking opportunity
7.2.4. Impact of Quality Initiative on Organizational Performance
Interviewees were asked for ‘qualitative rating’ of the benefits generated ‘after’
implementation of quality programs like ISO 9000 or Lean /5S implementation, the
results of which were presented in table 7.23. Interviewees from F, H, and J had
realised ‘some improvement’ in performance after implementation of Lean (or 5S/
Kanban in particular). On the contrary, G and I attributed their success to the

Chapter 7: Case Study Analysis
Maneesh Kumar 252
application of the tools of CI and close proximity with customers rather than because
of ISO 9000 certification.
Table 7.23: Hard and soft benefits realised by NSSS after implementing QP
Improvement after Six Sigma implementation
F G H I J
Hard benefits (increase in sales, profit, productivity, market share; decrease in scrap rate, defects; on-time delivery etc)
+ - + - +
Soft benefits (customer satisfaction, employee satisfaction, change in thinking process, proactive measures for problem solving, decisions based on data, understanding of CI initiatives, good top-down communication, etc)
+ + + - +
++ = significant improvement; + = some improvement; +- = mixed result; - = no improvement; -- =
negative improvement
The improvement in organizational performance of F was the result of the usage of
tools and techniques, implementation of ERP system, and adhering to basic concepts
of Lean manufacturing, i.e. 5S practice. The implementation of 5S had resulted in soft
and hard benefits being realised by the firm. 5S practice empowered shop floor
employees to manage their processes, keep it clean, and continually devise ways for
process improvement. This facilitated in breaking down resistance to change at the
shop-floor level and inculcated a culture of CI in the organizations. This has helped to
change the culture and mindset of the people. 5S implementation resulted in a
significant reduction in floor space requirement to meet customer demand and thereby
reducing the cost of heating the plant.
Application of Lean principles and 5S practices resulted in reduction in changeover
time from 7 hours to 1 hour for one of the production lines in H. Other benefits
observed due to the application of Lean principles in H was listed in table 7.24. Similar
benefits were realised by J after 5S implementation. Regular monthly 5S audits were
conducted in J and it was ensured that employees were implementing it in their daily
job. The implementation of 5S resulted in effective utilization of floor space and
employees were empowered and given ownership for improving their own processes.
It had now become part of their daily practice and employees enjoy keeping their
workplace clean, tidy and error-free. Low-on-time delivery performance is the major

Chapter 7: Case Study Analysis
Maneesh Kumar 253
concern in J due to regular changes in the customer specification leading to delay in
delivery of products.
Table 7.24: Benefits realised by H after Lean implementation
Hard Benefits Soft Benefits
� Better output (from 25000 soap tablets to 45000 tablets after 5S)
� Less paperwork (reduced by 5%)
� Reduction in customer complaints by 8%
� Scrap rate reduced from 2% to 1.16%
� Savings from the project not quantified by the accountants but believed to be approximately £50000 since implementation (about 5-6 months)
� Lift in staff morale
� Staff acquainted with the usage of basic tools of CI
� Shop-floor empowerment to take decisions for their processes
� Psychological aspect of the employees has become more positive
� All parts of the factory are labelled and have got a location, which is strictly followed
� Developed a habit of data collection and measurement for all the lines on shift basis and reported back to operations manager, financial controller and quality manager on day to day basis
The improvement in performance of G and I were not attributed to ISO certification,
but the use of tools and techniques of CI as cited by the interviewees. Both the
companies had managed to improve customer complaints due to their close proximity
with customers and the nature of their personal business. The improvement was
attributed to the company’s reaction to changing market forces and stiff competition.
However, interviewees agreed that ISO had helped in developing process thinking,
working closely with customers, and improving delivery performance. G does not use
the metrics such as reduction of cycle time or reduction of employee complaints.
Some indices used by the management board in G to drive the business were:
throughput per hour or loss time due to accident; some other metrics like customer
complaints were captured at middle management level to use it as a feedback to
improve customer satisfaction. Some of the key changes in the performance of G from
2005/2006 to 2006/2007 were reported in table 7.25. There was improvement in
revenue, profitability, and reduction in customer complaints observed compared to the
previous year’s performance in G. Understanding and regular follow-up of
performance metrics in I was very poor and needed to be developed as commented

Chapter 7: Case Study Analysis
Maneesh Kumar 254
by the Quality Manager. The key performance metrics used by I were customer
complaints, throughput, sales data, and safety performance.
Table 7.25: KPIs used and monitored by G
KPIs Actual 2005-06
Target 2006-07
Person Responsible
Key Actions Required to Achieve Target
Supporting Actions
Increase Revenue
£17.6m £20.4m Sales Director Consider a customer feedback survey as a way of identifying new opportunities as well as gathering information on marketplace perception and addressing areas where improvement is required
Display KPI in each department
Increase Profit Before Tax
£724k £905k Managing Director
Deliver Business KPI's Display KPI in each department. Review business KPI's with Dept Managers to ensure targets are being met. Review formally at Board and informally day to day
Delivery Performance % On Time
99.30% 98% Operations Director
Develop a close partnership with our transport/delivery provider. Ensure clear understanding of all requirements between customer and delivery provider
Monthly performance data available and visible in each department. 1/4 Review Meetings with Delivery provider to ensure current performance is maintained and Correctible and Preventive Actions implemented
Health and Safety - Lost time Accidents
2 0 Operations Director
Fully utilise the near miss incident and accident reporting and investigation system; Health and Safety Committee - meets on a monthly basis to review the site safety management system
Incident reports and investigations available. Implement preventive and corrective action- Ongoing
On the contrary, interviewees in F, H, and J held different opinions about ISO 9000
benefits. Adherence to ISO 9000 certification in F resulted in establishing systems and
procedures that had an impact on its performance improvement. Following the
skeleton/ structure of ISO 9000 in H facilitated improving the quality of the product by
focusing more on customer complaints, collecting and analyzing data for the

Chapter 7: Case Study Analysis
Maneesh Kumar 255
complaints, and addressing the critical issues from customer perspective. This was
not initially practised by employees in H. Comments from the MD further reinforces
the importance of certification from the company’s perspective – “Personally, I think
that ISO laid the foundation for us to be able to do the flow-charts; flow-charts helped
us to start gathering data. Without those systems in place and owned by the people,
we would have not reached the current state. ISO acts as a ready-made template to
standardize the process. ISO would be a general template that can be applied to any
business”.
Interviewees were also asked to rate their improvement in performance on 1-5 Likert
scale against the listed criteria in table 7.26, after the implementation of QP. The
scores of F, H, and J indicates that they have realised some or have made significant
improvement in metrics like scrap rate, cycle time, delivery time, productivity, cost,
profitability, and employee complaints. It should be noted that these three firms had
just embarked on the Lean journey (less than 7-8 months) when the interviews were
conducted in the sample firms.
Table 7.26: Impact of QP on performance of NSSS
Performance Evaluation of companies on the 1-5 Likert scale questions
Performance Indicators
F G H I J
Reduction in scrap rate 3 3 3 6 3
Reduction in cycle time 4 6 3 6 3
Reduction in delivery time 4 3 3 6 3
Increase in productivity 3 3 4 2 3
Reduction of costs 3 3 4 3 3
Increase in profitability 3 3 3 3 3
Improved sales 3 3 3 3 3
Reduction of customer complaints 3 4 4 2 3
Reduction of Employee Complaints/Grievances 3 6 3 2 3
1 = negative benefit / improvement; 2 = no benefit / improvement; 3= some benefit / improvement; 4=significant benefit / improvement; 5 =Crucial; 6 = measure not-used
Interviewees in the three firms opined that by application of more tools and techniques
of CI, they can realise significant improvement in the near future. The three firms also
Chapter 7: Case Study Analysis
Maneesh Kumar 256
realised the improvement in soft factors such as customer complaints and employee
complaints after implementation of Lean tools. Some of the most commonly used
performance metrics in SMEs such as scrap rate, cycle time, and delivery time, were
not established and used in I. At present, there was no culture of making decisions
based on facts and data in I. The interviewees commented on the imminent need to
establish the aforementioned metrics in the company to know how they are performing
and making improvement against the established metrics. The improvement in sales,
profitability and customer complaints were the result of being in frequent contact with
customers and resolving their problems on an immediate basis, as commented by
interviewees in G and I. ISO 9000 helped the two firms in establishing discipline in the
firm but played no role in profitability improvement of the respective firms.
One of the key challenges faced by participating firms was the quantification of
benefits generated from the implementation of QP. The reason cited by interviewees
was lack of involvement of people from accounting and finance department as well as
quality management being considered the sole responsibility of the Quality
Department. Due to this reason, interviewees were unable to provide a figure for
benefits realised as a result of Lean or ISO implementation in the participating firms.
A summary of key findings from the non-Six Sigma firms were presented in table 7.27.

Chapter 7: Case Study Analysis
Maneesh Kumar 257
Table 7.27: Summary of key findings from the non-Six Sigma firms
F G H I J
Current quality program in the firm
� Lean Lean program successful since its implementation in late 2007
� ISO 9001:2000 Success of the firm not attributed to ISO certification
� Lean Just started with lean implementation
� ISO 9001:2000 Follow basic guidelines of ISO for process standardisation
� Lean -A new CI initiative in the firm gaining popularity & momentum
Motivation to implement quality program
� Organize the shop-floor � Cleanliness of shop-floor � Good control over inventory � Minimize the floor-space
utilization
� Pressure from market place � Customer led rather than
company led � Holding on existing client � Preferred supplier status � Standardizing the procedures
� Optimal floor-utilization � Promote culture of CI � Easier to implement � Quick win � Cleanliness
� Externally driven by customer � Increase market share � Documented procedures � Preferred supplier status
� Control of inventory � Clean workplace � Minimize waste � Quick win
Organizational Infrastructure
� 3 YB (external training) � Project and Quality manager
responsible for product quality � Employees provided proper
training whenever required
� 2 YB (external training) � Quality is the responsibility of
Quality department � Employees not properly trained
on ISO
� Auditor � Process Controller � 1 YB (ext. training) � Business dev. manager � 3 dedicated supervisor to
monitor quality � Employees empowered to take
process decision
� Quality manager responsible for product quality
� Employees not properly trained on ISO
� Employees provided internal & ext. Training when required
� Operations Director manages quality department
� Employees empowered to take process decision
Quality tools & techniques usage
Knowledge of and uses some basic tools of CI; No knowledge of mgmt. tool; Tools within OTT not understood & used- only uses 5S, Kanban, & Regression analysis Awareness of OTT is going to increase as mgmt investing in employees training
Knowledge of and uses some basic tools of CI; No knowledge of mgmt. tool; Tools within OTT not understood & used- only uses Regression analysis Operating in fire fighting mode; less focus on process improvement activities
Knowledge of and uses some basic tools of CI; No knowledge of mgmt. tool; Tools within OTT not understood & used- only uses 5S Awareness of OTT is going to increase as mgmt investing in employees training
Little knowledge and usage of basic tools; No knowledge of mgmt. tool; Tools within OTT not understood and used More focus on increase in market share and meeting customer requirement ; less focus on process improvement
Knowledge of and uses some basic tools of CI; No knowledge of mgmt. tool; Tools within OTT not understood & used- only uses 5S and Kanban Awareness of OTT is going to increase as mgmt investing in employees training
Critical Success Factors
� Leadership � Communication � Strategic Vision � Data Collection &
Measurement � Role of Middle Manager � Education & training � Networking
� Communication � Process documentation � Regular audits � Education & training � Measurement � Leadership
� Leadership � Mgmt Commitment � Education & training � Career Progression � Resources Allocations � Networking � Role of middle manager
� Intrinsic Motivation rather than externally motivated
� Measurement � Company-wide involvement � Leadership � Communication
� Top Mgmt commit. � Leadership � Quick wins � Data availability &
measurement � Empowerment � Communication � Education & training
Challenges / Barriers
� People prefer to remain in Status quo
� Lack of vision � Barrier between shop-floor and
rest of the staff
� Change in management � Lack of management
commitment � Poor training and coaching � Allocation of resources
� Allocation of resources � Networking opportunity � Role of middle managers
� Resistance to change � Training & awareness of QP � ISO as destination to quality
journey � Resource availability
� Buy-in from middle managers � Resource availability � Awareness of different QP � Networking opportunity
Impact on Organizational Performance
+ve impact on Hard & Soft performance metrics after implementation
No impact – Improvement in performance metrics not attributed to ISO but other factors like close proximity to customers
+ve impact on Hard & Soft performance metrics after implementation
No impact - Improvement in performance metrics not attributed to ISO but other factors like close proximity to customers
+ve impact on Hard & Soft performance metrics after implementation
Chapter 7: Case Study Analysis
Maneesh Kumar 258
7.3. Findings from Practitioner interviews
7.3.1. Quality Management Practices in SMEs
In the experience of the interviewees, the majority of SMEs still believe in inspection
exercises rather than having a proactive system for quality management. ISO 9000
certification was the most common accreditation system observed in the UK SMEs. As
said by the interviewees, none of the SMEs in their experience had ever used
assessment models such as European Foundation for Quality Management (EFQM).
This result was in consensus with the findings from the literature and the first phase of
study (i.e. survey). SMEs have started realising the importance of CI initiatives such
as Lean and Six Sigma due to pressure from low cost South Asian economies like
India and China and also due to the growing importance of the supply chain. A
practitioner from Scottish Manufacturing Advisory Services (SMAS) stated that large
organizations in Scotland were not pressurising SMEs to embark on Six Sigma as
very few of the large firms were themselves aware of or applying Six Sigma. OEMs in
Scotland look for their suppliers to have some sort of accreditation such as ISO 9000
for QMS, ISO 14000 for Environmental Management System (EMS), BRC for food &
clothing industry. Within all these accreditations, the suppliers (in most cases are
SMEs) were expected to meet the basic requirements of management processes or
systems. As stated by the Manufacturing Institute (MI) practitioner, very few SMEs
(may be 10% of the companies he has visited for conducting a diagnostic test) send
out survey questionnaire to capture VOC. Data collected through customer
complaints, a reactive mode of operation, was the most commonly used practise in
SMEs to understand their customers’ problems. However, SMEs within food,
automotive and aerospace industries used questionnaire for understanding customer
requirements.
7.3.1.1. SMEs perception of ISO 9000
ISO 9000 is a formal QMS and the most common accreditation among SMEs. When
implemented effectively, ISO can give procedures a discipline and framework around
which the company could improve their business functions. The revised version of
ISO9000, which is ISO 9001: 2000, stresses continuous improvement and forces
firms to frequently use quality tools and techniques such as simple bar charts, Pareto

Chapter 7: Case Study Analysis
Maneesh Kumar 259
chart, and control charts. The quote from a Manufacturing Advisory Services (MAS)
practitioner was in consensus with aforementioned statement- “If you follow ISO 9000
seriously, it is beneficial. But what SMEs tend to do is they get the accreditation, they
don’t have resources to maintain it”. He further stated that not all companies need ISO
certification. If you are a company that does have procedures, discipline, using
effective tools, and have established business processes, you only need to have a
system in place that can sustain that process. But unfortunately many customers
(larger firms) view ISO 9000 as an indicator - of culture, of stability, of a formalised
approach to business processes which was viewed as a positive approach. In most
cases, the customer sets a prerequisite of ISO 9000 certification for SMEs to be their
supplier rather than SMEs seeing a compelling need for ISO. SMEs do implement
such systems due to pressure from their larger counterparts, to increase their market
share and to raise the profile of the company in the eyes of the customer.
When asked about ISO being the foundation to embark on Six Sigma, a practitioner
from SMAS provided the following statement – “I believe that a company would look at
ISO 9000 before they look into Lean and Six Sigma. ISO 9000 is a good starting point
for SMEs to establish systems and procedures in place, map the processes, and
develop metrics for the core business processes. This would lay a good foundation to
implement Six Sigma”. The practitioner from MI shared similar viewpoints on ISO
being the foundation for embarking on Lean or Six Sigma.
7.3.1.2. Current status of Six Sigma implementation in SMEs
In their knowledge and experience, interviewees believed that there are very few
SMEs in the UK implementing Six Sigma across their business processes. Their
viewpoints were in consensus with findings from the first phase of the study.
According to practitioners from SMAS and MI, many SMEs do not have enough
control and stability in their processes to use Six Sigma tools & techniques, which
comes later in the QM journey. They are not ready for Six Sigma implementation.
These companies do not even have flow and pull-system established within their
business processes. SMEs need to create the flow, implement Kanban and 5S, before
embarking on the Six Sigma journey. There is a lot of low-hanging fruit that need to be
attacked first by applying the Lean principles. If SMEs have achieved the first 4 Lean
principles then the company may start thinking about training people on Six Sigma.
Chapter 7: Case Study Analysis
Maneesh Kumar 260
Thus, its a good idea to implement Lean to see the benefits immediately, which they
will not get from Six Sigma.
As said by an interviewee from MI, “If you visit a company and walk around their
business processes - if business processes look good; people appear to be value
adding; everything seems systematic with no chaos in the workplace; you can’t see
immediate problems on and you go on and visit their balance sheet and see whether
they are making money, in such cases the company may be ready to embark on Six
Sigma. No company at the moment is fully implementing Six Sigma across their entire
business processes. At the most, 3-4 companies are doing some basic Six Sigma
DMAIC approach and do some analysis. Most of these companies use SPC,
flowcharting”.
A typical intervention by government bodies like MAS and MI starts with a 5S
workshop in a SME because it is an activity that involves everyone and is easier to
understand by employees - they enjoy doing it and can see direct benefits as it is very
visual. After 5S, SMEs are given basic introduction to Lean principles, and then start
with VSM. People understand the real value of doing 5S and VSM to identify any
waste in the entire process. It was commented by the MI practitioner that many SMEs
say that they do 5S in practice, but in reality have only achieved 1S or 2S. In his
experience of providing services to over 250 SMEs, only 10% of companies have
seriously implemented Lean.
7.3.1.3. Could Six Sigma be the solution to ailing manufacturing companies in
UK?
Interviewees agreed that to survive in the global market, manufacturing SMEs in the
UK need to reduce their operational cost and improve their efficiency by applying CI
initiatives such as Lean and Six Sigma. The challenge for firms is to evolve in order to
survive the global competition. Firms who continued to grow underwent a radical
change in the way they run their business- focused more on value rather than volume;
improved productivity by eliminating waste- to secure jobs, future, and maintained
profitability. When companies were adhering to the aforementioned practices, Lean
comes directly into the picture to achieve the objectives of eliminating waste. Some of
the companies were very well developed, mature, had gone through Lean
implementation, and are now thinking of implementing Six Sigma. The UK faces
Chapter 7: Case Study Analysis
Maneesh Kumar 261
challenges from the Far East and Eastern European countries to match their offering
of low cost products and services. To be meaner, leaner, slicker and faster than
before, they have to maintain the profitability of the organization- and the way forward
is to use CI initiatives such as Lean and Six Sigma.
7.3.1.4. Knowledge and usage of tools and techniques of CI
SMEs understanding and knowledge of the tools and techniques of CI were limited as
stated by interviewees. Some of the most common quality tools used for process
improvement in SMEs was
� Frequency / Bar chart
� Pareto chart
� Process mapping
� Control charts – many SMEs have no clear understanding of the differences
between control charts and run charts; they often use run charts and have a
perception that it is same as control charts. Again SMEs perceive SPC and
control charts as the same, whereas there is significant difference between
SPC and control charts; SPC is a technique for quality improvement which
includes tools like control charts.
� 5S practice
The majority of the SMEs were not aware of the seven management tools or tools
within other categories as discussed in table 7.6 and table 7.20. SMEs implementing
Lean and Six Sigma are aware of the seven basic tools of CI, some management
tools, and tools within other categories such as 5S, VSM, SPC, FMEA, regression
analysis, to name a few. Interviewees were in consensus with the findings, presented
in table 7.6 and table 7.20, on application of tools and techniques of CI within Six
Sigma and non-Six Sigma firms.
7.3.2. CSFs and challenges in implementation of CI initiatives in SMEs
7.3.2.1. CSFs for implementation of CI initiatives in SMEs
Some of the CSFs identified by interviewees were listed below

Chapter 7: Case Study Analysis
Maneesh Kumar 262
� Leadership, management involvement and commitment: top management
included CI initiatives within the strategic objectives of the business;
communicated to employees the reason for implementation of Lean and Six
Sigma; allocated resources and break down barriers encountered during
implementation.
� Communication: done through shift meetings, management meetings, board
meetings, whereby a company’s overall performance is openly discussed,
review analysed and cascaded down; other communication mediums such as
intranet and newsletters are also required.
� Existence of performance metrics and a culture of making decisions based on
facts and data; regular internal audits to see how people and processes are in
conformance to standard expectation.
� Education and training: giving people the required skills to carry out their jobs-
either technical or soft skills; education and training should be a continuous
process
� Culture of empowerment: employees are given the authority to take decisions,
and their recommendations are taken into account - they are included in project
review meetings.
� Networking: with government bodies such as SMAS, MAS, and MI may help
SMEs get the support required for implementation of CI initiatives. A
practitioner from SMAS strongly accentuated changing the curricula at
universities to incorporate topics such as Quality Management and Lean Six
Sigma. This will ensure that graduates leaving universities will have basic
knowledge of quality management topics.
The three interviewees agreed that the understanding of softer issues such as
leadership, communication, culture change, education and training, empowerment,
and a proactive mode of operation is more important than application of statistical
tools and techniques or DMAIC methodology. In support of aforementioned statement,
one of the practitioner from SMAS commented that “the best companies I see focus
on communication tools & development tools and then on the technical tools of Six
Sigma and Lean”.

Chapter 7: Case Study Analysis
Maneesh Kumar 263
7.3.2.2. Challenges faced in the implementation of CI initiatives in SMEs
The interviewees listed following impediments encountered by SMEs while
implementing initiatives such as Lean and Six Sigma
� Lack of support from top management: Many SMEs are family owned businesses,
where power to bring any change lies with the CEO or MD of the firm. It is difficult to
implement and sustain any change until the owner of the firm is convinced and
committed to the implementation of CI initiatives
� Lack of data availability is a typical barrier in implementing Six Sigma in SMEs
� Lack of awareness of CI tools & techniques
� Resources constraints: especially for the smaller companies- they struggle to
identify and allocate resources to improve their business processes. Government
supported bodies such as SMAS, MAS in England and Wales, the Manufacturing
Institute can play a big role in helping SMEs to implement CI initiatives. Some firms
seek paid external support and advice, whereas other firms look for cost free
services with less focus on the quality of external experts. In situations where the
company is losing money, and/or is behind budget- any money spent on training
and development is seen unnecessary that companies would rather save.
� Culture: no culture of continuous improvement; focus only on sales growth; working
in fire fighting mode
� Lack of education and training: whereby they do not have an understanding of
current changes required to improve quality and process efficiency
7.3.3. Performance metrics used in SMEs
From the interviewees’ experience, SMEs have less established performance metrics
in place compared to large organizations. It is worse in small companies, where
limited KPIs exist and the focus is mainly on the sales turnover, net and gross profit &
loss, and throughput. Medium-sized firms have more established KPIs compared to
small firms. Some of the non-financial measures used in many SMEs are customer
complaints and employee turnover. One of the practitioners commented on the usage

Chapter 7: Case Study Analysis
Maneesh Kumar 264
of the following metrics in SMEs based on his past experience of implementing CI
initiatives in over 250 SMEs:
� Scrap rate- very few firms use this metric
� Cycle time- Not used in many SMEs
� Reduction in delivery time- 20-30% of firms use this metric
� Increase in productivity- many firms use this metric though have not got good
understanding of what productivity is
� Reduction of cost- Most SMEs focus on this metric to greater extent
� Sales turnover- Almost all SMEs use this measure
� Customer complaints- This is one of the common metrics apart from sales and
profit used by SMEs to resolve customer issues (though it is a reactive mode of
operation, where action is taken after problems have already occurred)
� Cost of quality (COQ)- no understanding of cost of quality concept in the
majority of SMEs; for some SMEs, cost of quality means scrap and rework. It is
imperative for SMEs to develop a good understanding of COQ and start
measuring it to lower their cost of production and increase their sales turnover.
Interviewees also commented on the existence of the aforementioned metrics in firms
implementing Six Sigma. However, understanding of COQ was still at its rudimentary
stage in many Lean and Six Sigma implementing firms. Benefits generated from Lean
and Six Sigma programs in SMEs included both the hard and soft benefits. Significant
improvements in the bottom-line were observed in SMEs implementing Six Sigma and
Lean through increase in productivity, sales turnover, and decrease in defects and
scrap rate. Implementation of basic Lean tools such as 5S and VSM resulted in sales
and profit improvement through reduction of waste and improvement in on-time
delivery of products. Softer savings through Lean Six Sigma include enhanced
customer satisfaction, employee satisfaction, decisions based on data, good
communication systems, improvement in employee retention, to name a few.
Summary of key findings from practitioners interviews were presented in table 7.28.

Chapter 7: Case Study Analysis
Maneesh Kumar 265
Table 7.28: Summary of Key Findings from practitioner’s interviews
Issues investigated Practitioner’s Viewpoints
QM practices in SMEs � Majority of SMEs still follow inspection based quality system � ISO 9000 most common accreditation system in UK SMEs � EFQM assessment model not suited for SMEs � SMEs realising the importance of CI initiatives like Lean & Six Sigma � Reactive mode of operation- rely on customer complaints to improve product
quality SMEs perception of ISO 9000
� When implemented effectively, ISO can give procedures a discipline and framework
� The revised version of ISO, i.e. ISO 9001:2000 more effective & encourages CI � There is no need of certification if your processes are disciplined and
standardised � In most cases, customer sets a prerequisite of ISO 9000 certification for SMEs to
be their supplier � ISO 9000 would lay a good foundation to embark on Lean & Six Sigma
Status of Six Sigma implementation in SMEs
� Very few SMEs in UK implementing Six Sigma across their business processes � Control and stability of their process not enough to use Six Sigma � Lean could be the starting point to get quick gains and streamline processes
before implementing Six Sigma � Government funded bodies like MAS, MI, SMAS role critical in facilitating SMEs
to implement Lean & Six Sigma Lean & Six Sigma solution to ailing Mfg. Industry in UK
Yes- to survive in global market, SMEs in UK need to reduce their operational cost and improve their efficiency by applying initiatives like Lean and Six Sigma
Knowledge of quality tools & techniques in SMEs
� Understanding and knowledge of quality tools & techniques very limited in SMEs � Most commonly used quality tools in SMEs are bar charts, Pareto chart, process
maps, control charts, and 5S. � Majority of SMEs not aware of seven management tools or tools within OTT
categories � Six Sigma/Lean firms more aware & uses tools & techniques of quality as
compared to non-Six Sigma firms. Critical Success factors � Leadership & top management commitment
� Employee education & training � Employee empowerment � Decisions based on facts & data � Communication � Networking
Challenges/ Barriers � Lack of support from top management � Lack of data � Lack of awareness of tools & techniques of CI � Resource constraints � No culture of CI � Lack of employee education & training
Performance metrics used in SMEs
� Less established performance metrics in place as compared to large org. � Small firms focuses mainly on sales turnover, net & gross profit/loss, and throughput; Other metrics existing in SMEs are reduction in cost, customer complaints
� Limited or no understanding of important metrics like cost of quality � Six Sigma firms have more established metrics in place as compared to non-Six
Sigma firms Impact of QP on organizational Performance
� Sig. +ve impact on Hard & Soft performance metrics after implementation of Lean and Six Sigma
� ISO 9000 had limited influence on improving organizational performance

Chapter 7: Case Study Analysis
Maneesh Kumar 266
7.4. Differences between SMEs and Large organization
Interviewees from the 10 participating firms and 3 government bodies were asked to
comment on the differences in SMEs and large organizations that may facilitate or
hinder the implementation of CI initiatives in the firm. Responses were in consensus
with findings from the literature. Some of the key differences between SMEs and
larger organizations as cited by the interviewees were:
� SMEs have the advantage of a flat organizational structure that promotes faster
top-down and bottom-up communication with minimal distortion of messages
issued to the employees. This flat structure also promotes greater visibility across
the firm to raise staff awareness of changes happening in the business
� Shorter communication channels means that there are fewer people to convince,
which can make management’s job easier and faster
� It is easier to introduce any change management / process improvement activities
in the firm if the senior management is committed to allocate resources for the
change. Senior management is closer to those working on the shop floor-the type
of influence that senior management can bring to the shop floor will be quicker.
� Decision making is easier in SMEs compared to large organizations as the power
resides with the owner of the firm in most cases
� Compared to larger organizations, SMEs face resource constraints to invest in
new technology, invest in employee education and training or recruit skilled
manpower
� SMEs are less aware of opportunities to network with other similar/different
businesses, government bodies or academic institutions. They have minimal
knowledge of the support rendered by government organizations such as the MAS
in England, Scotland, Wales and Ireland or the MI
When interviewees in the case study firms were asked to comment on the relationship
between the size of an organization and Six Sigma implementation, the majority
believed that such programs were challenging to implement within a SME
environment. The MD of A opined that - “it is easier for bigger companies to implement
it. To some extent it is true. But we are a small company and we have done it and our
success has been because management is very committed to it. But I think if we had
Chapter 7: Case Study Analysis
Maneesh Kumar 267
not got the grant in the early days, I am not sure that we would have gone such a long
way in that everybody was trained on YB and two other belts”.
Interviewees in B stressed understanding the culture of the organization, irrespective
of the size of the organization, to successfully implement such a system. Accentuating
the importance of culture, the Lean Champion in B stated the following – “I think you
have got to address culture massively, irrespective of the type and the size of the
organization. If we don’t understand the culture of the business and how to make a
transition, any initiative will fail. For SMEs, you have got deadlines to meet and work in
fire fighting mode. Anything you try and plan is difficult, which causes frustration”.
Interviewees in E stated that Six Sigma implementation is dependent on the
complexity of the process, and repetitive processes existing in the company. It has got
no relation to the size of a company.
The same question was posed to the three practitioners from SMAS, MI, and MAS.
The interviewees felt that size does matter for implementation of Six Sigma but that
does not preclude SMEs from embarking on the CI journey of Lean and Six Sigma.
Large organizations have structured and dedicated resources and culture of CI that
facilitates ongoing quality improvement projects. For SMEs, it varies incredibly
depending whether it is a small or medium-sized firm. As stated by one of the
practitioners, “there are small companies that are doing well that are utterly down to
leadership style, knowledge, commitment, attitude, behaviour of individuals. Some
small business are incredibly successful and adaptive to new ideas and systems. I am
working with a company with 16 employees with 3 BB, 1 MBB”.
Interviewees were introduced to the growth models of small businesses, such as
stage models from Greiner (1972, 1998) or Churchill and Lewis (1983), and the state
model from Phelps et al (2007), and were asked to comment on whether a good
understanding of the characteristics of each stage/state in growth models may help
the firm to decide their readiness for implementing CI initiatives such as Lean and Six
Sigma. For more information on the growth models, refer to Chapter 2. Interviewees
had a common consensus that positioning of the firm in the growth stage model and
implementation of CI initiatives may vary from one business to another. It may be that
a firm is still at stage one or stage two of the growth model (stage1 and stage 2
typically represents a firm struggling for survival and working in a reactive mode) but
implementing Lean successfully. It also depends on whether SMEs want to grow their
Chapter 7: Case Study Analysis
Maneesh Kumar 268
business or maintain the status quo so that the owner had complete control over the
entire operation. The MD of J further reinforces the aforementioned point –
“Understanding the characteristics of SMEs at each stage of growth-, It is a good
model for a company to know where they are; however many SMEs prefer to maintain
the status quo and does not want to grow”. Interviewees reacted positively towards the
state model proposed by Phelps et al (2007) and were in consensus with the
researcher that external intervention in a SME environment is a must for the
acquisition of external knowledge, to develop the ability to recognize value of new
information, assimilate it, and apply it to commercial ends to allow their business to
grow. The inclusion of factors such as operations improvement, formal systems,
people management, and strategy in the model made it a more relevant and practical
model for firms embarking on the CI journey to follow. Interviewees were in agreement
that understanding of the characteristics of the growth model would certainly help
owners and senior managers to reflect on their current practices and its impact on the
growth of the firm. It would be difficult to decide on implementation of a CI program
depending upon their positioning on the growth model.
7.5. Six Sigma Readiness Index
This section attempts to identify the factors that constitute Six Sigma Readiness Index
(SSRI). The literature review on CI maturity model (refer to Section 3.7.2) facilitated in
understanding the characteristics of firms at different stages of CI journey. The author
made a similar attempt to identify the characteristics of organization that are ready to
embark on Six Sigma journey by proposing a SSRI. This section includes discussion
on how the factors, to include within SSRI, were identified by interviewing delegates
from the five Six Sigma firms, three practitioners from government bodies, and getting
opinion from 30 delegates attending International Conference on Six Sigma in
Edinburgh (15th-16th December, 2008). The interviewees were asked to cite five most
important factors that should be present in the company before embarking on the Six
Sigma journey. The five non-Six Sigma firms were not asked this question because of
their lack of knowledge or experience in implementing Six Sigma. Table 7.29
summarises the key factors listed by participating firms to check an organizational
readiness for Six Sigma implementation. As some factors were falling in the similar
category, e.g. employee education and training, employee empowerment were both
Chapter 7: Case Study Analysis
Maneesh Kumar 269
related to people issues or human resource management, it was rational to group
them together. The factors listed in table 7.29 were grouped in five categories as
follows:
� Style of Leadership within the company- whether ready for the challenge and will
support the change; whether the culture of the company will support the focus on
implementation of CI or whether it will fade away as a another fad of the month;
management focus, drive and commitment is a must for the success of any change
program.
� Communication to all relevant staff- a well established top-down and bottom-up
communication channel is required; communication through shift meetings,
management meetings, board meetings, whereby company’s overall performance
is openly discussed, review analysed and cascaded down. Different media sources
such as intranet, newsletters, management address to all employee on any major
change, and notice boards should be in place for effective communication.
� Established Systems and Procedures- the company should have established
systems and procedures in place by strictly adhering to quality management
systems standards or Lean implementation; all core and support processes should
be identified and mapped; key performance metrics for core processes should be
established and data available and recorded in a systematic manner; knowledge
and usage of basic tools of CI in daily jobs.
� Resources and skills to facilitate implementation- one of the most important
requirement is to build your human capital by providing education and training for
employees; collaborating with government bodies or local universities for
developing understanding of CI initiatives.
� Cultural Change- giving empowerment to employees to take decisions for their
processes; proactive approach to manage operations and processes; absence of
blame culture; decisions based on fact and data.
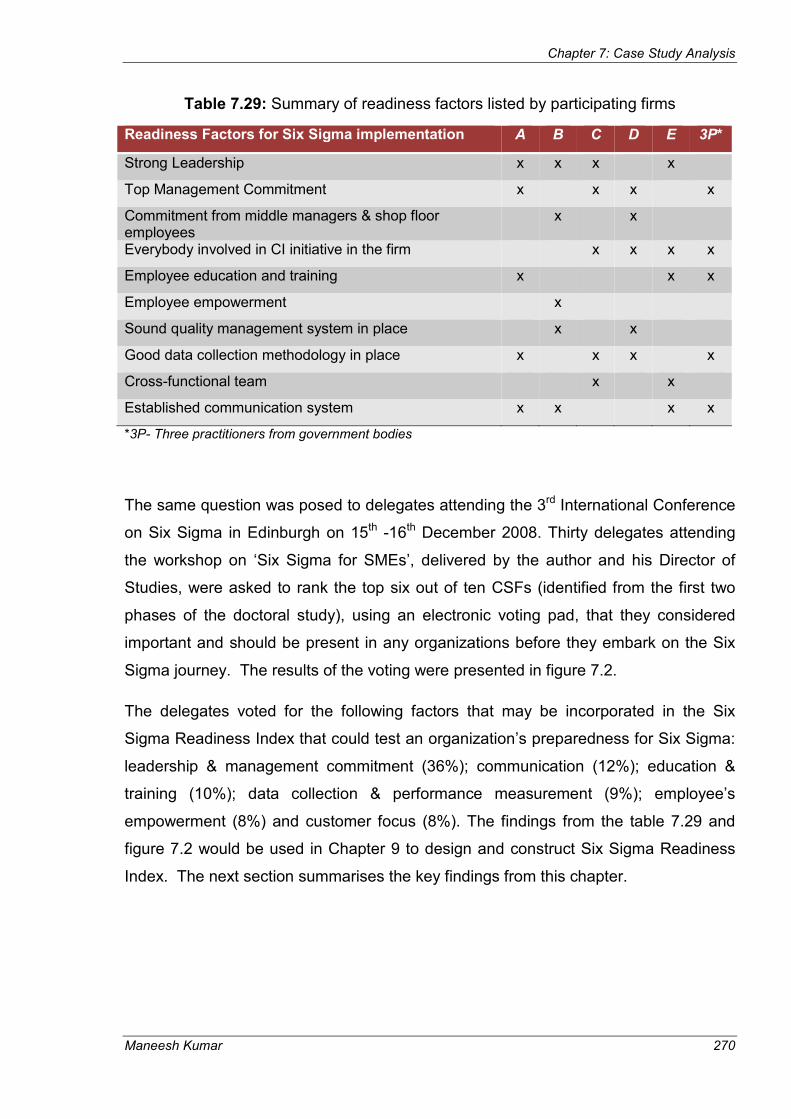
Chapter 7: Case Study Analysis
Maneesh Kumar 270
Table 7.29: Summary of readiness factors listed by participating firms
Readiness Factors for Six Sigma implementation A B C D E 3P*
Strong Leadership x x x x
Top Management Commitment x x x x
Commitment from middle managers & shop floor employees
x x
Everybody involved in CI initiative in the firm x x x x
Employee education and training x x x
Employee empowerment x
Sound quality management system in place x x
Good data collection methodology in place x x x x
Cross-functional team x x
Established communication system x x x x
*3P- Three practitioners from government bodies
The same question was posed to delegates attending the 3rd International Conference
on Six Sigma in Edinburgh on 15th -16th December 2008. Thirty delegates attending
the workshop on ‘Six Sigma for SMEs’, delivered by the author and his Director of
Studies, were asked to rank the top six out of ten CSFs (identified from the first two
phases of the doctoral study), using an electronic voting pad, that they considered
important and should be present in any organizations before they embark on the Six
Sigma journey. The results of the voting were presented in figure 7.2.
The delegates voted for the following factors that may be incorporated in the Six
Sigma Readiness Index that could test an organization’s preparedness for Six Sigma:
leadership & management commitment (36%); communication (12%); education &
training (10%); data collection & performance measurement (9%); employee’s
empowerment (8%) and customer focus (8%). The findings from the table 7.29 and
figure 7.2 would be used in Chapter 9 to design and construct Six Sigma Readiness
Index. The next section summarises the key findings from this chapter.

Maneesh Kumar
Figure 7.2: Six Sigma readiness factor voted by conference delegates
7.6. Summary
The findings from case study analysis clearly demonstrate that Six Sigma can be
implemented successfully i
Company A with 36 employees has managed to implement Six Sigma in its production
processes and have reaped significant benefits since its implementation. Participants
commented on the differences
organizations and negated the existence of links between growth models of SMEs and
implementation of CI initiatives in SMEs. The findings from the first phase of research
matched with the case study findi
and barriers, and performance measurement in the Six Sigma and the non
SMEs. Six Sigma SMEs have not followed any framework for implementation but
accentuated the need for a customized framework
0%
5%
10%
15%
20%
25%
30%
35%
40% 36%
% …
Chapter 7: Case
Six Sigma readiness factor voted by conference delegates
The findings from case study analysis clearly demonstrate that Six Sigma can be
implemented successfully in any organization, irrespective of the size of the company.
with 36 employees has managed to implement Six Sigma in its production
processes and have reaped significant benefits since its implementation. Participants
commented on the differences in the characteristics of SMEs compared with large
organizations and negated the existence of links between growth models of SMEs and
implementation of CI initiatives in SMEs. The findings from the first phase of research
matched with the case study findings in terms of quality management practices, CSFs
and barriers, and performance measurement in the Six Sigma and the non
SMEs. Six Sigma SMEs have not followed any framework for implementation but
accentuated the need for a customized framework tailored to the needs of SMEs.
36%
12%10% 9% 8% 8% 7%
Key ingredients required for Six Sigma implementation
% voted
Chapter 7: Case Study Analysis
271
Six Sigma readiness factor voted by conference delegates
The findings from case study analysis clearly demonstrate that Six Sigma can be
n any organization, irrespective of the size of the company.
with 36 employees has managed to implement Six Sigma in its production
processes and have reaped significant benefits since its implementation. Participants
in the characteristics of SMEs compared with large
organizations and negated the existence of links between growth models of SMEs and
implementation of CI initiatives in SMEs. The findings from the first phase of research
ngs in terms of quality management practices, CSFs
and barriers, and performance measurement in the Six Sigma and the non-Six Sigma
SMEs. Six Sigma SMEs have not followed any framework for implementation but
tailored to the needs of SMEs.
7%5%
3%
Key ingredients required for Six Sigma implementation

Chapter 7: Case Study Analysis
Maneesh Kumar 272
The interviewees in the sample firms agreed that a good foundation of QMS based on
ISO 9000 principles may facilitate implementation of Lean and Six Sigma in SMEs.
SMEs expressed their interest in networking with academic institutions or government
bodies to know more about the funding opportunities or help they can get in improving
their business performance through implementation of Six Sigma. Some of the SSS
were aware of government funding schemes such as knowledge transfer partnership
(KTP), though majority of the SMEs had no clue on how to get government funding or
academic support.
The qualitative data analysis of ten case study firms identified several ‘critical
incidents’ that either facilitated the firm in the implementation of quality initiative(s) or
led to the failure of those quality initiative(s). Understanding of critical incidents may
help an organization to increase their chance of success when implementing any new
CI initiative(s) within their business processes. The critical incidents captured through
interview process in the ten participating firms were listed in table 7.30.
Table 7.30: Critical incidents during implementation of quality initiative(s) in SMEs
Case Study firms
Critical Incidents
A � First attempt to implement Lean failed due to lack of training and employee involvement at shop-floor level
� Secured a partial funding from government body that helped them to implement Six Sigma
� The MD committed resources for next 5 years to deploy Six Sigma across the firm
� Use of train the trainer approach and rotation of team members in Six Sigma project to develop a sustainable organizational infrastructure
� Formation of cross-functional team for Lean / Six Sigma project
� Top-down and bottom-up communication channel established
� Involvement of finance director to quantify the savings generated from Six Sigma projects (The FD was not previously involved in cost-benefit analysis at the start of project)
B � Failed to successfully implement TOC and TQM due to lack of training and employee involvement at shop-floor level, and involvement of project leader in day to day jobs
� Initial Six Sigma training was partially supported by their OEM
� The MD attended GB training and executed a GB project to demonstrate long-term commitment in Six Sigma; this also helped in breaking down resistance to change
� Formation of cross-functional team for Lean / Six Sigma project
� Top-down and bottom-up communication channel established
C � Six Sigma initiative funded by their Parent Company and also supported by government bodies like SMAS
� First attempt to implement Lean failed due to lack of training and employee involvement at shop-floor level; Also initial Six Sigma training was only provided to process Engineer and rest of the staff were alienated to attend the awareness training
� Hoshin Kanri approach failed due to lack management involvement & commitment
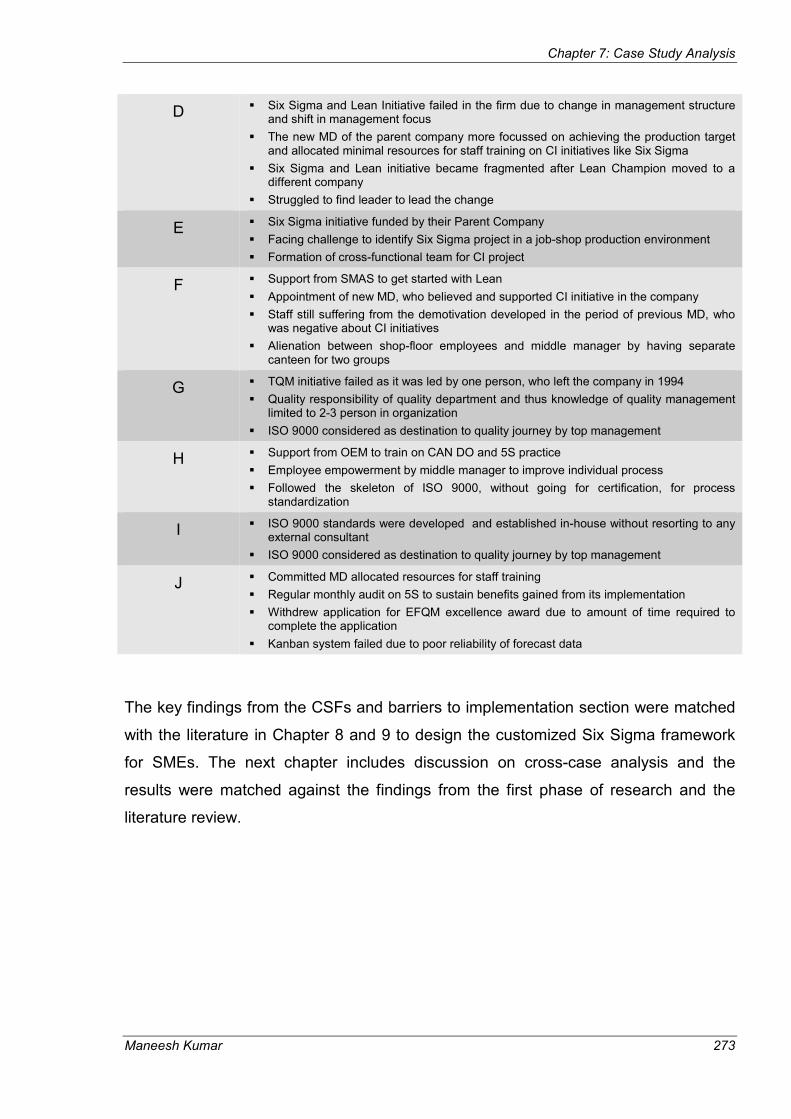
Chapter 7: Case Study Analysis
Maneesh Kumar 273
D � Six Sigma and Lean Initiative failed in the firm due to change in management structure and shift in management focus
� The new MD of the parent company more focussed on achieving the production target and allocated minimal resources for staff training on CI initiatives like Six Sigma
� Six Sigma and Lean initiative became fragmented after Lean Champion moved to a different company
� Struggled to find leader to lead the change
E � Six Sigma initiative funded by their Parent Company
� Facing challenge to identify Six Sigma project in a job-shop production environment
� Formation of cross-functional team for CI project
F � Support from SMAS to get started with Lean
� Appointment of new MD, who believed and supported CI initiative in the company
� Staff still suffering from the demotivation developed in the period of previous MD, who was negative about CI initiatives
� Alienation between shop-floor employees and middle manager by having separate canteen for two groups
G � TQM initiative failed as it was led by one person, who left the company in 1994
� Quality responsibility of quality department and thus knowledge of quality management limited to 2-3 person in organization
� ISO 9000 considered as destination to quality journey by top management
H � Support from OEM to train on CAN DO and 5S practice
� Employee empowerment by middle manager to improve individual process
� Followed the skeleton of ISO 9000, without going for certification, for process standardization
I � ISO 9000 standards were developed and established in-house without resorting to any external consultant
� ISO 9000 considered as destination to quality journey by top management
J � Committed MD allocated resources for staff training
� Regular monthly audit on 5S to sustain benefits gained from its implementation
� Withdrew application for EFQM excellence award due to amount of time required to complete the application
� Kanban system failed due to poor reliability of forecast data
The key findings from the CSFs and barriers to implementation section were matched
with the literature in Chapter 8 and 9 to design the customized Six Sigma framework
for SMEs. The next chapter includes discussion on cross-case analysis and the
results were matched against the findings from the first phase of research and the
literature review.
Chapter 8: Discussion of Key Findings
Maneesh Kumar 274
Chapter 8
Discussion of Key Findings
8.0. Introduction
Chapter 6 and Chapter 7 presented the results from a survey and multiple case
studies in SMEs on their status of Six Sigma implementation. Two clusters of Six
Sigma and non-Six Sigma firms were formed for conducting quantitative and
qualitative analysis (within case analysis of each cluster). This chapter discusses the
findings from the cross-case analysis across two clusters followed by mapping the
findings against the survey results and the literature. Cross-case analysis facilitated in
understanding the evolving patterns across the four research questions listed below:
RQ1: What makes SMEs different from large organizations?
RQ2: What are the critical differences in quality management practices of Six Sigma
and non-Six Sigma SMEs?
RQ3: What are the critical success factors and barriers to implementation of Six
Sigma in SMEs?
RQ4: Does the performance of Six Sigma firms differ from non-Six Sigma firms?
Retrospectively, the literature review findings on the aforementioned questions were
compared and contrasted with the findings from the empirical research. The key
findings from the literature and RQs were combined to address the fifth RQ on Six
Sigma Readiness Index in Chapter 9. The critical differences between the Six Sigma
SMEs (SSS) and the non-Six Sigma SMEs (NSSS) as identified from case study
analysis were reported below.
8.1. SMEs vs. Large Organizations
Interviewees in the 10 case study firms held a common consensus on differences in
characteristics of SMEs compared with their larger counterparts. SMEs were said to
have advantages in their flat structure, faster communication, greater top-down
visibility, and faster decision making process compared to larger firms. Due to the flat

Chapter 8: Discussion of Key Findings
Maneesh Kumar 275
structure of SMEs, the owner/ manager had the understanding of operational issues,
processes, customer needs, and were more involved with the customers, e.g. A, B, C,
and J. The decision making power was vested in 3-4 members of senior management
team that included the owner or the MD of the firm. Middle managers in the small firms
like A, E, and J were responsible for managing more than one departmental function
simultaneously due to limited resources. For example, the Operations Director in A
also acted as HR Manager to identify the training needs of employees. Strategic
activities in some firms like D, I, and J were informal, intuitive, invisible, and often
owed more to a speedy response than to in-depth analysis, matching with findings
from literature (Barnes, 2002; Sum et al., 2004; Beaver and Prince, 2004). The
empirical research clearly identified availability of resources required to bring any
change as the biggest challenge in SMEs compared to large organizations that may
hinder or jeopardize their motivation to embark on the CI journey. The findings from
the literature were in consensus with the case study results on differences in
characteristics of SMEs and large organizations (Greiner, 1972, 1998; Churchill and
Lewis, 1983; Phelps et al., 2007; Ghobadian and Gallear, 1996, 1997; Mitra and
Pingali, 1999; Noci and Toletti, 1998; Yusof and Aspinwall, 2000 a, b; McAdam, 2000;
Youssef et al., 2002; Garengo et al., 2005a,b; Barringer et al.,2005; Deros et al., 2006;
Kumar, 2007; Antony et al., 2005, 2008).
The case study analysis clearly indicated that SMEs were less aware of opportunities
to network with other similar/different businesses, government bodies or academic
institutions. They have minimal knowledge of the support rendered by government
organizations such as the MAS in England, Scotland, Wales and Ireland or the MI.
Networking with academic universities may facilitate knowledge transfer and
enhancement of existing capabilities within the SME (North et al., 2001; Thomas,
2007). Phelps et al (2007) accentuated the role of interventions, internally or
externally, for firms to raise their absorptive capacity and ascend from a state of
ignorance to a state of implementation with respect to factors such as operations
improvement and people management. Local universities play a key role in
disseminating latest technical knowledge to small firms through collaborative
programs such as the Knowledge Transfer Partnerships (KTP), SEEKIT, and SCORE
to name a few. KTP programs between academic institution and industry is an
effective vehicle for enabling the introduction and application of CI initiatives within

Chapter 8: Discussion of Key Findings
Maneesh Kumar 276
SMEs. However, very few SMEs (less than 2%) are acquainted with such schemes
(North et al., 2001; Thomas, 2007). Knowledge of schemes like KTP may alleviate
SMEs concerns and dependability on external consultants for enhancing their process
performance.
A common opinion was held by interviewees in the 10 sample firms that the size of the
organization does not hinder Six Sigma implementation. Though they struggle to
allocate resources for implementing such programs, the benefit outweighs the initial
investment made at the start of program. This was the common opinion shared by
interviewees across the Six Sigma cluster. Interviewees opined that knowledge of
growth models proposed for SMEs in the literature may be beneficial for SME
managers to understand their positioning on different stages of models against the
established criteria for each model. This may further help them to understand the
requirement to move to the next stage in the growth model and whether their existing
capability and working culture will enable to make that transition possible. However,
they said that it would be difficult to decide on the implementation of a CI program,
e.g. making a transition from ISO certification to Lean/ Six Sigma implementation,
depending upon their positioning on the growth model. Similar findings were observed
during the literature review process. Stage models proposed in the past have received
criticism in recent years for being conceptual, descriptive (Phelps et al, 2007; Bessant
et al., 2005), speculatively normative (Gibb and Davies, 1990), and prescriptive in
assuming that all firms grow through a series of predictable phases or preordained
stages.
8.2. Quality Management Practices in SMEs
In the SMEs literature, the most common reason cited for not embarking on
continuous improvement (CI) initiatives like TQM, Lean or Six Sigma was the
availability of resources, commitment from the top management to invest in the
required resources for successful implementation, and considering ISO certification as
a destination to CI efforts (Ghobadian and Gallear, 1996; Wiele and Brown, 1998;
Yusof and Aspinwall, 1999; Terziovski and Samson, 2000; Witcher, 1994; Terziovski
et al., 1997; Davig et al., 2003; Antony et al., 2005, 2008; Kumar, 2007; Thomas et al.,
Chapter 8: Discussion of Key Findings
Maneesh Kumar 277
2009). This study further enriches the literature by providing in-depth information on
the reasons for not implementing Six Sigma.
Findings from the first two phases of this doctoral research indicated that very few
SMEs in the UK are aware of Six Sigma and those implementing Six Sigma have less
than 3-5 years of implementation experience. The common reasons cited in this
empirical research for non-implementation of Six Sigma was lack of awareness of the
system, not sure if relevant, availability of resources to implement Six Sigma, never
heard, and ISO considered as destination to CI journey. Antony et al (2005, 2008) pilot
study on Six Sigma in the UK SMEs also reported the low awareness and
implementation of the Six Sigma initiative in the participating firms. Thus, the exemplar
of best-in-class quality management practices is still evolving in such firms. Even the
NSSS have realised the importance of initiatives like Lean/Six Sigma and have started
investing resources to avail themselves of the benefits derived from the
implementation of such initiatives.
The empirical findings also indicated that SMEs are not implementing EFQM model as
they perceived the model was suitable only for large organizations. The model was
bureaucratic and time consuming, making it difficult for SMEs to allocate scarce
resources for its implementation and follow-up. The literature also reported limited
evidence of success of self-assessment models (e.g. EFQM, AQA. MBNQA) in a SME
environment as these models were bureaucratic, time consuming, required excessive
paperwork, and increased complexity for managers (Watts and Dale, 1999; Wilkes
and Dale, 1998; Hewitt, 1997; Thomas and Webb, 2003). According to the author,
majority of SMEs are at their inception stage of CI journey, where processes are not
standardised, performance metrics are not established, SMEs have limited knowledge
on the usage of CI tools and techniques, to name a few. EFQM is an assessment
model that is effective for organizations that have an established track record of
commitment to CI and compete for EFQM excellence award. It may take few years or
a decade for SMEs to reach the standard where they can think of qualifying for EFQM
excellence award. However, this is not the case for every SME. A and B are the two
firms in the case study sample that rigorously followed the principles of CI and may
qualify for EFQM excellence award. It could be the case that application of EFQM
model in SMEs may grow in popularity in the next five to ten years, when SMEs have
more established QMS, performance metrics, and decisions based on facts and data.
Chapter 8: Discussion of Key Findings
Maneesh Kumar 278
The SSS selected their most talented people across the organization to train on Six
Sigma and execute projects forming a cross-functional team. To develop the bench-
strength for continued sustainability of the Six Sigma program, the team members
were rotated back to their original job after project completion and new members were
included in the cross-functional team to execute the Six Sigma project. This policy
compensated for their scarce human resources as well as facilitated in developing Six
Sigma knowledge team across the organization. The practice of rotation policy
compensated for the scarce resource problem faced by SMEs. This strategy of
rotation policy was not explicitly mentioned in the literature. On the contrary, process/
quality improvement was the responsibility of quality department to a greater extent in
the NSSS. Employees were working in fire-fighting mode in such firms with more
focus on targets and deadlines to meet rather than improving the quality of product
and services delivered to its customer (Ghobadian and Gallear, 1996, 1997; Yusof
and Aspinwall, 2000b; Antony et al., 2005). Employees in SSS (except company D)
were empowered to take decisions for improving their processes. A blame and fear
culture presence was minimal in the participating SSS. The decision making power in
the NSSS was entrusted to middle-level managers or supervisors.
Six Sigma should not be introduced when a company is going through a restructuring
process, e.g. merger, change in management, and downsizing. It was also suggested
that if a company is planning for redundancy of employees, it should be done before
the introduction of any change program. Otherwise if employees are made redundant
after implementation of initiatives like Six Sigma, it will leave a poor image in the eyes
of the employees leading to greater resistance to change.
The SSS were more conversant with the usage/benefits of basic tools of CI,
management tools, and tools within OTT category compared to the NSSS, where
knowledge of tools and techniques of CI was very limited. Though, the knowledge and
usage of tools and techniques of CI was better in the SSS compared to the NSSS,
they still are far behind in using tools within OTT category compared to many large
organizations. The state of knowledge and usage of tools and techniques of CI in the
case study firms is depicted in the figure 8.1 and figure 8.2. Similar findings were
observed in the literature when comparing the tools and techniques usage of TQM
firms against non-TQM firms (Yusof and Aspinwall, 2000 a, b, c; Ghobadian, 1996,
1997; Spencer and Loomba, 2001; Davig et al., 2003; Sousa et al., 2005, 2006;

Chapter 8: Discussion of Key Findings
Maneesh Kumar 279
Thomas et al., 2009). Basic tools of quality such as process maps, graphs, check
sheets, and Pareto charts were reported as the most commonly used tools in SMEs.
SMEs struggled to use complex tools and techniques of CI such as SPC, DoE, and
FMEA to name a few. Ahmed and Hassan (2002) also revealed that tools and
techniques application are more prevalent in TQM SMEs compared to non-TQM
SMEs.
Figure 8.1: Usage of basic tools Figure 8.2: Usage of tools within OTT category
The literature also revealed that management in small firms lack theoretical
knowledge on the application of statistical tools to resolve problems and fear of
statistics was restraining them from embracing tools and techniques that can have
significant affect on SMEs performance (Thomas et al., 2009; Sousa et al., 2005,
2006; Spencer and Loomba, 2001; Davig et al., 2003).
In spite of the critical differences between the SSS and the NSSS, interviewees and
practitioners held a common viewpoint on the role of the ISO 9000 in establishing
formal procedures and systems before embarking on Lean or Six Sigma. The findings
from this study gave an indication, similar to findings from the literature (Gotzamani,
2004; Gotzamani and Tsiotras, 2002; Soltani and Lai, 2007; Taormina, 2002;
Terziovski et al., 1997; Taylor, 1995; Russell, 2000; Coleman and Douglas, 2003;
Kanji, 1998), that ISO (or any system that establishes procedures and discipline in the
workplace) may be the foundation or building block to embark on the Lean / Six Sigma
journey. Interviewees believed that if a firm already had established system,
LOW HIGH
LOW
HIGH
KNOWLEDGE
U
S
A
G
E
LOW HIGH
LOW
HIGH
KNOWLEDGE
U
S
A
G
E
All SMEs lie
in this zone
G
H F
I
J D
E
A
C
= SS = NSS
B

Chapter 8: Discussion of Key Findings
Maneesh Kumar 280
procedures, and data collection strategies in place, they do not need ISO certification
but can follow the guiding principles that may aid the implementation of Six Sigma.
The literature also indicated a similar trend - If a company had religiously followed the
basic principle of ISO 9000 and developed procedures as prescribed in the standard,
there was no need for certification [provided there is no pressure from key customers](
McTeer and Dale, 1996). Stated by Yusof and Aspinwall (2000b) and supported by the
findings of this study – “Companies do not have to attain ISO 9000 certification if they
fully understand the true nature of a good quality assurance system”. Findings from
the first two phases and the literature also indicated the use of Lean for the first round
of improvement and quick wins in SMEs (Achanga et al., 2006). This will facilitate in
breaking down employee resistance to change. Based on aforementioned findings,
the author is also proposing to use QMS for process standardizations, followed by
Lean implementation before embarking on the Six Sigma journey, as shown in figure
8.3. However, this proposition should be treated cautiously and tested in further
research.
Figure 8.3: The role of QMS and Lean to facilitate Six Sigma implementation in SMEs
It was emphasized that it is necessary to understand the history of quality initiatives in
the company before embarking on any change program. Knowledge of success or
failure of past initiatives will have an effect on the success of any new initiative
introduced in the company. Moreover, it will help to understand the role of leadership
Critical Success
Factors of
Continuous
Improvement
L
E
A
N
L
E
A
N
SIX SIGMA
A well designed quality
management system (QMS)
Chapter 8: Discussion of Key Findings
Maneesh Kumar 281
and culture of the company by reviewing its quality history of the company. Leadership
and senior management commitment is paramount for the success of any CI initiatives
(Yusof and Aspinwall, 1999; Antony et al., 2005; Kumar, 2007).
SMEs expressed interest in networking/ collaboration with academic institutions or
government bodies to know more about funding opportunities or for help in improving
their business performance through implementation of Six Sigma. Some of the SSS
were aware of government funding schemes through bodies such as MI, SMAS, and
MAS, though the majority of SMEs had little idea of how to obtain government funding
or academic support. No specific framework or model was followed in the participating
firms to facilitate Six Sigma implementation. Six Sigma was rolled out in firms with the
help of government funding, or OEM support, or pressure from the parent company.
However, firms agreed to the fact that a guiding principle in the form of a framework
may facilitate implementation of Six Sigma and sustain its benefit on a long-term
basis. The most frequent reason cited in the literature for the failure of business
improvement methodology was the wrong implementation approach (Deros et al.,
2006). This was the reason why many researchers have emphasized the need to
design structured framework for problem solving (Davies and Kochhar, 2000; Goh and
Ridgway, 1994). Some the reasons why an implementation framework is needed are:
• It provides a focus on the objective to be achieved and links the change
management initiative to business objectives (Davies and Kochhar, 2000)
• It minimizes fire fighting and provides a guideline or structure that is easy to
understand, efficient, and can be implemented at reasonable cost and time
(Deros et al., 2006; Davies and Kochhar, 2000 )
• It forces the management to address a substantial list of key issues which
otherwise might not be addressed (Aalbregtse et al., 1991)
• It also provides an avenue for managers who are interested and enthusiastic in
quality improvement to provide essential leadership for the change initiative
agenda (Arya and Callaly, 2005)
• It facilitates the unification of several disciplines in the change process
(Mathaisel, 2005)

Chapter 8: Discussion of Key Findings
Maneesh Kumar 282
There are limited models / frameworks in quality management literature proposed for
TQM/ Lean/ Six Sigma implementation in SMEs compared to large organizations.
Even some of the existing quality frameworks/models on SMEs ignored the discussion
on how SMEs with their limited resources can opertionalize the frameworks/models.
The literature and empirical findings strongly support the need to design a customized
framework tailored to the needs of SMEs to ensure successful implementation and
sustainability of the initiative (Ghobadian and Gallear, 1997; Wilkes and Dale, 1998;
Yusof and Aspinwall, 2000c; Tannock et al., 2002). The author proposes a
customized Six Sigma framework for SMEs (discussed in Chapter 9) based on the
findings from empirical research and grounded in literature.
8.3. Critical Success factors and Barriers
Common opinion was shared by the SSS and the NSSS with regards to listing of
factors critical to the success of CI initiatives or certification systems. Strong
leadership, management commitment, communication, education and training,
measurement and data collection, and customer focus were considered critical in
driving any change within SMEs. Strong Leadership and management commitment
was considered as the most important factor to drive CI efforts in a SME environment
as all the powers are vested in the hands of MD/owner of the firm. If they are
convinced of the benefits of initiatives like Six Sigma (as observed in company A and
B), it is much easier to break down any stumbling blocks or resistance to change by
employees. The greater presence of these attributes in firms, irrespective of the type
of initiatives in firms, was driving the positive change in their quality management
practices.
Similar findings were reported from the first phase of the study. The mean score of the
SSS and the NSSS across the 13 CSFs were very similar and statistically
insignificant. It was further deduced that these CSFs are equally important for firms
implementing any type of change management program such as Six Sigma, Lean, or
certification system such as ISO 9000. However, when it comes to application of these
CSFs within the firms, statistically significant results were observed in the sample
firms. At this juncture, it may be fair to say that those firms applying the CSFs within
their day to day job had a better quality culture than firms struggling to implement the
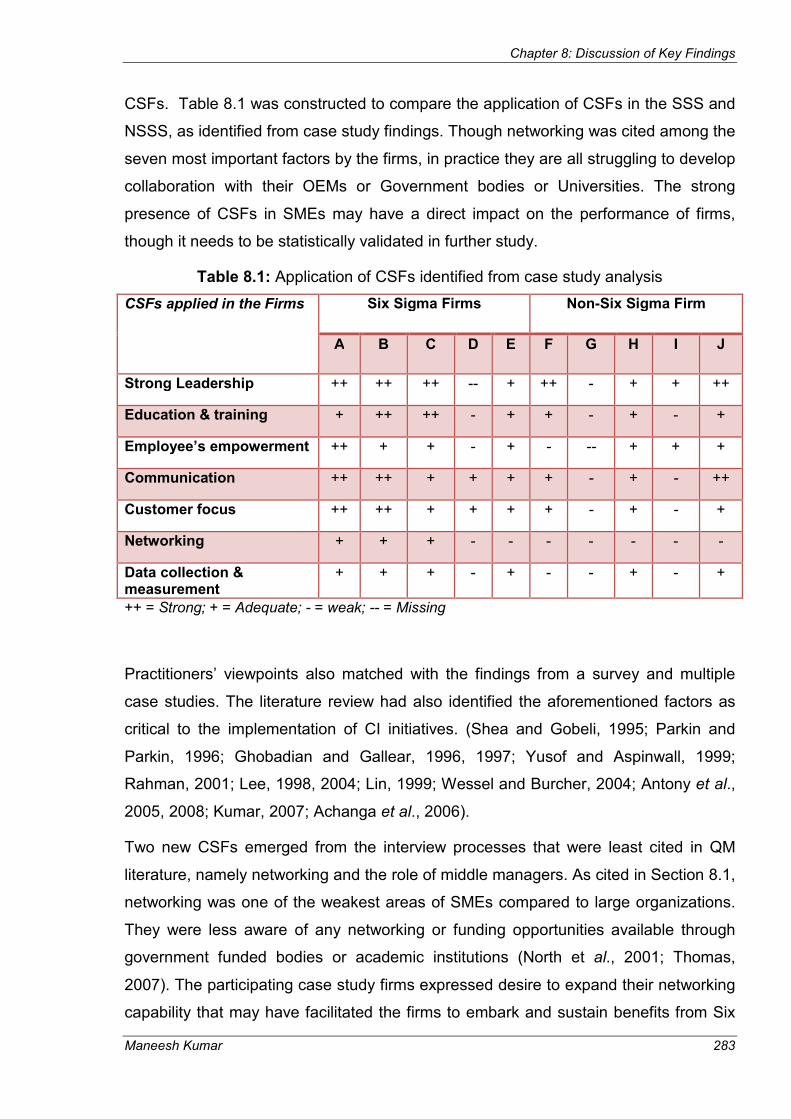
Chapter 8: Discussion of Key Findings
Maneesh Kumar 283
CSFs. Table 8.1 was constructed to compare the application of CSFs in the SSS and
NSSS, as identified from case study findings. Though networking was cited among the
seven most important factors by the firms, in practice they are all struggling to develop
collaboration with their OEMs or Government bodies or Universities. The strong
presence of CSFs in SMEs may have a direct impact on the performance of firms,
though it needs to be statistically validated in further study.
Table 8.1: Application of CSFs identified from case study analysis
CSFs applied in the Firms Six Sigma Firms Non-Six Sigma Firm
A B C D E F G H I J
Strong Leadership ++ ++ ++ -- + ++ - + + ++
Education & training + ++ ++ - + + - + - +
Employee’s empowerment ++ + + - + - -- + + +
Communication ++ ++ + + + + - + - ++
Customer focus ++ ++ + + + + - + - +
Networking + + + - - - - - - -
Data collection & measurement
+ + + - + - - + - +
++ = Strong; + = Adequate; - = weak; -- = Missing
Practitioners’ viewpoints also matched with the findings from a survey and multiple
case studies. The literature review had also identified the aforementioned factors as
critical to the implementation of CI initiatives. (Shea and Gobeli, 1995; Parkin and
Parkin, 1996; Ghobadian and Gallear, 1996, 1997; Yusof and Aspinwall, 1999;
Rahman, 2001; Lee, 1998, 2004; Lin, 1999; Wessel and Burcher, 2004; Antony et al.,
2005, 2008; Kumar, 2007; Achanga et al., 2006).
Two new CSFs emerged from the interview processes that were least cited in QM
literature, namely networking and the role of middle managers. As cited in Section 8.1,
networking was one of the weakest areas of SMEs compared to large organizations.
They were less aware of any networking or funding opportunities available through
government funded bodies or academic institutions (North et al., 2001; Thomas,
2007). The participating case study firms expressed desire to expand their networking
capability that may have facilitated the firms to embark and sustain benefits from Six

Chapter 8: Discussion of Key Findings
Maneesh Kumar 284
Sigma implementation. The role of middle managers in leading and supporting the
change was also identified as critical to the success of CI initiatives in SMEs. This
factor was identified by the author while conducting a pilot case study on Six Sigma
implementation in a SME (Kumar, 2007).
It was interesting to observe that CSFs identified from empirical research on Six
Sigma in SMEs matched with the CSFs proposed for the growth of small businesses
in Chapter 2 ((Mitra and Pingali, 1999; Shim et al., 2000; Barringer et al., 2005; Phelps
et al., 2007; Ostgaard and Birley, 1994; Barbosa and Fuller, 2007; Mazzarol, 2007;
Chen and Huang, 2004). Factors such as leadership, management style, customer
focus, systems and procedures, human resource management, and networking were
cited both in empirical research and literature on the small business growth. It gives an
indication that firms that are growing and which possess the aforementioned factors
are ready to embark on the CI journey of Lean or Six Sigma. Thus, the knowledge of
state model proposed by Phelps et al (2007) may facilitate SMEs to judge their
positioning on the model and thereby take decisions for external intervention to
acquire knowledge on CI initiatives such as Six Sigma.
Scarcity of resources was cited as the most common impeding factor in making the
change happen across the sample firms followed by middle-managers role,
commitment from senior management team, change in management structure, and
poor training and coaching. However, interviewees and practitioners viewed scarcity of
resources as an excuse by top management for not implementing or dedicating
resources to the CI effort in the firm. The benefits realised by Companies A, B, and C
after implementation of Six Sigma had surpassed the investment made at the initial
stages of implementation. The literature review process also identified similar barriers
to the implementation of CI initiatives in SMEs, namely: resource constraint, lack of
senior management commitment, lack of education and training of employees, lack of
understanding of CI program, to name a few (Moreno-Luzon, 1993; Lee and Oakes,
1995; Haksever, 1996; Parkin and Parkin, 1996; Ghobadian and Gallear, 1996, 1997;
Yusof and Aspinwall, 1999; Lee, 2004; Antony et al., 2005, 2008; Kumar, 2007).
The survey result does not cite top management commitment as one of the top five
impeding factors, whereas case study findings indicated lack of senior management
commitment as one of the barriers to embark on a CI journey. It is difficult in a SME to
get started with any change management initiative or sustain the efforts without the

Chapter 8: Discussion of Key Findings
Maneesh Kumar 285
commitment from the top management, as was observed in company D, G, and I.
Company D struggled to sustain the initial benefits realised from Six Sigma
implementation due to change in management structure and focus of senior
management team.
It is imperative for SMEs to have a strong management commitment and good
leadership skills before embarking on the Six Sigma programme. If Six Sigma is only
considered as the implementation of statistical tools and techniques to solve complex
problems in the organization, it is doomed to fail due to its very weak linkage to
strategic business objectives. Six Sigma is about overall business strategy, culture
and change, and small companies embarking on the Six Sigma initiative need to build
all of this into a sound corporate strategy plan (Antony, 2008b; Kumar et al., 2008).
8.4. Impact on Organizational Performance
The existence of metrics for core business processes and decisions based on fact
were the key features in the SSS compared to the NSSS, though such metrics are still
evolving in the SSS. Significant differences in performance were observed during case
analysis of the SSS and the NSSS. The SSS performance in operational metrics [such
as scrap rate, cycle time, on-time delivery, and yield] and strategic metrics [such as
sales, profit, customer satisfaction] outweighed those achieved by the NSSS. Each Six
Sigma project was linked to bottom-line savings, though initially SSS struggled to
quantify the benefits realised from implementation of the program. Recent involvement
of executives from the accounting and finance department to carry out cost-benefit
analysis of Six Sigma projects had resolved the issue of hard-dollar quantification from
Six Sigma projects. No such steps were taken in the NSSS.
The empirical findings also indicated that Six Sigma metrics like COPQ was still an
unexplored area in a SME environment. The definitions of quality-related costs are in
fairly specious terms in SMEs. As said by Dale et al (2007), COPQ constitutes
between 5-25% of the company’s annual sales turnover or operating costs. Though
this figure was established in researching large organizations, but still if SMEs are
losing 10-15% of their sales due to COPQ it would be difficult for them to remain
competitive in the global environment. Moreover, they cannot afford to lose money as
they already have resource constraints.
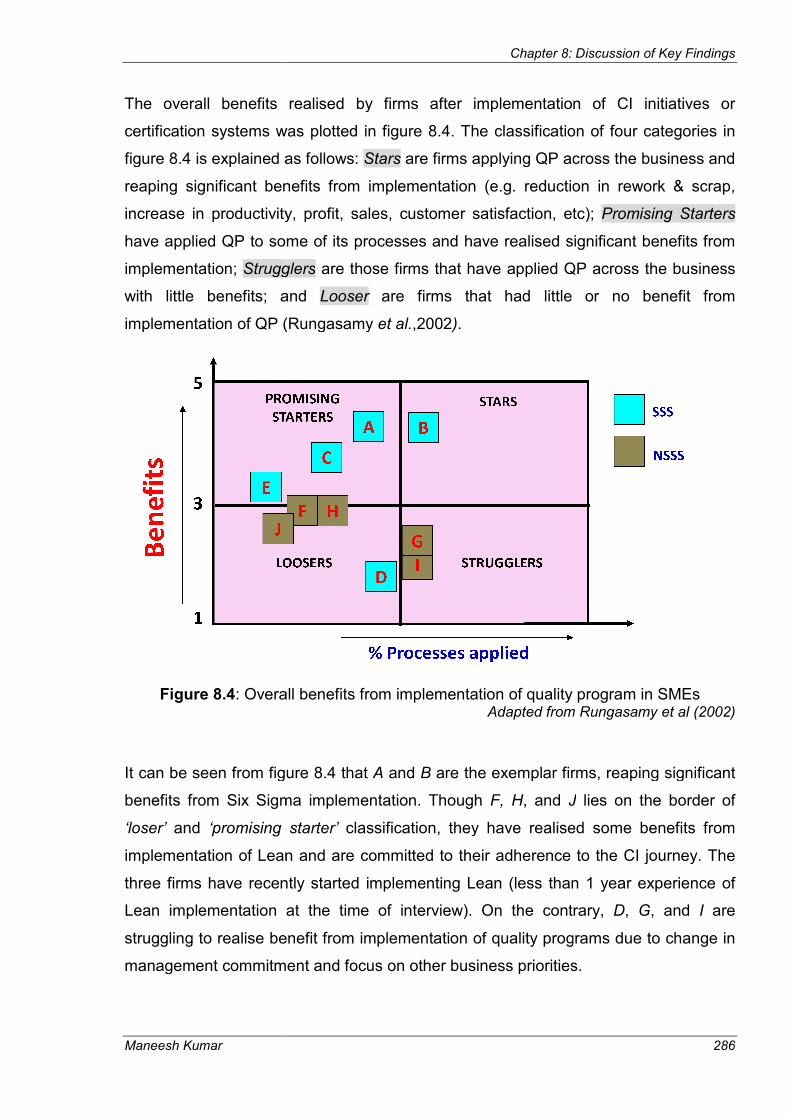
Maneesh Kumar
The overall benefits realised by firms after implementation of CI initiatives or
certification systems was plotted in figure 8.4. The classification of four categories in
figure 8.4 is explained as follows:
reaping significant benefits from implementation (e.g. reduction in rework & scrap,
increase in productivity, profit, sales, customer satisfaction, etc);
have applied QP to some of its processes and
implementation; Strugglers
with little benefits; and
implementation of QP (Rungasamy
Figure 8.4: Overall benefits from implementation of quality program in SMEs
It can be seen from figure 8.4 that
benefits from Six Sigma implementation. Though
‘loser’ and ‘promising starter’
implementation of Lean and are committed to their adherence to the CI journey. The
three firms have recently started implementing Lean (less than 1
Lean implementation at the time of interview). On the contrary,
struggling to realise benefit from implementation of quality programs due to change in
management commitment and focus on other business priorities.
Chapter 8: Discussion of Key Findings
The overall benefits realised by firms after implementation of CI initiatives or
certification systems was plotted in figure 8.4. The classification of four categories in
figure 8.4 is explained as follows: Stars are firms applying QP across the business and
reaping significant benefits from implementation (e.g. reduction in rework & scrap,
increase in productivity, profit, sales, customer satisfaction, etc);
have applied QP to some of its processes and have realised significant benefits from
Strugglers are those firms that have applied QP across the business
with little benefits; and Looser are firms that had little or no benefit from
implementation of QP (Rungasamy et al.,2002).
: Overall benefits from implementation of quality program in SMEsAdapted from Rungasamy
It can be seen from figure 8.4 that A and B are the exemplar firms, reaping significant
benefits from Six Sigma implementation. Though F, H, and J
‘promising starter’ classification, they have realised some benefits from
implementation of Lean and are committed to their adherence to the CI journey. The
three firms have recently started implementing Lean (less than 1
Lean implementation at the time of interview). On the contrary,
struggling to realise benefit from implementation of quality programs due to change in
management commitment and focus on other business priorities.
Chapter 8: Discussion of Key Findings
286
The overall benefits realised by firms after implementation of CI initiatives or
certification systems was plotted in figure 8.4. The classification of four categories in
ms applying QP across the business and
reaping significant benefits from implementation (e.g. reduction in rework & scrap,
increase in productivity, profit, sales, customer satisfaction, etc); Promising Starters
have realised significant benefits from
are those firms that have applied QP across the business
are firms that had little or no benefit from
: Overall benefits from implementation of quality program in SMEs Adapted from Rungasamy et al (2002)
are the exemplar firms, reaping significant
J lies on the border of
classification, they have realised some benefits from
implementation of Lean and are committed to their adherence to the CI journey. The
three firms have recently started implementing Lean (less than 1 year experience of
Lean implementation at the time of interview). On the contrary, D, G, and I are
struggling to realise benefit from implementation of quality programs due to change in
management commitment and focus on other business priorities.

Chapter 8: Discussion of Key Findings
Maneesh Kumar 287
In the NSSS category, SMEs (company F, H, and J) realised some improvement in
the hard and soft metrics (listed in table 7.23) after implementation of Lean. The visual
tools and techniques of Lean (5S and Kanban) were easily understood by shop-floor
employees and were being used to improve their process performance. Involvement
of shop-floor employees during Lean implementation facilitated in breaking down any
resistance to change, lifted staff morale, the psychological aspect of employees
became more positive, and helped to promote the culture of CI. Common opinion was
voiced in the SSS and the NSSS to use Lean for the first round of improvements and
quick gains before embarking on the Six Sigma journey. Both the SSS and the NSSS
have realised quick and visible benefits from the Lean implementation.
The benefits realised in the 5 NSSS were not the result of ISO 9000 certification, as
commented by the interviewees. The improvement was achieved through their close
proximity with key customers and addressing their concerns on an immediate basis.
The findings from the survey were very similar to results obtained from case study
analysis. The NSSS in the first phase mostly included SMEs having ISO 9000
certification. Significant statistical differences were observed in performance
improvement of firms after implementation of Six Sigma compared to post
implementation of other quality initiatives/ certification system in SMEs.
The literature in the past was devoid of any research comparing the performance of
Six Sigma and non-Six Sigma SMEs. Researchers have focused on measuring and
comparing the performance of TQM SMEs against non-TQM SMEs. TQM SMEs
outperformed non-TQM SMEs with regards to established performance metrics used
by the firms (Lee, 2004; Sousa et al., 2005, 2006; Beheshti and Lollar, 2003; Jones et
al, 2005; Prajogo and Brown, 2006; Sohail and Hoong, 2003). Mixed results were
observed on the contribution of ISO 9000 in improving firms performance (Ahire et al.,
1996; Tsiotras and Gotzamani, 1995; McAdam and McKeown, 1999; Gotzamani,
2004; Gotzamani and Tsiotras, 2002; Sohail and Hoong, 2003; Rahman, 2001a;
Taylor and Wright, 2003). For example, Sohail and Hoong (2003) observed a positive
impact of TQM on performance of ISO certified firms as compared to non-certified
firms. On the contrary, Rahman (2001a) and Taylor and Wright (2003) study revealed
no difference in the performance of firms with and without certification.
The practitioner interviews also indicated improvement in bottom-line results as
observed in Lean/Six Sigma SMEs through increase in productivity, decrease in scrap

Chapter 8: Discussion of Key Findings
Maneesh Kumar 288
rate and rework. Increase in customer satisfaction, employee satisfaction, fact based
decision making, and enhanced employee retention rate were typical softer savings
realised in Lean Six Sigma SMEs. The financial measures were reported as the widely
used metrics in comparison to soft factors in SMEs to monitor organizational
performance. This finding was in consensus with the literature (Sousa et al., 2005,
2006; Davig et al., 2003; Lee, 2004; Lewis et al., 2006).
8.5. Summary
The author in this doctoral research demystifies the myth – Six Sigma works only in
large organizations, by investigating into application of Six Sigma in the UK SMEs and
presenting the benefits realised by SMEs from successful implementation of Six
Sigma. No doubt deploying Six Sigma will cost organization some money and time,
but it will be worth expending time, money and effort to achieve real measurable
financial results. Organizations face myriad of problems in their day to day functions.
Six Sigma can be applied where there is a problem, irrespective of type or size of
business (Brue, 2006). Six Sigma can act as a catalyst for changing SMEs in the
quest for business excellence by mobilising their intellectual capital, provided there is
total commitment.
This chapter critically analyzed the key findings from the empirical research with the
results reported from the literature review process. The discussion was based on the
four research questions established in Chapter 1. The flat structure of SMEs promote
faster decision making, faster communication, and greater top-down visibility that
makes implementation of CI easier in SMEs compared to large organizations. It was
reported from empirical research that it was difficult to decide upon the implementation
of CI initiatives based on the firm position on the growth models proposed for small
businesses. The quality management practices in the SSS were more established and
prevalent as compared to the NSSS. Based on empirical findings and literature
comparison, ISO 9000 or a similar QMS system was proposed to be the foundation for
Six Sigma implementation. However, such propositions need to be statistically
validated in further study. Strong leadership and management commitment were
identified as the most important CSFs for implementing any change in organizations.
Networking and role of middle managers were identified as two new CSFs from this

Chapter 8: Discussion of Key Findings
Maneesh Kumar 289
study which had limited citation in the quality management literature on SMEs. All the
SMEs faced the challenge of limited resources to implement initiatives like Lean and
Six Sigma. The need for a Six Sigma framework for SMEs was accentuated in the
empirical research as well as supported by the literature.
The critical differences between SSS and NSSS as identified from cross- case study
analysis were reported below.
� Six Sigma firms were more conversant with the usage of basic and advanced
tools of CI for problem solving compared to NSSS, where knowledge of tools of
CI was very limited.
� SSS selected their best talented people across the organization to train on Six
Sigma and execute projects by forming a cross-functional team. Process
improvement was the responsibility of quality department in NSSS.
� Strong leadership, management commitment, communication, education and
training, measurement and data collection, and customer focus were
considered critical in driving any change within SMEs. These attributes were
driving the positive change in the SSS, which was missing or had limited
presence in NSSS
� Each Six Sigma project was linked to the bottom-line savings. Also people
from the finance department were involved to carry out the cost-benefit analysis
before embarking on any Six Sigma project. No such steps were taken in
NSSS.
� SSS performance in operational metrics [such as scrap rate, cycle time, on-
time delivery, and yield] and strategic metrics [such as sales, profit, customer
satisfaction] outweighed those achieved by NSSS.
� Existence of metrics for core business processes and decisions based on fact
were the key features in SSS.
The details of construction of the readiness index and development of the Six Sigma
framework were provided in the next chapter, i.e. Chapter 9. The index and framework
were developed by comparing the findings from the empirical research against the
literature.
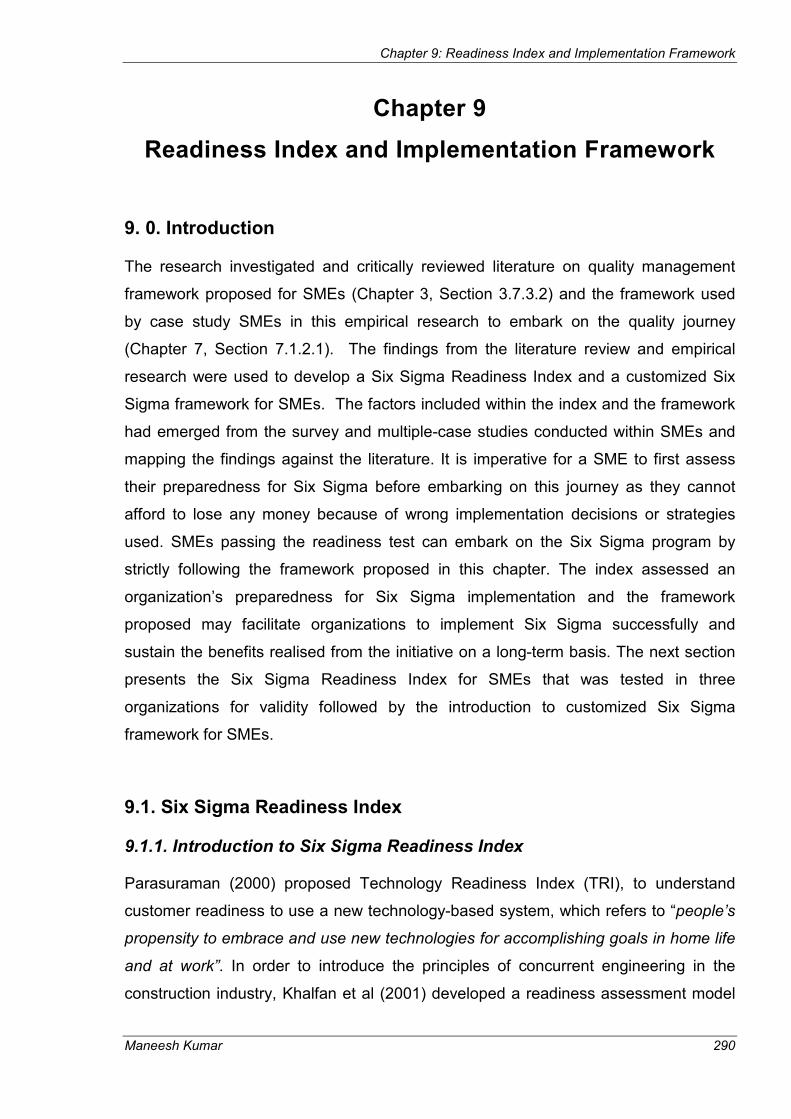
Chapter 9: Readiness Index and Implementation Framework
Maneesh Kumar 290
Chapter 9
Readiness Index and Implementation Framework
9. 0. Introduction
The research investigated and critically reviewed literature on quality management
framework proposed for SMEs (Chapter 3, Section 3.7.3.2) and the framework used
by case study SMEs in this empirical research to embark on the quality journey
(Chapter 7, Section 7.1.2.1). The findings from the literature review and empirical
research were used to develop a Six Sigma Readiness Index and a customized Six
Sigma framework for SMEs. The factors included within the index and the framework
had emerged from the survey and multiple-case studies conducted within SMEs and
mapping the findings against the literature. It is imperative for a SME to first assess
their preparedness for Six Sigma before embarking on this journey as they cannot
afford to lose any money because of wrong implementation decisions or strategies
used. SMEs passing the readiness test can embark on the Six Sigma program by
strictly following the framework proposed in this chapter. The index assessed an
organization’s preparedness for Six Sigma implementation and the framework
proposed may facilitate organizations to implement Six Sigma successfully and
sustain the benefits realised from the initiative on a long-term basis. The next section
presents the Six Sigma Readiness Index for SMEs that was tested in three
organizations for validity followed by the introduction to customized Six Sigma
framework for SMEs.
9.1. Six Sigma Readiness Index
9.1.1. Introduction to Six Sigma Readiness Index
Parasuraman (2000) proposed Technology Readiness Index (TRI), to understand
customer readiness to use a new technology-based system, which refers to “people’s
propensity to embrace and use new technologies for accomplishing goals in home life
and at work”. In order to introduce the principles of concurrent engineering in the
construction industry, Khalfan et al (2001) developed a readiness assessment model

Chapter 9: Readiness Index and Implementation Framework
Maneesh Kumar 291
to investigate the extent of organizational readiness to embrace concurrent
engineering and to identify the risk involved in its implementation within the company.
Oakland and Tanner (2007) comment on the importance of assessing the readiness
for change – “The experiences of many organizations that have launched change
programs such as Six Sigma, is that the first part- readiness- is not at all well
understood or developed”. The readiness index identifies the criteria that should be in
place before Six Sigma implementation begins; the framework incorporates criteria
that would ensure the successful implementation of Six Sigma and sustain the
momentum, and benefit realised over longer period. Taking cue from the
aforementioned research, the author defines Six Sigma Readiness Index (SSRI) for
SMEs as ‘the extent of SMEs preparedness for the introduction of Six Sigma. It
is also a way of assessing the degree to which the organization’s present values
are congruent with the values needed in a Six Sigma organization’. The purpose
of the index was to assess the level of quality management practices observed in the
past within an organization while implementing initiatives like TQM, Lean or ISO.
Assessment of a firm’s preparedness for Six Sigma was only possible by reflecting on
their past quality management practices, e.g. leadership commitment/people
management / process management to name a few, and measuring the success
/failure of those initiatives with respect to the factors listed above. The measurement
and monitoring of criteria would facilitate smoother implementation (without disruption)
of Six Sigma across the organization.
9.1.2. Criteria to measure the Six Sigma Readiness Index
The answer to the RQ5 on SSRI was developed by understanding the characteristics
of SMEs, Six Sigma, and maturity models and comparing the findings from empirical
research with the literature. The interviewees in the SSS were only asked (NSSS were
not asked due to their lack of experience in implementing Six Sigma) to cite the key
ingredients required by SMEs as a prerequisite to embark on the Six Sigma journey.
The factors identified (from case studies) as necessary to be present in a firm to
facilitate smoother implementation of Six Sigma were – leadership style,
communication, established systems and procedures, resources and skills, and
culture change. The Readiness factors identified from voting of delegates in a Six

Chapter 9: Readiness Index and Implementation Framework
Maneesh Kumar 292
Sigma conference were: leadership and management commitment, communication,
education and training, data collection and performance measurement, employee
empowerment, and customer focus.
It was imperative at this stage to compare the findings of empirical research with the
existing CI maturity models to identify the commonalities and differences in key factors
and their variables included in the existing models. The most common factors
appearing across the three quality awards (MBNQA, EQA, and AQA) were leadership,
people management, process management, and customer focus / satisfaction (Davies
et al., 1996; Wiele and Brown, 1999; Wiele et al., 1996; Ritchie and Dale, 2000;
Ghobadian and Woo, 1996). Nonetheless, it was argued that such quality awards
were not suited for firms beginning with the TQM journey (Yusof and Aspinwall,
2000a; Hansson and Klefsjo, 2003). The applicability of such models within SMEs
context was also questionable (Thomas and Webb, 2003; Wilkes and Dale, 1998;
Watts and Dale, 1999; Hewitt, 1997).
The review of the most popular CI maturity models gave information on the journey of
an organization to excellence in different stages and how they can build an
organizational culture based on the facets of TQM (Kaye and Dyason, 1995; Lascelles
and Dale, 1991; Dale and Lascelles, 1997; Dale and Smith, 1997; Dale et al., 1997;
Bessant and Caffyn, 1997; Bessant et al., 2001). Typical characteristics exhibited by
firms at level 4 in Dale and Lascelles (1997) and level 5 in Dale and Smith (1997)
included emergence of leadership culture with few champions to lead TQM
implementation (TQM accepted by all employees); long-term companywide education
and training program; cross-functional team leading process improvement across
organizations; organizational culture based on trust, reward and recognition, and
employee involvement; proactive quality management system; and benchmarking
data used to facilitate improvement activities. The characteristics of organizations
were similar to era three of the Kaye and Dyason (1995) model or level 3 of the
Bessant et al (2001) model.
Firms meeting the requirement of era four of the Kaye and Dyason (1995) model were
way ahead in their CI journey to excellence. This may be the ideal condition for firms
to implement Six Sigma, where quality is integrated within the business plan,
employees are empowered to take decisions, business results are reviewed against

Chapter 9: Readiness Index and Implementation Framework
Maneesh Kumar 293
objectives, and use of customer feedback to formulate the firm’s strategy and its
impact on society was also evaluated. Even achieving at least the characteristics of
era 3 in the Kaye and Dyason (1995) model or level 4 in the Dale and Lascelles
(1997) or level 5 in the Dale and Smith (1997) or level 3 in the Bessant et al (2001)
model, which is not very common in many SMEs, may facilitate the firm in the
implementation of Six Sigma (though this is not guaranteed if the leaders have no
desire to move to the next era). These characteristics indicate organizational
readiness to embark on initiatives like Six Sigma, as it matches the characteristics of
Six Sigma, as evidenced in the literature (Chapter 3, section 3.2).
The readiness factors identified through interviews and voting in Section 7.5 were
compared with the literature to construct the Six Sigma Readiness Index (SSRI). The
five most common factors cited by empirical research and literature review of CI
maturity models were- Leadership; Customer Focus; Measurement and Process;
System and Control; and People Management. The key variables stated within the
aforementioned stages of the CI maturity model were included within the five factors of
the readiness index. The variables included within each factor are presented in table
9.1 and a detailed questionnaire on Readiness Index was attached in the Appendix IV.
Established criteria for the SSRI aim to measure the organizational practices in the
past to ascertain their status on the CI journey and understand the role played by
leadership teams in driving the CI activities across the organizations.
� Leadership – included discussion on the CEO/MD involvement in the past in
leading CI initiatives across the organization; including CI within the strategic
objectives of the business; communicating the organization’s vision and mission
statement vertically down the organization; allocating resources and breaking
down stumbling blocks to facilitate implementation; recognition and reward of
employees involved in successful CI projects
� Customer Focus – includes variables such as an organization’s commitment in
meeting customer expectations; giving customers priority over internal policies;
and understanding value-added activities from the customer perspective
� Measurement and process – decisions based on facts and data; all key
processes documented; existence of internal and external performance
measures; understanding of basic tools of CI. A well-defined objective and

Chapter 9: Readiness Index and Implementation Framework
Maneesh Kumar 294
quantified metrics established to measure the outcome from an intervention is a
prerequisite for successful change (Oakland and Tanner, 2006, 2007; Shia and
Saad, 2008). Any CI process is based on the basic foundations of data and
information (Yusof and Aspinwall, 2000a). The established metrics, tied to the
business bottom-line, will help in monitoring the change (before and after
outcome) in the process from an intervention such as Lean or Six Sigma.
� Systems and Control – prevention based system; problem-solving infrastructure
in place; proactive quality management system; ISO or Lean as a foundation to
have established procedures and non-value added activities identified; effective
communication system; cross-functional team
� People Management – training and development needs of employees identified;
employees accountable for their processes; discouragement of blame culture;
involvement of all employees in CI activities
Table 9.1: The key constituents of Six Sigma Readiness Index
Criteria/ Precepts to measure Readiness Index
Leadership
L1- Visible involvement and continued commitment in leading companywide quality initiatives in the past (e.g. being available to speak to staff, operating an ‘open door’ policy, walk the floor, holding briefing and feedback meetings) L2- Understands and supported continuous improvement (CI) in the past by provision of appropriate resources, assistance, and breaking down stumbling blocks L3- Effectively communicated vision and mission, long-term quality goals and objectives vertically down the organization to achieve quality excellence
L4- CI within the top business priority and strategically linked to business goals
L5- Recognised and appreciated the efforts and success of individuals and teams Measurement and Processes
M1- All major business processes identified and documented (using flowcharts or process mapping techniques) M2- Key internal and external performance measures identified, defined, and developed
M3- Basic tools of CI understood and used by employees for problem solving
M4- Operations and decisions based on fact and data
M5- Performance indicators monitored, displayed and communicated through debriefing sessions, intranet, and bulletin boards on a continuous basis
People Management P1- Employee’s knowledge and competencies linked to training & development strategies, and career progression identified, developed, and sustained P2- Employees respected accountability and discouraged blame culture
P3- Employees feel free to report information on errors and defect
P4- Organization promoted the involvement of all its employees in quality and CI
Systems & Control S1- A policy deployment and problem-solving infrastructure in place together with robust and proactive

Chapter 9: Readiness Index and Implementation Framework
Maneesh Kumar 295
Findings from survey and case studies suggested having a good quality management
system or implementing Lean for quick gains before embarking on Six Sigma. Lean
tools such as 5S and VSM are very simple, easy to understand, and give
empowerment to employees to improve their own processes. The feeling of
empowerment along with the quick benefits realised from application of these tools
minimizes employee resistance to change and thereby facilitate progression towards
Six Sigma implementation. It is not a strict rule that Lean or ISO should be applied first
before embarking on Six Sigma. It depends on the type of problems organizations are
facing. However, the literature and empirical findings suggest that standardisation of
work processes / Lean implementation build a culture of CI that aid Six Sigma
implementation. This point was included within the ‘Systems and Control’ factor of the
Readiness Index.
It is imperative at this point to understand the differences between the key ingredients
(KI) of Readiness Index and Critical Success Factors (CSFs) of Six Sigma. The five
factors included within the Readiness Index assess organizational preparedness to
implement Six Sigma based on their past success or failure in implementation of
quality initiatives / quality management practices. These KIs must be present in a SME
to consider successful and effective implementation of Six Sigma. The higher score for
the five factors may ensure readiness of an organization to implement Six Sigma and
experience a smooth cultural transition during the change process. Whereas, CSFs
represent the essential ingredients without which a Six Sigma project stands little
chance of success (Antony & Banuelas, 2002). CSFs evaluate an organization
commitment to Six Sigma during or after the implementation of the initiative. The
quality system
S2- A high degree of closed loop error prevention through the control of basic production/ operation and/or service processes S3- Effective communication system and timely information flow vertically and horizontally at all levels
S4- Standardised procedures in a documented quality management system (religiously follow the principles of ISO 9000; certification not required until asked by customer; or identified value added activities through lean implementation) S5- Cross-functional team established as a way of working and to take decisions on system-wide problems
Customer Focus C1- Organization regularly seeks customer feedback to understand the key causes of concern, main complaints, and expected performance from customers C2- Customer focus and satisfaction given priority over internal policies
C3- Understanding of value-added and non-value added activities from customer perspective
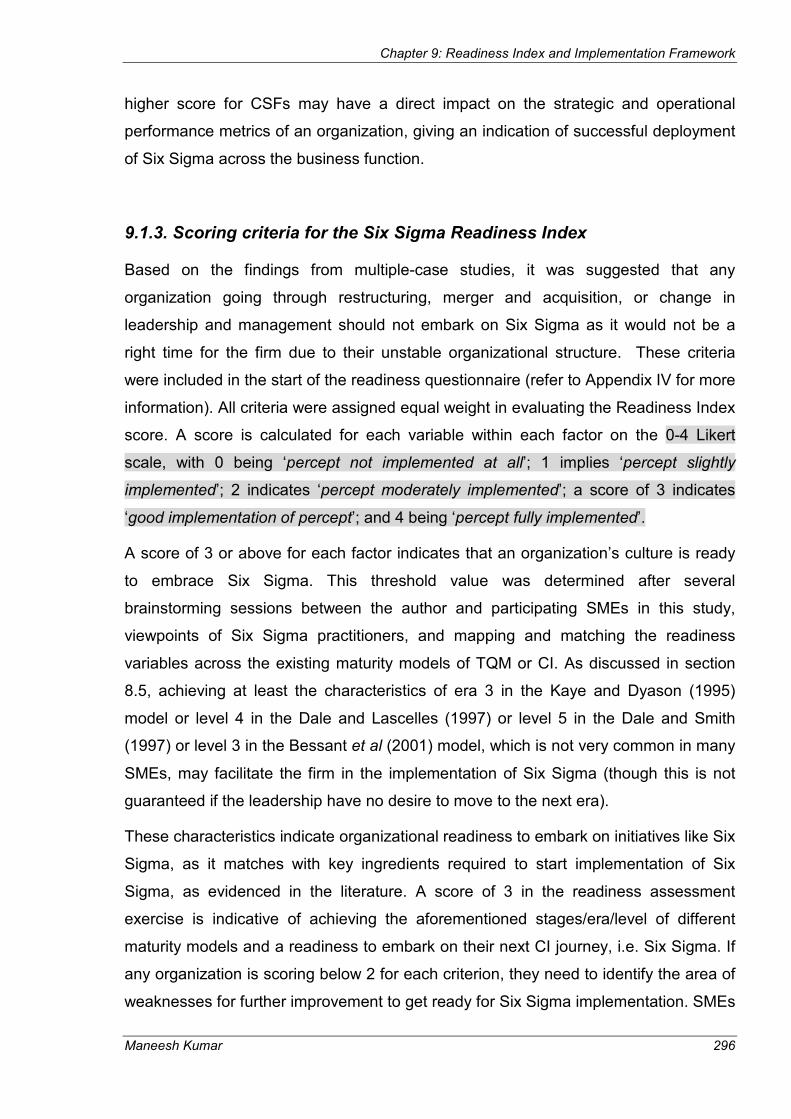
Chapter 9: Readiness Index and Implementation Framework
Maneesh Kumar 296
higher score for CSFs may have a direct impact on the strategic and operational
performance metrics of an organization, giving an indication of successful deployment
of Six Sigma across the business function.
9.1.3. Scoring criteria for the Six Sigma Readiness Index
Based on the findings from multiple-case studies, it was suggested that any
organization going through restructuring, merger and acquisition, or change in
leadership and management should not embark on Six Sigma as it would not be a
right time for the firm due to their unstable organizational structure. These criteria
were included in the start of the readiness questionnaire (refer to Appendix IV for more
information). All criteria were assigned equal weight in evaluating the Readiness Index
score. A score is calculated for each variable within each factor on the 0-4 Likert
scale, with 0 being ‘percept not implemented at all’; 1 implies ‘percept slightly
implemented’; 2 indicates ‘percept moderately implemented’; a score of 3 indicates
‘good implementation of percept’; and 4 being ‘percept fully implemented’.
A score of 3 or above for each factor indicates that an organization’s culture is ready
to embrace Six Sigma. This threshold value was determined after several
brainstorming sessions between the author and participating SMEs in this study,
viewpoints of Six Sigma practitioners, and mapping and matching the readiness
variables across the existing maturity models of TQM or CI. As discussed in section
8.5, achieving at least the characteristics of era 3 in the Kaye and Dyason (1995)
model or level 4 in the Dale and Lascelles (1997) or level 5 in the Dale and Smith
(1997) or level 3 in the Bessant et al (2001) model, which is not very common in many
SMEs, may facilitate the firm in the implementation of Six Sigma (though this is not
guaranteed if the leadership have no desire to move to the next era).
These characteristics indicate organizational readiness to embark on initiatives like Six
Sigma, as it matches with key ingredients required to start implementation of Six
Sigma, as evidenced in the literature. A score of 3 in the readiness assessment
exercise is indicative of achieving the aforementioned stages/era/level of different
maturity models and a readiness to embark on their next CI journey, i.e. Six Sigma. If
any organization is scoring below 2 for each criterion, they need to identify the area of
weaknesses for further improvement to get ready for Six Sigma implementation. SMEs

Chapter 9: Readiness Index and Implementation Framework
Maneesh Kumar 297
should get their basic understanding of CI right before embarking on Six Sigma. A
score between 2-3 requires careful investigation across five factors of the Readiness
Index before implementing Six Sigma. In such circumstances, SMEs are advised to
observe the score for the ‘leadership’ factor and if it is closer to 3 or equal to 3, than
they may think of going ahead with the implementation. Leadership emerged as the
most important factor for the success of any CI initiatives, as evidenced in the
literature, as good leaders make things change or happen in organizations. A higher
score for leadership compared to the other four factors may help SMEs to improve on
other factors as they have commitment from their top management. Thus, a score of
3 is indicative of a ‘green signal’, i.e. go ahead with implementation; a score between
2-3 is an ‘amber signal’, i.e. be cautious and carefully investigate five factors before
implementation; and a score less than 2 is a ‘red signal’, i.e. SME not ready for Six
Sigma implementation. A SME scoring 3 or above may be branded as ‘qualifier’ (ready
for Six Sigma implementation); a SME having a readiness score between 2-3 may be
classified as ‘vigilant’ (careful scrutiny required before implementation); and any firms
scoring less than 2 are not ready for the Six Sigma journey and thus classified as
‘struggler’.
The results from the readiness exercise will facilitate the identification of strengths or
opportunities for improvement in the CI efforts of an organization and help them to:
� Understand the cultural readiness to implement Six Sigma from a strategic to an
operational level;
� Understand the level of commitment to CI initiatives demonstrated by leader / CEO/
MD in the past; and
� Identify areas for improvement in an organization through the readiness exercise
The Readiness Index was tested for its robustness and validity in three SMEs (who
participated in the 2nd phase of study, i.e. case study), the results of which are
presented in the next section.
9.2. Evaluating SMEs Readiness for Six Sigma
In order to test the efficacy of the Readiness Index in truly capturing the information it
was designed for, three SMEs from the second phase of the study agreed to
participate in this validation exercise as well as test their readiness for Six Sigma

Chapter 9: Readiness Index and Implementation Framework
Maneesh Kumar 298
implementation. It was intended initially to select a Six Sigma implementing SME and
a non-Six Sigma firm to test the validity of index. A firm that had realised bottom-line
benefits and enhanced customer satisfaction from implementing Six Sigma should
score higher than 3 for most variables within the index. Also, any firm implementing
ISO 9000 or Lean and interested to embark on Six Sigma journey should have an
overall score closer to 3. Keeping these two sampling criteria in mind, Company A
and F were shortlisted (after their consent to participate in the study) for readiness
exercise. Company D was struggling to keep Six Sigma initiative afresh and alive due
to a change in the management structure and focus of the company. They also
approached the author to participate in the readiness exercise and identify their
weaknesses or gaps in their CI efforts.
The readiness index is still in its testing phase and may be revised in future based on
the comments of participating firms and Six Sigma experts. The demographic details
of the participating firms were provided in table 9.2. For more information about the
company, please refer to Chapter 7 on case study analysis (three firms listed as A, D,
and F in chapter 7 were included in this readiness exercise).
Table 9.2: Demographic details of firms participating in Readiness exercise
Company Manufacturing Activity
Company Type
Location Quality Initiative
Number of employees
A Electronics & Semi-conductor
Independent England Lean, Six Sigma
36
D Mechanical Part of MNC Scotland Lean, Six Sigma
105
F Electrical Independent Scotland ISO 9000, Lean
86
Two members (at middle management level) from each firm were requested to fill in
the readiness questionnaire after reaching a common consensus to rate each
question on 0-4 scale within the survey. It was not possible to collect data from senior
management teams or shop-floor employees due to time and resource constraints.
Future work will focus on a full blown readiness survey across the companies to
assess their readiness for Six Sigma implementation.

Chapter 9: Readiness Index and Implementation Framework
Maneesh Kumar 299
The score for 5 factors of the Readiness Index for A, D and F was presented in table
9.3. These scores were interpreted based on the responses of middle managers to the
questionnaire and linking it to the findings from the case study conducted (in the
second phase of the doctoral research) within the three firms. It can be observed from
the table that A is leading the score followed by F, while D scored poorly against the
five factors.
Table 9.3: SMEs score against the Readiness Index criteria
Six Sigma Readiness Variables SMEs scores against the Readiness Index criteria
A D F
Leadership 3.8 1.2 2.8
L1 4 1 3
L2 4 1 3
L3 4 1 2.5
L4 4 1 3
L5 3 2 2.5
Measurement & Process 3 1.8 2.3
M1 3 3 3
M2 3 2 2
M3 3 1 2
M4 3 1 2
M5 3 2 2.5
People Management 3.8 1.5 2.5
P1 3 2 3
P2 4 1.5 2.5
P3 4 1.5 2.5
P4 4 1 2
System and Control 3.2 1.5 2.1
S1 3 1.5 2
S2 3 2 2
S3 3 1 2.5
S4 4 2 3
S5 3 1 1
Customer Focus 3 1.7 2.3
C1 3 2 2.5
C2 3 2 2.5
C3 3 1 1
Reflecting back to the findings from the case study analysis in Chapter 7 and Chapter
8, and comparing it with the performance of three firms against the readiness criteria,

Chapter 9: Readiness Index and Implementation Framework
Maneesh Kumar 300
it can be said that A has already achieved the maturity level required for successful
deployment of Six Sigma, as was evidenced from their improvement in financial
savings and customer satisfactions from Six Sigma projects. A had scored 3 or higher
against all the variables included within the five factors of the index. As evidenced
from table 9.3, F is scoring in the range of 2-3 for most of the variables - indicating and
confirming their interest to embark on the Six Sigma journey after full deployment of
Lean across the organization (refer to Chapter 7, Section 7.2.2.2 for more information
about their interest to embark on the Six Sigma journey). Lack of commitment from top
management in D resulted in the failure of the Six Sigma initiative and thus their score
of 1-2 for variables within the index reflects on their commitment to the CI journey.
More detailed analysis of each factor within the index was presented below.
9.2.1. Interpretation of Leadership score in three firms
Leadership is the most important factor to ensure success of any change
management initiatives or CI initiatives as evidenced from the literature review and
empirical findings. Results from the readiness exercise are in consensus with the
empirical findings on quality management practices in company A, D, and F.
Leadership was identified as a ‘bottleneck’ factor in D that was holding back their
pursuit of the CI journey, as shown in figure 9.1. The change in management in D
resulted in the shift in focus from initiatives such as Lean/Six Sigma and increasing
attention was paid to bottom-line impact and productivity metrics. Lean/Six Sigma was
not included in the strategic objectives of the business (L4) and minimal support was
provided to drive the CI effort by senior management team (L2). Though D
implemented Six Sigma for process improvement, they were not culturally ready to
embrace and sustain the culture of CI due to lack of strong leadership and top
management commitment.
On the contrary, strong and committed leadership was visible in A and F. The detailed
description of the history of the quality journey in A and F were provided in Chapter 7.
Since its inception, A had taken incremental steps to embark on the CI journey and at
each step the Managing Director had allocated resources and shown commitment for
the initiative.

Chapter 9: Readiness Index and Implementation Framework
Maneesh Kumar 301
Figure 9.1: SMEs readiness score against leadership dimension
CI was always the top priority and was aligned to the strategic objectives of the
business in A. The MD believed that initiative such as Six Sigma and Lean may help
the company to minimize waste and compete with the low-cost manufacturing
countries like India and China. It was thus important, in the viewpoint of A, to build a
working culture based on the concept of process thinking and fact based decision
making. The change in the management team had helped F to remain steadfast in its
CI journey. Management had realised the benefits from implementation of ISO 9000
and Lean (had just started implementing Lean in 2007) and was committed to move
ahead in their CI journey. The score across the five variables of leadership for F
further substantiate the aforementioned statement. From the leadership perspective, F
is culturally ready to embark on the Six Sigma journey.
9.2.2. Interpretation of Measurement and Processes score in three firms
The scores for the three firms against the measurement and processes dimension
were depicted in figure 9.2. The core business processes in the three firms were
known, documented, and key activities within processes were mapped using
flowcharts or process maps. This was achieved through adherence to ISO 9000 QMS
in the three firms as well as by implementation of Lean in A and F.
0
1
2
3
4L1
L2
L3L4
L5A
D
F
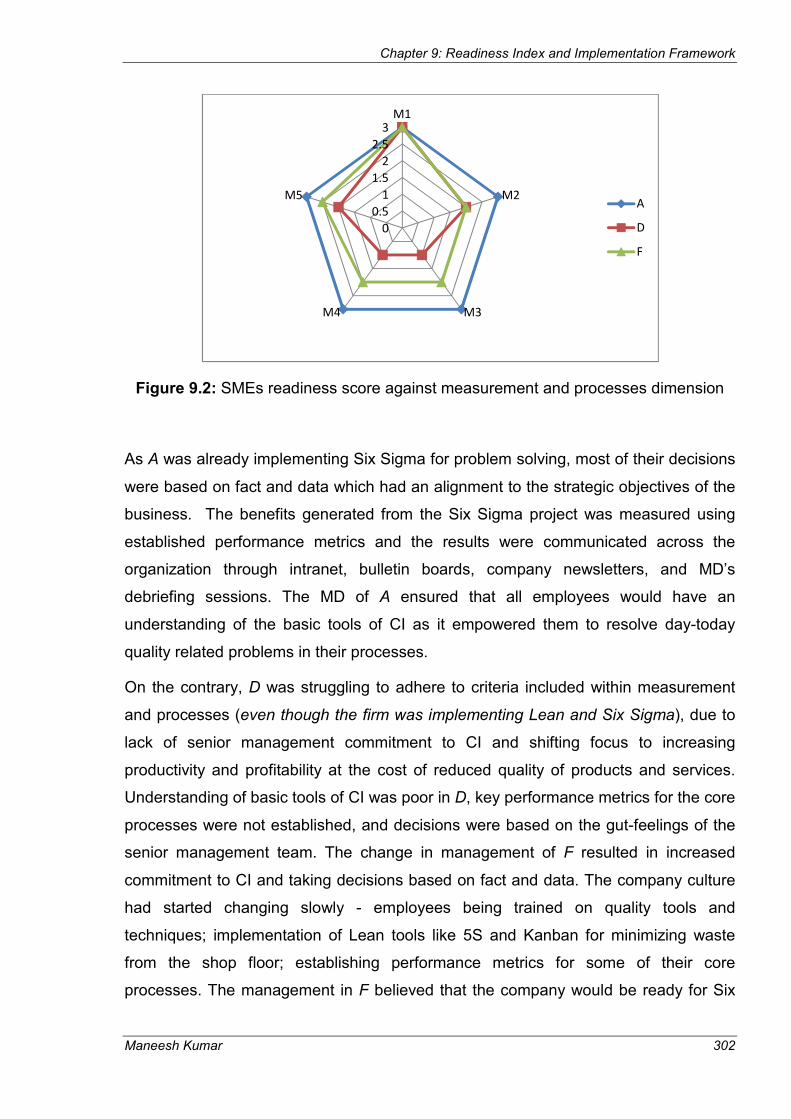
Chapter 9: Readiness Index and Implementation Framework
Maneesh Kumar 302
Figure 9.2: SMEs readiness score against measurement and processes dimension
As A was already implementing Six Sigma for problem solving, most of their decisions
were based on fact and data which had an alignment to the strategic objectives of the
business. The benefits generated from the Six Sigma project was measured using
established performance metrics and the results were communicated across the
organization through intranet, bulletin boards, company newsletters, and MD’s
debriefing sessions. The MD of A ensured that all employees would have an
understanding of the basic tools of CI as it empowered them to resolve day-today
quality related problems in their processes.
On the contrary, D was struggling to adhere to criteria included within measurement
and processes (even though the firm was implementing Lean and Six Sigma), due to
lack of senior management commitment to CI and shifting focus to increasing
productivity and profitability at the cost of reduced quality of products and services.
Understanding of basic tools of CI was poor in D, key performance metrics for the core
processes were not established, and decisions were based on the gut-feelings of the
senior management team. The change in management of F resulted in increased
commitment to CI and taking decisions based on fact and data. The company culture
had started changing slowly - employees being trained on quality tools and
techniques; implementation of Lean tools like 5S and Kanban for minimizing waste
from the shop floor; establishing performance metrics for some of their core
processes. The management in F believed that the company would be ready for Six
0
0.5
1
1.5
2
2.5
3M1
M2
M3M4
M5A
D
F
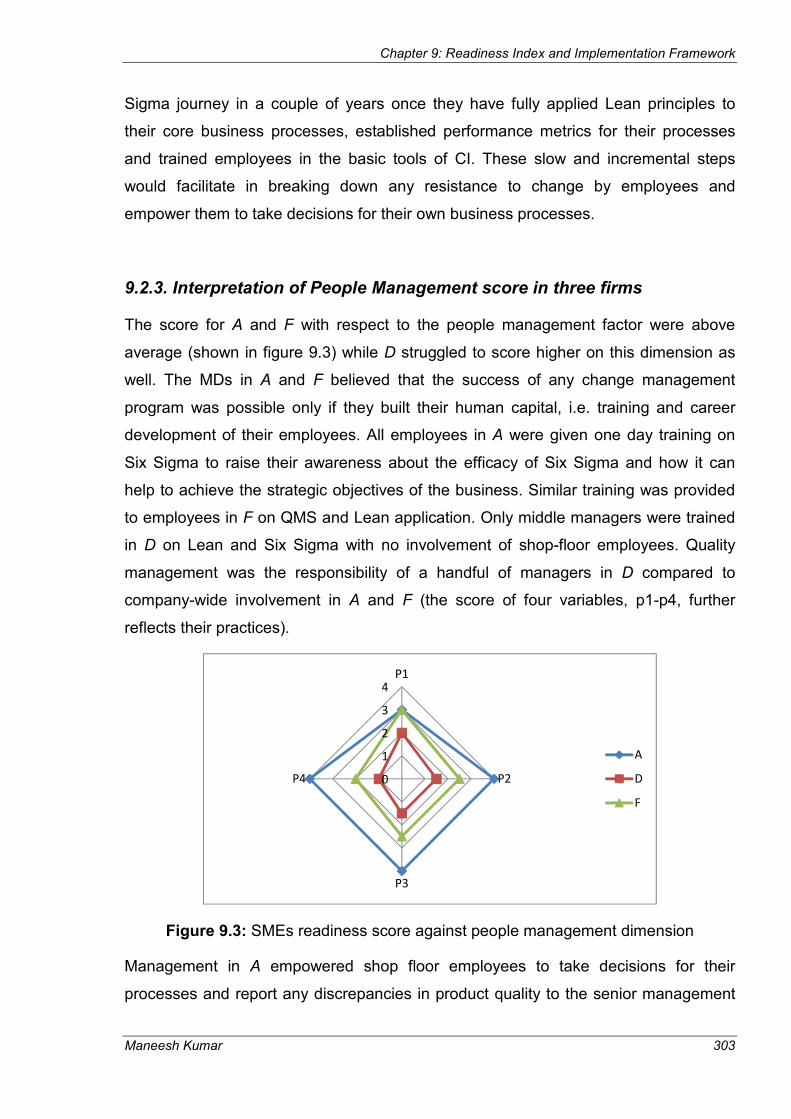
Chapter 9: Readiness Index and Implementation Framework
Maneesh Kumar 303
Sigma journey in a couple of years once they have fully applied Lean principles to
their core business processes, established performance metrics for their processes
and trained employees in the basic tools of CI. These slow and incremental steps
would facilitate in breaking down any resistance to change by employees and
empower them to take decisions for their own business processes.
9.2.3. Interpretation of People Management score in three firms
The score for A and F with respect to the people management factor were above
average (shown in figure 9.3) while D struggled to score higher on this dimension as
well. The MDs in A and F believed that the success of any change management
program was possible only if they built their human capital, i.e. training and career
development of their employees. All employees in A were given one day training on
Six Sigma to raise their awareness about the efficacy of Six Sigma and how it can
help to achieve the strategic objectives of the business. Similar training was provided
to employees in F on QMS and Lean application. Only middle managers were trained
in D on Lean and Six Sigma with no involvement of shop-floor employees. Quality
management was the responsibility of a handful of managers in D compared to
company-wide involvement in A and F (the score of four variables, p1-p4, further
reflects their practices).
Figure 9.3: SMEs readiness score against people management dimension
Management in A empowered shop floor employees to take decisions for their
processes and report any discrepancies in product quality to the senior management
0
1
2
3
4P1
P2
P3
P4
A
D
F

Chapter 9: Readiness Index and Implementation Framework
Maneesh Kumar 304
team. Employees thus take accountability for their processes and avoid a blame
culture in the company. As F had just embarked on the Lean journey, the change in
the company culture was slow but evident. The 5S and Kanban exercise had given a
sense of accountability and empowerment to shop floor employees to improve their
own processes. Due to weak leadership and lack of vision of the previous MD, the
company was still trying to recover from those bad practices where a blame culture
was prevalent and staff development was given least priority. The new MD in F is
making the change happen, but it takes time to involve everybody in this change
process. The management in D had cut costs on employee training to increase
profitability of the company. Quality management was the responsibility of middle
managers with shop floor employees given no empowerment to improve their
processes.
9.2.4. Interpretation of Systems and Control score in three firms
The scores in the first three factors of the Readiness Index may have an effect on
systems and the control dimension. The results from the table 9.3 and figure 9.4
indicates that A had well established systems and controls in place that may be
attributed to their performance in the first three factors of the index. Strong leadership,
established measurement and processes, and people management led to the
establishment of proactive quality systems, standardised procedures, and top-down
communication. Management realised the importance of forming a cross-functional
team for executing Lean/Six Sigma projects as participants from other functions would
look at the production problem from fresh eyes and may have different ideas for
problem solving compared to production staff.
Employees in F had strictly adhered to ISO 9000 principles to establish standardised
processes and regularly review their processes for improvement. In terms of
establishing good communication systems and proactive quality systems, the new
management team were devising ways to improve it at the time when the case study
was conducted. Similar to the majority of manufacturing SMEs, the problem solving
team involved people from production or the shop-floor with minimal involvement of
employees from other departments of the organization.

Chapter 9: Readiness Index and Implementation Framework
Maneesh Kumar 305
Figure 9.4: SMEs readiness score against systems and control dimension
It is imperative to improve on the aforementioned factors before F embarks on the Six
Sigma journey. Lack of strong leadership and poor measurement systems had an
impact on the establishment of systems and control in D. They scored very low for the
five variables included within the systems and control dimension of the Readiness
Index. Six Sigma / Lean and ISO 9000 certification seemed to be a window dressing
exercise for management in D to increase market share and improve customer
retention rate. All the aforementioned factors had resulted in the failure of the
Lean/Six Sigma initiative in D.
9.2.5. Interpretation of Customer Focus score in three firms
Employees in A regularly seek customer feedback to understand their expected
performance from the firm’s products/services, understand their causes of concern
and any major customer complaints issues. The MD along with the marketing and
sales teams in A used to meet their key clients to understand their product/service
requirements and expectations. Any customer complaints were given top priority and
were resolved on an immediate basis. With the implementation of the Six Sigma
strategy, the company started capturing the true voice of the customer (VOC) and
tried to identify value-added and non-value added steps from the customer
perspective. Management and employees took proactive measures to minimize the
complaints from the customer end. The scores for the three firms against the customer
focus dimension were depicted in figure 9.5.
0
1
2
3
4S1
S2
S3S4
S5 A
D
F

Chapter 9: Readiness Index and Implementation Framework
Maneesh Kumar 306
Figure 9.5: SMEs readiness score against customer focus dimension
Whereas both in D and F, customer complaints was the measure used to capture
VOC, which could be regarded as a reactive mode of operation, i.e. reacting after the
problem had already occurred. As Six Sigma was used as a window dressing exercise
for D, there was a lack of a proactive system to capture true VOC or identify value-
added activities or non-value added activities from the customer perspective.
Customer surveys were conducted in D but that data was rarely analyzed to
understand issues from the customer perspective. Due to strict adherence to QMS
and Lean, F had slowly started taking proactive measures to capture VOC (e.g.
customer survey, trained employees to understand customer issues) and understand
the non-value added activities from the customer perspective. It is imperative for the
management in F to be involved with their key customers and resolve their major
concerns on an immediate basis. This will prepare them for their Six Sigma journey,
where everything starts from the customer and ends at the customer.
9.3. A final thought on Six Sigma Readiness Index
The results of the readiness exercise in three SMEs reflects on their actual
commitment to quality management practices and are in consensus with the case
study findings discussed in Chapter 7. The findings from Chapter 7 clearly indicated
the high level of commitment from the MD of A to support and sustain the benefits
realised from Six Sigma implementation. The readiness score of A also reconfirm their
0
0.5
1
1.5
2
2.5
3C1
C2C3
A
D
F
Chapter 9: Readiness Index and Implementation Framework
Maneesh Kumar 307
firm’s maturity in the application of Six Sigma. The management in F indicated their
desire to implement Six Sigma, as discussed in Chapter 7, after they have streamlined
their business processes, established performance metrics for core processes,
developed basic understanding of tools and techniques of CI, and developed their
human capital. The readiness score for F indicates that they need to improve on four
dimensions of the index - measurement and feedback; people management; systems
and control; and customer focus, before they embark on the Six Sigma journey. The
readiness score of D reflects their culture of working in a reactive mode of operation
and poor commitment to quality management practices, as also evidenced from case
study findings. The readiness score for the three firms had managed to capture their
existing commitment to quality management practise and their continuous
improvement journey. It may be commented that the index had managed to capture
the data for which it was designed, thus addressing the issue of validity of the
instrument. The journey to continually improve the readiness index has just begun.
More comments from Six Sigma practitioners and industry executives would be taken
in future to further refine the readiness index.
9.4. Six Sigma Implementation Framework for SMEs
Six Sigma builds upon many of the successful elements of previous quality
improvement initiatives and incorporates a unique method of its own. Although the
financial payback from Six Sigma projects allurers many companies to embark on its
implementation journey, but they need to carefully consider the implementation
process to ensure sustainability and long term benefits from the initiative. The author
has developed a Six Sigma implementation framework that will act as a roadmap or
guidelines for SMEs to follow in their effort to improve continuously, maintain high
standards of quality and enhance their chance of success in embracing this program.
The company wide implementation of Six Sigma can take place in five phases, as
proposed in the framework, starting from assessing the readiness for Six Sigma
implementation to sustaining the benefits from the implementation, as illustrated in
figure 9. 6.

Maneesh Kumar
Figure 9.6: A five phase framework for Six Sigma implementation in SMEs
To date, no research projects or literature have proposed a generic implementation
framework to get started with Six Sigma in a SME environment. This framework was
developed by critically analyzing the quality frameworks/models proposed by
researchers and matching these with the findings from the two phases of doctoral
research. The five phases of the
frameworks/models proposed by researchers in the past such as Ghobadian and
Gallear (1997), Yusof and Aspinwall (2000c), Husband and Mandal (1999), Deros
(2006) and Khan et al
from this empirical research was compared with the existing frameworks/models
proposed for SMEs to design the five phases of the proposed Six Sigma framework
customized to the needs of SMEs.
The first decision of where to
started. If the implementation of Six Sigma is planned at organization
organization-wide support must be in place well before the Six Sigma project begins.
The proposed twelve steps,
framework will facilitate SMEs to apply Six Sigma in a systematic and logical manner.
Chapter 9: Readiness Index and Implementation Framework
A five phase framework for Six Sigma implementation in SMEs
To date, no research projects or literature have proposed a generic implementation
t started with Six Sigma in a SME environment. This framework was
developed by critically analyzing the quality frameworks/models proposed by
researchers and matching these with the findings from the two phases of doctoral
The five phases of the Six Sigma framework was influenced by the
frameworks/models proposed by researchers in the past such as Ghobadian and
Gallear (1997), Yusof and Aspinwall (2000c), Husband and Mandal (1999), Deros
(2007). The critical success factors and challenges identified
from this empirical research was compared with the existing frameworks/models
proposed for SMEs to design the five phases of the proposed Six Sigma framework
customized to the needs of SMEs.
The first decision of where to begin is so difficult that many organizations never get
started. If the implementation of Six Sigma is planned at organization
wide support must be in place well before the Six Sigma project begins.
The proposed twelve steps, as shown in figure 9.7, in the five phases of the
framework will facilitate SMEs to apply Six Sigma in a systematic and logical manner.
Chapter 9: Readiness Index and Implementation Framework
308
A five phase framework for Six Sigma implementation in SMEs
To date, no research projects or literature have proposed a generic implementation
t started with Six Sigma in a SME environment. This framework was
developed by critically analyzing the quality frameworks/models proposed by
researchers and matching these with the findings from the two phases of doctoral
Six Sigma framework was influenced by the
frameworks/models proposed by researchers in the past such as Ghobadian and
Gallear (1997), Yusof and Aspinwall (2000c), Husband and Mandal (1999), Deros et al
ctors and challenges identified
from this empirical research was compared with the existing frameworks/models
proposed for SMEs to design the five phases of the proposed Six Sigma framework
begin is so difficult that many organizations never get
started. If the implementation of Six Sigma is planned at organization-wide level, then
wide support must be in place well before the Six Sigma project begins.
as shown in figure 9.7, in the five phases of the
framework will facilitate SMEs to apply Six Sigma in a systematic and logical manner.

Chapter 9: Readiness Index and Implementation Framework
Maneesh Kumar 309
Though few steps of the framework are generic and applicable to all type or size of
firms, step 3-5, step 8, step 10, and step 12 were designed specifically for SMEs
taking into consideration the characteristics of SMEs and constraints faced by them.
For detailed information about each step of the framework, please refer to Section
9.4.1-9.4.4.
The framework was tested in three SMEs by conducting semi-structured interviews
with the middle management teams (the interviewees shortlisted for readiness test
participated in the framework testing as well). The comments and suggestions from
the interview process were incorporated in the framework to make some minor
amendments in the details of step 3, step 6, step 8, and step 12. The Six Sigma
framework presented in figure 9.7 is the revised framework that will facilitate SMEs to
successfully implement Six Sigma and become resilient to tackle quality challenges in
the global market.
The first phase of the framework, i.e. Phase 0, tests an organizational readiness for
Six Sigma implementation. The Readiness Index was discussed in detail in section 9.2
and 9.3. The readiness exercise would ensure that SMEs achieving the threshold
value smoothly sail through Six Sigma implementation without any major disruption.
This is the first step to build resilient SMEs that can sustain the benefits from Six
Sigma implementation on a long-term basis. The readiness criteria are the energy
force to drive Six Sigma success, the lack of which may not lead to long-term
improvements irrespective of how well other criteria in the framework had been
addressed. SMEs that achieve the threshold value in the readiness test are ready to
embark on Phase 1 of the framework for Six Sigma implementation. The next section
discusses the steps involved in of Phase 1 of implementation of the framework.

Chapter 9: Readiness Index and Implementation Framework
Maneesh Kumar 310
Figure 9.7: A 12 step approach in the five phase Six Sigma framework for SMEs
Prepare
Phase 1
Recognise
the need for
change
Top Mgmt.
Commitment
& Strong
Leadership
Education
and training
Identify &
train best
people for
first wave of
training
Identify the
core business
processes
Selecting Six
Sigma pilot
project
Communicating
initial success
Organization
wide training
Establish
methods to
evaluate
progress
Commitment
to continuous
improvement
Linking Six
Sigma to
intrinsic
motivation of
employees
Progression
towards
learning org.
Communication and Leadership Commitment
Readiness for Six Sigma
Yes/No
Phase 0
Sustain
Phase 4 Institutionalize
Phase 3
Initialize
Phase 2
If Yes
These steps were designed specifically to the needs of SMEs
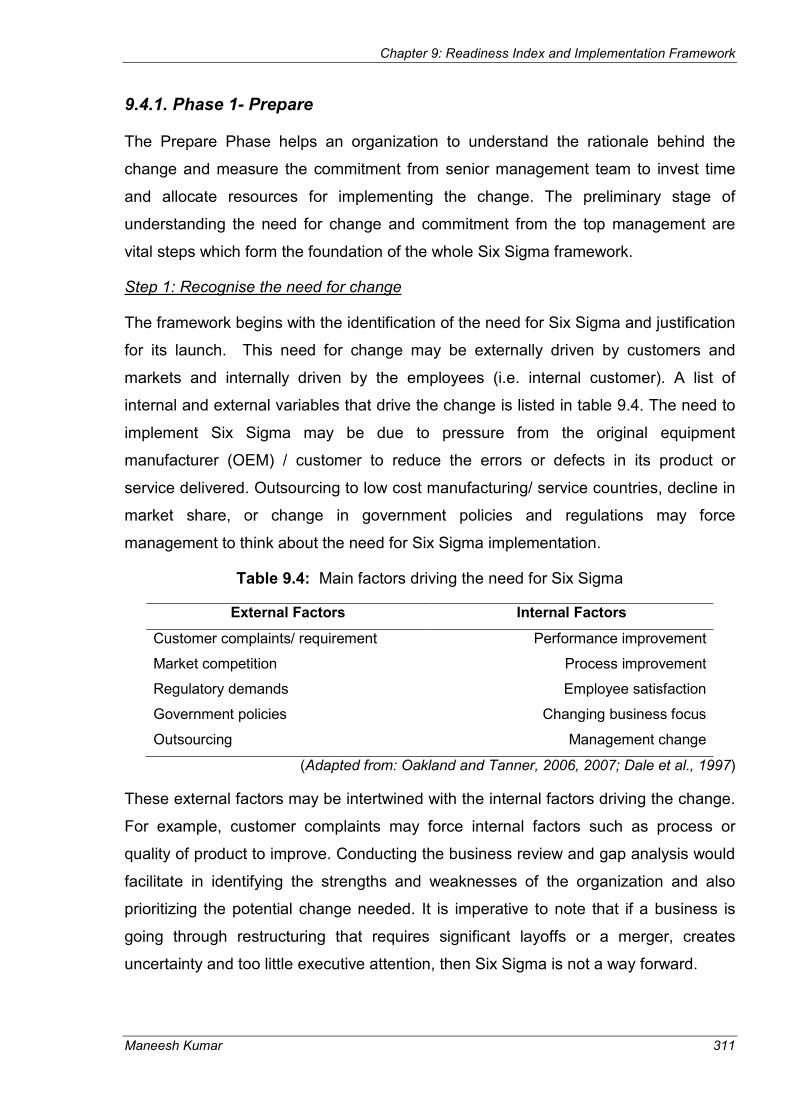
Chapter 9: Readiness Index and Implementation Framework
Maneesh Kumar 311
9.4.1. Phase 1- Prepare
The Prepare Phase helps an organization to understand the rationale behind the
change and measure the commitment from senior management team to invest time
and allocate resources for implementing the change. The preliminary stage of
understanding the need for change and commitment from the top management are
vital steps which form the foundation of the whole Six Sigma framework.
Step 1: Recognise the need for change
The framework begins with the identification of the need for Six Sigma and justification
for its launch. This need for change may be externally driven by customers and
markets and internally driven by the employees (i.e. internal customer). A list of
internal and external variables that drive the change is listed in table 9.4. The need to
implement Six Sigma may be due to pressure from the original equipment
manufacturer (OEM) / customer to reduce the errors or defects in its product or
service delivered. Outsourcing to low cost manufacturing/ service countries, decline in
market share, or change in government policies and regulations may force
management to think about the need for Six Sigma implementation.
Table 9.4: Main factors driving the need for Six Sigma
External Factors Internal Factors
Customer complaints/ requirement Performance improvement
Market competition Process improvement
Regulatory demands Employee satisfaction
Government policies Changing business focus
Outsourcing Management change
(Adapted from: Oakland and Tanner, 2006, 2007; Dale et al., 1997)
These external factors may be intertwined with the internal factors driving the change.
For example, customer complaints may force internal factors such as process or
quality of product to improve. Conducting the business review and gap analysis would
facilitate in identifying the strengths and weaknesses of the organization and also
prioritizing the potential change needed. It is imperative to note that if a business is
going through restructuring that requires significant layoffs or a merger, creates
uncertainty and too little executive attention, then Six Sigma is not a way forward.
Chapter 9: Readiness Index and Implementation Framework
Maneesh Kumar 312
Step 2: Strong leadership and Top Management commitment
Once a SME pass through Six Sigma readiness test, it gives an indication that the firm
had a strong leader supporting CI activities in the past. Again, this commitment from
top management and leaders needs to be reassessed at the start of the Six Sigma
implementation.
Six Sigma works best with a top-down approach- when the CEO and senior
management team own it, support it, and drive it (Pande et al., 2000; Antony and
Banuelas, 2002). This is the most important aspect to start with because many
companies have failed in their attempt to implement Six Sigma either due to lack of
commitment at the managerial level or due to lack of strong leaders to drive the
initiative. Communication plans should be developed and deployed so that all senior
management team are aware of the quality improvement effort and understand why it
is being implemented. SMEs have the advantage of faster communication across the
business due to their flat layer structure and less functional hierarchy.
Leadership from top of the organization is necessary to define, prioritize and construct
the quality thinking in the organization. GE success with Six Sigma was due in large
part to the role that Jack Welch (former CEO) played in relentlessly advocating the
initiative and integrating it into the core of the company’s strategy (Mekong Capital,
2004). It is desirable that senior management approves the Six Sigma initiative,
defines the purpose and scope of Six Sigma, and links it to the mission and vision of
the organization. If the business leaders and their team cannot invest two days of their
own time in learning more about Six Sigma and their role, then they are not ready to
start (Pande et al., 2000). Some of other roles and responsibilities of senior
management and their performance measures is cited in table 9.5.

Chapter 9: Readiness Index and Implementation Framework
Maneesh Kumar 313
Table 9.5: Responsibilities and performance measures of top management
Factor Main Responsibilities Performance measures
Leadership & Senior Management commitment
• Linking Six Sigma to company’s mission, vision, and values
• Making Six Sigma one of the top three priorities of the business
• Communicate the need for Six Sigma
• Ready to address any resistance to change
• Breaking down stumbling blocks or barriers to implementation
• Motivate and support the employee in the implementation process
• Develop a strategy for deployment
• Develop a 3-5 years strategic Six Sigma plan
• Allocate budget and resources
• Introduce incentive and reward schemes
• Control through visibility
• Monitor progress
• Committing themselves for one or two days training on Six Sigma
(Adapted from Motwani, 2001; Writer, 2007)
Step 3: Education and Training at Senior Management Level
To constantly maintain competitive edge and effectively transfer knowledge
throughout the organization, it is important to start training at the top of the
organization and this should then be cascaded down through the organizational
hierarchy (Antony and Taner, 2003). Education and awareness sessions will secure
senior management commitment and faith in the initiative. The literature review and
the empirical study explicitly stated resource constraints (financial, technical, time)
faced by SMEs for implementing any change. The best way forward for SMEs to
negate the effect of resource availability on the implementation process is to network
or collaborate with their OEM / organizations adopting Six Sigma or government
bodies or academic institutions for training and support during the initial phase of Six
Sigma implementation (Kumar and Antony, 2009; Thomas and Webb, 2003; Thomas,
2007; Thomas et al., 2008; Hewitt, 1997; Shea and Gobeli, 1995; Barrier, 1992). This
step will minimize their expenses in hiring expensive consultant to train their
employees.
Government bodies in the UK such as the Manufacturing Advisory Services (MAS)
provide help to SMEs to streamline their processes, reduce waste, become more
Chapter 9: Readiness Index and Implementation Framework
Maneesh Kumar 314
energy efficient and improve their business at free cost or at highly subsidised rates
(http://www.mas.berr.gov.uk/). Local universities can help SMEs in several ways to
embark on their CI journey- train on statistics concepts, principles of Lean, Six Sigma,
tools & techniques of CI; internship students available to work on the Six Sigma
project supported by an academic mentor. SMEs can take advantage of free support
available from social/professional networks on the internet such as –
www.isixsigma.com, International Society of Six Sigma Professionals (ISSSP), and
LinkedIn, to name a few. The development of a network will facilitate SMEs to share
their experiences of implementing CI initiatives or using self-assessment tools with
similar companies on a common platform.
The action plan for this step is listed below:
� Educate senior management team with executive or champion training
� Create a Six Sigma steering committee comprising the top management
(Writer, 2007) to provide leadership, co-ordinate the review of on-going
projects, liaise with champions of different projects and allocate resources to
them, ensure the projects selected have strategic links to business objectives
� Identify and select executive leaders to drive the initiative
9.4.2. Phase 2- Initialize
The Initialize phase helps an organization to implement the change on a pilot basis by
identifying, selecting and motivating the few talented employees to be the part of the
change and selecting a pilot project for execution that can be completed within short
span of time with maximum impact. The Initialize phase builds momentum for
deploying change across the organization.
Step 4- Identify and train best people for the first wave of Six Sigma
It is indispensable to attract the best people with good leadership skills to be involved
in the company’s first wave of training on Six Sigma (Pande et al., 2000; Pyzdek,
2003; Antony, 2004). There are three major reasons why top talent is so important to
the Six Sigma effort (Snee and Hoerl, 2003):
• The better the talent, the better the result

Chapter 9: Readiness Index and Implementation Framework
Maneesh Kumar 315
• Top talent attracts more top talent
• Top talent becomes the next organizational leader
Selection of top talent for the key roles gives a clear message to the organization that
management is committed and serious about Six Sigma. This will provide an impetus
and motivation for other employees to get involved in the initiative. Selection criteria
should be developed by top management in selecting the right people for the first
wave.
Taking into consideration problem complexity and resource limitation, SMEs do not
require an extensive role system where Master Black Belts, Black Belts (BB) are
involved in projects as are applied to large organizations (Kumar et al., 2006, 2008).
Findings from empirical research (Kumar and Antony, 2008, 2009) indicate the need
of 1-2 Black Belts for a firm with 250 employees. In the first wave of training one, or a
maximum of two employees from the firm (top talented people in the firm should be
selected) should be selected for Six Sigma Black Belt training. The Black Belt can
then train the rest of the employees, by taking train the trainer approach, at different
levels of Six Sigma expertise, i.e. Green Belt (for middle managers) and Yellow Belts
(for supervisor and shop floor employees).
There is no need for Master Black Belt in a SME environment and the focus should
be on training more Green Belts (in the second wave of training) as suggested by
case study firms, Six Sigma practitioners from MAS, and delegates at the 3rd
International conference on Six Sigma. Estimated savings from a Black Belt project in
a SME environment is different from that in large organizations. A typical BB in large
organizations is expected to save approximately £75k per project; whereas in a SME
environment, BB may save £30-£35k per project (supported by empirical research
conducted by author, though no such figure is available in the literature). The
requirement of BB and typical savings from BB projects in a SME environment is an
unexplored area of research that requires further investigation and development.
Key points to consider during the execution of step 4 are:
• Select best people from all departments of the organization
• Identify the best training provider in the area that has got reputation and
experience in delivering training (e.g. MAS, University offering BB training, or a
reliable consultancy company of international repute).

Chapter 9: Readiness Index and Implementation Framework
Maneesh Kumar 316
• Develop training plan/schedule.
• Identify and train candidates for Six Sigma project Champion and BB roles.
• Form one or two cross-functional teams for the first wave, comprising not more
than 6-8 members in each team. The team members should be the interested
parties from different functional groups such as Production, Research &
Development, Marketing & Sales, Finance, or Human Resources. The
involvement of members from other functional groups will provide more ideas
and fresh angle to the problems.
Step 5: Identify the core business processes
Identification of core processes is an area of potential bottleneck for many
organizations because, if the core processes are not known, the rest of the framework
is difficult to implement (Oakland, 2003). It becomes easier to understand the
business, processes, and identify opportunities for improvement, if the process
mapping / value stream mapping (VSM) for the core processes have been performed.
Adherence to ISO 9000 guidelines or implementation of Lean before embarking on Six
Sigma establishes standardised systems and procedures, identifies core and support
processes, and develop VSM for key processes. VSM projects the bottleneck
operations or chronic problems by identifying value-added and non-value added
activities in the value stream. The pre-established system like this in SMEs may aid in
Six Sigma implementation.
It is preferable to launch Six Sigma by focusing on a few strategic areas, rather than
10 or 20 (Snee and Hoerl, 2003). It is equally important to establish the process
performance measures, which could be used to define what is important for success
and which are used to select the project. Activities involved in this step are:
• Identify core business processes and prioritize critical processes (if not identified
in the readiness assessment stage, i.e. phase 0).
• Develop the process map or value stream map for the core processes.
• Develop a measurement plan and metrics for the core processes, e.g. cost of
quality; value-added or non-value added activities (It is worthwhile to identify,

Chapter 9: Readiness Index and Implementation Framework
Maneesh Kumar 317
isolate, and remove measurement variations, which would lead to the actual
measured values obtained from the measurement process)
• Establish performance metrics for the critical processes.
• Review the current performance for the critical processes.
• Perform the internal & external benchmarking for the critical processes.
• Identify and prioritize those processes that have greater stakeholder and financial
impact.
Step 6: Selecting Six Sigma pilot project
Projects are the core activity driving the change in Six Sigma organizations. As quoted
by Snee and Hoerl (2003), “Project selection is a critical component of success. Often
the battle is lost before we have even begun due to selection of poor projects”.
Some early wins are crucial and necessary to buy-in management and company-wide
commitment for the initiative. Primarily, initial pilot projects should focus on key
problem areas (as identified in step 5) with strategic alignment in terms of high
customer satisfaction and critical to business success in terms of faster or larger
financial return (Kumar et al., 2009; Pyzdek, 2003). Only those projects should be
selected at the start of the implementation process that could be completed in the
shortest possible time (3-4 months) with less effort and high impact in terms of
productivity and profitability (Barrier, 1992; Struebing and Klaus, 1997). The process
performance measures determined by the senior management facilitate everyone to
focus on the initial projects strategically (Snee and Hoerl, 2003). The success of the
pilot project would act as a model for the rest of the organization to follow. It is
desirable that the finance department is involved from the beginning of the project to
ensure that the cost-benefit analysis is carried out for each Six Sigma project and
savings are actually reflected in the bottom-line.

Chapter 9: Readiness Index and Implementation Framework
Maneesh Kumar 318
9.4.3. Phase 3- Institutionalize
The Institutionalize Phase refers to the deployment of Six Sigma across the
organization so that the culture of process thinking, statistical thinking, and CI is
embedded within the organization.
Step 7: Communicating the initial success
All financial and strategic savings generated from pilot projects should be reported
upon project completion. Awareness and recognition of all employees on Six Sigma
pursuit is achieved through the communication of Six Sigma savings. The senior
management team should communicate carefully to the whole company as why they
chose to deploy Six Sigma, what they hope to get out of it, and where it will take the
organization (Snee and Hoerl, 2003). Different communication strategies or media
such as intranet, newsletter, bulletin board, etc should be used. Important points to
consider in this step are
• Celebrate and widely share the success of pilot projects.
• Gain the appreciation of top management as well as members of supervisory
teams.
• Share the major challenges and pitfalls during project execution
Step 8: Organization-wide training
A sound organizational infrastructure for each of the Six Sigma roles (Black Belt (BB),
Green Belt (GB), Yellow Belt (YB)) is a key element for institutionalizing the Six Sigma
initiative within the fabric of the organization. It is not only important to allocate
resources for a wave of mass training, but also to identify all the training needs of all
the roles, and put together a sustained, ongoing system to continuously satisfy these
needs in the most efficient way possible (Snee and Hoerl, 2003). Training should not
just be short-term but should involve educating on the long-term basis, with regular
training follow-ups and briefings (Antony and Taner, 2003).
As discussed in step 4, BB can take the ‘train the trainer approach’ to train rest of the
employees at GB or YB level. This will not only save financial resources for SMEs, but
also build their own capability and understanding of Six Sigma for long-term
sustainability of the initiative. This approach was popular and practised by

Chapter 9: Readiness Index and Implementation Framework
Maneesh Kumar 319
participating case study firms in this study. It is also advisable in the authors’ opinion
to develop a White Belt system for SMEs instead of heavily investing in the Black Belt
system (Kumar et al., 2008). The White Belt definition provided by Harry and
Crawford (2004) is not realistic and achievable. Twelve projects in a year for a White
Belt are too ambitious. The author suggests that the White Belts may carry out
between 4 to 5 process or quality improvement related projects using the DMAIC
methodology. The expected savings from a White Belt project can be around £5000
per project. In our opinion, a company of size 100 should plan for about 10 to 15
White Belts, trained for a week on basic Six Sigma methodology. This is gray area of
research that needs further exploration and testing.
Other components of the supporting infrastructure that become key in this step are:
• A steering committee comprising the senior management people formed and
active (discussed in step 2)
• Executives trained at GB and BB level should execute a project linked to the
strategic goals of the business and demonstrate potential savings generated
from the project. Once the project is executed, the GB/BB should be rotated
back to their original job and opportunity should be given to other employees
to execute projects. This way SMEs can take care of their scarce human
resources as well as build up their own knowledge intensive workforce
• Continual training for new employees as well as experienced GBs
• Training should not only focus on statistical tools and techniques application
but also on softer issues such as change management, leadership, culture
issues, to name a few.
• Audits should be carried out to ensure that completed projects are continuing
to reap benefits (Snee and Hoerl, 2003)
Step 9: Establish methods for evaluating progress
The gap analysis conducted in the first-phase will help to identify the critical business
processes and establish the metrics to measure the performance of those processes.
Good performance measurement allows target areas for improvement to be identified
and has a key role in communication (Oakland and Tanner, 2006). These metrics

Chapter 9: Readiness Index and Implementation Framework
Maneesh Kumar 320
should regularly be monitored and reviewed by the Six Sigma team. It is equally
important to measure the non-financial metrics such as customer satisfaction,
employee satisfaction, job involvement and commitment, to name a few, which are the
key indicators of any change initiative. Key points to be accentuated upon in this step
are:
• Develop standard procedures and system for results recording and reporting.
• Highlight the successful as well as poor results and feedback to employees
• Members of supervisory team accountable for reporting results for their
individual processes.
• Establish monthly review of on-going projects, identify performance trends,
evaluate progress and revise strategies.
9.4.4. Phase 4- Sustain
The Sustain Phase emphasizes on how the learning from the first three phases could
be shared, transferred and applied across the organization to continue reaping
benefits on a long-term basis from the implementation of Six Sigma. The idea behind
including this phase was to make sure that the benefits and knowledge generated
from Six Sigma projects are sustained on a long-term basis.
Step10: Commitment to Continuous Improvement
Sustaining improvement is a challenging task, where many SMEs struggle due to a
change in business focus or fluctuation in economy. To keep the momentum going, it
is necessary to develop generations of managers, who not only understand but are
dedicated to the pursuit of continuous improvement in meeting external and internal
customer needs (Oakland, 2003). This is the first step towards long-term sustainability
of the initiative, facilitating in the creation of resilient SMEs.
Step11: Linking Six Sigma to intrinsic motivation of employees
Employees are the source of ideas and innovation, and their expertise and knowledge
should be harnessed to get those ideas implemented (Oakland, 2003). Management
should believe in the power of ‘intrinsic motivation’ (self-motivation) rather than solely
Chapter 9: Readiness Index and Implementation Framework
Maneesh Kumar 321
relying on ‘extrinsic motivation’ [coerced or bribed to do it] (Snee and Hoerl, 2003).
The intrinsic motivation can be generated through:
• Employee involvement in project improvement teams or review meetings
• Employee empowerment for their processes
• Training and development for their career progression
• Reward and recognition scheme (Antony and Banuelas, 2002)
The aforementioned features were evidenced in the participating case study firms
during the empirical research.
Step 12: Progression towards learning organization
According to Senge et al (1999) learning organizations are “organizations where
people continually expand their capacity to create the results they truly desire, where
new and expansive patterns of thinking are nurtured, where collective aspiration is set
free, and where people are continually learning to see the whole together”. The basic
rationale for such organizations is that in situations of rapid change only those that are
flexible, adaptive and productive will excel. A progression towards becoming a
learning organization would ensure Six Sigma SMEs to sustain benefits in the long-
term. Some of the key elements that an organization should focus on to become a
learning organization are:
• Regular project review meetings and briefings to enable both management and
employees to share experiences and progress on projects, and factors critical
for its success and failure (Senge et al, 1999)
• Individual and organizational learning should be actively encouraged (Kaye and
Anderson, 1999)
• Benchmarking of an organization’s activities and its progress with internal
(within department) and external competitors
• Regular review of employee training needs, evaluation of their performance and
feedback for improvement
As shown in figure 9.7, communication and leadership commitment plays a key role in
all the four phases for successful implementation of Six Sigma. An early and informed

Chapter 9: Readiness Index and Implementation Framework
Maneesh Kumar 322
strategy for implementation is always necessary and decisions about rolling out the
program in segments or as a whole is often determined by the culture within the
company, time available and the current needs of the organization. In implementing
the framework, it is important that communication of information is effective and that
accountability is explicit and supported by committed senior management team and
strong leaders. Top leaders should make themselves available for staff, keep in touch
with staff and communicate with all managers about the long-term strategies of the
organization. Middle managers play a key role in the success of any change program
(Snee and Hoerl, 2003; Kaye and Anderson, 1999) and their confidence in the
initiative is equally important. Kaye and Anderson (1999) quoted the following finding
in their survey study “Senior management walk around quite a lot and observe. Formal
systems won’t tell them how good quality is, they need to get out there”.
9.5. Summary
The implementation of Six Sigma has not been an easy task for many organizations.
Very little has been published on the implementation aspects of Six Sigma, such as
where to get started or how to get started, etc. The key practical contribution of this
doctoral research is the development of the Six Sigma Readiness Index and the Six
Sigma implementation framework tailored to the needs of SMEs. Both was developed
based on the review of the literature and key findings from an empirical research
conducted over a 3 year period. The literature identified very limited frameworks that
were designed for the needs of SMEs, taking into account their characteristics and
weaknesses. The key findings from multiple case-studies in 10 SMEs led to the
understanding of key constituents required to build a Six Sigma Readiness Index and
an implementation framework for SMEs.
The Readiness Index was designed to identify areas of strengths, weaknesses, and
opportunities for improvement in the organization’s quality management practices. The
purpose of the exercise was to assist SMEs in making right decisions in the
development of a Six Sigma strategy for achieving and sustaining competitiveness.
The cultural readiness and maturity to embark on the Six Sigma journey were
evaluated and tested within three SMEs. Findings from the readiness exercise were
critically analyzed to check the validity of the index.

Chapter 9: Readiness Index and Implementation Framework
Maneesh Kumar 323
The framework provided a structured and step by step approach for implementing Six
Sigma in a SME environment. It is not only imperative to drive improvement from
implementation of Six Sigma initiatives but also to sustain the gains over the long-
term. Phase 4 of the framework suggests the ways to sustain the benefits from Six
Sigma implementation by focusing on intrinsic motivation of employees and sharing
the learning across the firm. The sustainability dimension would accoutre SMEs to
absorb the ripple caused due to any external disruption and make them more resilient
to such changes. The practical applicability of the framework would be further tested
by conducting case studies in companies and also seeking suggestions for
improvement from world-class organizations, academics, and practitioners of Six
Sigma. The author is also working on establishing the time frame for the
implementation of each phase of the framework in consultation with Six Sigma experts
in academics and industry.

Chapter 10: Conclusion
Maneesh Kumar 324
Chapter 10
Conclusion
10.0. Introduction
As stated in Chapter 1, this research was undertaken to assess the status of Six
Sigma implementation in the UK manufacturing SMEs and thereby develop a
customized practical framework to facilitate successful implementation of Six Sigma in
SMEs. This exploratory research identified the research gap in terms of application of
Six Sigma in a SME environment (Antony et al., 2005, 2008; Kumar, 2007)- the
business strategy that has resulted in generating significant savings for many large
organizations (Snee, 2004; Hoerl, 2004; Kumar et al., 2008; Gutierrez et al., 2009;
Antony and Desai, 2009). Researchers have focussed in the past on TQM
implementation in SMEs, CSFs and barriers of TQM in SMEs, framework and model
for TQM implementation in SMEs, and impact of TQM on organizational performance
of SMEs (Ghobadian and Gallear, 1996; Yusof and Aspinwall, 1999, 2000 a, b, c).
Author was inspired by the study of Ghobadian and Gallear (1996) and Yusof and
Aspinwall (1999, 2000 a, b, c) on TQM implementation in SMEs and further extended
it to explore the status of Six Sigma implementation in SMEs.
As there were limited articles published on Six Sigma in SMEs, this research
attempted to answer the five research questions, discussed in the next section, to
make a contribution to the theory and practice of the Six Sigma body of knowledge.
This chapter briefly summarises the key findings from the doctoral research and
discusses how the quality criteria established in Chapter 5 was addressed for this
research. The quality criteria section addresses the reliability and validity of the
research, and its contribution to the theory and the practice. Limitation of research and
agenda for future research was discussed towards the end of this chapter.

Chapter 10: Conclusion
Maneesh Kumar 325
10.1. Key Findings from Empirical Research
RQ1: What makes SMEs different from large organizations?
The literature suggested differences in the characteristics of SMEs compared to large
organizations with respect to criteria such as management style, strategic planning,
systems and procedures, resource availability, organizational structure, operational
improvement, and networking (Ghobadian and Gallear, 1996, 1997; Yusof and
Aspinwall, 2000 a, b; McAdam, 2000; Phelps et al., 2007; Kumar, 2007; Antony et al.,
2008). The findings from the empirical research were in consensus with the literature
review. Leaders and senior management in a SME environment were seen to have
more understanding of processes, operational issues, and customer requirements a
compared to those in large organizations. The advantages of SMEs over their larger
counterparts lie in their effective and open communication channels, low resistance to
change, people orientation, functional integration, and innovativeness. However,
SMEs face disadvantages in the continuous search for operational improvement,
allocation of resources for training and staff development, economies of scale, lack of
forward planning, cash flow problems, lack of investment at the right time, lack of
business experience, little or no external help and limited customer bases. The
participating firms faced the challenge of resource availability to apply Six Sigma.
They also struggled to establish a close network with government bodies and
academic institutions in seeking support on CI training and projects. This is among
very few studies in the quality management (QM) literature that presents the
differences in the characteristics of SMEs and large organizations through the lens of
small business growth models. It also identified the similarity in the critical success
factors (CSFs) stated for small business growth and for the implementation of CI
initiatives in SMEs. The interviewees were in consensus that it would be difficult to
decide on the implementation of a CI program, e.g. making a transition from ISO
certification to Lean/ Six Sigma implementation, depending upon their positioning on
the growth model.

Chapter 10: Conclusion
Maneesh Kumar 326
RQ2: What are the critical differences in quality management practices of Six Sigma
and non-Six Sigma SMEs?
The survey response clearly indicated that very few SMEs are aware of or have
understanding of the Six Sigma initiative. It can be commented that Six Sigma is at its
rudimentary stage in terms of its application in the UK SMEs. Lean was the second
most popular initiative in SMEs after ISO 9000 certification. The findings from this
study gave an indication, similar to findings from literature (Gotzamani, 2004;
Gotzamani and Tsiotras, 2002), that a good QMS such as ISO may be the foundation
or building block to embark on the Six Sigma journey. The implementation of Lean
before Six Sigma was favoured by interviewees for quick gains and minimizing the
resistance to change by employees (Khan et al., 2007). Chapter 7 and 8 clearly
indicated on the difference in QM practices of Six Sigma firms and non-Six Sigma
firms with respect to tools and techniques used for problem solving, organizational
infrastructure, motivation to embark on the quality journey, and customer focus.
Findings from the literature also indicated the positive impact of TQM on the QM
practices of SMEs (Rahman, 2001; Lee, 2004; Ghobadian and Gallear, 1996; Yusof
and Aspinwall, 2000b) as compared to firms having only ISO 9000 certification
(McAdam and McKeown, 1999; Gotzamani, 2004; Gotzamani and Tsiotras, 2002).
The majority of Six Sigma firms had committed management team, established
systems and procedures, had a dedicated cross-functional team for problem solving,
used tools and techniques of quality for problem solving, involved people from
accounting and finance departments to quantify the benefits from Six Sigma projects,
and were in regular contact with customers to understand their needs and
requirements. Such characteristics were missing from the non-Six Sigma firms. The
resource availability for education and training of employees was more prevalent in
the Six Sigma firms as compared to the non-Six Sigma firms. The Six Sigma firms
used the ‘train the trainer’ approach as well as rotation of employees involved in Six
Sigma project to develop a sustainable organizational infrastructure for a long-term
sustainability of benefits realised from Six Sigma.

Chapter 10: Conclusion
Maneesh Kumar 327
RQ3: What are the critical success factors and barriers to implementation of Six
Sigma in SMEs?
Factors identified as critical to the success of the Six Sigma program in SMEs from
surveys and case study analysis were strong leadership and management
commitment, education and training of employees, communication, cultural change,
employee empowerment, role of middle manager, and networking with government
bodies, academic institutions, and OEMs. Networking and the role of middle managers
emerged as new factors from the case study analysis, which was least cited in the
previous study. The empirical findings also indicated that the aforementioned factors
are equally important for any type and size of firms irrespective of the type of initiatives
being implemented in the firm-whether it is Six Sigma, TQM, Lean, or ISO 9000 QMS.
Resource availability to implement CI initiatives or certification systems and to sustain
the benefits on a long-term basis were cited as the most common impeding factors in
the empirical research as well as the literature (Antony et al., 2005, 2008; Kumar,
2007; Yusof and Aspinwall, 1999, 2000b; Ghobadian and Gallear, 1996, 1997).
However, interviewees viewed scarcity of resources as an excuse by top management
for not implementing CI initiatives in SMEs. Other barriers to implementation of Six
Sigma in SMEs were identified as lack of knowledge, poor training/coaching, internal
resistance, poor employee participation, lack of senior management commitment, etc.
RQ4: Does the performance of Six Sigma firms differ from non-Six Sigma firms?
This is among very few studies that had conducted a comparative analysis of
performance of Six Sigma firms and non-Six Sigma firms. The majority of SMEs
embarking on the Six Sigma program had established performance metrics that were
regularly monitored to track the benefits from Six Sigma projects. The savings
generated from Six Sigma projects, as discussed in Section 7.1.4.2, clearly
outweighed the initial investment made at the start of the program. SMEs in the non-
Six Sigma category had less established systems and procedures, and performance
metrics to measure their process performance. Significant differences were observed
between the Six Sigma firms and the non-Six Sigma firms with respect to their scores
for operational and strategic performance metrics. SMEs realised significant
improvement in their established performance metrics after implementing Six Sigma
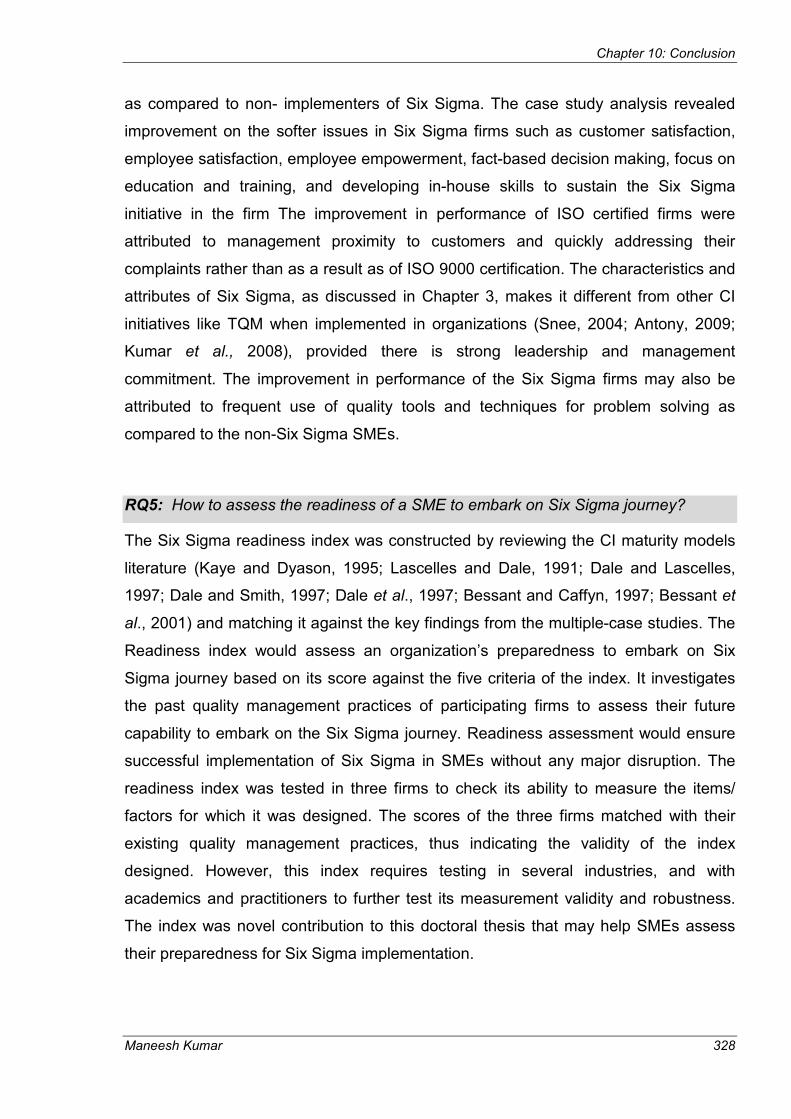
Chapter 10: Conclusion
Maneesh Kumar 328
as compared to non- implementers of Six Sigma. The case study analysis revealed
improvement on the softer issues in Six Sigma firms such as customer satisfaction,
employee satisfaction, employee empowerment, fact-based decision making, focus on
education and training, and developing in-house skills to sustain the Six Sigma
initiative in the firm The improvement in performance of ISO certified firms were
attributed to management proximity to customers and quickly addressing their
complaints rather than as a result as of ISO 9000 certification. The characteristics and
attributes of Six Sigma, as discussed in Chapter 3, makes it different from other CI
initiatives like TQM when implemented in organizations (Snee, 2004; Antony, 2009;
Kumar et al., 2008), provided there is strong leadership and management
commitment. The improvement in performance of the Six Sigma firms may also be
attributed to frequent use of quality tools and techniques for problem solving as
compared to the non-Six Sigma SMEs.
RQ5: How to assess the readiness of a SME to embark on Six Sigma journey?
The Six Sigma readiness index was constructed by reviewing the CI maturity models
literature (Kaye and Dyason, 1995; Lascelles and Dale, 1991; Dale and Lascelles,
1997; Dale and Smith, 1997; Dale et al., 1997; Bessant and Caffyn, 1997; Bessant et
al., 2001) and matching it against the key findings from the multiple-case studies. The
Readiness index would assess an organization’s preparedness to embark on Six
Sigma journey based on its score against the five criteria of the index. It investigates
the past quality management practices of participating firms to assess their future
capability to embark on the Six Sigma journey. Readiness assessment would ensure
successful implementation of Six Sigma in SMEs without any major disruption. The
readiness index was tested in three firms to check its ability to measure the items/
factors for which it was designed. The scores of the three firms matched with their
existing quality management practices, thus indicating the validity of the index
designed. However, this index requires testing in several industries, and with
academics and practitioners to further test its measurement validity and robustness.
The index was novel contribution to this doctoral thesis that may help SMEs assess
their preparedness for Six Sigma implementation.

Chapter 10: Conclusion
Maneesh Kumar 329
Addressing the aforementioned research questions facilitated in understanding of the
status of Six Sigma implementation in the UK SMEs and designing a customized five
phase Six Sigma framework tailored to the needs of SMEs. The framework was
designed by evaluating and including the key findings from the RQ1-RQ5 in the five
phases of the framework. SMEs passing the Six Sigma readiness test are ready to
embark on Six Sigma journey using the proposed framework. SMEs adherence to the
framework may facilitate successful implementation of Six Sigma as well as sustaining
its benefits on a long-term basis. The framework will be tested in future to gauge its
feasibility and ease of implementation in a SME environment. This was another major
contribution to this doctoral work.
10.2. Quality of Research
In order to ensure that research is fully completed, it is not only important to answer
the research questions but also to ensure that high quality research standards are
achieved in several aspects of this research against the set criteria (as discussed in
Section 5.3 and table 5.11). This section includes discussion on how the quality
criteria of reliability and validity were enhanced (Easterby-Smith et al., 2002; Yin,
2003; Voss et al., 2003) and contribution made to the Six Sigma body of knowledge
and practice. The summary of quality criteria for this research is presented in table
10.1. Here, reliability refers to “the extent to which your data collection techniques or
analysis procedures will yield consistent findings” (Easterby-Smith et al., 2002), while
validity refers to the issue of whether the set of indicators “devised to gauge a concept
really measures that concept” (Bryman and Bell, 2007).
Table 10.1: Quality criteria for this doctoral research
Quality Criteria Criteria addressed in this research Criteria fulfilled YES/ NO
Reliability Survey: Adaption and use of survey instrument from previous research
Case study: Use of Interview protocol, case documentation and review, database generation
YES
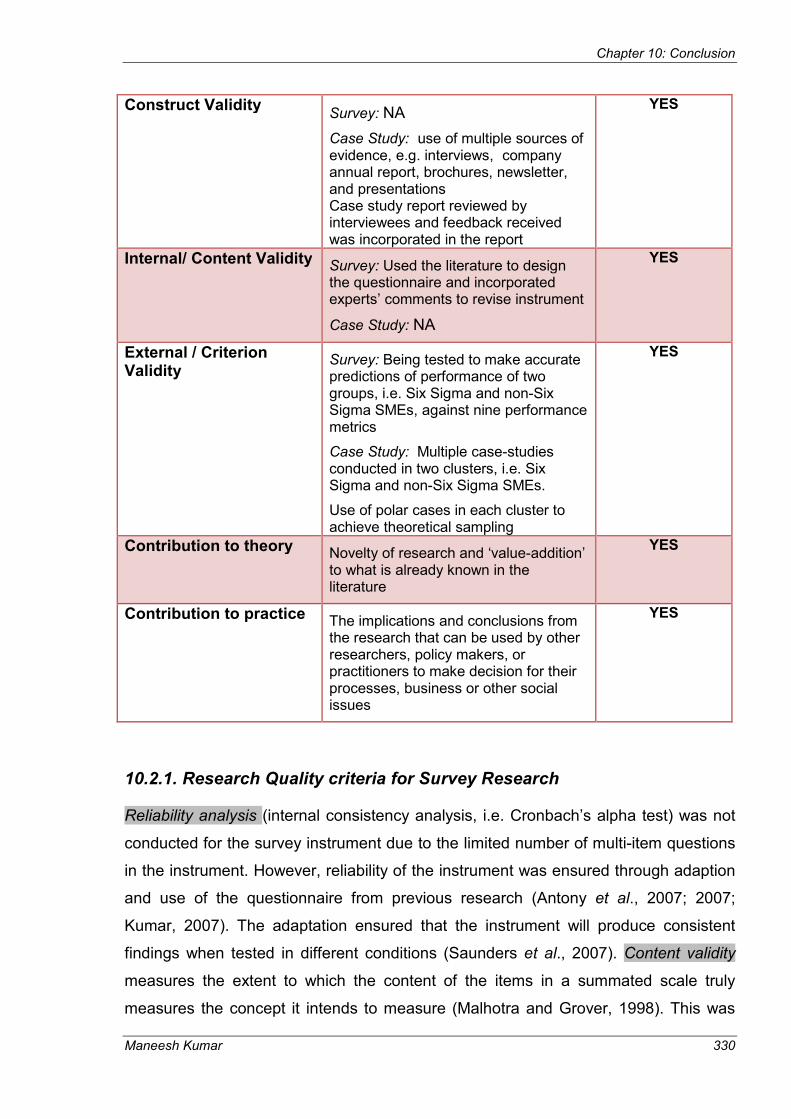
Chapter 10: Conclusion
Maneesh Kumar 330
10.2.1. Research Quality criteria for Survey Research
Reliability analysis (internal consistency analysis, i.e. Cronbach’s alpha test) was not
conducted for the survey instrument due to the limited number of multi-item questions
in the instrument. However, reliability of the instrument was ensured through adaption
and use of the questionnaire from previous research (Antony et al., 2007; 2007;
Kumar, 2007). The adaptation ensured that the instrument will produce consistent
findings when tested in different conditions (Saunders et al., 2007). Content validity
measures the extent to which the content of the items in a summated scale truly
measures the concept it intends to measure (Malhotra and Grover, 1998). This was
Construct Validity Survey: NA
Case Study: use of multiple sources of evidence, e.g. interviews, company annual report, brochures, newsletter, and presentations Case study report reviewed by interviewees and feedback received was incorporated in the report
YES
Internal/ Content Validity Survey: Used the literature to design the questionnaire and incorporated experts’ comments to revise instrument
Case Study: NA
YES
External / Criterion Validity
Survey: Being tested to make accurate predictions of performance of two groups, i.e. Six Sigma and non-Six Sigma SMEs, against nine performance metrics
Case Study: Multiple case-studies conducted in two clusters, i.e. Six Sigma and non-Six Sigma SMEs.
Use of polar cases in each cluster to achieve theoretical sampling
YES
Contribution to theory Novelty of research and ‘value-addition’ to what is already known in the literature
YES
Contribution to practice The implications and conclusions from the research that can be used by other researchers, policy makers, or practitioners to make decision for their processes, business or other social issues
YES
Chapter 10: Conclusion
Maneesh Kumar 331
achieved by reference to the literature and experts well versed in the domain. The
author used the literature to design the questionnaire and incorporated experts’
comments to ensure the content validity. The most common validation in survey
research is the construct validity that measures whether the set of items constituting a
measure is an appropriate operational definition of the theoretical construct measured
(Flynn et al., 1990). Construct validity is not required to be tested when the survey
instrument does not use multiple-item measurement scales (Rungtusanatham et al.,
2003). Thus, the construct validity test was not required in the author’s research
project due to the limited number of multi-item questions in the survey instrument. The
criterion-related validity refers to the ability of the scale to investigate the relationship
between predictor variables and the external variable (objective outcome or criterion).
The criterion-related validity is established when the measure differentiates individuals
on a criterion it is expected to predict (Nunnally, 1978; Forza, 2002; Saunders et al.,
2007). In this study, the author was interested in comparing the similarity / differences
in the performance of Six Sigma and non-Six Sigma firms against nine performance
metrics established from the literature, criterion-related validity was being tested to
make accurate predictions of the performance of two groups, i.e. Six Sigma and non-
Six Sigma SMEs. Flynn et al (1990) suggests the use to summated scales from the
past research with established validity and reliability to counteract with the difficultly of
establishing validity and reliability in the new research.
10.2.2. Research Quality criteria for Case Study Research
In case study, reliability is ensured by designing a case-study protocol and developing
a case study database so that data collection procedures can be repeated with similar
results when another investigator repeats the study (Yin, 2003; Easterby-Smith et al.,
2002). Interview protocol and case study databases/ reports were developed to
ensure the reliability of this doctoral research. Moreover qualitative data was analyzed
using tables, figures, and a 2 x 2 matrix to ensure similar interpretation of the key
findings from the case study. Construct validity was achieved in this research through
use of multiple sources of evidence using semi-structured interviews with senior /
middle management teams at company sites, non-participant observations during
visits, documentation (company annual report, brochures, newsletter, and
presentations) and getting the consent from interviewees on the contents of the

Chapter 10: Conclusion
Maneesh Kumar 332
company report created from interview process. Internal validity was not considered
in this study due to the exploratory nature of the study in which no attempt was made
to establish the causal relationship between variables, which is more focused in an
explanatory case study. External validity refers to generalization of a study’s findings
beyond the immediate case study (Yin, 2003, Easterby-Smith et al. 2002; Voss et al.,
2003). While exploring or building theory from case study, replication logic rather than
sampling logic is used to predict either similar results [literal replication] or
dichotomous results for predictable reasons [theoretical replication] (Voss et al.,2002;
Eisenhardt, 1989; Miles and Huberman, 1994). Thus the case study focuses more on
analytical/theoretical generalization (as compared to survey, where statistical
generalization is the preferred path) and research is striving to generalize a particular
set of findings to a broader theory. Multiple case studies were conducted (using the
concept of theoretical sampling) in Six Sigma and Non-Six Sigma SMEs to establish
the external validity (theoretical generalization) for this research. Multiple case studies
of the participating firms included polar cases in both cluster- Six Sigma and non-Six
Sigma firms, to achieve the concept of theoretical sampling (Eisenhardt, 1989).
10.2.3. Contribution to theory/ knowledge
A researcher is expected, in the domain of their research area, to contribute to the
theory/knowledge in terms of novelty of research and ‘adding value’ to what is already
known in the literature. The researcher can make a contribution to knowledge in the
following ways (Ates, 2008) by: confirming to existing theories; extending existing
theory into new areas; advances in methodology; development in the application of
techniques; generating hypotheses, grounded theory, or insights; rejecting null-
hypotheses and accepting alternate-hypotheses, to name a few. This research
adopted a mixed method approach to contribute to the advancement in methodology
application within the Six Sigma research in SMEs. The author had made a
contribution to theory by answering the five research questions established at the
outset of this research and developing a better understanding and know-how of a less
explored research area of ‘Six Sigma for the Little Guy’.
The Six Sigma body of knowledge was enriched through the following contributions
from this research:

Chapter 10: Conclusion
Maneesh Kumar 333
� This research demystifies the prevalent myth in Six Sigma literature that Six
Sigma can only be implemented in large organizations. The empirical research
had clearly demonstrated successful implementation of Six Sigma in SMEs of
sizes ranging from 35 to 240 headcount.
� The research developed better understanding of differences in characteristics
between SMEs and large organizations with respect to quality management
practices by combining the literature of growth of small firms with quality
management (RQ1). This is among very few instances when researchers have
linked the literature on small business growth models to quality management
practices in SMEs.
� Better understanding of quality management practices of SMEs was developed
by comparing and contrasting the similarities/differences in QM practices of Six
Sigma and non-Six Sigma SMEs (RQ2). Some similarities as well as polar
results were observed while comparing the QM practices across the two
clusters. The research also indicated that ISO or similar systems may be the
foundation or building block to embark on the Six Sigma journey.
� The CSFs study clearly indicated that all CSFs are equally important for
organizations to embark on the CI journey and is independent of type of CI
initiatives or certification systems undertaken by firms, i.e. factors identified as
critical for the Six Sigma firms are equally important for the non-Six Sigma firms
(RQ3). Networking and role of middle managers were the two new CSFs that
emerged from this empirical research.
� Better understanding of challenges faced by SMEs while embarking on the CI
journey of Six Sigma or Lean and introspection on how to overcome such
barriers (RQ3).
� The research clearly demonstrated the differences in performance of Six Sigma
and non-Six Sigma SMEs and explicated its link to existing QM practices in the
respective organizations (RQ4). Six Sigma SMEs outperformed non-Six Sigma
firms against the established criteria to measure the success of program.
� Development of criteria, based on empirical research and literature review, to
assess whether a SME is ready to embark on Six Sigma journey, i.e. assessing
organizational preparedness for Six Sigma (RQ5). Criteria developed to
Chapter 10: Conclusion
Maneesh Kumar 334
measure Six Sigma readiness index was further tested in sample firms to
assess the validity of the instrument.
10.2.4. Contribution to practice
The implications and conclusions from the research that can be used by other
researchers, policy makers, or practitioners to make decisions for their processes,
business or other social issues is referred as contribution to practice. The researcher
can make a contribution either by developing frameworks, models, guidelines, road
maps, policy or provide suggestions for changes/improvements related to business or
other social issues.
The practical contributions made by this research are listed below:
� Development of a valid and novel Six Sigma Readiness Index to assess
organizational preparedness for smoother implementation of Six Sigma without
causing any major disruption during the deployment process.
� Improved understanding of the key ingredients required by SMEs before
embarking on the Six Sigma journey
� Development of a novel and practical Six Sigma framework, customized to
the needs of SMEs, to facilitate implementation and long-term sustainability of
benefits realised from Six Sigma.
� Readiness assessment is the prerequisite for SMEs to fulfil before starting
to use the customized Six Sigma framework to facilitate its implementation
� Lean may be used for the first round of improvement in SMEs before
embarking on Six Sigma as it facilitates a quick win and results are very visual
� Improved understanding among SMEs in reference to the relationship
between Six Sigma implementation and organizational performance.
� The research clearly indicated the role played by government funded bodies
such as MAS and MI, and academic institutions in facilitating knowledge
transfer of best-in-class practices of CI initiatives such as Lean and Six Sigma.
Government bodies should take requisite measures to communicate the
different types of funding available for SMEs and other supports they can seek

Chapter 10: Conclusion
Maneesh Kumar 335
from institutions such as MAS. Current awareness of the existence of such
organizations and the type of support provided is unclear to SMEs. Formation
of Six Sigma user groups for SMEs, funded by government, may help in raising
awareness and sharing of best practices among SMEs by conducting regular
events, conferences, workshops and seminars on CI.
The key contributions of this research that makes it different from the previous
research work or literature were summarised in table 10.2.
Table 10.2: The novel contributions of this doctoral research
Research Questions Novel Contributions*
RQ1: What makes SMEs different from large organizations?
� Identified the differences between two clusters by reviewing the literature on the small business growth models and combining it with findings from the QM literature.
� This is among very few studies in QM literature that presents the difference in characteristics of SMEs through the lens of small business growth models.
� Also made an attempt to understand the maturity of a firm on a CI journey by reflecting on the growth models of small businesses
RQ2: What are the critical differences in quality management practices of Six Sigma and non-Six Sigma SMEs?
Many key findings were similar to that proposed in literature; the novelty lies in the identification of following:
� ISO certification is beneficial for SMEs provided they follow it religiously
� ISO foundation to embark on the CI journey of Lean and Six Sigma (in literature, this proposition was not clearly stated)
� Lean is good for first round of improvements in SMEs as it provides quick win and breaks down the resistance to change- gives a platform to embark on Six Sigma
� The involvement of accounting and finance departments was identified as critical in the quantification of benefits generated from the Six Sigma projects
� To have minimal effect of scare resource, rotation policy of BBs and other employee involved in Six Sigma project to build a sustainable organizational infrastructure in SMEs; also suggested train the trainer approach to build their human capital on Six Sigma
RQ3: What are the critical success factors and barriers to implementation of Six Sigma in SMEs?
Key findings in this section was similar to literature on CSFs & challenges, except the following
� Networking and role of the middle managers identified as two new factors emerging from this study;
� Past literature on QM had limited discussion on the role played by government bodies or academic institutions in driving change in a SME environment
� Resource constraint is an excuse for senior management
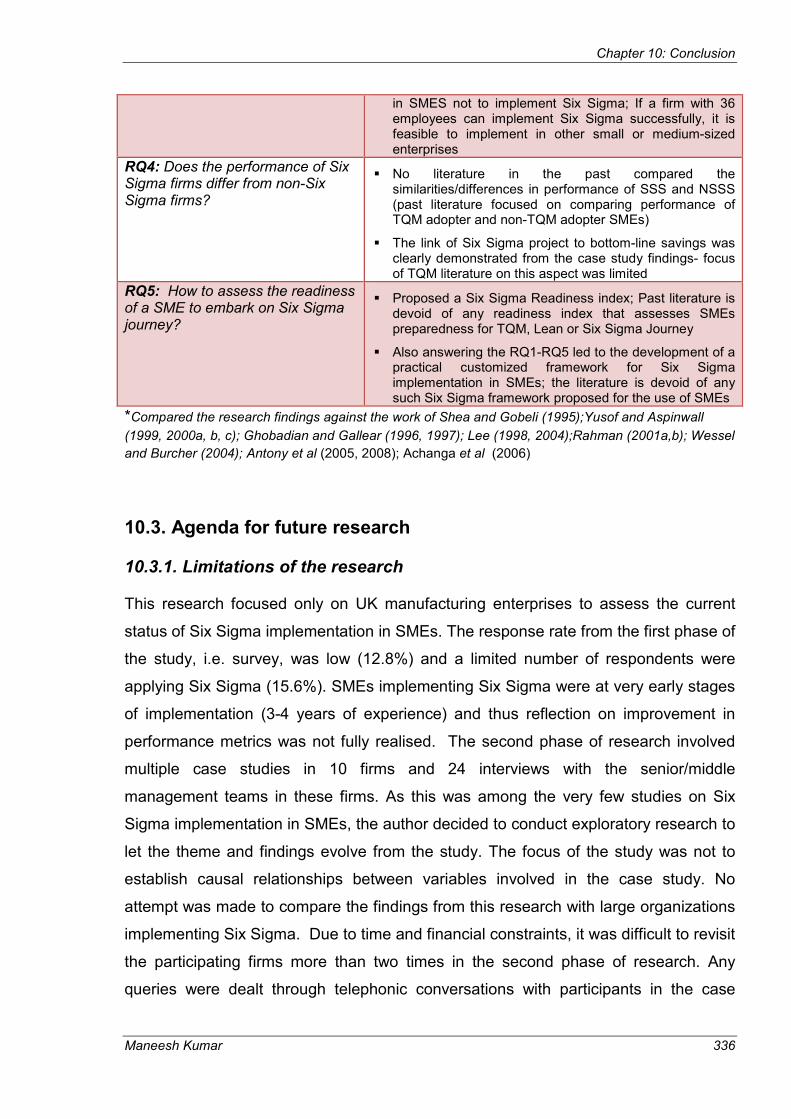
Chapter 10: Conclusion
Maneesh Kumar 336
in SMES not to implement Six Sigma; If a firm with 36 employees can implement Six Sigma successfully, it is feasible to implement in other small or medium-sized enterprises
RQ4: Does the performance of Six Sigma firms differ from non-Six Sigma firms?
� No literature in the past compared the similarities/differences in performance of SSS and NSSS (past literature focused on comparing performance of TQM adopter and non-TQM adopter SMEs)
� The link of Six Sigma project to bottom-line savings was clearly demonstrated from the case study findings- focus of TQM literature on this aspect was limited
RQ5: How to assess the readiness of a SME to embark on Six Sigma journey?
� Proposed a Six Sigma Readiness index; Past literature is devoid of any readiness index that assesses SMEs preparedness for TQM, Lean or Six Sigma Journey
� Also answering the RQ1-RQ5 led to the development of a practical customized framework for Six Sigma implementation in SMEs; the literature is devoid of any such Six Sigma framework proposed for the use of SMEs
*Compared the research findings against the work of Shea and Gobeli (1995);Yusof and Aspinwall (1999, 2000a, b, c); Ghobadian and Gallear (1996, 1997); Lee (1998, 2004);Rahman (2001a,b); Wessel
and Burcher (2004); Antony et al (2005, 2008); Achanga et al (2006)
10.3. Agenda for future research
10.3.1. Limitations of the research
This research focused only on UK manufacturing enterprises to assess the current
status of Six Sigma implementation in SMEs. The response rate from the first phase of
the study, i.e. survey, was low (12.8%) and a limited number of respondents were
applying Six Sigma (15.6%). SMEs implementing Six Sigma were at very early stages
of implementation (3-4 years of experience) and thus reflection on improvement in
performance metrics was not fully realised. The second phase of research involved
multiple case studies in 10 firms and 24 interviews with the senior/middle
management teams in these firms. As this was among the very few studies on Six
Sigma implementation in SMEs, the author decided to conduct exploratory research to
let the theme and findings evolve from the study. The focus of the study was not to
establish causal relationships between variables involved in the case study. No
attempt was made to compare the findings from this research with large organizations
implementing Six Sigma. Due to time and financial constraints, it was difficult to revisit
the participating firms more than two times in the second phase of research. Any
queries were dealt through telephonic conversations with participants in the case

Chapter 10: Conclusion
Maneesh Kumar 337
study. Design of the Six Sigma Readiness Index and framework was based on the
key findings from the small sample and matching it with the literature. Both the
framework and index were only tested in 3 SMEs for its robustness and validity. All
the aforementioned facts may limit the statistical generalizability of the findings.
10.3.2. Future research directions
The author, from his experience, holds a belief that until you sail through an arduous
task, you can’t comment on how you could have done this work differently or how you
could improve this work in future. Just as quality is a CI journey, the whole PhD
process and outputs produced also requires further refinement or improvement. The
aforementioned paragraph introduced some of the limitations of this doctoral research,
which could be improved in future to make the findings more generalizable to the
larger population. Some of the possible ways to address the generalizability issue are
listed below:
1. Increasing the scope of Six Sigma research in SMEs by including service firms
as well SMEs from across Europe and other continents. This will provide a
better picture of the status of Six Sigma implementation in SMEs across the
globe. This may also facilitate in identifying whether the culture of a country has
any impact on the success of Six Sigma.
2. The survey and case study research should also include large organizations to
do a comparative analysis of differences in QM practices of SMEs against their
larger counterparts
Proposition that could be tested based on aforementioned statement is
Proposition 1: QM practices in firms implementing Six Sigma is independent of
the size of the firm
3. This study can act as a base to conduct further explanatory research to
statistically establish the causal relationship between CI initiatives, QM
practices, and organizational performance of SMEs
The aforementioned statement leads to following proposition:

Chapter 10: Conclusion
Maneesh Kumar 338
Proposition 2a: There exists a causal relationship between the implementation
of CI initiatives like Lean/ Six Sigma and organizational performance
Proposition 2b: There exists a causal relationship between quality
management practices and organizational performance, with CI initiatives like
Lean/Six Sigma acting as the mediating factor
4. Future research should also explore the relationship between ISO certification
and Six Sigma implementation, as this research has given an indication of ISO
being base or building block to embark on the Six Sigma journey
The aforementioned statement leads to following proposition:
Proposition 3: Good Quality Management System can act as a building block
to embark on the Six Sigma journey
5. The knowledge, usage, and usefulness of tools and techniques of CI and its
impact on performance of SMEs needs further exploration
The link between tools usage and performance leads to following proposition:
Proposition 4: There exists a causal relationship between usage of tools / and
techniques of CI and organizational performance
6. This research did not focus on establishing the organizational infrastructure for
Six Sigma implementation in SMEs, i.e. number of Black Belts (BB), Green
Belts, and Yellow Belts required in SME environment. There exists a rule of
thumb for large organizations, i.e. for every 100 employees, you can have 1BB,
and 10 GB. Future research may also focus on whether SMEs need Black Belt
for project execution as it requires significant initial investment
Following proposition is deduced from aforementioned statement
Proposition 5a: The number of Black Belts and Green Belts required in a SME
environment is different from that required in large organizations

Chapter 10: Conclusion
Maneesh Kumar 339
Proposition 5b: Black Belt is not required in SMEs to conduct Six Sigma
projects
7. The savings generated from the BB and the GB project in a SME environment
is different from that generated in large organizations. This could be another
area for further exploration to establish the right figure for project savings
generated from a BB project in a SME
Saving from Six Sigma projects in SMEs leads to following proposition
Proposition 6: The savings generated from Black Belt and Green Belt project
in SMEs is different from that in large organizations
10.4. Critical Reflection
About 20 years have passed since the birth of Six Sigma in Motorola. Now the
important question is “Is Six Sigma sustainable in the 21st century? How long?”. I
believe that Six Sigma is sustainable, and will last for a long time. The answer to the
question “Is Six Sigma a passing fad?” is clearly no. Six Sigma is neither a fad nor just
another quality initiative. It is a ‘way of life’. It is a business strategy based on objective
decision making and problem solving, relying on meaningful and real data to create
actionable goals, analyzing root cause(s) of defects, and thus suggesting the ways to
eliminate the gap between existing performance and the desired level of performance.
Six Sigma will keep on building its momentum in almost all types of industries,
irrespective of the size and turnover, with no signs of giving up in the immediate
future. The challenge for all organisations is to integrate Six Sigma into their core
business processes and operations rather than managing it as a separate initiative. In
author’s opinion, Six Sigma will continue to grow as a powerful management initiative
for achieving and sustaining operational and service excellence. It might evolve into a
‘new package’ when it fails to achieve significant returns to the bottom-line. However,
the sound principles and key concepts of Six Sigma will stay with it for many years
(Snee, 2004, Antony, 2008a). In future, the Six Sigma toolkit will be enriched by the
continuous emergence of new useful tools and techniques, especially in the software,
Chapter 10: Conclusion
Maneesh Kumar 340
finance and healthcare applications. I believe that organisations developing and
implementing Six Sigma strategy should not view it as an advertising banner for
promotional purposes.
Some of the emerging research trends of Six Sigma include: integration of Six Sigma
with Lean Manufacturing, Agile Manufacturing, Quick Response Manufacturing, and
Theory of Constraints; development in new application areas such as healthcare,
finance, sales, human resources, software engineering; integration of Six Sigma with
other quality improvement initiatives such as ISO 9001:2008, and EFQM Excellence
Model; selection of Design for Six Sigma (DFSS) strategy over Six Sigma – based on
a number of variables such as risk, technology, customer demands, time, cost and
complexity; tailoring the existing Six Sigma DMAIC methodology for SMEs; the
relationship between Six Sigma and organisational culture and learning; integration of
eco-effective design into the DFSS processes to foster healthy and prosperous
conditions for humans and ecological systems by reusing materials and components
in natural biological or technical cycles; integration of DFSS with lean thinking, may be
called as ‘Design for Lean Sigma’. One of the areas that need further exploration is
the relationship between Six Sigma and innovation. Does Six Sigma facilitate
innovation or hamper innovation by following a structured and disciplined approach?
How do DFSS foster innovation compared to Six Sigma? Very limited research has
been done to date on relationship between Six Sigma and innovation. This is a very
promising area of research that needs further exploration.
Though Six Sigma is a well established quality management program that had
resulted in dramatic improvement in the bottom-line savings, its application in the UK
large organizations is not prevalent. What chance do their supply chain partners (in
most cases are SMEs) have to be aware of or implement Six Sigma? Six Sigma had
helped many companies appearing in the Fortune 500 list to improve their process
efficiency and effectiveness. It is now considered as a management philosophy in
many world-class companies that had changed the thinking process of employees in
these companies. I was involved in organizing 6-7 conferences and workshops on Six
Sigma in the UK in the last five years. It was shocking to see the minimal participation
of the UK industry and academic fraternity in the conference/workshop as compared
to the delegates coming from the USA (where Six Sigma was born in Motorola) and
other European countries. More than 70% of the delegates in the aforementioned
Chapter 10: Conclusion
Maneesh Kumar 341
conferences were from the USA. This shows the commitment of the USA counterpart
in the CI journey as compared to the UK.
I have often heard people giving the excuse that Six Sigma is more Americanised and
so it is not applicable within the UK context. I am not sure if such an excuse is
acceptable, especially when the UK industry is facing stiff challenge from the low cost
South Asian economy. In my experience, the main reasons for low implementation of
Six Sigma in the UK are as follows: Six Sigma involves many statistical tools and
techniques, which many process engineers/quality managers/ operation directors in
the UK are not comfortable to use for process improvement. This problem keeps on
appearing in the news and tabloid press that the UK schools are struggling to find
good teachers in Maths and Statistics. In many Business School across the UK,
statistics and mathematics calculations are kept to a minimum in the programs offered
to students. What chances do we have to improve our skills, if we don’t get the basics
right at the School and the University level? I don’t blame SMEs for not implementing
initiatives like Six Sigma as they are not pressurised by their OEMs to do so. Lean is
more popular in the UK SMEs compared to Six Sigma as it involves visual tools and
techniques that can be comprehended by any layman.
As witnessed from the case study analysis, SMEs that have implemented Six Sigma
without taking a cutting corner approach (e.g. A, B, C, and E) have reaped significant
benefits both in the hard and soft performance metrics. Few sample firms were lucky
to get support from their OEMs or parent company, or academic institutions, or
government bodies like MAS, SMAS, and MI. The question is how many SMEs are
lucky to get that support or are aware of such support system existing? Here the role
of academic institutions, government bodies, and OEMs are very crucial in raising the
awareness of CI initiatives and facilitating SMEs to implement such initiatives.
Government bodies like SMAS, MAS, and MI were formed to help the UK SMEs in
improving their process efficiency and effectiveness. The initial diagnostic services
provided by consultants, working for the government bodies, are free for SMEs and
thereafter they offer services at much subsidised rate. These bodies try to help those
SMEs who approach them to discuss their quality or process related issues or have
expressed some interest in the CI initiative(s).
Similarly academic institutions offer support to SMEs through the KTP program to
resolve their operational problems in the firm. The SMEs approaching government
Chapter 10: Conclusion
Maneesh Kumar 342
bodies or academic institutions are aware of such support systems and are also very
keen to improve their operational efficiency. Out of 4.5 million enterprises in the UK
(DTI, 2006), 99.9% are SMEs. How many of these SMEs are aware of such support
provided by government and academics? Hardly 1-2% of the SMEs population are
aware of the opportunities to collaborate or network with government bodies and
academic institutions. I think there should be some changes in government policies
(in redefining the roles and responsibilities of bodies like MAS and MI) and requires
active involvement of academics in the UK (by organizing more conferences,
seminars, and workshops on CI initiatives). This would raise awareness of the support
available for SMEs to improve their operational efficiency and effectiveness. Very few
universities (5-6) in the UK are involved in Six Sigma research and offering training
support to SMEs or larger organizations. I think the UK is 10 years behind in terms of
knowledge and application of CI initiatives compared to the USA. Academic institution
and government bodies have got a huge role to play here in making the UK
manufacturing and service industry globally competitive.
From the research design perspective, I have witnessed that many PhD students stick
to one paradigm (either positivist or phenomenological paradigm) while researching an
operations management topic. The analysis of articles published in two of the best
journals in the area of Operations Management (Journal of Operations Management
[4*] and International Journal of Operations and Production Management [3*])
indicated that majority of academics and research students in USA takes a positivist
stance compared to phenomenological stance taken by their UK counterpart. The
reasons stated by some researchers such as Meredith (1998), Boyer and Swink
(2008) and my own comprehension indicates that researchers don’t want to leave their
comfort zone. The decisions to choose the research paradigm were largely influenced
by their previous experience of using the qualitative or quantitative approaches to their
research problems. However, the choice of paradigm should be based on the type of
research questions established at the start. I am very quantitative person and enjoy
playing with numbers. I should have only used positivist paradigm to finish my doctoral
research. However, I chose to use a mixed method approach of positivist and
phenomenological paradigm to address my research questions. As Six Sigma in
SMEs is a new and developing area of research with limited theoretical knowledge
about its application within SMEs context, it was rational to use a mixed method
Chapter 10: Conclusion
Maneesh Kumar 343
approach so that the new theory is generated and tested in the sample firms. It was
clearly stated in Chapter 4 and Chapter 5 that mixed methods minimizes the limitation
of individual approach to research and is therefore beneficial in getting enriched
information on a phenomenon of interest. However, I am afraid that mixed method
approach is not popular in the UK doctoral research. I think it would be wrong to blame
only Doctoral students for this choice. Their supervisors or Director of Studies have
huge role to play in deciding the choice of philosophical paradigm. Similar to students,
Director of Studies (in most cases) also don’t want to leave their comfort zone and
thus stick to one paradigm which they are very comfortable with. I hope this approach
to research would change in future by raising more awareness of mixed methods in
operations management conferences, and publication of more articles on mixed
methods in the best journals of operations management.
The author had presented and published key findings from this research in
some International conferences and peer reviewed journals, the details of which
are listed in Appendix V.
References
Maneesh Kumar 344
References
Aalbregtse, R.J., Hejka, J.A., and McNeley, P.K., (1991). Total quality management (TQM): how do you do it?. Automation, 9(1):30-32.
Achanga, P., Shehab, E., Roy, R. and Nelder, G. (2006).Critical success factors for lean implementation within SMEs. Journal of Manufacturing Technology Management, 17 (4): 460-471
Ackroyd, S. (1996). The Quality of Qualitative Methods: Qualitative or Quality Methodology for organization studies. Organization, 3(3):439-51.
Acs, Z. J., and Audretsch, D. B. (1990). Innovation and Small Firms. Cambridge: The MIT Press.
Adams,C., Gupta, P., and Wilson, C. (2003). Six Sigma Deployment. Burlington, MA, USA: Butterworth-Heinemann,
Ahire, S.L., and Golhar, D.Y. (1996). Quality management in large versus small firms: an empirical investigation. Journal of Small Business Management, 34(2):1-13
Ahire, S.L., Waller, M.A., Golhar, D.Y. (1996). Quality management in TQM versus non-TQM firms: an empirical investigation. International Journal of Quality & Reliability Management, 13(8):8-27
Ahmed, S., and Hassan, M. (2002). Survey and case investigations on application of quality management tools and techniques in SMIs. International Journal of Quality & Reliability Management, 20(7):795-826
Ahmed, S., M. Hassan, H., and Taha, Z. (2004). State of implementation of TPM in SMIs: a survey study in Malaysia. Journal of Quality in Maintenance Engineering, 10(2): 93 - 106.
Aldrich, H., & Martinez, J. E. (2001). Many are called but Few are Chosen: An Evolutionary Perspective for the Study of Entrepreneurship. Entrepreneurship, Theory and Practice, 25(4), 41-47.
Altheide, D. L. and Johnson, J. M. (1994). Criteria for assessing interpretativist validity in qualitative research. Handbook of Qualitative Research, Thousand Oaks, CA: Sage Publications, pp. 485–499.
Amaratunga, D., Baldry, D. and Sarshar, M. (2001). Process Improvement Through Performance Measurement: The Balanced Scorecard Methodology. Work Study, 50(5):179-188
Anderson, M., and Sohal, A. (1999). A study of the relationship between quality management practices and performance in small businesses. International Journal of Quality & Reliability Management, 16(9):859-77
Anjard, R.P. (1998). Total quality management: key concepts. Work Study, 47(7): 238–247
Antony, J. (2004a). Some pros and cons of Six Sigma: an academic perspective. The TQM Magazine, 16(4): 303-306.
Antony, J. (2004b). Six Sigma in the UK Service Organisations: results from a pilot survey. Managerial Auditing Journal, 19(8):1006-1013.

References
Maneesh Kumar 345
Antony, J. (2006). Six Sigma for service processes. Business Process Management Journal, 12(2): 234-248.
Antony, J. (2008b). Can Six Sigma be effectively implemented in SMEs?. International Journal of Productivity and Performance Management, 57(5), 420-423
Antony, J. (2009). Six Sigma vs TQM: some perspectives from leading practitioners and academics. International Journal of Productivity and Performance Management, 58(3):274-279
Antony, J. and Banuelas, R. (2001). A strategy for survival. Manufacturing Engineer, 80 (3): 119–121.
Antony, J. and Banuelas, R. (2002). Key ingredients for the effective Implementation of Six Sigma program. Measuring Business Excellence, 6(4):20-27.
Antony, J., (2008a). What is the role of academic institutions for the future development of Six Sigma?. International Journal of Productivity and Performance Management, 57(1):107-110
Antony, J., and Desai, D. (2009). Assessing the status of six sigma implementation in the Indian industry: Results from an exploratory empirical study. Management Research News, 32(5):413-423
Antony, J., and Taner, T. (2003). A conceptual framework for the effective implementation of statistical process control. Business Process Management Journal, 9(4): 473-489.
Antony, J., Antony, F.J., Kumar, M., and Cho, B.R. (2007). Six Sigma in Service Organisations: Benefits, Challenges and Difficulties, Common Myths, Empirical Observations and Success Factors. International Journal of Quality and Reliability Management. 24(3):294-311
Antony, J., Kumar, M. and Madu, C.N. (2005). Six Sigma in Small and Medium Sized UK Manufacturing Enterprises: Some Empirical Observations. International Journal of Quality and Reliability Management, 22(8):860-874.
Antony, J., Kumar, M., & Labib, A. (2008). Gearing Six Sigma into UK Manufacturing SMEs: An Empirical assessment of Critical Success factors, Impediments, and viewpoints of Six Sigma implementation in SMEs. Journal of Operations Research Society, 59(4): 482-493.
Antony,J., Escamilla,J.L., and Caine, P. (2003). Lean Sigma. Manufacturing Engineer, 82 (4): 40–42
Arnheiter, E. and Maleyeff, J. (2005).The integration of lean management and six sigma. The TQM Magazine, 17(1):5-18
Arumugam, V., Ooi, K.-B.,and Fong, T-C. (2008). TQM practices and quality management performance: An investigation of their relationship using data from ISO 9001:2000 firms in Malaysia. The TQM Journal, 20(6): 636 - 650.
Arya, D., and Callaly, T., (2005). Using continuous quality improvement to implement a clinical governance framework in a mental health service. Australian Psychiatry,13 (3):241-246.
Asher, J.M. (1992). Implementing TQM in Small and Medium Sized Companies. Hertfordshire: Technical Communication (Publishing) Ltd.
References
Maneesh Kumar 346
Askin, R.G., Goldberg, J.B. (2001). Design and Analysis of Lean Production Systems. New York: Wiley
Ates, A. (2008).Strategy Process in manufacturing SMEs. PhD Thesis, Glasgow: University of Strathclyde, Thesis no. : T12174
Badri, M.A., Davis, D. and Donald, D. (1995). A study of measuring the critical factors of quality management. International Journal of Quality & Reliability Management, 12(2):36-53.
Baker, W. H., Addams, H. L., and Davis, B. (1993). Business planning in successful small firms. Long Range Planning, 26(6), 82-88.
Banuelas, R. and Antony, J. (2004). Modified Analytic Hierarchy Process to incorporate managerial aspects and uncertainty. International Journal of Production Research. 42(8):3851-3872
Banuelas, R. C., and Antony, J. (2002). Critical success factors for the successful implementation of six sigma projects in organizations. The TQM Magazine, 14(2): 92-99.
Barbosa, T., and Fuller, T. (2007). Entrepreneurs and their personal and business relations: shaping manufacturing SMEs global strategy. In L. Lloyd-Reason & L. Sear (Eds.), Trading Places- SMEs in the Global Economy (pp. 81). Cheltenham, UK: Edward Elgar Publishing Limited.
Barnes, D. (2001). Research methods for the empirical investigation of the process of formation of operations strategy. International Journal of Operations and Production Management, 21(8):1076-1095.
Barnes, D. (2002). The manufacturing strategy formation process in small and medium-sized enterprises. Journal of Small Business and Enterprise Development, 9(2): 130-149.
Barnes, M., Dickinson, T., Coulton, L., Dransfield, S., Field, J., Fisher, N., et al. (1998). A new approach to performance measurement for small to medium enterprises. Paper presented at the Proceedings of the Performance Measurement- Theory and Practice Conference, Cambridge.
Barrier, M. (1992). Small firms put quality first. Nation’s Business, May:22-32
Barringer, B. R., Jones, F. F., and Neubaum, D. O. (2005). A quantitative content analysis of the characteristics of rapid-growth firms and their founders. Journal of Business Venturing, 20(5): 663-687.
Beaver, G., and Prince, C. (2004). Management, strategy and policy in the UK small business sector: a critical review. Journal of Small Business and Enterprise Development, 11(1): 34-49.
Becchetti, L., & Trovato, G. (2002). The determinants of growth for small and medium-sized firms - The role of the availability of external finance. Small Business Economics, 19(4): 291-300.
Beheshti, H. M., and J. G. Lollar (2003). An Empirical Study of US SMEs Using TQM.TQM and Business Excellence, 14(8):839-847
Bendell, T. (2006). A review and comparison of Six Sigma and the lean organizations. The TQM Magazine, 18(3):255-262

References
Maneesh Kumar 347
Bergman, B., Klefsjö, B. (2003). Quality from Customer Needs to Customer Satisfaction. 2nd ed., Lund: Studentlitteratur
Berry, M. (1998). Strategic planning in small high tech companies. Long Range Planning, 31(3): 455-466.
Bessant, J., Caffyn, S. (1997). High – involvement innovation through continuous improvement. International Journal of Technology Management, 14(1):14-22
Bessant, J., Phelps, B., and Adams, R. (2005). External Knowledge: a Review of the Literature Addressing the Role of External Knowledge and Expertise at Key Stages of Business Growth and Development. London: Advanced Institute of Management
Bessant,J., Caffyn,S., and Gallagher,M. (2001). An evolutionary model of continuous improvement behaviour. Technovation. 21(2):67 – 77
Biazzo, S. and G. Bernardi (2003). Organisational self-assessment options: A classification and a conceptual map for SMEs. International Journal of Quality & Reliability Management, 20(8): 881 - 900.
Bicheno, J. (2000). The Lean Toolbox. Buckingham: PICSIE Books
Birchall, D., Chanaron, J., and Soderquist, K. (1996). Managing Innovation in SMEs: a comparison of companies in the UK, France, and Portugal. International Journal of Technology Management, 12(3): 291-305.
Bisgaard, S., Hoerl, R. W., & Snee, R. D. (2002). Improving business processes with Six Sigma. Quality Congress, 701-704.
Black, S. and Porter, L. (1996). Identification of the critical factors of TQM. Decision Sciences, 27(1):1-21.
Bolton, J. E. (1971). Report of the Committee of Enquiry on Small Firms. London: HMSO
Bothe, D. R. (1997).Measuring Process Capability. New York, USA: McGraw- Hill
Boyer, K., and Swink, M.L., (2008). Empirical Elephants- Why Multiple Methods are Essential to Quality Research in Operations and Supply Chain Management. Journal of Operations Management. 26:337-348
Brah, S., Tee, S., Rao, B. (2002). Relationship between TQM and performance of Singapore companies. International Journal of Quality & Reliability Management, 19(4):356-379
Brett, C. and Queen, P. (2005). Streamlining enterprise records management with lean six sigma. Information Management Journal, 39(6):58-62
Breyfogle, F. W. III. (1999).Implementing Six Sigma: Smarter Solutions Using Statistical Methods. New York, USA: John Wiley & Sons.
Breyfogle, III F.W., Cupello J.M., and Meadows, B. (2001). Managing Six Sigma. New York, NY: Wiley
Briscoe, J.A., Fawcett, S.E. and Todd, R.H. (2005). The implementation and impact of ISO 9000 among small manufacturing enterprises. Journal of Small Business Management, 43(3):309-330.
Brown, A., and Wiele, V.D.T. (1995). ISO 9000: are the benefits realised?. Quality Australia, 12: 30-34.
References
Maneesh Kumar 348
Brown, A., Wiele, V.D. A. and Loughton, K. (1998).Smaller enterprises’ experiences with ISO 9000. International Journal of Quality & Reliability Management, 15(3):273-285.
Browning, T. R. and Heath, R. D. (2009). Reconceptualizing the effects of lean on production costs with evidence from the F-22 program. Journal of Operations Management, 27(1): 23-44.
Brue, G. (2006). Six Sigma for Small Business, Madison, Wisconsin: CWL Publishing Enterprises, Inc.
Brue, G., (2002). Six Sigma for Managers. New York, NY: The McGraw-Hill Companies, Inc.
Bryman, A. (1988). Quantity and quality in social research, London: Unwin Hyman.
Bryman, A., and Bell, E. (2007). Business Research Methods. 2nd ed., London: Oxford University Press, ISBN: 978-0-19-928498-6
Burns, P., and Dewhurst, J. (1996). Small Business and Entrepreneurship (2nd ed.). Basingstoke: Palgrave Macmillan.
Burrell, G. and Morgan, G. (1979). Sociological Paradigms and Organisational Analysis. London: Heinemann Educational Books
Burton, T. (2004). Six Sigma for Small and Medium Sized Businesses. Available from http://www.isixsigma.com/library/content/ [Accessed on 1st March, 2006]
Cagliano, R., Blackmon, K., & Voss, C. (2001). Small firms under MICROSCOPE: internatioal difference in production/operation management practices and performance. Integrated Manufacturing Systems, 12(7): 469-482.
Cambridge Advanced Learner Dictionary. (2005). Cambridge, UK: Cambridge University Press
Caralli, R.A. (2004).The Critical Success factor Method: Establishing a Foundation for Enterprise Security Management. Technical Report, Carnegie Mellon Software Engineering Institute, CMU/SEI-2004-TR-010.
Carey, J.W. (1993). Linking qualitative and quantitative methods: Integrating cultural factors into public health. Qualitative Health Research, 3: 298-318.
Carpenter, R. E., and Peterson, B. C. (2002). Is the growth of small firms constrained by internal finance?. The Review of Economics and Statistics, 84(2): 298-309.
Carter, S., Ennis, S., Lowe, A., Tagg, S., Tzokas, N., Webb, J., et al. (2000). Barriers to Survival and Growth in UK Small Firms. London: Federation of Small Businesses
Castellanos, R. M. M. (2001). Small and medium young enterprises' strengths and weaknesses: Empirical study of a sample of industrial firms. Journal of Small Business and Enterprise Development, 8(1): 28-36.
Chaganti, R., Cook, R. G., and Smeltz, W. J. (2002). Effects of styles, strategies, and systems on the growth of small businesses. Journal of Developmental Entrepreneurship, 7(2): 175-193.
Chakrabarty, A., and Tan, K. (2007). The current state of six sigma application in services. Managing Service Quality, 17(2):194-208.

References
Maneesh Kumar 349
Chakrabarty, A., Chuan, T.K. (2009). An exploratory qualitative and quantitative analysis of Six Sigma in service organizations in Singapore. Management Research News, 32(7): 614-632
Chalmers, A.F., (1982). What is this Thing called Science?. 2nd ed., Philadelphia: Open University Press
Chandler, G. N., Keller, C., and Lyon, D. W. (2000). Unravelling the determinants and consequences of an innovation-supportive organizational culture. Entrepreneurship, Theory and Practice, 25(1): 59-76.
Chen, H.-L., and Huang, Y. (2004). The Establishment of Global Marketing Strategic Alliances by Small and Medium Enterprises. Small Business Economics, 22(5): 365-377.
Chileshe, N. (2007). Quality management concepts, principles, tools and philosophies: A valid methodology for deployment within UK construction-related SMEs. Journal of Engineering, Design and Technology, 5(1): 49 - 67.
China Service SMEs. (2002). Fact. http://www.sitrends.org/facts/figure.asp?FIGURE_ID=84 Retrieved 21st March 2008, 2008
Chittenden, F, Hall, G and Hutchinson, P. (1996). Small Firm Growth, Access To Capital Markets And Financial Structure: Review Of Issues And An Empirical Investigation. Small Business Economics, 8: 59-67
Chittenden, F., Poutziouris, P., and Syeda-Masooda, M. (1998), Small firms and the ISO 9000 approach to quality management. International Small Business Journal, 17(1):73-88.
Churchill, N. C., and Lewis, V. L. (1983). The Five Stages of Small Business Growth. Harvard Business Review, 61(3): 30-50.
Clough, P., And Nutbrown, C. (2002). A Student’s Guide to Methodology. London: Sage Publications
Co, H.C., Patuwo, B.E., Hu, M.Y. (1998). The human factor in advanced manufacturing technology adoption: an empirical analysis. International Journal of Operations and Production Management, 18(1):87-106
Cohen, W. M., and Levinthal, D. A. (1990). Absorptive capacity: a new perspective on learning and innovation. Administrative Science Quarterly, 35(1): 128-152.
Coleman S. and Douglas A. (2003). Where Next for ISO 9000 Companies?. The TQM Magazine, 15(2):88-92.
Collis, J., and Hussey, R. (2003). Business Research: a practical guide for undergraduate and postgraduate students. 2nd ed., Basingstoke: Palgrave Macmillan
Cooper, D.R., and Schindler, P.S. (2006). Business research methods. New York, NY: McGraw-Hill
Coughlan, P., and Coghlan, D. (2002). Action research for operations management. International Journal of Operations and Production Management, 22(2):220 – 240
Creswall, J.W., and Clark, V.L.P. (2007). Designing and conducting mixed method research. London: Sage Publications

References
Maneesh Kumar 350
Creswell, J. W. (1994). Research Design: Qualitative and Quantitative Approaches. Thousand Oaks, CA: Sage Publications
Crosby, P.B. (1979). Quality is free: The art of making quality certain. New York : McGraw Hill Custom Publishing,
Curran, J., and Blackburn, R. (1994). Small Firms and Local Economic Networks: The Death of the Local Economy. London: Paul Chapman Publishing.
Dahlgaard, J.J., and Dahlgaard-Park, S.M. (2006). Lean Production, Six Sigma Quality, TQM and Company Culture. The TQM Magazine, 18(3): 263-281.
Dale B. G., Wiele, T. V., and Iwaarden J. V. (2007). Managing Quality. 5th ed., Malden, MA, USA: Blackwell Publishing
Dale, B.G. and Lascelles, D.M. (1997). Total quality management adoption: revisiting the levels. The TQM Magazine, 9(6): 418-28
Dale, B.G., and Boaden, R.J. (1993). Managing quality improvement in financial services: a framework and case study. The Service Industries Journal, 13(1): 17-39
Dale, B.G., and Shaw, P. (1999). Tools and techniques: an overview. In Dale, B.G. (Eds), Managing Quality. 3rd ed., Oxford: Blackwell
Dale, B.G., and Smith, M. (1997). Spectrum of quality management implementation grid: development and use. Managing Service Quality, 7(6): 307-311
Dale, B.G., Boaden, R.J., Wilcox, M., and McQuater, R.E., (1997), Sustaining total quality management: what are the key issues?. The TQM Magazine, 9, 5, 372-380.
Daniel, R.H. (1961). Management data crisis. Harvard Business Review, September-October:111-112.
Darshak, A., and Desai B.E. (2004). DMAIC Methodology applied to Small Scale Industry. VII Annual International Conference of the Society of Operations Management, NITIE, Mumbai, India.
Davidsson, P., and Delmar, F. (1997). High-growth firms: characteristics, job contribution and method observations. Paper presented at the RENT XI Conference.
Davidsson, P., and Klofsten, M. (2003). The business platform: Developing an instrument to gauge and to assist the development of young firms. Journal of Small Business Management, 41(1): 1-26.
Davies, A.J., and Kochhar, A.K. (2000). A framework for the selection of best practices. International Journal of Operations and Production Management, 20(10):1203-1217.
Davig, W., Brown, S., Friel, T., and Tabibzadeh, K. (2003). Quality management in small manufacturing. Industrial Management & Data Systems, 103(2):68-77.
Davis, A. (2003). Six Sigma for Small Companies. Troy, 42(11): 20.
Davis, J., Khodabocus, F., and Obray, C. (1996). Self-assessment: a path to business excellence. Quality World Technical Supplement, 4-11.
de Vaus, D. A., (2005). Research Design in Social Research. London: Sage Publications Ltd, ISBN 0-761-5347-7

References
Maneesh Kumar 351
Deas, A. (2004). Six Sigma implementation in Small and Medium Sized Enterprises. Masters Thesis, Glasgow, UK: Glasgow Caledonian University
Deleryd, M. (1998).On the gap between theory and practice of process capability studies. International Journal of Quality and Reliability Management, 15(2):178-191.
Deleryd, M., Garvare, R. and Klefsjo, B. (1999). Experiences of implementing statistical methods in small enterprises. The TQM Magazine, 11(5): 341-350.
Delmar, F., Davidsson, P., and Gartner, W. B. (2003). Arriving at the high-growth firm. Journal of Business Venturing, 18(2): 189-216.
Deming, W. E. (1982). Quality, Productivity, and Competitive Position. MIT Press
Deming, W. E.(1986).Out of the Crisis. MIT Press, ISBN 0-911379-01-0.
Deming, W.E. (1994). Report Card on TQM. Management Review, October:26-27
Demirbag, M., Koh, S. C. L. Tatoglu, E., and Zaim, S. (2006b). TQM and market orientation's impact on SMEs' performance. Industrial Management & Data Systems, 106(8): 1206 - 1228.
Demirbag, M., Tatoglu, E., Tekinkus, M., and Zaim,S. (2006a). An analysis of the relationship between TQM implementation and organizational performance: Evidence from Turkish SMEs. Journal of Manufacturing Technology Management, 17(6): 829 - 847.
Denzin, N.K., and Lincoln, Y.S. (2000). Handbook of Qualitative Research. 2nd ed., London: Sage Publications
Deros, B. M., S. r. M. Yusof, and Salleh, A.M. (2006). A benchmarking implementation framework for automotive manufacturing SMEs. Benchmarking: An International Journal, 13(4): 396 - 430.
Desai, D.A. (2006). Improving customer delivery commitments the Six Sigma way: case study of an Indian small scale industry. International Journal of Six Sigma and Competitive Advantage, 2(1): 23-47.
Deshpande, R. (1983).Paradigms lost: on theory and method in research in marketing. Journal of Marketing, 47:101-110
Dewhurst, J., and Burns, P. (1993). Small Business Management (3rd ed.). Basingstoke: Palgrave Macmillan.
Dobbs, M., and Hamilton, R. T. (2007). Small Business Growth: recent evidence and new directions. International Journal of Entrepreneurial Behaviour & Research, 13(5), 296-322.
Dodgson, M., and Rothwell, R. (1991). Technology strategies in small firms. Journal of General Management, 17(1): 45-55.
DTI. (2006). National Statistics, Statistical Press Release. http://www.sbs.gov.uk/content/analytical/statistics/combinedsmestats.pdf Retrieved 31st January, 2008
Easterby-Smith, M., Thorpe, R. and Lowe, A. (2002). Management Research-An Introduction. 2nd ed., London: Sage Publication, ISBN 0 7619 7884 6.
Eden, C., and Huxham, C. (1996). Action research for management research. British Journal of Management, 7 (1): 75-86

References
Maneesh Kumar 352
Eisenhardt, K.M. (1989). Building theories from Case Study Research. The Academy of Management Review, 14(4): 532-550
Ellis, K. (2001). Mastering Six Sigma. Training, 28(12): 30-35.
European Commission. (2003). SME definition: Commission Recommendation of 06 May 2003. http://ec.europa.eu/enterprise/enterprise_policy/sme_definition/index_en.htm Retrieved 31st January 2008
EUROSTAT. (2003). Competence development in SMEs. No.6, Brussels: Observatory of European SMEs
Feigenbaum, A. V. (1991). Total Quality Control. 4th ed., New York, NY: McGraw-Hill.
Fisher, T.J. (1993). The view from the top: chief executives' perceptions of total quality management. Australian Journal of Management, 18(2):181-195
Flynn, B. B., R. G. Schroeder, et al. (1994). A framework for quality management research and an associated measurement instrument. Journal of Operations Management ,11(4): 339-366.
Flynn, B., et al (1990). Empirical Research Methods in Operations Management. Journal of Operations Management. 9(2):250-283
Forza, C. (2002). Survey research in operations management: a process-based perspective. International Journal of Operations and Production Management, 22(2):152-194.
Fowler, F. J., (2002). Survey Research Methods. 3rd Edition, London: Sage Publication, ISBN 07619 2190 7.
Fowler, F.J., and Mangione, T. W. (1990). Standardized Survey Interviewing. Applied social research method series, Vol. 18, London, UK: Sage Publication, ISBN 08039 3092 5
Fullerton, R. R., C. S. McWatters, et al. (2003). An examination of the relationships between JIT and financial performance. Journal of Operations Management, 21(4): 383-404.
Furterer, S., and Elshennawy, A. (2005). Implementation of TQM and lean six sigma tools in local government: a framework and a case study. Total Quality Management, 16(10):1179-1191
Garengo, P., Biazzo, S., and Bititci, U. S. (2005b). Performance measurement systems in SMEs: A review for a research agenda. International Journal of Management Reviews, 7(1): 25-47.
Garengo, P., Biazzo, S., Simonnetti, A., and Bernardi, G. (2005a). Benchmarking on managerial practices: a tool for SMEs. The TQM Magazine, 17(5): 440-455.
Garvin, D.A. (1998). Managing Quality. New York, NY: Free Press
George, M.L. (2003). Lean Six Sigma for Service. USA: McGraw Hill.
Ghauri, P., and Grønhaug, K. (2002). Research Methods in Business Studies. London: Pearson Education Limited, ISBN 0273-65110-2
Ghobadian, A., and Gallear, D. N. (1996). Total quality management in SMEs. Omega, 24(1): 83-106.

References
Maneesh Kumar 353
Ghobadian, A., and Gallear, D. N. (1997). TQM and organization size. International Journal of Operations & Production Management, 17(2): 121-163.
Ghobadian, A., and Woo, H.S., (1996). Characteristics, benefits and shortcomings of four major quality awards. International Journal of Quality and Reliability Management, 13(2): 10-44
Gibb, A. A., and Davies, L. (1990). In pursuit of frameworks for the development of growth models of the small business. International Small Business Journal, 9(1):15-31.
Gill, J., and Johnson, P. (2002). Research Methods for Manager. 3rd ed., London: Paul Chapman.
Glaser, B. G., and Strauss, A. L. (1967). The Discovery of Grounded Theory: Strategies for Qualitative Research. New York: Aldine Publishing Company
Gnibus, R.J. and Krull, R. (2003). Small Companies see the money. Quality, 42(8): 48-51.
Goh, P.L., and Ridgway, K. (1994). The Implementation of Total Quality Management in Small and Medium-sized Manufacturing Companies. The TQM Magazine, 6(2):54-60
Goh, T.N. (2002). A Strategic Assessment of Six Sigma, Quality and Reliability Engineering International, 18(5): 403-410.
Gome, A. (1996).Total quality madness. Business Review Weekly, 18: 38-44.
Gotzamani, K. D. (2004). A thorough analysis of ISO 9000 contribution to small and medium size enterprises: a comparison with large enterprises. International Journal of Management Practice, 1(1): 41-56
Gotzamani, K.D. and Tsiotras, G. (2002). The true motives behind ISO 9000 certification, their effect on the overall certification benefits and long-term contribution towards TQM. International Journal of Quality & Reliability Management, 19(2):151-169
Greiner, L. E. (1972). Evolution and Revolution as Organizations Grow. Harvard Business Review, 50(4), 37-46.
Greiner, L. E. (1998). Evolution and Revolution as Organizations Grow. Harvard Business Review, 76(3): 55-68.
Gummesson, E. (2000). Qualitative Methods in Management Research. 2nd ed., Thousand Oaks, CA: Sage Publications
Gunasekaran, A., Forker,L., and Kobu, B. (2000). Improving operations performance in a small company: a case study. International Journal of Operations & Production Management, 20(3): 316 - 336.
Gunasekaran, A., Okko, P., Martikainen, T., Yli-Olli, P. (1996). Improving productivity and quality in small and medium enterprises: cases and analysis, International Small Business Journal, 15(1):59-72
Gunter, B. (1991).Process capability studies, Part I-V. Quality Progress, 24(6): 97.
Gupta, P. and Schultz, B. (2005). Six Sigma Success in Small Businesses. Quality Digest, April 5.
References
Maneesh Kumar 354
Gupta, Y. P., and Chin, D. C. W. (1993). Strategy making and environment: an organizational life-cycle perspective. Technovation, 13(1): 27-44.
Gustafsson, R., Klefsjo, B., Berggren, E. and Granfors-Wellemets, U. (2001). Experiences from implementing ISO 9000 in small enterprises – a study of Swedish organizations.The TQM Magazine, 13 (4):232-246.
Gutierrez, L. J. G., Llorens-Montes., F.J., and Sanchez, O. F. B., (2009). Six sigma: from a goal-theoretic perspective to shared-vision development. International Journal of Operations and Production Management, 29(2):151-169
Haikonen, A., Savolainen, T., and Jarvinen, P. (2004). Exploring Six Sigma and CI capability development: preliminary case study findings on management role. Journal of Manufacturing Technology Management, 15(4): 369-378.
Haksever, C. (1996). Total Quality Management in the small business environment. Business Horizons, 39(2): 33-40.
Hallberg, K. (2003). A Market Orientated Strategy for Small and Medium Scale Enterprises. IFC Discussion Paper number 40 Retrieved July, 2008
Hammersley, M. (1996). The relationship between qualitative and quantitative research: Paradigm loyalty versus methodological electism. In Richardson, J.T.E. (ed.) Handbook of Research Methods for Psychology and the Social Sciences, Leicester: BPS Books
Hammersley, M., and Atkinson, P. (1995). Ethnography: Principles in Practice. 2nd ed., London: Tavistock.
Hanks, S. H., and Chandler, G. N. (1994). Patterns of functional specialization in emerging high tech firms. Journal of Small Business Management, 32(2): 23-36.
Hanks, S. H., Watson, C. J., Jansen, E., and Chandler, G. N. (1993). Tightening the life-cycle construct: a taxonomic study of growth stage configurations in high-technology organizations. Entrepreneurship Theory and Practice, 18(2):5-29.
Hansen, E. and Bash, R. (1999). Understanding customer quality requirements: models and applications. Industrial Marketing Management, 28:119-130
Hansson, J. and B. Klefsjo (2003). A core value model for implementing total quality management in small organisations. The TQM Magazine, 15(2): 71 - 81.
Harari, O. (1997). Ten reasons why TQM doesn’t work. Management Review, 86(1): 38-44
Hare, L.B. (2005). Linking Statistical Thinking to Six Sigma. International Journal of Six Sigma and Competitive Advantage, 1(4): 389-402
Harry, M and Crawford, D. (2005). Six Sigma – The Next Generation. Machine Design, 77(4):126-131.
Harry, M. and Crawford, J.D. (2004). Six Sigma for the little guy. Mechanical Engineering, 126(11): 8-10.
Harry, M. and Schroeder, R. (1999). Six Sigma - The Breakthrough Management Strategy Revolutionizing the World’s Top Corporations, New York, USA: Doubleday
Harry, M. J. (1998). Six Sigma: A Breakthrough Strategy for Profitability. Quality Progress, 31(5): 60-64.

References
Maneesh Kumar 355
Hasson, D., and Arnetz, B.B. (2005). Validation and Findings Comparing VAS vs. Likert Scales for Psychosocial Measurements. International Electronic Journal of Health Education, 8:178-192
Hellsten, U., and Klefsjo, B. (2000), TQM as a management system consisting of values, techniques and tools. The TQM Magazine, 12 (4):238-44.
Henderson, K., and Evans, J. (2000).Successful implementation of Six Sigma: benchmarking General Electric Company. Benchmarking and international Journal, 7: 260-281.
Hendricks, K. B. and Singhal, V. R. (2001). Firm characteristics, total quality management, and financial performance. Journal of Operations Management, 19(3): 269-285.
Hendricks, K.B. and Singhal,V.R. (1997). Does implementing an effective TQM program actually improve operating performance? Empirical evidence from firms that have won quality awards. Management Science, 43:1258–1274
Hewitt, S., (1997). Business excellence: does it work for small companies?. The TQM Magazine, 9(1):76-82
Hines, P., Holweg, M., and Rich, N. (2004). Learning to evolve: A review of contemporary lean thinking. International Journal of Operations & Production Management, 24(10):994-1011
Hirschman, E. C. (1986). Humanistic Inquiry in Marketing Research: Philosophy, Method and Criteria. Journal of Marketing Research, 13 (August):237-249
Hoerl, R. W. (1998).Six Sigma and the future of the quality profession. Quality Progress, 33(4):35-42.
Hoerl, R.W. (2004). One perspective on the future of Six Sigma. International Journal of Six Sigma and Competitive Advantage, 1(1): 112-119.
Holweg, M. (2007). The genealogy of lean production. Journal of Operations Management, 25(2): 420-437.
Holweg, M., Pil, F.K., (2004). The Second Century: Reconnecting Customer and Value Chain through Build-to-Order. The MIT Press, Cambridge, MA.
Hong, P., and Jeong, J. (2006). Supply chain management practices of SMEs: from a business growth perspective. Journal of Enterprise Information Management, 19(3):292-302
Hopp, W.J., and Spearman, M.L. (2004). To Pull or Not to Pull: What is the Question?. Manufacturing and. Service Operations Management, 6(2): 133-148
Humphreys, P., McAdam, R., and Leckey, J. (2005). Longitudinal evaluation of innovation implementation in SMEs. European Journal of Innovation Management, 8(3), 283-304.
Husband, S. and Mandal, P. (1999). A conceptual model for quality integrated management in small and medium size enterprises. International Journal of Quality & Reliability Management, 16(7): 699 - 713.
Husband, S.G. (1997). Innovation in Advanced Professional Practice: Doctor of Technology (Report No 2). Faculty of Science and Technology, Deakin University, Geelong, Australia

References
Maneesh Kumar 356
Hvolby, H-H., and Thorstenson, A., (2001), Indicators for performance measurement in small and medium-sized enterprises, J. Engineering Manufacture, 215: 1143-1146.
Ingle, S., and Roe, W. (2002). Black Belts save Motorola a billion. Strategic Direction, 18(1):8-13.
Ishikawa, K. (1985). In: Lu, D.J. (Ed.), What is Total Quality Control? The Japanese Way. Englewood Cliffs, NJ: Prentice-Hall
Jankowicz, A.D., (2005). Business Research Projects.Thomson Learning, UK.
Juran, J.M. (1993). Quality Planning and Analysis. New York, NY: McGrawHill Education
Kanji, G.K. (1998). An innovative approach to make ISO 9000 standards more effective. Total Quality Management Journal, 9(1): 67-78.
Karlsson, C., and Olsson, O. (1998). Product Innovation in Small and Large Enterprises. Small Business Economics, 10(1):31-46.
Kaye, M., and Anderson, R. (1999). Continuous improvement: the ten essential criteria. International Journal of Quality and Reliability Management, 16(5):485-506
Kaye, M.M., and Dyason, M.D. (1995). The fifth era. The TQM Magazine, 7(1):33-37.
Kazanjian, R. K. (1988). Relation of dominant problems to stage of growth in technology-based new ventures. Academy of Management Journal, 31(2): 257-279.
Keller, P., (2003). Does Six Sigma work in Smaller Companies? Available from http://www.qualityamerica.com/knowledgecentre/articles/ [Accessed on 25th Feb., 2010]
Keller, P.A. (2001). Six Sigma Deployment. Tucson, AZ:Quality Publishing
Kerlinger, F. N. (1986). Survey Research: In Foundations of Behavioral Research in Education. New York: Holt, Rinehart, and Winston.
Khalfan, M.M.A., Anumba, C.J., Siemieniuch, C.E., and Sinclair, M.A., (2001). Readiness Assessment of the construction supply chain for concurrent engineering. European Journal of Purchasing & Supply Management, 7(2):141-153.
Khan, Z., Bali,R. K., Wickramasinghe, N. (2007). Developing a BPI framework and PAM for SMEs. Industrial Management & Data Systems, 107(3): 345 - 360.
Kinni, T.B. (1995). Process improvement part 1: Kaizen and the never ending search for perfection, Industry Week, 244(2): 52-55
Kolberg,B., Dahlgaard,J.J., and Brehmer, P.O. (2007). Measuring Lean initiatives in health care services: issues and findings. Sweden International Journal of Productivity and Performance Management, 56(1): 7-24
Kuei, C., and Madu, C. (2003). Customer-Centric Six Sigma Quality & Reliability Management. International Journal of Quality & Reliability Management, 20(8): 954-964
Kullmann, J. (2002). Introduction to Six Sigma for Small to Mid-Sized Companies. White paper, Six Sigma Qualtec, May 2002.

References
Maneesh Kumar 357
Kumar, M. (2005). The Status of Six Sigma within UK Manufacturing SME: Methodology and Survey Results. Masters Dissertation, Glasgow: Glasgow Caledonian University
Kumar, M. and J. Antony (2008). Comparing the quality management practices in UK SMEs. Industrial Management & Data Systems, 108(9): 1153 - 1166.
Kumar, M., (2007), Critical Success Factors and Hurdles to Six Sigma Implementation: the case of a UK manufacturing SME, International Journal of Six Sigma and Competitive advantage, 3(4): 333-351
Kumar, M., and Antony, J., (2009). Investigating the quality management practices in Six Sigma against Non-Six Sigma UK Manufacturing SMEs: Key findings from multiple case studies. Journal of Engineering Manufacture, IMECH E Part B , 223(7): 925-934.
Kumar, M., Antony, J., and Cho, B.R. (2009). Project Selection and its impact on successful deployment of Six Sigma. Business Process Management Journal, 15(5): 669-686
Kumar, M., Antony, J., Madu, C., Montgomery, D.C., Park, S.H. (2008). Common myths of Six Sigma demystified. International Journal of Quality and Reliability Management, 25(8): 878-895.
Kumar, M., Antony, J., Singh, R.K., Tiwari, M.K., Perry, D. (2006). Implementing the Lean Sigma Framework in an Indian SME: A Case Study. Production Planning and Control, 17(4): 407-423.
Kumar, M., Antony, J., Tiwari, M.K., (2010), Six Sigma Implementation Framework for SMEs – A roadmap to manage and sustain the change, International Journal of Production Research (Accepted for publication)
Kumar, S., and Harms, R. (2004). Improving business process for increased operational efficiency: a case study. Journal of Manufacturing Technology Management, 15(7): 662-674
Kuratko, D.F., Goodale, J.C., and Hornsby, J.S. (2001). Quality Practices for a Competitive Advantage in Smaller Firms. Journal of Small Business Management, 39(4):293-311.
Kwak, Y.H., and Anbari, F.T. (2006). Benefits, obstacles, and future of Six Sigma approach. Technovation, 26: 708-715.
Laforet, S., and Tann, J. (2006). Innovative characteristics of small manufacturing firms. Journal of Small Business and Enterprise Development, 13(3): 363-380.
Lascelles, D.M., and Dale, B.G. (1991). Levelling out the future. The TQM Magazine, 3(2): 125-128.
Lee, C.Y. (1998). Quality management by small manufacturers in Korea: an exploratory study. Journal of Small Business Management, 36(4): 61-67.
Lee, C.Y. (2004). TQM in small manufacturers: an exploratory study in China. International Journal of Quality and Reliability Management, 21(3):175-197.
Lee, G. L., and Oakes, I. (1995). The Pros and Cons of TQM for smaller forms in manufacturing: some experiences down the supply chain. Total Quality Management, 6(4): 413-426.
References
Maneesh Kumar 358
Lee, K.S. and Palmer, E. (1999). An empirical examination of ISO 9000-registered companies in New Zealand. Total Quality Management, 10(6):887-899.
Lee-Mortimer, A. (2006). Six Sigma: a vital improvement approach when applied to the right problems, in the right environment. Assembly Automation, 26(1):10-17
Levie, J., and Hay, M. (1998). Progress or just proliferation? A historical review of stage models of early corporate growth. Working Paper. London Business School, FEM wp 98.5
Lewin, K. (1946). Action research and minority problems. Journal of Social Issue, 2:34-46
Lewis, W.G., Pun, K.F. and Lalla, T.R.M. (2006b).Empirical investigation of the hard and soft criteria of TQM in ISO 9001 certified small and medium-sized enterprises. International Journal of Quality & Reliability Management, 23(8):964-985.
Liker,J. (1998). Becoming Lean, Inside Stories of U.S. Manufacturers. Portland, Oregon: Productivity Press
Lin, C., Madu, C.N., & Kuei, C. H. (1999). The association between organizational climate and quality management practices: an empirical study on small-and medium-sized manufacturing companies in Taiwan. Total Quality Management, 10(6): 863-868.
Lin, Y.Y.C. (1999). Success factors of small and medium-sized enterprises in Taiwan: an analysis of cases. Journal of Small Business Management, 36(4):43-56
Lincoln, Y. S., and Guba, E. G. (2000). Paradigmatic controversies, contradictions, and emerging confluences. In N. K. Denzin & Y. S. Lincoln (Eds.), Handbook of qualitative research. 2nd ed., pp. 163-188, Thousand Oaks, CA: Sage Publications
Linderman, K., Schroeder R. G., Zaheer, S., and Choo, A.S. (2003). Six Sigma: a goal-theoretic perspective. Journal of Operations Management, 21(2): 193-203.
Linderman, K., Schroeder R. G., Choo,A.S. (2006). Six Sigma: The role of goals in improvement teams. Journal of Operations Management, 24(6):779-790.
Linderman, K., Schroeder R. G., Zaheer, S., Liedtke, C., and Choo, A.S. (2004). Integrating quality management practices with knowledge creation processes. Journal of Operations Management, 22(6): 589-607.
Lippitt, G. L., and Schmidt, W. H. (1967). Crises in a developing organization. Harvard Business Review, 45(6), 102-112.
Lloyd-Reason, L., and Sear, L. (2007). Introduction: the role of SMEs in the global economy. In L. Lloyd-Reason & L. Sear (Eds.), Trading Places- SMEs in the Global Economy ( 1). Cheltenham, UK: Edward Elgar Publishing Limited.
Lloyd-Reason, L., and Sear, L., (2007). Trading Places – SMEs in the Global Economy. Cheltenham, UK: Edward Elgar Publishing Limited.
Lopez, U. (2005). Collaboration Relationships in Supply Chain. PhD Thesis, Glasgow: University of Strathclyde, Thesis no.: T11435
Lukács, E. (2005). THE ECONOMIC ROLE OF SMES IN WORLD ECONOMY, ESPECIALLY IN EUROPE. http://www.uni-miskolc.hu/uni/res/kozlemenyek/2005/pdf/lukacs.doc Retrieved 22nd March, 2008

References
Maneesh Kumar 359
Mackau, D. (2003). SME integrated management system: a proposed experiences model. The TQM Magazine, 15(1): 43-51.
Macpherson, A. (2005). Learning how to grow: resolving the crisis of knowing. Technovation, 25(10):1129-1140.
Magnusson, K., Kroslid, D., & Bergman, B.(2003). Six Sigma: The Pragmatic Approach, Sweden:Second Edition, Studentlitteratur.
Mahanti, R., and Antony, J. (2009). Six Sigma in the Indian software industry: some observations and results from a pilot survey. The TQM Magazine, 21(6):549-564
Malhotra, M.K., Grover, V., (1998). An assessment of survey research in POM: from constructs to theory. Journal of Operations Management. 16:407-425
Marsh, S.A. (2000). Six Sigma: A passing fad or a sign of things to come?. http://www.thesamgroup.com/sixsigmaarticle.htm [Accessed on 8th November, 2007]
Marshall, C., and Rossman, G.B. (1999). Designing qualitative research. 3rd ed., Thousand Oaks,CA: Sage Publications.
Martinez-Hernandez, V. (2005). Understanding Value Creation: The Value Matrix and The Value Cube. PhD Thesis, Glasgow: University of Strathclyde, Thesis no.: T10678
Mason, J. (2002). Qualitative Researching. London: Sage Publications
Mathaisel, D.F.X., (2005). A lean architecture for transforming the aerospace maintenance, repair and overhaul (MRO) enterprise. International Journal of Productivity and Performance Management, 54(8): 623-644.
Mazzarol, T. (2007). International SME innovation study: Summary findings from the survey. Unpublished manuscript, 2007
McAdam, R. (2000). Quality models in an SME context: A critical perspective using a grounded approach. International Journal of Quality & Reliability Management, 17(3): 305 - 323.
McAdam, R., and Armstrong, G. (2001). A symbiosis of quality and innovation in SMEs: a multiple case study analysis. Managerial Auditing Journal, 16(7):394-399.
McAdam, R., Armstrong, G., and Kelly, B. (1998). Investigation of the relationship between total quality and innovation: a research study involving small organizations. European Journal of Innovation Management, 1(3): 139-147.
McAdam, R., Hazlett, S. A., and Henderson, J., (2005). A critical review of six sigma: exploring the dichotomies. International Journal of Organizational Analysis, 13(2): 151-174.
McAdam, R., Kelly, M. (2002). A business excellence approach to generic benchmarking in SMEs. Benchmarking: An International Journal, 9(1):7-27.
McAdam, R., McKeown, M. (1999). Life after ISO 9000: an analysis of the impact of ISO 9000 and total quality management on small businesses in Northern Ireland. Total Quality Management, 10(2):229-241
McAdam, R., Stevenson, P., and Armstrong, G. (2000). Innovative change management in SMEs: beyond continuous improvement. Logistics Information Management, 13(3): 138-149.

References
Maneesh Kumar 360
McCutcheon, D.M., and Meredith, J.R. (1993). Conducting case study research in operations management. Journal of Operations Management, 11:239-256.
McShea, A., Danley, D., Fuji, S. (2004). Six Sigma-Based Methodology: A Motorola/3M Case Study. Future Fab International, Vol 16. http://www.future-fab.com/documents.asp?d_ID=2308# [Accessed on 22nd October 2007]
McTeer, M.M. and Dale, B.G. (1994). Are the ISO 9000 series of quality management systems standards of value to small companies?. European Journal of Purchasing and Supply Management, 1(4):227–235.
McTeer, M.M., and Dale, B.G. (1996). The attitude of small companies to the ISO 9000 series. Journal of Engineering Manufacture, IMECH E Part B, 210(5): 397-403.
Meegan, S.T., Taylor, W.A. (1997). Factors influencing a successful transition from ISO 9000 to TQM. International Journal of Quality & Reliability Management, 14(2):100-117.
Mekong Capital. (2004). Introduction to Six Sigma. Mekong Capital Ltd Vietnam: HCMC
Mendibil, K.T. (2003). Designing effective team-based performance measurement systems: an integrated approach. PhD Thesis, Glasgow: University of Strathclyde, Thesis no. : T11096
Meredith, J. (1993). Theory Building through conceptual methods. International Journal of Operations and Production Management, 13(5):3-11
Meredith, J., (1998). Building operations management theory through case and field research. Journal of Operations Management, 16(4): 441–454.
Meredith, J.R., Raturi, A., Amoako-Gympah, K., and Kaplan, B. (1989). Alternative research paradigms in operation. Journal of Operations Management, 8(4): 297-326.
Miles, M.B. and Huberman, A.M. (1994). Qualitative Data Analysis: a Sourcebook for New Methods. Newbury Park, CA.: Sage Publication.
Mitra, A. (2004).Six Sigma education: a critical role for academia. The TQM Magazine, 16(4): 293-302.
Mitra, J. (2000). Making connections: innovation and collective learning in small businesses. Education & Training, 42(4): 228-237.
Mitra, R., and Pingali, V. (1999). Analysis of growth stages in small firms: a case study of automobile ancillaries in India. Journal of Small Business Management, 37(3):62-75.
Mo, J. and Chan, A. (1997). Strategic for the successful implementation of ISO 9000 in small and medium manufacturers. The TQM Magazine, 9(2):135-145.
Monden, Y. (1983). Toyota Production Systems. Portland: Productivity Press
Montgomery, D.C., (2005). Generation III Six Sigma. Quality and Reliability Engineering International, 21(6): iii-iv.
Moreno-Luzon, M. D. (1993). Can total quality management make small firms competitive? Total Quality Management, 4(2): 165-181.
References
Maneesh Kumar 361
Moser, S.B., and Bailey, T.L., (1997), Total quality management in the US Air Force: a study of application and attitudes, International Journal of Quality & Reliability Management, Vol. 14, No.5, pp. 482-490.
Motwani, J. (2001).Critical factors and performance measures of TQM. The TQM Magazine, 13(4):292-300.
Motwani, J., Kumar, A., and Antony, J (2004). A business process change framework for examining the implementation of Six Sigma: a case study of Dow Chemicals. The TQM Magazine, 16(4): 273-283.
Mulhaney, A., Sheehan, J., and Hughes, J. (2004). Using ISO9000 to drive continual improvement in a SME. The TQM Magazine, 16(5): 325-330
Naslund, D. (2008). Lean, six sigma and lean sigma: fads or real process improvement methods?. Business Process Management Journal, 14(3):269-287
Neely, A. (2000). Performance Measurement - Past, Present and Future. Centre for Business Performance, Cranfield School of Management, Cranfield University Bedford, UK:
Noci, G. (1995). Accounting and non-accounting measures of quality-based performances in small firms. International Journal of Operations and Production Management, 15 (7):78–105
Noci, G. (1996). Selecting quality based programmes in small firms. Small Business Economics, 8:431–447.
Noci, G., and Toletti, G. (1998). A decision support system for the selection of quality-based programmes in small firms. Management Decision, 36 (7):473-486
Nooteboom, B. (1994). Innovation and Diffusion in Small Firms: Theory and Evidence Small Business Economics, 6(5): 327-347.
North, D., and Smallbone, D. (2000). The innovativeness and growth of rural SMEs during the 1990s. Regional Studies, 34(2): 145-157.
North, D., Smallbone, D., and Vickers, I. (2001). Public Sector Support for Innovating SMEs. Small Business Economics, 16(4): 303-317.
North, J., Blackburn, R., and Curran, J. (1998). The Quality Business Quality Issues in the Smaller Firm. UK: Routledge
Nwankwo, S. (2000). Quality assurance in small business organisations: myths and realities. International Journal of Quality & Reliability Management , 17(1): 82 - 99.
Oakey, R. P., and Cooper, S. Y. (1991). The relationship between product technology and innovation performance in high technology small firms. Technovation, 11(2): 79-92.
Oakland, J. (2000). TQM text with cases. 2nd ed., Oxford: Butterworth- Heinemann
Oakland, J.S., (2003). Total Quality Management text with cases. 3rd edition. Oxford: Elsevier Butterworth-Heinemann
Oakland, J.S., and Tanner, S.J. (2007). A new framework for managing change. The TQM Magazine, 19(6): 572-589.

References
Maneesh Kumar 362
Oakland, J.S., and Tanner, S.J., (2006). Quality management in the 21st century- implementing successful change. International Journal of Productivity and Quality Management, 1(1/2): 69-87.
OECD. (2000). Small and Medium-sized Enterprise: Local Strength, Global Reach. Policy Brief: June 2000.
Ohno, T., (1988). The Toyota Production System: Beyond Large-Scale Production. Productivity Press, Portland.
Orser, B. J., Hogarth-Scott, S., and Riding, A. L. (2000). Performance, firm size, and management problem solving. Journal of Small Business Management, 38(4): 42-58.
Ostgaard, T., and Birley, S. (1994). Personal Networks and Firm Competitive Strategy: A Strategic or coincidental Match? Journal of Business Venturing, 9(4):281-306.
Palmer, K. and Tsui, K. L. (1999). A review and interpretations of process capability indices. Annals of Operation Research, 87(1): 31- 47.
Pande, P., and Holpp, L. (2002). What is six sigma?, New York: McGraw-Hill.
Pande, P., Neuman, R. and Cavanagh, R., (2000). The Six Sigma Way: How GE, Motorola and Other Top Companies are Honing their Performance. NY, USA: McGraw-Hill Professional.
Parasuraman, A. (2000). Technology Readiness Index [TRI]: A Multiple-Item Scale to Measure Readiness to Embrace New Technologies. Journal of Service Research, 2(4): 307-320.
Park, S.H. (2003) .Six Sigma for Quality and Productivity Promotion. Asian Productivity Organization, Tokyo.
Parkin, M.A. and Parkin, R. (1996).The impact of TQM in UK SMEs. Industrial Management & Data Systems, 4(96):6-10.
Pavitt, K. (1991). Key characteristics of the large innovating firms. British Journal of Management, 2(1): 41-50.
Payne, A.C., Chelsom, J.V., Reavill, L.R.P. (1996). Management for Engineers. Chichester: Wiley
Pena, I. (2002). Intellectual capital and business start-up success. Journal of Intellectual Capital, 3(2): 180-198.
Penrose, E. T. (1959). The theory of the growth of the firm. London: Basil Blackwell Publisher Ltd.
Pettigrew, A. (1988). Longitudinal field research on change: Theory and practice. Paper presented at the National Science Foundation Conference on Longitudinal Research Methods in Organizations, Austin, TX
Phelps, R., Adams, R., and Bessant, J. (2007). Life cycles of growing organizations: A review with implications for knowledge and learning. International Journal of Management Reviews, 9(1): 1-30.
Philliber, S.G., Schwab, M.R. and Samsloss, G. (1980). Social research: guides to a decision making process. Case Study Research – Design and Methods, Itasca, IL: Peacock

References
Maneesh Kumar 363
Poksinska, B., Eklund, J.A.E. and Dahlgaard, J.J. (2006). ISO 9001:2000 in small organisations: lost opportunities, benefits and influencing factors. International Journal of Quality & Reliability Management, 23(5):490-512.
Popper, K. (1994). The Myth of the Framework. London: Routledge
Powell, T.C. (1995). Total quality management as competitive advantage: a review and empirical study. Strategic Management Journal, 16: 15-37.
Prajogo, D.I. and Brown, A. (2006). Approaches to adopting quality in SMEs and the impact on quality management practices and performance. Total Quality Management, 17(5):555-566.
Process Quality Associates, (2003). Six Sigma for SMEs. Available from http://www.pqa.net/sixsigma/ [Accessed on March 7th, 2006]
Pyzdek ,T., (2003). The Six Sigma Handbook. NY, USA:The McGraw-Hill Companies, Inc.
Pyzdek, T. (1999). Six Sigma is primarily a management program. Quality Digest, June: 26
Quazi, H. A. and Padibjo, S. R. (1998). A journey toward total quality management through ISO 9000 certification - a study on small- and medium-sized enterprises in Singapore. International Journal of Quality & Reliability Management, 15(5): 489 - 508.
Quinn, R. E., and Cameron, K. (1983). Organizational Life Cycles And Shifting Criteria Of Effectiveness: Some Preliminary Evidence. Management Science, 29(1): 33-51.
Rahman, S. (2001a). A Comparative Study of TQM Practice and Organisational Performance of SMEs With and Without ISO 9000 Certification. International Journal of Quality and Reliability Management, 18(2): 35-49.
Rahman, S. (2001b). Total Quality Management Practices and Business Outcome: Evidence from SMEs in Western Australia. Total Quality Management and Business Excellence. 12(2):201-210.
Ramsey, J. (1998).The value of ISO 9000 certification to a small business. Conference Proceedings: Second International and Fifth National Research Conference on Quality Management, 145-56
Rayner, P. and Porter, L.J. (1991). BS 5750/ISO 9000 – the experience of small and medium-size firms. International Journal of Quality & Reliability Management, 8(6):26
Reichstein, T., and Dahl, M. S. (2004). Are firm growth rates random? Analysing patterns and dependencies. International Review of Applied Economics, 18(2): 225-246.
Reid, A. J. (1996). What we want: Qualitative research. Canadian Family Physician. 42: 387–389.
Ritchie, L., Dale, B. (2000). Self-assessment using the business excellence model: A study of practice and process. International Journal of Production Economics, 66(3): 241-254.
Rockart, J. (1979). Chief executives defines their own data needs. Harvard Business Review, 57(2): 238-41.

References
Maneesh Kumar 364
Rothwell, R. (1983). The Role of Small Firms in the Emergence of New Technologies. OMEGA, 12(1): 19-29.
Rothwell, R. (1989). Small Firms, innovation and Industrial change. Small Business Economics, 1(1): 51-64.
Rowlands, B.H. (2005). Grounded in Practice: Using Interpretive Research to Build Theory. Electronic Journal of Business Research Methodology, 3(1):81-92
Rowlands, H. (2004). Implementation issues of Six Sigma in an SME. First International Conference on Six Sigma, 16th and 17th December, Glasgow, Scotland,UK.
Rungasamy, S., Antony, J. Ghosh, S. (2002). Critical Success Factors for SPC implementation in UK small and medium-sized enterprises: some key findings from a survey. The TQM Magazine, 14(4):217-224.
Rungtusanatham, M.J. et al (2003). Survey research in operations management: historical analyses. Journal of Operations Management. 21: 475-488.
Russell, S. (2000). ISO 9000: 2000 and the EFQM excellence model: competition or co-operation. Total Quality Management, 11(4-6): S657-665.
Rutherford, M. W., Buller, P. F., and Mcmullen, P. R. (2003). Human resource management problems over the life-cycle of small to medium-sized firms. Human Resource Management, 42(4): 321-335.
Salaheldin, S. I. (2008). Critical success factors for TQM implementation and their impact on performance of SMEs. International Journal of Productivity and Performance Management, 58(3): 215 - 237.
Samson, D. and Terziovski, M. (1999). The relationship between total quality management practices and operational performance. Journal of Operations Management, 17(4): 393-409.
Sandelowski, M. (1986). The problem of rigour in qualitative research. Advances in Nursing Science, 8: 27–37.
Saunders, M., Lewis, P. and Thornhill, A. (2007). Research Methods for Business Students. 4th ed, London: Prentice Hall, ISBN 0 273 65804 2
Scandura, T.A., Williams, E.A. (2000). Research Methodology in management: current practices, trends, and implications for future research. Academy of Management Journal, 43(6):1248-1264.
Schroeder, R. G., Linderman, K., Liedtke,C., and Choo, A.S. (2008). Six Sigma: Definition and underlying theory. Journal of Operations Management, 26(4): 536-554.
Schwinn, D.R. (2003). Six Sigma Simplified for Small Organisation. Available from http://www.qualityadvisor/library/six_sigma/ [Accessed on April 15th, 2007].
Scott, M., and Bruce, R. (1987). Five stages of growth in small business. Long Range Planning, 20(3): 45-52.
Seddon, J. (1998), Quality at the crossroads, Quality World, March, pp.30-31.
Seddon, J. (2000). The Case against ISO 9000: How to Create Real Quality in Your Organisation. London: Oak Tree Press
References
Maneesh Kumar 365
Sehwail, L., and DeYong, C. (2003).Six Sigma in Health Care. Leadership in Health Services, 16(4):1-5.
Senge, P., Kleiner, A., Roberts, C., Ross, R., Roth, G. & Smith, B. (1999). The Dance of Change: The Challenges of Sustaining Momentum in Learning Organizations. New York: Doubleday/Currency.
Seth, D., Tripathi, D. (2005). Relationship between TQM and TPM implementation factors and business performance of manufacturing industry in an Indian context. International Journal of Quality & Reliability Management, 22(3):256-277
Shah, R. and Ward, P. T. (2003). Lean manufacturing: context, practice bundles, and performance. Journal of Operations Management, 21(2): 129-149.
Shah, R. and Ward, P. T. (2007). Defining and developing measures of lean production. Journal of Operations Management, 25(4): 785-805.
Shamsuddin, A. (2007). Technological competency and organizational performance. PhD Thesis, Glasgow: University of Strathclyde, Thesis no. : T11948
Shea, J., and Gobeli, D. (1995). TQM: the experience of 10 small businesses. Business Horizons, 38(1): 71-77.
Shim, S., Eastlick, M. A., and Lotz, S. (2000). Examination of US Hispanic-owned small retail and service businesses: an organizational life-cycle approach. Journal of Retailing and Consumer Services, 7(2):19-32.
Shrader, C. B., Mulford, C. L., and Blackburn, V. L. (1989). Strategy and operational planning, uncertainty, and performance in small firms. Journal of Small Business Management, 27(4): 45-60.
Siha, S.M., and Saad, G.H. (2008). Business process improvement: empirical assessment and extensions. Business Process Management Journal, 14(6): 778-802.
Sila, I. (2007). Examining the effects of contextual factors on TQM and performance through the lens of organizational theories: An empirical study. Journal of Operations Management, 25(1): 83-109.
Sila, I., Ebrahimpour, M., & Birkholtz, C. (2005). Critical Linkages among TQM Factors and Business Results. International Journal of Operations and Production Management, 25 (11): 1123-1155.
Silen, J., (2000). Successful Deployment of Six Sigma within a Small to medium Company. IQPC: Best Practices in Six Sigma, October 20, 2000.
Slack, N.; Chambers, S., and Johnston, R. (2007). Operations Management, 5th Edn. London:Prentice Hall.
Smallbone, D., Leigh, R., and North, D. (1995). The characteristics and strategies of high growth SMEs. International Journal of Entrepreneurial Behaviour & Research, 1(3): 44-56.
Smallbone, T. and Quinton, S. (2004). Increasing business students' confidence in questioning the validity and reliability of their research. Electronic Journal of Business Research Methods, 2(2):153-162
Smith, J. K. (1983), Quantitative versus qualitative research: An attempt to clarify the issue. Educational Researcher, 12: 6–13.
References
Maneesh Kumar 366
Smith, K. G., Mitchell, T. R., and Summer, C. E. (1985). Top level management priorities in different stages of the organizational life-cycle. Academy of Management Journal, 28(4):799-820.
Smith, S., Tranfield, D., Foster, M. and Whittle, S. (1994) . Strategies for managing the TQ agenda. International Journal of Operations and Production Management, 4: 75-88.
Snee, R.D. (2000) .Impact of Six Sigma on quality engineering. Quality Engineering, 12(3): 9-14.
Snee, R.D. (2004). Six Sigma: The Evolution of 100 years of Business Improvement Methodology. International Journal of Six Sigma and Competitive Advantage, 1(1):4-20
Snee, R.D. and Hoerl, R.W. (2003) .Leading Six Sigma – A Step by Step Guide based on Experience at GE and other Six Sigma companies. NJ, USA: FT Prentice-Hall.
Snee, R.D. and Rodebaugh, W.F. (2002). Project Selection Process. Quality Progress, September: 78–90.
Soderquist, K., Chanaron, J. J., and Motwani, J. (1997). Managing innovation in French small and medium-sized enterprises: an emprical study. Benchmarking for Quality Management & Technology, 4(4): 259-272.
Sohail, M. S. and Hoong, T.B. (2003). TQM practices and organizational performances of SMEs in Malaysia: Some empirical observations. Benchmarking: An International Journal, 10(1): 37 - 53.
Soltani, E. and Lai, P.-C. (2007). Approaches to quality management in the UK: survey evidence and implications. Benchmarking: An International Journal, 14(4): 429 - 454.
Sousa, S., Aspinwall, E., and Rodrigues, A. (2006). Performance measurement in English small and medium enterprises: survey results. Benchmarking: An International Journal, 13 (1/2):120-134
Sousa, S., Aspinwall, E., Sampaio, P.A. and Rodrigues, A. (2005). Performance measures and quality tools in Portuguese small and medium enterprises: survey results. Total Quality Management & Business Excellence, 16(2):277-307
Spanyi, A. and Wurtzel, M. (2003). Six Sigma for the Rest of Us. Quality Digest, Retrieved 20th March, 2010 from http://www.qualitydigest.com/july03/articles/01_articles.html
Spencer, M.S. and Loomba, A. P.S. (2001). Total Quality Management programmes at smaller manufacturers: benchmarking techniques and results. Total Quality Management, 12(5):689-695.
Spencer, M.S., Roger, D.S., and Daugherty, P.J. (1994). JIT systems and external logistics suppliers. International Journal of Operations and Production Management. 14(6):60-74
Stake, R. (1995). The art of case research. Thousand Oaks, CA: Sage Publications
Steinmetz, L. L. (1969). Critical stages of small business growth : When they occur and how to survive them. Business Horizons, 12(1): 29-36.
References
Maneesh Kumar 367
Steinmuller, B. (1993). JESSI -- Common-Framework JCF -- An Open Framework for Integrated CAx-Environments. Proceedings of the Fifth International Conference on Human-Computer Interaction, 337-342.
Storey, D. J. (1994). Understanding the Small Business Sector. London: Routledge.
Struebing, L. and Klaus, L.A. (1997). Small businesses thinking big, Quality Progress, February: 23-27.
Stubbart, C. I., and Smalley, R. D. (1999). The deceptive allure of stage models of strategic processes. Journal of Management Enquiry, 8(3): 273-287.
Sua´rez-Barraza, M.F., and Ramis-Pujol, J. (2009). Implementation of Lean-Kaizen in the human resource service process. Journal of Manufacturing Technology Management, 21(3): 388-410
Sum, C.-C., Kow, L. S.-J., and Chen, C.-S. (2004). A taxonomy of operations strategies of high performing small and medium enterprises in Singapore. International Journal of Operations and Production Management, 24(3): 321-345.
Sun, H. (1999). The patterns of implementing TQM versus ISO 9000 at the beginning of the 1990s. International Journal of Quality & Reliability Management, 16(3):201-215.
Sun, H. (2000). Total quality management ISO 9000 certification and performance improvement. International Journal of Quality & Reliability Management, 17(2):168-179.
Sun, H. and Cheng, T. (2002). Comparing reasons, practices and effects of ISO 9000 certification and TQM implementation in Norwegian SMEs and large firms. International Small Business Journal, 20 (4):421-442
Sun, H., Li, S., Ho, K., Gertsen, F., Hansen, P., Frick, J. (2004). The trajectory of implementing ISO 9000 standards versus total quality management in Western Europe. International Journal of Quality & Reliability Management, 21(2):131-153.
Swinney, Z. (2005). Six Sigma is just a fad. http://www.isixsigma.com/library/content/c030512a.asp [Accessed on 28th December 2007]
Szeto, A.Y.T., and Tsang, A.H.C. (2005). Antecedents to successful implementation of Six Sigma. International Journal of Six Sigma and Competitive Advantage, 1(3): 307-322.
Tannock, J., Krasachol, L., Ruangpermool, S.. (2002). The development of total quality management in Thai manufacturing SMEs: A case study approach. International Journal of Quality & Reliability Management, 19(4): 380 - 395.
Taormina, T. (2002). Implementing IS0 9001:2000: The Journey from Conformance to Performance. Upper Saddle River, NJ: Prentice Hall PTR.
Taylor, W.A (1997). Leadership challenges for smaller organisations: self-perceptions of TQM implementation. Omega-International Journal Management Science, 25(5):567-579
Taylor, W.A. (1995). Senior executives and ISO 9000 – attitudes, behaviours and commitment. International Journal of Quality & Reliability Management, 12(4): 40-57.

References
Maneesh Kumar 368
Taylor, W.A. and Wright, G.H. (2003). A longitudinal study of TQM implementation: factors influencing success and failure. Omega, 31:97-111.
Teddlie, C., and Tashakkori, A. (2009). Foundations of mixed methods research: Integrating quantitative and qualitative approaches in the social and behavioral sciences. Thousand Oaks, CA: Sage Publications
Temtime, Z. T. and Solomon, G. H. (2002). Total quality management and the planning behavior of SMEs in developing economies. The TQM Magazine, 14(3): 181 - 191.
Tennant, G. (2001). Six Sigma: SPC and TQM in Manufacturing and Services. UK: Ashgate Publishing
Terziovski, M. (2003). The relationship between networking practices and business excellence: a study of small to medium enterprises (SMEs). Measuring Business Excellence, 7(2): 78-92.
Terziovski, M., Samson, D. (2000). The effect of company size on the relationship between TQM strategy and organizational performance. The TQM Magazine, 12(2): 144-148.
Terziovski, M., Samson, D., and Dow, D., (1997). The business value of quality management systems certification: evidence from Australia and New Zealand. Journal of Operations Management, 15:1-18.
The Chambers Dictionary, (2003), Edinburgh, UK : Chambers Harrap Publishers Ltd.,
Thomas, A. and Barton, R. (2006). Developing an SME based six sigma strategy. Journal of Manufacturing Technology Management ,17(4): 417 - 434.
Thomas, A. J. (2007). Creating sustainable small to medium enterprises through technological innovation. Journal of Engineering Manufacture, 221: 513-528.
Thomas, A. J., and Webb, D. (2003). Quality Systems implementation in Welsh small-to medium-sized enterprises: a global comparison and a model for change. Journal of Engineering Manufacture, 217(4): 573-579.
Thomas, A., Barton, R., and Chuke-Okafor, C.(2009). Applying lean six sigma in a small engineering company †a model for change. Journal of Manufacturing Technology Management ,20(1): 113 - 129.
Thomas, A.J., Barton, R., and John, E.J. (2008). Advanced manufacturing technology implementation: a review of benefits and a model for change. International Journal of Productivity and Performance Management, 57(2):156-176
Thomerson, L.D. (2001). Journey for Excellence: Ketuchky’s Commonwealth Health Corporation Adopts Six Sigma Approach. ASQ’s 55th Annual Quality Congress Proceedings, 152-158.
Tidd, J., Bessant, J., and Pavitt, K. (2001). Managing Innovation: Integrating Technology, Market and Organizational Change (2nd ed.). West Sussex, UK: John Wiley & Sons Ltd.
Tolentino, A. (2000). Guidelines or the Analysis of Policies and Programmes for Small and Medium Enterprises Development. ILO Enterprise and Management Development Working Paper-EMD/13/E, Retrieved 14th April 2008

References
Maneesh Kumar 369
Tonge, J. (2001). A review of small business literature: defining the small business. MMU Business School Working Paper, Manchester Metropolitan University, Manchester.
Van den Heuvel, J., Does, R.J.M.M. and de Koning, H. (2006). Lean Six Sigma in a hospital. International Journal of Six Sigma and Competitive Advantage, 2(4):377–388
Vinnell, R., and Hamilton, R. T. (1999). A historical perspective on small firm development. Entrepreneurship Theory and Practice, 23(4): 5-18.
Voss, C. (1995). Alternative paradigms for manufacturing strategy. International Journal of Operations and Production Management, 15(4): 5-16
Voss, C., Tsikriktsis, N., Frohlich, M., (2002). Case research in operations management. International Journal of Operations and Production Management, 22(2):195-219.
Vossen, R. W. (1998). Relative Strengths and Weaknesses of Small Firms in Innovation. International Small Business Journal, 16(3): 88-94.
Walters, L. (2005). Six Sigma: is it Really Different?. Quality and Reliability Engineering International, 21(6): 221-224.
Watson, G. H. (2001). Cycles of Learning: Observations of Jack Welch. Six Sigma Forum Magazine, November 2001, 1(1).
Watts, B., and Dale, B.G. (1999). Small- Business Evaluation and Support Services, A Model from the United Kingdom. Quality Progress, 32(2): 80-83.
Waxer,C. (2004). Is Six Sigma Just for Large Companies? What about Small Companies?. Available from http://www.isixsigma.com/library/content/ [Accessed on 2nd March, 2010]
Weile, V.D. T., Williams, A.R.T., Dale, B.G. (2000). ISO 9000 and Excellence Model: fad to fashion to fit. Journal of General Management, 25(3):50-66.
Wessel, G., and Burcher, P. (2004). Six Sigma for Small and Medium-Sized Enterprises. The TQM Magazine, 16(4): 264-272.
Wiele V.D.A., Brown A. (1998). Venturing down the TQM path for SMEs. International Small Business Journal, 16 (2):50-68.
Wiele V.D.A., Brown A. (1999). Self-assessment practices in Europe and Australia. International Journal of Quality & Reliability, 16(3): 238-51
Wiele, V.D. A., William, A.R.T. and Brown, A. (2001). ISO 9000 series as a tool for organisational change: a case for it?. Business Process Management Journal, 7(4): 323-331.
Wiele, V.D.A., Williams, A.R.T., Dale, B.G., Kolb, F., Luzon, D.M., Wallace, M., and Schmidt, A. (1996). Self-assessment: a study of progress in Europe’s leading organizations in quality management practices. International Journal of Quality and Reliability Management, 13(1): 88-104.
Wiele, V.D.T. and Brown, A. (1997). ISO 9000 series: experiences in small and medium-sized enterprises. Total Quality Management, 8( 2/3):300-305.
Wiklund, H. and Wiklund, P.S. (2002). Widening the Six Sigma concept: An approach to improve organizational learning. Total Quality Management, 13(2):233-239
References
Maneesh Kumar 370
Wilkes, N. and Dale, B.G. (1998). Attitudes to self-assessment and quality awards: A study in small and medium-sized companies. Total Quality Management, 9(8): 731-739.
Williams, N. (1997). ISO 9000 as a route to TQM in small to medium sized enterprises: snake or ladder?. The TQM Magazine, 9(1):8-13
Wilson, N. (2004). The Small Company and Six Sigma: Advantages of the Small Business Culture. Available from http://www.sixsigmaforum.com/protected/articles/ [Accessed on March 7th, 2010]
Witcher, B. (1994).The adoption of total quality management in Scotland. The TQM Magazine, 6(2):48-53.
Womack, J.P., and Jones, D.T. (1994). From lean production to the lean enterprise. Harvard Business Review, 72(March–April (2):93–104
Womack, J.P., and Jones, D.T. (1996). Lean Thinking: Banish Waste and Create Wealth for Your Corporation. New York: Simon & Schuster
Womack, J.P., Jones, D.T., and Roos, D. (1990). The Machine That Changed the World. New York: Rawson Associates
Wright, D.T. and Burns, N.D. (1998). New organization structures for global business: an empirical study. International Journal of Operations and Production Management, 18(9/10):896-923
Writers, S. (2007). Six Sigma: Preparing your organization for Six Sigma, Six Sigma forum Magazine Available: http://www.asq.org/forums/sixsigma/beginner/beg_preparing_organization.html (Accessed 15 July, 2007)
Yin, R.Y. (2003), Case Study Research, 3rd Ed., California, USA: Sage Publication Inc.
Youssef, M. A., Mohamed, Z., Sawyer, J., and Whaley, G. L. (2002). Testing the impact of integrating TQM and DFM on the ability of small to medium size firms to respond to their customer needs. Total Quality Management, 13(3): 301-313.
Yusof, S. M. and Aspinwall E. (2001). Case studies on the implementation of TQM in the UK automotive SMEs. International Journal of Quality & Reliability Management, 18(7): 722 - 744.
Yusof, S. M. and Aspinwall, E. (2000c). A conceptual framework for TQM implementation for SMEs. The TQM Magazine, 12(1): 31 - 37.
Yusof, S. M. and Aspinwall, E. (2000a). Total quality management implementation frameworks: comparison and review. Total Quality Management, 11(3): 281- 294.
Yusof, S. M. and Aspinwall, E. (2000b). TQM implementation issues: review and case study. International Journal of Operations & Production Management, 20(6): 634 - 655.
Yusof, S.M. and Aspinwall, E. (1999). Critical success factors for total quality management implementation in small and medium enterprises. Total Quality Management, 10(4/ 5): S803-S809.
Yusuf, Y., and Adeleye, E.O. (2002). A comparative study of lean and agile manufacturing with a related survey of current practices in the UK. International Journal of Production Research, 40(17):4545-4562.

References
Maneesh Kumar 371
Zahra, S. A., and George, G. (2002). Absorptive capacity: a review, reconceptualization, and extension. Academy of Management Review, 27(2): 185-203.
Zairi, M. (2002), Synchronisation of TQM. The TQM Magazine, 14(1): 5-6.
Zairi, M., Letza, S.R., Oakland, J.S. (1994). Does TQM impact on bottom-line results?. The TQM Magazine, 6(1):38-43
Zu, X., Fredendall, L. D. et al. (2008). The evolving theory of quality management: The role of Six Sigma. Journal of Operations Management, 26(5): 630-650.

Appendices
Maneesh Kumar 372
Appendices
Appendix I: Growth models of SMEs
Appendix II: Survey Questionnaire
Appendix III: Invitation letter and interview protocol
Appendix IV: Six Sigma Readiness Index questionnaire
Appendix V: List of publications from this doctoral research

Appendices
Maneesh Kumar 373
APPENDIX I

Appendices
Maneesh Kumar 374
Growth Model of SMEs
Business researchers have proposed a number of models over the last five decades that seek to delineate life cycle of small business. Dobbs and Hamilton (2007) classified the approaches to study the life cycle of small business into six broad categories: stochastic; descriptive; evolutionary; resource-based; learning; and deterministic. For the purpose of this research, the review is limited to only three approaches, i.e. descriptive, deterministic and learning approaches, to identify and understand the critical factors affecting the transition of small firms into large organization, rather than understanding ‘how’ the transition occurs in all the categories discussed by Dobbs and Hamilton (2007). Moreover, the other three approaches, i.e. stochastic, evolutionary, and resource-based, have several limitations and failed to explain and justify the phenomenon of small business growth (Levie and Hay, 1998; Vinnell and Hamilton, 1999; Rutherford et al., 2003; Reichstein and Dahl, 2004). The identification of critical factors and their impact on small business growth are measured by focusing only on the key approaches: descriptive, deterministic and learning approaches. The focus of reviewing the growth models is only to understand the key characteristics of firms rather than commenting on how the firm transform from small business to large organization.
Descriptive approach
SMEs in the past have failed to realise that their future success lie in understanding the characteristics of their own business and its evolving stages of development. The main tenet of ‘descriptive’ research perspective is underpinned in two significant assumptions: firms grow linearly; and this growth can be categorised into predictable, discrete, and consistent stages (Lippitt and Schmidt, 1967; Steinmetz, 1969; Greiner, 1972, 1998; Churchill and Lewis, 1983; Quinn and Cameron, 1983; Scott and Bruce, 1987). Moreover, each stage or phase is both an effect of the previous phase and a cause of the next (Greiner, 1972, 1998). The transition from one phase to next requires considerable changes and often experiences crisis (Steinmetz, 1969; Churchill and Lewis, 1983; Scott and Bruce, 1987) or revolution (Greiner, 1972,1998) followed by stability. The models proposed by researchers act as diagnostic tools in assisting firm’s current position and a indicator of strategies that would be suitable at different stages of firm growth. The focus in this section is to identify the critical factors that facilitate in trouncing the crisis as the firm progresses to next stage in its life cycle.
To develop the better understanding of the stage model, we will discuss the work of Greiner (1972), as this is the most cited literature on stages of small business growth. Greiner (1972, 1998) considered five key dimensions of age; size; stages of evolution; stages of revolution; and growth rate of industry, to build a general growth model for organization development as presented in figure 1 and table 1. Greiner (1972) described the growth stages of firms as ‘evolution’ [i.e. describe the prolonged periods of growth whereon major upheaval occurs in organization practices] and the critical transition stage to next phase as ‘revolution’ [i.e. describe those periods of substantial turmoil in organization life]. The model reflects the change in management style from individualistic and entrepreneurial to participative as the firm matures and grows bigger.

Appendices
Maneesh Kumar 375
Figure 1. Greiner model of five stages of growth (Greiner, 1972)
Revisiting the topic again in 1998 and studying number of firms, Greiner stated that that major phases of development in the life of growing companies last between three to fifteen years each. The high growth industry experiences each phase at a faster rate as compared to slow-growing industry. The organizational practices during the five phase of growth in Greiner’s model are presented in table 1 below. Strong leadership, management commitment and focus, formal organizational structure, and reward and recognition were considered as critical factors in the growth of small firms.
As a firm grow from small size (Phase 1) to large organization (Phase 5), as shown in figure 1 and table 1, significant changes in organizational structure, management style, control system, management focus is observed. During this transition period, the structure becomes more formal, management becomes participative in delegating responsibilities and more focus is on expanding the market and consolidating their business rather than struggling for survival. As the firm grow, more resources are available (human, technical, financial) to train and reward employees, that may result in the improvement of established strategic and operational performance measures. These observations are also reported in other literature on the life cycle of small business (Lippitt and Schmidt, 1967; Steinmetz, 1969; Greiner, 1972, 1998; Churchill and Lewis, 1983; Quinn and Cameron, 1983; Scott and Bruce, 1987; Mitra and Pingali, 1999; Shim et al., 2000; Kazanjian, 1988; Gupta and Chin, 1993; Hanks et al., 1993; Barringer et al., 2005).
Table 1. Organizational Practice in the five phases of growth (Greiner, 1972)
Category Phase 1 Phase 2 Phase 3 Phase 4 Phase 5
Management Focus
Make and Sell Efficiency of operations
Expansions of market
Consolidation of organization
Problem Solving and innovation
Organizational Structure
Informal Centralized and functional
Decentralized and geographical
Line staff and product groups
Matrix of teams

Appendices
Maneesh Kumar 376
Top-Management Style
Individualistic and entrepreneurial
Directive Delegation Watchdog Participative
Control System
Market results Standards and cost centres
Reports and profit centres
Plans and investment centres
Mutual goal setting
Management Reward Emphasis
Ownership Salary and merit increases
Individual bonus
Profit sharing and stock options
Team Bonus
An imbalance of aforementioned factors at each stage of growth may result in creating serious problems for the entrepreneur. It is therefore vital for the managing directors of small businesses to understand, anticipate and manage the factors as they become important to the company. The knowledge of their current status would facilitate managers to make more informed choices and get prepared themselves for future challenges. Similarly, analyzing other literature on stage models for organizations facilitated in identifying critical factors that determines the successful growth of small firms. The details of the findings are presented in table 2.4. Concluding from the review of descriptive stage models, determinants of small business growth are as follows: Strong Leadership; Management Commitment; Strategic Planning; Formal organizational structure; Focus on human resources; Information planning and control mechanism; Flexibility.
Stage models proposed in the past have received criticism in recent years for being conceptual, descriptive (Phelps et al, 2007; Bessant et al., 2005), speculatively normative (Gibb and Davies, 1990), and prescriptive in assuming that all firms grow through series of predictable phases or preordained stages. Stubbart and Smalley (1999) argues that stage models are enticing because of simplification of several facts associated with complex transformational change to a uniform, predictable, unidirectional, designated liner paths. Majority of the proposed descriptive stage models is either theoretical or conceptual in nature or grounded in empirical model of questionable validity.
Business models proposed by the researchers in the past for small businesses experience stages of growth, each with its own distinctive characteristics. It’s true that not all business experience all phases of growth. However, a prior knowledge of next stage of development would facilitate the owner in planning the future of the business.
These models may help the SMEs to identify the crisis point in the growth stage and identify the remedial measures that would be necessary to successfully negotiate the next stage of growth. Some of the other information drawn from models is presented below.
• Few organizations experience all the phases of growth. Most of the companies fail in the initial phase of inception and survival or often merges/get acquired by companies that are in a stage of growth or maturity.
• Each phase of business growth posses its own characteristics, unique structure, systems, and leadership. The strengths and learning from the preceding phase will add on to or act as essential for the success in succeeding phase.
• Business models proposed provides a simple outline of the vast challenges the management may encounter when envisaging the firm growth- e.g., challenges

Appendices
Maneesh Kumar 377
during the change of role from direct supervision in the start stage to delegation of responsibilities as the firm grow larger.
• Being cognizant about the history of business development would enable the managers to be in a vantage of evaluating their current status, predicting problems, dismantle current structure, proactively prepare solution and coping strategies for problems.
One of the criticisms of descriptive stage models is that researchers failed to statistically validate models and explain the variation in critical factors at different stages of firm’s growth. However, as cited in majority of stage models literature, the performance of any organization still depends on fundamentals of goal management –strong leadership, committed and motivated workforce, understanding voice of customer and devising a winning strategy.
Deterministic approach
Similar to descriptive approach, deterministic approach also focuses on life-cycle models for business to grow. The critical difference in two approaches lie in the fact that the deterministic approach takes into account set of explanatory variables relating to people, firm, and its industry environment to explain the variation in the organization growth rates by applying the concept of multivariate techniques to large cross-section data sets (Dobbs and Hamilton, 2007). On the contrary, there is no statistical rigour involved in validating the models of small business growth in descriptive approach.
The research in this dominant empirical approach to develop the prescriptive model of small business growth is growing in importance to establish the list of context-specific variables that determines the growth of small firms (Barringer et al., 2005; Davidsson and Klofsten, 2003; Chaganti et al., 2002; Shim et al., 2000; Mitra and Pingali, 1999; Hanks and Chandler, 1994; Hanks et al., 1993; Kazanjian, 1988; Smith et al., 1985). Most of the models proposed were developed by taking cue from the work of Greiner (1972), Churchill and Lewis (1983), and Scott and Bruce (1987).
Sample cases selected during model development in many studies were associated with high technology companies or newly formed companies (Kazanjian and Drazin, 1989). Majority of the listed researchers used factor analysis followed by cluster analysis to determine the existence of discrete life cycle stages through identification of patterns of variables. The focus was on how the variables vary across different stages of life cycle, i.e. a variable may be important when the firm is at its inception but the degree of importance will change as the firm matures into large organization. For example, at the inception stage, more importance is given to autocratic style of leadership whereas the importance shifts to participative style as the firm matures. Similarly the organizational structure is centralised and informal during the start-up stage but more importance is assigned to formal structure to manage the business in a better way as the firm matures.
Several factors critical to the growth of firms were identified and is listed in table 2.5 below. Organizational structure, planning, communication, strategy, top-management decision making, management style, resources, rewards, organizational size and age are some common factors emerging from the review process.

Appendices
Maneesh Kumar 378
More emphasis is given in high-growth industry to mission statement, commitment to growth, customer knowledge, business strategy, and human resources issues such as employee training and education, and financial incentives as compared to slow-growth counterparts. However, many researchers failed to prioritize or provide ranking to factors that are important in life-cycle of a firm through statistical analysis. Future work need to empirically validate the importance of each factor at different stages of firm growth.

Appendices
Maneesh Kumar 379
APPENDIX II
Appendices
Maneesh Kumar 380
In the attention of General Manager/ Quality Manager/ Operations Director
Dear Sir/ Madam
The Strathclyde Institute of Operations Management at University of Strathclyde is conducting a survey as a part of a Doctoral study to assess the status of UK Small and Medium-Sized Enterprises (SMEs) in implementing quality improvement initiatives within their unit to enhance customer satisfaction and bottom-line impact. The Strathclyde Institute for Operations Management brings together the leading experts in Operations Management from Strathclyde Business School and Engineering Faculty to establish Operations Management as a strategic resource. The mission of the Institute is to provide thought leadership and facilitate the advancement of the theory and practice of operations management through internationally leading research, innovative education programmes, and services to business.
The main aim of this Doctoral research is to develop a ‘Readiness Index’ that can identify key areas a company is excelling in or indeed if underperforming. We plan to develop a practical framework for SMEs as a guide to getting started with quality improvement initiatives like Lean and Six Sigma and in achieving and sustaining results. The results from the survey will be used for the research purpose only and no attempt will be made to identify any individual in the organisation. All responses will be treated with the utmost confidence and no single set of responses will be readily identifiable. Your assistance and time taken to complete this questionnaire is greatly appreciated. Companies participating in this study will be offered a discount of 10% to attend the “First European research conference on quality management and Lean Six Sigma” in Glasgow. For more information about the conference, please visit http://www.inderscience.com/mapper.php?id=51 .
Thanks a lot
Kind Regards
Maneesh Kumar M103, James Weir Building 75 Montrose Street University of Strathclyde Glasgow- G1 1XJ Email: [email protected] Voice: 0141 548 2588 (o), 07727008427 (m) Fax: 0141 552 0557
Strathclyde Institute of Operations Management Design Manufacturing and Engineering Management
University of Strathclyde
Survey Questionnaire
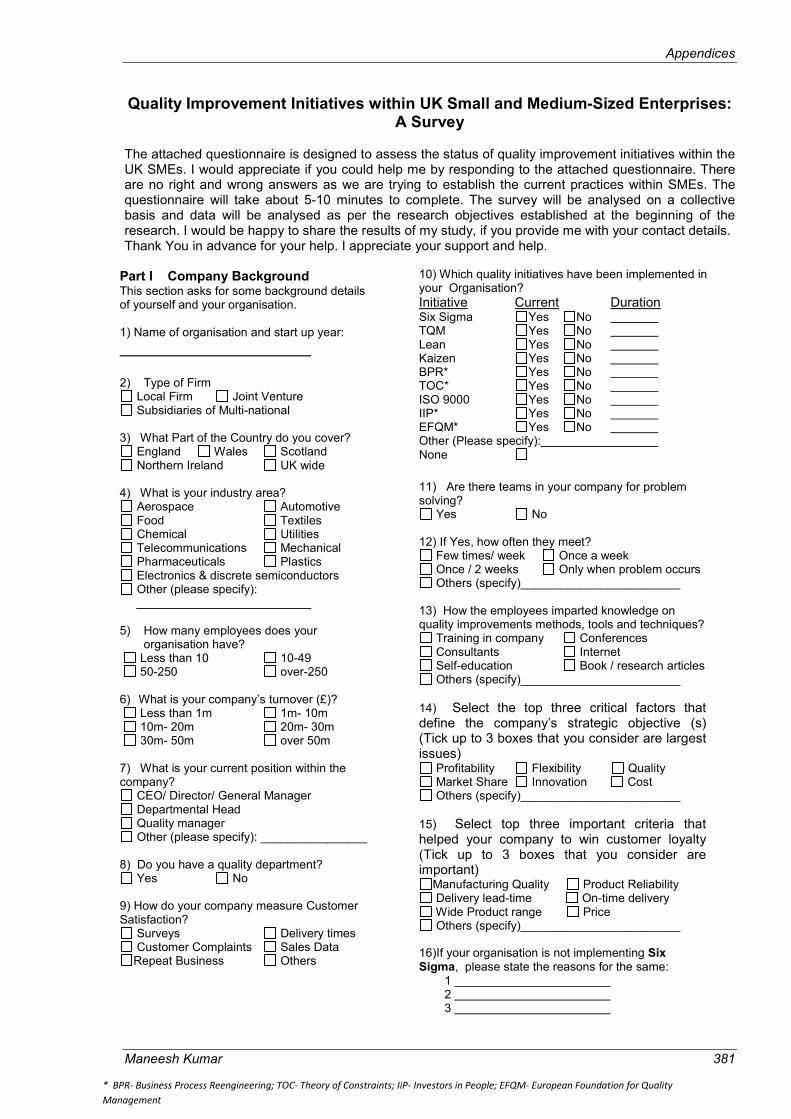
Appendices
Maneesh Kumar 381
Quality Improvement Initiatives within UK Small and Medium-Sized Enterprises: A Survey
The attached questionnaire is designed to assess the status of quality improvement initiatives within the UK SMEs. I would appreciate if you could help me by responding to the attached questionnaire. There are no right and wrong answers as we are trying to establish the current practices within SMEs. The questionnaire will take about 5-10 minutes to complete. The survey will be analysed on a collective basis and data will be analysed as per the research objectives established at the beginning of the research. I would be happy to share the results of my study, if you provide me with your contact details. Thank You in advance for your help. I appreciate your support and help.
Part I Company Background This section asks for some background details of yourself and your organisation. 1) Name of organisation and start up year:
2) Type of Firm
Local Firm Joint Venture Subsidiaries of Multi-national
3) What Part of the Country do you cover?
England Wales Scotland Northern Ireland UK wide
4) What is your industry area?
Aerospace Automotive Food Textiles Chemical Utilities Telecommunications Mechanical Pharmaceuticals Plastics Electronics & discrete semiconductors Other (please specify):
5) How many employees does your
organisation have? Less than 10 10-49 50-250 over-250 6) What is your company’s turnover (£)? Less than 1m 1m- 10m 10m- 20m 20m- 30m 30m- 50m over 50m 7) What is your current position within the company?
CEO/ Director/ General Manager Departmental Head Quality manager Other (please specify): ________________
8) Do you have a quality department?
Yes No 9) How do your company measure Customer Satisfaction?
Surveys Delivery times Customer Complaints Sales Data Repeat Business Others
10) Which quality initiatives have been implemented in your Organisation?
Initiative Current Duration Six Sigma Yes No TQM Yes No Lean Yes No Kaizen Yes No BPR* Yes No TOC* Yes No ISO 9000 Yes No IIP* Yes No EFQM* Yes No Other (Please specify): None
11) Are there teams in your company for problem solving?
Yes No
12) If Yes, how often they meet? Few times/ week Once a week Once / 2 weeks Only when problem occurs Others (specify)________________________
13) How the employees imparted knowledge on quality improvements methods, tools and techniques?
Training in company Conferences Consultants Internet Self-education Book / research articles Others (specify)________________________
14) Select the top three critical factors that define the company’s strategic objective (s) (Tick up to 3 boxes that you consider are largest issues)
Profitability Flexibility Quality Market Share Innovation Cost Others (specify)________________________
15) Select top three important criteria that helped your company to win customer loyalty (Tick up to 3 boxes that you consider are important)
Manufacturing Quality Product Reliability Delivery lead-time On-time delivery Wide Product range Price Others (specify)________________________
16)If your organisation is not implementing Six Sigma, please state the reasons for the same:
1 2 3
* BPR- Business Process Reengineering; TOC- Theory of Constraints; IiP- Investors in People; EFQM- European Foundation for Quality
Management

Appendices
Maneesh Kumar 382
Part 2 Critical Success Factors This section determines the degree of importance and implementation level for the factors that you consider to be crucial whilst implementing quality initiatives (QI) in your organisation. Please tick the appropriate box according to the following code: (Use a five-point Likert scale from 1(not important) to 5 (very important) for importance and also use the same for the implementation level, from 1 (not implemented) to 5 (fully implemented).
Importance Implementation Level (1 – 5) (1 – 5) Management Involvement and Commitment □ □ □ □ □ □ □ □ □ □ Organisational Infrastructure □ □ □ □ □ □ □ □ □ □ Cultural Change □ □ □ □ □ □ □ □ □ □ Education and Training □ □ □ □ □ □ □ □ □ □ Vision and Plan Statement □ □ □ □ □ □ □ □ □ □ Linking Quality Improvement (QI) Initiative to Customers □ □ □ □ □ □ □ □ □ □ Linking QI Initiative to Business Strategy □ □ □ □ □ □ □ □ □ □ Linking QI Initiative to Employees □ □ □ □ □ □ □ □ □ □ Linking QI Initiative to Suppliers □ □ □ □ □ □ □ □ □ □ Communication □ □ □ □ □ □ □ □ □ □ Project Management Skills □ □ □ □ □ □ □ □ □ □ Project Prioritisation and Selection □ □ □ □ □ □ □ □ □ □ Usage of Innovative techniques and IT systems □ □ □ □ □ □ □ □ □ □ Others (Please Specify): ________________________ _________________________
Part 3 Results of Implementation of Quality Improvement Program
This section asks about the benefits that your organisation has experienced following the implementation of Quality Improvement program in your business process(es). Please tick the appropriate box according to the following code:
1 Negative benefit / improvement 2 No benefit / improvement 3 Some benefit / improvement 4 Significant benefit / improvement 5 Crucial
1. 1 2 3 4 5 Measure
Not used in the company
Reduction of scrap rate
Reduction of cycle time
Reduction of delivery time
Increase in productivity
Reduction of costs
Increase in profitability
Improved sales
Reduction of customer complaints
Reduction of Employee Complaints/Grievances
2. Do you understand the term Cost of Quality? Yes No

Appendices
Maneesh Kumar 383
If you have answered Yes to question 2, please mention the factors that constitute cost of quality in your company. _____________________________________________________________________________ _____________________________________________________________________________ _____________________________________________________________________________ _____________________________________________________________________________
3. What have been the Five largest issues you have faced during implementation of quality improvement initiatives? (Please select Five from the list)
Lack of top management commitment Lack of Knowledge Poor Supplier involvement Poor Employee Participation Poor Delegation of authority Lack of Training Inadequate process control techniques Availability of resources Changing business focus Internal resistance Poor project selection
4. Please use this space to tell us more about the successful (and unsuccessful) quality initiatives within your organization
Part 4 Contact Details If you would like a copy of the results of this survey, please tick this box If you would like to participate in future study, please tick this box
Please provide your contact details Name………………………………………………………………………………………………… Organization ……………………………………………………………………………………….. Address ……………………………………………………………………………………………… Email ………………………………………………………………………………………………… Fax Number ………………………………………………………………………………………… Tel Number …………………………………………………………………………………………
Thanks a lot for taking the time to complete this questionnaire. Please return it either by fax to 0141-552-0557 or post them to me,
Maneesh Kumar, M103, James Weir Building, 75 Montrose Street, University of Strathclyde
Glasgow- G1 1XJ

Appendices
Maneesh Kumar 384
APPENDIX III

Appendices
Maneesh Kumar 385
SMEs AND SIX SIGMA – DOCTORAL RESEARCH INTERVIEW INVITE Dear ____________________
I’d like to take this opportunity to thank you for participating in the first phase of research conducted by CRISSPI on assessing the status of UK manufacturing SMEs to implement Six Sigma. Based on the questionnaire that you completed a report will be prepared utilising the findings from the survey and will be sent to you for your perusal. The findings from this study have helped us to identify a number of SMEs existing quality practices including, performance metrics used in the company, critical success factors and barriers to implementation of quality initiatives.
The aim of this Doctoral research is to develop a ‘Readiness Index’ that can identify the areas where the company is excelling in or underperforming. We will also be developing and proposing a Six Sigma practical framework for SMEs that would provide a guideline as how to get started with Six Sigma followed by sustaining the results achieved by implementing Six Sigma. This framework will be of practical utility to industry helping companies like yourselves evaluate your readiness for Six Sigma implementation.
In order to develop this framework, it is essential that I gain a more detailed picture of the quality practices in SMEs. This aim can be fulfilled through interviewing yourself and some of your colleagues including the Managing Director/ Operations Director and Quality Manager of your company. I am interested in hearing your experiences and challenges you have faced in deploying Quality Initiatives in your company. The interview process would not last for more than 90 minutes and will form, not only an integral part of my research but will also make a valuable contribution to the field of quality management. All responses will be treated with the utmost confidence and no single set of responses will be readily identifiable. Please let me know your two or three available dates in next two months to schedule the meeting. Thanks a lot in anticipation of your continued support Kind Regards Maneesh Kumar M103, James Weir Building 75 Montrose Street University of Strathclyde Glasgow- G1 1XJ Email: [email protected] Voice: 0141 548 2588 (o), 07727008427 (m) Fax: 0141 552 0557
Strathclyde Institute of Operations Management Design Manufacturing and Engineering Management
University of Strathclyde DOCTORAL RESEARCH INTERVIEW INVITE
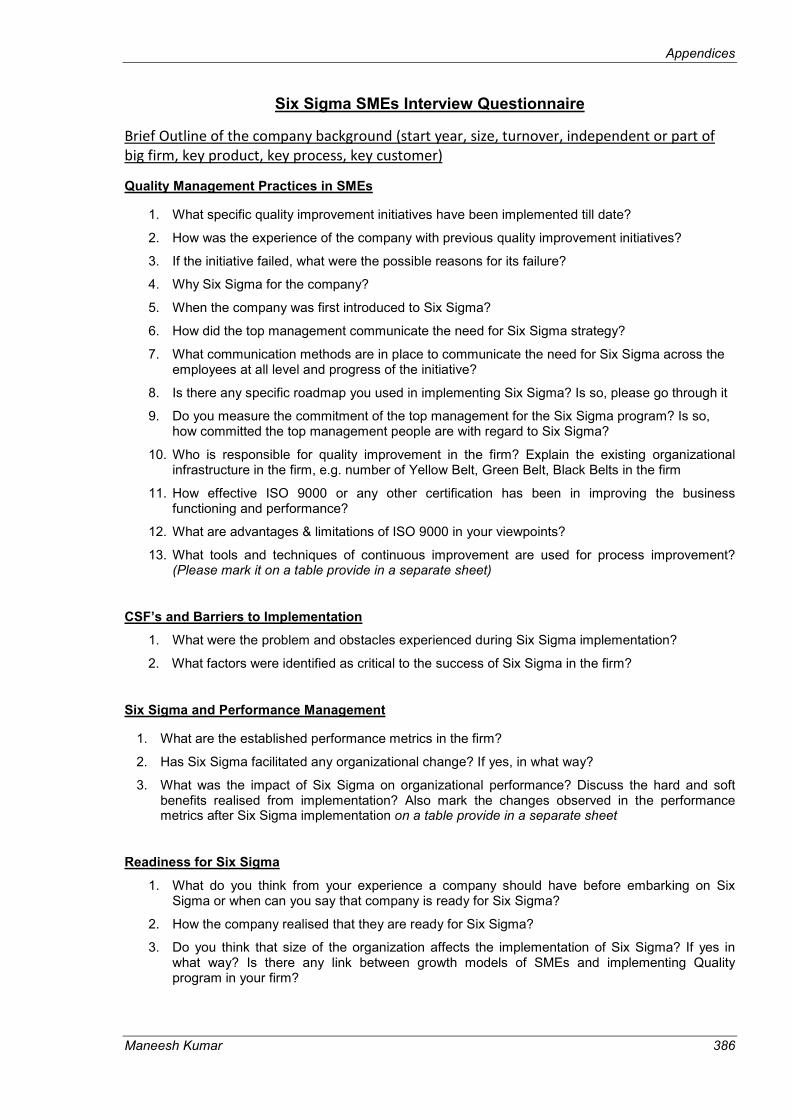
Appendices
Maneesh Kumar 386
Six Sigma SMEs Interview Questionnaire
Brief Outline of the company background (start year, size, turnover, independent or part of
big firm, key product, key process, key customer)
Quality Management Practices in SMEs
1. What specific quality improvement initiatives have been implemented till date?
2. How was the experience of the company with previous quality improvement initiatives?
3. If the initiative failed, what were the possible reasons for its failure?
4. Why Six Sigma for the company?
5. When the company was first introduced to Six Sigma?
6. How did the top management communicate the need for Six Sigma strategy?
7. What communication methods are in place to communicate the need for Six Sigma across the employees at all level and progress of the initiative?
8. Is there any specific roadmap you used in implementing Six Sigma? Is so, please go through it
9. Do you measure the commitment of the top management for the Six Sigma program? Is so, how committed the top management people are with regard to Six Sigma?
10. Who is responsible for quality improvement in the firm? Explain the existing organizational infrastructure in the firm, e.g. number of Yellow Belt, Green Belt, Black Belts in the firm
11. How effective ISO 9000 or any other certification has been in improving the business functioning and performance?
12. What are advantages & limitations of ISO 9000 in your viewpoints?
13. What tools and techniques of continuous improvement are used for process improvement? (Please mark it on a table provide in a separate sheet)
CSF’s and Barriers to Implementation
1. What were the problem and obstacles experienced during Six Sigma implementation?
2. What factors were identified as critical to the success of Six Sigma in the firm?
Six Sigma and Performance Management
1. What are the established performance metrics in the firm?
2. Has Six Sigma facilitated any organizational change? If yes, in what way?
3. What was the impact of Six Sigma on organizational performance? Discuss the hard and soft benefits realised from implementation? Also mark the changes observed in the performance metrics after Six Sigma implementation on a table provide in a separate sheet
Readiness for Six Sigma
1. What do you think from your experience a company should have before embarking on Six Sigma or when can you say that company is ready for Six Sigma?
2. How the company realised that they are ready for Six Sigma?
3. Do you think that size of the organization affects the implementation of Six Sigma? If yes in what way? Is there any link between growth models of SMEs and implementing Quality program in your firm?
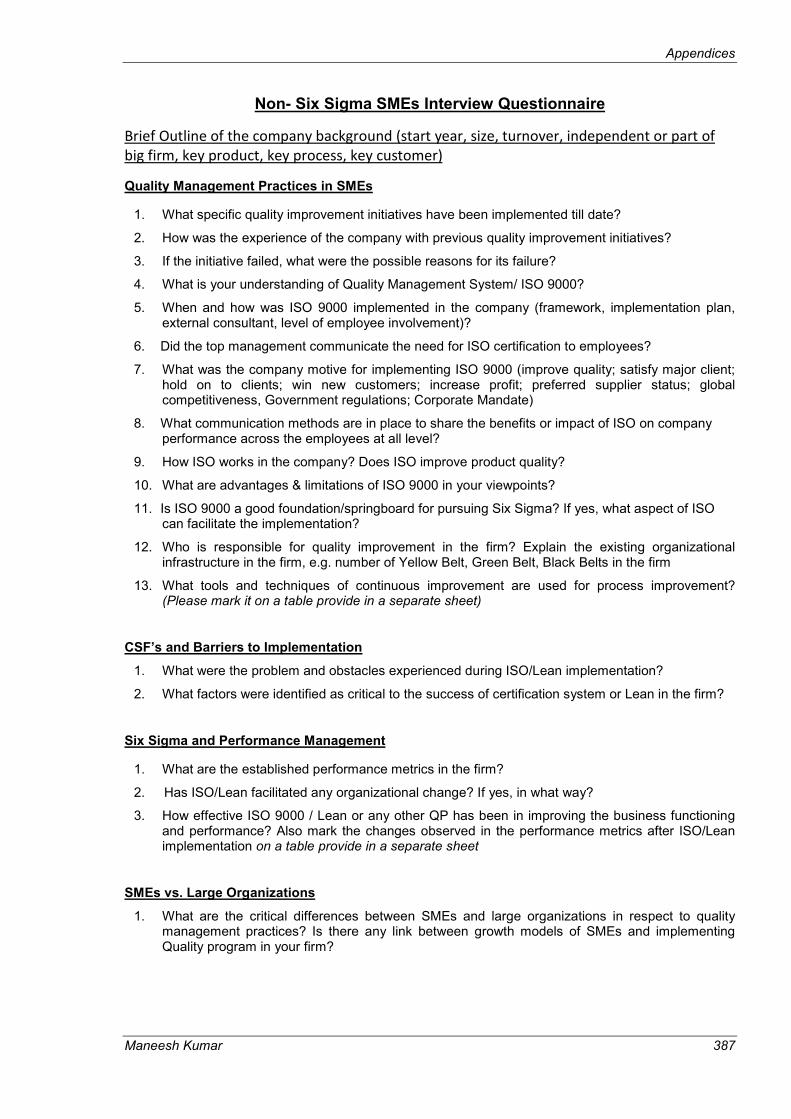
Appendices
Maneesh Kumar 387
Non- Six Sigma SMEs Interview Questionnaire
Brief Outline of the company background (start year, size, turnover, independent or part of
big firm, key product, key process, key customer)
Quality Management Practices in SMEs
1. What specific quality improvement initiatives have been implemented till date?
2. How was the experience of the company with previous quality improvement initiatives?
3. If the initiative failed, what were the possible reasons for its failure?
4. What is your understanding of Quality Management System/ ISO 9000?
5. When and how was ISO 9000 implemented in the company (framework, implementation plan, external consultant, level of employee involvement)?
6. Did the top management communicate the need for ISO certification to employees?
7. What was the company motive for implementing ISO 9000 (improve quality; satisfy major client; hold on to clients; win new customers; increase profit; preferred supplier status; global competitiveness, Government regulations; Corporate Mandate)
8. What communication methods are in place to share the benefits or impact of ISO on company performance across the employees at all level?
9. How ISO works in the company? Does ISO improve product quality?
10. What are advantages & limitations of ISO 9000 in your viewpoints?
11. Is ISO 9000 a good foundation/springboard for pursuing Six Sigma? If yes, what aspect of ISO can facilitate the implementation?
12. Who is responsible for quality improvement in the firm? Explain the existing organizational infrastructure in the firm, e.g. number of Yellow Belt, Green Belt, Black Belts in the firm
13. What tools and techniques of continuous improvement are used for process improvement? (Please mark it on a table provide in a separate sheet)
CSF’s and Barriers to Implementation
1. What were the problem and obstacles experienced during ISO/Lean implementation?
2. What factors were identified as critical to the success of certification system or Lean in the firm?
Six Sigma and Performance Management
1. What are the established performance metrics in the firm?
2. Has ISO/Lean facilitated any organizational change? If yes, in what way?
3. How effective ISO 9000 / Lean or any other QP has been in improving the business functioning and performance? Also mark the changes observed in the performance metrics after ISO/Lean implementation on a table provide in a separate sheet
SMEs vs. Large Organizations
1. What are the critical differences between SMEs and large organizations in respect to quality management practices? Is there any link between growth models of SMEs and implementing Quality program in your firm?
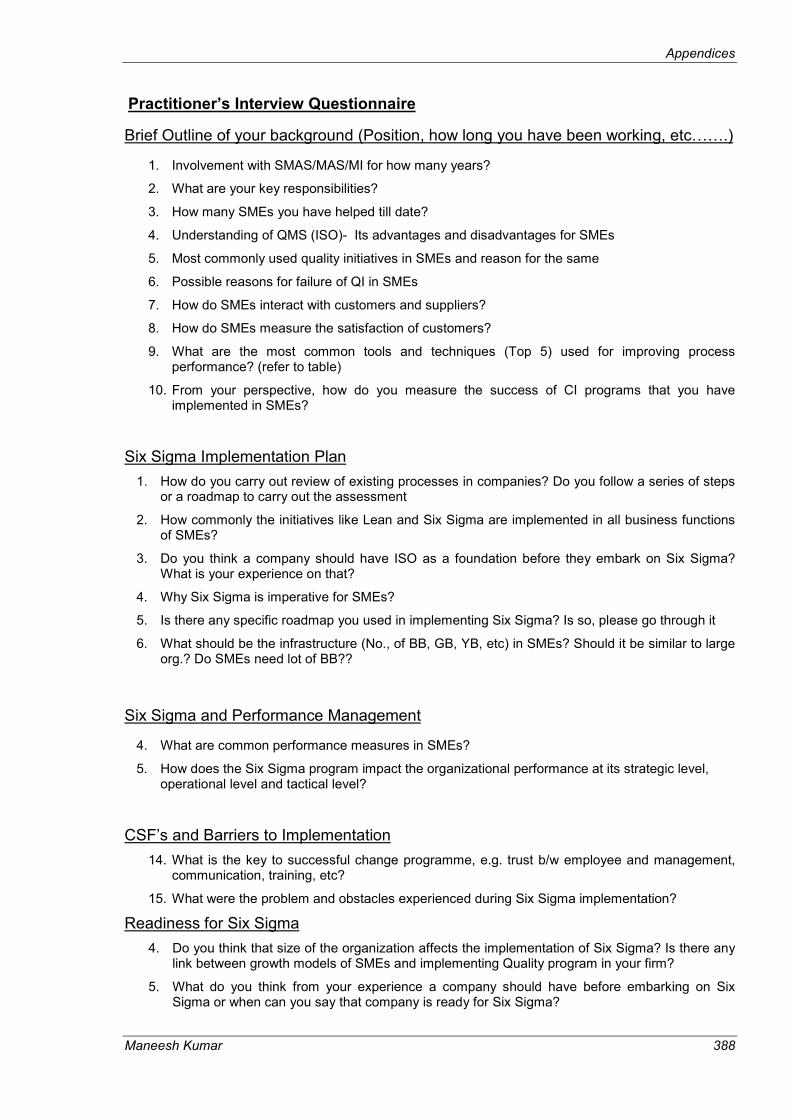
Appendices
Maneesh Kumar 388
Practitioner’s Interview Questionnaire
Brief Outline of your background (Position, how long you have been working, etc…….)
1. Involvement with SMAS/MAS/MI for how many years?
2. What are your key responsibilities?
3. How many SMEs you have helped till date?
4. Understanding of QMS (ISO)- Its advantages and disadvantages for SMEs
5. Most commonly used quality initiatives in SMEs and reason for the same
6. Possible reasons for failure of QI in SMEs
7. How do SMEs interact with customers and suppliers?
8. How do SMEs measure the satisfaction of customers?
9. What are the most common tools and techniques (Top 5) used for improving process performance? (refer to table)
10. From your perspective, how do you measure the success of CI programs that you have implemented in SMEs?
Six Sigma Implementation Plan
1. How do you carry out review of existing processes in companies? Do you follow a series of steps or a roadmap to carry out the assessment
2. How commonly the initiatives like Lean and Six Sigma are implemented in all business functions of SMEs?
3. Do you think a company should have ISO as a foundation before they embark on Six Sigma? What is your experience on that?
4. Why Six Sigma is imperative for SMEs?
5. Is there any specific roadmap you used in implementing Six Sigma? Is so, please go through it
6. What should be the infrastructure (No., of BB, GB, YB, etc) in SMEs? Should it be similar to large org.? Do SMEs need lot of BB??
Six Sigma and Performance Management
4. What are common performance measures in SMEs?
5. How does the Six Sigma program impact the organizational performance at its strategic level, operational level and tactical level?
CSF’s and Barriers to Implementation
14. What is the key to successful change programme, e.g. trust b/w employee and management, communication, training, etc?
15. What were the problem and obstacles experienced during Six Sigma implementation?
Readiness for Six Sigma
4. Do you think that size of the organization affects the implementation of Six Sigma? Is there any link between growth models of SMEs and implementing Quality program in your firm?
5. What do you think from your experience a company should have before embarking on Six Sigma or when can you say that company is ready for Six Sigma?
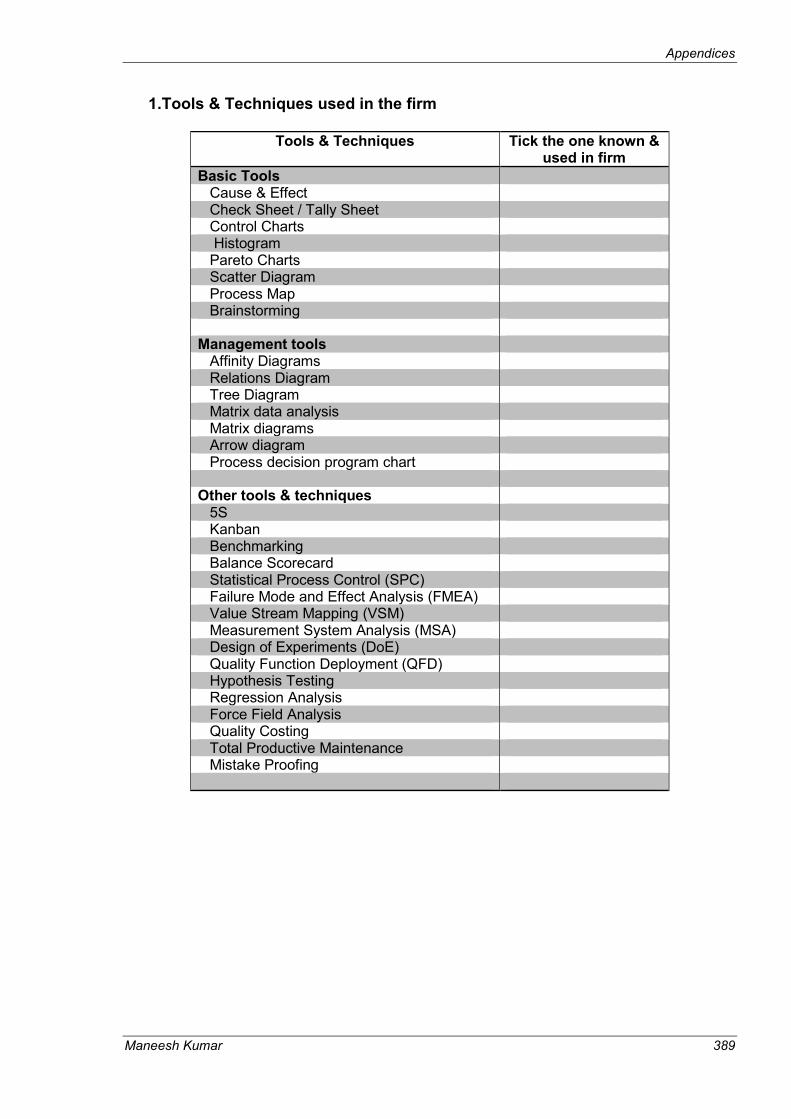
Appendices
Maneesh Kumar 389
1.Tools & Techniques used in the firm
Tools & Techniques
Tick the one known & used in firm
Basic Tools Cause & Effect Check Sheet / Tally Sheet Control Charts Histogram Pareto Charts Scatter Diagram Process Map Brainstorming
Management tools
Affinity Diagrams Relations Diagram Tree Diagram Matrix data analysis Matrix diagrams Arrow diagram Process decision program chart
Other tools & techniques 5S Kanban Benchmarking Balance Scorecard Statistical Process Control (SPC) Failure Mode and Effect Analysis (FMEA) Value Stream Mapping (VSM) Measurement System Analysis (MSA) Design of Experiments (DoE) Quality Function Deployment (QFD) Hypothesis Testing Regression Analysis Force Field Analysis Quality Costing Total Productive Maintenance Mistake Proofing

Appendices
Maneesh Kumar 390
2. Impact of QP/Certification on Performance Metrics
Performance Evaluation of Firm on the 1-5 Likert scale questions
Performance Indicators
Reduction in scrap rate
Reduction in cycle time
Reduction in delivery time
Increase in productivity
Reduction of costs
Increase in profitability
Improved sales
Reduction of customer complaints
Reduction of Employee Complaints/Grievances
1 = negative benefit / improvement; 2 = no benefit / improvement; 3= some benefit / improvement; 4=significant benefit / improvement; 5 =Crucial; 6 = measure not-used

Appendices
Maneesh Kumar 391
APPENDIX IV
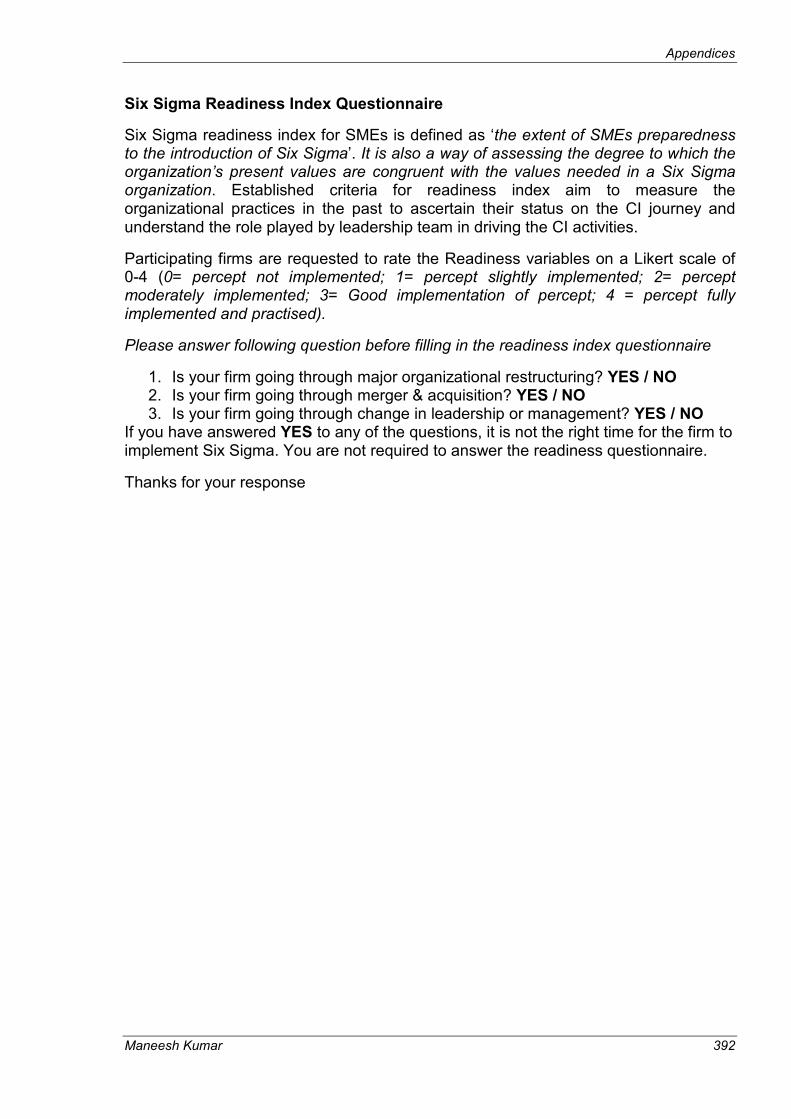
Appendices
Maneesh Kumar 392
Six Sigma Readiness Index Questionnaire
Six Sigma readiness index for SMEs is defined as ‘the extent of SMEs preparedness to the introduction of Six Sigma’. It is also a way of assessing the degree to which the organization’s present values are congruent with the values needed in a Six Sigma organization. Established criteria for readiness index aim to measure the organizational practices in the past to ascertain their status on the CI journey and understand the role played by leadership team in driving the CI activities.
Participating firms are requested to rate the Readiness variables on a Likert scale of 0-4 (0= percept not implemented; 1= percept slightly implemented; 2= percept moderately implemented; 3= Good implementation of percept; 4 = percept fully implemented and practised).
Please answer following question before filling in the readiness index questionnaire
1. Is your firm going through major organizational restructuring? YES / NO 2. Is your firm going through merger & acquisition? YES / NO 3. Is your firm going through change in leadership or management? YES / NO
If you have answered YES to any of the questions, it is not the right time for the firm to implement Six Sigma. You are not required to answer the readiness questionnaire.
Thanks for your response

Appendices
Maneesh Kumar 393
Criteria/ Precepts to measure Readiness Index
Measurement Scale
0 1 2 3 4 Leadership L1- Visible involvement and continued commitment in leading companywide quality initiatives in the past (e.g. being available to speak to staff, operating an ‘open door’ policy, walk the floor, holding briefing and feedback meetings)
L2- Understands and supported continuous improvement (CI) in the past by provision of appropriate resources, assistance, and breaking down stumbling blocks
L3- Effectively communicated vision and mission, long-term quality goals and objectives vertically down the organization to achieve quality excellence
L4- CI within the top business priority and strategically linked to business goals
L5- Recognised and appreciated the efforts and success of individuals and teams
Measurement and Processes M1- All major business processes identified and documented (using flowcharts or process mapping techniques)
M2- Key internal and external performance measures identified, defined, and developed
M3- Basic tools of CI understood and used by employees for problem solving
M4- Operations and decisions based on fact and data M5- Performance indicators monitored, displayed and communicated through debriefing sessions, intranet, and bulletin boards on a continuous basis
People Management
P1- Employee’s knowledge and competencies linked to training & development strategies, and career progression identified, developed, and sustained
P2- Employees respected accountability and discouraged blame culture
P3- Employees feel free to report information on errors and defect
P4- Organization promoted the involvement of all its employees in quality and CI
Systems & Control
S1- A policy deployment and problem-solving infrastructure in place together with robust and proactive quality system
S2- A high degree of closed loop error prevention through the control of basic production/ operation and/or service

Appendices
Maneesh Kumar 394
processes S3- Effective communication system and timely information flow vertically and horizontally at all levels
S4- Standardised procedures in a documented quality management system (religiously follow the principles of ISO 9000; certification not required until asked by customer; or identified value added activities through lean implementation)
S5- Cross-functional team established as a way of working and to take decisions on system-wide problems
Customer Focus
C1- Organization regularly seeks customer feedback to understand the key causes of concern, main complaints, and expected performance from customers
C2- Customer focus and satisfaction given priority over internal policies
C3- Understanding of value-added and non-value added activities from customer perspective
Appendices
Maneesh Kumar 395
APPENDIX V

Appendices
Maneesh Kumar 396
List of Publications during the tenure of Doctoral Research
Journal Papers
� Kumar, M., and Antony, J., Tiwari, M.K., Six Sigma Implementation Framework for SMEs – A roadmap to manage and sustain the change, International Journal of Production Research (Accepted for publication in 2010)
� Kumar, M., and Antony, J., The Impact of Six Sigma Implementation in UK Manufacturing SME: Findings from a Pilot Case Study, International Journal of Quality and Reliability Management (Accepted for publication in 2010)
� Kumar, M., and Antony, J., (2009), Investigating the quality management practices in Six Sigma against Non-Six Sigma UK Manufacturing SMEs: Key findings from multiple case studies, Journal of Engineering Manufacture, IMECH E Part B , Vol.223, No.7, pp. 925-934.
� Kumar, M., Antony, J., Douglas, A., (2009), Does Size matter for Six Sigma implementation?-Findings from the survey in UK SMEs, The TQM Journal, Vol.21, No.6, pp.623-635
� Kumar, M., Antony, J., (2008), Comparing the Quality Management Practices in UK SMEs, Industrial Management and Data System, Vol. 108, No.9, pp.1153-1166
� Kumar, M., Antony, J., Madu, C., Montgomery, D.C., Park, S.H., (2008), Common myths of Six Sigma demystified, International Journal of Quality and Reliability Management. Vol.25, No.8, pp.878-895.
� Antony, J., Kumar, M., Labib, A., (2008), Gearing Six Sigma into UK Manufacturing SMEs: An Empirical assessment of Critical Success factors, Impediments, and viewpoints of Six Sigma implementation in SMEs, Journal of Operations Research Society. Vol.59, No.4, pp.482-493
� Kumar, M., (2007), Success Factors and Hurdles to Six Sigma Implementation: the case of a UK manufacturing SME, International Journal of Six Sigma and Competitive Advantage , Vol.3, No.4, pp. 333-351
� Antony, J., Kumar, M. and Madu, C.N., (2005), Six Sigma in Small and Medium Sized UK Manufacturing Enterprises: Some Empirical Observations, International Journal of Quality and Reliability Management, Vol.22, No.8, pp.860-874.
Conference Papers
� Kumar, M., Antony, J., (2010), Six Sigma Readiness Index for SMEs, 7th-10th May 2010, 21st Annual Production and Operations Management Conference, Vancouver, Canada
� Kumar, M., Antony, J., (2010), Feasibility study of Six Sigma in UK SMEs: Multiple-Case Study Analysis, 17th International Annual EurOMA Conference, 6th-9th June, Porto, Portugal
� Kumar, M., Antony, J., (2009), Longitudinal study on Six Sigma status in UK SMEs, 18th -20th May 2009, World Conference on Quality Improvement, Minneapolis, USA [ 2nd Best Student paper Award]
� Kumar, M., Antony, J., (2008), Comparing the quality management practices between Six Sigma and ISO certified SMEs- a survey based approach, 25th -27th June 2008,
Appendices
Maneesh Kumar 397
13th International Conference on Productivity and Quality Research, Oulu, Finland [Best Student paper Award]
� Kumar, M., Antony, J., (2008), Six Sigma myth demystified - Multiple case study analysis of Six Sigma application in UK SMEs, 9-11 September 2008, British Academy of Management Conference, Harrogate, United Kingdom.
� Antony, J., Kumar, M., (2008), Six Sigma implementation in UK manufacturing SMEs: A multiple case- study analysis and key findings, 4th- 6th June 2008, Quality and Productivity Research Conference, Madison, Wisconsin, USA.
� Kumar, M., Upadhyay, S., Ogbu, C., Antony, J., (2008), An investigation of Six Sigma implementation within UK manufacturing SMEs: Findings from the survey, 10th March, 2008, First European Research Conference on Continuous Improvement and Lean Six Sigma, University of Strathclyde, Glasgow.
� Kumar, M., (2008), Assessing the readiness of Six Sigma implementation in UK Small and Medium-Sized Enterprises (SMEs), 15th January 2008, Research Presentation day, Faculty of Engineering, University of Strathclyde.
� Kumar, M., Antony, J., Hari, S., Wang, C., (2006), Evaluating the relationship between Six Sigma and Organizational Performance: A case study from a UK SME, British Academy of Management Conference, 12th- 15th September, Belfast, UK.
� Antony, J., and Kumar, M., (2006), Six Sigma in UK Manufacturing SME-A Case Study, ENBIS 6,18th – 20th September 2006, Wroclaw, Poland.
� Antony, J., Kumar, M., and Deas, A., (2005), Assessing the Status of Six Sigma Implementation in UK Manufacturing SMEs, 3rd European Conference on Intelligent Management Systems in Operations, 28-29th June 2005, Salford, United Kingdom.
� Kumar, M., Antony, J., Hari, S., Perry, D., (2005), The Relationship between Critical Success Factors of Six Sigma and Organisational Performance, International Conference on Quality and Productivity Research, 12th-15th December 2005, IIT Delhi, India.
Workshop/ Seminar delivered
� Workshop on “Six Sigma for the Little Guy”, Third International Conference on Six Sigma, 15th- 16th December 2008, Edinburgh (3hours)
� Introductory Workshop on “The Status of Six Sigma within UK manufacturing SMEs”, Second International Conference on Six Sigma, 6th – 8th June 2006, Glasgow (3 hours)
� One Day Workshop on “Six Sigma for the Little Guy”, Partick Burgh Hall, Glasgow, 1st November 2006
� Invited as the panel member on a research seminar organized by University of Strathclyde on ‘Six Sigma for the Little Guy’ on 25th November, 2009