Singapore's Zero-Energy Building's daylight monitoring system
14
Singapore’s Zero-Energy Building's daylight monitoring system Lars O. Grobe a)* , Stephen Wittkopf a) , Anupama Rana Pandey a) and Yang Xiaoming a) Ang Kian Seng b Jean-Louis Scartezzini c) Stephen Selkowitz d) a) Solar Energy Research Institute of Singapore (SERIS), 7 Engineering Drive 1, Block E3A, #06-01, Singapore 117574, [email protected] a)* , +6565151507 phone +6567751943 fax b) Building and Construction Authority (BCA), 5 Maxwell Rd., #16-00 Tower Block MND Complex, Singapore 069110 c) Solar Energy and Building Physics Laboratory (LESO), Swiss Federal Institute of Technology Lausanne (EPFL), Batiment LE, Station 18, CH-1015 Lausanne, Switzerland d) Environmental Energy Technology Division, Lawrence Berkeley National Laboratory, 1 Cyclotron Road, Berkeley, 94720 California, USA 1. Abstract A setup to monitor the daylighting performance of different glazing types in Singapore is presented. The glazing is installed in the facade of four dedicated testing chambers in BCAA's Zero Energy Building in Singapore. These test rooms are equipped with sensors that both record illuminances on the work plane, and luminances as seen by occupants. The physical and logical design of the monitoring system is presented. Criteria to assess the daylighting performance are introduced, and initial results of the work in progress are presented. Keywords: daylighting, building monitoring system, glazing performance 2. Introduction The Zero Energy Building (ZEB) aims at demonstrating the application of various green building features, from Building-Integrated Photovoltaics (BIPV) [1] to daylighting, solar cooling and green facade technologies. It allows test-bedding under realistic tropical conditions. Visitors can learn about the performance and benefits of different glazing types in the visitor centre attached to the ZEB [2] . They can experience them by visiting the installations or accessing the building monitoring system (BMS). The BMS can be accessed using either the displays on site or by visiting the dedicated web-site. The visitors will also complement the measured data by providing subjective feed-back through surveys. Both, the feed-back from the user-experience and the monitoring data will provide new insight into visual comfort and the performance of glazing under the specific climate conditions of the tropics in Singapore. The four testing chambers are located on the ground floor of the ZEB facing west. They make up one third of the ground floor's west facade. Each chamber provides a floor area of about 13m2 and is to approximate a standard office. The chambers are not air-conditioned and are separated by moveable walls. This enables visitors to directly compare all four glazing configurations side by side when open, but isolates the chambers from each other during measurements. The chambers' facade is almost completely glazed, with a 50cm high parapet. The glazing is implemented as a mullion/transom facade with inserted frames. The frames allow to reconfigure the facade using identical modules, and thus to modify the layout during the study.
Transcript of Singapore's Zero-Energy Building's daylight monitoring system

Singapore’s Zero-Energy Building's daylight monitoring system
Lars O. Grobea)*
, Stephen Wittkopfa)
, Anupama Rana Pandeya)
and Yang Xiaominga)
Ang Kian Sengb
Jean-Louis Scartezzinic)
Stephen Selkowitzd)
a) Solar Energy Research Institute of Singapore (SERIS), 7 Engineering Drive 1, Block E3A,
#06-01, Singapore 117574, [email protected] a)*
, +6565151507 phone +6567751943 fax
b) Building and Construction Authority (BCA), 5 Maxwell Rd., #16-00 Tower Block MND
Complex, Singapore 069110
c) Solar Energy and Building Physics Laboratory (LESO), Swiss Federal Institute of
Technology Lausanne (EPFL), Batiment LE, Station 18, CH-1015 Lausanne, Switzerland
d) Environmental Energy Technology Division, Lawrence Berkeley National Laboratory,
1 Cyclotron Road, Berkeley, 94720 California, USA
1. Abstract
A setup to monitor the daylighting performance of different glazing types in Singapore is
presented. The glazing is installed in the facade of four dedicated testing chambers in BCAA's
Zero Energy Building in Singapore. These test rooms are equipped with sensors that both
record illuminances on the work plane, and luminances as seen by occupants. The physical
and logical design of the monitoring system is presented. Criteria to assess the daylighting
performance are introduced, and initial results of the work in progress are presented.
Keywords: daylighting, building monitoring system, glazing performance
2. Introduction
The Zero Energy Building (ZEB) aims at demonstrating the application of various green
building features, from Building-Integrated Photovoltaics (BIPV)[1]
to daylighting, solar
cooling and green facade technologies. It allows test-bedding under realistic tropical
conditions. Visitors can learn about the performance and benefits of different glazing types in
the visitor centre attached to the ZEB[2]
. They can experience them by visiting the installations
or accessing the building monitoring system (BMS). The BMS can be accessed using either
the displays on site or by visiting the dedicated web-site.
The visitors will also complement the measured data by providing subjective feed-back
through surveys. Both, the feed-back from the user-experience and the monitoring data will
provide new insight into visual comfort and the performance of glazing under the specific
climate conditions of the tropics in Singapore.
The four testing chambers are located on the ground floor of the ZEB facing west. They make
up one third of the ground floor's west facade. Each chamber provides a floor area of about
13m2 and is to approximate a standard office. The chambers are not air-conditioned and are
separated by moveable walls. This enables visitors to directly compare all four glazing
configurations side by side when open, but isolates the chambers from each other during
measurements. The chambers' facade is almost completely glazed, with a 50cm high parapet.
The glazing is implemented as a mullion/transom facade with inserted frames. The frames
allow to reconfigure the facade using identical modules, and thus to modify the layout during
the study.

Figure 1: Facade as seen from inside with partition walls opened. From left to right: glazing
integrated blinds, electrochromatic glazing, aSi photovoltaic glazing, and clear glass.
Figure 2: Layout of testing chambers with horizontal (H) and vertical (V) illuminance sensor
positions.
All four glazing considered in the scope of this study are configured as double-glazing hold
by frames. The total glazing thickness is identical for all four types and defined by the
requirement of the electrochromatic glazing type. While the frames are mounted to the facade
in a way that allows to swap them and thus combine the different glazing types in one
chamber's facade, for this study each testing chamber corresponds to one type of glazing. The
configurations of the testing chambers' facades for this study and their specifications are given
in table 1.

location glazing type transmission
vis. light [ % ]
reflectance
vis. light [ % ]
Shading coeff.
(max.)
u-value
[ W / (m2 K) ]
TC 1 clear glazing 70 10 0.46 1.6
TC 2 aSi photovoltaic glazing 10 15 0.12 1.2
TC 3 electrochromatic glazing, untinted 62 15 0.55 0.28
electrochromatic glazing, tinted 4 5 0.1 0.28
TC 4 glazing integrated blinds, open 68 15 0.75 1.4
glazing integrated blinds, closed 5 15 0.23 1.4
Table 1: Glazing specifications for testing chamber TC 1-4.
3. Monitoring system set-up
The monitoring system consists of two types of sensors and data acquisition systems. The first
type of sensors is integrating all incoming light over a hemisphere to derive the illuminance
on a plane. The second group of sensors performs an angular resolved measurement, resulting
in luminance maps.
3.1. Illuminance sensors
To assess the performance of facades for energy savings due to replacing electrical lighting by
daylight, illuminance data needs to be acquired to compute the necessary contribution by
electrical lighting.
As illuminance sensors allow readings only at one location each, the space needs to be
divided into zones, with increasing distances to the window[3
,4]
. Each testing chamber is
monitored by an array of eight horizontal illuminance sensors. The sensors, distributed on a
regular grid and pointing up, measure the illuminance on a horizontal plane at 0.85m height.
In each chamber, one additional illuminance sensor is pointing towards the glazing at 1.20m
height, recording the illuminance on a vertical plane at the eye level of a seated occupant.
Exterior illuminance is monitored continuously by one sensor on the roof pointing up and one
exterior sensor on the outside of the facade, pointing away from the building. This allows
deriving daylight factors by relating interior to exterior horizontal illuminances.
The illuminance sensors closely follow the spectral luminous efficiency function for photopic
vision[5]
as defined by the CIE. They are configured for a measurement range from 0 to
30,000lx, which is translated to a voltage of 0-30mV. The sensors are directly connected to a
signal transmitter, which is linked to a 12bit controller that translates the analogue into a
digital signal. This digital signal is fed into the central Building Management System and
recorded. For the given illuminance range, the set-up allows illuminance reading in 10lx
steps. The illuminance data is recorded in intervals of five minutes during 24 hours. The
exterior illuminance sensors follow this set-up but are configured for an illuminance range of
0 to 150,000lx.
The results presented here were derived from a slightly changed setup, in which only readings
from five of the horizontal illuminance sensors were recorded. Vertical illuminance was
recorded neither inside the testing chambers nor outside.

Figure 3: Layout of the illuminance monitoring system.
Figure 4: Horizontal illuminance sensors (left to right): close-up, modified sensor layout for
daylight autonomy study, sensors in testing chamber 2 (only one row considered for the study)

3.2. High Dynamic Range imaging setup
Four digital single-lens reflex (DSLR) cameras, one in each chamber, mounted on tripods at
1.4m height and equipped with fisheye-lenses, are connected to a control computer using
USB connections. The lenses, that cover more then the full hemisphere, show very little light
fall-off towards the edges[6]
.
(1)
Once every ten minutes, a series of six exposures in 2EV steps is acquired from each camera.
The exposure times are 0.1250s, 0.0333s, 0.008s, 0.002s, 0.0005s, 0.0002s. This scope from
1/8s to 1/5000s is equivalent to a range of more then 15 EV, when a range of 6 EV is
considered for the sensor. This can be translated to a contrast ratio greater then 1:30000
according to formula 1. The range can be chosen according to the application needs, as long
as the camera is capable of the settings. An open source library of tools to interface digital
cameras called gphoto2[7]
was used, and as such the system could be adapted to use any of the
many supported camera models.
After the transfer from the camera, which is based on standard USB cabling, the images are
assembled into High Dynamic Range (HDR) images[8]
on the control pc. The open software
library pfstools is used to derive camera response curves from captured image series, to
calibrate and assemble the images into HDR images which provide valid luminance
readings[9]
. The HDR images are encoded in the Radiance RGBE format[10]
, which allows a
high dynamic range at moderate storage requirements. The black frame resulting from the use
of a circular fisheye lens with a rectangular sensor is cut off the image using Radiance's image
processing tools[11]
, and then named according to time and camera.
A system consisting mainly of Perl-scripts calling the different tools of the mentioned libraries
has been developed that works independent from user interaction in both acquiring,
processing and archiving the images. An external hard-disk is used to transfer the assembled
HDR images, the synchronization starts automatically when the disk gets attached. Further
processing of the imaging data happens off-site.
As all the program logic required for acquisition and processing is on the control computer,
little requirements apply to the cameras other then the availability of suitable lenses and
support by the software tools. This allowed setting up the system using consumer-grade
DSLRs.
Figure 5: Overlapping luminance ranges of six low dynamic range exposures allow capturing
a range of more then 15 EV when assembled into one high dynamic range image.
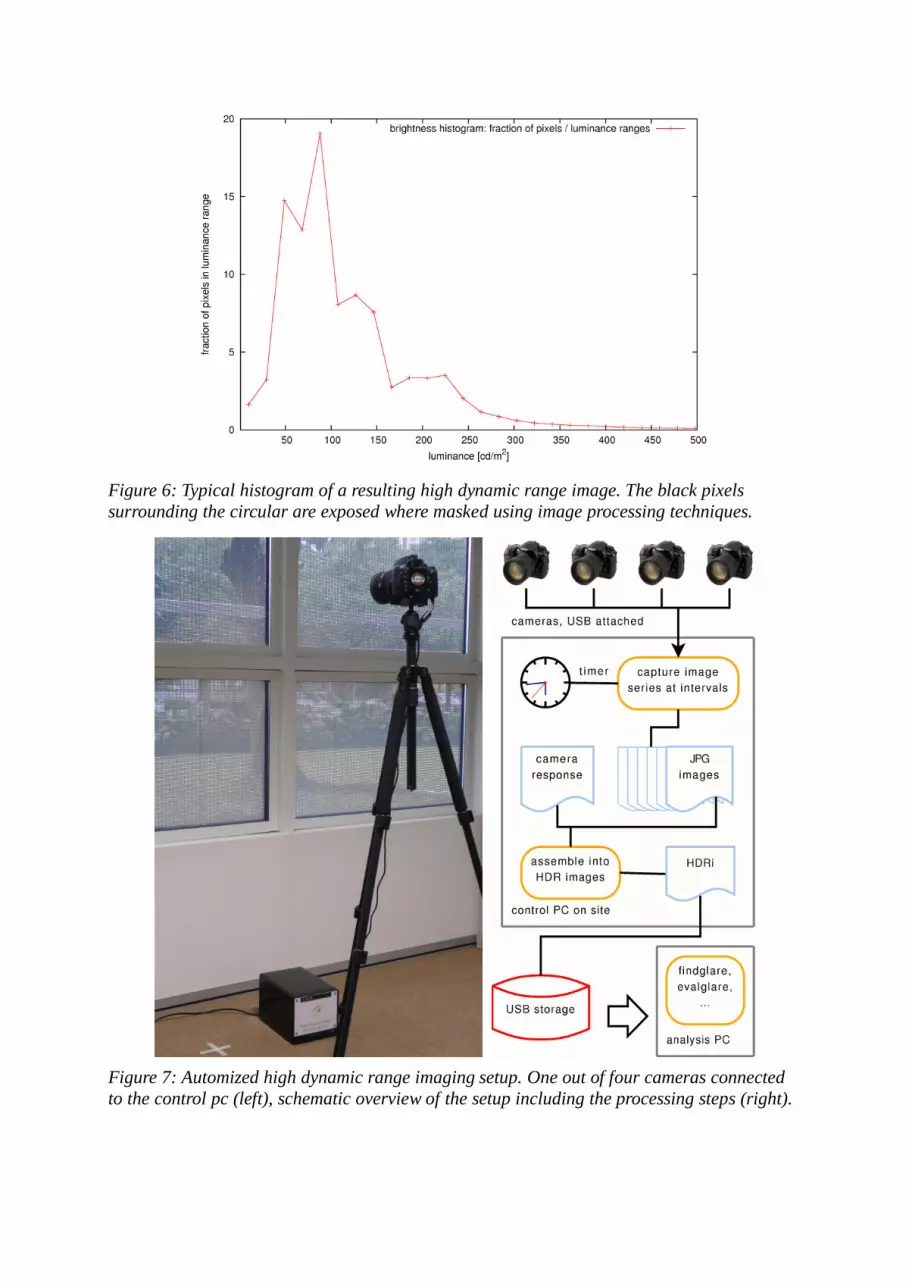
Figure 6: Typical histogram of a resulting high dynamic range image. The black pixels
surrounding the circular are exposed where masked using image processing techniques.
Figure 7: Automized high dynamic range imaging setup. One out of four cameras connected
to the control pc (left), schematic overview of the setup including the processing steps (right).

4. Criteria for assessing daylighting performance
Two aspects of daylighting performance are covered by this study. The first one quantitatively
describes the potential for energy savings, the second one is qualitative and focuses on user
acceptance and visual comfort:
1) - Daylight Factor DF
- Useful Daylight Illuminance UDI
- Daylight Autonomy DA
2) - Vertical Illuminance
- IES Daylight Glare Index DGI
- Daylight Glare Probability DGP
Established performance indicators are illuminance levels on the work plane, and derived
from that the daylight factor which does not take into account local climate conditions and
occupancy requirements. As such, they have been proven to be limited for the assessment of
daylighting designs. The possibility to consider climate data in computational simulations led
to new performance indicators. The Useful Daylight Illuminance[12]
(UGI) relates the
illuminance on the work plane to maximum and minimum thresholds. To achieve any relevant
contribution to lighting of a space, a minimum of 100lx is set, while an illuminance of more
then 2000lx is considered as affecting the occupants. This results in three metrics for the UGI,
defining exceeding (>2000lx), insufficient (<100lx) and achieved requirements (100-2000lx).
To describe the potential for energy savings in lighting, the daylight autonomy of each testing
chamber is proposed for initial studies[13]
. This requires knowledge on the required
illuminance as well as representative data on the average illuminances achieved over the
occupancy period. A daily occupancy period from 8 a.m. to 6 p.m. is typically to be
considered for offices. Building codes in Singapore require 300 lx to 500 lx for office
work[14]
. The study assumes a baseline illuminance requirement as of 300 lx accordingly at a
working plane level of 0.85m. The daylight autonomy is derived as the fraction of occupancy
time that illuminance measured by the sensors meets this requirement for the monitored time
span.
The assessment of visual comfort and glare requires assumptions on the field of view of the
occupant. Different glare indices are established, mostly based on empirical studies from
surveys, for different environments. In the scope of this study, the software tool findglare
(from the Radiance lighting simulation environment) was applied both on HDR images
captured on site and on synthetic HDR images from simulation. The performance indicator
used was the Daylight Glare Index (DGI)[15]
as defined by the IES glare formula:
(2)

The glare indices presented reflect the exposure to glare for an observer facing the facade.
The IES DGI does not consider a task area, and can thus be determined without further
assumptions on occupant's behaviour or furnishing of the office spaces. The resulting value is
compared to a look-up table, relating it to a grading system from just perceptible (<=16) to
intolerable (>28).
Recently, a new glare index referenced to as Daylight Glare Probability (DGP)[16]
had been
proposed to address the specific characteristics of glare caused by daylighting. Existing
indices had been found to lead to wrong results when assumptions typically valid for artificial
lighting did not match the conditions in daylid spaces. Other then the DGI, which relies
mostly on luminances (which tend to have a high variability for facades and thus to scatter in
the results), it includes vertical illuminance. This index is calculated according to formula 3:
(3)
The DGP directly describes the probability in per cent that a person will perceive glare. As not
only the vertical illuminance as a less variable parameter for environments with outside view
had been introduced, but also the high number of probants used to develop the index (74 for
DGP), a higher consistency of predictions for daylid environment is expected.
5. Initial results
First acquired records were analyzed according to the defined daylight performance criteria.
As daylight is subject to seasonal and random changes, projectable results require a
monitoring period of at least a year, while the data used for the analysis shown here was
acquired during short test runs of the system.
The measurement data for one day at TC 1 (clear glazing) is presented as an example of the
raw data that is stored in the BMS' database. As the illuminance monitoring system does not
work with a dynamic range, the matching of the components such as sensors, transmitters and
DDC-converters was a critical step to achieve the resolution of 10lx over the wide range from
0 to 30,000lx. The cabling from the sensors to the DDC converter proved to have significant
impact on the stability of the analog signal.
The logarithmic plot shows the readings from four sensors at TC 1 over one day, with the
stable increase in the morning and sudden illuminance changes in the afternoon, when the
sensors get directly hit by the sun. The noise at night for the three sensors located beyond 2m
from the facade is due to the fact that these receive an illuminance below 10lx, which is the
resolution of the system, resulting in random readings.

Figure 8: Logarithmic plot of four illuminance sensors' reading for one day at testing
chamber TC 1 (clear glazing, facing west).
Figure 9: Horizontal illuminances and derived daylight autonomy percentages for four testing
chambers TC1-4. In testing chamber TC 2 (photovoltaic glazing), daylight autonomy could
not be reached at any measurement interval.

Daylight autonomy during daytime was easily achieved by clear glazing and glazing with
integrated blinds, even when the blinds were closed. Under tropical climate conditions, the
chambers located at the building perimeter are exposed to intense irradiation. The aSi PV
facade does not achieve a transmittance to reach daylight autonomy at any time of the
monitored period except for the position directly behind the glazing, when very high exterior
illuminance was observed. Electrochromatic glazing could still achieve daylight autonomity
levels of 40% during daytime when switched to clear, but dropped to 0% when switched to
tinted. Besides being adaptable to the environmental conditions and still achieving sufficient
illuminance levels at any time, glazing integrated blinds showed a potential to more evenly
spread light into the room.
For each testing chamber, the results from capturing eight HDR images are presented here,
covering two hours from 2 p.m. to 4 p.m. with an interruption of fifteen minutes at 3 p.m. The
glare studies based on these HDR images resulted in acceptable glare indices except for the
case of the glazing with open integrated blinds. Compared to the clear glass facade,
significantly higher vertical illuminance was measured, and this may indicate that between the
capturing times of the two HDR images, the exterior conditions had changed. The aSi PV
facade of TC 2 leads to very low vertical illuminances and shows no potential for glare, while
the electrochromatic glazing shows its ability to effectively bring down the glare index
numbers by shading the testing chamber – however at the cost of very low illuminances. It
has to be noted that the high sun elevation during the monitoring period does not allow direct
visibility of the sun, and thus the assessment of the strongest potential source of glare is
excluded here.
Figure 10: Vertical illuminance and glare indices according to CIE Daylight Glare Index
(DGI) for a monitoring period of two hours at all testing chambers. Note that the
electrochromatic glazing (TC 3) and glazing integrated blinds (TC 4) were operated during
the monitoring, while transmissive properties for TC 1 and 2 were constant.

6. Discussion
Initial exemplary readings of the sensors were presented. As the system has just started to be
operational, valid data from several sensors is still not available and not all daylighting
performance metrics could be derived yet. E.g. without having readings from exterior sensors,
the daylight factor cannot be calculated from given interior horizontal illuminances. Besides
completeness of the readings, a sufficient monitoring time-span is required to acquire
representive data. As such, the set-up of the daylight monitoring systems are presented more
then the results.
The current monitoring system will be kept in operation for a full year to acquire enough data
for representative results. Additional performance indicators, such as alternative glare indices,
will be introduced. Current photometric monitoring will be complimented by refined
radiometric measurements using CCD-spectrometers that also capture the effects of glazing
types on colour rendition, their capability to block unwanted long-wavelength radiation and
the changes in the daylight spectrum according to season and daytime. Furthermore, advanced
daylighting systems such as horizontal light ducts, vertical light pipes and light shelves,
installed both on the in- and outside of the facade, are studied. The data acquisition from
sensors will be complimented by surveys to relate the numerical results of occupant
experience and acceptance.
7. Acknowledgment
The presented work is a part of research project funded by the “Ministry of National
Development Research Fund for the Built Environment” and Economic Development Board’s
“Clean energy Research and Test-bedding” programme.

Figure 11: Tonemapped image derived from HDR image with glare sources as found by
findglare (left), falsecolor showing the luminance distribution (right) at testing chamber TC 1
(clear glass).
Figure 12: Tonemapped image derived from HDR image with glare sources as found by
findglare (left), falsecolor showing the luminance distribution (right) at testing chamber TC 2
(aSi photovoltaic glazing).

Figure 13: Tonemapped image derived from HDR image with glare sources as found by
findglare (left), falsecolor showing the luminance distribution (right) at testing chamber TC 3
(electrochromatic glazing).
Figure 14: Tonemapped image derived from HDR image with glare sources as found by
findglare (left), falsecolor showing the luminance distribution (right) at testing chamber TC 4
(glazing integrated blinds).

[1] Wittkopf S, Seng AK, Poh P and Pandey A, BIPV Design for Singapore Zero-Energy Building, PLEA 2008 5th conference on passive and low energy architecture, Dublin, 2008.
[2] Wittkopf S, Pandey A, Grobe LO and Borsuit A, Demonstration and test bedding of four glazing types
in daylight test chambers in Singapore, Proceedings of Glass Performance Days 2009, Tampere, 2009.
[3] Atif MR, Love JA and Littlefair P, Daylighting monitoring protocols & procedures for buildings, a
report of IEA Task 21 / Annex 29, 1997.
[4] Velds M and Christoffersen J, Monitoring procedures for the assessment of daylighting performance of buildings, a report of IEA Task 21 / Annex 29, 2001.
[5] ISO 11664-1:2008(E)/CIE S 014-1/E:2006 CIE Standard Colorimetric Observers, Commission
Internationale de l'Eclairage, 2006.
[6] Jacobs A, Wittkopf S and Grobe LO, Per-pixel sky luminance with HDR photography, 7th international Radiance Workshop, 2007.
[7] Meissner M, Figuiere H, Fritzinger S, Müller S and others, gphoto2, http://www.gphoto.org.
[8] Debevec PE and Malik J, Recovering high dynamic range radiance maps from photographs,
Proceedings of SIGGRAPH 97, Computer Graphics Proceedings, Annual Conference Series, pp. 369-
378, 1997.
[9] Krawczyk G, Mantiuk R and others, pfstools, http://pfstools.sourceforge.net.
[10] Ward G, Real pixels, Graphics Gems II, Ed. by J. Arvo, Academic Press, 1992.
[11] Ward G, Shakespeare R, Rendering with Radiance, pp. 17,18, 1998.
[12] Nabil A and Mardaljevic J, Useful daylight illuminance: a new paradigm for assessing daylight in buildings, Lighting Research and Technology, V. 37, No. 1, pp. 41-57, 2005.
[13] Reinhart CF, Mardaljevic J and Rogers Z, Dynamic daylight performance metrics for sustainable
building design, Leukos V. 3, No. 1, pp. 1-25, 2006.
[14] SS 531 – 1:2006 Code of practice for lighting of work places – Indoor, Electrical and Electronic Standards Committee, 2006.
[15] The development of the IES glare index system, Transactions of the Illumination Engineering Society,
V. 27, No. 1, pp. 9-26, 1962.
[16] Wienold J and Christoffersen J, Evaluation methods and development of a new glare prediction model
for daylight environments with the use of CCD cameras, Energy and buildings, V. 38, No. 7, pp. 743-
757, 2006.