Sind Stoffe persistenter als die Testsysteme glauben lassen?
71
28/2022 TEXTE Sind Stoffe persistenter als die Testsysteme glauben lassen? – Überprüfung der Testsysteme zur Persistenzbewertung am Beispiel der Hydrolyse Influence of particles being present in aquatic environments on the hydrolytic degradation of organic substances
-
Upload
khangminh22 -
Category
Documents
-
view
5 -
download
0
Transcript of Sind Stoffe persistenter als die Testsysteme glauben lassen?

28/2022 TEXTE
Sind Stoffe persistenter als die Testsysteme glauben lassen? – Überprüfung der Testsysteme zur Persistenzbewertung am Beispiel der Hydrolyse Influence of particles being present in aquatic environments on the hydrolytic degradation of organic substances


TEXTE 28/2022
Environmental Research of the Federal Ministry for the Environment, Nature Conservation, Nuclear Safety and Consumer Protection
Project No. (FKZ) 3714 65 419 0 Report No. UBA-FB 002749
Sind Stoffe persistenter als die Testsysteme glauben lassen? – Überprüfung der Testsysteme zur Persistenzbewertung am Beispiel der Hydrolyse
Influence of particles being present in aquatic environments on the hydrolytic degradation of organic substances
by
Friedrich Wendel, Thomas Ternes Bundesanstalt für Gewässerkunde, Koblenz
On behalf of the German Environment Agency

Imprint
Publisher: Umweltbundesamt Wörlitzer Platz 1 06844 Dessau-Roßlau Tel: +49 340-2103-0 Fax: +49 340-2103-2285 [email protected] Internet: www.umweltbundesamt.de
/umweltbundesamt.de /umweltbundesamt
Study performed by: Bundesanstalt für Gewässerkunde Am Mainzer Tor 1 56068 Koblenz Study completed in: 2017 Edited by: Section IV 2.3 Chemicals Daniel Sättler Publication as pdf: http://www.umweltbundesamt.de/publikationen ISSN 1862-4804 Dessau-Roßlau, March 2022 The responsibility for the content of this publication lies with the author(s).

Hydrolysis of micropollutants
Abstract
Hydrolysis is an abiotic process that is crucial for the fate of many water-soluble substances in an aquatic environment. The ability of chemicals to undergo hydrolysis is currently tested in purified lab water in accordance with OECD guideline 111. It has been suggested that the addition of particles such as sediment or microplastic fibers may result in a change in the rate of hydrolysis or in the formation of different transformation products. This study therefore tested the hydrolysis of three environmen-tally relevant compounds with and without addition of microplastic, sediment, or humic acids. The target compounds used were the fungicide trifloxystrobin (TFX), the anti-anxiety drug oxazepam, and (Methoxycarbonylmethyl)triphenylphosphonium (MCM-TPP) bromide, an intermediate product of industrial processes. None of the interfering materials had a significant effect on the hydrolysis of TFX. No significant influence was observed for oxazepam either, although the addition of sediment or humic acids resulted in a slight (almost significant) increase of the oxazepam hydrolysis half-live. However, for MCM-TPP the addition of humic acids and sediment resulted in a small, but significant decrease of the hydrolysis rate, while the addition of microplastic fibers had no effect on the hydrolysis. It was thus shown that sediment particles and humic substances commonly occurring in aquatic envi-ronments can lead to a reduced hydrolysis rate of organic substances, probably especially for sorbing cationic compounds. However, this effect is small compared to the influences known to occur for changes of pH or temperature. The addition of interfering material (IMs) when testing the hydrolysis behavior of chemicals in OECD guideline 111 is thus not recommended. However, it is recommended to quantity in addition to the target compound also its main hydrolysis products to close the mass bal-ances.
Kurzbeschreibung
Die Hydrolyse ist ein entscheidender Prozess für den Abbau vieler wasserlöslicher Substanzen in der Umwelt. Hydrolysestudien mit neuen Substanzen werden derzeit in Reinstwasser durchgeführt. Es besteht die Möglichkeit, dass in natürlichen Gewässern vorkommende (natürliche oder künstliche) Partikel einen Einfluss auf die Hydrolyse von Spurenstoffen haben.
Um dies zu testen, wurde in dieser Studie der hydrolytische Abbau von drei Substanzen in reinem Wasser sowie in Anwesenheit von Mikroplastikfasern, Sediment und Huminsäuren untersucht. Bei den ausgewählten Substanzen handelte es sich um das Fungizid Trifloxystrobin (TFX), das Benzodia-zepin Oxazepam sowie um (Methoxycarbonylmethyl)triphenylphosphonium-(MCM-TPP-)bromid, ein Zwischenprodukt bei der Synthese von Alkenen.
Im Fall von TFX konnte kein Einfluss der Störstoffe auf die Hydrolyse nachgewiesen werden. Auch mit Oxazepam wurde kein signifikanter Einfluss beobachtet, obwohl die Anwesenheit von Sediment und Huminsäuren zu einem leichten, aber nicht signifikanten, Anstieg der Halbwertszeit führte. Im Fall von MCM-TPP führte die Zugabe von Sediment als auch von Huminsäuren zu einer geringen, aber signifi-kanten Verlangsamung des Abbaus, während Mikroplastikfasern keinen Einfluss auf die Hydrolysege-schwindigkeit hatten.
Die in natürlichen Gewässern vorkommende Sediment-Partikel und Huminstoffe können zu einer re-duzierten Hydrolyserate bestimmter Spurenstoffe führen. Dies ist vermutlich für sorbierende kationi-sche Verbindungen besonders wahrscheinlich. Dieser Effekt ist allerdings relativ klein im Vergleich zum Einfluss anderer Parameter wie der Änderung von pH-Wert und Temperatur.
Auf Grundlage dieser Ergebnisse ergibt sich nicht die Notwendigkeit, die Berücksichtigung verschie-dener Störstoffe bei der Bewertung von Chemikalien zu fordern. Allerdings wäre es sinnvoll, zusätzlich zur Konzentration der Ausgangsverbindung auch immer die Konzentration der wichtigsten Hydroly-seprodukte zu bestimmen, um geschlossene Massenbilanzen zu erhalten.

Hydrolysis of micropollutants
Table of Contents
List of Figures ................................................................................................................................................... IV
List of Tables .................................................................................................................................................... VI
List of Abbreviations ....................................................................................................................................... VII
Summary ....................................................................................................................................................... VIII
Zusammenfassung ........................................................................................................................................ XI
1 Introduction ............................................................................................................................................ 1
1.1 Abiotic hydrolysis of micropollutants in the aquatic environment .................................................. 1
1.2 Hydrolysis ......................................................................................................................................... 3
1.3 Hydrolysis testing according to OECD guidelines ............................................................................. 5
1.4 Studies employing OECD guideline 111 ........................................................................................... 6
1.5 Influence of IMs ................................................................................................................................ 6
1.6 Aim of this study ............................................................................................................................... 7
2 Preliminary considerations ..................................................................................................................... 8
2.1 Selection criteria for analytes........................................................................................................... 8
2.2 Selection criteria for interfering materials ..................................................................................... 10
3 Materials and methods ......................................................................................................................... 12
3.1 Materials ........................................................................................................................................ 12
3.1.1 Analytes ................................................................................................................................... 12
3.1.1.1 Trifloxystrobin 12
3.1.1.2 MCM-TPP 13
3.1.1.3 Oxazepam 15
3.1.2 Interfering materials ................................................................................................................ 16
3.1.2.1 Humic acids 17
3.1.2.2 Microplastic fibers 18
3.1.2.3 Sediment 19
3.2 Experimental methods ................................................................................................................... 20
3.2.1 Buffer systems ......................................................................................................................... 20
3.2.2 Lab-scale experiments ............................................................................................................. 20
3.2.2.1 Single-vessel experiments 20
3.2.2.2 Differences from the standard method 21
3.2.3 Available standards .................................................................................................................. 21
3.2.4 ASE method ............................................................................................................................. 22
3.3 Analytical methods ......................................................................................................................... 22
3.4 Determination of sediment properties .......................................................................................... 24

Hydrolysis of micropollutants
3.4.1 Particle size distribution .......................................................................................................... 24
3.4.2 Dry matter ............................................................................................................................... 24
3.4.3 TOC .......................................................................................................................................... 24
3.5 Statistical evaluation ...................................................................................................................... 24
4 Results and discussion .......................................................................................................................... 26
4.1 Main experiments .......................................................................................................................... 26
4.1.1 Trifloxystrobin .......................................................................................................................... 26
4.1.2 MCM-TPP ................................................................................................................................. 31
4.1.2.1 TPP oxide 36
4.1.3 Oxazepam ................................................................................................................................ 37
4.2 Losses by sorption .......................................................................................................................... 42
5 Conclusions ........................................................................................................................................... 45
5.1 Conclusions for future revisions of OECD guideline 111 ................................................................ 45
6 References ............................................................................................................................................ 47

Hydrolysis of micropollutants
List of Figures
Figure 1: Hydrolysis of amoxicillin ...................................................................................................... 2
Figure 2: Hydrolysis of formetanate ................................................................................................... 3
Figure 3: Chemical structure of some other strobilurins .................................................................. 12
Figure 4: Chemical structure of TFX (left) and its main hydrolysis product ..................................... 13
Figure 5: Reaction mechanism of the Wittig reaction, part I: formation of the
ylide ................................................................................................................................... 14
Figure 6: Reaction mechanism of the Wittig reaction, part II: formation of the
alkene ................................................................................................................................ 14
Figure 7: Chemical structure of MCM-TPP (left) and its main hydrolysis product ........................... 14
Figure 8: Chemical structure and hydrolysis pathway of oxazepam ................................................ 16
Figure 9: Structure of a humic acid molecule ................................................................................... 17
Figure 10: Picture of humic acid used as an IM .................................................................................. 18
Figure 11: Structure of PET ................................................................................................................. 18
Figure 12: Picture of microplastic fibers used .................................................................................... 19
Figure 13: Grain size distribution of the Ehrenbreitstein sediment ................................................... 19
Figure 14: Degradation of TFX with no IM .......................................................................................... 26
Figure 15: Degradation of TFX in the presence of microplastics ........................................................ 27
Figure 16: Degradation of TFX in the presence of sediment particles ............................................... 27
Figure 17: Degradation of TFX in the presence of humic acids .......................................................... 28
Figure 18: Direct comparison of degradation of TFX under different conditions. ............................. 29
Figure 19: Logarithmic plot of data from TFX experiments ................................................................ 30
Figure 20: Degradation of MCM-TPP with no IM ............................................................................... 32
Figure 21: Degradation of MCM-TPP in the presence of microplastics.............................................. 32
Figure 22: Degradation of MCM-TPP in the presence of sediment .................................................... 33
Figure 23: Degradation of MCM-TPP with in the presence of humic acids ........................................ 33
Figure 24: Direct comparison of degradation of MCM-TPP under different
conditions. ......................................................................................................................... 35
Figure 25: Logarithmic plot of data from MCM-TPP experiments ..................................................... 36
Figure 26: Chemical structure of TPP oxide ........................................................................................ 36
Figure 27: Suggested hydrolysis product (in the presence of glycine) and its
fragmentation pattern ....................................................................................................... 37
Figure 28: Formation of the oxazepam hydrolysis product ................................................................ 38
Figure 29: Degradation of oxazepam with no IM ............................................................................... 38
Figure 30: Degradation of oxazepam in the presence of microplastics ............................................. 39
Figure 31: Degradation of oxazepam in the presence of sediment ................................................... 39

Hydrolysis of micropollutants
Figure 32: Degradation of oxazepam in the presence of humic acids ............................................... 40
Figure 33: Direct comparison of degradation of oxazepam under different
conditions. ......................................................................................................................... 41
Figure 34: Logarithmic plot of data from oxazepam experiments ..................................................... 42

Hydrolysis of micropollutants
List of Tables
Table 1: Potential analytes that were considered for the project .................................................... 8
Table 2: Potential interfering materials considered for this project ............................................... 10
Table 3: Physicochemical values of TFX .......................................................................................... 13
Table 4: Physicochemical values of MCM-TPP ................................................................................ 15
Table 5: Physicochemical values of oxazepam ................................................................................ 16
Table 6: Surrogate standards used for quantification ..................................................................... 21
Table 7: Chromatographic settings for MCM-TPP experiments ................................................. 23
Table 8: Chromatographic settings for trifloxystrobin experiments ............................................... 23
Table 9: Chromatographic settings for oxazepam experiments ................................................. 24
Table 10: Rate constants and half-lives for TFX ................................................................................ 28
Table 11: Rate constants and half-lives for MCM-TPP ...................................................................... 34
Table 12: Rate constants and half-lives for oxazepam ...................................................................... 40
Table 13: Recovery rates (%) of MCM-TPP in the aqueous phase with different
amounts of IM ................................................................................................................... 43
Table 14: Recovery rates (%) of TFX in the aqueous phase with different
amounts of IM ................................................................................................................... 43
Table 15: Recovery rates (%) of oxazepam in the aqueous phase with different
amounts of IM ................................................................................................................... 43

Hydrolysis of micropollutants
List of Abbreviations
ASE Accelerated Solvent Extraction
a.u. Arbitrary units
CAS Chemical Abstracts Service
CB-TPP Carboxymethyl(triphenylphosphonium)
(hydrolysis product of MCM-TPP)
CNT Carbon nanotubes
DDD Defined daily dose
IM Interfering material
MCM-TPP (Methoxycarbonylmethyl)triphenylphosphonium
OECD Organisation for Economic Co-operation and Development
PBT persistent, bio-accumulating or toxic
PET Polyethylene terephthalate
REACH Registration, Evaluation, Authorisation and Restriction of Chemicals
TFX Trifloxystrobin
TFXA „Trifloxystrobin acid“, (E)-2-(methoxyimino)-2-(2-((((E)-(1-(3-(trifluoromethyl)phenyl)ethylidene)amino)oxy)methyl)phenyl)acetic acid
TOC Total Organic Carbon
TP Transformation product
TPP Triphenylphosphonium or triphenylphosphine
WWTP Wastewater treatment plant

Hydrolysis of micropollutants
VIII
Summary
Hydrolysis is an abiotic process that is crucial for the fate of many water-soluble substances in the aquatic environment. Chemicals containing several functional groups such as amides, esters, or epox-ides can be degraded by their reaction with water. The ability of new chemicals to undergo hydrolysis is currently tested in purified lab water according to OECD guideline 111.1 It has been suggested that the addition of particles such as sediment, microplastic fibers, or humic acids may result in a change in the rate of hydrolysis or in the formation of different transformation products. An increase in the reac-tion rate could be caused by catalysis of the reaction by acid groups in the particles or by stabilization of the transition state, while a decrease could be caused if the sorbed portion of a chemical is no longer hydrolyzed. This study therefore tested the hydrolysis of three environmentally relevant compounds with or with-out addition of microplastic, sediment, or humic acids. The target compounds used were the fungicide trifloxystrobin (TFX), the anti-anxiety drug oxazepam, and (Methoxycarbonylmethyl)triphenyl-phosphonium (MCM-TPP) bromide, an intermediate product in industrial processes. They were used in individual experiments with concentrations of 100 µg/L. The used microplastic consisted of poly-ethylenterephthalate (PET) fibers that were intended as filling material for pillows; the sediment was a fine sandy silt material gathered at the Ehrenbreitstein marina on the Rhine river; and the humic acids were acquired as a commercial standard. They all were applied in concentrations of 30 mg/L. The experiments were carried out in solution that had been sterilized by autoclaving. The pH was in-dividually adjusted for each analyte to enable an appreciable hydrolysis which should not be too fast to determine the degradation kinetics. Individual samples were used for every sampling point, with the last sample being taken after 45 days. All samples were analyzed using an LC-Orbitrap mass spec-trometer. In the case of TFX, no significant effect of any of the three added materials was observed. In the exper-iments, carried out at pH 7.5, the half-life of TFX was found to be 10.9 ± 1.4 d when no interfering ma-terial (IM) was added. It was slightly, but not significantly lower when microplastic fibers, humic acids, or sediment were added. Figure S1 shows a direct comparison of the degradation of TFX in the differ-ent experiments.
Figure S1 : Direct comparison of degradation of TFX under different conditions
Calculated curves based on the average of all experiments, based on non-linear regression of the untransformed data. Curves for the degradation in the presence of microplastic (red) and sediment (green) are not identical, but so similar that the green curve has to be represented by a dashed line.
Hydrolysis of micropollutants
IX
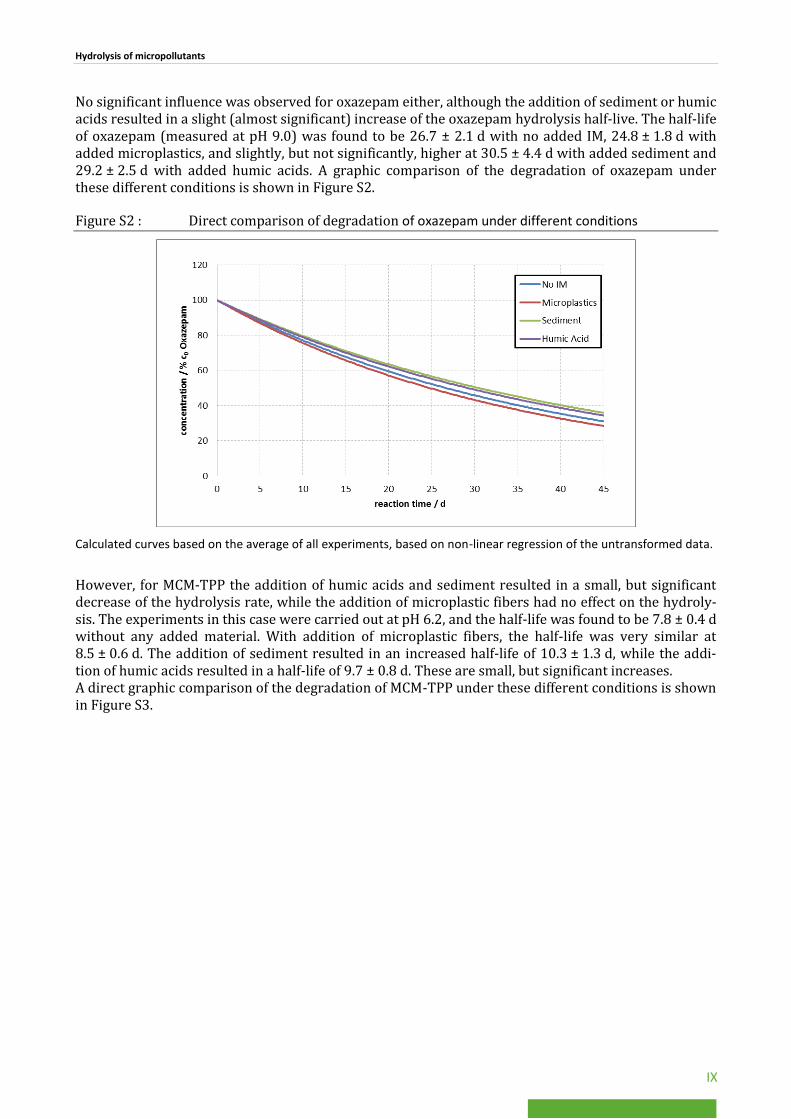
No significant influence was observed for oxazepam either, although the addition of sediment or humic acids resulted in a slight (almost significant) increase of the oxazepam hydrolysis half-live. The half-life of oxazepam (measured at pH 9.0) was found to be 26.7 ± 2.1 d with no added IM, 24.8 ± 1.8 d with added microplastics, and slightly, but not significantly, higher at 30.5 ± 4.4 d with added sediment and 29.2 ± 2.5 d with added humic acids. A graphic comparison of the degradation of oxazepam under these different conditions is shown in Figure S2.
Figure S2 : Direct comparison of degradation of oxazepam under different conditions
Calculated curves based on the average of all experiments, based on non-linear regression of the untransformed data.
However, for MCM-TPP the addition of humic acids and sediment resulted in a small, but significant decrease of the hydrolysis rate, while the addition of microplastic fibers had no effect on the hydroly-sis. The experiments in this case were carried out at pH 6.2, and the half-life was found to be 7.8 ± 0.4 d without any added material. With addition of microplastic fibers, the half-life was very similar at 8.5 ± 0.6 d. The addition of sediment resulted in an increased half-life of 10.3 ± 1.3 d, while the addi-tion of humic acids resulted in a half-life of 9.7 ± 0.8 d. These are small, but significant increases. A direct graphic comparison of the degradation of MCM-TPP under these different conditions is shown in Figure S3.

Hydrolysis of micropollutants
X
Figure S3 : Direct comparison of degradation of MCM-TPP under different conditions
Calculated curves are based on non-linear regression of the untransformed data of all experiments.
It was thus shown that sediment particles and humic substances commonly occurring in aquatic envi-ronments can lead to a reduced hydrolysis rate of organic substances, at least for sorbing cationic compounds such as MCM-TPP. However, this effect is small in comparison to the influences known to occur due to changes of pH or temperature. It should be noted that the concentration of IMs was 30 mg/L in all experiments. While this is a high concentration for microplastics in the environment, concentrations of humic acids and suspended matter can in some cases reach higher concentrations. Under the experimental conditions we used, sorption to the IMs was almost negligible compared to the dissolved fractions. As consequence, experiments with the addition of interfering material (IMs) when testing the hydrolysis in OECD 111 is not recommended. If IMs are to be included, it would probably be sufficient to include them in sorption tests (e.g. according to OECD guideline 106). If no significant sorption of a chemical occurs to any IM at environmentally relevant concentrations, it seems unlikely that the IMs will affect the hydrolysis of that chemical. However, it is recommended to quantify in addition to the target compound also its main hydrolysis products to close the mass balances enabling to differentiate between sorption and hydrolysis leading to the dissipation of the target compound concentrations. The toxicological potential of the hydrolysis products could then be modelled or assessed experimentally. Overall, a revision of OECD guideline 111 to include the effect of interfering particles seems to be unnecessary based on our results and a litera-ture review.

Hydrolysis of micropollutants
XI
Zusammenfassung
Die Hydrolyse ist ein entscheidender Prozess für den Abbau vieler wasserlöslicher Substanzen in der Umwelt. Chemikalien mit häufig vorkommenden funktionellen Gruppen wie Ester, Amide oder Epoxi-de können durch eine Reaktion mit Wasser abgebaut werden.
Hydrolysestudien mit neuen Substanzen werden derzeit nach OECD-Richtlinie 111 in Reinstwasser durchgeführt.1 Es besteht die Möglichkeit, dass in natürlichen Gewässern vorkommende (natürliche oder künstliche) Partikel einen Einfluss auf die Hydrolyse von Spurenstoffen haben. Dabei ist sowohl eine Erhöhung der Abbaugeschwindigkeit möglich, wenn zum Beispiel Säuregruppen in einem Stör-stoff wie Huminsäure einen Abbau katalysieren, als auch eine Verringerung der Abbaugeschwindig-keit, wenn sorbierte Chemikalien nicht für einen hydrolytischen Abbau zur Verfügung stehen.
Um dies zu testen, wurde in dieser Studie der hydrolytische Abbau von drei Substanzen in reinem Wasser sowie in Anwesenheit von Mikroplastikfasern, Sediment und Huminsäuren untersucht. Bei den ausgewählten Substanzen handelte es sich um das Fungizid Trifloxystrobin (TFX), das Benzodia-zepin Oxazepam sowie um (Methoxycarbonylmethyl)triphenylphosphonium-(MCM-TPP-)bromid, ein Zwischenprodukt industrieller Prozesse. Diese Substanzen wurden in Konzentrationen von 100 µg/L eingesetzt.
Die Mikroplastikfasern wurden von PET-Kügelchen entfernt, die als Füllmaterial für Kissen oder Stoff-tiere gedacht waren; bei dem eingesetzten Sediment handelte es sich um einen sandigen Schluff aus dem Koblenzer Rheinhafen Ehrenbreitstein; die Huminsäure stand als kommerzieller Standard zur Verfügung. Alle Störstoffe wurden in Konzentrationen von 30 mg/L eingesetzt.
Die Versuche wurden in autoklavierten Lösungen bei Raumtemperatur durchgeführt und liefen über 45 Tage. Der pH-Wert wurde dabei für jeden Analyten so gewählt, dass ein signifikanter, aber nicht zu schneller Abbau erwartet werden konnte. In regelmäßigen Abständen wurden aus individuellen Reak-tionsgefäßen Proben entnommen und mittels Orbitrap-MS analysiert. Im Fall von TFX konnte kein Einfluss der Störstoffe auf die Hydrolyse nachgewiesen werden. Die Ver-suche wurden hierbei bei einem pH-Wert von 7.5 durchgeführt. Die errechnete Halbwertszeit lag in dem Versuch ohne zugesetzten Störstoff bei 10.9 ± 1.4 d. In den Versuchen mit Störstoff war sie insig-nifikant kleiner. Abbildung S1 zeigt einen direkten Vergleich des Abbaus von TFX unter den verschie-denen Bedingungen.
Abbildung S1: Direkter Vergleich des TFX-Abbaus unter verschiedenen Bedingungen
Berechnete Abbaukurven, aus den Ergebnissen aller Experimente mittels direkter nichtlinearer Regression der Daten errechnet. Die Abbaukurven für die Versuche mit Mikroplastik (rot) und mit Sediment (grün) sind nicht identisch, aber so nahe bei einander, dass die Sediment-Abbaukurve gestrichelt dargestellt werden muss.

Hydrolysis of micropollutants
XII
Auch mit Oxazepam wurde kein signifikanter Einfluss beobachtet, obwohl die Anwesenheit von Sedi-ment und Huminsäuren zu einem leichten, aber nicht signifikanten, Anstieg der Halbwertszeit führte. Tatsächlich konnte der Unterschied im Fall von Huminsäure als klein, aber signifikant angesehen wer-den, wenn die Daten mittels Auftragung des Logarithmus der Konzentration gegen die Zeit ausgewer-tet wurden, was eine immer noch häufig verwendete Vorgehensweise darstellt. Wurden die kineti-schen Parameter stattdessen mittels nichtlinearer Regression der nicht-transformierten Daten ermit-telt, so ergab sich eine Halbwertszeit (bei pH 9.0) von 26.7 ± 2.1 d ohne Störstoff und von 24.8 ± 1.8 d bei Zusatz von Mikroplastikfasern. Die Werte aus den Versuchen mit Sediment (30.5 ± 4.4 d) und Huminsäure (29.2 ± 2.5 d) waren leicht, aber nicht signifikant erhöht.
Eine graphische Zusammenfassung der Abbaukurven von Oxazepam unter allen verschiedenen Reak-tionsbedingungen findet sich in Abbildung S2.
Abbildung S2: Direkter Vergleich des Oxazepam-Abbaus unter verschiedenen Bedingungen
Berechnete Abbaukurven, aus den Ergebnissen aller Experimente mittels direkter nichtlinearer Regression der Daten errechnet.
Im Fall von MCM-TPP führte sowohl die Zugabe von Sediment als auch von Huminsäuren zu einer ge-ringen, aber signifikanten Verlangsamung des Abbaus, während Mikroplastikfasern keinen Einfluss auf die Hydrolysegeschwindigkeit hatten. In den Versuchen, die bei einem pH-Wert von 6.2 durchge-führt wurden, wurde für MCM-TPP eine Halbwertszeit von 7.8 ± 0.4 d ohne Zusatz von Störstoffen und von 8.5 ± 0.6 d bei Zusatz von Mikroplastik ermittelt. Die Zugabe von Sediment führte dagegen zu ei-ner Erhöhung der Halbwertszeit auf 10.3 ± 1.3 d, die Zugabe von Huminsäure zu einer Halbwertszeit von 9.7 ± 0.8 d. Dies ist in beiden Fällen eine geringe, aber signifikante Zunahme.
Ein direkter graphischer Vergleich des Abbaus unter diesen verschiedenen Bedingungen findet sich in Abbildung S3.

Hydrolysis of micropollutants
XIII
Abbildung S3: Direkter Vergleich des Abbaus von MCM-TPP unter verschiedenen Bedingungen
Berechnete Abbaukurven, aus den Ergebnissen aller Experimente mittels direkter nichtlinearer Regression der Daten errechnet.
Die in natürlichen Gewässern vorkommende Sediment-Partikel und Huminstoffe können also zu einer reduzierten Hydrolyserate bestimmter Spurenstoffe führen. Dies ist vermutlich für sorbierende katio-nische Verbindungen besonders wahrscheinlich. Dieser Effekt ist allerdings relativ klein im Vergleich zum Einfluss anderer Parameter wie der Änderung von pH-Wert und Temperatur. Die eingesetzten Störstoffkonzentrationen von 30 mg/L lagen für Mikroplastik weit oberhalb der normalerweise zu erwartenden Umweltkonzentration, während für Huminsäure und insbesondere für Sediment auch wesentlich höhere Werte vorkommen. Unter den von uns gewählten Versuchsbedin-gungen spielte die Sorption an die Oberfläche der Störstoffe nur eine geringe Rolle. Auf Grundlage dieser Ergebnisse ergibt sich augenscheinlich nicht die Notwendigkeit, allgemein die Berücksichtigung verschiedener Störstoffe bei der Untersuchung von Chemikalien nach OECD-Richtlinie 111 zu fordern. Um den Einfluss von Störstoffen zu berücksichtigen, könnte ein Sorptions-tests (z.B. nach OECD-Richtlinie 106) vorgeschaltet werden. Sollte bei umweltrelevanten Störstoffkon-zentrationen keine signifikante Sorption der Substanz auftreten, erscheint es unwahrscheinlich, dass der Störstoff die Hydrolyse der Chemikalie beeinflusst.
Andere Änderungen der Vorgehensweise scheinen sinnvoller, beispielsweise eine stärkere Berück-sichtigung der Frage, ob beim hydrolytischen Abbau tatsächliche eine Verringerung des Gefahrenpo-tentials erfolgt, das von einer neuen Chemikalie ausgeht. D.h. der Bildung der stabilen Hydrolysepro-dukte sollte mehr Beachtung geschenkt werden. Zum einen kann hierdurch die Massenbilanz ge-schlossen werden, also nachweislich Abbau und Sorption unterschieden werden, und zum anderen kann das toxikologische Potenzial der Hydrolyseprodukte modelliert oder sogar experimentell ermit-telt werden.
Eine grundlegende Überarbeitung von OECD-Richtlinie 111 scheint auf Grundlage unserer Ergebnisse und der verfügbaren Literatur nicht notwendig zu sein.

Hydrolysis of micropollutants
1
1 Introduction
Anthropogenic contaminants are constantly being emitted into the aquatic environment via different
pathways such as effluents of wastewater treatment plants (WWTPs) or discharges by several diffuse
pollution sites such as run-offs from agricultural lands or urban areas.2-8
The fate of emerging contaminants in WWTPs as well as in the aquatic environment is of high rele-
vance for the toxicity of emerging contaminants on aquatic organisms. In addition to a microbial deg-
radation under aerobic and anaerobic conditions,5, 9-11 abiotic processes also have to be considered.
Abiotic processes are direct and indirect photolysis and redox reactions as well as hydrolysis.12-14 In all
cases the abiotic reactions lead to the degradation of the emerging pollutant; any possible toxicity of
the pollutant may thus disappear or be reduced. Hydrolysis therefore has to be classified an important
process for the assessment of the persistence of water-soluble substances in the aquatic
environment,15 and the ability of substances to undergo hydrolysis is tested during the registration of
new chemicals in REACH.16
Of special concern are substances that are persistent, bioaccumulative and toxic (PBT substances).
PBT substances are especially problematic due to their potential long term adverse effects on human
health or ecosystems. Furthermore, long-term effects are difficult to predict, and any substance that is
hydrolyzed reduces the likelihood of long-term effects which are caused in the environment by the
respective substance. The ability of chemicals to undergo hydrolysis is currently tested according to
OECD guideline 111 („Hydrolysis as a function of pH“) in purified lab water without the addition of
particles.1
It can be hypothesized that testing under these idealized lab-conditions (purified water without parti-
cles) might underestimate the environmental stability of certain emerging contaminants. If a sub-
stance is partially sorbed onto suspended matter/sediments or microplastic, hydrolysis might be
slowed down and cease to be an effective degradation pathway.17 On the other hand, the hydrolysis of
emerging contaminants might be even catalyzed by the presence of particles.18, 19
1.1 Abiotic hydrolysis of micropollutants in the aquatic environment
Hydrolysis is an abiotic degradation process involving the attack of water on a molecule. Several func-tional groups in a molecule can potentially undergo hydrolysis. Among these functional groups are:
► halogenated aliphatic hydrocarbons
► epoxides
► anhydrides
► organophosphates
► amides
► carbamates
► esters
These functional groups are present in a multitude of anthropogenic contaminants such as biocides, pharmaceuticals, personal care products, cleaning agents or industrial chemicals. Detailed studies for the fate of such substances and their hydrolytic degradation in the aquatic environment exist only for few compounds. Furthermore, the majority of compounds for which such studies exist are pesticides or herbicides. Examples include sulfosulfuron.20, 21 clomazon,22 terbufos23, and isoxaflutol.24-26 Cham-berlain et al. (2011)27 tested the hydrolytic stability of a total of 62 pesticides at three different pH values (pH 2, 7, and 12). They found that only 7 of the 62 compounds (11%) were degraded by at least

Hydrolysis of micropollutants
2
half their initial concentration after 7 days at neutral pH. At acidic pH, 10 pesticides were degraded by at least that amount, while almost half of all tested pesticides (28 of 62, 45%) were degraded by at least 50% in the same time at pH 12. In contrast to this, Bialk-Bielinska et al. (2012)28 analyzed the hydrolysis of sulfonamides and found that 10 out of 12 tested compounds were hydrolyzed (by at least 10% within 7 days) at pH 4, while only 3 of them were hydrolyzed at neutral pH, and none at all were hydrolyzed significantly at a pH of 9.
There have been several reports on the hydrolysis of different emerging pollutants recently. Below, some of these studies are discussed to emphasize the range of hydrolysis reactions and the relevance of the formed hydrolysis products.
Hirte et al. (2016)29 described the hydrolysis of amoxicillin (AMX), a beta-lactam antibiotic. The au-
thors confirmed that not only the hydrolysis rate, but also the pattern of transformation products
(TPs) was strongly pH-depended. The first three TPs (AMX penicilloic acid, AMX 2´,5´-
diketopiperazine, AMX penilloic acid) were formed by cleavage of the beta lactam ring. By a subse-
quent decarboxylation, they were transformed even further into 23 TPs. (See Figure 1.) Thus, a multi-
tude of subsequent reactions follow the first attack on AMX by a water molecule. The instability of be-
ta-lactam rings are the main reason for the hydrolysis reactions. A cleavage of the lactam ring by hy-
drolysis has also been reported for Penicillin G leading to penicilloic acid, penilloic acid and iso-penillic
acid30 as well as for four cephalosporin antibiotics.31
Figure 1: Hydrolysis of amoxicillin
Source: Hirte et al.29 The TPs formed depended strongly on the pH at which the experiment was conducted.
The hydrolysis of the two amphenicols chloramphenicol and florfenicol and the two macrolide antibi-
otics spiramycin and tylosin32 was reported to be most relevant at pH<5 and pH>8 as well as at elevat-
ed temperatures (25-60°C). In those compounds, alkyl fluorides, amides and lactone (cyclic ester)
moieties are hydrolyzed. However, the authors noted that under ambient environmental conditions
(pH 7, low temperature) the investigated antibiotics are rather recalcitrant regarding hydrolysis. At
pH 8 however, spiramycin and chloramphenicol were already significantly hydrolyzed.
Su et al. (2016)33 reported the pH dependence of the hydrolysis of 16 organophophate tri-esters used
as flame retardants and plasticizers. While the tri-alkylphosphonate triesters and (chloro)trialkyl-
phosphonate triesters were not hydrolyzed at pH 7, 9 and 11, the tri-bromoarylphosphonate tri-esters
were hydrolyzed at all pH values (7, 9, 11, 13) tested. As major hydrolyze products the di-
bromoarylphosphonate diesters were identified because the released negative charge of the phos-
phate OH moiety obviously inhibited a further cleavage of another brominated aryl moiety.

Hydrolysis of micropollutants
3
Ramezani et al. (2008)34 reported that three imidazolinone herbicides are slowly hydrolyzed at pH 9, while they are completely stable at pH 3 and The half-life reported at pH 9 was 6.5 months for ima-zaquin, 9.2 months for imazethapyr, and 9.6 months for imazapyr.
Divito et al. (2007)35 elucidated the hydrolysis of the insecticide formetanate, which contains two func-tional groups: a formamidine group and a carbamate. By analyzing the TPs, the researchers were able to show that the compound is hydrolyzed at the foramidine group, while the carbamate moiety is mostly stable. This is an example for a hydrolysis reaction in which it is important to identify the TPs to understand the reaction. (See Figure 2.)
Figure 2: Hydrolysis of formetanate
According to Divito et al.35 In the bifunctional pesticide formetanate, the formamidine group is hydrolyzed under basic conditions, while the carbamate group remains stable.
1.2 Hydrolysis
Hydrolysis is an abiotic process which might lead to a degradation of emerging contaminants in the
aquatic environment. A compound undergoing hydrolysis reacts with water according to the following
reaction scheme:
Thus Hydrolysis causes the cleavage of a certain moiety. It can be catalyzed by both H+ and OH- ions
and therefore occurs at reduced rates at neutral pH, while more rapid hydrolysis is found under basic
and acidic conditions. Since hydrolysis is a reaction between two molecules (one of them being water),
it follows a second-order rate law. However, since water is present in a large surplus, its concentration
over the course of the reaction can be seen as constant. Thus the reaction can be modelled by pseudo-
first order kinetic:
k1 is the rate constant, which describes the speed at which the reaction occurs. It is typically strongly
dependent on the pH, and also changes with temperature.
The concentration of the substance undergoing hydrolysis changes according to the following equa-
tion:
𝑣 = −𝑑[𝐴]
𝑑𝑡= 𝑘 ∙ [𝐴]

Hydrolysis of micropollutants
4
Integrating this equation yields:
[𝐴]𝑡 = [𝐴]0 ∙ 𝑒−𝑘∙𝑡
[A]t: concentration of A at time t, [A]0: starting concentration of A, k: rate constant
It is common to use the logarithmic form of this equation, as shown below:
ln[𝐴]𝑡 = (−𝑘 ∙ 𝑡) + ln[𝐴]0
This is particularly useful because it means that plotting ln([A]t/[A]0) against the time results in a
straight line with the reaction constant k as its (negative) slope. This offers an easy way to visually
judge whether a reaction follows first-order kinetics, and allows determination of kinetic parameters
using linear rather than non-linear regression analysis. However, this logarithmic transformation also
means that in fitting the kinetic parameters, it is the logarithm of the errors that will be minimized
rather than the errors themselves. This is equivalent to weighing the data (1/(fitted value))² and can
thus result in distorted values for the fitted parameters.36 When tools for non-linear regression analy-
sis are available, it is preferable to determine all kinetic parameters from the untransformed data.
Under the assumptions that there is only one reaction product B and that B is stable once formed, we
can also take advantage of the fact that the sum of A and B remains constant over the course of the
reaction:
[𝐴]𝑡 + [𝐵]𝑡 = [𝐴]0
The concentration of B at any given time thus only depends on the starting concentration of A and the
reaction constant k, according to the following equation:
[𝐵]𝑡 = [𝐴]0 ∙ (1 − 𝑒−𝑘∙𝑡)
The rate constant k of this reaction is also temperature-dependent. This is expressed by the Arrhenius
equation, which links the rate of the reaction with its activation energy.
𝑘 = 𝐴𝑒−𝐸𝑎
𝑅𝑇⁄
A: pre-exponential factor, Ea: activation energy of the reaction, R: universal gas constant, T: temperature
The pre-exponential factor A in that equation is a constant for each chemical reaction that describes
how often the reactant molecules collide in the correct orientation. Together with the activation ener-
gy, this factor determines the temperature dependence of the reaction. These factors are typically de-
termined by measuring the rate of a reaction at different temperatures and plotting it on a logarithmic
scale according to the logarithmic form of the Arrhenius equation:
ln(𝑘) = ln(𝐴) +1
𝑇
−𝐸𝑎
𝑅

Hydrolysis of micropollutants
5
When ln(k) is plotted against 1/T in this manner, the result is a straight line with ln(A) as its
yintercept and a slope of –Ea/R, which allows the calculation of both the pre-exponential Arrhenius
factor A and the activation energy Ea.
1.3 Hydrolysis testing according to OECD guidelines
Chemicals are currently tested to assess their hydrolytic transformation according to OECD guideline
111, “Hydrolysis as a function of pH”.1 The principle of the test is that sterile buffer solution of differ-
ent pH values (pH 4, 7, and 9) are treated with the test substance and incubated in the dark at a con-
stant temperature. At regular intervals, buffer solutions are analyzed for the remaining amount of the
test substance and for hydrolysis products. The most important instructions from these guidelines are
described in the following paragraphs.
According to the guideline, the study should be performed in glass containers under dark and sterile
conditions. Alternative materials (such as Teflon) may be used if it is known or likely that the test sub-
stance adheres to glass.
The reaction containers must be kept at constant temperature, which requires temperature-controlled
water baths or thermostatically-controlled incubators. All glassware and solutions should be sterilized
to avoid biological degradation of the test substance.
The test substance is typically applied as an aqueous solution; or as a solution in a small amount of
water miscible solvent (such as acetonitrile) if this is necessary for adequate dissolution. If organic
solvents are used, their concentration in the reaction mixture should not exceed 1 % v/v, unless it can
be shown that this has no effect on the hydrolysis of the test substance.
To avoid precipitation issues, the employed concentration of the test substance should not exceed
0.01 M or half the saturation concentration.
The test should be performed at pH values of 4, 7, and 9. Suitable buffers for these pH values, namely
biphthalate, citrate, borate, and phosphate buffers, are suggested in the annex of the guidelines.
The most typical temperature for hydrolysis testing is 25°C, although the guidelines suggest 10-70°C
as a suitable range; the temperature only needs to be kept constant during the experiment. If the hy-
drolytic behavior of the test substance is unknown, a preliminary test at a temperature of 50°C should
be conducted – this increased temperature allows for a faster determination of whether the test sub-
stance is hydrolytically stable. A compound is thus generally regarded as stable at the tested pH if it is
degraded by less than 10% during 5 days at 50°C, which implies a half-life of more than a year at room
temperature.
The test is performed in the dark to avoid photolytic degradation of any test substance. Since dissolved
oxygen in the water could also lead to increased degradation of some test substances, measures should
be taken to avoid oxygen, e.g. by bubbling an inert gas through the solution before the start of the ex-
periment.
It is further advised to use individual reaction vessels for each sampling point, since the use of a single
bulk vessel from which samples are drawn at each sample point can lead to contamination of the test
solution and also does not allow for an analysis of data variability. Samples should be prepared at least
in duplicate for each sample point.
According to the guidelines, any hydrolysis products that represent at least 10% of the starting con-
centration of the analyte should be identified.

Hydrolysis of micropollutants
6
Regarding data handling and reporting, the guideline demands that log-transformed data of the test
substance concentrations should be presented graphically, but also states that more accurate kinetic
models should be used to determine the kinetic parameters such as half-lives.
1.4 Studies employing OECD guideline 111
Guideline 111 was adopted by the OECD in 2004.1 Since then, there have been a number of studies that
explicitly used the guideline in the determination of the hydrolysis of emerging contaminants.
Maszkowska et al. (2014)37 investigated the hydrolytic stability of beta-blockers to evaluate the envi-
ronmental risk assessment (ERA) proposed by Kuester et al. (2009)38. However, they concluded that
the beta-blockers propranolol and metoprolol are not hydrolyzed at all at pH 7 and only to a very
small extent at pH 4 or pH 9. Only nadolol exhibited a small tendency to hydrolysis which increased
from pH 4 to pH 9, but is reported to have a half-life of more than 1 year at pH 7. Bialk-Bielinska et al.
(2012)28 conducted a hydrolysis study of 12 sulfonamides used as antibiotics mainly in veterinary
medicine, with some of them also being used in human medicine. The authors confirmed that the hy-
drolysis reaction rates increased for pH 9 < pH7 < pH4 due to the protonation of the sulfonamide moi-
ety, which is negatively charged at elevated pH values. Nevertheless, under normal environmental
conditions the sulfonamides are rather stable with regard to hydrolysis. A similar conclusion was re-
ported by Rayne and Forest who modelled that the sulfonamide group of perfluorinated compounds
containing such a group should not be hydrolyzed.39, 40
Michel et al. (2014)41 reported the hydrolysis of polyether trisiloxanes using OECD 111. At pH 7 with
MilliQ water, the hydrolysis rate was extremely low or even negligible, while a rapid hydrolysis was
observed at pH 9. Furthermore, a clear increase of the hydrolysis rate constants was found with in-
creasing temperature. They even observed a small increase of about 10% of the rate constants if the
river water used was filtrated. This could be an indication that the particulate matter reduces the hy-
drolysis rate constants, although to a very minor extent.
1.5 Influence of IMs
Hydrolysis testing is typically performed in purified water. In natural waters, the presence of particles
might influence the rate of hydrolysis in various ways. For most substances, it is believed that they
hydrolyze only in the aqueous phase, but remain stable while sorbed onto sediment or other
particles.42 This would imply that the hydrolysis of trace substances is slowed down by the presence of
particles onto which the substance can be sorbed. This effect has been observed in a number of stud-
ies.17, 43
On the other hand, the presence of particles has been some cases also been found to increase the ap-
parent rate of hydrolysis of trace substances. This was for instance observed for the herbicide atra-
zine.44 To explain this effect, acid hydrolysis and stabilization of the transition state have been sug-
gested.17, 45 Surface-catalyzed hydrolysis has also been shown to occur in the presence of metal oxides
or activated carbon.18, 46, 47
Macalady and Wolfe in 1985 studied the hydrolysis of the insecticide chlorpyrifos.43 They suggested
that hydrolysis in this case can in fact also occur in the sorbed state, at least under neutral conditions.
For alkaline conditions, they did not observe hydrolysis in the sediment-sorbed phase comparable to
that in the aqueous phase.
Perdue et al. studied the influence of the presence of humic substances on the hydrolysis kinetics of
(2,4-dichlorophenoxy)acetic acid in 1982. They found that the apparent rate of hydrolysis was re-

Hydrolysis of micropollutants
7
duced in the presence of humic substances, which they explained with reversible adsorption of the
analyte to the surface of the humic substances.48
Walse et al. in 2002 reported the influence of suspended solids on the oxidation and hydrolysis of the
insecticide endosulfan and its degradation products. They observed a catalytic effect for some solids
(sea sand, TiO2, Fe2O3, FeOOH, Laponite, and SiO2), while suspended creek sediment inhibited the hy-
drolysis.46
Salvestrini (2013)19 studied the abiotic degradation of phenylurea herbicides in soil-water systems
catalyzed by low molecular weight humic acids like compounds. They concluded that the presence of
benzoic acid derivatives catalysis the hydrolysis of diuron herbicides. The influence of dissolved hu-
mic acids on the hydrolysis of γ-hexachlorocyclohexane and 1,1,2,2-tetrachloroethane was investigat-
ed by Georgi et al. (2008).17 They found that 1,1,2,2-tetrachloroethan was not affected by the addition
of 2 g humic acids at pH 10, while the hydrolysis of γ-hexachlorocyclohexane was reduced, since the
sorbed molecules are protected from the attack of OH- by the negative charge of the humic acids.
In a previous study conducted at the German Federal Environmental Agency (Umweltbundesamt), a
reduced hydrolysis of Metilox (methyl 3-(3,5-di-tert-butyl-4-hydroxyphenyl)propanoate) was ob-
served when ion-exchange resin, carbon nanotubes, or activated sludge were added as interfering ma-
terial (IM).49
1.6 Aim of this study
This project tested whether an appreciable amount of particles can influence the hydrolysis rate or
lead to the formation of different transformation products. For this, three emerging contaminants,
which were known to be hydrolyzed from literature studies, were tested under a variety of conditions
in purified water that contained particles such as sediment or microplastic.
The overall aim of the project was to study the hydrolysis of emerging contaminants in order to find
out whether current test systems underestimate their persistence.

Hydrolysis of micropollutants
8
2 Preliminary considerations
2.1 Selection criteria for analytes
At the start of the project, analytes had to be selected which can be used in the hydrolysis tests to be
performed. Crucial criteria for suitable analytes were:
1. Half-lives of hydrolysis are < 120 d and > 2 d
2. Standards are commercially available
3. Analytical methods are known or easy to develop for environmental concentrations
4. Hydrolysis products are (mostly) known and their standards are ideally commercially available
5. Target compounds should belong to different classes of chemicals (e.g. pesticides, pharmaceuti-
cals)
6. Environmental relevance (detected in surface water, potential ecotoxicity)
7. Known or likely interactions with particles
Potential analytes considered for this project are listed in Table 1.
Table 1: Potential analytes that were considered for the project
Name CAS Number Description
Trifloxystrobin 141517-21-7 Fungicide
Dithianon 3347-22-6 Fungicide
Captan 133-06-2 Fungicide
2,3,4,5-Tetrahydro-7,8-dinitro-3-(trifluoroacetyl)-1,5-methano-1H-3-benzazepine
230615-59-5 Intermediate indus-
trial compound
2-Propylheptyl-octanoate 868839-23-0 Oil found in cosmet-
ics
(Methoxycarbonylmethyl)triphenylphosphonium bromide
1779-58-4 Industrial by-product
1-Butoxy-2,3-difluorobenzene 136239-66-2 Intermediate indus-
trial compound
2-Morpholinothio-benzothiazole 102-77-2 Additive in rubber
Diazolidinyl urea 78491-02-8 Preservative found
in cosmetics
Mefenpyrdiethyl 135590-91-9 Herbicide
Isotianil 224049-04-1 Fungicide
Amoxicillin 26787-78-0 Antibiotic drug
Oxazepam 604-75-1 Anti-anxiety drug

Hydrolysis of micropollutants
9
Of these compounds, several had to be discarded after preliminary tests. Dithianon, 2Propylheptyl-
octanoate, captan, 2,3,4,5-Tetrahydro-7,8-dinitro-3-(trifluoroacetyl)-1,5-methano-1H-3-benzazepine,
1-Butoxy-2,3-difluorobenzene, and Isotianil all proved to be difficult to detect at concentrations of
100 µg/L. 2Morpholinothio-benzothiazole was found to hydrolyze too fast, with complete degrada-
tion after less than 24 h at 25°C. The half-life of the potential analytes needs to be short enough to
guarantee that a significant degradation occurs over the course of the experiment, but long enough so
that several samples can be taken before the analyte is completely degraded.
We also preferred using analytes that are representatives of different classes of compounds, e.g. a
pharmaceutical, a pesticide, an intermediate and a final industrial compound, or a food additive. Regu-
lations for the evaluation and registration of these different classes of compounds differ widely. The
potential analytes that best met the criteria were trifloxystrobin, MCM-TPP, and oxazepam, although it
should be noted that not all criteria could be met for all of these analytes. Trifloxystrobin is known to
undergo hydrolysis with a half-life of approximately 36 d. The compound and its main hydrolysis
product are available as commercial standards. Analytical methods for its detection and quantification
are known, and as a commonly used fungicide, its fate and degradation in the environment is highly
relevant. With a log Kow of 4.5, it can also be expected that the compound interacts with IM surfaces.
MCM-TPP is positively charged, so an interaction with the typically negatively charged surfaces of sed-
iments50, 51 as well as with negatively charged functional groups of humic acids are likely. Hydrolysis of
the easily accessible ester group also seems likely. An analytical method (described in section 3.3)
could easily be established. Since the compound is just an industrial by-product that is not sold at large
quantities, isotope-labelled standards were not available, although we were able to also obtain the
main hydrolysis product. Its environmental relevance is unknown, but it can be seen as a representa-
tive of cationic compounds in general.
Oxazepam as a pharmaceutical belongs to a completely different class of chemicals than the other two
analytes. It can easily be commercially obtained together with an isotope-labelled standard, and ana-
lytical methods are already established. Oxazepam is known to undergo hydrolysis,52 and it also
known to interact with sediment particles.53
The selected analytes are discussed in more detail in section 3.1.1.

Hydrolysis of micropollutants
10
2.2 Selection criteria for interfering materials
There is a wide variety of potentially interfering compounds that could be found in the aquatic envi-
ronment, of which only a small number could be employed in this study. The criteria for selecting IMs
were as follows:
► Environmental relevance
► (Commercial) Availability
► Interactions with analytes is known or likely
► Defined and reproducible properties
► Ease of experimental handling
► Particles are stable for the duration of the experiment (45 d)
Potential IMs that were considered for this project are listed in Table 2.
Table 2: Potential interfering materials considered for this project
IM Description/comment
(Sterilized) activated sludge Structural change during sterilization likely
Sediment Many different sediments available; structural change
during sterilization possible
Humic acids Partly dissolved in water54, 55
Microplastic fibers Different materials possible, e.g. polystyrol, fleece,
etc.
Carbon
(nanoparticles, activated carbon)
Nanotubes containing heavy metals are unsuitable
because of their catalytic effects56, 57
Natural particles
(such as dried leaves, wood fibers)
Highly diverse material58
Plankton Highly diverse material, difficult to reproduce; struc-
tural changes during sterilization likely59-61
Lignin Might de-polymerize at high pH62-64
Activated sludge was excluded because its main expected effect on organic compounds in the envi-
ronment would be expected to be the biological degradation caused by the microorganisms it contains.
Sediments occur in all natural waters and are thus highly relevant, although there are many different
types of sediments. We chose a sediment that was easily available and has been used in several studies
already.65, 66 Humic acids also occur ubiquitously in the aquatic environment. Their abundance of func-
tional groups makes interactions with organic compounds very likely. Commercial standards of humic
acids are available.
Some other natural compounds (such as plankton) are too variable to make good standard materials.

Hydrolysis of micropollutants
11
Microplastics are released into the environment by human activities. Their fate and behavior in the
environment is a topic of high scientific and ecological relevance. Many different kinds of plastics exist,
so we chose to work with one that is easily commercially available and has a high likelihood of occur-
ring in the aquatic environment.
The analytes that were ultimately chosen (microplastic fibers, sediment, and humic acids) are dis-
cussed in more detail in section 3.1.2.

Hydrolysis of micropollutants
12
3 Materials and methods
3.1 Materials
3.1.1 Analytes
The hydrolysis of three environmentally relevant compounds was investigated in this project: a) the
fungicide trifloxystrobin; b) an intermediate for the synthesis of olefins, (Methoxycarbonylme-
thyl)triphenylphosphonium bromide; and c) the anti-anxiety drug oxazepam. The three compounds
are introduced in more detail in the following sections.
3.1.1.1 Trifloxystrobin
Trifloxystrobin (TFX) is a fungicide from the strobilurin class used in agriculture.
Strobilurins are a class of synthetic fungicides which act similar to the naturally occurring stro-
bilurin A, which is produced by fungi.67 It was first extracted from the small mushroom Strobilurus
tenacellus, which was known for its ability to defend itself against other fungi.68, 69
The toxophore (the chemical group which causes the toxic effect) in all strobilurins is the
βmethoxyacrylate moiety, which is shown in blue in Figure 3. This group binds tightly to the mito-
chondrial coenzyme Q0, thus interrupting the respiratory chain of the fungus and inhibiting its
growth.70, 71 Strobilurins therefore belong to the larger group of quinone outside inhibitors, or QoI fun-
gicides.72 Strobilurin-producing fungi are immune to their own toxins.
Figure 3: Chemical structure of some other strobilurins
The β-methoxyacrylate group, which produces the toxic effect in strobilurins, is highlighted in blue.
Because of its broad spectrum of effects for fungal diseases, TFX has been widely used in various crops,
for instance in cereals, citrus fruit and rice cultivation.73-75 In the European Union, the use of tri-
floxystrobin was first approved in 2003,76 and the approval period was most recently extended by the
Commission Implementing Regulation 2016/950 until July 31th, 2017.77
Since the common toxophore of the strobilurins contains an ester group, they all are susceptible to
hydrolysis. The degradation of trifloxystrobin by hydrolysis and photolysis was described by Liu et al.
in 2014.78

Hydrolysis of micropollutants
13
The chemical structure of TFX is presented in Figure 4. TFX has a molar mass of 408.4 g/mol, an oc-
tanol-water partition coefficient (log KOW) of 4.5 and a water solubility of 0.61 mg/L at 25 °C.79 It does
not possess any groups that could readily be protonated or deprotonated and can be expected to be
present predominantly as an uncharged molecule at any pH found in surface waters.
Figure 4: Chemical structure of TFX (left) and its main hydrolysis product
Table 3: Physicochemical values of TFX
Property Value
Solubility in water 0.61 mg/L
log Kow 4.5
log Koc
(MCI method)
6.48*
log Koc
(Kow method)
3.35*
Values marked with * are estimated in EPI suite.
3.1.1.2 MCM-TPP
(Methoxycarbonylmethyl)triphenylphosphonium (MCM-TPP), which was used as a bromide salt, is an
intermediate product of the Wittig reaction. This reaction, discovered in 1954 by Georg Wittig, is now-
adays used at an industrial scale to form alkenes from ketones or aldehydes using phosphonium
ylides.80, 81 The general reaction mechanism is shown in Figure 5 and Figure 6.82

Hydrolysis of micropollutants
14
Figure 5: Reaction mechanism of the Wittig reaction, part I: formation of the ylide
To generate the ylides, triphenylphosphine is first quarternized by reaction with an alkyl halide. This
results in an alkylphosphonium salt, for which MCM-TPP bromide is an example. In the Wittig reaction,
the alkylphosphonium salt is then deprotonated with a strong base to form an ylide/ylene, which re-
acts with the ketons or aldehydes by forming olefin moieties.
Figure 6: Reaction mechanism of the Wittig reaction, part II: formation of the alkene
When the hydrolysis of phosphonium salts is discussed, this usually means a reaction at the central
phosphor which results in the formation of triphenylphosphine oxide.83-85 Byrne et al. only proved in
2015 that this mechanism involves the intermediate formation of Phydroxytetraorgano-
phosphorane.86
With MCM-TPP however, the hydrolysis of the ester group in the side chain is the prevailing process.
Figure 7: Chemical structure of MCM-TPP (left) and its main hydrolysis product
MCM-TPP has a molar mass of 415.3 g/mol as a bromide salt. It can be expected to be present as a cat-
ion at any pH found in natural waters. Although no experimental values values for Kow and Koc were

Hydrolysis of micropollutants
15
available and prediction software (such as EPI suite)87 seems unreliable when handling permanently
charged molecules, it can be expected that phosphonium as a cationic compound will sorb quite
strongly to soil and sediments. EPI suite predicts a log Koc of 5.44 or 2.86, depending on the method
used.
Table 4: Physicochemical values of MCM-TPP
Property Value
Solubility in water 6.20 mg/L*
log Kow 3.61*
log Koc
(MCI method)
5.44*
log Koc
(Kow method)
2.86*
Values marked with * are estimated in EPI suite.
3.1.1.3 Oxazepam
Oxazepam is a psychoactive drug commonly used for the treatment of anxiety and insomnia. It belongs
to the benzodiazepine class of drugs and is also a human metabolite of several other benzodiazepines
such as diazepam and nordiazepam.
Benzodiazepines are used extensively worldwide and are known to occur in WWTP effluent and many
surface waters.6, 88-91 There is some concern that oxazepam at environmental concentrations may in-
fluence the behavior of fish populations.92 This was demonstrated for the European perch (Perca fluvi-
atilis) by Brodin et al. in 2013.93
The mechanisms and kinetics of benzodiazepine hydrolysis were described by Han et al. in a series of
articles in 1976 and 1977.52, 94, 95 The proposed degradation pathway is presented in Figure 8.

Hydrolysis of micropollutants
16
Figure 8: Chemical structure and hydrolysis pathway of oxazepam
Oxazepam is known to be moderately persistent in the environment, with a tendency to sorb onto sed-
iment.53 It has been shown to be relatively stable toward photodegradation, with a half-life of roughly
4 sunny summer days.96
It has a molar mass of 286.7 g/mol, a log KOW of 2.24 and a water solubility of 20 mg/L at 22 °C.97, 98
Oxazepam has a pKa of 11.3 and its corresponding acid has a pKa of 1.7 – Oxazepam can therefore be
expected to be present predominantly as an uncharged molecule at any pH commonly found in surface
waters.
Table 5: Physicochemical values of oxazepam
Property Value
Solubility in water 20 mg/L
log Kow 2.24
log Koc
(MCI method)
2.76*
log Koc
(Kow method)
1.73*
Values marked with * are estimated in EPI suite.
3.1.2 Interfering materials
Humic acids, microplastic fibers and sediments were used as interfering materials (IMs) in our exper-
iments. For better comparability, all IMs were typically used in the same concentration of 30 mg/L.
This concentration is comparable to the level at which humic acids occur in aquatic environments,

Hydrolysis of micropollutants
17
while microplastic fibers occur in much lower concentrations. For sediment, using a much larger
amount could also be justified. OECD guideline 308 for instance, which describes the procedure for
testing the transformation of chemicals in aquatic sediment systems, suggests using a water:sediment
volume ratio between 3:1 and 4:1.99 However, particulate matter can be present in rivers and streams
in the range of 30 mg/L.100
3.1.2.1 Humic acids
Humic acids are a diverse mixture of high-molecular weight compounds containing many carboxyl
and phenolic moieties.54 They are formed by the partial biological degradation of plants and represent
a significant part of the organic component present in soil and the aquatic environments. Humic acids
are found everywhere in the aquatic environment: in soils101, lakes102, rivers103, and in the sea.104, 105
The 2D and 3D structure of a molecule of humic acid, as proposed by Schulten et al., is shown as an
example in Figure 9.106
Figure 9: Structure of a humic acid molecule
Element colors in the 3D model: carbon (cyan); hydrogen (white); oxygen (red); and nitrogen (blue). Source: Schulten et al. 1997.106
In this study, we used a commercially available humic acid standard provided by Sigma Aldrich (article
number 53680, CAS 1415-93-6). The carbon content of this standard was determined as 39.4 %. The
use of commercial humic acids has been criticized since they may be significantly different from natu-
rally occurring aquatic NOM even if their elemental composition is similar.107 However, they still allow
improved ease of handling and greater comparability of results with those of other researchers.
It is well known that humic acids can increase the apparent solubility of otherwise insoluble substanc-
es.108 This is because the substances can be sorbed onto the humic acid, which itself is partly dissolved
in water.

Hydrolysis of micropollutants
18
Figure 10: Picture of humic acid used as an IM
Scale in cm.
3.1.2.2 Microplastic fibers
Plastic waste can be found everywhere in the aquatic environment. The first reports of plastic litter in
the ocean date back to the 1970s.109, 110 This includes large plastic items as well as microscopic frag-
ments and fibers.111 These so-called microplastics and their behavior in the environment have been
studied extensively in recent years.112-121 They have been found in oceans122, rivers118, 123, and sedi-
ments123, 124 as well as in living organisms.116, 124
Microplastics are both formed from larger plastic objects in the environment and released into the
environment by a number of different sources.120, 125, 126 Domestic sources of microplastic fibers in-
clude the washing of polyester fleece textiles127 as well as some personal care products.120, 128
Microplastics in aquatic environments have the potential to absorb persistent organic pollutants and
transfer them to marine organisms after being ingested.129 There is some concern that the microplas-
tics used in laboratory experiments are not consistent with those found in the field.130 The most com-
monly used types of plastic are polyethylene (PE), polypropylene (PP), polyvinylchloride (PVC), poly-
styrene (PS), and polyethylene terephthalate (PET) (see Figure 11), which together account for ap-
proximately 90% of the global plastic production.131
Figure 11: Structure of PET
The microplastic fibers employed in this study were purchased as small PET balls (approximately
1 cm diameter) that were sold as filling material for pillows or stuffed toys. Similar fibers are used in

Hydrolysis of micropollutants
19
mixed-fiber textiles. The fibers should therefore be comparable to fibers that are released into the en-
vironment during the domestic washing of clothes. Individual fibers (length up to several cm, diameter
<0.1 mm) were manually detached from the PET balls prior to use.
Figure 12: Picture of microplastic fibers used
Scale in cm.
3.1.2.3 Sediment
Sediments are naturally occurring materials that are broken down by erosion and weathering and are
subsequently transported by the action of water or other natural means.132 Sediments are classified by
grain size, reaching from clay (<3.9 µm) to coarse sand (0.5-2 mm). Even larger particles such as grav-
el, cobble, and even boulders can be considered sediment, as long as they are transported, e.g. by glaci-
ers.133
The used Rhine sediment is a sandy silt sediment sampled at the Ehrenbreitstein marina at Koblenz.
It was filtered through a 2-mm sieve prior to its application in the lab-scale experiments. The grain
size distribution of the sediment can be seen in Figure 13.
Figure 13: Grain size distribution of the Ehrenbreitstein sediment

Hydrolysis of micropollutants
20
The Ehrenbreitstein sediment thus consists of approximately 4.4% clay, 70.2% silt, and 25.4% sand. It
has a dry matter content of 32.8% with an organic portion of 4.3%.
3.2 Experimental methods
3.2.1 Buffer systems
Buffer systems used in this project were acetic acid/acetate buffer for experiments at low pH (up to
pH 6), phosphate buffer for near-neutral experiments (up to pH 8), and glycine-NaOH buffer for basic
conditions. Buffers were used in concentrations of 0.1 mol/L.
Acetic acid/acetate buffer was prepared by dissolving 6 mL glacial acetic acid and 16.4 g sodium
acetate each in 1 L purified water separately, then slowly adding acetic acid solution to the sodium
acetate solution while stirring vigorously until the desired pH is reached.
Phosphate buffer was prepared by dissolving 10.206 g KH2PO4 in 1.5 L purified water, then slowly
adding sodium hydroxide solution (c = 0.1 mol/L) until the desired pH is reached.
Glycine-NaOH buffer was prepared by dissolving 15.0 g glycine and 11.7 sodium chloride in 2 L puri-
fied water and adjusting to the desired pH by slowly adding sodium hydroxide solution (c = 0.1 mol/L)
until the desired pH is reached.
3.2.2 Lab-scale experiments
For a series of the experiment, a buffer solution (approximately eight liters) at the desired pH was
prepared and distributed to individual reaction vessels (100 mL brown glass bottles), containing a
magnetic stirring bar and 3 mg of IM (if any). The whole solutions were autoclaved at 121 °C with a
sterilization time of 15 min using a Systec VE-75 (Systec, Linden). 100 µL of analyte stock solution
(100 mg/L in MeOH) was added to the buffer solution for a resulting concentration of 100 µg/L. The
reaction vessels were then placed in a climate cabinet at 25 °C in the dark. At each sampling point, a
complete vessel was sacrificed for analysis. The first sample of each experiment (d 0) was drawn
30 min after placing the samples in the climate cabinet.
The reaction mixture was filtered through a syringe filter. The filter was washed with 3x10 mL of the
buffer solution. Finally, an internal standard was added to the filtrate, which was then stirred for 5
min. An aliquot of 1 mL was analyzed immediately at the end of the experiment, and another 4 mL
were retained as a backup sample. Both samples were stored at -20 °C.
The reaction vessels and the filters were also extracted using 3x10 mL methanol to cover the sorbed
quantities. In some experiments, this was done separately for the vessel and the filter; in later experi-
ments, the methanol was first poured into the vessel and shaken vigorously, then the same methanol
was used to wash the filter. Internal standards were also added to the extracts, and they were stored
until analysis at -20 °C.
3.2.2.1 Single-vessel experiments
A simplified experimental set-up was used for the lab-scale experiments by using larger vessels con-
taining 1 L of the reaction mixture, which was sampled repeatedly at defined intervals. However, this
layout was not in accordance with OECD method 111 and has severe drawbacks in that microbial con-
tamination of the reaction vessel during sampling was difficult to avoid. Due to inconsistent data the
experiments were stopped (data not shown). Thus, all results shown in this report were achieved by
using individual vessels for each sampling point.

Hydrolysis of micropollutants
21
3.2.2.2 Differences from the standard method
Except for the single-vessel experiments described in the previous section, all experiments followed
the standard experimental layout described in OECD method 111 closely, with one important differ-
ence: preliminary tests were carried out at three (or more) different pH values, but the main experi-
ments (with added IMs) were only conducted at a pH at which the substances were found to have a
half-life of about one to two weeks. At a much longer half-life, degradation would be difficult to ob-
serve over the course of an experiment that only lasts about one month. Much shorter half-lives on the
other hand would be experimentally more challenging (they require faster sampling intervals so that
not all of the analyte is consumed after just one or two sampling points), and they are also less rele-
vant: if a substance is degraded very quickly, a slightly reduction of the rate of degradation does not
matter as much as it does in a substance that is already relatively stable.
3.2.3 Available standards
In addition to an external calibration, internal standards were used for quantification of the target
substances as well as the hydrolysis products. The surrogate standards were spiked to a sample at the
beginning of sample preparation. The concentrations of the analytes were calculated as the ratio of the
signal of the analyte and that of the internal standard, which allows to correct losses during sample
preparation and storage, as well as to compensate variations in the sensitivity of the measurements.
For each of the selected compound the surrogate standards used for quantification in this study are
shown in Table 6.
Table 6: Surrogate standards used for quantification
TFX standards MCM-TPP stand-
ards
Oxazepam standards

Hydrolysis of micropollutants
22
For TFX, an isotope-labelled standard were unfortunately not commercially available. Several suppli-
ers were conducted to purchase TFX-d6, but without success. To amend this, three compounds with a
similar chemical structure as TFX were purchased at Sigma-Aldrich and tested for their suitability as
surrogate standard of TFX. All of them are also strobilurin class fungicides: picoxystrobin, kresoxim-
methyl, and metominostrobin. Picoxystrobin, which has the greatest similarity to TFX, proved to be the
most suitable compound for quantification, and ended up being used as the only internal standard. It
has physicochemical properties that are reasonably similar to those of TFX, such as a log Kow of 3.6
(TFX: 4.5) and a water solubility of 3.1 mg/L (TFX: 0.6 mg/L).134, 135 It shares with TFX not only the
βmethoxyacrylate moiety that all strobilurins have in common, but also the trifluoromethyl group.
TFXA, the main hydrolysis product of TFX was available as an un-labelled standard (Sigma-Aldrich).
Since no isotope-labelled standard was available for MCM-TPP, another TPP salt was used:
(2methoxyethyl)triphenylphosphonium bromide. Values for the physicochemical properties of these
phosphonium salts are not readily available, since they are formed as undesired intermediate products
and not sold at larger quantities that would require a complete registration. It can however be as-
sumed that the sorption behavior of all TPP salts is dominated by the permanent positive charge. The
main hydrolysis product CB-TPP was available as a standard. Triphenylphosphine oxide, another pos-
sible result of the hydrolysis of phosphonium salts, was also purchased (both Sigma-Aldrich).
Isotope-labelled oxazepam (oxazepam-d5) was purchased at Sigma-Aldrich. As for the hydrolysis
product, (2-amino-5-chlorophenyl)(phenyl)methanone had been acquired, but turned out to be a
product of minor importance under the conditions used in this project.
3.2.4 ASE method
In the ASE method used, 1 g of the IMs was filled in extraction cells (7.5 cm, 2 cm diameter) together
with inert purified sea sand (Th. Geyer, Renningen). They were heated within 6 min to 120 °C, fol-
lowed by 15 min of extraction at a pressure of 100 bar via MeOH/H2O (80/20; v/v) containing 1% of
formic acid. This extraction cycle was repeated three times. The volume of the ASE extracts was then
reduced in a gentle nitrogen stream to a defined volume and analytes were measured using the meth-
ods described below.
3.3 Analytical methods
All samples were analyzed via LC-MS on an LTQ Orbitrap Elite (Thermo Scientific, Bremen, Germany).
Separation was achieved using a Hydro-RP column (50x2 mm, 4 µm, Phenomenex, Aschaffenburg) at
30 °C. The chromatographic settings are listed in Table 1-3. The flow rate was 400 µL/min. All analyses
were run in positive ionization mode at a resolution of 60,000 for the full scan and 15,000 for subse-
quent fragmentation experiments to identify hydrolysis products. The injection volume was set at
100 µl. For MCM-TPP, the m/z range was set to 180-1000. For oxazepam and trifloxystrobin, it was set
to 180-400 or 180-600, respectively.
With these settings, all of the analytes could be reliably quantified at concentrations of 1 µg/L, corre-
sponding to 1% of the starting concentration used in degradation experiments. With every set of ex-
perimental samples, an calibration curve was measured, consisting of samples at known concentra-
tions of 0 µg/L, 1 µg/L, 2 µg/L, 5 µg/L, 10 µg/L, 20 µg/L, 50 µg/L, 100 µg/L, and 150 µg/L.

Hydrolysis of micropollutants
23
Table 7: Chromatographic settings for MCM-TPP experiments
time / min water / % acetonitrile / %
0 95 5
1.5 95 5
2 65 35
5 65 35
8 40 60
9 40 60
9.2 95 5
12 95 5
Table 8: Chromatographic settings for trifloxystrobin experiments
time / min water / % acetonitrile / %
0 60 40
1 60 40
2 30 70
5 10 90
10 10 90
10.5 60 40
15 60 40

Hydrolysis of micropollutants
24
Table 9: Chromatographic settings for oxazepam experiments
time / min water / % acetonitrile / %
0 80 20
1 80 20
2 40 60
5 20 80
10 20 80
10.5 80 20
15 80 20
3.4 Determination of sediment properties
3.4.1 Particle size distribution
The particle size distribution of the Ehrenbreitstein sediment was conducted by dynamic light scatter-
ing using a Beckman Coulter LS 200.
3.4.2 Dry matter
The dry matter was determined by drying samples to constant mass at 105°C in a drying oven. The
difference in mass before and after drying can be used to calculate water content and dry matter.
3.4.3 TOC
The TOC content of sediment was determined by burning samples in a purified atmosphere in a
Mitsubishi HF-210 and measuring the resulting amount of carbon dioxide (Compact IC pro 881,
Metrohm, Herisau, Switzerland).
3.5 Statistical evaluation
Excel 2010 (Microsoft, Redmond, USA) was used for data management and simple calculations. Calcu-
lation of kinetic parameters in Excel is possible,136, 137 but using specialized statistics software is much
more comfortable. Therefore, SigmaPlot for Windows Version 13.0 (Systat Software, San Jose, USA)
was used as well.
Hydrolysis typically is a first-order reaction, which can be described by the following equation:
𝑌𝑡 = 𝑌0 ∙ 𝑒−𝑘∙𝑡
𝑌𝑡: 𝑐𝑎𝑙𝑐𝑢𝑙𝑎𝑡𝑒𝑑 𝑐𝑜𝑛𝑐𝑒𝑛𝑡𝑟𝑎𝑡𝑖𝑜𝑛 𝑎𝑡 𝑡𝑖𝑚𝑒 𝑡, 𝑌0: 𝑐𝑎𝑙𝑐𝑢𝑙𝑎𝑡𝑒𝑑 𝑐𝑜𝑛𝑐𝑒𝑛𝑡𝑟𝑎𝑡𝑖𝑜𝑛 𝑜𝑓 𝑡 = 0, 𝑘: 𝑟𝑎𝑡𝑒 𝑐𝑜𝑛𝑠𝑡𝑎𝑛𝑡
The parameters Y0 and k were optimized via non-linear regression by minimizing the root of the sum
of the squared differences between experimental data and theoretical curves. For every measured
concentration c and the associated reaction time t, the error between c and the corresponding theoret-

Hydrolysis of micropollutants
25
ical concentration Yt is calculated, the errors are squared (to obtain only positive values), and the sum
of the squared errors is minimized by iteratively varying Y0 and k using statistical analysis software.
Half-lives were calculated as:
𝐷𝑇50 =ln (2)
𝑘
Confidence intervals of k were calculated in SigmaPlot, and confidence intervals of the half-lives were
calculated from these using simple rules for the propagation of uncertainty:
𝑓(𝐷𝑇50) =ln(2)
(𝑘)2𝑓(𝑘)

Hydrolysis of micropollutants
26
4 Results and discussion
4.1 Main experiments
4.1.1 Trifloxystrobin
It was already known78 that TFX is stable at pH 4 and still has a half-life of almost 40 days at neutral
pH, but is completely degraded within just a few hours at pH 9. We therefore first conducted prelimi-
nary experiments at room temperature and pH 7.5, pH 8.0 and pH 8.5. Based on the results of these
preliminary experiments, we decided to run the main degradation experiments at pH 7.5 in phosphate
buffer. This would allow for a degradation that is fast enough for several half-lives to pass over the
course of the experiment, but not so fast that all the TFX is consumed within just a few days. The con-
centration of the TFX hydrolysis product TFXA in the main experiments was also measured and a mass
balance was calculated.
In the experiments without IM (Figure 14) and with sediment (Figure 16), the mass balances were
always close to 100%. In the experiment with microplastic (Figure 15), the mass balance dropped
down to about 80% early on, but remained at that level for the duration of the experiment, which
might be caused by an under-determination of the starting concentration. In the experiments with
humic acid on the other hand (Figure 17), the mass balance fluctuated somewhat stronger, with ap-
parent values of up to 133%. The most likely explanation for this is that the concentration of the hy-
drolysis product (for which an internal standard was not available) was over-estimated. Overall, it is
obvious from the mass balance that TFXA is the dominant hydrolysis product of TFX, and that TFXA is
not further hydrolyzed.
Figure 14: Degradation of TFX with no IM
Red diamonds: TFX, light blue circles: TFXA, normalized on the molar mass of TFX (solid symbols: first run, hollow symbols: second run), dark blue squares: sum of TFX and TFXA (averaged for both runs). The black dashed lines repre-sent the 95% CI, the green dashed line shows DT50, pH 7.5.

Hydrolysis of micropollutants
27
Figure 15: Degradation of TFX in the presence of microplastics
Red diamonds: TFX, light blue circles: TFXA, normalized on the molar mass of TFX (solid symbols: first run, hollow symbols: second run), dark blue squares: sum of TFX and TFXA (averaged for both runs). The black dashed lines repre-sent the 95% CI, the green dashed line shows DT50, pH 7.5.
Figure 16: Degradation of TFX in the presence of sediment particles
Red diamonds: TFX, light blue circles: TFXA, normalized on the molar mass of TFX (solid symbols: first run, hollow symbols: second run), dark blue squares: sum of TFX and TFXA (averaged for both runs). The black dashed lines repre-sent the 95% CI, the green dashed line shows DT50, pH 7.5.

Hydrolysis of micropollutants
28
Figure 17: Degradation of TFX in the presence of humic acids
Red diamonds: TFX, light blue circles: TFXA, normalized on the molar mass of TFX (solid symbols: first run, hollow symbols: second run), dark blue squares: sum of TFX and TFXA (averaged for both runs). The black dashed lines repre-sent the 95% CI, the green dashed line shows DT50, pH 7.5.
An overview of the rate constants and half-lives measured for TFX experiments is listed in Table 10.
The half-life measured without addition of any IM was slightly higher (10.9 d) than for any of the ex-
periments with addition of IM (ranging from 8.6 d to 9.6 d).
Table 10: Rate constants and half-lives for TFX
No IM Microplastics Sediment Humic acids
k 0.063 ± 0.008 0.072 ± 0.009 0.072 ± 0.080 0.081 ± 0.011
DT50 10.9 ± 1.4 9.6 ± 1.3 9.6 ± 1.0 8.6 ± 1.2
klog 0.073 ± 0.007 0.065 ± 0.007 0.065 ± 0.007 0.085 ± 0.006
DT50,log 9.5 ± 0.8 10.6 ± 1.1 10.7 ± 1.1 8.2 ± 0.6
k and DT50 determined by non-linear regression of the untransformed data. klog and DT50,log determined from the slope of a logarithmic plot of the concentration over time, pH 7.5 .
Liu et al. (2014)78 report the half-life of trifloxystrobin at 25°C as 866.4 h (or 36.1 d) at pH 7 and 36.3 h
(or 1.5 d) at pH 8; this was for experiments which, of course, did not include any IM. This is in good
agreement with our finding of a half-life of about 10 d (or 240 h) at pH 7.5.

Hydrolysis of micropollutants
29
Figure 18: Direct comparison of degradation of TFX under different conditions.
Calculated curves based on the average of all experiments, based on non-linear regression of the untransformed data. Curves for the degradation in the presence of microplastic (red) and sediment (green) are not identical, but so similar that the green curve has to be represented by a dashed line.
Figure 18 shows a direct comparison of the degradation curves for all TFX experiments.
The observed rate of hydrolysis was slightly lower without the addition of IM, but the confidence in-tervals still overlap for all experiments. Although there is a tendency that the rate constants were low-er with added IM, the difference was statistically not significant. The hypothesis that the IMs signifi-cantly reduce the rate of hydrolysis of TFX could therefore not be confirmed. Due to the closed mass balances, it can also be excluded that other transformations products are formed when IM are added.
In absolute values, the measured starting concentration for all TFX experiments were very close to each other and to the theoretical concentration, with values of 99.3 µg/L in the experiment without added IM, 95.9 µg/L in the sediment experiment, 100.1 in the experiment with microplastic fibers, and 96.3 µg/L in the experiment with humic acid.
As mentioned in section 1.2, kinetic constants are frequently determined by plotting ln([A]t/[A]0) against the time, which results in a straight line with -k as its slope. For comparison, we also deter-mined k (and the associated DT50) that way. The plots can be seen in Figure 19, the kinetic data are also listed in Table 10.
The kinetic parameters determined this way differ from those determined by non-linear regression by about 10%. It is interesting to note that the order of experiments (if ranked by ascending reaction rate) has changed: while the rate constant for the experiment without added IM is lowest if deter-mined by non-linear regression, klog is lower for the experiments with added microplastic or sediment. This is caused by the fact that the last few data points are slightly below the modelled degradation curve for the experiment in pure water (see Figure 14), but slightly above that line in the microplastics and sediment experiments (see Figure 15 and Figure 16). The influence of these data points is in-creased in the logarithmic plot, which overvalues samples with low concentrations.
The confidence intervals for the experiment in pure water overlap with those of all other experiments in the logarithmic plot as well. This confirms the conclusion that the employed IMs have no significant effect on the hydrolysis of TFX.

Hydrolysis of micropollutants
30
Figure 19: Logarithmic plot of data from TFX experiments
Top row: no IM (left), microplastics (right). Bottom row: sediment (left), humic acid (right).

Hydrolysis of micropollutants
31
4.1.2 MCM-TPP
Since MCM-TPP is a positively charged compound, it is clear that its hydrolysis will be catalyzed by hydroxide ions and will thus be faster at elevated pH values. In preliminary experiments, we found that MCM-TPP is almost completely consumed within 3 days at room temperature and neutral pH. To slow down this fast degradation, additional preliminary tests were run at pH 4, pH 5, and pH 6. Degra-dation in all of these experiments was very slow, with less than 20% hydrolysis observed after two weeks at pH 6. After a final round of preliminary pH tests at pH 6.2, pH 6.5, and pH 6.8, we therefore decided to run the main MCM-TPP experiments in phosphate buffer at pH 6.2. For these main experi-ments, both MCM-TPP and its expected hydrolysis product carboxymethyl(triphenylphosphonium) (CB-TPP) were available as standards for an external calibration.
In addition, (2methoxyethyl)triphenylphosphonium was added to the samples during sample prepa-
ration and was used as a surrogate standard for MCM-TPP quantification. In the experiments with sed-
iment, samples from d 21 on showed vastly increased peak areas for the IS. Since the reason for this
was not found, these samples were quantified using the average peak area of the IS in the samples tak-
en on d 0-17.
In all experiments, it was found that CB-TPP is the dominant hydrolysis product, as can be seen from Figure 20-Figure 23. In the experiment without an added IM, the formation of CB-TPP initially seemed to be much faster than the degradation of MCM-TPP, which caused the mass balance to jump to 120%. This is most likely caused by an over-determination of the CB-TPP concentration due to the lack of an appropriate surrogate standard for CB-TPP yielding to a mass balance of 120 % even at the end of the experiment after 45 days.
In the experiments with added sediment or humic acids, the sum of MCM-TPP and CB-TPP remained relatively constant over the course of the reaction, with only some inflated values of about 120% of the starting concentration. These are likely also the result of an over-determination of CB-TPP. In the mi-croplastics experiments, the mass balance dropped to about 80% toward the end of the reaction, which was caused by an apparent decrease of the CB-TPP concentrations. No such decrease was ob-served in the other experiments. It is possible that some of the CB-TPP formed was slowly sorbed to the microplastics fibers. However, this effect was small and may also be caused by random fluctuations in the measurements of CB-TPP.
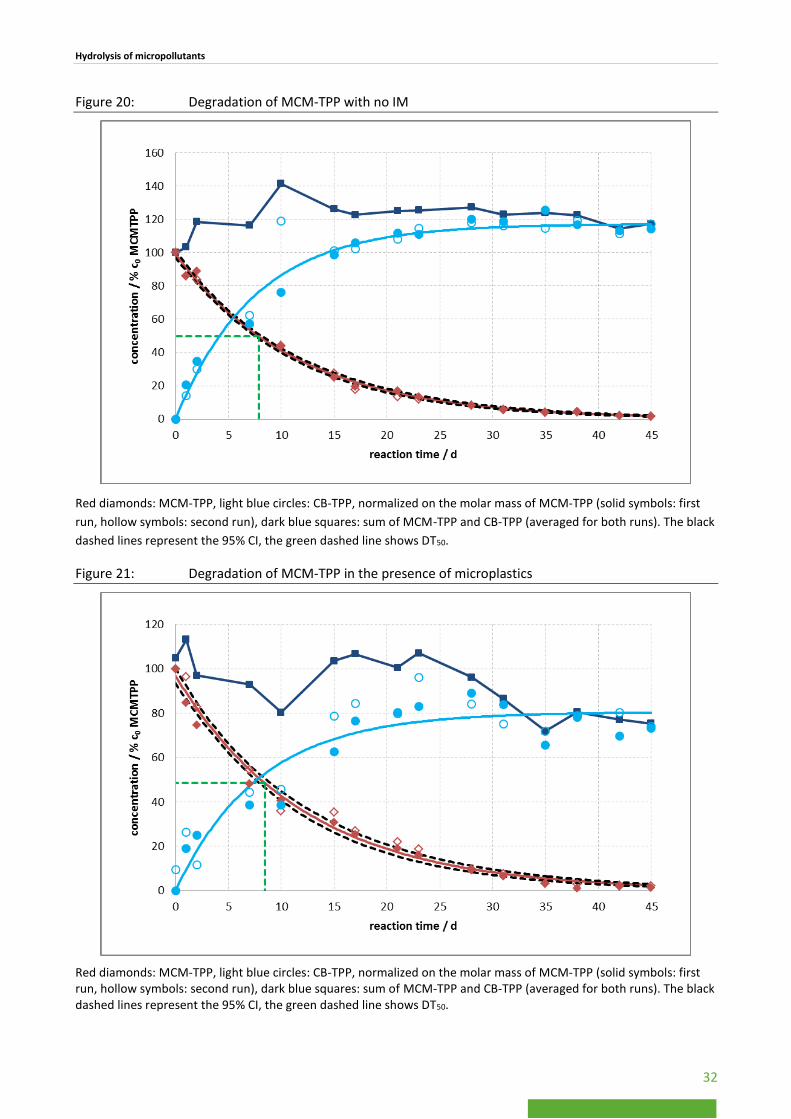
Hydrolysis of micropollutants
32
Figure 20: Degradation of MCM-TPP with no IM
Red diamonds: MCM-TPP, light blue circles: CB-TPP, normalized on the molar mass of MCM-TPP (solid symbols: first
run, hollow symbols: second run), dark blue squares: sum of MCM-TPP and CB-TPP (averaged for both runs). The black
dashed lines represent the 95% CI, the green dashed line shows DT50.
Figure 21: Degradation of MCM-TPP in the presence of microplastics
Red diamonds: MCM-TPP, light blue circles: CB-TPP, normalized on the molar mass of MCM-TPP (solid symbols: first run, hollow symbols: second run), dark blue squares: sum of MCM-TPP and CB-TPP (averaged for both runs). The black dashed lines represent the 95% CI, the green dashed line shows DT50.

Hydrolysis of micropollutants
33
Figure 22: Degradation of MCM-TPP in the presence of sediment
Red diamonds: MCM-TPP, light blue circles: CB-TPP, normalized on the molar mass of MCM-TPP (solid symbols: first run, hollow symbols: second run), dark blue squares: sum of MCM-TPP and CB-TPP (averaged for both runs). The black dashed lines represent the 95% CI, the green dashed line shows DT50. MCM-TPP concentrations from d21 on calculat-ed without the use of an internal standard.
Figure 23: Degradation of MCM-TPP with in the presence of humic acids
Red diamonds: MCM-TPP, light blue circles: CB-TPP, normalized on the molar mass of MCM-TPP (solid symbols: first run, hollow symbols: second run), dark blue squares: sum of MCM-TPP and CB-TPP (averaged for both runs). The black dashed lines represent the 95% CI, the green dashed line shows DT50.

Hydrolysis of micropollutants
34
In the experiment with added humic acids, the last two samples in both experimental runs differed
clearly from the previous samples: they contained slightly lower amounts of MCM-TPP than expected,
and clearly increased amounts of CB-TPP, resulting in an apparent mass balance of about 120%. It is
possible that these observations were caused by an accelerated hydrolysis actually occurring in these
samples, e.g. due to a slightly increased temperature in the climate cabinet after d 38. These points
might be excluded as outliers, but this proved to have only a negligible effect on the calculated value of
k. (0.071 ± 0.006 rather than 0.072 ± 0.006)
In addition to CB-TPP, no other quantitatively significant hydrolysis product can be expected, and in
fact, the only further compound detected in any of the samples was triphenylphosphine oxide, which is
discussed in the following section.
An overview of the kinetic data from MCM-TPP experiments are listed in Table 11. The half-life was
slightly lower (7.8 d) in the experiment without added IM than in any of the other experiments (8.5 d
to 10.3 d).
Table 11: Rate constants and half-lives for MCM-TPP
No IM Microplastics Sediment Humic acids
k
0.089 ± 0.004 0.082 ± 0.006 0.068 ± 0.009 0.072 ± 0.006
0.071 ± 0.006*
DT50
7.8 ± 0.4 8.5 ± 0.6 10.3 ± 1.3 9.6 ± 0.7
9.7 ± 0.8*
klog
0.095 ± 0.010 0.095 ± 0.008 0.061 ± 0.009 0.088 ± 0.010
0.064 ± 0.009*
DT50,log
7.3 ± 0.3 7.3 ± 0.6 11.4 ± 1.7 10.9 ± 1.6*
k and DT50 determined by non-linear regression of the untransformed data. klog and DT50,log determined from the slope of a logarithmic plot of the concentration over time, (*) without outliers.
For the experiments without added IM on the one hand and the experiments with added sediment or
humic acid on the other hand, there was no overlap of the 95% CI. This suggests that at least sedi-
ments and humic acids might have a decreasing effect on the hydrolysis rate of MCM-TPP. However,
the increase of the rate constants for these two IMs was very similar and overlapped with the (insignif-
icant) increase in the experiments with microplastics additions. This suggests that the inhibiting effect
on the hydrolysis of MCM-TPP was quite small. A difference in the formed TPs was not observed.
As discussed in section 4.1.1, the experiments were also evaluated by plotting the logarithmic concen-trations against the reaction time (see

Hydrolysis of micropollutants
35
Figure 25). The kinetic parameters derived from these plots were once again very similar to the pa-rameters obtained by non-linear regression of the untransformed data, with the exception of the ex-periment with add humic acids. In this case, the last two data points from both runs of the experiment are somewhat lower than expected. This is obvious in the logarithmic plot, but difficult to see in the direct plot (see Figure 23). It might be best to exclude these points as outliers. If, however, they are included in the calculations, they strongly influence the kinetic constant derived from the logarithmic plot of the data (because they are data points at low concentrations), but barely matter for the con-stant obtained from non-linear regression.
Figure 24: Direct comparison of degradation of MCM-TPP under different conditions.
Calculated curves based on the average of all experiments, based on non-linear regression of the untransformed data.
This highlights advantages and disadvantages of the logarithmic plot beyond its ease of use: it makes it
easier to judge whether a degradation actually follows first order kinetics, and it allows for an easier
identification of potential outliers; but it also means that the calculated kinetic parameters are strongly
influenced even by small variations in experimental data measured at low concentrations.
If the outliers are excluded, both the sediment and the humic acids experiment yield significantly de-
creased rate constants. This confirms the conclusion that sediment and humic acids may have an effect
on the hydrolysis of MCM-TPP, but it also illustrates that this effect is relatively small.
A direct comparison of the degradation curves of all experiments with MCM-TPP can be seen in Figure 24. In absolute values, the measured starting concentration for three of the MCM-TPP experiments were close to each other and to the theoretical concentration, with values of 106.0 µg/L in the experi-ment without added IM, 108.5 µg/L in the sediment experiment, and 96.0 µg/L in the experiment with humic acid. In the experiment with added microplastic fibers, the measured starting concentration was somewhat lower at 88.6 µg/L. Since this fit very well with the other sampling points in this exper-iment as well as with the measured values for the hydrolysis product (which were also lower in abso-lute values in this experiment than in any of the others), it seems unlikely that this was the result of sorption to the microplastic. It is more convincing to assume that a slightly smaller amount of analyte was actually used in the preparation of the samples for this experiment, or that the quantification of the analyte was too low, for instance due to a bad calibration curve or sensitivity problems of the in-strument.

Hydrolysis of micropollutants
36
Figure 25: Logarithmic plot of data from MCM-TPP experiments
Top row: no IM (left), microplastics (right). Bottom row: sediment (left), humic acid (right).
4.1.2.1 TPP oxide
In addition to the expected hydrolysis product, only one other compound was found in samples from
the MCM-TPP experiments: triphenylphosphine oxide (TPP oxide, structure shown in Figure 26). This
compound was available as an external standard, so concentrations could also be determined.
Figure 26: Chemical structure of TPP oxide
In the experiments without IM, around 20 µg/L of TPP oxide were determined toward the end of the
reaction period. However, it was found that TPP oxide was already present as a contamination in the
MCM-TPP standard, and most of the TPP oxide (around 70%) was already detected at the beginning of
the experiment.
It is well known that hydrolysis of phosphonium compounds can result in the formation of phosphine
oxide,85, 138 and it seems plausible that this also occurred in our experiments to a minor extent. Because
of the presence of TPP oxide in the MCM-TPP standard however, no further attempt to quantify TPP
oxide in other experiments was undertaken.

Hydrolysis of micropollutants
37
4.1.3 Oxazepam
Preliminary tests at pH 4, pH 7, and pH 9, conducted at a temperature of 50 °C, showed that hydrolysis
was quite slow at neutral pH (with only about 50% degradation within 4 days), and faster at pH 4 and
pH 9, with about 90% degradation at pH 4 and about 95% degradation at pH 9. Since that degradation
is overall relatively slow, we decided to conduct the main experiment series at pH 9, where the degra-
dation was fastest.
The hydrolysis of oxazepam is more complex than that of the other analyzed compounds, because
both the amide and the imine function can be hydrolyzed. When this happens, the final product is
(2amino5-chlorophenyl)(phenyl)methanone. However, it turned out that the buffer used in our ex-
periment interfered with the formation of that transformation product in an unexpected manner. A
glycine-NaOH buffer was used, which seemed to be a good choice since the side chain cleaved from
oxazepam also is a glycine derivative. However, the glycine from the buffer reacted with one of the
intermediate hydrolysis products to form the quinazoline derivative shown in Figure 27. The fragmen-
tation pattern of the product that was used to suggest the structure is also shown in that figure.
Figure 27: Suggested hydrolysis product (in the presence of glycine) and its fragmentation pattern
Since no standard of this compound was available, an accurate quantification of this transformation
product was impossible. A comparison between the different experiments showed that a similar for-
mation was observed in experiments without IM and with the addition of sediment and microplastic
fibers. However, in experiments with humic acids, after 10 days no further formation of the quinazo-
line derivative occurred although hydrolysis of oxazepam still took place; while such a plateau was not
found in any of the other experiments. If another transformation product was formed or if sorption
effects are causing this result cannot be concluded without further experiments, although no other
products were detected in any of the samples.

Hydrolysis of micropollutants
38
Figure 28: Formation of the oxazepam hydrolysis product
Peak areas plotted against the reaction time.
Graphs for the hydrolysis of oxazepam itself can be found in Figure 29-32.
Figure 29: Degradation of oxazepam with no IM
Red diamonds: oxazepam. (solid symbols: first run, hollow symbols: second run). The black dashed lines represent the 95% CI, the green dashed line shows DT50.

Hydrolysis of micropollutants
39
Figure 30: Degradation of oxazepam in the presence of microplastics
Red diamonds: oxazepam. (solid symbols: first run, hollow symbols: second run). The black dashed lines represent the 95% CI, the green dashed line shows DT50.
Figure 31: Degradation of oxazepam in the presence of sediment
Red diamonds: oxazepam. (solid symbols: first run, hollow symbols: second run). The black dashed lines represent the 95% CI, the green dashed line shows DT50.

Hydrolysis of micropollutants
40
Figure 32: Degradation of oxazepam in the presence of humic acids
Red diamonds: oxazepam. (solid symbols: first run, hollow symbols: second run). The black dashed lines represent the 95% CI, the green dashed line shows DT50.
An overview of the kinetic data found in oxazepam experiments can be found in Table 12. The half-life
was somewhat higher (26.7 d) in the experiment without added IM than in the experiment with added
microplastic fibers (24.8 d), but lower than in any of the other experiments (29.2 d to 30.5 d). The dif-
ferences were statistically not significant to confirm our hypothesis that the IMs significantly reduce
on the rate of hydrolysis of oxazepam. Due to the missing mass balances, it cannot be excluded that
other transformations products are formed when IM are added. However, no such products were de-
tected in any experiment, so it seems unlikely that any further product was formed in appreciable
amounts.
Table 12: Rate constants and half-lives for oxazepam
No IM Microplastics Sediment Humic acids
k 0.026 ± 0.002 0.028 ± 0.002 0.023 ± 0.003 0.024 ± 0.002
DT50 26.7 ± 2.1 24.8 ± 1.8 30.5 ± 4.4 29.2 ± 2.5
klog 0.027 ± 0.002 0.027 ± 0.003 0.021 ± 0.003 0.022 ± 0.002
DT50,log 26.0 ± 2.1 25.7 ± 2.0 32.4 ± 4.7 31.4 ± 2.4
k and DT50 determined by non-linear regression of the untransformed data. klog and DT50,log determined from the slope of a logarithmic plot of the concentration over time.
In absolute values, the measured starting concentration for all oxazepam experiments were very close to each other, although they were somewhat higher than the intended concentration, with values of 114.6 µg/L in the experiment without added IM, 117.4 µg/L in the microplastics experiment, 116.6 in the experiment with sediment, and 113.7 µg/L in the experiment with humic acid. Since these values are all in such good agreement, the explanation for the overquantification is almost certainly that the

Hydrolysis of micropollutants
41
concentration in the parent solution was too high or the concentration in the calibration curve was too low.
The differences from kinetic parameters derived from a logarithmic plot of the data (see Figure 34)
and parameters obtained by non-linear regression were relatively small in all cases. However, they
were large enough to cause a significant difference in the half-life without IM and with added humic
acids. The mean value for the half-life with added sediment was even larger, but the difference in this
was still not significant because of the larger uncertainty. A graphical comparison of the degradation
curves for all oxazepam experiments is shown in Figure 33.
Figure 33: Direct comparison of degradation of oxazepam under different conditions.
Calculated curves based on the average of all experiments, based on non-linear regression of the untransformed data.
Parameters derived from non-linear regression should be more accurate, since it actually minimizes
the errors between experimental data and modelled values rather than the logarithm of these errors.
In this case, this probably means that the IMs had no effect on the rate of hydrolysis of oxazepam, alt-
hough a small decreasing effect caused by humic acids or sediment seems possible.

Hydrolysis of micropollutants
42
Figure 34: Logarithmic plot of data from oxazepam experiments
Top row: no IM (left), microplastics (right). Bottom row: sediment (left), humic acids (right).
4.2 Losses by sorption
In order to determine sorbed quantities of the analytes, reaction vessels and filters in all experiments were extracted using methanol after filtering the reaction mixtures, as described in section 3.2. These methanol extracts were analyzed by the same detection methods as used for the filtrates. However, analytes and their hydrolysis products were only sporadically detected in these extracts, and their concentrations were very low in all experiments, never exceeding 1% of the original analyte concen-tration (data not shown).
We also conducted an experiment to estimate the minimum amount of IM at which sorption of the analytes would become problematic. To this end, we added increasing amounts of IM to solutions con-taining 100 µg/L analyte, and withdrew samples from the aquatic phase approximately after 30 min of vigorous stirring. At the end of the experiment, the IM (30 g/L) was removed from the remaining reac-tion mixture, washed with buffer solution, and subsequently extracted using ASE. The amount of ana-lyte found in these extracts was compared with the amount that had disappeared from the water phase.
This test was conducted at acidic pH to slow down the hydrolysis of MCM-TPP (which is only catalyzed by OH-, since the molecule itself is cationic) so that no significant hydrolysis would occur over the course of the experiment. This was verified by determining the amount of hydrolysis product in the samples, which never exceeded 0.81% of the starting amount of MCM-TPP.

Hydrolysis of micropollutants
43
Table 13: Recovery rates (%) of MCM-TPP in the aqueous phase with different amounts of IM
MCM-TPP Sediment
pH 4.0
Sediment
pH 6.2
Microplastics
pH 4.0
Microplastics
pH 6.2
0 mg/L IM 99 - 101 97 - 103 100 89 - 111
30 mg/L IM 78 - 79 109 - 115 95 - 103 96 - 97
300 mg/L IM 18 - 20 75 - 82 103 - 104 96 - 104
3 g/L IM 8 - 9 3 – 4 103 - 104 91 - 101
30 g/L IM 3 <1 102 - 103 85 - 101
All numbers in % of the mean concentration found with no IM. For comparison: the main experiments were carried out at pH 6.2 with 30 mg/L IM.
Table 14: Recovery rates (%) of TFX in the aqueous phase with different amounts of IM
TFX Sediment
pH 7.0
Microplastics
pH 7.0
0 mg/L IM 95 - 106 90 - 106
30 mg/L IM 94 - 111 91 - 117
300 mg/L IM 98 - 101 104 - 115
3 g/L IM 70 - 77 87 - 119
30 g/L IM 27 - 31 55 - 60
All numbers in % of the mean concentration found with no IM.
Table 15: Recovery rates (%) of oxazepam in the aqueous phase with different amounts of IM
Oxazepam Sediment
pH 7.0
Sediment
pH 9.0
Microplastics
pH 7.0
Microplastics
pH 9.0
0 mg/L IM 97 - 103 94 - 110 97 - 105 95 - 103
30 mg/L IM 93 - 110 98 - 99 93 - 104 95 - 120
300 mg/L IM 98 - 104 90 - 101 83 - 103 95 - 103
3 g/L IM 92 - 94 95 - 90 86 - 90 100 - 106
30 g/L IM 56 - 66 45 - 50 85 - 97 95 - 109
All numbers in % of the mean concentration found with no IM.
The experiment was only carried out with sediment and microplastic, because the large amounts of IM
would have made filtering the sample almost impossible when using humic acids. An overview of the
results can be seen in Table 13-12.

Hydrolysis of micropollutants
44
The strongest sorption by far was observed with MCM-TPP, although even there it required IM
amounts much larger than the ones used in the main experiments. With microplastics, it can be seen
that both at pH 4.0 and at pH 6.2, almost the entire amount of MCM-TPP was found in the liquid phase.
With sediment as IM, the effect was stronger – when 30 g/L of sediment were added, almost the entire
amount of MCM-TPP was sorbed, regardless of pH. With the sediment concentration used in the main
experiments however, sorption was only relevant at pH 4, while the main experiments were carried
out at pH 6.2.
Using ASE, most of the MCM-TPP sorbed to the sediment could be recovered: 91.8% at pH 4.0 and
87.4% at pH 6.2. This was not tested for the other analytes, since they sorbed onto the IMs to a much
smaller extent. During our project, extraction of absorbed analytes never became an important prob-
lem, but these data show that the ASE method could potentially be used in experiments in which this is
the case. With microplastics, a different extraction method might be needed, because the one applied
here involved temperatures of up to 90 °C, which is above the glass transition temperature of PET139
and might cause permanent absorption of analytes by the PET fibers. In our experiment however, no
significant sorption to the microplastic fibers occurred anyway, so no special extraction method was
required.
It may seem surprising that so little sorption occurred in our experiments with analytes such as TFX,
which has a relatively high log Kow of 4.5, or the permanently charged MCM-TPP. One must keep in
mind however that the IMs were used in concentrations of only 30 mg/L – the amount of water thus is
approximately 33,000 times larger than the amount of IM. Even if the concentration of the analyte is
100 times higher in the solid phase than it is in the water phase (Kd = 100), 99.7% of the analyte
would still be present in dissolved state.
EPI suite estimates the log Koc of TFX as 6.48 (MCI method) or 3.35 (Kow method). The former value,
combined with the organic carbon content of our used sediment (4.3%), would let us expect approxi-
mately 80% sorption onto the sediment:
106.48 =𝐾𝑑 ∙ 100
4.3
𝐾𝑑 ~ 130,000 = 𝑐𝑜𝑛𝑐𝑒𝑛𝑡𝑟𝑎𝑡𝑖𝑜𝑛 𝑖𝑛 𝑡ℎ𝑒 𝑠𝑜𝑖𝑙
𝑐𝑜𝑛𝑐𝑒𝑛𝑡𝑟𝑎𝑡𝑖𝑜𝑛 𝑖𝑛 𝑡ℎ𝑒 𝑤𝑎𝑡𝑒𝑟
𝑐 (𝑖𝑛 𝑠𝑜𝑖𝑙)
𝑐 (𝑖𝑛 𝑤𝑎𝑡𝑒𝑟)
𝑚𝑠𝑜𝑖𝑙
𝑚𝑤𝑎𝑡𝑒𝑟=
130,000
33,000 ~
4
1
If however the value of 3.35 is correct, less than 0.3 % of TFX should be sorbed onto the sediment.
𝑐 (𝑖𝑛 𝑠𝑜𝑖𝑙)
𝑐 (𝑖𝑛 𝑤𝑎𝑡𝑒𝑟)
𝑚𝑠𝑜𝑖𝑙
𝑚𝑤𝑎𝑡𝑒𝑟=
96
33,000 ~ 0.0029

Hydrolysis of micropollutants
45
5 Conclusions
IMs used in this project had little influence on the rate of hydrolysis of the employed analytes. For TFX,
no significant effect was observed with any IM. For MCM-TPP, a significant, but still limited effect on
the hydrolysis was derived, resulting in slightly increased half-lives by about 25%. For oxazepam, no
significant effect was observed, although a small decrease in the reaction rate with humic acids (and
maybe even with sediment) cannot be totally ruled out.
In a previous study conducted by the German “Umweltbundesamt (UBA)”, a significant effect on the degradation of Metilox (methyl 3-(3,5-di-tert-butyl-4-hydroxyphenyl)propanoate) was observed. This effect was quite large in the case of three specific IMs: activated sludge, carbon nanotubes (CNT), and an ion-exchange resin. In the former two cases, Metilox was degraded faster, while it was degraded much slower in the presence of the ion-exchange resin. The fast degradation in the presence of (non-sterile) activated sludge was convincingly attributed not to faster hydrolysis, but to biological degrada-tion.
CNT and ion-exchange resin both have highly structured surfaces which apparently can influence the
hydrolysis of trace compounds. However, both of them are not commonly found in the aquatic envi-
ronment in appreciable amounts. With sediment and microplastic (polystyrene) fibers as well as with
sterilized activated sludge, the study also found only minor effects of the IM on the hydrolysis of
Metilox.
Based on the results of that study as well as those of this project, we cannot exclude that the hydrolysis
of emerging contaminants could be affected by the presence of IMs, but to a rather minor extent for
particles that are commonly found in the aquatic environment. In our study, the only analyte for which
the IMs (sediment, humic acids) had an effect was a cationic phosphonium compound, which is likely
for specific electrostatic interactions with materials/particles having negatively charged sites such as
humic acids or sediments. It seems plausible that those ionic interactions might reduce the hydrolysis
rates. This is supported by the fact that the hydrolysis of MCM-TPP was not influenced by the presence
of PET microplastic fibers which do not have negatively charged sites.
In any case, commonly occurring natural particles seem to have a negligible effect on hydrolysis, while
the effect of pH is orders of magnitude larger. Even the effect of the temperatures that changes the
hydrolysis rate according to the Arrhenius equation is much more relevant.
5.1 Conclusions for future revisions of OECD guideline 111
The hydrolysis of chemicals is currently tested in purified water without the addition of any IM. The
integration of a variety of IMs would significantly increase the complexity of the tests that need to be
conducted as well as the interpretation of the results. Since the effect of IMs on the hydrolysis of mi-
cropollutants was very small in comparison to the effects of pH, we would not recommend including
testing with IM into the official OECD 111 guideline.
OECD guideline 111 already demands that individual test samples should be used for each sampling
point, rather than a single bulk sample from which aliquots are drawn. Our experiences confirm that
this is an important provision. Another requirement stated in the guideline is that half-lives and other
kinetic data should not be determined from a simple plot of the log-transformed data, but from “more
accurate kinetic model calculations”. In our experiments, we found that the difference between using
log-transformed data and using non-linear regression generally lead to very similar results, but in one
case actually made the difference between an effect being deemed significant or insignificant. We
therefore agree that kinetic parameters should not be derived from a simple logarithmic plot, but from
kinetic modelling of the untransformed data.

Hydrolysis of micropollutants
46
Demanding the inclusion of several IMs in the testing and registration process for chemicals would
likely be excessive. If IMs are to be included, it would probably be sufficient to include them in sorp-
tion tests, which are easier to conduct than hydrolysis tests in which the transformation products and
transformation pathways should be identified (see below). If no significant sorption of a chemical oc-
curs to any IM at environmentally relevant concentrations, it seems unlikely that the IMs will affect the
hydrolysis of that chemical. Further hydrolysis tests might then be considered for cases in which a
significant percentage of the chemical will be sorbed to environmentally occurring particles.
However, other changes dealing with molecule transformation during hydrolysis to the current testing
regime seem to be more useful.
1. The hydrolysis products need to be identified and quantified. It cannot be presumed that hydroly-
sis always leads to a detoxification of a compound. Thus, the hydrolysis pathway as well the hy-
drolysis products should be elucidated in order to assess the formation of potential stable hydroly-
sis products as well as estimate their ecotoxicological relevance.
2. Furthermore, the mass balances should be closed. Thus, the removed quantity should be explaina-
ble by the quantity of the formed hydrolysis products. Mass balances under OECD guideline 111
are only required when labelled test substances were used.
OECD guideline 111 already calls for the identification and quantification of hydrolysis products rep-
resenting >10% of the applied substance; but does not require considerations as to whether the occur-
ring transformations are significant. For instance, a substance is considered to be hydrolytically de-
gradable even if only minor changes to its structure occur, e.g. the cleavage of a single methyl group.
When the test substance is carcinogenic or mutagenic, these properties may not be much reduced by
such a simple structural change. In such cases, it may be more appropriate to require the inclusion of
stability tests for the transformation products as well, until complete mineralization or a significant
structural degradation is achieved.
Overall, a revision of OECD guideline 111 to include the effect of interfering particles seems to be un-
necessary based on our results and a literature review.

Hydrolysis of micropollutants
47
6 References
1. Organisation for Economic Co-operation and Development, Hydrolysis as a Function of pH. 2004.
2. Kümmerer, K., Antibiotics in the aquatic environment–a review–part I. Chemosphere 2009, 75, (4), 417-434.
3. Li, W. C., Occurrence, sources, and fate of pharmaceuticals in aquatic environment and soil. Environmental Pollution 2014,
187, 193-201.
4. Petrie, B.; Barden, R.; Kasprzyk-Hordern, B., A review on emerging contaminants in wastewaters and the environment:
Current knowledge, understudied areas and recommendations for future monitoring. Water Research 2015, 72, 3-27.
5. Luo, Y.; Guo, W.; Ngo, H. H.; Nghiem, L. D.; Hai, F. I.; Zhang, J.; Liang, S.; Wang, X. C., A review on the occurrence of
micropollutants in the aquatic environment and their fate and removal during wastewater treatment. Science of The Total
Environment 2014, 473, 619-641.
6. Loos, R.; Carvalho, R.; Antonio, D. C.; Cornero, S.; Locoro, G.; Tavazzi, S.; Paracchini, B.; Ghiani, M.; Lettieri, T.; Blaha, L.;
Jarosova, B.; Voorspoels, S.; Servaes, K.; Haglund, P.; Fick, J.; Lindberg, R. H.; Schwesig, D.; Gawlik, B. M., EU-wide monitoring survey
on emerging polar organic contaminants in wastewater treatment plant effluents. Water Research 2013, 47, (17), 6475-6487.
7. Schwarzenbach, R. P.; Escher, B. I.; Fenner, K.; Hofstetter, T. B.; Johnson, C. A.; Von Gunten, U.; Wehrli, B., The challenge
of micropollutants in aquatic systems. Science 2006, 313, (5790), 1072-1077.
8. Gerbersdorf, S. U.; Cimatoribus, C.; Class, H.; Engesser, K.-H.; Helbich, S.; Hollert, H.; Lange, C.; Kranert, M.; Metzger, J.;
Nowak, W.; Seiler, T.-B.; Steger, K.; Steinmetz, H.; Wieprecht, S., Anthropogenic Trace Compounds (ATCs) in aquatic habitats —
Research needs on sources, fate, detection and toxicity to ensure timely elimination strategies and risk management. Environment
International 2015, 79, 85-105.
9. Leahy, J. G.; Colwell, R. R., Microbial degradation of hydrocarbons in the environment. Microbiological reviews 1990, 54,
(3), 305-315.
10. Benner, J.; Helbling, D. E.; Kohler, H.-P. E.; Wittebol, J.; Kaiser, E.; Prasse, C.; Ternes, T. A.; Albers, C. N.; Aamand, J.;
Horemans, B., Is biological treatment a viable alternative for micropollutant removal in drinking water treatment processes? Water
research 2013, 47, (16), 5955-5976.
11. Meckenstock, R. U.; Elsner, M.; Griebler, C.; Lueders, T.; Stumpp, C.; Aamand, J.; Agathos, S. N.; Albrechtsen, H.-J.;
Bastiaens, L.; Bjerg, P. L., Biodegradation: updating the concepts of control for microbial cleanup in contaminated aquifers. In ACS
Publications: 2015.
12. Fenner, K.; Canonica, S.; Wackett, L. P.; Elsner, M., Evaluating pesticide degradation in the environment: blind spots and
emerging opportunities. Science 2013, 341, (6147), 752-758.
13. He, Y.; Wilson, J.; Su, C.; Wilkin, R., Review of abiotic degradation of chlorinated solvents by reactive iron minerals in
aquifers. Groundwater Monitoring & Remediation 2015, 35, (3), 57-75.
14. Tobiszewski, M.; Namieśnik, J., Abiotic degradation of chlorinated ethanes and ethenes in water. Environmental Science
and Pollution Research 2012, 19, (6), 1994-2006.
15. Mabey, W.; Mill, T., Critical review of hydrolysis of organic compounds in water under environmental conditions. Journal
of Physical and Chemical Reference Data 1978, 7, (2), 383-415.
16. European Union, Regulation concerning the Registration, Evaluation, Authorisation and Restriction of Chemicals (REACH),
establishing a European Chemicals Agency (ECHA). In 2006.
17. Georgi, A.; Trommler, U.; Reichl, A.; Kopinke, F. D., Influence of sorption to dissolved humic substances on transformation
reactions of hydrophobic organic compounds in water. Part II: Hydrolysis reactions. Chemosphere 2008, 71, (8), 1452-1460.

Hydrolysis of micropollutants
48
18. Zhang, P.; Sun, H. W.; Yu, L.; Sun, T. H., Adsorption and catalytic hydrolysis of carbaryl and atrazine on pig manure-derived
biochars: Impact of structural properties of biocharse. Journal of Hazardous Materials 2013, 244, 217-224.
19. Salvestrini, S., Diuron herbicide degradation catalyzed by low molecular weight humic acid-like compounds. Environ.
Chem. Lett. 2013, 11, (4), 359-363.
20. Saha, S.; Kulshrestha, G., Degradation of sulfosulfuron, a sulfonylurea herbicide, as influenced by abiotic factors. Journal
of agricultural and food chemistry 2002, 50, (16), 4572-4575.
21. Saha, S.; Kulshrestha, G., Hydrolysis kinetics of the sulfonylurea herbicide Sulfosulfuron. International Journal of
Environmental and Analytical Chemistry 2008, 88, (12), 891-898.
22. Jia, C.; DIAO, X.-p.; HU, J.-y., Hydrolysis and photolysis of herbicide clomazone in aqueous solutions and natural water
under abiotic conditions. Journal of Integrative Agriculture 2013, 12, (11), 2074-2082.
23. Hong, F.; Win, K. Y.; Pehkonen, S. O., Hydrolysis of terbufos using simulated environmental conditions: rates, mechanisms,
and product analysis. Journal of agricultural and food chemistry 2001, 49, (12), 5866-5873.
24. Beltran, E.; Fenet, H.; Cooper, J.; Coste, C., Kinetics of abiotic hydrolysis of isoxaflutole: influence of pH and temperature
in aqueous mineral buffered solutions. Journal of agricultural and food chemistry 2000, 48, (9), 4399-4403.
25. Beltran, E.; Fenet, H.; Cooper, J. F.; Coste, C. M., Kinetics of chemical degradation of isoxaflutole: influence of the nature
of aqueous buffers (alkanoic acid/sodium salt vs phosphate). Pest management science 2001, 57, (4), 366-371.
26. Beltrán, E.; Fenet, H.; Cooper, J.-F.; Coste, C.-M., Fate of isoxaflutole in soil under controlled conditions. Journal of
agricultural and food chemistry 2003, 51, (1), 146-151.
27. Chamberlain, E.; Shi, H.; Wang, T.; Ma, Y.; Fulmer, A.; Adams, C., Comprehensive screening study of pesticide degradation
via oxidation and hydrolysis. Journal of agricultural and food chemistry 2011, 60, (1), 354-363.
28. Białk-Bielińska, A.; Stolte, S.; Matzke, M.; Fabiańska, A.; Maszkowska, J.; Kołodziejska, M.; Liberek, B.; Stepnowski, P.;
Kumirska, J., Hydrolysis of sulphonamides in aqueous solutions. Journal of hazardous materials 2012, 221, 264-274.
29. Hirte, K.; Seiwert, B.; Schüürmann, G.; Reemtsma, T., New hydrolysis products of the beta-lactam antibiotic amoxicillin,
their pH-dependent formation and search in municipal wastewater. Water Research 2016, 88, 880-888.
30. Li, D.; Yang, M.; Hu, J.; Zhang, Y.; Chang, H.; Jin, F., Determination of penicillin G and its degradation products in a
penicillin production wastewater treatment plant and the receiving river. Water Research 2008, 42, (1), 307-317.
31. Jiang, M.; Wang, L.; Ji, R., Biotic and abiotic degradation of four cephalosporin antibiotics in a lake surface water and
sediment. Chemosphere 2010, 80, (11), 1399-1405.
32. Mitchell, S. M.; Ullman, J. L.; Teel, A. L.; Watts, R. J., Hydrolysis of amphenicol and macrolide antibiotics: Chloramphenicol,
florfenicol, spiramycin, and tylosin. Chemosphere 2015, 134, 504-511.
33. Su, G.; Letcher, R. J.; Yu, H., Organophosphate flame retardants and plasticizers in aqueous solution: pH-dependent
hydrolysis, kinetics, and pathways. Environmental science & technology 2016, 50, (15), 8103-8111.
34. Ramezani, M.; Oliver, D. P.; Kookana, R. S.; Gill, G.; Preston, C., Abiotic degradation (photodegradation and hydrolysis) of
imidazolinone herbicides. Journal of Environmental Science and Health, Part B 2008, 43, (2), 105-112.
35. Divito, C. B.; Davies, S.; Masoudi, S.; Muhoro, C. N., Relative stability of formamidine and carbamate groups in the
bifunctional pesticide formetanate hydrochloride. Journal of agricultural and food chemistry 2007, 55, (14), 5377-5382.
36. FOCUS Guidance Document on Estimating Persistence and Degradation Kinetics from Environmental Fate Studies on
Pesticides in EU Registration; 2006.

Hydrolysis of micropollutants
49
37. Maszkowska, J.; Stolte, S.; Kumirska, J.; Łukaszewicz, P.; Mioduszewska, K.; Puckowski, A.; Caban, M.; Wagil, M.;
Stepnowski, P.; Białk-Bielińska, A., Beta-blockers in the environment: Part I. Mobility and hydrolysis study. Science of the Total
Environment 2014, 493, 1112-1121.
38. Küster, A.; Bachmann, J.; Brandt, U.; Ebert, I.; Hickmann, S.; Klein-Goedicke, J.; Maack, G.; Schmitz, S.; Thumm, E.;
Rechenberg, B., Regulatory demands on data quality for the environmental risk assessment of pharmaceuticals. Regulatory
Toxicology and Pharmacology 2009, 55, (3), 276-280.
39. Rayne, S.; Forest, K., A new class of perfluorinated acid contaminants: Primary and secondary substituted perfluoroalkyl
sulfonamides are acidic at environmentally and toxicologically relevant pH values. Journal of Environmental Science and Health,
Part A 2009, 44, (13), 1388-1399.
40. Rayne, S.; Forest, K., Modeling the hydrolysis of perfluorinated compounds containing carboxylic and phosphoric acid
ester functions and sulfonamide groups. Journal of Environmental Science and Health Part A 2010, 45, (4), 432-446.
41. Michel, A.; Brauch, H.-J.; Worch, E.; Lange, F. T., Homologue specific analysis of a polyether trisiloxane surfactant in
German surface waters and study on its hydrolysis. Environmental pollution 2014, 186, 126-135.
42. Wolfe, N. L.; Zepp, R. G.; Paris, D. F.; Baughman, G. L.; Hollis, R. C., Methoxychlor and DDT degradation in water: rates and
products. Environmental Science & Technology 1977, 11, (12), 1077-1081.
43. Macalady, D. L.; Wolfe, N. L., Effects of sediment sorption on abiotic hydrolyses. 1. Organophosphorothioate esters.
Journal of Agricultural and Food Chemistry 1985, 33, (2), 167-173.
44. Li, G.-C.; GEORGE T FELBECK, J., Atrazine hydrolysis as catalyzed by humic acids. Soil Science 1972, 114, (3), 201-209.
45. Perdue, E. M., Association of organic pollutants with humic substances: partitioning equilibria and hydrolysis kinetics.
Aquatic and terrestrial humic materials 1983, 1, 441-460.
46. Walse, S. S.; Shimizu, K. D.; Ferry, J. L., Surface-catalyzed transformations of aqueous endosulfan. Environmental science &
technology 2002, 36, (22), 4846-4853.
47. Shin, J. Y.; Cheney, M. A., Abiotic dealkylation and hydrolysis of atrazine by birnessite. Environmental toxicology and
chemistry 2005, 24, (6), 1353-1360.
48. Perdue, E. M.; Wolfe, N. L., Modification of pollutant hydrolysis kinetics in the presence of humic substances.
Environmental Science & Technology 1982, 16, (12), 847-852.
49. Reiber, L. Untersuchung zum Einfluss der Partikelbindung einer lipophilen Modellsubstanz mit PBT- ähnlichen
Eigenschaften auf den hydrolytischen Abbau. Universität Potsdam, Potsdam, 2012.
50. Neihof, R. A.; Loeb, G. I., The surface charge of particulate matter in seawater. Limnology and Oceanography 1972, 17, (1),
7-16.
51. Beckett, R.; Le, N. P., The role or organic matter and ionic composition in determining the surface charge of suspended
particles in natural waters. Colloids and Surfaces 1990, 44, 35-49.
52. Han, W. W.; Yakatan, G. J.; Maness, D. D., KINETICS AND MECHANISMS OF HYDROLYSIS OF 1,4-BENZODIAZEPINES .2.
OXAZEPAM AND DIAZEPAM. Journal of Pharmaceutical Sciences 1977, 66, (4), 573-577.
53. Loffler, D.; Rombke, J.; Meller, M.; Ternes, T. A., Environmental fate of pharmaceuticals in water/sediment systems.
Environmental Science & Technology 2005, 39, (14), 5209-5218.
54. Harvey, G. R.; Boran, D. A.; Chesal, L. A.; Tokar, J. M., The structure of marine fulvic and humic acids. Marine Chemistry
1983, 12, (2-3), 119-132.
55. Senn, T.; Kingman, A. R., A review of humus and humic acids. Research Series Report 1973, (145).

Hydrolysis of micropollutants
50
56. Planeix, J.; Coustel, N.; Coq, B.; Brotons, V.; Kumbhar, P.; Dutartre, R.; Geneste, P.; Bernier, P.; Ajayan, P., Application of
carbon nanotubes as supports in heterogeneous catalysis. Journal of the American Chemical Society 1994, 116, (17), 7935-7936.
57. Serp, P.; Corrias, M.; Kalck, P., Carbon nanotubes and nanofibers in catalysis. Applied Catalysis A: General 2003, 253, (2),
337-358.
58. Azwa, Z.; Yousif, B.; Manalo, A.; Karunasena, W., A review on the degradability of polymeric composites based on natural
fibres. Materials & Design 2013, 47, 424-442.
59. Telesh, I. V., Plankton of the Baltic estuarine ecosystems with emphasis on Neva Estuary: a review of present knowledge
and research perspectives. Marine Pollution Bulletin 2004, 49, (3), 206-219.
60. Siokou-Frangou, I.; Christaki, U.; Mazzocchi, M.; Montresor, M.; Ribera d'Alcalá, M.; Vaqué, D.; Zingone, A., Plankton in
the open Mediterranean Sea: a review. Biogeosciences 2010, 7, (5), 1543-1586.
61. Prairie, J. C.; Sutherland, K. R.; Nickols, K. J.; Kaltenberg, A. M., Biophysical interactions in the plankton: A cross‐scale
review. Limnology and Oceanography: Fluids and Environments 2012, 2, (1), 121-145.
62. Chakar, F. S.; Ragauskas, A. J., Review of current and future softwood kraft lignin process chemistry. Industrial Crops and
Products 2004, 20, (2), 131-141.
63. Roberts, V.; Stein, V.; Reiner, T.; Lemonidou, A.; Li, X.; Lercher, J. A., Towards quantitative catalytic lignin
depolymerization. Chemistry-A European Journal 2011, 17, (21), 5939-5948.
64. Toledano, A.; Serrano, L.; Labidi, J., Organosolv lignin depolymerization with different base catalysts. Journal of Chemical
Technology and Biotechnology 2012, 87, (11), 1593-1599.
65. Feiler, U.; Claus, E.; Spira, D.; Heininger, P., Der Einsatz von Pflanzentests bei der Sedimentbewertung.
Umweltwissenschaften und Schadstoff-Forschung 2009, 21, (3), 264-266.
66. Schiwy, S.; Bräunig, J.; Alert, H.; Hollert, H.; Keiter, S. H., A novel contact assay for testing aryl hydrocarbon receptor
(AhR)-mediated toxicity of chemicals and whole sediments in zebrafish (Danio rerio) embryos. Environmental Science and Pollution
Research 2015, 22, (21), 16305-16318.
67. Bartlett, D. W.; Clough, J. M.; Godwin, J. R.; Hall, A. A.; Hamer, M.; Parr-Dobrzanski, B., The strobilurin fungicides. Pest
Management Science 2002, 58, (7), 649-662.
68. Balba, H., Review of strobilurin fungicide chemicals. Journal of Environmental Science and Health, Part B 2007, 42, (4),
441-451.
69. Anke, T.; Oberwinkler, F.; Steglich, W.; Schramm, G., The strobilurins-new antifungal antibiotics from the basidiomycete
Strobilurus tenacellus (Pers. ex Fr.) Sing. The Journal of antibiotics 1977, 30, (10), 806-810.
70. Becker, W. F.; Von Jagow, G.; Anke, T.; Steglich, W., Oudemansin, strobilurin A, strobilurin B and myxothiazol: new
inhibitors of the bc1 segment of the respiratory chain with an E-β-methoxyacrylate system as common structural element. FEBS
Letters 1981, 132, (2), 329-333.
71. Godwin, J.; Young, J.; Hart, C., ICIA5504: effects on development of cereal pathogens. 1994.
72. Chen, X.; Xu, J.; Liu, X.; Tao, Y.; Pan, X.; Zheng, Y.; Dong, F., Simultaneous determination of trifloxystrobin and
trifloxystrobin acid residue in rice and soil by a modified quick, easy, cheap, effective, rugged, and safe method using ultra high
performance liquid chromatography with tandem mass spectrometry. Journal of Separation Science 2014, 37, (13), 1640-1647.
73. Schirra, M.; D'aquino, S.; Palma, A.; Angioni, A.; Cabras, P.; Migheli, Q., Residues of the quinone outside inhibitor fungicide
trifloxystrobin after postharvest dip treatments to control Penicillium spp. on citrus fruit. Journal of food protection 2006, 69, (7),
1646-1652.
74. Cao, M.; Li, S.; Wang, Q.; Wei, P.; Liu, Y.; Zhu, G.; Wang, M., Track of fate and primary metabolism of trifloxystrobin in rice
paddy ecosystem. Science of The Total Environment 2015, 518–519, 417-423.

Hydrolysis of micropollutants
51
75. Bertelsen, J.; De Neergaard, E.; Smedegaard‐Petersen, V., Fungicidal effects of azoxystrobin and epoxiconazole on
phyllosphere fungi, senescence and yield of winter wheat. Plant Pathology 2001, 50, (2), 190-205.
76. The European Commission, Commission Implementing Regulation (EU) No 540/2011. In 2011.
77. The European Commission, Commission Implementing Regulation (EU) 2016/950 In 2016.
78. H.J. Liu, X. Z., H.L. Wang, B.Y. Guo, L. Zheng, J.Z.H. Li, Hydrolysis and Photodegradation of Trifloxystrobin in Aqueous
Solution. Asian J. Chem. 2014, 26, (10), 2834-2838.
79. de Melo Abreu, S.; Caboni, P.; Cabras, P.; Garau, V. L.; Alves, A., Validation and global uncertainty of a liquid
chromatographic with diode array detection method for the screening of azoxystrobin, kresoxim-methyl, trifloxystrobin,
famoxadone, pyraclostrobin and fenamidone in grapes and wine. Analytica Chimica Acta 2006, 573, 291-297.
80. Becker, K. B., Cycloalkenes by intramolecular wittig reaction. Tetrahedron 1980, 36, (12), 1717-1745.
81. Balema, V. P.; Wiench, J. W.; Pruski, M.; Pecharsky, V. K., Mechanically Induced Solid-State Generation of Phosphorus
Ylides and the Solvent-Free Wittig Reaction. Journal of the American Chemical Society 2002, 124, (22), 6244-6245.
82. Maryanoff, B. E.; Reitz, A. B., The Wittig olefination reaction and modifications involving phosphoryl-stabilized carbanions.
Stereochemistry, mechanism, and selected synthetic aspects. Chemical Reviews 1989, 89, (4), 863-927.
83. Brophy, J.; Gallagher, M., Phosphonium salts. I. The alkaline hydrolysis of some bis-phosphonium salts. Australian Journal
of Chemistry 1969, 22, (7), 1385-1398.
84. Corfield, J.; De'Ath, N.; Trippett, S., The alkaline hydrolysis of sterically crowded phosphonium salts. Journal of the
Chemical Society C: Organic 1971, 1930-1933.
85. Schnell, A.; Tebby, J. C., Mechanism of hydrolysis of phosphonium salts and ylides. Journal of the Chemical Society, Perkin
Transactions 1 1977, (16), 1883-1886.
86. Byrne, P. A.; Ortin, Y.; Gilheany, D. G., First ever observation of the intermediate of phosphonium salt and ylide hydrolysis:
P-hydroxytetraorganophosphorane. Chemical Communications 2015, 51, (6), 1147-1150.
87. US EPA, Estimation Programs Interface Suite for Microsoft Windows, v 4.11. In Washington DC, USA, 2012.
88. Hass, U.; Duennbier, U.; Massmann, G., Occurrence and distribution of psychoactive compounds and their metabolites in
the urban water cycle of Berlin (Germany). Water Research 2012, 46, (18), 6013-6022.
89. Kosjek, T.; Perko, S.; Zupanc, M.; Hren, M. Z.; Dragicevic, T. L.; Zigon, D.; Kompare, B.; Heath, E., Environmental
occurrence, fate and transformation of benzodiazepines in water treatment. Water Research 2012, 46, (2), 355-368.
90. van der Aa, M.; Bijlsma, L.; Emke, E.; Dijkman, E.; van Nuijs, A. L. N.; van de Ven, B.; Hernandez, F.; Versteegh, A.; de
Voogt, P., Risk assessment for drugs of abuse in the Dutch watercycle. Water Research 2013, 47, (5), 1848-1857.
91. Wu, M. H.; Xiang, J. J.; Que, C. J.; Chen, F. F.; Xu, G., Occurrence and fate of psychiatric pharmaceuticals in the urban
water system of Shanghai, China. Chemosphere 2015, 138, 486-493.
92. Huerta, B.; Margiotta-Casaluci, L.; Rodriguez-Mozaz, S.; Scholze, M.; Winter, M. J.; Barcelo, D.; Sumpter, J. P., ANTI-
ANXIETY DRUGS AND FISH BEHAVIOR: ESTABLISHING THE LINK BETWEEN INTERNAL CONCENTRATIONS OF OXAZEPAM AND
BEHAVIORAL EFFECTS. Environmental Toxicology and Chemistry 2016, 35, (11), 2782-2790.
93. Brodin, T.; Fick, J.; Jonsson, M.; Klaminder, J., Dilute concentrations of a psychiatric drug alter behavior of fish from
natural populations. Science 2013, 339, (6121), 814-815.
94. Han, W. W.; Yakatan, G. J.; Maness, D. D., KINETICS AND MECHANISMS OF HYDROLYSIS OF 1,4-BENZODIAZEPINES .1.
CHLORDIAZEPOXIDE AND DEMOXEPAM. Journal of Pharmaceutical Sciences 1976, 65, (8), 1198-1204.

Hydrolysis of micropollutants
52
95. Han, W. W.; Yakatan, G. J.; Maness, D. D., KINETICS AND MECHANISMS OF HYDROLYSIS OF 1,4-BENZODIAZEPINES-3 -
NITRAZEPAM. Journal of Pharmaceutical Sciences 1977, 66, (6), 795-798.
96. Calisto, V.; Domingues, M. R. M.; Esteves, V. I., Photodegradation of psychiatric pharmaceuticals in aquatic environments
- Kinetics and photodegradation products. Water Research 2011, 45, (18), 6097-6106.
97. Hansch, C.; Leo, A.; Hoekman, D., Exploring QSAR: Hydrophobic, electronic, and steric constants. American Chemical
Society: Washington, DC, 1995; Vol. 2.
98. Samuel H. Yalkowsky, Y. H., Parijat Jain, Handbook of Aqueous Solubility Data - Second Edition. CRC Press: Boca Ranton,
2010.
99. Organisation for Economic Co-operation and Development, Aerobic and Anaerobic Transformation in Aquatic Sediment
Systems. In 2002.
100. Asselman, N. E. M., Suspended sediment dynamics in a large drainage basin: the River Rhine. Hydrological Processes 1999,
13, (10), 1437-1450.
101. Schulten, H.-R.; Schnitzer, M., Three-dimensional models for humic acids and soil organic matter. Naturwissenschaften
1995, 82, (11), 487-498.
102. Paludan, C.; Jensen, H. S., Sequential extraction of phosphorus in freshwater wetland and lake sediment: significance of
humic acids. Wetlands 1995, 15, (4), 365-373.
103. Sholkovitz, E.; Boyle, E.; Price, N., The removal of dissolved humic acids and iron during estuarine mixing. Earth and
Planetary Science Letters 1978, 40, (1), 130-136.
104. Opsahl, S.; Benner, R., Distribution and cycling of terrigenous dissolved organic matter in the ocean. Nature 1997, 386,
(6624), 480.
105. Malcolm, R. L., The uniqueness of humic substances in each of soil, stream and marine environments. Analytica Chimica
Acta 1990, 232, 19-30.
106. Schulten, H.-R.; Schnitzer, M., Chemical model structures for soil organic matter and soils. Soil science 1997, 162, (2), 115-
130.
107. Malcolm, R. L.; MacCarthy, P., Limitations in the use of commercial humic acids in water and soil research. Environmental
science & technology 1986, 20, (9), 904-911.
108. Chiou, C. T.; Kile, D. E.; Brinton, T. I.; Malcolm, R. L.; Leenheer, J. A.; MacCarthy, P., A comparison of water solubility
enhancements of organic solutes by aquatic humic materials and commercial humic acids. Environmental science & technology
1987, 21, (12), 1231-1234.
109. Carpenter, E. J.; Smith, K., Plastics on the Sargasso Sea surface. Science 1972, 175, (4027), 1240-1241.
110. Colton, J. B.; Knapp, F. D.; Burns, B. R., Plastic particles in surface waters of the northwestern Atlantic. Science 1974, 185,
(4150), 491-497.
111. Thompson, R. C.; Olsen, Y.; Mitchell, R. P.; Davis, A.; Rowland, S. J.; John, A. W.; McGonigle, D.; Russell, A. E., Lost at sea:
where is all the plastic? Science 2004, 304, (5672), 838-838.
112. Andrady, A. L., Microplastics in the marine environment. Marine pollution bulletin 2011, 62, (8), 1596-1605.
113. Cole, M.; Lindeque, P.; Halsband, C.; Galloway, T. S., Microplastics as contaminants in the marine environment: a review.
Marine pollution bulletin 2011, 62, (12), 2588-2597.
114. Zarfl, C.; Fleet, D.; Fries, E.; Galgani, F.; Gerdts, G.; Hanke, G.; Matthies, M., Microplastics in oceans. Marine Pollution
Bulletin 2011, 62, 1589-1591.

Hydrolysis of micropollutants
53
115. Liebezeit, G.; Dubaish, F., Microplastics in beaches of the East Frisian islands Spiekeroog and Kachelotplate. Bull. Environ.
Contam. Toxicol. 2012, 89, (1), 213-217.
116. Wright, S. L.; Thompson, R. C.; Galloway, T. S., The physical impacts of microplastics on marine organisms: a review.
Environmental Pollution 2013, 178, 483-492.
117. Law, K. L.; Thompson, R. C., Microplastics in the seas. Science 2014, 345, (6193), 144-145.
118. Wagner, M.; Scherer, C.; Alvarez-Muñoz, D.; Brennholt, N.; Bourrain, X.; Buchinger, S.; Fries, E.; Grosbois, C.; Klasmeier, J.;
Marti, T., Microplastics in freshwater ecosystems: what we know and what we need to know. Environmental Sciences Europe 2014,
26, (1), 12.
119. Barboza, L. G. A.; Gimenez, B. C. G., Microplastics in the marine environment: current trends and future perspectives.
Marine pollution bulletin 2015, 97, (1), 5-12.
120. Duis, K.; Coors, A., Microplastics in the aquatic and terrestrial environment: sources (with a specific focus on personal care
products), fate and effects. Environmental Sciences Europe 2016, 28, (1), 2.
121. Wang, J.; Tan, Z.; Peng, J.; Qiu, Q.; Li, M., The behaviors of microplastics in the marine environment. Marine
environmental research 2016, 113, 7-17.
122. Shim, W. J.; Thomposon, R. C., Microplastics in the Ocean. Archives of Environmental Contamination and Toxicology 2015,
69, (3), 265-268.
123. Klein, S.; Worch, E.; Knepper, T. P., Occurrence and spatial distribution of microplastics in river shore sediments of the
Rhine-Main area in Germany. Environmental science & technology 2015, 49, (10), 6070-6076.
124. Claessens, M.; Van Cauwenberghe, L.; Vandegehuchte, M. B.; Janssen, C. R., New techniques for the detection of
microplastics in sediments and field collected organisms. Marine pollution bulletin 2013, 70, (1), 227-233.
125. Thompson, R. C., Microplastics in the Marine Environment: Sources, Consequences and Solutions. In Marine
Anthropogenic Litter, Bergmann, M.; Gutow, L.; Klages, M., Eds. Springer International Publishing: Cham, 2015; pp 185-200.
126. Murphy, F.; Ewins, C.; Carbonnier, F.; Quinn, B., Wastewater treatment works (WwTW) as a source of microplastics in the
aquatic environment. Environmental science & technology 2016, 50, (11), 5800-5808.
127. Pirc, U.; Vidmar, M.; Mozer, A.; Kržan, A., Emissions of microplastic fibers from microfiber fleece during domestic washing.
Environmental Science and Pollution Research 2016, 23, (21), 22206-22211.
128. Fendall, L. S.; Sewell, M. A., Contributing to marine pollution by washing your face: microplastics in facial cleansers.
Marine pollution bulletin 2009, 58, (8), 1225-1228.
129. Bakir, A.; Rowland, S. J.; Thompson, R. C., Enhanced desorption of persistent organic pollutants from microplastics under
simulated physiological conditions. Environmental Pollution 2014, 185, 16-23.
130. Phuong, N. N.; Zalouk-Vergnoux, A.; Poirier, L.; Kamari, A.; Châtel, A.; Mouneyrac, C.; Lagarde, F., Is there any consistency
between the microplastics found in the field and those used in laboratory experiments? Environmental Pollution 2016, 211, 111-
123.
131. Andrady, A. L.; Neal, M. A., Applications and societal benefits of plastics. Philosophical Transactions of the Royal Society B:
Biological Sciences 2009, 364, (1526), 1977-1984.
132. Weltje, G. J.; von Eynatten, H., Quantitative provenance analysis of sediments: review and outlook. Sedimentary Geology
2004, 171, (1), 1-11.
133. Boulton, G., Boulder shapes and grain‐size distributions of debris as indicators of transport paths through a glacier and till
genesis. Sedimentology 1978, 25, (6), 773-799.
134. The European Commission, Review report for the active substance picoxystrobin. In 2003.

Hydrolysis of micropollutants
54
135. The European Commission, Review report for the active substance trifloxystrobin. 2003.
136. Kemmer, G.; Keller, S., Nonlinear least-squares data fitting in Excel spreadsheets. Nat. Protocols 2010, 5, (2), 267-281.
137. Brown, A. M., A step-by-step guide to non-linear regression analysis of experimental data using a Microsoft Excel
spreadsheet. Computer Methods and Programs in Biomedicine 2001, 65, (3), 191-200.
138. Dawber, J. G.; Tebby, J. C.; Waite, A. A. C., Kinetics of alkaline hydrolysis of quaternary phosphonium salts. The influence
of aprotic solvents on the hydrolysis of ethyl(phenyl)phosphonium iodides. Journal of the Chemical Society, Perkin Transactions 2
1983, (9), 1923-1925.
139. Chen, D.; Zachmann, H. G., Glass transition temperature of copolyesters of PET, PEN and PHB as determined by dynamic
mechanical analysis. Polymer 1991, 32, (9), 1612-1621.