
Establishing Data Collection Procedures Equivalence in International Business Research
Upload
independentCategory
view
0download
0
C. R. Mecanique 337 (2009) 373–384
Combustion for aerospace propulsion
Simultaneous measurements of equivalence ratio and flame structurein multipoint injectors using PLIF
Mikaël Orain ∗, Frédéric Grisch, Eric Jourdanneau, Bjorn Rossow, Christian Guin,Brigitte Trétout
Office national d’études et de recherches aérospatiales, chemin de la Hunière, 91761 Palaiseau cedex, France
Available online 21 July 2009
Abstract
Simultaneous measurements of PLIF-kerosene and PLIF-OH have been successfully performed in a multipoint injection systemfor various overall equivalence ratio, air inlet temperature between 480 and 730 K and pressure up to 2.2 MPa. Single shot 2D-maps of the spatial distribution of kerosene vapour and OH radical in the combustor have been recorded with good signal-to-noiseratio. Results show that depending on the split between the pilot and the main injectors, the flame front exhibits a single ora double structure. Good spatial correlation between the repartition of the kerosene vapour and the position of the flame front wasobserved; in particular, no “dark zone” is observed between the fuel and the flame front. As temperature and pressure increase,fuel evaporation improves and the spatial distribution of OH radical becomes more homogeneous in the combustor, suggestinga partially-distributed combustion. To cite this article: M. Orain et al., C. R. Mecanique 337 (2009).© 2009 Académie des sciences. Published by Elsevier Masson SAS. All rights reserved.
Résumé
Mesures simultanées de richesse et de structure de flamme en sortie d’injecteur multipoint par PLIF. Des mesures PLIF-kérosène et PLIF-OH ont été réalisées en sortie d’injecteur multipoint pour différentes conditions de richesse, avec une températured’air entre 480 et 730 K, à des pressions jusqu’à 2.2 MPa. Des images instantanées des distributions spatiales de kérosène et duradical OH ont été enregistrées dans le foyer de combustion avec un bon rapport signal-à-bruit. Les résultats montrent qu’enfonction de la répartition entre les injecteurs pilote et principal, le front de flamme possède une structure simple ou double. Unebonne corrélation spatiale est observée entre les distributions de kérosène vapeur et la position du front de flamme. En particulier,aucune zone sans signal de fluorescence n’est observée entre le carburant et le front de flamme. Lorsque la température ou lapression augmente, l’évaporation du carburant s’améliore et la répartition spatiale de du radical OH devient plus homogène dansle foyer, suggérant une combustion partiellement distribuée. Pour citer cet article : M. Orain et al., C. R. Mecanique 337 (2009).© 2009 Académie des sciences. Published by Elsevier Masson SAS. All rights reserved.
Keywords: Combustion; Planar laser-induced fluorescence; Aromatics; Kerosene–air combustion; Flame structure; High pressure
Mots-clés : Combustion ; Imagerie de fluorescence induite par laser ; Aromatiques ; Combustion kérosène–air ; Structure de flamme ; Hautepression
* Corresponding author.E-mail addresses: [email protected] (M. Orain), [email protected] (F. Grisch), [email protected] (E. Jourdanneau),
[email protected] (B. Rossow), [email protected] (C. Guin), [email protected] (B. Trétout).
1631-0721/$ – see front matter © 2009 Académie des sciences. Published by Elsevier Masson SAS. All rights reserved.doi:10.1016/j.crme.2009.06.019

374 M. Orain et al. / C. R. Mecanique 337 (2009) 373–384
1. Introduction
Increasingly stringent regulations on pollutant emissions, such as NOx, COx and soot, require one to improvecombustion efficiency and overall operability of kerosene-fuelled aeronautical gas turbines. Among key parameterslikely to fulfil these goals, the injection system is one of them where substantial improvements can still be achieved. Itis well known that atomisation of liquid jets (shear-coaxial injectors) occurs via different physical processes comparedto break-up of liquid sheets (film injectors), which often results in different droplet size, velocity and density [1,2].Therefore, optimising the atomisation of liquid fuel into fine droplets and their subsequent evaporation is of greatimportance for fuel spatial distribution within the combustor [3,4]. Efficient mixing between preheated combustionair and fuel vapour generated by droplet evaporation is also crucial to combustion efficiency, firstly, in terms ofpollutant emissions which can be greatly reduced if the spatial distribution of the air/fuel mixture in the combustor ishomogeneous with lean equivalence ratio. This yields a lower flame temperature (1500–1800 K), hence lower NOxemissions, and the absence of fuel-rich pockets leads to reduced soot formation. Second, in terms of combustioninstabilities which are known to partly depend on temporal and spatial inhomogeneities of the air/fuel mixture inthe combustion chamber. Such instabilities are naturally not compatible with standards of reliability, durability anddrivability required for aircrafts engines, and, therefore, must be avoided.
Over the last two decades, intensive research has been dedicated to improve existing injection systems and toimagine innovative designs. This has led to new concepts like multipoint, LP (Lean Premixed) and LPP (Lean Pre-mixed Prevaporised) injectors which contribute to matching the targeted goals of future regulations on pollutantsemissions [5]. The principle of these injectors is to atomise the liquid fuel into small droplets which evaporate toa large extent, and mix the subsequent fuel vapour with air in a prevaporising/premixing duct, in order to obtain afairly homogeneous air/fuel mixture before combustion occurs. Many experiments have used laser-based techniquesto determine the influence of parameters like droplet size and velocity, air temperature, fuel and air flowrates on theperformances of such injectors [6,7]. However, these studies were mainly focused on the spatial distribution of liq-uid phase in the combustor, and the evolution of droplet size at different locations from the injector exit was usedto estimate fuel evaporation [8,9]. Indeed, only few experiments were performed to characterise fuel vapour phase[10–12]. In addition, results were typically obtained with surrogate fuels or added tracers which were not necessarilyrepresentative of typical fuels used in aircraft engines (i.e. kerosene). Therefore, it may be that the conclusions drawnfrom these experiments were biased by the type of fuel they used, because of the different evaporation behaviourand combustion processes of surrogates or tracers compared to that of real fuels. Only very few examples of stud-ies performed with laser-based diagnostics directly applied to kerosene vapour are available in the literature [13,14].Unfortunately, these results were only qualitative, because kerosene spectroscopy was not properly established de-spite the pioneering work of Löfström et al. [15]. Arnold et al. [16] also applied planar laser-induced fluorescence(PLIF) to fuel-oil detection in gas turbines for temperature between 360 and 486 ◦C at atmospheric pressure. The au-thors have indicated that PLIF could enable equivalence ratio measurements within a 25% error. Recently, Barangeret al. [17] have thoroughly investigated the photophysics of kerosene for various conditions of temperature, pres-sure and oxygen molar fraction, with a 266 nm excitation wavelength. Dependence of kerosene fluorescence on theabove parameters was measured and the molecular species responsible for this fluorescence were identified. Usingthe spectroscopic results of Baranger et al. [17], Orain et al. [18] have derived a quantitative strategy for measur-ing local equivalence ratio in kerosene-fuelled gas turbines using PLIF-kerosene. The technique was applied to aLPP injector operating with jet A1 fuel at atmospheric pressure for non-reactive conditions, at temperature between500 and 730 K and overall equivalence ratio in the range 0.12–0.44. The influence of these parameters on the spa-tial distribution of the local equivalence ratio in the combustor was investigated. However, these experiments wereperformed without combustion, at low pressure and, therefore, there was a need to assess the capability of the tech-nique to measure fuel vapour concentration at high pressure in firing conditions. Characterising the performance ofaircraft injectors also requires the determination of the flame structure and flame reaction rate, which gives informa-tion about combustion efficiency depending on operating conditions. This can be classically performed using PLIFapplied to OH radical [19] and the technique has already been applied to pressure larger than 1.0 MPa [20,21]. How-ever, it is interesting to determine the spatial and temporal correlation between fuel vapour distribution and flamestructure. Such information can be obtained by means of simultaneous measurements of kerosene vapour and OHradical in the combustor, and this can be used to evaluate the influence of fuel concentration on local flame reactionrate.

M. Orain et al. / C. R. Mecanique 337 (2009) 373–384 375
The goal of the present experiments was to combine PLIF-kerosene and PLIF-OH in order to measure simul-taneously local equivalence ratio and spatial distribution of OH radical in a fired high-pressure combustor op-erating with jet A1 fuel. The techniques were successfully applied at temperature between 480 and 730 K andpressure up to 2.2 MPa. The remaining paper comprises four sections. The next section briefly recalls the pho-tophysics of aromatics fluorescence for application to kerosene-fuelled combustors. The second section presentsthe combustor facility and describes the optical set-up. In the third section, the technique is subsequently appliedto a high-pressure kerosene-fuelled multipoint injector. Finally, the paper ends with a summary of the main find-ings.
2. Planar laser-induced fluorescence for kerosene vapour measurements
In a typical PLIF experiment, the flow is illuminated by a laser sheet which wavelength is tuned to excite a par-ticular transition of a molecular tracer, which can be a species naturally-produced in the flow (e.g. CH, OH, C2,CO, . . . ) or seeded into the flow (e.g. I2, O2, NO, aldehydes, ketones, aromatics, . . . ). A fraction of the moleculesin the lower energy level absorbs the incident light and is promoted to a higher energy level. Some of the excitedmolecules photodissociate or return to equilibrium, either by emitting photons or by transferring the excess of energythrough non-radiative decay processes (collisional quenching, intersystem crossing, internal conversion or vibrationalrelaxation). For a weak laser excitation, the fluorescence signal intensity can generally be expressed as [19]:
I = ηoptE
hc/λVcNabsσ(λ,T )
kf
kf + knr + ∑q kqXq
(1)
where ηopt is the overall efficiency of the collection optics, E is the laser fluence (J/cm2), hc/λ is the energy (J)of a photon at the excitation wavelength λ and Vc is the collection volume (cm3). Quantities that may vary withgas dynamic parameters (temperature T , total pressure P , and species composition) are Nabs, the number density ofabsorbing molecules (cm−3); σ , the molecular absorption cross section of the molecule (cm2); kf, the spontaneousemission rate; knr, the upper-level decay rate owing to collisionless processes (such as intersystem crossing, photodis-sociation or vibrational relaxation) and kq , the collisional-quenching rate. Xq is defined as the molar fraction of thequenching species. In the case of kerosene, which is mainly composed of aliphatic and aromatic molecules, fluores-cence typically arises from the excitation of aromatics [17]. It is well known from the literature that oxygen is themain quencher for aromatics fluorescence [22,23] and that other species like H2O, CO or CO2 have little influence.Therefore Xq will be denoted as XO2 in the following.
The expression of Eq. (1) can be used to derive strategies for imaging quantities such as equivalence ratio andtemperature, which completely characterise spray evaporation, only in the mixing regions of non-burning and burningsprays, upstream from the flame front. In these specific regions, oxygen can be considered as the main quencher ofkerosene fluorescence and, therefore, Eq. (1) can be applied. Visualisation of mixing process requires simultaneous2D-imaging of fuel and oxygen concentrations in the flow with a temporal resolution faster than the timescales ofmixing and chemical reaction. Simply, the fluorescence signal is seen to be a specific function of T , XO2 and Xfuelfor a particular excitation wavelength. Detection of fluorescence from aromatics with one excitation wavelength overtwo specific spectral ranges can provide dual-parameter imaging, yielding for example equivalence ratio in additionto temperature. Collection of kerosene and di-aromatics fluorescence signals on two separate ICCD cameras withappropriate spectral filters may be one of the possibilities because of their different temperature and oxygen depen-dencies. Using experimentally-determined behaviour of kerosene fluorescence [17], along with a calibration point ina reference flow where thermodynamic parameters are well known, an iterative processing routine of both instanta-neous fluorescence signals, combined with the closure relation for species composition (i.e., Xfuel + XO2 + XN2 = 1)is then used to determine the desired quantities. Note that this data reduction implies that the ratio between mono-aromatics and di-aromatics remains constant during the experiments. This assumption remains valid for temperaturesup to 1100–1300 K, where kerosene pyrolysis may be observed.
Additional spectroscopic measurements to those of Baranger et al. [17] have been performed in a test cell athigh temperature and pressure. For instance, Fig. 1 represents the evolution of integrated fluorescence from di-aromatics with temperature and pressure under N2 atmosphere. As can be seen, fluorescence intensity decreasesby about 55% as temperature increases from 450 to 700 K, which corresponds to the range of interest for PLIFmeasurements in gas turbines. This indicates that temperature has some influence on di-aromatics fluorescence,

376 M. Orain et al. / C. R. Mecanique 337 (2009) 373–384
Fig. 1. Evolution of di-aromatics integrated fluorescence in N2 with temperature at atmospheric pressure (a) and with pressure for two tempera-tures (b).
although the signal reduction with temperature remains somehow limited. Fig. 1a shows that fluorescence fromdi-aromatics increases with pressure for different temperatures, and the gradient is stronger below 0.5 MPa. To-gether with results from Fig. 1a, this allows one to estimate the evolution of fluorescence signal with tempera-ture and pressure for a given concentration of kerosene vapour. For example, fluorescence intensity per moleculeis reduced by a factor of 2 as temperature and pressure change from (450 K, 0.5 MPa) to (700 K, 2.0 MPa).This indicates that fluorescence signals remain easily detectable at high temperature and pressure, and gives usconfidence about the applicability of PLIF-kerosene to operating conditions representative of aeronautical gas tur-bines.
3. Experimental set-up
3.1. Combustor facility
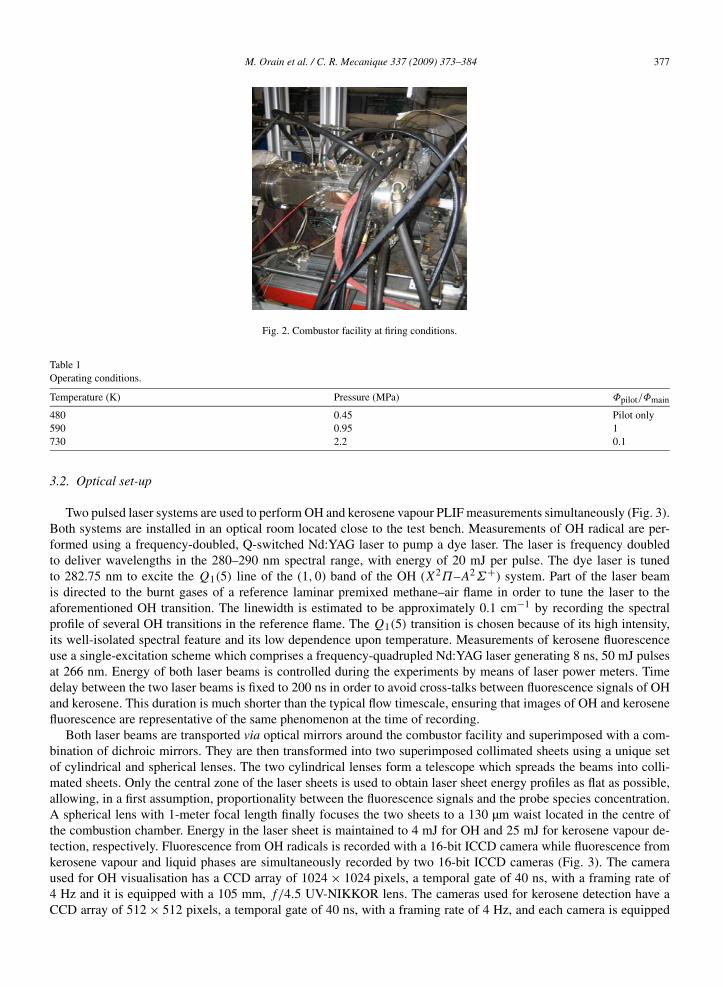
The combustor used in the experiments is represented in Fig. 2. It is connected to the so-called “M1 test bench”,which is the high temperature–high pressure combustion facility from ONERA-Palaiseau dedicated to the investiga-tion of aircraft and helicopter injectors under real operating conditions. This bench consists of a heat exchanger whichcan preheat air up to 900 K for air flowrates up to 1 kg/s or up to 800 K for air flowrates up to 4 kg/s. Preheatedair is injected into the combustor together with liquid kerosene via two injectors: a single pilot injector is located onthe combustor axis and it is used to stabilise the flame whereas a multipoint main injector is located at larger radialdistance. Fuel flowrate is split between the two injectors and the ratio between equivalence ratio from the pilot and themain injector (Φpilot/Φmain) lies between 0.1 and 1, except for a condition where only the pilot injector is used (seeTable 1). The combustor comprises a water-cooled visualisation sector which is equipped with three optical accessesfor laser measurements. Optical windows are made of UV-silica. One is used for laser access and the two others fordetecting fluorescence from kerosene and OH radical. Optical accesses are specifically designed so that fluorescencecan be collected directly at the outlet of the injector. The outlet of the combustor is equipped with a sonic throttlewhich can be partly obstructed by a water-cooled needle in order to control the pressure inside the combustor. Finally,exhaust gases are collected by a fan. Air inlet temperature varies between 480 and 730 K and pressure inside thecombustor is in the range 0.45–2.2 MPa.
Table 1 summarises the operating conditions presented in this article. In the following, Φpilot is the equivalenceratio of the pilot injector and Φmain refers to the equivalence ratio of the main injector.
M. Orain et al. / C. R. Mecanique 337 (2009) 373–384 377
Fig. 2. Combustor facility at firing conditions.
Table 1Operating conditions.
Temperature (K) Pressure (MPa) Φpilot/Φmain
480 0.45 Pilot only590 0.95 1730 2.2 0.1
3.2. Optical set-up
Two pulsed laser systems are used to perform OH and kerosene vapour PLIF measurements simultaneously (Fig. 3).Both systems are installed in an optical room located close to the test bench. Measurements of OH radical are per-formed using a frequency-doubled, Q-switched Nd:YAG laser to pump a dye laser. The laser is frequency doubledto deliver wavelengths in the 280–290 nm spectral range, with energy of 20 mJ per pulse. The dye laser is tunedto 282.75 nm to excite the Q1(5) line of the (1,0) band of the OH (X2Π–A2Σ+) system. Part of the laser beamis directed to the burnt gases of a reference laminar premixed methane–air flame in order to tune the laser to theaforementioned OH transition. The linewidth is estimated to be approximately 0.1 cm−1 by recording the spectralprofile of several OH transitions in the reference flame. The Q1(5) transition is chosen because of its high intensity,its well-isolated spectral feature and its low dependence upon temperature. Measurements of kerosene fluorescenceuse a single-excitation scheme which comprises a frequency-quadrupled Nd:YAG laser generating 8 ns, 50 mJ pulsesat 266 nm. Energy of both laser beams is controlled during the experiments by means of laser power meters. Timedelay between the two laser beams is fixed to 200 ns in order to avoid cross-talks between fluorescence signals of OHand kerosene. This duration is much shorter than the typical flow timescale, ensuring that images of OH and kerosenefluorescence are representative of the same phenomenon at the time of recording.
Both laser beams are transported via optical mirrors around the combustor facility and superimposed with a com-bination of dichroic mirrors. They are then transformed into two superimposed collimated sheets using a unique setof cylindrical and spherical lenses. The two cylindrical lenses form a telescope which spreads the beams into colli-mated sheets. Only the central zone of the laser sheets is used to obtain laser sheet energy profiles as flat as possible,allowing, in a first assumption, proportionality between the fluorescence signals and the probe species concentration.A spherical lens with 1-meter focal length finally focuses the two sheets to a 130 µm waist located in the centre ofthe combustion chamber. Energy in the laser sheet is maintained to 4 mJ for OH and 25 mJ for kerosene vapour de-tection, respectively. Fluorescence from OH radicals is recorded with a 16-bit ICCD camera while fluorescence fromkerosene vapour and liquid phases are simultaneously recorded by two 16-bit ICCD cameras (Fig. 3). The cameraused for OH visualisation has a CCD array of 1024 × 1024 pixels, a temporal gate of 40 ns, with a framing rate of4 Hz and it is equipped with a 105 mm, f/4.5 UV-NIKKOR lens. The cameras used for kerosene detection have aCCD array of 512 × 512 pixels, a temporal gate of 40 ns, with a framing rate of 4 Hz, and each camera is equipped

378 M. Orain et al. / C. R. Mecanique 337 (2009) 373–384
Fig. 3. Optical setup for the simultaneous detection of OH radical and kerosene vapour fluorescence.
Fig. 4. Fluorescence intensity emitted by kerosene vapour and droplets in the combustor (a), example of the removal of droplet fluorescenceintensity (b), 480 K and 0.45 MPa (pilot only).
with a f = 94 mm, achromatic UV lens. For OH measurements, the camera has a combination of colored glass filters(WG 295 and UG 5 from Schott) and an interferential filter centred at 310 nm (FWHM = 5.6 nm). For kerosenemeasurements, the first camera is equipped with a combination of colored glass filters (WG 280 from Schott and acustom-made bandpass filter collecting fluorescence in the range 260–420 nm) to collect the whole fluorescence ofkerosene (i.e. fluorescence from mono- and di-aromatics), whereas the second camera uses a combination of coloredglass filters (WG 305 from Schott and a custom-made bandpass filter collecting fluorescence in the range 260–420 nm)to collect fluorescence from di-aromatics only. Each camera is interfaced to a personal computer used to control thecamera and to record images.
Fig. 4a presents a typical instantaneous raw image of kerosene fluorescence after illumination of the flow in thecombustor by the laser sheet from top to bottom. The red dots, representing large intensities, correspond to droplets,while fuel vapour is displayed with a false colorscale. The gain of both ICCD cameras is adjusted to keep the energyrecorded by the array detector proportional to the fluorescence signal issued from the liquid and gas phases, whichprevents the ICCD cameras from local saturation and blooming induced by the liquid kerosene fluorescence. For each
M. Orain et al. / C. R. Mecanique 337 (2009) 373–384 379
flow condition, 200 single-shot images are acquired with each ICCD camera and the maps of mean fluorescence (ei-ther from kerosene or OH radical) presented in this article result from the average over these 200 single-shots. Rawfluorescence images are corrected for background luminosity, non-uniformities in the collection optics and inhomo-geneity in the laser sheet profile. An average background image is acquired with the laser on in hot air. Subtractionof this image from the fluorescence image accounts for laser scattering and other background luminosity. An averagebackground image is also acquired with the laser off and the flame on in order to remove chemiluminescence emissionfrom the flame. Finally, with the present experiments, it is necessary to add an extra routine which takes account ofthe presence of kerosene droplets in the flow. Due to the difference of density between the liquid and vapour phasesof kerosene, fluorescence signals are significantly larger for the liquid phase. As a result, there is a strong intensitygradient between a droplet and its surrounding vapour. We take advantage of this feature to identify the location ofdroplets and to eliminate the fluorescence signal from the liquid phase which is initially set to zero. The fluorescencesignal at the droplet location is then interpolated over the droplet area using the value of fluorescence intensity fromkerosene vapour at the first pixel around the droplet both in the radial and axial directions. An example of this process-ing is shown in Fig. 4b. However, considering the difference of density between liquid and vapour phases (typically∼102–103) and the fact that droplet fluorescence intensity is proportional to its cubic diameter, fluorescence signalfrom droplets with diameter less than 20 µm cannot be distinguished from fluorescence signal coming from the vapourphase, with the present spatial resolution. This introduces some uncertainty on the maps of local equivalence ratio.
4. Results
This section presents simultaneous PLIF measurements of kerosene and OH radical at the outlet of the multipointinjector for different operating conditions. Both axial measurements and radial measurements have been performed.In the first part, spatial correlation between kerosene and OH fluorescence is discussed. The second part of the sectionpresents the influence of combustion parameters (temperature, pressure and fuel split between the pilot and the maininjectors) on kerosene and OH spatial distributions.
4.1. Correlation between OH and kerosene fluorescence
Fig. 5 shows a comparison between axial single-shot fluorescence images of OH radical and kerosene for twoconditions of temperature and pressure. The red contour is used to define the spatial contours of kerosene vapour atthe outlet of the injector. The pilot injector is located a few millimetres upstream from the main injector and, therefore,the pilot flame in Fig. 5a burns upstream from the region visualised by the ICCD cameras. Although information ismissing in that region, it is believed that kerosene radially spreads close to the swirler walls immediately after theoutlet of the pilot injector. In Fig. 5b, the main injector has a wide angle and kerosene vapour is mainly located at theedge of the bowl due to swirling effects. As can be seen, for all the conditions investigated, a good spatial correlationis obtained between the distribution of kerosene vapour and the location of OH radical, and the respective imagescan be compared in details. Indeed, for a given condition, small scale structures due to local high levels of turbulencecan be observed at the same position on both images. In particular, it is remarkable that kerosene fuel is present atlarger distance than OH radical, which suggests that combustion occurs on the inner side of the cone delimitatingkerosene. Although OH radical is present both in the flame front and in the region of hot gases, the combined analysisof the simultaneous fluorescence images of kerosene and OH radical allows to determine where the flame front starts.Indeed, it is noticed that the flame front appears at the location where kerosene vapour vanishes, and no “dark zone” isvisible. This confirms that, unlike surrogate fuels such as acetone that pyrolyse at significant distance upstream fromthe flame front, aromatics are consumed within the flame front and their signal remains detectable at temperatureshigher than 1000 K. Therefore, in the following, the term “flame front” will refer to the outer edge of the region whereOH radical is present.
4.2. Influence of combustion parameters
4.2.1. Axial measurementsFor axial measurements, the laser sheet propagates from the top to the bottom of the combustor and it is located on
its vertical axis.

380 M. Orain et al. / C. R. Mecanique 337 (2009) 373–384
Fig. 5. Axial instantaneous images of kerosene (first column) and OH radical (second column) fluorescence for different operating conditions: (firstraw) 480 K and 0.45 MPa (pilot only), (second raw) 590 K and 0.95 MPa (Φpilot/Φmain = 1).
Fig. 6 shows axial single-shot images of OH radical fluorescence for various conditions of temperature, pressureand fuel split between the pilot and the main injectors. As can be seen, the flame front is highly stretched by turbulenceand wrinkled structures can be clearly identified. In Fig. 5a, only the pilot injector is used and, therefore, the flamefront is located close to the axis of the injector, with a cone-like shape. By contrast, pilot and main injectors areoperated with the same equivalence ratio in Fig. 5b and a double flame structure is noticeable on the image. There areindeed two flame fronts: the one close to the axis comes from the pilot injector, whereas the peripheral flame front canbe attributed to the main injector. In Fig. 6c, kerosene fuel is mainly injected through the main injector and, therefore,the flame front is located at the outer part of the injector.
Figs. 7 and 8 show the mean images obtained after average over 200 single laser-shots for the same operatingconditions as in Fig. 6. These images are corrected for laser absorption across the combustor using the classical Beer–Lambert’s law, assuming that the flame shape and the spatial distribution of kerosene fuel are axisymmetric. Eachmean image is normalised by its maximum value and it is displayed on a black-to-red colorscale, where black colorcorresponds to a zero concentration of species and red color indicates the maximum concentration of species. Noabsolute values of OH or kerosene concentration can be given in the article for confidentiality reasons: the industrialdoes not want to unveil information to potential competitors.
As can be seen in Fig. 7, when temperature and pressure increase, the flame tends to slightly move away fromthe injector. However, in Figs. 7a and 7b, the pilot injector is operated, and this injector has a recess of severalmillimetres compared to the main injector. Therefore, the flame front due to the pilot injector is located at axiallocations smaller than the flame front coming from the main injector. Nonetheless, in Fig. 7c the flame front occurs atlarger axial distance from the injector (a few mm) as temperature and pressure increase. Not surprisingly, as the fuelsplit between the pilot and the main injectors switches from 100% pilot to ∼100% main, the flame front gradually

M. Orain et al. / C. R. Mecanique 337 (2009) 373–384 381
Fig. 6. Axial instantaneous images of OH radical fluorescence for various operating conditions: (a) 480 K and 0.45 MPa (pilot only), (b) 590 K and0.95 MPa (Φpilot/Φmain = 1), (c) 730 K and 2.2 MPa (Φpilot/Φmain = 0.1).
Fig. 7. Axial mean images of OH concentration for various operating conditions: (a) 480 K and 0.45 MPa (pilot only), (b) 590 K and 0.95 MPa(Φpilot/Φmain = 1), (c) 730 K and 2.2 MPa (Φpilot/Φmain = 0.1). Average is performed over 200 instantaneous images.
moves to larger radial distance and changes from a cone-like to a bowl-like shape. It is remarkable that the doubleflame structure remains visible on the average image in Fig. 7b, which indicates that it is fairly repeatable from oneimage to the other. In addition, it is noticed that the flame shape is axisymmetric, which comes from an unbalancedairflow through the injector due to the geometry of the kerosene injection strut. Fig. 7 also allows one to determineflame angle and flame length for the different operating conditions. It is noticed that the flame opens up as pressure andtemperature increase and flame angle increases from ∼95◦ to ∼135◦. This evolution may be partly attributed to thegradual switch of the repartition of fuel loading between the pilot and the main injectors from 100% pilot to ∼100%main. In addition, flame length also tends to increase from Fig. 7a to 7c. Nonetheless, fuel split, temperature and airflowrates are different between all these conditions, and it is difficult to determine which parameter most influencesthe flame length. Finally, very little fluorescence from OH radical is detected on the axis of the combustor, whichsuggests that OH concentration is very low at that position. Indeed, the recirculation zone located at the outlet of theinjector entrains burnt gases and dilution air close to the injector and helps to stabilise the flame. Dilution air quencheschemical reactions in the burnt gases, which reduces OH concentration in the gas mixture recirculating back close tothe injector.
Similarly to observations with OH radical, Fig. 8 shows that when fuel injection gradually switches from 100% pilotto ∼100% main, kerosene vapour gradually moves to larger radial distance. In addition, as temperature and pressure

382 M. Orain et al. / C. R. Mecanique 337 (2009) 373–384
Fig. 8. Axial mean images of equivalence ratio for various operating conditions: (a) 480 K and 0.45 MPa (pilot only), (b) 590 K and 0.95 MPa(Φpilot/Φmain = 1), (c) 730 K and 2.2 MPa (Φpilot/Φmain = 0.1). Average is performed over 200 instantaneous images.
increase, the spatial extent of kerosene vapour reduces. Although values of local equivalence ratio are representativeof droplet evaporation and mixing efficiency between fuel vapour and air, Figs. 8a to 8c cannot be compared straight-forward. Indeed, the operating conditions given in Table 1 have different overall equivalence ratios. Nonetheless, airinlet temperature is higher at 2.2 MPa and this enhances fuel evaporation, which leads to larger local equivalence ratio.
4.2.2. Radial measurementsFor radial measurements, the laser sheet propagates from right to left on the images across the combustor, at
different distances downstream from the injector. The focal plane of the images is located on the combustor axis.Fig. 9 shows radial single-shot images of kerosene and OH radical fluorescence for the condition where the pilot
and the main injectors are operated with the same equivalence ratio. Images are not corrected for distortion due to theangle (∼30◦) between the laser sheet and the ICCD cameras. Fluorescence information is missing both on the upperand the lower part for the images, which is due to limited viewing angle of the optical windows. Neither OH norkerosene radial images have been corrected for absorption of the laser sheet across the combustor, which explains theasymmetry observed between the left and right part of each image. It is noticed that the flame front exhibits a doublestructure, which is similar to observations from Fig. 6b. This double structure can also be observed on the averageimage in Fig. 10b. Comparison between Figs. 9a and 9b (or 10a and 10b) shows that kerosene is located at larger axialdistance than OH radical, which indicates that combustion occurs on the inner side of the cone delimitating kerosene.This is in agreement with findings from Fig. 5. Finally, the spatial distribution of both kerosene and OH radical areaxisymmetric, which confirms results from axial measurements. This suggests that such a multi-point injector canprovide a fairly homogeneous repartition of kerosene in the combustor. Therefore, regions with large gradients of fuelconcentration should be limited, which may help to achieve stable combustion and low levels of pollutant emissions.In addition, the axisymmetric spatial distributions of kerosene and OH radical obtained with the radial measurementsvalidate the hypothesis used to correct the raw axial images of OH and kerosene fluorescence for laser absorption.
5. Conclusions
Simultaneous measurements of planar laser-induced fluorescence applied to OH radical and kerosene were suc-cessfully performed at the outlet of a multipoint injector, for various operating conditions (temperature up to 730 Kand pressure up to 2.2 MPa). Experiments demonstrate the potential of PLIF technique to visualise simultaneously theflame structure and the spatial distribution of kerosene vapour concentration in a real aeronautical injection systemoperating at flight conditions. Results can be summarised as follows:
• Application of OH-PLIF and kerosene-PLIF to a real aircraft injection system is demonstrated at pressure up to2.2 MPa. Discrimination of fluorescence of mono-aromatics and di-aromatics is also demonstrated experimentally,which makes possible the quantitative analysis of the present results.

M. Orain et al. / C. R. Mecanique 337 (2009) 373–384 383
Fig. 9. Radial instantaneous images of kerosene (a) and OH radical (b): 590 K and 0.95 MPa (Φpilot/Φmain = 1).
Fig. 10. Radial mean images of kerosene (a) and OH radical (b): 590 K and 0.95 MPa (Φpilot/Φmain = 1). Average is performed over 200instantaneous images.
• When both the pilot and main injectors are operated with a similar equivalence ratio, the flame exhibits a dualstructure and two separate flame fronts coming from the pilot and the main injectors are clearly visible. Bycontrast, when either the pilot or the main injector is operated, the flame front displays a single structure.
• As pressure and temperature increase, the flame front changes from a cone-like to a bowl-like shape.• Results show good spatial correlation between the repartition of the kerosene vapour and the position of the flame
front. The spatial removal of aromatics coincides with the production of OH radicals, which means that aromaticsnaturally present in kerosene (multi-component fuel) matches the behaviour of the parent fuel. No pyrolysis effectis observed.
• Future work will concern the extension of the PLIF-OH and PLIF-kerosene techniques to higher temperature(900 K) and pressure (3.0 MPa).
Acknowledgements
This work was performed within the “Towards Lean Combustion” program sponsored by the European Unionunder grant N◦ FP6-2003-Aero-1 with D. Chiron as program monitor and Snecma Moteurs as coordinator.

384 M. Orain et al. / C. R. Mecanique 337 (2009) 373–384
References
[1] M. Pilch, C.A. Erdman, Use of breakup time data and velocity history data to predict the maximum size of stable fragments for acceleration-induced breakup of a liquid drop, Int. J. Multiphase Flow 13 (1987) 741–757.
[2] A.H. Lefebvre, Atomization and Sprays, 1st ed., Hemisphere Publishing, 1989.[3] A.H. Lefebvre, The role of fuel preparation in low emission combustion, J. Eng. Gas Turb. Power 117 (1995) 617–654.[4] A.H. Lefebvre, Gas Turbines Combustion, 2nd ed., Taylor & Francis, 1999.[5] S.M. Correa, A review of NOx formation under gas-turbine combustion conditions, Combust. Sci. Technol. 87 (1992) 329–362.[6] C. Löfström, J. Engström, M. Richter, C.F. Kaminski, P. Johansson, K. Nyholm, J. Hult, J. Nygren, M. Aldén, Feasibility studies and appli-
cation of laser/optical diagnostics for characterisation of a practical low-emission gas turbine combustor, ASME paper N◦ 2000-GT-0124,2000.
[7] D.A. Greenhalgh, Laser imaging of fuel injection systems and combustors, Proc. Inst. Mech. Eng., Part A: J. Power Energy 214 (2000)367–376.
[8] Y. Michou, I.S. Carvahlo, C. Chauveau, I. Gökalp, Experimental study of lean premixed and prevaporised turbulent spray combustion, AIAApaper N◦ 1999-332, 1999.
[9] J. Becker, C. Hassa, Liquid fuel placement and mixing of generic aeroengine premix module at different operating conditions, J. Eng. GasTurb. Power 125 (2003) 901–908.
[10] J.H. Stufflebeam, D.W. Kendrick, W.A. Sowa, T.S. Snyder, Quantifying fuel/air unmixedness in premixing nozzles using an acetone fluores-cence technique, J. Eng. Gas Turb. Power 124 (2002) 39–45.
[11] D. Galley, A. Pubill Melsio, S. Ducruix, F. Lacas, D. Veynante, Experimental study of the dynamics of a LPP injection system, AIAA paperN◦ 2004-4032, 2004.
[12] H. Krämer, F. Dinkelacker, A. Leipertz, Optimization of the mixing quality of real size gas turbine burner with instantaneous planer laser-induced fluorescence imaging, ASME paper N◦ 99-GT-135, 1999.
[13] Y.R. Hicks, R.J. Locke, R.C. Anderson, M. Zaller, H.J. Schock, Imaging fluorescent combustion species in gas turbine flame tubes: oncomplexities in real systems, AIAA paper N◦ 97-2837, 1997.
[14] Y.R. Hicks, R.J. Locke, R.C. Anderson, Optical measurement and visualization in high-pressure, high-temperature, aviation gas turbine com-bustors, NASA/TM-2000-210377, 2000.
[15] C. Löfström, H. Kaaling, M. Aldén, Visualization of fuel distributions in premixed ducts in a low-emission gas turbine combustor using lasertechniques, Proc. Combust. Inst. 26 (1996) 2787–2793.
[16] A. Arnold, R. Bombach, W. Hubschmid, A. Inauen, B. Käppeli, Fuel-oil concentration in a gas turbine burner measured with laser-inducedfluorescence, Exp. Fluids 29 (2000) 468–477.
[17] P. Baranger, M. Orain, F. Grisch, Fluorescence spectroscopy of kerosene vapour: application to gas turbines, AIAA paper N◦ 2005-828, 2005.[18] M. Orain, H. Verdier, F. Grisch, Equivalence ratio measurements in kerosene-fuelled LPP injectors using planar laser induced fluorescence,
in: 13th International Symposium on Application of Laser Techniques to Fluid Mechanics, Lisbon (Portugal), 26–29 June 2006, Paper 1220.[19] R.K. Hanson, Combustion diagnostics: planar imaging techniques, Proc. Combust. Inst. 21 (1986) 1677–1691.[20] J.H. Frank, M.F. Miller, M.G. Allen, Imaging of laser-induced fluorescence in a high-pressure combustor, AIAA-99-0773, 1999.[21] B. Atakan, J. Heinze, U.E. Meier, OH laser-induced fluorescence at high pressures: spectroscopic and two-dimensional measurements using
the A–X (1,0) transition, Appl. Phys. B 64 (1997) 585–591.[22] J.B. Birks, Photophysics of Aromatic Molecules, Wiley–Interscience, London, 1970.[23] W. Koban, J.D. Koch, R.K. Hanson, C. Schulz, Oxygen quenching of toluene fluorescence at elevated temperatures, Appl. Phys. B 80 (2005)
777–784.
Copyright © 2022 FDOKUMEN