Simultaneous forward and epi-CARS microscopy with a single detector by time-correlated single photon...
9
eScholarship provides open access, scholarly publishing services to the University of California and delivers a dynamic research platform to scholars worldwide. University of California Peer Reviewed Title: Simultaneous forward and epi-CARS microscopy with a single detector by time-correlated single photon counting Author: Schie, Iwan W , University of California, Davis Weeks, Tyler , University of California, Davis McNerney, Gregory P , University of California, Davis Fore, Samantha , University of California, Davis Sampson, Juliana K , University of California, Davis Wachsmann-Hogiu, Sebastian , University of California, Davis Rutledge, John C , University of California, Davis Huser, Thomas , University of California, Davis Publication Date: 02-01-2008 Publication Info: Postprints, UC Davis Permalink: http://escholarship.org/uc/item/71m712d8 Abstract: We present a novel scheme to simultaneously detect coherent anti-Stokes Raman scattering ( CARS) microscopy signals in the forward ( F) and backward (epi-E) direction with a single avalanche photodiode (APD) detector using time-correlated single photon counting (TCSPC). By installing a mirror at a well-defined distance above the sample the forward-scattered F-CARS signal is reflected back into the microscope objective leading to spatial overlap of the F and E- CARS signals. Due to traveling an additional distance the F-CARS signal is time delayed relative to the E-CARS signal. TCSPC then allows for the two signals to be resolved in the time domain. This results in an efficient, simple, and compact method of CARS signal detection. We demonstrate this technique by analyzing forward and backward CARS signals obtained by imaging living adipocyte cells derived from human mesenchymal stem cells. (c) 2008 Optical Society of America.
-
Upload
independent -
Category
Documents
-
view
0 -
download
0
Transcript of Simultaneous forward and epi-CARS microscopy with a single detector by time-correlated single photon...
eScholarship provides open access, scholarly publishingservices to the University of California and delivers a dynamicresearch platform to scholars worldwide.
University of California
Peer Reviewed
Title:Simultaneous forward and epi-CARS microscopy with a single detector by time-correlated singlephoton counting
Author:Schie, Iwan W, University of California, DavisWeeks, Tyler, University of California, DavisMcNerney, Gregory P, University of California, DavisFore, Samantha, University of California, DavisSampson, Juliana K, University of California, DavisWachsmann-Hogiu, Sebastian, University of California, DavisRutledge, John C, University of California, DavisHuser, Thomas, University of California, Davis
Publication Date:02-01-2008
Publication Info:Postprints, UC Davis
Permalink:http://escholarship.org/uc/item/71m712d8
Abstract:We present a novel scheme to simultaneously detect coherent anti-Stokes Raman scattering( CARS) microscopy signals in the forward ( F) and backward (epi-E) direction with a singleavalanche photodiode (APD) detector using time-correlated single photon counting (TCSPC). Byinstalling a mirror at a well-defined distance above the sample the forward-scattered F-CARSsignal is reflected back into the microscope objective leading to spatial overlap of the F and E-CARS signals. Due to traveling an additional distance the F-CARS signal is time delayed relative tothe E-CARS signal. TCSPC then allows for the two signals to be resolved in the time domain. Thisresults in an efficient, simple, and compact method of CARS signal detection. We demonstrate thistechnique by analyzing forward and backward CARS signals obtained by imaging living adipocytecells derived from human mesenchymal stem cells. (c) 2008 Optical Society of America.
Simultaneous forward and epi-CARS
microscopy with a single detector by time-
correlated single photon counting
Iwan W. Schie1, Tyler Weeks
1, Gregory P. McNerney
1, Samantha Fore
1, Juliana K.
Sampson2, Sebastian Wachsmann-Hogiu
1, John C. Rutledge
1,2, and Thomas Huser
1,2
1
NSF Center for Biophotonics Science and Technology, University of California, Davis, Sacramento, CA 95817, USA
2
Department of Internal Medicine, University of California, Davis, Sacramento, CA 95817, USA
*Corresponding author: [email protected]
http://www.cbst.ucdavis.edu
Abstract: We present a novel scheme to simultaneously detect coherent
anti-Stokes Raman scattering (CARS) microscopy signals in the forward (F)
and backward (epi - E) direction with a single avalanche photodiode (APD)
detector using time-correlated single photon counting (TCSPC). By
installing a mirror at a well-defined distance above the sample the forward-
scattered F-CARS signal is reflected back into the microscope objective
leading to spatial overlap of the F and E-CARS signals. Due to traveling an
additional distance the F-CARS signal is time delayed relative to the E-
CARS signal. TCSPC then allows for the two signals to be resolved in the
time domain. This results in an efficient, simple, and compact method of
CARS signal detection. We demonstrate this technique by analyzing
forward and backward CARS signals obtained by imaging living adipocyte
cells derived from human mesenchymal stem cells.
© 2008 Optical Society of America
OCIS code: (220.4830) Systems design; (180.4315) Nonlinear microscopy; (170.6920) Time-resolved imaging;
(190.5650) Raman effect
Reference and links
1. M. D. Duncan, J. Reintjes, and T. J. Manuccia, "Scanning Coherent Anti-Stokes Raman Microscope," Opt.
Lett. 7, 350-352 (1982).
2. A. Zumbusch, G. R. Holtom, and X. S. Xie, "Three-dimensional vibrational imaging by coherent anti-Stokes
Raman scattering," Phys. Rev. Lett. 82, 4142-4145 (1999).
3. J. X. Cheng, Y. K. Jia, G. F. Zheng, and X. S. Xie, "Laser-scanning coherent anti-stokes Raman scattering
microscopy and applications to cell biology," Biophys. J. 83, 502-509 (2002).
4. M. Müller, and A. Zumbusch, "Coherent anti-Stokes Raman Scattering Microscopy," ChemPhysChem 8,
2156-2170 (2007).
5. C. L. Evans, E. O. Potma, M. Puoris'haag, D. Cote, C. P. Lin, and X. S. Xie, "Chemical imaging of tissue in
vivo with video-rate coherent anti-Stokes Raman scattering microscopy," Proc. Natl. Acad. Sci. 102, 16807-
16812 (2005).
6. T. Hellerer, C. Axäng, C. Brackmann, P. Hillertz, M. Pilon, and A. Enejder, "Monitoring of lipid storage in
Caenorhabditis elegans using coherent anti-Stokes Raman scattering (CARS) microscopy," Proc Natl Acad
Sci USA 104, 14658-14663 (2007).
7. J. X. Cheng, A. Volkmer, and X. S. Xie, "Theoretical and experimental characterization of coherent anti-
Stokes Raman scattering microscopy," J. Opt. Soc. Am. B 19, 1363-1375 (2002).
8. J. X. Cheng, and X. S. Xie, "Coherent anti-Stokes Raman scattering microscopy: Instrumentation, theory,
and applications," J. Phys. Chem. B 108, 827-840 (2004).
9. A. Volkmer, J. X. Cheng, and X. S. Xie, "Vibrational imaging with high sensitivity via epidetected coherent
anti-Stokes Raman scattering microscopy," Phys. Rev. Lett. 8702, 4 (2001).
10. S. O. Konorov, C. H. Glover, J. M. Piret, J. Bryan, H. G. Schulze, M. W. Blades, and R. F. B. Turner, "In
situ analysis of living embryonic stem cells by coherent anti-Stokes Raman microscopy," Anal. Chem. 79,
7221-7225 (2007).
11. B. Kraemer, F. Koberling, U. Ortmann, M. Wahl, P. Kapusta, A. Buelter, and R. Erdmann, "Time-resolved
laser scanning microscopy with FLIM and advanced FCS capability," Proc. SPIE 5700, 138-143 (2005).
12. D. Elson, J. Siegel, S. Webbb, S. Leveque-Fort, M. Lever, P. French, K. Lauritsen, M. Wahl, and R.
Erdmann, "Fluorescence lifetime system for microscopy and multiwell plate imaging with a blue picosecond
diode laser " Opt. Lett. 27 (2002).
13. M. Wahl, H. Rahn, I. Gregor, R. Erdmann, and J. Enderlein, "Dead-time optimized time-correlated photon
counting instrument with synchronized, independent timing channels " Rev. Sci. Instrum. 78, 033106 (2007).
14. S. Ly, G. McNerney, S. Fore, J. Chan, and T. Huser, "Time-gated single photon counting enables separation
of CARS microscopy data from multiphoton-excited tissue autofluorescence," Opt. Express 15, 16839-16851
(2007).
15. E. O. Potma, C. L. Evans, and X. S. Xie, "Heterodyne coherent anti-Stokes Raman scattering (CARS)
imaging," Opt. Lett. 31, 241-243 (2006).
1. Introduction
In the search for more robust and less invasive methods of imaging, coherent anti-Stokes
Raman scattering (CARS) microscopy has begun to demonstrate its utility in the study of
single cells [1-6]. CARS is a stimulated scattering process that relies on a pump field Ep and a
Stokes field Es that are spatially and temporally overlapped at the sample. For microscopy
applications, both fields must be tightly focused onto the sample with a high NA objective in
order to relax and satisfy the phase matching condition [2, 7, 8]. Because the CARS signal is
quadratically dependent on the intensity of the pump field and linearly dependent on the
intensity of the Stokes field there is a cubic loss in signal as a scatterer moves further away
from the focus. These conditions make CARS signals very attractive as a high resolution
point-scanning biochemical imaging technique [7].
In CARS microscopy, two types of signals are typically detected: forward generated
CARS (F-CARS), and backward (or: epi) generated CARS (E-CARS). There are significant
differences between these signals even though both are generated by interference of waves
originating from the same scatterers [7]. The F-CARS signal is relatively insensitive to
sample size or shape and is at least an order of magnitude stronger than the E-CARS signal
since it is generated by constructive interference. Microscopy applications based on F-CARS
are limited by a strong non-resonant background signal produced by a four-wave mixing
process in bulk solution. E-CARS, on the other hand, is very sensitive to the size and shape of
the sample and in large samples can be completely suppressed due to destructive interference.
E-CARS also exhibits less non-resonant background contributions compared to forward
CARS [4, 7, 9]. For imaging applications, these differences make it desirable to record both
signals simultaneously, since the information they carry can be significantly different and
highly useful for proper sample characterization.
Typically, two detectors are used so that F-CARS and E-CARS are detected separately at
180 degrees to each other [3]. To record the F-CARS signal a condenser lens and a photo-
multiplier tube (PMT) are installed above the sample. The condenser lens collects the signal
and focuses it directly onto the PMT. Several filters are required to reject the pump and
Stokes beams and other scattered light in the forward direction. Even then a significant
background signal is usually present [8]. To record the E-CARS signal, another PMT is
installed in the backward direction. The signals are recorded independently and later
combined by software.
Recently, F-CARS signal detection in the backward direction has been reported by Evans
et al. [5], where they exploited F-CARS photons backscattered within a thick tissue sample.
Konorov et al. [10] also capitalized on the reflected F-CARS signal by placing their samples
on mirrored cover slips to overlap the forward and backward scattered signals. Both groups
attributed an enhancement of the detected signal in the epi-direction to the additional
contributions from back-reflected F-CARS photons. Mixing of these signals on a single
detector can, however, lead to potential artifacts due to interference and does not resolve the
problem of the nonresonant background signal.
In this paper we present a novel CARS detection scheme that includes mirror-reflection
combined with registering the photon arrival time, which enables us to simultaneously detect
both F- and E-CARS signals on a single detector. In our setup the F-CARS signal is first
collected with a condenser lens, but then reflected by a mirror held above the lens, which
sends the F-CARS signal back into the objective so that both, F-and E CARS signals are
spatially overlapped. Both signals are then detected simultaneously by a single APD detector.
Since the back-reflected F-CARS signal travels a well-defined distance farther than the E-
CARS signal, they are separated in time. By using a commercial TCSPC board we can then
easily distinguish the signals in the time domain.
2. Materials and methods
2.1 Optical setup
Our CARS microscopy setup (see schematics in Fig. 1(a).) is built around a picosecond
pulsed 1064 nm Nd:YVO4 laser (PicoTrain, HighQ Laser, Austria) with an output power of
10 W, a repetition rate of 76 MHz, and a pulse duration of 7 ps. Approximately 4.5 W of this
laser are used to pump a synchronously pumped Optical Parametric Oscillator (OPO, Levante,
APE Berlin, Berlin, Germany) with a tuning range of 770-960 nm. The OPO is tuned to 816.8
nm, to probe the CH2 stretch vibration at 2845 cm-1,
and has an average output power of ~450
mW and a pulse duration of ~6 ps. The OPO beam is reduced to an average power of 20 mW
and serves as pump beam, while a fraction of the Nd:YVO4 laser beam reduced to 15 mW
average power serves as the Stokes beam for our CARS experiment. Both beams are
combined by a 970 nm dichroic mirror (Chroma Technology, Rockingham, VT) and are
spatially and temporally overlapped.
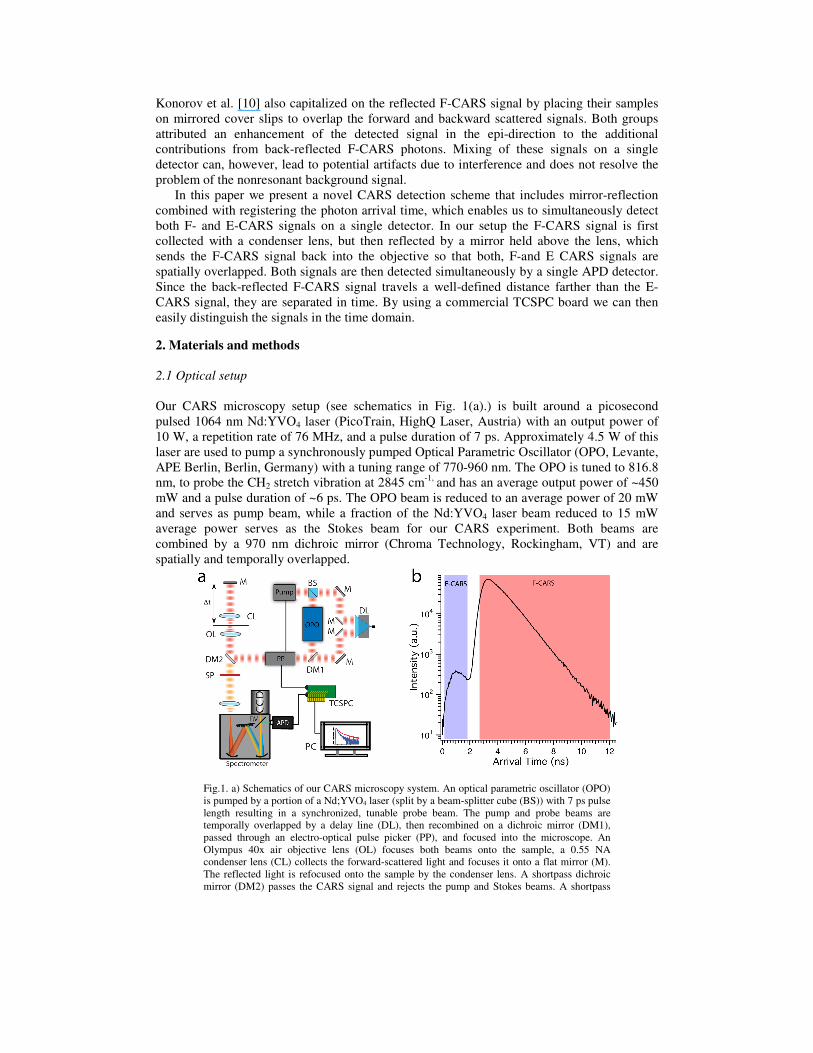
Fig.1. a) Schematics of our CARS microscopy system. An optical parametric oscillator (OPO)
is pumped by a portion of a Nd;YVO4 laser (split by a beam-splitter cube (BS)) with 7 ps pulse
length resulting in a synchronized, tunable probe beam. The pump and probe beams are
temporally overlapped by a delay line (DL), then recombined on a dichroic mirror (DM1),
passed through an electro-optical pulse picker (PP), and focused into the microscope. An
Olympus 40x air objective lens (OL) focuses both beams onto the sample, a 0.55 NA
condenser lens (CL) collects the forward-scattered light and focuses it onto a flat mirror (M).
The reflected light is refocused onto the sample by the condenser lens. A shortpass dichroic
mirror (DM2) passes the CARS signal and rejects the pump and Stokes beams. A shortpass
filter (SP) further removes residual laser photons. E-CARS and F-CARS signals are detected
either by a CCD camera or an avalanche photodiode detector (APD) by use of a flip mirror
(FM). b) Time distribution histogram of the photon arrival time of the spatially overlapped E-
CARS and F-CARS signals. Note that the temporally delayed F-CARS signal is significantly
more intense than the E-CARS signal.
In order to minimize photo-induced thermal damage while maintaining high pulse energy,
an electro-optical modulator (M350-160, Conoptics, Danbury, CT) is used to reduce the pulse
repetition rate to 7.6 MHz. The combined laser beams are then sent into an inverted optical
microscope (IX71, Olympus America, Center Valley, PA), reflected by a 750 nm short pass
dichroic mirror (Chroma Technology) and focused onto the sample by a 40x, 0.75 NA air
objective (Olympus). The sample is held in a piezo-actuated closed-loop xy translation and
objective focusing stage (Model P-733.2CL and P-721.CLQ, Physik Instrumente, Irvine, CA)
which provides 100 µm x 100 µm x 100 µm translation range to scan the sample. CARS
signals are collected in the epi-direction, spectrally separated from the excitation sources by
the dichroic mirror and a multiphoton short-pass filter (FF-01-750, Semrock, Rochester, NY),
and sent to an imaging spectrograph (Acton SpectraPro 2300i, PI Acton, Trenton, NJ). A 300
grooves/mm grating is used to disperse the incoming light onto a back-illuminated deep-
depletion charge-coupled device (CCD) camera (PIXIS 100BR, PI Acton, Trenton, NJ), or,
alternatively focus it onto a single photon counting avalanche photodiode (APD, SPCM-AQR
14, Perkin-Elmer, Waltham, MA) accessible on the second exit port of the monochromator by
a motor-actuated flip mirror. The advantage of using this detection scheme is the spectral
filtering of the monochromator, which acts as a narrow bandpass filter and leads to superior
suppression of residual laser and room light.
To collect the F–CARS signal the forward-propagating light is collected by a 0.55 NA
condenser lens (Olympus), which focuses the CARS signal onto a planar dielectric mirror
(E02, 1” diameter, Thorlabs, Newton, NJ) that reflects the F-CARS signal back through the
condenser and into the objective as depicted in Fig. 1(a). The distance between this mirror and
the sample is approximately 300 mm, i.e. ~ 600 mm roundtrip. This additional distance which
the F-CARS light travels leads to a temporal delay in the arrival time of the back-reflected F-
CARS signal at the detector of ~2 ns.
2.2 Time-correlated single photon counting detection scheme
Photon counts from the APD are used as the start signal and the electronic reference signal
from the laser is used as the stop signal for a time-correlated single-photon counting
electronics board (TCSPC, TimeHarp200, PicoQuant GmbH, Berlin, Germany). Data
collection, image scan synchronization, and data analysis is achieved by a commercial
software package (SymPhoTime, PicoQuant GmbH, Berlin, Germany). The TCSPC board is
operated in Time-Tagged Time Resolved (TTTR) mode, which records both, the microscopic
arrival time of each photon with picosecond time resolution, as well as the macroscopic
(absolute) arrival time with 100 ns precision [11-13]. The instrument response function (IRF)
was measured to be ~330 ps at ~ 650 nm [14].
2.3 Cultured human adipocyte samples
Frozen human mesenchymal stem cells (hMSC) were purchased from Lonza, Inc.
(Walkersville, MD). The cells were cultured on glass bottom culture dishes (MatTek Corp.,
Ashland, MA) in human mesenchymal stem cell growth medium (MSCGM) until they
reached confluency. Once confluent, hMSC were induced to differentiate into fat cells
(adipocytes) according to the manufacturer’s specifications. Briefly, the cells were fully
differentiated over a 3 week period in Lonza hMSC adipogenic induction medium and
maintenance medium. Differentiation into adipocytes was confirmed by observing their
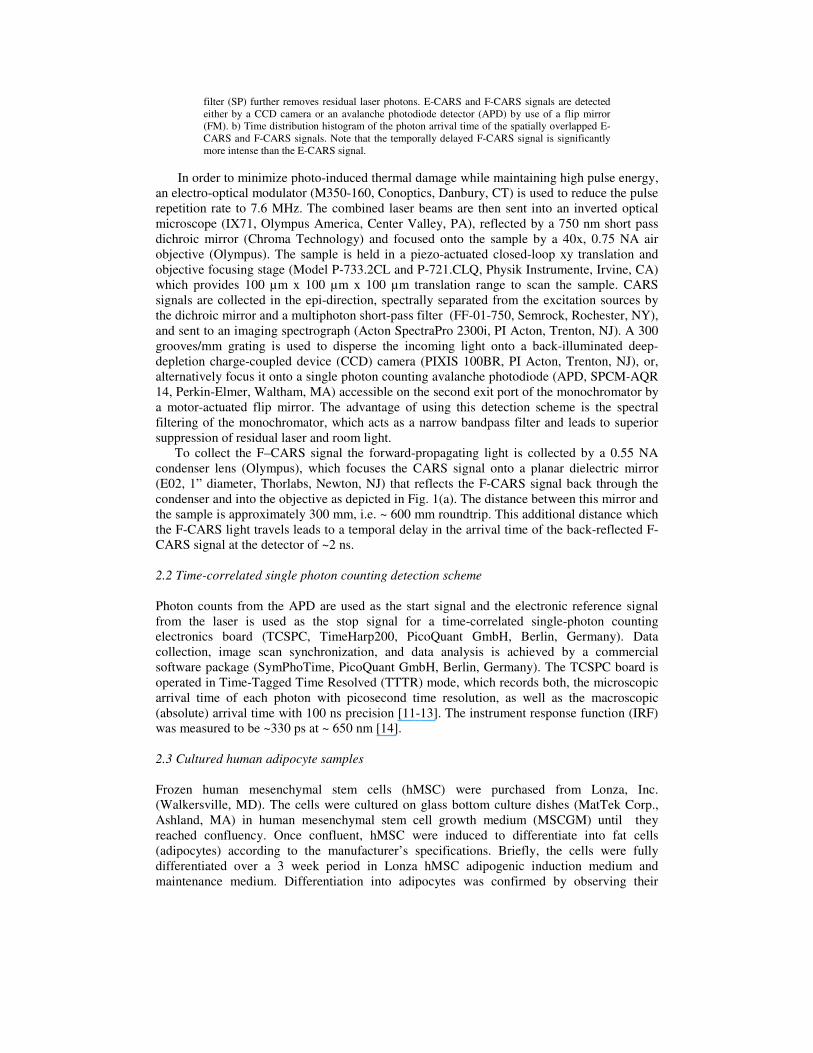
Fig.2. CARS microscopy of living, human MSC-derived adipocytes in culture. a) CARS
image encoding the photon arrival time of the individual photons by false color. b)
Normalized photon arrival time histograms obtained by histogramming all photons of the
regions of interest shown in a). The area surrounding region 1 is comprised of mostly
back-scattered E-CARS photons, while region 2 contains mostly signals from back-
reflected F-CARS photons (resulting in a fixed delay in the photon arrival time delay of ~
2 ns. Region 3 was taken from an area outside the cells and characterizes the nonresonant
background signal. It was offset downwards for clarity. Note that the slope of all decay
curves is approximately the same, which indicates that the arrival time signals are limited
by the instrument response function. The image consists of 512x512 pixels with a pixel
dwell time of 0.2ms, and was acquired in 4.3 min. The laser power of the pump and Stokes
beams at the sample was 20 mW and 15 mW, respectively.
characteristic lipid droplets in white light micrographs and by Oil Red O staining (data not
shown).
3. Results and discussion
Back-reflection of forward-scattered CARS photons by a mirror held above the sample allows
us to use the microscopic photon arrival time as a means to simultaneously detect and
distinguish E-CARS and back-reflected F-CARS signals with a single detector. The
combination of a photon-counting APD detector together with TCSPC electronics provides
sufficient time-resolution to measure the CARS photon arrival time distribution of E-CARS
and F-CARS photons as shown in Fig. 1(b). To allow for sufficient temporal separation of the
E- and F-CARS signals within the boundaries imposed by building our CARS system around
an inverted optical microscope frame, the distance of the mirror to the sample was set to
approximately 30 cm, resulting in an extra ~60 cm roundtrip distance, i.e. ~ 2.0 ns delay for
the F-CARS signal. As shown in Fig. 1(b), this temporal delay separates both signals beyond
the system’s timing uncertainty so that discrete peaks can be assigned to each signal,
respectively. The peak with the lower count-rate on the left hand side of the photon arrival
time histogram represents the average arrival time of the E-CARS photons, while the more
intense peak to the right reflects the average arrival time of the delayed F-CARS photons. As
demonstrated further below, this temporal separation enables us to set time gates by software
to sort and separate the CARS signals based on their arrival time. Note that the signal
intensity of the 2 peaks is different. The approximately 2 orders of magnitude higher intensity
of the F-CARS signal over the E-CARS signal is consistent with observations made by Cheng
et al. [7] and can be attributed to constructive and destructive interference effects,
respectively, of the different signals during signal generation. It should be noted that TCSPC
with APD detectors favors the detection of early photons over late photons, because of the ~
35 ns deadtime of the detector. Thus, even a weak signal can be easily detected against a
strong background signal as long as this signal arrives well before the stronger background.

Fortunately, this is the case in our detection scheme, where the weak E-CARS signal arrives
before the strong F-CARS signal.
We demonstrate our ability to separate F-CARS and E-CARS signals by imaging a
sample of living adipocytes cells, which were derived from human mesenchymal stem cells
(hMSCs). After induction of differentiation into adipocytes, MSCs begin to form
characteristic lipid-filled droplets that spread throughout their entire cytoplasm. The lipid
droplets provide a strong CARS signal due to the symmetrical stretch vibration of the
aliphatic lipid CH2 bond at 2845 cm-1
. In this case, the pump beam of our system was tuned to
816.8 nm while the Stokes beam was maintained at 1064 nm. Figure 2(a) shows an image
based on the average photon arrival time of the overlapped signal beams from the adipocyte
sample, collected by the same APD. The different colors in the image represent the different
photon arrival times at the detector, indicating that the earlier arriving E-CARS signal (blue)
is generated mostly at the circumference of large lipid droplets or in droplets smaller than the
wavelength. The false-color distribution in this image readily demonstrates how well the two
signals can be distinguished based on their arrival time. To further characterize the nature of
these signals we have calculated photon arrival time histograms from different regions of
interest (ROI) in the sample. As indicated by the white outlines in Fig. 2(a), ROI 1 is a ring-
shaped area enclosing mostly early arriving E-CARS photons, while ROI 2 outlines mostly
only the delayed F-CARS photons from the inner circle. ROI 3 is an area outside the cells,
representing the nonresonant background signal from the glass cover slip and the surrounding
medium. The corresponding normalized arrival time distribution plots are shown in Fig. 2(b).
The nonresonant background signal is mostly forward directed, just as F-CARS, and exhibits
a very similar characteristic decay curve. The blue curve obtained from ROI 1 exhibits a
single exponential decay, which clearly indicates that this area contains only E-CARS signals
arriving within the first ~ 2 ns after the laser pulse. ROI 2, however, receives mostly F-CARS
photons as shown by the red curve. Note that this decay curve still exhibits a slight peak at the
position of the E-CARS signal. We attribute this peak mostly to residual E-CARS
contributions as well as F-CARS signal that is back-reflected from within the sample. The
decay time of this smaller peak appears to be dramatically different from the one shown from
ROI 1 or that shown in Figure 1(b). The slower decay would typically indicate that this signal
is comprised of background contributions from autofluorescence in the sample [14]. In our
case, however, the slope of the signal depends highly on the area of the selected ROI,
indicating quite clearly that the varying slope is due to a convolution of the onset of the F-
CARS peak with the weak residual E-CARS decay. It should also be noted that all signals
detected with our specific experimental configuration (E-CARS, F-CARS, and the
nonresonant background signal) are significantly faster than the instrument response function
of our system. The instrument response of our instrument is primarily limited by the timing
jitter of the APD detectors and we have characterized this in a recent paper to be ~330 ps at
650 nm [14]. Thus, all decay curves exhibit very similar decay times representative of the
instrument response function. To separate the E-CARS and F-CARS signals from each other
we defined software time gates as indicated by the differently colored boxes in Fig. 1(b) and
sorted the photons based on their arrival time. The E-CARS signal shown in blue in Fig. 2(a)
can then be efficiently gated out, resulting in an image of only the F-CARS signal as shown in
the intensity image of the adipocyte lipid droplets in Fig. 3(a). Likewise, by gating out the
delayed F-CARS photons, an image consisting only of the E-CARS signal remains, as shown
in the intensity image in Fig. 3(b). As shown by Cheng et al. [8], E-CARS signals of spherical
objects smaller than 0.3λ produce an E-CARS signal that is comparable to F-CARS signals,
but with efficient rejection of the non-resonant background, which would otherwise
overwhelm the F-CARS signal. Thus, E-CARS and F-CARS images are complementary and
carry information from different length scales of the sample. Because the E-CARS signal is
mostly sensitive to droplets with a size of less than the wavelength of light, as well as sample
boundaries, a strong E-CARS signal is observed near the border of the lipid droplets, which
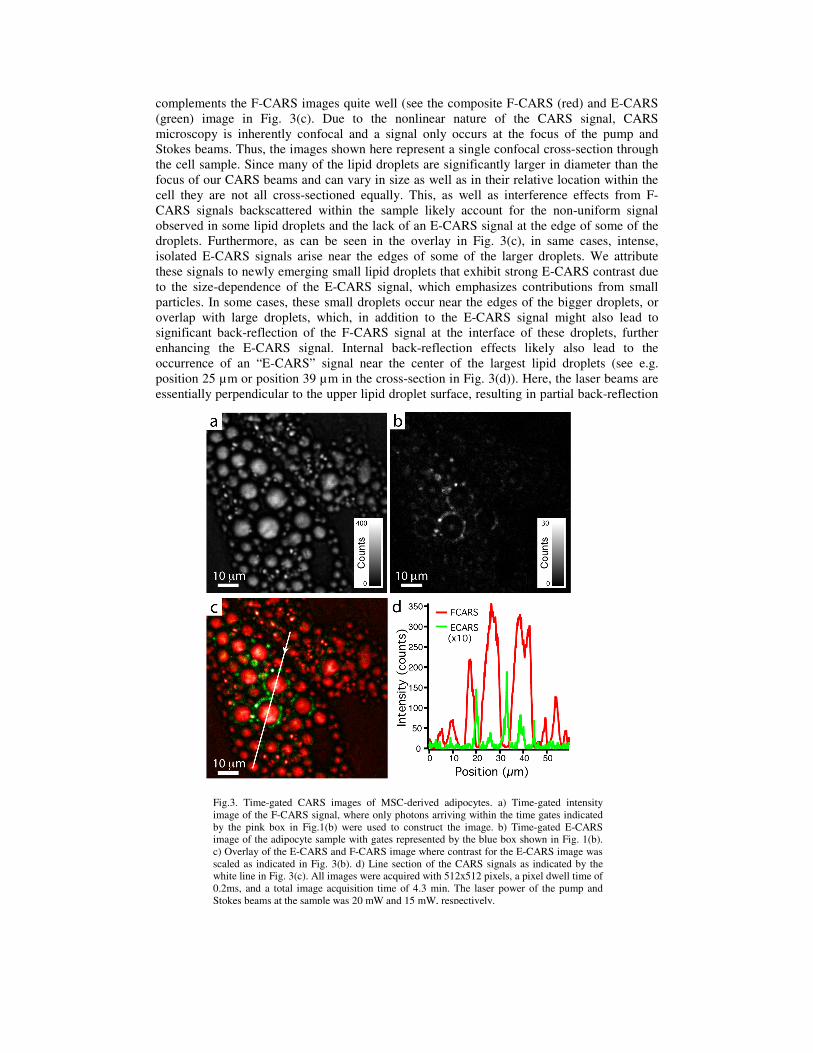
complements the F-CARS images quite well (see the composite F-CARS (red) and E-CARS
(green) image in Fig. 3(c). Due to the nonlinear nature of the CARS signal, CARS
microscopy is inherently confocal and a signal only occurs at the focus of the pump and
Stokes beams. Thus, the images shown here represent a single confocal cross-section through
the cell sample. Since many of the lipid droplets are significantly larger in diameter than the
focus of our CARS beams and can vary in size as well as in their relative location within the
cell they are not all cross-sectioned equally. This, as well as interference effects from F-
CARS signals backscattered within the sample likely account for the non-uniform signal
observed in some lipid droplets and the lack of an E-CARS signal at the edge of some of the
droplets. Furthermore, as can be seen in the overlay in Fig. 3(c), in same cases, intense,
isolated E-CARS signals arise near the edges of some of the larger droplets. We attribute
these signals to newly emerging small lipid droplets that exhibit strong E-CARS contrast due
to the size-dependence of the E-CARS signal, which emphasizes contributions from small
particles. In some cases, these small droplets occur near the edges of the bigger droplets, or
overlap with large droplets, which, in addition to the E-CARS signal might also lead to
significant back-reflection of the F-CARS signal at the interface of these droplets, further
enhancing the E-CARS signal. Internal back-reflection effects likely also lead to the
occurrence of an “E-CARS” signal near the center of the largest lipid droplets (see e.g.
position 25 µm or position 39 µm in the cross-section in Fig. 3(d)). Here, the laser beams are
essentially perpendicular to the upper lipid droplet surface, resulting in partial back-reflection
Fig.3. Time-gated CARS images of MSC-derived adipocytes. a) Time-gated intensity
image of the F-CARS signal, where only photons arriving within the time gates indicated
by the pink box in Fig.1(b) were used to construct the image. b) Time-gated E-CARS
image of the adipocyte sample with gates represented by the blue box shown in Fig. 1(b).
c) Overlay of the E-CARS and F-CARS image where contrast for the E-CARS image was
scaled as indicated in Fig. 3(b). d) Line section of the CARS signals as indicated by the
white line in Fig. 3(c). All images were acquired with 512x512 pixels, a pixel dwell time of
0.2ms, and a total image acquisition time of 4.3 min. The laser power of the pump and
Stokes beams at the sample was 20 mW and 15 mW, respectively.
of the F-CARS signal by the droplet surface because of the refractive index mismatch
between the lipid droplets and the surrounding aqueous medium. Moreover, as demonstrated
in the overlay in Fig. 3(c), the E-CARS signal appears typically in exactly those positions
where the F-CARS signal is absent, which is caused by the mismatch of the χ(3)
resonant
signal from the droplet with the χ(3)
NR of the non-resonant background generated in the
medium. This is a good example of the difference in the information contained in F- and E-
CARS signals and underlines why it is important to detect both signals. It should also be
noted that the F-CARS image shown in this example exhibits exceptionally low non-resonant
background contributions from the medium even though no special measures were taken to
reduce this background [15].
4. Conclusions
We have demonstrated that the simultaneous detection of forward and backward-directed
CARS microscopy signals through back-reflection by a mirror leads to maximized CARS
signal collection. Time-correlated single photon counting allows for selection of the optimal
signal, their separation or combination – as required by the application. Furthermore, the
back-reflection technique based on installing a mirror in the transmitted light illumination
path of a standard inverted optical microscope can readily be implemented in other
microscopy and spectroscopy applications with isotropic light distribution or predominantly
forward-directed signals, i.e. fluorescence microscopy of individual cells or molecules,
spontaneous Raman micro-spectroscopy, stimulated Raman spectroscopy (SRS), or second
harmonic generation (SHG) microscopy.
Acknowledgements
We would like to thank Dr. James Chan and Sonny Ly for useful suggestions and help with
the CARS microscope system. This work was supported by funding from the National
Science Foundation. The Center for Biophotonics, an NSF Science and Technology Center, is
managed by the University of California, Davis, under Cooperative Agreement No. PHY
0120999. T. Weeks is supported by a Howard Hughes Medical Institute fellowship, and the
Keaton-Raphael memorial gift fund. J. Rutledge acknowledges the Richard A. and Nora
Eccles Harrison Endowed Chair in Diabetes Research, and National Institutes of Health grant
HL78615 for support. J. Sampson is supported by a supplement to HL78615. T. Huser also
acknowledges support by the Clinical Translational Science Center under grant number UL1
RR024146 from the National Center for Research Resources (NCRR), a component of the
National Institutes of Health (NIH), and the NIH Roadmap for Medical Research.