Simulation of Fluid Flow in DI Diesel Engine for Different Bowl ...
8
Simulation of Fluid Flow in DI Diesel Engine for Different Bowl Configurations Dr. A. Sreekanth Gowd Principal, Bheema Institute of Technology & Science, Adoni, Kurnool (Dist.), A.P, India. Prof. K. Hemachandra Reddy Registrar, JNT University Anantapur, Anantapuramu, A.P, India Dr. M. Srinivasa Reddy Technical Assistant, JNTUA College of Engineering Anantapur, Anantapuramu, A.P, India Abstract— Understanding in-cylinder gas dynamics by conducting experiments is rather difficult. Every parameter, such as piston shape, injector inclination and mixing process has to be carefully examined. For this purpose numerical simulation techniques are being used to predict in-cylinder fluid behavior. STAR-CD a general purpose finite volume CFD code is used. The STAR-CD (es-ICE) also provides an automated IC Engine mesh motion description methodology. Detailed investigations have been carried out with regard to the dynamic behavior of in-cylinder fluid motion in a single cylinder two valve DI Diesel engine with three different piston bowls viz., Mexican-hat Bowl, Hemispherical Bowl and Double swirl combustion Bowl. Study and comparison are done for different parameters like pressure, TKE and swirl for these geometries. The validation of the code is done by comparing the predicted global parameters with the experimental data available in the literature. Results are compared with three bowl configurations for different parameters and it is observed that Double Swirl Combustion Bowl gives the best for the engine under consideration. Keywords— Swirl ratio, Turbulent kinetic energy, Double swirl combustion bowl, Turbulence, Fuel injection. I. INTRODUCTION Increasing environmental concerns and legislated emission standards have lead to the necessity of both conventional and unconventional means for reducing soot and NO x emissions in diesel engines. The need for faster, cleaner, and more fuel- efficient engines is from society‟s desires and regulatory mandates. This poses a very complex problem for engine designers, since many of these goals are competing. The process is further complicated because the in-cylinder fluid dynamics is still not fully understood. In the pursuit of these goals, it is necessary to have as a thorough understanding of engine phenomena. Direct injection diesel engines are widely used in industrial applications and as vehicular power sources and compact designs are used in passenger cars. Environment concerns have led to stringent emission regulations for diesel engines. Incomplete combustion is mainly responsible for the emissions, and better mixture formation would be the best way to improve the combustion and emission quality. Effective spray mixing process in a DI diesel engine is the most important factor to improve the engine performance such as power, exhaust emissions, fuel consumption are affected drastically by the shape and the arrangement of the combustion chamber. Also, the in-cylinder fluid motion and thermodynamic parameters such as temperature and pressure greatly influence fuel-air mixing. II. PREVIOUS WORK Over the past one and half decades many models have been reported for two and three dimensional engine flows with fuel spray and combustion (1-7) . Much progress has been made in IC engine model development in recent years. The development is rapid in the last five years with the advent of high-speed computational facilities and experimental methods that provide a base for verifying the model computations. Because of the complications in the modeling of the ignition and combustion processes in DI diesel engines, it is not yet possible to model all the phenomena in a comprehensive manner. Even the most sophisticated fluid dynamic based codes now available are not able to reveal complete details of the engine process. III. THEORETICAL MODEL The gas flow within the cylinder is extremely complex and three-dimensional. They are unsteady and turbulent in nature due to the reciprocating piston movement. In the present work a time marching three-dimensional, finite difference program is used to steady the fluid flow. This program solves three- dimensional differential equations of conservation of mass, momentum, energy and species concentrations. To get the solution for a continuum problem such as flow field inside the engine cylinder, the continuum is represented by a finite number of discretization. This means to divide the region of interest into a number of small cells. These cells form a mesh, which serves as a framework for constructing finite volume approximations to the governing partial differential equations. The time variable is similarly discretized into a sequence of small time intervals called time steps and a transient solution is marched out in time. The following section presents the basic governing equations. 2605 International Journal of Engineering Research & Technology (IJERT) Vol. 3 Issue 2, February - 2014 ISSN: 2278-0181 www.ijert.org IJERTV3IS21177
-
Upload
khangminh22 -
Category
Documents
-
view
5 -
download
0
Transcript of Simulation of Fluid Flow in DI Diesel Engine for Different Bowl ...

Simulation of Fluid Flow in DI Diesel Engine for
Different Bowl Configurations
Dr. A. Sreekanth Gowd Principal, Bheema Institute of Technology & Science,
Adoni, Kurnool (Dist.), A.P, India.
Prof. K. Hemachandra Reddy Registrar, JNT University Anantapur,
Anantapuramu, A.P, India
Dr. M. Srinivasa Reddy Technical Assistant, JNTUA College of Engineering Anantapur,
Anantapuramu, A.P, India
Abstract— Understanding in-cylinder gas dynamics by
conducting experiments is rather difficult. Every parameter, such
as piston shape, injector inclination and mixing process has to be
carefully examined. For this purpose numerical simulation
techniques are being used to predict in-cylinder fluid behavior.
STAR-CD a general purpose finite volume CFD code is used. The
STAR-CD (es-ICE) also provides an automated IC Engine mesh
motion description methodology.
Detailed investigations have been carried out with
regard to the dynamic behavior of in-cylinder fluid motion in a
single cylinder two valve DI Diesel engine with three different
piston bowls viz., Mexican-hat Bowl, Hemispherical Bowl and
Double swirl combustion Bowl. Study and comparison are done
for different parameters like pressure, TKE and swirl for these
geometries. The validation of the code is done by comparing the
predicted global parameters with the experimental data available
in the literature. Results are compared with three bowl
configurations for different parameters and it is observed that
Double Swirl Combustion Bowl gives the best for the engine
under consideration.
Keywords— Swirl ratio, Turbulent kinetic energy, Double swirl
combustion bowl, Turbulence, Fuel injection.
I. INTRODUCTION
Increasing environmental concerns and legislated emission
standards have lead to the necessity of both conventional and
unconventional means for reducing soot and NOx emissions in
diesel engines. The need for faster, cleaner, and more fuel-
efficient engines is from society‟s desires and regulatory
mandates. This poses a very complex problem for engine
designers, since many of these goals are competing. The
process is further complicated because the in-cylinder fluid
dynamics is still not fully understood. In the pursuit of these
goals, it is necessary to have as a thorough understanding of
engine phenomena.
Direct injection diesel engines are widely used in industrial
applications and as vehicular power sources and compact
designs are used in passenger cars. Environment concerns
have led to stringent emission regulations for diesel engines.
Incomplete combustion is mainly responsible for the
emissions, and better mixture formation would be the best way
to improve the combustion and emission quality. Effective
spray mixing process in a DI diesel engine is the most
important factor to improve the engine performance such as
power, exhaust emissions, fuel consumption are affected
drastically by the shape and the arrangement of the
combustion chamber. Also, the in-cylinder fluid motion and
thermodynamic parameters such as temperature and pressure
greatly influence fuel-air mixing.
II. PREVIOUS WORK
Over the past one and half decades many models have been
reported for two and three dimensional engine flows with fuel
spray and combustion (1-7)
. Much progress has been made in IC
engine model development in recent years. The development is
rapid in the last five years with the advent of high-speed
computational facilities and experimental methods that provide
a base for verifying the model computations. Because of the
complications in the modeling of the ignition and combustion
processes in DI diesel engines, it is not yet possible to model
all the phenomena in a comprehensive manner. Even the most
sophisticated fluid dynamic based codes now available are not
able to reveal complete details of the engine process.
III. THEORETICAL MODEL
The gas flow within the cylinder is extremely complex and
three-dimensional. They are unsteady and turbulent in nature
due to the reciprocating piston movement. In the present work
a time marching three-dimensional, finite difference program
is used to steady the fluid flow. This program solves three-
dimensional differential equations of conservation of mass,
momentum, energy and species concentrations. To get the
solution for a continuum problem such as flow field inside the
engine cylinder, the continuum is represented by a finite
number of discretization. This means to divide the region of
interest into a number of small cells. These cells form a mesh,
which serves as a framework for constructing finite volume
approximations to the governing partial differential equations.
The time variable is similarly discretized into a sequence of
small time intervals called time steps and a transient solution
is marched out in time. The following section presents the
basic governing equations.
2605
International Journal of Engineering Research & Technology (IJERT)
Vol. 3 Issue 2, February - 2014
IJERT
IJERT
ISSN: 2278-0181
www.ijert.orgIJERTV3IS21177

Governing Equations:
The governing equations are written in vector notations.
The unit vectors in the x,y, and z, directions are denoted by i, j
and k respectively. The position vector x is denoted by
zkyjxix )1(
The vector operator is given by
zk
yj
xi
)2(
and the fluid velocity vector u is given by
3),,,(),,,(),,,( ktzyxwjtzyxvitzyxuu
Where „t‟ is the time. Here xx and uu
The program solves the equations of motion for fluid along
with the equations for spray droplets and chemical kinetics.
IV. BOUNDARY CONDITIONS
Temperature and velocity boundary conditions are required
to calculate the flow field computational domain. In this work
the law of the wall boundary condition is considered to resolve
boundary layer near the solid walls while calculating
velocities as shown below.
a) When the wall is flat the components of tangential velocity
are calculated.
b) When the wall is having curvature is one direction, the
component of tangential velocity in the direction of
curvature is set to zero and the other component in the
direction of no curvature is set equal to the next closest
corner(but not on the wall).
c) When the wall is curved in both principal directions (the
case of hemispherical bowl) both components of tangential
velocity are set to zero.
The normal velocity is always set equal to the velocity of
the corresponding wall.
In the present work an attempt is made to investigate the
dynamic behavior of in-cylinder fluid motion in a single
cylinder DI Diesel engine with different piston bowls viz;
(Hemispherical bowl, Mexican-hat and double swirl
combustion chamber). Fluid flow behavior in the combustion
chamber is predicted using the scheme STAR-CD. The
ECFM-3Z combustion model has been invoked to analyze
combustion for n-Dodecane liquid fuel. An attempt is made to
compare the capabilities of two turbulence models viz; 1) k- /
High Reynolds number, 2) k- /Quadratic/ high-Reynolds
number.
V. MESH GENERATION FOR SECTOR
Only the sector of engine domain has been considered to
simulate combustion process. The combustion process
simulated between the piston positions 400 before TDC (680
0)
and 800 after TDC (800
0). 120
0 crank angle variation only is
considered to minimize the computational time and computer
storage requirements. During this crank angle period both the
inlet and exhaust valves will be in closed position. Hence, the
effect of valves is not considered. 450 sectors considered for
the analysis.
The simulation requires a moving mesh and boundary
algorithm embedded into the STAR-CD programme. The
moving mesh and boundary algorithm for this engine model
has been developed inside STAR-CD by declaring the events
for each time step and then activating the grid in order to
move the mesh. The concept of moving mesh is that the cell is
squeezed to zero volume over one time step, with all its
contents (pressure, temperature, mass, momentum, enthalpy,
etc.) being expelled into the neighboring cells. Hence,
conservation is satisfied exactly even with removal of any cell
layer. On the other hand, when the cell layers are added, they
grow from zero size to their full volume, absorbing the
conserved variables through their faces.
VI. ANALYSIS SETUP
Apply initial and boundary condition like in-cylinder
pressure, temperature, swirl ratio and temperatures of cylinder
wall, cylinder dome and piston crown at that particular crank
angle position. For multi phase treatment Lagrangian multi
phase is used. Locate the injector location by creating the
coordinate at that point. The z-direction shows the axis of
injector. Select the required turbulence model for the analysis.
For the problem setup the time domain is taken as transient
and the density properties are set to Ideal. For the momentum
and turbulence the differencing scheme MARS is used. Under
relaxation for pressure correction is set to 0.3.
The fuel considered for the analysis is n-Dodecane with
cetane number 60. The properties of the fuel considered for
the analysis is given in Table 5.1. The standard model is used
for momentum transfer, mass transfer and heat transfer, Reitz
model is used for droplet breakup, Bai model is used for
droplet-wall interaction. For fuel injection Huh atomization
model is use.
VII. RESULTS AND DISCUSSION
1) Validation of Code with Experimental Results:
It is important to validate the results obtained with the code
to ascertain the accuracy of prediction. The effort made is to
validate the code by comparing the predicted pressure Vs
crank angle curve and heat release rate curve with the
experimental p- and heat release rate curves published by
Tree and faster. The test engine considered by Tree and faster
has Mexican hat bowl and the fuel injection starts at 22.50
bTDC and end at 10.50 aTDC. The computations are
performed for the engine with the same specifications and
engine geometry so that the comparisons is justified.
Predictive capability of any CFD code, particularly when
applied to the complex fluid dynamic problems such as in-
cylinder flows in diesel engines, depends on the turbulence
models employed. The predictions are carried out by
employing k- / High Reynolds number (k- -high) and k-
/Quadratic/ high-Reynolds number (k- -quad) turbulence
models. These models have been identified after careful
review of the literature.
The global in-cylinder pressures and heat release rates are
predicted for the engine specifications given in Table.1. The
predicted global pressure variations and heat release rate with
crank angle are compared with those taken from literature[7].
2606
International Journal of Engineering Research & Technology (IJERT)
Vol. 3 Issue 2, February - 2014
IJERT
IJERT
ISSN: 2278-0181
www.ijert.orgIJERTV3IS21177
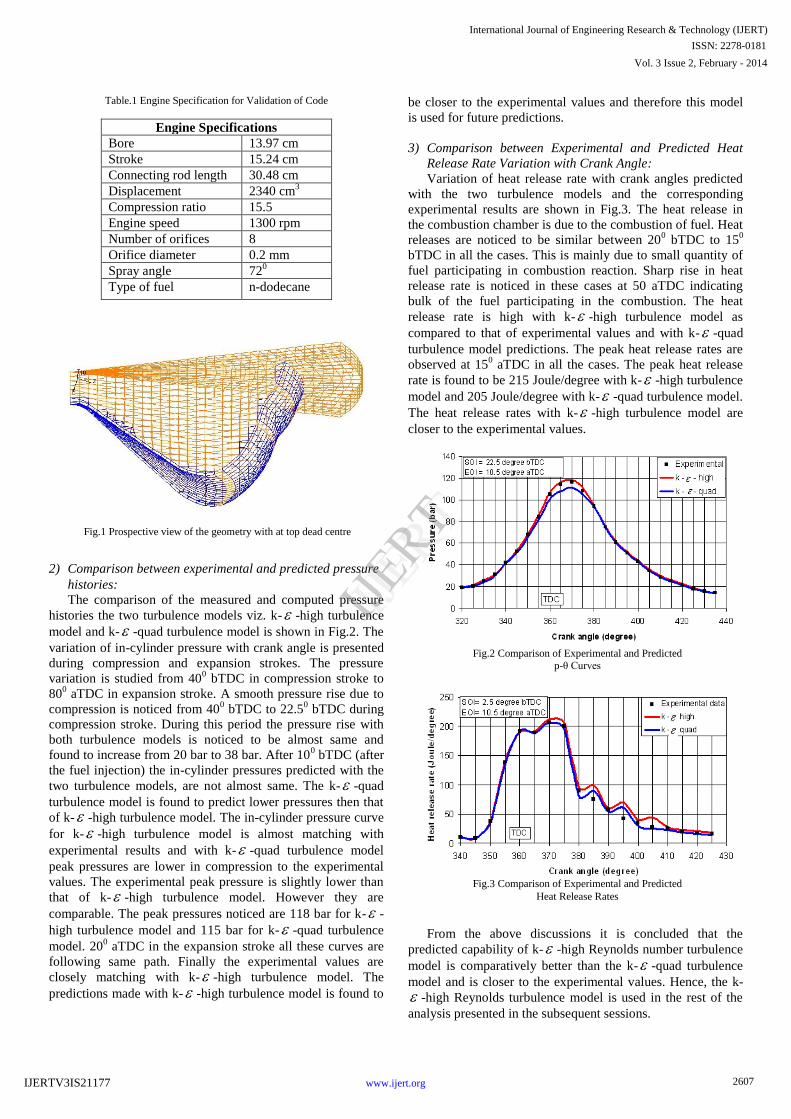
Table.1 Engine Specification for Validation of Code
Engine Specifications
Bore 13.97 cm
Stroke 15.24 cm
Connecting rod length 30.48 cm
Displacement 2340 cm3
Compression ratio 15.5
Engine speed 1300 rpm
Number of orifices 8
Orifice diameter 0.2 mm
Spray angle 720
Type of fuel n-dodecane
2) Comparison between experimental and predicted pressure
histories:
The comparison of the measured and computed pressure
histories the two turbulence models viz. k- -high turbulence
model and k- -quad turbulence model is shown in Fig.2. The
variation of in-cylinder pressure with crank angle is presented
during compression and expansion strokes. The pressure
variation is studied from 400 bTDC in compression stroke to
800 aTDC in expansion stroke. A smooth pressure rise due to
compression is noticed from 400 bTDC to 22.5
0 bTDC during
compression stroke. During this period the pressure rise with
both turbulence models is noticed to be almost same and
found to increase from 20 bar to 38 bar. After 100 bTDC (after
the fuel injection) the in-cylinder pressures predicted with the
two turbulence models, are not almost same. The k- -quad
turbulence model is found to predict lower pressures then that
of k- -high turbulence model. The in-cylinder pressure curve
for k- -high turbulence model is almost matching with
experimental results and with k- -quad turbulence model
peak pressures are lower in compression to the experimental
values. The experimental peak pressure is slightly lower than
that of k- -high turbulence model. However they are
comparable. The peak pressures noticed are 118 bar for k- -
high turbulence model and 115 bar for k- -quad turbulence
model. 200 aTDC in the expansion stroke all these curves are
following same path. Finally the experimental values are
closely matching with k- -high turbulence model. The
predictions made with k- -high turbulence model is found to
be closer to the experimental values and therefore this model
is used for future predictions.
3) Comparison between Experimental and Predicted Heat
Release Rate Variation with Crank Angle:
Variation of heat release rate with crank angles predicted
with the two turbulence models and the corresponding
experimental results are shown in Fig.3. The heat release in
the combustion chamber is due to the combustion of fuel. Heat
releases are noticed to be similar between 200 bTDC to 15
0
bTDC in all the cases. This is mainly due to small quantity of
fuel participating in combustion reaction. Sharp rise in heat
release rate is noticed in these cases at 50 aTDC indicating
bulk of the fuel participating in the combustion. The heat
release rate is high with k- -high turbulence model as
compared to that of experimental values and with k- -quad
turbulence model predictions. The peak heat release rates are
observed at 150 aTDC in all the cases. The peak heat release
rate is found to be 215 Joule/degree with k- -high turbulence
model and 205 Joule/degree with k- -quad turbulence model.
The heat release rates with k- -high turbulence model are
closer to the experimental values.
From the above discussions it is concluded that the
predicted capability of k- -high Reynolds number turbulence
model is comparatively better than the k- -quad turbulence
model and is closer to the experimental values. Hence, the k-
-high Reynolds turbulence model is used in the rest of the
analysis presented in the subsequent sessions.
Fig.1 Prospective view of the geometry with at top dead centre
Fig.2 Comparison of Experimental and Predicted
p-θ Curves
Fig.3 Comparison of Experimental and Predicted
Heat Release Rates
2607
International Journal of Engineering Research & Technology (IJERT)
Vol. 3 Issue 2, February - 2014
IJERT
IJERT
ISSN: 2278-0181
www.ijert.orgIJERTV3IS21177
4) Results and Discussion for Different Combustion Chamber
Configurations:
In spite of the capabilities of most comprehensive CFD codes,
they cannot entirely predict the complete details due to
complex in-cylinder flow dynamics. The important aspect in
presentation of the results is to process, organise and present
the huge data generated by the code. Therefore, it is necessary
to present this information in a comprehensive form. In order
to study the influences of combustion chamber shape on the
fluid flow near TDC, CFD calculations for the compression
and expansion stroke have been performed in a single cylinder
DI Diesel engine with different piston bowl geometries viz;
Hemispherical bowl, Mexican hat bowl and Double swirl
combustion bowl.
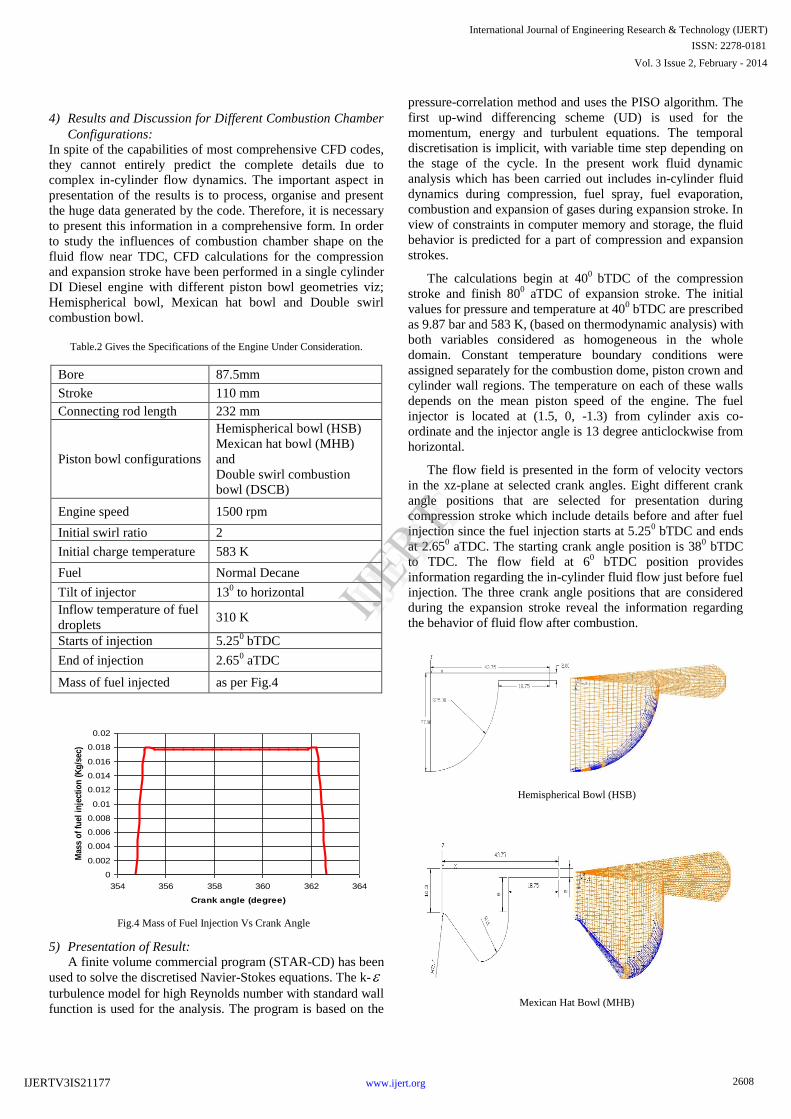
Table.2 Gives the Specifications of the Engine Under Consideration.
Bore 87.5mm
Stroke 110 mm
Connecting rod length 232 mm
Piston bowl configurations
Hemispherical bowl (HSB)
Mexican hat bowl (MHB)
and
Double swirl combustion
bowl (DSCB)
Engine speed 1500 rpm
Initial swirl ratio 2
Initial charge temperature 583 K
Fuel Normal Decane
Tilt of injector 130 to horizontal
Inflow temperature of fuel
droplets 310 K
Starts of injection 5.250 bTDC
End of injection 2.650 aTDC
Mass of fuel injected as per Fig.4
5) Presentation of Result:
A finite volume commercial program (STAR-CD) has been
used to solve the discretised Navier-Stokes equations. The k-
turbulence model for high Reynolds number with standard wall
function is used for the analysis. The program is based on the
pressure-correlation method and uses the PISO algorithm. The
first up-wind differencing scheme (UD) is used for the
momentum, energy and turbulent equations. The temporal
discretisation is implicit, with variable time step depending on
the stage of the cycle. In the present work fluid dynamic
analysis which has been carried out includes in-cylinder fluid
dynamics during compression, fuel spray, fuel evaporation,
combustion and expansion of gases during expansion stroke. In
view of constraints in computer memory and storage, the fluid
behavior is predicted for a part of compression and expansion
strokes.
The calculations begin at 400
bTDC of the compression
stroke and finish 800 aTDC of expansion stroke. The initial
values for pressure and temperature at 400 bTDC are prescribed
as 9.87 bar and 583 K, (based on thermodynamic analysis) with
both variables considered as homogeneous in the whole
domain. Constant temperature boundary conditions were
assigned separately for the combustion dome, piston crown and
cylinder wall regions. The temperature on each of these walls
depends on the mean piston speed of the engine. The fuel
injector is located at (1.5, 0, -1.3) from cylinder axis co-
ordinate and the injector angle is 13 degree anticlockwise from
horizontal.
The flow field is presented in the form of velocity vectors
in the xz-plane at selected crank angles. Eight different crank
angle positions that are selected for presentation during
compression stroke which include details before and after fuel
injection since the fuel injection starts at 5.250 bTDC and ends
at 2.650 aTDC. The starting crank angle position is 38
0 bTDC
to TDC. The flow field at 60 bTDC position provides
information regarding the in-cylinder fluid flow just before fuel
injection. The three crank angle positions that are considered
during the expansion stroke reveal the information regarding
the behavior of fluid flow after combustion.
0
0.002
0.004
0.006
0.008
0.01
0.012
0.014
0.016
0.018
0.02
354 356 358 360 362 364
Crank angle (degree)
Mas
s o
f fu
el i
nje
ctio
n (
Kg
/sec
)
Fig.4 Mass of Fuel Injection Vs Crank Angle
Hemispherical Bowl (HSB)
Mexican Hat Bowl (MHB)
2608
International Journal of Engineering Research & Technology (IJERT)
Vol. 3 Issue 2, February - 2014
IJERT
IJERT
ISSN: 2278-0181
www.ijert.orgIJERTV3IS21177

Fig. 5 Piston Bowl Geometries & Pictorial View of Computational Mesh for 450 Sectors at TDC
6) Effect of Piston BowlConfiguration:
The combustion chamber geometry significantly influences the
in-cylinder fluid dynamics, fuel-air mixing and combustion
characteristics. It is therefore important to study the effect of
piston-bowl configuration on these characteristics. An attempt
is made to study the effect of bowl configuration on the fluid
flow. The three bowl configurations considered for the analysis
are (i) the popular hemispherical bowl (HSB) (ii) Mexican hat
bowl (MHB) and (iii) Double swirl combustion bowl (DSCB).
The details of these bowl geometries are given in Fig.6.5. The
bowl dimensions are selected in such a way that the bowl lip
diameter and volume of combustion chamber remains same in
all the three cases. Considering the symmetry, computations
have been carried out on a 450 sector, which includes the
cylinder and piston bowl. The number of cells in the sector
varies from 66,368 (2,192 Tetrahedral cells and 64,176
Hexahedral cells) at BDC to 7,104 at TDC for HSB. The
number of cells in case of MHB varies from 75,024 (1,520
Tetrahedral cells and 73,504 Hexahedral cells) at BDC to
12,804 at TDC. DSCB sector has highest number of cells
compared to HSB and MHB. It has 90,736 (2,176 Tetrahedral
cells and 88,528 Hexahedral cells) at BDC to 11,024 at TDC.
Coarse mesh type is preferred above the piston and fine mesh
is used in the bowl region because most of the flow field action
takes place in the bowl.
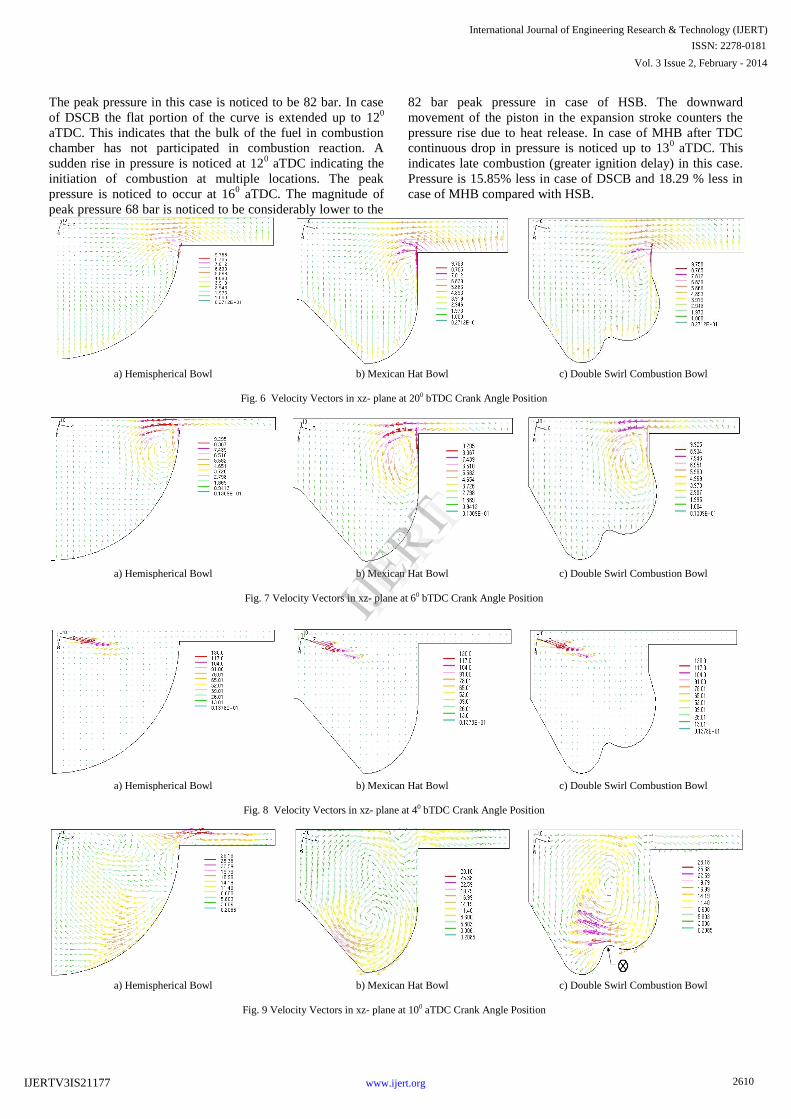
At 200 bTDC (Fig.6) the maximum velocities are noticed at
the bowl lip in all the three cases. At this stage the maximum
velocities are 8.97 m/s, 9.758 m/s and 9.38 m/s in HSB, MHB
and DSCB respectively. The fluid particles are seen entering
into the bowl in case of MHB and DSCB. The entry of the fluid
particles into the bowl from the squish region and vertical
upward orientation of the fluid particles in the bowl counter
each other forming a clear vortex motion in these two cases.
The establishment of a vortex motion is not very clear in case
of HSB. This can be attributed to the relatively low velocities
in the Hemi spherical bowl. A similar trend is noticed at 60
bTDC (Fig.7) just before the fuel injection in all the three
cases. The vortex zones are noticed to intensify further and
occupy considerable portion of the bowl in case of DSCB. The
shape of DSCB is the main reason for influencing the
augmentation and strengthening of the vortex motion.
The fuel is injected at 5.250 bTDC, the velocity vector
plots at 40 bTDC (Fig.8), a little after fuel injection, the
velocity vectors near the fuel injector is noticed to be oriented
in the direction of the jet. Very high velocities in the range of
110 to 130 m/s are noticed in the fuel jet. The high pressure
fuel particles appear to push the fluid molecules in the
direction of fuel injection due to the momentum exchange
between spray droplets and fluid molecules. At this stage
velocity decay occurs in case of MHB and DSCB and this is
attributed to large wall friction losses due to the higher surface
to volume ratio in these two cases compared to HSB.
Minimum velocity 0.0137 m/s is noticed in case of MHB,
where as the minimum velocity in case of HSB is 0.044 m/s.
However, the increased diffusion due to the vortex motion is
resulting in higher turbulence in the case of DSCB. From the
plots it can be concluded that the shape of the bowl has a
strong influence on the structure of the fluid motion in the
piston bowl.
At 100 aTDC (Fig.9) the piston already has started moving
towards the BDC due to expansion stroke. Fuel injection is
assumed to terminate at 2.650 aTDC. At this stage the entire
fuel has been injected into the combustion chamber. By this
time a reverse squish flow (fluid flow from the bowl region to
squish region) is noticed in all the three cases. The velocities
in all three combustion chambers are noticed to increase
considerably. This can be attributed to the combustion related
pressure pulses. The vortex formation is strong and occupies
major portion of the bowl region in case of DSCB. The
magnitude of velocities are appreciably high at the location
“ ” (Ref.Fig.9©). The vortex formation in case of MHB is
not as strong as that of DSCB and the location is near the
bottom of the bowl. Poor swirling motion in HSB, as noticed
from Fig.9(a), can be takes as a cause for poor fuel-air mixing.
At 200 aTDC (Fig.10) majority of the fluid in the
combustion chamber are the burnt gases. At this stage the
velocities noticed in HSB are considerably low as compared to
the other two cases. The maximum velocity noticed is 8.9 m/s,
whereas, the maximum velocities noticed in case of MHB and
DSCB are around 14 m/s. It is noticed that the swirling flow in
squish region is strong due to angular momentum movement
from bowl region to squish region in case of MHB and DSCB.
7) Comparisions of Pressure Variations with Crank Angle for
Different Bowl Configurations:
Fig.11 presents the variation of in-cylinder pressure with
crank angle during compression and expansion strokes. The
pressure variation is studied from 400 bTDC in compression
stroke to 800 aTDC in expansion stroke. A smooth pressure
rise due to compression is noticed from 400 bTDC to 5
0 bTDC
during compression stroke. The pressure rise is noticed to be
same for all the three bowl configurations, as the volume of
the piston bowls is the same. During this period the pressure is
noticed to increase from 9.87 bar to 45 bar. After the
commencement of fuel injection i.e., after 5.250 bTDC a slight
drop in the in-cylinder pressure is noticed in all three cases.
This can be attributed to the fact that the injected fuel
evaporates taking energy from the air which results in slight
drop in in-cylinder temperature and hence pressure. During the
expansion stroke for about 40 aTDC the pressure curve is seen
to be almost flat indicating pre-flame reaction carrying slight
increase in pressure which is nullified by the expansion of
gases. At about 70 aTDC a rapid rise in pressure is noticed in
case of HSB. This can be due to the bulk of the fuel burning.
Double Swirl Combustion bowl (DSCB)
2609
International Journal of Engineering Research & Technology (IJERT)
Vol. 3 Issue 2, February - 2014
IJERT
IJERT
ISSN: 2278-0181
www.ijert.orgIJERTV3IS21177
The peak pressure in this case is noticed to be 82 bar. In case
of DSCB the flat portion of the curve is extended up to 120
aTDC. This indicates that the bulk of the fuel in combustion
chamber has not participated in combustion reaction. A
sudden rise in pressure is noticed at 120 aTDC indicating the
initiation of combustion at multiple locations. The peak
pressure is noticed to occur at 160 aTDC. The magnitude of
peak pressure 68 bar is noticed to be considerably lower to the
82 bar peak pressure in case of HSB. The downward
movement of the piston in the expansion stroke counters the
pressure rise due to heat release. In case of MHB after TDC
continuous drop in pressure is noticed up to 130 aTDC. This
indicates late combustion (greater ignition delay) in this case.
Pressure is 15.85% less in case of DSCB and 18.29 % less in
case of MHB compared with HSB.
a) Hemispherical Bowl b) Mexican Hat Bowl c) Double Swirl Combustion Bowl
Fig. 6 Velocity Vectors in xz- plane at 200 bTDC Crank Angle Position
a) Hemispherical Bowl b) Mexican Hat Bowl c) Double Swirl Combustion Bowl
Fig. 7 Velocity Vectors in xz- plane at 60 bTDC Crank Angle Position
a) Hemispherical Bowl b) Mexican Hat Bowl c) Double Swirl Combustion Bowl
Fig. 8 Velocity Vectors in xz- plane at 40 bTDC Crank Angle Position
a) Hemispherical Bowl b) Mexican Hat Bowl c) Double Swirl Combustion Bowl
Fig. 9 Velocity Vectors in xz- plane at 100 aTDC Crank Angle Position
2610
International Journal of Engineering Research & Technology (IJERT)
Vol. 3 Issue 2, February - 2014
IJERT
IJERT
ISSN: 2278-0181
www.ijert.orgIJERTV3IS21177

a) Hemispherical Bowl b) Mexican Hat Bowl c) Double Swirl Combustion Bowl
Fig. 10 Velocity Vectors in xz- plane at 200 aTDC Crank Angle Position
8) Comparison of Turbulent Kinetic Energy Variation with
Crank Angle for Different Bowl Configurations:
Fig.12 presents the average Turbulent Kinetic Energy
(TKE) Vs crank angle plots for HSB, MHB and DSCB cases.
From the figure it is observed that TKE levels are slightly low
in case of HSB and MHB till the time of fuel injection. During
this period the TKE is noticed to be higher, in case of DSCB
due to the stronger swirl effects. A sharp rise in turbulent
kinetic energy is noticed in all the three cases, with the
commencement of fuel injection. The peak TKE‟s is noticed
to occur at around 40 aTDC, the peak values estimated from
Fig. 12 are 45, 47 and 31 m2/s
2 for HSB, DSCB and MHB.
Sharp fall in TKE is noticed after the completion of fuel
injection as the piston started moving down during the
expansion stroke. Interestingly a sudden rise in the TKE plots
is noticed at 90 aTDC for HSB, 12
0 aTDC for DSCB and 16
0
aTDC for MHB. These bumps indicate the increase in
turbulent kinetic energy due to initiation of combustion. From
the end of fuel injection to 400 aTDC the TKE of DSCB is
noticed to be higher than the TKE‟s of the other two bowls.
The fluid motion during the period greatly affects the fuel-air
mixing and combustion. Higher TKE in case of DSCB
indicate that the bowl shape augments compression swirl.
From 400 aTDC onwards the TKE of the three bowls behave
similar. The TKE is 37.78 % less in case of MHB compared
with HSB and DSCB.
9) Comparision of Swirl Ratio Variations with Crank Angle
for Different Bowl Configurtions:
Fig. 13, 14 and 15 presents the squish, swirl and tumble
ratios Vs crank angle plots for different bowl configurations in
x, y and z axis respectively. These ratios depends on angular
momentum of fluid which is influenced by bowl shape, fuel
injection velocity, direction of fuel injection, combustion of
fuel also influence the flow direction and velocity of fluid
inside the combustion chamber. The squish ratios Vs crank
angle plots (Fig 13) indicate the compression squish is more or
less same for MHB and DSCB until the piston reaches TDC.
The bowl shape has a direct influence on squish ratio during
this period. The squish ratio is noticed to be lower by 0.6 in
case of HSB. The initiation of the combustion appears to
affect the squish ratios due to the sudden expansion of gases in
the combustion zones. These are noticed at 90 aTDC for HSB,
120 aTDC for DSCB and 16
0 aTDC for MHB. The rise in
squish ratio is noticed to be very sharp in case of HSB due to
reverse squish flows causing the sharp increase. At about 110
aTDC the squish ratios for the three bowls are noticed to be
the same. In case of MHB and DSCB, from 300 aTDC the
squish ratios are falling due to the increase in the combustion
chamber volume during the expansion stroke. In case of HSB
the squish ratio is increasing even after 200 aTDC this can be
attributed due to late combustion of considerable part of the
fuel in this case (combustion in case of HSB is highly
heterogeneous as discussed in velocity vector plots and
temperature contours). The squish ratio is falling very sharply
in the later part of the expansion stroke in HSB as bowl shape
is not supporting the squish.
The swirl ratio in y-axis (Fig.14) observed to follow
similar trend in case of MHB and DSCB up to the start of fuel
injection, where as in case of HSB it is different and the swirl
ratio is observed to be low compared to MHB and DSCB up to
the start of fuel injection. The high swirl ratio is observed in
case of HSB i.e. 4.0 (during the period of combustion) where
as in case of MHB it is 2.5 and in DSCB it is 3.5. A sudden
drop in swirl ratios is noticed immediately after the
combustion due to the increase in the combustion chamber
volume. A sharp fall in the y-axis swirl ratio is observed from
2.5 to 0.9 during 160 aTDC and 18
0 aTDC. Delayed
combustion (as late as 160 aTDC) appears to be the reason for
the sudden drop in the angular momentum. In case of DSCB
the swirl ratio is increased up to 50 aTDC and the swirl ratio is
observed 3.2 at 50 aTDC higher than that of MHB indicate the
suitability of DSC Bowl shape in the swirl point of view.
The tumble ratio in z-axis (tumble ratio) is observed from
the Fig.15 for different bowl configurations and it is constant
up to the fuel injection in all the cases. But the tumble ratio
before fuel injection in case of HSB is 2.9 and in case of MHB
and DSCB it is 1.4 this is because low squish effect in case of
HSB. The high pressure fuel jet, combustion chamber volume
affects the tumble ratio.
0
10
20
30
40
50
60
70
80
90
320 330 340 350 360 370 380 390 400 410 420 430 440
Crank angle (Degree)
In-c
yli
nd
er
Pre
ssu
re (
bar)
HSB
MHB
DSCB
SOI = 5.25 degree bTDC
EOI = 2.65 degree aTDC
TDC
Fig.11 Effect of Bowl Configuration on Volume-Averaged In-Cylinder
Pressure
2611
International Journal of Engineering Research & Technology (IJERT)
Vol. 3 Issue 2, February - 2014
IJERT
IJERT
ISSN: 2278-0181
www.ijert.orgIJERTV3IS21177

VIII. CONCLUSIONS
From the above work it is concluded that the Double swirl
combustion bowl (DSCB) is the best among the three bowl
configurations (Hemispherical bowl, Mexican hat bowl and
Double swirl combustion bowl). That is why In-cylinder
pressure is 15.85% less in case of DSCB and 18.29 % less in
case of MHB when compared with HSB. The TKE is 37.78 %
less in case of MHB compared with HSB and DSCB. Based
on the above facts and figures it is concluded that the Double
Swirl Combustion Chamber is the best for the engine under
consideration.
REFERENCES
[1] M. E. McCracken and J. Abraham,”Swirl-Spray Interactions in a Diesel Engine”. SAE Technical Paper. 2001-01-0996.
[2] Rahman M. Montajir, H. Tsunemoto and H. Ishitani., “Fuel Spray Behavior in a Small DI Diesel Engine: Effect of Combustion Chamber Geometry”. SAE Technical Paper. 2000-01-0946.
[3] G.M. Bianchi and P. Pelloni, ”Modeling the Diesel Fuel Spray Breakup by Using a Hybrid Model”, SAE Technical Paper.1999-01-0226.
[4] Yoshiyuki Kidoguchi, Changlin Yang and Kei Miwa, ”Effect of High Squish Combustion Chamber on Simultaneous Reduction of NOx and Particulate from a Direct-Injection Diesel Engine”, SAE Technical Paper. 1999-01-1502.
[5] Sung, N.W., Choi, J.S. and Jeong, Y.I., “A Study on the Flow in the Engine Intake System” SAE Paper No. 952067, 1995.
[6] Alex B.Liu, Daniel Mather and Rolf D. Reitz, “Modelling the Effects of Drop Drag and Up Fuel Sprays”, SAE Paper No. 930072, 1993.
[7] Tree, D. R., and Foster, D. E. "Optical Soot Particle-Size and Number Density-Measurements in a Direct-Injection Diesel-Engine", Combust. Sci. Technol., 95, 313-331, 1994.
0
5
10
15
20
25
30
35
40
45
50
320 330 340 350 360 370 380 390 400 410 420 430 440
Crank angle (Degree)
Tu
rb
ule
nt
Kin
eti
c E
nerg
y (
m2/s
2) HSB
MHB
DSCB
SOI = 5.25 degree bTDC
EOI = 2.65 degree aTDC
TDC
Fig.12 Effect of Bowl Configuration on Volume-Averaged Turbulent
Kinetic Energy
-2.5
-2
-1.5
-1
-0.5
0
0.5
1
1.5
2
320 330 340 350 360 370 380 390 400 410 420 430 440
Crank angle (Degree)
Sw
irl
rati
o
HSB
MHB
DSCB
SOI = 5.25 degree bTDC
EOI = 2.65 degree aTDC
TDC
Fig.13 Effect of Bowl Configuration on Swirl ration in X-direction
-2
-1
0
1
2
3
4
5
320 330 340 350 360 370 380 390 400 410 420 430 440
Crank angle (Degree)
Sw
irl
rati
o
HSB
MHB
DSCB
SOI = 5.25 degree bTDC
EOI = 2.65 degree aTDC
TDC
Fig.14 Effect of Bowl Configuration on Swirl Ratio in Y-direction
-0.5
0
0.5
1
1.5
2
2.5
3
3.5
320 330 340 350 360 370 380 390 400 410 420 430 440
Crank angle (Degree)
Sw
irl
rati
o
HSB
MHB
DSCB
SOI = 5.25 degree bTDC
EOI = 2.65 degree aTDC
TDC
Fig15. Effect of Bowl Configuration on Swirl Ratio in Z-direction
2612
International Journal of Engineering Research & Technology (IJERT)
Vol. 3 Issue 2, February - 2014
IJERT
IJERT
ISSN: 2278-0181
www.ijert.orgIJERTV3IS21177