
Simulation and exergy analysis of a hybrid Solid Oxide Fuel Cell (SOFC)–Gas Turbine System
22
Energy 31 (2006) 3278–3299 Simulation and exergy analysis of a hybrid Solid Oxide Fuel Cell (SOFC)–Gas Turbine System F. Calise a, , M. Dentice d’Accadia a , A. Palombo a , L. Vanoli b a DETEC—University of Naples Federico II, P.le Tecchio 80-80125, Napoli, Italy b DSA—University of Naples Federico II, Portici (NA), Italy Abstract The simulation and exergy analysis of a hybrid Solid Oxide Fuel Cell–Gas Turbine (SOFC–GT) power system are discussed in this paper. In the SOFC reactor model, it is assumed that only hydrogen participates in the electrochemical reaction and that the high temperature of the stack pushes the internal steam reforming reaction to completion; the unreacted gases are assumed to be fully oxidized in the combustor downstream of the SOFC stack. Compressors and GTs are modeled on the basis of their isentropic efficiency. As regards the heat exchangers and the heat recovery steam generator, all characterized by a tube-in-tube counterflow arrangement, the simulation is carried out using the thermal efficiency-NTU approach. Energy and exergy balances are performed not only for the whole plant but also for each component in order to evaluate the distribution of irreversibility and thermodynamic inefficiencies. Simulations are performed for different values of operating pressure, fuel utilization factor, fuel-to-air and steam-to-fuel ratios and current density. Results showed that, for a 1.5 MW system, an electrical efficiency close to 60% can be achieved using appropriate values of the most important design variables; in particular, the operating pressure and cell current density. When heat loss recovery is also taken into account, a global efficiency of about 70% is achieved. r 2006 Elsevier Ltd. All rights reserved. Keywords: SOFC; Modelling; Exergy 1. Introduction The Solid Oxide Fuel Cell (SOFC) is one of the most promising type of fuel cells. It is considered an excellent device for future power plants, expected to produce clean electrical energy at high conversion rates, low emissions and low noise levels [1–4]. This electrochemical device is based on a solid-state ion-conducting (O 2 ) electrolyte (yttria-stabilized zirconia), which requires high operating temperature (up to 1000 1C). Such temperatures impose several technological constraints on SOFC materials, but make this device very suitable for co-generation and/or coupling with gas turbines (GTs). The integration of an SOFC stack with GTs and other conventional devices, such as compressors and heat exchangers, is a very successful application, since an SOFC–GT hybrid system can reach net electrical and global efficiencies close to 70% and 85%, respectively [5–8]. ARTICLE IN PRESS www.elsevier.com/locate/energy 0360-5442/$ - see front matter r 2006 Elsevier Ltd. All rights reserved. doi:10.1016/j.energy.2006.03.006 Corresponding author. Tel.: +39 081 7682304; fax: +39 081 2390364. E-mail address: [email protected] (F. Calise).
Transcript of Simulation and exergy analysis of a hybrid Solid Oxide Fuel Cell (SOFC)–Gas Turbine System

ARTICLE IN PRESS
0360-5442/$ - se
doi:10.1016/j.en
�CorrespondE-mail addr
Energy 31 (2006) 3278–3299
www.elsevier.com/locate/energy
Simulation and exergy analysis of a hybrid Solid Oxide Fuel Cell(SOFC)–Gas Turbine System
F. Calisea,�, M. Dentice d’Accadiaa, A. Palomboa, L. Vanolib
aDETEC—University of Naples Federico II, P.le Tecchio 80-80125, Napoli, ItalybDSA—University of Naples Federico II, Portici (NA), Italy
Abstract
The simulation and exergy analysis of a hybrid Solid Oxide Fuel Cell–Gas Turbine (SOFC–GT) power system are
discussed in this paper. In the SOFC reactor model, it is assumed that only hydrogen participates in the electrochemical
reaction and that the high temperature of the stack pushes the internal steam reforming reaction to completion; the
unreacted gases are assumed to be fully oxidized in the combustor downstream of the SOFC stack. Compressors and GTs
are modeled on the basis of their isentropic efficiency. As regards the heat exchangers and the heat recovery steam
generator, all characterized by a tube-in-tube counterflow arrangement, the simulation is carried out using the thermal
efficiency-NTU approach. Energy and exergy balances are performed not only for the whole plant but also for each
component in order to evaluate the distribution of irreversibility and thermodynamic inefficiencies. Simulations are
performed for different values of operating pressure, fuel utilization factor, fuel-to-air and steam-to-fuel ratios and current
density. Results showed that, for a 1.5MW system, an electrical efficiency close to 60% can be achieved using appropriate
values of the most important design variables; in particular, the operating pressure and cell current density. When heat loss
recovery is also taken into account, a global efficiency of about 70% is achieved.
r 2006 Elsevier Ltd. All rights reserved.
Keywords: SOFC; Modelling; Exergy
1. Introduction
The Solid Oxide Fuel Cell (SOFC) is one of the most promising type of fuel cells. It is considered anexcellent device for future power plants, expected to produce clean electrical energy at high conversion rates,low emissions and low noise levels [1–4]. This electrochemical device is based on a solid-state ion-conducting(O�2) electrolyte (yttria-stabilized zirconia), which requires high operating temperature (up to 1000 1C). Suchtemperatures impose several technological constraints on SOFC materials, but make this device very suitablefor co-generation and/or coupling with gas turbines (GTs). The integration of an SOFC stack with GTs andother conventional devices, such as compressors and heat exchangers, is a very successful application, since anSOFC–GT hybrid system can reach net electrical and global efficiencies close to 70% and 85%, respectively[5–8].
e front matter r 2006 Elsevier Ltd. All rights reserved.
ergy.2006.03.006
ing author. Tel.: +39 081 7682304; fax: +39 081 2390364.
ess: [email protected] (F. Calise).

ARTICLE IN PRESS
Nomenclature
A cell active area (cm2)cp specific heat (kJ/kgK)exch�
molar-specific chemical exergy (kJ/kmol)exph mass-specific physical exergy (kJ/kg)E energy flow rate (kW)Exd
:exergy destruction rate (kW)
F Faraday’s constant (96,439C/moles of electrons)g�
Gibbs-specific molar energy (kJ/kmol)h specific enthalpy (kJ/kg)h�
specific molar enthalpy (kJ/kmol)i current density (mA/cm2)il limiting current density (mA/cm2)in internal current density (mA/cm2)i0 exchange current density (mA/cm2)I current (A)in internal current density (mA/cm2)L:
mechanical power (kW)m:
mass flow rate (kg/s)M molar mass (kmol/kg)n:
molar flow rate (mol/s)ne number of moles of electrons per mole of H2 reactedp pressure (bar)pref reference pressure (1 bar)pH2
hydrogen partial pressure (bar)pH2O
steam partial pressure (bar)pCH4
methane partial pressure (bar)Q:
heat flow rate (kW)R�
molar gas constant (8.31 kJ/kmol)s specific entropy (kJ/kg K)S:
gen entropy generation rate (kW)t temperature (1C)T temperature (K)Uf fuel utilization factorV,E cell voltage (V)x methane reforming rate of reactiony shift rate of reactionz electrochemical rate of reaction
Greek symbol
Zis isentropic efficiencyZex exergetic efficiencya charge transfer coefficientg exchange current density constant (mA/cm2)
Subscripts
f formations solid
F. Calise et al. / Energy 31 (2006) 3278–3299 3279

ARTICLE IN PRESS
ref reference statusGT gas turbineinlet inlet streamoutlet outlet streamcell SOFC stacka environmentvs saturated vaporl liquidC cathodeA anode
Superscripts
0 reference pressure
F. Calise et al. / Energy 31 (2006) 3278–32993280
In the last few years, many researchers were involved in the investigation of the SOFC stack and of thehybrid plant [9–13]. A number of their papers simulated the performance of several types of SOFC–GTsystems, analyzing their performance only from the energetic point of view [9–11]. More recently, a group ofpapers investigated stack performances paying special attention to its electrochemistry [9–12]. Some of them,investigated the stack or simple system also using the exergy analysis [14].
However, none of them investigated the inefficiencies of a complex hybrid SOFC–GT plant, analyzing thedistribution of the efficiency defects through its components. One of the aims of this present paper was topresent a detailed exergy analysis of a highly coupled SOFC–GT hybrid plant, paying special attention to thesources of inefficiency and analyzing their variations with respect to changes in their operational parameters.
Finally, this exergy analysis will be the basis for future works dealing with the thermoeconomicoptimization of the plant under investigation, with the aim of finding the optimum set of design parameters.The above-mentioned previous papers modeled the physical, chemical or electrochemical phenomena usingvery different approaches. This paper has also presented a consistent and complete set of equations for othersto use or improve on, for the stack and for all the components of the plant. Here, the simulation is carried outusing the MATLAB toolboxes. The simulation model is based on a number of parameters, dramaticallyaffecting the result coming out from the code. Thus, a literature review was performed in order to find themost reliable values of these parameters and the model is calibrated and validated, comparing results with datareported by Chan et al. [9–12], recording errors lower than 5%. For given design and operating conditions, thesimulation model provides the energy and exergy balances for the whole system and for all the components ofthe plant. The calculation of local and global exergy destruction rates will be the basis for successive studiesconcerning the thermodynamic and thermoeconomic optimization of the system.
2. System layout
Common SOFC operating temperatures require preheating of both the fuel and air streams in order toavoid excessive thermal stresses in the stack [3]. It is therefore mandatory to use heat exchangers that cantransfer the high thermal energy rates of SOFC outlet streams increasing air and fuel inlet temperature. Theheart of the system is the Internal Reforming SOFC (IRSOFC) stack that is based on the tubular technologypioneered by Siemens Westinghouse in the 1970s [1]. The steam needed to support the internal reformingreaction can be externally supplied by an external Heat Recovery Steam Generator (HRSG) [10].Alternatively, it may be obtained by re-circulating part of the anode outlet stream [15–19]. In this study, amore complex system layout is considered. It was assumed that steam is produced within the HRSG byheating up demineralized water with the outlet thermal energy of the gas–fuel heat exchanger. The systemlayout consists of air and fuel compressors, gas–air and gas–fuel heat exchangers, a HRSG, a pump, a mixer,the IRSOFC stack, a catalytic burner and two GTs (Fig. 1).

ARTICLE IN PRESS
Fig. 1. Plant layout.
F. Calise et al. / Energy 31 (2006) 3278–3299 3281
The operating principle of the plant can be summarized as follows: fuel (node 15) and air (node 1) streamsare compressed up to the stack operating pressure by the fuel and air compressors. Since the temperatures ofthe inlet streams are not high enough for the SOFC system, such streams must be preheated using two heatexchangers. The fuel–gas heat exchanger outlet temperature (node 9) is high enough to produce steam in theHRSG where demineralized water (node 11), pressurized by the pump, is conducted to the state ofsuperheated steam (node 13). Fuel coming from the heat exchanger (node 17) and steam must be mixed inorder to produce the mixture that will drive the internal steam reforming reaction. The preheated air stream(node 3) is fed to the cathodes of the fuel cell stack and the mixture of steam and fuel is carried to the SOFCanode. The electrochemical reaction occurs at the three phase boundaries of both electrodes, producing ionicflow through the electrolyte and electron flow across the electrodes. The DC current produced by the fuel cellsis converted into the more suitable AC current by using an appropriate inverter. The electrochemical reactionis dramatically exothermic: the heat produced is utilized partially to drive the internal steam reformingreaction and partially to heat up the cathode and anode stream temperature. Carbon monoxide and unutilizednatural gas and hydrogen (produced within the cell by the internal reforming reactions) are mixed with thedepleted air coming from the cathode stream (node 4C) and combusted in the catalytic burner. The outlet flowtemperature (node 5) is high enough to be used in the GTs. The first one is designed in order to cover all theinternal loads of the plant (compressors and pump); the second one, coupled with a proper electricalgenerator, supplies further electrical power. The GT exhaust flow (node 7) is finally used to preheat air(node 2) and fuel (node 16) inlet streams and to produce steam, as earlier described. The temperature of theHRSG outlet stream (node 10) allows production of low-quality heat, available for co-generation.
The whole system is analyzed on the basis of the following general assumptions: one-dimensional flow;steady state; thermodynamic equilibrium; negligible pressure drops; no gas leakage; negligible heat lossestoward the environment; negligible kinetic and gravitational terms in the energy and exergy balance equations.
Special attention is paid to the SOFC stack, as its performances depend on a number of parameters, such aspressure, temperature, gas composition, cell geometric parameters, cell electrochemical parameters, currentdensity, etc., creating a complex interdependence with the other components of the plant.
3. Thermodynamic properties of working fluids
The hybrid SOFC–GT system is fed by three different streams: air to SOFC cathode; superheated steam andfuel to mixer. The air composition is assumed to have the typical value of 80% N2 and 20% O2, neglecting itsargon, water and carbon dioxide content in the present work.
ARTICLE IN PRESS
Table 1
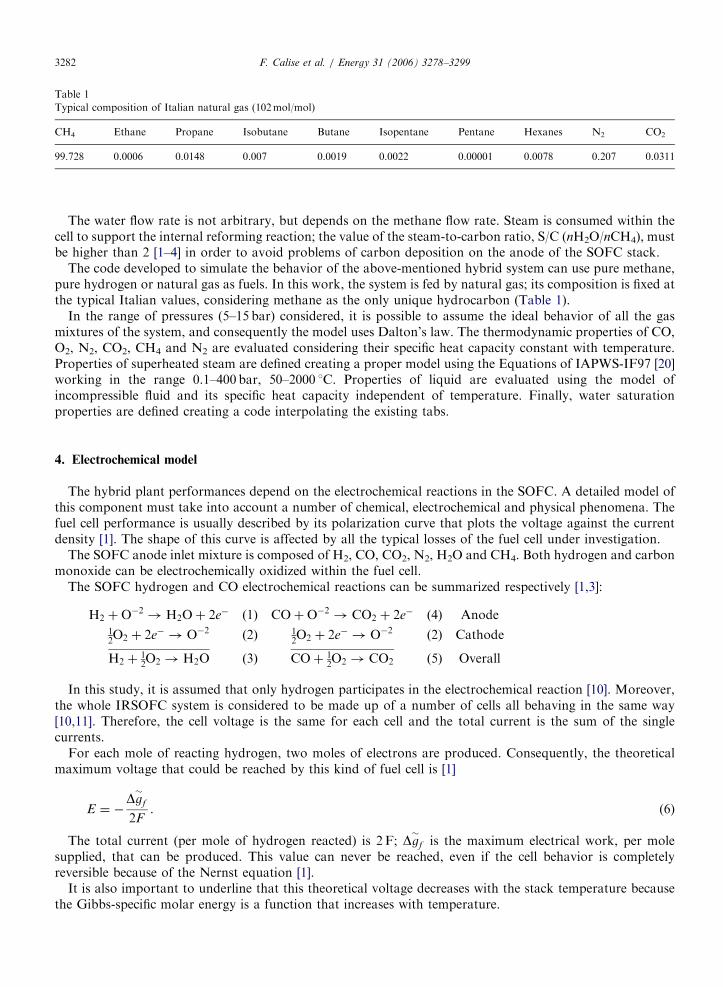
Typical composition of Italian natural gas (102mol/mol)
CH4 Ethane Propane Isobutane Butane Isopentane Pentane Hexanes N2 CO2
99.728 0.0006 0.0148 0.007 0.0019 0.0022 0.00001 0.0078 0.207 0.0311
F. Calise et al. / Energy 31 (2006) 3278–32993282
The water flow rate is not arbitrary, but depends on the methane flow rate. Steam is consumed within thecell to support the internal reforming reaction; the value of the steam-to-carbon ratio, S/C (nH2O/nCH4), mustbe higher than 2 [1–4] in order to avoid problems of carbon deposition on the anode of the SOFC stack.
The code developed to simulate the behavior of the above-mentioned hybrid system can use pure methane,pure hydrogen or natural gas as fuels. In this work, the system is fed by natural gas; its composition is fixed atthe typical Italian values, considering methane as the only unique hydrocarbon (Table 1).
In the range of pressures (5–15 bar) considered, it is possible to assume the ideal behavior of all the gasmixtures of the system, and consequently the model uses Dalton’s law. The thermodynamic properties of CO,O2, N2, CO2, CH4 and N2 are evaluated considering their specific heat capacity constant with temperature.Properties of superheated steam are defined creating a proper model using the Equations of IAPWS-IF97 [20]working in the range 0.1–400 bar, 50–2000 1C. Properties of liquid are evaluated using the model ofincompressible fluid and its specific heat capacity independent of temperature. Finally, water saturationproperties are defined creating a code interpolating the existing tabs.
4. Electrochemical model
The hybrid plant performances depend on the electrochemical reactions in the SOFC. A detailed model ofthis component must take into account a number of chemical, electrochemical and physical phenomena. Thefuel cell performance is usually described by its polarization curve that plots the voltage against the currentdensity [1]. The shape of this curve is affected by all the typical losses of the fuel cell under investigation.
The SOFC anode inlet mixture is composed of H2, CO, CO2, N2, H2O and CH4. Both hydrogen and carbonmonoxide can be electrochemically oxidized within the fuel cell.
The SOFC hydrogen and CO electrochemical reactions can be summarized respectively [1,3]:
H2 þO�2! H2Oþ 2e� ð1Þ COþO�2 ! CO2 þ 2e� ð4Þ Anode12O2 þ 2e� ! O�2 ð2Þ 1
2O2 þ 2e� ! O�2 ð2Þ Cathode
H2 þ12O2 ! H2O ð3Þ COþ 1
2O2! CO2 ð5Þ Overall
In this study, it is assumed that only hydrogen participates in the electrochemical reaction [10]. Moreover,the whole IRSOFC system is considered to be made up of a number of cells all behaving in the same way[10,11]. Therefore, the cell voltage is the same for each cell and the total current is the sum of the singlecurrents.
For each mole of reacting hydrogen, two moles of electrons are produced. Consequently, the theoreticalmaximum voltage that could be reached by this kind of fuel cell is [1]
E ¼ �Dg�
f
2F. (6)
The total current (per mole of hydrogen reacted) is 2 F; Dg�
f is the maximum electrical work, per molesupplied, that can be produced. This value can never be reached, even if the cell behavior is completelyreversible because of the Nernst equation [1].
It is also important to underline that this theoretical voltage decreases with the stack temperature becausethe Gibbs-specific molar energy is a function that increases with temperature.

ARTICLE IN PRESSF. Calise et al. / Energy 31 (2006) 3278–3299 3283
A theoretical maximum cell efficiency can be defined as follows:
Zmax ¼ �Dg�
f
Dh�
f
. (7)
The real reversible cell voltage depends on reactants’ partial pressures, stack temperature and operatingpressure. The Nernst voltage is given by
E ¼Dg�0
f
2Fþ
R�
T
2Flog
pH2
ffiffiffiffiffiffiffipO2
2p
pH2O
!. (8)
In order to keep high values of the reversible voltage, the hydrogen and oxygen partial pressures should besufficiently high, while the steam pressure should be low enough. This is the reason why the fuel and airutilization factors can never reach their unitary limit value [3].
The calculated fuel cell voltage (8) is obtained for an open circuit system. When the current produced by thecells is used for the external load, additional losses must be taken into account.
4.1. Activation overvoltage
Although the SOFC electrochemical reaction, consisting of the anode and cathode semireactions, is stronglyexothermic, the ‘activation energy’ must be supplied to overcome the ‘energy hill’, which means that if theprobability of a molecule having enough energy is low, then the reaction will only proceed slowly. This energybarrier depends on activation or charge-transfer polarization, determined by the charge transfer betweenelectronic and ionic conductors [1]. Therefore, the activation overpotential is the ‘energy hill’ that has to beovercome in order to drive the global electrochemical reaction.
This loss is described by the Butler–Volmer equation [11,12,21]:
i ¼ i0 exp aneF
RTs
V act
� �� exp �ð1� aÞ
neF
RTs
V act
� �� �. (9)
This formula must be applied to both anode and cathode semireactions in order to evaluate theirovervoltages. Their exchange current densities are taken from Yamamura and Mogensen [21]:
i0;anode ¼ ganode
pH2
pref
!pH2O
pref
!exp �
Eact;anode
RTs
� �, (10)
i0;cathode ¼ gcathde
pO2
pref
!0:25
exp �Eact;cathode
RTs
� �. (11)
The activation overvoltage depends principally on the exchange current density. This parameter can beconsidered as the forward and reverse electrode reaction rate at the equilibrium potential. High exchangecurrent density means high electrochemical reaction rate; in this case, good fuel cell performance can beexpected. The value of the exchange current density can be improved by increasing the fuel cell operatingtemperature or using catalytic materials with lower activation energies [1].
Under high activation overpotential, the second term of the Butler–Volmer can be neglected and theformula can be rearranged [12]:
DV act ¼ A lni
i0
� �; A ¼
RTs
neaF. (12)
Here, it is possible to recognize the well-known Tafel equation, which is valid only when the current densityis higher than the exchange current density. The charge transfer coefficient (a) value depends on the reactionsinvolved and on the electrode materials. Its typical anode value is 0.5 and the cathode values often varybetween 0.1 and 0.5 [1] (note that in both cases it must be in the range 0–1.0). Generally, the anode activation

ARTICLE IN PRESSF. Calise et al. / Energy 31 (2006) 3278–32993284
overpotential is much smaller than that of cathode because it is usually verified that i0;A � i0;C . However, it ispossible to summarize the anode and cathode activation overpotential losses using the following formula:
DV act ¼ ðAA þ ACÞ lni
ði0;AÞAA=AAþAC þ ði0;CÞ
AC=AAþAC
!. (13)
When the activation overvoltage is low, it is possible to expand the Butler–Volmer equation as a Taylorseries; neglecting the higher terms, the result is
DV act ¼RTs
neaF
i
i0
� �. (14)
Previous papers [10] showed that if a 5% error can be accepted, it is possible to use (i) the Tafel Equation(12) for V act40:28V and (ii) the linear-shaped formula (14) for V acto0:1V.
4.2. Fuel crossover and internal currents
Fuel crossover is a phenomenon that takes place when a certain amount of fuel diffuses from the anode to thecathode, through electrolyte, without reacting electrochemically. At the cathode electrode, it reacts directly withoxygen producing heat. Moreover, the real electrolytes are usually very good ionic conductors, even if they couldalso support some electron conduction, determining the internal currents. Both phenomena determine voltagelosses. In the first case, some fuel is combusted and in the second, electrons cannot be used by the external electricalload. They are summarized in a single loss, called ‘mixed potential’, introducing the internal current density in. Thisloss, usually neglected in case of SOFC, is accounted for by adding in [1] to the actual fuel cell current density.
4.3. Ohmic losses
SOFCs are greatly affected by this kind of loss because of their physical configuration. The voltage drop isdue to the Ohmic resistance of cathode, anode, electrolyte and mostly interconnections. In these cells, based onSiemens Westinghouse technology, the interconnections resistance is dramatically higher than that in all otherfuel cells [9]. The total Ohmic loss is evaluated using the following formula [12]:
DV ohm ¼ ir, (15)
r ¼ dr, (16)
r ¼ x expðl=TÞ. (17)
The area-specific resistance (r) depends on material thickness (d) and on the SOFC operating temperaturebecause of the resistivity exponential dependence (17). The coefficients of this equation are derived using themodels proposed by Bessette (1995) and Chan (2001) [12].
4.4. Mass transport and concentration losses
The reduction of fuel and air partial pressures causes voltage drop, as stated in the Nernst equation. Thefuel supplied to the anode electrode is continuously used by the electrochemical reaction, determining a localreduction in its partial pressure. In situation where this fuel is not readily replenished, its partial pressure coulddramatically decrease; moreover, fuel outlet pressure is smaller than the inlet one because of the pressure dropdue to the fluid resistance. The global effect is a reduction in hydrogen partial pressure. A similar phenomenonalso occurs at air electrode.
In this paper, the concentration loss is calculated using the Fick Law and the definition of the limitingcurrent density il (corresponding to a surface concentration value of zero) [1]:
i ¼nFDðCB � CSÞ
3:6dm, (18)
ARTICLE IN PRESSF. Calise et al. / Energy 31 (2006) 3278–3299 3285
il ¼nFDCB
3:6dm. (19)
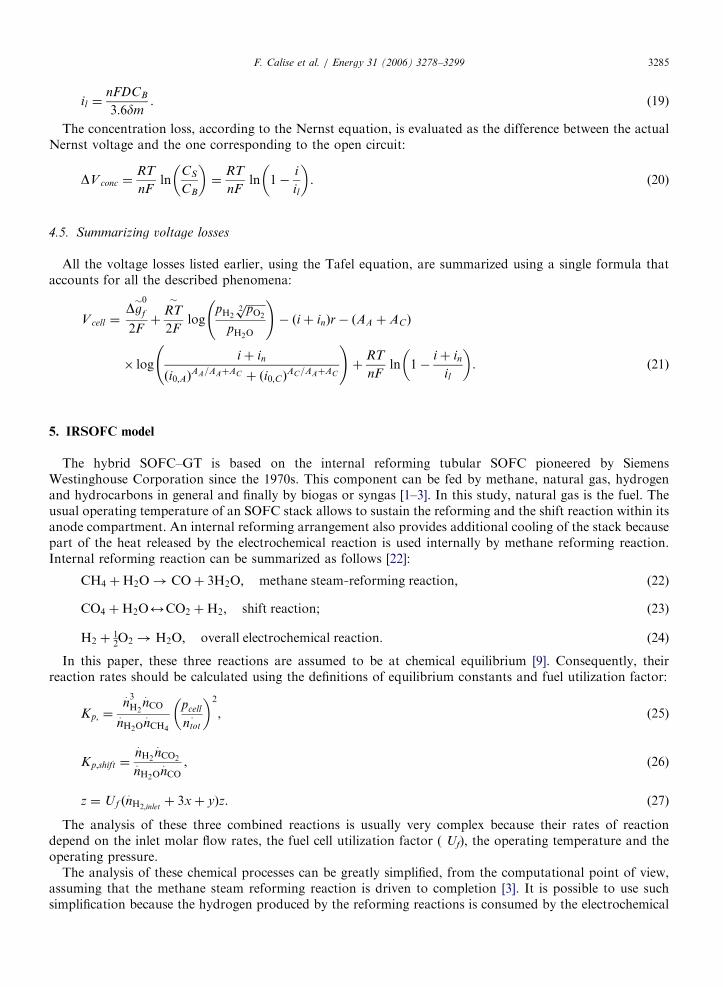
The concentration loss, according to the Nernst equation, is evaluated as the difference between the actualNernst voltage and the one corresponding to the open circuit:
DV conc ¼RT
nFln
CS
CB
� �¼
RT
nFln 1�
i
il
� �. (20)
4.5. Summarizing voltage losses
All the voltage losses listed earlier, using the Tafel equation, are summarized using a single formula thataccounts for all the described phenomena:
Vcell ¼Dg�0
f
2Fþ
RT�
2Flog
pH2
ffiffiffiffiffiffiffipO2
2p
pH2O
!� ði þ inÞr� ðAA þ ACÞ
� logi þ in
ði0;AÞAA=AAþAC þ ði0;CÞ
AC=AAþAC
!þ
RT
nFln 1�
i þ in
il
� �. ð21Þ
5. IRSOFC model
The hybrid SOFC–GT is based on the internal reforming tubular SOFC pioneered by SiemensWestinghouse Corporation since the 1970s. This component can be fed by methane, natural gas, hydrogenand hydrocarbons in general and finally by biogas or syngas [1–3]. In this study, natural gas is the fuel. Theusual operating temperature of an SOFC stack allows to sustain the reforming and the shift reaction within itsanode compartment. An internal reforming arrangement also provides additional cooling of the stack becausepart of the heat released by the electrochemical reaction is used internally by methane reforming reaction.Internal reforming reaction can be summarized as follows [22]:
CH4 þH2O! COþ 3H2O; methane steam�reforming reaction; (22)
CO4 þH2O2CO2 þH2; shift reaction; (23)
H2 þ12O2! H2O; overall electrochemical reaction: (24)
In this paper, these three reactions are assumed to be at chemical equilibrium [9]. Consequently, theirreaction rates should be calculated using the definitions of equilibrium constants and fuel utilization factor:
Kp; ¼n: 3H2
n:CO
n:H2On
:CH4
pcell
ntot:
� �2
, (25)
Kp;shift ¼n:H2
n:CO2
n:H2On
:CO
, (26)
z ¼ Uf ðn:H2;inlet
þ 3xþ yÞz. (27)
The analysis of these three combined reactions is usually very complex because their rates of reactiondepend on the inlet molar flow rates, the fuel cell utilization factor ( Uf), the operating temperature and theoperating pressure.
The analysis of these chemical processes can be greatly simplified, from the computational point of view,assuming that the methane steam reforming reaction is driven to completion [3]. It is possible to use suchsimplification because the hydrogen produced by the reforming reactions is consumed by the electrochemical

ARTICLE IN PRESSF. Calise et al. / Energy 31 (2006) 3278–32993286
reaction and because of the high value of its equilibrium constant. In fact, several studies showed that atSOFC typical operating conditions, the anode methane molar fraction is lower than 1% [1,9,11].
The equilibrium molar flow rates can be calculated using stoichiometric balances on the reforming, shift andelectrochemical reactions:
n:CH4¼ n
:CH4;inlet
� x, (28)
n:H2O ¼ n
:H2Oinlet
� x� yþ z, (29)
n:CO ¼ n
:COinlet
þ x� y, (30)
n:H2¼ n
:H2;inlet
þ 3xþ y� z, (31)
n:O2¼ n
:O2;inlet
� z=2, (32)
n:CO2¼ n
:CO2;inlet
þ y. (33)
Shift reaction is exothermic, so its constant of reaction increases as temperature decreases; this variable isderived using the following function:
Kp;shift ¼ exp4594
T� 4:35
� �. (34)
Several previous papers [8,14–16] showed that solid, anode and cathode outlet streams’ equilibriumtemperatures reach the same value. The simplifications used in this paper allow the calculation of the SOFCeffluent molar flow rates by solving a simple quadratic equation. Therefore, the solution of a strongly non-linear algebraic system (of three equations in three variables depending on SOFC stack temperature) isavoided. Such a temperature can be evaluated using the energy balance on the fuel cell control surface. Theinlet energy rate is
E:
inlet ¼X
i
m:
icpi
!�����inlet;A
ðtinlet;A � t0Þ þm:H2O;inlet;AhH2Oðtinlet;A; xH2Opinlet;AÞ
þX
i
m:
icpi
!�����inlet;C
ðtinlet;C � t0Þ. ð35Þ
The net energy rate generated by the reforming, shift and electrochemical reactions is
E:
react ¼ � zDhH2þ yDhshift þ xDhref
� �. (36)
Fuel cell DC current can be derived by the stoichiometric balance on the anode semireaction, assuming thatall the cells have the same behavior:
I ¼ 2n:H2
F . (37)
The outlet fuel cell energy rate is
E:
outlet ¼X
i
m:
icpi
!outlet
ðtoutlet � t0Þ þm:H2Ooutlet;AhH2O þ VcellI � 10�3. (38)
SOFC voltage (Vcell) is given by the results coming from the model simulating the electrochemical behaviorof the fuel cell. This subroutine calculates the function:
Vcell ¼ f in; il ; i; toutlet; poutlet;xH2;xH2O;xO2
� �. (39)
The IRSOFC module is solved iteratively searching the outlet cell temperature that matches theconvergence criterion on the energy balance equation:
E:
react þ E:
inlet ¼ E:
outlet þ V cellI � 10�3. (40)
ARTICLE IN PRESSF. Calise et al. / Energy 31 (2006) 3278–3299 3287
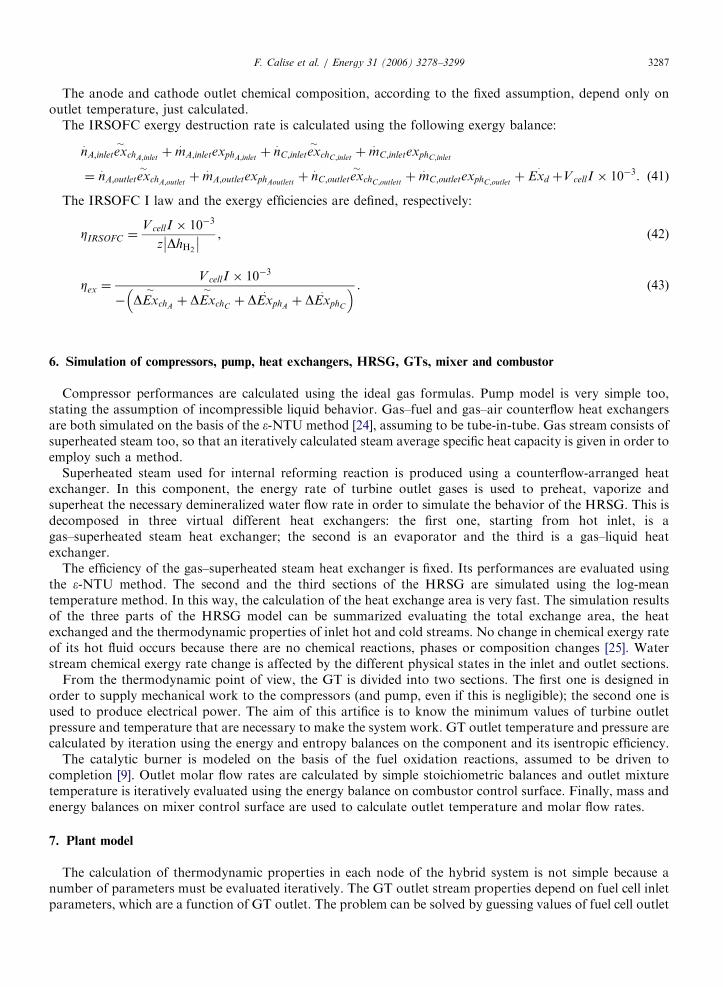
The anode and cathode outlet chemical composition, according to the fixed assumption, depend only onoutlet temperature, just calculated.
The IRSOFC exergy destruction rate is calculated using the following exergy balance:
n:A;inletex
�
chA;inletþm
:A;inletexphA;inlet
þ n:C;inletex
�
chC;inletþm
:C;inletexphC;inlet
¼ n:A;outletex
�
chA;outletþm
:A;outletexphAoutlett
þ n:C;outletex
�
chC;outlettþm
:C;outletexphC;outlet
þ Exd
:þV cellI � 10�3. ð41Þ
The IRSOFC I law and the exergy efficiencies are defined, respectively:
ZIRSOFC ¼VcellI � 10�3
z DhH2
�� �� , (42)
Zex ¼V cellI � 10�3
� DEx�
chAþ DEx
�
chCþ DEx
:
phAþ DEx
:
phC
. (43)
6. Simulation of compressors, pump, heat exchangers, HRSG, GTs, mixer and combustor
Compressor performances are calculated using the ideal gas formulas. Pump model is very simple too,stating the assumption of incompressible liquid behavior. Gas–fuel and gas–air counterflow heat exchangersare both simulated on the basis of the e-NTU method [24], assuming to be tube-in-tube. Gas stream consists ofsuperheated steam too, so that an iteratively calculated steam average specific heat capacity is given in order toemploy such a method.
Superheated steam used for internal reforming reaction is produced using a counterflow-arranged heatexchanger. In this component, the energy rate of turbine outlet gases is used to preheat, vaporize andsuperheat the necessary demineralized water flow rate in order to simulate the behavior of the HRSG. This isdecomposed in three virtual different heat exchangers: the first one, starting from hot inlet, is agas–superheated steam heat exchanger; the second is an evaporator and the third is a gas–liquid heatexchanger.
The efficiency of the gas–superheated steam heat exchanger is fixed. Its performances are evaluated usingthe e-NTU method. The second and the third sections of the HRSG are simulated using the log-meantemperature method. In this way, the calculation of the heat exchange area is very fast. The simulation resultsof the three parts of the HRSG model can be summarized evaluating the total exchange area, the heatexchanged and the thermodynamic properties of inlet hot and cold streams. No change in chemical exergy rateof its hot fluid occurs because there are no chemical reactions, phases or composition changes [25]. Waterstream chemical exergy rate change is affected by the different physical states in the inlet and outlet sections.
From the thermodynamic point of view, the GT is divided into two sections. The first one is designed inorder to supply mechanical work to the compressors (and pump, even if this is negligible); the second one isused to produce electrical power. The aim of this artifice is to know the minimum values of turbine outletpressure and temperature that are necessary to make the system work. GT outlet temperature and pressure arecalculated by iteration using the energy and entropy balances on the component and its isentropic efficiency.
The catalytic burner is modeled on the basis of the fuel oxidation reactions, assumed to be driven tocompletion [9]. Outlet molar flow rates are calculated by simple stoichiometric balances and outlet mixturetemperature is iteratively evaluated using the energy balance on combustor control surface. Finally, mass andenergy balances on mixer control surface are used to calculate outlet temperature and molar flow rates.
7. Plant model
The calculation of thermodynamic properties in each node of the hybrid system is not simple because anumber of parameters must be evaluated iteratively. The GT outlet stream properties depend on fuel cell inletparameters, which are a function of GT outlet. The problem can be solved by guessing values of fuel cell outlet

ARTICLE IN PRESSF. Calise et al. / Energy 31 (2006) 3278–32993288
stream parameters (temperature and gas composition), solving the whole system of equations andrecalculating the guessed parameters until the convergence criterion is obtained. The assumptions used tosimulate the hybrid SOFC–GT system allow for a simplification of the calculation dramatically. The outletparameters of IRSOFC module depend on its operating temperature and on some setting parameters such asair, water and fuel compositions and flow rates and fuel cell utilization factor and fuel cell operating pressure.If a guess value of IRSOFC outlet temperature is fixed, the corresponding SOFC outlets can be calculated; thewhole system can be solved, and the stack temperature recalculated. The iteration goes on until theconvergence criterion on stack temperature is realized. The calculation of some other components depends onthe stack temperature and consequently should be part of the loop of this variable. It is important to stressthat it is not always possible to foresee that the solution will always converge. For instance, it may happen thatGT is not able to supply enough energy to preheat fuel and air and to vaporize water for steam reforming. Inthis case, it is necessary to change the system settings: the code is designed to increase outlet second GTpressure until the energy rate matches the required value; part of system electrical work is used to preheat theinlet streams. However, this is not the only way to solve the problem; it could also be possible to (i) vaporizewater using an external boiler; (ii) increase fuel flow rate and bypass part of it to the catalytic burner; (iii)change heat exchanger layout; (iv) increase current density or increase fuel flow rate to the fuel cell.
8. Electrochemical results
The performance of a fuel cell stack is usually described by plotting the well-known polarization curve,which relates the cell voltage to its current density. This plot is affected by all the typical losses of the fuel cellunder investigation and can be used to analyze their values. The polarization curve of the SOFC used in thestack of this study is represented in Figs. 2 and 3. These curves are the focal point of the simulation code.
Fig. 2 clearly shows the strong dependence of the SOFC voltage on its operating temperature. The figure isplotted by fixing some other important setting parameters such as total pressure, hydrogen, water and oxygen
Fig. 2. Polarization curve.

ARTICLE IN PRESS
Fig. 3. Polarization curve.
F. Calise et al. / Energy 31 (2006) 3278–3299 3289
partial pressures. According to the Nernst equation, it can be observed that the cell voltage value increases byraising the operating pressure (Fig. 3), hydrogen and oxygen partial pressures or by lowering the anode watermolar fraction. From the achieved results, it can also be observed that on increasing pH2
and pO2(or lowering
pH2O), lower values of fuel and air utilization factors are achieved. Moreover, by increasing cell operating
pressure, it is possible to gain best performance even if a higher cost must be taken into account, due to theenergy and investment for compressors. The shape of SOFC polarization curve depends on the Ohmic,concentration and activation losses. Results showed that the first and the last one are dominant in the overallovervoltage. The Ohmic losses (Fig. 4) affecting the SOFC under investigation are mainly due tointerconnections among cathode, anode and electrolyte [11]. This kind of overvoltage could be reduced bylowering the cell thickness or by increasing the operating temperature as shown in Fig. 4. In the presentsimulation, the concentration overvoltage is taken into account by using a simplified approach based on Fick’slaw. Resultantly, the limiting current density value is considered a fixed parameter. This assumption isconsidered in order to simplify the simulation model, although more detailed models [11,16,23,26,27] coulddemonstrate that il increases with the cell working temperature. Moreover, Fig. 5 shows that the concentrationloss is slightly dependent on temperature, especially when the working current density is far from its limitingvalue, il. Finally, Fig. 6 shows the activation loss that consists mainly of cathode activation overpotential, dueto an exchange current value much greater than the anode one. The exponentially shaped function thatcharacterizes the exchange current density (not shown in these figures) induces the strong dependence on theworking cell temperature, shown in Fig. 6.
9. Case study
The hybrid SOFC–GT plant layout under investigation is simulated for the fixed set of design parametersshown in Table 1. The aim of this analysis was to evaluate the plant efficiency and to find the components

ARTICLE IN PRESS
Fig. 4. Ohmic overpotential.
Fig. 5. Concentration overpotential.
F. Calise et al. / Energy 31 (2006) 3278–32993290

ARTICLE IN PRESS
Fig. 6. Activation overpotential.
F. Calise et al. / Energy 31 (2006) 3278–3299 3291
where the main sources of irreversibility are located. Moreover, the proposed model allows to evaluate, at eachnode of the plant, the following thermodynamic properties: temperatures, pressures, enthalpies, entropies,physical and chemical exergies, and gas compositions. These results are reported in Table 2. In this case study,a very high combustor outlet temperature is found (node 5). This is one of the key point behavior of a hybridSOFC–GT plant. In fact, this value could increase using low fuel utilization factor or high working currentdensity values generating large amounts of heat. In situation where the temperature of node 5 is too high, forthe present technological constraints at the inlet GT, fresh air bypassed from the air compressor should bemixed to this stream (Table 3).
In Figs. 7 and 8, the cathode and anode outlet flow compositions of the SOFC under investigation areshown. Their amounts affect the SOFC voltage highly because of the shape of the Nernst equation. It is verydifficult to keep the hydrogen partial pressure at lower levels, because a high fuel utilization factor would benecessary. Moreover, in Fig. 7, steam partial pressure is very high because of the unreacted steam coming fromthe internal reforming reaction and a mole of H2O that is produced at the anodic side for each mole ofhydrogen reacted. Finally, the same figure shows that a low amount of CO is produced by the internalreforming reactions. This quantity is burnt in the catalytic combustor, thereby raising its outlet temperature.Fig. 9 shows that the plant components, where chemical or electrochemical reactions occur, mainly affect theplant overall irreversibilities. Results of the plant simulation show that the SOFC and the catalytic burner arepredominant in the overall exergy destruction rate. The ratio of SOFC to catalytic burner efficiency defectsdepends mainly on the fuel utilization factor. A high value of this parameter means that most of the chemicalreactions occur within the fuel cell, releasing a very little amount of fuels for the burner. On the otherhand, when the fuel utilization factor is low, the electrical energy produced by the SOFC decreases. Inthis case, methane or hydrogen is mostly used in the combustion processes. Furthermore, Fig. 9 showsthat turbomachineries’ efficiency defect is not significant, as a consequence of the high values of theirisentropic efficiencies. Similarly, the high values of heat exchange efficiencies determine excellent exergetic

ARTICLE IN PRESS
Table 2
Setting parameters
Gas–air heat exchanger effectiveness 0.80
Gas–air heat exchanger effectiveness 0.80
Gas–superheated steam heat exchanger eff. 0.80
Combustor efficiency 0.98
Electric generator efficiency 0.98
Inverter efficiency 0.95
Pump isentropic efficiency 0.80
Fuel compressor isentropic efficiency 0.80
Air compressor isentropic efficiency 0.80
Gas turbine isentropic efficiency 0.80
Fuel compressor mechanical efficiency 0.98
Air compressor mechanical efficiency 0.98
Pump mechanical efficiency 0.98
Gas turbine mechanical efficiency 0.98
Limiting current density (mA/cm2) 900
Internal current density (mA/cm2) 2
Methane inlet molar flow rate (kmol/s) 0.0028
Water inlet molar flow rate (kmol/s) 0.0057
Oxygen inlet molar flow rate (kmol/s) 0.0070
Cell operating pressure (bar) 7
Environment pressure (bar) 1
Environment temperature (1C) 25
Fuel utilization factor 0.85
Minimum steam-to-carbon ratio 2
Cell current density (mA/cm2) 100
Anode thickness (cm) 0.010
Anode thickness (cm) 0.010
Cathode thickness (cm) 0.190
Interconnection thickness (cm) 0.004
Anode activation energy (kJ/kmol) 1.1� 105
Cathode activation energy (kJ/kmol) 1.1� 105
ganode (mA/cm2) 2.13� 107
gcathode (mA/cm2) 1.49� 107
Table 3
Node thermodynamic properties
Node ex�
ch (kJ/kmol) exph (kJ/kg) h (kJ/kg) t (1C) m:(kg/s) n
:(kmol/s) p (bar)
1 130.8 0.0 25.3 25.0 1.009 0.03500 1.00
2 130.8 248.8 304.6 300.8 1.009 0.03500 7.00
3 130.8 520.5 747.2 737.8 1.009 0.03500 7.00
4A 48893.0 2700.5 6420.8 985.1 0.148 0.01411 7.00
4C 281.5 593.1 869.6 985.1 1.009 0.03053 7.00
5 2648.6 1181.2 2020.8 1290.3 1.156 0.04351 7.00
6 2648.6 889.8 1748.3 1078.6 1.156 0.04351 3.30
7 2648.6 578.2 1455.6 847.1 1.156 0.04351 1.20
8 2648.6 307.4 1061.4 526.3 1.156 0.04351 1.20
9 2648.6 294.5 1040.7 509.2 1.156 0.04351 1.20
10 2648.6 115.5 700.6 223.7 1.156 0.04351 1.20
11 3.12E+03 0.1 104.8 25.0 0.103 0.00570 1.00
12 3.12E+03 0.0 104.8 25.0 0.103 0.00570 7.00
13 1.17E+04 1038.5 3354.1 440.3 0.103 0.00570 7.00
14 2.82E+05 840.0 2652.9 448.1 0.148 0.00851 7.00
15 8.35E+05 416.4 530.6 25.0 0.045 0.00281 1.00
16 8.35E+05 0.0 56.2 235.9 0.045 0.00281 7.00
17 8.35E+05 686.9 1053.2 468.2 0.045 0.00281 7.00
F. Calise et al. / Energy 31 (2006) 3278–32993292

ARTICLE IN PRESS
Fig. 7. Outlet anode gas composition.
F. Calise et al. / Energy 31 (2006) 3278–3299 3293
performances for both heat exchangers and HRSG. Obviously, this result is obtained using an optimumset of the operating parameters for the plant (Table 2) and also by determining remarkable high systemcapital cost.
Thus, in future works, the above calculated exergy flows will be used in order to implement an optimizationprocedure aimed at evaluating the optimum ‘thermo-economic’ set of the synthesis/design parameters. Fig. 10shows that for the considered plant configuration, the electrical energy is produced mostly by the SOFC(985 kW). The passive loads consist mainly of mechanical power for the air compression. The plant as a whole,fixing such setting parameters, is able to achieve net electrical (net electrical power to methane lower heatingvalue ratio) and global (net electrical and thermal powers to methane lower heating value ratio) efficiencies of0.55 and 0.65, respectively.
10. Varying setting parameters
Plant energetic and exergetic performances, calculated on the basis of the initial setting parameters (listed inTable 1), are changed by varying the following design parameters.
10.1. Current density
The previous case study showed that the net plant electrical power is produced mainly by the SOFCand therefore it is mandatory to keep its performances at high values in order to improve the system efficiency.The shape of the SOFC polarization curve suggests that the best configuration corresponds at lower valuesof working current density (Figs. 2 and 3) even if a greater cost, due to the higher cell active area, has to betaken into account. It has also to be considered that when the current density is very low, the amount ofheat available is low. Consequently, the cell temperature decreases and causes the SOFC voltage to decrease

ARTICLE IN PRESS
Fig. 8. Outlet cathode gas composition.
F. Calise et al. / Energy 31 (2006) 3278–32993294
as well, thereby partially correcting the above-mentioned phenomenon. The results of this analysis, varyingthe current density, are displayed in Figs. 11a and b. In particular, the former shows the above-discussedtrend of the global and electrical efficiencies, whereas the latter displays the result of the exergy analysis.Obviously, the lower the current density, the higher the plant overall exergetic efficiency. This circumstanceis due basically to the reduction of the exergy destruction rate in the SOFC, as a result of the reductionof the amount of its overvoltages. In fact, as shown in the previous sections, overvoltages increase withhigh values of cell-operating current density. Thus, Fig. 11b suggests to implement an optimization proce-dure in order to find the value of current density allows to achieve the best compromise betweenexergetic efficiency and capital costs. Note also that efficiency defects of fuel compressor, fuel–gas heatexchanger and of the pumps are always negligible. This is due to the low values of fuel and steam massflow rates.
10.2. Operating pressure
Pressure is varied, holding all the other setting parameters constant. The consequence is that the outletSOFC temperature is reduced with the increasing pressure. Higher efficiencies could be obtained fixing the celltemperature and increasing its operating pressure. Figs. 11c and d show that by increasing SOFC pressure, it ispossible to improve the electrical and global plant efficiencies, thereby lowering the irreversibilities in the heatexchangers, and mostly in the HRSG. In particular, the higher the operating pressure, the higher the cellvoltage (Eq. (8)), determining a remarkable improvement of the electrical efficiency of the plant. It is alsoobvious that when the value of the operating pressure is increased, higher compressors and turbines costs mustbe considered.

ARTICLE IN PRESS
Fig. 9. Destroyed exergy rate.
Fig. 10. Thermal/mechanical/electrical power.
F. Calise et al. / Energy 31 (2006) 3278–3299 3295
10.3. Fuel-to-oxygen ratio
The hybrid SOFC–GT air inlet mass flow rate depends on electrochemical rate of reaction, cell temperatureand combustion reaction. The amount of oxygen used in the plant is necessary to oxidize hydrogen in theSOFC and the other fuels in the catalytic burner, and mostly to cool the stack in order to keep its operating

ARTICLE IN PRESS
Fig. 11. (a) Plant efficiencies (varying i), (b) Local exergy destruction rates (varying i), (c) Plant efficiencies (varying p), (d) Local exergy
destruction rates (varying p), (e) Plant efficiencies (varying n:CH4
= n:O2), (f) Efficiency defects (varying n
:CH4
= n:O2), (g) Plant efficiencies
(varying SC), (h) Efficiency defects (varying SC), (i) Plant efficiencies (varying Uf), (l) Efficiency defects (varying Uf).
F. Calise et al. / Energy 31 (2006) 3278–32993296
temperature at reasonable values. A lower air flow rate causes better cell performances (as shown in Fig. 11e),mostly because of the growth of its operating temperature, but also because of the oxygen cathode partialpressure increase. Obviously, the fuel-to-air ratio cannot be increased arbitrarily since the cell would operate

ARTICLE IN PRESS
Fig. 11. (Continued)
F. Calise et al. / Energy 31 (2006) 3278–3299 3297
at temperature values unacceptable for its materials. Furthermore, the capital cost of the SOFC is usually atemperature-dependent function: the higher its operating temperature, the higher the material andmanufacturing costs. Fig. 11f presents the components’ efficiency defects (local exergy destruction rate toplant fuel ratio), showing that the plant irreversibilities can be reduced by increasing the fuel-to-air ratio. Thiscircumstance is due to the dramatic growth of the SOFC operating temperature, which decreases all itsoverpotentials. Conversely, the higher the cell operating temperature, the higher the heat flow of the HRSG,thus determining higher exergy destruction rates in this component.
10.4. Steam-to-carbon ratio
The plant layout under investigation in this study is based on an IRSOFC stack whose steam is providedexternally by the HRSG. Consequently, the inlet GT steam partial pressure, considering the combustionreactions too, is quite high. The minimum value of the steam-to-carbon ratio (SC), which depends on thepresent technological constraints of the SOFCs, is necessary to avoid problems of carbon deposition at cellanode. Figs. 11g shows that the SC should be kept at lower levels because it determines lower plant electricaland global efficiencies. In particular, Fig. 11g shows that the slope of the global efficiency curve is higher withrespect to the electrical efficiency curve: in fact, the higher the SC, the higher the amount of heat required bythe HRSG, lowering plant thermal efficiency. Electrical efficiency slightly decreases since higher steam partial

ARTICLE IN PRESSF. Calise et al. / Energy 31 (2006) 3278–32993298
pressures cause higher Nernst overvoltages. Fig. 11h shows that the components’ efficiency defects onlyslightly depend on the steam-to-carbon ratio.
10.5. Fuel utilization factor
As shown earlier, the fuel utilization factor is one of the key parameters in the design of a fuel cell stack. Thetarget is generally to keep its value at highest level, even if this is almost never possible because of thetechnological and economical constraints. Fig. 11i displays that, for the considered plant layout, higher Uf
values determine better overall global and electrical efficiencies. When the fuel utilization factor is very high,almost all the amount of hydrogen produced by the internal reforming reactions is consumed within the fuelcell by the anode electrochemical semireaction. Thus, the electricity produced by the SOFC increases, causinga raise of its electrochemical rate of reaction and consequently of its chemical exergy destruction rate. On theother hand, the fuel molar flow rate to the catalytic burner is reduced thus determining lower local chemicalexergy conversion rates. Fig. 11l shows that the higher the Uf, the higher the plant exergetic efficiency since theamount of fuel converted via the electrochemical process, with respect to the amount reacted into thecombustor, is higher. In fact, from the exergetic point of view, the former process is much more efficient thanthe latter. Furthermore, the higher the Uf, the lower the chemical exergy flow available for the combustor,thereby determining the decrease of its efficiency defect. The same phenomena also determine the trend ofSOFC efficiency defect shown in Fig. 11l. The simulation is carried out fixing all the setting parameters listedin Table 1. The results showed that increasing the fuel utilization factor, the hydrogen partial pressure, andconsequently the cell voltage, is reduced. On the other hand, calculations showed that higher cell active areaand heat exchanger surface are needed and therefore increasing plant investment costs.
11. Conclusions
In this paper, the exergy analysis concerning a hybrid SOFC–GT power plant has been carried out. Theresults showed that IRSOFC is the component with the highest irreversibility. Even if the fuel cell is a veryefficient device, it is the place where almost all the chemical and electrochemical reactions occur (steamreforming and electrochemical oxidation), which are the most important sources of exergy destruction.Combustor efficiency defect is also high; its exergy destruction rate increases with the amount of unreactedfuel. Consequently, a good plant design must be focused prominently on the fuel cell stack. Like manyprevious papers dealing with hybrid steam cycles [28,29], in this work, the exergy analysis is performed notonly on the stack sub-system [14] but also on all the components of the SOFC–GT hybrid plant. The modeldeveloped and discussed in this paper forms the basis for future work aimed at the thermoeconomic analysisand optimization of the plant. To this end, exergy balances are needed to better and more effectively addressthe problem [14].
References
[1] Larminie J, Dicks A. Fuel cell system explained. New York: Wiley; 2004.
[2] Benjamin TG, Camera EH, Marianowski LG. Handbook of fuel cell performance. Institute of Gas Technology; 1995.
[3] Fuel cell handbook, 6th edition. US Department of Energy, 2002. http://www.fuelcells.org/info/library/fchandbook.pdfwww.
fuelcells.org/info/library/fchandbook.pdf
[4] Fuel cell technology handbook, 2002. Gregors Hoogers/CRC Press/SAE 814 International, Hardbound.
[5] Palsson J, Selimovic A, Sjunnesson L. Combined solid oxide fuel cell and gas turbine systems for efficient power and heat generation.
J Power Sources 2000;86:442–8.
[6] Kimijima S, Kasagi N. Performance evaluation of gas turbine–fuel cell hybrid micro generation system. In: Proceedings of
ASMETURBO EXPO 2002, Amsterdam, The Netherlands, June 3–6.
[7] Bae BH, Sohn JL, Ro ST. Thermodynamic modeling and performance analysis of a power generation system based on the solid oxide
fuel cell. In: Proceedings of ASME Conference on Fuel Cell Science, Engineering and Technology, Rochester, New York, USA, April
21–23, 2003.
[8] Inui Y, Yanagisawa S, Ispida T. Proposal of high performance SOFC combined power generation system with carbon dioxide
recovery. Energy Convers Manage 2003;44:597–609.

ARTICLE IN PRESSF. Calise et al. / Energy 31 (2006) 3278–3299 3299
[9] Chan SH, Ho HK, Tian Y. Modelling of a simple hybrid solid oxide fuel cell and gas turbine power plant. J Power Sources
2002;109:111–20.
[10] Chan SH, Ho HK, Tian Y. Modeling for part load operation of solid oxide fuel cell–gas turbine hybrid power plant. J Power Sources
2003;114:213–27.
[11] Chan SH, Ho HK, Tian Y. Multi-level modeling of SOFC-gas turbine hybrid system. Int J Hydrogen Energy 2003;28:889–900.
[12] Chan SH, Khor KA, Xia ZT. A complete polarization model of a solid oxid fuel cell and its sensitivity to the change of cell
component thickness. J Power Sources 2001;93:130–40.
[13] Bejan A, Tsatsaronis G, Moran M. Thermal design and optimization. New York: Wiley; 1996.
[14] Chan SH, Low CF, Ding OL. Energy and exergy analysis of a simple solid-oxide fuel cell power system. J Power Sources
2002;103:188–200.
[15] Campanari S. Power plants based on solid oxide fuel cells combined with gas turbine cycles. PhD thesis, 1998. Milano: Politecnico di
Milano.
[16] Costamagna P, Magistri L, Massardo AF. Design and part-load performance of a hybrid system based on a solid oxide fuel cell
reactor and a micro gas turbine. J Power Sources 2001;96:352–68.
[17] Campanari S. Carbon dioxide separation from high temperature power plants. J Power Sources 2002;112:273–89.
[18] Campanari S. Full load and part load performance prediction for integrated SOFC and microturbine systems. J Power Sources
2001;96:352–68.
[19] Campanari S. Thermodynamic model and parametric analysis of a tubular SOFC module. J Power Sources 2001;92:26–34.
[20] http://www.iapws.org/newform.htm.
[21] Costamagna P, Hoenegger K. Modelling of solid oxide heat exchanger integrated stacks and simulation at high fuel utilization.
J Electrochem Soc 1998;145(11).
[22] Peters R, Dahl R, Kluttgen U, Palm C, Stolen D. Internal reforming of methane in sold oxide fuel cell systems. J Power Sources
2002;106:238–44.
[23] Chan SH, Wang HM. Thermodynamic analysis of natural-gas fuel processing for fuel cell applications. Int J Hydrogen Energy
2000;25:441–9.
[24] Kakac S, Liu H. Heat exchanger selection, rating, and thermal design. Boca Raton, FL: CRC Press; 1998.
[25] Kotas. The exergy method of thermal plant analysis. Melbourne, FL: Krioeger; 1995.
[26] Tanakaa K, Wen C, Yamada K. Design and evaluation of combined cycle system with solid oxide fuel cell and gas turbine. Fuel
2000;79:1493–507.
[27] Bedringas KW, Ertesvag IS. Exergy analysis of solid oxide fuel cell systems. Energy 1997;22:403–12.
[28] Dunbar WR, Lior N, Gaggioli R. Combining fuel cells with fuel-fired power plants for improved exergy efficiency. Energy
1991;16(10):1259–74.
[29] Dunbar WR, Lior N, Gaggioli R. The effect of the fuel-cell unit size on the efficiency of a fuel-cell-topped Rankine Cycle. ASME
J Energy Resour Technol 1993;115:105–7.