Similar Resilience Attributes in Lakes with Different Management Practices
10
Similar Resilience Attributes in Lakes with Different Management Practices Didier L. Baho 1 *, Stina Drakare 1 , Richard K. Johnson 1 , Craig R. Allen 2 , David G. Angeler 1 1 Swedish University of Agricultural Sciences, Department of Aquatic Sciences and Assessment, Uppsala, Sweden, 2 U.S. Geological Survey, Nebraska Cooperative Fish and Wildlife Research Unit, School of Natural Resources, University of Nebraska – Lincoln, Lincoln, Nebraska, United States of America Abstract Liming has been used extensively in Scandinavia and elsewhere since the 1970s to counteract the negative effects of acidification. Communities in limed lakes usually return to acidified conditions once liming is discontinued, suggesting that liming is unlikely to shift acidified lakes to a state equivalent to pre-acidification conditions that requires no further management intervention. While this suggests a low resilience of limed lakes, attributes that confer resilience have not been assessed, limiting our understanding of the efficiency of costly management programs. In this study, we assessed community metrics (diversity, richness, evenness, biovolume), multivariate community structure and the relative resilience of phytoplankton in limed, acidified and circum-neutral lakes from 1997 to 2009, using multivariate time series modeling. We identified dominant temporal frequencies in the data, allowing us to track community change at distinct temporal scales. We assessed two attributes of relative resilience (cross-scale and within-scale structure) of the phytoplankton communities, based on the fluctuation frequency patterns identified. We also assessed species with stochastic temporal dynamics. Liming increased phytoplankton diversity and richness; however, multivariate community structure differed in limed relative to acidified and circum-neutral lakes. Cross-scale and within-scale attributes of resilience were similar across all lakes studied but the contribution of those species exhibiting stochastic dynamics was higher in the acidified and limed compared to circum-neutral lakes. From a resilience perspective, our results suggest that limed lakes comprise a particular condition of an acidified lake state. This explains why liming does not move acidified lakes out of a ‘‘degraded’’ basin of attraction. In addition, our study demonstrates the potential of time series modeling to assess the efficiency of restoration and management outcomes through quantification of the attributes contributing to resilience in ecosystems. Citation: Baho DL, Drakare S, Johnson RK, Allen CR, Angeler DG (2014) Similar Resilience Attributes in Lakes with Different Management Practices. PLoS ONE 9(3): e91881. doi:10.1371/journal.pone.0091881 Editor: John F. Valentine, Dauphin Island Sea Lab, United States of America Received August 28, 2013; Accepted February 17, 2014; Published March 11, 2014 This is an open-access article, free of all copyright, and may be freely reproduced, distributed, transmitted, modified, built upon, or otherwise used by anyone for any lawful purpose. The work is made available under the Creative Commons CC0 public domain dedication. Funding: Financial support was provided by the August T. Larsson Foundation (NL Faculty, Swedish University of Agricultural Sciences). The Nebraska Cooperative Fish and Wildlife Research Unit are jointly supported by a cooperative agreement between the U.S. Geological Survey, the Nebraska Game and Parks Commission, the University of Nebraska2Lincoln, the United States Fish and Wildlife Service, and the Wildlife Management Institute. Reference to trade names does not imply endorsement by the authors or the U.S. government. The funders had no role in study design, data collection and analysis, decision to publish, or preparation of the manuscript. Competing Interests: The authors have declared that no competing interests exist. * E-mail: [email protected] Introduction The capacity of an ecosystem to tolerate disturbances without changing its original structure, functions and processes has been defined as ecological resilience [1,2]. Ecological systems can undergo regime shifts when disturbance thresholds are exceeded and reorganize in alternative states with new structures, functions and processes [3,4]. Ecological consequences of regime shifts are uncertain, and sometimes they are considered to have negative consequences for biodiversity and ecosystem service provisioning to humans; for instance, when cultural eutrophication triggers a shift from a clear-water to a turbid-water state [4,5]. After regime shifts, the new or alternative states can be stable, meaning that they resist returning to a state that existed prior to the regime shift [6]. In such cases, costly management and restoration interven- tions are needed to return ecosystems to resilient desired states [7,8,9,10]. Clear examples of ecosystems that are trapped in a degraded state are acidified lakes [11,12,13,14]. Although international agreements have resulted in reduced sulfur emissions to reduce acidification of freshwaters, several factors contribute to maintain lakes in an acidified state. Chemical weathering processes in soils [15,16], biological interactions [17], biotic resistance [18], food web stability [19], limited dispersal and population connectivity [20], scale-specific processes [21], and Allee effects [12,22] have been shown to constrain recovery to a desired, pre-acidification lake state. Thus, to protect sensitive biodiversity elements, especially the fish fauna, extensive liming programs have been established in many regions, including Sweden [23,24,25,26,27,28]. Despite the conse- quences of liming on aquatic biota and ecosystem properties being increasingly understood [29,30], it is unknown how liming affects the resilience of aquatic ecosystems. Here, we describe an analysis of the resilience of phytoplankton community structure (resilience of what, [31]) in circum-neutral, acidified and limed lakes (i.e., lakes with different anthropogenic stress and management histories; resilience to what). We compare resilience characteristics of limed lakes relative to the degraded, undesired lake conditions (acidified lakes) and targeted reference conditions (circum-neutral lakes) (e.g. [12]), and more generally the efficiency of liming as a management tool. For such analyses, phytoplankton communities are appealing compared to other PLOS ONE | www.plosone.org 1 March 2014 | Volume 9 | Issue 3 | e91881
-
Upload
independent -
Category
Documents
-
view
4 -
download
0
Transcript of Similar Resilience Attributes in Lakes with Different Management Practices

Similar Resilience Attributes in Lakes with DifferentManagement PracticesDidier L. Baho1*, Stina Drakare1, Richard K. Johnson1, Craig R. Allen2, David G. Angeler1
1 Swedish University of Agricultural Sciences, Department of Aquatic Sciences and Assessment, Uppsala, Sweden, 2 U.S. Geological Survey, Nebraska Cooperative Fish and
Wildlife Research Unit, School of Natural Resources, University of Nebraska – Lincoln, Lincoln, Nebraska, United States of America
Abstract
Liming has been used extensively in Scandinavia and elsewhere since the 1970s to counteract the negative effects ofacidification. Communities in limed lakes usually return to acidified conditions once liming is discontinued, suggesting thatliming is unlikely to shift acidified lakes to a state equivalent to pre-acidification conditions that requires no furthermanagement intervention. While this suggests a low resilience of limed lakes, attributes that confer resilience have not beenassessed, limiting our understanding of the efficiency of costly management programs. In this study, we assessedcommunity metrics (diversity, richness, evenness, biovolume), multivariate community structure and the relative resilienceof phytoplankton in limed, acidified and circum-neutral lakes from 1997 to 2009, using multivariate time series modeling.We identified dominant temporal frequencies in the data, allowing us to track community change at distinct temporalscales. We assessed two attributes of relative resilience (cross-scale and within-scale structure) of the phytoplanktoncommunities, based on the fluctuation frequency patterns identified. We also assessed species with stochastic temporaldynamics. Liming increased phytoplankton diversity and richness; however, multivariate community structure differed inlimed relative to acidified and circum-neutral lakes. Cross-scale and within-scale attributes of resilience were similar acrossall lakes studied but the contribution of those species exhibiting stochastic dynamics was higher in the acidified and limedcompared to circum-neutral lakes. From a resilience perspective, our results suggest that limed lakes comprise a particularcondition of an acidified lake state. This explains why liming does not move acidified lakes out of a ‘‘degraded’’ basin ofattraction. In addition, our study demonstrates the potential of time series modeling to assess the efficiency of restorationand management outcomes through quantification of the attributes contributing to resilience in ecosystems.
Citation: Baho DL, Drakare S, Johnson RK, Allen CR, Angeler DG (2014) Similar Resilience Attributes in Lakes with Different Management Practices. PLoS ONE 9(3):e91881. doi:10.1371/journal.pone.0091881
Editor: John F. Valentine, Dauphin Island Sea Lab, United States of America
Received August 28, 2013; Accepted February 17, 2014; Published March 11, 2014
This is an open-access article, free of all copyright, and may be freely reproduced, distributed, transmitted, modified, built upon, or otherwise used by anyone forany lawful purpose. The work is made available under the Creative Commons CC0 public domain dedication.
Funding: Financial support was provided by the August T. Larsson Foundation (NL Faculty, Swedish University of Agricultural Sciences). The NebraskaCooperative Fish and Wildlife Research Unit are jointly supported by a cooperative agreement between the U.S. Geological Survey, the Nebraska Game and ParksCommission, the University of Nebraska2Lincoln, the United States Fish and Wildlife Service, and the Wildlife Management Institute. Reference to trade namesdoes not imply endorsement by the authors or the U.S. government. The funders had no role in study design, data collection and analysis, decision to publish, orpreparation of the manuscript.
Competing Interests: The authors have declared that no competing interests exist.
* E-mail: [email protected]
Introduction
The capacity of an ecosystem to tolerate disturbances without
changing its original structure, functions and processes has been
defined as ecological resilience [1,2]. Ecological systems can
undergo regime shifts when disturbance thresholds are exceeded
and reorganize in alternative states with new structures, functions
and processes [3,4]. Ecological consequences of regime shifts are
uncertain, and sometimes they are considered to have negative
consequences for biodiversity and ecosystem service provisioning
to humans; for instance, when cultural eutrophication triggers a
shift from a clear-water to a turbid-water state [4,5]. After regime
shifts, the new or alternative states can be stable, meaning that
they resist returning to a state that existed prior to the regime shift
[6]. In such cases, costly management and restoration interven-
tions are needed to return ecosystems to resilient desired states
[7,8,9,10].
Clear examples of ecosystems that are trapped in a degraded
state are acidified lakes [11,12,13,14]. Although international
agreements have resulted in reduced sulfur emissions to reduce
acidification of freshwaters, several factors contribute to maintain
lakes in an acidified state. Chemical weathering processes in soils
[15,16], biological interactions [17], biotic resistance [18], food web
stability [19], limited dispersal and population connectivity [20],
scale-specific processes [21], and Allee effects [12,22] have been
shown to constrain recovery to a desired, pre-acidification lake state.
Thus, to protect sensitive biodiversity elements, especially the fish
fauna, extensive liming programs have been established in many
regions, including Sweden [23,24,25,26,27,28]. Despite the conse-
quences of liming on aquatic biota and ecosystem properties being
increasingly understood [29,30], it is unknown how liming affects
the resilience of aquatic ecosystems.
Here, we describe an analysis of the resilience of phytoplankton
community structure (resilience of what, [31]) in circum-neutral,
acidified and limed lakes (i.e., lakes with different anthropogenic
stress and management histories; resilience to what). We compare
resilience characteristics of limed lakes relative to the degraded,
undesired lake conditions (acidified lakes) and targeted reference
conditions (circum-neutral lakes) (e.g. [12]), and more generally
the efficiency of liming as a management tool. For such analyses,
phytoplankton communities are appealing compared to other
PLOS ONE | www.plosone.org 1 March 2014 | Volume 9 | Issue 3 | e91881

groups because they respond quickly to environmental change
[6,32] and are good indicators for tracking community changes in
acidified [33], and limed lakes [29].
Theory and empirical evidence suggest that the dynamics of
ecosystems are controlled by a small set of ecological processes that
operate at distinct spatial and temporal scales [21,34,35]. The
partitioning of structures and processes at multiple scales of time
and space has important implications for the resilience of
ecological systems [36,37,38], because resilience depends partly
on how species, and the ecological functions they carry out, are
distributed within and across scales [5,39,40]. It has been assumed
that resilience increases with an increasing redundancy of species
functions at a single scale, as well as how often these functions
occur across scales [41]. Thus, a first step towards the empirical
quantification of resilience is to make within and cross-scale
structures explicit.
We use multivariate time series modeling, based on canonical
ordination, to identify dominant temporal frequency fluctuation
patterns in the phytoplankton communities [42]. Specifically, time
series modeling identifies different temporal frequency patterns in
the abundance or biomass structure of communities, which allows
an assessment of the dynamic system structure that most likely
arises from, and thus reflects, state-inherent system organization
(e.g. feedbacks that characterize a basin of attraction). The method
allows us to test for the presence of dominant temporal frequencies
in species abundance or biomass, which in turn provides insight
into temporal scaling patterns of communities [42,43]. Enumer-
ating the number of fluctuation frequencies or temporal scales
present, allow us to quantify the cross-scale aspect of ecological
resilience [44,45]. We can then determine a second characteristic
of resilience by examining the distribution of species within each of
the temporal scales identified [44,45]. Hypothetically, in a
degraded ecosystem only a few dominant species might explain
fluctuation frequencies at the temporal scales detected, whereas in
a restored ecosystem both species richness within and the number
of scales are higher. In this hypothetical example, the resilience of
the restored system is deemed to be higher because of a higher
within- and cross scale redundancy of patterns, suggesting a
stronger reinforcement of processes and greater ability to buffer
against disturbances.
Within and cross-scale structures in ecosystems are related to
diversity [46]. To evaluate how diversity characteristics influence
the within- and cross-scale structure of acidified, limed and
circum-neutral lakes, we first evaluate metrics of community
structure that are commonly used in ecology, followed by time
series modeling. Based on our current ecological knowledge of
limed and acidified lakes, we test the hypothesis that the relative
resilience of limed lakes is lower relative to circum-neutral and
acidified lakes. This lower resilience should manifest in a reduced
within- and cross-scale structure arising from lime applications
that we expect shall disrupt and homogenize natural community
assembly processes. Results may provide a mechanistic basis for
understanding why communities return to an acidified state once
liming is discontinued [30].
Materials and Methods
Ethics StatementAll field sampling and laboratory analyses reported in this study
are part of either the Swedish National Lake Monitoring Program
or the national monitoring program for Integrated Studies of the
Effects of Liming of Acidified Waters, both regulated by the
Swedish Agency for Marine and Water Management. All data are
made freely available to the public via the web by the data host
(Department of Aquatic Sciences and Assessment; Swedish
University of Agricultural Sciences; www.slu.se/aquatic-sciences)
and no permission for use of the data is therefore required. It is
also confirmed that the field studies did not involve endangered or
protected species.
Table 1. Results of repeated-measures ANOVA contrasting phytoplankton community metrics (total biovolume, richness, diversityand evenness) between lakes (circum-neutral, acidified and limed), time (year) and their interactions.
Metrics Statistics Treatment Time Treatment 6Time
Total biovolume d.f 3.71, 22.26 7.42, 22.26 7.42, 22.26
MS 2.12 0.45 0.22
F 0.15 2.01 0.98
P 0.86 0.13 0.48
Richness d.f 10.36, 62.18 20.73, 62.18 20.73, 62.18
MS 34973.35 262.93 100.42
F 19.23 4.50 1.72
P ,0.001 ,0.001 0.05
Diversity d.f 16.95, 101.70 33.90, 101.70 33.90, 101.70
MS 4330.69 78.48 32.07
F 12.27 2.53 1.04
P ,0.001 ,0.001 0.43
Evenness d.f 2, 6 38, 228 38, 228
MS 0.24 0.03 0.01
F 0.59 3.08 1.03
P 0.584 ,0.001 0.412
Significant terms are emphasized in bold.(df: degrees of freedom Huynh-Feldt corrected, MS: mean squares, F ratio and P levels).doi:10.1371/journal.pone.0091881.t001
Management and Resilience
PLOS ONE | www.plosone.org 2 March 2014 | Volume 9 | Issue 3 | e91881
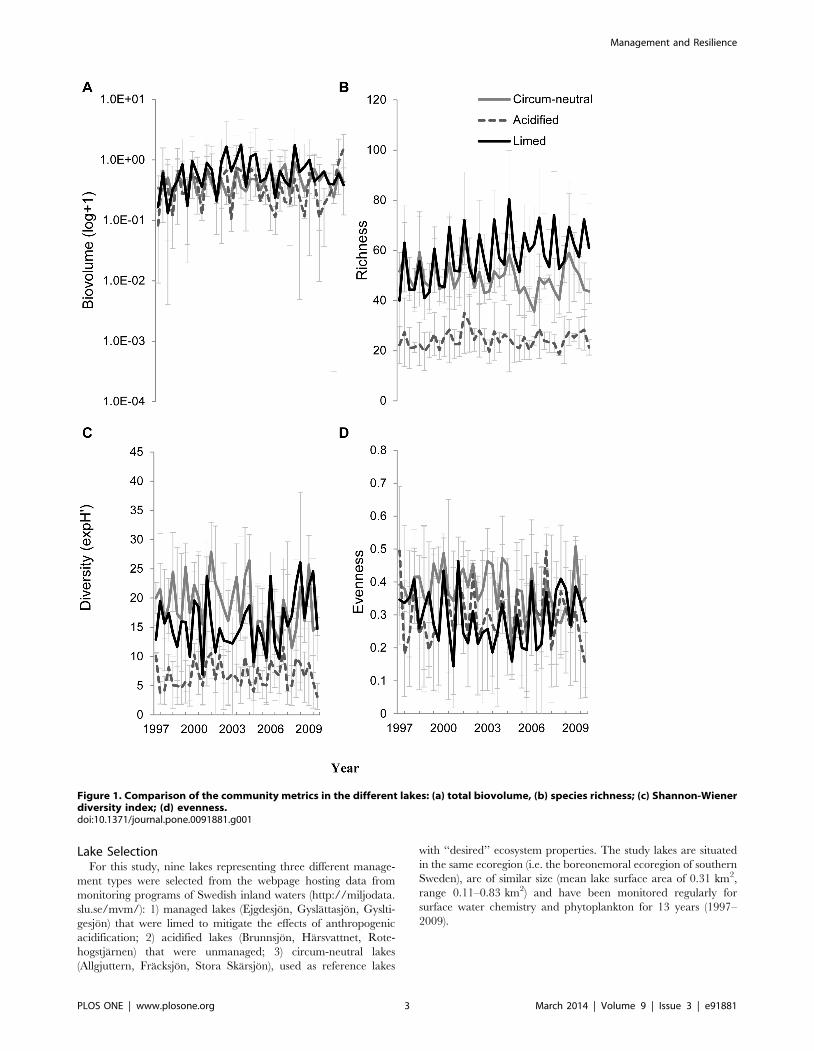
Lake SelectionFor this study, nine lakes representing three different manage-
ment types were selected from the webpage hosting data from
monitoring programs of Swedish inland waters (http://miljodata.
slu.se/mvm/): 1) managed lakes (Ejgdesjon, Gyslattasjon, Gyslti-
gesjon) that were limed to mitigate the effects of anthropogenic
acidification; 2) acidified lakes (Brunnsjon, Harsvattnet, Rote-
hogstjarnen) that were unmanaged; 3) circum-neutral lakes
(Allgjuttern, Fracksjon, Stora Skarsjon), used as reference lakes
with ‘‘desired’’ ecosystem properties. The study lakes are situated
in the same ecoregion (i.e. the boreonemoral ecoregion of southern
Sweden), are of similar size (mean lake surface area of 0.31 km2,
range 0.11–0.83 km2) and have been monitored regularly for
surface water chemistry and phytoplankton for 13 years (1997–
2009).
Figure 1. Comparison of the community metrics in the different lakes: (a) total biovolume, (b) species richness; (c) Shannon-Wienerdiversity index; (d) evenness.doi:10.1371/journal.pone.0091881.g001
Management and Resilience
PLOS ONE | www.plosone.org 3 March 2014 | Volume 9 | Issue 3 | e91881

SamplingPhytoplankton and two water chemistry variables that are
directly related to liming (pH and calcium concentration) were
sampled monthly during the ice-free period at a mid-lake station in
each lake. Water was collected at 0.5 m depth with a PlexiglasHsampler and kept cool during transport to the laboratory for
further analysis. All physicochemical analyses were done by
SWEDAC certified laboratories (Swedish Board for Accreditation
and Conformity Assessment, SWEDAC; http://www.swedac.se/
en/) at the Department of Aquatic Sciences and Assessment,
Swedish University of Agricultural Sciences, following Interna-
tional (ISO) or European (EU) standards when available [47]. A
broader characterization of the abiotic environment of the lakes
studied is shown in Electronic Table S1. Standard sampling
protocols for abiotic and biological variables were used throughout
the study period.
Phytoplankton was sampled by taking a water sample from the
epilimnion using a 2-m long Plexiglas tube sampler (diame-
ter = 3 cm). In lakes with a surface area .1 km2 a single mid-lake
site was used for sampling. In lakes with a surface area ,1 km2,
five random epilimnetic water samples were taken and mixed to
form a composite sample from which a subsample was taken and
preserved with acid Lugol’s iodine solution [48]. Phytoplankton
counts were made using an inverted light microscope and the
modified Utermohl technique commonly used in the Nordic
countries [48]. Taxa were identified to the lowest taxonomic unit
possible (usually species). Biovolumes (mm3 L21) were calculated
from geometric shapes following protocols developed by Blomqvist
and Herlitz [49].
Statistical Analyses
Community and Water Quality AnalysisPrior to analyses, phytoplankton data were averaged to obtain
three values that were spaced nearly equidistantly in time,
covering early spring, summer and late autumn each year. We
characterized phytoplankton community structure across lakes
using common metrics (total biovolume, richness, diversity and
evenness) following recent recommendations by Jost [50] and
Tuomisto [51,52] to obtain mathematically and statistically
unbiased measures. The exponentiated Shannon index [50],
which considers both species richness and evenness was used as a
measure of ‘‘diversity’’ [51]. Exponentiation of the Shannon index
expresses diversity in terms of species equivalents, making
‘‘diversity’’ and ‘‘richness’’ patterns directly comparable [50,51].
Evenness was obtained by dividing ‘‘diversity’’ with ‘‘richness’’ and
therefore unrelated to richness [50,52].
Repeated measures analysis of variance (rm-ANOVA) was
carried out in Statistica v.5 (Statsoft Inc, Tulsa, OK, USA) to test
for significant differences in phytoplankton community metrics
between the three categories of lakes. Similar rm-ANOVAs were
conducted for pH and calcium concentration, to associate
phytoplankton community dynamics with abiotic effects of liming.
We tested for the effects of ‘‘management type’’ (circum-neutral,
acidified and limed) (fixed factor), ‘‘time’’ (random factor) and
their interactions. These factors comprised the independent
variables while the community metrics comprised the dependent
variables in the analysis. All data were log-transformed when
necessary prior to analyses to fulfill the requirements of parametric
tests. Because assumptions of sphericity were violated, degrees of
Table 2. Results of PERMANOVA contrasting phytoplankton communities between lakes (circum-neutral, acidified and limed),time (year) and their interactions.
Metrics Statistics Treatment Time Treatment 6Time
Communities d.f 2, 6 38, 228 76, 228
MS 8.28 0.27 0.14
F 38.81 1.24 0.65
P ,0.001 ,0.001 1
Significant terms are emphasized in bold.(df: degrees of freedom, MS: mean squares, F ratio and P levels).doi:10.1371/journal.pone.0091881.t002
Table 3. Results of repeated-measures ANOVA contrasting water quality variables (pH and calcium concentration) between lakes(circum-neutral, acidified and limed), time (year) and their interactions.
Parameters Statistics Treatment Time Treatment 6Time
pH d.f 2, 6 38, 228 76, 228
MS 80.25 0.05 0.03
F 894.9 0.56 0.31
P ,0.001 0.98 1.00
Calcium (meq/L) d.f 2, 6 38, 228 76, 228
MS 1.30 ,0.01 ,0.01
F 463.07 0.78 0.42
P ,0.001 0.83 1.00
Significant terms are emphasized in bold.(df: degrees of freedom, MS: mean squares, F ratio and P levels).doi:10.1371/journal.pone.0091881.t003
Management and Resilience
PLOS ONE | www.plosone.org 4 March 2014 | Volume 9 | Issue 3 | e91881
freedom were corrected following the procedure by Huynh and
Feldt [53] (note that this adjustment can lead to degrees of
freedom with decimals). Inference was made at P,0.05. Tukey’s
HSD test was performed to make a posteriori, group-wise
comparisons of lake management types when a significant
treatment effect was observed. We consider significant interaction
terms between management type 6 time crucial for inferring
differences in phytoplankton community metrics.
These univariate comparisons were complemented with multi-
variate analyses on phytoplankton communities using permuta-
tional multivariate analysis of variance in PERMANOVA version
1.6 [54]. PERMANOVA was based on a similar design as the
univariate ANOVAs, using square root transformed species
biovolume matrices that were converted in Bray–Curtis dissimi-
larity matrices and 9999 unrestricted permutations of raw data.
Significant differences were inferred at an a-level of 0.05.
Multivariate Time Series ModelingWe assessed two attributes of relative resilience (cross-scale and
within-scale structure) of the phytoplankton communities with a
time series modeling approach based on redundancy analysis
(RDA) [42]. For an outline of the approach see the flow chart in
Appendix S1 and Angeler et al [45]. We used temporal variables
extracted by Asymmetric Eigenvector Maps (AEM) analysis
[55,56]. Briefly, the AEM analysis produces a set of orthogonal
temporal variables that are derived from the linear time vector
that comprises the length of the study period (i.e., 39 time steps for
each lake) and that can be used as explanatory variables to model
temporal relationships in community data. The type of AEM
variables computed in the present study was designed for spatial
analysis to account for linear trends in the response variables. As
time comprises a directional process, AEM is better suited to
model linear trends relative to other methods (Principal Coordi-
nates of Neighbor Matrices and Moran Eigenvector Maps [56]).
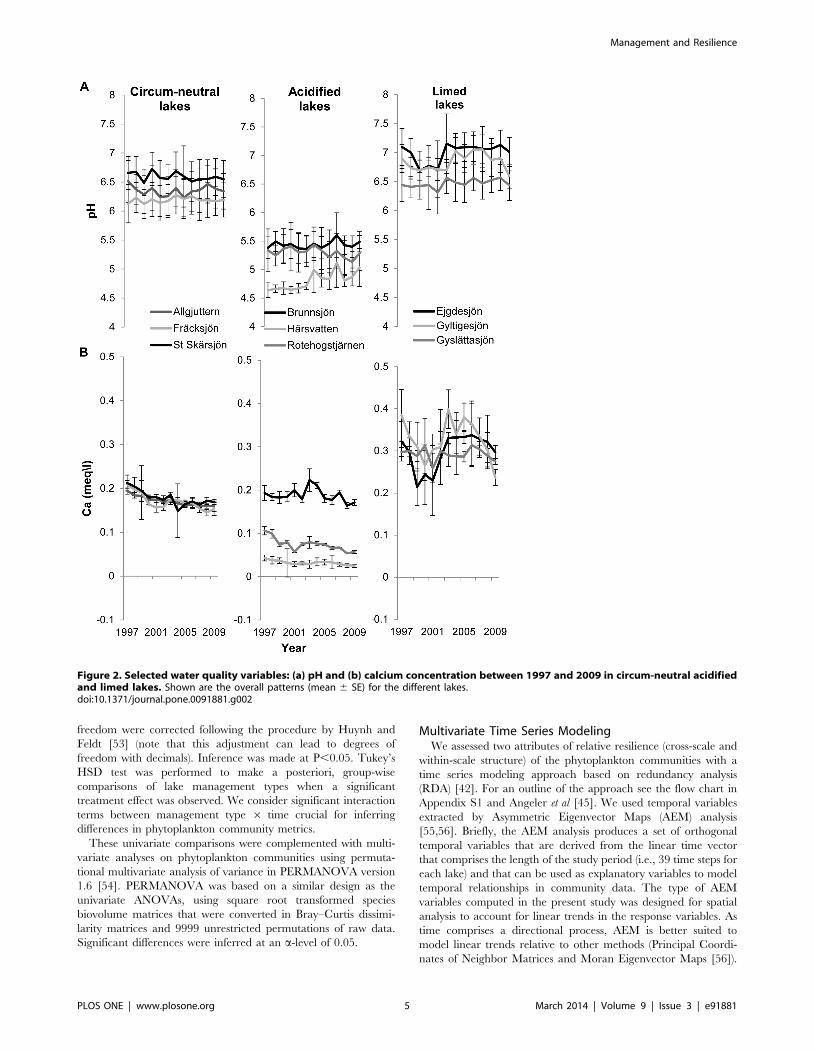
Figure 2. Selected water quality variables: (a) pH and (b) calcium concentration between 1997 and 2009 in circum-neutral acidifiedand limed lakes. Shown are the overall patterns (mean 6 SE) for the different lakes.doi:10.1371/journal.pone.0091881.g002
Management and Resilience
PLOS ONE | www.plosone.org 5 March 2014 | Volume 9 | Issue 3 | e91881
This procedure yielded AEM variables with positive Eigenvalues,
each of which corresponds to a specific temporal structure and
scale: the first AEM variable models linear trends and the
subsequent variables capture temporal variability from slow to
increasingly shorter fluctuation frequencies in the community data
[57]. For each lake we constructed a parsimonious temporal model
by running a forward selection on the AEM variables. Because
AEM analysis is efficient in covering linear trends no detrending of
models was necessary.
Redundancy analysis (RDA) retains significant AEM variables
and these are linearly combined in ways to extract temporal
patterns from the Hellinger-transformed species matrices (this
transformation is achieved by dividing the species biovolumes by
the row sum and taking the square root of the resulting values).
The RDA identifies species with similar temporal patterns in the
species 6 time matrix and uses their temporal pattern to calculate
a modeled species group trend for these species based on linearly
combined AEMs. The significance of the temporal patterns of all
modeled fluctuation patterns of species groups revealed by the
RDA is tested by means of permutation tests. The RDA relates
each modeled temporal fluctuation pattern with a significant
canonical axis. The R software generates linear combination (lc)
score plots, which visually present the modeled temporal patterns
of species groups that are associated with each canonical axis.
Based on the number of significant canonical axes, the number of
modeled fluctuation patterns of species groups with independent
temporal patterns can be deduced. The ecological relevance of
each temporal pattern identified can be quantified, using adjusted
R2 values of the canonical axes. The overall temporal structure of
the whole community can then be deduced from the number of
significant canonical axes in the RDA models. The number of
canonical (RDA) axes identified gives insight about the number of
temporal scales at which phytoplankton community fluctuations
take place and can therefore be used to assess the cross-scale
structure attribute of resilience [44,45].
All relevant steps in the analyses were carried out with two
functions implemented in the R 2.15.2 statistical software package
[58]. First, the conversion of the linear time vector to AEM
variables is done using the ‘‘aem.time’’ function (AEM package).
All remaining steps (calculation of modeled species group trends,
visual presentation of the results in form of lc score plots) are
carried out with the ‘‘quickPCNM’’ function (PCNM package). All
models are calculated exclusively based on an automatic statistical
procedure, which limits bias in modeling scales that can be
introduced by researcher subjectivity.
After identifying the cross-scale structure in phytoplankton
community dynamics, we evaluated the within-scale attribute of
resilience using correlation analysis. Spearman’s rank correlation
analysis was used to investigate the relationship between individual
phytoplankton species (raw biovolume data of individual species)
with the linear combination (lc) scores extracted from significant
canonical axes of the time series models for each lake type. With
this approach we were able to calculate scale-specific taxon
richness. Species that did not correlate with any canonical axes
were considered to reflect stochastic dynamics. The number of
these stochastic species was evaluated by subtracting the total
number of species that correlated with canonical axes from the
total number of species used for the time series modeling across
lakes [45].
Results
Univariate and Multivariate Community AnalysesUnivariate analyses of community metrics (Table 1; Figure 1)
revealed significant lake management type effects for species
richness and diversity but not for total biovolume and evenness.
Post-hoc analysis revealed that the species richness and diversity
were higher in circum-neutral lakes and limed lakes compared to
acidified lakes (Tukey’s HSD test: circum-neutral = limed.acidi-
fied; P,0.05). The effect of time was significant for all metrics
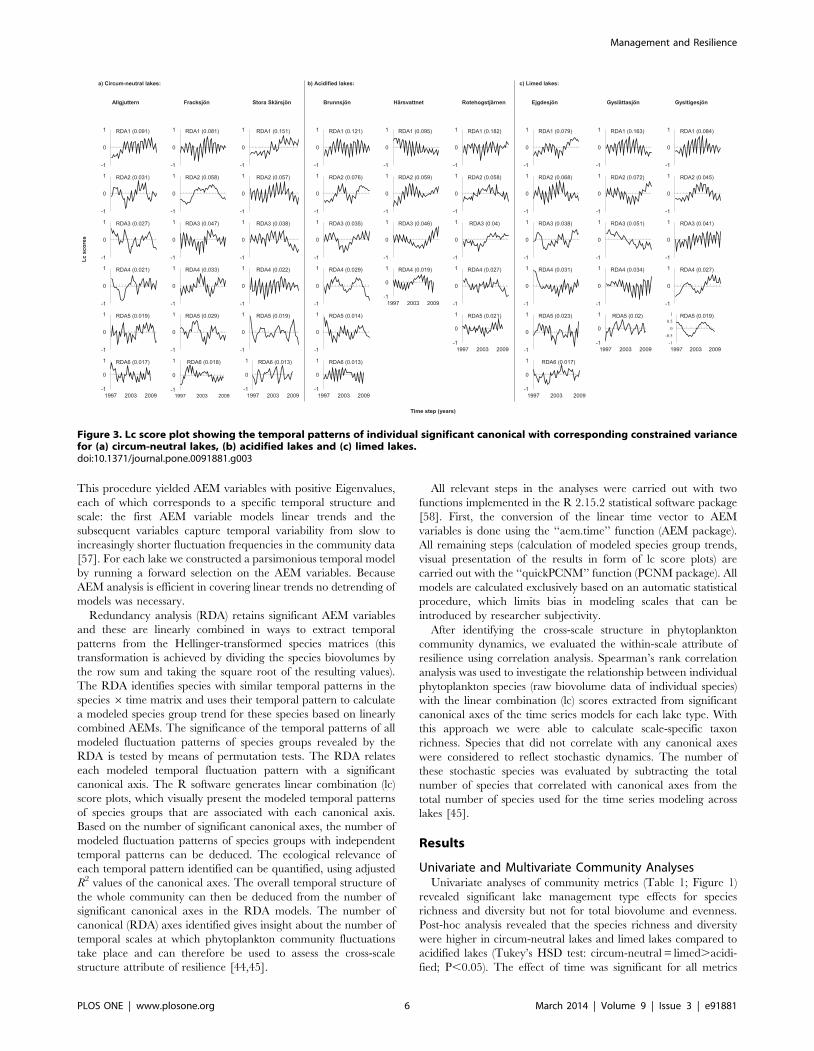
Figure 3. Lc score plot showing the temporal patterns of individual significant canonical with corresponding constrained variancefor (a) circum-neutral lakes, (b) acidified lakes and (c) limed lakes.doi:10.1371/journal.pone.0091881.g003
Management and Resilience
PLOS ONE | www.plosone.org 6 March 2014 | Volume 9 | Issue 3 | e91881

studied, but the interaction term (management type 6 time) was
only significant for species richness. The results of the PERMA-
NOVA identified a significant effect of management type and time
whilst the interaction effect was not significant (Table 2). Group-
wise analysis using PERMANOVA indicated that the phytoplank-
ton community structure in the three different lake types were
significantly different from each other (P,0.001).
Water Chemistry: pH and Calcium ConcentrationThe results of the repeated measures analysis of variance
revealed that management type has an effect on both the pH and
the calcium concentration, while the effect of time and the
interaction term were not significant (Table 3 and Figure 2).
Moreover, post-hoc analysis revealed that both the pH and the
calcium concentration were higher in limed lakes than circum-
neutral and acidified lakes, whereas circum-neutral lakes had
higher values than acidified lakes (Tukey’s HSD test: Limed.
circum-neutral.acidified; P,0.05).
Multivariate Time Series ModelingTime series modeling revealed significant temporal structure in
all lakes studied (Figure 3). The RDA models explained on average
similar amounts of the adjusted variance of phytoplankton
community dynamics (26% circum-neutral lakes, 27% acidified
and 28% limed). The models show that the temporal fluctuation
patterns of groups within the phytoplankton communities were
unique in each lake independent of management practice.
However, all circum-neutral lakes showed temporal dynamics at
six significant temporal scales, compared to acidified (Brunnsjon 6,
Harsvattnet 4, Rotehogstjarnen 5) and limed lakes (Ejgdesjon 6,
Gyslattasjon 5, Gysltigesjon 5) (Figure 3), highlighting a slightly
higher and more consistent cross-scale structure in circum-neutral
lakes relative to the other lake types. Using Spearman rank
correlation analysis (Table 4) to assess the within-scale attribute of
resilience, we found that the number of species contributing to the
scale-specific temporal patterns was comparable across the
different lake types, suggesting that they have similar within-scale
structures. Species that did not correlate with any significant
temporal frequency pattern (i.e. stochastic species) were on
average higher in limed (27%) and acidified (23%) compared to
circum-neutral (15%) lakes.
Discussion
The relative resilience of limed lakes in terms of the dynamic
within- and cross-scale structure of phytoplankton communities
was predicted to be lower relative to acidified and circum-neutral
lakes. The within-scale component of resilience, expressed as the
percentage of species that explained each temporal pattern, was
similar across lake types. Also the cross-scale structure differed
marginally between managed and unmanaged lakes, although
water chemistry accounted for subtle differences in cross-scale
structure. All circum-neutral lakes and the least acidified
Brunnsjon showed six distinct temporal frequency fluctuations,
while the most acidified lake Harsvatten, that clearly comprises an
undesired but stable state, had only four patterns. This pattern is
counterintuitive because it suggests a lower resilience of this lake.
This highlights that the cross-scale structure analysis, despite
characterizing important features of complexity, may not capture
the full spectrum of resilience. Our study shows how considering
the dynamics of stochastic species can provide a broader picture of
resilience. Similarly, despite liming substantially increasing pH and
calcium concentration, no significant increase in cross-scale
structure was observed, highlighting no pronounced effect of
Ta
ble
4.
Spe
arm
anra
nk
corr
ela
tio
nan
alys
issh
ow
ing
the
nu
mb
er
of
spe
cie
sco
rre
lati
ng
wit
hth
esi
gn
ific
ant
can
on
ical
(RD
A)
axe
sfr
om
the
mu
ltiv
aria
teti
me
seri
es
anal
ysis
.
La
ke
RD
A1
RD
A2
RD
A3
RD
A4
RD
A5
RD
A6
Sto
cha
stic
To
tal
Allg
jutt
ern
a4
2(3
3)
19
(15
)1
1(9
)1
1(9
)1
1(9
)1
4(1
1)
17
(14
)1
25
Frac
ksjo
na
36
(27
)1
7(1
3)
31
(24
)1
4(1
1)
17
(13
)7
(5)
9(7
)1
31
Sto
raSk
arsj
on
a3
6(2
1)
20
(11
)3
0(1
7)
19
(11
)1
2(7
)1
3(7
)4
6(2
6)
17
6
Bru
nn
sjo
nb
18
(23
)1
5(1
9)
11
(14
)2
(3)
7(9
)7
(9)
18
(23
)7
8
Har
svat
ten
b1
5(2
9)
7(1
4)
8(1
6)
6(1
2)
––
15
(29
)5
1
Ro
teh
og
stja
rne
nb
21
(20
)2
0(1
9)
24
(23
)1
3(1
4)
6(6
)–
19
(18
)1
03
Ejg
de
sjo
nc
48
(23
)3
8(1
9)
25
(12
)1
6(8
)8
(4)
14
(7)
55
(27
)2
04
Gyl
tig
esj
on
c3
7(1
3)
44
(16
)4
6(1
6)
48
(17
)1
0(4
)–
94
(34
)2
79
Gys
latt
asjo
nc
54
(20
)7
4(2
8)
40
(15
)3
5(1
2)
13
(5)
–5
3(2
0)
26
9
Th
en
um
be
ro
fsp
eci
es
that
did
no
tco
rre
late
wit
han
ysi
gn
ific
ant
axe
sw
asco
nsi
de
red
as‘‘S
toch
asti
c’’a
nd
the
tota
ln
um
be
ro
fsp
eci
es
inth
eco
mm
un
itie
sas
‘‘To
tal’’
.Val
ue
ssh
ow
nin
par
en
the
ses
are
calc
ula
ted
pe
rce
nta
ge
sfr
om
the
tota
l.aci
rcu
m-n
eu
tral
lake
s,b
acid
ifie
dla
kes,
clim
ed
lake
s.d
oi:1
0.1
37
1/j
ou
rnal
.po
ne
.00
91
88
1.t
00
4
Management and Resilience
PLOS ONE | www.plosone.org 7 March 2014 | Volume 9 | Issue 3 | e91881
management action on phytoplankton cross-scale attributes of
resilience. Although our study hypothesis was rejected, our results
provided us with a better understanding how management action,
specifically liming, influences resilience.
Management and restoration efforts are often directed towards
breaking equilibrium conditions of undesired system states,
returning them to more desired states and increasing the resilience
of these restored or managed states [7,8,9,10]. The finding of
similar resilience characteristics across circum-neutral, acidified
and limed lakes has several implications for management,
especially regarding liming as a management tool [29,59,60].
The results can be interpreted in two contexts. (1) Circum-neutral
lakes have been marginally affected by anthropogenic acidification
because of their higher acid buffering capacity [61,62]. The
resilience characteristics observed in those lakes therefore com-
prises the target of management. The similar within - and cross-
scale features of resilience observed in the acidified lakes suggest
that natural recovery has putatively led to approaching targeted
(circum-neutral lakes) resilience conditions. In this case, given the
similar within- and cross scale resilience characteristics observed in
limed lakes, we can conclude that costly management interven-
tions do not necessarily achieve better conditions than unman-
aged, natural recovery [60].
(2) The resilience characteristics observed in acidified lakes
characterizes their basin of attraction and thus their resistance to
return to desired target conditions [32]. This explanation seems
more plausible, given that ecological recovery (i.e. resilience
attributes and community composition) has not reached manage-
ment targets in many cases despite decades of policy implemen-
tation [28,63]. This interpretation is also supported by research
that has identified many abiotic and biotic factors that constraint
recovery [12,13,64]. How is this related to the resilience observed
in limed lakes?
The similar within- and cross-scale attributes of resilience in
limed and acidified lakes, suggest that liming produces at least a
partial management success in terms of increasing species richness
and diversity, which has also been observed in other studies
[29,65,66]. However, from a systemic point of view, it seems to
reorganize communities within the acidified states rather than
break the feedbacks that maintain lakes in the acidified state. This
re-organization, which was manifested in communities that are
neither representative of acidified nor circum-neutral lakes, was
evident in our PERMANOVA analysis (see also NMDS plot in
Appendix S2) and the water chemistry analysis (see also [29]).
From a resilience perspective, our results suggest that limed lakes
comprise a particular condition of an acidified lake state; that is,
liming keeps lakes in the ‘‘degraded’’ basin of attraction, thereby
failing to restore and reinforce a desired state equivalent to pre-
acidification conditions that maintains desired ecosystem attri-
butes. Alternatively, if liming creates an alternative basin of
attraction, it might be very shallow and therefore instable.
Whether or not limed lakes comprise a particular configuration
of an acidified state or an alternative state itself, our results support
findings that have suggested that communities return to an
acidified state once liming is discontinued [30]. Thus, the broader
ecological implications of liming lakes are the following: 1) when
natural recovery of acidified lakes attains similar resilience
characteristics as in targeted reference lakes, costly management
practice might not be necessary, 2) ecologists have begun to regard
liming as an ecosystem-level perturbation rather than an integral
restoration tool [67,68,69]. In a more specific management
context, liming may comprise some form of command and control
management [70], whereby the partial success in terms of targeted
increase in diversity and species richness, and habitat suitability to
sustain fisheries might generate substantial negative side effects in
the ecosystem due to biogeochemical alteration [71]. If liming only
partly mitigates acidification impacts without fundamentally
altering the equilibrium conditions of acidified states (i.e. restoring
acidified lakes to pre-acidification conditions that become self-
sustaining), further research will be required to foster our
understanding of potentially negative side effects on the ecological
integrity of managed lakes (e.g. altered Al toxicity [72], altered
nutrient precipitation [73], material consumption by invertebrates
[74], food web structure [29]).
In addition to assessing patterns of resilience across managed
and unmanaged boreal lakes, our study provides new insight into
the consequences of liming for biodiversity and its effects on
resilience. Increased resilience has been associated with a higher
species richness and diversity in communities [5,32]. While liming
indeed increased the species richness and diversity in the limed
lakes to targeted levels present in circum-neutral relative to
acidified lakes, our time series models suggest that this increased
diversity contributed little to within- and cross scale structure in
the phytoplankton communities. This apparent paradox can be
explained by the number of species with ostensibly stochastic
dynamics that were on average higher in the limed and acidified
compared to circum-neutral lakes. From a disturbance ecology
perspective, our results are consistent with the findings of an
increased importance of stochastic community assembly when
ecosystems face perturbations [75,76]; if this pattern can be
generalized, the argument that liming comprises a perturbation
would find additional support. This also suggests that the most
acidified lake Harsvatten with the lowest cross-scale structure
detected, might be able to cope with disturbances, thereby
maintaining its functions and feedbacks, because of the higher
amount of stochastic species increasing adaptive capacity (e.g. a
high response diversity [77]). Our study makes clear how the role
of species richness can be scrutinized if partitioned into patterns
that reflect both the deterministic and stochastic processes
occurring at different scales [45], thereby highlighting the
usefulness of time series modeling for assessing resilience. These
patterns can be further explored for gaining a more process-based
understanding of how management affects species diversity and
their influence on resilience.
We conclude by highlighting that, given the similar within-
and cross-scale attributes observed across lakes, an assessment of
resilience characteristic of limed lakes would have been
inconclusive. Without information of the broader ecological
impacts of liming on communities and other ecosystem
characteristics that has accumulated in the literature
[29,30,68,69,71,72,73,74] and ecological knowledge of refer-
ence lakes, we would have not been able to judge whether lake
liming achieved the ultimate management goal: of restoring and
fostering desired ecosystem states. Assessments of the relative
resilience of managed systems therefore require multiple lines of
evidence, including reference sites that comprise management
targets and approaches based on complex systems theory and
‘‘traditional’’ ways of characterizing community structure and
functions to increase inference.
Supporting Information
Table S1 Summary of geographical positions, morphological
characteristics and water chemistry of study lakes. Values
represent the inter-annual mean value and standard deviation
for the study period 1997–2009.
(DOCX)
Management and Resilience
PLOS ONE | www.plosone.org 8 March 2014 | Volume 9 | Issue 3 | e91881
Appendix S1 Flow chart outlining the steps involved intime series modeling.
(DOCX)
Appendix S2 Non-metric multidimensional scaling(NMDS) ordination showing phytoplankton communi-ties across the different lake types over the study period(1997–2009).
(DOCX)
Acknowledgments
The authors thank the Swedish Agency for Marine and Water
Management and the many people involved in the monitoring program
for making this study possible. The constructive criticism received from two
anonymous referees helped to improve the paper.
Author Contributions
Conceived and designed the experiments: DLB DGA SD RKJ. Performed
the experiments: DLB DGA. Analyzed the data: DLB DGA. Wrote the
paper: DLB DGA SD RKJ CRA.
References
1. Holling CS (1973) Resilience and stability of ecological systems. Annual Reviewof Ecology and Systematics 4: 1–23.
2. Walker B, Holling CS, Carpenter SR, Kinzig A (2004) Resilience, adaptability
and transformability in social-ecological systems. Ecology and Society 9.
3. Beisner BE, Haydon DT, Cuddington K (2003) Alternative stable states in
ecology. Front Ecol Environ 1: 376–382.
4. Scheffer M, Carpenter S, Foley JA, Folke C, Walker B (2001) Catastrophic shifts
in ecosystems. Nature 413: 591–596.
5. Folke C, Carpenter S, Walker B, Scheffer M, Elmqvist T, et al. (2004) Regimeshifts, resilience, and biodiversity in ecosystem management. Annual Review of
Ecology Evolution and Systematics 35: 557–581.
6. Scheffer M, Hosper SH, Meijer ML, Moss B, Jeppesen E (1993) Alternative
equilibria in shallow lakes. Trends in Ecology & Evolution 8: 275–279.
7. Soltero R, Singleton L, Patmont C (1992) The changing spokane riverwatershed: actions to improve and maintain water quality. In: Naiman R, editor.
Watershed Management: Springer New York. pp. 458–478.
8. Jeppesen E, Meerhoff M, Jacobsen BA, Hansen RS, Søndergaard M, et al.
(2007) Restoration of shallow lakes by nutrient control and biomanipulation–the
successful strategy varies with lake size and climate. Hydrobiologia 581: 269–285.
9. Cooke GD (1993) Restoration and management of lakes and reservoirs. LewisPublishers (Boca Raton, Fla.).
10. Carpenter SR, Kraft CE, Wright R, He X, Soranno PA, et al. (1992) Resilience
and resistance of a lake phosphorus cycle before and after food webmanipulation. The American Naturalist 140: 781–798.
11. Marmorek D, Korman J (1993) The use of zooplankton in a biomonitoringprogram to detect lake acidification and recovery. Water, Air, and Soil Pollution
69: 223–241.
12. Yan ND, Keller W, Somers KM, Pawson TW, Girard RE (1996) Recovery ofcrustacean zooplankton communities from acid and metal contamination:
Comparing manipulated and reference lakes. Canadian Journal of Fisheries andAquatic Sciences 53: 1301–1327.
13. Yan ND, Leung B, Keller W, Arnott SE, Gunn JM, et al. (2003) Developing
conceptual frameworks for the recovery of aquatic biota from acidification.Ambio 32: 165–169.
14. Kopacek J, StuchlIk E, Vesely J, Schaumburg J, Anderson I, et al. (2002)Hysteresis in Reversal of Central European Mountain Lakes from Atmospheric
Acidification. Water, Air and Soil Pollution: Focus 2: 91–114.
15. Bostedt G, Lofgren S, Innala S, Bishop K (2010) Acidification remediationalternatives: Exploring the temporal dimension with cost benefit analysis. Ambio
39: 40–48.
16. Jacks G, Joelsson A, Fleischer S (1994) Nitrogen retention in forest wetlands.
Ambio 23: 358–362.
17. Ledger ME, Hildrew AG (2005) The ecology of acidification and recovery:changes in herbivore-algal food web linkages across a stream pH gradient.
Environmental Pollution 137: 103–118.
18. Keller W, Yan ND (1998) Biological recovery from lake acidification:
Zooplankton communities as a model of patterns and processes. Restoration
Ecology 6: 364–375.
19. Layer K, Hildrew A, Monteith D, Woodward G (2010) Long-term variation in
the littoral food web of an acidified mountain lake. Global Change Biology 16:3133–3143.
20. Gray DK, Arnott SE (2011) Does dispersal limitation impact the recovery of
zooplankton communities damaged by a regional stressor? Ecological Applica-tions 21: 1241–1256.
21. Angeler DG, Johnson RK (2012) Temporal scales and patterns of invertebratebiodiversity dynamics in boreal lakes recovering from acidification. Ecological
Applications 22: 1172–1186.
22. Gray DK, Arnott SE (2011) The interplay between environmental conditionsand Allee effects during the recovery of stressed zooplankton communities.
Ecological Applications 21: 2652–2663.
23. Appelberg M, Svenson T (2001) Long-term ecological effects of liming – theIselaw programme. In: Satake K, Shindo J, Takamatsu T, Nakano T, Aoki S et
al., editors. Acid rain 2000: Springer Netherlands. pp. 1745–1750.
24. Bertills U, J Folster, and H Lager (2007) Natural acidification only–report on in-
depth evaluation of the environmental quality objective work. Stockholm,Sweden: Swedish Environmental Protection Agency. 116 pp p.
25. Gunn J, Sein R, Keller B, Beckett P (2001) Liming of acid and metal
contaminated catchments for the improvement of drainage water quality. Water,
Air, and Soil Pollution 130: 1439–1444.
26. Hagley CA, Wright D, Owen CJ, Eiler P, Danks M (1996) Changes in aquatic
macrophytes after liming Thrush Lake, Minnesota. Restoration Ecology 4: 307–
312.
27. Raitaniemi J, Rask M (1990) Preliminary observations on the effects of liming to
the fish populations of small acidic lakes in southern Finland. Aqua Fennica 20:
115–123.
28. Sandøy S, Romundstad A (1995) Liming of acidified lakes and rivers in Norway.
Water, Air, and Soil Pollution 85: 997–1002.
29. Angeler DG, Goedkoop W (2010) Biological responses to liming in boreal lakes:
an assessment using plankton, macroinvertebrate and fish communities. Journal
of Applied Ecology 47: 478–486.
30. Clair TA, Hindar A (2005) Liming for the mitigation of acid rain effects in
freshwaters: a review of recent results. Environmental Reviews 13: 91–128.
31. Carpenter S, Walker B, Anderies JM, Abel N (2001) From metaphor to
measurement: Resilience of what to what? Ecosystems 4: 765–781.
32. Carpenter SR, Ludwig D, Brock WA (1999) Management of eutrophication for
lakes subject to potentially irreversible change. Ecological Applications 9: 751–
771.
33. Stendera S, Johnson RK (2008) Tracking recovery trends of boreal lakes: use of
multiple indicators and habitats. Journal of the North American Benthological
Society 27: 529–540.
34. Allen CR, Garmestani AS, Havlicek TD, Marquet PA, Peterson GD, et al.
(2006) Patterns in body mass distributions: sifting among alternative hypotheses.
Ecology Letters 9: 630–643.
35. Levin SA (1992) The problem of pattern and scale in ecology. Ecology 73: 1943–
1967.
36. Nystrom M, Folke C (2001) Spatial resilience of coral reefs. Ecosystems 4: 406–
417.
37. Sundstrom SM, Allen CR, Barichievy C (2012) Species, functional groups, and
thresholds in ecological resilience. Conservation Biology 26: 305–314.
38. Wardwell DA, Allen CR, Peterson GD, Tyre AJ (2008) A test of the cross-scale
resilience model: Functional richness in Mediterranean-climate ecosystems.
Ecological Complexity 5: 165–182.
39. Gunderson LH, Holling CS, eds. (2002). Panarchy: understanding transforma-
tions in human and natural systems Washington D.C., USA: Island Press.
40. Peterson G, Allen CR, Holling CS (1998) Ecological resilience, biodiversity, and
scale. Ecosystems 1: 6–18.
41. Allen CR, Gunderson L, Johnson AR (2005) The use of discontinuities and
functional groups to assess relative resilience in complex systems. Ecosystems 8:
958–966.
42. Angeler DG, Viedma O, Moreno JM (2009) Statistical performance and
information content of time lag analysis and redundancy analysis in time series
modeling. Ecology 90: 3245–3257.
43. Angeler DG, Allen CR, Johnson RK (2012) Insight on invasions and resilience
derived from spatiotemporal discontinuities of biomass at local and regional
scales. Ecology and Society 17.
44. Angeler DG, Allen CR, Johnson RK (2013) Measuring the relative resilience of
subarctic lakes to global change: redundancies of functions within and across
temporal scales. Journal of Applied Ecology 50: 572–584.
45. Angeler DG, Allen CR, Rojo C, Alvarez-Cobelas M, Rodrigo MA, et al. (2013)
Inferring the relative resilience of alternative states. Plos One 8: e77338.
46. Zaccarelli N, Petrosillo I, Zurlini G, Riitters KH (2008) Source/sink patterns of
disturbance and cross-scale mismatches in a panarchy of social-ecological
landscapes. Ecology and Society 13.
47. Wilander A, Johnson RK, Goedkoop W (2003) Riksinventering 2000. En
synoptisk studie av vattenkemi och bottenfauna i svenska sjoar och vattendrag.:
Institutionen for Miljoanalys, SLU, Uppsala.
48. Olrik KP, Blomqvist P, Brettum P, Cronberg G, Eloranta P (1989) Methods for
quantitative assessment of phytoplankton in freshwaters, Part I.: Swedish
Environmental Protection Agency, Stockholm.
49. Blomqvist P, Herlitz E (1998) Methods for quantitative assessment of
phytoplankton in freshwaters, part 2 (Report 4861). Naturvardsverket (Swedish
Environmental Protection Agency), Stockholm.
Management and Resilience
PLOS ONE | www.plosone.org 9 March 2014 | Volume 9 | Issue 3 | e91881

50. Jost L (2007) Partitioning diversity into independent alpha and beta components.
Ecology 88: 2427–2439.
51. Tuomisto H (2010) A diversity of beta diversities: straightening up a concept
gone awry. Part 1. Defining beta diversity as a function of alpha and gamma
diversity. Ecography 33: 2–22.
52. Tuomisto H (2012) An updated consumer’s guide to evenness and related
indices. Oikos 121: 1203–1218.
53. Huynh H, Feldt LS (1976) Estimation of the box correction for degrees of
freedom from sample data in randomized block and split-plot designs. Journal of
Educational Statistics 1: 69–82.
54. Anderson MJ (2001) A new method for non-parametric multivariate analysis of
variance. Austral Ecology 26: 32–46.
55. Blanchet FG, Legendre P, Borcard D (2008) Modelling directional spatial
processes in ecological data. Ecological Modelling 215: 325–336.
56. Blanchet FG, Legendre P, Maranger R, Monti D, Pepin P (2011) Modelling the
effect of directional spatial ecological processes at different scales. Oecologia 166:
357–368.
57. Carpenter SR, Cole JJ, Pace ML, Batt R, Brock WA, et al. (2011) Early
Warnings of Regime Shifts: A Whole-Ecosystem Experiment. Science 332:
1079–1082.
58. RDevelopmentCoreTeam (2012) R: A Language and Environment for
Statistical Computing. Vienna, Austria: R Foundation for Statistical Computing.
59. Bradley DC, Ormerod SJ (2002) Long-term effects of catchment liming on
invertebrates in upland streams. Freshwater Biology 47: 161–171.
60. Ormerod SJ, Durance I (2009) Restoration and recovery from acidification in
upland Welsh streams over 25 years. Journal of Applied Ecology 46: 164–174.
61. Scott KA, Wissel B, Gibson JJ, Birks SJ (2010) Chemical characteristics and acid
sensitivity of boreal headwater lakes in northwest Saskatchewan. Journal of
Limnology 69: 33–44.
62. Lewis WM (1982) Changes in pH and buffering capacity of lakes in Colorado
Rockies. Limnology and Oceanography 27: 167–172.
63. Henrikson L, Brodin Y-W (1995) Liming of surface waters in Sweden–a
synthesis. Liming of Acidified Surface Waters: Springer. pp. 1–44.
64. Binks JA, Arnott SE, Sprules WG (2005) Local factors and colonist dispersal
influence crustacean zooplankton recovery from cultural acidification. Ecolog-
ical Applications 15: 2025–2036.
65. Jarvinen M, Kuoppamaki K, Rask M (1995) Responses of phyto- and
zooplankton to liming in a small acidified humic lake. Water, Air, and SoilPollution 85: 943–948.
66. Eriksson F, Hornstrom E, Mossberg P, Nyberg P (1983) Ecological effects of lime
treatment of acidified lakes and rivers in Sweden. In: Forsberg C, Johansson J-A,editors. Forest Water Ecosystems: Springer Netherlands. pp. 145–163.
67. Bishop K, Laudon H, Hruska J, Kram P, Kohler S, et al. (2001) Doesacidification policy follow research in Northern Sweden? The case of natural
acidity during the 1990’s. Water, Air, and Soil Pollution 130: 1415–1420.
68. McKie BG, Petrin Z, Malmqvist B (2006) Mitigation or disturbance? Effects ofliming on macroinvertebrate assemblage structure and leaf-litter decomposition
in the humic streams of northern Sweden. Journal of Applied Ecology 43: 780–791.
69. Weatherley NS (1988) Liming to mitigate acidification in freshwater ecosystems:A review of the biological consequences. Water, Air, and Soil Pollution 39: 421–
437.
70. Holling CS, Meffe GK (1996) Command and control and the pathology ofnatural resource management. Conservation Biology 10: 328–337.
71. Schindler DW (1997) Liming to restore acidified lakes and streams: A typicalapproach to restoring damaged ecosystems? Restoration Ecology 5: 1–6.
72. Rosseland BO, Blakar IA, Bulger A, Kroglund F, Kvellstad A, et al. (1992) The
mixing zone between limed and acidic river waters - complex Aluminumchemistry and extreme toxicity for salmonids. Environmental Pollution 78: 3–8.
73. Wallstedt T, Borg H, Meili M, Morth CM (2008) Influence of liming on metalsequestration in lake sediments over recent decades. Science of the Total
Environment 407: 405–417.74. Kullberg A, Petersen RC (1987) Dissolved organic carbon, seston and
macroinvertebrate drift in an acidified and limed humic stream. Freshwater
Biology 17: 553–564.75. Kreyling J, Jentsch A, Beierkuhnlein C (2011) Stochastic trajectories of
succession initiated by extreme climatic events. Ecology Letters 14: 758–764.76. Newbery DM, Lingenfelder M (2009) Plurality of tree species responses to
drought perturbation in Bornean tropical rain forest. Plant Ecology 201: 147–
167.77. Mori AS, Furukawa T, Sasaki T (2013) Response diversity determines the
resilience of ecosystems to environmental change. Biological Reviews 88: 349–364.
Management and Resilience
PLOS ONE | www.plosone.org 10 March 2014 | Volume 9 | Issue 3 | e91881