sikkim book text 2016. - :: ENVIS Centre on Himalayan Ecology ::
136
Volume 1(4), 2015 ENVIS Centre on Himalayan Ecology ENVIS Centre on Himalayan Ecology G.B. Pant Institute of Himalayan Environment & Development G.B. Pant Institute of Himalayan Environment & Development (An Autonomous Institute of Ministry of Environment, Forest and Climate Change, Government of India) (An Autonomous Institute of Ministry of Environment, Forest and Climate Change, Government of India) Kosi-Katarmal, Almora-263 643, Uttarakhand, India Kosi-Katarmal, Almora-263 643, Uttarakhand, India ISSN : 2455-8133 (Online) State at a Glance Sikkim f o r n m I l a a t t i o n n e S m y n s o r t i e v m n E f o r n m I l a a t t i o n n e S m y n s o r t i e v m n E INDIA
-
Upload
khangminh22 -
Category
Documents
-
view
2 -
download
0
Transcript of sikkim book text 2016. - :: ENVIS Centre on Himalayan Ecology ::

Volume 1(4), 2015
ENVIS Centre on Himalayan EcologyENVIS Centre on Himalayan Ecology
G.B. Pant Institute of Himalayan Environment & DevelopmentG.B. Pant Institute of Himalayan Environment & Development(An Autonomous Institute of Ministry of Environment, Forest and Climate Change, Government of India)(An Autonomous Institute of Ministry of Environment, Forest and Climate Change, Government of India)
Kosi-Katarmal, Almora-263 643, Uttarakhand, IndiaKosi-Katarmal, Almora-263 643, Uttarakhand, India
ISSN : 2455-8133 (Online)
State at a Glance
Sikkim
forn mI l aa tt ion ne Sm
yn
so r ti ev mn E
forn mI l aa tt ion ne Sm
yn so r ti ev mn E
INDIA

Sta
te a
t a G
lan
ce: S
ikkim
State at a Glance: Sikkim
Disclaimer : The information furnished in this volume is made available with the sole purpose of providing and wider dissemination of scientific information from secondary sources and is not meant for commercial use and purposes. ENVIS-GBPIHED Centre is not responsible for, any mistake, misprint or factual error, if any.
Cover Photo Credits : H.K. Badola, Vaibhav Gosavi
Volume 1(4), 2015
ENVIS Team
Dr. P. P. Dhyani, CoordinatorDr. S. Sharma, Scientist-in-ChargeDr. Dinesh Giri, Programme Officer Mr. V. C. Sharma, Information Officer
Mr. S. K. Sinha, IT Assistant
Online available at : http://gbpihedenvis.nic.in/sikkim.html
Copyright ©: 2015, GBPIHED, Kosi-Katarmal, Almora
Series EditorsG. C. S. S. SharmaR. Joshi
Negi
Dr. P. P. DhyaniDirector, GBPIHED
ENVIS Advisory Committee
CHAIRMAN
MEMBERS
MEMBER SECRETARY
Prof. S.S. Bargali, Kumaun University, Nainital, Uttarakhand, India
Prof. Varun Joshi, Guru Govind Singh Indraprastha University, Dwarka, New Delhi, India
Dr. G.C.S. Negi, Them Head - BCM & ES, GBPIHED, Kosi-Katarmal, Almora, Uttarakhand, India
Mr. Ranjan Joshi, Theme Head - WPM, GBPIHED, Kosi-Katarmal, Almora, Uttarakhand, India
Dr. Sandipan Mukherjee, Scientist, GBPIHED, Kosi-Katarmal, Almora, Uttarakhand, India
Dr. Subrat Sharma, Them Head - CC, GBPIHED, Kosi-Katarmal, Almora, Uttarakhand, India
Mr. Arvind Kumar, Field/Lab Assistant (Institute Support)

State at a Glance: Sikkim
Editorial Board
ENVIS Coordinator/Director, GBPIHED
Dr. P.P. Dhyani
ENVIS Centre on Himalayan EcologyG.B. Pant Institute of Himalayan Environment & Development
(An Autonomous Institute of Ministry of Environment, Forest and Climate Change, Government of India)
Kosi-Katarmal, Almora-263 643, Uttarakhand, India
Compiled by
Dinesh Giri, S.K. Sinha and V.C. Sharma
Volume 1(4), 2015
G.C.S. NegiS. SharmaR. JoshiP. Sirari


PrefaceThe majestic Himalaya, which breezes life into all inter-dependent
components of ecological systems and environment, needs to be better
understood. In particular, availability of ‘data’ that helps in turning simple
'opinions' into 'facts' and then, analyses of such data-base reveals present
patterns and assists in future projections. Realizing this fact, a new
publication series of "ENVIS Centre on Himalayan Ecology" has been
initiated with an attempt to collect, collate and synthesize available data/information on
different aspects of the Indian Himalayan Region (IHR).
The past and present status of various interlinked components such as demography,
socio-economy, literacy, land, water, climate, natural resources, etc. reveals crucial cues about
the past planning status, current pace of development, and future growth prospects. In India,
there exist a number of specialized government agencies and departments which collect and
compile such datasets and make them available through various mechanisms. In these
endeavors, treating each Himalayan State as one independent entity, following compilation of
datasets in a condensed volume is likely to be more useful for a wide range of information
seekers, users and stakeholders.
In the above context, "ENVIS Centre on Himalayan Ecology" at G.B. Pant Institute of
Himalayan Environment and Development has prepared this issue on "Sikkim" State. This
publication, fourth in its series, covers temporal trends across important segments, e.g.,
Social, Education, Health and Family welfare, Climate, Land, Water, Agriculture,
Horticulture, Livestock, Forests, Minerals and Petroleum, Industry, Road and Transport
profiles, etc., which would help in policy planning and decision-making.
I am hopeful that this compendium based on secondary information would be useful for
understanding of environment and developmental status of this Himalayan State, and cater to
the need of various stakeholders. I urge the readers to provide comments and views so as to
enable us to further strengthen the forthcoming similar issues on other states of IHR. I take this
opportunity to thank all colleagues in the Institute, particularly the ENVIS team for their
valuable contribution and MoEF&CC for their generous funding support. The critical review
of this issue by readers will guide us to further improve other similar publications in future.
P.P. Dhyani
Director
G.B. Pant Institute of Himalayan Environment & Development


From the Editorial Desk
Augmentation of authentic data base on physical, biological and socio-economic
aspects of the Himalayan mountains has always been challenging and fascinating
to academicians, researchers, planners and policy makers and implementing
agencies, particularly when this region is viewed as “data deficient” by the Inter
Governmental Panel on Climate Change (IPCC). Authentic data base is not only
important for generating fundamental knowledge but also proves crucial for
formulating policies and developmental planning. "ENVIS Centre on Himalayan
Ecology" of this Institute has been given a task by the MoEF&CC, Govt. of India to
compile such a data base for the Indian Himalayan states. Therefore, continuing
with the series of past such publications for Himachal Pradesh, Arunachal Pradesh
and Jammu & Kashmir, in the present publication we have taken up the state of
'Sikkim' by collecting, collating and compiling secondary data base available with
various sources. In coming years, we will bring out such publications on other
states of Indian Himalayan region. We hope that readers will find this compilation
a useful reference for baseline information. Suggestions to improve this
publication series are always welcome.
Editorial Team


Profile Page No.
About Sikkim
i-ii
Fact Sheet
iii -vi
Social
01
15
29
37
43
51
57
67
71
79
87
89
93
101
111
Education
Health and Family Welfare
Climate
Land
Water
Agriculture
Horticulture
Livestock
Forests and Protected Areas
Minerals and Petroleum
Industry
Road and Transport
Miscellaneous
Web Directory
CONTENTS


About Sikkim
nd thSikkim is the 22 state of India came into existence with effect from 26 April, 1975. Sikkim
has been divided into four districts and each district has further been bifurcated into two sub-
divisions for administrative purpose. Sikkim state being a part of inner mountain ranges of
Himalayas is hilly having varied elevation ranging from 300 to 8540 m. But the habitable
areas are only up to the altitude of 2100 m. constituting only 20% of the total area of the state.
The highest portion of Sikkim lies in its North West direction. A large number of mountains
having altitudes of about seven thousand meters stands here with - Kanchenjunga (8598 m.),
The third highest peak in the world. The high serrated, snow capped spurs and peaks of
i
Not to Scale

Kanchenjunga look attractive consisting of Kumbha Karna (7711 m.), Pendem (6706 m.),
Narsingh (5825 m.), Kabru Dome (6545 m.), etc. A number of glaciers descends from eastern
slopes of Kanchenjunga into Sikkim where snow clad line is found above 5300 m. The biggest
of them is Zemu, from whose snout above Lachen monastery rises the river Teesta. Teesta is
the main river and its main tributaries are Zemu, Lachung, Rangyong, Dikchu, Rongli,
Rangpo and Rangit which form the main channel of drainage from the north to the south. It
boasts of the great mount Kanchendzonga as its crown. Ethically Sikkim has mainly three
groups of people viz. Nepalis, Bhutias, Lepchas. The local language is Nepali. English is the
official language. This jewel- like mountain state of ethereal beauty with an area of 7299 sq.
km., nestles in the heart of Himalayas. Cradled in the manifold splendors of nature deep within
the snow clad Himalayas is Sikkim's capital Gangtok.
Source: http://sikkim.nic.in/sws/home_int.htm
Map source: http://www.censusindia.gov.in/2011census/maps/atlas/11part1.pdf
ii

2011 ,, 878
Fact Sheet - Sikkim
Geographical Area : 7096 sq.km
Administrative Structure
No. of Districts : 4
No. of Tehsils : 9
No. of CD Blocks : 9
No. of Panchayats : 906
Number of village (including uninhabited villages) : 451
No. of Towns : 9
Items
Sector/Year
Unit
Sikkim
Population 2001 Total No 540851
Population 2011 Total No 607688
No. of Towns 2001 No 9
No. of Towns 2011 No 9
Decadal Growth of Population
1991-2001 Absolute 134394
Percentage 33.06
Decadal Growth of Population
2001-2011
Absolute 66837
Percentage 12.36
Urban Population as a percentage to Total Population
2001
Percentage 11.07
Sex Ratio
1971 Percentage 25.2
1981 Females per 863
1991 1,000 Males 835
iii

iv
Density of Population 2011 Per Sq. Km 86
Literacy Rate 2001 Percentage 69.68
Literacy Rate 2011 Percentage 82.20
Percentage of Main
Workers to Total
Population
2001 Percentage 39.31
2011 Percentage 37.73
Location Approx. 27 deg. North 88 Deg. East
Capital Gangtok
District, Areas and
District Capitals
East District (954 sq.km.) - Gangtok
West District (1166 sq.km) - Gyalshing
South District (750 sq.km) - Namchi
North District (4226 sq.km.)- Mangan
No. of Sub-Divisions
9 (Gangtok, Pakyong, Rongli, Namchi, Soreng, Gyalshing,
Rabongla, Mangan, Chungthang)
Climate Tropical, Temperate and Alpine
Other Important
towns Chungthang and Soreng
Jorethang, Singtam, Rangpo, Pakyong, Rhenock, Melli,
Languages Spoken Nepali, Bhutia, Lepcha, Limboo, Magar, Rai, Gurung, Sherpa,
Tamang, Newari.
Main occupations Farmers, Cardamom Growers, Government Contractors and
Government Employees.
Religions Hinduism, Buddhism and Christianity
Distance from
Siliguri
114 Km
Distance from New 125 Km
Density of Population
2001 Per Sq. Km 76
Jalpaiguri

State Day (the Day
Sikkim became a Part
of India)
th16 May 1975
State Animal Red Panda (Ailurus fulgens)
State Bird Blood Pheasant (Ithaginis cruentus)
State Flower Nobile Orchid (Dendrobium nobile)
State Tree Rhododendron (Rhododendron niveum)
No. of Assembly seats
32
No. of Lok Sabha seat
1
No. of Rajya Sabha seat
1
No. of Hospitals 6 including Sir Thutob Namgyal Memorial and Manipal Referral
Hospitals
Source : Msme Developmemt Institute, Ministry of Msme, Govt. of India, Gangtok Annual Report - 2012-13.
http://dcmsme.gov.in/ar-12-13/Gangtok%20_Annual%20Report%20-2012-13.pdf http://www.sikkim.gov.in/stateportal/UsefulLinks/Sikkim%20A%20Statistical%20Journal%2
02013%20(DRAFT).pdf
v


Social
List of Tables
1.1: Human Population and Growth in Sikkim
1.2: Year-wise Population Growth
1.3: District-wise Population
1.4: Population by Age Group
1.5: Decadal variation in Population
1.6: District-wise Population by Sex
1.7: District-wise Population by Age Group (0-6 Year)
1.8: Scheduled Caste (SC) Population
1.9: Scheduled Tribe (ST) Population
1.10: Population of Scheduled Caste (SC) in the Age Group 0-6 Year
1.11: Population of Scheduled Tribe(ST) in the Age Group 0-6 Year
1.12: Year-wise Sex Ratio
1.13: Human Development Index (HDI) Score
1.14: Estimated Crude Birth Rate (CBR), Crude Death Rate (CDR) and Infant Mortality
Rate (IMR) by Residence
1.15: Population below Poverty Line
1.16: Gross State Domestic Product (GSDP)
1.17: Per Capita Net State Domestic Product (NSDP)
1.18: Net State Domestic Product (NSDP)
1.19: Fiscal and Revenue Deficit of Gross State Domestic product (GSDP)
1.20: Civic Administration Status of Towns (Census, 2011)
1.21: District-wise Households
1.22: District-wise Workers
1.23: Category of Workers
1.24: Sectoral distribution of Workers
1.25: Contribution of different Sectors to Sikkim’s GDP
1
State at a Glance: Sikkim, Vol. 1(4), 2015
ENVIS Centre on Himalayan Ecology

Table 1.1: Human Population and Growth in Sikkim
Human Population (Census, 2001) (in No.)
Male
Female
Total
288484
252367
540851
Human Population (Census, 2011)
Male
Female
Total
323070
287507
610577
Child Population in the Age Group (0-6) (Census, 2011)
Male
Female
Total
32761
31350
64111
Decadal Growth Rate (in %)
1991-2001
2001-2011
33.06
12.89
Sex Ratio
2001
2011
875
890
Population Density (in sq. km)
2001
2011
76
86
Source: Ministry of Home Affairs, Office of the Registrar General & Census Commissioner, Govt. of India.http://censusindia.gov.in (accessed on 04 .03.2016)
2
State at a Glance: Sikkim, Vol. 1(4), 2015
ENVIS Centre on Himalayan Ecology

Table 1.2: Population Growth (Census, 1901 – 2011)
(in No.)
Year Total Male Female
1901 59014 30795 28219
1911 87920 45059 42861
1921 81721 41492 40229
1931 109808 55825 53983
1941 121520 63289 58231
1951 137725 72210 65515
1961 162189 85193 76996
1971 209843 112662 97181
1981 316385 172440 143945
1991 406457 216427 190030
2001 540851 288484 252367
2011 610577 323070 287507 Source: Ministry of Home Affairs, Office of the Registrar General & Census Commissioner,
Govt. of India http://www.censusindia.gov.in/2011cens us/dchb/1100_PART_B_DCHB_SIKKIM.pdf(accessed on 04 .03.2016)
Table 1.3: District-wise Population (Census, 1971 – 2011)
(in No.)
Year North District West District South District East DistrictTotal Rural Urban Total Rural Urban Total Rural Urban Total Rural Urban
1971 13014 12683 331 58023 56927 1096 53185 51963 1222 85621 68602 17019 1981 26455 25675 780 75192 73495 1697 75976 70611 5365 138762 95520 43242 1991 31240 30437 803 98161 96399 9762 98604 96035 2569 178452 146580 31872
2001 41030 39782 1248 123256 121432 1824 131525 127579 3946 245040 192188 52852 2011 43709 39065 4644 136435 131187 5248 146850 125651 21199 283583 161096 122487
Source: Department of Economics, Statistics, Monitoring & Evaluation, Govt. of Sikkim
http://www.sikkim.gov.in/stateportal/UsefulL inks/Sikkim%20A%20Statistical%20Journal%202013%20 (DRAFT).pdf (accessed on 04.10.2015)
Year wise
3
State at a Glance: Sikkim, Vol. 1(4), 2015
ENVIS Centre on Himalayan Ecology

4
State at a Glance: Sikkim, Vol. 1(4), 2015
Table 1.4: Population by Age Group (Census, 2011) (in No.)
Total/Rural/Urban
Total
Age Group Persons Males Females
All ages 610577 323070 287507 0-4 42336 21685 20651 5-9 56678 28688 27990 10-14 66923 33965 32958 15-19 66937 33998 32939 20-24 67297 35146 32151 25-29 64639 34700 29939 30-34 52225 28562 23663 35-39 43627 23396 20231 40-44 36552 20170 16382 45-49 29462 16114 13348 50-54 24432 13624 10808 55-59 17541 9913 7628 60+ 40752 22472 18280 Age not told 1176 637 539
Rural All ages 456999 242797 214202 0-4 32382 16541 15841 5-9 44158 22334 21824 10-14 52191 26588 25603 15-19 50759 25943 24816 20-24 49839 26301 23538 25-29 46628 25475 21153 30-34 37412 20788 16624 35-39 30928 16613 14315 40-44 26111 14402 11709 45-49 21104 11394 9710 50-54 18081 10021 8060 55-59 13219 7390 5829 60+ 33200 18476 14724 Age not told 987 531 456
Urban All ages 153578 80273 73305 0-4 9954 5144 4810 5-9 12520 6354 6166 10-14 14732 7377 7355 15-19 16178 8055 8123 20-24 17458 8845 8613 25-29 18011 9225 8786 30-34 14813 7774 7039 35-39 12699 6783 5916 40-44 10441 5768 4673 45-49 8358 4720 3638 50-54 6351 3603 2748 55-59 4322 2523 1799 60+ 7552 3996 3556 Age not told 189 106 83
Source: Ministry of Home Affairs, Office of the Registrar General & Census Commissioner, Govt. of India. http://censusindia.gov.in (accessed on 04 .03.2016)
ENVIS Centre on Himalayan Ecology

5
State at a Glance: Sikkim, Vol. 1(4), 2015
Table 1.5: Decadal variation in Population
(Census, 1901-2011)
Year Decadal variation (in %)
1901 NA
1911 +48.98
1921 -7.05
1931 +34.37 1941 +10.67
1951 +13.34
1961 +17.76
1971 +29.38
1981 +50.77 1991 +28.47 2001 +33.06 2011 +12.89
NA= Not Available
Table 1.6: District-wise Population by Sex (Census, 2011)
(in No.)
District Persons Male Female Density
(sq. km) Sex
RatioTotal Rural Urban Total Rural Urban Total Rural Urban
North 43709 39065 4644 24730 22274 2456 18979 16791 2188 10 767
West 136435
131187
5248
70238
67528
2710 66197
63659
2538
117
942
South 146850
125651
21199
76670
65848
10822 70180
59803
10377
196
915
East 283583
161096
122487
151432
87147
64285
132151
73949
58202
297
873
Total Sikkim
610577
456999
153578
323070
242797
80273
287507
214202
73305
86
889
Source
(Tables 1.5 & 1.6) : Ministry of Home Affairs, Office of the Registrar General & Census Commissioner, Govt. of India
http://censusindia.gov.in (accessed on 04 .03.2016)
ENVIS Centre on Himalayan Ecology

Table 1.7: District-wise Population by Age Group (0-6 Year) (Census, 2011)
District Persons Male Female
Total Rural Urban Total Rural Urban Total Rural Urban
North
4677 4092 585 2425 2116 309 2252 1976 276
West 15706 15167 539 7996 7722 274 7710 7445 265
South 15744 13736 2008 8063 7024 1039 7681 6712 969
East 27984 16223 11761 14277 8199 6078 13707 8024 5683
Total Sikkim
64111 49218 14893 32761 25061 7700 31350 24157 7193
Source (Tables 1.7-1.8): Ministry of Home Affairs, Office of the Registra r General & Census Commissioner, Govt. of India. http://censusindia.gov.in; (accessed on 04 .03.2016)
Table 1.8: Scheduled Caste (SC) Population (Census, 2011) (in No.)
District Persons Male Female
Total Rural Urban Total Rural Urban Total Rural Urban
North
982 804 178 536 441 95 446 363 83
West 5935 5663 272 3117 2978 139 2818 2685 133
South 6053 5042 1011 3058 2569 489 2995 2473 522
East 15305 8826 6479 7743 4508 3235 7562 4318 3244
Total Sikkim
28275 20335 7940 14454 10496 3958 13821 9839 3982
6
State at a Glance: Sikkim, Vol. 1(4), 2015
ENVIS Centre on Himalayan Ecology

Table 1.9: Scheduled Tribe (ST) Population (Census, 2011) (in No.)
District Persons Male Female
Total Rural Urban Total Rural Urban Total Rural Urban
North 28715 26695 2020 14741 13751 990 13974 12944 1030
West 57817 56394 1423 29485 28773 712 28332 27621 711
South 41392 36909 4483 21556 19365 2191 19836 17544 2292
East 78436 47148 31288 39479 24170 15309 38957 22978 15979
Total
Sikkim 206360 167146 39214 105261 86059 19202 101099 81087 20012
Table 1.10: Population of Scheduled Caste (SC) in the Age Group 0-6 Year (Census, 2011) (in No.)
District
Persons North West South East
Total 108 826 732 1851
Male 61 444 370 908
Female 47 382 362 943
Table 1.11: Population of Scheduled Tribes (ST) in the Age Group 0-6 year (Census, 2011) (in No.)
Districts
Persons North West South East
Total 3324 6710 4450 7426
Male 1726 3420 2295 3731
Female 1598 3290 2155 3695
Source (Tables 1.9 -1.11): Ministry of Home Affairs, Office of the Registrar General
& Census Commissioner, Govt. of India. http://www.censusindia.gov.in/2011(accessed on 04 .11.2015)
7
State at a Glance: Sikkim, Vol. 1(4), 2015
ENVIS Centre on Himalayan Ecology

Table 1.12: Year-wise Sex Ratio (Census, 1901-2011)
Year Sex Ratio
1901 916
1911 951
1921 970
1931 967
1941 920
1951 907
1961 904
1971 863
1981 835
1991 878
2001 875
2011 890
Source: Ministry of Home Affairs, Office of the Registrar General & Census Commissioner, Govt. of India
http://www.censusindia.gov.in (accessed on 04 .11.2015) Table 1.13: Human Development Index (HDI) Score
State/ Country HDI Score % reduction in shortfall
1996 2006
Sikkim 0.582 0.665 19.9
India 0.530 0.605 16.0
Source: Govt. of Sikkim (Sikkim Human Development Report, 2014).
http://www.sikkim.gov.in/stateportal/Link/Sikkim%20Human%20Developent%20Report%202014.pdf (accessed on 04.01.2016)
8
State at a Glance: Sikkim, Vol. 1(4), 2015
ENVIS Centre on Himalayan Ecology

Table 1.14: Estimated Crude Birth Rate (CBR), Crude Death Rate (CDR) and Infant Mortality Rate (IMR) by Residence (per Thousand)
CBR/CDR/IMR 2009 2010 2011 2012 2013
CBR
Total 18.1 17.8 17.6 17.2 17.1
Rural 18.4 18.1 17.7 17.3 17.1
Urban 16.0 16.1 16.6 16.7 16.7
CDR
Total 5.7 5.6 5.6 5.4 5.2
Rural 6.0 5.9 5.9 5.7 5.6
Urban 3.9 3.8 3.5 3.3 3.2
IMR
Total 34 30 26 24 22
Rural 36 31 28 25 23
Urban 21 19 17 16 15
Note: Infant Mortality Rate for smaller States & Union Territories is based on three -year period 2009-13.
Source: Ministry of Home Affairs, Office of the Registrar General & Census Commissioner, Govt. of India(Statistical Year Book, India, 2015). http://censusindia.gov.in/vital_statistics/SRS_Bulletins/Bulletins.aspx (accessed on 04.11. 2015)
9
State at a Glance: Sikkim, Vol. 1(4), 2015
ENVIS Centre on Himalayan Ecology

Table 1.15: Population below Poverty Line
Year Percentage (%)
1973-74 50.86
1977-78 55.89
1982-83 39.71
1987-88 36.06
1993-94 41.43
1999-00 36.55 2004-05
NA
2006-07
NA
2011-12
8.19
Source: Perspective Planning Division, Planning Commission, Govt. of India.
http://planningcommission.gov.in/data/datatable/data_2312/comp_dat a 2312.pdf
(accessed on 6.8.2015)
Table 1.16:
Gross State Domestic Product (GSDP) (as on 31.07.2010)
Year
at Current Prices
at Constant (2004-05) Prices
GSDP (Rs. in crore)
Growth Rate (%)
Growth Rate (%)
2010-11
7412
20.85
4784
8.70 2011-12
8907
20.17
5299
10.77
2012-13
10473
17.58
5703
7.62
2013-14
12377
18.18
6152
7.87
Table 1.17:
Per Capita Net State Domestic Product (NSDP)
(as on 31.07.2015)
(Per Capita in Rs. Growth Rate in %)
Year
at Current Prices
at Constant Prices
Per Capita NSDP Growth Rate
Per Capita NSDP
Growth Rate
2010-11
108972
20.08
66136
8.82
2011-12
130127
19.41
73704
11.44
2012-13
151395
16.34
78427
6.41
2013-14 176491 16.58 83527 6.50
NA = Not Available
GSDP (Rs. in crore)
Source (Tables 1.16-1.17): Niti Aayog, Govt.
of India
http://niti.gov.in/content/state -stats.php (accessed on 12.02.2016)
10
State at a Glance: Sikkim, Vol. 1(4), 2015
ENVIS Centre on Himalayan Ecology

Table 1.18: Net State Domestic Product (NSDP) (as on 31.07.2015)
Year at Current Prices at Constant Prices
NSDP Growth Rate NSDP Growth Rate
2010-11 6636 21.47 4028 10.08
2011-12 8029 20.99 4548 12.91
2012-13 9432 17.47 4886 7.43
2013-14 11137 18.08 5271 7.88
Source (Tables 1.16-1.18): NITI (National Institute for Transforming India) Aayog , Govt. of India.
http://niti.gov.in/content/state -stats.php (accessed on 12.02.2016)
Table 1.19: Fiscal and Revenue Deficit of Gross State Domestic Product (GSDP)
Year Fiscal Deficit as % of
GSDP Revenue Deficit as % of
GSDP 1997-98 -9.80 -3.08 1998-99 -16.92 -5.19 2001-02 -5.88 12.58 2002-03 -0.77 15.51 2003-04 -3.50 11.19 2004-05 -11.61 10.55 2005-06 -8.14 10.77 2006-07 -4.75 11.23 2007-08 -2.56 14.00 2008-09 -7.25 11.70 2009-10 -2.75 8.42 2010-11 -4.27 1.89 2011-12 -2.02 4.97 2012-13 -0.63 7.46 2013-14 (P) -2.52 8.18
P=Provisional Source: Planning Commission, Govt. of India.
http://planningcommission.nic.in/data/datatable/data_2312/comp_data2312.pdf (accessed on 12.02.2016)
11
State at a Glance: Sikkim, Vol. 1(4), 2015
ENVIS Centre on Himalayan Ecology

Table 1.20: Civic Administration Status of Towns (Census, 2011) Name Population of Towns
(in No.) Persons Males Females
North District 4644 2456 2188 Mangan (NP) 4644 2456 2188 West District 5248 2710 2538 Gyalshing (NP) 4013 2054 1959 Nayabazar (NBA) 1235 656 579 South District 21199 10822 10377 Namchi (M.Cl) 12190 6166 6024 Jorethang (NP) 9009 4656 4353 East District 122487 64285 58202 Gangtok (M.Cor) 100286 52459 47827 Singtam (NP) 5868 3097 2771 Rangpo (NP) 10450 5555 4895 Rhenock (CT) 5883 3174 2709 State Total 153578 80273 73305 Note: NP-Nagar Panchayat, NBA- Notified Bazaar Area, M. Cl.- Municipal Council, M. Cor.- Municipal Corporation and CT- Census Town Source: Ministry of Home Affairs, Office of the Registrar General & Census Commissioner, Govt. of India. http://www.censusindia.gov.in/2011census/dchb/1100_PART_B_DCHB_SIKKIM.pdf
(accessed on 04.01.2016)
Table 1.21: District-wise Households (in No.) District Normal Institutional Houseless
North 8753 110 10
West 27913 98 12
South 30368 161 14
East 61081 447 39
Source: Ministry of Home Affairs, Office of the Registrar General & Census
Commissioner, Govt. of India. http://www.censusindia.gov.in/2011census/dchb/1100_PART_B_DCHB_SIKKIM.pdf (accessed on 04 .11.2015)
12
State at a Glance: Sikkim, Vol. 1(4), 2015
ENVIS Centre on Himalayan Ecology

Table 1.22: District-wise Workers
(in No.)
Workers North District
West District
South District
East District
Total Workers (Main and Marginal)
Total Males Females
Main Workers Total Males Females
Marginal Workers
Total Males Females
Non-Workers Total Males Females
23359 15935 7424 17216 12677 4539 6 143 3258 2885 20350 8795 11555
70348 40772 29576 51225 33254 17971 19123 7 518 11605 66087 29466 36621
74753 45300 29453 50898 35271 15627 23855 10029 13826 72097 31370 40727
139678 92351 47327 111058 79311 31747 28620 13040 15580 143905 59081 84824
Source: (Table 1.22 & 1.23) : Ministry of Home Affairs, Office
of the Registrar General & Census
http://www.censusindia.gov.in/2011census/dc hb/1100_PART_B_DCHB_SIKKIM.pdf
(accessed on 04 .11.2015)
Table 1.23: Category of Workers (in No.)
Category Persons North
District
West
District
South
District
East
District
Cultivators
Total 7313 40797 37802 31489
Males 3889 22153 20808 16477
Females 3424 18644 16994 15012
Agricultural
Labourers
Total 2262 8 053 4188 11483
Males 1308 4 077 2116 5382
Females 954 3 976 2072 6 101
Workers in
household
industry
Total 332 1 403 1004 2404
Males 152 761 563 1471
Females 180 642 441 933
Other Workers
Total 13452 20095 31759 94302
Males 10586 13781 21813 69021
Females 2 866 6 314 9 946 25281
Commissioner, Govt . of India.
13
State at a Glance: Sikkim, Vol. 1(4), 2015
ENVIS Centre on Himalayan Ecology

Table 1.24: Sectoral Distribution of Workers
(in percentage )
Persons Primary Secondary Tertiary
Rural
Male 62 16 22
Female 86 5 9
Total 73 11 16
Urban
Male 1 25 74
Female 3 10 88
Total 1 20 78
Total
Male 50 18 32
Female 77 6 18
Total 62 13 26
Table 1.25: Contribution of different Sectors to Sikkim’s GDP
Year 2004
– 05
2005–
06
2006
–07
2007
–08
2008
–09
2009
–10
2010
–11
2011–
12
Agriculture (%) 19 18 17 16 14 9 8 8
Industry (%) 29 29 30 30 35 55 55 59
Services (%) 52 53 53 54 51 36 37 33
Source (Table 1.24 & 1.25): Govt. of Sikkim (Sikkim Human Development Report, 2014)
http://www.sikkim.gov.in/stateportal/Link/Sikkim%20Human%20Developent%20Report%202014.pdf (accessed on 04.01.2016)
14
State at a Glance: Sikkim, Vol. 1(4), 2015
ENVIS Centre on Himalayan Ecology

Education
List of Tables
2.1: School Education Institutions in Sikkim
2.2: District-wise Enrolment of Students in State Government Schools
2.3: Number of Teachers in various types of Schools
2.4: Pupil Teacher Ratio (PTR) in School Education
2.5: Gross Primary Enrolment Ratio
2.6: Number of Universities
2.7: Specialization wise Number of Universities
2.8: Number of College per Lakh Population
2.9: Number of Private and Government Colleges
2.10: Enrolment in Private and Government Colleges
2.11: Enrolment in Universities Teaching Departments and its Constituent Units/Off-campus Centres
2.12: Estimated Enrolment in Colleges at PG and UG level
2.13: Performance of Livelihood Schools
2.14: Estimated Enrolment in Higher Education at various Social Categories
2.15: Enrolment in Persons with Disability and Minority Community at Higher Level
2.16: Enrolment through Regular Mode at various levels of Education
2.17: Gross Enrolment Ratio in Higher Education
2.18: Gender Parity Index in Higher Education
2.19: Number of Teachers among various Social Categories in Higher Education
2.20: Number of Teachers among Minority & Persons with Disability at Higher Education
2.21: Post-wise Number of Male & Female Teachers in Higher Education
2.22: Universities listed by University Grant Commission (UGC)
2.23: Number of Colleges
2.24: Students Enrolment in Universities & Colleges
2.25: Detail of Central University
2.26: Detail of Private Universities
2.27: Literacy Rate
2.28: Gender Gap in Literacy
15
State at a Glance: Sikkim, Vol. 1(4), 2015
ENVIS Centre on Himalayan Ecology

Table 2.1: School Education Institutions in Sikkim(in No.)
Table 2.2: District-wise Enrolment of Students in State Government Schools
Source: Department of Education, Ministry of Human Resource Development, Govt. of India (Statistical Year Book, India, 2015).http://mospi.nic.in/Mospi_New/upload/SYB2015/ch29.html (accessed on 04.01.2016)
*Student enrolment report received till 30 September 2012 Source:
Directorate of School Education, Human Resource Development Department (HRDD), Govt. of
Sikkim (Sikkim Human Development Report 2014). http://www.sikkim.gov.in/stateportal/Link/Sikkim%20Human%20Developent%20Report%202014.pdf
(accessed on 04.01.2016)
(in No.)
School 2010-11 2011-12 2012-13
Intermediate/Senior Secondary Schools 59 61 74
High/Secondary Schools 126 137 195
Upper Primary Schools 244 327 537
Primary Schools 749 692 742
Total of All Schools 1178 1217 1548
District Gender 2005 2006 2007 2008 2009 2010 20011 2012*
East Boys 14246 13245 12587 12087 11918 13140 11800 10519
Girls 14590 13558 12805 12271 12027 13492 11933 10838
South
Boys 9582 8980 8558 8208 8088 9404 8281 7401
Girls 9815 9150 8715 8474 8351 9449 8185 7276
North
Boys 2849 2545 2427 2309 2247 2506 2206 1888
Girls
2880
2649
2614
2488
2379
2662
2323 1971
West
Boys
9939
8978
8689
8337
8142
9100
8165 7271
Girls
9799
8990
8661
8291
8133
9135
8153
7336
Total
Boys
36617
33748
32261
30941 30395
34150
30452
27079
Girls
37085
34347
32795
31524
30890
34738
30594
27421
Total
73702
68095
65056
62465
61285
68888
61046
54500
16
State at a Glance: Sikkim, Vol. 1(4), 2015
ENVIS Centre on Himalayan Ecology

Table 2.3: Number of Teachers in various types of Schools
School Teacher -2008 09 2009-10 2010-11 2011-12
Intermediate/Senior Secondary Schools
354 354 1209 209 209 1279 563 563 2488
High/Secondary Schools 855 855 1298 657 657 1323 1512 1512 2621
Upper Primary Schools
1116 1116 1867 1113 1113 1990 2229 2229 3857
Primary Schools
3322 3322 1764 4523 4523 1833 7845 7845 3597
Pre-Primary Schools
- - - - - -
Men Women Total Men Women Total Men Women Total Men Women Total Men Women Total
418 243 661 855 657 1512 1116 1113 2229 3246 3059 6305 76 1464 1540 - - -
Table 2.4: Pupil Teacher Ratio (PTR) in School Education
Year 2008-09 2009-10 2010-11 2011-12
Intermediate/ Senior Secondary Schools
12
15 15 17
High/Secondary Schools 8 8 8 15
Upper Primary Schools 14 15 15 10
Primary Schools 13 14 14 7
Pre-Primary Schools 19 - - -
Source (Tables 2.3 & 2.4): Ministry of Human Resource Development, Govt. of India. (Statistics of School Education
-
2006-07, 2007-08, 2008-09, 2009-10, 2010-11 & 2011-12).
http://mhrd.gov.in/statist?field_statistics_category_tid=32 (accessed on 05.01.2016)
17
State at a Glance: Sikkim, Vol. 1(4), 2015
ENVIS Centre on Himalayan Ecology

Table 2.5: Gross Primary Enrolment Ratio (2013-14)
Gross Primary Enrolment Ratio
Primary Boys Girls Total
Upper Primary Boys Girls Total
Enrolment Boys Girls Total
Secondary Boys Girls Total
Higher Secondary Boys Girls Total
128.15 120.58 124.42 132.96 144.98 138.84 129.89 129.32 129.61 87.63 102.53 95.03 51.83 65.47 58.58
Source: Department of Higher Education, Statistical Division, Ministry of Human Resource
Development; Ministry of Health and Family Welfare, Govt. of India (National Health Profile 2015).
http://www.indiaenvironmentportal.org.in/files/file/NHP-2015.pdf (accessed on 19.01.2016)
Table 2.6: Number of Universities
Year 2010-11 2011-12 2012-13 2013-14 2014-15 Central University Central Open University Institution of National Importance State Public University State Open University State Private University Institution Established Under State Legislature Act.
Government Deemed University Private Deemed University Others Grand Total
1 - 1 - - 4 -
- - - 4
1-1--4-
---6
1-1--4-
---6
1-1--4-
---6
1-1--5-
---7
Source: Ministry of Human Resource Development, Govt. of India. (All India Survey on Higher Education-2010-11, 2011-12, 2012-13, 2013-14, 2014-15) .http://mhrd.gov.in/statist?field_statistics_category_tid=32 (accessed on 05.01.2016)
18
State at a Glance: Sikkim, Vol. 1(4), 2015
ENVIS Centre on Himalayan Ecology

Table 2.7: Specialization-wise Number of Universities
Specialization
2010-11
2011-12
General
2
Agriculture
-
2012-13 2013-14
Medical
-
Law
-
Technical
1
Veterinary
-
Others
1
Total
4
4
-
-
-
1
-
1
6
4
-
1
-
1
-
-
6
4
-
-
-
1
-
1
6
Table 2.8: Number of College per Lakh Population (18-23 Years)
Year
No. of College
College
(per lakh Population)
Average Enrolment per College
2010-11
814
2011-12 994
2012-13 461
2013-14 520 2014-15
1111121313
14
14
15
16 16 584
Table 2.9: Number of Private and Government Colleges
(based on actual response)
Year
Private Un-Aided
Private Aided
Total Private
Government
Total 2010-11
4
0
4
5
9 2011-12
5
0
5
5
10 2012-13
5
0
5
7
12
2013-14
5
0
5
7
12
2014-15
5
0
5
7
12
Table 2.10: Enrolment in Private and Government Colleges
(based on actual response)
Year
Private Un-Aided
Private Aided
Total Private
Government
Total
2010-11
682
0
682
6643
7325
2011-12
1144
0
1144
8797
9941
2012-13
1047
0
1047
4480
5527
2013-14
899
0
899
5337
6236
2014-15
911
0
911
6091
7002
Source (Tables 2.7 -2.10): Ministry of Human Resource Development, Govt. of India
(All India Survey on Higher Education-2010-11, 2011-12, 2012-13, 2013-14, 2014-15).http://mhrd.gov.in/statist?field_statistics_category_tid=32 (accessed on 05.01.2016)
19
State at a Glance: Sikkim, Vol. 1(4), 2015
ENVIS Centre on Himalayan Ecology

Table 2.11: Enrolment in Universities Teaching Departments and its Constituent
Units/Off-campus Centres
Level of Education
Person
2010-11
2011-12
2012-13
2013-14
2014-15
Number of Universities
Total
6
6
6
6
7
Responding
4
6
6
6
5
Ph.D.
Male
0
0
10
9
42
Female
0
0
7
10
21
Total
0
0
17
19
63
M.Phil.
Male
0
27
39
48
65
Female
0
23
32
40
73
Total
0
50
71
88
138
Post Graduate
Male
3329
2686
1904
2083
2143
Female
249
1543
2349
2706
2855
Total
3578
4229
4253
4789
4998
Under Graduate Male
1864
3746
4110
4940
5001
Female
1052
3797
4341
4217
4077
Total
2916
7543
8451
9157
9078
PG Diploma Male
0
19
16
16
17
Female
0
13
11
10
10
Total
0
32
27
26
27
Diploma Male 0 97 5 100 101
Female 0 174 114 348 362
Total 0 271 119 448 463
Certificate Male 0 0 0 0 10 Female 0 0 0 0 8 Total 0 0 0 0 18
Integrated
Male 33 66 97 176 257 Female 25 45 68 145 205 Total
58
111
165
321
462
Grand Total
Male
5226
6641
6181
7372
7636 Female
1326
5595
6922
7476
7611
Total 6552 12236 13103 14848 15247
Source (Tables 2.11-2.12):
Ministry of Human Resource Development, Govt. of India.
(All India Survey on Higher Education-2010-11, 2011-12, 2012-13, 2013-14, 2014-
15)http://mhrd.gov.in/statist?field_statistics_category_tid=32 (accessed on 05.01.2016)
Table 2.12: Estimated Enrolment in Colleges at PG and UG level
(in No.)
Level of Education
Person
2010-11 2011-12
2012-13
2013-14
2014-15
Post
Graduate
Male
12 67
59
57
56Female
16 32
35
44
31Total
28 99
94
101
87
Under Graduate
Male
3346
4802
2157
2535
2820
Female
4208
4764
2978
3288
3785
Total
7554
9566 5135 5823 6605
20
State at a Glance: Sikkim, Vol. 1(4), 2015
ENVIS Centre on Himalayan Ecology

Table 2.13 : Performance of Livelihood Schools
Year Enrolment No. of Students Graduated Placed or Self Employed Dropouts(%)Male Female Total Male Female Total Male Female Total
2009–10 50 27 77 50 27 77 50 27 77 -2010–11 548 501 1049 488 455 943 330 247 577 102011–12 1005 1032 2037 849 838 1687 694 626 1320 172012–13 1198 1056 2254 750 548 1298* 636 364 1000 12
2013–14 332 559 891 - - - - - - -Total 3133 3175 6308 2137 1868 4005* 1719 1270 2989 -
Note *783 students are still under various courses; dropout is calculated for courses that are finished
Source: Government of Sikkim (Sikkim Human Development Report, 2014). http://www.sikkim.gov.in/stateportal/Link/Sikkim%20 Human%20Developent%20Report%202014.pdf (accessed on 04.01.2016)
Table 2.14: Estimated Enrolment in Higher Education at various Social Categories
(in No.)
Category Persons 2010-11 2011-12 2012-13 2013-14 2014-15
All Categories Male 10834 12071 9055 10891 11399 Female 8171 10682 10398 11293 11880 Total 19005 22753 19453 22184 23279
Scheduled Caste (SC) Male 239 546 354 590 630 Female 237 537 346 400 457 Total 476 1083 700 990 1087
Scheduled Tribe (ST) Male 1292 2066 1768 2236 2451 Female 1742 3017 2914 3426 3703 Total 3034 5083 4682 5662 6154
Other Backward Classes (OBC)
Male 1495 2639 1657 2237 2448 Female 1565 2734 2067 2452 2773 Total 3060 5373 3724 4689 5221
Source : Ministry of Human Resource Development, Govt. of India (All India Survey on Higher Education-2010-11, 2011-12, 2012-13, 2013-14, 2014-15).
http://mhrd.gov.in/statist?field_statistics_category_tid=32 (accessed on 05.01.2016)
21
State at a Glance: Sikkim, Vol. 1(4), 2015
ENVIS Centre on Himalayan Ecology

Source (Tables 2.15-2.16) :Ministry of Human Resource Development, Govt. of India
(All India Survey on Higher Education-2010-11, 2011-12, 2012-13, 2013-14, 2014-15).
http://mhrd.gov.in/statist?field_statistics_category_tid=32 (accessed on 05.01.2016)
Table 2.15: Enrolment in Persons with Disability and Minority Community at Higher Level
Community 2010-11 2011-12 2012-13 2013-14 2014-15
Persons with Disability
Male 22 6 3 1 1 Female 12 1 1 0 1 Total 34 7 4 1 2
Muslim
Male 53 96 76 60 52 Female 27 25 26 22 12 Total 80 121 102 82 64
Other Minority Communities
Male 330 41 59 50 75 Female 518 78 89 196 236 Total 848 119 148 246 311
Table 2.16: Enrolment through Regular Mode
at various levels of Education
Level of Education
Persons
2010-11
2011-12
2012-13
2013-14
2014-15
Ph.D.
Male
-
-
10
9
42 Female
-
-
7
10
21
Total
-
-
17
19
63 M.Phil.
Male
-
27
39
48
65
Female
-
23
32
40
73
Total
-
50
71
88
138
Post Graduate
Male
347
455
440
633
692
Female
265
360
416
718
854
Total
612
815
856
1351
1546
Under Graduate
Male
5210
7354
4846
6080
6426
Female
5260
6496
4936
5171
5528
Total
10470
13850
9782
11251
11954
PG Diploma
Male
0
0
0
0
1
Female
0
0
0
0
0
Total
0
0
0
0
1
Diploma
Male
719
490
573
842
805
Female
176
242
389
534
540
Total
895
732
962
1376
1345
Certificate
Male
0
0
0
0
10
Female
0
0
40
20
28
Total
0
0
40
20
38
Integrated
Male
80
142
184
261
340
Female
110
164
213
288
324
Total
190
306
397
549
664
Grand Total
Male
6356
8468
6092
7873
8381
Female 5811 7285 6033 6781 7368Total 12167 15753 12125 14654 15749
22
State at a Glance: Sikkim, Vol. 1(4), 2015
ENVIS Centre on Himalayan Ecology

Table 2.17: Gross Enrolment Ratio in Higher Education (18-23years)
Category
2010-11
2011-12
2012-13
2013-14
2014-15
All Categories
Male
26.0
28.9
21.8
26.4
27.9
Female
22.2
27.4
26.9
29.3
31.1
Total
24.2
28.2
24.3
27.8
29.4
Scheduled Caste (SC)
Male
12.4
28.9
18.9
31.6
34.0
Female
11.3
26.8
17.3
20.2
23.2
Total
11.8
27.8
18.1
25.7
28.4
Scheduled Tribe (ST)Male
16.4
15.6
13.4
17.1
18.9
Female 22.2 22.4
21.8
25.8
28.0
Total 19.3 19.0
17.6 21.5
23.5
Table 2.18: Gender Parity Index in Higher Education (18-23 Years) Year All Categories SC Students ST Students 2010-11 0.85 0.91 1.35 2011-12 0.95 0.93 1.44 2012-13 1.23 0.92 1.62 2013-14 1.11 0.64 1.51 2014-15 1.11 0.68 1.49
Table 2.19: Number of Teachers among various Social Categories in Higher Education
Year
2010-11
2011-12
2012-13
2013-14
2014-15
Total
Male
469
699
799
767
844 Female
310
464
549
531
556
Total
779
1163
1348
1298
1400
Scheduled Caste (SC)
Male
10
36
28
25
32 Female
5
29
19
15
9
Total
15
65
47
40
41
Scheduled Tribe (ST)
Male
67
72
108
95
95
Female
92
110
161
149
121
Total
159
182
269
244
216
Other Backward
Classes (OBC)
Male
63
102
122
134
112
Female
52
84
93
128
78
Total
115
186
215
262
190
Source
(Tables 2.17-2.19):
Ministry of Human Resource Development, Govt. of India.
(All India Survey on Higher Education -2010-11, 2011-12, 2012-13, 2013-14, 2014-15) http://mhrd.gov.in/statist?field_statistics_category_tid=32 (accessed on 05.01.2016)
23
State at a Glance: Sikkim, Vol. 1(4), 2015
ENVIS Centre on Himalayan Ecology

Table 2.20:
Number of Teachers among Minority & Persons with Disability at Higher Education
(in No.)
Persons
2010-11
2011-12
2012-13
2013-14
2014-15
Persons with
Disability
Male
1
0
4
1
0
Female
0
0
0
0
0
Total
1
0
4
1
0
Muslim
Male
3
18
17
13
3
Female
2
0
4
2
0
Total
5
18
21
15
3
Other Minority
Communities
Male
24
21
8
5
0
Female
27
29
8
25
0
Total
51
50 16 30 0
Table 2.21: Post-wise Number of Male & Female Teachers in Higher Education
(based on actual response) Year
2010-11
2011-12
2012-13
2013-14
2014-15
Professor & Equivalent
Male
61
65
74
77
68
Female
5
11
15
28
25
Total
66
76
89
105
96
Reader & Associate
Professor
Male
62
62
103
91
126
Female
35
29
38
26
38
Total
97
91
141
117
164
Lecturer/ Assistant
Professor
Male
292
507
458
431
437
Female
196
345
326
261
264
Total
488
852
784
692
701
Demonstrator/ Tutor
Male
30
28
66
62
95
Female
37
33
97
126
135
Total
67
61
163
188
230
Temporary Teacher ,
etc.
Male
24
37
98
106
118
Female
37
46
73
90
91
Total
61
83
171
196
209
Grand Total
Male
469
699
799
767
844
Female
310
464
549
531
556
Total
779
1163
1348
1298
1400
Visiting Teacher
Male
-
1
6
4
7
Female
-
1
15
5
8
Total - 2 21 9 15
Source
(Tables 2.20-2.21):
Ministry of Human Resource Development, Govt. of India.(All India Survey on Higher Education -2010-11, 2011-12, 2012-13, 2013-14, 2014-15)http://mhrd.gov.in/statist?field_statistics_category_tid=32 (accessed on 05.01.2016)
24
State at a Glance: Sikkim, Vol. 1(4), 2015
ENVIS Centre on Himalayan Ecology

Table 2.22: Universities
listed by University Grant Commission (UGC), 2015
(in No.)
No. of Universities
Total
06
Central
01
State
-
Private
05
Deemed -Others* -
Table 2.23: Number of Colleges* during the Year 2014 -15 (in No.)
Year Number of Colleges 2010-11 15 2011-12 15 2012-13 15 2013-14 39 2014-15* 21 *Number of Colleges includes Affiliated Colleges /University Colleges/Constituent Colleges/PG Centres/Recognised Centres / Off Campuses, etc. Table 2.24: Students Enrolment* in Universities & Colleges (2014-15) Students Enrolment Enrolment Total 15519 Women 6700 % of Women 43.17 * Provisional Data
Table 2.25: Detail of Central University Name of University Year of Establishment Website
Sikkim University, 6th Mile, Samdur, P.O. Tadong, Gangtok, Sikkim-737 102
2009
http://www.cus.ac.in
Source (Tables 2.22-2.25): University Grants Commission, Bahadur Shah Zafar Marg, New Delhi, India.
http://www.ugc.ac.in/pdfnews/2465555_Annual-Report-2014-15.pdf
(accessed on 21.01.2016)
25
State at a Glance: Sikkim, Vol. 1(4), 2015
ENVIS Centre on Himalayan Ecology

Table 2.26: Detail of Private Universities
Name of University
Date of Notification
Website
Eastern Institute for integrated Learning in Management
University, (EIILM), 8th Mile, Malbasey, Budang, WestSikkim–737
121
24.03.2006
http://www.eiilmuniversity.ac.in
Shri Ramasamy Memorial university, 5th Mile, Tadong,
Ranipool P.O.
Gangtok, Sikkim-737
102
16.01.2014
http://www.srmus.ac.in
Sikkim-
Manipal University, 5th Mile, P.O. Tadong,Gangtok-737
102
11.10.1995
http://www.smu.edu.in
The Institute of Chartered Financial Analysts of India
University, (ICFAI), Ranka Road, Lower
Sichey, Gangtok-737
101, Sikkim
04.10.2004
http://www.iusikkim.edu.in
Vinayaka Missions Sikkim University, Plot No. 438,N-312 Sang Phatak Road, Middle Tadong, P.O.-Daragaorn,Tadong, East
Sikkim –
737 102.
30.07.2008
http://www.vmsu.in
Source University Grants Commission, Bahadur Shah Zafar Marg, New Delhi, India. http://www.ugc.ac.in/pdfnews/2465555_Annual-Report-2014-15.pdf (accessed on 21.01.2016)
Table 2.27: Literacy Rate (Census, 2011)
Person
Total
81.4 Rural
78.9
Urban
88.7
Male
Total
86.6
Rural
84.6
Urban
92.4
Female
Total
75.6
Rural
72.4
Urban
84.7
Source: Census of India 2011, Govt. of India.
www.censusindia.gov.in (accessed on 19.01.2016)
26
State at a Glance: Sikkim, Vol. 1(4), 2015
ENVIS Centre on Himalayan Ecology

Table 2.28: Gender Gap in Literacy (in per cent)
Year 1981 1991 2001 2011
Rural 22 17 16 12
Urban 16 11 8 8
Sikkim 22 10 15 11
Source : Note Figures have been rounded off : Census of India 2011. (Sikkim Human Development Report 2014).. http://www.sikkim.gov.in/stateportal/Link/Sikkim%20Human%20Developent%20Report%202014.pdf
(accessed on 04.01.2016)
27
State at a Glance: Sikkim, Vol. 1(4), 2015
ENVIS Centre on Himalayan Ecology


Health & Family Welfare
List of Tables
3.1: Government Hospitals and Beds positions in Sikkim
3.2: Government Doctors and Surgeons
3.3: Hospitals and Bed Strength under Ayush Systems
3.4: Dispensaries under Ayush Systems
3.5: Health Centers during Five Year Plans
3.6: Hospitals & Mobile Medical Units Functioning
3.7: District-wise availability of Health Centres
3.8: Shortfall in Health Infrastructure
3.9: Building Position for Sub/Primary/Community Health Centres
3.10: Details of Medical Staffs at various Health Centres
3.11: Facilities available at Sub Centres
3.12: Facilities available at Primary Health Centers
3.13: Facilities available at Community Health Centres
3.14: Licensed Blood Banks
3.15: Health Infrastructure in Employees’ State Insurance Corporation
3.16: Medical Colleges with their Admission Capacity and No. of Beds in Attached
Hospitals
29
State at a Glance: Sikkim, Vol. 1(4), 2015
ENVIS Centre on Himalayan Ecology
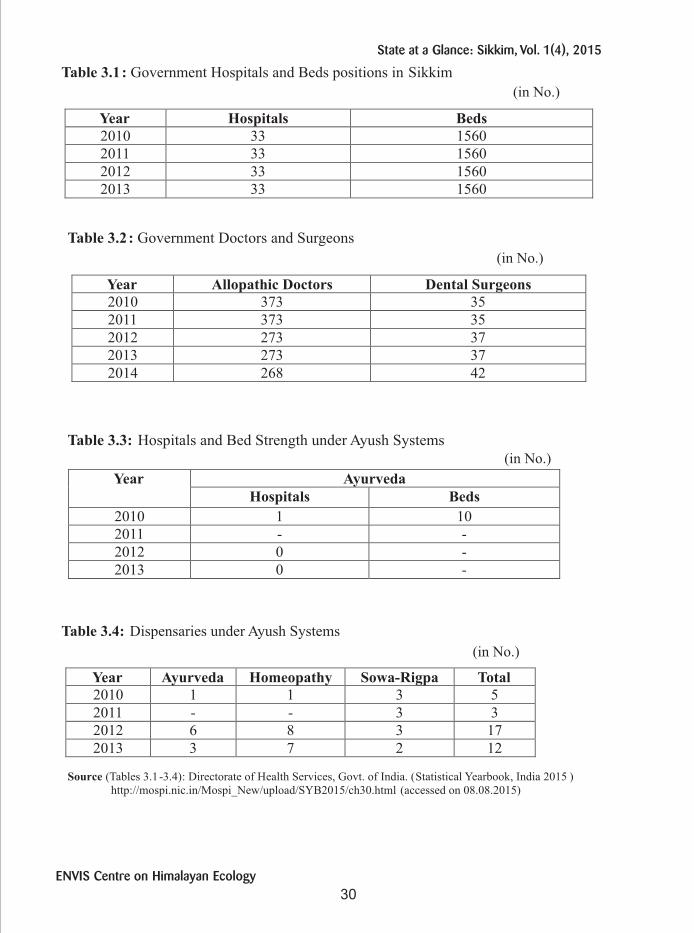
Table 3.1: Government Hospitals and Beds positions in Sikkim (in No.)
Year Hospitals Beds
2010 33 1560
2011 33 1560
2012 33 1560
2013 33 1560
Table 3.2: Government Doctors and Surgeons
(in No.)
Year Allopathic Doctors Dental Surgeons
2010 373 35
2011 373 35
2012 273 37
2013 273 37
2014 268 42
Table 3.3: Hospitals and Bed Strength under Ayush Systems
(in No.)
Year Ayurveda
Hospitals Beds
2010 1 10
2011 - -
2012
0
-
2013
0
-
Table 3.4: Dispensaries under Ayush Systems
(in No.)
Year
Ayurveda
Homeopathy
Sowa-Rigpa
Total
2010
1
1
3
5
2011
-
-
3
3
2012
6
8
3
17
2013
3
7
2
12
Source
(Tables 3.1-3.4):
Directorate of Health Services, Govt. of India. (Statistical Yearbook, India 2015 )
http://mospi.nic.in/Mospi_New/upload/SYB2015/ch30.html
(accessed on 08.08.2015)
30
State at a Glance: Sikkim, Vol. 1(4), 2015
ENVIS Centre on Himalayan Ecology

Table 3.5 : Health Centers during Five Year Plans
(in No.)
Five Year Plan Sub Centers Primary Health Centers
(PHCs)
Community Health Centers (CHCs)
Sixth Plan
(1981-85)
82 18 0
Seventh Plan
(1985-1990)
132 20 2
Eight Plan
(1992-1997)
147 24 2
Ninth Plan
(1997-2002)
147 24 2
Tenth Plan
(2002-2007)
147 24 4
Eleventh Plan
(2007-2012)
147 24 2
Twelfth Plan
(2012-2017)
147 24 2
Table 3.6: Hospitals & Mobile Medical Units Functioning (as on 31st March, 2015)
Hospital/Unit Number
Sub Divisional Hospital (SDH) 0
District Hospital (DH) 4
Mobile Medical Units (MMU) 4
Source (Tables 3.5-3.6): Ministry of Health and Family Welfare, Govt. of India (Rural Health Statistics 2015). https://nrhm-mis.nic.in/SitePages/HMIS-Publications.aspx?RootFolder=%2FPubStatistical_Publications%2FRural%20Health%20Statistics&FolderCTID=0x012000AC878C9A74E6DC46A4B9220C1AAC27300098F49E13CE4ED442AB009F0A97E0CFFA&View={963874F4-C1DD-4335-9EEB-C1FC961508FB} (accessed on 15.09.2015)
31
State at a Glance: Sikkim, Vol. 1(4), 2015
ENVIS Centre on Himalayan Ecology

Source (Tables 3.8-3.9): Ministry of Health and Family Welfare, Govt. of India . (Rural Health Statistics 2015) https://nrhm- mis.nic.in/SitePages/HMIS-Publications.aspx?RootFolder=%2FPubStatistical_Publications%2FRural%20Health%20Statistics&FolderCTID=0x012000AC878C9A74E6DC46A4B9220C1AAC27300098F49E13CE4ED442AB009F0A97E0CFFA&View={963874F4-C1DD-4335-9EEB-C1FC961508FB}
(accessed on
15.09.2015)
Table 3.7: District-wise Availability of Health Centres (as on 31st March, 2015) (in No.) Name of the
District
Sub Centres PHCs CHCs Sub Divisional Hospital
District Hospital
East 48 6 1 0 1 North 19 5 0 0 1 South 39 6 1 0 1 West 41 7 0 0 1 Total 147 24 2 0 4 Source: Ministry of Health and Family Welfare Statistics Division,
Govt. of India (Rural Health Statistics 2014-15).
http://www.mohfw.nic.in/
(accessed on 18.02.2016)
Table 3.8: Shortfall in Health Infrastructure
(as per 2011 Population)
(as on 31st
March, 2015)
Health Centres
Required
Position
Shortfall
%
Shortfall Sub Centers
113
147
*
*
Primary Health Centres
18
24
*
* Community Health Centres
4
2
2
50
*Surplus
Table 3.9: Building Position for sub/Primary/Community Health Centres
(as on 31st
March, 2015)
(in No.)
Total
Sub Centres
Primary Health Centres
Community Health Centres
Govt. Buildings
142
24
2 Rented Buildings
5
0
0
Rent Free Panchayat / Vol. Society Buildings
0
0
0
Buildings Under Construction
0
0
0
Buildings required1 to be constructed
5
0
0
32
State at a Glance: Sikkim, Vol. 1(4), 2015
ENVIS Centre on Himalayan Ecology

33
State at a Glance: Sikkim, Vol. 1(4), 2015
Table 3.10: Details of Medical Staffs at various Health Centres (as on 2015) (in No.)
Details Doctors at PHCs
Specialist at
CHCs
Radiographers at
CHCs
Pharmacists at PHCs & CHCs
Lab Technician at PHCs &
CHCs
Nursing Staff at PHCs & CHCs
Required 24 8 2 26 26 38 Sanctioned NA NA NA NA NA NA In Position 29 0 0 14 31 41 Vacant NA NA NA NA NA NA Shortfall * 8 2 12 * *
*Surplus
Table 3.11: Facilities available at Sub Centres (as on 31st
March, 2015)
Number of Sub Centres
Functioning
Without Water Supply Without Electricity
Supply
Without All-Weather Motorable
Approach Road
Number
%
Number %
Number
%
147
12
8.2
0
0.0
22
15.0
Table 3.12: Facilities available at Primary Health Centers
(as on 31st
March,
2015)
Number of
Primary Health Centers
Functioning
With Labour Room
With Operation Theatre
With at Least 4 Beds
Number
%
Number
%
Number
%
637
328
51.5
13
2.0
384
60.3
Source (Tables 3.10-3.12) : Ministry of Health and Family Welfare, Govt. of India . (Rural Health Statistics 2015)
https://nrhm- mis.nic.in/SitePages/HMIS-Publications.aspx?RootFolder=%2FPubStatistical_Publications%2FRural%20Health%20Statistics&FolderCTID=0x012000AC878C9A74E6DC46A4B9220C1AAC27300098F49E13CE4ED442AB009F0A97E0CFFA&View={963874F4-C1DD-4335-9EEB-C1FC961508FB} (accessed on 15.09.2015)
ENVIS Centre on Himalayan Ecology
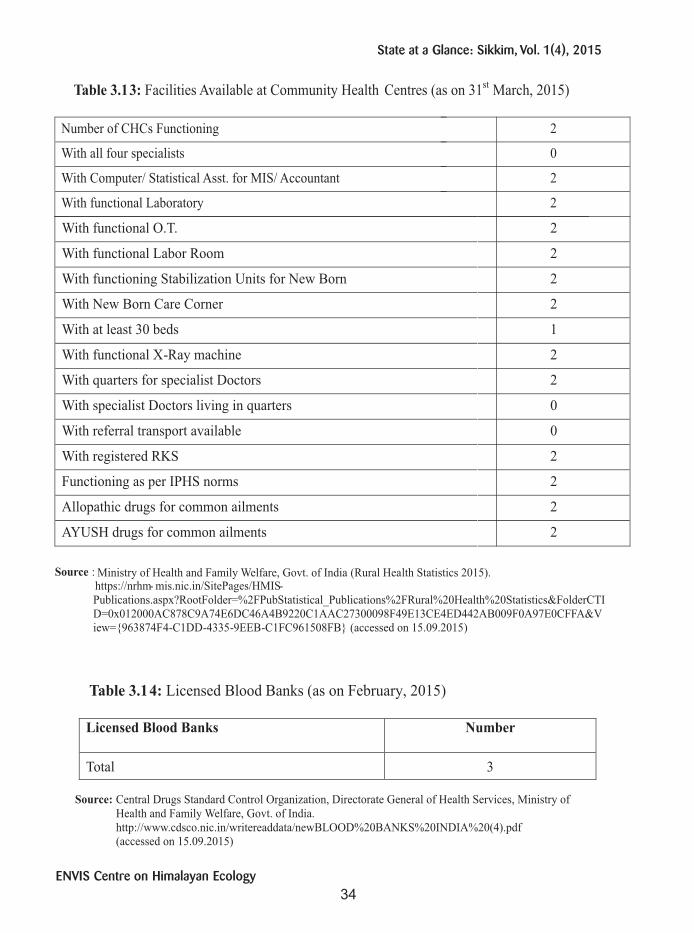
With functional O.T. 2
With functional Labor Room 2
With functioning Stabilization Units for New Born 2
With New Born Care Corner 2
With at least 30 beds 1
With functional X-Ray machine 2
With quarters for specialist Doctors 2
With specialist Doctors living in quarters 0
With referral transport available 0
With registered RKS 2
Functioning as per IPHS norms 2
Allopathic drugs for common ailments 2
AYUSH drugs for common ailments 2
Table 3.14: Licensed Blood Banks (as on February, 2015)
Licensed Blood Banks Number
Total 3
Source: Central Drugs Standard Control Organization, Directorate General of Health Services, Ministry of Health and Family Welfare, Govt. of India.
http://www.cdsco.nic.in/writereaddata/newBLOOD%20BANKS%20INDIA%20(4).pdf(accessed on 15.09.2015)
Table 3.13: Facilities Available at Community Health Centres (as on 31st March, 2015)
Number of CHCs Functioning
With all four specialists
With Computer/ Statistical Asst. for MIS/ Accountant
With functional Laboratory
2
2 0 2
Source : Ministry of Health and Family Welfare, Govt. of India (Rural Health Statistics 2015).
https://nrhm- mis.nic.in/SitePages/HMIS-Publications.aspx?RootFolder=%2FPubStatistical_Publications%2FRural%20Health%20Statistics&FolderCTID=0x012000AC878C9A74E6DC46A4B9220C1AAC27300098F49E13CE4ED442AB009F0A97E0CFFA&View={963874F4-C1DD-4335-9EEB-C1FC961508FB} (accessed on 15.09.2015)
34
State at a Glance: Sikkim, Vol. 1(4), 2015
ENVIS Centre on Himalayan Ecology

Table 3.15: Health Infrastructure in Employees’ State Insurance Corporation (as June, 2015)
Total No. of Dispensaries 2 Total No. of Hospitals -- Total No. of Beds --
Table 3.16: Medical Colleges with their Admission Capacity and No. of Beds in Attached Hospitals
Name of Medical College City/Town Govt./ Private
Admission Capacity
No. of Beds in
Attached Hospital
Sikkim Manipal Institute of Medical Sciences, Gangtok
Gangtok Trust
100
650
Total
100
650
Source ( Tables 3.15-3.16): Ministry of Health and Family Welfare, Govt. of India (National Health Profile 2015). http://www.cbhidghs.nic.in/index.asp (accessed on 21.09.2015)
35
State at a Glance: Sikkim, Vol. 1(4), 2015
ENVIS Centre on Himalayan Ecology


Climate
List of Tables
4.1: Mean Monthly Temperature (°C) of Mangan
4.2: Monthly Cumulative Rainfall of Mangan
4.3: Mean Monthly Temperature (°C) of Namthang
4.4: Monthly Cumulative Rainfall of Namthang
4.5: Mean Monthly Temperature (°C) of Gangtok
4.6: Monthly Cumulative Rainfall of Gangtok
4.7: Mean Monthly Relative Humidity at Gangtok (Part-1)
4.8: Mean Monthly Relative Humidity at Gangtok (Part-2)
4.9: Mean Monthly Wind Speed of Gangtok
37
State at a Glance: Sikkim, Vol. 1(4), 2015
ENVIS Centre on Himalayan Ecology

Table 4.1:
Mean Monthly Temperature (°C) of Mangan
Month
2008
2009
2010
2011
2012
2013
Max.
Min.
Max.
Min.
Max.
Min.
Max.
Min.
Max.
Min.
Max.
Min.
January
16.3
06.3
NA
NA
15.5
08.6
13.9
06.6
13.7
06.7
15.6
06.8
February
12.2
07.2
NA
NA
15.4
09.0
18.2
08.0
16.4
08.5
19.7
07.4
March
16.9
09.9
NA
NA
22.1
17.7
19.3
10.8
19.9
11.0
22.2
07.1
April
25.7
14.4
22.8
10.9
25.0
19.0
22.6
12.2
21.2
15.3
21.6
07.8
May
30.4
20.4
29.7
20.9
27.1
21.3
22.5
12.7
24.8
18.1
23.7
10.0
June
31.6
23.1
28.7
22.7
26.5
17.5
24.4
14.9
24.1
15.8
27.1
17.1
July
32.0
23.6
32.0
23.6
25.7
21.0
23.9
14.6
25.9
16.0
26.2
18.0
August
30.7
21.9
NA
NA
24.8
22.2
24.9
17.6 26.6
15.4
26.9
19.1
September
NA
NA
26.6
19.9
24.2
22.3
23.5
17.3 24.2
15.1
25.1
16.4
October
NA
NA
27.1
20.0
23.5
20.6
21.9
16.0 20.9
15.1
21.4
13.1
November NA NA 22.5 17.9 19.7 17.1 17.5 13.3 17.6 10.7 19.0 09.5
December NA NA 21.0 08.6 16.3 10.5 15.8 10.8 14.2 08.0 15.6 07.1
max. = maximum; min. = minimum
Table 4.2: Monthly Cumulative Rainfall of Mangan (in mm)
Month
2008
2009
2010
2011
2012
2013
January
078.3
NA
000.0
031.8
093.9
009.1
February
270.7
NA
031.4
072.4
039.5
062.6
March
207.0
NA
394.6
081.8
217.9
121.3
April
309.2
058.2
325.0
150.3
377.6
247.0
May
298.7
256.2
732.7
200.0
134.2
620.7
June
413.4
419.6
643.9
471.0
609.6
313.6
July
718.5
698.2
591.5
542.9
601.8
470.8
August
562.4
NA
853.4
439.9
301.6
304.5
September
NA
960.0
388.3
291.8
890.7
325.7
October
NA
121.2
147.9
142.9
281.0
182.6
November
NA
045.6
111.8
067.4
000.0
082.4
December
NA
009.0
011.2
012.7
011.3
012.7
NA: Not Available
Source:
(Tables 4.1-4.2):
India Meteorological Department, Meteorological Centre, Rajbhawan Area
Meteorological Centre Gangtok.
http://sikenvis.nic.in/WriteReadData/UserFiles/file/Monthly%20Meteorological%20Data%20Sikkim%20(2008-2013).pdf (accessed on 15.12.2015)
38
State at a Glance: Sikkim, Vol. 1(4), 2015
ENVIS Centre on Himalayan Ecology

Table 4.3: Mean Monthly Temperature (°C) of Namthang
Month
2008
2009
2010
2011
2012
2013
Max.
Min.
Max.
Min.
Max.
Min.
Max.
Min.
Max.
Min.
Max.
Min.
January
14.8
06.7
17.1
07.6
18.1
09.2
15.0
05.5
14.9
05.2
14.7
04.5
February
16.5
07.8
21.0
09.9
20.3
08.4
19.1
08.2
16.7
07.0
18.0
06.9
March
21.7
15.1
23.4
11.5
23.3
12.6
23.1
11.5
21.7
10.9
22.1
10.6
April
24.0
17.9
25.0
13.9
25.6
13.0
24.2
12.4
25.0
13.1
23.9
12.6
May
25.4
16.1
25.9
14.8
25.6
14.1
25.6
15.8
26.2
14.5
25.0
16.1
June
24.6
18.4
27.1
19.4
25.6
18.4
25.7
17.8
25.6
17.7
26.6
20.4
July
26.4
19.1
26.4
19.1
25.7
19.0
25.4
17.0
25.9
18.2
25.0
20.4
August
26.5
19.3
26.2
18.7
25.9
21.5
25.9
17.5
25.9
18.3
26.4
19.8
September
27.0
18.1
27.3
19.5
25.4
18.9
26.4
17.5 24.4
18.7
27.5
19.5
October
25.2
13.8
24.7
13.5
19.2
17.2
22.5
15.5 22.6
14.3
24.8
16.0
November
20.3
10.8
20.4
09.9
18.6
16.1
18.4
09.2 20.7
09.5
21.2
10.4
December 18.5 10.0 18.0 10.0 16.6 07.8 18.8 08.9 16.5 06.5 16.4 08.0
max. = maximum; min. = minimum
Table 4.4: Monthly Cumulative Rainfall of Namthang (in mm)
Month
2008
2009
2010
2011
2012
2013 January
006.2
00.0
000.0
011.9
010.6
002.0
February
014.0
00.0
009.6
008.6
002.0
019.4
March
059.5
36.8
025.5
090.4
007.2
078.3
April
174.8
279.7
139.9
117.3
099.9
122.5
May
537.6
227.3
155.4
153.2
101.4
142.1
June
391.3
227.9
349.1
271.5
371.6
171.0
July
443.7
407.1
547.4
488.4
276.1
215.8
August
779.6
394.0
158.3
373.2
337.1
232.4
September
89.7
175.7
486.3
255.9
319.8
085.8
October
05.2
252.1
012.5
009.6
002.2
062.8
November
00.0
000.0
000.2
026.6
000.0
002.0
December
11.7
000.0
000.0
000.0
000.0
006.0
Source
(Tables 4.3-4.4):
India Meteorological Department, Meteorological Centre, Rajbhawan Area
Meteorological Centre Gangtok.http://sikenvis.nic.in/WriteReadData/UserFiles/file/Monthly%20Meteorological%20Data%20Sikkim%20(2008-2013).pdf (accessed on 15.12.2015)
39
State at a Glance: Sikkim, Vol. 1(4), 2015
ENVIS Centre on Himalayan Ecology

Table 4.5: Mean Monthly Temperature (°C) of Gangtok Month
2008
2009
2010
2011
2012 2013
Max.
Min.
Max.
Min.
Max.
Min.
Max.
Min.
Max.
Min.
Max.
Min.
January
11.8
06.0 13.5
07.6
15.0
06.9
11.2
04.8
10.2
04.4
13.3
05.2
February
12.8
05.3
16.6
09.0
15.4
07.6
15.0
08.1
14.5
07.2
16.7
08.2
March
17.9
10.3
18.4
10.7
19.0
12.2
18.3
10.8
17.4
09.9
19.2
11.2
April
20.3
12.9
20.7
13.5
22.0
14.5
20.6
12.3
20.3
12.6
19.6
12.5
May
21.6
14.6
21.2
14.7
22.1
15.4
21.8
15.0
22.9
15.1
20.6
15.0
June
21.1
17.0
22.8
17.1
22.3
17.1
22.2
17.1
21.6
17.5
22.1
17.7
July
21.9
17.7
22.3
18.2
21.8
17.9
21.1
17.7
21.6
17.9
21.5
18.0
August
21.3
17.6
21.7
18.0
21.9
18.0
21.7
17.5
22.4
17.8
21.8
17.6
September
21.6
16.4
22.8
17.0
21.0
17.0
21.6
17.1
21.2
16.9
22.0
17.1
October
20.9
13.7
21.1
14.4
20.2
14.5
20.6
14.0
19.9
13.1
19.2
14.1
November
17.9
10.5
17.0
10.7
16.2
11.1
15.3
10.0
17.0
09.4
17.4
10.0
December
13.9
09.0
13.3
07.6
14.6
07.0
13.7
07.6
13.9
07.0
12.9
0
max. = maximum; min. = minimum
Table 4.6: Monthly Cumulative Rainfall of Gangtok
(in
mm)
Month/Year
2008
2009
2010
2011
2012
2013
January
017.7
011.3
000.0
027.8
028.6
006.0
February
006.8
007.5
017.4
045.6
042.6
047.3
March
155.3
107.5
224.6
073.8
047.9
168.2
April
350.1
300.6
444.9
172.1
458.9
372.3
May
179.0
365.0
431.7
375.2
227.9
669.7
June
786.5
463.5
623.3
706.8
859.5
570.4
July
661.9
502.4
746.5
744.7
687.0
666.8
August
628.9
546.9
601.2
638.8
557.5
395.7
September
437.4
248.4
445.3
451.6
522.6
319.8
October
106.2
221.7
141.3
060.7
127.0
368.9
November
029.0
002.7
064.0
100.9
000.2
084.8
December
018.5
009.1 000.2 004.7 003.2 008.4
Source (Tables 4.5-4.6): India Meteorological Department, Meteorological Centre, Rajbhawan AreaMeteorological Centre Gangtok.http://sikenvis.nic.in/WriteReadData/UserFiles/file/Monthly%20Meteorological%20Data%20Sikkim%20(2008-2013).pdf (accessed on 15.12.2015)
40
State at a Glance: Sikkim, Vol. 1(4), 2015
ENVIS Centre on Himalayan Ecology

Table 4.7:
Mean Monthly Relative Humidity of Gangtok
(Part-1)
2008
2009
2010
Month
08:30 Hrs IST
17:30 Hrs IST
08:30 Hrs IST
17:30 Hrs IST
08:30 Hrs IST
17:30 Hrs IST
January
84
81
84
78
74
66
February
83
76
82
74
83
72
March
80
80
68
65
81
78
April
82
81
81
79
79
84
May
85
84
85
81
87
84
June
96
93
93
88
93
89
July
96
93
95
92
94
92
August
95
93
95
92
95
93
September
92
90
91
88
93
91
October 77 79 82 79 86 85
November 76 73 80 78 87 84
December 83 83 87 81 76 71
Table 4.8: Mean Monthly Relative Humidity of Gangtok (Part-2)
2011 2012 2013
Month 08:30 Hrs IST
17:30 Hrs IST
08:30 Hrs IST
17:30 Hrs IST
08:30 Hrs IST
17:30 Hrs IST
January
85
76
83
81
76
63
February
84
76
83
76
71
66
March
75
73
76
68
76
74
April
75
77
80
83
80
81
May
88
84
80
78
90
88 June
93
88
94
93
93
90 July
96
93
95
94
95
93 August
94
92
93
91
94
92
September
93
91
93
91
94
91
October
83
82
84
80
87
86
November
82
81
78
73
75
73
December
81
75
80
74
85
82
Source
(Tables 4.7-4.8):
India Meteorological Department, Meteorological Centre, Rajbhawan Area
Meteorological Centre Gangtok.
http://sikenvis.nic.in/WriteReadData/UserFiles/file/Monthly%20Meteorological%20Data%20Sikkim% 20(2008-2013).pdf (accessed on 15.12.2015)
41
State at a Glance: Sikkim, Vol. 1(4), 2015
ENVIS Centre on Himalayan Ecology

Table 4.9: Mean Monthly Wind Speed of Gangtok (in km/hr)
Month 2008 2009 2010 2011 2012 2013
January 002 002 002 001 002 002
February 002 002 002 002 002 003
March 003 003 002 003 002 003
April 003 003 003 004 003 003
May 003 004 003 002 003 002
June 001 002 002 002 002 002
July 001 001 001 001 001 001
August 001 001 001 001 001 001
September 002 001 001 001 001 001
October 003 002 002 002 002 002
November 002 002 001 002 002 002
December 001 001 002 001 001 002
Source:
India Meteorological Department, Meteorological Centre, Rajbhawan Area
Meteorological Centre
Gangtok. http://sikenvis.nic.in/WriteReadData/UserFiles/file/Monthly%20Meteorological%20Data%20Sikk im%20
(2008-2013).pdf
(accessed on 15.12.2015)
42
State at a Glance: Sikkim, Vol. 1(4), 2015
ENVIS Centre on Himalayan Ecology

Land
List of Tables
5.1: Land Use Classification in Sikkim
5.2: Land Use Classification (Part-2)
5.3: Details of Irrigated Area
5.4: Net Area Irrigated by sources
5.5: Status of Wasteland
5.6: District-wise status of Wasteland
(Part-1)
43
State at a Glance: Sikkim, Vol. 1(4), 2015
ENVIS Centre on Himalayan Ecology

Tab
le 5
.1:
Lan
d U
se C
lass
ific
atio
n in
Sik
kim
(Pa
rt-I
)
(Tho
usan
d H
ecta
res)
Yea
rG
eogr
aphi
c A
rea
R
epor
ting
ar
ea f
or
land
ut
iliza
tion
st
atis
tics
For
ests
Not
ava
ilabl
e fo
r cu
ltiv
atio
n
Oth
er u
ncul
tiva
ted
land
exc
ludi
ng
Are
a un
der
non-
agri
cult
ural
us
es
Bar
ren
&
un-
cult
urab
le
land
Tot
al
Per
man
ent
past
ures
&
othe
r gr
azin
g la
nds
Lan
d un
der
mis
c.
tree
cro
ps &
gr
oves
(no
t in
cl.
in n
et a
rea
sow
n)
Cul
tura
ble
was
te la
nd
T
otal
2008
-09
71
0
693
58
4
11
-
11
-
8 3
11
2009
-10
71
0
693
58
4
11
- 11
-
8
3
1120
10-1
1
710
693
58
4
11
- 11
-
8
3
1120
11-1
2
710
69
3
584
11
-
11
-
8 3
11
2012
-13
71
0
693
58
4
11
- 11
-
8
3
11
Tab
le 5
.2:
Lan
d U
se C
lass
ific
atio
n (P
art-
2)
(Tho
usan
d H
ecta
res)
Yea
rF
allo
w
Lan
ds
Net
ar
ea
Sow
n
Tot
al
Cro
pped
A
rea
Are
a so
wn
mor
e th
an
once
Agr
i. L
and/
Cul
ti-v
able
la
nd/C
ultu
r-ab
le
land
/Ara
ble
land
Cul
tiva
ted
land
Un-
cult
ivab
le
land
Un-
cult
ivat
ed
land
Fal
low
land
s ot
her
than
cur
rent
fa
llow
s
Cur
rent
fa
llow
s
Tot
al
2008
-09
4
5
9
77
118
40
98
82
595
61
0
2009
-10
4
5
9
77
14
4
67
98
82
59
5
61
0
20
10-1
14
5
9
77
152
74
98
82
595
610
20
11-1
24
5
9
77
137
60
98
82
595
610
20
12-1
34
5
9
77
144
66
98
82
595
610
So
urce
(Ta
bles
5.1
-5.2
):
Dir
ecto
rate
of
Eco
nom
ics
and
Stat
istic
s, D
epar
tmen
t of A
gric
ultu
re a
nd C
oope
ratio
n an
d Fa
rmer
s
W
elfa
re, M
inis
try
of A
gric
ultu
re a
nd F
arm
ers
Wel
fare
, Gov
t. of
Ind
ia.
ht
tp://
eand
s.da
cnet
.nic
.in/
(acc
esse
d on
04.
01.2
016)
44
State at a Glance: Sikkim, Vol. 1(4), 2015
ENVIS Centre on Himalayan Ecology

Tabl
e 5.
3:
Det
ails
of
Ir
riga
ted
Are
a
(
Tho
usan
d H
ecta
res)
Y
ear
Net
Irr
igat
ed
Are
a
Gro
ss I
rrig
ated
A
rea
Are
a Ir
riga
ted
mor
e th
an o
nce
Net
Un-
Irri
gate
d A
rea
Gro
ss U
n-Ir
riga
ted
Are
a Per
cent
age
of
Gro
ss I
rrig
ated
A
rea
to T
otal
C
ropp
ed A
rea
Cro
ppin
g In
tens
ity
2003
-04
6
11
5
72
110
9.
4 15
5.1
20
04-0
5
6
11
5
72 11
2
9.2
158.
1
2005
-06
14
19
4
64
105
15
.1 15
8.3
20
06-0
7
14
19
4
63 10
5
15.1
159.
5
2007
-08
14
17
3
63
101
14
.6 15
2.7
20
08-0
9
14
18
4
63 10
0
15.4
152.
3
2009
-10
14
20
5
63
124
13
.7 18
6.0
20
10-1
1
14
20
6
63 13
1
13.2
195.
7
2011
-12
14
19
4
63
118
13
.7 17
7.3
20
12-1
3
14
19
5
63
124
13
.5 18
5.7
So
urce
:
D
irec
tora
te o
f Eco
nom
ics
and
Stat
istic
s, D
epar
tmen
t of A
gric
ultu
re a
nd C
oope
ratio
n an
d Fa
rmer
s W
elfa
re,
Min
istr
y of
Agr
icul
ture
and
Far
mer
s W
elfa
re, G
ovt.
of In
dia.
http
://ea
nds.
dacn
et.n
ic.in
/
(acc
esse
d on
04.
01.2
016)
45
State at a Glance: Sikkim, Vol. 1(4), 2015
ENVIS Centre on Himalayan Ecology

Tabl
e 5.
4: N
et A
rea
Irri
gate
d by
Sou
rces
(T
hous
and
Hec
tare
s)
Year
Can
als
Ta
nks
Wel
ls
Oth
er
Sour
ces
Net
Irr
igat
ed A
rea
Gov
ernm
ent
Pr
ivat
e
Tota
l
Tube
-Wel
ls
Oth
er W
ells
20
03-0
41
-
1
-
-
-
5 6
2004
-05
1
-
1
-
- -
5
6 20
05-0
6-
-
-
0
- -
14
14
2006
-07
-
-
-
0 -
-
14
14 20
07-0
8-
-
-
0
- -
14
14
2008
-09
-
-
-
0 -
-
14
14 20
09-1
0-
-
-
0
- -
14
14
2010
-11
-
-
-
0 -
-
14
14 20
11-1
2-
-
-
0
- -
14
14
2012
-13
-
-
-
0 -
-
14
14
Sour
ce :
Wel
fare
, Min
istr
y of
Agr
icul
ture
and
Far
mer
s W
elfa
re, G
ovt.
of I
ndia
.D
irec
tora
te o
f E
cono
mic
s an
d St
atis
tics,
Dep
artm
ent o
f Agr
icul
ture
and
Coo
pera
tion
and
Farm
ers
ht
tp://
eand
s.da
cnet
.nic
.in/
(a
cces
sed
on 0
4.01
.201
6)
46
State at a Glance: Sikkim, Vol. 1(4), 2015
ENVIS Centre on Himalayan Ecology

Table 5.5: Status of Wasteland
(in sq.km)
Categories* Year Change 2005-06 2008-09
1 - - - 2 - - - 3 - - - 4 6.37 20.23 13.87 5 - - - 6 - - - 7 - - - 8 - - - 9 - - - 10 - - - 11 60.96 61.18 0.23 12 - - - 13 - - - 14 - - - 15 - - - 16 - - - 17 - - - 18 - - - 19 - - - 20 - - - 21 - - - 22 579.90 362.22 -217.67 23 2633.66 2829.51 195.85
*Details of Categories:1. Gullied and/ or ravinous land (Medium), 2. Gullied and/ or ravinous land (Deep), 3. Land with Dense Scrub, 4. Land with
Open Scrub, 5. Waterlogged and Marshy land (Permanent), 6. Waterlogged and Marshy land (Seasonal), 7. Land affected by salinity/alkalinity (Medium), 8. Land affected by salinity/alkalinity (Strong), 9. Shifting Cultivation - Current Jhum, 10. Shifting Cultivation - Abandoned Jhum, 11. Under-utilised/degraded forest (Scrub domin), 12. Under-utilised/degraded forest (Agriculture), 13. Degraded pastures/ grazing land, 14. Degraded land under plantation crop, 15. Sands-Riverine, 16. Sands-Coastal, 17. Sands-Desertic, 18. Sands-Semi Stab.-Stab>40m, 19. Sands-Semi Stab.-Stab 15-40m, 20. Mining Wastelands, 21. Industrial wastelands, 22. Barren Rocky/Stony waste, 23. Snow covered /Glacial area
Source: Department of Land Resources, Ministry of Rural Development, Govt. of India (Wasteland Atlas of India 2011).
http://www.dolr.nic.in/WastelandsAtlas2011/Wastelands_Atlas_2011.pdf (accessed on 13.01.2016)
47
State at a Glance: Sikkim, Vol. 1(4), 2015
ENVIS Centre on Himalayan Ecology

Tabl
e 5.
6: D
istr
ict-
wis
e st
atus
of W
aste
land
(in
sq.k
m)
Cat
ego-
ries
*
Eas
t Sik
kim
N
orth
Sik
kim
So
uth
Sikk
im
Wes
t Sik
kim
To
tal
Y
ear
C
hang
e
Y
ear
C
hang
e
Yea
r C
hang
e
Yea
r
Cha
nge
Yea
r Cha
nge
20
05-
06
2008
-09
20
05-
06
2008
-09
20
05-
06 20
08-
09 20
05-
06
2008
-09
20
05-
06
2008
-09
1
--
--
--
--
--
--
--
-- --
--
--
--
--
--
--
2
--
--
--
--
--
--
-- --
--
--
--
--
-- --
--
3
--
--
--
--
--
--
--
-- --
--
--
--
--
--
--
41.
03
10.5
7
9.54
2.
54
7.43
4.
89
2.26
1.68
-0.5
8
0.53
0.
55 0.
02 6.
37
20.2
3
13.8
7
5--
--
--
--
--
--
--
-- --
--
--
--
--
--
--
6--
--
--
--
--
--
--
-- --
--
--
--
--
--
--
7--
--
--
--
--
--
--
-- --
--
--
--
--
--
--
8--
--
--
--
--
--
--
-- --
--
--
--
--
--
--
9--
--
--
--
--
--
--
-- --
--
--
--
--
--
--
10--
--
--
--
--
--
--
-- --
--
--
--
--
--
--
114.
51
4.21
-0
.30
24
.45
24
.93
0.
48
15.0
5 14
.95
-0.1
1
16.9
4 1
7.10
0.16
60.9
6
61.1
8
0.23
12
--
--
--
--
--
--
-- --
--
--
--
--
-- --
--
13
--
--
--
--
--
--
-- --
--
--
--
--
-- --
--
14
--
--
--
--
--
--
-- --
--
--
--
--
-- --
--
15
--
--
--
--
--
--
-- --
--
--
--
--
-- --
--
16
--
--
--
--
--
--
-- --
--
--
--
--
-- --
--
17
--
--
--
--
--
--
-- --
--
--
--
--
-- --
--
18
--
--
--
--
--
--
-- --
--
--
--
--
-- --
--
19
--
--
--
--
--
--
-- --
--
--
--
--
-- --
--
20
--
--
--
--
--
--
-- --
--
--
--
--
-- --
--
21
--
--
--
--
--
--
-- --
--
--
--
--
-- --
--
22
111.
67
104.
15
-7.5
2
351.
15
145.
17
-205
.98
5.
09 3.
66
-1.4
3
111.
99 10
9.24
-2.7
5
579.
90
362.
22
-217
.67
23
5.12
2.
52
-2.6
0
2474
.07
26
62.6
2
188.
55
29.1
9 29
.54
0.35
12
5.28
134.
83 9.55
26
33.6
6
2829
.66
19
5.85
48
State at a Glance: Sikkim, Vol. 1(4), 2015
ENVIS Centre on Himalayan Ecology

Det
ails
of C
ateg
orie
s:
1. G
ulli
ed a
nd/ o
r ra
vino
us la
nd (
Med
ium
), 2
. Gul
lied
and
/ or
ravi
nous
land
(D
eep)
, 3
. Lan
d w
ith
Den
se S
crub
, 4. L
and
wit
h O
pen
Scr
ub, 5
. Wat
erlo
gged
and
Mar
shy
land
(P
erm
anen
t), 6
. Wat
erlo
gged
and
Mar
shy
land
(S
easo
nal)
, 7
. Lan
d af
fect
ed b
y sa
lini
ty/a
lkal
init
y (M
ediu
m),
8. L
and
affe
cted
by
sali
nity
/alk
alin
ity
(Str
ong)
, 9.
Shi
ftin
g C
ulti
vati
on -
Cur
rent
Jhu
m,
10.
Shi
ftin
g C
ulti
vati
on -
Aba
ndon
ed J
hum
, 1
1. U
nder
-uti
lise
d/de
grad
ed f
ores
t (S
crub
dom
in),
12
. U
nder
-uti
lise
d/de
grad
ed
fore
st (
Agr
icul
ture
), 1
3. D
egra
ded
past
ures
/ gr
azin
g la
nd, 1
4. D
egra
ded
land
und
er p
lant
atio
n cr
op, 1
5. S
ands
-Riv
erin
e,
16. S
ands
-Coa
stal
, 17.
San
ds-D
eser
tic,
18.
San
ds-S
emi S
tab.
-Sta
b>40
m, 1
9. S
ands
-Sem
i Sta
b.-S
tab
15-4
0m, 2
0. M
inin
g W
aste
land
s, 2
1. In
dust
rial
was
tela
nds,
22.
Bar
ren
Roc
ky/S
tony
was
te, 2
3. S
now
cov
ered
/Gla
cial
are
a
Sou
rce:
Dep
artm
ent o
f Lan
d R
esou
rces
, Min
istr
y of
Rur
al D
evel
opm
ent,
G
ovt.
of I
ndia
(W
aste
land
Atl
as o
f In
dia
2011
).
ht
tp:/
/ww
w.d
olr.
nic.
in/W
aste
land
sAtl
as20
11/W
aste
land
s_A
tlas
_201
1.pd
f (a
cces
sed
on 1
3.01
.201
6)
49
State at a Glance: Sikkim, Vol. 1(4), 2015
ENVIS Centre on Himalayan Ecology


Water
List of Tables
6.1: Installed Capacity of Power Utilities (including allocated shares in Joint & Central
Sector utilities) in Sikkim
6.2: Status of Hydropower Electricity
6.3: Station wise Installed Capacity of Hydropower Electricity Stations
6.4: Status of projects under Integrated Water-shed Management Programme (IWMP)
6.5: Estimated Potential of Renewable Power
6.6: Distribution of Large Dams Completed
6.7: Live Storage Capacity of Large Dams/Reservoirs/Projects
6.8: Ultimate Irrigation Potential (UIP)
6.9: Financial Expenditure on Major and Medium Irrigation
6.10: Plan-wise Financial Expenditure on Flood Management Work
th6.11: List of on-going Projects under CADWM Programme during the period of XI Plan
6.12: Central Released under the Command Area Development Programme (CADP)
6.13: Households access to Safe Drinking Water (Tap/Hand pump/Tube well)
6.14: Ground Water Resources Availability, Utilization and Stage of Development
51
State at a Glance: Sikkim, Vol. 1(4), 2015
ENVIS Centre on Himalayan Ecology
(in MW)
Installed Capacity of Power Utilities (including allocated shares in Joint & Central Sector
utilities) in Sikkim (as on February, 2016)
52
State at a Glance: Sikkim, Vol. 1(4), 2015
.
.
ENVIS Centre on Himalayan Ecology

Hydropower Electricity
Year No. of Projects Area Covered (m. ha)
Central funds released (Rs. In crore)
2012-13 2 0.007 8.18 2013-14 - - 0.00 2014-15 4 0.016 - Total 15 0.066 14.38
Source: Ministry of Rural Development, Govt. of India (Annual Report 2014-15) http://rural.nic.in/netrural/rural/sites/annual-report.aspx (accessed on 4.01.2016)
-
53
State at a Glance: Sikkim, Vol. 1(4), 2015
ENVIS Centre on Himalayan Ecology

Source (Tables 6.6-6.9): Planning & Progress Directorate, Central water Commission, Government of India (Water and Related Statistics 2013, 2015). http://www.cwc.gov.in/main/downloads/Water%20&%20Related%20Statistics%202015.pdf (accessed on 04.11.2015)
54
State at a Glance: Sikkim, Vol. 1(4), 2015
Major & Medium Surface Water
Surface Water
Ground Water
Total
Monor
Irrigation
ENVIS Centre on Himalayan Ecology

Project Name Year of Inclusion
CCA CCA Covered
till 31.3.2013
Reported balance ofexecutable
CCA A Cluster of 17 Minor irrigation of North and East district of Sikkim
2000-01 1.03 0 1.03
A Cluster of 17 Minor irrigation of North and East district of Sikkim
2000-01 1.22 0.107 1.113
Total 2.25 0.107 2.143 CCA
-
Cultural Command Area
Source (Tables 6.10 -6.12): Ministry of Water Resources (CAD Wing), Govt. of India. (Water and Related
Statistics 2015).
http://www.cwc.gov.in/main/downloads/Water%20&%20Related%20Statistics%202015.pdf
(accessed on 04.11.2015)
55
State at a Glance: Sikkim, Vol. 1(4), 2015
ENVIS Centre on Himalayan Ecology

(i
n %
)
Yea
r
1981
1991
2001
2011
T
otal
30
.3
73.1
70.7
85.3
Rur
al
21.7
70
.8 67
.0 82
.7 U
rban
71
.9
92.8
97.1
92.2
S
ourc
e:
Pla
nnin
g C
omm
issi
on, G
ovt.
of
Ind
ia.
ht
tp:/
/pla
nnin
gcom
mis
sion
.nic
.in/
data
/dat
atab
le/d
ata_
231
2/co
mp_
data
2312
acc
esse
d on
12.
02.2
016)
Tab
le 6.
14: G
roun
d W
ater
Res
ourc
es A
vaila
bilit
y, U
tiliz
atio
n an
d St
age
of D
evel
opm
ent (
as o
n 20
09)
(i
nbc
m)
Sour
ce: C
entr
al G
roun
d W
ater
Boa
rd, M
inis
try
of W
ater
Res
ourc
e, G
ovt.
of I
ndia
(G
roun
d Y
ear
Boo
k 20
13-1
4).
ht
tp://
ww
w.c
gwb.
gov.
in/d
ocum
ents
/Gro
und%
20W
ater
%20
Yea
r%20
Boo
k%20
2013
-14.
(acc
esse
d on
6.11
.201
5)
Ann
ual R
eple
nish
able
Gro
und
Wat
er R
esou
rce
N
atur
al
Dis
char
ge
duri
ng
non-
m
onso
on
seas
on
Net
Ann
ual
G
roun
d
Wat
er
Ava
ilabi
lity
Ann
ual G
roun
d W
ater
Dra
ft
Pro
ject
ed
dem
and
fo
r
Dom
esti
c
and
In
dust
rial
us
es u
pto
20
25
Gro
und
W
ater
A
vaila
bilit
y
for
futu
re
irri
gate
on
us
e
Stag
e of
Gro
und
Wat
er
Dev
elop
men
t
(%)
Mon
soon
Sea
son
Non
-mon
soon
Se
ason
Tot
al
Irri
gati
on
Dom
esti
c
and
in
dust
rial
us
es
Tot
al
Rec
harg
e
from
rain
fall
Rec
harg
e fr
om
othe
r so
urce
s
Rec
harg
e
from
ra
infa
ll
Rec
harg
e
from
ot
her
so
urce
s
-
-
- -
-
-
0.
046
0.00
3
0.
007
0.
010
0.
012
0.
031
21
56
State at a Glance: Sikkim, Vol. 1(4), 2015
ENVIS Centre on Himalayan Ecology
Agriculture
List of Tables
7.1: Area Production and yield of Agricultural Crops in Sikkim (Part-A)
7.2: Area Production and yield of Agricultural Crops (Part-B)
7.3: Area Production and yield of Agricultural Crops (Part-C)
7.4: Area under Principal Crops
7.5: Production of Principal Crops
7.6: Average Yield of Principal Crops
7.7: Gross State Domestic Product (GSDP) from Agriculture and Allied Sector at
Constant Prices
7.8: Share of Agriculture and Allied Sector in Gross State Domestic Product (GSDP)
at Current Prices
7.9: Area Irrigated by Crops
7.10: National Agricultural Insurance Scheme (NAIS)
7.11: Kisan Credit Cards Issued
7.12: Classification of Workers
7.13: Classification of Cultivators
7.14: Details of Operational Holdings by Size Groups
7.15: Details of Agricultural Households
7.16: Production of Fish
7.17: Fish Seed Production
57
State at a Glance: Sikkim, Vol. 1(4), 2015
ENVIS Centre on Himalayan Ecology
Table 7.1:
Area Production and yield of Agricultural Crops in Sikkim (Part-A)
Area (‘000 ha) Production (' 000 Tonnes) Yield (kg./ ha)
Year
Rice
Wheat
Maize
Ragi
A*
P**
Y***
A*
P**
Y***
A*
P**
Y***
A*
P**
Y***
2007-08
14.0
22.9
1636
4.5
4.5
1000
39.1
62.6
1601
4.4
4.0
909
2008-09
14.7
21.7
1476
5.8
7.8
1345
37.7
58.2
1544
4.4
3.9
886
2009-10
13.0
24.3
1869
5.2
5.9
1135
39.5
66.0
1671
4.3
5.0
1163
2010-11
12.1
21.0
1727
2.7
2.7
1023
40.2
66.2
1648
3.0
2.9
967
2011-12
12.1
20.9
1730
2.5
2.7
1060
40.0
66.2
1657
4.5
4.2
933
2012-13
11.9
21.3
1790
0.5
0.6
1058
40.0
68.0
1700
3.0
3.4
1133
2013-14
11.2
20.3
1815
0.4
0.4
1083
39.9
68.8
1724
3.6
3.5
961
Table 7.2:
Area Production and yield of Agricultural Crops (Part-B)
Area (‘000 ha) Production ('000 Tonnes) Yield (kg./ ha)
Year Small Millets Barley Kharif Coarse Cereals Rabi Coarse Cereals
A* P** Y*** A* P** Y*** A* P** Y*** A* P** Y***
2007-08 5.8 5.3 537 0.7 0.7 1000 49.3 71.9 1458 0.7 0.7 1000
2008-09 3.3 2.8 555 1.1 1.3 1182 45.4 64.9 1430 1.1 1.3 1182 2009-10 2.2 2.0 909 1.0 1.2 1200 46.0 73.0 1587 1.0 1.2 1200 2010-11 4.4 5.1 1150 0.6 0.6 938 47.6 74.2 1559 0.6 0.6 938 2011-12 3.0 2.8 963 0.6 0.6 966 47.4 73.2 1546 0.6 0.6 966 2012-13 6.5 6.3 969 0.6 0.6 1000 49.5 77.7 1569 0.6 0.6 1000 2013-14 3.0 3.0 1003 0.6 0.6 1017 46.5 75.3 1618 0.6 0.6 1017
Table 7.3:
Area Production and yield Agricultural Crops (Part-C)
Area ( '000 ha) Production (' 000 Tonnes) Yield (kg./ ha)
Year
Soyabean
Total Pulses
Rapeseed & Mustard
Total Oilseeds
A*
P**
Y***
A*
P**
Y***
A*
P**
Y***
A*
P**
Y***
2007-08
3.6
3.2
889
12.5
11.6
928
5.0
4.3
860
8.6
7.5
872
2008-09
3.9
3.3
846
12.6
11.8
937
5.8
4.1
707
9.7
7.4
763
2009-10
4.0
4.1
1025
13.2
12.9
977
5.8
5.3
914
9.8
9.4
959
2010-11
4.2
3.7
881
13.2
11.87
899
5.3
4.2
792
9.5
7.9
832
2011-12
3.9
3.5
897
6.5
5.87
903
5.4
4.3
-
9.3
7.8
841
2012-13
-
-
-
6.37
5.83
915
-
-
-
-
-
-
2013-14
-
-
-
6.3
5.83
925
-
-
-
-
-
-
*A=Area; **P= Production; ***Y=Yield
Source
(Tables 7.1-7.3):
Directorate of Economics and Statistics, Department of Agriculture and Cooperation
and Farmers Welfare, Ministry of Agriculture and Farmers Welfare, Govt. of India
http://eands.dacnet.nic.in/Default.htm (accessed on 04.01.2016)
58
State at a Glance: Sikkim, Vol. 1(4), 2015
ENVIS Centre on Himalayan Ecology

Table 7.4: Area under Principal Crops
('000 ha)
Crops
2009-10
2010-11
2011-12
2012-13
Food grains (cereals)
Rice
13
12
12
12
Maize
40
40
40
40
Ragi
4
3
5
-
Small millets
2
4
3
7
Wheat
5
3
3
1
Barley
1
1
1
1
Total Cereals
65
63
63
60
Food grains(pulses)
Gram
-
-
-
-
Tur
-
-
-
-
Other Pulses
13
13
7
6
Total Pulses
13
13
7
6
Total Food grains
78
76
69
66
Oilseeds
Groundnut
-
-
-
-
Sesamum
-
-
-
-
Rapeseed and mustard
6
5
5
4
Linseed
-
-
-
Total oilseeds (*)
10
10
9
8
Tea
80
..
-
-
Coffee
..
..
-
-
Banana
-
1
2
2
Potato
-
9
10
10
Ginger
7
7
9
9
Turmeric
-
-
1
1
P= Provisional Note: Totals may not tally due to rounding off of figure.NE states accounted for 5.1 thousand hectares under coffee production.
1. Tea Board, Ministry of Commerce & Industry
2. Coffee Board, Ministry of Commerce & Industry
3. Rubber Board, Ministry of Commerce & Industry
(*) Relates to the nine number of oilseeds viz., groundnut, sesamum, rapeseed and mustard, linseed, castor seed, nigerseed, safflower, sunflower and soya been.
Sources :
Directorate of Economics and Statistics, Ministry of
Agriculture, Govt.
of India
(Statistical Year Book, India 2015).
http://mospi.nic.in/Mospi_New/upload/SYB2015/ch8.html (accessed on 04.01.2016)
59
State at a Glance: Sikkim, Vol. 1(4), 2015
ENVIS Centre on Himalayan Ecology

P= Provisional Note: Totals may not tally due to rounding off of figure.NE states accounted for 5.1 thousand hectares under coffee production.
1. Tea Board, Ministry of Commerce & Industry
2. Coffee Board, Ministry of Commerce & Industry
3. Rubber Board, Ministry of Commerce & Industry
(*) Relates to the nine number of oilseeds viz., groundnut, sesamum, rapeseed and mustard, linseed, castor seed, nigerseed, safflower, sunflower and soya been.
Sources :
Directorate of Economics and Statistics, Ministry of
Agriculture, Govt.
of India
(Statistical Year Book, India 2015).
http://mospi.nic.in/Mospi_New/upload/SYB2015/ch8.html (accessed on 04.01.2016)
Table 7.5: Production of Principal Crops
(‘000
Tonnes)
Crops
2009-10
2010-11 2011-12
2012-13
Food grains (Cereals)
Rice
24
21
21
21
Maize
66
66
66
68
Ragi
5
3
4
3
Small millets
2
5
3
6
Wheat
6
3
3
1
Barley
1
1
1
1
Total Cereals
104
99
97
100
Food grains
(Pulses)
Gram
-
-
-
-
Tur
-
-
-
-
Other Pulses 13 12 6 6 Total Pulses 13 12 6 6 Total Food grains 117 111 103 106 Oilseeds
Groundnut
-
-
- -
Sesamum
-
-
- -
Rapeseed and mustard
5
4
4 4
Linseed
Total oilseeds (*)
9
8
8 7
Tea (million kgs)
-
-
- -
Coffee (MT)
-
-
- -
Natural Rubber (MT)
Banana (000MT)
3
3
4 4
Sugarcane (000MT)
-
-
- -
Potato (000MT)
44
46
47 49
Chillies (P) (000MT)
-
-
- -
Ginger (P) (000MT)
36
36
48 52
Turmeric (P) (000MT)
-
-
3 5
60
State at a Glance: Sikkim, Vol. 1(4), 2015
ENVIS Centre on Himalayan Ecology

Table 7.6:
Average Yield of Principal Crops
(in kg/ha)
Year 2009-10 2010-11 2011-12 2012-13 Food grains (Cereals) Rice 1869.2 1727.3 1729.9 1790.3 Maize 1670.9 1648.0 1657 1700.0 Ragi
1162.8
966.7
932.7
1098.0
Small millets
909.1
1150.3
962.7
969.4 Wheat
1134.6
1022.6
1060.0
1057.7
Barley
1200
937.5
965.5
1000.0
Total Cereals
1601.0
1563.0
1557.0
1682.0
Food grains
(Pulses)
Gram
-
-
-
-
Tur
-
-
-
-
Other Pulses
977
909
857
915
Total Pulses
977.3
899.2
903.1
915
Total Food grains
1496.0
1448.0
1495.0
1608.0
Oilseeds
Groundnut
-
-
-
-
Sesamum
-
-
-
-
Rapeseed and mustard
913.8
792.5
801
799.1
Linseed - - - -Total oilseeds (*) 959.2 831.6 840.7 862.9Tea 4.0 - -Banana - 30.0 20.0 -
Potato - 51.1 47.0 -
Ginger 53.2 53.9 - - Turmeric 34.3 34.9 - -
Sources: Directorate of Economics and Statistics, Ministry of Agriculture, Ministry of Agriculture Govt. of
India (Statistical Year Book, India 2015).
http://mospi.nic.in/Mospi_New/upload/SYB2015/ch8.html (accessed on 04.01.2016)
Table 7.7: Gross State Domestic Product
(GSDP)
from Agriculture and Allied Sector at
Constant (2004-05) Prices
(Rs Lakh)
Year
GSDP
2004-05
32325
2005-06
33660
2006-07 33690
2007-08 35009
2008-09 36510
2009-10 38056 2010-11
39904
2011-12
55212
2012-13
56405
2013-14
58307
61
State at a Glance: Sikkim, Vol. 1(4), 2015
ENVIS Centre on Himalayan Ecology

Table 7.9: Area Irrigated by Crops
(‘000 ha)
Source:
Directorate of Economics and Statistics, Department of Agriculture and Cooperation and Farmers
Welfare, Ministry of Agriculture and Farmers Welfare, Govt. of India . http://eands.dacnet.nic.in/Default.htm (accessed on 04.01.2016)
Crops
2003-04
2004-05
2005-06
2006-07
2007-08
2008-09
2009-10
2010-11
2011-12
2012-13
Rice
8
8
13
13
12
12
11
10
10
10
Maize
0
0
1
1
1
1
1
1
1
1
Wheat
1
1
1
1
1
0
0
0
Total Food-grains
9
9
15
15
15
15
14
13
12
12
Condiments & Spices
2
2
1
1
1
1
1
1
1
1
Fruits &
Vegetables (including root crops)
1
1
1
1
1
1
4
6
5
6
Total Food Crops
11
11
17
17
16
17
18
19
18
19
Rape-
seed & Mustard
1
1
1
1
1
1
1
1
Total Oilseeds
1
1
1
1
1
1
1
1
Total Non-Food Crops
1 1 1 1 1 1 1 1
Total Irrigated Area under all crops
11 11 19 19 17 18 20 20 19 19
Table 7.8: Share of Agriculture and Allied Sector in Gross State Domestic Product (GSDP) at Current Prices
(Rs Lakh)
Share of Agriculture GSDP 2011-12 2012-13 2013-14
GSDP from Agriculture and Allied
100053
110243
124798
% Share of Agriculture and Allied in
Total GSDP
11.23
10.53
10.08
% Growth over Previous Year
-
10.19
13.20
Notes: Agriculture and Allied includes Agriculture, Forestry, Logging and Fishing. Source:
(Tables 7.7-7.8):
Central Statistics Office (CSO). (Agricultural Statistics at a Glance, 2014)
http://eands.dacnet.nic.in/PDF/Agricultural-Statistics-At-Glance2014.pdf (accessed on 10.12.2015)
62
State at a Glance: Sikkim, Vol. 1(4), 2015
ENVIS Centre on Himalayan Ecology

Table 7.10: National Agricultural Insurance Scheme (NAIS) (Cumulative up to Kharif 2014)
(Rs in lakh)
Details
Values
No. of Farmers Covered
1894
Area Insured (in Ha)
1323.95
Sum Insured
254.03
Farmers’ Premium
3.25
State Government Premium (Share)
0.28
GoI Premium (Share)
0.28
Gross Premium
3.80
Claims Reported
1.28
Claims Paid 1.28
No. of Farmers Benefi ted
86
Note: Kharif 2014 statistics is provisional.Source: Department of Agriculture and Cooperation, Credit Division, Govt. of India (Agricultural Statistics at a
Glance, 2014).
Table 7.11: Kisan Credit Cards Issued
http://eands.dacnet.nic.in/PDF/Agricultural-Statistics-At-Glance2014.pdf (accessed on 10.12.2015)
(up to 31 March 2014)
Name of Bank
Card Issued (in No.)
Cooperative Banks
6118
Regional Rural Banks
0
Commercial Banks
10963
Total 17081
Table 7.12: Classification of Workers (2011)
Classification of Workers
Total
Rural
Urban
Total Population
Total Working Population Total Main Workers
Total Marginal Workers
Total Non-workers
Male Population
Male Working Population
Male Main Workers
Female Population
Female Working Population
Female Main Workers
610577
308138 230397 77741
302439
323070
194358
160513
287507
113780
69884
456999
243785 173682 70103
213214
242797
148186
119014
214202
95599
54668
153578
64353 56715 7638
89225
80273
46172
41499
73305
18181
15216
63
State at a Glance: Sikkim, Vol. 1(4), 2015
ENVIS Centre on Himalayan Ecology

Table 7.14:
Details of Operational Holdings by Size Groups (2010-2011)
(in ha)
Holdings by Size Group
Operational Holdings by
Size Group
(in No.)
Area of Operational Holdings by Size Group
Average Size of Holdings by Size
Group
Marginal
Small
Semi-medium
Medium
Large
All Holdings
4047616941
10809
5922
780
74928
0.371.202.495.4415.771.42
Note: Totals may not tally due to rounding off.
1481120397
26932
32238
12304
106683
Table 7.15: Details of Agricultural Households
Agricultural Households and Indebted Number
Estimated Number of Rural Households ('00) 1150
Estimated Number of Agricultural Households ('00) 674
Estimated Number of Agricultural Households Having Loan ('00) 97
% of Agricultural Households Indebted 14.4
Source:
Directorate of Economics and Statistics, Ministry of Agriculture and Farmers Welfare, Govt. of India
(Statistics at a Glance 2014).
http://eands.dacnet.nic.in/PDF/Agricultural-Statistics-At-Glance2014.pdf (accessed on 10.12.2015)
Table 7.13: Classification of Cultivators
(2011)
Classification of Cultivators
Total
Rural
Urban
Cultivators (Main and Marginal)
117401 116532
Agricultural Labourers (Main and
Marginal)
25986 24880
Male Cultivators (Main and Marginal)
63327 62869
Male Agricultural Labourers (Main and
Marginal)
12883 12297
Female Cultivators (Main and
Marginal)
54074
53663
Female Agricultural
Labourers (Main
and Marginal)
13103
12583
869
1106
458
586
411
520
Source (Tables 7.11 to 7.13): Registrar General of India, Govt. of India (Agricultural Statistics at a Glance, 2014).
http://eands.dacnet.nic.in/PDF/Agricultural-Statistics-At-Glance2014.pdf (accessed on 10.12.2015)
Source: Department of Agriculture and Cooperation, Credit Division, Govt. of India (Agricultural Statistics at a Glance 2014).
64
State at a Glance: Sikkim, Vol. 1(4), 2015
http://eands.dacnet.nic.in/PDF/Agricultural-Statistics-At-Glance2014.pdf (accessed on 10.12.2015)
ENVIS Centre on Himalayan Ecology

Table 7.17: Fish Seed Production (in '000 tonnes)
Year Fish Seed Production
2002-03 2003-04 2004-05 2005-06 2006-07 2007-08 2008-09 2009-10 2010-11 2010-12 2012-13 2013-14(P)
0.14 0.14 0.14 0.15 0.15 0.18 0.17 0.17 0.18 0.28 0.49 0.42
P: Provisional Source: Director of Fisheries State Govt. / UT Administrations (Handbook on Fisheries Statistics 2014).
http://dahd.nic.in/dahd/statistics/fisheries.aspx (accessed on 07.12.2015)
Table 7.16: Production of Fish
(in tonnes)
Fish
2011-12
2012-13
Marine
0
0
Inland
280
490
Total
280
490
Source:
Department of Animal Husbandry, Dairying & Fisheries, Govt. of India
(Agricultural Statistics at a
Glance 2014).http://eands.dacnet.nic.in/PDF/Agricultural-Statistics-At-Glance2014.pdf (accessed on 07.12.2015)
65
State at a Glance: Sikkim, Vol. 1(4), 2015
ENVIS Centre on Himalayan Ecology


Horticulture
List of Tables
8.1: Area, Production and Productivity of Fruits in Sikkim
8.2: Area, Production and Productivity of Vegetables
8.3: Area and Production of Flowers
8.4: Area, Production & Productivity of major spices
8.5: Area and Production of Various Horticultural Crops
8.6: Area and Production of major Fruits
8.7: Area and Production of major Vegetables
67
State at a Glance: Sikkim, Vol. 1(4), 2015
ENVIS Centre on Himalayan Ecology

Table 8.1:
Area, Production and Productivity of Fruits
in Sikkim
Year
Productivity
(in mt/ha)
2009-10
2010-11
Area (in 000' ha)( i n 000’ha)
Production(in 000’mt)
2011-12
2012-13
2013-14
12.217.513.4
14.7
16.0
18.525.822.5
24.0
24.1
1.51.51.71.61.5
Table 8.2:
Area, Production and Productivity of Vegetables
Year
Area
(in 000’ha) Production
(in 000’mt) Productivity
(in mt/ha)
2009-10
2010-11
2011-12
2012-13
2013-14
28.7
23.9
25.0
25.6
26.1
147.7120.9
127.7
132.5
134.5
5.15.15.15.25.2
Table 8.3: Area and Production of Flowers
Year Area (in 000 ha)
Production (Loose in 000 mt and Cut in lakh Nos)
Loose Cut 2009-10
2010-11
2011-12 2012-13 2013-14
0.2
0.2 0.2 0.0 0.2
-
- 25.95
26.50 16.00
200.0230.0209.1214.11.9
Table 8.4:
Area, Production & Productivity of major spices
Year
Area ( in 000’ ha)
Production
(in 000’ mt)
Productivity
(mt/ha)
2009-10
2010-11
2011-12
2012-13
2013-14
7.8
0.9
24.4
54.42.2
7.8
0.9
26.6
60.12.3
52.4
2.1
32.1
55.81.7
Source
(Tables 8.1-8.4):
National Horticulture Board, Ministry of Agriculture and Farmers Welfare, Govt. of
India
(Indian Horticulture Database- 2008, 2010, 2011, 2013 & 2014).
http://nhb.gov.in/Default.aspx (accessed on 07.01.2016)
68
State at a Glance: Sikkim, Vol. 1(4), 2015
ENVIS Centre on Himalayan Ecology

Table 8.5:
Area and Production of various Horticultural Crops
(Area in 000’ ha; Production in 000’ mt)
Name of Crops
2006-07
2009-10
2010-11
2012-13
2013-14
Fruits
Area
9.0
12.2
17.5
14.65
16.02
Production
13.41
18.5
25.8
24.02
24.05
Vegetable
Area
17.84
28.7
23.9
25.56
26.11
Production
80.81
147.7
120.9
132.51
134.53
Flowers
Area
0.1
0.2
0.2
0.22
0.24
Production
Loose
0.1
-
-
26.50
16.00
Cut
17.0
200.
230.0
214.10
1.88
Aromatic
Area
-
-
-
0.0
-
Production
-
-
-
0.0
-
Spices
Area
34.0
26.6
24.4
26.56
32.06
Production
41.9
41.7
52.4
60.08
55.80
Plantation
Area
0.0
0.0
0.0
0.0
0.0
Production
0.0
0.0
0.0
0.0
0.0
Total
Area
60.9
67.6
65.9
67.00
74.43
Production 136.2 20.7 199.1 243.11 232.26
Table 8.6: Area and Production of major Fruits
(Area in 000’ ha ; Production in 000’mt)
Name of Fruits 2006-07 2009-10 2010-11 2012-13 2013-14 Apple
Area
0.0
0.0
0.0
0.0
0.02
Production
0.0
0.0
0.0
0.0
0.03 Banana
Area
0.0
1.6
1.7
0.04
1.63
Production
0.3
3.2
3.4
0.89
3.89
Grapes
Area
-
-
-
0.02
-
Production
-
-
-
0.28
-
Guava
Area
-
0.9
1.0
5.40
1.10
Production
-
0.1
0.1
74.80
0.11
Litchi
Area
-
0.2
0.2
-
0.32
Production
-
0.0
0.0
-
0.03
Mango
Area
-
-
-
5.00
-
Production
-
-
-
70.17
-
Papaya
Area
-
-
-
0.90
-
Production
-
-
-
16.01
-
Citrus
Area
5.55
7.9
8.3
24.71
10.28
Production
9.25
13.1
14.4
455.59
16.86
Pineapple
Area
-
-
-
-
-
Production
-
-
-
-
-
Pomegranate
Area
-
-
-
1.01
-
Production
-
-
-
5.50
-
Sapota
Area
-
-
-
0.02
-
Production
-
-
-
0.08
-
Total Fruits
Area
9.0
12.2
17.5
46.52
16.02
Production
13.41
18.5
25.8
716.82
24.05
Source (Tables 8.5-8.6): National Horticulture Board, Ministry of Agriculture and Farmers Welfare, Govt. of India (Indian Horticulture Database- 2008, 2010, 2011, 2013 & 2014).http://nhb.gov.in/Default.aspx (accessed on 07.01.2016)
(Area in 000' ha; production in 000' mt)
(Area in 000' ha; production in 000' mt)
69
State at a Glance: Sikkim, Vol. 1(4), 2015
ENVIS Centre on Himalayan Ecology

Table 8.7: Area and Production of major Vegetables
(Area in 000’ ha; Production in 000’mt)
Source: National Horticulture Board, Ministry of Agriculture and Farmers Welfare, Govt. of India.
(Indian Horticulture Database- 2008, 2010, 2011, 2013 & 2014) http://nhb.gov.in/Default.aspx (accessed on 07.01.2016)
Name of Vegetables 2006-07 2009-10 2010-11 2012-13 2013-14
Brinjal Area 0.1 0.3 0.3 0.26 0.26
Production 0.5 1.6 1.6 1.66 1.68
Cabbage Area 1.0 1.2 1.2 1.21 1.21
Production 5.8 7.0 6.9 7.25 7.34
Cauliflower Area 0.5 0.8 0.7 0.78 0.78
Production 2.0 3.9 3.9 4.17 4.23
Okra Area 0.08 1.0 1.1 1.13 1.13
Production 0.3 6.5 7.2 7.46 7.52
Onion Area 0.08 0.3 0.3 0.32 0.32
Production 0.37 1.7 1.6 1.71 1.72
Peas Area 1.6 1.8 2.0 2.00 2.02
Production 9.7 7.7 8.6 9.15 9.27
Potato Area 7.6 9.1 9.4 10.06 10.24
Production 33.3 44.3 45.7 49.14 49.86
Sweet Potato Area 0.11 - - - -
Production 0.59 - - - -
Tapioca Area 0.36 - - - -
Production 1.63 - - - -
Tomato Area 0.1 0.6 0.9 1.00 1.01
Production 0.4 4.1 8.1 8.96 9.08
Total Area 17.83 13.7 23.9 25.56 26.11
Production 80.81 70.9 120.9 132.51 -
70
State at a Glance: Sikkim, Vol. 1(4), 2015
ENVIS Centre on Himalayan Ecology

Livestock
List of Tables
9.1: Livestock Population in Sikkim
9.2: Details of Bovines by Sex
9.3: Details of Cattle by Age, Sex and Use in Rural and Urban Combined
9.4: Estimates of Milk, Egg & Wool Production
9.5: Share of Milk Production by Cows and Buffaloes
9.6: Per Capita Availability of Milk
9.7: Per Capita Availability of Eggs
9.8: Details of Backyard Poultry in Rural and Urban Combined for Fowls
9.9: Details of Backyard Poultry in Rural and Urban Combined for Ducks
9.10: Details of Backyard Poultry in Rural and Urban Combined for Turkeys
9.11: Details of Poultry Farms / Hatcheries and Poultry Birds in Farms / Hatcheries in
Rural and Urban Combined
9.12: Number of Households and Households Enterprises owning Animals/Poultry Birds in
Rural and Urban Combined
9.13: Estimates of Meat Production
9.14: Estimate of Meat Production from Goats
9.15: Details of Veterinary Institutions
9.16: Artificial Inseminations Performed
9.17: Animals Insured under Livestock Insurance Scheme of Department of Animal
Husbandry Dairying & Fisheries (DADF)
9.18: Estimates of major Livestock Products
9.19: Marketing details of Milk and Milk products
71
State at a Glance: Sikkim, Vol. 1(4), 2015
ENVIS Centre on Himalayan Ecology

Table 9.1: Livestock Population in Sikkim
(in ‘000)
Year
Cattle
Buffalos
Goats
Sheep
Pigs
Horse
&
Ponies
Yaks
Total Livestock
CB
ND
Total
2003
80
79
159
2
124
6
38
2.00
7
338
2007
72.97
61.90
134.87
0.24
92.00
2.54
35.25
0.00
5.23
270.13
2012
126.52
13.95
140.47
0.70
113.36
2.63
29.91
511.00
4.04
802.11
CB-
Crossbred, ND-
Nondescript
Table 9.2: Details of Bovines by Sex
District
Male
Female
Total
East
13874
33141
47015
North 5684 12030 17714
South 12245 24968 37213
West 13220 30044 43264
Total 45023 100183 145206
Table 9.3: Details of Cattle by Age, Sex and Use in Rural and Urban Combined
District
Exotic / Crossbred Cattle Male
Up to 1.5
Years
Over 1.5 Years
Total Male
Used for
Breeding
only
Used for
Draught only
Used for both
Draught and
Breeding
Others
East
5606
615
6064
625
28
12938 North
1360
179
267
220
39
2065
South
5074
274
4801
1054
69
11272
West
5209
539
4453
1564
213
11978
Total
17249
1607
15585
3463
349
38253
Source
(Tables 9.1-9.3): Department of Animal Husbandry Dairying & Fisheries, Ministry of Agriculture & Farmers
Welfare,
Govt.
of India (19th
Livestock Census 2012).
http://dahd.nic.in/dahd/statistics/animal-husbandry-statistics-division/volume.aspx (accessed on 07.12.2015)
72
State at a Glance: Sikkim, Vol. 1(4), 2015
ENVIS Centre on Himalayan Ecology
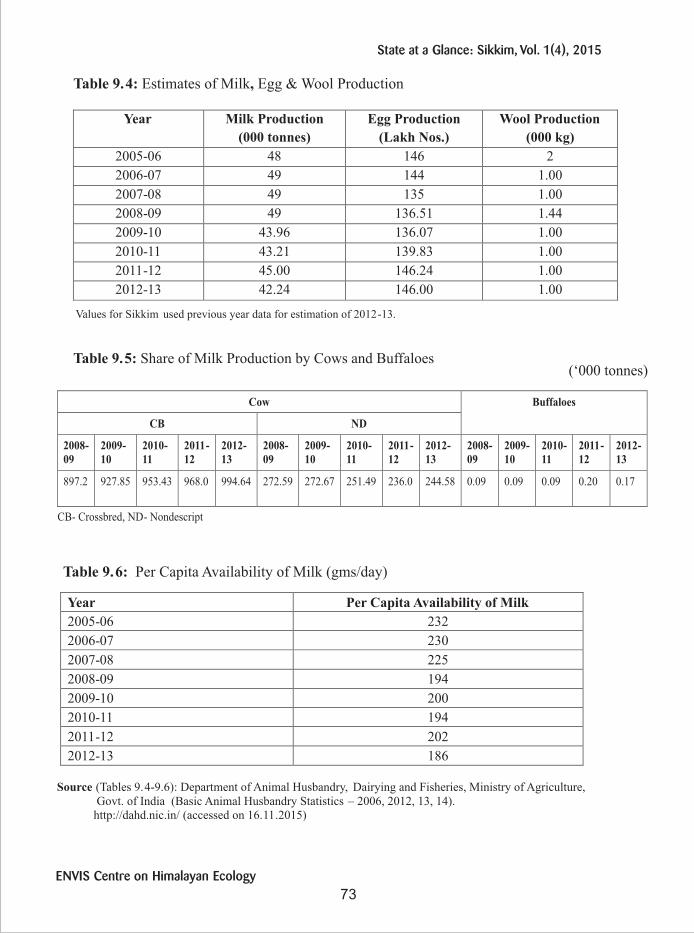
Table 9.4: Estimates of Milk, Egg & Wool Production
Year
Milk Production
(000 tonnes)
Egg Production
(Lakh Nos.)
Wool Production
(000 kg)
2005-06
48
146
2
2006-07
49
144
1.00
2007-08
49
135
1.00
2008-09
49
136.51
1.44
2009-10
43.96
136.07
1.00
2010-11
43.21
139.83
1.00
2011-12
45.00
146.24
1.00
2012-13
42.24
146.00
1.00
Values for Sikkim used previous year data for estimation of 2012-13.
Table 9.5: Share of Milk Production by Cows
and Buffaloes
(‘000 tonnes)
Cow
Buffaloes
CB
ND
2008-09 2009-
10 2010-
11 2011-
12 2012-
13 2008-
09 2009-10
2010-11
2011-12
2012-13
2008-09
2009-10
2010-11
2011-12
2012-13
897.2
927.85
953.43 968.0
994.64
272.59
272.67
251.49
236.0
244.58
0.09
0.09
0.09
0.20 0.17
CB-
Crossbred, ND- Nondescript
Table 9.6: Per Capita Availability of Milk (gms/day)
Year
Per Capita Availability of Milk
2005-06
232
2006-07
230
2007-08
225
2008-09
194
2009-10 200
2010-11 194
2011-12 202
2012-13 186
Source (Tables 9.4-9.6): Department of Animal Husbandry, Dairying and Fisheries, Ministry of Agriculture, Govt. of India (Basic Animal Husbandry Statistics – 2006, 2012, 13, 14). http://dahd.nic.in/ (accessed on 16.11.2015)
73
State at a Glance: Sikkim, Vol. 1(4), 2015
ENVIS Centre on Himalayan Ecology

Table 9.7: Per Capita Availabilit y of Eggs (No./Annum)
Source: Department of Animal Husbandry, Dairying and Fisheries, Ministry of Agriculture, Govt .
of
India (Basic Animal Husbandry Statistics –
2006, 2012, 13, 14).
http://dahd.nic.in/
(accessed on 16.11.2015)
Table 9.8: Details of Backyard Poultry in Rural and Urban Combined for Fowls
District
Cocks
Hens
Desi
Improved
Total
Desi
Improved
Total
East
19979
4195
24174
36590
6209
42799
North
5685
199
5884
10109
763
10872
South
16352
11131
27483
24874
10651
35525
West
19527
6379
25906
33396
4838
38234
Total
61543
21904
83447
104969
22461
127430
Table 9.9: Details of Backyard Poultry in Rural and Urban Combined for Ducks
District
Drakes
Ducks
Desi
Improved
Total
Desi
Improved
Total
East
64
8
72
78
6
84
North
26
0
26
52
5
57
South
49
1
50
49
2
51
West
3
1
4
403
1
404
Total
142
10
152
582
14
596
Source
(Tables 9.8-9.9):
Department of Animal Husbandry Dairying & Fisheries, Ministry of Agriculture & Farmers
Welfare, Govt.
of India (19th
Livestock Census 2012).
http://dahd.nic.in/dahd/statistics/animal-husbandry-statistics-division/volume.aspx (accessed on 07.12.2015)
Year Per Capita Availability of Eggs 2004-05 25 2005-06
24
2006-07
25
2007-08
23
2008-09
23 2009-10
23
2010-11
23 2011-12
24
2012-13
23
74
State at a Glance: Sikkim, Vol. 1(4), 2015
ENVIS Centre on Himalayan Ecology

Table 9.10: Details of Backyard Poultry in Rural and Urban Combined for Turkeys
District
Turkeys Quails
Other Poultry
Birds
Total Poultry
Birds Male Female Total
East
North
South
West
Total
0
0
0
0
0
1
0
3
0
4
1
0
3
0
4
0
0
0
0
0
0
0
4
0
4
117829
31045
175499
107891
432264
Table 9 .11 : Details of Poultry Farms / Hatcheries and Poultry Birds in Farms / Hatcheries in Rural and Urban Combined
District Number of Birds in Farms / Hatcheries
Layer Broiler Duck Others* East 2102 4000 0 0 North 0 0 0 0 South 0 13600 0 0 West 0 0 0 0 Total 2102 17600 0 0
*Others include Turkey, Emu, Ostrich , etc.
Table 9.12: Number of Households and Households Enterprises owning Animals/Poultry Birds in Rural and Urban Combined
District
Number of Households and Households Enterprises Having
Cattle
Buffaloes
Goats
Sheep
Pigs
Backyard
Poultry
Poultry Farm
& Hatcheries
East 17112 16 8482 45 4371 11168 1
North 3559 1 2261 9 1928 3466 1
South 14026 15 7152 120 4718 10119 12
West 16325 339 10391 368 6945 15385 3
Total 51022 371 28286 542 17962 40138 17
Source (Tables 9.10-9.12): Department of Animal Husbandry Dairying & Fisheries, Ministry of Agriculture & Farmers
Welfare, Govt. of India (19th
Livestock Census 2012).
http://dahd.nic.in/dahd/statistics/animal-husbandry-statistics-division/volume.aspx (accessed on 07.12.2015)
75
State at a Glance: Sikkim, Vol. 1(4), 2015
ENVIS Centre on Himalayan Ecology

Table 9.13: Estimates of Meat Production
(‘000 tonnes)
Year
Meat Production*
2008-09
0.89
2009-10
3.02
2010-11
3.02
2011-12
3.00
2012-13
3.00
*Meat production from recognized sectors
Table 9.14: Estimate of Meat Production
from Goats
Year
Estimated Number of Animals Slaughtered
(‘000)
Average Annual Yield/Animal
(No.)
Meat
Production
(‘000 Tonnes)
2009-10
3.50
12.00
0.04
2010-11
3.50
12.00
0.04
2011-12 4.00 12.00 0.04
2012-13 4.00 12.00 0.05
Table 9.15: Details of Veterinary Institutions
(in Nos.) Veterinary Institutions
2012
2014
Veterinary Hospitals/Polyclinics
14
14
Veterinary Dispensaries
40
40
Veterinary Aid Centre (Stockmen Centers/ Mobile Dispensaries)
62
62
Table 9.16: Artificial Inseminations Performed
(‘000 Nos.)
Year
Artificial Inseminations
2010-11
10
2011-12
-
2012-13
-
2013-14
-
-
Data not reported/ not applicable
Source (Tables 9.13-9.16): Department of Animal husbandry, Dairying and Fisheries, Ministry of Agriculture,
Govt.
of India (Basic Animal Husbandry and Fisheries, 2010, 2014).
http://dahd.nic.in/ (accessed on 16.11.2015)
76
State at a Glance: Sikkim, Vol. 1(4), 2015
ENVIS Centre on Himalayan Ecology

Table 9.17: Animals Insured under Livestock Insurance Scheme of Department of Animal Husbandry Dairying & Fisheries (DADF)
Year Number of Animals Insured
2006-07 2310
2007-08 2013
2008-09 313
2009-10 1386
2010-11 1446
2011-12 565
2012-13 389
Table 9.18: Estimates of major Livestock Products
Year Milk
(‘000 MT)
Egg
(Lakh Nos.)
Meat
(‘000 MT)
Wool
(‘000 KG)
2013-14 (P) 45.99
99.35
3.00
1.00
P=Provisional Source (Tables 9.17-9.18): Department of Animal Husbandry, Dairying and Fisheries, Ministry of Agriculture, Govt.
of India (Basic Animal Husbandry and Fisheries Statistics 2013, 2014). http://dahd.nic.in/ (accessed on 18.11.2015)
Table 9.19: Marketing details of Milk and Milk products (in kgs.)
Detail 2006-07 2007-08 2008-09 2009-10 2010-11Liquid Milk in '000 Lts 3610 3395 4288 4139 4334 Butter (kgs.) 22513 14011 10370 8277 13831 Paneer (kgs.) 13310 18064 12579 25145 11635 Chhurpi (kgs.) 4564 3191 5131 4008 4848 Curd (kgs.) 52167 30100 54420 59567 76320 Cream (kgs.) 27686 16630 251 8639 14180 Source: Department of Animal Husbandry Livestock, Fisheries & Veterinary Services, Govt. of India (Annual Report 2010-11).
http://www.sikkim-ahvs.gov.in/pdf/Annual_Report_2010 -2011.pdf (accessed on 07.12.2015)
77
State at a Glance: Sikkim, Vol. 1(4), 2015
ENVIS Centre on Himalayan Ecology

Forest
List of Tables
10.1: Forest Cover within Green Wash in Sikkim
10.2: Growing Stock
10.3: Forest Cover Change Matrix
10.4: Altitude-wise Forest Cover
10.5: Sikkim’s Biodiversity at a Glance
10.6: Area under Forest Cover
10.7: Recorded Forest Area
10.8: District-wise Forest Cover
10.9: Forest Cover
10.10: Forest Cover in Tribal Districts & Forest Cover in the North Eastern States
10.11: Tree Cover Estimate
10.12: Revenue realized by Forest, Environment & Wildlife Management Department,
10.13: Out of Turn Forest Resources
10.14: Value of Minor Forest Products Produce during last three years
10.15: State Green Mission- Total Saplings Planted under State Green Mission
10.16: National Park, Sanctuary and Forest Park National Parks and Sanctuaries
10.17: Wildlife Protected Areas
79
State at a Glance: Sikkim, Vol. 1(4), 2015
ENVIS Centre on Himalayan Ecology

80
State at a Glance: Sikkim, Vol. 1(4), 2015
,
,2015).
ENVIS Centre on Himalayan Ecology

81
State at a Glance: Sikkim, Vol. 1(4), 2015
,
ENVIS Centre on Himalayan Ecology

82
State at a Glance: Sikkim, Vol. 1(4), 2015
,
ENVIS Centre on Himalayan Ecology

83
State at a Glance: Sikkim, Vol. 1(4), 2015
ENVIS Centre on Himalayan Ecology

84
State at a Glance: Sikkim, Vol. 1(4), 2015
ENVIS Centre on Himalayan Ecology

85
State at a Glance: Sikkim, Vol. 1(4), 2015
ENVIS Centre on Himalayan Ecology
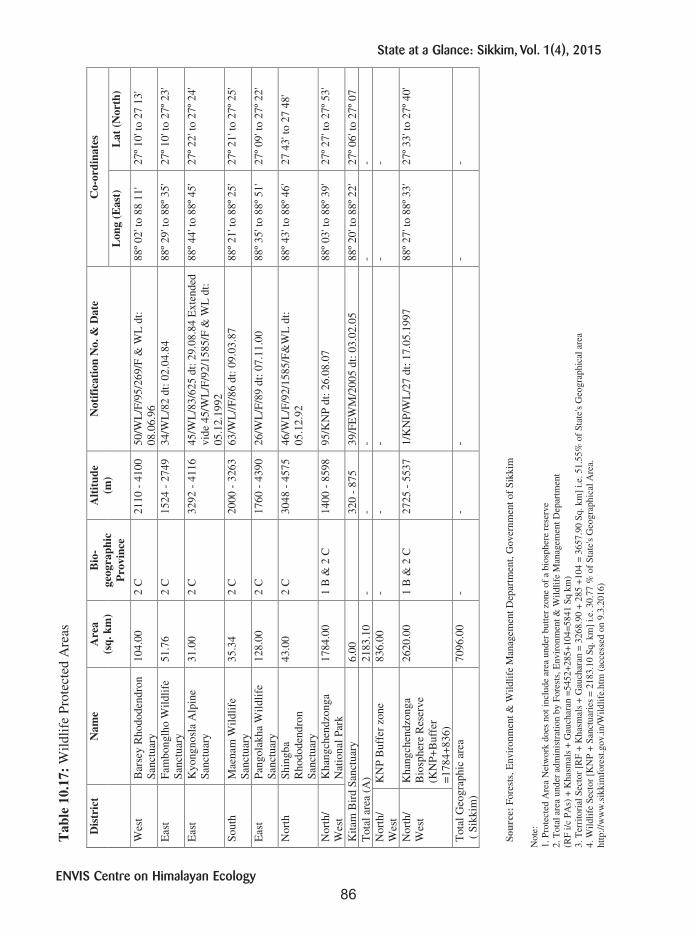
86
State at a Glance: Sikkim, Vol. 1(4), 2015
ENVIS Centre on Himalayan Ecology

Minerals and Petroleum
List of Tables
11.1: Value of Mineral Production in Sikkim
11.2: Value of Mineral Production by Mineral Groups
11.3: Production of Minerals and Ores by Selected Items
87
State at a Glance: Sikkim, Vol. 1(4), 2015
ENVIS Centre on Himalayan Ecology

Table 11.1: Value of Mineral Production (Excluding Atomic Minerals) in Sikkim
Year Value (in Rs. ‘000)
2005-06 37258
2006-07 13436
2007-08 9050
2008-09 18787
2009-10 18787
2010-11 18787
2011-12 18787
2012-13 (P) 18787
P: Provisional
Table 11.2: Value of Mineral Production (Excluding Atomic Minerals) by Mineral Groups
(in Rs. ‘000)
Year 2011-12 2012-13 (P)
Fuel Minerals - -
Metallic Minerals - -
Non-metallic Minerals - -
Minor Minerals 18787 18787
P: Provisional
Table 11.3: Production of Minerals and Ores by Selected Items
(Rs '000) Year 2009-10 2010-11 2011-12 2012-13(R) 2013-14 (P)
All minerals Value 18787 18787 18787 0 18787
Minor Minerals (Value) 18787 18787 18787 18787 18787
P: Provisional
Source (Tables 11.1-11.3) : Ministry of Mines, Govt. of India (Indian Mineral Year Book, 2008, 2011, 2012, 2013). http://ibm.gov.in/index.php?c=pages&m=index&id=107&mid=18255 (accessed on 17-11-2015)
88
State at a Glance: Sikkim, Vol. 1(4), 2015
ENVIS Centre on Himalayan Ecology

Industry
List of Tables
12.1: Inventory of Geological Resources of Coal in Sikkim
12.2: Gross Domestic Product by Industry of Origin
12.3: Annual Survey of Industries (Factory Sector)
12.4: Production of Raw Silk and Silk Yarn
12.5: Per Capita Net Domestic Product
89
State at a Glance: Sikkim, Vol. 1(4), 2015
ENVIS Centre on Himalayan Ecology

Table 12.1: Inventory of Geological Resources of Coal in Sikkim
(Quantity in Million Tonnes)
Resources 2010 2011 2012 2013 2014 0 0 0 0 0
58 58 58 58 58 13 43 43 43 43
Proved IndicatedInferred Total 101 101 101 101 101
Data may not add up to respective total due to rounding off. Source: Geological Survey of India. Ministry of Coal, Govt.
of India (
Provisional Coal Statistics 2011-
12, 2012-13, 2013-14).
http://coal.nic.in/search/node/PROVISIONAL%20COAL%20STATISTICS (accessed on 17.02.2016)
Table 12.2: Gross Domestic Product by Industry of Origin (at 2004-05 Prices)
Particulars
2004-05
2005-06
2006-07
2007-08
2008-09
2009-10
2010-11
2011-12
2012-13
2013-14(P)
Actu
al
fig
ure
Rs.
Cro
re a
t 200
4-0
5 C
onst
ant
Pri
ces
GSDP (2004-05 Prices)
1,739
1,909
2,024
2,178
2,535
4,401
4,784
5,299
5,703 6,152
Agriculture and Allied
323
337
337
350
365
381
399
552
564 583
Agriculture
285
298
299
313
330
346
365
516
528 546Industry
502
561
600
660
890
2426
2833
3137
3409 3728Mining & Quarrying
2
2
2
2
4
4
5
7
12
15
Manufacturing
67
69
74
85
93
1252
1777
2013
2017 2074Services
914
1012
1087
1168
1280
1594
1552
1610
1730 1841
% S
hare
to
Tota
l G
SD
P a
t C
on
stan
t 2
00
4-0
5 P
rices
GSDP (2004-05 Prices)
100.00
100.00
100.00
100.00
100.00
100.00
100.00
100.00
100.00 100.00
Agriculture and Allied
18.59
17.63
16.65
16.07
14.40
8.65
8.34
10.42
9.89 9.48
Agriculture
16.39
15.63
14.77
14.37
13.02
7.85
7.62
9.74
9.25 8.88
Industry
28.84
29.37
29.65
30.29
35.09
55.13
59.23
59.19
59.77 60.60
Mining & Quarrying
0.12
0.11
0.11
0.11
0.15
0.10
0.10
0.14
0.20 0.24
Manufacturing
3.86
3.60
3.66
3.90
3.65
28.44
37.15
37.98
35.37 33.71
Services
52.58
53.03
53.70
53.65
50.51
36.22
32.44
30.39
30.34 29.93
P= Provisional
Source: Planning Commission, Govt. of India.http://planningcommission.nic.in/data/datatable/data_2312/comp_data2312.pdf (accessed on 12.02.2016)
90
State at a Glance: Sikkim, Vol. 1(4), 2015
ENVIS Centre on Himalayan Ecology
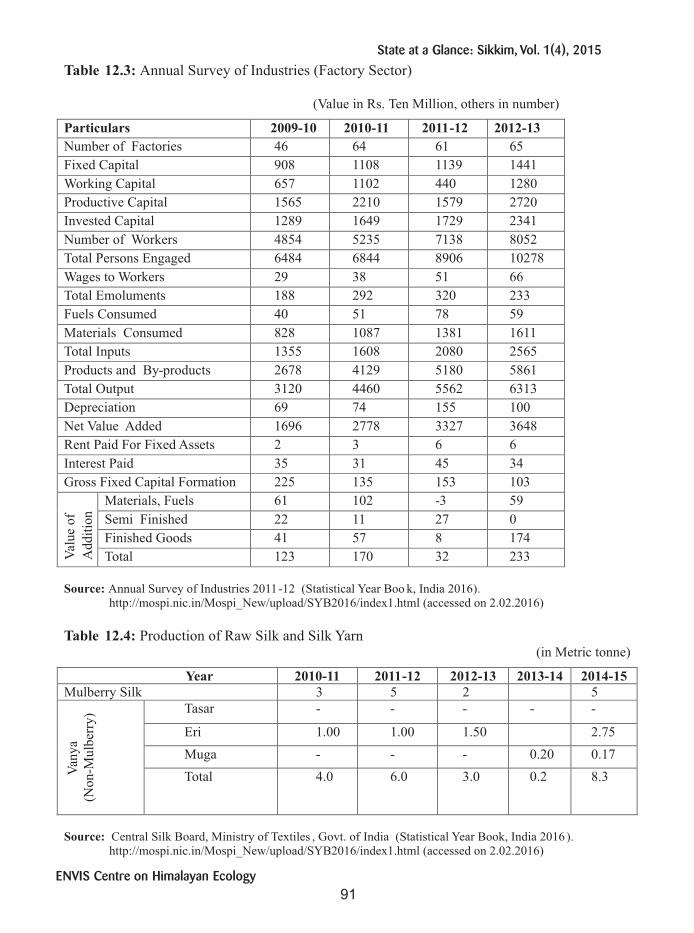
Table 12.3: Annual Survey of Industries (Factory Sector)
(Value in Rs. Ten Million, others in number)
Particulars
2009-10
2010-11
2011-12
2012-13
Number of Factories
46
64
61
65
Fixed Capital
908
1108
1139
1441
Working Capital
657
1102
440
1280
Productive Capital
1565
2210
1579
2720
Invested Capital
1289
1649
1729
2341
Number of Workers
4854
5235
7138
8052
Total Persons Engaged
6484
6844
8906
10278
Wages to Workers
29
38
51
66
Total Emoluments 188 292 320 233
Fuels Consumed 40 51 78 59
Materials Consumed 828 1087 1381 1611
Total Inputs 1355 1608 2080 2565
Products and By-products 2678 4129 5180 5861
Total Output 3120 4460 5562 6313
Depreciation 69 74 155 100 Net Value Added 1696 2778 3327 3648 Rent Paid For Fixed Assets 2 3 6 6 Interest Paid 35 31 45 34 Gross Fixed Capital Formation 225 135 153 103
Val
ue o
f
Add
itio
n
Materials, Fuels
61
102
-3
59
Semi Finished
22
11
27
0
Finished Goods
41
57
8
174
Total
123
170
32
233
Source:
Annual Survey of Industries 2011-12 (Statistical Year Boo k, India 2016).
http://mospi.nic.in/Mospi_New/upload/SYB2016/index1.html (accessed on 2.02.2016)
Table 12.4: Production of Raw Silk and Silk Yarn
(in Metric tonne)
Year
2010-11
2011-12
2012-13
2013-14
2014-15
Mulberry Silk
3
5
2
5
Van
ya
(Non
-Mul
berr
y)
Tasar
-
-
-
-
-
Eri
1.00
1.00
1.50
2.75
Muga
-
-
-
0.20
0.17
Total
4.0
6.0
3.0
0.2
8.3
Source:
Central Silk Board, Ministry of Textiles , Govt. of India (Statistical Year Book, India 2016 ).
http://mospi.nic.in/Mospi_New/upload/SYB2016/index1.html (accessed on 2.02.2016)
91
State at a Glance: Sikkim, Vol. 1(4), 2015
ENVIS Centre on Himalayan Ecology
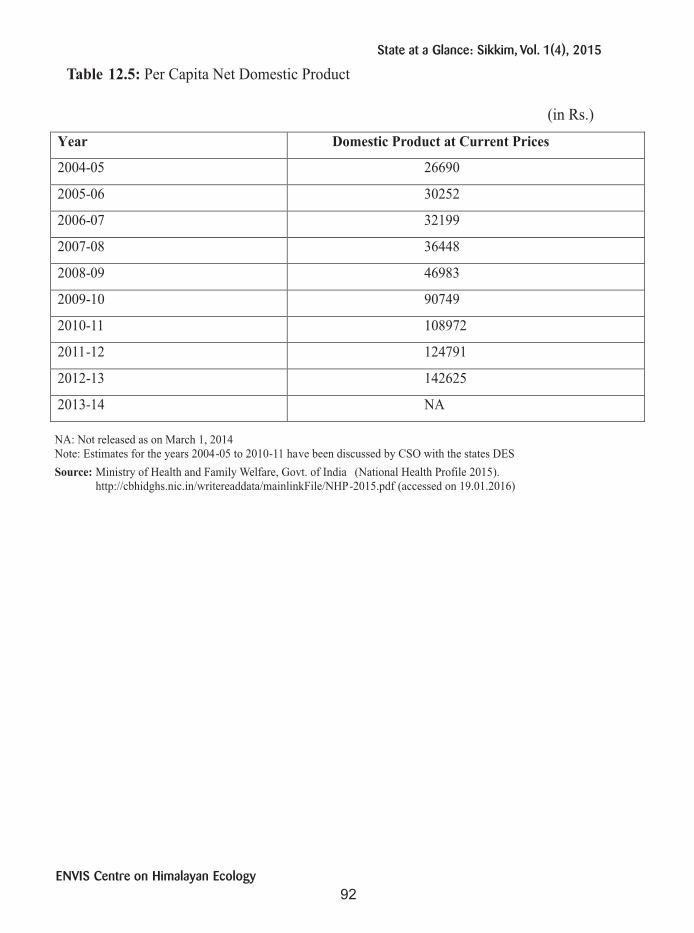
Table 12.5: Per Capita Net Domestic Product
(in Rs.)
Year Domestic Product at Current Prices
2004-05 26690
2005-06 30252
2006-07 32199
2007-08 36448
2008-09 46983
2009-10 90749
2010-11 108972
2011-12 124791
2012-13 142625
2013-14 NA
NA: Not released as on March 1, 2014 Note: Estimates for the years 2004-05 to 2010-11 have been discussed by CSO with the states DES
Source: Ministry of Health and Family Welfare, Govt. of India (National Health Profile 2015).
http://cbhidghs.nic.in/writereaddata/mainlinkFile/NHP-2015.pdf (accessed on 19.01.2016)
92
State at a Glance: Sikkim, Vol. 1(4), 2015
ENVIS Centre on Himalayan Ecology

Road and Transport
List of Tables
13.1: Total and Surfaced Road Length in Sikkim
13.2: Length of Urban Roads by Authorities
13.3: Length of Project Roads by Authorities
13.4: Total and Surfaced Length of Roads
13.5: Length of National Highways
13.6: Lane-Wise Length of National Highways
13.7: Total and Surfaced Length of other PWD Roads
13.8: Length of other PWD Roads by Type of Surface
13.9: Total and Surfaced Length of Rural Roads
13.10: Total and Surfaced Length of Urban Roads
13.11: Length of Urban Roads by Type of Surface
13.12: Physical Progress of Rural Roads Under Bharat Nirman
13.13: Length of Pradhan Mantri Gram Sadak Yojana (PMGSY) Roads
13.14: Amount Sanctioned under Pradhan Mantri Gram Sadak Yojana
13.15: Total and Surfaced Length of Project Roads
13.16: Length of Project Roads by Type of Surface
13.17: Length of Roads under Forest Department by Type of Surface
13.18: Outlay and expenditure on Roads and Bridges
13.19: Details of National Highways
93
State at a Glance: Sikkim, Vol. 1(4), 2015
ENVIS Centre on Himalayan Ecology

Table 13.1: Total and Surfaced Road Length in Sikkim (in km.)
Types of Roads 2008 2009 2010 2011 2012 2013
National Highways Total Surfaced
State Highways Total Surfaced
Other PWD Roads Total 1950 Surfaced 1228
Rural Roads Total Surfaced
Urban Roads Total Surfaced
Project Roads Total Surfaced
62 62 179 179 15981145- - 29 29 5 3
626217917917701292--414153
62 62 17917918661388- - 67 67 5 3
62 62 17917918961388- - 1621605 3
149149179179
24012401162160775745
1491491791791992122833433343133131774745
Note: Rural Roads exclude roads built under JRY
Table 13.2: Length of Urban Roads by Authorities
(in km.)
Roads 2008 2009 2010 2011 2012 2013
Municipal Roads Total 12 12 38 133 133 133 Surfaced 12 12 38 131 131 131
Railways Roads Total - - - - - - Surfaced - - - - - -
Ports Roads Total - - - - - - Surfaced - - - - - -
Military Engineering Service Roads
Total 17 29 29 29 29 0
Surfaced 17 29 29 29 29 0
Total Urban Roads Total 29 41 67 162 162 133 Surfaced 29 41 67 160 160 131
: Not Reported
Note:-1. Total may not tally due to rounding of figures. 2. Data based on Railway Zones which had reported and is based on latest year informatio n (1993-
2013) as reported 3. Total Urban Roads includes Minor Port Roads as well even though the component has not been
indicated separately. Source
(Tables 13.1 -13.2):
Transport Research Wing, Ministry of Road Transport and Highways , Govt. of India
(Statistical Year
Book, India, 2016).
http://mospi.nic.in/Mospi_New/upload/SYB2016/index1.html (accessed on 2.02.2016)
94
State at a Glance: Sikkim, Vol. 1(4), 2015
ENVIS Centre on Himalayan Ecology

Table 13.3: Length of Project Roads by Authorities
(in km.)
Roads
2008
2009
2010
2011
2012
2013
Forest Department
Total
5
5
5
5
5
5
Surfaced
3
3
3
3
3
3
Border Road Organisation
Total
-
-
-
-
-
769
Surfaced
-
-
-
-
-
742
Total Project Road
Total
5
5
5
5
775
774
Surfaced
3
3
3
3
745
745
Note: Above table has been sourced from Basic Road Statistics of Various Years. The latest information, as provided by various states, while compiling the publication was used in the Basic Road Statistics of each year. Hence for any given year, in the table above, data for different States may actually pertain to a different period.
Source: Transport Research Wing, Ministry of Road Transport and Highways , Govt. in India (Statistical Year
Book, India 2016).
http://mospi.nic.in/Mospi_New/upload/SYB2016/index1.html (accessed on 2.02.2016)
Table 13.4: Total and Surfaced Length of Roads*
(in km.)
Year
Surfaced
Total
2009
3,719
4,199
2010 3,940 4,420
2011 4,119 4,630
2012 4,862 5,616
2013 5,775 6,570
* Excluding JRY Roads ; Totals may not add up because of rounding off of decimals. Source: Ministry of Road Transport and Highways, Govt. of India
(Basic Road Statistics of India 2004, 2005, 2006, 2007, 2008, 2009, 2010, 2011, 2012 & 2013).
http://morth.nic.in/index2.asp?slid=314&sublinkid=142&lang=1(accessed on 17.02.2016)
Table 13.5: Length of National Highways*
(in km.)
Year
NH Length 2009
2010 2011 2012 2013
62 62 62 149 149
*: All National Highways are surfaced.
Source:
Roads Wing, Ministry of Road Transport & Highways.
Ministry of Road Transport and Highways,
Govt.
of India (
Basic Road Statistics of India 2004, 2005, 2006, 2007, 2008, 2009,2010,2011,2012 & 2013).
http://morth.nic.in/index2.asp?slid=314&sublinkid=142&lang=1(accessed on 17.02.2016)
95
State at a Glance: Sikkim, Vol. 1(4), 2015
ENVIS Centre on Himalayan Ecology

Table 13.6: Lane-wise Length of National Highways
(in km.)
Year Less than 2 Lane Two-Lane Total Length 2009 62 0 2010 62 0 2011 62 0 2012
149
0
2013
149
0
626262149149
Totals may not add up because of rounding off of decimals. Source (Tables 13.6-13.8) : Roads Wing, Ministry of Road Transport & Highways, Govt. of India
(Basic Road Statistics of India 2009, 2010, 2011, 2012 & 2013).
http://morth.nic.in/index2.asp?slid=314&sublinkid=142&lang=1(accessed on 17.02.2016)
Table 13.7: Total and Surfaced Length of other PWD Roads
(in km.)
Year
Surfaced
Total
2004
1367
1776
2005
1376
1796
2006
1327
1838
2007
1145
1598
2008
1145
1598
2009
1292
1770
2010
1388
1866
2011
1388
1896
2012 1228 19502013 1228 1992
Table 13.8: Length of other PWD Roads by Type of Surface
(in km.)
Year
Surfaced
Unsurfaced Grand Total
W.B.M.
B.T./C.C.
Total
2012 190 1,038 1,228 7222013 148 1,080 1,228 764
1,9501,992
96
State at a Glance: Sikkim, Vol. 1(4), 2015
ENVIS Centre on Himalayan Ecology

Table 13.9: Total and Surfaced Length of Rural Roads (in km.)
Year Surfaced Total 2009 2142 2142 2010 2241 2241 2011 2326 2326 2012 2401 2401 2013 3343 3343
Source: State Rural Works Departments/ Local Self -Govt. Departments/State
Panchayati Raj Departments/State Rural Road Departments and National Rural Road
Development Agency, Ministry of Rural Development, Govt. of India (Basic Road Statistics of India 2009,2010, 2012 & 20132011,
).
http://morth.nic.in/index2.asp?slid=314&sublinkid=142&lang=1(accessed on 17.02.2016)
Table 13.10: Total and Surfaced Length of Urban Roads
(in km.) Year
Surfaced
Total
2009
41
41
2010
67
67
2011
160
162
2012
160
162
2013
131
133
Table 13.11: Length of Urban Roads by Type of Surface
(in km.)
Year
Surfaced
Unsurfaced
Grand Total
W.B.M.
B.T./C.C.
Total
2009
0
41
41
0
41
2010
3
64
67
0
67
2011
1
159
160
2
162
2012
1
159
160
2
162
2013
1
130
131
2
133
Source (Tables 13.10-13.11) : State Departments of Municipal Administration/Urban Affairs, Ministry of Road Transport & Highways Govt. of India (Basic Road Statistics of India-2009, 10, 11, 12 &13 ).
http://morth.nic.in/index2.asp?slid=314&sublinkid=142&lang=1(accessed on 17.02.2016)
97
State at a Glance: Sikkim, Vol. 1(4), 2015
ENVIS Centre on Himalayan Ecology

Table 13.12: Physical Progress of Rural Roads Under Bharat Nirman
Physical Progress
2010-11
2011-12
2012-13
2014-15
New
C
onnec
tiv
ity
Habitations covered during the year (in No.)
13
8
6
2
Habitations covered up to the year (in No.)
106
125
131
133
Road constructed during the year (in km.)
14.00
2.47
6
1
Road constructed up to the year
(in km.)
838.93
890.09
896
897
Up
grad
atio
n
Road upgraded during the year
(in km.)
0.00
0.00
0
0
Road upgraded up to the year
(in km.)
26.20
26.20
26
26
Source:
Ministry of Rural Development, Govt.
of India (Annual Report 2014-15).
http://rural.nic.in/netrural/rural/sites/annual-report.aspx (accessed on 4.01.2016)
Table 13.13: Length of Pradhan Mantri Gram Sadak Yojana (PMGSY) Roads
(in km.)
Year Length 2009 2,142 2010
2,241
2011
2,326 2012
2,401
2013
3,343
Note: All PMGSY Roads are surfaced.
Source:
National Rural Road Development Agency, Minis try of Rural. Ministry of Road Transport and
Highways,
Govt.
of India (Basic Road Statistics of India 2009,
2010,
2011,
2012 & 2013).
http://morth.nic.in/index2.asp?slid=314&sublinkid=142&lang=1(accessed on 17.02.2016)
Table 13.14: Amount Sanctioned
under
Pradhan Mantri Gram Sadak Yojana
(in Rs. Crore)
Year
Amount
2011-12
2012-13
2013-14
2014-15
Total
206.04
-
112.11
136.99
1219.99
Source: Ministry of Rural Development, Govt. of India (Annual Report 2014-15).http://rural.nic.in/netrural/rural/sites/annual-report.aspx (accessed on 4.01.2016)
98
State at a Glance: Sikkim, Vol. 1(4), 2015
ENVIS Centre on Himalayan Ecology

Table 13.15: Total and Surfaced Length of Project Roads
(in km.)
Year
Surfaced
Total
333
745
745
555
775774
W.B.M.: Water Bound Macadam; B.T.: Bituminous; C.C.: Cement Concrete
Sources:
200920102011
2012
2013
1. State Departments of Municipal Administration/Urban Affairs. Ministry of
Road Transport and Highways,
Govt.
of India
(Basic Road Statistics of India
2009,
2010,
2011, 2012 & 2013).
2. Directorate of Works, Engineering in Chief's Branch, Integrated HQ of MoD (Army)
3. Zonal railway headquarters; 4. Major Port Trust; 5. State Maritime Boards
http://morth.nic.in/index2.asp?slid=314&sublinkid=142&lang=1(accessed on 17.02.2016)
Table 13.16: Length of Project Roads by Type of Surface
(in km.)
Year
Surfaced
Un surfaced
Grand Total
W.B.M.
B.T./C.C.
Total
2009
0
2010 0
2011 0 2012 6 2013 6
3
3
3 739 739
3
3
3 745 745
2
2
2 30 29
5
5
5 775 774
W.B.M.: Water Bound Macadam; B.T.: Bituminous; C.C.: Cement Concre te
Sources:
State Departments of Forest.
Ministry of Road Transport and Highways,
Govt.
of India.(Basic
Road Statistics of India 2009, 2010, 2011, 2012 & 2013).
1. State Departments of Irrigation; 2. State Departments of Electricity; 3. State Sugarcane Departments 4. Coal Departments of State Governments; 5. Steel Authority of India Ltd.
6. National Mineral Development Corporation; 7. Border Roads
http://morth.nic.in/index2.asp?slid=314&sublinkid=142&lang=1(accessed on 17.02.2016)
Table 13.17: Length of Roads under Forest Department by Type of Surface
(in km.)
Year
Surfaced
Un surfaced
Grand Total
W.B.M.
B.T./C.C.
Total
2009
0
3
3
2
5
2010
0
3
3
2
5
2011
0
3
3
2
5
2012
!
0 3 3 2 5
2013
0
3
3
2
5
! : As on 31st March 2011; + : As on 31st March 2012
W.B.M.: Water Bound Macadam; B.T.: Bituminous; C.C.: Cement Co ncrete
Source:
State Departments of Forests. Ministry of Road Transport and Highways,
Govt.
of India (Basic
Road Statistics of India 2009, 2010,2011, 2012 & 2013).http://morth.nic.in/index2.asp?slid=314&sublinkid=142&lang=1(accessed on 17.02.2016)
99
State at a Glance: Sikkim, Vol. 1(4), 2015
ENVIS Centre on Himalayan Ecology

Tab le 13 .18: Outlay and expenditure on Roads and Bridges
(Rs. in lakhs) Year Outlay Expenditure 2010-11 7,708.35 7,708.35 2011 -12 7433.51 5418.68 2012-13 10635.28 19080.3 1 2013-14 19456.5 19456.5
Source: Ministry of Road Transport and Highways, Govt. of India (Basic Road Statistics of India 2012 & 2013).
http://morth.nic.in/index2.asp?slid=314&sublinkid=142&lang=1(accessed on 17.02.2016)
Table 13 .19: Details of National Highways
National Highway No. 31A, 310, 310A New, 510 New, 710 New
Total Length (km.) 309.00
Source: Ministry of Road Transport and Highways, Govt. of India (Basic Road Statistics of India 2013). http://morth.nic.in/index2.asp?slid=314&sublinkid=142&lang=1(accessed on 17.02.2016)
100
State at a Glance: Sikkim, Vol. 1(4), 2015
ENVIS Centre on Himalayan Ecology

Miscellaneous
List of Tables
14.1: Tourist Visits in Sikkim
14.2: Percentage Shares and Rank of Different in Domestic and Foreign Tourist Visits
14.3: Distribution of Classified Hotels
14.4: Number of projects and amount sanctioned
14.5: Panchayati Raj Institutions and Elected Representatives
14.6: Financial and Physical Progress under Indira Awaas Yojana (IAY)
14.7: Percentage of House-Hold by Availability of Toilet Connectivity within the House
14.8: Distribution by Percentage of Households by availability of type of Drainage
14.9: Details of Employment under the Mahatma Gandhi National Rural Employment
Guarantee Act (MGNREGA)
14.10: Financial Outcomes under The Mahatma Gandhi National Rural Employment
Guarantee Act (MGNREGA)
14.11: Physical and Financial Progress under Bharat Nirman
14.12: Swachh Bharat Mission (Gramin) Physical Progress Under SBM(G)
14.13: Number of Registered Newspapers and Periodicals
14.14: Number of Registered Newspapers and Periodicals by Language
14.15: Consumer Price Index - General Index
14.16: Details of State Co-operative Banks
14.17: Details of Primary Credit and Agricultural Credit Societies
14.18: Category-wise Elected Representatives of Panchayati Raj Institutions
101
State at a Glance: Sikkim, Vol. 1(4), 2015
ENVIS Centre on Himalayan Ecology

Table 14.1: Tourist Visits in Sikkim
Tourist 2013 2014 Domestic 576749 562418 Foreign 31698 49175 % Growth (2012/11) -2.48 55.14
Table 14.2: Percentage Shares and Rank of Different in Domestic and Foreign Tourist Visits
(in No.) Tourist 2013 2014
Tourist Visits (Numbers) Domestic 576749 562418 Foreign 31698 49175
Percentage Share Domestic 0.05 0.04 Foreign 0.16 0.22
Rank Domestic 27 29 Foreign 23 23
Table 14.3: Distribution of Classified Hotels
Hotels 2013 2014 No. of Hotels No. of Room No. of Hotels No. of Room
5 Star Deluxe 1 68 1 68 5 Star 1 25 1 25 4 Star - - - - 3 Star 2 51 2 51 2 Star 6 93 4 67 1 Star - - - - Heritage Hotels 1 25 - - Un-classified - - 1 50 Total 11 262 9 261
Source (Tables 14.1-14.3) : Ministry of Tourism, Govt . of India (Tourism Statistics 2014).
http://tourism.gov.in/sites/default/files/Other/India%20Tourism%20Statics%20ENGLISH%202014_compressed (accessed on 02.02.2016).pdf
(in No.)
102
State at a Glance: Sikkim, Vol. 1(4), 2015
ENVIS Centre on Himalayan Ecology

Table 14.4: Number of Projects* and amount sanctioned
(Rs. Crore)
Year Plan 2007-08 to 2011-12
No. Amount
11th Five Year plan 86 213.68
12th Five Year plan
2012-13
4 20.75
2013-14
11 104.35
2015
8 52.00
*Includes Projects relating to Product/ Infrastructure Development for Destinations and Circuits (PIDDC), Human Resource
Source: Ministry of Tourism, Govt . of India (Tourism Statistics 2014). http://tourism.gov.in/sites/default/files/Other/India%20Tourism%20Statics%20ENGLISH%202014_co mpressed.pdf (accessed on 02.02.2016)
Table 14.5: Panchayati Raj Institutions and Elected Representatives
(in No.)
Panchayats 2008* 2013 2014 Village Panchayats
Representatives
Number 163 341 341 Elected 891 989 989
Intermediate Panchayats
Number 0 NA NA Elected 0 NA NA
District Panchayats Number 95 4 4 Elected 95 110 110
(a) Elections to the Local Bodies are yet to be conducted; Intermediate Panchayat does not exist (2 Tier).
(b) District Panchayat does not exist; Panchati Raj System is yet to be revived. NA: Not Applicable.
Source: Ministry of Panchayati Raj, Govt. of India (Statistical Year Book, India 2016). http://mospi.nic.in/Mospi_New/upload/SYB2016/index1.html (accessed on 2.02.2016)
103
State at a Glance: Sikkim, Vol. 1(4), 2015
ENVIS Centre on Himalayan Ecology

Table 14.6: Financial and Physical Progress under Indira Awaas Yojana (IAY) Particulars 2014-15 Financial Allocation (Rs. In lakh) 1288.122 Total Utilization of Funds 662.35
Ann
ual
T
arget
SC 197 ST 1129 Minority 501 Others 7 Total 1834
Total Houses Completed 0 % of Target Achieved 0.00 Source: Ministry of Rural Development, Govt. of India (Annual Report 2014-15). http://rural.nic.in/netrural/rural/sites/annual-report.aspx (accessed on 4.01.2016)
Table 14.7: Percentage of House-Hold by Availability of Toilet Connectivity within the House (Census, 2011)
Latrine Facility Total No. of Households (Excluding institutional households) 128131
Flush/pour flush latrine connected to
Latrine facility Available within premises 87.2 Piped sewer system 11.8 Septic Tank 59.8 Other systems 3.4
Pit latrine
With slab/ ventilated improved pit 6.5 Without slab/open pit 5.4
Other latrine Night soil disposed into open drain 0.1 Night soil removed by human 0.0 Night soil serviced by animal 0.1
Latrine Not available within premises
Total 12.8 Public latrine 1.5 Open 11.3
Source: Ministry of Health and Family Welfare, Govt. of India (National Health Profile 2015).
http://www.indiaenvironmentportal.org.in/files/file/NHP -2015.pdf (accessed on 19.01.2016)
104
State at a Glance: Sikkim, Vol. 1(4), 2015
ENVIS Centre on Himalayan Ecology

Table 14.8: Distribution by Percentage of
Households by Availabilit y of Type of Drainage
(Census, 2011)
Facility
Total No. of Households (Excluding institutional households)
128131
Bathing Facility Bathroom available
65.1
Bathing in enclosure without roof
3.5
No. bathroom
31.4
Type of Drainage Closed drainage
14.6
Open drainage
38.1
No. drainage
47.3
Kitchen
Kitchen available
90.2
Cooking inside house, does not have kitchen
7.8
Cooking in open
1.5
No. cooking
0.6
Source:
Ministry of Health and Family Welfare, Govt. of India (National Health Profile 2015).
http://www.indiaenvironmentportal.org.in/files/file/NHP -2015.pdf (accessed on 19.01.2016)
Table 14.9: Details of Employment under the Mahatma Gandhi National Rural Employment Guarantee Act (MGNREGA)
Employment 2011-12 2012-13 2013-14 2014-15 No. of households who have demanded employment
55797 32944 65393 49563
No. of households provided employment
54642 30633 63288 43197
Per
son
day
s In
Lak
hs Total 32.85 11.59 44.03 15.08
SCs 1.49 0.53 1.85 0.62 % Age of SC participation 4.53 4.55 4.20 4.11 STs 11.86 3.59 17.62 5.26 % Age of ST participation
36.09
30.97
40.02
34.91
Women
14.69
5.42
19.75
7.42
% Age of Women participation
44.71
46.77
44.85
49.23
Other
19.50
7.47
24.56
9.19 Average person days per
Household
60
38
70
35
Number of households availed 100 days of employment
8746
1149
14005
1179
% of HH completed 100 days Employment
16.01
3.75
22.13
2.73
Source:
Ministry of Rural Development, Govt.
of India
(Annual Report 2014-15).
http://rural.nic.in/netrural/rural/sites/annual-report.aspx (accessed on 4.01.2016)
105
State at a Glance: Sikkim, Vol. 1(4), 2015
ENVIS Centre on Himalayan Ecology
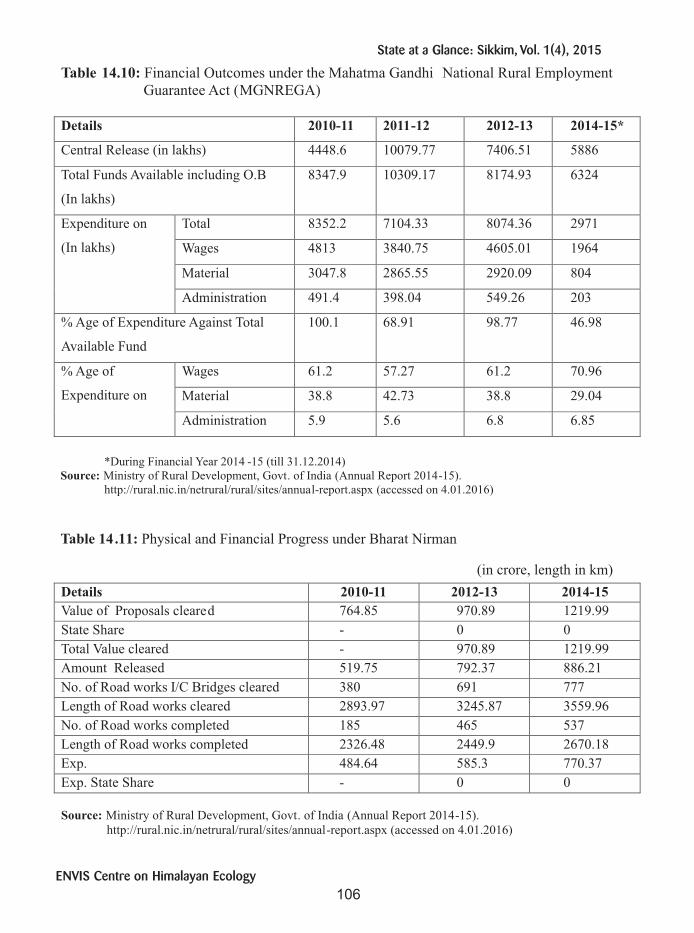
Table 14.10: Financial Outcomes under the Mahatma Gandhi National Rural Employment Guarantee Act (MGNREGA)
Details
2010-11
2011-12
2012-13
2014-15*
Central Release (in lakhs)
4448.6
10079.77
7406.51
5886
Total Funds Available including O.B
(In lakhs)
8347.9
10309.17
8174.93
6324
Expenditure on
(In lakhs)
Total
8352.2
7104.33
8074.36
2971
Wages
4813
3840.75
4605.01
1964
Material
3047.8
2865.55
2920.09
804
Administration
491.4
398.04
549.26
203
% Age of Expenditure Against Total
Available Fund
100.1 68.91 98.77 46.98
% Age of
Expenditure on
Wages 61.2 57.27 61.2 70.96
Material 38.8 42.73 38.8 29.04
Administration 5.9 5.6 6.8 6.85
*During Financial Year 2014 -15 (till 31.12.2014)
Source: Ministry of Rural Development, Govt. of India (Annual Report 2014-15). http://rural.nic.in/netrural/rural/sites/annual-report.aspx (accessed on 4.01.2016)
Table 14.11: Physical and Financial Progress under Bharat Nirman
(in crore, length in km)
Details 2010-11 2012-13 2014-15 Value of Proposals cleared 764.85 970.89 1219.99 State Share
-
0
0
Total Value cleared
-
970.89
1219.99
Amount Released
519.75
792.37
886.21
No. of Road works I/C
Bridges cleared
380
691
777
Length of Road works cleared
2893.97
3245.87
3559.96
No. of Road
works completed
185
465
537 Length of Road
works completed
2326.48
2449.9
2670.18
Exp.
484.64
585.3
770.37 Exp. State Share
-
0
0
Source:
Ministry of Rural Development, Govt.
of India
(Annual Report 2014-15).
http://rural.nic.in/netrural/rural/sites/annual-report.aspx
(accessed on 4.01.2016)
106
State at a Glance: Sikkim, Vol. 1(4), 2015
ENVIS Centre on Himalayan Ecology

Table 14.12: Swachh Bharat Mission (Gramin) Physical Progress Under SBM(G)
Year
IHHL (BPL)
IHHL (APL)
IHHL Total
Sanitary
Complex School
Aganwadi Toilets
2013-14
3389
54
3443
192
166
100
2014-15
2755
0
2755
27
505
36
IHHL-
Individual Households Latrine, BPL-Below Poverty Line, APL-Above Poverty Line
Note: -
(a) Cumulative funds released to NE States: As
against the project objectives, an amount of Rs. 971.40 crore have been released to the NE States upto December 2014, under the NBA/SBM (G).
(b) Funds released during 2013-14 and 2014-15 (till Dec. 2014)
The funds released to the States in 2013-14 and 2014-15 is as below:
Source:
Ministry of Drinking Water & Sanitation, Govt .
of India
(Annual Report 2014-15).
http://www.mdws.gov.in/sites/default/files/Annual -Report-%20Drinking%20Water_0.pdf
(accessed on 11.02.2016)
Table 14.13: st
Number of Registered Newspapers and Periodicals (as on 31 March)
News paper/
Periodicals
2008-09 2009-10 2010-11 2011-12 2012-13 2013-14
Daily 10 11 12 13 14 15
Bi/Tri Weekly
2 2 2 2 2 2
Weekly 70 71 72 75 78 82 Fortnightly 1 1 1 1 1 1 Monthly 1 1 1 1 3 3 Quarterly 2 2 2 3 3 3 Annual - - 0 0 0 0 Others 3 3 3 3 3 3 Total 89 91 93 98 104 109
Table 14.14: Number of Registered Newspapers and Periodicals by Language
Language
2008-09
2009-10
2010-11
2011-12
2012-13
2013-14
English
14
15
15
17
20
21 Hindi
2
2
2
2
3
4 Bi-lingual
2
2
2
2
2
2 Others
71
72
74
77
79
82 Total
89
91
93
98
104
109
Note: The year above indicates 1st April (previous year) to 31 st
March.
Source
(Tables 14.13-14.14) : Registrar of Newspapers for India, Ministry of Information and Broadcasting, Govt.
(Statistical Year Book,
India 2016).
http://mospi.nic.in/Mospi_New/upload/SYB2016/index1.html (accessed on 2.02.2016)of India
107
State at a Glance: Sikkim, Vol. 1(4), 2015
ENVIS Centre on Himalayan Ecology

Table 14.15: Consumer Price Index* - General Index
2010-11 2011-12 2012-13 2013-14 2014-15
Rural 106.9 114.1 123.5 131.4 116.3
Urban 107.9 121.0 134.8 146.1 122.5
Combined 107.1 115.4 125.6 134.2 118.3
*Indices are based on CPI Base Year 2012=100 Source: Central Statistics Office, National Accounts Division (PCL Unit), Govt. of India (Statistical Year Book, India 2016).
http://mospi.nic.in/Mospi_New/upload/SYB2016/index1.html (accessed on 2.02.2016)
Table 14.16: Details of State Co-operative Banks (Amount in Millions)
Type 2008-09 2009-10 2010-11 2011-12 2012-13
2013-14
Membership Societies 337 337 337 354 352 352
Individuals 1838 1838 1838 3921 3528 3528
Share capital 102.8 105.6 105.6 112.814 117 125
Reserves 67.5 81 81 120.964 151 162
Deposits 867 1941.4 1941.4 1359.957 2405 3209
Borrowings
from
Govt. NA NA NA - - -
RBI/ Nabard 78 119 194 209 138 121
Others NA NA NA 0 0 0
Total 79.8 120.2 194 209 138 121
Total working Capital 1105.9 1105.9 1105.9 1898 3001 4336
Loans issued during the
year
179.3 179.3 179.3 340 300 514
NA-Not Available The figures of borrowings from Govt./Other sources not available.
Source: As sourced by National Bank for Agriculture and Rural Development from concerned St CBs, Govt. of India
(Statistical Year Book, India 2016 ). http://mospi.nic.in/Mospi_New/upload/SYB2016/index1.html (accessed on 2.02.2016)
Type
108
State at a Glance: Sikkim, Vol. 1(4), 2015
ENVIS Centre on Himalayan Ecology
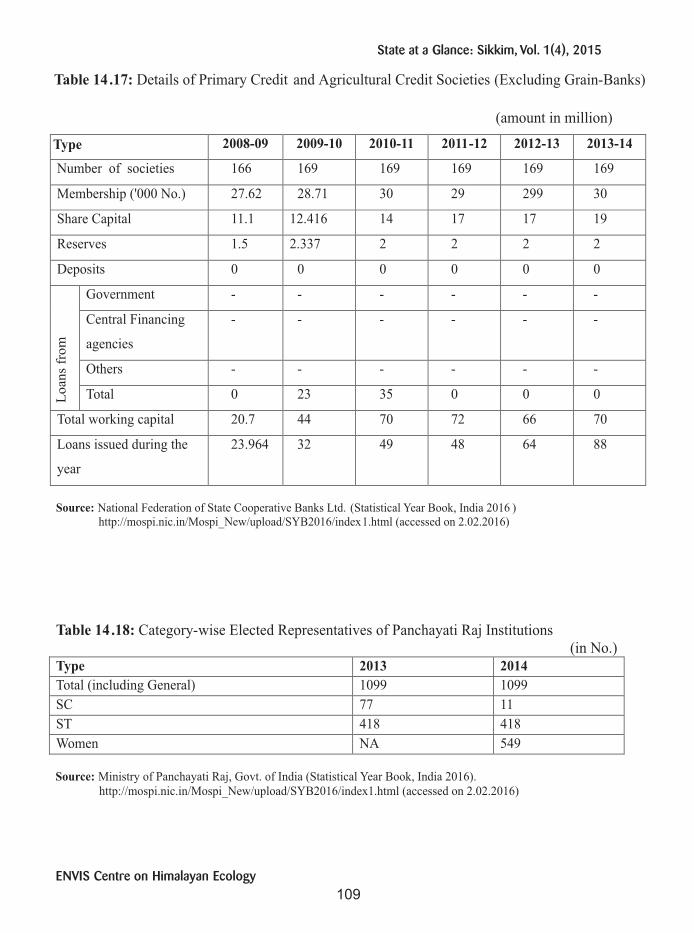
Table 14.17: Details of Primary Credit and Agricultural Credit Societies (Excluding Grain-Banks)
(amount in million)
Type
2008-09
2009-10
2010-11
2011-12
2012-13
2013-14
Number of societies
166
169
169
169
169
169
Membership ('000 No.)
27.62
28.71
30
29
299
30
Share Capital
11.1
12.416
14
17
17
19
Reserves
1.5
2.337
2
2
2
2
Deposits
0
0
0
0
0
0
Loan
s fr
om
Government
-
-
-
-
-
-
Central Financing
agencies
- - - - - -
Others - - - - - -
Total 0 23 35 0 0 0
Total working capital 20.7 44 70 72 66 70
Loans issued during the
year
23.964 32 49 48 64 88
Source: National Federation of State Cooperative Banks Ltd. (Statistical Year Book, India 2016 )
http://mospi.nic.in/Mospi_New/upload/SYB2016/index1.html (accessed on 2.02.2016)
Table 14.18: Category-wise
Elected Representatives of Panchayati Raj Institutions
(in No.) Type
2013
2014
Total (including General)
1099
1099 SC
77
11
ST
418
418 Women
NA
549
Source:
Ministry of Panchayati Raj, Govt. of India (Statistical Year Book, India 2016).
http://mospi.nic.in/Mospi_New/upload/SYB2016/index1.html (accessed on 2.02.2016)
109
State at a Glance: Sikkim, Vol. 1(4), 2015
ENVIS Centre on Himalayan Ecology


Web Directory
List of Tables
15.1 : Apex Bodies in Sikkim
15.2 : Legislative Assembly and Council
15.3 : Judiciary
15.4 : Districts (Official Website)
15.5 : Directorate, Divisions/ Units/ Wings
15.6 : State Departments
15.7 : Union Government Departments
15.8 : Boards / Undertakings
15.9 : Local and Statutory Bodies, Commissions/Committees/Missions and Councils
111
State at a Glance: Sikkim, Vol. 1(4), 2015
ENVIS Centre on Himalayan Ecology

Table 15.1
:
Apex Bodies in Sikkim
Name
URL
Governors Office, Sikkim
http://rajbhavansikkim.gov.in/
Official Portal of Sikkim Government
https://www.sikkim.gov.in/portal
State Information Commission (SIC), Sikkim
http://www.cicsikkim.gov.in/
Sikkim Public Service Commission (SPSC)
http://spscskm.gov.in/
Table 15.2 : Legislative Assembly
and Council
Name
URL
Legislative Assembly, Sikkim http://www.sikkimassembly.org/
Table 15.3: Judiciary
Name URL
District and Sessions Court, Namchi, South
Sikkim
http://districtcourtsnamchi.nic.in/
Sikkim High Court
http://highcourtofsikkim.nic.in/
Sikkim Judicial Academy
http://sikkimjudicialacademy.nic.in/
Table 15.4: Districts (Official Website)
Name of District
URL
East Sikkim
NA
North Sikkim
http://northsikkim.nic.in/
South Sikkim
http://southsikkim.nic.in/
West Sikkim
1. Krishi Vigyan Kendra, Gyaba,
Gyalshing, West Sikkim
1.
http://www.kvkwestsikkim.gov.in/
112
State at a Glance: Sikkim, Vol. 1(4), 2015
ENVIS Centre on Himalayan Ecology

113
State at a Glance: Sikkim, Vol. 1(4), 2015
Table 15.5: Directorate, Divisions/ Units/ Wings
Table 15.6: State Departments
Name URL
Animal husbandary, Livestock, Fisheries and Veterinary Services Department, Sikkim
http://sikkim-ahvs.gov.in/
Building and Housing Department, Sikkim http://www.sikkim-building.gov.in/
Commerce and Industries Department, Sikkim http://sikkimindustries.gov.in/
Co-operation Department, Sikkim NA
Cultural Affairs and Heritage Department, Sikkim
1. Sikkim Government Archives
http://www.sikkim-
culture.gov.in/Home/Index.aspx 1. http://sikkimarchives.gov.in/
Ecclesiastical Affairs Department, Sikkim
http://sikkimeccl.gov.in/
Election Department, Sikkim
http://secsikkim.org/
Energy and Power Department, Sikkim
http://www.powerdepartmentsikkim.com/
Excise (ABKARI) Department, Sikkim
http://www.sikkim-excise.gov.in/Default.aspx
Finance, Revenue and Expenditure Department, Sikkim
1.
Commercial Taxes Division, Finance, Revenue and
Expenditure Department, Sikkim
2.
eProcurement Portal, Government of Sikkim
http://sikkimfred.gov.in/user/home.aspx
1.
http://www.sikkimtax.gov.in/
2.
https://sikkimtender.gov.in/
Food, Civil Supplies and Consumer Affairs Department,
Sikkim
http://sikkimfcs-cad.gov.in/
Food Security and
Agriculture Development Department,
Sikkim
http://sikkimagri.gov.in/
1.
http://www.kvkwestsikkim.gov.in/
Name
URL
Commercial Taxes Division, Finance, Revenue and
Expenditure Department, Sikkim
http://www.sikkimtax.gov.in/
Directorate of Handicrafts & Handloom
http://sikkimcrafts.gov.in/
Directorate of Sericulture -
Government of Sikkim
http://serisikkim.in/
Sikkim Government Gazettes
http://www.sikkimgazettes.gov.in/
Chungthang Sub Division, North Sikkim
http://chungthangsubdivision.nic.in/
ENVIS Centre on Himalayan Ecology

Food Security and
Agriculture Development Department,
Sikkim
1.
Krishi Vigyan Kendra, Gyaba, Gyalshing, West
Sikkim
http://sikkimagri.gov.in/
1.
http://www.kvkwestsikkim.gov.in/
Forest, Environment and Wildlife Management
Department, Sikkim
1.
Directorate of Sericulture -
Government of
Sikkim
2.
Environmental Information System
(ENVIS), Sikkim
3.
Sikkim State Pollution Control Board
http://www.sikkimforest.gov.in/
1.
http://serisikkim.in/
2.
http://www.sikenvis.nic.in/
3.
http://www.spcbsikkim.org/
Health Care, Human Services and Family Welfare
Department, Sikkim
http://sikkimhealth.gov.in/
Home Department, Sikkim
1. Sikkim Prisons
2. Sikkim State Human Rights Commission
(SSHRC)
1. http://sikkimprisons.gov.in/
2. http://sshrc.nic.in/
Human Resource Development Department, Sikkim
1. Sikkim Public Service Commission
(SPSC) 2.
Sikkim University, Gangtok
http://sikkimhrdd.org/
1. http://spscskm.gov.in/
2. http://www.cus.ac.in/
Information and Public Relations Department, Sikkim
http://www.sikkimipr.org/#/
Information Technology Department, Sikkim
NA
Irrigation and Flood Control Department, Sikkim
http://www.sikkim-irrigation.gov.in/
Labour Department, Sikkim
NA
Land Revenue and Disaster Management Department,
Sikkim
1.
Sikkim Government Gazettes
2.
Sikkim State Disaster Management
Authority (SSDMA)
http://sikkimlrdm.gov.in/
1.
http://www.sikkimgazettes.gov.in/
2.
http://www.ssdma.nic.in/
Mines, Minerals and Geology Department, Sikkim
1.
Directorate of Handicrafts & Handloom
http://sikkimmines.gov.in/
1.
http://sikkimmines.gov.in/
Personnel Administrative Reforms, Training and Public http://www.sikkimdop.org/
114
State at a Glance: Sikkim, Vol. 1(4), 2015
ENVIS Centre on Himalayan Ecology

Police Department, Sikkim
1.
Vigilance Department, Sikkim
http://sikkimpolice.nic.in/
1.
http://sikkim-vigilance.gov.in/
Printing and Stationary Department, Sikkim
NA
Roads and Bridges Department, Sikkim
http://www.sikkim-roadsandbridges.gov.in/
Rural Management and Development Department, Sikkim
1.
Chungthang Sub Division, North Sikkim
2.
Member of Parliament Local Area Development
Scheme (MPLADS), Sikkim
3.
State Institute of Rural Development (SIRD),
Sikkim
http://rdsikkim.org/
1.
http://chungthangsubdivision.nic.in/
2.
http://sikkim-mplads.gov.in/
3.
http://sirdsikkim.in/
Science and Technology Department, Sikkim
1.
Bioinformatics Centre, Sikkim
http://dstsikkim.gov.in/
1. http://bioinformaticssikkim.gov.in/
Social Justice, Empowerment and Welfare Department,
Sikkim
NA
Sports and Youth Affairs Department, Sikkim NA
Tourism and Civil Aviation Department, Sikkim http://sikkimtourism.gov.in/Webforms/G eneral
/Default.aspx
Transport Department, Sikkim NA Urban Development and Housing Department, Government
of Sikkim
http://sikkimudhd.org/
Water Security and
Public Health Engineering Department,
Sikkim
http://sikkim-wsphed.in/
NA: Not Available
Table 15.7: Union Government Departments
Name of the Department
URL
Chief Electoral Officer (CEO), Sikkim
http://ceosikkim.nic.in/
Meteorological Center, Gangtok
http://www.imdsikkim.gov.in/
MSME -
Development Institute, Gangtok, Sikkim
http://sikkim.nic.in/msme-di/
National Research Centre for Orchids (NRCO)
http://nrcorchids.nic.in/
115
State at a Glance: Sikkim, Vol. 1(4), 2015
ENVIS Centre on Himalayan Ecology

Table 15.8: Boards / Undertakings Name URL
Sikkim Prisons http://sikkimprisons.gov.in/ Sikkim State Disaster Management Authority (SSDMA) http://www.ssdma.nic.in/ Sikkim State Pollution Control Board http://www.spcbsikkim.org/ Sikkim Tourism Development Corporation (STDC) http://www.sikkimstdc.com/Index.aspx
NA: Not Available Table 15.9 : Local and Statutory Bodies, Commissions/Committees/Missions and Councils
Name of the Department URL
Sikkim State Human Rights Commission (SSHRC)
http://sshrc.nic.in/
Source :National Portal Secretariat, National Informatics Centre, New Delhi -110 003, India.
http://goidirectory.nic.in (accessed on 14.01.2016)
116
State at a Glance: Sikkim, Vol. 1(4), 2015
ENVIS Centre on Himalayan Ecology


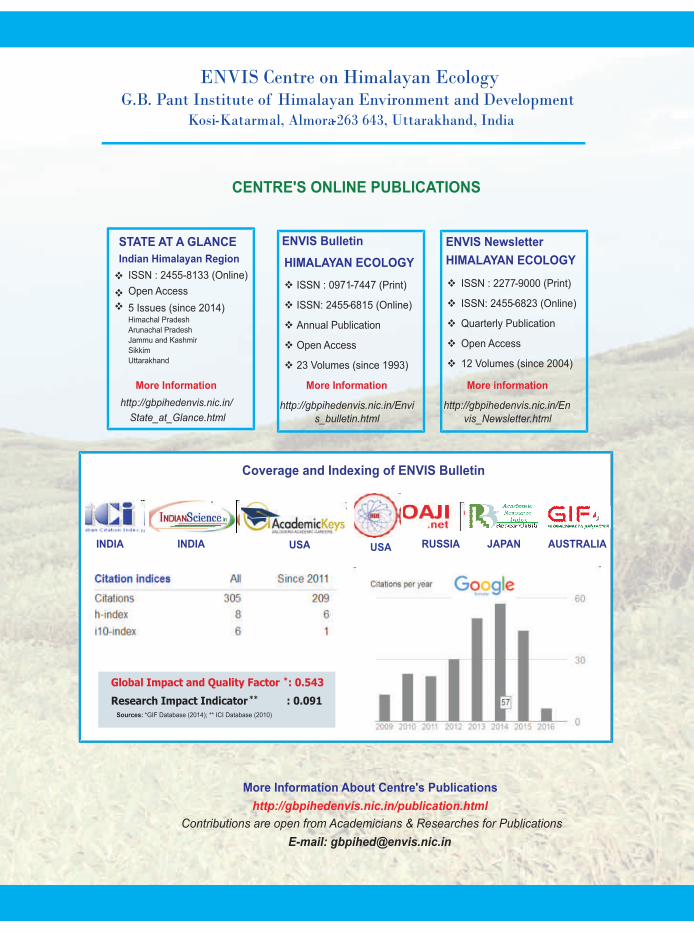
ENVIS Centre on Himalayan EcologyG.B. Pant Institute of Himalayan Environment and Development
Kosi-Katarmal, Almora-263 643, Uttarakhand, India
?ISSN : 2277-9000 (Print)
?ISSN: 2455-6823 (Online)
?Quarterly Publication
?Open Access
?12 Volumes (since 2004)
ENVIS Newsletter
HIMALAYAN ECOLOGY
More information
http://gbpihedenvis.nic.in/Envis_Newsletter.html
ENVIS Bulletin
?ISSN : 0971-7447 (Print)
?ISSN: 2455-6815 (Online)
?Annual Publication
?Open Access
?23 Volumes (since 1993)
More Information
http://gbpihedenvis.nic.in/Envis_bulletin.html
HIMALAYAN ECOLOGY
STATE AT A GLANCE
Indian Himalayan Region
More Information
http://gbpihedenvis.nic.in/
State_at_Glance.html
USAINDIA USA RUSSIA JAPANINDIA
Coverage and Indexing of ENVIS Bulletin
AUSTRALIA
Global Impact and Quality Factor *: 0.543
Research Impact Indicator ** : 0.091Sources: *GIF Database (2014); ** ICI Database (2010)
More Information About Centre's Publications
http://gbpihedenvis.nic.in/publication.html
Contributions are open from Academicians & Researches for Publications
E-mail: [email protected]
CENTRE'S ONLINE PUBLICATIONS
?ISSN : 2455-8133 (Online)
Open Access
5 Issues (since 2014)Himachal Pradesh
Arunachal Pradesh
Jammu and Kashmir
Sikkim
Uttarakhand
??

De
sig
n &
Prin
t : A
PN
A J
AN
MA
T, D
.Du
n P
h. : 0
13
5-2
65
34
20
, 2
65
51
74
G.B. Pant Institute of Himalayan Environment and DevelopmentKosi-Katarmal, Almora-263 643, Uttarakhand, India
ENVIS CentreHIMALAYAN ECOLOGY
ENVIS Centre on Himalayan Ecology at the G.B. Pant Institute of Himalayan Environment and Development (GBPIHED) was established in 1992-93 with the financial support from the Ministry of Environment, Forest & Climate Change (MoEF&CC), Government of India, New Delhi. The Centre is collecting, collating, compiling and building quantitative and qualitative databases of information related to various aspects of Himalayan Ecology. Through print/electronic media, the Centre is regularly disseminating all available information, free of cost, to various stakeholders/users, which include all District Information Centres (working in the Himalayan states of the country), ENVIS Centres of the MoEF&CC Universities, Research Centers, Engineering Colleges, Govt. Institutions, NGOs and experts/individuals working in the Indian Himalayan Region (IHR). The main mandate of the Centre is to spread environmental awareness and help research and development in areas related to Himalayan Ecology.
E-mail: [email protected] ENVIS URL: http://gbpihedenvis.nic.in GBPIHED URL: http://gbpihed.gov.in