Shri Mata Vaishno Devi University - smvdu
45
1 A Bi-annual Referred Journal of Faculty of Management, SMVD University Volume 12 (1 and 2), 2017 Shri Mata Vaishno Devi University Katra, J&K, India, 182320
-
Upload
khangminh22 -
Category
Documents
-
view
0 -
download
0
Transcript of Shri Mata Vaishno Devi University - smvdu

1
A Bi-annual Referred Journal of Faculty of Management, SMVD University
Volume 12 (1 and 2), 2017
Shri Mata Vaishno Devi University Katra, J&K, India, 182320
i
Arth Anvesan, Volume 12 (1 & 2), 2017, ISSN: 0973-8193 Bi-Annual Refereed Journal of Faculty of Management, Shri Mata Vaishno Devi University (SMVDU)
PATRON: Prof. Sanjeev Jain, Vice Chancellor, SMVDU
EDITOR IN CHIEF: Prof. (Dr.) D. Mukhopadhyay, Dean, Faculty of Management, SMVDU
MANAGING EDITOR: Dr. Saurabh Assoc. Prof., School of Business, SMVDU
CONSULTANT EDITOR: Dr. Supran Kumar Sharma, Assoc. Prof., School of Business, SMVDU
JOINT EDITORS:
Dr. Ashutosh Vashishtha, Assoc. Prof., School of Business, Faculty of Management, SMVDU
Dr. Jyoti Sharma, Assoc. Prof., School of Business, SMVD U
Dr. Sushil Kumar Mehta, Assoc. Prof., School of Business, SMVDU
Dr. Kakali Majumdar, Assoc. Prof., Head, School Of Economics, Faculty of Management. SMVDU
Members:
Dr. Hari Govind Mishra, Assoc. Prof., School of Business, SMVDU
Dr. Arti Maini, Asst. Prof, School of Business, SMVDU
Dr. Rashi Taggar, Asst. Prof, School of Business, SMVDU
Dr. Deepak Jain, Asst. Prof, School of Business, SMVDU
Dr. Meenakshi Gupta, Asstt. Prof School of Economics, SMVDU
Dr. Rooplal Sharma, Asstt. Prof., School of Economics, SMVDU
Mr. Pabitra Jena, Asstt. Prof., School of Economics, SMVDU
Editorial Review Board Referees Prof. A.S. Sethi, Punjab School of Economics,
GND University, Amritsar
Prof.Azhar Kazmi, King Fahd University of
Petroleum & Minerals, Saudi Arabia
Prof. (Retd.) D.K.Banwett, Dept. of Management
Studies, IIT, Delhi.
Prof. J.V. Vaishampayan, Vice Chancellor, CSJM
University, Kanpur
Prof. Khurshid Bhat, Dept. of Commerce
University of Kashmir, Srinagar
Dr. Manoj Kumar, FLAME University, Pune.
Prof. Neelu Rohmetra, Director, IIM Sirmaur
Prof. Nirankar Srivastava, School of Economics,
Management & Information Science, NEHU,
Shilong. Prof. R.D. Sharma, Vice Chancellor,
University of Jammu, Jammu.
Prof. Rashmi Aggarwal, Dept. of Business
Economics, University of Delhi.
Prof. S.K. Sharma, Management Studies, TITS,
Bhiwani.
Dr. Sunil Giri, MDI, Murshidabad, West Bengal.
Prof. T.A. Bhawani, Institute of Economic Growth,
Delhi.
Prof. Tran Van Hoa, Director, Vietnam and
ASEAN plus Research Program, CSES, Victoria
University, Australia.
Prof. V. Upadhyay, Dept. of Humanities & Social
Sciences, IIT, Delhi.
Dr. Anuradha R. Chetiya, Ramjas College, University of
Delhi.
Prof. Ashish Pandey, IIT, Powai Mumbai.
Dr. Bikash Ranjan Mishra, Department of Economics,
Ravenshaw University, Cuttack, Odisha
Prof. D.S Hegde, National Institute of Industrial
Engineering, Mumbai.
Prof. G.V.Bhavani Prasad, Kakatiya University.
Dr. Hari Sundar, VIT Business School, Tamil Nadu.
Dr. Himanshu Sekhar, SRK Government Arts College
Prof. H.K Singh, BHU, Varanasi
Dr. H.P. Mathur, FMS, Banaras Hindu University, Varanasi.
Prof. Kanak Bagchi, North Bengal University Prof.
Khurshid Bhat, Kashmir University
Prof.Maniklal Adhikary, Bardwan University, West Bengal
Prof. Nirankar Srivastav, North Eastern Hill University,
Meghalaya
Prof. Pawan K. Garg, H P University, Shimla Prof. Prashant
Kulkarni. IBA Bangalore
Dr. Pratibha Goyal, Department of Management Studies,
Punjab Agriculture University, Ludhiana
Dr. Ran Singh Dhaliwal, Punjabi University, Patiala.
Dr.Rudra Prakesh Pradhan, IIT KGP, West Bengal
Prof. S.C. Sharma, Sur College of Applied Sciences, Oman.
Prof. Sanjay Medhavi, University of Lucknow
Dr. Sanjay Mohapatra, XIM, Bhubhneshwar, Odisha
Dr. Sanjeev Gupta, Himachal Central University,
Dharmshala
Dr. S. Narayan Rao, IIT Mumbai, Powai,Mumbai
Dr. Suneel Kumar, Shinas College of Technology, Oman

Arth Anvesan, Volume 12 (1 & 2), 2017 ISSN: 0973-8193
ii
From the Editor….
Greetings!!
It is my pleasure to bring to you the twelfth volume of the bi-annual refereed journal Arth Anveshan,
published by School of Business, Faculty of management, Shri Mata Vaishno Devi University, Katra,
J&K, India. Arth Anveshan has been providing a platform to the researchers and academicians to
present their research work. Over the period the journal has been working to improve the quality of
articles submitted through a rigorous double blind peer review.
In the current volume the submissions are selected from the various field of management, commerce
and economics. The article Rural Entrepreneurship and Skill Development through National Rural
Livelihood Mission (NRLM): An appraisal of Self Help Groups (SHGs) of village Ghagwal inDistrict
Samba, by Sonam Sharma is a comprehensive case research to explore the extent of empowerment of
women in the rural areas through NRLM and SHGs. The article addresses the implementation issues
of the government schemes and programs. Another article by Deepti Sharma and Nisha Pandey is a
study that analyzes the Willingness to Accept (WTA) of a rural population in the eastern Indian
province of Bihar for the goods and services offered by the local 6000 ha Kabar wetland. The paper
uses empirical analysis to prove that how the value of wetland increases through shrinkage. It explores
the variables responsible for the valuation of wetland. The research paper Consumer Online Search
Behavior and Intention to Buy from E-tail Stores, by Amit Kishore Sinha, Gyanendra Johri and Dr.
Sandeep Singh brings forth the learning of the pattern of online behavior of the consumers in the tier
II cities of Madhya Pradesh. The study establishes that there is a positive relationship between the
time spending on e-tail sites and its conversion into the purchase.
The volume twelve of Arth Anveshan also presents the case study Surgical Strike at Tata Group by
Surbhi Bedi and Snadeep Vij. The case study was awarded in the International case Study Conference
(INCSC-2017) at SMVD University Katra, J&K. The case study discusses the abrupt changes in the
top management of TATA group in India. It raises the questions for succession planning and corporate
governance.
With select papers in this volume assure for being a platform for the researchers who believe in
working on the local, national and international issues. The journal accepts the research work that not
only draws the attention towards the policy issues but also contributes in the development of models
and theories. We further invite the original work in form of concept papers, empirical papers based
on quantitative and qualitative tools, case research, review articles and book reviews for the future
issues of this bi-annual referred journal.
I wish happy learning to all the readers and solicit their support with regular contributions.
Dr. Saurabh
Managing Editor
Arth Anvesan, Volume 12 (1 & 2), 2017 ISSN: 0973-8193
iii
Table of Content
Sr. No. Title Author (s) Page
1 Rural Entrepreneurship and Skill
Development through National Rural
Livelihood Mission (NRLM): An
appraisal of Self Help Groups (SHGs)
of village Ghagwal in District Samba
Sonam Sharma 01-08
2 Consumer Online Search Behaviour
and Intention to Buy from E-tail Stores
Amit Kishore Sinha,
Gyanendra B.S. Johri
and Sandeep Singh
09-16
3 Valuation of a Subtropical Wetland by
the Contingent Valuation Method:
Effect of Temporary Shrinkage on the
Willingness to Accept Values in Rural
Eastern India
Deepti Sharma and
Nisha Pandey
17-28
4 Case Study: Surgical Strike at Tata
Group
Surbhi Bedi and
Snadeep Vij
29-38

1
Blank Page

Arth Anvesan, Volume 12 (1 & 2), 2017 ISSN: 0973-8193
1
Rural Entrepreneurship and Skill Development through National Rural Livelihood
Mission (NRLM): An appraisal of Self Help Groups (SHGs) of village Ghagwal in
District Samba
Ms Sonam Sharma*
ABSTRACT
In India, women are facing a lot of challenges and biasness particularly women living in rural areas. Appropriate policies for rural entrepreneurship and skill development to empower the women occupy a dominant place in bringing the socio-economic stability
across gender in an economy. In contemporary India, education, entrepreneurship and skill development are key drivers of economic
empowerment and developing Knowledge society. Skill development has emerged as a national priority in the 21st century in India. In order to make rural women in rural areas more empowered, rural entrepreneurship in the form of self help groups plays a crucial role in catering
the economic needs of the these women. Over the years various schemes have been taken up by the government of Jammu and Kashmir to
enhance the employability of rural women and self help groups through skill development in the state. Also efforts have been made to create opportunities for the women which help to bring them into the mainstream economic environment of the state. In the present paper an effort
have been made to find out as to how far Self Help Groups and Skill development have been able to empower the women of rural areas in
village Ghagwal of Samba district and what challenges the various institutions and agencies involved face in the implementation process.
Key words: Skill Development, Self Help Groups, Socio-Economic, Rural, Entrepreneurship.
JEL Classification: C80, C83, I31, J24
INTRODUCTION
The concept “empowered women” is the result of numerous essential appraisal and disputes whipped
up by the women's movement throughout the world, particularly among the third world feminists. It has been
observed that in developing nations a number of women are helpless and marginalized due to unequal access to
resources and service opportunities. The overall development and harmonious growth particularly nation like
India is possible only when women are considered as equal partners in the developmental process.
With the formation of National Commission for Women in 1992, a series of other developmental
initiatives in India were brought into action for the development of socio-economic base of women that almost
constitute half of the total population of the country. In the post reforms era women’s participation started
getting recognition and the empowerment became central issues to human development programmes of our
developing economy. Despite the impetus at the policy level in the form of developmental programmes like
Support to Training and Employment Programme (STEP) for women, Integrated Scheme for Women
Empowerment (ISWE) and Gender Budgeting etc it has been noted that women in rural areas specifically from
lower strata could not receive the benefits thus remained marginalized. Women empowerment as a concept is
multidimensional in nature that extends to the psychological, economic, social, cultural, political and
institutional spheres of women's lives. Self employments in the form of self help groups (SHGs) however cannot
be considered to have achieved nothing so far, they have in fact emerged as the tool that wields power to create
socio-economic revolution in rural India.
____________________________________________________________
*Ms Sonam Sharma (Research Scholar), Department of PP&PA, Central University of Jammu , Rahya
Suchani, Samba 181143, India. Phone No. +919018225049, +919018139288,
E-mail: [email protected]
An independent, innovative and voluntary association of like minded women who have some familiar common
goal of social, economic and sexually empowerment forms a Self Help Group. The need for such informal
organisations were initially realised at the grass root level to empower the women, with the goal of introducing

Arth Anvesan, Volume 12 (1 & 2), 2017 ISSN: 0973-8193
2
gender equality, economic needs and impart self confidence among them. The formation of these innovative
and self employment groups besides a micro credit project is an empowerment process. This study thus discusses
working of these self help groups in the field for the women’s empowerment and analyses the mechanism of
their activities and the impact on their communities.
EMERGENCE
Post the world war second the European nations started restructuring their economies and focused
more on empowering the women folks. The countries like Germany and Britain started programmes like
Rotating Savings and Credit Associations (ROSCA). This concept evolved over time and pioneered by late
Noble laureate of Bangladesh Mohammad Yunus, as Self Help Groups (SHGs) in 1970s. Notably core
principles in both the ideas were same “the collateral of loan is trust and peer pressure”. He tried out a new
approach to rural credit in Bangladesh. In India NABARD -National Bank for Agriculture and Rural
Development initiated Self Help Groups (SHGs) in the year 1986-1987 but the real efforts were taken after
1991-1992 from the linkage of these associations with the banks. However this movement gained momentum
in India after 1992, when NABARD- National Bank for Agriculture and Rural Development realised its
potential and started promoting it. The endeavor was recognized by various state governments and the four core
southern Indian states, Andhra Pradesh, Tamil Nadu, Kerala and Karnataka established their respective
programmes. The movement got boost when government of India introduced Swarn Jayanti Gram Swarojgaar
Yojana (SGSY) to promote self employment in rural areas through formation and skilling of Self Help Groups
(SHGs). The programme evolved as a national movement in the year 2011 and became National Rural
Livelihoods Mission (NRLM).
“A self-help group is a registered or unregistered group of micro entrepreneurs having homogeneous
social and economic background voluntarily, coming together to save small amounts regularly to mutually agree
to contribute to a common fund and to meet their emergency needs on mutual help basis. The group members
use collective and wisdom pressure to ensure proper end use of credit and timely repayment thereof. In fact,
peer pressure has been recognized as an effective substitute for collaterals” as per the Reserve Bank of India.
As per guidelines of National Rural Livelihood Mission (NRLM) “A self help group is a village based
financial intermediary committee usually composed of 10–12 neighborhood women with maximum
homogeneity.” India is most SHG concentrated country around the globe. In the state of Jammu and Kashmir
the State Rural Livelihood Mission (JKSRLM) has authority to identify, organize, merge and train women
members from rural areas and provide them a platform to understand menace of poverty and strategically come
out of it by themselves. “A SHG is an informal association of 10 to 12 poor women belonging to the same
village and sharing a common socio-economic background. The group enables its members to gain their identity
as individuals, while realizing – and utilizing – the immense power of mutual aid”.
According to Primary Agriculture Cooperative Society (PACS) Self Help Group is a “group of
association of individuals with common economic needs who undertake a systematic economic activity
participating directly in decision making and sharing benefits on an equitable basis” (Gupta, 2003). Self help
groups has evolved into an organizational setup in which each group is assigned a name, opens and maintains a
saving account in bank and is provided with continuous trainings for initial days.
Each self help group follows five fundamental principles:
1. There are regular weekly meetings.
2. The group maintains regular weekly savings.
3. They have options for regular lending.
4. Prompt repayment.
5. The book or e-book keeping is also mandatory.
SELF HELP GROUPS AND SKILL DEVELOPMENT IN JAMMU AND KASHMIR
The state of Jammu and Kashmir being one of the highly disturbed states in India has not been
successful in tasting the fruits of post reform developmental model. In the past over six years, the government
has been trying to uplift the socio-economic condition of the people living in the state, through its various
entrepreneurial and skill developmental initiatives. The militancy driven era has contributed as much to the lack
of development of the region as has been due to its geographical terrain. In the border of Jammu and Kashmir
State, SHGs has been set up by the government as well as private players including non-governmental
organizations. The state government, under its centrally sponsored project National Rural Livelihood Mission
Arth Anvesan, Volume 12 (1 & 2), 2017 ISSN: 0973-8193
3
(NRLM) which has come to be known as NRLM (UMEED), J&K, has set up various SHGs in different blocks
of the two provinces of Jammu and Kashmir including Ladakh region. UMEED Mission in Jammu and Kashmir
has been formed to promote poverty reduction programmes in the state and restructure the grassroot institutions
for the marginalized section. The engagement of such communities into gainful livelihoods by making sure
significant enhancement in their income on a sustainable basis has been a priority for the state government.
Over the years these institutions have been quite active in providing opportunities to rural youth especially
women.
The UMEED scheme in the state so far has turned out to be highly useful for promoting skill and
generating livelihood opportunities. This mission helps in economic empowerment of women and encourages
people especially women folks to build their skill in different sectors including traditional Pashmina weaving.
The other areas where the impact has been realized are horticulture, agriculture, dairy farming, handicraft,
poultry farming, and saffron cultivation.
UMEED PROJECT
Constitution of State-wise Sub-Committees of State Level Banker’s Committee (SLBC) for SRLM
across the County was the initiative mooted by Ministry of Rural Development (MoRD), Government of India
in compliance with the Jammu and Kashmir State Government has comprised J&K State Rural Livelihood
Mission (JKSRLM) which is being run by the State Rural Livelihood Society under the name UMEED. UMEED
is an initiative that organizes the “Rural Women” into Self Help Groups and facilitates their right to use credit
for livelihood enhancement. Government has approved the UMEED as a special project, with an outlay of 755
Crore for the State of J&K that mandates coverage of 66percent of the rural households under the project. Over
the next 5 years Project UMEED will be implemented in all the Gram Panchyats with a target of formation of
90,000 SHGs across the State. UMEED was launched in April 2013 in Jammu region and in Kashmir region the
project was kick started in June 2013.
THE BASIC PRINCIPLE
The core principle of Self Help Groups (SHGs) is “one of all and all for one”. According to NABARD
-National Bank for Agriculture and Rural Development “Self Help Groups are small economical homogenous
affinity of rural poor voluntarily formed to save and mutually contribute a common fund to be lend to its
members as per its group decision”. The former rural development minister Jairam Ramesh once remarked “If
panchayats are institutions of representation, Women’s Self Help Groups are institutions of participation”. It is
quite evident with the democratic structure of such voluntary associations which work with a common interest
without any biased affiliations. The three tire structure at the grass root level i.e. Self Help Groups, Village
Level-Village Organization and Cluster Level has together expedited the economic growth in the rural areas.
SELF HELP GROUPS: NEW MEANS TO EMPOWER WOMEN
Empowerment and entrepreneurship through participation in Self Help Groups (SHGs) have the
potential to bring desirable changes and improve the standard of living of women in poor and developing nations
like India. Self Help Group is basically based on a practice of collective efforts by a group of independent and
innovative women with some familiar aims and objectives. This facilitation of coming together voluntarily and
show the enthusiasm in participating into the various developmental activities like savings, credit and income
generation has become essence of Self Help Groups. It is thus ensuring economic independence of each and
every member of the group.
The Self Help Groups (SHGs) developed by an NGO named ‘Besahara’ in various villages of Tehsil Hiranagar,
Kathua district of Jammu and Kashmir, have been found contributing way more those of men in returning loan
and performing rural activities like cultivation of crops, vegetables and fruits. Women SHGs formed under
Council for Advancement People’s Action and Rural Technology (CAPART) also went on very well at village
Barori, Khedian, Suchani in Samba district of Jammu. In cold arid zone of Ladakh, an SHG of local women
varying in numbers came together with dual purposes-to empower the women in the changing times and to
strengthen the indigenous culture and agriculture in their respective areas. They faced the similar problems and
together provided the solution. Some of the members claimed that “after becoming the member of self help
group, their sense of public participation broadened their possibility of participation in social activities,
increased their self-esteem, self-respect and their horizon of lives expanded”. It also increases the status of
women as participants, decision makers and beneficiaries in the democratic, economic, social and cultural

Arth Anvesan, Volume 12 (1 & 2), 2017 ISSN: 0973-8193
4
spheres of life. Thus these voluntary associations proved to be an effective means to authorize women socially
, economically and sexually as well as.
CASE
Jammu and Kashmir government has created State Rural Livelihoods Mission for
implementing NRLM in the state. The programmee has been named as “Umeed” which means “Hope”. Umeed
was launched in April 2013 in Jammu and Kashmir. The project was started in June 2013. Samba district
consists of four blocks: Samba, Vijaypur, Purmandal, and Ghagwal. The Programmee is currently operational
in block Ghagwal only. Besides having more than 500 SHGs the block also comprised of 10 Automatic Milk
Collection Centres (AMCC). All of these centers are registered under Umeed scheme and found mostly
managed by Self help Groups of the area. It has been observed that the Automatic Milk Collection Centres
(AMCC) has become a prompt solution to mechanize the milk collection process in these areas and making it a
well-organized activity. The process also consumes minimum time with the system incorporating full solution
right from capturing weight, measuring fat. It has also assisted in regularly checking the type of milk (Cow milk
or Buffalo milk) being sold in the nearby towns. On the basis of the parameters and quantities, it computes rate,
saves transaction record and prints the detail of transaction. The most important feature of the system is that it
allows less adulteration of milk which is because the rates are decided by the presence of content of fat in the
milk not by the quantity. These Automatic Milk Collection Centres (AMCCs) were initially inaugurated at
Madwal and Paloora village of Ghagwal village which are managed by the women connected with Self Help
Groups (SHGs) which have been created under Umeed scheme of National Rural Livelihood Mission (NRLM)
in collaboration with Jammu and Kashmir Milk Producers Cooperative limited (JKMPCL).
Table 1.1: Ghagwal block
Total Number of
Panchyats
Total Number of
villages
Total Number of
Households
Total Number of
SHGs
AMCCs
(Automatic Milk
Collection
Centres)
17 62 4558 502 10
Source: JKSRLM, Ghagwal Block
Economic development is the key for the social development and for this the financial inclusion of the
women is the primary and most important step. The SHGs are medium of the financial inclusion and economic
development of the women. There are 4558 household in the ambit of Programme spread across 17 Panchyats
and 62 villages in block Ghagwal. 467 SHGs were formed with 4613 women members. These SHGs has been
federated in 45 Village level organizations and Six Cluster level Federations. Through SHGs women are feeling
economically self-reliant which encourages economic empowerment of women and access loans at their will
wider an opportunity for women to undertake an economic activities, Increase in mobility, creates awareness of
local issues, banking transactions, Promotes skills for income generation, enhancement of decision-making
within the family as well as in the social institutions, Increase in mobilization of groups in support of individual
clients and social Issues, actively participates in community development activities. SHG also form federations
at village level and cluster level which also acts as financial institutions at gross root level.
Table 1.2: Status of Education and Sex Ratio Sex Ratio Literacy Rate Gaps in literacy rate
Sex Ratio Sex Ratio Literacy Rate Total Gaps in literacy rate
Male Female
Ghagwal Block 885 89.68 74.51 74.51 15 %
Samba 886 88.41 73.64 81.41 15 %
Jammu and Kashmir 883 78.26 58.01 82.47 19.99 %
Source: Census 2011
In Jammu and Kashmir, the status of women is also not good as the literacy rate is just 58.01percent
and one of the future challenge emerges is the decline in the sex ratio which is 883/1000 males. Female
population in J&K 46.88percent of the total population in (census 2011), but the role of women in economic
contribution is not satisfactory. The table 1.2 shows the status of work force in district Samba and block

Arth Anvesan, Volume 12 (1 & 2), 2017 ISSN: 0973-8193
5
Ghagwal. This clearly shows that there is a huge gap between the work of the male and female force ratios
which need to be minimizing by providing the opportunity to women to take part actively n economic activities.
Thus Self Help Groups has huge potential for economic development particularly for rural women.
PROFILE OF VILLAGE GHAGWAL
According to the census data 2011, Ghagwal is village located in Samba district of Jammu and
Kashmir. Total 317 families live in the village Ghagwal and mostly are resided by the farmers whose economy
is sustainable in nature . The social structure of the village is comprised of Schedule Caste (SC) and schedule
tribes. Schedule Caste (SC) constitutes 43.16 percent while Schedule Tribe (ST) was 0.66 percent of total
population in village Ghagwal. Average Sex Ratio of Ghagwal village is 929 and is much higher than the state
itself i.e. 889.
Table 1.3: Statistics regarding the Village Ghagwal
Details Total No. of Male No. of Female
Total No. of Households 317 - -
Population of village Ghagwal 1520 788 732
Child population (0-6) 194 112 82
Population of Schedule Caste (SC) 656 335 321
Population of Schedule Tribe (ST) 10 4 6
Literacy rate 83.56 % 91.72 % 75.08 %
Total Workers 390 354 36
Main Worker 288 0 0
Marginal Worker 102 97 5
Source: Census 2011
As per the census 2011, the child sex ratio of village Ghagwal is 732, which is lower than the State
i.e. 862. Ghagwal village also has high literacy rate compared to the state level. In 2011, literacy rate of
Ghagwal village was 83.56percent while as that of state was 67.16 percent. In Ghagwal Male literacy stands at
91.72 percent while female literacy rate is 75.08 percent owing to the reasons like illiteracy etc. According to
the constitution of India and Panchayati Raj Act, Ghagwal is administrated by a Sarpanch (Head of the Village).
The Sarpanch in India is elected representative of a village. The working population status of the village
Ghagwal shows that out of the total population, 390 people are involved in work activities. 73.85per cent of the
workers claim their work as main work (Employment or Earning more than 6 Months) as their occupation, while
26.15 percent are engaged in marginal activities which provides livelihood for less than 6 months.
The source of motivation and strengthen to these women in Ghagwal village that lead them to come
together making themselves empowered is that the women of different age groups come together which makes
them more efficient and successful in their endeavors. No doubt the SHGs have generated many Self-
employment opportunities for the women in these villages and changed many by improving their economic
conditions by not only providing the value addition to their existing livelihoods but also provide the SHG
members a financial support to start new livelihoods. But all the efforts by the state financial institutions
ultimately depend on these brave women who work hard to make their lives better off.
Table 1.4 Age group of members in SHGs in Village Ghagwal
Age Group (years) No of Members Percentage (%)
18-24 18 9.32
25-30 47 24.35
31-36 32 16.58
37-42 30 15.51
43-48 23 12.10
49-54 20 10.36
55-60 15 7.77
60 and Above 8 4.14
TOTAL 193 100
Source: Field Survey
Arth Anvesan, Volume 12 (1 & 2), 2017 ISSN: 0973-8193
6
In a modern market economy the women folks are essential for the advancement of the society thus they need
to be empowered in all the aspects of their lives. More possibilities would be explored if the associations like
self help groups get the necessary market support and their products are sold across the country at good prices.
It is in this context that the project Umeed aims to help the women living in the rural areas to contribute in their
family incomes and meet the expenses of their families thus making women independent both economically
and socially.
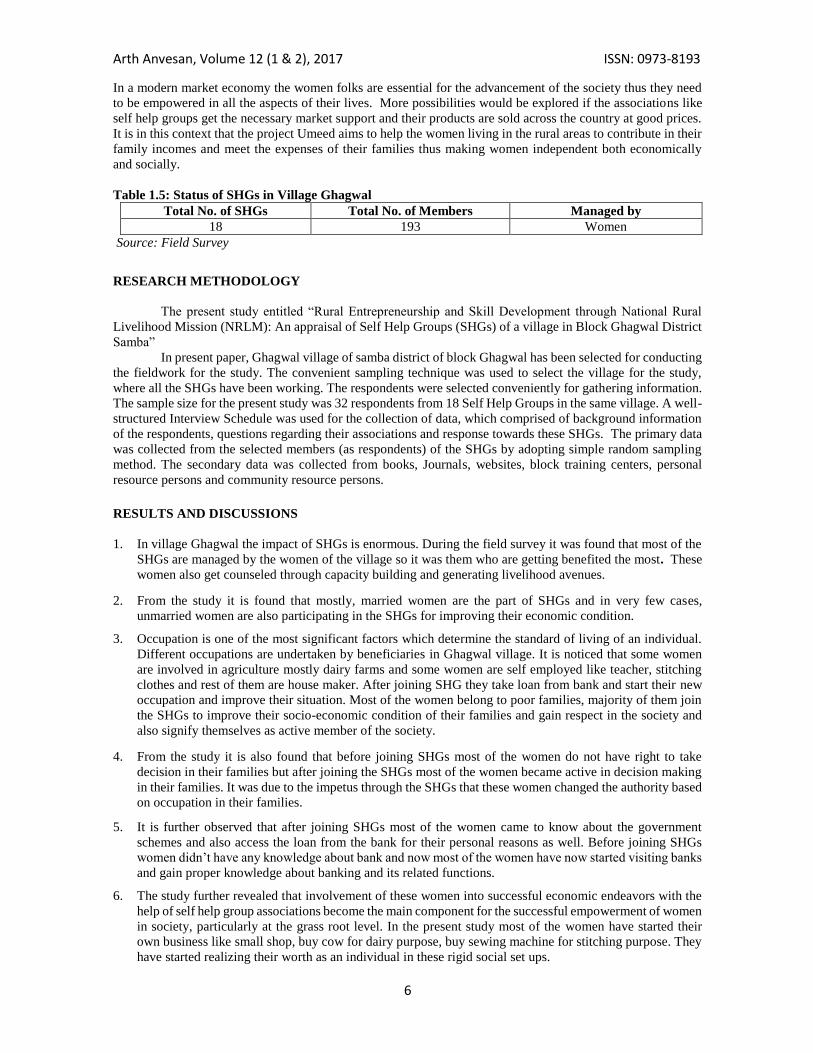
Table 1.5: Status of SHGs in Village Ghagwal
Total No. of SHGs Total No. of Members Managed by
18 193 Women
Source: Field Survey
RESEARCH METHODOLOGY
The present study entitled “Rural Entrepreneurship and Skill Development through National Rural
Livelihood Mission (NRLM): An appraisal of Self Help Groups (SHGs) of a village in Block Ghagwal District
Samba”
In present paper, Ghagwal village of samba district of block Ghagwal has been selected for conducting
the fieldwork for the study. The convenient sampling technique was used to select the village for the study,
where all the SHGs have been working. The respondents were selected conveniently for gathering information.
The sample size for the present study was 32 respondents from 18 Self Help Groups in the same village. A well-
structured Interview Schedule was used for the collection of data, which comprised of background information
of the respondents, questions regarding their associations and response towards these SHGs. The primary data
was collected from the selected members (as respondents) of the SHGs by adopting simple random sampling
method. The secondary data was collected from books, Journals, websites, block training centers, personal
resource persons and community resource persons.
RESULTS AND DISCUSSIONS
1. In village Ghagwal the impact of SHGs is enormous. During the field survey it was found that most of the
SHGs are managed by the women of the village so it was them who are getting benefited the most. These
women also get counseled through capacity building and generating livelihood avenues.
2. From the study it is found that mostly, married women are the part of SHGs and in very few cases,
unmarried women are also participating in the SHGs for improving their economic condition.
3. Occupation is one of the most significant factors which determine the standard of living of an individual.
Different occupations are undertaken by beneficiaries in Ghagwal village. It is noticed that some women
are involved in agriculture mostly dairy farms and some women are self employed like teacher, stitching
clothes and rest of them are house maker. After joining SHG they take loan from bank and start their new
occupation and improve their situation. Most of the women belong to poor families, majority of them join
the SHGs to improve their socio-economic condition of their families and gain respect in the society and
also signify themselves as active member of the society.
4. From the study it is also found that before joining SHGs most of the women do not have right to take
decision in their families but after joining the SHGs most of the women became active in decision making
in their families. It was due to the impetus through the SHGs that these women changed the authority based
on occupation in their families.
5. It is further observed that after joining SHGs most of the women came to know about the government
schemes and also access the loan from the bank for their personal reasons as well. Before joining SHGs
women didn’t have any knowledge about bank and now most of the women have now started visiting banks
and gain proper knowledge about banking and its related functions.
6. The study further revealed that involvement of these women into successful economic endeavors with the
help of self help group associations become the main component for the successful empowerment of women
in society, particularly at the grass root level. In the present study most of the women have started their
own business like small shop, buy cow for dairy purpose, buy sewing machine for stitching purpose. They
have started realizing their worth as an individual in these rigid social set ups.
Arth Anvesan, Volume 12 (1 & 2), 2017 ISSN: 0973-8193
7
7. The field study of SHGs in Ghagwal village clearly shows that Umeed programmee is snowballing into a
successful project and is bridging the gap between rich and poor lives. The programmee seems to be very
flourishing in reaching poor people. The study also explains that there is undoubtedly a change among the
rural women in Ghagwal village of Samba district. The empowerment levels of women are visible at four
levels: the individual, the household, the self-help groups/enterprise and at the community level.
8. It has also been noted that the orthodox perceptions among the village patriarch towards the women
members of self help group disappeared once the economic independency started creating assurance for
societal, financial self-reliance among these women members. The rural poor women now experience that
they can also be associated with the development of rural areas by joining the SHG movement.
9. These SHGs has been found playing a very important role in social change especially providing opportunity
for many women to start their own business enterprises and make their living at their own. These
associations not only brought change within a particularly community but also crossed the barriers of caste,
creed and sex. Also they not only change the material aspect of life of these individuals also their attitude
towards life i.e. psychological.
10. Communication skills of the women also improved and now they feel quite confident to communicate with
other members of the society, Panchayat leaders, family members etc. Their confidence level have
increased manifold.
11. These SHGs have helped the women to resolve the community issues related to health, sanitation and
education.
12. The source of motivation and strengthen to these women in Ghagwal village that lead them to come together
making themselves empowered is that the women of different age groups come together which makes them
more efficient and successful in their endeavours.
SUGGESTIONS
To make the SHGs really significant and successful, the government, at different levels has to get
involved in a large scale not as provider of finance or provider of other inputs, but as facilitator and
supporter.
Governments must take a step to make rural people more conscious about the functions of these income
generating schemes and also need to convey them that the SHGs are not only the chief means of rural
service creation but also support to resolve the issues like unemployment of rural population.
General awareness programmes should be conducted among the working women of these SHGs to sensitize
them about the self help groups and their great role in poverty alleviation in a developing economy like
India.
There should be more private organizations participating in SHGs related endeavours at the grass root level.
The SHGs should also be empowered with the latest Information, communication and technology benefits.
CONCLUSION
The concept of SHG has large scope in the present universal unemployment situation. The Self- Help
Groups have indeed definitely contributed towards the progress of rural masses and has been successful in
creating an environment of skill development and entrepreneurship. The study also explains that there is
undoubtedly a change among the rural women in Ghagwal village of Samba district. The empowerment
levels of women are visible at four levels: the individual, the household, the self-help groups/enterprise and
at the community level. The major findings in the study justify the superior role played by the SHGs in
increasing empowerment of women, by making them financially strong, as well as it helped them to save
amount of money and invest it in further development. It is also found that the SHGs created confidence
for social, economic self-reliance among the members; the rural poor women now feel that they can also
be partners in the process of rural development by joining the SHG movement. These SHGs play a very
important role in social change especially providing opportunity for many women to start their own
business enterprises and make their living at their own. SHG not only changes the outer form of a
community or a society but also the social institutions as well as ideas of the people living in the society.
In other words it also applies to the changes in the material aspects of lives as well as in the ideas, values
and attitudes of the people. SHGs act like blueprint to successful life for these women living in villages.

Arth Anvesan, Volume 12 (1 & 2), 2017 ISSN: 0973-8193
8
REFERENCES
Biradar, B. (2014). Effects of Self Help Groups to Empowerment of Women in Rural Area of Bellary
District. International Journal of Economic and Bussiness Review, 2(8), 84-89.
Creswell, J. W. (2009). Research Design Qualitative, Quantative and Mixed Methods Approaches. 3rd ed.
United States of America: Sage Publication.
C.Maindargi, S. (2016). A Study on Impact of SHG through Microfinance on Women Empowerment with
Special Refrence to Solapur City (Maharashtra). International Journal of Research in IT, Management and
Engineering, 6(3), 1-15.
Rural Development through SHGs. (2014, February 6). Excelsior Daily. Retrieved from
http//dailyexcelsior.com/rural-development.through.shgs/
What is next for Self Help Group Movement in India? . (2018, June 29). India Times. Retrieved from
http//timesofindia.indiatimes.com/blogs/voices/.
Khurshid, N., (2015). Women and Self-Help Groups in Kashmir. IOSR Journal Of Humanities And Social
Science, 20(2), 30-33.
Kumar, R. (2014). Research Methodology A Step-by-Step Guide for Beginners. 4th ed. New Delhi: Sage
Publication.
Sahoo, A. (2013). Self Help Group & Woman Empowerment: A Study on Some Selected SHGs.
International Journal of Business and Management Invention, 2(9), 54-61.
Sandhu, G. K. (2013). A Study Of Norms And Functioning Of Self Help Groups (SHGs) In Punjab. Journal
of Business Management & Social Sciences Research , 2(8), 32-37.
Singh, T. K. A. R. (2014). Micro Financing Schemes & Their Impact on Poverty Reduction - A Study
Conducted on Members of Self Help Groups in Punjab (India). International Journal of Research-
Granthaalayah, 2(2), 84-98.
Singh, L. S. A. C. S. (2015). Women Empowerment through Microfinance (SHGs): A Study of Ajmer
District, Rajasthan, India. International Research Journal of Social Sciences, 4(11), 1-6.
Sreedhar, N. (2012). Self Help Groups Performance in India. A Journal of Economics and Management,
1(8), 8-15.
Qasba, G. N., Sharma. Kapil., Bhat. M. Y & Asif. (2016). Financial Inclusion and Women Empowerement:
JKSRLM (UMEED) in context "International Journal of Humanities and Social Sciences studies,2 (5).

Arth Anvesan, Volume 12 (1 & 2), 2017 ISSN: 0973-8193
9
Consumer Online Search Behavior and Intention to Buy from E-tail Stores
Dr. Amit Kishore Sinha* Dr. Gyanendra B.S. Johri** Dr. Sandeep Singh***
ABSTRACT
This research work aims to study the relationship between consumer online pre-purchase search behavior in recent past with their future buying intention to buy products from e-tail stores. For the purpose of studying this relationship primary data has been collected from 500
respondents. Data has been collected from four tier-II cities of Madhya Pradesh from the respondents who had purchased at least once in
last one year from online stores. Online survey method has been used for the purpose of data collection. As an outcome it was found that
consumers who are spending more time on e-tail websites and search various information about required products are showing very
favorable intention to make purchases in comparison to those consumers who are spending lesser time on such website, before making
online purchases.
Keywords: Consumer Behavior, Pre and Post Purchase behavior, E-tail Stores
JEL Classification: C9, D10, D91
INTRODUCTION
Since 2005 with the entry of e-bay in India consumers first time got the flavour of shopping through internet
using a stable platform (e-bay online). Following the e-bay, Flipkart also started operations here in 2007 (flipkart
stories) and made offers through internet based portal; therefore a new era of online shopping started off with
full swing in India. In entire world, during start of online shopping browsing rate was pretty higher in
comparison to actual purchase of products. Same pattern was followed in India too. In the early years Indian
consumers were also searching more on such internet based e-tail stores with less intention to purchase products.
Possibly consumers were more inclined towards browsing the internet for the sake of information and
entertainment. Slows things started changing and consumers started purchasing from e-tail stores. But still there
is a question that whether persons who are searching the products on e-tail stores are they really willing to make
purchases from there. Therefore research work focuses to know that persons who are spending more time on
such e-tail websites before making purchases, whether their intention to purchase in future is different from
persons who spending comparatively less time before making any online purchase.
_______________________________________
*Associate Professor, Department of Management, School of Management Sciences, Varanasi
Email: [email protected], Mob: 9451744577
** Associate Professor, Department of Tourism, IGNTU, Amarkantak, M.P.
*** Professor, Department of Management, School of Management Sciences, Varanasi
Arth Anvesan, Volume 12 (1 & 2), 2017 ISSN: 0973-8193
10
REVIEW OF LITERATURE
Related to consumer online search behaviour – Several researchers have included time spent by consumers on
e-tail website before making purchases. Klein (1998) has emphasized on the importance of pre-purchase search
of goods through internet as this attract very less cost in comparison to traditional stores. He has also framed a
model of predictors of consumer buying behaviour and gave importance place to consumer pre-purchase
searching of goods in his model. He also narrated that search behaviour of consumer also depends upon
consumer experience and psychological factors. It is also said that transaction cost of executing pre-purchase
search is an important predictor in consumer buying decisions (Liang and Huang, 1998). Few scholars
((Dowling, 1986; Mitchell & Boustani, 1994) opined that consumer pre-purchase search orientation depends
upon their opinion about risk attached to the buying decisions. If they believe that risk is higher they like to
spend more time on pre-purchase search. Eastlick stated that possibly consumers would like to search before
making any online purchase as this is a comparatively new stream of buying (Eatslick, 1996). Consumer can
easily get the much detailed information about the product by searching the same through interactive media of
internet (Bakos,1991). This benefit of can easily be attained by those customers who comparatively time starved
in their routine (Beatty and Smith 1987).
Related to consumer intention to buy from e-tail stores – Shim in his work of model development for online
search concluded that internet purchase intentions significantly depend upon internet search behaviour (Shim
et.al. 2001). He also stated that consumers who search information from a specific medium (online or offline)
they generally prefer the same medium for purchasing the searched goods. Few scholars opined that this relation
is very complex and influenced by various other factors (Olafson, 2011, Darden & Dorsch, 1990). He further
suggested organizations should prepare a harmonious strategy by using a combination of online and offline
mediums. Therefore an e-tail store should also try to have physical stores for better promotion of their brand
and products.
OBJECTIVE
After going through review of literature it become quite clear that there are various dimensions of consumer
online purchase intention. In the present research work one specific objective has been formulated on the basis
of above mentioned review. Objective is –
To Study the relationship between consumer online pre-purchase search behaviour and their online buying
tendency
HYPOTHESIS
In line with above mentioned objective Null Hypothesis simply comes out as-
H01 : There is no significant relationship between consumer online pre-purchase search behaviour and their
online buying intention.
RESEARCH METHODOLOGY
Data collection is being done from respondents of select cities. Online survey method is used for primary data
collection from respondents. Selected four tier-II cities of Madhya Pradesh are Jabalpur, Bhopal, Indore and
Gwalior. These cities are chosen for the purpose of survey as Madhya Pradesh state has only four tier-II cities.
Tier-II cities are preferred also because these cities are passing through developing stage. Therefore these cities
have significant scope for online stores. Sample size of the study is 500 respondents. Total 583 responses are
received, out of which 500 responses are selected for the purpose of study. Structured questionnaire was used
for the purpose of survey. In the present research work primarily two statements are picked for the purpose of
analyzing the research problem mentioned in objective section. Two statements are-
Statement 1: I search a lot to get the best deal before buying a product from online store
Statement 2: Possibly I will do more buying from online stores in future
Arth Anvesan, Volume 12 (1 & 2), 2017 ISSN: 0973-8193
11
Through first statement consumer’s online search habit before purchasing a product from online store, is
discussed. Second statement deals with consumer intention to make purchases from online stores in near future.
Research work is empirical in nature as major findings are discussed in light of primary data collected from
respondents. Consumers who had purchased goods from online stores in last one year time period were used as
sample unit. In both the statements customers were needed to reply through five point scale. Scale had options
ranging from Strongly Disagree (1), Disagree (2), Not sure (3), Agree (4) & Strongly Agree (5). For the purpose
of reliability of statements used in questionnaires Cronbach’s Alpha is used. Cronbach’s Alpha value for the
statements is 0.707 which is comfortable acceptable as per established standards. For validity testing expert
opinion and pilot survey is executed and statements are reframed accordingly.
ANALYSIS
During the analysis consumer online search behavior and their online buying intention in near future has been
analyzed. Primarily online search behavior has been analyzed using frequency distribution, mean values and
ANOVA. Mean values and standard deviation of online buyers for their pre-purchase search behavior has been
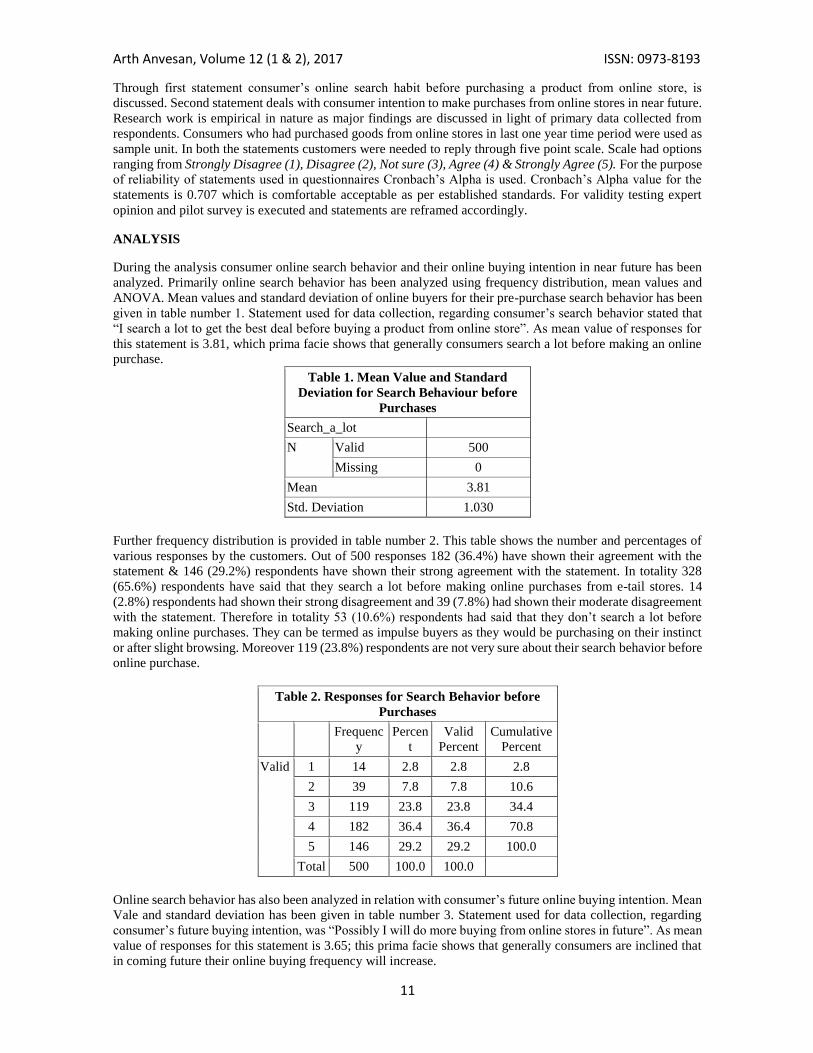
given in table number 1. Statement used for data collection, regarding consumer’s search behavior stated that
“I search a lot to get the best deal before buying a product from online store”. As mean value of responses for
this statement is 3.81, which prima facie shows that generally consumers search a lot before making an online
purchase.
Table 1. Mean Value and Standard
Deviation for Search Behaviour before
Purchases
Search_a_lot
N Valid 500
Missing 0
Mean 3.81
Std. Deviation 1.030
Further frequency distribution is provided in table number 2. This table shows the number and percentages of
various responses by the customers. Out of 500 responses 182 (36.4%) have shown their agreement with the
statement & 146 (29.2%) respondents have shown their strong agreement with the statement. In totality 328
(65.6%) respondents have said that they search a lot before making online purchases from e-tail stores. 14
(2.8%) respondents had shown their strong disagreement and 39 (7.8%) had shown their moderate disagreement
with the statement. Therefore in totality 53 (10.6%) respondents had said that they don’t search a lot before
making online purchases. They can be termed as impulse buyers as they would be purchasing on their instinct
or after slight browsing. Moreover 119 (23.8%) respondents are not very sure about their search behavior before
online purchase.
Table 2. Responses for Search Behavior before
Purchases
Frequenc
y
Percen
t
Valid
Percent
Cumulative
Percent
Valid 1 14 2.8 2.8 2.8
2 39 7.8 7.8 10.6
3 119 23.8 23.8 34.4
4 182 36.4 36.4 70.8
5 146 29.2 29.2 100.0
Total 500 100.0 100.0
Online search behavior has also been analyzed in relation with consumer’s future online buying intention. Mean
Vale and standard deviation has been given in table number 3. Statement used for data collection, regarding
consumer’s future buying intention, was “Possibly I will do more buying from online stores in future”. As mean
value of responses for this statement is 3.65; this prima facie shows that generally consumers are inclined that
in coming future their online buying frequency will increase.

Arth Anvesan, Volume 12 (1 & 2), 2017 ISSN: 0973-8193
12
Table 3. Mean Value and Standard
Deviation for Intention to buy in
Future
Buy_more_in_Future
N Valid 500
Missing 0
Mean 3.65
Std. Deviation .997
Afterwards frequency distribution for the future buying possibility is provided in table number 4. This table
clearly shows the number and percentages of various responses by the customers regarding their future online
buying intention. Among 500 respondents 199 (39.8%) have shown their agreement with the statement & 100
(20%) respondents have shown their strong agreement with the statement. In totality 299 (59.8%) respondents
have said that they might purchase more frequently from online stores in near future, in comparison to recent
past. 17 (3.4%) respondents had shown their strong disagreement and 40 (8%) had shown their mild
disagreement with the statement. Therefore in totality 57 (11.4%) respondents had said that possibly their online
buying frequency will not increase in near future. Further 144 (28.8%) respondents are not sure about their
possible online purchase frequency in near future.
Table 4. Responses for Intention to buy in Future
Frequenc
y Percent
Valid
Percent
Cumulativ
e Percent
Valid 1 17 3.4 3.4 3.4
2 40 8.0 8.0 11.4
3 144 28.8 28.8 40.2
4 199 39.8 39.8 80.0
5 100 20.0 20.0 100.0
Tota
l 500 100.0 100.0
Besides descriptive analysis of consumer’s pre-purchase searching behavior and future buying intention it is
also important to statistically analyze their relationship. For this purpose ANOVA (analysis of Variance) has
been used by the researcher. In the SPSS consumer pre-purchase online search behavior has been taken as Factor
and their possible future buying frequency has been taken as dependent item. Through analysis table number 5
is generated. As given in table, F-calculated value is 9.147 which is much higher than F-table value 2.67 and
calculated p-value is 0.000 which is less than 0.05. Therefore it can be said that consumer online buying
intention changes for different groups formed on the basis of their pre-purchase search behavior towards online
shopping.

Arth Anvesan, Volume 12 (1 & 2), 2017 ISSN: 0973-8193
13
Table 5. ANOVA between Groups Search Behavior and Intention
to Buy
Buy_more_in_Future
Sum of
Squares Df
Mean
Square F Sig.
Between
Groups 34.122 4 8.530 9.147 .000
Within Groups 461.628 495 .933
Total 495.750 499
Further mean values of future buying possibility for different groups of pre-purchase consumer behavior is
available in table number 6. By looking at the table it can be inferred that as consumer online search frequency
is increasing, their buying intention is also increasing. Whether these groups of different mean value are
significantly different, this can be analyzed through table number 7 representing ANOVA.
Table 6. Mean Values of different Buying Groups for
different Pre-Purchase Search Behaviour
Buy1 Buy2 Buy3 Buy4 Buy5
N Valid 14 39 119 182 146
Mean 2.79 3.08 3.57 3.68 3.91
Std. Deviation 1.311 1.244 .829 .939 .982
Table number 7 is providing Multiple Comparisons between two factor groups. Multiple Comparisons among
factors have been classified under table 7A to 7E. These tables clearly show that the manner in which values of
possible future online buying frequency changes with respect to different pre-purchase search behavior groups
formed. Table 7A shows that how the values of consumer future online buying possibility of very low pre-
purchase search group customers (mean value 1) varies for few other groups of consumer’s pre-purchase
behavior. According to significance value (p-value) group 1 is significantly different from group 3, 4, 5 as their
significance values (0.042, 0.009 and 0.000 subsequently) are less than 0.05. Therefore it can be said that values
of consumer future online buying possibility for those who do not search a lot prior to buying are significantly
different from customers who search a lot.
Table 7A: Multiple Comparisons for different Search Groups
between Group 1 and other Groups
Buy_more_in_Future
Bonferroni
(I)
Search_
a_lot
(J)
Search_
a_lot
Mean
Differen
ce (I-J)
Std.
Error Sig.
95% Confidence
Interval
Lower
Bound
Upper
Bound
1 2 -.291 .301 1.000 -1.14 .56
3 -.786* .273 .042 -1.56 -.02
4 -.896* .268 .009 -1.65 -.14
5 -1.125* .270 .000 -1.89 -.36
*. The mean difference is significant at the 0.05 level.
Table 7B shows that how the values of consumer future online buying possibility of moderately low pre-
purchase search group customers (mean value 2) varies for few other groups of consumer’s pre-purchase
behavior. According to significance value (p-value) group 2 is significantly different from group 4, 5 as their
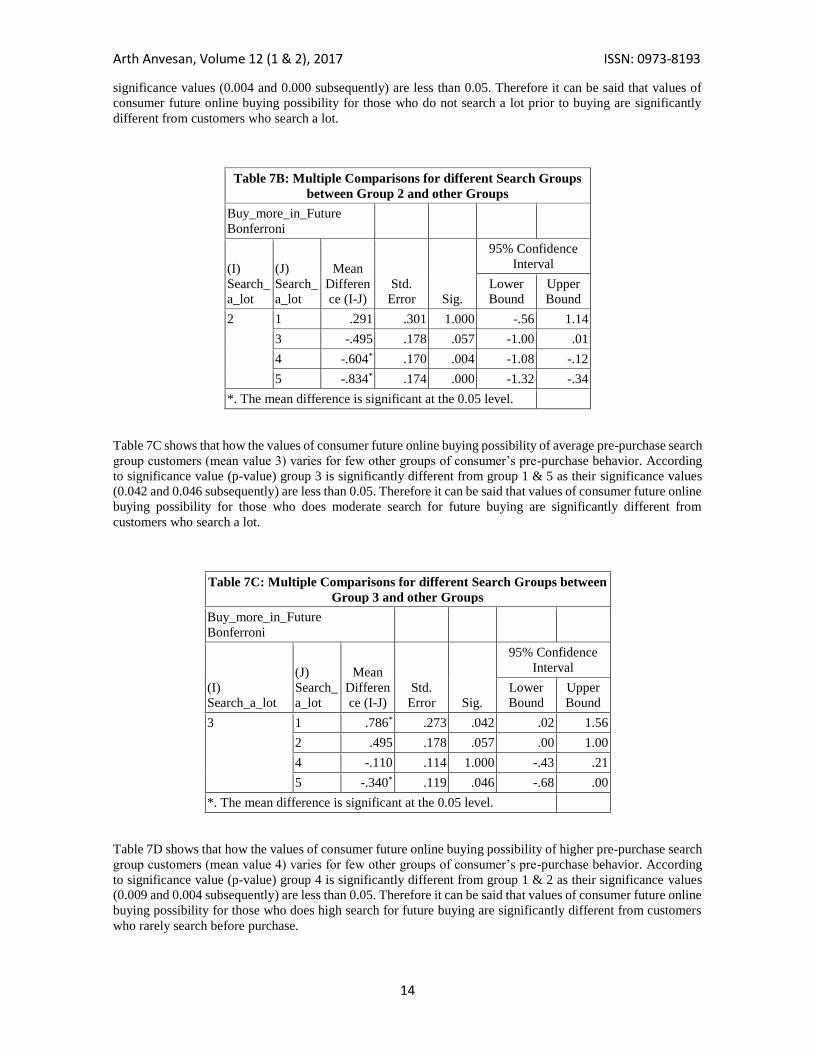
Arth Anvesan, Volume 12 (1 & 2), 2017 ISSN: 0973-8193
14
significance values (0.004 and 0.000 subsequently) are less than 0.05. Therefore it can be said that values of
consumer future online buying possibility for those who do not search a lot prior to buying are significantly
different from customers who search a lot.
Table 7B: Multiple Comparisons for different Search Groups
between Group 2 and other Groups
Buy_more_in_Future
Bonferroni
(I)
Search_
a_lot
(J)
Search_
a_lot
Mean
Differen
ce (I-J)
Std.
Error Sig.
95% Confidence
Interval
Lower
Bound
Upper
Bound
2 1 .291 .301 1.000 -.56 1.14
3 -.495 .178 .057 -1.00 .01
4 -.604* .170 .004 -1.08 -.12
5 -.834* .174 .000 -1.32 -.34
*. The mean difference is significant at the 0.05 level.
Table 7C shows that how the values of consumer future online buying possibility of average pre-purchase search
group customers (mean value 3) varies for few other groups of consumer’s pre-purchase behavior. According
to significance value (p-value) group 3 is significantly different from group 1 & 5 as their significance values
(0.042 and 0.046 subsequently) are less than 0.05. Therefore it can be said that values of consumer future online
buying possibility for those who does moderate search for future buying are significantly different from
customers who search a lot.
Table 7C: Multiple Comparisons for different Search Groups between
Group 3 and other Groups
Buy_more_in_Future
Bonferroni
(I)
Search_a_lot
(J)
Search_
a_lot
Mean
Differen
ce (I-J)
Std.
Error Sig.
95% Confidence
Interval
Lower
Bound
Upper
Bound
3 1 .786* .273 .042 .02 1.56
2 .495 .178 .057 .00 1.00
4 -.110 .114 1.000 -.43 .21
5 -.340* .119 .046 -.68 .00
*. The mean difference is significant at the 0.05 level.
Table 7D shows that how the values of consumer future online buying possibility of higher pre-purchase search
group customers (mean value 4) varies for few other groups of consumer’s pre-purchase behavior. According
to significance value (p-value) group 4 is significantly different from group 1 & 2 as their significance values
(0.009 and 0.004 subsequently) are less than 0.05. Therefore it can be said that values of consumer future online
buying possibility for those who does high search for future buying are significantly different from customers
who rarely search before purchase.

Arth Anvesan, Volume 12 (1 & 2), 2017 ISSN: 0973-8193
15
Table 7D: Multiple Comparisons for different Search Groups
between Group 4 and other Groups
Buy_more_in_Future Bonferroni
(I)
Search_
a_lot
(J)
Search_
a_lot
Mean
Differen
ce (I-J)
Std.
Error Sig.
95% Confidence
Interval
Lower
Bound
Upper
Bound
4 1 .896* .268 .009 .14 1.65
2 .604* .170 .004 .12 1.08
3 .110 .114 1.000 -.21 .43
5 -.230 .107 .328 -.53 .07
*. The mean difference is significant at the 0.05 level.
Table 7E shows that how the values of consumer future online buying possibility of very high pre-purchase
search group customers (mean value 5) varies for few other groups of consumer’s pre-purchase behavior.
According to significance value (p-value) group 5 is significantly different from group 1, 2 & 3 as their
significance values (0.000, 0.000 and 0.046 subsequently) are less than 0.05. Therefore it can be said that values
of consumer future online buying possibility for those who does very high search for future buying are
significantly different from customers who rarely search or moderately search before purchase.
Table 7E: Multiple Comparisons for different Search Groups
between Group 5 and other Groups
Buy_more_in_Future
Bonferroni
(I)
Search_
a_lot
(J)
Search_
a_lot
Mean
Differen
ce (I-J)
Std.
Error Sig.
95% Confidence
Interval
Lower
Bound
Upper
Bound
5 1 1.125* .270 .000 .36 1.89
2 .834* .174 .000 .34 1.32
3 .340* .119 .046 .00 .68
4 .230 .107 .328 -.07 .53
*. The mean difference is significant at the 0.05 level.
TESTING OF HYPOTHESIS
As mentioned in hypothesis heading present research work assumed that there is no relationship between
consumer online pre-purchase search behavior and their online buying intention. After detailed analysis of
primary data collected for the purpose it was found that consumer online buying intention is changing
significantly for various groups of consumers having different habits of searching on the web before making
purchases from online stores. This got confirmed as significance values among various groups are less than
0.05. This ensures that consumer online buying intention is different for various groups of consumers formed
on the basis of their pre-purchase search behavior. Therefore null hypothesis can be rejected on the basis of
above analysis.

Arth Anvesan, Volume 12 (1 & 2), 2017 ISSN: 0973-8193
16
CONCLUSION
Research work has objective to identify the relationship between consumer online pre-purchase search behavior
and their intention to purchase from such e-tail websites. After analyzing the primary data it can be inferred that
the consumers who are taking more time in making purchase online purchases their intention to purchase from
e-tail stores is comparatively positive. It can also be said that consumers who are appearing more sincere in
buying process and using their rational before buying they are more potential future buyers (high mean value)
of e-tail websites. On the other side, customers who are purchasing products from e-tail stores in a lot hurry and
not spending time on websites, they are not appearing such potential customers for future days as their buying
intention for future (low mean value) is not that much positive. In nutshell it can be said that e-tail stores should
have focus on those buyers who not just purchasing on impulse but spending some time on website before
purchasing goods.
References
Bakos, J. Y. (1991). A strategic analysis of electronic marketplaces. MIS Quarterly, 295–310.
Beatty, S. A., & Smith, S. M. (1987). External search effort: an investigation across several product
categories. Journal of Consumer Research, 14(1), 83–95.
Darden, W. R., & Dorsch, M. J. (1990). An action strategy approach to examining shopping behaviour.
Journal of Business Research, 21(3), 289–308.
Dowling, G. R. (1986). Perceived risk: the concept and its measurement. Psychology and Marketing, 3(3)
193–210.
Eastlick, M. A. (1996). Consumer intention to adopt interactive teleshopping. Report-Marketing Science
Institute Cambridge Massachusetts.
E-bay Online media centre. (2018, May 15). eBay comes to India - India gets a new address on the globe
Retrieved from https://pages.ebay.in/community/aboutebay/news/pressreleases/corporate/globe.html
Flipkart Stories. (2018, May 25). 10 years of flipkart – a timeline of milestones. Retrieved from
https://stories.flipkart.com/10-years-timeline-milestones/
Klein, L. R. (1998). Evaluating the potential of interactive media through a new lens: Search versus
experience goods. Journal of business research, 41(3), 195-203.
Liang, T. P., & Huang, J. S. (1998). An empirical study on consumer acceptance of products in electronic
markets: a transaction cost model. Decision support systems, 24(1), 29-43.
Mitchell, V. W., & Boustani, P. (1994). A preliminary investigation into pre-and post-purchase risk
perception and reduction. European Journal of Marketing, 28(1), 56-71.
Olafson, E. (2001). Multichannel retailing clicks. Chain Store Age, 77(1), 88.
Shim, S., Eastlick, M. A., Lotz, S. L., & Warrington, P. (2001). An online prepurchase intentions model: the
role of intention to search: best overall paper award—the sixth triennial AMS/ACRA retailing conference,
2000☆ 1. Journal of retailing, 77(3), 397-416.
Arth Anvesan, Volume 12 (1 & 2), 2017 ISSN: 0973-8193
17
Contingent Valuation Method to Assess Impact of Temporary Shrinkage of the
Kabar Wetland on the Willingness to Accept Values in Bihar
*Dr. Deepti Sharma, **Dr. Nisha Pandey
ABSTRACT
Using the Contingent Valuation Method (CVM) for assigning a price tag to natural ecosystems – in return of the various goods and
services one gets – is not only an awareness-raising exercise but also a widely accepted method to calculate compensations. The purpose of the present study was two-fold – to help raise awareness regarding the worth of natural ecosystems in low-income, high population
density societies wherein heavy dependence on and over-use of environmental resources are observed; secondly, the use of CVM and
WTA in low-income, developing countries are few and far between, and more empirical studies are required. In the present study, a unique
opportunity was presented by the temporary shrinkage of the Kabar Wetland (spread across 600 ha) in Bihar, India – Willingness to
Accept (WTA) was thus, calculated in 2008 and 2010, before and after the shrinkage. A 1.45 time increase was observed in the Willingness to Accept (WTA) values, due mostly to the fact that the loss of ecosystem services – hitherto taken for granted – was felt keenly during
the shrinkage period.
Keywords: Ecosystem goods and services, Wetland Ecosystems, Kabar Wetland, Wetland Management JEL Classification: C00, C83, J11, J17 INTRODUCTION Wetland ecosystems are one of the most precious, and the most vulnerable ecosystems of the world.
Wetland ecosystems face two-pronged threats one is quality degradation due to pollutant discharge and
shrinkage or drainage due to switch over to apparently more profitable land-use options like real estate or
agriculture (Turner 1991; Brouwer et al. 1999; Ratner et al. 2004). The subtropical wetlands of an over-
populated nation like India are disappearing at an unprecedented rate (Lee Foote et al. 1996). This is in
spite of the fact that Indian wetlands include immense habitat diversity ranging from high-altitude cold
desert wetlands to the hot and humid wetlands of the coastal zone (Prasad et al. 2002).
A significant cause of poor conservation of wetlands may be their incomplete and insufficient valuation
(Barbier et al.1997). As the dependent population is unaware of the complete worth of an ecosystem, it
remains apathetic towards its conservation. A wetland ecosystem, like other ecosystems, has broadly been
assigned two categories of values - use and non-use (Barbier et al. 1994).
*Technical Head , TerraNero Pvt Ltd., Mumbai, Maharashtra, India, [email protected]
**Associate Professor, VES Institute of Management Studies and Research ,Mumbai,
Arth Anvesan, Volume 12(1 & 2), 2017 ISSN: 0973-8193
18
In brief, the use values may be further sub-divided into direct and indirect uses. Direct uses are the
marketable services such as product harvest and recreation. Indirect uses are the essential non-marketable
services an ecosystem provides. Non-use values of an ecosystem include its existence, bequest and option
values that do not involve any withdrawal of service from the ecosystem. A sum-total of all these values
estimates the total worth of an ecosystem (Primack, 2006).For instance, a typical wetland ecosystem will
provide fish and recreation (direct uses), flood protection, climate stabilization, groundwater recharge and
nutrient recycling (indirect uses), and existence, option and bequest values (non-use values).
This study presents the valuation – through the Contingent Valuation Method (CVM) – of the ecosystem
goods and services provided by the Kabar wetland of rural eastern India. The valuation exercise was
conducted twice – before and after the ~6000 ha wetland underwent a temporary shrinkage, in 2008 and
2010 respectively. Data was collected through household survey of villagers in 25 villages within 5km
radius of the Kabar wetland. The paper includes a rigorous multiple regression analysis that backs the
survey-based results. The factors that affect the valuation of ecosystem goods and services have been
elaborated.
THEORETICAL PERSPECTIVES VALUATION OF ECOSYSTEM GOODS AND SERVICES At the outset, economic valuation may be defined as “the attempt to assign quantitative values to the goods
and services provided by environmental resources, whether or not market prices are available to assist us
(Barbier et al. 1997).” The calculation of the total economic value of ecosystems has been reviewed in
detail by Costanza et al. (1997) who conducted a detailed meta-analysis to elaborate the worth of the
different ecosystems of the world. Several methods have been used for the valuation of ecosystem goods
and services. Short descriptions as per Brander et al. (2006) have been provided:
Contingent Valuation is a popular, stated-preference method in which the respondents are directly
interrogated through interview and/or questionnaires about the price they are willing to pay or accept for an
ecosystem good or service. The market pricing method has been utilized to estimate the direct use value
wherein the market worth of goods is worked out. Restoration/Replacement cost approaches the valuation
exercise from the angle of estimating the replacement cost of providing that service should the ecosystem
no longer function properly or no longer exist. Another much-used method is the travel cost method. The
travel cost approach uses information about the number of trips to particular sites and the cost of those trips
to infer how much individuals are willing to pay for access to the site. Travel cost studies are applied
primarily to studies of the value of recreation, in which people travel to particular sites to hunt, fish, hike,
or watch wildlife. Hedonic pricing is a method based on the principle that environmental factors such as
scenic views, distance from hills or lakes can affect the price of marketable goods such as residential areas.
Method selection depends on the suitability of the method for the given type of service, data availability
and response from the interviewed public (Branders et al. 2006; Barbier 1989).
Several authors have made notable efforts in evaluating wetlands across America, Europe and Australia
(Bingham et al. 1995; Daily 1997; Loomis et al. 2000; Lee & Han 2002; Crase & Gillespie 2008;
Baerenklau et al. 2010; Kimmel et al. 2010; Bennett 2011). However, such studies regarding sub-tropical
wetlands, and especially those present in India, remain few and insufficient (Brander et al. 2006) despite
notable efforts by Ambastha et al. (2007a& 2007b), Badola & Hussain (2005) and Ramachandra et al.
(2011). SIGNIFICANCE OF ECOSYSTEM VALUATION In the absence of valuation, the worth of an aquatic ecosystem’s indispensable goods and services can be –

Arth Anvesan, Volume 12(1 & 2), 2017 ISSN: 0973-8193
19
and has been – taken as zero as wetlands have even been looked upon as „wastelands‟ (Mitsch & Gosselink
1993). Hence, the most significant aspect of ecosystem valuation is that it brings these services down to the
common denominator of money. This raises awareness among the local populations and accentuates the
importance of these services in the public psyche. Consequently, a larger number of stakeholders are likely
to emerge.
It is also imperative to attach a price tag to the non-marketable services that wetlands provide so that they
can be included in planning and budgeting exercises conducted by the government bodies. This assists
long-term and large-scale efforts at conservation and efficient wetland management. Ecosystem valuation
has the potential to be a valuable asset to policy-makers (Anton et al. 2010).
Another aspect is the grant of compensation to stakeholders in the event of draining a wetland ecosystem.
Actual payment of compensation to dependent locals in the event of loss of environmental goods and
services has been encountered in some Indian case studies (Appasamy & Nelliyat 2007). Raju et al. (2006)
have brought out the outcome of a workshop on payment of compensations against loss of ecosystem
services in Asian countries as “(the) discussion revealed that the political process for the implementation of
CES (Compensation for Ecosystem Services) is strongly dependent on the local perceptions of ecosystem
services.” This indicates that the emphasis must be paid on better, regular and frequent valuation exercises
for vulnerable ecosystems.
Besides, management of wetlands is an expensive project (Kramer et al. 2006). Wetlands require protection
against encroachment and waste disposal. Regular monitoring must be carried out against exotic species
and algal blooms. Siltation and slope stabilization also pose as challenges. If the benefits provided by a
wetland are converted in terms of money through proper valuation and balanced against the costs incurred
in maintaining the wetland, the task of managing it may become attractive for investors (Turner et. al1995). SIGNIFICANCE OF VALUATION EXERCISES IN LOW INCOME, LOW LITERACY, RURAL
POPULATIONS Unfortunately, low income and poor literacy countries where dependence on ecological resources is high,
there is very poor awareness about the valuation of ecosystem goods and services (Ambastha et al. 2007a).
In fact, even the very concept of valuation remains new and unexplored for such populations (Raju et al.
2006). Here, the public psyche is such that only the small portion of direct use values of an ecosystem is
most well-established in their thought process with indirect and non-use values relegated into confusion
and obscurity. Unfortunately, the direct uses form a very small fraction of the total goods and services
provided by an ecosystem; however, their monetary value is much more evident. On the other hand, the
indirect and non-use values lend themselves to commercial conceptualization with difficulty despite being
of a much greater significance. Neither do the indirect and non-use values of an ecosystem finds mention in
decision making and policy framing processes. This makes alternative land use options such as drainage for
real estate or agriculture more commonly adopted for wetland ecosystems and land use changes and
conservation policies regarding wetlands take place keeping in mind the smaller commercial gains
(Costanza et al. 1989; Barbier et al. 1997). Such an attitude must necessarily undergo a positive change for
conservation efforts to get a boost as indirect and non-use values of an ecosystem are often vital and
indispensable for human life. Frequent ecosystem valuation exercises may be utilized as a tool for
transforming the mindset of apathetic dependents. CONTINGENT VALUATION METHOD (CVM) CVM is a stated preference method wherein the population being surveyed is directly provided with a
range of values it is willing to pay or accept for a given ecosystem good or service. The mean of the value
chosen yields the value of that ecosystem service. CVM has been widely used as the only method for
evaluating the non-use values of an ecosystem (Branders et al. 2006; Brauer 2003; Woodward & Wui
2001).In the event of a complete absence of a market for such values, the individual’s stated preference for
an environmental good or service provides revealing insights into the perception of ecosystem benefits
among stakeholders. CVM may first be traced to Ciriacy-Wantrup (1947), but was popularized by Davies

Arth Anvesan, Volume 12(1 & 2), 2017 ISSN: 0973-8193
20
(1963).This is an interview and/or questionnaire-based survey.
In CVM, Willingness to Pay (WTP) or Willingness to Accept (WTA) are two alternative techniques of
eliciting a response from the interviewees. As per the Hicksian measure of individual welfare, WTP is the
mode of choice in the case of an increase in environmental quality while WTA is calculated in the event
of a decrease in quality as compensation (Hicks 1946). SOCIO-ECOLOGICAL SIGNIFICANCE OF THE KABAR WETLAND Kabar wetland, (25° 35‟N; 86° 10‟E, m.s.l. 44m) is one of the largest wetlands of the Bihar province in the
eastern part of the Indo-Gangetic Plains of India (Figure 1). Roger & Panwar (1988) include Kabar in the
list of the most important wetlands of the Indo-Gangetic Plains. Kabar has been fed mostly by the River
Buri Gandak, a major tributary of the River Ganges. Its area fluctuates between 7400 Ha in the post-
monsoon season during average rainfall, when it connects with the nearby wetland Bikarampur chaur
(paddy field), Nagri Lake and River Buri Gandak, and 200-300 Ha during late summers. About 2400 Ha of
the exposed mudflats is used to cultivate paddy. Ghosh et al. (2004) have reported the area of Kabar as
6043Ha in March, 2002. The annual rainfall in the region is around 1384mm that falls in the June-October
period.
Kabar was declared a protected zone in the year 1986 under section 37 of the Wildlife (Protection) Act,
1972 and later a Migratory Bird Reserve in 1989. It was also recognized as an Important Bird Area (IBA
Site Code: IN-BR-04). Despite this, the wetland continues to deal with rampant encroachment and poaching
issues. It is difficult to ascertain the total number of migratory waterfowl visiting Kabar, but Shahi
(1982) reported that prior to the declaration of Kabar as a protected area, thousands of birds were trapped
every year and the nearby village of Manjhaul was a major bird market. About 26 species of birds were
ringed in Kabar during a Bombay Natural History Society (BNHS) bird-ringing camp (Anon. 2002). Kabar
also supports a rich biodiversity of commercial fish apart from harboring several floral species.
Figure 1: Map of Kabar showing its Location in India
The local residents have a very high degree of dependence on the Kabar wetland. Major direct use of Kabar
wetland has been as a fishery with more than 29 species of commercially important fish reportedly
harvested. Emergent species such as Phragmites karka that grow along the bank have been used as fodder
and for making huts. Its waters are used for irrigation, cattle-washing, bathing and washing clothes. Kabar
wetland is also a popular recreation spot. Among its indirect services, the Kabar wetland provides flood
protection as it accepts the overflow of water from the neighboring River Buri Gandak. In the absence of

Arth Anvesan, Volume 12(1 & 2), 2017 ISSN: 0973-8193
21
the wetland, the river is likely to flood its banks and create major havoc as frequently occurs in many other
regions of the district. It replenishes the groundwater, retains the sediment, stabilizes the climate of the
region and serves the purpose of water disposal. The most important non-use value of Kabar wetland for
the surrounding population was the association of a local temple, Jaimanglagadh, with it and the migratory
birds that it attracted.
In the years 2009 and 2010, the rainfall in the Bihar region of India was very low. This led to an acute
drainage of Kabar wetland by the middle of the year 2010. Figure 2 depicts the extent of the study area in
September, 2008 and the extent of shrinkage in September, 2010. Remote sensing data has also been
confirmed with ground-truth studies both in 2008 and 2010. The images were obtained from the Indian
Remote Sensing satellite IRS-P6 equipped with the Advanced Wide Field Sensor (AWiFs) that provides a
minimum resolution of 56m.
VALUATION OF KABAR WETLAND AND FACTORS INFLUENCING THE CVM-BASED
RESULTS SURVEY DETAILS
Kabar was evaluated by the CV method twice – once in 2008 and then again in 2010 in the months of
November and December. 25 villages were selected with the help of Survey of India 1:50,000 maps and
seconded by ground trothing. All the villages were within 5km of Kabar wetland. Sample size in both the
years was 500. Villages in the study region are characterized by the presence of distinct social strata called
castes. These castes are based on professions, and the type of benefit derived from Kabar wetland is
profession and caste-specific. It is common practice for members of one caste to occupy the same locality
inside the village. The villages in the study region have distinct caste-based localities called as tolas. The
sampling procedure was designed such that each tola contributed at least one active adult male member for
interviewing. This ensured that each sampled individual represented an average 10.34 households. This
process further ensured that there were no blank responses as at least one member of a tola was available
for questioning.
Bidding game method was used for eliciting the response of the villagers as this is the best-suited method
for developing countries (Venkatachalam 2004). Details of the surveyed villages and their socio-economic
profiles have been provided as supplementary information. All 2008 and 2010 prices were converted to
US$ 2011 (1 INR = 0.02 US$) for ease of comparison. Interviews were conducted in the native language.
Willingness to Accept (WTA) was assessed in both the years as in either year, the scenario described to the
interviewees was better than the existing one. Statistical Package for Social Sciences (SPSS) version 8
(Norussis 1994) was used to perform the statistical analyses.

Arth Anvesan, Volume 12(1 & 2), 2017 ISSN: 0973-8193
22
Figure 2: Extent of Kabar Wetland in 2008 and 2010
EFFECT OF KABAR WETLAND SHRINKAGE ON VALUATION
The pre and post-shrinkage value of Kabar as calculated through CVM has been elaborated in Table 1. The
CVM reported the total use and non-use value of Kabar as US$ 27379.53/household/year in 2008 and US$
in 2010. The price of fish accounted for up to 96% of the total use value of Kabar in both the years. A
robust linear regression model was designed for the same using 6 variables (literacy,
income/household, distance from Kabar, household size, social norms and % of total income derived from
Kabar) that explained 92.45% of the variations in the WTA amount (Table2). The model had high adjusted
R-squared value (0.799) and theF-statistic value (30.983) at P<0.05 indicating the good fit of the equation
with the observed data and the statistical significance of the results. The estimated mean worth of Kabar
was US$ 28 931.97 in 2008 and US$ 42 004.34 in 2010. Thus, post-shrinkage, the value of the Kabar
wetland increased 1.45 times. The study conducted by Ambastha et al. (2007b) put the worth of Kabar
wetland at US$ 27 500.00, which is quite comparable to our 2008 value.
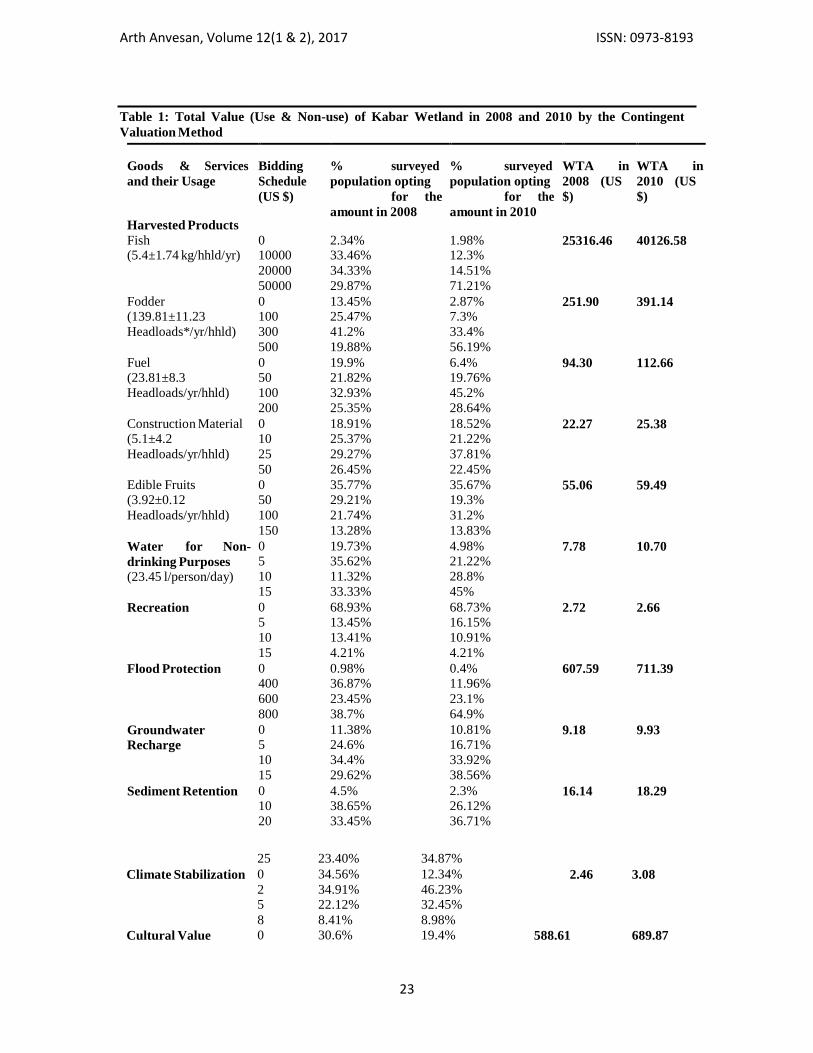
Arth Anvesan, Volume 12(1 & 2), 2017 ISSN: 0973-8193
23
Table 1: Total Value (Use & Non-use) of Kabar Wetland in 2008 and 2010 by the Contingent
Valuation Method
Goods & Services
and their Usage
Bidding
Schedule
(US $)
% surveyed
population opting
for the
amount in 2008
% surveyed
population opting
for the
amount in 2010
WTA in
2008 (US
$)
WTA in
2010 (US
$)
Harvested Products
Fish (5.4±1.74 kg/hhld/yr)
0 10000
20000
50000
2.34% 33.46%
34.33%
29.87%
1.98% 12.3%
14.51%
71.21%
25316.46 40126.58
Fodder (139.81±11.23
Headloads*/yr/hhld)
0 100
300
500
13.45% 25.47%
41.2%
19.88%
2.87% 7.3%
33.4%
56.19%
251.90 391.14
Fuel (23.81±8.3
Headloads/yr/hhld)
0 50
100
200
19.9% 21.82%
32.93%
25.35%
6.4% 19.76%
45.2%
28.64%
94.30 112.66
Construction Material (5.1±4.2
Headloads/yr/hhld)
0 10
25
50
18.91% 25.37%
29.27%
26.45%
18.52% 21.22%
37.81%
22.45%
22.27 25.38
Edible Fruits (3.92±0.12
Headloads/yr/hhld)
0 50
100
150
35.77% 29.21%
21.74%
13.28%
35.67% 19.3%
31.2%
13.83%
55.06 59.49
Water for Non-
drinking Purposes (23.45 l/person/day)
0 5
10
15
19.73% 35.62%
11.32%
33.33%
4.98% 21.22%
28.8%
45%
7.78 10.70
Recreation 0 5
10
15
68.93% 13.45%
13.41%
4.21%
68.73% 16.15%
10.91%
4.21%
2.72 2.66
Flood Protection 0 400
600
800
0.98% 36.87%
23.45%
38.7%
0.4% 11.96%
23.1%
64.9%
607.59 711.39
Groundwater Recharge
0 5
10
15
11.38% 24.6%
34.4%
29.62%
10.81% 16.71%
33.92%
38.56%
9.18 9.93
Sediment Retention 0 10
20
4.5% 38.65%
33.45%
2.3% 26.12%
36.71%
16.14 18.29
25 23.40% 34.87%
Climate Stabilization 0 34.56% 12.34% 2.46 3.08
2 34.91% 46.23% 5 22.12% 32.45% 8 8.41% 8.98% Cultural Value 0 30.6% 19.4% 588.61 689.87
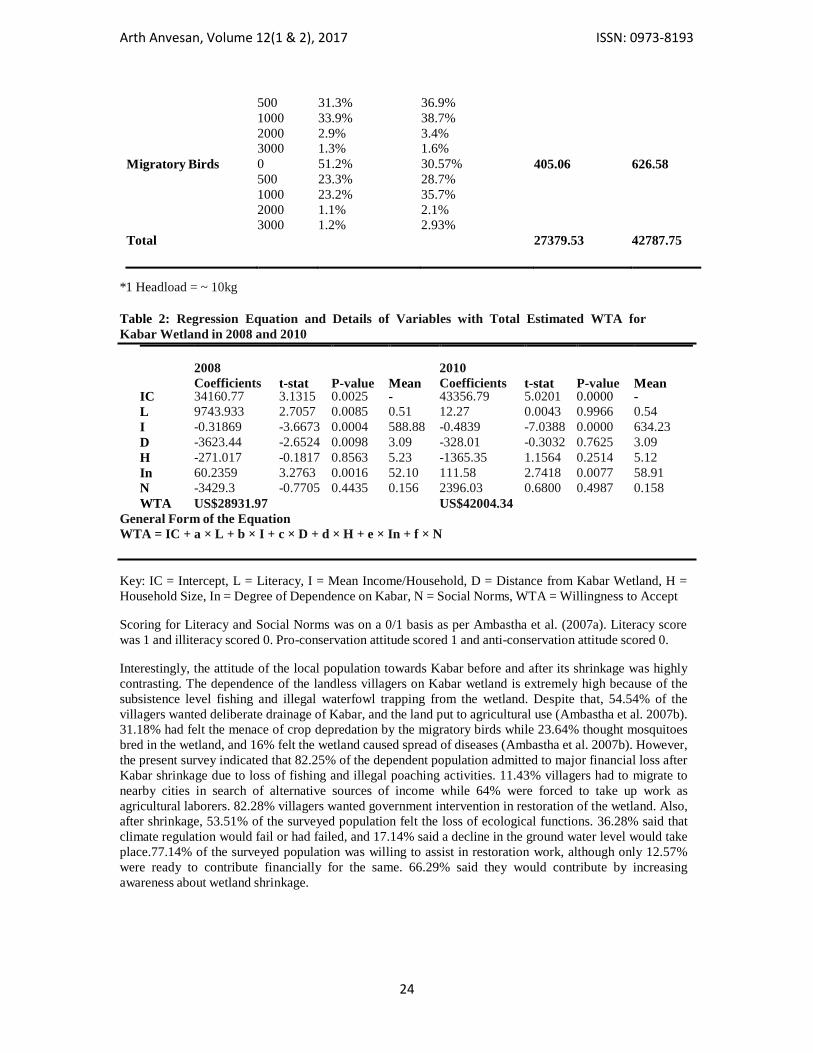
Arth Anvesan, Volume 12(1 & 2), 2017 ISSN: 0973-8193
24
500 31.3% 36.9% 1000 33.9% 38.7% 2000 2.9% 3.4% 3000 1.3% 1.6% Migratory Birds 0 51.2% 30.57% 405.06 626.58
500 23.3% 28.7% 1000 23.2% 35.7% 2000 1.1% 2.1% 3000 1.2% 2.93% Total 27379.53 42787.75
*1 Headload = ~ 10kg
Table 2: Regression Equation and Details of Variables with Total Estimated WTA for
Kabar Wetland in 2008 and 2010
2008
Coefficients
t-stat
P-value
Mean
2010
Coefficients
t-stat
P-value
Mean
IC 34160.77 3.1315 0.0025 - 43356.79 5.0201 0.0000 -
L 9743.933 2.7057 0.0085 0.51 12.27 0.0043 0.9966 0.54
I -0.31869 -3.6673 0.0004 588.88 -0.4839 -7.0388 0.0000 634.23
D -3623.44 -2.6524 0.0098 3.09 -328.01 -0.3032 0.7625 3.09
H -271.017 -0.1817 0.8563 5.23 -1365.35 1.1564 0.2514 5.12
In 60.2359 3.2763 0.0016 52.10 111.58 2.7418 0.0077 58.91
N -3429.3 -0.7705 0.4435 0.156 2396.03 0.6800 0.4987 0.158
WTA US$28931.97 US$42004.34 General Form of the Equation
WTA = IC + a × L + b × I + c × D + d × H + e × In + f × N
Key: IC = Intercept, L = Literacy, I = Mean Income/Household, D = Distance from Kabar Wetland, H =
Household Size, In = Degree of Dependence on Kabar, N = Social Norms, WTA = Willingness to Accept Scoring for Literacy and Social Norms was on a 0/1 basis as per Ambastha et al. (2007a). Literacy score
was 1 and illiteracy scored 0. Pro-conservation attitude scored 1 and anti-conservation attitude scored 0. Interestingly, the attitude of the local population towards Kabar before and after its shrinkage was highly
contrasting. The dependence of the landless villagers on Kabar wetland is extremely high because of the
subsistence level fishing and illegal waterfowl trapping from the wetland. Despite that, 54.54% of the
villagers wanted deliberate drainage of Kabar, and the land put to agricultural use (Ambastha et al. 2007b).
31.18% had felt the menace of crop depredation by the migratory birds while 23.64% thought mosquitoes
bred in the wetland, and 16% felt the wetland caused spread of diseases (Ambastha et al. 2007b). However,
the present survey indicated that 82.25% of the dependent population admitted to major financial loss after
Kabar shrinkage due to loss of fishing and illegal poaching activities. 11.43% villagers had to migrate to
nearby cities in search of alternative sources of income while 64% were forced to take up work as
agricultural laborers. 82.28% villagers wanted government intervention in restoration of the wetland. Also,
after shrinkage, 53.51% of the surveyed population felt the loss of ecological functions. 36.28% said that
climate regulation would fail or had failed, and 17.14% said a decline in the ground water level would take
place.77.14% of the surveyed population was willing to assist in restoration work, although only 12.57%
were ready to contribute financially for the same. 66.29% said they would contribute by increasing
awareness about wetland shrinkage.
Arth Anvesan, Volume 12(1 & 2), 2017 ISSN: 0973-8193
25
APPLICATION OF CONTINGENT VALUATION METHOD IN LOW INCOME, LOW
LITERACY, RURAL POPULATIONS
All interviews had to be taken in person as the socio-economic and literacy level of the interviewed
population was unsuitable for telephonic or mail-based interaction. Local language speakers were requested
to conduct the interviews to avoid miscommunication of any sort. Prior to conducting the survey for
establishing the worth of Kabar wetland as per CVM, an initial survey was conducted to assess the
awareness level of the rural population. The interviewees were new to the very concept of valuation and
detailed explanations had to be given. Although villagers showed high awareness about indirect values like
flood protection and groundwater recharge – due to their close association with the ecosystem – they were
unaware of the non-use values. Moreover, a distinct incapacity was apparent among them to name a price
they would be willing to accept for indirect or non-use values, whereas it was relatively simple in the case
of direct use values. This hurdle was partially circumvented by the replacement/restoration cost approach.
Villagers were explained how, in the absence of certain ecological services provided by the Kabar wetland,
they would be forced to look for costly alternatives or incur substantial expenditure in restoring the lost
ecosystem. It was clarified that the exercise involved a hypothetical market, and no actual payments were
being made, thereby reducing the strategic bias. The pre-survey interview was also used as an opportunity
to minimize the sequencing bias by discussing the question order with the interviewees. The CVM proved
to be a significant awareness building exercise among the rural masses.
FACTORS INFLUENCING VALUATION OF KABAR WETLAND
Among the various factors affecting the valuation of the Kabar wetland, some are general while the others
are specific to the study area. Ehrlich & Ehrlich (1992) opine that the actual worth of ecosystem services
cannot be accurately ascertained and will always be an under-estimate as all ecosystem services cannot be
brought down to the common denominator of money. Such was also observed in the present study. Several
wetland functions like nutrient recycling, gas regulation and carbon sequestration could not be converted
into money. Another important aspect is that the methods of price calculation themselves may create the
under-estimation - the replacement cost method does exactly that and has been criticized for the same
(Chee 2004). Conflict or trade-off between various uses of a wetland is a major cause of concern in
the management of these ecosystems (Barbier et al. 1997). Confusion about ownership rights is an
important cause behind mismanagement and misevaluation of wetlands as natural resources have been seen
to suffer from the tragedy of commons (Adger & Luttrell 2000; Barbier et al. 1997).
Among specific causes, literacy of the dependent population is a significant parameter. When the
dependent population is uneducated and poor it is difficult to use more accurate but sophisticated methods
like production function and hedonic pricing (Barbier 1989). Hence, prices may increase with the design of
better, bias-free methods (Costanza et al. 1997) and with an increase in the literacy rate of the dependent
population. Prevalent social norms are also significant factors affecting the valuation exercise. Here, the
prevalent social norms may be deemed as a reason for the initial lower value being assigned to Kabar
wetland. For instance, only 32.3% of the surveyed locals believed that their neighbors and fellow villagers
were serious about the conservation of Kabar. A high percentage (68.23%) of the interviewed population
felt they would be ridiculed or could even be the victims of violence if they attempted to prevent
encroachment of Kabar on their own. 78.14% agreed to initiate pro-conservation practices only if their
friends and neighbors agreed to do so. 76.76% refused to voluntarily reduce product harvest from Kabar as
they were afraid their neighbors would not do so, resulting in a loss for them. Another reason for the under-
evaluation was the confusion regarding property rights. The locals were still not very clear as to who
owned the land obtained by the shrinkage of Kabar. A previous study had indicated that25.67% people
claimed to own land within Kabar (Ambastha et al. 2007b) but post-shrinkage it was found that 12.19% of
the claims were unsupported.

Arth Anvesan, Volume 12(1 & 2), 2017 ISSN: 0973-8193
26
CONCLUSION It is concluded that the worth of sub-tropical wetland ecosystems is felt more keenly by the dependent
population after these services are lost to them - the monetary value assigned to the wetland may increase
by up to 1.45 times post-shrinkage. The specific causes behind this under-estimation may be summarized as
poor awareness, the tragedy of commons and anti-conservation social norms. The outcome of this study is
likely to make the dependent locals in sub-tropical regions more pro-conservation apart from directly
influencing the amount of compensation paid to them in the event of the planned drainage of wetlands.
Also, this being a comprehensive wetland valuation study in the Indian sub-continent, it may encourage
inclusion of the value of environmental goods and services into government budgeting. The
comprehensiveness of the study, however, only highlights the necessity of more such exercises in detail.
REFERENCES
Adger, W. N., & Luttrell, C. (2000). Property rights and the utilization of wetlands. Ecological
Economics, 35(1), 75-89.
Adger, W.N., & Luttrell, C. (2000). The Values of Wetlands: Landscape and Institutional
Perspectives. Ecological Economics, 35(1), 75–89.
Ambastha, K., Hussain, S.A., & Badola, R. (2007). Socio and Economic Considerations in
conserving wetlands of Indo-Gangetic Plains – A case study of Kabartal wetland India.
Environmentalist, 27(2), 261-273.
Ambastha, K., Hussain, S.A., & Badola, R. (2007). Resource dependence and attitudes of local
people toward conservation of Kabartal wetland: a case study from the Indo-Gangetic Plains.
Wetlands Ecology and Management, 15(4), 287-302.
Anon. (2002). Bird Banders Training Programme. Final Report. Bombay Natural History Society,
Mumbai, India.
Anton, C., Young, J., Harrison, P. A., Musche, M., Bela, G., Feld, C. K. & Skourtos, M. (2010).
Research needs for incorporating the ecosystem service approach into EU biodiversity
conservation policy. Biodiversity and Conservation, 19(10), 2979-2994.
Appasamy, P.P., & Nelliyat, P. (2007). Compensating the Loss of Ecosystem Services Due to
Pollution in Noyyal River Basin, Tamil Nadu. Madras School of Economics.
Badola, R., & Hussain, S.A. (2005). Valuing ecosystem functions: an empirical study on the storm
protection function of Bhitarkanika mangrove ecosystem, India. Environmental Conservation,
32(1), 85-92.
Baerenklau, K.A., Gonza´lez-Caba´n, A., Paez, C., & Chavez, E. (2010). Spatial allocation of
forest recreation value. Journal of Forest Economics, 16(2), 113-126.
Barbier, E.B. (1994). Valuing Environmental Functions: Tropical Wetlands. Land Economics,
University of Wisconsin Press, 70(2), 155-173.
Barbier, E.B., Acreman, M., & Knowler, D. (1997). Economic Valuation of Wetlands - A guide
for policy makers and planners. Ramsar Convention Bureau.
Bennett, J. (2011). Estimating the value of Australian environmental assets. Australasian Journal
of Environmental Management, 18(1), 21-32.
Bingham, G., Bishop, R., Brody, M., Bromley, D., Clark, E.T., Cooper, W., Costanza, R., Hale,
T., Hayden, G., Kellert, S., Norgaard, R., Norton, B., Payne, J., Russell, C., & Suter, G. (1995)
Issues in ecosystem valuation: improving information for decision making. Ecological Economics,
14(2), 73-90.
Boyer, T., & Polasky, S. (2004). Valuing Urban Wetlands: A Review of Non-Market Valuation
Studies. Wetlands, 24(4), 744-755.
Boyle, K.J., Bishop, R.C., & Welsh, M.P. (1985). Starting Point Bias in Contingent Valuation
Bidding Games. Land Economics, 62(2), 188-194.
Brander, L. M., Florax, R. J., & Vermaat, J. E. (2006). The empirics of wetland valuation: A
comprehensive summary and a meta-analysis of the literature. Environmental and Resource
Economics, 33(2), 223-250.
Brauer, I. (2003). Money as an indicator: to make use of economic evaluation for biodiversity
conservation. Agriculture Ecosystem & Environment, 98(1-3), 483-491.

Arth Anvesan, Volume 12(1 & 2), 2017 ISSN: 0973-8193
27
Brouwer, R., Langford, I.H., Bateman, I.J., & Turner, R.K. (1999). A meta-analysis of wetland
contingent valuation studies. Regional Environmental Change, 1(1), 47-57.
Crase, L., & Gillespie, R. (2008). The impact of water quality and water level on the recreation
values of Lake Hume. Australasian Journal of Environmental Management, 15(1), 21-29.
Chee, Y.E. (2004). An ecological perspective on the valuation of ecosystem services. Biological
Conservations, 120(4), 549-565.
Ciriacy-Wantrup, S. V. (1947). Capital returns from soil-conservation practices. Journal of farm
economics, 29(4), 1181-1196.
Costanza, R., Farber, S.C., & Maxwell, J. (1989). Valuation and Management of Wetland
Ecosystems. Ecological Economics, 1(4), 335-361.
Costanza, R., d'Arge, R., De Groot, R., Farber, S., Grasso, M., Hannon, B., Limburg, K., Naeem, S., O‟Neill, R.V., Paruelo, J., Raskin, R. G. (1997). The value of the world's ecosystem services and natural capital. Nature, 387(6630), 253.
Daily, G. (1997). Nature’s services: societal dependence on natural ecosystems. Washington DC.
Ehrlich, P.R., & Ehrlich, A.E. (1992). The value of biodiversity. ,Ambio, 21, 219–226.
Ghosh, A. K., Bose, N., Singh, K. R. P., & Sinha, R. K. (2004). Study of spatio-temporal changes
in the wetlands of north Bihar through remote sensing. Proceeding of the ISCO.
Hicks, J. (1946). Value and Capital. Oxford University Press.
Kramer, D. B., Polasky, S., Starfield, A., Palik, B., Westphal, L., Snyder, S., Pamela, J., Rachel,
Hudson. & Gustafson, E. (2006). A comparison of alternative strategies for cost-effective water
quality management in lakes. Environmental management, 38(3), 411-425.
Kimmel, K., Kull, A., Salm, J. O., & Mander, Ü. (2010). The status, conservation and sustainable
use of Estonian wetlands. Wetlands ecology and management, 18(4), 375-395.
Lee, C. K., & Han, S. Y. (2002). Estimating the use and preservation values of national parks‟
tourism resources using a contingent valuation method. Tourism management, 23(5), 531-540.
Foote, A. L., Pandey, S., and Krogman, N. T. (1996). Processes of wetland loss in India.
Environmental Conservation, 23(1), 45-54.
Loomis, J., Kent, P., Strange, L., Fausch, K., & Covich, A. (2000). Measuring the total economic
value of restoring ecosystem services in an impaired river basin: results from a contingent
valuation survey. Ecological economics, 33(1), 103-117.
Norussis, M.J. (1994). SPSS professional statistics version 8, SPSS Inc., Chicago, Illinois.
Mitchell, R. C., & Carson, R. T. (1981). An experiment in determining willingness to pay for
national water quality improvements. Draft report to the US Environmental Protection Agency,
Washington, DC.
Mitsch, W.J., & Gosselink, J.G. (1993).Wetlands. New York: John Wiley.
Murphy, J. J., Stevens, T., & Weatherhead, D. (2005). Is cheap talk effective at eliminating
hypothetical bias in a provision point mechanism? Environmental and Resource economics, 30(3),
327-343.
Prasad, S. N., Ramachandra, T. V., Ahalya, N., Sengupta, T., Kumar, A., Tiwari, A. K., and
Vijayan, L. (2002). Conservation of wetlands of India-a review. Tropical Ecology, 43(1), 173-186.
Primack, R.B. (2006). Essentials of Conservation Biology. Massachusetts: Sinauer Associates, Inc.
Raju, K. V., Puttaswamaiah, S., Sekher, M., & Rumley, R. (2007). Asia regional workshop on
compensation for ecosystem services: a component of the global scoping study on compensation
of ecosystem service. ICRAF working paper; 34.
Ramachandra, T. V., Alakananda, B., Rani, A., & Khan, M. A. (2011). Ecological and Socio-
Economic Assessment of Varthur Wetland, Bengaluru (India). Journal of environmental science
& engineering, 53(1), 101-108.
Ratner, B. D. (2004). Undervalued and overlooked: Sustaining rural livelihoods through better
governance of wetlands (Vol. 1741). World Fish.
Rodgers, W. A., & Panwar, H. S. (1988). Planning a wildlife protected area network in India.
Scott, D. A. (1989). A directory of Asian wetlands. IUCN, The World Conservation Union.
Shahi, S. P. (1982). Bird massacre in Manjhaul. Hornbill, 3, 17-22.
Turner, K. (1991). Economics and wetland management. Ambio, 59-63.
Turner, R. K., Folke, C., Gren, I. M., & Bateman, I. J. (1995). Wetland valuation: three case
studies. Biodiversity loss: economic and ecological issues. Cambridge University Press,
Arth Anvesan, Volume 12(1 & 2), 2017 ISSN: 0973-8193
28
Cambridge, MA, USA.
Venkatachalam, L. (2004). The contingent valuation method: a review. Environmental impact
assessment review, 24(1), 89-124.
Veronesi, M., Alberini, A., & Cooper, J. C. (2011). Implications of bid design and willingness-to-
pay distribution for starting point bias in double-bounded dichotomous choice contingent valuation
surveys. Environmental and Resource Economics, 49(2), 199-215.
Woodward, R. T., & Wui, Y. S. (2001). The economic value of wetland services: A meta- analysis.
Ecological economics, 37(2), 257-270.
Arth Anvesan, Volume 12(1 & 2), 2017 ISSN: 0973-8193
29
Surgical Strike at Tata Group
Surbhi Bedi*, Dr. Snadeep Vij**
ABSTRACT
The Tata Group - an Indian multinational, salt-to-software conglomerate, dominated the Indian corporate world for over 149 years and
was present in 100 countries across 6 continents. In 2016, CEO Cyrus Mistry was abruptly removed from his position after he had served the company for a period of four years. The turnover of Tata group during Mistry’s tenure dropped and debt increased. He was removed
citing the performance of the company as an issue. This episode was no less than a surgical strike at India’s largest multinational
conglomerate. However, it raised the questions of succession planning and corporate governance at the group. This paper highlights the succession planning undertaken by the group while passing on the reigns from JRD Tata to Ratan Tata and then from Ratan Tata to
Cyrus Mistry. The paper concludes with observations regarding succession planning and corporate governance in the Indian context,
taking cues from the Tata case.
Key Words: Succession Planning, Corporate Governance, Tata Group
JEL CLASSIFICATION: G34, M14, O16
INTRODUCTION:
TATA GROUP: A BRIEF HISTORY
The Tata group of companies was owned by the Tata Trust. Tata Sons was the holding company for
all the companies in the group. Tata Sons board chairman also held the position of chairman in other Tata
group companies. As the promoter of Tata group of companies such as Tata Steel and Tata Motors, Tata Sons
had the power to decide about the capital allocation for the group companies. i Tata’s entered the business in
1868 with a spirit of nationalism which was clear from their efforts to take the country on a path towards
industrialization. Later, they also proved themselves to be pioneers, when India’s first software company,
Tata Consultancy Services (TCS) was founded in 1968, when India’s first indigenously developed car, the
Indica was made by Tata Motors, in 1998 and also by making the world’s most affordable car, the Tata
Nano. ii The Tata group managed more than hundred companies in a variety of industries like ICT,
engineering goods, services, energy, consumer products, automobiles, and chemicals. The group operated in
more than hundred companies across six continents and exported its products/services to more than 150
countries. The total revenue of the group was $100.39 billion in 2016-17. Tata companies employed over
695,000 people worldwide. The name ‘Tata’ gained respect in India for more than 149 years for its cohesion
with its values and business ethics. All of the group companies operated independently. Every company had
its own board of directors and shareholders, to whom it was answerable. 29 companies of Tata’s were publicly
listed and they had a combined market capitalization of about $130.13 billion (as on March 31, 2017). Some
of the most contributing Tata companies were Tata Steel, Tata Motors, TCS, Tata Power, Tata Chemicals,
Tata Global Beverages, Tata Teleservices, Titan, Tata Communications and Indian Hotels.iii
________________________________________________
* Junior Research Fellow (JRF), Department of Commerce and Business Management, DAV University,
Jalandhar
** Associate Professor, Department of Commerce and Business Management, DAV University, Jalandhar
Arth Anvesan, Volume 12(1 & 2), 2017 ISSN: 0973-8193
30
CEO’S AT TATA GROUP
Tata Group- an Indian multinational conglomerate, was founded by Jamsetji Nusserwanji Tata in 1868.ivAfter
Jamsetji’s death, in Germany in 1904, the chairmanship of the Tata group was passed to his elder son, Sir
Dorabji Tata.v Dorabji, in 1932 was succeeded as by Sir Nowroji Saklatwala.Following Saklatwala’s demise
in 1938, JRD Tata at the age of 34 was appointed as the chairman of the group. Ratan Tata took over as
chairman from JRD in 1991 and led the group towards the new era of liberalization, privatization, and
globalization. At the age of 75, Ratan retired from the chairmanship and passed the reigns to Cyrus Mistry in
2012. Mistry, owing to many controversies, was removed from the chairmanship in 2016 by the Tata Trust
and Natarajan Chandrasekaran became the new chairman of the group (Refer Exhibit 1).
In its history of 149 years, the Tata Group had six chairmen and all of them belonged to Parsi community.
The first non-Tata to become chairman of the group was Saklatwala, who remained in power from 1932 to
1938. Saklatwala was the son of Jamsetji’s sister Virbaijiwhich still makes him a family member.vi Mistry
was the second non-Tata chairman from 2012 to 2016. Mistry’s sister, Aloo Mistry, was married to the half-
brother of Ratan Tata- Noel Tata.vii
PASSING THE REIGNS FROM JRD TATA TO RATAN TATA
JRD led the group for the 53 years with wisdom, foresight and a rare grace that touched everyone he met.
During more than five decade tenure of JRD Tata, the group diversified and expanded into new many
unrelated businesses e.g. Tata Chemicals (1939), Tata Motors (1945) and Tata Industries (1945), Voltas
(1954), Tata Tea (1962), TCS (1968) and Titan Industries (1984).viii
The beginning of the 1990’s ushered in plenty of change in Indian business. Economic reforms opened up
many sectors, signaling increased competition and the arrival of foreign companies. Ratan took over as
chairman in 1991 when India was undergoing turbulent business environment and the economy was being
liberalized, privatized and globalised. After the death of JRD Tata in 1993, the Tata group saw a paradigm
shift in policies under the leadership of Ratan Tata. Tata group made many acquisitions outside India and
became a major player in the international market. The first big acquisition was that of Tetley Tea, one of
Britain’s leading tea brands, by Tata Tea (now Tata Beverages) in 2000. Later, the acquisitions of steelmaker
Corus Group plc (Corus) by Tata Steel in 2007 was a moment of great promise for India’s surging steel
industry. Acquisition of Jaguar Land Rover by Tata Motors in 2008 from Ford Motors were other high-profile
acquisitions done by the Tata Group. Since 2005, there had been a steady stream of acquisitions in Europe,
Asia, and North Americaix (also refer http://www.nivansys.com/htm/Group_MnA_YearWise.htm ).
Appointment of Ratan as group’s CEO took everyone to surprise because there were others in the league to
the Tata crown. JRD said that others had no less integrity than Ratan but he saw his own image in Ratan. The
journey was not at all easy for Ratan. He joined the family business in 1962 and worked at Tata Steel’s shop
floor at Jamshedpur, just like one of several thousand employees. In fact, he was considered to be jinxed
because the endeavors he took up before taking up the chairmanship never turned out to be fruitful. He could
not turn around group companies, NELCO and Empress Mills, which he was expected to do. With the help
of JRD, he drew a strategic plan for the group in 1983 which attracted only cobwebs because some of the
heads of the companies, who had become extremely powerful and influential due to the freedom to operate
under the benevolent leadership of JRD, blatantly ignored his plan and paid it just lip service. In 1988, he
was appointed as the chairman of Telco. This success only brought him at the center of a prolonged labor
dispute, which was one of the worst industrial relations experiences that Ratan had to deal with. And when
Ratan took over as chairman of Tata Group in 1991, he was not at all welcomed by the heads of the other
group companies. Individual company heads were larger-than-life personalities in their own right and had
ruled their respective companies for decades. Some of them were Russi Mody at Tata Steel, Darbari Seth at
Tata Chemicals, Ajit Kerkar at Indian Hotels, and Nani Palkhivala at ACC. Many believed that they were
more experienced and deserving to head the group than Ratan. Palkhivala's political views and Mody's
clashes within the group worked against them and JRD decided to bequeath the legacy to Ratan.x
It was next to impossible for Ratan to work with the heads of the other group companies. He then devised his
own ways to deal with them. Ratan enacted the retirement age rule whereby all business heads and directors

Arth Anvesan, Volume 12(1 & 2), 2017 ISSN: 0973-8193
31
will have to retire at the age of 60. This made him deal with Seth and Kerkar who eventually retired and left
the company. Palkhivala's departure was hastened due to his ill-health. But still Ratan’s crown remained
shaky for several years. There were opinions in 1997 that Shapoorji Pallonji Mistry, who was the single
largest shareholder in Tata Sons with 18 % stake, would drive out Ratan and take over the command of the
group.xi
After taking over as chairman, Ratan streamlined and consolidated the group companies for better
productivity and synergies. He swiftly exited from pharma, textiles, and cement business. Even after these
divestments, the company was a diversified, salt-to-software group, but now there was a method to the
business expansion.xii The group was highly decentralized, and member companies had great autonomy in
terms of strategy and operations. But the values and ethos of the group had always been the main driving
force behind the diverse business strategies of group companies which kept them unified.xiii By 1998, Ratan
made a common group logo and that logo was owned by Tata Sons.xivSince then, the group companies had
to pay a royalty to Tata Sons to use its brand name.xv
An analyst was of the view that the culture that Ratan had created will stay on with the group as a legacy. He
institutionalized the processes. Be it the area of mergers and acquisitions, engineering or cars or anything
else, he always worked with a forward-looking strategy of putting new competency in the old companies.
The reputation of the group and its values and ethics had always been the guiding light for Ratan while
making decisions.xvi
PASSING THE REIGNS FROM RATAN TATA TO CYRUS MISTRY
In 2002, when Ratan was to retire at 65, the Tata Sons board appointed him as non-executive chairman,
allowing him to stay with the group for another five years. Three years later, the board upped the retirement
age of non-executive directors to 75, thus increasing his connection with the group by 5 more years. These
decisions were duly supported by the board as well as shareholders asking Ratan to stay with the company
saying that "We can't lose our ratan (jewel)."xviiThe message was clear: Ratan was indispensable. There were
hardly any red marks in the group’s financial report card during his tenure of 21 years with the group.
Revenue grew 46 times to Rs. 4.75 lakh crores (Rs. 4.75 trillion) in 2011-12 and the increase in net profit
was even more remarkable, climbing 51 times to over Rs. 33,500 crores (Rs. 335 billion). Investors
appreciated the returns they got and the group's market capitalization grew 33 times during the Ratan’s
tenure.xviii
Ratan’s retirement was due in 2012. Ratan wanted his successor to be a "younger" leader, who could hold
fast to the Tata values, could demonstrate managerial abilities and could have the vision to run the group. He
clarified that his successor need not be a Tata, Parsi, or even an Indian but should be the right person.xix
The actual selection process of a successor was not publically disclosed, but it was evident that it would be a
scientific process. A five-member selection committee was formed. The candidates were assessed on the
basis of their leadership qualities, management skills, operational performance and other criteria. The top
scorer on these parameters would secure the job.xx And finally, on November 23, 2011, selection of Cyrus
Mistry as Ratan’s successor surprised everyone. Mistry was appointed as deputy chairman, to be trained by
Ratan for a year before the latter’s retirement in December 2012. He was selected after a 15-month search
led by the selection committee. Mistry was on the board of Tata Sons since 2006 and was himself a member
of the search and selection committee that was set up in 2010 to choose Ratan’s successor.xxi Ratan on
Mistry’s appointment said, “I have been impressed with the quality and caliber of his participation [on the
board], his astute observations and his humility….He is intelligent and qualified to take on the responsibility
being offered and I will be committed to working with him over the next year to give him the exposure, the
involvement, and the operating experience to equip him to undertake the full responsibility of the group on
my retirement.”xxii
Mistry, then 43, who was not even in the race for the chairmanship was declared to be the next CEO of Tata
Group. The group had several experienced outsiders in the league for the chairman including Indra Nooyi –
the head of PepsiCo and Arun Sarin – CEO of Vodafone, but finally considered an insider.xxiiiMistry was an
Irish businessman of Indian origin who was appointed as the sixth chairman to head the Tata’s. Mistry was
the younger son of Pallonji Mistry who had an 18.4 percent stake in Tata Sons.xxiv
Arth Anvesan, Volume 12(1 & 2), 2017 ISSN: 0973-8193
32
MISTRY’S REMOVAL
The next surprise by the group was the abrupt removal of Mistry from the position of CEO of the group on
24th October 2016.When Mistry was picked as the chairman of the group it was seen to be a victory for the
youth. “Be your own man”, was Ratan’s words of wisdom to his 43 years old successor. But soon the same
youth was perceived as a rude and arrogant fellow who was out to destroy the core values that the group had
always been proud of for last 149 years.xxv
The rift between Ratan and Mistry started becoming evident when Mistry removed Indian Hotels managing
director Raymond Bickson in 2014. Bickson was recognized as being close to Ratan. He was replaced with
Rakesh Sarna, who served Hyatt as its Vice President before joining Indian Hotels. Later, Mistry did not
remove Sarna despite many complaints against him. It put a question mark on Mistry's ability to identify
talent.xxvi Unlike previous CEOs he did not hire inspirational leaders. After the retirement of Ishaat Hussain,
the chief financial officer (CFO) of the group, the post remained vacant for about 3 years which was strange
enough.xxvii The turnover of the group dropped to $103 billion in 2015-2016 from $108 billion the previous
year. Net debt rose to $24.5 billion in March 2016 from $23.4 billion a year ago. Out of numerous businesses
of the group, only two -Tata Consultancy Services (TCS) and Jaguar Land Rover - were performing
steadily.xxviii
Many other of its group companies were struggling. The domestic automobile business, despite accounting
for roughly half of India’s trucks business, had long been under strain. Tata Steel which was once the brightest
star in the Tata constellation faced a sharp downfall since 2012.The $12.5 billion acquisition of Anglo-Dutch
competitor Corus in 2007, had been identified by analysts as being the main reason for the downfall of Tata
Steel. The decision of Mistry to shut down operations of Tata Steel Europe, after much debt and continual
losses made the group unhappy because it was Tata’s one of the many proud acquisitions. Mistry's approach
of divesting from non-profitable businesses and focusing on the growing and improving the profitable ones
was in direct contrast to Ratan’s approach. While Ratan wanted to build a global empire by acquiring
companies across the globe and turning around the unprofitable ones, Mistry, stressed on divesting from the
unprofitable businesses. He aggressively pursued the disposal of non-profitable businesses. Tata group
expected Mistry to turnaround some of the group companies like Nano and Corus which Misty could not
agree to do.xxix
Ratan criticized the way Mistry handled the separation of Tata and Japan’s Docomo, where in June 2016,
Docomo moved to court over an exit clause in the deal and secured a $1.2 billion arbitration award. Some of
the consumption-linked businesses such as Titan, Tata Global Beverages, Indian Hotels, Trent, and Rallis
India were doing slightly better (Refer Exhibit 2), but when looked at from the perspective of their collective
operating profit, they had grown only at 4% CAGR in the past five years. In the financial year 2016, nine of
the 27 listed companies in the group reported losses and the earnings of seven companies declined. The only
bright stars in the constellation were Tata Power and Tata Chemicals, which reported strong earnings growth
in the financial year 2016.xxx
Mistry was keener to build new businesses. He entered into e-commerce, defense and infrastructure rather
than consolidating existing businesses. He emphasized 'Profitability' with equal vigor on all group companies,
despite the diverse nature of the businesses. Mistry marketed his three years of achievements in direct
comparison to previous years of Tata.xxxiTata Trust expressed its displeasure for not receiving enough
dividends on their shares. The compound annual growth rate of dividends received during the Mistry years
was 18.1%, a slowdown from the 21% growth in the four preceding years when Ratan was the chairman.xxxii
The creation of the Group Executive Council (GEC) by Mistry was perceived to be a threat and a parallel
power center by many in the group. Many members of the GEC did not really have real time experience of
managing a business. The key advisors in the group, including Madhu Kannan, NS Rajan, Nirmalya Kumar,
were also asked to exit the group along with Mistry. The main bone of contention Mistry and Ratan was
particularly with regard to business ethics, values, vision and the direction that the group was headed in.
Tata’s claimed that Mistry responded in a very vague and non-specific manner when asked to spell out his
vision, five-year plan, etc.xxxiiiWhile others were of the view that Mistry was good enough in taking the
business ahead but could not take people along with him in the process.xxxiv
Arth Anvesan, Volume 12(1 & 2), 2017 ISSN: 0973-8193
33
Shares of group companies declined, a day after Mistry was shown doors by the group. (Refer Exhibit 3).xxxv
MISTRY’S RESPONSE
Mistry clarified that The Group Executive Council (GEC) made by him was not a “super-board” as perceived
by Ratan but it was made to help the group companies who desired their assistance on matters such as, HR,
corporate affairs, brand protection, ethics etc.xxxviKumar who was sacked along with Mistry, and was a
member of GEC, defended Mistry by refuting the charge against him of not sharing his strategy with the Tata
Group. Kumar claimed that Mistry presented the strategy document to the board of Tata Sons on three
occasions: June 2015, December 2015 and June 2016.xxxviiMistry further clarified that he never marketed his
achievements or work. He never gave any interviews to the press but instead, focused on institution
building.xxxviii
Mistry defended his tenure by saying that he divested only from that business which continued to obtain
negative returns and there was no scope for a turnaround. And the divestment proceeds were used to repay
the debt and infuse liquidity in the company.xxxixHe further questioned the decisions of Ratan of entering into
the aviation sector, his aggressive bidding for Tata Power’s Mundra power project and also his decision to
continue with the Nano car. He claimed that he couldn’t function freely because of Ratan’s continuous
interference and the special powers that Tata Trust had with them and pointed out corporate governance
issues at the company.xl
Tata Trusts, which consisted of Sir Dorabji Tata Trust, Sir Ratan Tata Trust and some other trusts which were
endowed by the members of the Tata family, owned two-thirds of Tata Sons, and had special rights in the
holding company of the conglomerate, especially in the matters of the appointment and removal of chairman,
according to the group’s articles of association. These trusts controlled 66 percent of the shares of Tata Sons,
and they support a variety of causes, institutions, and individuals. This special power was provided to the
Trust just days before Mistry took the top job as chairman, whereby a majority of the directors nominated by
the Trusts had to approve the appointment and removal of chairman, with affirmative vote.xli Because of
these special powers with the Trust, two members of the nomination and remuneration committee of the
board, who had earlier appreciated Mistry’s performance, voted for his removal.xlii
Mistry, in a letter written to shareholders, claimed that according to group’s articles of association, a selection
committee must be constituted for removal and replacement of the chairman, which was not done in case of
his removal. Just two months before his removal, three new directors were inducted into the Tata Sons Board.
Two of them were appointed at the request of Ratan in his capacity as a shareholder of Tata Sons. Mistry
claimed that his team prepared an orientation programme for these new directors which was scheduled for
November 2, 2016, and November 15, 2016. But even before they could be oriented within the company,
they voted their judgment against Mistry’s four-year term at the company. Mistry further claimed that the
Nomination and Remuneration Committee of the group lauded his performance as CEO on June 28, 2016
and proposed a hike in his remuneration.xliii
Mistry in his letter to the shareholders blamed the trustees to be taking decisions for their personal benefits.
Mistry further asked that the decisions of trustees must also be under regular check so as to maintain proper
governance standards at the company. Mistry also questioned the special notice issued by the board to remove
him as director from the board of group companies issued pursuant his removal as chairman. He claimed that
the special notice did not give even a hint about the reason for his removal. The special notice mentioned “a
combination of several factors” as the reason for his removal, but no specific reason was actually referred
to.xliv
Nusli Wadia, who was an independent director at the group supported Mistry. But few months after Mistry’s
removal Wadia was also removed from his position at the extraordinary general meeting called by the group.
Where shareholders supported Wadia’s removal, others in the industry questioned this move by the group.
Another shareholder was of the view that Wadia was “being crushed for expressing his opinions” and
identified Wadia’s removal as “black day for corporate governance.”xlv

Arth Anvesan, Volume 12(1 & 2), 2017 ISSN: 0973-8193
34
THE WAY FORWARD
Mistry’s removal from the position of chairman of Tata Sons and from the position of director of the group
companies was followed by the appointment of Ratan as interim CEO of the group. Ratan, then 79,
constituted a selection committee to choose Mistry’s successor within four months. And finally ended up
selecting Natarajan Chandrasekaran1as the chairman within 3 months of Mistry’s ouster. This was unlike the
previous time, when the selection committee took about 18 months to select Mistry. Chandrasekaran
happened to be the first non-Parsi, third non-Tata and seventh chairman to head the group. When Ratan was
asked about the reason for Mistry’s removal, he replied that “the answer will probably go with me to my
grave.” This statement of Ratan gives an impression as if there was a truth which only he was aware of and
was not ready to share. Moreover, it also brought to light the free will and power of Ratan within the group
to do as per his will without explaining things to anyone.xlvi
It is now to be seen whether Chandrasekaran takes the group towards a better future or stucks in another
boardroom battle.
CONCLUSION
Succession planning is extremely important. Fayol (1916) suggested that organizations should ensure the
stability of the tenure of personnel. Otherwise, key positions in the organizations will get filled up by ill-
prepared people. The continued survival of the firms depends upon having the right people in the right places
the right times. Succession planning and management are needed to encourage diversity and multiculturalism
in organizations and to avoid homo-social reproduction by managers (Rothwell, 2010). This case highlights
the flaws in the succession planning at Tata group. It also highlights the need for carefully identifying and
appointing leaders who understand and accept the basic corporate values and philosophies of the company.
The incumbent leader should have sufficient awareness about the work-culture of the company, should be
provided sufficient transition period to realign the business as per his/her own strategy, without any
interference. The succession plans of the organization should detail out the route it should take in the event
of anticipated or unanticipated leadership vacancy. This boardroom battle at Tata group was the biggest
corporate spat of 2016 and provides a classic example of management clashes over strategy, performance,
leadership style and corporate structure. The case also throws light on some of very important corporate
governance issues e.g. excessive interference by majority shareholders/promoter group, majority-minority
shareholder imbalance, existence of a ‘weak’ board, governance issues in public trusts which indirectly
control many of the companies.
1Chandrasekaran started his journey with Tata group in 1987 as a software programmer at TCS. In 2007, he was given a role on the TCS board as the chief operating officer (COO) of the company. As COO, he drove TCS’s acquisition strategy. Two years later, in October 2009, he was promoted as CEO and managing director. He became one of the youngest CEOs in the group to hold that position at the age of 46. Under Chandrasekaran’s leadership, company’s revenues grew at about 24% annually and its market capitalization stood at Rs. 4.6 trillion.

Arth Anvesan, Volume 12(1 & 2), 2017 ISSN: 0973-8193
35
Exhibit 1: CEO’s at Tata Group and their Major Work
CEO Tenure Major Work
Jamsetji Nusserwanji Tata 1868-1904 He helped pave the path to industrialization in India
by seeding pioneering businesses in sectors such as
steel, energy, textiles, and hospitality.
Sir Dorab Tata 1904-1932 He was the force behind the setting up, in 1907, of
the Tata Iron and Steel Company. xlvii He
consolidated the group’s businesses while also
getting in new areas, notably insurance and the
production of soaps, detergents and cooking oil.
Sir Nowroji Saklatwala 1932-1938 He remained at the position of chairman for a very
limited time owing to his ill health and continued
with the work of consolidation started by Sir Dorab
Tata.
JRD Tata 1938-1991 Under his leadership, Tata group expanded
regularly into new spheres of business. The more
prominent of these ventures were Tata Chemicals
(1939), Tata Motors and Tata Industries (both
1945), Voltas (1954), Tata Tea [(1962) now known
as Tata Global Beverages], Tata Consultancy
Services (1968) and Titan Industries (1984).
Ratan Tata 1991-2012 He was instrumental in the acquisition of Tetley,
Jaguar Land Rover and Corus, which turned Tata
from a major India-Centric company to a global
brand name. The success of the company under his
leadership took the company to the New York
Stock Exchange. He was also a leading
philanthropist and more than half of his share in the
group is invested in charitable trusts. Through his
pioneering ideas and positive outlook, he continues
to serve as a guiding force for his conglomerate
even after retirement.xlviii
Cyrus Mistry 2012-2016 He attracted many controversies and was sacked by
the company following his tenure of four years as
chairman citing non-performance of the group
companies as thereas on.
Natarajan Chandrasekaran 2016-
present
He was the youngest CEO of one of the best
performing Tata group companies, TCS.
Source: Our heritage. (n.d.). Tata Group. Retrieved 27 October 2017, from
http://www.tata.com/htm/heritage/HeritageOption1.html#2Page/4
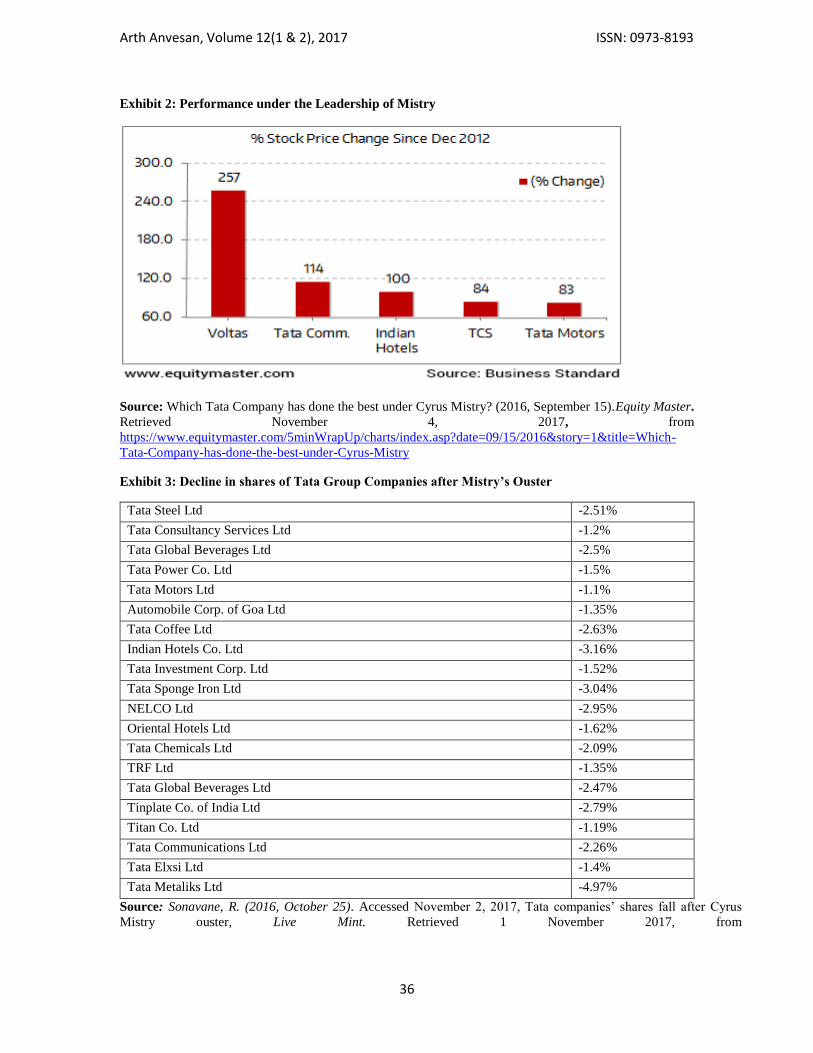
Arth Anvesan, Volume 12(1 & 2), 2017 ISSN: 0973-8193
36
Exhibit 2: Performance under the Leadership of Mistry
Source: Which Tata Company has done the best under Cyrus Mistry? (2016, September 15).Equity Master.
Retrieved November 4, 2017, from
https://www.equitymaster.com/5minWrapUp/charts/index.asp?date=09/15/2016&story=1&title=Which-
Tata-Company-has-done-the-best-under-Cyrus-Mistry
Exhibit 3: Decline in shares of Tata Group Companies after Mistry’s Ouster
Tata Steel Ltd -2.51%
Tata Consultancy Services Ltd -1.2%
Tata Global Beverages Ltd -2.5%
Tata Power Co. Ltd -1.5%
Tata Motors Ltd -1.1%
Automobile Corp. of Goa Ltd -1.35%
Tata Coffee Ltd -2.63%
Indian Hotels Co. Ltd -3.16%
Tata Investment Corp. Ltd -1.52%
Tata Sponge Iron Ltd -3.04%
NELCO Ltd -2.95%
Oriental Hotels Ltd -1.62%
Tata Chemicals Ltd -2.09%
TRF Ltd -1.35%
Tata Global Beverages Ltd -2.47%
Tinplate Co. of India Ltd -2.79%
Titan Co. Ltd -1.19%
Tata Communications Ltd -2.26%
Tata Elxsi Ltd -1.4%
Tata Metaliks Ltd -4.97%
Source: Sonavane, R. (2016, October 25). Accessed November 2, 2017, Tata companies’ shares fall after Cyrus
Mistry ouster, Live Mint. Retrieved 1 November 2017, from

Arth Anvesan, Volume 12(1 & 2), 2017 ISSN: 0973-8193
37
http://www.livemint.com/Money/YE6YP7Tm4KDDPI0yZ1zMIN/Tata-Group-companies-shares-fall-after-Cyrus-
Mistrys-ouste.html
Endnotes
iKrishnan, R. (2016, October 27). Cyrus Mistry vs Ratan Tata: A guide to the key issues involved. Live Mint. Retrieved 1 November
2017, from http://www.livemint.com/Companies/0F1R1KoI1wugK6jq9r1ZFK/The-TataMistry-spat-All-you-need-to-know.html. iiKnowledge Management Practices in Tata Group. (n.d). Shodhganga. Retrieved 28 October 2017, from http://shodhganga.inflibnet.ac.in/bitstream/10603/170430/11/11_chapter_2.pdf. iiiTata group profile. (n.d.). Tata Group. Retrieved 27 October 2017, from http://www.tata.com/aboutus/sub_index/Leadership-with-
trust. ivThe amazing story of how Ratan Tata built an empire. (2010, October 21). Rediff. Retrieved 29 October 2017, from
http://business.rediff.com/slide-show/2010/oct/20/slide-show-1-amazing-story-of-how-ratan-tata-built-an-empire.htm#1. v Our heritage. (n.d.). Tata Group. Retrieved 27 October 2017, fromhttp://www.tata.com/htm/heritage/HeritageOption1.html#2Page/4. viThe amazing story of how Ratan Tata built an empire. (2010, October 21). Rediff. Retrieved 29 October 2017, from
http://business.rediff.com/slide-show/2010/oct/20/slide-show-1-amazing-story-of-how-ratan-tata-built-an-empire.htm#12. vii HT Correspondent. (2016, October 25). Cyrus Mistry, brought in young as Tata Group chief and gone soon, Hindustan Times. Retrieved 1 November 2017, from http://www.hindustantimes.com/business-news/cyrus-mistry-the-man-behind-the-6th-chairman-of-
the-tata-group/story-EEtsVIgRlm32KmHMnqOhBK.html. viii Our heritage. (n.d.). Tata Group. Retrieved 27 October 2017, from http://www.tata.com/htm/heritage/HeritageOption1.html#3Page. ix Our heritage. (n.d.). Tata Group. Retrieved 27 October 2017, fromhttp://www.tata.com/htm/heritage/HeritageOption1.html#4Page. xThe amazing story of how Ratan Tata built an empire. (2010, October 21). Rediff. Retrieved 29 October 2017, from
http://business.rediff.com/slide-show/2010/oct/20/slide-show-1-amazing-story-of-how-ratan-tata-built-an-empire.htm#5. xi The amazing story of how Ratan Tata built an empire. (2010, October 21). Rediff. Retrieved 29 October 2017, from
http://business.rediff.com/slide-show/2010/oct/20/slide-show-1-amazing-story-of-how-ratan-tata-built-an-empire.htm#6. xiiIdib. xiii Witzel, M. (2010, December 30). Case study: Tata. The Financial Times. Retrieved 29 October 2017, from
http://www.tata.com/article/inside/a4nE!$$$!ZOfHT0=/TLYVr3YPkMU=Case. xiv The amazing story of how Ratan Tata built an empire. (2010, October 21). Rediff. Retrieved 29 October 2017, from
http://business.rediff.com/slide-show/2010/oct/20/slide-show-1-amazing-story-of-how-ratan-tata-built-an-empire.htm#6. xv Representation to Stakeholders from the desk of Cyrus Mistry. (2016, December 5). Cyrus for Governance, Retrieved November 4, 2017, from http://cyrusforgovernance.com/pdf/stakeholders/Indian-Hotels-Company-Limited-Stakeholders.pdf. xviThe amazing story of how Ratan Tata built an empire. (2010, October 21). Rediff. Retrieved 29 October 2017, from
http://business.rediff.com/slide-show/2010/oct/20/slide-show-1-amazing-story-of-how-ratan-tata-built-an-empire.htm#7. xviiThe amazing story of how Ratan Tata built an empire. (2010, October 21). Rediff. Retrieved 29 October 2017, from
http://business.rediff.com/slide-show/2010/oct/20/slide-show-1-amazing-story-of-how-ratan-tata-built-an-empire.htm. xviii Why Ratan Tata remains the king of India's corporate world.(2015, January 21).Rediff. Retrieved 30 October 2017, from http://www.rediff.com/business/special/special-why-ratn-tata-remains-the-king-of-indias-corporate-world/20150121.htm. xixThe amazing story of how Ratan Tata built an empire. (2010, October 21). Rediff. Retrieved 29 October 2017, from
http://business.rediff.com/slide-show/2010/oct/20/slide-show-1-amazing-story-of-how-ratan-tata-built-an-empire.htm#11. xxThe amazing story of how Ratan Tata built an empire. (2010, October 21). Rediff. Retrieved 29 October 2017, from
http://business.rediff.com/slide-show/2010/oct/20/slide-show-1-amazing-story-of-how-ratan-tata-built-an-empire.htm#13. xxi Mistry was Tata favourite, a unanimous choice in 2011. (2016, October 24). The Hindu. Retrieved 29 October 2017, from 2016 http://www.thehindu.com/business/Industry/Mistry-was-Tata-favourite-unanimous-choice-in-2011/article16081482.ece. xxiiIdib. xxiii HT Correspondent. (2016, October 25). Cyrus Mistry, brought in young as Tata Group chief and gone soon, Hindustan Times. Retrieved 1 November 2017, from http://www.hindustantimes.com/business-news/cyrus-mistry-the-man-behind-the-6th-chairman-of-
the-tata-group/story-EEtsVIgRlm32KmHMnqOhBK.html. xxivIdib. xxv Kalesh, B., Vijayraghavan, K., & Barman, A. (2016, October 25). Behind the scenes: What led to Cyrus Mistry ouster. The Times
of India. Retrieved 2 November 2017, from https://timesofindia.indiatimes.com/business/india-business/Behind-the-scenes-What-led-
to-Cyrus-Mistry-ouster/articleshow/55042818.cms. xxviIdib. xxviiIdib. xxviii BI India Bureau. (2016, October 24). Why did Tata Sons remove Cyrus Mistry as the Chairman? Business Insider. Retrieved 2 November 2017, from http://www.businessinsider.in/Why-did-Tata-Sons-remove-Cyrus-Mistry-as-the-
Chairman/articleshow/55032613.cms. xxixIdib. xxxIdib. xxxi John, N. (2016, October 27). 9 possible reasons behind the removal of Cyrus Mistry, Business Today. Retrieved 2 November 2017,
from http://www.businesstoday.in/current/corporate/9-possible-reasons-behind-the-removal-of-cyrus-mistry/story/238901.html. xxxiiKrishnan, R. (2016, October 27). Cyrus Mistry vs Ratan Tata: A guide to the key issues involved. Live Mint. Retrieved 1
November 2017, from http://www.livemint.com/Companies/0F1R1KoI1wugK6jq9r1ZFK/The-TataMistry-spat-All-you-need-to-
know.html.
Arth Anvesan, Volume 12(1 & 2), 2017 ISSN: 0973-8193
38
xxxiii Kalesh, B., Vijayraghavan, K., & Barman, A. (2016, October 25). Behind the scenes: What led to Cyrus Mistry ouster. The Times
of India. Retrieved 2 November 2017, from https://timesofindia.indiatimes.com/business/india-business/Behind-the-scenes-What-led-to-Cyrus-Mistry-ouster/articleshow/55042818.cms. xxxiv PRATAP, R. (2016, October 25). Tata Cyrus: A clear case of the need for succession planning. The Hindu. Retrieved October 30,
2017, from http://www.thehindubusinessline.com/companies/tata-cyrus-a-clear-case-of-the-need-for-succession-planning/article9267984.ece. xxxv Sonavane, R. (2016, October 25). accessed November 2, 2017, Tata companies’ shares fall after Cyrus Mistry ouster, Live Mint.
Retrieved 1 November 2017, from http://www.livemint.com/Money/YE6YP7Tm4KDDPI0yZ1zMIN/Tata-Group-companies-shares-fall-after-Cyrus-Mistrys-ouste.html. xxxvi Representation to Stakeholders from the desk of Cyrus Mistry. (2016, December 5). Cyrus for Governance, Retrieved November 4, 2017, from http://cyrusforgovernance.com/pdf/stakeholders/Indian-Hotels-Company-Limited-Stakeholders.pdf. xxxvii Zachariah, R., Vipashana V K. (2016, November 22). Shared Tata strategy only with Trusts: Nirmalya Kumar, The Economic
Times. Retrieved 2 November 2017, from https://economictimes.indiatimes.com/news/company/corporate-trends/shared-tata-strategy-only-with-trusts-nirmalya-kumar/articleshow/55556226.cms. xxxviii Representation to Stakeholders from the desk of Cyrus Mistry. (2016, December 5). Cyrus for Governance, Retrieved November
4, 2017, from http://cyrusforgovernance.com/pdf/stakeholders/Indian-Hotels-Company-Limited-Stakeholders.pdf. xxxixIdib. xlKrishnan, R. (2016, October 27). Cyrus Mistry vs Ratan Tata: A guide to the key issues involved. Live Mint. Retrieved 1 November
2017, from http://www.livemint.com/Companies/0F1R1KoI1wugK6jq9r1ZFK/The-TataMistry-spat-All-you-need-to-know.html. xliIdib. xliiKrishnan, R. (2016, October 27). Cyrus Mistry vs Ratan Tata: A guide to the key issues involved. Live Mint. Retrieved 1 November
2017, from http://www.livemint.com/Companies/0F1R1KoI1wugK6jq9r1ZFK/The-TataMistry-spat-All-you-need-to-know.html. xliii Representation to Stakeholders from the desk of Cyrus Mistry. (2016, December 5). Cyrus for Governance, Retrieved November 4,
2017, from http://cyrusforgovernance.com/pdf/stakeholders/Indian-Hotels-Company-Limited-Stakeholders.pdf. xlivIdib. xlv Sharma, S. (2016, December 22). Tata Steel EGM: Verdict on Nusli Wadia as independent director likely today. Live Mint.
Retrieved November 7, 2017, from http://www.livemint.com/Companies/DB4ZQlnnHIvFlOqidRvweI/Nusli-Wadia-stays-away-from-
Tata-Steel-EGM.html. xlvi Representation to Stakeholders from the desk of Cyrus Mistry. (2016, December 5). Cyrus for Governance, Retrieved November 4,
2017, from http://cyrusforgovernance.com/pdf/stakeholders/Indian-Hotels-Company-Limited-Stakeholders.pdf. xlvii Our heritage. (n.d.). Tata Group. Retrieved 27 October 2017, fromhttp://www.tata.com/htm/heritage/HeritageOption1.html#2Page/4. xlviii Ratan Tata Biography (2017, September 26). The Famous People. Retrieved November 7, 2017, from
https://www.thefamouspeople.com/profiles/ratan-tata-5516.php.

Arth Anvesan, Volume 12(1 & 2), 2017 ISSN: 0973-8193
39
Dear Authors,
Arth Anvesan is a refereed biannual journal of Faculty of Management of Shri Mata Vaishno Devi
University, Katra, J&K, India. It invites empirical research papers, articles, case researches, case
studies with teaching notes, policy papers and book reviews, related to different facets of
management and economics, from academicians, practitioners and research scholars, for
publication in its upcoming issues. The material, sent for publication should be an original work
which has not been previously published or submitted for publication elsewhere. Manuscript
submitted for publication must be in English. The guidelines for submission are as follows:
General Guidelines:
1. Papers are accepted only in English. 2. The manuscripts must mention in the cover note regarding the category in which their
submission should be considered in, such as research papers, articles, case researches, case studies with teaching notes, policy papers or book reviews
3. Manuscripts should be compiled in the following order: title page; abstract; keywords; main text; acknowledgments; appendixes (as appropriate); references; table(s) with caption(s) (on individual pages); figure caption(s) (as a list).
4. The references should be according to the APA VIth format. 5. The manuscripts should be typed in double space on one side of A4-size paper in MS-
Word Format; with margins of 1.5" on the left side and 1" on the other three sides; 6. The manuscripts submitted should not be of more than 5000 words. 7. Abstracts of 200-300 words are required for all papers submitted. 8. Each paper should have three to six keywords 9. All the authors of a paper should include their full names, affiliations, postal addresses,
telephone and fax numbers and email addresses on the cover page of the manuscript. One author should be identified as the Corresponding Author.
10. Tables, figures and photographs must be numbered consecutively with Roman numerals. Please check that your text contains a source to each table. Equations must be numbered consecutively on the right margin, using Arabic numerals in parenthesis.
11. Authors must adhere to SI units. Units should not be italicized.
Note: Each article should be accompanied with a declaration by all the authors in their submission letter addressed to the Managing Editor that:
Work submitted by the author is original. He has secured all the necessary permissions for use of third party material and they do not violate any copy right norms.
Arth Anvesan, Volume 12(1 & 2), 2017 ISSN: 0973-8193
40
The author has not included any statement that could be considered: abusive, defamatory, libellous, obscene, and fraudulent, to infringe the rights of others, or to be in any other way unlawful or in violation of applicable laws.
The author has obtained necessary consent for case study from the organizations for participants in any research or study. Furthermore he must confirm that no individual/ organization can be identified by the manuscript, nor will author identify them in any way as per the copyright.
The author has acknowledged in the text of the manuscript about the benefit arising from the direct applications of the research.
The author has consulted co-authors if any and guarantees that he has been authorized by all co-authors to sign on their behalf, if applicable.
If the warranties outlined above are breached I understand that author will keep publisher i.e. School of Business, Faculty of Management, Shri Mata Vaishno Devi University, Katra, indemnified in full against all loss, damages, injury, costs and expenses (including legal and other professional fees and expenses) incurred or paid by publisher as a result.
If submitting through post, the manuscripts should be sent to the following address:
The Managing Editor,
Arth Anvesan School of Business
Faculty of Management Shri Mata Vaishno Devi University
Katra-182320 Jammu & Kashmir, India
The manuscripts can be submitted via e-mail to the Managing Editor Arth Anvesan at Email id: - [email protected], [email protected]
Frequency and Subscription
Arth Anvesan is a Bi-Annual Refereed Journal from Faculty of Management, SMVDU. Single
copy of the journal is available for Rs. 250 only and subscriptions fees are as follows:
Individual Subscription Fees Institutional Subscription Fees
One Year Rs. 400 One Year Rs.500
Five Years Rs. 1800 Five Years Rs. 2000
Demand draft or Cheque should be drawn in favor of Registrar, Shri Mata Vaishno Devi
University, payable at Katra, J&K.