Short echo time 1 H MRSI of the human brain at 3T with adiabatic slice-selective refocusing pulses;...
10
Original Research Short Echo Time 1 H MRSI of the Human Brain at 3T With Adiabatic Slice-Selective Refocusing Pulses; Reproducibility and Variance in a Dual Center Setting Jannie P. Wijnen, MSc, 1 * Jack J.A. van Asten, MA, 1 Dennis W.J. Klomp, PhD, 1 Torill E. Sjobakk, PhD, 2 Ingrid S. Gribbestad, PhD, 2 Tom W.J. Scheenen, PhD, 1 and Arend Heerschap, PhD 1 Purpose: To assess the reproducibility of 1 H-MR spectro- scopic imaging (MRSI) of the human brain at 3T with volume selection by a double spin echo sequence for localization with adiabatic refocusing pulses (semi- LASER). Materials and Methods: Twenty volunteers in two differ- ent institutions were measured twice with the same pulse sequence at an echo time of 30 msec. Magnetic resonance (MR) spectra were analyzed with LCModel with a simu- lated basis set including an experimentally acquired mac- romolecular signal profile. For specific regions in the brain mean metabolite levels, within and between subject variance, and the coefficient of variation (CoV) were calcu- lated (for taurine, glutamate, total N-acetylaspartate, total creatine, total choline, myo-inositol þ glycine, and gluta- mate þ glutamine). Results: Repeated measurements showed no significant differences with a paired t-test and a high reproducibility (CoV ranging from 3%–30% throughout the selected vol- ume). Mean metabolite levels and CoV obtained in similar regions in the brain did not differ significantly between two contributing institutions. The major source of differ- ences between different measurements was identified to be the between-subject variations in the volunteers. Conclusion: We conclude that semi-LASER 1 H-MRSI at 3T is an adequate method to obtain quantitative and reproducible measures of metabolite levels over large parts of the brain, applicable across multiple centers. Key Words: MRSI; reproducibility; multicenter study; within subject variance; between subject variance; brain; 3T J. Magn. Reson. Imaging 2010;31:61–70. V C 2009 Wiley-Liss, Inc. IN CLINICAL APPLICATIONS of proton magnetic reso- nance (MR) spectroscopic imaging ( 1 H-MRSI) point- resolved spectroscopy (1) (PRESS) is the most com- monly used method to select a volume of interest (VOI). However, with the introduction of MR systems at higher magnetic field strength the chemical shift displacement error (CSDE) of the slice selective refo- cusing pulses can no longer be overlooked. This can be solved by using pulses with large bandwidths, although this comes at the expense of higher peak power. To avoid high peak power, longer pulses are chosen but this lengthens the minimal echo time. Recently, a 1 H-MRSI sequence was developed based on PRESS localization, combining adiabatic slice selective refocusing pulses (2) as applied in the LASER sequence (localization by adiabatic selective refocusing (3)) with conventional slice selective excita- tion. This so-called semi-LASER sequence (4) can be applied to the brain with an echo time of 30 msec. Its bandwidth of 5 kHz for the adiabatic refocusing pulses restricts the CSDE at 3T to 12% over 5 ppm, whereas the CSDE of PRESS with conventional slice selective pulses (bandwidth of 1.3 kHz) at 3T and 1.5T is 48% and 24% respectively (4). Therefore, semi-LASER enables acquisition of high-quality spec- tra of individual voxels in almost the entire VOI. With the small CSDE and sharp selection profiles of the ad- iabatic refocusing pulses, the VOI can be positioned close to the skull, without causing contamination of voxels within the VOI with signals from subcutaneous lipids. The adiabatic refocusing pulses are tolerant to B 1 inhomogeneities as well, which is a benefit at 1 Department of Radiology, Radboud University Nijmegen Medical Center, Nijmegen, The Netherlands. 2 Department of Circulation and Medical Imaging, Norwegian University of Science and Technology, Trondheim, Norway. Contract grant sponsor: European Union eTUMOUR Project; Contract grant number: LSHC-CT-2004-503094; Contract grant sponsor: Netherlands Organisation for Health Research and Development; Contract grant number: ZonMw grant 916.56.036. *Address reprint requests to: J.P.W., Department of Radiology (667), Radboud University Nijmegen Medical Center, Geertgroote plein 10, P.O. Box 9101, 6500 HB Nijmegen, The Netherlands. E-mail: [email protected] Received April 24, 2009; Accepted October 6, 2009. DOI 10.1002/jmri.21999 Published online in Wiley InterScience (www.interscience.wiley.com). JOURNAL OF MAGNETIC RESONANCE IMAGING 31:61–70 (2010) V C 2009 Wiley-Liss, Inc. 61
-
Upload
independent -
Category
Documents
-
view
0 -
download
0
Transcript of Short echo time 1 H MRSI of the human brain at 3T with adiabatic slice-selective refocusing pulses;...
Original Research
Short Echo Time 1H MRSI of the Human Brainat 3T With Adiabatic Slice-Selective RefocusingPulses; Reproducibility and Variance in a DualCenter Setting
Jannie P. Wijnen, MSc,1* Jack J.A. van Asten, MA,1 Dennis W.J. Klomp, PhD,1
Torill E. Sjobakk, PhD,2 Ingrid S. Gribbestad, PhD,2 Tom W.J. Scheenen, PhD,1
and Arend Heerschap, PhD1
Purpose: To assess the reproducibility of 1H-MR spectro-scopic imaging (MRSI) of the human brain at 3T withvolume selection by a double spin echo sequence forlocalization with adiabatic refocusing pulses (semi-LASER).
Materials and Methods: Twenty volunteers in two differ-ent institutions were measured twice with the same pulsesequence at an echo time of 30 msec. Magnetic resonance(MR) spectra were analyzed with LCModel with a simu-lated basis set including an experimentally acquired mac-romolecular signal profile. For specific regions in thebrain mean metabolite levels, within and between subjectvariance, and the coefficient of variation (CoV) were calcu-lated (for taurine, glutamate, total N-acetylaspartate, totalcreatine, total choline, myo-inositol þ glycine, and gluta-mate þ glutamine).
Results: Repeated measurements showed no significantdifferences with a paired t-test and a high reproducibility(CoV ranging from 3%–30% throughout the selected vol-ume). Mean metabolite levels and CoV obtained in similarregions in the brain did not differ significantly betweentwo contributing institutions. The major source of differ-ences between different measurements was identified tobe the between-subject variations in the volunteers.
Conclusion: We conclude that semi-LASER 1H-MRSI at3T is an adequate method to obtain quantitative and
reproducible measures of metabolite levels over largeparts of the brain, applicable across multiple centers.
Key Words: MRSI; reproducibility; multicenter study;within subject variance; between subject variance; brain; 3TJ. Magn. Reson. Imaging 2010;31:61–70.VC 2009 Wiley-Liss, Inc.
IN CLINICAL APPLICATIONS of proton magnetic reso-nance (MR) spectroscopic imaging (1H-MRSI) point-resolved spectroscopy (1) (PRESS) is the most com-monly used method to select a volume of interest(VOI). However, with the introduction of MR systemsat higher magnetic field strength the chemical shiftdisplacement error (CSDE) of the slice selective refo-cusing pulses can no longer be overlooked. This canbe solved by using pulses with large bandwidths,although this comes at the expense of higher peakpower. To avoid high peak power, longer pulses arechosen but this lengthens the minimal echo time.Recently, a 1H-MRSI sequence was developed basedon PRESS localization, combining adiabatic sliceselective refocusing pulses (2) as applied in theLASER sequence (localization by adiabatic selectiverefocusing (3)) with conventional slice selective excita-tion. This so-called semi-LASER sequence (4) can beapplied to the brain with an echo time of 30 msec. Itsbandwidth of 5 kHz for the adiabatic refocusingpulses restricts the CSDE at 3T to 12% over 5 ppm,whereas the CSDE of PRESS with conventional sliceselective pulses (bandwidth of 1.3 kHz) at 3T and1.5T is 48% and 24% respectively (4). Therefore,semi-LASER enables acquisition of high-quality spec-tra of individual voxels in almost the entire VOI. Withthe small CSDE and sharp selection profiles of the ad-iabatic refocusing pulses, the VOI can be positionedclose to the skull, without causing contamination ofvoxels within the VOI with signals from subcutaneouslipids. The adiabatic refocusing pulses are tolerant toB1 inhomogeneities as well, which is a benefit at
1Department of Radiology, Radboud University Nijmegen MedicalCenter, Nijmegen, The Netherlands.2Department of Circulation and Medical Imaging, Norwegian Universityof Science and Technology, Trondheim, Norway.
Contract grant sponsor: European Union eTUMOUR Project; Contractgrant number: LSHC-CT-2004-503094; Contract grant sponsor:Netherlands Organisation for Health Research and Development;Contract grant number: ZonMw grant 916.56.036.
*Address reprint requests to: J.P.W., Department of Radiology (667),Radboud University Nijmegen Medical Center, Geertgroote plein 10,P.O. Box 9101, 6500 HB Nijmegen, The Netherlands.E-mail: [email protected]
Received April 24, 2009; Accepted October 6, 2009.
DOI 10.1002/jmri.21999Published online in Wiley InterScience (www.interscience.wiley.com).
JOURNAL OF MAGNETIC RESONANCE IMAGING 31:61–70 (2010)
VC 2009 Wiley-Liss, Inc. 61
higher field strengths. The four adiabatic refocusingpulses in the semi-LASER sequence are expected toaffect the spectral shape of J-coupled spin systems(4), which has to be taken into account when process-ing spectra with algorithms using prior knowledge ofspectral shape such as LCModel (5).
In clinical MR spectroscopy, knowledge of metabo-lite levels, their distribution, and the variation withinand between subjects in the normal human brain isnecessary to distinguish significant differences inmetabolite levels within one patient or betweenpatients and healthy subjects. To be of value in clini-cal diagnosis, the changes in metabolite levels causedby diseases have to be larger than the biological varia-tion of these metabolite levels and larger than changesin metabolite levels that occur due to imperfectionsof the measurement method. Information on thebetween-subject variance is important in diseasesthat may affect larger parts of the brain, such as mul-tiple sclerosis and Alzheimer’s (6,7), when an internalreference to normal tissue is missing. The variation ofmetabolite levels in the human brain has been deter-mined with single voxel spectroscopy (8–10) and 1H-MRSI (11–13) at various magnetic field strengths.Also, the reproducibility or an analysis of variance(ANOVA) of conventional PRESS 1H-MRSI at 1.5T (14–16) and of single voxel PRESS MRS at 3T has beenreported (17,18). However, recent advances in 1H-MRSI at 3T with the introduction of the semi-LASERsequence invoke the need for an estimate of the repro-ducibility of 1H-MRSI at 3T as well as evidence of ro-bust performance of the semi-LASER sequence inde-pendent from institution and MR spectroscopist, todetermine if this new technique could be used as aclinical standard for the near future.
Therefore, the aim of this study was to determinethe reliability and reproducibility of assessing metabo-lite levels in the human adult brain by the semi-LASER sequence with a short echo time at 3T. Data-sets were acquired at two independent centers usingthe same protocol to evaluate the reproducibility ofthe sequence in a dual center setting.
MATERIALS AND METHODS
The contributing institutions were the Radboud Uni-versity Nijmegen Medical Center in the Netherlands(RUN-MC) and the Norwegian University of Scienceand Technology in Norway (NTNU).
Hardware and Subjects
All investigations were performed on 3T whole bodyMR systems (TIM Trio, Siemens Medical Solutions,Erlangen, Germany). The body coil was used for exci-tation of the MR signal and a receive-only 12-channelarray head coil driven in CP mode was used for signalreception. Metabolite levels in the brain were investi-gated in 10 healthy volunteers at each institution. Todetermine the reproducibility of the semi-LASERsequence, the 10 volunteers were measured twice inRUN-MC. In NTNU 10 other volunteers were also
examined twice. The age of the volunteers was 35 612 years in RUN-MC and 23 6 3 years in NTNU. Themeasurements were conducted in compliance with theregulations of the local institutions Human EthicsCommittee.
MRI and MRS Protocol
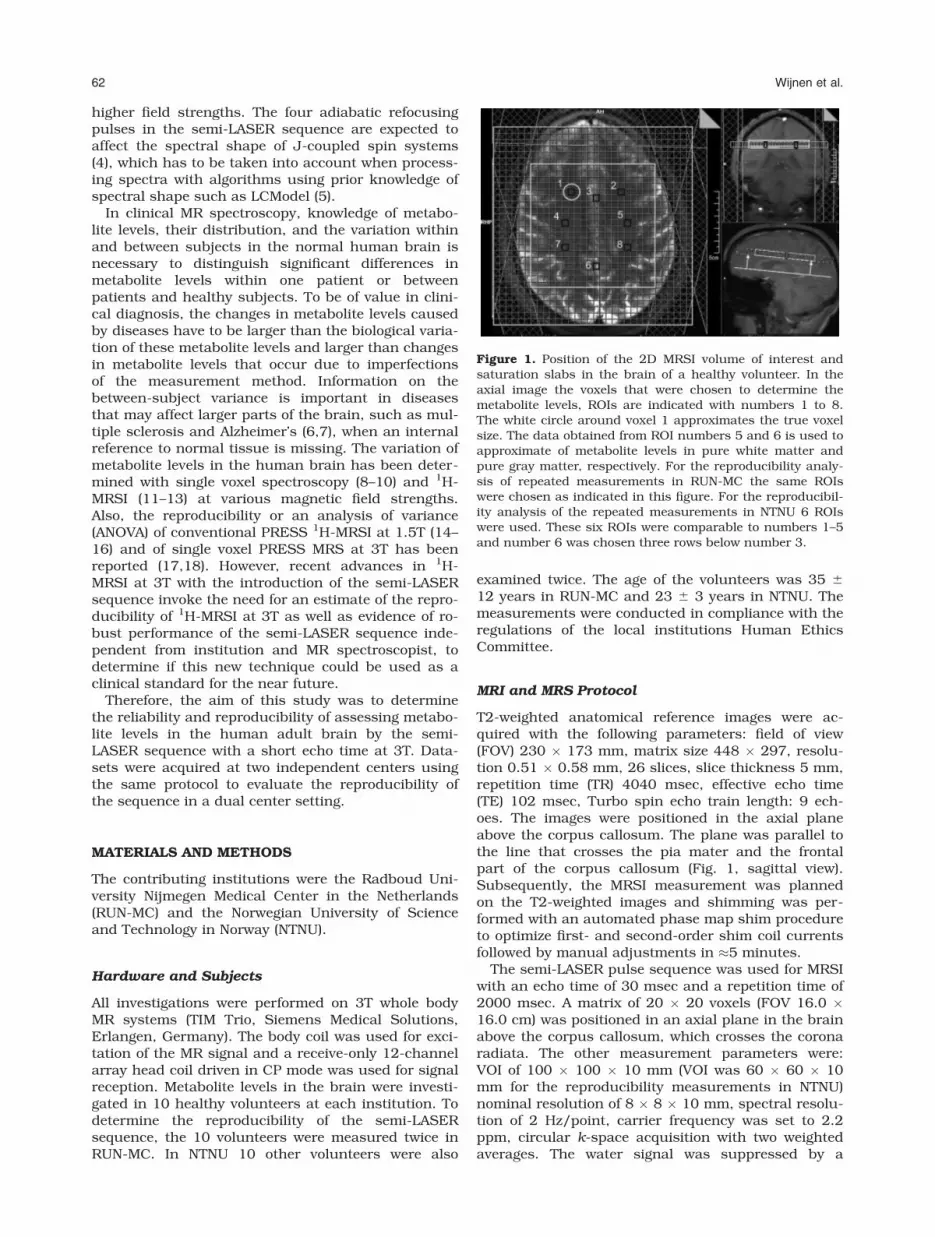
T2-weighted anatomical reference images were ac-quired with the following parameters: field of view(FOV) 230 � 173 mm, matrix size 448 � 297, resolu-tion 0.51 � 0.58 mm, 26 slices, slice thickness 5 mm,repetition time (TR) 4040 msec, effective echo time(TE) 102 msec, Turbo spin echo train length: 9 ech-oes. The images were positioned in the axial planeabove the corpus callosum. The plane was parallel tothe line that crosses the pia mater and the frontalpart of the corpus callosum (Fig. 1, sagittal view).Subsequently, the MRSI measurement was plannedon the T2-weighted images and shimming was per-formed with an automated phase map shim procedureto optimize first- and second-order shim coil currentsfollowed by manual adjustments in �5 minutes.
The semi-LASER pulse sequence was used for MRSIwith an echo time of 30 msec and a repetition time of2000 msec. A matrix of 20 � 20 voxels (FOV 16.0 �16.0 cm) was positioned in an axial plane in the brainabove the corpus callosum, which crosses the coronaradiata. The other measurement parameters were:VOI of 100 � 100 � 10 mm (VOI was 60 � 60 � 10mm for the reproducibility measurements in NTNU)nominal resolution of 8 � 8 � 10 mm, spectral resolu-tion of 2 Hz/point, carrier frequency was set to 2.2ppm, circular k-space acquisition with two weightedaverages. The water signal was suppressed by a
Figure 1. Position of the 2D MRSI volume of interest andsaturation slabs in the brain of a healthy volunteer. In theaxial image the voxels that were chosen to determine themetabolite levels, ROIs are indicated with numbers 1 to 8.The white circle around voxel 1 approximates the true voxelsize. The data obtained from ROI numbers 5 and 6 is used toapproximate of metabolite levels in pure white matter andpure gray matter, respectively. For the reproducibility analy-sis of repeated measurements in RUN-MC the same ROIswere chosen as indicated in this figure. For the reproducibil-ity analysis of the repeated measurements in NTNU 6 ROIswere used. These six ROIs were comparable to numbers 1–5and number 6 was chosen three rows below number 3.
62 Wijnen et al.

slightly modified WET (water suppression enhancedthrough T1 effects) scheme (19). The final gradientspoiler of this scheme has a high amplitude and shortduration, leaving time for five optional outer volumesaturation slabs (nine-lobe sinc RF pulses) before the90� excitation of the MRSI sequence. These saturationslabs were placed around the VOI over the skull. Theacquisition time was 11 minutes. The MRSI measure-ment was repeated with a one-average acquisitionwithout water suppression to acquire a water refer-ence dataset (acquisition time 9 minutes).
All MRSI data were filtered in the two spatial dimen-sions with a Hamming filter. Before Fourier transfor-mation the data were zero-filled to a 32 � 32 matrix.The combination of the weighted acquisition and fil-tering of k-space reduced contamination from neigh-boring voxels, but it increases the real voxel size(defined at 50% of slice profile height) by a factor of1.57 in both spatial directions (20). The true voxelsize can be best approximated by a circle with a diam-eter of 12.5 mm in a slice of 10 mm thickness.
Macromolecular MRS Profile of the Brain
To obtain an MRS profile of the macromolecules inthe brain a separate measurement was done on ahealthy volunteer using a similar method as describedbefore for MRS in the brain (21,22). For this purposean inversion pulse was applied before the excitationpulse in the semi-LASER sequence. With an inversiontime of 500 msec, most signals from the main metab-olites were nulled and a spectrum of the macromole-cules was obtained. Nine voxels containing a mix ofgray and white matter were averaged. From this signalthe residues from water, the methyl group of creatine,and the methyl group of N-acetylaspartate wereremoved. The time domain signal was zero-filled tomatch the dwell time of the simulated MR spectra forthe LCModel basis set. This final result was includedas macromolecular signal profile in the LCModel basisset (see below).
Simulations of MR Spectra for Basis Set
1H MR spectral profiles were simulated for each rele-vant compound by NMRSIM (v. 4.6.a. Bruker Biospin,Billerica, MA) with the semi-LASER pulse sequence atan echo time of 30 msec, for glycerophosphocholine(GPC), choline (Cho), phosphocholine (PC), creatine(Cr), phosphocreatine (PCr), glutamate (Glu), gluta-mine (Gln), taurine (Tau), myo-inositol (mI), glycine(Gly), glucose (Glc), N-acetylaspartate(glutamate) (NAA(G)),alanine (Ala), c-aminobutyrate (GABA), aspartate (Asp),glutathione (GSH), lactate (Lac), succinate (Suc), guani-doacetate (Gua), pyruvate (Pyr), scyllo-Inositol (Scyllo),and acetate (Act). We used chemical shift constantsand coupling constants as reported by Govindarajuet al (23). All simulated spectral profiles togetherwith the measured macromolecular signal served asthe basis set to fit measured in vivo MR spectra byLCModel (v. 6.1-4F) (5).
LCModel Analysis
All voxels inside the VOI selection volume were ana-lyzed by LCModel. The signal of water in the unsup-pressed MRSI was used by LCModel for eddy currentcorrection and quantification. For this quantificationwe assumed an average tissue water content in thebrain of 64% (35.6 mol/L in white matter, LCModelmanual). Furthermore, with TE ¼ 30 msec and TR ¼2000 msec the T2 and T1 relaxation have to be takeninto account for quantification. A variety of T1 and T2relaxation times of several metabolite and water pro-ton spins in the brain at 3T have been reported fordifferent locations and tissue types (22–26). We calcu-lated correction factors, f, for the signal intensities ofindividual metabolites as compared to the water sig-nal intensity for white matter using Eq. [1] with T1relaxation times of 832, 1350, 1240, 1080, 1010, and1170 msec for water (26), NAA, Cr, Cho, mI, and Glu(25), respectively, and T2 relaxation times of 80, 295,156, 187, 200 msec for water (26), NAA, Cr, Cho (25),Glu (24), and assuming a T2 relaxation time of 170msec for mI.
f ¼ attenuationmetabolite
attenuationwater¼ ð1� e�TR=Tmet
1 Þe�TE=Tmet2
ð1� e�TR=TH2O
1 Þe�TE=TH2O
2
[1]
The correction factors derived from these calcula-tions varied between 1.06 and 1.16. Since the repro-ducibility results are not influenced by this attenua-tion factor, we used a general correction factor of1.12, which accounts for an average of 12% attenua-tion of metabolite signals as compared to that ofwater.
Regions of Interest
To compare metabolite levels in the brain both institu-tions selected the same volume of interest in 10 vol-unteers as shown in Fig. 1. In this volume, eightregions of interest (ROIs) were chosen to assess theselevels in different locations of white and gray matter(Fig. 1). Tissue levels of the sum of NAA and NAAG(NAA þ NAAG), total creatine (sum of Cr and PCr),total choline (sum of Cho, GPC, and PC), the sum ofmyo-inositol and glycine (mI þ Gly), Tau and Glu weredetermined. The data from ROI number 5 (Fig. 1) wasused to approximate metabolite levels of pure whitematter; the data from ROI number 6 in the same fig-ure served as a measure of pure gray matter.
Repeated measures were done between at least 1day and at most 4 months after the first measure-ment. Subject were positioned supine and with thehead in the middle of the head coil in the same wayas done in the first measurement. Eight ROIs (Fig. 1)from the data of repeated measurements performed inRUN-MC were used for the reproducibility analysis.The dimensions of the VOI in the repeated measure-ments that were performed at NTNU were 60 � 60 �10 mm and six ROIs were chosen similarly as shownin Fig. 1 to calculate the reproducibility from.
Short Echo Time 1H MRSI at 3T 63
Statistical Analysis
For each ROI, mean and standard deviation of Tau,Glu, total Cho, total NAA (NAA þ NAAG), total Cr, mIþ Gly, and Glx (Glu þ Gln) were calculated. The dif-ferences between metabolite levels in comparable vox-els of each site were tested with a one-way ANOVA(GraphPad Prism 4, San Diego, CA). A segmentationof the ROI in partial volume of gray matter, white mat-ter, and cerebrospinal fluid (CSF) was performedwhen the metabolite levels differed between sites. Thissegmentation was done manually on the T2-weightedimages using Siemens Syngo software for visualiza-tion of the ROIs.
Furthermore, in each voxel of the VOI the coefficientof variation (CoV) was calculated. The CoV wasdefined as the standard deviation of differencesbetween the first and second measurement (Dk) di-vided by the mean value of all measurements (M) ineach voxel, for each metabolite level (27) or:
CoV ¼
ffiffiffiffiffiffiffiffiffiffiffiffiffiffiffiffiffiffiffiffiffiffiffiffiffiffiffiffiffiffiffiffiffiffiffiffiffiffiffiffi1
ðn�1ÞPnk¼1
ðDk � �DÞ2s
�M� 100 and �D ¼ 1
n
Xnk¼1
Dk
[2]
where k is the volunteer number and n is the totalnumber of volunteers (per contributing center).
To assess the reproducibility for each metabolite ineach ROI a paired t-test and a test–retest reliabilitytest were performed (SPSS 16.0.01, Chicago, IL). Thereliability test used a two-way random model ANOVA,with the subjects and the repeated measurement asfactors of variance and it also includes a randomnoise term. From this the within-subject variancer2within (repeated measurements) the between-subjects
variance r2between (subject to subject), and the intra-
class correlation coefficient (ICC) were calculated. Theoverall measurement variance can be expressed as:
r2 ¼ r2between þ r2
within þ r2random; [3]
where r2random reflects variance due to randomness.
We defined the ICCbetween to reflect the part of thetotal variance that is caused by subject-to-subjecteffects, and the ICCwithin to represent the part of thetotal variance that is caused by the differences of therepeated measurement by the following equations:
ICCbetween ¼ MSbetween=ðMSbetween
þMSwithin þMSrandomÞ �100% [4]
ICCwithin ¼ MSwithin=ðMSbetween
þMSwithin þMSrandomÞ �100% [5]
MS is the mean square, which represents the sumof squares (r2) divided by the number of the degrees offreedom. For the sake of completeness, the ICCrandom
can be calculated from Eq. [4] and Eq. [5], being100% minus ICCbetween and ICCwithin, thus the sum ofthree ICCs equals 100% by definition.
RESULTS
All measurements were completed according to theprotocol described in Materials and Methods. Shim-ming resulted in consistent water linewidths over theentire VOI. The linewidth of water proton spins ofindividual voxels inside the VOI were 5.8 6 07 Hz forthe RUN-MC cases (n ¼ 1200, 120 voxels per volun-teer) and 5.5 6 0.5 Hz for the NTNU cases (n ¼ 1200,120 voxels per volunteer).
Fitting MR Spectra by LCModel
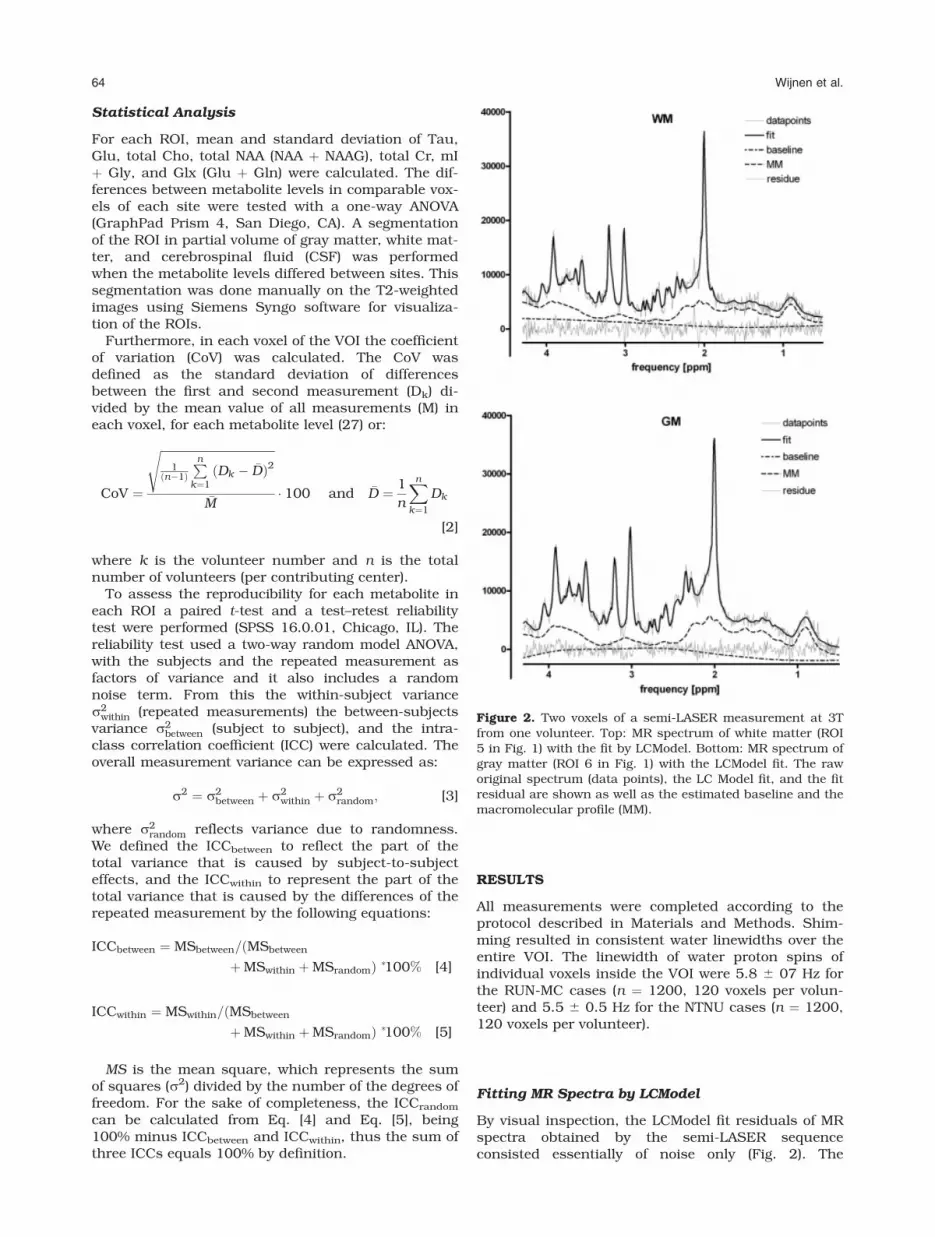
By visual inspection, the LCModel fit residuals of MRspectra obtained by the semi-LASER sequenceconsisted essentially of noise only (Fig. 2). The
Figure 2. Two voxels of a semi-LASER measurement at 3Tfrom one volunteer. Top: MR spectrum of white matter (ROI5 in Fig. 1) with the fit by LCModel. Bottom: MR spectrum ofgray matter (ROI 6 in Fig. 1) with the LCModel fit. The raworiginal spectrum (data points), the LC Model fit, and the fitresidual are shown as well as the estimated baseline and themacromolecular profile (MM).
64 Wijnen et al.
metabolites as well as the macromolecular signalswere properly fitted by the model spectra. The CRLB(in percentage) for the major brain metabolites, tNAA,tCr, tCho, and mI þ Gly in all ROIs in RUN-MC were3.0 6 0.5, 3.9 6 0.8, 5.1 6 0.9, and 5.2 6 1.0,respectively. In NTNU the CRLB for tNAA, tCr, tCho,and mI þ Gly in all ROIs were 3.3 6 0.8, 4.1 6 1.1,5.6 6 2.6, and 6.0 6 1.5, respectively. The CRLB forGlu was 14.9 6 5.6 [%] in RUN-MC, and 14.3 6 6.3[%] in NTNU. Also, the macromolecular profile had agood fit (CRLB < 20%) in data from both institutions.The CRLB for Tau in all ROIs was much higher: 43 627 [%] in RUN-MC and 36 6 29 [%] in NTNU.
Despite the possible mixed tissue content of graymatter, white matter, and CSF in individual voxels,
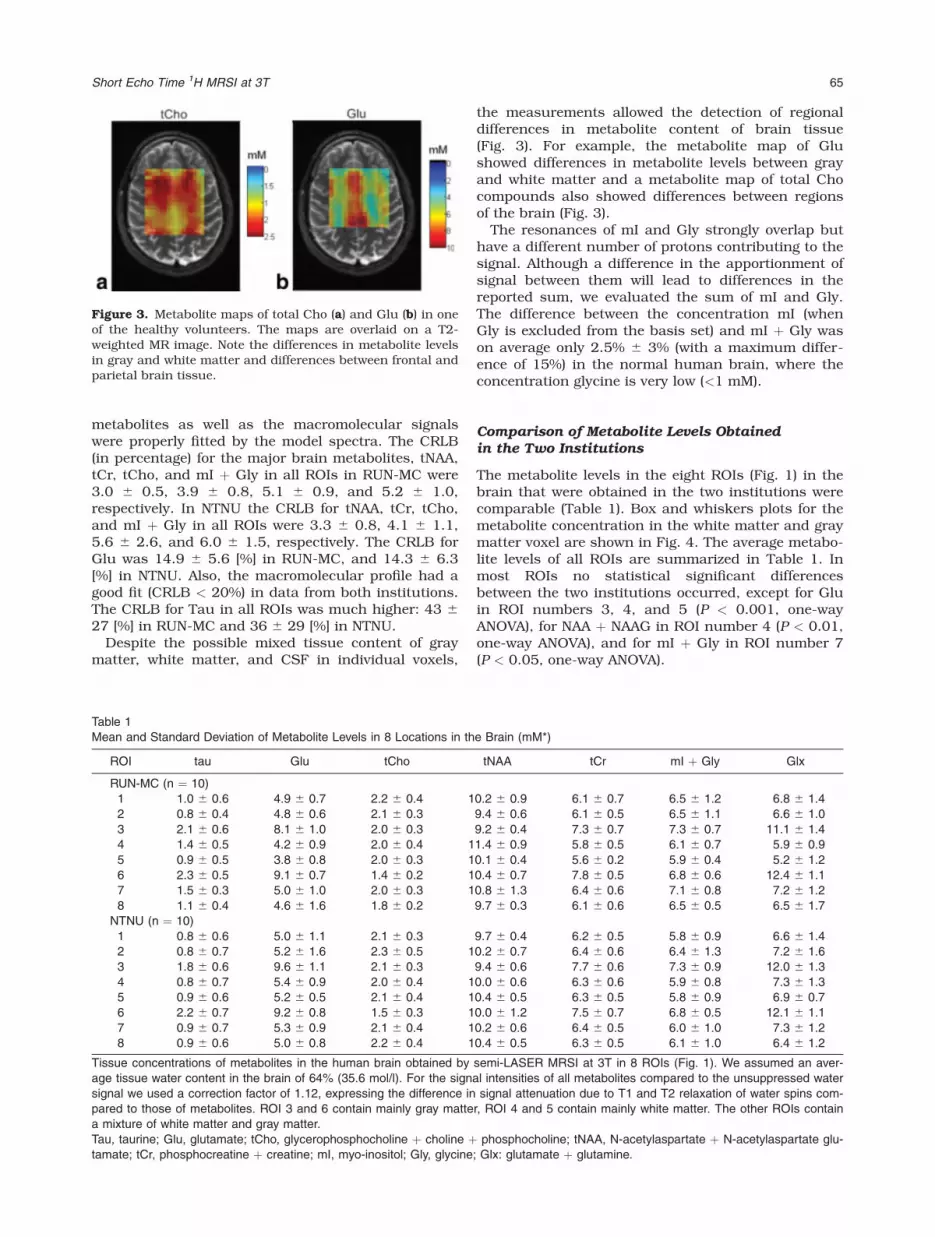
the measurements allowed the detection of regionaldifferences in metabolite content of brain tissue(Fig. 3). For example, the metabolite map of Glushowed differences in metabolite levels between grayand white matter and a metabolite map of total Chocompounds also showed differences between regionsof the brain (Fig. 3).
The resonances of mI and Gly strongly overlap buthave a different number of protons contributing to thesignal. Although a difference in the apportionment ofsignal between them will lead to differences in thereported sum, we evaluated the sum of mI and Gly.The difference between the concentration mI (whenGly is excluded from the basis set) and mI þ Gly wason average only 2.5% 6 3% (with a maximum differ-ence of 15%) in the normal human brain, where theconcentration glycine is very low (<1 mM).
Comparison of Metabolite Levels Obtainedin the Two Institutions
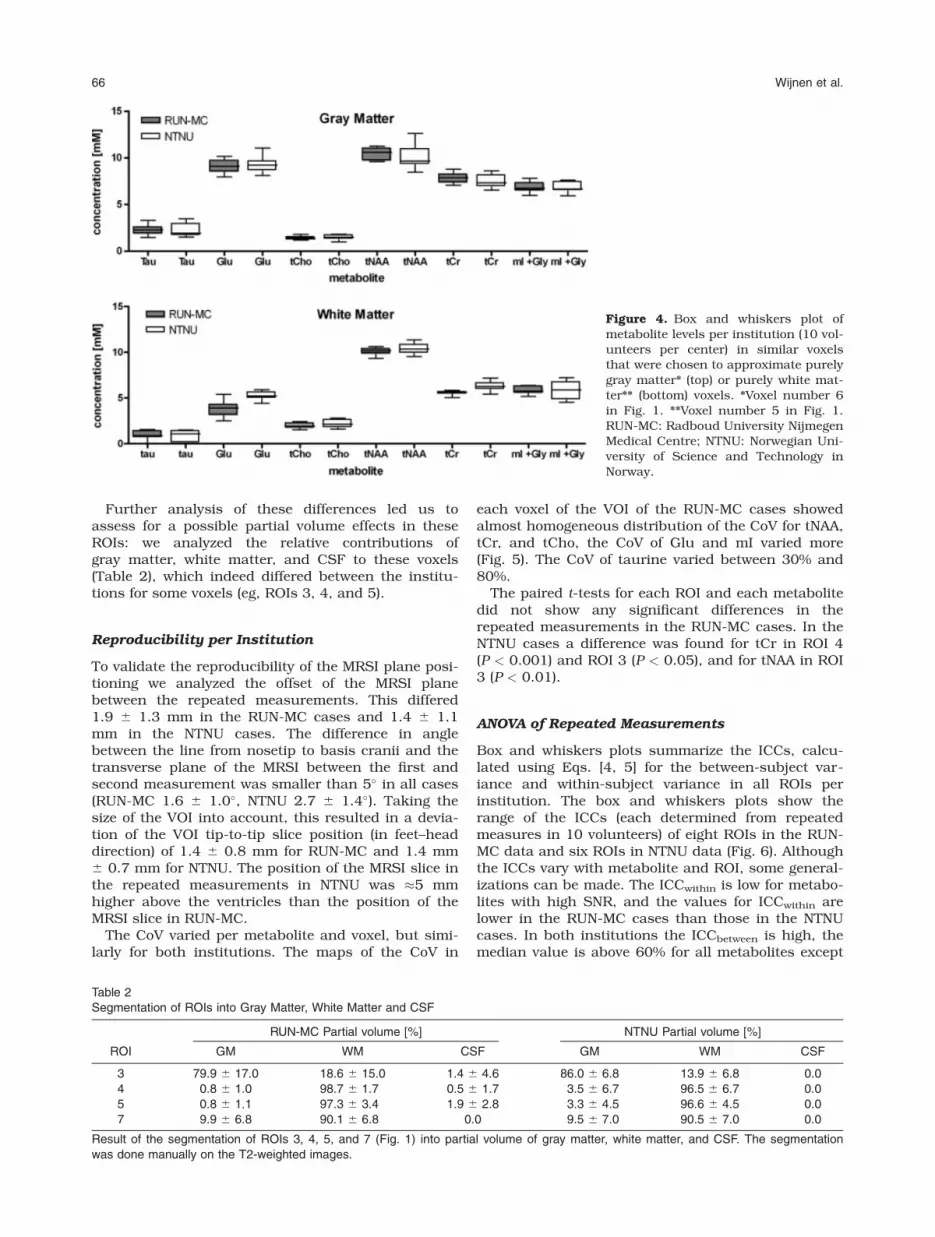
The metabolite levels in the eight ROIs (Fig. 1) in thebrain that were obtained in the two institutions werecomparable (Table 1). Box and whiskers plots for themetabolite concentration in the white matter and graymatter voxel are shown in Fig. 4. The average metabo-lite levels of all ROIs are summarized in Table 1. Inmost ROIs no statistical significant differencesbetween the two institutions occurred, except for Gluin ROI numbers 3, 4, and 5 (P < 0.001, one-wayANOVA), for NAA þ NAAG in ROI number 4 (P < 0.01,one-way ANOVA), and for mI þ Gly in ROI number 7(P < 0.05, one-way ANOVA).
Figure 3. Metabolite maps of total Cho (a) and Glu (b) in oneof the healthy volunteers. The maps are overlaid on a T2-weighted MR image. Note the differences in metabolite levelsin gray and white matter and differences between frontal andparietal brain tissue.
Table 1
Mean and Standard Deviation of Metabolite Levels in 8 Locations in the Brain (mM*)
ROI tau Glu tCho tNAA tCr mI þ Gly Glx
RUN-MC (n ¼ 10)
1 1.0 6 0.6 4.9 6 0.7 2.2 6 0.4 10.2 6 0.9 6.1 6 0.7 6.5 6 1.2 6.8 6 1.4
2 0.8 6 0.4 4.8 6 0.6 2.1 6 0.3 9.4 6 0.6 6.1 6 0.5 6.5 6 1.1 6.6 6 1.0
3 2.1 6 0.6 8.1 6 1.0 2.0 6 0.3 9.2 6 0.4 7.3 6 0.7 7.3 6 0.7 11.1 6 1.4
4 1.4 6 0.5 4.2 6 0.9 2.0 6 0.4 11.4 6 0.9 5.8 6 0.5 6.1 6 0.7 5.9 6 0.9
5 0.9 6 0.5 3.8 6 0.8 2.0 6 0.3 10.1 6 0.4 5.6 6 0.2 5.9 6 0.4 5.2 6 1.2
6 2.3 6 0.5 9.1 6 0.7 1.4 6 0.2 10.4 6 0.7 7.8 6 0.5 6.8 6 0.6 12.4 6 1.1
7 1.5 6 0.3 5.0 6 1.0 2.0 6 0.3 10.8 6 1.3 6.4 6 0.6 7.1 6 0.8 7.2 6 1.2
8 1.1 6 0.4 4.6 6 1.6 1.8 6 0.2 9.7 6 0.3 6.1 6 0.6 6.5 6 0.5 6.5 6 1.7
NTNU (n ¼ 10)
1 0.8 6 0.6 5.0 6 1.1 2.1 6 0.3 9.7 6 0.4 6.2 6 0.5 5.8 6 0.9 6.6 6 1.4
2 0.8 6 0.7 5.2 6 1.6 2.3 6 0.5 10.2 6 0.7 6.4 6 0.6 6.4 6 1.3 7.2 6 1.6
3 1.8 6 0.6 9.6 6 1.1 2.1 6 0.3 9.4 6 0.6 7.7 6 0.6 7.3 6 0.9 12.0 6 1.3
4 0.8 6 0.7 5.4 6 0.9 2.0 6 0.4 10.0 6 0.6 6.3 6 0.6 5.9 6 0.8 7.3 6 1.3
5 0.9 6 0.6 5.2 6 0.5 2.1 6 0.4 10.4 6 0.5 6.3 6 0.5 5.8 6 0.9 6.9 6 0.7
6 2.2 6 0.7 9.2 6 0.8 1.5 6 0.3 10.0 6 1.2 7.5 6 0.7 6.8 6 0.5 12.1 6 1.1
7 0.9 6 0.7 5.3 6 0.9 2.1 6 0.4 10.2 6 0.6 6.4 6 0.5 6.0 6 1.0 7.3 6 1.2
8 0.9 6 0.6 5.0 6 0.8 2.2 6 0.4 10.4 6 0.5 6.3 6 0.5 6.1 6 1.0 6.4 6 1.2
Tissue concentrations of metabolites in the human brain obtained by semi-LASER MRSI at 3T in 8 ROIs (Fig. 1). We assumed an aver-
age tissue water content in the brain of 64% (35.6 mol/l). For the signal intensities of all metabolites compared to the unsuppressed water
signal we used a correction factor of 1.12, expressing the difference in signal attenuation due to T1 and T2 relaxation of water spins com-
pared to those of metabolites. ROI 3 and 6 contain mainly gray matter, ROI 4 and 5 contain mainly white matter. The other ROIs contain
a mixture of white matter and gray matter.
Tau, taurine; Glu, glutamate; tCho, glycerophosphocholine þ choline þ phosphocholine; tNAA, N-acetylaspartate þ N-acetylaspartate glu-
tamate; tCr, phosphocreatine þ creatine; mI, myo-inositol; Gly, glycine; Glx: glutamate þ glutamine.
Short Echo Time 1H MRSI at 3T 65
Further analysis of these differences led us toassess for a possible partial volume effects in theseROIs: we analyzed the relative contributions ofgray matter, white matter, and CSF to these voxels(Table 2), which indeed differed between the institu-tions for some voxels (eg, ROIs 3, 4, and 5).
Reproducibility per Institution
To validate the reproducibility of the MRSI plane posi-tioning we analyzed the offset of the MRSI planebetween the repeated measurements. This differed1.9 6 1.3 mm in the RUN-MC cases and 1.4 6 1.1mm in the NTNU cases. The difference in anglebetween the line from nosetip to basis cranii and thetransverse plane of the MRSI between the first andsecond measurement was smaller than 5� in all cases(RUN-MC 1.6 6 1.0�, NTNU 2.7 6 1.4�). Taking thesize of the VOI into account, this resulted in a devia-tion of the VOI tip-to-tip slice position (in feet–headdirection) of 1.4 6 0.8 mm for RUN-MC and 1.4 mm6 0.7 mm for NTNU. The position of the MRSI slice inthe repeated measurements in NTNU was �5 mmhigher above the ventricles than the position of theMRSI slice in RUN-MC.
The CoV varied per metabolite and voxel, but simi-larly for both institutions. The maps of the CoV in
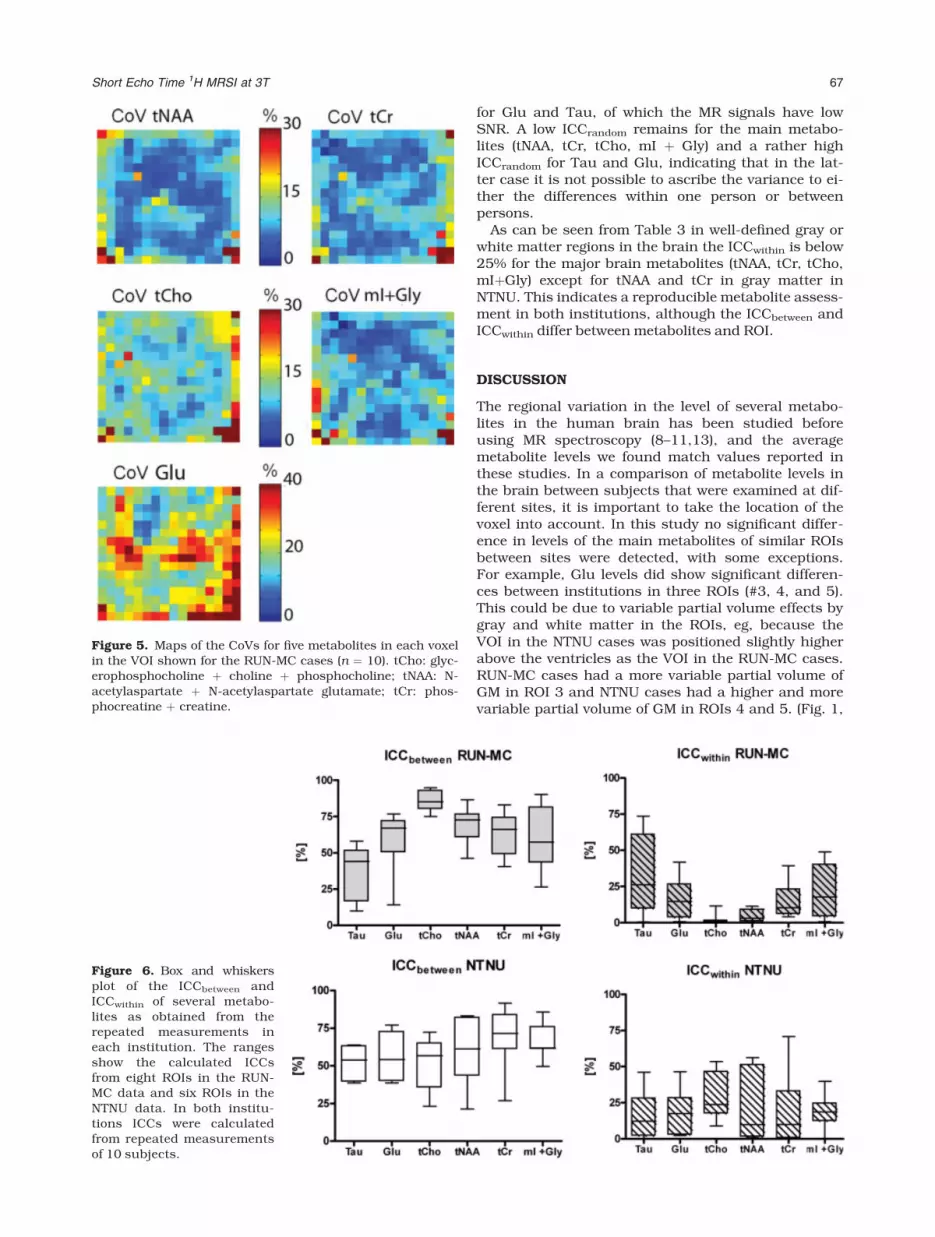
each voxel of the VOI of the RUN-MC cases showedalmost homogeneous distribution of the CoV for tNAA,tCr, and tCho, the CoV of Glu and mI varied more(Fig. 5). The CoV of taurine varied between 30% and80%.
The paired t-tests for each ROI and each metabolitedid not show any significant differences in therepeated measurements in the RUN-MC cases. In theNTNU cases a difference was found for tCr in ROI 4(P < 0.001) and ROI 3 (P < 0.05), and for tNAA in ROI3 (P < 0.01).
ANOVA of Repeated Measurements
Box and whiskers plots summarize the ICCs, calcu-lated using Eqs. [4, 5] for the between-subject var-iance and within-subject variance in all ROIs perinstitution. The box and whiskers plots show therange of the ICCs (each determined from repeatedmeasures in 10 volunteers) of eight ROIs in the RUN-MC data and six ROIs in NTNU data (Fig. 6). Althoughthe ICCs vary with metabolite and ROI, some general-izations can be made. The ICCwithin is low for metabo-lites with high SNR, and the values for ICCwithin arelower in the RUN-MC cases than those in the NTNUcases. In both institutions the ICCbetween is high, themedian value is above 60% for all metabolites except
Figure 4. Box and whiskers plot ofmetabolite levels per institution (10 vol-unteers per center) in similar voxelsthat were chosen to approximate purelygray matter* (top) or purely white mat-ter** (bottom) voxels. *Voxel number 6in Fig. 1. **Voxel number 5 in Fig. 1.RUN-MC: Radboud University NijmegenMedical Centre; NTNU: Norwegian Uni-versity of Science and Technology inNorway.
Table 2
Segmentation of ROIs into Gray Matter, White Matter and CSF
ROI
RUN-MC Partial volume [%] NTNU Partial volume [%]
GM WM CSF GM WM CSF
3 79.9 6 17.0 18.6 6 15.0 1.4 6 4.6 86.0 6 6.8 13.9 6 6.8 0.0
4 0.8 6 1.0 98.7 6 1.7 0.5 6 1.7 3.5 6 6.7 96.5 6 6.7 0.0
5 0.8 6 1.1 97.3 6 3.4 1.9 6 2.8 3.3 6 4.5 96.6 6 4.5 0.0
7 9.9 6 6.8 90.1 6 6.8 0.0 9.5 6 7.0 90.5 6 7.0 0.0
Result of the segmentation of ROIs 3, 4, 5, and 7 (Fig. 1) into partial volume of gray matter, white matter, and CSF. The segmentation
was done manually on the T2-weighted images.
66 Wijnen et al.
for Glu and Tau, of which the MR signals have lowSNR. A low ICCrandom remains for the main metabo-lites (tNAA, tCr, tCho, mI þ Gly) and a rather highICCrandom for Tau and Glu, indicating that in the lat-ter case it is not possible to ascribe the variance to ei-ther the differences within one person or betweenpersons.
As can be seen from Table 3 in well-defined gray orwhite matter regions in the brain the ICCwithin is below25% for the major brain metabolites (tNAA, tCr, tCho,mIþGly) except for tNAA and tCr in gray matter inNTNU. This indicates a reproducible metabolite assess-ment in both institutions, although the ICCbetween andICCwithin differ between metabolites and ROI.
DISCUSSION
The regional variation in the level of several metabo-lites in the human brain has been studied beforeusing MR spectroscopy (8–11,13), and the averagemetabolite levels we found match values reported inthese studies. In a comparison of metabolite levels inthe brain between subjects that were examined at dif-ferent sites, it is important to take the location of thevoxel into account. In this study no significant differ-ence in levels of the main metabolites of similar ROIsbetween sites were detected, with some exceptions.For example, Glu levels did show significant differen-ces between institutions in three ROIs (#3, 4, and 5).This could be due to variable partial volume effects bygray and white matter in the ROIs, eg, because theVOI in the NTNU cases was positioned slightly higherabove the ventricles as the VOI in the RUN-MC cases.RUN-MC cases had a more variable partial volume ofGM in ROI 3 and NTNU cases had a higher and morevariable partial volume of GM in ROIs 4 and 5. (Fig. 1,
Figure 5. Maps of the CoVs for five metabolites in each voxelin the VOI shown for the RUN-MC cases (n ¼ 10). tCho: glyc-erophosphocholine þ choline þ phosphocholine; tNAA: N-acetylaspartate þ N-acetylaspartate glutamate; tCr: phos-phocreatine þ creatine.
Figure 6. Box and whiskersplot of the ICCbetween andICCwithin of several metabo-lites as obtained from therepeated measurements ineach institution. The rangesshow the calculated ICCsfrom eight ROIs in the RUN-MC data and six ROIs in theNTNU data. In both institu-tions ICCs were calculatedfrom repeated measurementsof 10 subjects.
Short Echo Time 1H MRSI at 3T 67
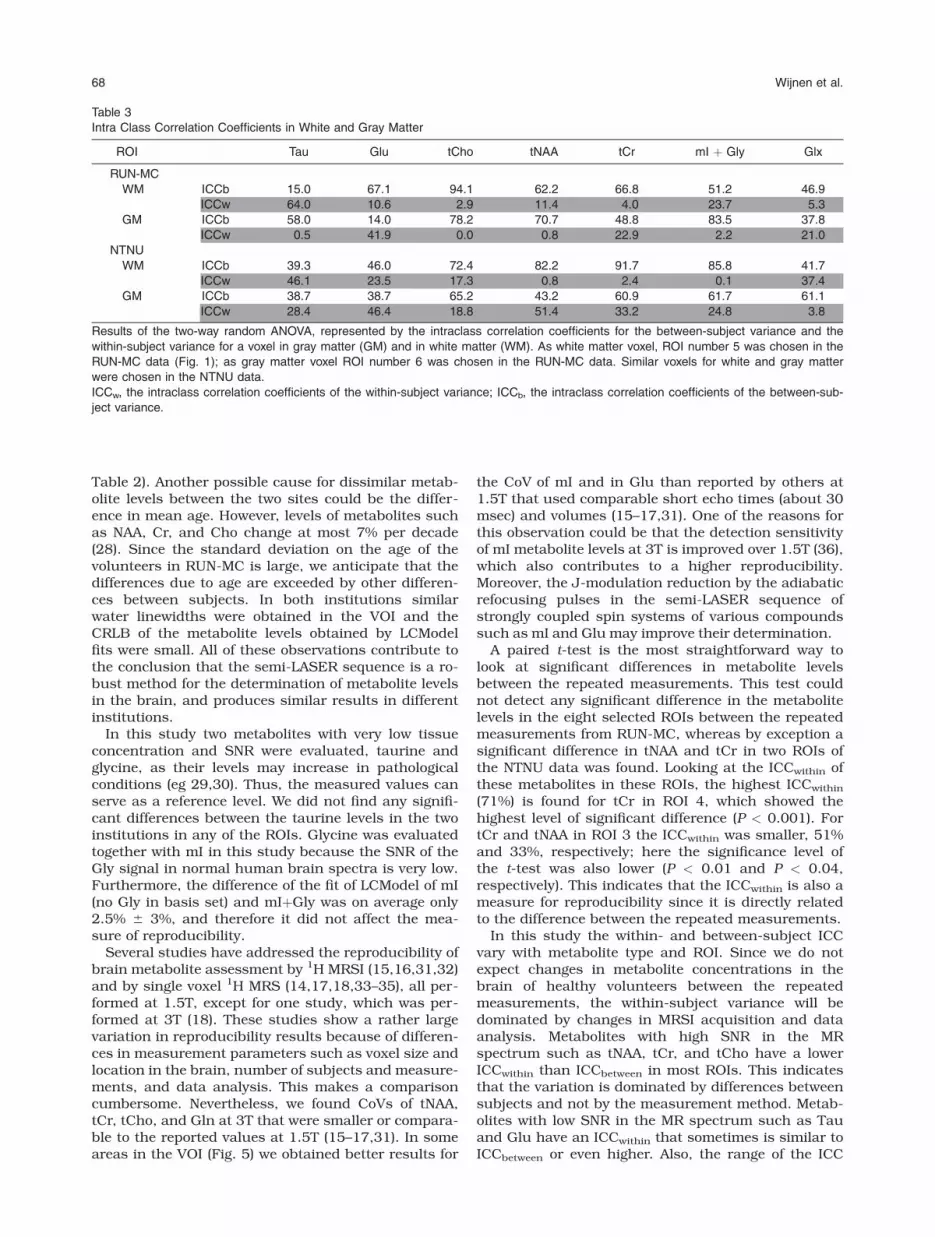
Table 2). Another possible cause for dissimilar metab-olite levels between the two sites could be the differ-ence in mean age. However, levels of metabolites suchas NAA, Cr, and Cho change at most 7% per decade(28). Since the standard deviation on the age of thevolunteers in RUN-MC is large, we anticipate that thedifferences due to age are exceeded by other differen-ces between subjects. In both institutions similarwater linewidths were obtained in the VOI and theCRLB of the metabolite levels obtained by LCModelfits were small. All of these observations contribute tothe conclusion that the semi-LASER sequence is a ro-bust method for the determination of metabolite levelsin the brain, and produces similar results in differentinstitutions.
In this study two metabolites with very low tissueconcentration and SNR were evaluated, taurine andglycine, as their levels may increase in pathologicalconditions (eg 29,30). Thus, the measured values canserve as a reference level. We did not find any signifi-cant differences between the taurine levels in the twoinstitutions in any of the ROIs. Glycine was evaluatedtogether with mI in this study because the SNR of theGly signal in normal human brain spectra is very low.Furthermore, the difference of the fit of LCModel of mI(no Gly in basis set) and mIþGly was on average only2.5% 6 3%, and therefore it did not affect the mea-sure of reproducibility.
Several studies have addressed the reproducibility ofbrain metabolite assessment by 1H MRSI (15,16,31,32)and by single voxel 1H MRS (14,17,18,33–35), all per-formed at 1.5T, except for one study, which was per-formed at 3T (18). These studies show a rather largevariation in reproducibility results because of differen-ces in measurement parameters such as voxel size andlocation in the brain, number of subjects and measure-ments, and data analysis. This makes a comparisoncumbersome. Nevertheless, we found CoVs of tNAA,tCr, tCho, and Gln at 3T that were smaller or compara-ble to the reported values at 1.5T (15–17,31). In someareas in the VOI (Fig. 5) we obtained better results for
the CoV of mI and in Glu than reported by others at1.5T that used comparable short echo times (about 30msec) and volumes (15–17,31). One of the reasons forthis observation could be that the detection sensitivityof mI metabolite levels at 3T is improved over 1.5T (36),which also contributes to a higher reproducibility.Moreover, the J-modulation reduction by the adiabaticrefocusing pulses in the semi-LASER sequence ofstrongly coupled spin systems of various compoundssuch as mI and Glu may improve their determination.
A paired t-test is the most straightforward way tolook at significant differences in metabolite levelsbetween the repeated measurements. This test couldnot detect any significant difference in the metabolitelevels in the eight selected ROIs between the repeatedmeasurements from RUN-MC, whereas by exception asignificant difference in tNAA and tCr in two ROIs ofthe NTNU data was found. Looking at the ICCwithin ofthese metabolites in these ROIs, the highest ICCwithin
(71%) is found for tCr in ROI 4, which showed thehighest level of significant difference (P < 0.001). FortCr and tNAA in ROI 3 the ICCwithin was smaller, 51%and 33%, respectively; here the significance level ofthe t-test was also lower (P < 0.01 and P < 0.04,respectively). This indicates that the ICCwithin is also ameasure for reproducibility since it is directly relatedto the difference between the repeated measurements.
In this study the within- and between-subject ICCvary with metabolite type and ROI. Since we do notexpect changes in metabolite concentrations in thebrain of healthy volunteers between the repeatedmeasurements, the within-subject variance will bedominated by changes in MRSI acquisition and dataanalysis. Metabolites with high SNR in the MRspectrum such as tNAA, tCr, and tCho have a lowerICCwithin than ICCbetween in most ROIs. This indicatesthat the variation is dominated by differences betweensubjects and not by the measurement method. Metab-olites with low SNR in the MR spectrum such as Tauand Glu have an ICCwithin that sometimes is similar toICCbetween or even higher. Also, the range of the ICC
Table 3
Intra Class Correlation Coefficients in White and Gray Matter
ROI Tau Glu tCho tNAA tCr mI þ Gly Glx
RUN-MC
WM ICCb 15.0 67.1 94.1 62.2 66.8 51.2 46.9
ICCw 64.0 10.6 2.9 11.4 4.0 23.7 5.3
GM ICCb 58.0 14.0 78.2 70.7 48.8 83.5 37.8
ICCw 0.5 41.9 0.0 0.8 22.9 2.2 21.0
NTNU
WM ICCb 39.3 46.0 72.4 82.2 91.7 85.8 41.7
ICCw 46.1 23.5 17.3 0.8 2.4 0.1 37.4
GM ICCb 38.7 38.7 65.2 43.2 60.9 61.7 61.1
ICCw 28.4 46.4 18.8 51.4 33.2 24.8 3.8
Results of the two-way random ANOVA, represented by the intraclass correlation coefficients for the between-subject variance and the
within-subject variance for a voxel in gray matter (GM) and in white matter (WM). As white matter voxel, ROI number 5 was chosen in the
RUN-MC data (Fig. 1); as gray matter voxel ROI number 6 was chosen in the RUN-MC data. Similar voxels for white and gray matter
were chosen in the NTNU data.
ICCw, the intraclass correlation coefficients of the within-subject variance; ICCb, the intraclass correlation coefficients of the between-sub-
ject variance.
68 Wijnen et al.
values is larger for these metabolites. Apparently, it isdifficult to estimate the metabolite levels from signalswith low SNR: either the error is appointed to differen-ces within the subject or the random error is dominat-ing the variance. The latter is the case when both theICCbetween and the ICCwithin are low.
A major potential cause of variation (within-subjectvariance) between repeated measurements in thisstudy is the manual positioning of ROIs. Slight differ-ences in location may result in different contributionsof CSF, white matter, and gray matter to the selectedvoxels, which in turn may affect the measured metab-olite levels. To tackle this problem one can applyautomated tissue segmentation based on MR imagesto determine the amount of gray and white matter inthe voxels and use this for a correction of metabolitelevels. However, in clinical practice voxels will alwayscontain a mixture of tissue types. For longitudinalstudies the error introduced by the repositioning ofthe MRSI grid is of more importance; in those casesan automated repositioning algorithm (37) or a stereo-tactic repositioning method (38) may avoid differencesin position of the voxels and improve the reproducibil-ity of the measurements.
In conclusion, the semi-LASER sequence can beused successfully for MRSI of the human brain at 3T.MR spectra acquired in different institutions are com-parable and the metabolite levels we observed fit wellin the range of previously reported metabolite valuesof the human brain. Furthermore, the repeated meas-urements showed that the method is robust and reli-able since the variance is mainly introduced by differ-ences between subjects.
ACKNOWLEDGMENTS
We thank Lutgarde Buydens for useful discussionabout the statistical analysis, and Dr. S. Roll (Sie-mens Medical Solutions, Erlangen, Germany) foraccess to pulse sequence source codes.
REFERENCES
1. Bottomley PA. Spatial localization in NMR spectroscopy in vivo.Ann N Y Acad Sc 1987;508:333–348.
2. Slotboom J, Mehlkopf AF, Bovee WM. A single-shot localizationpulse sequence suited for coils with inhomogeneous RF fieldsusing adiabatic slice-selective RF pulses. J Magn Reson 1991;95:396–404.
3. Garwood M, DelaBarre L. The return of the frequency sweep:designing adiabatic pulses for contemporary NMR. J Magn Reson2001;153:155–177.
4. Scheenen TW, Klomp DW, Wijnen JP, Heerschap A. Short echotime 1H-MRSI of the human brain at 3T with minimal chemicalshift displacement errors using adiabatic refocusing pulses.Magn Reson Med 2008;59:1–6.
5. Provencher SW. Estimation of metabolite concentrations fromlocalized in vivo proton NMR spectra. Magn Reson Med 1993;30:672–679.
6. Geurts JJ, Reuling IE, Vrenken H, et al. MR spectroscopic evi-dence for thalamic and hippocampal, but not cortical, damage inmultiple sclerosis. Magn Reson Med 2006;55:478–483.
7. Godbolt AK, Waldman AD, MacManus DG, et al. MRS showsabnormalities before symptoms in familial Alzheimer disease.Neurology 2006;66:718–722.
8. Kreis R, Ernst T, Ross BD. Development of the human brain: invivo quantification of metabolite and water content with proton
magnetic resonance spectroscopy. Magn Reson Med 1993;30:424–437.
9. Michaelis T, Merboldt KD, Bruhn H, Hanicke W, Frahm J. Abso-lute concentrations of metabolites in the adult human brain invivo: quantification of localized proton MR spectra. Radiology1993;187:219–227.
10. Pouwels PJ, Brockmann K, Kruse B, et al. Regional age depend-ence of human brain metabolites from infancy to adulthood asdetected by quantitative localized proton MRS. Pediatr Res 1999;46:474–485.
11. Degaonkar MN, Pomper MG, Barker PB. Quantitative protonmagnetic resonance spectroscopic imaging: regional variations inthe corpus callosum and cortical gray matter. J Magn ResonImaging 2005;22:175–179.
12. Schuff N, Ezekiel F, Gamst AC, et al. Region and tissue differen-ces of metabolites in normally aged brain using multislice 1Hmagnetic resonance spectroscopic imaging. Magn Reson Med2001;45:899–907.
13. Soher BJ, van Zijl PC, Duyn JH, Barker PB. Quantitative protonMR spectroscopic imaging of the human brain. Magn Reson Med1996;35:356–363.
14. Gu M, Kim DH, Mayer D, Sullivan EV, Pfefferbaum A, Spielman DM.Reproducibility study of whole-brain 1H spectroscopic imaging withautomated quantification. Magn Reson Med 2008;60:542–547.
15. Li BS, Babb JS, Soher BJ, Maudsley AA, Gonen O. Reproducibil-ity of 3D proton spectroscopy in the human brain. Magn ResonMed 2002;47:439–446.
16. Wiedermann D, Schuff N, Matson GB, et al. Short echo time mul-tislice proton magnetic resonance spectroscopic imaging inhuman brain: metabolite distributions and reliability. Magneticresonance imaging 2001;19:1073–1080.
17. Hammen T, Stadlbauer A, Tomandl B, et al. Short TE single-voxel1H-MR spectroscopy of hippocampal structures in healthy adultsat 1.5 Tesla—how reproducible are the results? NMR Biomed2005;18:195–201.
18. Wellard RM, Briellmann RS, Jennings C, Jackson GD. Physio-logic variability of single-voxel proton MR spectroscopic measure-ments at 3T. AJNR Am J Neuroradiol 2005;26:585–590.
19. Ogg RJ, Kingsley PB, Taylor JS. WET, a T1- and B1-insensitivewater-suppression method for in vivo localized 1H NMR spectros-copy. J Magn Reson B 1994;104:1–10.
20. Scheenen TW, Klomp DW, Roll SA, Futterer JJ, Barentsz JO,Heerschap A. Fast acquisition-weighted three-dimensional protonMR spectroscopic imaging of the human prostate. Magn ResonMed 2004;52:80–88.
21. Behar KL, Rothman DL, Spencer DD, Petroff OA. Analysis ofmacromolecule resonances in 1H NMR spectra of human brain.Magn Reson Med 1994;32:294–302.
22. Pfeuffer J, Tkac I, Provencher SW, Gruetter R. Toward an in vivoneurochemical profile: quantification of 18 metabolites in short-echo-time (1)H NMR spectra of the rat brain. J Magn Reson1999;141:104–120.
23. Govindaraju V, Young K, Maudsley AA. Proton NMR chemicalshifts and coupling constants for brain metabolites. NMR Biomed2000;13:129–153.
24. Choi C, Coupland NJ, Bhardwaj PP, et al. T2 measurement andquantification of glutamate in human brain in vivo. Magn ResonMed 2006;56:971–977.
25. Mlynarik V, Gruber S, Moser E. Proton T (1) and T (2) relaxationtimes of human brain metabolites at 3 Tesla. NMR Biomed 2001;14:325–331.
26. Wansapura JP, Holland SK, Dunn RS, Ball WS Jr. NMR relaxa-tion times in the human brain at 3.0 Tesla. J Magn Reson Imag-ing 1999;9:531–538.
27. Bland JM, Altman DG. Statistical methods for assessing agree-ment between two methods of clinical measurement. Lancet1986;327:307–310.
28. Maudsley AA, Domenig C, Govind V, et al. Mapping of brainmetabolite distributions by volumetric proton MR spectroscopicimaging (MRSI). Magn Reson Med 2008;61:548–559.
29. Opstad KS, Bell BA, Griffiths JR, Howe FA. Taurine: a potentialmarker of apoptosis in gliomas. Br J Cancer 2009;100:789–794.
30. Lehnhardt FG, Bock C, Rohn G, Ernestus RI, Hoehn M. Meta-bolic differences between primary and recurrent human braintumors: a 1H NMR spectroscopic investigation. NMR Biomed2005;18:371–382.
Short Echo Time 1H MRSI at 3T 69
31. Chard DT, McLean MA, Parker GJ, MacManus DG, Miller DH.Reproducibility of in vivo metabolite quantification with protonmagnetic resonance spectroscopic imaging. J Magn Reson Imag-ing 2002;15:219–225.
32. Tedeschi G, Bertolino A, Campbell G, et al. Reproducibility ofproton MR spectroscopic imaging findings. AJNR Am J Neurora-diol 1996;17:1871–1879.
33. Brooks WM, Friedman SD, Stidley CA. Reproducibility of 1H-MRSin vivo. Magn Reson Med 1999;41:193–197.
34. Marshall I, Wardlaw J, Cannon J, Slattery J, Sellar RJ. Reprodu-cibility of metabolite peak areas in 1H MRS of brain. Magn ResonImaging 1996;14:281–292.
35. Schirmer T, Auer DP. On the reliability of quantitative clinicalmagnetic resonance spectroscopy of the human brain. NMRBiomed 2000;13:28–36.
36. Srinivasan R, Vigneron D, Sailasuta N, Hurd R, Nelson S. Acomparative study of myo-inositol quantification using LC-model at 1.5 T and 3.0 T with 3 D 1H proton spectroscopicimaging of the human brain. Magn Reson Imaging 2004;22:523–528.
37. Ratai EM, Hancu I, Blezek DJ, Turk KW, Halpern E,Gonzalez RG. Automatic repositioning of MRSI voxels in lon-gitudinal studies: impact on reproducibility of metabolite con-centration measurements. J Magn Reson Imaging 2008;27:1188–1193.
38. Langer DL, Rakaric P, Kirilova A, Jaffray DA, DamyanovichAZ. Assessment of metabolite quantitation reproducibility inserial 3D-(1)H-MR spectroscopic imaging of human brainusing stereotactic repositioning. Magn Reson Med 2007;58:666–673.
70 Wijnen et al.