Spatio-spectral encoding of fringes in optical long-baseline interferometry. Example of the 3T and...
9
A&A 531, A110 (2011) DOI: 10.1051/0004-6361/201116976 c ESO 2011 Astronomy & Astrophysics Spatio-spectral encoding of fringes in optical long-baseline interferometry Example of the 3T and 4T recombining mode of VEGA/CHARA D. Mourard 1 , Ph. Bério 1 , K. Perraut 2 , R. Ligi 1 , A. Blazit 1 , J. M. Clausse 1 , N. Nardetto 1 , A. Spang 1 , I. Tallon-Bosc 3 , D. Bonneau 1 , O. Chesneau 1 , O. Delaa 1 , F. Millour 1 , P. Stee 1 , J. B. Le Bouquin 2 , T. ten Brummelaar 4 , C. Farrington 4 , P. J. Goldfinger 4 , and J. D. Monnier 5 1 Laboratoire Fizeau, OCA/UNS/CNRS UMR6525, Parc Valrose, 06108 Nice Cedex 2, France e-mail: [email protected] 2 UJF-Grenoble 1/CNRS-INSU, Institut de Planétologie et d’Astrophysique de Grenoble (IPAG) UMR 5274, 38041 Grenoble, France 3 UCBL/CNRS CRAL, 9 avenue Charles André, 69561 Saint Genis Laval Cedex, France 4 CHARA Array, Mount Wilson Observatory, 91023 Mt Wilson CA, USA 5 University of Michigan, Ann Arbor, Michigan 48109-1090 MI, USA Received 29 March 2011 / Accepted 9 May 2011 ABSTRACT Context. One of the main challenges of optical stellar interferometers is to increase the number of telescopes in the recombining unit to provide a larger number of measurements and an improved imaging capability. At the same time there is a need to preserve the spectroscopic capabilities, which leads to complex recombining schemes that may inhibit development. Aims. We describe the possibilities of combining the spatial and spectral encoding of fringes for the design of more compact beam combiners and for minimizing the number of pixels that must be read. Methods. We establish the formalism of the spatio-spectral fringe encoding, discuss general applications, and describe an implemen- tation in the 3T/4T observing mode of the VEGA (Visible spEctroGraph and polArimeter) instrument installed at the coherent focus of the CHARA Array located on Mt Wilson in California. We finally present the science cases made possible by this instrumental implementation in the case of VEGA/CHARA. Results. We demonstrate the interest in implementing an optimized spatio-spectral encoding of fringes in a multi-telescope beam combiner. On-sky results, obtained with the 3T mode of the VEGA combiner are presented. At visible wavelengths and with the hectometric baselines of CHARA, sub-mas stellar diameters could be determined with a precision of a few percent with a spectral resolution of 5000. Our first estimates of closure phase show that accuracies better than 1 degree can be achieved. Conclusions. The first on-sky results obtained with the 3T-4T VEGA instrument using spatio-spectral fringe encoding show the validity of using this principle in the design of future complex beam combiners. Key words. instrumentation: interferometers – instrumentation: spectrographs – methods: data analysis – stars: fundamental parameters 1. Introduction Since the study of Labeyrie (1975), optical interferometry has been developed with spectroscopic capabilities to both relax the coherencing limits of white-light observations and increase the accessible scientific information. Combining spectral capabili- ties with interferometric measurements has led to important ap- plications in stellar physics, such as the kinematical analysis of circumstellar environments or the chromatic study of stel- lar surfaces (Chiavassa et al. 2010). The need to combine more than two telescopes is of the utmost importance to achieve a higher spatial resolution analysis and permit accurate image re- construction. A challenge is therefore to be able to combine three, four, or more telescopes and preserve the spectroscopic capacities as much as possible so as to achieve polychromatic imaging of stellar surfaces and/or environments. Interferometric beam-combination can follow co-axial or multi-axial optical ap- proaches. In the latter case and for more than two telescopes, it is mandatory to optimize the detector pixel number while respecting both spectral and spatial sampling of fringe patterns. One way of satisfying this condition is to combine spatio-OPD (optical path difference) coding of spectrally dispersed fringes as originally suggested for a space interferometer (Vakili & Koechlin 1989). These authors demonstrated by means of a nu- merical simulation the possibility of retrieving the different high frequency information even in the case of a linear redundant con- figuration. In 2006, Le Bouquin & Tatulli (2006) studied the pos- sibility and efficiency of reducing the number of pixels in the case of multi-axial single mode interferometry through a par- tially redundant output pupil configuration. The Center for High Angular Resolution Astronomy (CHARA) of the Georgia State University operates an optical interferometric array located at the Mount Wilson Observatory that consists of six one meter telescopes placed in pairs along the arms of a Y-shaped array. It yields 15 baselines ranging from 34 to 331 m. Operating in the near-infrared with CLASSIC (ten Brummelaar et al. 2005), CLIMB (Sturmann et al. 2010), FLUOR (Coude du Foresto et al. 2003), and MIRC (Monnier et al. 2008),and in the visible with PAVO (Ireland et al. 2008) Article published by EDP Sciences A110, page 1 of 9
-
Upload
independent -
Category
Documents
-
view
1 -
download
0
Transcript of Spatio-spectral encoding of fringes in optical long-baseline interferometry. Example of the 3T and...
A&A 531, A110 (2011)DOI: 10.1051/0004-6361/201116976c© ESO 2011
Astronomy&
Astrophysics
Spatio-spectral encoding of fringes in optical long-baselineinterferometry
Example of the 3T and 4T recombining mode of VEGA/CHARA
D. Mourard1, Ph. Bério1, K. Perraut2, R. Ligi1, A. Blazit1, J. M. Clausse1, N. Nardetto1, A. Spang1, I. Tallon-Bosc3,D. Bonneau1, O. Chesneau1, O. Delaa1, F. Millour1, P. Stee1, J. B. Le Bouquin2, T. ten Brummelaar4, C. Farrington4,
P. J. Goldfinger4, and J. D. Monnier5
1 Laboratoire Fizeau, OCA/UNS/CNRS UMR6525, Parc Valrose, 06108 Nice Cedex 2, Francee-mail: [email protected]
2 UJF-Grenoble 1/CNRS-INSU, Institut de Planétologie et d’Astrophysique de Grenoble (IPAG) UMR 5274, 38041 Grenoble, France3 UCBL/CNRS CRAL, 9 avenue Charles André, 69561 Saint Genis Laval Cedex, France4 CHARA Array, Mount Wilson Observatory, 91023 Mt Wilson CA, USA5 University of Michigan, Ann Arbor, Michigan 48109-1090 MI, USA
Received 29 March 2011 / Accepted 9 May 2011
ABSTRACT
Context. One of the main challenges of optical stellar interferometers is to increase the number of telescopes in the recombining unitto provide a larger number of measurements and an improved imaging capability. At the same time there is a need to preserve thespectroscopic capabilities, which leads to complex recombining schemes that may inhibit development.Aims. We describe the possibilities of combining the spatial and spectral encoding of fringes for the design of more compact beamcombiners and for minimizing the number of pixels that must be read.Methods. We establish the formalism of the spatio-spectral fringe encoding, discuss general applications, and describe an implemen-tation in the 3T/4T observing mode of the VEGA (Visible spEctroGraph and polArimeter) instrument installed at the coherent focusof the CHARA Array located on Mt Wilson in California. We finally present the science cases made possible by this instrumentalimplementation in the case of VEGA/CHARA.Results. We demonstrate the interest in implementing an optimized spatio-spectral encoding of fringes in a multi-telescope beamcombiner. On-sky results, obtained with the 3T mode of the VEGA combiner are presented. At visible wavelengths and with thehectometric baselines of CHARA, sub-mas stellar diameters could be determined with a precision of a few percent with a spectralresolution of 5000. Our first estimates of closure phase show that accuracies better than 1 degree can be achieved.Conclusions. The first on-sky results obtained with the 3T-4T VEGA instrument using spatio-spectral fringe encoding show thevalidity of using this principle in the design of future complex beam combiners.
Key words. instrumentation: interferometers – instrumentation: spectrographs – methods: data analysis – stars: fundamentalparameters
1. Introduction
Since the study of Labeyrie (1975), optical interferometry hasbeen developed with spectroscopic capabilities to both relax thecoherencing limits of white-light observations and increase theaccessible scientific information. Combining spectral capabili-ties with interferometric measurements has led to important ap-plications in stellar physics, such as the kinematical analysisof circumstellar environments or the chromatic study of stel-lar surfaces (Chiavassa et al. 2010). The need to combine morethan two telescopes is of the utmost importance to achieve ahigher spatial resolution analysis and permit accurate image re-construction. A challenge is therefore to be able to combinethree, four, or more telescopes and preserve the spectroscopiccapacities as much as possible so as to achieve polychromaticimaging of stellar surfaces and/or environments. Interferometricbeam-combination can follow co-axial or multi-axial optical ap-proaches. In the latter case and for more than two telescopes,it is mandatory to optimize the detector pixel number whilerespecting both spectral and spatial sampling of fringe patterns.
One way of satisfying this condition is to combine spatio-OPD(optical path difference) coding of spectrally dispersed fringesas originally suggested for a space interferometer (Vakili &Koechlin 1989). These authors demonstrated by means of a nu-merical simulation the possibility of retrieving the different highfrequency information even in the case of a linear redundant con-figuration. In 2006, Le Bouquin & Tatulli (2006) studied the pos-sibility and efficiency of reducing the number of pixels in thecase of multi-axial single mode interferometry through a par-tially redundant output pupil configuration.
The Center for High Angular Resolution Astronomy(CHARA) of the Georgia State University operates an opticalinterferometric array located at the Mount Wilson Observatorythat consists of six one meter telescopes placed in pairs alongthe arms of a Y-shaped array. It yields 15 baselines rangingfrom 34 to 331 m. Operating in the near-infrared with CLASSIC(ten Brummelaar et al. 2005), CLIMB (Sturmann et al. 2010),FLUOR (Coude du Foresto et al. 2003), and MIRC (Monnieret al. 2008), and in the visible with PAVO (Ireland et al. 2008)
Article published by EDP Sciences A110, page 1 of 9

A&A 531, A110 (2011)
and VEGA (Mourard et al. 2009), the CHARA array allows amaximum angular resolution of 1.3 and 0.3 ms of arc in the Kand V band, respectively. The VEGA spectrograph is designed tosample the visible band from 0.45 to 0.85 μm with spectral res-olutions of 1700, 5000, and up to 30 000. It is equipped with twophoton counting detectors that simultaneously study two differ-ent spectral bands at high and medium spectral resolution. Theprinciple and performance of VEGA, in its two telescope mode,has been presented in Paper I (Mourard et al. 2009). Fringes withthree and four telescopes were obtained in 2010.
This paper aims to present a way of combining more thantwo telescopes in a dispersed fringe mode and discuss initialon-sky results in 3T and 4T mode of VEGA as an example.Section 2 explains the principle of the spatio-spectral encodingof fringes. Section 3 is devoted to the application of this princi-ple to VEGA 3T/4T mode and to possible future instruments. Wealso present the first measurements obtained with VEGA in 3Tmode and show the way in which we compute closure phase es-timators in this multi-mode/multi-telescope/multi-lambda beamcombiner. Finally in Sect. 4 we present some of the new sciencecases made possible by the use of this new observing mode.
2. Principle of optimized spatio-spectral encodingof fringes
In the case of interferometers based on dispersed fringe mode,the pupils are linearly recombined in a direction perpendicu-lar to the spectral dispersion. Non-redundant linear reconfigura-tions are usually chosen (AMBER, Petrov et al. 2007; or MIRCMonnier et al. 2008) to easily separate the fringes coming fromdifferent pairs of telescopes. In this section, we develop a gen-eral formalism describing dispersed fringe interferograms andwe explain how redundant pupil reconfigurations could be usedwithout losing any information.
2.1. Formalism of the spatio-spectral encoding
Assuming that the flux of each beam is identical, the intensity ofthe interferogram can be written as
I(x, y) = ni(x, y)
⎛⎜⎜⎜⎜⎜⎝1 + 2n
n∑i=1
γi cos[2πσχi + φi
]⎞⎟⎟⎟⎟⎟⎠ , (1)
where (x, y) represents the pixels in the image plane, i(x, y) rep-resents the image of an individual pupil, n is the number of base-lines, σ is the wave number, χi is the optical path difference(hereafter OPD) of baseline i and γi and φi are, respectively,the modulus and phase of the complex fringe visibility for thebaseline i, and χi is a function of x and y that will be quanti-fied in Eq. (4). Figure 1 shows a simulated interferogram in thedispersed fringe mode.
The direction of dispersion is parallel to the x axis such thatwe have
λ = ax, (2)
where a is proportional to the dispersion coefficient of the dis-persive optics.
We assume that the spectral bandwidth (total width Δλ) issmall with respect to the wavelength λ. Denoting λ0 as the cen-ter of the spectral band (corresponding to the pixel x0), one canwrite for any wavelength of the spectral band λ = λ0 + a(x− x0).Thus we could write
σ =1λ≈ 1λ0
(1 − a(x − x0)
λ0
)≈ 2σ0 − ax
λ20
, (3)
Fig. 1. Simulated interferogram in the dispersed fringe mode.Observations with four telescopes.
where λ0 is the center of the spectral band.Assuming a direction of dispersion perpendicular to the
remapped pupil separation, the optical path difference χi couldbe written as a function of y only. Therefore, we have
χi = χ0i − biy, (4)
where χ0i is the OPD at the center of the image and bi depends on
the pupil separation for baseline i and the distance to the imageplane. Substituting Eqs. (2)−(4) into Eq. (1) gives
I(x, y) ≈ ni(x, y)
×⎛⎜⎜⎜⎜⎜⎝1 +
2n
n∑i=1
γi cos
⎡⎢⎢⎢⎢⎣2π (χ0i − biy
) ⎛⎜⎜⎜⎜⎝2σ0 − ax
λ20
⎞⎟⎟⎟⎟⎠ + φi
⎤⎥⎥⎥⎥⎦⎞⎟⎟⎟⎟⎟⎠ ,(5)
which could also be written, using Eq. (3) for the term in y, as
I(x, y) ≈ ni(x, y)
×⎛⎜⎜⎜⎜⎜⎝1+
2n
n∑i=1
γi cos
⎛⎜⎜⎜⎜⎝4πχ0iσ0 + φi−2π
aχ0i
λ20
x − 2πbiσy
⎞⎟⎟⎟⎟⎠⎞⎟⎟⎟⎟⎟⎠ .
(6)
The Fourier transform FT (I)(u, v) of such a fringe pattern showspeaks at high frequencies. As shown in Mourard et al. (2009),we estimate the energy of these high frequency peaks in order toestimate the squared visibility. FT (I)(u, v) can be written as
FT (I)(u, v) = nFT (i)(u, v)⊗ P(u, v) (7)
where
P(u, v) ≈ 1 +1n
n∑i=1
γiei[φi+4πχ0i σ0]δ(u − aσ2
0χ0i )δ(v + biσ)
+1n
n∑i=1
γie−i[φi+4πχ0
i σ0]δ(u + aσ20χ
0i )δ(v − biσ). (8)
If we take into account the sampling of the image, the coordi-nates of the high frequency peaks in pixels are(Up,i,Vp,i
)≈
(aσ2
0χ0i Δx,−biσΔy
), (9)
where (Δx,Δy) represents the total field in the source image. Thefinal expression of (Upi,Vpi) is
(Upi,Vpi
)≈
⎛⎜⎜⎜⎜⎝χ0i Δλ
λ20
,−biΔy
λ
⎞⎟⎟⎟⎟⎠ · (10)
This expression is identical to the one given by Koechlin et al.(1996) for the case of two telescopes.
A110, page 2 of 9
D. Mourard et al.: Spatio-spectral encoding of fringes in optical long-baseline interferometry
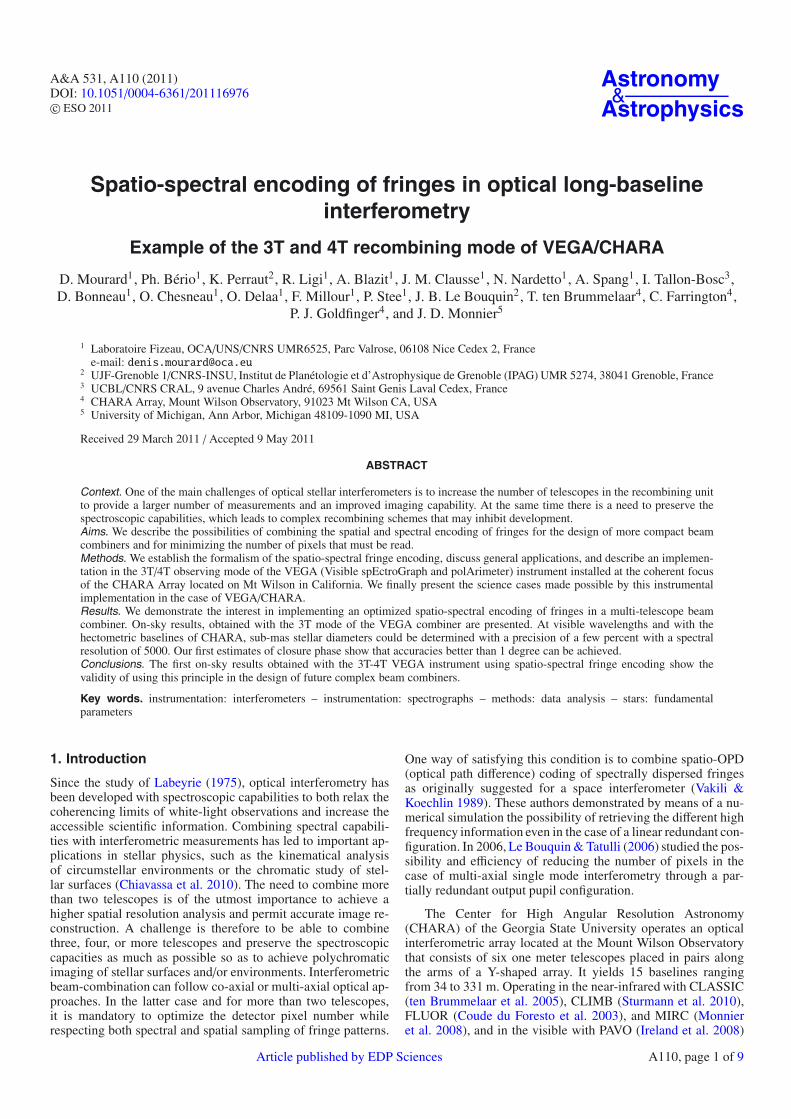
Fig. 2. Schematic representation of a simple 3T non-redundant (left) andredundant (right) linear configuration for a dispersed fringe instrument.For each case, we show the pupil plane at the entrance of the spectro-graph and the 2D Modulation Transfer Function (MTF). By adding anoptical path difference (δ) on one of the pupil in the redundant case, onecan separate the fringe signals in the MTF plane despite the redundancy.
2.2. Constraints for V 2 measurements
In the case of non-redundant reconfigurations, the separation be-tween two pupils is unique regardless of the number of tele-scopes (see Fig. 2)
bi � b j ∀i � j. (11)
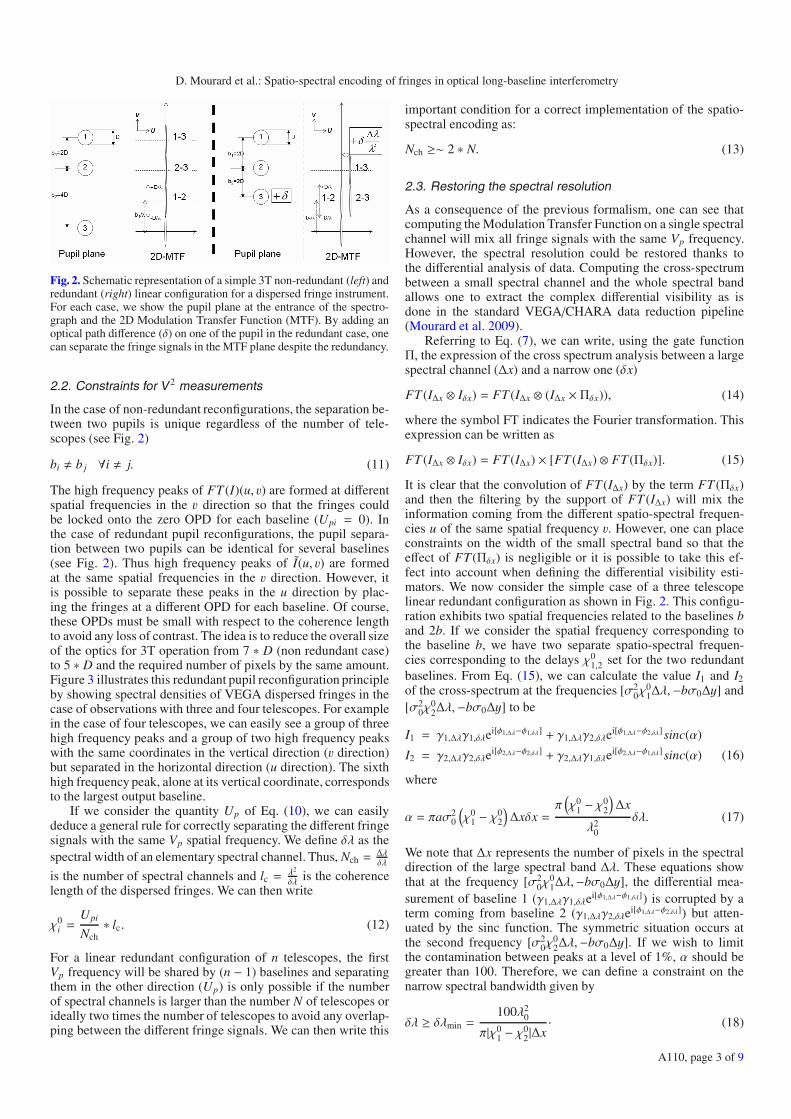
The high frequency peaks of FT (I)(u, v) are formed at differentspatial frequencies in the v direction so that the fringes couldbe locked onto the zero OPD for each baseline (Upi = 0). Inthe case of redundant pupil reconfigurations, the pupil separa-tion between two pupils can be identical for several baselines(see Fig. 2). Thus high frequency peaks of I(u, v) are formedat the same spatial frequencies in the v direction. However, itis possible to separate these peaks in the u direction by plac-ing the fringes at a different OPD for each baseline. Of course,these OPDs must be small with respect to the coherence lengthto avoid any loss of contrast. The idea is to reduce the overall sizeof the optics for 3T operation from 7 ∗ D (non redundant case)to 5 ∗ D and the required number of pixels by the same amount.Figure 3 illustrates this redundant pupil reconfiguration principleby showing spectral densities of VEGA dispersed fringes in thecase of observations with three and four telescopes. For examplein the case of four telescopes, we can easily see a group of threehigh frequency peaks and a group of two high frequency peakswith the same coordinates in the vertical direction (v direction)but separated in the horizontal direction (u direction). The sixthhigh frequency peak, alone at its vertical coordinate, correspondsto the largest output baseline.
If we consider the quantity Up of Eq. (10), we can easilydeduce a general rule for correctly separating the different fringesignals with the same Vp spatial frequency. We define δλ as thespectral width of an elementary spectral channel. Thus, Nch =
Δλδλ
is the number of spectral channels and lc = λ2
δλ is the coherencelength of the dispersed fringes. We can then write
χ0i =
Upi
Nch∗ lc. (12)
For a linear redundant configuration of n telescopes, the firstVp frequency will be shared by (n − 1) baselines and separatingthem in the other direction (Up) is only possible if the numberof spectral channels is larger than the number N of telescopes orideally two times the number of telescopes to avoid any overlap-ping between the different fringe signals. We can then write this
important condition for a correct implementation of the spatio-spectral encoding as:
Nch ≥∼ 2 ∗ N. (13)
2.3. Restoring the spectral resolution
As a consequence of the previous formalism, one can see thatcomputing the Modulation Transfer Function on a single spectralchannel will mix all fringe signals with the same Vp frequency.However, the spectral resolution could be restored thanks tothe differential analysis of data. Computing the cross-spectrumbetween a small spectral channel and the whole spectral bandallows one to extract the complex differential visibility as isdone in the standard VEGA/CHARA data reduction pipeline(Mourard et al. 2009).
Referring to Eq. (7), we can write, using the gate functionΠ, the expression of the cross spectrum analysis between a largespectral channel (Δx) and a narrow one (δx)
FT (IΔx ⊗ Iδx) = FT (IΔx ⊗ (IΔx × Πδx)), (14)
where the symbol FT indicates the Fourier transformation. Thisexpression can be written as
FT (IΔx ⊗ Iδx) = FT (IΔx) × [FT (IΔx) ⊗ FT (Πδx)]. (15)
It is clear that the convolution of FT (IΔx) by the term FT (Πδx)and then the filtering by the support of FT (IΔx) will mix theinformation coming from the different spatio-spectral frequen-cies u of the same spatial frequency v. However, one can placeconstraints on the width of the small spectral band so that theeffect of FT (Πδx) is negligible or it is possible to take this ef-fect into account when defining the differential visibility esti-mators. We now consider the simple case of a three telescopelinear redundant configuration as shown in Fig. 2. This configu-ration exhibits two spatial frequencies related to the baselines band 2b. If we consider the spatial frequency corresponding tothe baseline b, we have two separate spatio-spectral frequen-cies corresponding to the delays χ0
1,2 set for the two redundantbaselines. From Eq. (15), we can calculate the value I1 and I2of the cross-spectrum at the frequencies [σ2
0χ01Δλ,−bσ0Δy] and
[σ20χ
02Δλ,−bσ0Δy] to be
I1 = γ1,Δλγ1,δλei[φ1,Δλ−φ1,δλ] + γ1,Δλγ2,δλei[φ1,Δλ−φ2,δλ]sinc(α)
I2 = γ2,Δλγ2,δλei[φ2,Δλ−φ2,δλ] + γ2,Δλγ1,δλe
i[φ2,Δλ−φ1,δλ]sinc(α) (16)
where
α = πaσ20
(χ0
1 − χ02
)Δxδx =
π(χ0
1 − χ02
)Δx
λ20
δλ. (17)
We note that Δx represents the number of pixels in the spectraldirection of the large spectral band Δλ. These equations showthat at the frequency [σ2
0χ01Δλ,−bσ0Δy], the differential mea-
surement of baseline 1 (γ1,Δλγ1,δλei[φ1,Δλ−φ1,δλ]) is corrupted by aterm coming from baseline 2 (γ1,Δλγ2,δλei[φ1,Δλ−φ2,δλ]) but atten-uated by the sinc function. The symmetric situation occurs atthe second frequency [σ2
0χ02Δλ,−bσ0Δy]. If we wish to limit
the contamination between peaks at a level of 1%, α should begreater than 100. Therefore, we can define a constraint on thenarrow spectral bandwidth given by
δλ ≥ δλmin =100λ2
0
π|χ01 − χ0
2|Δx· (18)
A110, page 3 of 9

A&A 531, A110 (2011)
Fig. 3. Spatio-spectral densities of VEGA dispersed fringes in 3T mode (left) with CLIMB used as IR group delay tracking and in 4T mode (right)with MIRC used as IR group delay tracking. Axes correspond to the (u, v) coordinates defined in Eq. (6): u is the horizontal direction, v the verticalone. The three (respectively sic) high-frequency fringe signals are clearly separated in this 2D spectral density for the 3T (respectively 4T) mode.
This constraint can induce a degradation of the actual spectralresolution during the data processing but this disadvantage canalso be removed by the complete solution of the system of equa-tions described in Eq. (16). For example, if we compute δλminin the case of the differential processing presented in Sect. 3.5(where λ0 = 735 nm, |χ0
1 −χ02| = 450 μm and Δx = 1816 px), we
obtain δλmin = 0.02 nm. This value is well below the mediumspectral resolution of VEGA.
2.4. Interest for future spectro-interferometric instruments
We now consider the case for a possible future dispersed fringenear-infrared instrument recombining Nt = 6 or 8 telescopesand we compare its performance with or without the use of thespatio-spectral encoding. The main issue is of course the smallernumber of pixels that have to be read, which leads to a reductionin both the readout noise and the total overhead. If we considerthe linear non-redundant configuration proposed in Le Bouquin& Tatulli (2006) for 6 and 8 telescopes, we can calculate thatthe output pupil extends over 36 (respectively 76) times the in-dividual diameter for 6 (respectively 8) telescopes. The spatio-spectral encoding allows us to reduce these numbers to 12 (re-spectively 16) times the individual diameter. Thus, the gain inthe number of pixels is 3 (respectively 4.75) in 6T (respectively8T) mode.
It is clear that following recent progresses in developing verylow noise infrared detectors, this gain will not be as high but onehas to keep in mind that an accurate calculation should also takeinto account the observing efficiency that includes the percent-age of time on sky versus that on reading the detector. Hence theimplementation of this optimized encoding will certainly bringimportant improvements in terms of limiting magnitude of futuremulti-axial instruments or fringe tracker devices.
Table 1. Optimal characteristics of the spatio-spectral encoding of theVEGA-3T/4T modes in medium spectral resolution.
MODE Nch lc(mm) OPD offsets (μm)3T 200 ±1.8 0 -100 +1504T 200 ±1.8 0 -100 +150 +250
Notes. The last column indicates the typical OPD offsets for pupils 1-2-3 or 1-2-3-4. The actual implementation could be different, thanks to theresidual cophasing errors between VEGA and the infrared instruments.
3. On sky validation: VEGA-3T first measurementsand performance
3.1. Context of VEGA
The VEGA spectrograph (Mourard et al. 2006, 2008) was orig-inally developed, in terms of optics, to accept three beams lin-early arranged in a non-redundant way, as presented in Fig. 2-left. To preserve the correct sampling in the detector plane, weconsidered adding anamorphosis optics or changing the magni-fication, which caused a reduction in either the field of view orwidth of the spectral band. Thanks to improved algorithms de-veloped for photon counting detectors (Blazit et al. 2008), wedemonstrated the possibility of simply improving the spatial res-olution in the image plane by a factor of four through sub-pixellocalization of photo-events. By adopting the new principle ofspatio-spectral encoding, it was then possible to simultaneouslyrecombine not only three telescopes but even four in a high re-dundant mode. The interest lies in the huge improvement in themeasurement’s output with three squared visibilities and one clo-sure phase in 3T mode and six squared visibilities and three in-dependent closure phases in 4T mode (see Fig. 3).
Table 1 presents the main characteristics of VEGA/CHARA3T-4T modes used in the medium resolution mode (R = 6000).
A110, page 4 of 9

D. Mourard et al.: Spatio-spectral encoding of fringes in optical long-baseline interferometry
0 100 200 300 400-150
-125
-100
-75
-50
OPD
E1E
2 (μ
m)
0 100 200 300 400250
275
300
325
350
OPD
E2W
2 (μ
m)
0 100 200 300 400Block Number
150
175
200
225
250
OPD
E1W
2 (μ
m)
Fig. 4. Observation of the calibrator star HD 55185 with VEGA withthree telescopes (E1E2W2) at medium spectral resolution (Δλ = 30 nmcentered at λ = 735 nm). The tracking of the fringes is done in the near-infrared with the instrument CLIMB. Plots represent the OPD residualsmeasured on VEGA data for the three baselines. The OPD estimates aredone each second (50 short exposures of 20 ms). Note that, according tothe principle described in Sect. 2, the fringes are not stabilized aroundnull OPDs. For this specific experiment, we did not used the standardconfiguration as defined in Table 1.
3.2. General remarks on the VEGA-3T and -4T observingmodes
3T and 4T operation, especially with CHARA, immediatelyleads to long baselines because of the telescope configuration.The more compact telescope triplet (S1S2W2) has already abaseline of 170 m, which leads to low visibility measurementsin the visible. The other triplets lead to very long baselines of upto 200 m and even 330 m. Until mid-2010, we were only ableto stabilize the VEGA coherence through a real-time processingof the science data allowing us to correct the offset of the delaylines. This mode prevents us, however, from an efficient group-delay tracking at the needed rate of 0.1 Hz for a visibility be-low 0.3. In 2010, we succeeded in observing with VEGA, whilethe fringes were externally stabilized with the new CHARA in-frared instrument called CLIMB (Sturmann et al. 2010) for 3Toperations, and with MIRC (Monnier et al. 2008) for the first4T VEGA light. With these external group delay trackers, wemeasured a typical residual jitter on the optical path differenceof about 5 microns (see Fig. 4), which is well adapted to ourhigh and medium spectral resolution modes. For this operation,we introduced differences in the internal offsets between VEGAand CLIMB or MIRC so that fringes are stabilized in the infraredaround a null optical path difference and around non-null offsetsin the visible to correctly apply the principle of spatio-spectralencoding as described in Sect. 2.
3.3. Squared visibility estimation
Mourard et al. (2009) described squared visibility estimationsin the case of observations with two telescopes. In the case ofthree or four telescope observations, we used exactly the sameestimator. hence, we measured the energy of each high frequencypeak of the power spectrum calibrated by the energy of the lowfrequency peak. In the case of 3(4) telescopes, we estimated 3(6)squared visibilities.
Here, we illustrate the quality of observations for three tele-scopes and the data reduction by deriving the angular diameter
Fig. 5. Fit of a uniform disc model to the squared visibilities mea-sured with VEGA on HD 55185. VEGA measurements are plottedwith crosses and error bars and the model is plotted with circle. Themodel corresponds to a uniform disk angular diameter of φHD 55185 =0.474 ± 0.014 mas.
of HD 55185. We used HD 46487 as a calibrator. The ob-servations in 2010 October 16 were performed using the tele-scopes E1E2W2 and the group-delay sensor CLIMB, and wereof medium spectral resolution around 735 nm, and consisted of400 s of total observation time corresponding to 20 000 short ex-posures of 20 ms. In the data reduction, we selected a spectralband of Δλ = 30 nm centered on λ = 735 nm. We assumedthat the uniform disk (UD) angular diameter of the calibrator isφHD 46487 = 0.18±0.01 mas (estimated value given by SearchCaltool1 of the JMMC, Bonneau et al. 2006a). We used the LitPro2
software (Tallon-Bosc et al. 2008) to fit a uniform disc model tothe squared visibilities measured on the three baselines and esti-mated and angular diameter of HD 55185 (see Fig. 5). We foundφHD 55185 = 0.474 ± 0.014 mas.
We used surface brightness relations to obtain an indepen-dent estimate of the angular diameter (Kervella et al. 2004). Wefound 0.478 mas and 0.476 mas from (V − R) and (B − V), re-spectively. Our result is therefore in very good agreement withthese photometric estimations.
Our determination, after conversion into a limb-darkened di-ameter, is combined with the recent determination of the paral-lax (8.49 ± 0.17 mas, van Leeuwen 2007) to obtain an estima-tion of the effective temperature of HD 55185. This leads to9488 ± 163 K, which is coherent for a A2V star. Our result il-lustrates the capability of VEGA for measuring sub-mas angulardiameters of star with a precision of a few percent (3% in thecase of HD 55185) and obtain a very reliable estimate of effec-tive temperature.
3.4. Closure phase estimation
The problem of obtaining the most reliable estimate of the clo-sure phase has been examined by a number of authors. Cornwell(1987) showed that the closure phase is equal to the phase of thebispectrum (or triple product) and Woan & Duffett-Smith (1988)showed that averaging the bispectrum is the best way to estimatethe closure phase if the visibility phases cannot be recovered.
1 Available at http://www.jmmc.fr/searchcal2 Available at http://www.jmmc.fr/litpro
A110, page 5 of 9

A&A 531, A110 (2011)
Fig. 6. Bispectrum averaged over 250 short exposures of 20 ms (obser-vation of the calibrator star HD 55185). Left: real part of the bispectrum,right: imaginary part of the bispectrum.
The bispectrum is a complex valued function defined as:
D(3)(u1, u2, v1, v2) = I(u1, v1)I(u2, v2)I∗(u1 + u2, v1 + v2), (19)
where I(u) is the Fourier transform of the fringe pattern and I∗denotes the complex conjugate of I. The argument of the bispec-trum is the closure phase Δφ
arg[D(3)(u1, u2, v1, v2)
]= Δφ = θ12 + θ23 − θ13, (20)
where θi j is visibility phase of baseline i j.The dimension of the bispectrum is always twice that of the
power spectrum. In the case of VEGA, the bispectrum will thenbe four dimensional as presented in Eq. (19). Because the smallnumber of telescopes (three or four) provides only a small num-ber of closure triangles, it is only necessary to calculate the bis-pectrum on a small number of points. In the case of three tele-scopes, the bispectrum is calculated around (Up1,Up2,Vp1,Vp2)as defined in Eq. (10).
Figure 6 shows the real and imaginary parts of the bispec-trum averaged over 250 short exposures of 20 ms around thefrequencies (Up1,Up2,Vp1,Vp2). The averaged bispectrum hasbeen projected on the plane defined by the axis (u1, v1) in or-der to ease the visualization of this four-dimensional function.We show a signal in the real part of the averaged bispectrumwhereas no signal is present in the imaginary part. This is ofcourse expected since the star is unresolved and therefore theclosure phase is zero.
Figure 7 presents closure phase measurements for two cali-brator stars (HD 46487 and HD 55185). The observations wereperformed using three telescopes (E1E2W2) at medium spectralresolution. Each estimate corresponds to 5 s of observation andto a spectral band of Δλ = 30 nm centered at λ = 735 nm. Themean and standard deviation of both series are
ΔφHD 46487 = −0.091 ± 8.499◦,
ΔφHD 55185 = 0.776 ± 5.625◦. (21)
No significant bias in the closure phase is detected from these es-timates. The difference in the precision of the two sets is relatedto the photon noise, HD 55185 having a magnitude mV = 4.14compared to mV = 5.08 for HD 46487. These first estimates ofclosure phase also show that precision better than 1◦ ≈ 20 mradcan be achieved with VEGA by averaging phase closure esti-mates over several minutes (10 mn for HD 46487 for example).
3.5. Differential measurements
Spectro-interferometers such as VEGA permit us to determinethe differential visibility and phase. These instruments have been
0 20 40 60 80-50
-25
0
25
50
Clo
sure
Phas
e (d
egre
e) HD46487
0 20 40 60 80Block Number
-50
-25
0
25
50
Clo
sure
Phas
e (d
egre
e)
HD55185
Fig. 7. Estimate of the closure phase of calibrator stars HD 46487 andHD 55185 with VEGA with three telescopes (E1E2W2) at mediumspectral resolution (Δλ = 30 nm centered at λ = 735 nm) and fringetracking done with CLIMB. Each estimate corresponds to 5 s of obser-vation (250 short exposures of 20 ms).
intensively used, for example, to study the morphology and kine-matic of circumstellar environments (Mourard et al. 1989; Berioet al. 1999; Meilland et al. 2007). A data reduction method wasdeveloped to derive these differential measurements for VEGA,which is described in detail in Mourard et al. (2009) for twotelescope observations. In the case of three or four telescope ob-servations, we use exactly the same method but for each highfrequency peak of the cross-spectrum.
Here, we address the problem of the differential phases in thecase of three telescope observations. In Fig. 8, we present mea-surements of differential phase for the observations of HD 55185(see the description of observation in Sect. 3.3). We used a ref-erence channel of Δλ1 = 30 nm centered at λ1 = 735 nm and asliding narrow channel of Δλ2 = 0.6 nm. We averaged the cross-spectrum of 20 000 short exposures of 20 ms (corresponding to400 s of observation) in order to estimate the differential phasewith a good signal to noise ratio (SNR). In theory, the differen-tial phase curves should be constant and equal to zero regardlessof the baseline (E1E2, E1W2, or E2W2), since the star is verypartially resolved. However, we detect linear and/or quadratictrends for each baseline. The differential phase is corrupted bythe OPD
Δφ12,i = θλ1,i − θλ2,i + 2π
(χi(λ1)λ1− χi(λ2)λ2
), (22)
where Δφ12,i is the differential phase for the baseline i, θλ j ,i is thephase of the object at the wavelength λ j for the baseline i, andχi(λ j) is the OPD of the baseline i. This OPD depends on thewavelength through the chromatism of the refractive index of air(Colavita et al. 2004; and Ciddor 1996)
χi(λ) = n(λ)Li = (1 + N(λ)) Li = χi + δχi(λ), (23)
where n(λ) is the refractive index of air, N(λ) represents the chro-matic part of n(λ), and Li is the path difference in air for thebaseline i. Although CHARA uses vacuum pipes for the beamtransportation, the delay lines are in open air, thus the differencein the positions of delay lines introduced a difference in the pathin air. In Eq. (23), χi is the static part of the OPD as describedin Sect. 2 and δχi(λ) is the chromatic OPD. Hence, inserting
A110, page 6 of 9

D. Mourard et al.: Spatio-spectral encoding of fringes in optical long-baseline interferometry
720 725 730 735 740 745 750-60
-40
-20
0
20
40
60
Dif
fere
nti
al P
has
e (d
egre
e)
720 725 730 735 740 745 750Wavelength (nm)
-60
-40
-20
0
20
40
60
Dif
fere
nti
al C
losu
re P
has
e (d
egre
e)
Fig. 8. Top: plots represent the differential phases in a narrow spectralband of 0.6 nm with respect to the wavelength (baseline E1E2 in black,E2W2 in red, E1W2 in green). Bottom: plot represents the differen-tial closure phase deduced from the three individual differential phases.Each estimate corresponds to 400 s of observation of calibrator starHD 55185 using VEGA with three telescopes (E1E2W2) at mediumspectral resolution and fringe tracking done with CLIMB. Individualerror bars are not plotted for clarity. On baselines E1E2 and E2W2, theerrors are at the level of 0.5◦, whereas on the baseline E1W2 they arecloser to 5◦.
Eqs. (23) into (22) gives
Δφ12,i = θλ1,i − θλ2 ,i + 2πχi
(1λ1− 1λ2
)+ φdisp,12, (24)
where the dispersive differential phase is
φdisp,12 = 2π
(δχi(λ1)λ1
− δχi(λ2)λ2
)· (25)
Hence, if the interferometer operates in vacuum and if the OPDis servoing to zero, the third and fourth terms in Eq. (24) dis-appear and the differential phase depends only on the phase ofthe object. In the case of VEGA, the OPDs of each baselineare servoing to a non-zero value and the delay lines operate inair. Therefore, the differential phases are corrupted by both thestatic OPD and the dispersive differential phase φdisp,12, whichexplains the linear and/or quadratic trends of the curves pre-sented in Fig. 8.
Extraction of the astrophysical signal requires the removalof these linear and/or quadratic trends. This is usually doneby fitting and subtracting a low-order polynomial function ora model of the dispersive differential phase to the differentialphase (Matter et al. 2010). The main drawback of this methodis the loss of both the linear and/or quadratic terms in the as-trophysical signal. For studies of circumstellar discs for exam-ple, it is not a major problem because the astrophysical signal ismore complex and confined only to spectral lines. So the neigh-boring continuum could be used to remove the linear and/orquadratic trends. However, other astrophysical studies, such asbinary stars, require us to measure signatures in the differentialphase that are very close to linear or quadratic trends. In thatcase, the differential phase could not be used directly. We de-fined a new interferometric observable, which is the differentialclosure phase
Δφ(3)12 = Δφ12,1 + Δφ12,2 − Δφ12,3. (26)
Fig. 9. Sky coverage of potential calibrator stars well adapted toVEGA/CHARA in 3T/4T mode with CLIMB as external IR group de-lay tracking. All these stars have a spectral type ranging from O (cross),B (star), A (diamond), to F (triangle).
It can easily be shown that this quantity does not depend on theOPD but is the difference in the classical closure phase of eachspectral band
Δφ(3)12 = Δφ1 − Δφ2, (27)
where Δφ1 and Δφ2 are respectively the classical closure phaseof the reference channel and of the narrow channel. Figure 8(bottom plot) illustrates that the linear and/or quadratic trendsdue to the OPD have disappeared in the differential closurephase. The mean of the differential closure phase in one narrow
channel is Δφ(3)12 = 0.2 ± 11◦ all over the spectral band of 30 nm.
4. Discussion of possible VEGA/3T-4T sciencecases
4.1. 3T-4T operation issues
Even if progress in fringe tracking allows fainter objects to beobserved and/or lower visibilities to be recorded, this requiresfinding calibrators that are bright enough for both the scientificinstrument and the fringe tracker. Moreover, using very longbaselines makes the choice of calibrators much more difficultsince lots of them are partially resolved. The calibrators mustalso be close to the scientific targets in terms of both distanceand spectral type to avoid any bias in the calibrated interferomet-ric observables. As an example, we selected calibrators amongthe 9500 stars (declination larger than −30◦ and magnitude Vbrighter than 7.0) in the VEGA internal catalog by applying fil-ters to parameters such as magnitude and diameter so as to fit theVEGA capabilities. Angular diameters were calculated using aspectrophotometric polynomial law based on the V magnitudeand the (V − K) color index (Bonneau et al. 2006b). Accordingto the current limiting magnitude, we considered only the starsbrighter than 6.5 in the V band and brighter than 7 in the K band(for CLIMB that performs the group delay tracking). We iden-tified 1866 potential calibrators in all parts of the sky with anangular diameter smaller than 0.4 mas providing a high visibil-ity measurement even on the largest baselines. All of them areOBAF stars (Fig. 9). Figure 10 shows the histogram of the num-ber of calibrators found per regions of sky of 1h in right ascen-sion and 5◦ in declination.
A110, page 7 of 9

A&A 531, A110 (2011)
Fig. 10. Number of sky regions of 1h in right ascension and 5◦ in decli-nation as a function of existing calibrators.
4.2. Fundamental parameters
Thanks to direct angular diameter measurements by optical in-terferometry combined with the bolometric flux, it is possibleto derive the fundamental stellar parameters, such as the effec-tive temperature, the luminosity, and the stellar radius. The de-termination of the angular diameter is based on visibility mea-surements that are directly linked to the Fourier transform of theobject intensity distribution. For a single circular star, the visi-bility curve as a function of spatial frequency B/λ (where B isthe interferometric baseline and λ is the operating wavelength)is related to the first Bessel function, and contains a central lobe,that is almost only sensitive to the size of the object, and an everdecreasing series of side lobes, separated by nulls, which one ob-serves with an increasing angular resolution. As a rule of thumb,the side lobes are sensitive to limb darkening and atmosphericstructure but consist of very low visibilities. With VEGA, beingable to measure very low visibilities will allow us to determinethe angular diameters of stars of sub-mas sizes to an accuracybetter than 2% (Mourard et al. 2010). We limit ourselves to starspresenting an angular diameter smaller than 3.0 mas in order tobe able to cover both the central lobe and the side lobes of thevisibility function.
Moreover, using triplets of the longest baselines in the visi-ble is a powerful means of determining accurate limb darkeninglaws throughout the HR diagram. Limb darkening is a functionof the wavelength, and in particular limb darkening in a givenspectral line depends upon the physical location in the atmo-sphere of the line-forming region of the element. Thus, an ac-curate measurement of the limb-darkening within spectral lineswill allow us to study the temperature and density structure of theatmosphere, hence the strong interest in using multi-telescopecombiners operating with dispersed fringes.
For VEGA, by adopting the same approach used for search-ing to calibrators and considering the standard VEGA squaredvisibility measurement accuracy of 2% and the CHARA longestbaseline (330 m), we have determined the minimum measur-able diameter for a given accuracy. This corresponds to 0.16 mas(resp. 0.12, 0.075) for a 1% (resp. 2%, 5%) accuracy in the angu-lar diameter determination. We have then determined that suchlimb-darkening studies will be possible for stars spread overnearly the whole Hertzsprung-Russell diagram (excluding com-pact objects) as illustrated in Fig. 11, and will result in a very
significant improvement in the stellar atmosphere models (1Dand 3D) of all stars.
4.3. Towards chromatic imaging of stellar surfacesand complex environments
Visibility measurements close to zero and closure phases aresensitive to departures from circular symmetry (due to stellarspots, for instance). Both the 3T and 4T operations are there-fore well adapted to stellar activity studies and/or spot detec-tion on stellar surfaces. In various contexts, high angular reso-lution measurements provided by optical interferometry appearsto be very relevant to the study of geometrical constraints onstellar spotty surfaces and to be very complementary to existingspectro-photometric techniques. As an example, this techniquecan be well suited to the detection of spots on exoplanet hoststars and to accurately quantify the stellar noise that can mimicplanetary signals in radial-velocity and/or transit methods whensearching for exoplanets (Lagrange et al. 2010). Provided thathigh spectral resolution is coupled to long-baseline interferome-try, another challenge is to be able to detect and image the abun-dance inhomogeneities of chemically peculiar stars, which willbe an important step in more clearly understanding this peculiarclass of objects and the physical processes that occur in a stronglarge-scale organized magnetic field.
4.4. Other scientific goals
Coupling high angular resolution to high spectral resolution isalso of interest for kinematic studies that use emission lines.Being able to reconstruct velocity-resolved images is a power-ful means of studying the complex environments of hot stars,permitting us to probe the geometry and kinematics of the dustand the gas that surrounds these objects or to provide constraintson the size, the inclination, or the position angle of the circum-stellar disks. It could also provide information about the stellarrotation and the differential rotation for fast rotators (Zorec et al.2011).
Binary star study will also greatly benefit from a combina-tion of high spectral and high spatial resolutions. This is indeedthe ideal way to achieve accurate measurements of mass and lu-minosity, which are the primary parameters of stellar evolutionmodels.
Finally, it has been demonstrated that using spectral differen-tial observables to reconstruct images greatly improves the qual-ity of the reconstructed images, which are then astrometricallylinked from wavelength-to-wavelength (Millour et al. 2011).
5. Conclusion
We have described the principles and the formalism of thespatio-spectral encoding of fringes. This mode is well adaptedto multi-axial dispersed fringe instruments for optical long-baseline interferometry and allows us to simultaneously reducethe size of the optics to accommodate the beams, decrease thenumber of pixels that have to be read to correctly analyze allthe fringe systems, and increase the SNR and thus the limitingmagnitude of these instruments.
Thanks to the dual instrument capabilities of the CHARA ar-ray operating system, we have been able to use the visible spec-trograph VEGA in parallel with the infrared instruments CLIMBand MIRC. A low-frequency group-delay tracking of fringes inthe infrared has been shown to permit an excellent stabilization
A110, page 8 of 9
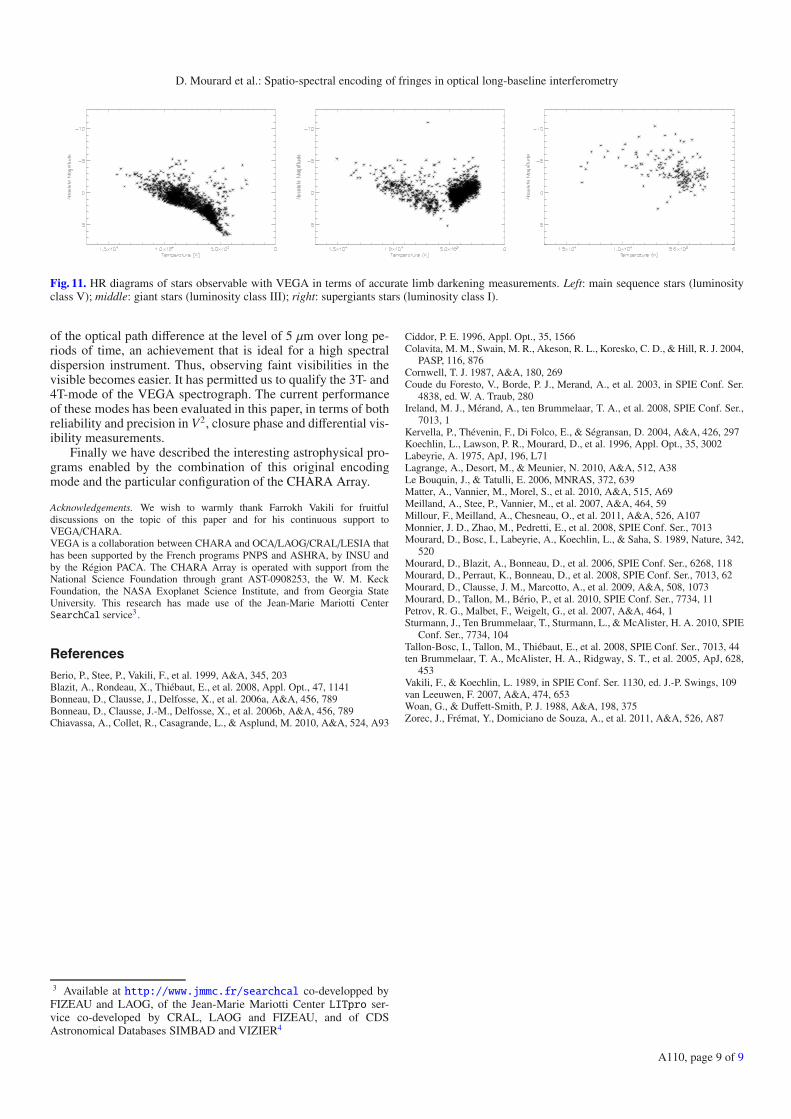
D. Mourard et al.: Spatio-spectral encoding of fringes in optical long-baseline interferometry
Fig. 11. HR diagrams of stars observable with VEGA in terms of accurate limb darkening measurements. Left: main sequence stars (luminosityclass V); middle: giant stars (luminosity class III); right: supergiants stars (luminosity class I).
of the optical path difference at the level of 5 μm over long pe-riods of time, an achievement that is ideal for a high spectraldispersion instrument. Thus, observing faint visibilities in thevisible becomes easier. It has permitted us to qualify the 3T- and4T-mode of the VEGA spectrograph. The current performanceof these modes has been evaluated in this paper, in terms of bothreliability and precision in V2, closure phase and differential vis-ibility measurements.
Finally we have described the interesting astrophysical pro-grams enabled by the combination of this original encodingmode and the particular configuration of the CHARA Array.
Acknowledgements. We wish to warmly thank Farrokh Vakili for fruitfuldiscussions on the topic of this paper and for his continuous support toVEGA/CHARA.VEGA is a collaboration between CHARA and OCA/LAOG/CRAL/LESIA thathas been supported by the French programs PNPS and ASHRA, by INSU andby the Région PACA. The CHARA Array is operated with support from theNational Science Foundation through grant AST-0908253, the W. M. KeckFoundation, the NASA Exoplanet Science Institute, and from Georgia StateUniversity. This research has made use of the Jean-Marie Mariotti CenterSearchCal service3.
ReferencesBerio, P., Stee, P., Vakili, F., et al. 1999, A&A, 345, 203Blazit, A., Rondeau, X., Thiébaut, E., et al. 2008, Appl. Opt., 47, 1141Bonneau, D., Clausse, J., Delfosse, X., et al. 2006a, A&A, 456, 789Bonneau, D., Clausse, J.-M., Delfosse, X., et al. 2006b, A&A, 456, 789Chiavassa, A., Collet, R., Casagrande, L., & Asplund, M. 2010, A&A, 524, A93
3 Available at http://www.jmmc.fr/searchcal co-developped byFIZEAU and LAOG, of the Jean-Marie Mariotti Center LITpro ser-vice co-developed by CRAL, LAOG and FIZEAU, and of CDSAstronomical Databases SIMBAD and VIZIER4
Ciddor, P. E. 1996, Appl. Opt., 35, 1566Colavita, M. M., Swain, M. R., Akeson, R. L., Koresko, C. D., & Hill, R. J. 2004,
PASP, 116, 876Cornwell, T. J. 1987, A&A, 180, 269Coude du Foresto, V., Borde, P. J., Merand, A., et al. 2003, in SPIE Conf. Ser.
4838, ed. W. A. Traub, 280Ireland, M. J., Mérand, A., ten Brummelaar, T. A., et al. 2008, SPIE Conf. Ser.,
7013, 1Kervella, P., Thévenin, F., Di Folco, E., & Ségransan, D. 2004, A&A, 426, 297Koechlin, L., Lawson, P. R., Mourard, D., et al. 1996, Appl. Opt., 35, 3002Labeyrie, A. 1975, ApJ, 196, L71Lagrange, A., Desort, M., & Meunier, N. 2010, A&A, 512, A38Le Bouquin, J., & Tatulli, E. 2006, MNRAS, 372, 639Matter, A., Vannier, M., Morel, S., et al. 2010, A&A, 515, A69Meilland, A., Stee, P., Vannier, M., et al. 2007, A&A, 464, 59Millour, F., Meilland, A., Chesneau, O., et al. 2011, A&A, 526, A107Monnier, J. D., Zhao, M., Pedretti, E., et al. 2008, SPIE Conf. Ser., 7013Mourard, D., Bosc, I., Labeyrie, A., Koechlin, L., & Saha, S. 1989, Nature, 342,
520Mourard, D., Blazit, A., Bonneau, D., et al. 2006, SPIE Conf. Ser., 6268, 118Mourard, D., Perraut, K., Bonneau, D., et al. 2008, SPIE Conf. Ser., 7013, 62Mourard, D., Clausse, J. M., Marcotto, A., et al. 2009, A&A, 508, 1073Mourard, D., Tallon, M., Bério, P., et al. 2010, SPIE Conf. Ser., 7734, 11Petrov, R. G., Malbet, F., Weigelt, G., et al. 2007, A&A, 464, 1Sturmann, J., Ten Brummelaar, T., Sturmann, L., & McAlister, H. A. 2010, SPIE
Conf. Ser., 7734, 104Tallon-Bosc, I., Tallon, M., Thiébaut, E., et al. 2008, SPIE Conf. Ser., 7013, 44ten Brummelaar, T. A., McAlister, H. A., Ridgway, S. T., et al. 2005, ApJ, 628,
453Vakili, F., & Koechlin, L. 1989, in SPIE Conf. Ser. 1130, ed. J.-P. Swings, 109van Leeuwen, F. 2007, A&A, 474, 653Woan, G., & Duffett-Smith, P. J. 1988, A&A, 198, 375Zorec, J., Frémat, Y., Domiciano de Souza, A., et al. 2011, A&A, 526, A87
A110, page 9 of 9