Ship Speed Petition - Center for Biological Diversity
44
April 28, 2021 Gina M. Raimondo Secretary of Commerce United States Department of Commerce 14th and Constitution Avenue, NW Washington, DC 20230 [email protected] Catherine Marzin, Director (Acting) Office of Protected Resources National Marine Fisheries Service 1315 East-West Highway Silver Spring, MD 20910-3225 [email protected] Barry Thom, Regional Administrator National Marine Fisheries Service (NMFS) West Coast Regional Office 1201 Northeast Lloyd Portland, OR 97232 [email protected] RE: Notice of Petition for Rulemaking to Prevent Deaths and Injuries of Endangered Blue, Humpback, and Fin Whales from Vessel Strikes Dear Secretary Raimondo, Acting Director Marzin, and Mr. Thom, Endangered blue, humpback, and fin whales off California’s coast are too frequently struck and killed by ships. Rich, cold waters attract them from hundreds of miles away to feed. They return year after year to specific ocean areas known for productivity to feed on krill, anchovy, and other ocean animals. In doing so, these great whales sequester carbon, fertilize the sea floor, and create opportunities for the vast diversity of life in California’s ocean. California is also home to millions of people, making its waters subject to pressure from anthropogenic threats. Vessel strikes are the biggest source of human-caused mortality to most large whales on the U.S. West Coast, followed closely by fishing gear entanglements. Large cargo ships, some longer than four city blocks, funnel into shipping lanes to ports, including those near the San Francisco and Santa Barbara regions. If traveling at speeds over 10 knots, these large ships risk hitting whales, causing internal organ damage, propeller wounds, and other injuries. Scientists estimate that 80 whales die from ship strikes each year on the U.S. West Coast, although records of dead whales injured by ship strikes are less frequent because the carcasses may sink to the bottom of the ocean or wash ashore on remote beaches. Most large whale species are listed as endangered or threatened, with populations still facing extinction brought on by industrial whaling. The largest animal in the world, the endangered blue whale, is especially at risk because it uses the waters of southern California for feeding and breeding behaviors next to the busy Ports of Los Angeles and Long Beach. Estimated annual mortality for blue whales (18)
-
Upload
khangminh22 -
Category
Documents
-
view
4 -
download
0
Transcript of Ship Speed Petition - Center for Biological Diversity
April 28, 2021
Gina M. Raimondo Secretary of Commerce United States Department of Commerce 14th and Constitution Avenue, NW Washington, DC 20230 [email protected]
Catherine Marzin, Director (Acting) Office of Protected Resources National Marine Fisheries Service 1315 East-West Highway Silver Spring, MD 20910-3225 [email protected]
Barry Thom, Regional Administrator National Marine Fisheries Service (NMFS) West Coast Regional Office 1201 Northeast Lloyd Portland, OR 97232 [email protected]
RE: Notice of Petition for Rulemaking to Prevent Deaths and Injuries of Endangered Blue, Humpback, and Fin Whales from Vessel Strikes
Dear Secretary Raimondo, Acting Director Marzin, and Mr. Thom,
Endangered blue, humpback, and fin whales off California’s coast are too frequently struck and killed by ships. Rich, cold waters attract them from hundreds of miles away to feed. They return year after year to specific ocean areas known for productivity to feed on krill, anchovy, and other ocean animals. In doing so, these great whales sequester carbon, fertilize the sea floor, and create opportunities for the vast diversity of life in California’s ocean.
California is also home to millions of people, making its waters subject to pressure from anthropogenic threats. Vessel strikes are the biggest source of human-caused mortality to most large whales on the U.S. West Coast, followed closely by fishing gear entanglements. Large cargo ships, some longer than four city blocks, funnel into shipping lanes to ports, including those near the San Francisco and Santa Barbara regions. If traveling at speeds over 10 knots, these large ships risk hitting whales, causing internal organ damage, propeller wounds, and other injuries.
Scientists estimate that 80 whales die from ship strikes each year on the U.S. West Coast, although records of dead whales injured by ship strikes are less frequent because the carcasses may sink to the bottom of the ocean or wash ashore on remote beaches. Most large whale species are listed as endangered or threatened, with populations still facing extinction brought on by industrial whaling. The largest animal in the world, the endangered blue whale, is especially at risk because it uses the waters of southern California for feeding and breeding behaviors next to the busy Ports of Los Angeles and Long Beach. Estimated annual mortality for blue whales (18)

ii
exceeds the threshold level that allows recovery (1.23 deaths in U.S. waters) by an order of magnitude.
For these reasons, the National Marine Fisheries Service (NMFS) must take action under the Marine Mammal Protection Act and the Endangered Species Act to issue regulations slowing commercial vessels greater than or equal to 40 feet in length, establish offshore shipping routes between southern California and San Francisco, and issue regulations protecting areas of importance for large whales near the coast. Years of voluntary speed limit recommendations have failed to slow enough ships to reduce mortality by the level required by law.
Pursuant to the right to petition the government provided in the First Amendment to the U.S. Constitution and the Administrative Procedure Act (APA), the Center for Biological Diversity hereby petitions the Secretary of Commerce, acting through NMFS, to take the additional steps necessary to protect endangered and threatened blue, humpback, and fin whales. Specifically, we request that NMFS utilize its authorities under the Endangered Species Act (ESA) and the Marine Mammal Protection Act (MMPA) to issue a rule as follows:
Implement a year-round mandatory 10 knot speed limit in the National Oceanic and Atmospheric Administration’s (NOAA’s) current voluntary vessel speed reduction zones in the San Francisco Bay Region and the Southern California Region for vessels greater than or equal to 40 feet in length.
Establish shipping routes or vessel tracks for all commercial shipping vessels transiting between ports in Southern California and San Francisco Bay Area at least 24 nautical miles from shore.
Identify areas of seasonal importance for blue whales, humpback whales, and fin whales, and set a vessel traffic threshold above which additional management measures will be triggered. The measures considered must include a ban on nighttime traffic.
Recent science comparing the overlap of blue, humpback, and fin whales and vessel traffic by using Automatic Identification System (AIS) data has given NMFS the information it needs to support promulgation of the requested regulation. We urge NMFS to start the rulemaking process immediately to fulfill its statutory obligations under the ESA and MMPA to ensure the whales’ survival and recovery.
The APA allows for an interested person to participate in the regulatory process through the submission of a petition for the “issuance, amendment, or repeal of a rule.” 5 U.S.C. § 553(e). Failure to respond to such a petition within a reasonable timeframe constitutes a violation of an agency’s duty under the APA. 5 U.S.C. § 555(e). The Center for Biological Diversity considers 12 months to be such a reasonable timeframe given the severe and ongoing

iii
impact of ship strikes on strategic marine mammal stocks and requests that the agency respond to the petition within that period.1
Sincerely,
Catherine Kilduff, Senior Attorney Center for Biological Diversity 1212 Broadway, St. #800 Oakland, CA 94612
The Center for Biological Diversity is a national, nonprofit conservation organization with more than 1.7 million members and online activists dedicated to the protection of endangered species and wild places. The Center and its members are concerned with the conservation of marine mammals, sea turtles, and other organisms, and the effective implementation of the Endangered Species Act, Marine Mammal Protection Act, and other applicable laws.
1 The provisions of this Petition are severable. If any provision of this Petition is found to be invalid or unenforceable, the invalidity or lack of legal obligation shall not affect the other provisions of the Petition.
iv
Table of Contents
I. Introduction: The need for action ............................................................................................ 1
II. Legal Framework ..................................................................................................................... 2
A. ESA .................................................................................................................................. 2
B. MMPA .............................................................................................................................. 3
III. Background on Blue Whales, Humpback Whales, and Fin Whales ....................................... 5
A. Blue Whales ..................................................................................................................... 5
B. Humpback Whales ......................................................................................................... 11
C. Fin Whales ...................................................................................................................... 15
IV. Mandatory Regulations Are Needed To Reduce Vessel Strike Mortality of Blue, Humpback, and Fin Whales. ............................................................................................................................ 18
A. Vessel Strike Mortality Exceeds Blue and Humpback Whale Biological Thresholds. . 19
B. Mandatory Mitigation Measures Have Clear and Quantified Benefits To Whales. ...... 20
C. NMFS Has Failed to Protect Whales in Response to Past Petitions. ............................. 20
Petitioned Action 1: Implement a year-round mandatory 10-knot speed limit in NMFS’s current voluntary vessel speed reduction zones in the San Francisco Bay Region and the Southern California Region for vessels greater than or equal to 40 feet in length. .................. 21
Petitioned Action 2: Establish shipping routes or vessel tracks for all commercial shipping vessels transiting between ports in Southern California and San Francisco region at least 24 nautical miles from shore. ......................................................................................................... 27
Petitioned Action 3: Identify areas of seasonal importance for blue whales, humpback whales, and fin whales, and set a vessel traffic threshold above which additional management measures will be triggered. The measures considered must include a ban on nighttime traffic through the area. ........................................................................................................................ 29
V. Suggested Regulatory Language ........................................................................................... 31
VI. Conclusion ............................................................................................................................. 32
VII. References ............................................................................................................................. 33

1
I. Introduction: The need for action In 2018, ships killed and seriously injured 13 whales in California (Carretta et al. 2020a).
This was the highest number on record number since NMFS began keeping records in 1982. Ship strikes represent the majority of human-caused large whale deaths on the U.S. West Coast from 2014 to 2018, with a total of at least 26 whale deaths, followed by fishery-related entanglements (21 deaths) (id.). For fin whales, eight died from vessel strikes during this time period, representing the leading cause of human-caused injury and death (id.). For both blue whales (three deaths) and humpback whales (13 deaths), vessel strikes are the second leading cause of injury and death after fishery interactions (id.).
Figure 1. Number of recorded whale injuries and deaths from ship collisions in California each year. (Data Source: NMFS, pers. comm.)
These observed whale deaths severely undercount actual mortality. Scientists estimate that vessel strikes kill 80 whales each year off the West Coast (Rockwood et al. 2017). Rockwood et al. (2017) estimated that annual vessel strike mortality from July to December was 18 blue, 22 humpback, and 46 or 43 fin whales, under two different models of whale collision avoidance: decreasing avoidance with increasing vessel speed or a constant 55% avoidance, respectively (id.). Given the uncertainty in accounting for whale collision avoidance, they also calculated strike mortality in the case of no avoidance, producing estimates of 40 blue, 48 humpback, and 95 fin whale deaths (id.). For imperiled populations, “death from vessel collisions may be a significant impediment to population growth and recovery” (id.).
2
Even that study underestimated the annual number of whales killed because it focused on the period of July to December. An update used recent humpback data to calculate mortality in winter/spring (January-April); mortality during these four months was actually more (6.5 whales; 1.63/month) than during the 6 summer/fall months (5 whales; 1.25/month) in Southern California (Rockwood and Jahncke 2019). This study neither included information for January to April for fin or blue whales, nor estimated humpback mortality in central or Northern California. Thus, even it underestimated whale mortality.
II. Legal Framework Both the ESA and MMPA mandate that NMFS protect and recover endangered whales.
To meet these statutory mandates, NMFS must ensure that blue, fin, and humpback whales are protected from one of the biggest anthropogenic threats to their continued existence – vessel strikes – by requiring speed limits that apply to all vessels over 40 feet in length and adjusting the areas in which shipping traffic is focused away from whale hotspots.
A. ESA
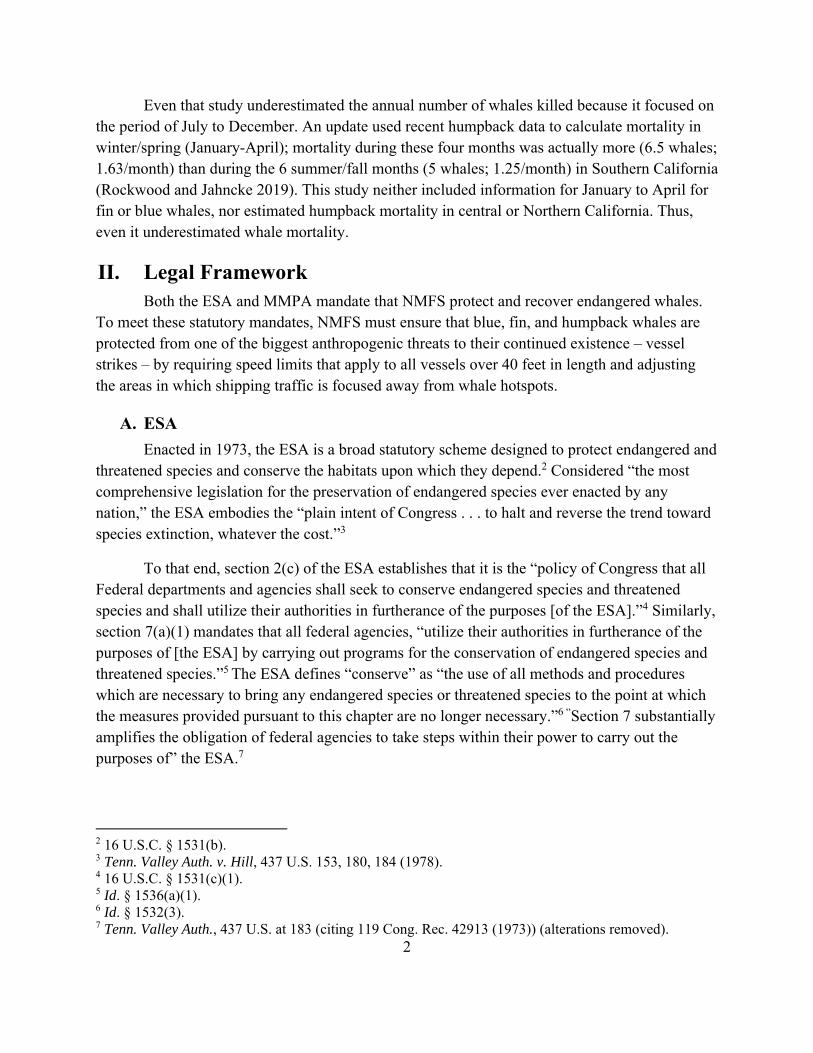
Enacted in 1973, the ESA is a broad statutory scheme designed to protect endangered and threatened species and conserve the habitats upon which they depend.2 Considered “the most comprehensive legislation for the preservation of endangered species ever enacted by any nation,” the ESA embodies the “plain intent of Congress . . . to halt and reverse the trend toward species extinction, whatever the cost.”3
To that end, section 2(c) of the ESA establishes that it is the “policy of Congress that all Federal departments and agencies shall seek to conserve endangered species and threatened species and shall utilize their authorities in furtherance of the purposes [of the ESA].”4 Similarly, section 7(a)(1) mandates that all federal agencies, “utilize their authorities in furtherance of the purposes of [the ESA] by carrying out programs for the conservation of endangered species and threatened species.”5 The ESA defines “conserve” as “the use of all methods and procedures which are necessary to bring any endangered species or threatened species to the point at which the measures provided pursuant to this chapter are no longer necessary.”6 “Section 7 substantially amplifies the obligation of federal agencies to take steps within their power to carry out the purposes of” the ESA.7
2 16 U.S.C. § 1531(b). 3 Tenn. Valley Auth. v. Hill, 437 U.S. 153, 180, 184 (1978). 4 16 U.S.C. § 1531(c)(1). 5 Id. § 1536(a)(1). 6 Id. § 1532(3). 7 Tenn. Valley Auth., 437 U.S. at 183 (citing 119 Cong. Rec. 42913 (1973)) (alterations removed).
3
In addition, section 4(f) specifically requires that NMFS “develop and implement plans (. . . referred to as ‘recovery plans’) for the conservation and survival of endangered species.”8 Consistent with the intent that recovery plans actually be implemented, Congress required that recovery plans “incorporate . . . a description of such site-specific management actions as may be necessary to achieve the plan’s goal for the conservation and survival of the species.”9 Based on the information below showing that the level of mortality from vessel strikes exceeds biological thresholds (potential biological removal) for blue whales and humpback whales, NMFS must take additional action aimed at reducing the risk of injury and death from vessel strikes to meet the requirements of sections 2, 4, and 7 of the ESA.
Collisions with vessels are not only impeding the recovery of blue, humpback, and fin whales, but the mortalities and injuries that result from such collisions are also themselves unlawful. The ESA prohibits the unauthorized “take” of an endangered species.10 The ESA defines take to include engaging in or attempting to engage in conduct that will “harass, harm, pursue, hunt, shoot, wound, kill, trap, capture, or collect” an individual of a listed species.11 Vessel strikes resulting in the injury or death of an endangered whale “take” whales in violation of section 9 of the ESA. The ownership, operation, and authorization of vessels that take endangered whales have occurred and continue to occur without any permit from NMFS authorizing such takes. NMFS must therefore regulate vessel operations to eliminate these illegal takes.12
B. MMPA
Similar to the ESA, the MMPA requires NMFS to “prescribe such regulations as are necessary and appropriate to carry out the purposes of th[e] Act.”13 In enacting the MMPA, Congress declared that marine mammals “have proven themselves to be resources of great international significance, esthetic and recreational as well as economic” and that they “should be protected and encouraged to develop to the greatest extent feasible commensurate with sound policies of resource management and that the primary objective of their management should be to maintain the health and stability of the marine ecosystem.”14
8 16 U.S.C. § 1533(f)(1) (emphasis added). 9 Id. § 1533(f)(1)(B)(i). 10 Id. § 1538(a)(1)(B), (C). 11 Id. § 1532(19). NMFS defines “harm” to include “an act which actually kills or injures fish or wildlife. Such an act may include significant habitat modification or degradation which actually kills or injures fish or wildlife by significantly impairing essential behavioral patterns, including, breeding, spawning, rearing, migrating, feeding or sheltering.” 50 C.F.R. § 222.102. 12 See 16 U.S.C. § 1540(f) (authorizing NMFS to “promulgate such regulations as may be appropriate to enforce” the mandates of the ESA). 13 Id. § 1382(a). 14 Id. § 1361(6).
4
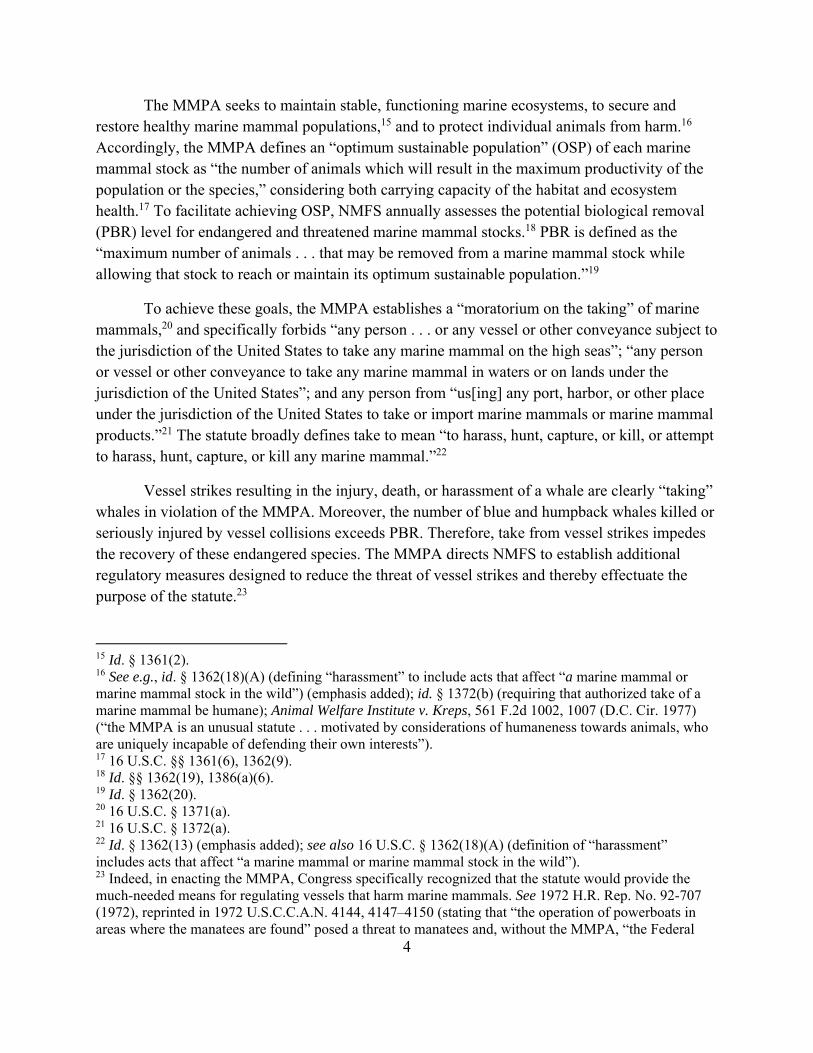
The MMPA seeks to maintain stable, functioning marine ecosystems, to secure and restore healthy marine mammal populations,15 and to protect individual animals from harm.16 Accordingly, the MMPA defines an “optimum sustainable population” (OSP) of each marine mammal stock as “the number of animals which will result in the maximum productivity of the population or the species,” considering both carrying capacity of the habitat and ecosystem health.17 To facilitate achieving OSP, NMFS annually assesses the potential biological removal (PBR) level for endangered and threatened marine mammal stocks.18 PBR is defined as the “maximum number of animals . . . that may be removed from a marine mammal stock while allowing that stock to reach or maintain its optimum sustainable population.”19
To achieve these goals, the MMPA establishes a “moratorium on the taking” of marine mammals,20 and specifically forbids “any person . . . or any vessel or other conveyance subject to the jurisdiction of the United States to take any marine mammal on the high seas”; “any person or vessel or other conveyance to take any marine mammal in waters or on lands under the jurisdiction of the United States”; and any person from “us[ing] any port, harbor, or other place under the jurisdiction of the United States to take or import marine mammals or marine mammal products.”21 The statute broadly defines take to mean “to harass, hunt, capture, or kill, or attempt to harass, hunt, capture, or kill any marine mammal.”22
Vessel strikes resulting in the injury, death, or harassment of a whale are clearly “taking” whales in violation of the MMPA. Moreover, the number of blue and humpback whales killed or seriously injured by vessel collisions exceeds PBR. Therefore, take from vessel strikes impedes the recovery of these endangered species. The MMPA directs NMFS to establish additional regulatory measures designed to reduce the threat of vessel strikes and thereby effectuate the purpose of the statute.23
15 Id. § 1361(2). 16 See e.g., id. § 1362(18)(A) (defining “harassment” to include acts that affect “a marine mammal or marine mammal stock in the wild”) (emphasis added); id. § 1372(b) (requiring that authorized take of a marine mammal be humane); Animal Welfare Institute v. Kreps, 561 F.2d 1002, 1007 (D.C. Cir. 1977) (“the MMPA is an unusual statute . . . motivated by considerations of humaneness towards animals, who are uniquely incapable of defending their own interests”). 17 16 U.S.C. §§ 1361(6), 1362(9). 18 Id. §§ 1362(19), 1386(a)(6). 19 Id. § 1362(20). 20 16 U.S.C. § 1371(a). 21 16 U.S.C. § 1372(a). 22 Id. § 1362(13) (emphasis added); see also 16 U.S.C. § 1362(18)(A) (definition of “harassment” includes acts that affect “a marine mammal or marine mammal stock in the wild”). 23 Indeed, in enacting the MMPA, Congress specifically recognized that the statute would provide the much-needed means for regulating vessels that harm marine mammals. See 1972 H.R. Rep. No. 92-707 (1972), reprinted in 1972 U.S.C.C.A.N. 4144, 4147–4150 (stating that “the operation of powerboats in areas where the manatees are found” posed a threat to manatees and, without the MMPA, “the Federal

5
III. Background on Blue Whales, Humpback Whales, and Fin Whales
A. Blue Whales
The largest animal ever to exist, blue whales have been protected by the ESA and its pre-cursor for over 50 years. Blue whales off California belong to the Eastern North Pacific Stock (Carretta et al. 2020b). Whales photographed off California have matched to whales off northern British Columbia and one individual in the northern Gulf of Alaska (Calambokidis et al. 2009). California satellite-tagged whales have been tracked along the Baja California, Mexico coast and as far as the Costa Rica Dome, an upwelling feature in the eastern tropical Pacific (Mate et al. 1999, Szesciorka et al. 2020). See Figure 2.
Figure 2. GPS positions from satellite tagged blue whales (n=122) showing movement between summer feeding grounds in and north of the Southern California Region and winter breeding grounds in the Costa Rica Dome. Colors correspond with individual whales. Tagging dates spanned 1993–2008, and tags remained attached from 1 to 504 days with an average of 95 days. Tagging locations included Northern California (n=22), Central California (n=17), Southern California (n=78), Baja California (n=3), and the Costa Rica Dome (n=2) (Szesciorka et al. 2020).
government is essentially powerless to force these boats to slow down or curtail their operations.” The MMPA “would provide the Secretary of the Interior with adequate authority to regulate or even forbid the use of powerboats in waters where manatees are found.”).

6
Generally blue whales arrive in the Southern California region to feed on krill in May and depart in November, staying on average 8.4 months (Szesciorka et al. 2020). Acoustic data collected in the San Francisco Bay Area, at Cordell Bank National Marine Sanctuary, indicated that blue whales were present beginning in July or August and ending in December or January, depending on the year (Haver et al. 2020). The arrival and departure of the whales varies year to year, depending on oceanographic conditions and prey availability.
Scientists have concluded that blue whales’ memory of the prior year sea surface temperature anomalies and prior years’ spring bloom locations influence when they arrive on the feeding grounds and where they go (Szesciorka et al. 2020; Abrahms et al. 2019a). Because krill biomass is correlated with sea surface temperature the year prior, blue whales could advance their arrival time (cold years, more krill, early arrival) or delay it (warm years, impoverished prey, late arrival) (Szesciorka et al. 2020). Despite the year-to-year variability, the data show a long-term trend of blue whales arriving at their summer feeding grounds more than a month earlier than at the beginning of a 10-year study but departing at the same time every year (id.). This presents a possible increase in overlap with commercial ships and other anthropogenic threats off California (id.).
One scientific development that could help inform when blue whales are leaving the feeding grounds and migrating south is the discovery that foraging blue whales sing primarily at night, whereas migratory whales sing primarily during the day (Oestreich et al. 2020). This research might allow near real-time information necessary for dynamic management strategies, for example, “notice on the timing of southward migration from key foraging areas (e.g., Monterey Bay) might inform prediction of when migrating blue whales will encounter relatively high vessel-strike risk in areas such as the Santa Barbara Channel” (id.).
Blue Whale Population
The most-recent abundance estimate for the Eastern North Pacific blue whale is 1,496 (CV=0.44) whales, based on the 2014 line-transect survey within the California Current (Barlow 2016; Carretta et al. 2020b). There is no evidence of a population size increase in the Eastern North Pacific blue whale population since the early 1990s, according to mark-recapture estimates, which are the best estimate of population trends (Carretta et al. 2020b). The minimum estimate of abundance is 1,050 whales, which gives a potential biological removal level (PBR) for U.S. waters of 1.23 whales (id.). Given the estimate of ship strike mortality in Rockwood et al. (2017) of 18 whales annually on the U.S. West Coast, in summer and fall months and assuming some avoidance behavior, ship strikes alone exceeds PBR several times over (Rockwood et al. 2017, Redfern et al. 2013).
Blue whales also succumb to fishing gear entanglements. The estimated annual entanglement rate of blue whales is 1.44 whales annually (Carretta et al. 2020b). Reported entanglements have occurred in the California Dungeness crab pot gear fishery and unidentified
7
pot/trap fishery (id.). Gillnet mortality may also occur but go unobserved because whales swim away with a portion of the net (id.). The estimate of fishing gear mortality is an underestimate because not all cases are detected and there is no correction factor available to account for undetected entanglements (id.).
Blue Whale Distribution and Importance of West Coast Feeding Grounds
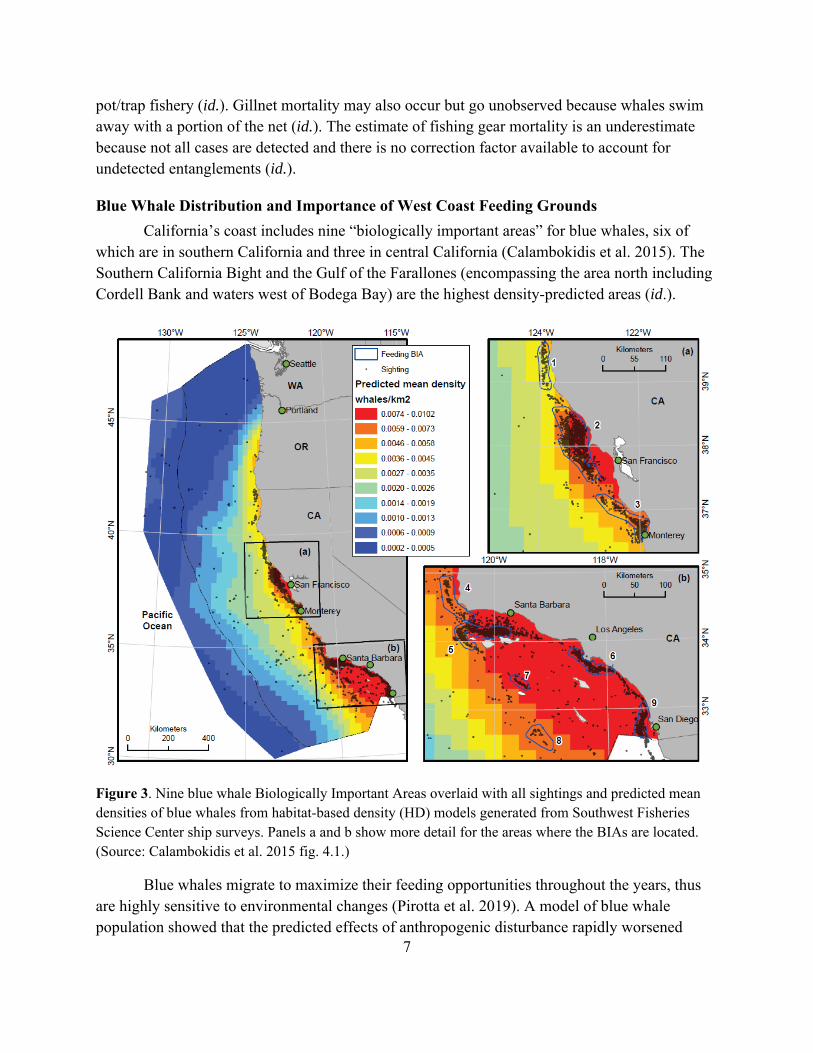
California’s coast includes nine “biologically important areas” for blue whales, six of which are in southern California and three in central California (Calambokidis et al. 2015). The Southern California Bight and the Gulf of the Farallones (encompassing the area north including Cordell Bank and waters west of Bodega Bay) are the highest density-predicted areas (id.).
Figure 3. Nine blue whale Biologically Important Areas overlaid with all sightings and predicted mean densities of blue whales from habitat-based density (HD) models generated from Southwest Fisheries Science Center ship surveys. Panels a and b show more detail for the areas where the BIAs are located. (Source: Calambokidis et al. 2015 fig. 4.1.)
Blue whales migrate to maximize their feeding opportunities throughout the years, thus are highly sensitive to environmental changes (Pirotta et al. 2019). A model of blue whale population showed that the predicted effects of anthropogenic disturbance rapidly worsened
8
when they occurred in the context of an environment that was also changing (id.). The synergistic interactions of environmental change and anthropogenic disturbance caused stronger effects than in isolation (id.).
In other words, the model showed that blue whales are generally more resilient to anthropogenic disturbance than to environmental changes (e.g., a good or bad krill year) (id.). This changed, however, if the disturbance were localized in areas critical for supporting females’ summer feeding, after a winter spent in suboptimal feeding habitats and possibly delivery of large amounts of milk to a calf (id.). Therefore, the authors concluded that “for a wide-ranging species like blue whales, reducing repeated or continuous exposure to a stressor is critical to ensure individuals can compensate for foraging opportunities that are missed” (id.).
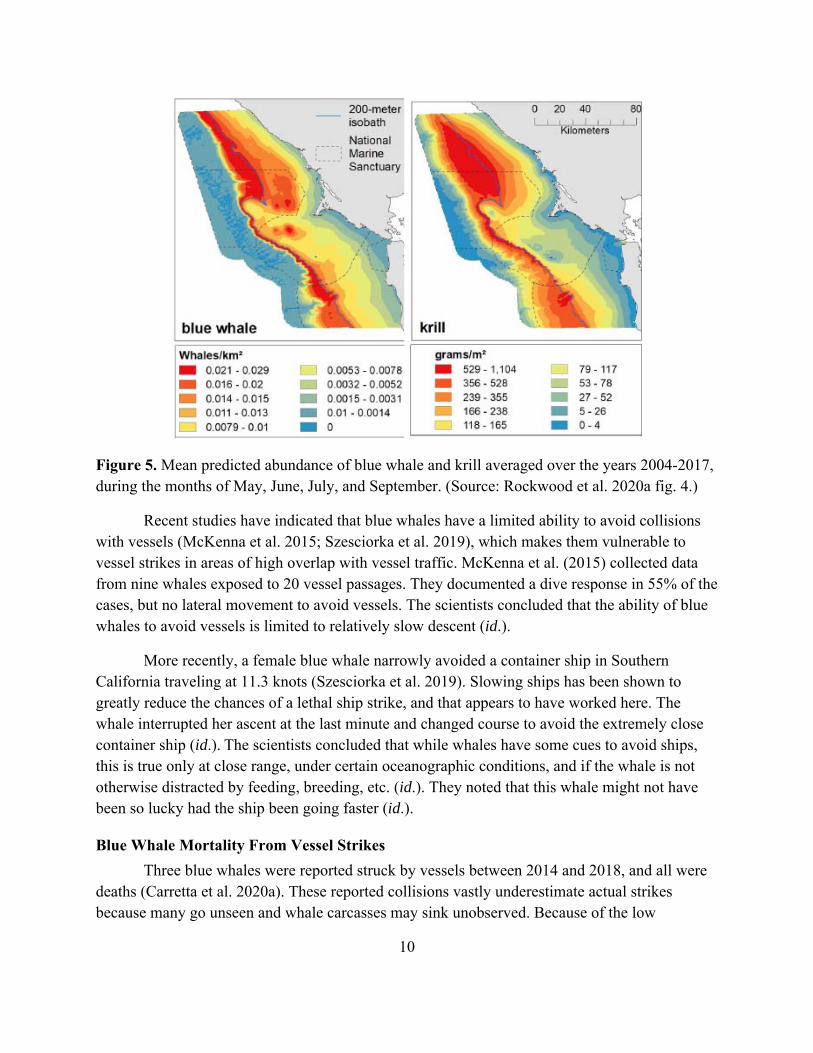
The Santa Barbara Channel hosts the world’s largest seasonal aggregation of blue whales. These animals migrate to the California coast to undertake intensive feeding sessions, which means that their movements depend on their search for krill. The median blue whale feeding session, or “bout,” lasted 3.3 hours and contained about 23 dives (id.). In one case a blue whale was feeding for 34.9 hours straight, or continuously for almost 1.5 days (Irvine et al. 2019). Another tagged blue whale fed continuously during daylight, 12.2 hours, for many days (id.).
Irvine et al. (2019) observed sex-based differences in movement and the areas occupied by male and female blue whales in Southern California, specifically that males traveled in offshore waters while females remained coastal (id.). The males fed little offshore, perhaps because of insufficient prey concentrations, but perhaps the males’ movement was to vocalize and undertake courtship behavior (id.). This would be consistent with observations in the Southern California Bight byŠirovic´et al. (2015) that detected B calls, which are thought to be related to breeding and associated with males, from June to January with a peak in September. In addition, blue whales have been observed to form male-female pairs during the summer with the pairs increasing in number toward the end of summer (Schall et al. 2019 citing Calambokidis, unpub. data). One theory is that breeding activities in blue whales may be opportunistic rather than restricted to a season or specific habitat (Schall et al. 2019).

9
A practical implication of the different behavior between males and females is that nearshore ship strikes may disproportionately affect females, thus sex-specific habitat use should be considered when developing mitigation measures (Irvine et al. 2019).
Figure 4. Tracks of male (left) and female (right) blue whales in August 2014 and July 2015 (Source: Irvine et al. 2019 fig. 2.)
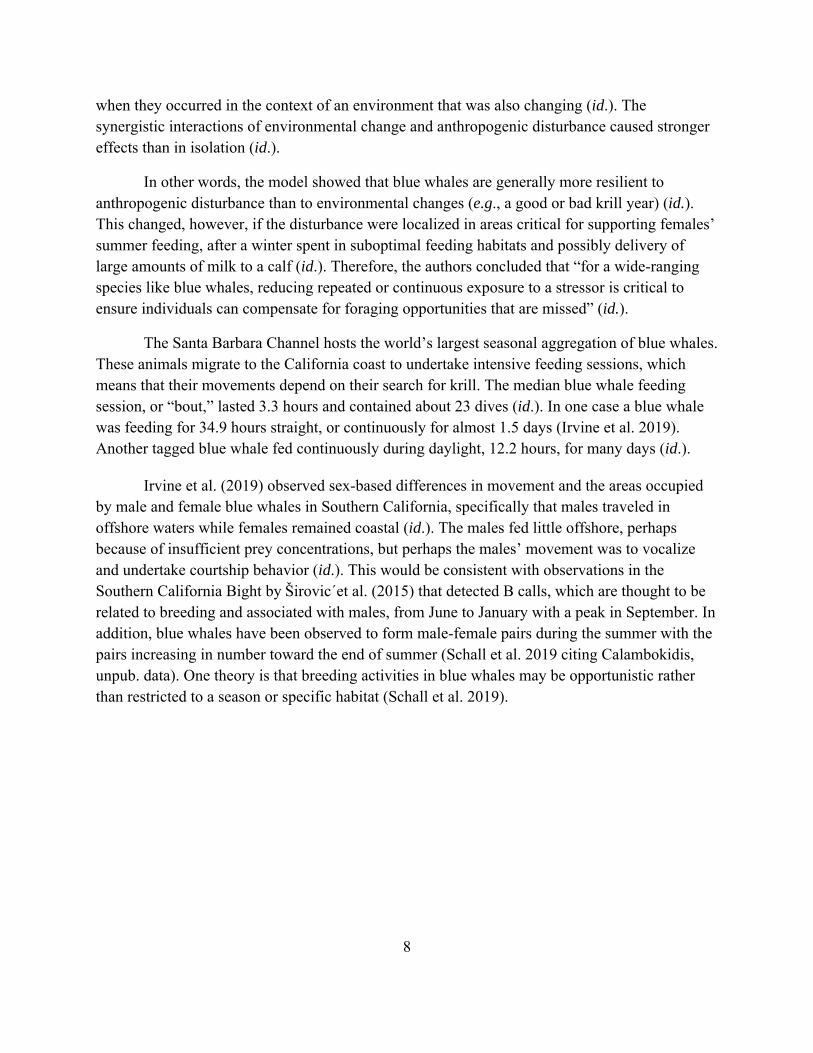
In the San Francisco Bay Area, blue whales consistently use the northeast region of Cordell Bank, the Farallon Escarpment, and the shelf-break waters to feed on krill (Figure 5, Rockwood et al. 2020a). This area is just at the end of the northern shipping lane to San Francisco, providing compelling evidence that managers should implement management areas to slow vessel traffic and increase caution in these areas.
10
Figure 5. Mean predicted abundance of blue whale and krill averaged over the years 2004-2017, during the months of May, June, July, and September. (Source: Rockwood et al. 2020a fig. 4.)
Recent studies have indicated that blue whales have a limited ability to avoid collisions with vessels (McKenna et al. 2015; Szesciorka et al. 2019), which makes them vulnerable to vessel strikes in areas of high overlap with vessel traffic. McKenna et al. (2015) collected data from nine whales exposed to 20 vessel passages. They documented a dive response in 55% of the cases, but no lateral movement to avoid vessels. The scientists concluded that the ability of blue whales to avoid vessels is limited to relatively slow descent (id.).
More recently, a female blue whale narrowly avoided a container ship in Southern California traveling at 11.3 knots (Szesciorka et al. 2019). Slowing ships has been shown to greatly reduce the chances of a lethal ship strike, and that appears to have worked here. The whale interrupted her ascent at the last minute and changed course to avoid the extremely close container ship (id.). The scientists concluded that while whales have some cues to avoid ships, this is true only at close range, under certain oceanographic conditions, and if the whale is not otherwise distracted by feeding, breeding, etc. (id.). They noted that this whale might not have been so lucky had the ship been going faster (id.).
Blue Whale Mortality From Vessel Strikes
Three blue whales were reported struck by vessels between 2014 and 2018, and all were deaths (Carretta et al. 2020a). These reported collisions vastly underestimate actual strikes because many go unseen and whale carcasses may sink unobserved. Because of the low
11
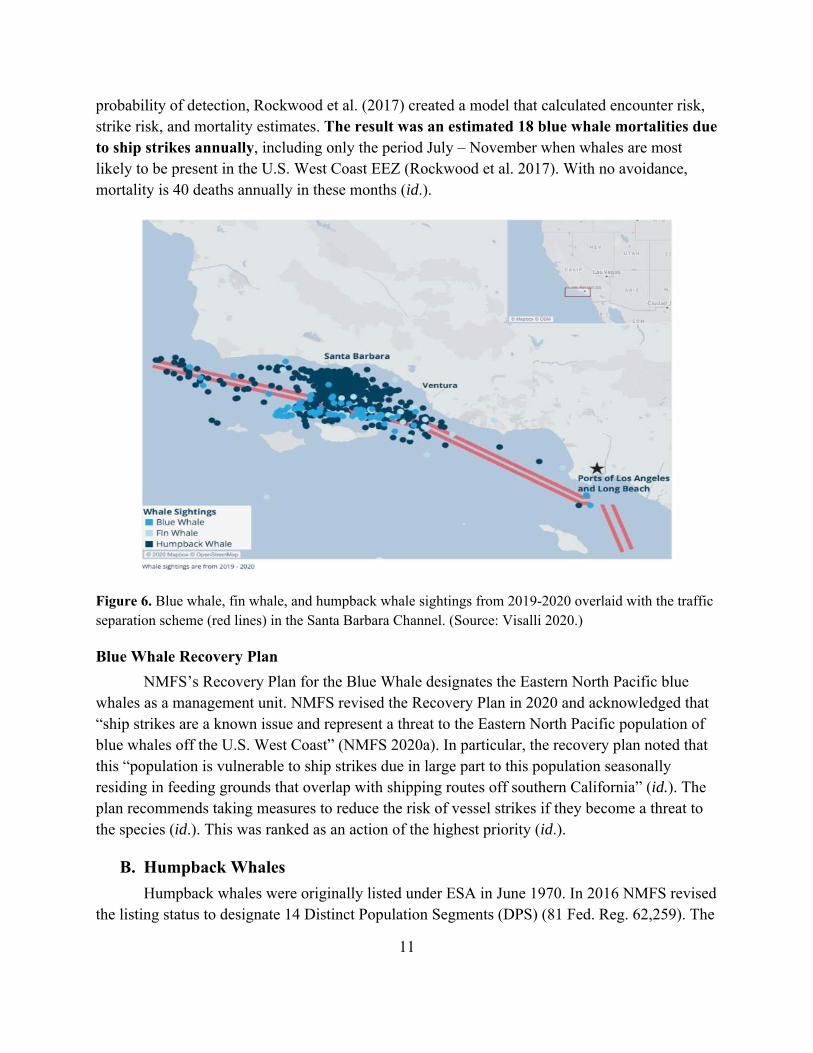
probability of detection, Rockwood et al. (2017) created a model that calculated encounter risk, strike risk, and mortality estimates. The result was an estimated 18 blue whale mortalities due to ship strikes annually, including only the period July – November when whales are most likely to be present in the U.S. West Coast EEZ (Rockwood et al. 2017). With no avoidance, mortality is 40 deaths annually in these months (id.).
Figure 6. Blue whale, fin whale, and humpback whale sightings from 2019-2020 overlaid with the traffic separation scheme (red lines) in the Santa Barbara Channel. (Source: Visalli 2020.)
Blue Whale Recovery Plan
NMFS’s Recovery Plan for the Blue Whale designates the Eastern North Pacific blue whales as a management unit. NMFS revised the Recovery Plan in 2020 and acknowledged that “ship strikes are a known issue and represent a threat to the Eastern North Pacific population of blue whales off the U.S. West Coast” (NMFS 2020a). In particular, the recovery plan noted that this “population is vulnerable to ship strikes due in large part to this population seasonally residing in feeding grounds that overlap with shipping routes off southern California” (id.). The plan recommends taking measures to reduce the risk of vessel strikes if they become a threat to the species (id.). This was ranked as an action of the highest priority (id.).
B. Humpback Whales
Humpback whales were originally listed under ESA in June 1970. In 2016 NMFS revised the listing status to designate 14 Distinct Population Segments (DPS) (81 Fed. Reg. 62,259). The
12
Central America DPS and Mexico DPS, the only humpbacks that enter waters off California, were listed as endangered and threatened, respectively (id.).
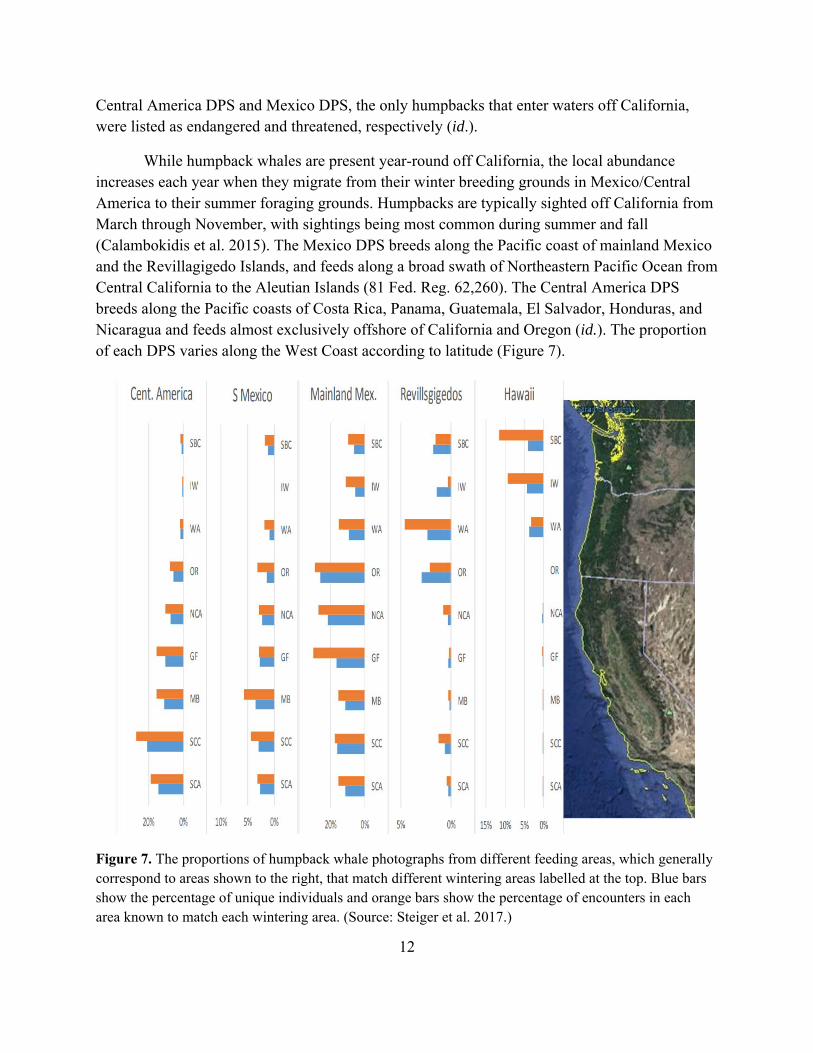
While humpback whales are present year-round off California, the local abundance increases each year when they migrate from their winter breeding grounds in Mexico/Central America to their summer foraging grounds. Humpbacks are typically sighted off California from March through November, with sightings being most common during summer and fall (Calambokidis et al. 2015). The Mexico DPS breeds along the Pacific coast of mainland Mexico and the Revillagigedo Islands, and feeds along a broad swath of Northeastern Pacific Ocean from Central California to the Aleutian Islands (81 Fed. Reg. 62,260). The Central America DPS breeds along the Pacific coasts of Costa Rica, Panama, Guatemala, El Salvador, Honduras, and Nicaragua and feeds almost exclusively offshore of California and Oregon (id.). The proportion of each DPS varies along the West Coast according to latitude (Figure 7).
Figure 7. The proportions of humpback whale photographs from different feeding areas, which generally correspond to areas shown to the right, that match different wintering areas labelled at the top. Blue bars show the percentage of unique individuals and orange bars show the percentage of encounters in each area known to match each wintering area. (Source: Steiger et al. 2017.)
13
Humpback Whale Population
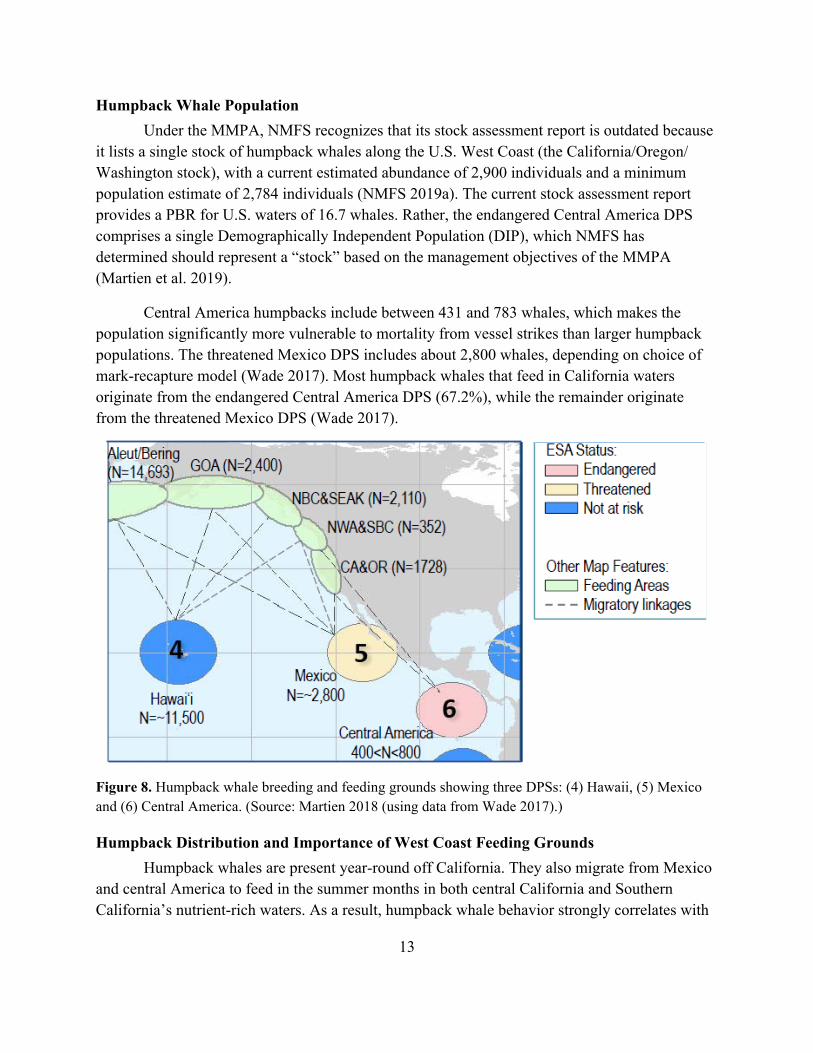
Under the MMPA, NMFS recognizes that its stock assessment report is outdated because it lists a single stock of humpback whales along the U.S. West Coast (the California/Oregon/ Washington stock), with a current estimated abundance of 2,900 individuals and a minimum population estimate of 2,784 individuals (NMFS 2019a). The current stock assessment report provides a PBR for U.S. waters of 16.7 whales. Rather, the endangered Central America DPS comprises a single Demographically Independent Population (DIP), which NMFS has determined should represent a “stock” based on the management objectives of the MMPA (Martien et al. 2019).
Central America humpbacks include between 431 and 783 whales, which makes the population significantly more vulnerable to mortality from vessel strikes than larger humpback populations. The threatened Mexico DPS includes about 2,800 whales, depending on choice of mark-recapture model (Wade 2017). Most humpback whales that feed in California waters originate from the endangered Central America DPS (67.2%), while the remainder originate from the threatened Mexico DPS (Wade 2017).
Figure 8. Humpback whale breeding and feeding grounds showing three DPSs: (4) Hawaii, (5) Mexico and (6) Central America. (Source: Martien 2018 (using data from Wade 2017).)
Humpback Distribution and Importance of West Coast Feeding Grounds
Humpback whales are present year-round off California. They also migrate from Mexico and central America to feed in the summer months in both central California and Southern California’s nutrient-rich waters. As a result, humpback whale behavior strongly correlates with

14
oceanographic conditions and primary productivity. Humpback whales are opportunistic feeders that switch between prey items depending on environmental conditions (Santora et al. 2020; Ryan et al. 2019a). When targeting krill, humpbacks are likely to be farther offshore, and when targeting schooling forage fishes, come nearshore (Calambokidis et al. 2017).
Figure 9. Four of the seven total humpback whale feeding Biologically Important Areas overlaid with all sightings and predicted mean densities of blue whales from habitat-based density (HD) models generated from Southwest Fisheries Science Center ship surveys. Depicted BIAs are (4) Fort Bragg to Point Arena, July-November; (5) Gulf of the Farallones–Monterey Bay, July-November; (6) Morro Bay to Point Sal, April-November; and (7) Santa Barbara Channel–San Miguel, March-September. (Source: Calambokidis et al. 2015 fig. 4.5(c).)
NMFS designated critical habitat for humpback whales that is based in part on the biological important areas identified in Calambokidis et al. (2015) (see Figure 9) (86 Fed. Reg. 21,082 (Apr. 21, 2021)). The critical habitat includes generally contiguous areas along the coast, including a San Francisco and Monterey Bay area, a Central California Coast area, and a Channel Islands, which comprise essential feeding and migratory habitat (id.). High occurrences of krill are associated with canyons between Monterey Bay and Bodega Bay. Anchovy and sardine are more abundant within the Monterey Bay. In Southern California, krill hotspots have been observed off San Nicolas and Santa Barbara Islands, and additionally in association with submarine canyons (id. (citing Santora et al. 2011, 2018)).
Humpback Whale Mortality From Vessel Strikes
Thirteen humpback whales (7 deaths, 1 serious injury, and 5 non-serious injuries) were reported struck by vessels between 2014 and 2018 (Carretta et al. 2020a). These reported
15
collisions vastly underestimate actual strikes because many go unseen and whale carcasses may sink unobserved. Because of the low probability of detection, Rockwood et al. (2017) created a model that calculated encounter risk, strike risk, and mortality estimates for the West Coast. The result was an estimated 22 humpback whale mortalities due to ship strikes annually, including only the period July to November when whales are most likely to be present in the U.S. West Coast EEZ (Rockwood et al. 2017).
The large majority of reported and estimated humpback whale collisions with vessels occur off California. Of the humpback whale collisions reported from 2014 to 2018, 10 of the 13 occurred in California (Carretta et al. 2020a). Applying this proportion to the estimated 22 humpback whale deaths from vessel strike mortalities on the U.S. West Coast (Rockwood et al. 2017) means that 16.9 humpback mortalities occur annually off California (22 deaths *0.77) from July to November.
Updated abundance estimates for Southern California allowed Rockwood and Jahncke (2019) to estimate that mortality from January to April in Southern California alone was 6.5 whales (1.63/month24). When added to the estimated mortality from July to November, this means that the total estimated annual humpback mortality from ship strikes in California alone is 23.4 deaths (16.9 + 6.5). This exceeds the PBR that is based on the California/Oregon/Washington humpback whale stock (16.7 humpback whales) and is not protective of the Central America DPS, which has a far smaller population.
Most of the humpback whale deaths that occur off California are likely to be from the Central America DPS. Wade (2017) predicted a 67.2% movement probability for a whale in California to move to Central America. That means that an estimated 15.7 Central America DPS humpback whales die from vessel strikes off California annually (23.4 deaths * 0.672). Conservatively using the smaller estimate of abundance, this represents 3.7% of the population that is killed by vessel strikes annually (15.7 deaths/431 whales). This is a minimum estimate because it does not include humpback whales killed in central California from January to April and assumes avoidance behavior, per Rockwood et al. (2017). With no avoidance, the mortality is likely to be at least double (Rockwood et al. 2017).
C. Fin Whales
The worldwide population of fin whales has been listed as endangered since the ESA’s enactment in 1973. Taxonomically, all North Pacific fin whales, except of those found in the East China Sea, are recognized as a separate subspecies: Balaenoptera physalus velifera (Archer
24 This per month estimate is higher than what Rockwood et al. (2017) reported for Southern California during July through November, the six summer/fall months: five whales; 1.25/month.

16
et al. 2019, Archer et al. 2013).25 The fin whales in the East China Sea may be a subspecies distinct from the rest of the North Pacific but need more genetic studies (Archer et al. 2019). The range of B. p. velifera includes the Gulf of California, the U.S. West Coast, and British Columbia, Canada into the Gulf of Alaska, along the Aleutians, and in the Bering Sea and Chukchi Sea up to approximately 70o N. In the Western Pacific they are found off Kamchatka in the Okhotosk Sea, and Japan (id.).
Fin Whale Population
Under the MMPA, NMFS recognizes three stocks of fin whales in the North Pacific: (1) the California/Oregon/Washington stock, (2) the Hawaii stock, and (3) the Northeast Pacific stock (Carretta et al. 2020). The best estimate of fin whale abundance in California, Oregon, and Washington waters out to 300 nm is 9,029 (CV=0.12) whales (id.). There is evidence of an increasing trend in fin whale abundance in the California/Oregon/Washington stock between 1991 and 2014, though since 2005 numbers off Central and Southern California have been stable (id.; Nadeem et al. 2016). The minimum population size is 8,127 fin whales, and PBR is 81 whales.
Fin Whale Distribution and Importance of West Coast Feeding Grounds
Fin whales are present off California year-round, with peak numbers in the late summer and early fall (Širović et al. 2013). During the winter, fin whales are sighted inshore and during the spring and summer they appear to move offshore (Falcone and Schorr 2012, 2013). Acoustic data suggest there may be a resident population in southern California (Širović et al. 2015, 2017). The fin whale biologically important areas are shown below, in Figure 10.
Five tagged fin whales in Southern California showed sex-specific behaviors similar to tagged blue whales – a male undertook a circuitous route offshore that did not involve feeding bouts, as were seen when the whales were closer to shore (Irving et al. 2019). This suggested that offshore either the prey was patchier farther or that the male was exhibiting breeding behavior (id.).
25 Within the subspecies, there are two well-supported North Pacific mitogenomic matrilines: Clade A (Gulf of California and Southern California Bight), and Clade C (California, Oregon, Washington, and Gulf of Alaska) (Archer et al. 2013). The lack of nuclear differentiation indicates that these are not evidence of a lack of gene flow, but reflect different historical migrations to the North Pacific, at 1.8 million years ago and 300,000 years ago, respectively (Archer et al. 2019).

17
Figure 10. Predicted fin whale feeding Biologically Important Areas overlaid with all sightings and predicted mean densities of blue whales from habitat-based density (HD) models generated from Southwest Fisheries Science Center ship surveys. (Source: Calambokidis et al. 2015 fig. 4.5.)
Fin Whale Mortality From Vessel Strikes
In a literature review of vessel strikes of large whales, fin whales are often the most commonly struck whale in the records (Halliday 2020). For U.S. West Coast fin whales, vessel strikes are the biggest source of human-caused mortality (Carretta et al. 2020a). Eight fin whales were reported struck by vessels between 2014 and 2018, all resulting in death, seven of which occurred in California (Carretta et al. 2020a). These reported collisions vastly underestimate actual strikes because many go unseen and whale carcasses may sink unobserved. Because of the low probability of detection, Rockwood et al. (2017) created a model that calculated encounter risk, strike risk, and mortality estimates. Total fin whale mortality in the U.S. West Coast EEZ is approximately twice that for blue whales, and 2.4 times humpback whale mortality (Rockwood et al. 2017). The result is an estimated 43 fin whale mortalities due to ship strikes annually, during the summer and fall months (Rockwood et al. 2017).

18
Figure 11. Photo Credit: Alisa Schulman-Janiger. Source: https://channelislands.noaa.gov/management/resource/images/strike.jpg
Fin Whale Recovery Plan
NMFS’s Fin Whale Recovery Plan, published in 2010, concluded that the threat to fin whales from vessel strikes was “unknown but potentially high.” Citing records of fin whale deaths in which vessel strikes were implicated, plus the fact that many vessel strikes go either undetected or unreported, NMFS said that the threat occurs at a medium severity but with a high level of uncertainty (NMFS 2010). Assessing the effectiveness of vessel strike measures and adjusting, as necessary, was a second-level priority in the recovery plan.
IV. Mandatory Regulations Are Needed To Reduce Vessel Strike Mortality of Blue, Humpback, and Fin Whales.
NMFS must impose mandatory measures that will prevent vessels from killing whales. Only this will allow endangered whales to recover. As stated above, vessel collisions are not only impeding the recovery of blue, humpback, and fin whales, but the mortalities and injuries that result from such collisions are also themselves unlawful under the ESA and the MMPA. The science is clear that vessel traffic in whale hotspots increases risks of ship strikes and that

19
slowing those vessels is an effective mitigation measure. Therefore, NMFS must immediately promulgate regulations to drastically reduce or eliminate the risk of vessel strikes to whales.
A. Vessel Strike Mortality Exceeds Blue and Humpback Whale Biological Thresholds.
Mandatory regulations to slow down vessels in areas of high vessel traffic and whale overlap are urgently needed because the estimates of blue and humpback whale mortality exceed PBR, the NMFS-determined human-caused mortality level above which stocks cannot reach optimum sustainable population. The estimates of vessel strike mortality are underestimates because they do not include estimates for vessels transiting between the Santa Barbara and San Francisco regions, and only include year-round estimates for humpback whale in Southern California. Nonetheless, the best estimates are collated from the sections above into the table below.
PBR, U.S. Waters
Estimated Annual Vessel Strike Mortality, West
Coast
Minimum Estimated Annual Vessel Strike Mortality, California
Blue Whale 1.23 whales 18 deaths 12.9626
Humpback Whale 16.7 whales 28.5 deaths 23.427
Fin Whale 81 whales 46 deaths 29.9
These estimates do not account for or anticipate the likely increase in whale vessel strikes due to increasing shipping. The increase in global shipping has concentrated impacts at the entrance to ports such as Los Angeles, Long Beach, and San Francisco. Global shipping has increased rapidly since about 2000 and is projected to continue to grow at a rapid rate because of both a higher volume of materials being shipped and a greater distance over which material is being transported, particularly as globalization has led to the growth of export industries in Asia (Kaplan and Solomon 2016). There was a brief decline in shipping in the second quarter of 2020 due to the pandemic (Ryan et al. 2020). But shipping traffic rebounded with a surge of imports in the second half of the year such that there was an average wait of eight days to enter Southern California ports and 62 ships anchored in San Pedro Bay in February 2021 (Baertlein 2021).
26 See Rockwood et al. (2017). For blue and fin whales, mortality levels above the 90th percentile were confined to waters off California. The area above the 90th percentile (covering ~10% of the study region) contained 74% and 65% of mortality for blue and fin whales, respectively.
27 See the calculations for estimated humpback whale mortality in California at page 15.
20
B. Mandatory Mitigation Measures Have Clear and Quantified Benefits To Whales.
The impacts on whales of vessels coming to California ports can be mitigated through regulation. Studies of past air regulations showed that ships responded – i.e. ship traffic changed depending on the regulation – and that these changes altered the risk of ship strikes to whales (Moore et al. 2018). The science shows that NMFS can intentionally design regulations to slow vessel speed and protect whale hotspots to save whales from vessel strike injuries and deaths.
Further, scientists have quantified the predicted benefits of different mitigation measures in such a way as to show their necessity. Rockwood et al. (2020b) estimated that compared to the years prior to voluntary speed reductions (2012-2014), the lower speeds in 2016-2017 lowered blue whale deaths within the shipping lanes by 11–13% and humpback whale deaths by 9–10% in 2016−2017. If 95% of ships complied with a 10-knot speed limit, twice as many blue whale deaths and three times as many humpback whale deaths would be avoided compared to current adherence (Rockwood et al. 2020b). These predictions mean that NMFS has an obligation to implement regulations to achieve these benefits to whales.
C. NMFS Has Failed to Protect Whales in Response to Past Petitions.
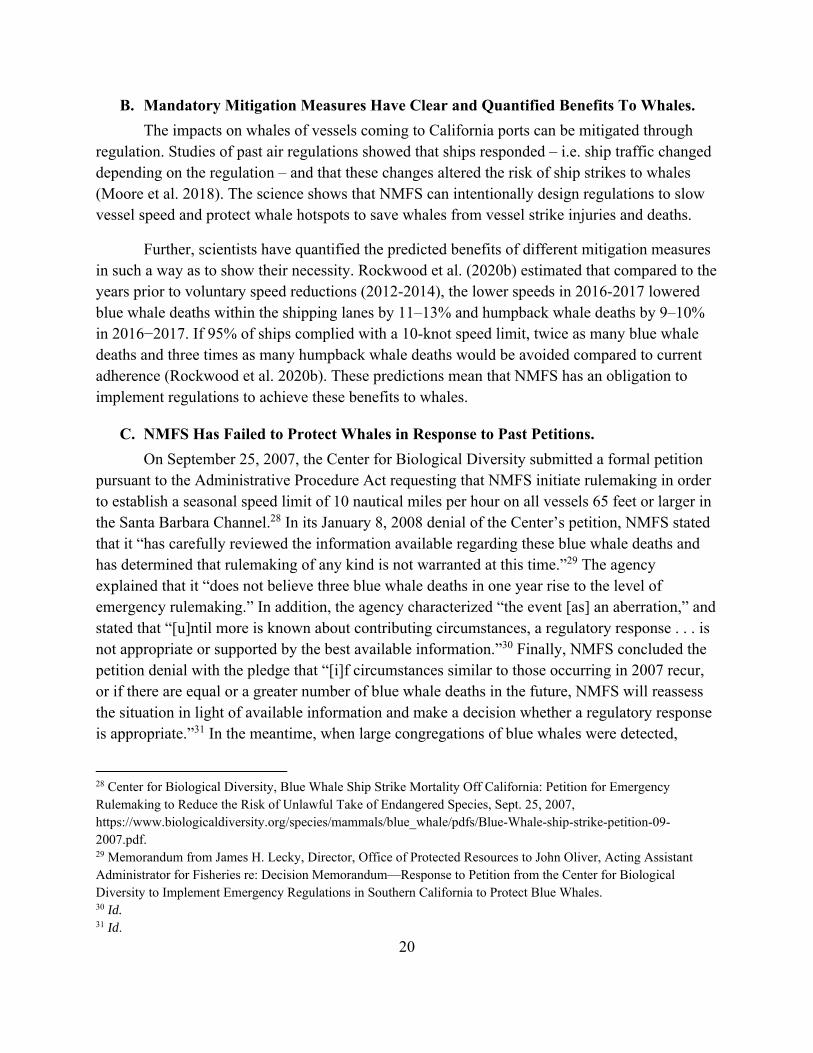
On September 25, 2007, the Center for Biological Diversity submitted a formal petition pursuant to the Administrative Procedure Act requesting that NMFS initiate rulemaking in order to establish a seasonal speed limit of 10 nautical miles per hour on all vessels 65 feet or larger in the Santa Barbara Channel.28 In its January 8, 2008 denial of the Center’s petition, NMFS stated that it “has carefully reviewed the information available regarding these blue whale deaths and has determined that rulemaking of any kind is not warranted at this time.”29 The agency explained that it “does not believe three blue whale deaths in one year rise to the level of emergency rulemaking.” In addition, the agency characterized “the event [as] an aberration,” and stated that “[u]ntil more is known about contributing circumstances, a regulatory response . . . is not appropriate or supported by the best available information.”30 Finally, NMFS concluded the petition denial with the pledge that “[i]f circumstances similar to those occurring in 2007 recur, or if there are equal or a greater number of blue whale deaths in the future, NMFS will reassess the situation in light of available information and make a decision whether a regulatory response is appropriate.”31 In the meantime, when large congregations of blue whales were detected,
28 Center for Biological Diversity, Blue Whale Ship Strike Mortality Off California: Petition for Emergency Rulemaking to Reduce the Risk of Unlawful Take of Endangered Species, Sept. 25, 2007, https://www.biologicaldiversity.org/species/mammals/blue_whale/pdfs/Blue-Whale-ship-strike-petition-09-2007.pdf. 29 Memorandum from James H. Lecky, Director, Office of Protected Resources to John Oliver, Acting Assistant Administrator for Fisheries re: Decision Memorandum—Response to Petition from the Center for Biological Diversity to Implement Emergency Regulations in Southern California to Protect Blue Whales. 30 Id. 31 Id.
21
NMFS would rely on advisories recommending that vessels voluntarily reduce their speed to 10 knots or less.32
By relying solely on observed whale deaths to estimate mortality, the NMFS petition denial ignored the already well-known fact that documented strikes greatly underestimate actual mortality (Laist et al. 2001; Kraus et al. 2005). Since the denial, the best available science has consistently and strongly demonstrated that the 2007 mortality event was, unfortunately, not an aberration, and that vessel speed reductions are necessary to reduce this mortality. Moreover, numerous studies conducted both before and after the petition denial have consistently found that the voluntary ship speed reduction efforts relied upon by NMFS in its petition denial, as well as incentive-based strategies developed subsequent to that denial, are ineffectual (Langpap and Wu 2004; Wiley et al. 2008; Jett and Thapa 2010; Silber et al. 2012; McKenna et al. 2012).
In 2011, the Center for Biological Diversity, in a coalition of environmental groups, formally petitioned NOAA to establish a 10-knot speed limit for large commercial vessels within the national marine sanctuaries off the California coast.33 In 2012 NOAA denied the petition, and said that NOAA may decide to implement other actions including mandatory speed restrictions if voluntary programs do not reduce whale strike occurrences.34 It is past time for NOAA to evaluate its management measures and review recent relevant scientific studies, and promulgate regulations with mandatory speed limits and other measures to reduce whale mortality below biologically relevant thresholds.
For these reasons, it is urgent that NMFS implement the following measures:
Petitioned Action 1: Implement a year-round mandatory 10-knot speed limit in NMFS’s current voluntary vessel speed reduction zones in the San Francisco Bay Region and the Southern California Region for vessels greater than or equal to 40 feet in length.
There is broad agreement in the scientific literature that the overlap of whales and ship traffic increases ship strike risk, and that slowing vessels’ speed can reduce the number of whales killed or injured by vessel strikes (Halliday 2020). There is a positive, linear relationship
32 Id. 33 Petition to establish a 10-knot speed limit for vessel traffic within National Marine Sanctuaries off the California Coast. June 6, 2011. https://www.biologicaldiversity.org/campaigns/ocean_noise/pdfs/Petition_NMS_Ship_Speed_Limits_2011-06-06.pdf. 34 Letter from David M. Kennedy, Assistant Administrator for Ocean Services and Coastal Zone Management, dated March 30, 2012. https://nmschannelislands.blob.core.windows.net/channelislands-prod/media/archive/management/resource/pdf/petitionresponsenoaa2012.pdf

22
between vessel speed and the probability of a whale being struck and a logistic relationship between vessel speed and the probability of a vessel strike killing a whale (id.). For example, a large whale has a 50% probability of lethal strike at 9 knots and 80% at 15.4 knots (Figure 12) (Conn and Silber 2013). Therefore, slowing down vessels in areas that are hotspots for whales holds promise for significantly reducing vessel strike injuries and mortalities.
Figure 12. Probability of a lethal whale strike given strike speed. The dashed line gives predictions from a logistic regression, the solid line gives posterior mean estimates from a Bayesian implementation of probit regression, and the dotted line gives logistic regression estimates reported by Vanderlaan and Taggart (2007). The gray area represents a 95% credible interval from the Bayesian analysis. (Source: Conn and Silber fig. 3).
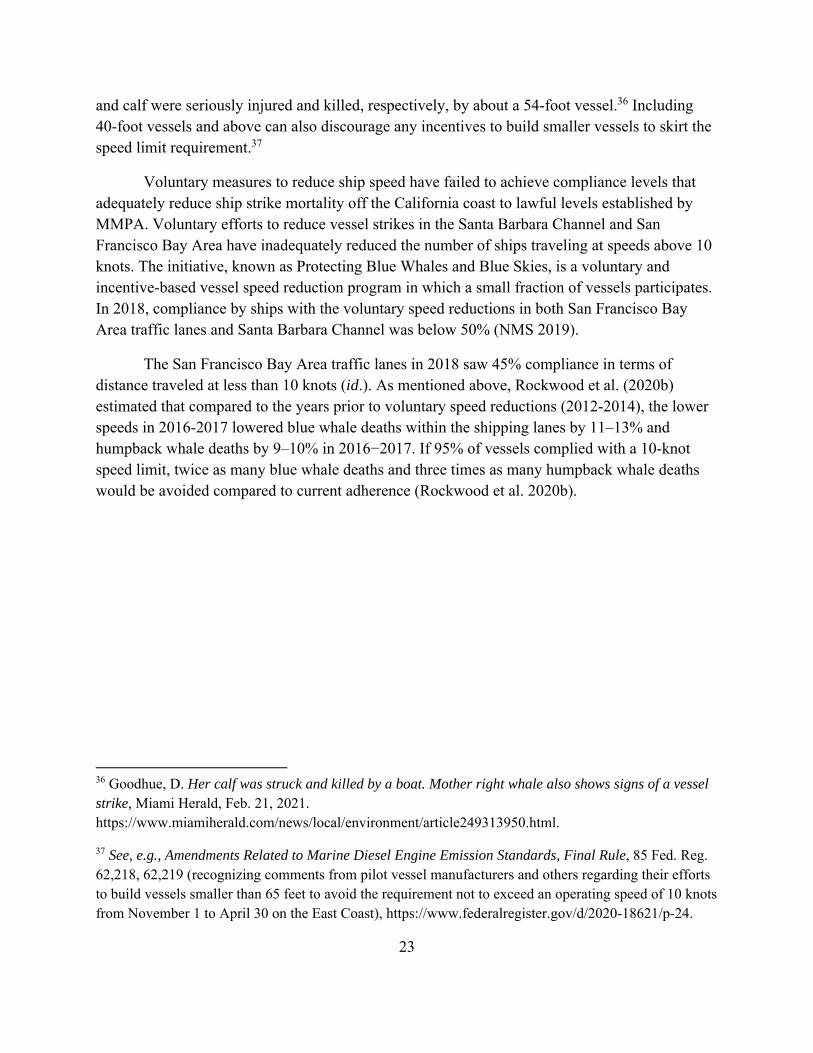
NMFS has implemented seasonal voluntary Vessel Speed Reductions in the designated shipping routes of San Francisco, CA (Figure 13), and in a large area in Southern California (Figure 15). To increase compliance in these zones, NMFS should implement a year-round 10-knot mandatory speed limit for all vessels greater than or equal to 40 feet in length.
It is important to include vessels greater than or equal to 40 feet in length because of examples of whales injured by smaller vessels.35 This has been shown to be empirically true as well; Kelley et al. (2020) used biophysical models to show that vessels of all sizes can produce forces strong enough to cause lethal injury. Recently a critically endangered right whale mom
35 For example, a 12 m vessel killed a humpback. See Jensen and Silber (2003) at p. 26.
23
and calf were seriously injured and killed, respectively, by about a 54-foot vessel.36 Including 40-foot vessels and above can also discourage any incentives to build smaller vessels to skirt the speed limit requirement.37
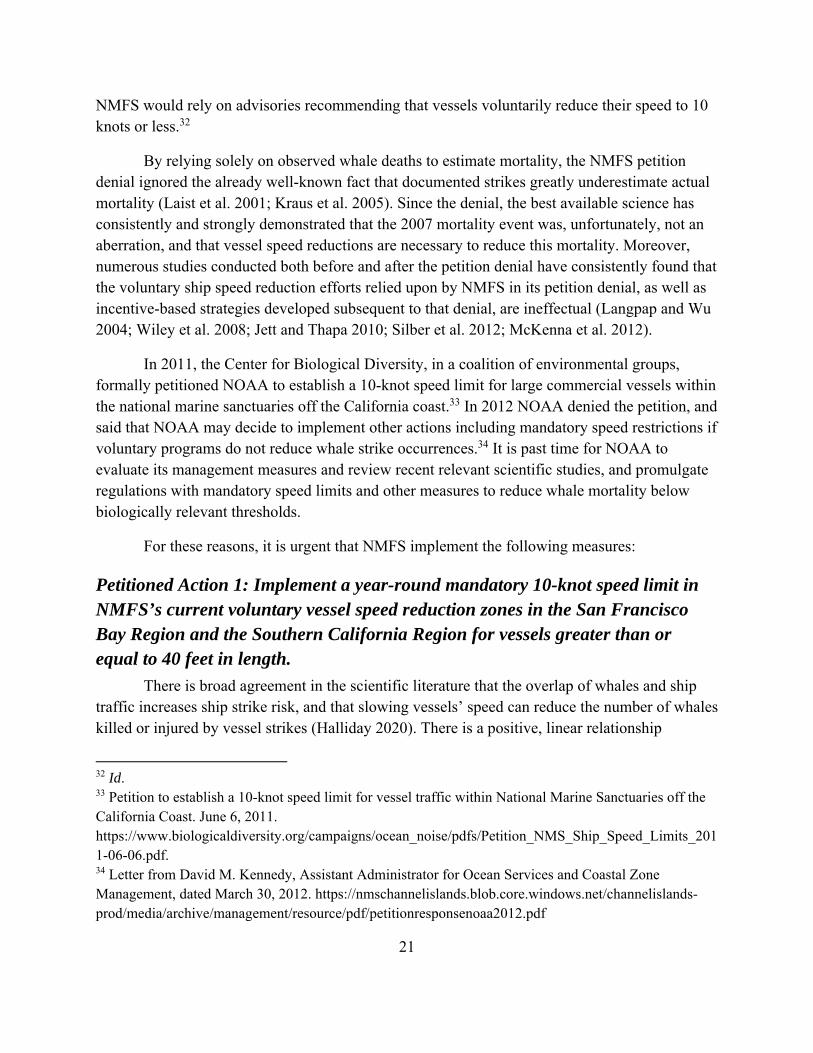
Voluntary measures to reduce ship speed have failed to achieve compliance levels that adequately reduce ship strike mortality off the California coast to lawful levels established by MMPA. Voluntary efforts to reduce vessel strikes in the Santa Barbara Channel and San Francisco Bay Area have inadequately reduced the number of ships traveling at speeds above 10 knots. The initiative, known as Protecting Blue Whales and Blue Skies, is a voluntary and incentive-based vessel speed reduction program in which a small fraction of vessels participates. In 2018, compliance by ships with the voluntary speed reductions in both San Francisco Bay Area traffic lanes and Santa Barbara Channel was below 50% (NMS 2019).
The San Francisco Bay Area traffic lanes in 2018 saw 45% compliance in terms of distance traveled at less than 10 knots (id.). As mentioned above, Rockwood et al. (2020b) estimated that compared to the years prior to voluntary speed reductions (2012-2014), the lower speeds in 2016-2017 lowered blue whale deaths within the shipping lanes by 11–13% and humpback whale deaths by 9–10% in 2016−2017. If 95% of vessels complied with a 10-knot speed limit, twice as many blue whale deaths and three times as many humpback whale deaths would be avoided compared to current adherence (Rockwood et al. 2020b).
36 Goodhue, D. Her calf was struck and killed by a boat. Mother right whale also shows signs of a vessel strike, Miami Herald, Feb. 21, 2021. https://www.miamiherald.com/news/local/environment/article249313950.html.
37 See, e.g., Amendments Related to Marine Diesel Engine Emission Standards, Final Rule, 85 Fed. Reg. 62,218, 62,219 (recognizing comments from pilot vessel manufacturers and others regarding their efforts to build vessels smaller than 65 feet to avoid the requirement not to exceed an operating speed of 10 knots from November 1 to April 30 on the East Coast), https://www.federalregister.gov/d/2020-18621/p-24.
24
Figure 13. San Francisco Bay Region Vessel Speed Reduction Zone in green. (Source: Protecting Blue Whales and Blue Skies, https://www.ourair.org/wp-content/uploads/2020-VSR-Attachment-A.pdf.)
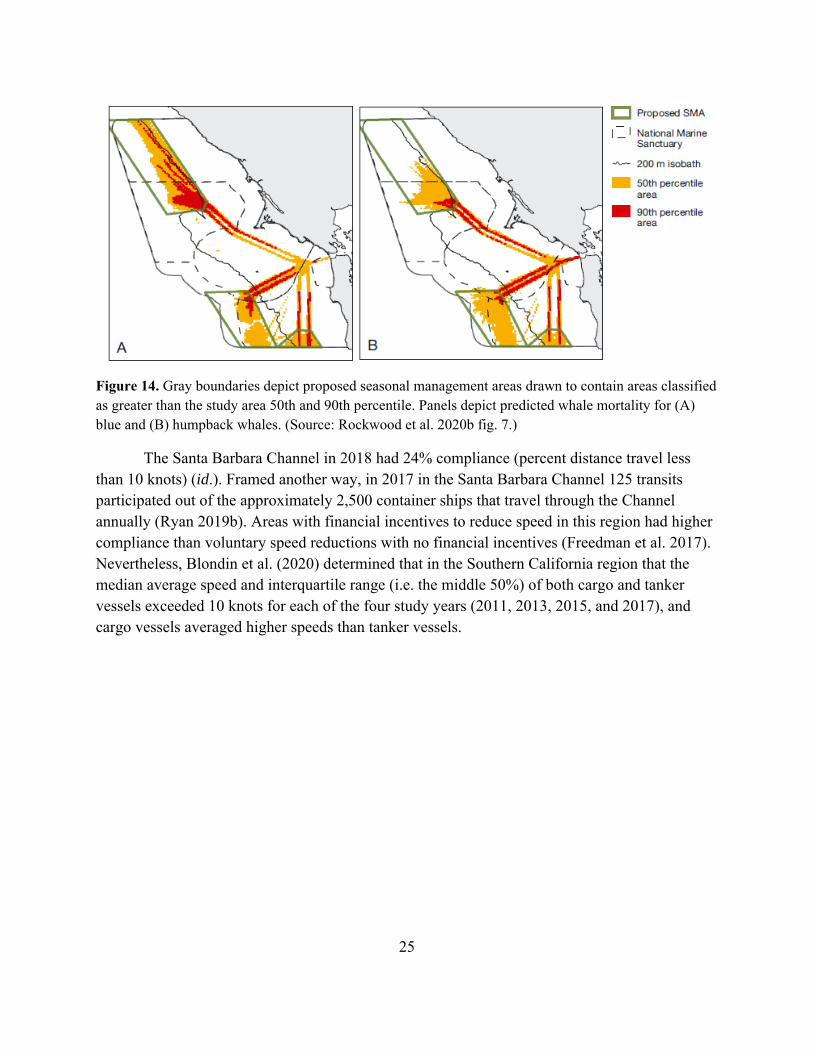
Further, adding a management area with a 10-knot speed limit at the end of the traffic lanes would result in about 5- and 4-fold reductions in blue whale and humpback whale mortality, respectively, relative to current practices (Figure 14) (id.). This recommendation addresses the problem that while risk is highest in the shipping lanes off San Francisco, only a fraction of total estimated mortality occurs in these proportionally small areas (Rockwood et al. 2017). That means conservation efforts exclusively within shipping lanes are insufficient (id.)
While Rockwood et al. (2020b) recommend this as a seasonal management area, the management area should be in place year-round. This is because humpback whales are present off California year-round and the timing of whales’ migration changes according to oceanographic conditions. Moreover, a year-round requirement will generate more awareness of the speed limit and thus likely increase compliance.
25
Figure 14. Gray boundaries depict proposed seasonal management areas drawn to contain areas classified as greater than the study area 50th and 90th percentile. Panels depict predicted whale mortality for (A) blue and (B) humpback whales. (Source: Rockwood et al. 2020b fig. 7.)
The Santa Barbara Channel in 2018 had 24% compliance (percent distance travel less than 10 knots) (id.). Framed another way, in 2017 in the Santa Barbara Channel 125 transits participated out of the approximately 2,500 container ships that travel through the Channel annually (Ryan 2019b). Areas with financial incentives to reduce speed in this region had higher compliance than voluntary speed reductions with no financial incentives (Freedman et al. 2017). Nevertheless, Blondin et al. (2020) determined that in the Southern California region that the median average speed and interquartile range (i.e. the middle 50%) of both cargo and tanker vessels exceeded 10 knots for each of the four study years (2011, 2013, 2015, and 2017), and cargo vessels averaged higher speeds than tanker vessels.

26
Figure 15. Southern California Region Vessel Speed Reduction Zone in green. (Source: Protecting Blue Whales and Blue Skies, https://www.ourair.org/wp-content/uploads/2020-VSR-Attachment-A.pdf.)
It is important that the implementation of mandatory speed reduction in Southern California apply to the entire Vessel Speed Reduction zone, not just the shipping lanes. Blondin et al. (2020) looked at daily risk levels based on blue whale habitat suitability as predicted by Abrahms et al. (2019b) and vessel traffic data from AIS. In general, the study concluded that areas outside the shipping lanes are important to consider when vessels alter their spatial behavior. This was echoed by Freedman et al. (2017) because ships were traveling south of the Channel Islands and not using shipping lanes with the implementation of air quality restrictions.
Voluntary measures in dynamic management areas on the East Coast designed to protect North Atlantic right whales have similarly had insufficient cooperation. A NMFS assessment in 2020 found that “cooperative vessel traffic remains modest” in voluntary dynamic management areas and “fails to approach levels achieved in mandatory” seasonal management areas (NMFS 2020c). The assessment noted that these findings echoed findings of a 2012 report on “modest cooperation that fell short of program goals” for voluntary measures in dynamic management areas (id.).
To encourage compliance at high levels that will significantly reduce whale mortality, NMFS must implement and enforce mandatory 10-knot speed limits for all vessels greater than
27
or equal to 40 feet in length in the San Francisco and Southern California Vessel Speed Restriction zones.
The current incentives for compliance should remain in place and perhaps expand because mandatory limits alone do not ensure effectiveness. As one example, mandatory ship speed limits to protect North Atlantic right whales still had low compliance in parts of the U.S. southeast (NMFS 2020c). Compliance has increased in the presence of law enforcement (Schoeman et al. 2020).
Petitioned Action 2: Establish shipping routes or vessel tracks for all commercial shipping vessels transiting between ports in Southern California and San Francisco region at least 24 nautical miles from shore.
To protect whales from the vessel traffic that transits north to south from the San Francisco region to Southern California or vice-versa, NMFS should establish, in collaboration with other federal agencies and the International Maritime Organization, ship routes or vessel tracks at least 24 nautical miles from shore. NMFS should explore methods to encourage compliance with these vessel tracks, including through agreements with the ports or private companies, to move vessel traffic at least 24 nautical miles from shore.38
Redfern et al. (2020) found that vessel strike risk was highest for blue, humpback, and fin whales in the central region of California when vessel traffic occurred nearshore. If traffic followed an offshore route similar to those used by ships from 2009-2011 (when avoiding California Air Resources Board regulations that applied within 24 nm of shore), mean risk for all three species can be reduced up to 35% (id.).
This result is consistent with Maxwell et al.’s (2013) study that showed that the highest “cumulative utilization and impact” metric to whales from shipping occurred from Southern California to just past the San Francisco Bay region. The scientists determined the distribution and key habitats of whales, then measured the overlap with shipping activity (Maxwell et al. 2013.). The map shows that despite the proximity of national marine sanctuaries and other protections, the impact of shipping on whales from southern California to the San Francisco Bay Area is high.
Moving the ship traffic offshore not only will protect whales that are off central California, but also provide an incidental benefit of directing ship traffic to the western shipping lane approach to San Francisco. Rockwood et al. (2020) recommend only using the western lane in the San Francisco Bay Region, which was the preferred lane when vessel traffic routes were
38 See 16 U.S.C. §1382(e), allowing agreements with federal government, state government, and private individuals to protect areas of importance for marine mammals.

28
offshore through central California. This will protect blue and humpback whale hotspots at the ends of the northern and southern shipping lanes.
Figure 16. Shipping’s cumulative utilization and impact for marine mammals. Solid outer line represents U.S. EEZ, solid inner lines represent National Marine Sanctuaries and dashed lines represent the 200 m depth contour. (Source: Maxwell et al. 2013 Supp. fig. S4.)
Voluntary lanes in the Monterey Bay National Marine Sanctuary exist already. In December of 2000, the International Maritime Organization adopted voluntary routes for vessels 300 gross tons or more to help guide traffic through the Monterey Bay National Marine Sanctuary, a sensitive marine environment, and align traffic with the San Francisco approaches.39 NMFS should extend these vessel tracks farther along the coast and establish that all vessels, not
39 Coast Guard, Notice of Study Results, Port Access Route Study: The Approaches to San Francisco, June 21, 2011, at 9-10, https://www.navcen.uscg.gov/pdf/PARS/ Port_Access_Route_Study_The_Approaches_San_Francisco.pdf.
29
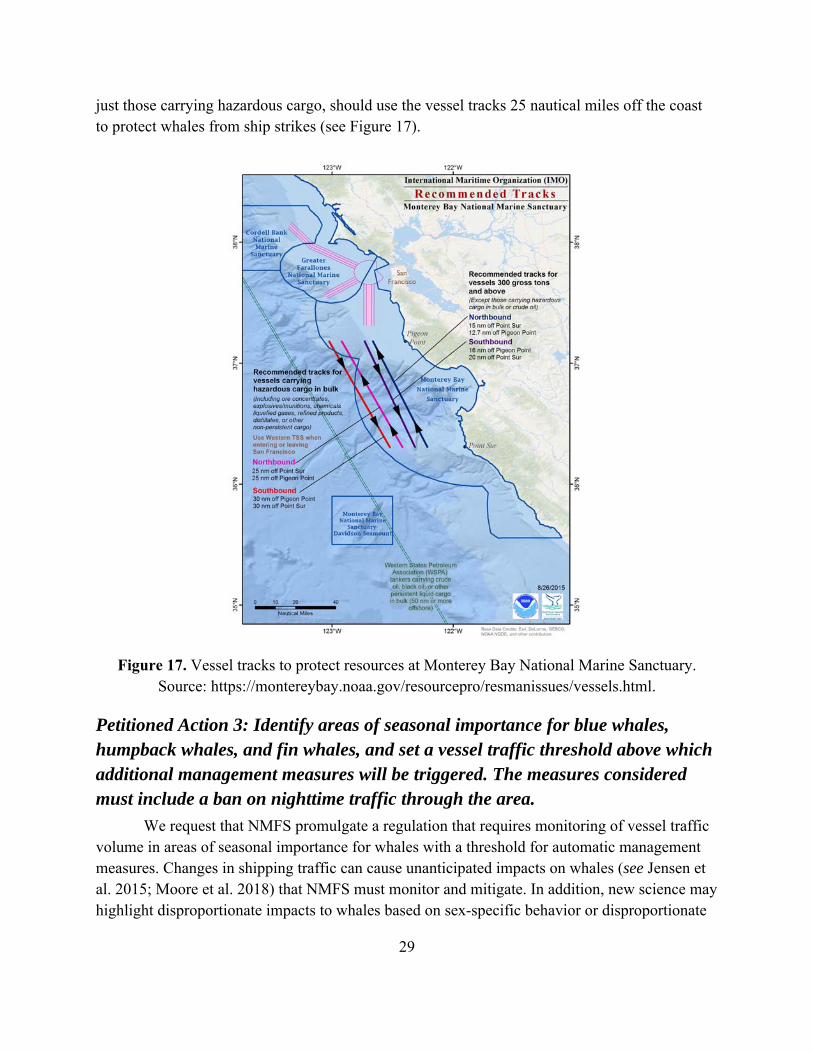
just those carrying hazardous cargo, should use the vessel tracks 25 nautical miles off the coast to protect whales from ship strikes (see Figure 17).
Figure 17. Vessel tracks to protect resources at Monterey Bay National Marine Sanctuary. Source: https://montereybay.noaa.gov/resourcepro/resmanissues/vessels.html.
Petitioned Action 3: Identify areas of seasonal importance for blue whales, humpback whales, and fin whales, and set a vessel traffic threshold above which additional management measures will be triggered. The measures considered must include a ban on nighttime traffic through the area.
We request that NMFS promulgate a regulation that requires monitoring of vessel traffic volume in areas of seasonal importance for whales with a threshold for automatic management measures. Changes in shipping traffic can cause unanticipated impacts on whales (see Jensen et al. 2015; Moore et al. 2018) that NMFS must monitor and mitigate. In addition, new science may highlight disproportionate impacts to whales based on sex-specific behavior or disproportionate
30
risk at night, for example. For this reason, NMFS should implement management measures on a seasonal basis when and where thresholds of vessel traffic have been exceeded.
Vessel traffic should be monitored because Blondin et al. (2020) found that vessel strike risk can change year-to-year based on changes in vessel activity’s spatial pattern. For example, in 2017, when vessel activity was most concentrated, risk was also concentrated, and in 2013, both vessel activity and risk were diffuse (id.). Vessel activity became more concentrated north of the Channel Islands over the study period from 2011 to 2017 (id.).
That said, Blondin et al. also found that patterns of seasonal risk mimicked the temporal probability of whale presence (id.). (Vessel activity was temporally consistent throughout the year.) In 2011 and 2013, the highest risk was during July to October (a “normal” climatic year), while in 2015 and 2017, periods of high risk occurred as early as March and as late as November (id.). In 2015, an El Niño year, a March spike in risk was due to both an increase in whale probability and an increase in vessel activity (id.). This supports the idea that the management measures triggered by vessel traffic can be effective as seasonal management measures rather than year-round measures, and should be tailored to account for year-to-year variation.
New technology makes monitoring the overlap of whales and ships possible and even easy. Technology, specifically “eco-informatics,” can meet the continuing need for evaluation of human risk and animal space (Blondin et al. 2020). Hazen et al. (2017) developed a model to predict blue whale presence based on oceanographic conditions called “WhaleWatch” that can advise resource managers and mariners of blue whale suitable habitat, i.e. areas with ship strike risk. Ultimately it might be possible to use high-resolution maps integrated directly into shipboard navigation systems to avoid whales (Madon et al. 2017). Observers on board commercial cargo ships (Flynn and Calambokidis 2019) and infrared technology (Smith et al. 2020) can help monitor whale presence.
A daily analysis of risk could trigger a risk threshold for additional management (id.). One management measure considered should be a ban on nighttime vessel traffic in the relevant area. Blondin et al. (2020), in a case study of blue whale ship strike risk in the U.S. Southern California Bight, found that AIS data showed that vessel traffic increased from midnight each day through 10 to 11 a.m. each day, followed by a slight decrease through midnight the following day. Because blue whale dive depth studies show a period of surface behavior at night, from about 10 p.m. to 7 a.m. each day, the authors concluded that strike risk is likely highest at that time (id.).
Calambokidis et al. (2019) found distinct diurnal differences in dive and movement behavior for blue, humpback and fin whales along the West Coast. All three species spent a high proportion of their time closer to the surface where they would be more vulnerable to ship strikes at night than in the day (Calambokidis et al. 2019). This was most pronounced for blue whales;
31
vulnerability to ship strikes was twice as high at night compared to the day (id.). Similar observations have been made regarding other blue whale populations (Caruso et al. 2020). Keen et al. (2019) studied fin whale ship strike risk during day and night and found that both increased use of the upper water column and increased ship traffic contribute to elevated ship-strike risk at night.
In addition, visual cues that could help a vessel avoid a whale are not available at night, which means that vessel strikes may be more likely. In San Francisco Bay, Cope et al. (2020) observed no significant differences in cargo or tanker ship presence between day and night but noted that cargo ships traveled significantly faster at night with a median speed greater than 10 knots. This raised the question of whether humpbacks, if present at night, might be more likely to suffer a collision.
V. Suggested Regulatory Language While the Center for Biological Diversity is not required to submit proposed regulatory
language, it does here for the agency’s convenience. The following language is a suggestion of what such language could look like; the Center is not petitioning for this particular language. Rather, as described above in the Notice of Petition on page i, the Center is petitioning NMFS to issue regulations that: (1) implement a year-round mandatory 10-knot speed limit in the current voluntary vessel speed reduction zones in the San Francisco Bay Region and the Southern California Region for vessels greater than or equal to 40 feet in length; and (2) identify areas of seasonal importance for blue whales, humpback whales, and fin whales, and set a vessel traffic threshold above which additional management measures will be triggered.
50 C.F.R. § 224.106 Speed restrictions and dynamic management measures to protect California blue whales, humpback whales, and fin whales.
(a) The following restrictions apply to: All vessels greater than or equal to 40 ft (14.9 m) in overall length and subject to the jurisdiction of the United States, and all other vessels greater than or equal to 40 ft (14.9 m) in overall length entering or departing a port or place subject to the jurisdiction of the United States.
1) Santa Barbara Region: Vessels shall travel at a speed of 10 knots or less over ground when transiting the area between Point Arguello and Dana Point, including the Traffic Separation Schemes in the Santa Barbara Channel and San Pedro Channel. This region is bounded by the following: At the Northwest corner: 34o 34.43’ N, -121o 01.796’ W At the Northeast corner: Point Arguello At the Southwest corner: 33o 18.066’ N, -121o 01.796’ W At the Southeast corner: 33o 18.066’ N, -117o 29.988’ W
32
2) San Francisco Bay Region: Vessels shall travel at a speed of 10 knots or less over ground in the Traffic Separation Schemes and the polygon areas depicted in Figure 14.
(b) The Assistant Administrator will identify areas of seasonal importance for blue whales, humpback whales, and fin whales, monitor shipping AIS data, and set a vessel traffic threshold of marine traffic above which additional management measures will be triggered to reduce the risk of vessel strikes. The Assistant Administrator will consider a ban on nighttime vessel traffic to protect whales.
VI. Conclusion Both the ESA and the MMPA prohibit the take of endangered blue, humpback, and fin
whales, yet NMFS has failed to take regulatory action to reduce or eliminate vessel strike mortality at California ports. Mortality estimates for blue and humpback whales far exceed the PBR level, indicating that vessel strikes alone prevent these stocks from reaching their optimum sustainable populations. For these reasons, NMFS must implement a year-round 10-knot speed limit in NOAA’s current vessel speed reduction zones in the San Francisco Bay Region and the Southern California Region for vessels greater than or equal to 40 feet in length.
Establish shipping routes or vessel tracks for all commercial shipping vessels transiting between ports in Southern California and San Francisco Bay Area at least 24 nautical miles from shore.
Identify areas of seasonal importance for blue whales, humpback whales, and fin whales, and set a vessel traffic threshold above which additional management measures will be triggered. The measures considered must include a ban on nighttime traffic.
NMFS must promptly respond to this petition and initiate the petitioned-for rulemaking within 12 months, which is a reasonable timeframe given the severe and ongoing impact of ship strikes on strategic marine mammal stocks. The failure to respond would constitute a dereliction of the agency’s legal obligations and leave endangered whales at risk of suffering yet more injury and death from vessels.
33
VII. References Abrahms, B., Hazen, E. L., Aikens, E. O., Savoca, M. S., Goldbogen, J. A., Bograd, S. J., Jacox, M.G., Irvine, L.M., Palacios, D.M. & Mate, B. R. 2019a. Memory and resource tracking drive blue whale migrations. Proceedings of the National Academy of Sciences, 116(12), 5582-5587.
Abrahms, B., Welch, H., Brodie, S., Jacox, M.G., Becker, E.A., Bograd, S.J., Irvine, L.M., Palacios, D.M., Mate, B.R. and Hazen, E.L., 2019b. Dynamic ensemble models to predict distributions and anthropogenic risk exposure for highly mobile species. Diversity and Distributions, 25(8), pp.1182-1193.
Archer, F.I., Brownell Jr., R.L., Hancock-Hanser, B.L., Morin, P.A., Robertson, K.M., Sherman, K.K., Calambokidis, J., Urbán R, J., Rosel, P.E., Mizroch, S.A. and Panigada, S., 2019. Revision of fin whale Balaenoptera physalus (Linnaeus, 1758) subspecies using genetics. Journal of Mammalogy, 100(5), pp.1653-1670.
Archer, F.I., P.A. Morin, B.L. Hancock-Hanser, K.M. Robertson, M.S. Leslie, M. Berube, S. Panigada, and B.L. Taylor. 2013. Mitogenomic phylogenetics of fin whales (Balaenoptera physalus spp.): genetic evidence for revision of subspecies. PLOS ONE 8(5): e63396. doi:10.1371/journal.pone.0063396.
Baertlein, L., 2021. Some Containerships Sent North as Port of Los Angeles Hits Capacity. MarineLink, Feb. 17, 2021. https://www.marinelink.com/news/containerships-sent-north-port-los-485375 (last accessed Feb. 19, 2021).
Blondin, H., Abrahms, B., Crowder, L.B. and Hazen, E.L., 2020. Combining high temporal resolution whale distribution and vessel tracking data improves estimates of ship strike risk. Biological Conservation, 250, p.108757.
Burtenshaw, J. C., Oleson, E. M., Hildebrand, J. A., McDonald, M. A., Andrew, R. K., Howe, B. M., and Mercer, J. A. (2004). “Acoustic and satellite remote sensing of blue whale seasonality and habitat in the Northeast Pacific,” Deep Sea Res., Part II 51(10-11), 967–986.
Calambokidis, J., Fahlbusch, J.A., Szesciorka, A.R., Southall, B.L., Cade, D.E., Friedlaender, A.S. and Goldbogen, J.A., 2019. Differential vulnerability to ship strikes between day and night for blue, fin, and humpback whales based on dive and movement data from medium duration archival tags. Frontiers in Marine Science, 6, p.543.
Calambokidis, J., J. Barlow, K. Flynn, E. Dobson, and G. H. Steiger. 2017. Update on abundance, trends, and migrations of humpback whales along the US West Coast. International Whaling Commission Paper SC/A17/NP/13. 17 p.
Calambokidis, J., G.H. Steiger, C. Curtice, J. Harrison, M.C. Ferguson, E. Becker, M. DeAngelis and S.M. Van Parijs. 2015. Biologically important areas for selected cetaceans within U.S. waters – West Coast region. Aquatic Mammals 41:39-53.
34
Calambokidis, J., J. Barlow, J.K.B. Ford, T.E. Chandler, and A.B. Douglas. 2009. Insights into the population structure of blue whales in the Eastern North Pacific from recent sightings and photographic identification. Marine Mammal Science 25:816-832.
Calambokidis, J., G.S. Schorr, G.H. Steiger, J. Francis, M. Bakhtiari, G. Marshal, E.M. Oleson, D. Gendron and K. Robertson. 2007. Insights into the underwater diving, feeding, and calling behavior of blue whales from a suction-cup-attached video-imaging tag (CRITTERCAM). Marine Technology Society Journal 41:19-29.
Campbell, G.S., Thomas, L., Whitaker, K., Douglas, A.B., Calambokidis, J. and Hildebrand, J.A., 2015. Inter-annual and seasonal trends in cetacean distribution, density and abundance off southern California. Deep Sea Research Part II: Topical Studies in Oceanography, 112, pp.143-157.
Carretta, James V., Blair Delean, Van Helker, Marcia M. Muto, Justin Greenman, Kristin Wilkinson, Dan Lawson, Justin Viezbicke, and Jason Jannot. 2020a. Sources of Human-Related Injury and Mortality for U.S. Pacific West Coast Marine Mammal Stock Assessments, 2014-2018, U.S. Department of Commerce, NOAA Technical Memorandum NMFS-SWFSC631.
Carretta, James V., Karin. A. Forney, Erin M. Oleson, David W. Weller, Aimee R. Lang, Jason Baker, Marcia M. Muto, Brad Hanson, Anthony J. Orr, Harriet Huber, Mark S. Lowry, Jay Barlow, Jeffrey E. Moore, Deanna Lynch, Lilian Carswell, and Robert L. Brownell Jr. 2020b. U.S. Pacific Marine Mammal Stock Assessments: 2019, U.S. Department of Commerce, NOAA Technical Memorandum NMFS-SWFSC-629.
Caruso, F., Hickmott, L., Warren, J.D., Segre, P., Chiang, G., Bahamonde, P., ESPAÑOL‐JIMÉNEZ, S., Li, S. and Bocconcelli, A., 2020. Diel differences in blue whale (Balaenoptera musculus) dive behavior increase nighttime risk of ship strikes in northern Chilean Patagonia. Integrative Zoology.
Conn, P., Silber, G., 2013. Vessel speed restrictions reduce risk of collision-related mortality for North Atlantic right whales. Ecoshpere 4 (4), 1–15.
Cope, S., Hines, E., Bland, R., Davis, J.D., Tougher, B. and Zetterlind, V., 2020. Application of a new shore-based vessel traffic monitoring system within San Francisco Bay. Frontiers in Marine Science, 7, p.86.
Croll, D.A., Kudela, R. and Tershy, B.R., 2006. Ecosystem impact of the decline of large whales in the North Pacific. Whales, whaling and ocean ecosystems, pp.202-214.
Falcone, E. A. & Schorr, G. S., 2013. Distribution and demographics of marine mammals in SOCAL through photoindentification, genetics, and satellite telemetry: A summary of surveys conducted 1 July 2012 - 30 June 2013. p. 35 (Naval Postgraduate School, Monterey, CA).
Falcone, E. A. & Schorr, G. S., 2012. Distribution and demographics of marine mammals in SOCAL through photo-identification, genetics, and satellite telemetry: A summary of surveys conducted 1 July 2011–15 June 2012. p. 38 (Naval Postgraduate School, Monterey, CA).

35
Fiedler, P., S. Reilly, R. Hewitt, D. Demer, V. Philbrick, S. Smith, W. Armstrong, D. Croll, B. Tershy and M. B. 1998. Blue whale habitat and prey in the Channel Islands. Deep Sea Research Part II-Topical Studies in Oceanography 45:1781-1801.
Flynn, K.R. and Calambokidis, J., 2019. Lessons from placing an observer on commercial cargo ships off the US West coast: utility as an observation platform and insight into ship strike vulnerability. Frontiers in Marine Science, 6, p.501.
Freedman R., Herron, S., Byrd, M., Birney, K., Morten, J., Shafritz, B., Caldow, C., and Hastings, S. 2017. The effectiveness of incentivized and non-incentivized vessel speed reduction programs: Case study in the Santa Barbara channel. Ocean and Coastal Management 148: 31–39. https ://doi.org/10.1016/j.ocecoaman.2017.07.013.
Goldbogen, J.A. and Madsen, P.T., 2021. The largest of August Krogh animals: Physiology and biomechanics of the blue whale revisited. Comparative Biochemistry and Physiology Part A: Molecular & Integrative Physiology, p.110894.
Halliday, W.D. and Ferguson, S., 2020. Literature Review of Ship Strike Risk to Whales. http://www.arcticnoise.ca/uploads/4/6/5/5/46551507/wcsc_literature_review_of_ship_strike_risks_to_whales_2020-02-28.pdf (last accessed Feb. 6, 2021).
Haver, S.M., Rand, Z., Hatch, L.T., Lipski, D., Dziak, R.P., Gedamke, J., Haxel, J., Heppell, S.A., Jahncke, J., McKenna, M.F. and Mellinger, D.K., 2020. Seasonal trends and primary contributors to the low-frequency soundscape of the Cordell Bank National Marine Sanctuary. The Journal of the Acoustical Society of America, 148(2), pp.845-858.
Hazen, E.L., Palacios, D.M., Forney, K.A., Howell, E.A., Becker, E., Hoover, A.L., Irvine, L., DeAngelis, M., Bograd, S.J., Mate, B.R. and Bailey, H., 2017. WhaleWatch: a dynamic management tool for predicting blue whale density in the California Current. Journal of Applied Ecology, 54(5), pp.1415-1428.
Irvine, L.M., Palacios, D.M., Lagerquist, B.A. and Mate, B.R., 2019. Scales of blue and fin whale feeding behavior off California, USA, with implications for prey patchiness. Frontiers in Ecology and Evolution, 7, p.338.
Jensen, C.M., Hines, E., Holzman, B.A., Moore, T.J., Jahncke, J. and Redfern, J.V., 2015. Spatial and temporal variability in shipping traffic off San Francisco, California. Coastal Management, 43(6), pp.575-588.
Jensen, A.S. and G.K. Silber. 2003. Large Whale Ship Strike Database. U.S. Department of Commerce, NOAA Technical Memorandum. NMFS-OPR- , 37 pp. https://tethys.pnnl.gov/sites/default/files/publications/Jensen_Silber_2003.pdf.
Kaplan, M.B. & Solomon, S., 2016. A coming boom in commercial shipping? The potential for rapid growth of noise from commercial ships by 2030. Marine Policy, 73: 119–121.
36
Keen, E.M., Scales, K.L., Rone, B.K., Hazen, E.L., Falcone, E.A. and Schorr, G.S., 2019. Night and day: diel differences in ship strike risk for fin whales (Balaenoptera physalus) in the California current system. Frontiers in Marine Science, 6, p.730.
Kelley, D.E., Vlasic, J.P. and Brillant, S.W., 2020. Assessing the lethality of ship strikes on whales using simple biophysical models. Marine Mammal Science.
Kraus, SD, et al. (2005). North Atlantic right whales in crisis. Science 309:561-562.
Laist, D., Knowlton, A., Pendleton, D., 2014. Effectiveness of mandatory vessel speed limits for protecting North Atlantic right whales. Endanger. Species Res. 23 (2).
Laist, D.W., A.R. Knowlton, J.G. Mead, A.S. Collet, M. Pod. 2001. Collisions between ships and whales. Marine Mammal Science 17:35-75.
Langpap, C., and J. Wu. 2004. Voluntary conservation of endangered species: When does no regulatory assurance mean no conservation? Journal of Environmental Economics and Management 47:435-457.
Madon, B., David, R., Pendleton, L., Garello, R. and Fablet, R., 2017, November. Strike-alert: Towards real-time, high resolution navigational software for whale avoidance. In 2017 IEEE Conference on Technologies for Sustainability (SusTech) (pp. 1-5). IEEE.
Martien, Karen K., Aimée R. Lang, Barbara L. Taylor, Patricia E. Rosel, Samantha E. Simmons, Erin M. Oleson, Peter L. Boveng, and M. Bradley Hanson. 2019. The DIP Delineation Handbook: A Guide to Using Multiple Lines of Evidence to Delineate Demographically Independent Populations of Marine Mammals. U.S. Department of Commerce, NOAA Technical Memorandum NMFS-SWFSC-622.
Martien, K.K. 2018. Potential Population Level Impacts of West Coast Large Whale Entanglements. Marine Mammal Commission Annual Meeting.
Mate, B.R., B.A. Lagerquist and J. Calambokidis. 1999. Movements of North Pacific blue whales during the feeding season off southern California and their southern fall migration. Marine Mammal Science 15:12.
Maxwell, S.M., Hazen, E.L., Bograd, S.J., Halpern, B.S., Breed, G.A., Nickel, B., Teutschel, N.M., Crowder, L.B., Benson, S., Dutton, P.H. and Bailey, H., 2013. Cumulative human impacts on marine predators. Nature communications, 4(1), pp.1-9.
McKenna, M.F., Calambokidis, J., Oleson, E.M., Laist, D.W. and Goldbogen, J.A., 2015. Simultaneous tracking of blue whales and large ships demonstrates limited behavioral responses for avoiding collision. Endangered Species Research, 27(3), pp.219-232.
McKenna, M.F., S.L. Katz, C. Condit, and S. Walbridge. 2012. Response of commercial ships to a voluntary speed reduction measure: Are voluntary strategies adequate for mitigating ship-strike risk? Coastal Management 40:6, 634-650.

37
Moore, T.J., Redfern, J.V., Carver, M., Hastings, S., Adams, J.D. and Silber, G.K., 2018. Exploring ship traffic variability off California. Ocean & Coastal Management, 163, pp.515-527.
NMFS, 2020a. Recovery Plan for the Blue Whale (Balaenoptera musculus) - First Revision. National Marine Fisheries Service, Office of Protected Resources, Silver Spring, MD.
NMFS, 2020b. Blue Whale (Balaenoptera musculus) 5-Year Review: Summary and Evaluation. National Marine Fisheries Service, Office of Protected Resources, Silver Spring, MD.
NMFS, 2020c. North Atlantic Right Whale (Eubalaena glacialis) Vessel Speed Rule Assessment. National Marine Fisheries Service, Office of Protected Resources, Silver Spring, MD.
NMFS, 2017. 2016 West Coast Entanglement Summary. in N.W.C. Region ed., https://media.fisheries.noaa.gov/dam-migration/wcr_2016_whale_entanglements_3-26-17_final.pdf.
NMFS, 2010. Recovery plan for the fin whale (Balaenoptera physalus). National Marine Fisheries Service, Silver Spring, MD. 121 pp.
Nadeem, K., Moore, J.E., Zhang, Y. and Chipman, H., 2016. Integrating population dynamics models and distance sampling data: a spatial hierarchical state‐space approach. Ecology, 97(7), pp.1735-1745.
National Marine Sanctuaries, 2020. Office of National Marine Sanctuaries Coordination Report. Pacific Fishery Management Council, Agenda Item C.1.a. March 2020.
National Marine Sanctuaries, 2019. National Marine Sanctuaries Coordination Report. Pacific Fishery Management Council, Agenda Item D.1.a. March 2019.
National Marine Sanctuaries, 2018. National Marine Sanctuaries Coordination Report. Pacific Fishery Management Council, Agenda Item C.3.a. March 2018.
Oestreich, W.K., Fahlbusch, J.A., Cade, D.E., Calambokidis, J., Margolina, T., Joseph, J., Friedlaender, A.S., McKenna, M.F., Stimpert, A.K., Southall, B.L. and Goldbogen, J.A., 2020. Animal-Borne Metrics Enable Acoustic Detection of Blue Whale Migration. Current Biology, 30(23), pp.4773-4779.
Pirotta, E., Mangel, M., Costa, D.P., Goldbogen, J., Harwood, J., Hin, V., Irvine, L.M., Mate, B.R., McHuron, E.A., Palacios, D.M. and Schwarz, L.K., 2019. Anthropogenic disturbance in a changing environment: modelling lifetime reproductive success to predict the consequences of multiple stressors on a migratory population. Oikos, 128(9), pp.1340-1357.
Redfern, J.V., Becker, E.A. and Moore, T.J., 2020. Effects of variability in ship traffic and whale distributions on the risk of ships striking whales. Frontiers in Marine Science, 6, p.793.

38
Redfern, J. V., M. Mckenna, T. Moore, J. Calambokidis, M. L. Deangelis, E. A. Becker, J. Barlow, K. Forney, P. Fiedler and S. Chivers, 2013. Assessing the risk of ships striking large whales in Marine Spatial Planning. Conservation Biology 27: 292-302.
Rockwood, R.C., Elliott, M.L., Saenz, B., Nur, N. and Jahncke, J., 2020a. Modeling predator and prey hotspots: Management implications of baleen whale co-occurrence with krill in Central California. PloS one, 15(7), p.e0235603.
Rockwood, R.C., Adams, J., Silber, G. and Jahncke, J., 2020b. Estimating effectiveness of speed reduction measures for decreasing whale-strike mortality in a high-risk region. Endangered Species Research, 43, pp.145-166.
Rockwood, C and Jahncke J. 2019. Management recommendations to reduce deadly whale strikes off California. Unpublished report for the National Oceanic and Atmospheric Administration, the United States Coast Guard, and the Maritime Industry. 16 p.
Rockwood, R. C., J. Calambokidis and J. Jahncke, 2017. High mortality of blue, humpback and fin whales from modeling of vessel collisions on the U.S. West Coast suggests population impacts and insufficient protection. PLOS ONE 12(8): e0183052.
Roman, J. and McCarthy, J.J., 2010. The whale pump: marine mammals enhance primary productivity in a coastal basin. PloS one, 5(10), p.e13255.
Ryan, J.P., Joseph, J.E., Hatch, L.T., DeVogelaere, A., Peavey Reeves, L.E., Southall, B.L., Baumann-Pickering, S., Stimpert, A.K., 2020. Oceanic Quieting During a Global Pandemic. 179th ASA Meeting, Acoustics Virtually Everywhere, December 10, 2020.
Ryan, J.P., Cline, D.E., Joseph, J.E., Margolina, T., Santora, J.A., Kudela, R.M., Chavez, F.P., Pennington, J.T., Wahl, C., Michisaki, R. and Benoit-Bird, K., 2019a. Humpback whale song occurrence reflects ecosystem variability in feeding and migratory habitat of the northeast Pacific. PloS one, 14(9), p.e0222456.
Ryan, J. 2019b. Whales are facing a big, deadly threat along West Coast: Massive ships. Washington Post, Mar. 18, 2019. https://www.washingtonpost.com/national/health-science/whales-are-facing-a-big-deadly-threat-along-west-coast-massive-container-ships/2019/03/15/cebee6e8-3eb0-11e9-a0d3-1210e58a94cf_story.html (last accessed Feb. 21, 2021).
Santora, J. A., Mantua, N. J., Schroeder, I. D., Field, J. C., Hazen, E. L., Bograd, S. J., Sydeman, W.J., Wells, B.K., Calambokidis, J., Saez, L. & Lawson, D., 2020. Habitat compression and ecosystem shifts as potential links between marine heatwave and record whale entanglements. Nature Communications, 11(1), 1-12.
Santora, J. A., Sydeman, W. J., Schroeder, I. D., Wells, B. K., & Field, J. C., 2011. Mesoscale structure and oceanographic determinants of krill hotspots in the California Current: Implications for trophic transfer and conservation. Progress in Oceanography, 91(4), 397-409.
39
Scales, K.L., Schorr, G.S., Hazen, E.L., Bograd, S.J., Miller, P.I., Andrews, R.D., Zerbini, A.N. and Falcone, E.A., 2017. Should I stay or should I go? Modelling year‐round habitat suitability and drivers of residency for fin whales in the California current. Diversity and Distributions, 23(10), pp.1204-1215.
Schall, E., Di Iorio, L., Berchok, C., Filún, D., Bedriñana‐Romano, L., Buchan, S.J., Van Opzeeland, I., Sears, R. and Hucke‐Gaete, R., 2019. Visual and passive acoustic observations of blue whale trios from two distinct populations. Mar Mam Sci.; 1–10. https://doi.org/10.1111/mms. 12643.
Schoeman, R.P., Patterson-Abrolat, C. and Plön, S., 2020. A global review of vessel collisions with marine animals. Frontiers in Marine Science, 7, p.292.
Schorr, G. S., Falcone, E. A., Calambokidis, J. & Andrews, R. D., 2010. Satellite tagging of fin whales off California and Washington in 2010 to identify movement patterns, habitat use, and possible stock boundaries. p. 9 (Cascadia Research Collective, Olympia, WA).
Silber, G.K., J.D. Adams, and S. Bettridge. 2012. Vessel operator response to a voluntary measure for reducing collisions with whales. Endangered Species Research 17:245-254.
Silber, G. K., J. Slutsky and S. Bettridge, 2010. Hydrodynamics of a ship/whale collision. Journal of Experimental Marine Biology and Ecology 391: 10-19.
Širović, A., Oleson, E.M., Buccowich, J., Rice, A. and Bayless, A.R., 2017. Fin whale song variability in southern California and the Gulf of California. Scientific reports, 7(1), pp.1-11.
Širović, A., Rice, A., Chou, E., Hildebrand, J.A., Wiggins, S.M. and Roch, M.A., 2015. Seven years of blue and fin whale call abundance in the Southern California Bight. Endangered Species Research, 28(1), pp.61-76.
Smith, H.R., Zitterbart, D.P., Norris, T.F., Flau, M., Ferguson, E.L., Jones, C.G., Boebel, O. and Moulton, V.D., 2020. A field comparison of marine mammal detections via visual, acoustic, and infrared (IR) imaging methods offshore Atlantic Canada. Marine pollution bulletin, 154, p.111026.
Southall, B. L., Hatch, L. Scholik-Schlomer, A., Bergmann, T., Jasny, M., Metcalf, K., Weilgart, L., Wright, A. J., and Perera, M.E. (2018). Reducing Noise from Large Commercial Ships: Progress and Partnerships. Proceedings of the Marine Safety and Security Council - Coast Guard Journal of Safety and Security at Sea, 1, 58-65.
Steiger, G.H., J. Calambokidis, P. Wade, K. Audley, and C.S. Baker, 2017. Migratory destinations of humpback whales that feed off the U.S. West Coast: Implications for management under the newly recognized Distinct Population Units, 22nd Biennial Conference on the Biology of Marine Mammals, Oct. 22-27, 2017, Halifax, Nova Scotia, Canada (poster presentation).
40
Szesciorka, A.R., Ballance, L.T., Širović, A., Rice, A., Ohman, M.D., Hildebrand, J.A. and Franks, P.J., 2020. Timing is everything: Drivers of interannual variability in blue whale migration. Scientific reports, 10(1), pp.1-9.
Vanderlaan, A. and C. T. Taggart (2007). Vessel collisions with whales: the probability of lethal injury based on vessel speed. Marine Mammal Science 23(1): 144-156.
Visalli, M. 2020. Global Fishing Watch Data Reveals Ships Speed through Endangered Whale Habitat, Sept. 18, 2020, https://globalfishingwatch.org/research/endangered-whale-habitat/ (last visited Mar. 21, 2021).
Wade, P. R., 2017. Estimates of abundance and migratory destination for North Pacific humpback whales in both summer feeding areas and winter mating and calving areas – revision of estimates in SC/66b/IA21, International Whaling Commission Paper, SC/A17/NP10.
Wiley, D.N. J.C. Moller, R.M. Pace, and C. Carlson. 2008. Effectiveness of voluntary conservation agreements: Case study of endangered whales and commercial whale watching. Conservation Biology 22:450-457; Jett, J.S. and B. Thapa. 2010. Manatee zone compliance among boaters in Florida. Coastal Management. 38:165-185.