Shelf-slope exchanges by frontal variability in a steep submarine canyon
22
Shelf-slope exchanges by frontal variability in a steep submarine canyon A. Jordi * , A. Orfila, G. Basterretxea, J. Tintore ´ IMEDEA, Instituto Mediterra ´ neo de Estudios Avanzados (CSIC-UIB), C/ Miquel Marque ´s, 21, 07190 Esporles, Spain Received 9 October 2002; received in revised form 25 March 2003; accepted 29 July 2004 Available online 13 May 2005 Abstract We study the dynamics of a frontal jet and its short-timescale variability generated by the interaction with a submar- ine canyon using a limited-area fine-resolution three-dimensional coastal ocean model. The focus is on the steep and narrow Palamo ´ s Canyon located off the northeast Catalan coast (northwestern Mediterranean) that is characterized by the presence of a permanent along-slope density-driven current. First, we analyse the stationary circulation induced with different jet locations and show a deflection of the flow in the vicinity of the canyon. Significant vertical motions develop as a result of these current adjustments; the general pattern such as downwelling upstream of the canyon and upwelling downstream are always observed. Second, we analyse the circulation and exchanges associated with an onshore displacement of the jet; thus produces a meander propagating with the flow that interacts with the canyon. We find that the resulting three-dimensional patterns present an oscillation characterized by an intense downwelling followed by upwelling. As a result of this interaction, shelf-slope exchanges and vertical motions are enhanced in the area compared with the passing of a meander above a shelf that is not indented by a submarine canyon. The resulting horizontal transports through the Palamo ´ s canyon represent up to 10% of the along-shore fluxes on the shelf and appear to be sufficient to exchange the shelf water of the Gulf of Lions and Catalan sea in 2.5 years. Considering the number of canyons existing in the area, we can estimate an exchange of all the shelf waters in less than 3 months. Ó 2005 Elsevier Ltd. All rights reserved. Keywords: Submarine canyon; Shelf-slope exchange; Numerical coastal ocean model; Frontal variability; Northwestern Mediterra- nean 1. Introduction Submarine canyons are characteristic features of many continental shelves that may appear as short inden- tations of the shelf edge or expand all the way to shore. Physical and, consequently, chemical, biological and 0079-6611/$ - see front matter Ó 2005 Elsevier Ltd. All rights reserved. doi:10.1016/j.pocean.2004.07.009 * Corresponding author. Fax: +34 971611 761. E-mail address: [email protected] (A. Jordi). Progress in Oceanography 66 (2005) 120–141 www.elsevier.com/locate/pocean Progress in Oceanography
Transcript of Shelf-slope exchanges by frontal variability in a steep submarine canyon

Progress in Oceanography 66 (2005) 120–141
www.elsevier.com/locate/pocean
Progress inOceanography
Shelf-slope exchanges by frontal variability in asteep submarine canyon
A. Jordi *, A. Orfila, G. Basterretxea, J. Tintore
IMEDEA, Instituto Mediterraneo de Estudios Avanzados (CSIC-UIB), C/ Miquel Marques, 21, 07190 Esporles, Spain
Received 9 October 2002; received in revised form 25 March 2003; accepted 29 July 2004
Available online 13 May 2005
Abstract
We study the dynamics of a frontal jet and its short-timescale variability generated by the interaction with a submar-
ine canyon using a limited-area fine-resolution three-dimensional coastal ocean model. The focus is on the steep and
narrow Palamos Canyon located off the northeast Catalan coast (northwestern Mediterranean) that is characterized
by the presence of a permanent along-slope density-driven current. First, we analyse the stationary circulation induced
with different jet locations and show a deflection of the flow in the vicinity of the canyon. Significant vertical motions
develop as a result of these current adjustments; the general pattern such as downwelling upstream of the canyon and
upwelling downstream are always observed. Second, we analyse the circulation and exchanges associated with an
onshore displacement of the jet; thus produces a meander propagating with the flow that interacts with the canyon.
We find that the resulting three-dimensional patterns present an oscillation characterized by an intense downwelling
followed by upwelling. As a result of this interaction, shelf-slope exchanges and vertical motions are enhanced in the
area compared with the passing of a meander above a shelf that is not indented by a submarine canyon. The resulting
horizontal transports through the Palamos canyon represent up to 10% of the along-shore fluxes on the shelf and
appear to be sufficient to exchange the shelf water of the Gulf of Lions and Catalan sea in 2.5 years. Considering
the number of canyons existing in the area, we can estimate an exchange of all the shelf waters in less than 3 months.
� 2005 Elsevier Ltd. All rights reserved.
Keywords: Submarine canyon; Shelf-slope exchange; Numerical coastal ocean model; Frontal variability; Northwestern Mediterra-
nean
1. Introduction
Submarine canyons are characteristic features of many continental shelves that may appear as short inden-
tations of the shelf edge or expand all the way to shore. Physical and, consequently, chemical, biological and
0079-6611/$ - see front matter � 2005 Elsevier Ltd. All rights reserved.
doi:10.1016/j.pocean.2004.07.009
* Corresponding author. Fax: +34 971611 761.
E-mail address: [email protected] (A. Jordi).

A. Jordi et al. / Progress in Oceanography 66 (2005) 120–141 121
geological processes are modified in their vicinity. Several studies suggest that canyons affect the spatial pat-
tern of regional upwelling and enhance the shelf-slope exchanges of water andmaterial (Freeland &Denman,
1982; Hickey, 1997; Inman, Nordstrom, & Flick, 1976). As a result, submarine canyons have an important
effect on the entire food chain of marine ecosystem, from phytoplankton to marine mammals (Hickey, 1995).
They also play an important role in the ultimate fate of sediment in suspension over the continental shelf,since they act as a sediment trap (Granata, Vidondo, Duarte, Satta, & Garcia, 1999; Monaco, Durrieu de
Madron, Rodacovitch, Huessner, & Carbone, 1999).
Available observational data show that the effect of submarine canyons on the regional circulation is
inherently three-dimensional. The most conspicuous feature of the flow patterns is the cyclonic/anticy-
clonic circulation related to left/right coastal bounded flows observed within some canyons and over
their edges. Cyclonic vorticity, associated with shelf water sinking into the canyon, occurs near the shelf
edge in the upstream side whereas anticyclonic vorticity occurs in the downstream side (Hickey, 1995).
However, the mean flow at some distance above the canyon (�50–100 m) is generally little affected andfollows the curvature of the regional isobaths in a quasi-geostrophic motion. Regional circulation at-
tempts to follow the topography as it bends around the canyon at the shelf edge. How successful it fol-
lows the topography depends on stratification, vertical and horizontal structure of the incident flow,
canyon width and Rossby number of the incident flow (Hickey, 1995). The higher the Rossby number,
the less important is ageostrophic motion and the less the flow over the canyon turns to follow canyon
isobaths (Hickey, 1997).
Theoretical and numerical studies have been carried out to understand the circulation in the vicinity of a
submarine canyon. These demonstrate that canyons affect the spatial pattern of regional upwelling, partic-ularly, at the downstream side of a canyon (Peffley & O�Brien, 1976). Freeland and Denman (1982) sug-
gested that the upwelling is mainly driven by non-linear canyon–current interaction. Klink (1988)
discussed the effects of different canyons widths and suggested that only narrow canyons have strong effects
on circulation. Klink (1989) considered the geostrophic adjustment of a stratified coastal current in the
presence of a submarine canyon using an analytical model and studied the relevance of the different scales
in this adjustment processes.
More recently three-dimensional numerical models have identified the essential physical mechanisms at
play in the adjustment processes that occur between the flow and bottom topography. Klink (1996) indi-cated along-shore flow direction with respect to the coast governs the shape of vertical and cross-slope mo-
tions, while water column stratification determines their magnitude. Allen (1996) demonstrated that the
effect of nonlinearity is to advect the flow pattern downstream as well as to enhance cyclonic vorticity with-
in the canyon. The wind is also responsible for a remarkable modification of the circulation in the vicinity
of the canyon and leads to an increase of cross-shore transports and vertical motions (Ardhuin, Pinot, &
Tintore, 1999). Allen (2000) suggested that variations in the geometry of the canyon produce different tem-
poral scales of vertical motions. Modelling studies with real canyon topography have been developed by
Ardhuin et al. (1999), Skliris, Goffart, Hecq, and Djenidi (2001), Skliris, Hecq, and Djenidi (2002), who alsoincluded irregular near-shore topography. These studies suggested that the complexity and asymmetry of
real bathymetry should be taken into account.
The interaction of coastal currents with submarine canyons has also been addressed in laboratory exper-
iments. Perenne, Verron, Renouard, Boyer, and Zhang (1997) investigated the characteristics of a baro-
tropic oscillatory along-shelf motion at subtidal and tidal frequencies in the vicinity of a canyon. They
demonstrated that the asymmetry of the flow for right to left and left to right (facing to the deep ocean)
oscillation phases leads to the generation of a mean flow along the canyon walls, which exits the canyon
region on the right. A mean upwelling at all levels is also associated with this phenomenon for a subinertialand superinertial oscillatory flow of a linearly stratified fluid interacting with a canyon (Boyer, Zhang, &
Perenne, 2000). Codiga, Renouard, and Fincham (1999) simulated coastal-trapped waves incident on a can-
yon in a continuously stratified ocean. They found that along-shore wave propagation remains largely

122 A. Jordi et al. / Progress in Oceanography 66 (2005) 120–141
unmodified and loss of energy by scattering is weak, although a limited range of parameter space was ex-
plored with respect to the canyon geometry.
It is however also important to understand the interaction between density fronts and submarine can-
yons, both considering the variability in the front�s cross-shelf position and the relevance of mesoscale
frontal instabilities that has been suggested by different authors. Shelf-slope fronts exist over many con-tinental shelf regions and in situ and satellite data have shown the formation of meanders and the exis-
tence of energetic mesoscale instabilities (La Violette, Tintore, & Font, 1990; Onken, 1992; Spall, 1995;
Tintore, Wang, & La Violette, 1990; Wang, 1993). These instabilities in the vicinity of submarine canyons
may induce short-timescale variability that can give rise to significant vertical transports. Alvarez, Tin-
tore, and Sabates (1996) studied the short-timescale response of a shelf break baroclinic jet to the pres-
ence of a downstream canyon from data of three intensive surveys. They concluded that the influence of
short-timescale variability in the position of the front–current system is very relevant to the dynamical
and biological aspects of a coastal region when a canyon is present. However, none of the existingnumerical studies has yet addressed the problem of the interaction of such variability with submarine
canyons.
Our objective is to understand the interaction between a submarine canyon and a density front and more
specifically the interaction between short-timescale variability in the position of the front upstream and
downstream of the canyon to estimate the associated exchanges between the coast and the open ocean.
To be able to compare model results with observations we have centered this more general numerical study
in the Palamos Canyon, one of the canyons that indent the shelf of northeastern edge of Catalan coast
(northwestern Mediterranean).The paper is organized as follows. A description of the canyon topography and mean flow character-
istics is given in Section 2. In Section 3 we provide a brief description of the numerical model and its
parameters. The results obtained are presented in Sections 4–6: we initially focus on the stationary flow
associated with the forcing by a constant along-slope current prescribed upstream of the canyon. Next,
we investigate the transient adjustment associated with an onshore displacement and the associated
meandering. In Section 6 we present the results obtained for the shelf-slope exchange induced by the
interaction of frontal variability with the submarine canyon. In Section 7 we discuss the results presented
and compare model results with observations and previous modelling studies. Conclusions are presentedin Section 8.
2. The Palamos Canyon and regional oceanographic background
The continental margin in the Gulf of Lions and Catalan Sea is indented by a series of canyons that
cut across about 60% of the shelf area (Fig. 1). One of the major canyons is the Palamos Canyon, lo-
cated off the Catalan coast. The canyon has a triangular shape with a mouth approximately 35 km wideand intrudes approximately 30 km onto the shelf (200 m isobath). At the head of the canyon the shelf is
only 5 km wide while the canyon mouth reaches almost 2000 m, with the 1500 m contour located only
10 km from coast. The Palamos canyon is therefore a very steep topographic feature (Alvarez et al.,
1996).
The regional oceanography is dominated by a shelf-slope density front, oriented southward in a direc-
tion almost perpendicular to the canyon axis. It belongs to the cyclonic along-slope current, called the Lig-
uro-Provenco-Catalan or Northern Current, which forms the northern branch of circulation in the
northwestern Mediterranean (Millot, 1999). The current is strongly baroclinic, separating low-salinity shelfwaters with continental influence from denser open-sea waters (Font, Salat, & Tintore, 1988). Its core is
typically confined to the upper 300 m of the water column, has a width of 30 km and a mean surface veloc-
ity of approximately 30 cm/s (Garcıa-Ladona, Castellon, Font, & Tintore, 1996). Outside the core the

0o 1oE 2oE 3oE 4oE 5oE 6oE40oN
41oN
42oN
43oN
44oN
3oE 12' 24' 36' 48'
24'
36'
48'
42oN
12'
Barcelona
Tarragona
Montpellier
Marseille
Gulf of Lions
PalamósCanyon
500200
1000 5001500 50
020
0050
025
00
500
2000
500
2000
Palamós
Roses
100
200
600
1000
200
600
1400
1000
1400
500500
Fig. 1. Bathymetry of the northwestern Mediterranean and magnified view in the area of Palamos Canyon.
A. Jordi et al. / Progress in Oceanography 66 (2005) 120–141 123
background flow is a few centimeters per second. Stratification largely depends on the season, reaching its
highest value in summer. Tides are negligible.
Over the shelf the circulation is weak and variable (Maso & Tintore, 1991), mostly driven by the slope
current instabilities developing at the onshore edge of the current. The circulation patterns can be observed
on satellite images of sea surface temperature since the advection of a tongue of surface fresh and cold con-tinental waters originating from the Rhone River in the north represents an excellent tracer (La Violette
et al., 1990). The synoptic variability in the Gulf of Lions and Catalan continental margin is characterized
by fluctuations of 2–4 and 7–10 day period (Durrieu de Madron, Radakovitch, Heussner, Loye-Pilot, &
Monaco, 1999; Flexas, Durrieu de Madron, Garcia, Canals, & Arnau, 2002; Puig, Palanques, Guillen, &
Garcıa-Ladona, 2000). Millot (1985) and Flexas et al. (2002) explain the 7–10 days period current fluctu-
ation as a propagating topographic wave, but no studies have yet explained the 2–4 days period.
The Palamos Canyon is therefore an ideal place to study the interaction of a baroclinic jet trapped at the
shelf break and an abrupt topographic canyon. Several hydrographic cruises have been carried out in thearea to investigate the role of the canyon in modifying the slope circulation. In particular, Alvarez et al.
(1996) showed significant cross-shore displacements of the current axis, shifting from 10 to 30 km from
the coast on a timescale of 10 days. From March to November 2001, observational data were obtained
from moored instruments and hydrographic surveys in the context of the CANYONS project aimed at
understanding the internal dynamics, fluxes, and biodiversity originating in the canyon system (Palanques
et al., this issue).

124 A. Jordi et al. / Progress in Oceanography 66 (2005) 120–141
3. Numerical model
The model is a three-dimensional free-surface coastal ocean model formulated in a constant z coordi-
nate. A detailed description of the model can be found in Wang (1982), Wang (1985), and Wang (1997).
In essence, the governing equations are written in finite-difference form on an Arakawa C grid. The schemeis leapfrog in time, centered in space (except for salinity and temperature equations where a flux corrected
transport scheme is used). It uses mode-split in the vertical direction and a semi-implicit scheme in the hor-
izontal direction.
The model domain (Fig. 2) is a rectangular box, 90 km in the across-shore (x) direction and 110 km in
the along-shore (y) direction. The Catalan coast is rotated 27� anticlockwise, so that the Palamos Canyon
axis is along the model�s x-axis. Horizontal resolution in the model is set to 1 km, in order to adequately
represent the canyon topography. In the vertical we use 120 levels, each 20 m thick. The Coriolis parameter
is assumed constant (f = 9.7 · 10�5 s�1). Time steps are 1 s for the external mode and 30 s for the internalmode.
A free-slip boundary condition and zero normal momentum flux are imposed at the coast. A quadratic
law is used for bottom friction with a drag coefficient set to 3 · 10�3, and bottom vertical velocity is set to
zero. We use the upstream boundary to model the observed inflow and a normal radiation condition at
downstream and offshore boundaries, which allows disturbances to propagate out of the computational do-
main (Marchesiello, McWilliams, & Shchepetkin, 2001). Nevertheless, open boundaries are placed far en-
ough from the area of interest with smoothed topography to avoid contamination by spurious boundary
effects.The horizontal eddy coefficient is constant (10 m2 s�1). The vertical eddy coefficients are computed from
an embedded mixed layer model using Mellor-Yamada level 2 turbulence closure (Chen, Horrigan, &
0 20 40 60 800
10
20
30
40
50
60
70
80
90
100
Across-shore distance (km)
Alo
ngsh
ore
dist
ance
(km
)
100
200
500
1000
1500
2000
Fig. 2. Representation of bottom topography in the model domain. The dashed line encloses a region for which results are displayed.
The grey line encloses the canyon area used for computing shelf-slope exchanges.

A. Jordi et al. / Progress in Oceanography 66 (2005) 120–141 125
Wang, 1988). The model allows vertical both viscosity and diffusivity to be as small as 0.1 cm2/s. When the
gradient Richardson number exceeds a critical value (0.23), turbulent mixing is suppressed by the density
stratification.
The initial density field (in rt units) is imposed in the entire model domain to simulate the observed shelf-
slope density front. It is modelled by the following expressions (Ardhuin et al., 1999)
r ¼ r0 �Dr0
21� tanh
x� x0L0
� �� �exp � z
h0
� �; ð1Þ
where r0 is the homogeneous background density (r0 = 26.3), Dr0 is the across-front density difference
(Dr0 = 0.8), x0 is the offshore jet location (it takes different values), L0 is the scale of the front width
(L0 = 6.4 km), and h0 is the scale for the front change with depth (h0 = 65 m), which controls stratification.
The values between brackets are used in all the simulations described and are tuned to reproduce the char-
acteristics of the flow measured during the CANYONS project. The geostrophic current associated with the
density field is computed before the first time step with reference to the bottom at 2000 m without taking
into account the bottom topography. A barotropic component of 3 cm s�1 is added to the geostrophic cur-
rent to include a weak along-slope flow at depth. Density and velocity are maintained at the upstreamboundary during the simulations.
4. Steady circulation
To study the effects of the canyon on the steady circulation, we initialize the model with the density field
described by expression (1) and the associated geostrophic flow, without considering any wind forcing. We
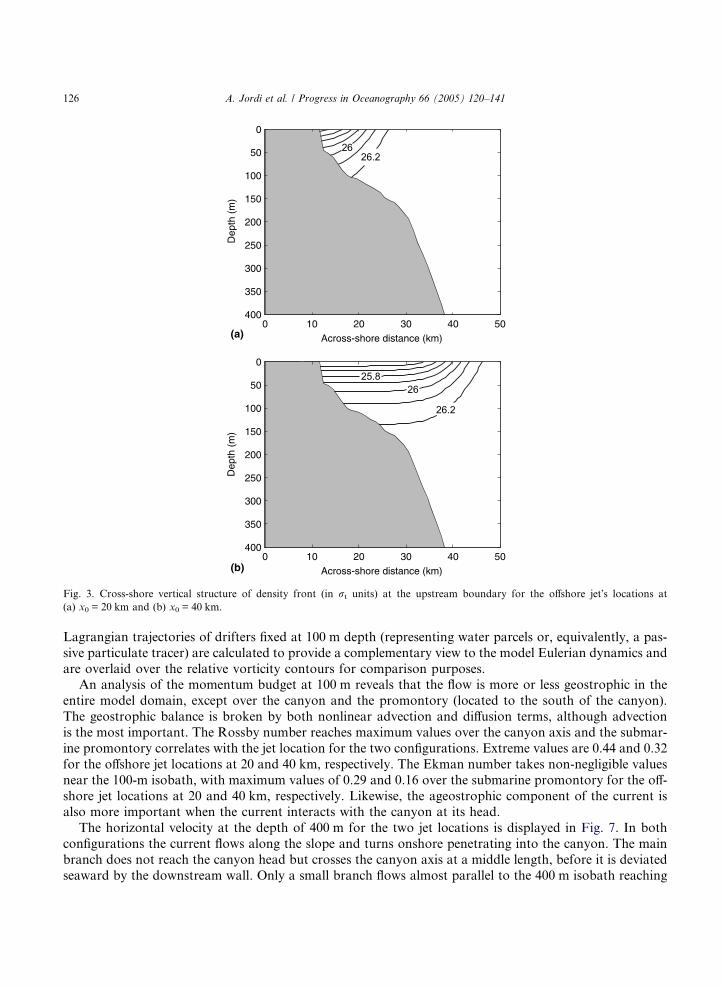
use two flow configurations with different offshore jet locations (Fig. 3) on the basis of the observationsdescribed by Alvarez et al. (1996): a configuration where the along-slope flow interacts with the head of
the canyon (x0 = 20 km), and another where the jet interacts with the mouth of the canyon (x0 = 40 km).
Note that there is no stratification offshore. These fields are maintained constant at the upstream boundary
and represent the only forcing in the system. All simulations are run up to 50 days to ensure that the cir-
culation reaches the steady state. Figs. 4–8 show the steady circulation with the offshore jet location at (a)
x0 = 20 km and (b) x0 = 40 km.
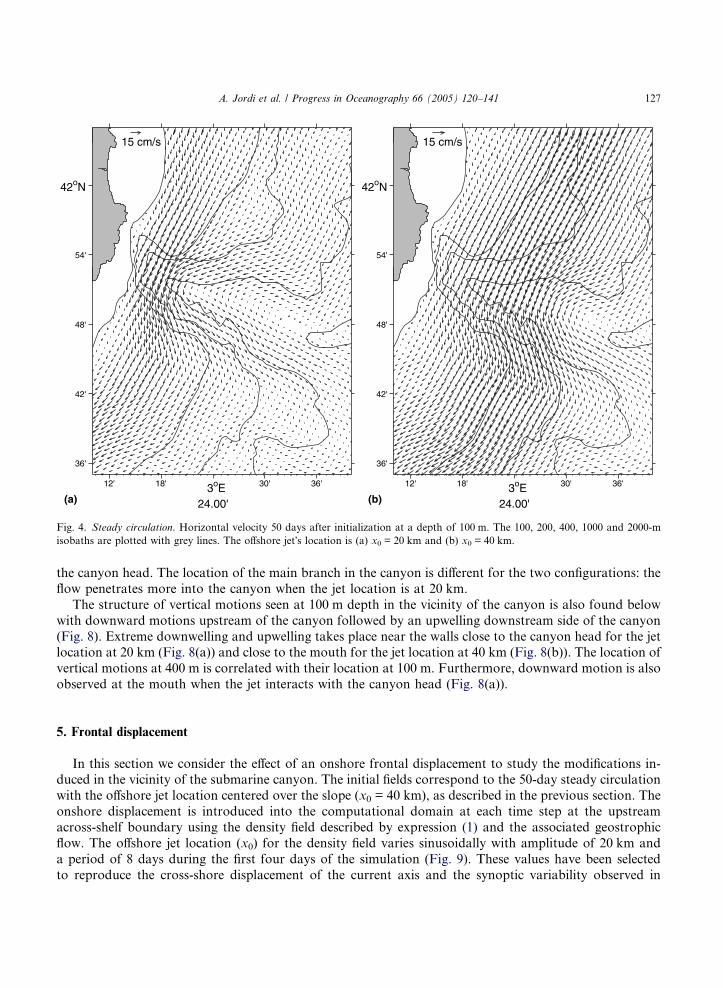
In the upper 200 m the jet is thinner and its velocity is greater when it interacts with the canyon head
(Fig. 4(a)) compared to when it interacts with the canyon mouth (Fig. 4(b)), although the flow is perturbedfollowing the same pattern in the vicinity of the canyon for the two locations of the jet. The interaction of
the jet with the canyon leads to an acceleration of the flow. Near the coast the flow is slightly deflected off-
shore, although there is a larger deflection downstream of the canyon. In the deeper part of the domain the
flow tends to follow isobaths, leading to an onshore transport over the upstream rim and offshore over the
downstream rim of the canyon. Further to the south a shoreward current veering is also seen.
Associated with the location where the jet interacts with the canyon, vertical motions develop. In both
configurations, the motion is downward upstream of the canyon and upward on the downstream edge of
the canyon (Fig. 5). A less intense downwelling further to the south of the canyon is also observable relatedto the shoreward current veering. This effect can be attributed to down-flow current adjustments or bottom
topography (a submarine promontory is located just to the south of the canyon). Equally to the horizontal
currents, vertical velocities in the vicinity of the canyon are larger when the interaction takes place near the
canyon head.
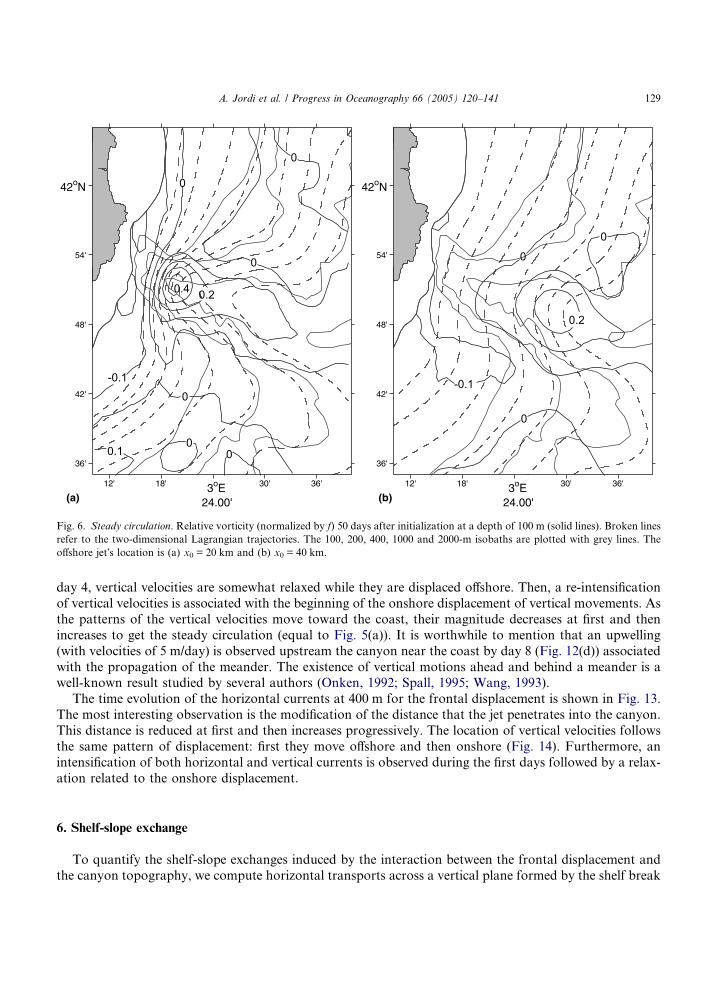
Fig. 6 shows the relative vorticity normalized by the planetary vorticity and Lagrangian trajectories at a
depth of 100 m. The meandering of the horizontal current over the canyon produces a maximum of cyclo-
nic relative vorticity, which is correlated with the place where the jet interacts with the canyon. Extreme
values are 0.46 and 0.27 for the offshore jet location at 20 and 40 km, respectively. Two-dimensional
0 10 20 30 40 50
0
50
100
150
200
250
300
350
400
Across-shore distance (km)
Dep
th(m
)
0 10 20 30 40 50
0
50
100
150
200
250
300
350
400
Across-shore distance (km)
Dep
th(m
)
(a)
(b)
Fig. 3. Cross-shore vertical structure of density front (in rt units) at the upstream boundary for the offshore jet�s locations at
(a) x0 = 20 km and (b) x0 = 40 km.
126 A. Jordi et al. / Progress in Oceanography 66 (2005) 120–141
Lagrangian trajectories of drifters fixed at 100 m depth (representing water parcels or, equivalently, a pas-
sive particulate tracer) are calculated to provide a complementary view to the model Eulerian dynamics and
are overlaid over the relative vorticity contours for comparison purposes.An analysis of the momentum budget at 100 m reveals that the flow is more or less geostrophic in the
entire model domain, except over the canyon and the promontory (located to the south of the canyon).
The geostrophic balance is broken by both nonlinear advection and diffusion terms, although advection
is the most important. The Rossby number reaches maximum values over the canyon axis and the submar-
ine promontory correlates with the jet location for the two configurations. Extreme values are 0.44 and 0.32
for the offshore jet locations at 20 and 40 km, respectively. The Ekman number takes non-negligible values
near the 100-m isobath, with maximum values of 0.29 and 0.16 over the submarine promontory for the off-
shore jet locations at 20 and 40 km, respectively. Likewise, the ageostrophic component of the current isalso more important when the current interacts with the canyon at its head.
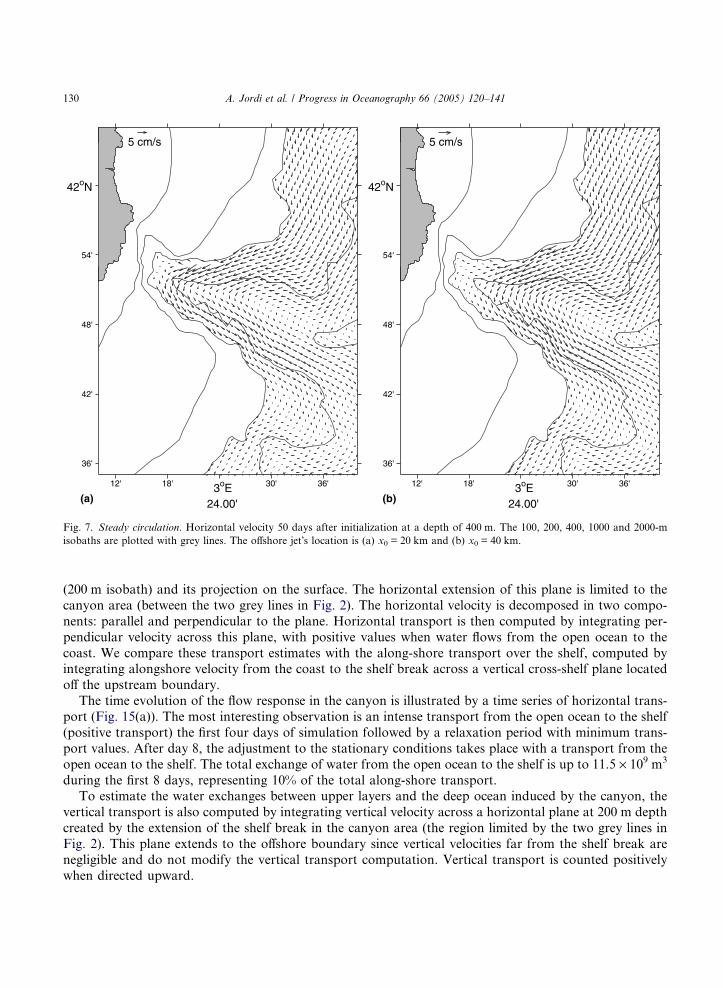
The horizontal velocity at the depth of 400 m for the two jet locations is displayed in Fig. 7. In both
configurations the current flows along the slope and turns onshore penetrating into the canyon. The main
branch does not reach the canyon head but crosses the canyon axis at a middle length, before it is deviated
seaward by the downstream wall. Only a small branch flows almost parallel to the 400 m isobath reaching
15 cm/s
(a) (b)
12' 18' 3oE24.00'
30' 36'
36'
42'
48'
54'
42oN
15 cm/s
12' 18' 3oE24.00'
30' 36'
36'
42'
48'
54'
42oN
Fig. 4. Steady circulation. Horizontal velocity 50 days after initialization at a depth of 100 m. The 100, 200, 400, 1000 and 2000-m
isobaths are plotted with grey lines. The offshore jet�s location is (a) x0 = 20 km and (b) x0 = 40 km.
A. Jordi et al. / Progress in Oceanography 66 (2005) 120–141 127
the canyon head. The location of the main branch in the canyon is different for the two configurations: the
flow penetrates more into the canyon when the jet location is at 20 km.
The structure of vertical motions seen at 100 m depth in the vicinity of the canyon is also found below
with downward motions upstream of the canyon followed by an upwelling downstream side of the canyon
(Fig. 8). Extreme downwelling and upwelling takes place near the walls close to the canyon head for the jetlocation at 20 km (Fig. 8(a)) and close to the mouth for the jet location at 40 km (Fig. 8(b)). The location of
vertical motions at 400 m is correlated with their location at 100 m. Furthermore, downward motion is also
observed at the mouth when the jet interacts with the canyon head (Fig. 8(a)).
5. Frontal displacement
In this section we consider the effect of an onshore frontal displacement to study the modifications in-duced in the vicinity of the submarine canyon. The initial fields correspond to the 50-day steady circulation
with the offshore jet location centered over the slope (x0 = 40 km), as described in the previous section. The
onshore displacement is introduced into the computational domain at each time step at the upstream
across-shelf boundary using the density field described by expression (1) and the associated geostrophic
flow. The offshore jet location (x0) for the density field varies sinusoidally with amplitude of 20 km and
a period of 8 days during the first four days of the simulation (Fig. 9). These values have been selected
to reproduce the cross-shore displacement of the current axis and the synoptic variability observed in

(a) (b)
12' 18' 3oE24.00'
30' 36'
36'
42'
48'
54'
42oN
12' 18' 3oE24.00'
30' 36'
36'
42'
48'
54'
42oN
Fig. 5. Steady circulation. Vertical velocity 50 days after initialization at a depth of 100 m. The units are meters/day. The 100, 200, 400,
1000 and 2000-m isobaths are plotted with grey lines. The offshore jet�s location is (a) x0 = 20 km and (b) x0 = 40 km.
128 A. Jordi et al. / Progress in Oceanography 66 (2005) 120–141
the area. After the first four days of simulation, the jet location remains constant at 20 km until the sim-
ulation ends at day 20 in order to analyse the readjustment of the circulation.
The time evolution of the surface density field for the frontal displacement is shown in Fig. 10. The on-
shore displacement of the front generates a meander with a wavelength about 45 km, which propagates
southward with the flow. The effect of this displacement in the vicinity of the canyon becomes apparent
after the first day of the simulation. Before the meander crosses the canyon, the jet moves slightly offshore
and becomes narrower over the canyon. By day 5, the meander is located over the canyon and the jet begins
to move onshore. Associated with this onshore displacement, the jet�s width grows until the meander hascompletely crossed the canyon at day 10. The time evolution during the days after the crossing of the mean-
der over the canyon is characterized by the progressive reformation of the steady circulation corresponding
to the jet�s location at 20 km.
As a response to the frontal displacement, the horizontal current at 100 m by day 2 is intensified up-
stream of the canyon near the coast (Fig. 11). Then, this coastal current is deviated offshore upstream
the canyon intensifying the flow over the canyon. At the same time, downstream of the canyon the current
decreases near the coast and the maximum velocities are located more offshore. The current begins to in-
crease by day 6 near the coast upstream of the canyon and it is also intensified by day 8 downstream of thecanyon. This intensification of the coastal current is related to a progressive onshore displacement of the
maximum horizontal current, first over the canyon and later downstream.
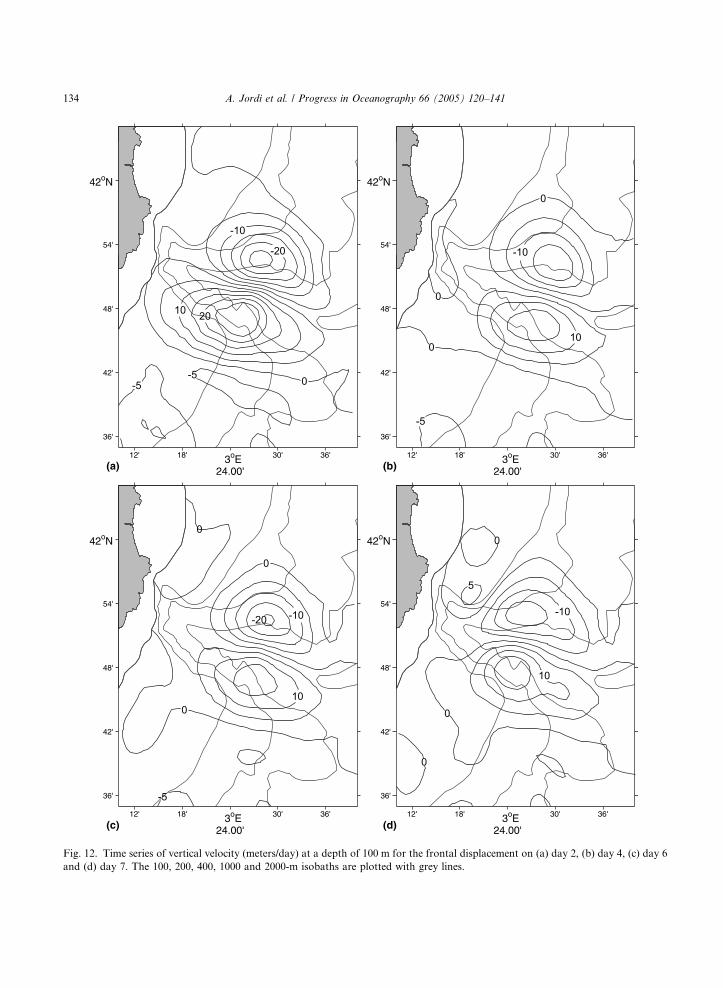
Vertical velocities at 100 m are also modified by the frontal displacement (Fig. 12). During the first days,
vertical movements become larger although they follow the same pattern as in the steady circulation. By
12' 18' 3oE24.00'
30' 36'
36'
42'
48'
54'
42oN
12' 18' 3oE24.00'
30' 36'
36'
42'
48'
54'
42oN
(a) (b)
Fig. 6. Steady circulation. Relative vorticity (normalized by f) 50 days after initialization at a depth of 100 m (solid lines). Broken lines
refer to the two-dimensional Lagrangian trajectories. The 100, 200, 400, 1000 and 2000-m isobaths are plotted with grey lines. The
offshore jet�s location is (a) x0 = 20 km and (b) x0 = 40 km.
A. Jordi et al. / Progress in Oceanography 66 (2005) 120–141 129
day 4, vertical velocities are somewhat relaxed while they are displaced offshore. Then, a re-intensification
of vertical velocities is associated with the beginning of the onshore displacement of vertical movements. As
the patterns of the vertical velocities move toward the coast, their magnitude decreases at first and then
increases to get the steady circulation (equal to Fig. 5(a)). It is worthwhile to mention that an upwelling
(with velocities of 5 m/day) is observed upstream the canyon near the coast by day 8 (Fig. 12(d)) associated
with the propagation of the meander. The existence of vertical motions ahead and behind a meander is awell-known result studied by several authors (Onken, 1992; Spall, 1995; Wang, 1993).
The time evolution of the horizontal currents at 400 m for the frontal displacement is shown in Fig. 13.
The most interesting observation is the modification of the distance that the jet penetrates into the canyon.
This distance is reduced at first and then increases progressively. The location of vertical velocities follows
the same pattern of displacement: first they move offshore and then onshore (Fig. 14). Furthermore, an
intensification of both horizontal and vertical currents is observed during the first days followed by a relax-
ation related to the onshore displacement.
6. Shelf-slope exchange
To quantify the shelf-slope exchanges induced by the interaction between the frontal displacement and
the canyon topography, we compute horizontal transports across a vertical plane formed by the shelf break
5 cm/s
(a) (b)12' 18' 3oE
24.00'
30' 36'
36'
42'
48'
54'
42oN
5 cm/s
12' 18' 3oE24.00'
30' 36'
36'
42'
48'
54'
42oN
Fig. 7. Steady circulation. Horizontal velocity 50 days after initialization at a depth of 400 m. The 100, 200, 400, 1000 and 2000-m
isobaths are plotted with grey lines. The offshore jet�s location is (a) x0 = 20 km and (b) x0 = 40 km.
130 A. Jordi et al. / Progress in Oceanography 66 (2005) 120–141
(200 m isobath) and its projection on the surface. The horizontal extension of this plane is limited to the
canyon area (between the two grey lines in Fig. 2). The horizontal velocity is decomposed in two compo-
nents: parallel and perpendicular to the plane. Horizontal transport is then computed by integrating per-
pendicular velocity across this plane, with positive values when water flows from the open ocean to the
coast. We compare these transport estimates with the along-shore transport over the shelf, computed byintegrating alongshore velocity from the coast to the shelf break across a vertical cross-shelf plane located
off the upstream boundary.
The time evolution of the flow response in the canyon is illustrated by a time series of horizontal trans-
port (Fig. 15(a)). The most interesting observation is an intense transport from the open ocean to the shelf
(positive transport) the first four days of simulation followed by a relaxation period with minimum trans-
port values. After day 8, the adjustment to the stationary conditions takes place with a transport from the
open ocean to the shelf. The total exchange of water from the open ocean to the shelf is up to 11.5 · 109 m3
during the first 8 days, representing 10% of the total along-shore transport.To estimate the water exchanges between upper layers and the deep ocean induced by the canyon, the
vertical transport is also computed by integrating vertical velocity across a horizontal plane at 200 m depth
created by the extension of the shelf break in the canyon area (the region limited by the two grey lines in
Fig. 2). This plane extends to the offshore boundary since vertical velocities far from the shelf break are
negligible and do not modify the vertical transport computation. Vertical transport is counted positively
when directed upward.

(a) (b)
12' 18' 3oE24.00'
30' 36'
36'
42'
48'
54'
42oN
12' 18' 3oE24.00'
30' 36'
36'
42'
48'
54'
42oN
Fig. 8. Steady circulation. Vertical velocity 50 days after initialization at a depth of 400 m. The units are meters/day. The 100, 200, 400,
1000 and 2000-m isobaths are plotted with grey lines. The offshore jet�s location is (a) x0 = 20 km and (b) x0 = 40 km.
0 5 10 15 200
10
20
30
40
50
Time (days)
Acr
oss-
shor
edi
stan
ce(k
m)
Fig. 9. Offshore jet�s location at the upstream across-shelf boundary during the frontal displacement.
A. Jordi et al. / Progress in Oceanography 66 (2005) 120–141 131
The shelf-slope exchange of surface water is associated with significant vertical motions, as shown by
time series of the vertical flux (Fig. 15(b)). An intense downward flux is observed the first 2.5 days, followed
by strong upward transport during the next days. Later in the simulation, we again reach stationary

(a) (b) (c)
(d) (e) (f)
12' 18' 3oE24.00'
30' 36'
36'
42'
48'
54'
42oN
12' 18' 3oE24.00'
30' 36'
36'
42'
48'
54'
42oN
12' 18' 3oE24.00'
30' 36'
36'
42'
48'
54'
42oN
12' 18' 3oE24.00'
30' 36'
36'
42'
48'
54'
42oN
12' 18' 3oE24.00'
30' 36'
36'
42'
48'
54'
42oN
12' 18' 3oE24.00'
30' 36'
36'
42'
48'
54'
42oN
26.2
25.9
25.6
25.6
25.9
26.2
25.6
25.9
26.2
26.2
25.925.6
25.6
25.9
26.2
25.6
25.9
26.2
Fig. 10. Time series of density field (units rt) at surface for the frontal displacement on (a) day 0, (b) day 2, (c) day 4, (d) day 6, (e) day
8 and (f) day 10. The 100, 200, 400, 1000 and 2000-m isobaths are plotted with grey lines.
132 A. Jordi et al. / Progress in Oceanography 66 (2005) 120–141
conditions. The exchange of water between the upper and deep ocean is up to �1.0 · 109 m3 (directed
downward) during the first 2.5 day. The net vertical exchange during the first 8 days is 3.3 · 109 m3, which
represents 30% of the horizontal shelf-slope exchange and 3% of the along-shore transport.
To determine how much of the transport is caused by the meander and how much of it is caused by thecanyon, we have repeated the above simulations taking the canyon out of the model bathymetry (the iso-
baths have been smoothly extended in the canyon area). The topography of the shelf is now characterized
by the transition from a narrow shelf to a broader shelf. The transport estimates are computed across
planes similar to those explained above (they are not the same since the shelf break have changed). The time
series of both horizontal and vertical transport have been overlaid with grey lines in Fig. 15 for comparison
purposes.

15 cm/s
(a) (b)
(c) (d)
12' 18' 3oE24.00'
30' 36'
36'
42'
48'
54'
42oN
15 cm/sb
12' 18' 3oE24.00'
30' 36'
36'
42'
48'
54'
42oN
15 cm/s
12' 18' 3oE24.00'
30' 36'
36'
42'
48'
54'
42oN
15 cm/s
12' 18' 3oE24.00'
30' 36'
36'
42'
48'
54'
42oN
Fig. 11. Time series of horizontal velocity at a depth of 100 m for the frontal displacement on (a) day 2, (b) day 4, (c) day 6 and (d) day
7. The 100, 200, 400, 1000 and 2000-m isobaths are plotted with grey lines.
A. Jordi et al. / Progress in Oceanography 66 (2005) 120–141 133
(a) (b)
(c) (d)
12' 18' 3oE24.00'
30' 36'
36'
42'
48'
54'
42oN
12' 18' 3oE24.00'
30' 36'
36'
42'
48'
54'
42oN
12' 18' 3oE24.00'
30' 36'
36'
42'
48'
54'
42oN
12' 18' 3oE24.00'
30' 36'
36'
42'
48'
54'
42oN
Fig. 12. Time series of vertical velocity (meters/day) at a depth of 100 m for the frontal displacement on (a) day 2, (b) day 4, (c) day 6
and (d) day 7. The 100, 200, 400, 1000 and 2000-m isobaths are plotted with grey lines.
134 A. Jordi et al. / Progress in Oceanography 66 (2005) 120–141

5 cm/s
12' 18' 3oE24.00'
30' 36'
36'
42'
48'
54'
42oN
5 cm/s
12' 18' 3oE24.00'
30' 36'
36'
42'
48'
54'
42oN
5 cm/s
12' 18' 3oE24.00'
30' 36'
36'
42'
48'
54'
42oN
5 cm/s
12' 18' 3oE24.00'
30' 36'
36'
42'
48'
54'
42oN
(a) (b)
(c) (d)
Fig. 13. Time series of horizontal velocity at a depth of 400 m for the frontal displacement on (a) day 2, (b) day 4, (c) day 6 and (d) day
7. The 100, 200, 400, 1000 and 2000-m isobaths are plotted with grey lines.
A. Jordi et al. / Progress in Oceanography 66 (2005) 120–141 135

12' 18' 3oE24.00'
30' 36'
36'
42'
48'
54'
42oN
12' 18' 3oE24.00'
30' 36'
36'
42'
48'
54'
42oN
12' 18' 3oE24.00'
30' 36'
36'
42'
48'
54'
42oN
12' 18' 3oE24.00'
30' 36'
36'
42'
48'
54'
42oN
(a) (b)
(c) (d)
Fig. 14. Time series of vertical velocity (meters/day) at a depth of 400 m for the frontal displacement on (a) day 2, (b) day 4, (c) day 6
and (d) day 7. The 100, 200, 400, 1000 and 2000-m isobaths are plotted with grey lines.
136 A. Jordi et al. / Progress in Oceanography 66 (2005) 120–141
0 2 4 6 8 10 12 14 16 18 20-10
0
10
20
30
40
Hor
izon
tal T
rans
port
Time (days)
0 2 4 6 8 10 12 14 16 18 20-10
-5
0
5
10
15
20
Ver
tical
Tran
spor
t
Time (days)
(a)
(b)
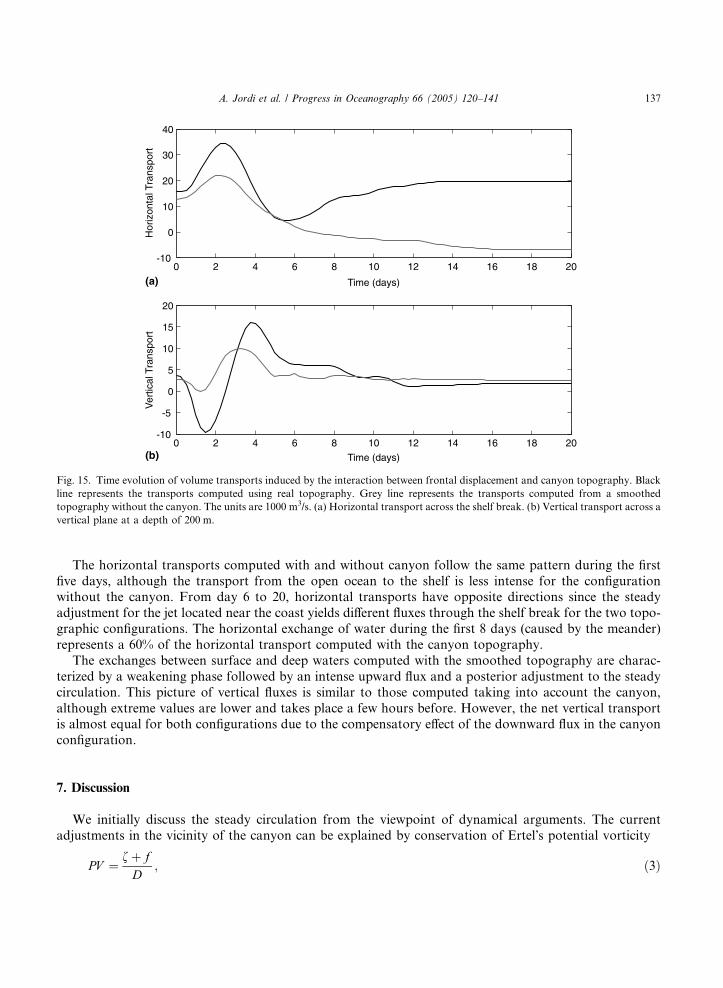
Fig. 15. Time evolution of volume transports induced by the interaction between frontal displacement and canyon topography. Black
line represents the transports computed using real topography. Grey line represents the transports computed from a smoothed
topography without the canyon. The units are 1000 m3/s. (a) Horizontal transport across the shelf break. (b) Vertical transport across a
vertical plane at a depth of 200 m.
A. Jordi et al. / Progress in Oceanography 66 (2005) 120–141 137
The horizontal transports computed with and without canyon follow the same pattern during the first
five days, although the transport from the open ocean to the shelf is less intense for the configurationwithout the canyon. From day 6 to 20, horizontal transports have opposite directions since the steady
adjustment for the jet located near the coast yields different fluxes through the shelf break for the two topo-
graphic configurations. The horizontal exchange of water during the first 8 days (caused by the meander)
represents a 60% of the horizontal transport computed with the canyon topography.
The exchanges between surface and deep waters computed with the smoothed topography are charac-
terized by a weakening phase followed by an intense upward flux and a posterior adjustment to the steady
circulation. This picture of vertical fluxes is similar to those computed taking into account the canyon,
although extreme values are lower and takes place a few hours before. However, the net vertical transportis almost equal for both configurations due to the compensatory effect of the downward flux in the canyon
configuration.
7. Discussion
We initially discuss the steady circulation from the viewpoint of dynamical arguments. The current
adjustments in the vicinity of the canyon can be explained by conservation of Ertel�s potential vorticity
PV ¼ fþ fD
; ð3Þ

138 A. Jordi et al. / Progress in Oceanography 66 (2005) 120–141
where f represents the relative vorticity, f the planetary vorticity, and D the vertical separation between iso-
pycnals. Then, potential vorticity conservation (DPV = 0) requires that individual changes of the vertical
separation between isopycnals and the relative vorticity be related by
DD ¼ DfPV
. ð4Þ
An important fact derived from Fig. 6 is that the Langrangian trajectories cut across the relative vorticity
contours. If we assume that water parcels are advected along Lagrangian trajectories, then these parcels will
�feel� the changing relative vorticity along their path. According to (4) this relative vorticity change will re-
sult in a compensating vortex stretching or compression of vortex tubes depending on the sign of the along-trajectory relative vorticity gradient. This gradient is positive on the upstream wall and negative on the
downstream wall. Thus, vortex stretching (downwelling) occurs on the upstream wall followed by compres-
sion of vortex tubes (upwelling) on the downstream rim.
This structure for verticals motions shows some coincidences with previous studies and also with existing
observations in the area. Submarine canyons affect the spatial pattern of regional vertical motions. An anti-
symmetrical structure of these motions was predicted by Klink (1996), Skliris et al. (2001) and Skliris et al.
(2002), showing downwelling motion on the upstream side of the canyon followed by an upwelling on the
downstream side. Our model also predicts another downwelling motion further downstream to the lastupwelling probably due to the presence of a submarine promontory located just downstream to the canyon.
Several numerical studies addressed the importance of water column stratification. Klink (1996), Ard-
huin et al. (1999) and Skliris et al. (2002) indicated that the effect of stratification is to limit the vertical
extent of the influence of the canyon topography on the flow pattern. Although we have not specifically
studied this effect, our results show that the circulation follows the isobaths in the deeper parts of the model
domain, where stratification is almost homogeneous. Near the coast, the flow is less affected by topography
due to the screening effect of stratification, which agrees with previous studies.
A description of the flow–topography interaction in the Palamos Canyon area, derived from three inten-sive surveys, is given by Alvarez et al. (1996). They find that the modifications induced by the short-
timescale variability (10 days) in the position of the Catalan front–current system produce different regimes
of exchange between the shelf and the slope in the canyon domain that strongly modify the dynamics and
the biomass pattern in the area. They also suggest that the perturbation of the flow in the upper layers is
higher when the current crosses the head of the canyon due to the relevance of ageostrophic motions (versus
simple geostrophic motions). Our results for the steady circulation confirm these observations.
Regarding to the frontal displacement, the question will be answered as to why frontal instability is not
exhibited since the initial state satisfies necessary conditions for instability in simplified systems. A neces-sary condition for baroclinic instability is a potential vorticity gradient changing sign somewhere with
depth. Barotropic instability requires a sign change of the horizontal gradient of the absolute vorticity (Ped-
losky, 1987). To solve this issue, the initial state can be approximated by a simple two-layer system with
density contrast Dr0 = 0.8 and layers depth H1 = 150 m and H2 = 2250 m (see Fig. 3). According to the
quasi-geostrophic theory, sufficiently long waves (compared with the deformation radius) will grow due
to baroclinic instability. However, as long as
L <pf
gDq0
q0
H 1H 2ð Þ1=2� �1=2
¼ 66.2 km ð5Þ
the system will be stable (Pedlosky, 1987), in good agreement with the model results.
Although none of the existing numerical works have studied the interaction between the meandering in-
duced by short-timescale variability of the along-slope front with the submarine canyons, results obtained
in this work are similar to the effect of easterly wind bursts simulated by Ardhuin et al. (1999). The wind
forcing produces an oscillation of the flow characterized by a downwelling phase during the wind burst and

A. Jordi et al. / Progress in Oceanography 66 (2005) 120–141 139
an upwelling phase as the wind relaxes, like the effect produced by the meander and the posterior relaxation
to the steady circulation. The enhancement of shelf-slope exchanges by wind gusts and frontal variability is
also comparable. From these similarities, it follows that the combined effect of wind and frontal displace-
ments should be investigated.
We close this section by providing an estimate of the shelf-slope exchange associated with the interactionof the frontal instability described with the canyon: we find an exchange of up to 11.5 · 109 m3 for an 8 days
period. Assuming that the meandering has a period of 7–10 days, the interaction of meanders with Palamos
Canyon produce a transport of sufficient volume to exchange waters of the continental shelf in the Gulf of
Lions and the Catalan Sea in 2.5 years. This result is similar to estimations obtained by She and Klinck
(2000), who estimated in a few (2–5) years the time which Astoria-like submarine canyons driven by winds
flush a continental shelf.
Considering the whole global area of study (500 km north of Barcelona) and the existence in this zone of
15 canyons, we could estimate that the replacement of the shelf waters takes place in a time scale of theorder of a few months (2–3). Although we have computed the exchange from the passing of a single mean-
der above the canyon on a rather short period, this result would indicate that there is more connection and
exchanges between the open ocean and the coast than previously considered. The importance of theses re-
sults cannot be over-emphasized but observations to support the above-described numerical results are
needed. Furthermore, other processes (wind, surface current instabilities, deep water formation, . . .) may
alter the exchanges of water between the shelf and the slope of the Catalan Sea and the Gulf of Lions
and should be taken into account for accurate computations of shelf-slope exchanges.
8. Conclusions
Results of a limited-area fine-resolution primitive equation model simulating the coupling of a jet to the
shelf-slope topography in the vicinity of a submarine canyon off the northeast Catalan coast have been pre-
sented. The variability of the offshore position of the along-slope current has a strong impact on the steady
adjustment of the flow in the canyon. The displacements of the current-front yield a meandering jet, which
interacts with the canyon, producing an enhancement of the exchange between the shelf and the slope.Our results suggest that the interaction of the current at different offshore locations with the canyon
forces different steady adjustments of the flow in the canyon. Over the shelf the flow is deviated in the vicin-
ity of the canyon leading to vertical motions over the rims of the canyon that can be explained by conser-
vation of potential vorticity. Nevertheless the flow is more perturbed with weak stratification, which has a
screening effect in the upper layers. Also the flow is more affected when the current crosses the head of the
canyon compared to when it crosses the canyon near its mouth due to the importance of ageostrophic mo-
tion. At deeper layers, the along-slope flow penetrates into the canyon along the upstream wall and exits
along the downstream wall.The modifications induced by the short-timescale variability in the position of the Catalan front alter the
local dynamics and the shelf-slope dynamics in the Palamos Canyon area. The onshore displacement of the
current front generates a meander propagating southward. The interaction of this meander with the canyon
produces an enhancement of the shelf-slope exchange and an oscillation of the vertical flow characterized
by an intense downwelling phase followed by an upwelling. The comparison of the transport estimates com-
puted with or without the canyon topography shows a clear enhancement of the shelf-slope exchanges
caused by the canyon, although cross-shelf fluxes induced by the meander are so significant.
About 10% of the water that flows along the shelf is exchanged with open waters and about 3% withdeep waters. This volume of water transported between the shelf and the slope through the Palamos Can-
yon results enough to exchange shelf waters in 2.5 years. This time would be reduced to less than 3 months
when considering all the canyons in Gulf of Lions and Catalan continental margin. The bio-geo-chemical

140 A. Jordi et al. / Progress in Oceanography 66 (2005) 120–141
importance of this numerical result cannot be over-emphasized since we have simulated the passing of a
single meander above the canyon. Therefore, observations and numerical work considering all processes
that could control the exchanges of water are needed.
Acknowledgments
This work has been supported by the Plan Nacional de I+D+D, through CICYT Grant MAR1999-1060.
Constructive comments from two reviewers are gratefully acknowledged.
References
Allen, S. E. (1996). Topographically generated subinertial flows within a finite length canyon. Journal of Physical Oceanography, 26,
1608–1632.
Allen, S. E. (2000). On subinertial flow in submarine canyons: Effect of geometry. Journal of Geophysical Research, 105, 1285–1297.
Alvarez, A., Tintore, J., & Sabates, A. (1996). Flow modification of shelf-slope exchange induced by a submarine canyon off the
northeast Spanish coast. Journal of Geophysical Research, 101, 12043–12055.
Ardhuin, F., Pinot, J. M., & Tintore, J. (1999). Numerical study of the circulation in a steep canyon off the Catalan coast. Journal of
Geophysical Research, 104, 11115–11135.
Boyer, D. L., Zhang, X., & Perenne, N. (2000). Laboratory observations of rotating, stratified flow in the vicinity of a submarine
canyon. Dynamics of Atmospheres and Oceans, 31, 47–72.
Chen, D., Horrigan, S. G., & Wang, D. P. (1988). The late summer vertical nutrient mixing in Long Island Sound. Journal of Marine
Research, 46, 753–770.
Codiga, D. L., Renouard, D. P., & Fincham, A. M. (1999). Experiments on waves trapped over the continental slope and shelf in a
continuously stratified rotating ocean, and their incidence on a canyon. Journal of Marine Research, 57, 585–612.
Durrieu de Madron, X., Radakovitch, O., Heussner, S., Loye-Pilot, M. D., & Monaco, A. (1999). Role of the climatological and
current variability on shelf-slope exchanges of particulate matter: Evidence from the Rhone continental margin (NW
Mediterranean). Deep-Sea Research I, 46, 1513–1538.
Flexas, M. M., Durrieu de Madron, X., Garcia, M. A., Canals, M., & Arnau, P. (2002). Flow variability in the Gulf of Lions during
the MATER HFF experiment (March–May 1997). Journal of Marine Systems, 33–34, 197–214.
Font, J., Salat, J., & Tintore, J. (1988). Permanent features of the circulation in the Catalan Sea. In H. J. Minas, & P. Nival (Eds.),
Oceanographie Pelagique Mediterraneenne. Oceanologica Acta, 9, 51–57.
Freeland, H. J., & Denman, K. L. (1982). A topographically controlled upwelling center off southern Vancouver Island. Journal of
Marine Research, 40, 1069–1093.
Garcıa-Ladona, E., Castellon, A., Font, J., & Tintore, J. (1996). The Balearic current and volume transports in the Balearic basin.
Oceanologica Acta, 19, 489–497.
Granata, T. C., Vidondo, B., Duarte, C. M., Satta, M. P., & Garcia, M. (1999). Hydrodynamics and particle transport associated with
a submarine canyon off Blanes (Spain, NW Mediterranean Sea). Continental Shelf Research, 19, 1249–1263.
Hickey, B. M. (1995). Coastal submarine canyons, paper presented at �Aha Huliko�: A workshop on flow topography interactions.
Honolulu: Office of Naval Research.
Hickey, B. M. (1997). The Response of a steep-sided, narrow canyon to a time-variable wind forcing. Journal of Physical
Oceanography, 27, 697–729.
Inman, D. L., Nordstrom, C. E., & Flick, R. (1976). Currents in submarine canyons: An air–sea–land interaction. Annual Review of
Fluid Mechanics, 8, 275–310.
Klink, J. M. (1988). The influence of a narrow transverse canyon on initially geostrophic flow. Journal of Geophysical Research, 93,
509–515.
Klink, J. M. (1989). Geostrophic adjustment over submarine canyons. Journal of Geophysical Research, 94, 6133–6144.
Klink, J. M. (1996). Circulation near submarine canyons: A modeling study. Journal of Geophysical Research, 101, 1211–1223.
La Violette, P. E., Tintore, J., & Font, J. (1990). The surface circulation of the Balearic Sea. Journal of Geophysical Research, 95,
1559–1568.
Marchesiello, P., McWilliams, J. C., & Shchepetkin, A. (2001). Open boundary conditions for long-term integration of regional
oceanic models. Ocean Modeling, 3, 1–20.
Maso, M., & Tintore, J. (1991). Variability of the shelf water off the northeast Spanish coast. Journal of Marine Systems, 1, 441–450.
Millot, C. (1985). Evidence of a several-day propagating wave. Journal of Physical Oceanography, 15, 258–272.

A. Jordi et al. / Progress in Oceanography 66 (2005) 120–141 141
Millot, C. (1999). Circulation in the Western Mediterranean Sea. Journal of Marine Systems, 20, 423–442.
Monaco, A., Durrieu de Madron, X., Rodacovitch, O., Huessner, S., & Carbone, J. (1999). Origin and variability of downward
biogeochemical fluyes on the Rhone continental margin (NW Mediterranean). Deep Sea Research I, 46, 1483–1511.
Onken, R. (1992). Mesoscale upwelling and density finestructure in the seasonal thermocline – A dynamical model. Journal of Physical
Oceanography, 22, 1257–1273.
Palanques, A., Garcia-Ladona, E., Gomis, D., Martın, J., Marcos, M., Pascual, A., et al. (2005). A multidisciplinary program to study
the dynamics and the ecology of a northwestern Mediterranean submarine canyon: The Palamos Canyon. This issue.
Pedlosky, J. (1987). Geophysical fluid dynamics. New York: Springer-Verlag.
Peffley, M. B., & O�Brien, J. J. (1976). A three-dimensional simulation of coastal upwelling off Oregon. Journal of Physical
Oceanography, 6, 164–180.
Perenne, N., Verron, J., Renouard, D., Boyer, D. L., & Zhang, X. (1997). Rectified barotropic flow over a submarine canyon. Journal
of Physical Oceanography, 27, 1868–1893.
Puig, P., Palanques, A., Guillen, J., & Garcıa-Ladona, E. (2000). Deep slope currents and suspended particle fluxes in and around the
Foix submarine canyon (NW Mediterranean). Deep Sea Research I, 47, 343–366.
She, J., & Klinck, J. M. (2000). Flow near submarine canyons driven by constant winds. Journal of Geophysical Research, 105,
28671–28694.
Skliris, N., Goffart, A., Hecq, J. H., & Djenidi, S. (2001). Shelf-slope exchanges associated with a steep submarine canyon off Calvi
(Corsica, NW Mediterranean Sea): A modeling approach. Journal of Geophysical Research, 106, 19883–19901.
Skliris, N., Hecq, J. H., & Djenidi, S. (2002). Water fluxes at an ocean margin in presence of a submarine canyon. Journal of Marine
Systems, 32, 239–251.
Spall, M. A. (1995). Frontogenesis, subduction and cross-front exchange at upper ocean fronts. Journal of Geophysical Research, 100,
2543–2557.
Tintore, J., Wang, D. P., & La Violette, P. E. (1990). Eddies and thermohaline intrusions on the shelf/slope front off the northeast
Spanish coast. Journal of Geophysical Research, 95, 1627–1633.
Wang, D. P. (1982). Development of a three-dimensional limited-area (island) shelf circulation model. Journal of Physical
Oceanography, 12, 605–617.
Wang, D. P. (1985). Numerical study of gravity currents in a channel. Journal of Physical Oceanography, 15, 299–305.
Wang, D. P. (1993). Model of frontogenesis: Subduction and upwelling. Journal of Marine Research, 51, 497–513.
Wang, D. P. (1997). Effects of small-scale wind on coastal upwelling with application to Point Conception. Journal of Geophysical
Research, 102, 15555–15566.