Sheddase Activity of Tumor Necrosis Factor- Converting Enzyme Is Increased and Prognostically...
20
Sheddase Activity of Tumor Necrosis Factor-Alpha Converting Enzyme is Increased and Prognostically Valuable in Head and Neck Cancer Lisheng Ge *,¶ , Dejan Baskic *,¶,£ , Per Basse *,ƒ , Lazar Vujanovic *,† , Sebnem Unlu *,¶ , Toshie Yoneyama * , Andrea Vujanovic * , Jie Han *,¶ , Dragic Bankovic £ , Miroslaw J. Szczepanski *,$ , Jennifer L. Hunt § , Ronald B. Herberman *,† , Susanne M. Gollin ‡,* , Robert L. Ferris *,¥,ƒ , Theresa L. Whiteside *,¶,¥,ƒ , Eugene N. Myers ¥ , and Nikola L. Vujanovic *,¶,ƒ,1 * University of Pittsburgh Cancer Institute, University of Pittsburgh, Pittsburgh, Pennsylvania, US ¶ Department of Pathology, University of Pittsburgh, Pittsburgh, Pennsylvania, US † Department of Medicine, University of Pittsburgh, Pittsburgh, Pennsylvania, US ƒ Department of Immunology, University of Pittsburgh, Pittsburgh, Pennsylvania, US ‡ Department of Human Genetics, University of Pittsburgh, Pittsburgh, Pennsylvania, US ¥ Department of Otolaryngology, University of Pittsburgh, Pittsburgh, Pennsylvania, US § Department of Pathology, Cleveland Clinic, Ohio, US £ Department of Microbiology and Immunology, School of Medicine, and Department of Mathematics and Informatics, School of Science, University of Kragujevac, Serbia $ Departments of Otolaryngology and Clinical Immunology, School of Medicine, Poznan, Poland Abstract Tumor necrosis factor alpha converting enzyme (TACE) is a sheddase overexpressed in cancers that generates cancer cell growth and survival factors, and is implicated in carcinogenesis and tumor growth. This indicates that TACE could be a potentially important cancer biomarker. Unexpectedly, TACE expression in cancer tissues does not correlate with cancer stage or invasiveness. Although TACE sheddase activity is a more direct and potentially better indicator of TACE biology and might be a better cancer biomarker than TACE expression, it has not been studied in cancer tissues. In the present study, we developed a reliable specific assay for quantification of TACE sheddase activity, investigated TACE activity and TACE protein expression in head and neck cancer (HNC) tissues, and examined the correlation of the results with HNC clinical stages and likelihood to recur. We found that HNC cell lines and tissues contained remarkably higher quantities of TACE activity and TACE protein than normal keratinocytes or oral mucosa. siRNA silencing of TACE resulted in the inhibition of release of the tumorogenic factors amphiregulin and TGF alpha, and tumor protective factors tumor necrosis factor receptors from HNC cells. Importantly, TACE activity, but not TACE protein expression, was significantly higher in large, T3/T4, primary tumors relative to small, T1/ T2, primary tumors, and especially in primary tumors likely to recur relative to those unlikely to recur. These data demonstrate that increased TACE activity in cancer is biologically and clinically relevant, and indicate that TACE activity could be a significant biomarker of cancer prognosis. Keywords Head and neck cancer; Biomarker; Tumor necrosis factor alpha converting enzyme; protein expression; sheddase activity 1Corresponding author: Nikola L. Vujanovic, M.D., Ph.D., University of Pittsburgh Cancer Institute, Hillman Cancer Center, G.17d, 5117 Centre Avenue, Pittsburgh, PA 15213-1863, USA; Phone: (412) 623-3211; Fax: (412) 623-1119; [email protected]. NIH Public Access Author Manuscript Cancer Epidemiol Biomarkers Prev. Author manuscript; available in PMC 2010 November 1. Published in final edited form as: Cancer Epidemiol Biomarkers Prev. 2009 November ; 18(11): 2913–2922. doi: 10.1158/1055-9965.EPI-08-0898. NIH-PA Author Manuscript NIH-PA Author Manuscript NIH-PA Author Manuscript
-
Upload
independent -
Category
Documents
-
view
2 -
download
0
Transcript of Sheddase Activity of Tumor Necrosis Factor- Converting Enzyme Is Increased and Prognostically...

Sheddase Activity of Tumor Necrosis Factor-Alpha ConvertingEnzyme is Increased and Prognostically Valuable in Head andNeck Cancer
Lisheng Ge*,¶, Dejan Baskic*,¶,£, Per Basse*,ƒ, Lazar Vujanovic*,†, Sebnem Unlu*,¶, ToshieYoneyama*, Andrea Vujanovic*, Jie Han*,¶, Dragic Bankovic£, Miroslaw J. Szczepanski*,$,Jennifer L. Hunt§, Ronald B. Herberman*,†, Susanne M. Gollin‡,*, Robert L. Ferris*,¥,ƒ,Theresa L. Whiteside*,¶,¥,ƒ, Eugene N. Myers¥, and Nikola L. Vujanovic*,¶,ƒ,1
*University of Pittsburgh Cancer Institute, University of Pittsburgh, Pittsburgh, Pennsylvania, US¶Department of Pathology, University of Pittsburgh, Pittsburgh, Pennsylvania, US †Department ofMedicine, University of Pittsburgh, Pittsburgh, Pennsylvania, US ƒDepartment of Immunology,University of Pittsburgh, Pittsburgh, Pennsylvania, US ‡Department of Human Genetics, Universityof Pittsburgh, Pittsburgh, Pennsylvania, US ¥Department of Otolaryngology, University ofPittsburgh, Pittsburgh, Pennsylvania, US §Department of Pathology, Cleveland Clinic, Ohio, US£Department of Microbiology and Immunology, School of Medicine, and Department of Mathematicsand Informatics, School of Science, University of Kragujevac, Serbia $Departments ofOtolaryngology and Clinical Immunology, School of Medicine, Poznan, Poland
AbstractTumor necrosis factor alpha converting enzyme (TACE) is a sheddase overexpressed in cancers thatgenerates cancer cell growth and survival factors, and is implicated in carcinogenesis and tumorgrowth. This indicates that TACE could be a potentially important cancer biomarker. Unexpectedly,TACE expression in cancer tissues does not correlate with cancer stage or invasiveness. AlthoughTACE sheddase activity is a more direct and potentially better indicator of TACE biology and mightbe a better cancer biomarker than TACE expression, it has not been studied in cancer tissues. In thepresent study, we developed a reliable specific assay for quantification of TACE sheddase activity,investigated TACE activity and TACE protein expression in head and neck cancer (HNC) tissues,and examined the correlation of the results with HNC clinical stages and likelihood to recur. Wefound that HNC cell lines and tissues contained remarkably higher quantities of TACE activity andTACE protein than normal keratinocytes or oral mucosa. siRNA silencing of TACE resulted in theinhibition of release of the tumorogenic factors amphiregulin and TGF alpha, and tumor protectivefactors tumor necrosis factor receptors from HNC cells. Importantly, TACE activity, but not TACEprotein expression, was significantly higher in large, T3/T4, primary tumors relative to small, T1/T2, primary tumors, and especially in primary tumors likely to recur relative to those unlikely torecur. These data demonstrate that increased TACE activity in cancer is biologically and clinicallyrelevant, and indicate that TACE activity could be a significant biomarker of cancer prognosis.
KeywordsHead and neck cancer; Biomarker; Tumor necrosis factor alpha converting enzyme; proteinexpression; sheddase activity
1Corresponding author: Nikola L. Vujanovic, M.D., Ph.D., University of Pittsburgh Cancer Institute, Hillman Cancer Center, G.17d,5117 Centre Avenue, Pittsburgh, PA 15213-1863, USA; Phone: (412) 623-3211; Fax: (412) 623-1119; [email protected].
NIH Public AccessAuthor ManuscriptCancer Epidemiol Biomarkers Prev. Author manuscript; available in PMC 2010 November 1.
Published in final edited form as:Cancer Epidemiol Biomarkers Prev. 2009 November ; 18(11): 2913–2922. doi:10.1158/1055-9965.EPI-08-0898.
NIH
-PA Author Manuscript
NIH
-PA Author Manuscript
NIH
-PA Author Manuscript
IntroductionPrognosis and treatment planning of head and neck cancer (HNC) are mainly based ontraditional clinical methods such as the tumor-node-metastasis (TNM) classification andhistopathology. These methods are both subjective and lack sensitivity for canceraggressiveness, prognosis and treatment responsiveness. Therefore, new biomarkers areneeded to provide clinical oncologists with more precise information on the intrinsic biologicalproperties of HNC. In recent years, several biomarkers, including epidermal growth factorreceptor (EGFR), p53, cyclooxygenase-2 (COX-2) and matrix metalloprotease-9 (MMP-9),have been discovered and have shown both biological relevance and significant ability todetermine the aggressiveness and prognosis of HNC (1-4). However, these and other promisingbiomarkers await clinical validation to be approved for application in clinical practice.
Another potentially important cancer biomarker might be tumor necrosis factor alpha (TNF)converting enzyme (TACE, ADAM17 or CD156q). TACE is an integral plasma membranezinc-dependent metalloprotease and member of the ADAM (A Disintegrin AndMetalloprotease) family of molecules (5-7). TACE is produced as an inactive proenzyme of120 kD, which is physiologically activated via stimulation of G protein-coupled receptors (8,9) and furin-like-enzyme cleavage of the TACE prodomain leading to generation of the 100kD active enzyme (5-7). TACE is a primary sheddase and/or activator of several biologicallyimportant membrane-anchored proteins, including TNF, epithelial cell growth factors, celladhesion molecules and TNF family receptors; and is an essential regulator of the vitalfunctions inflammation, immune responses, and tissue/organ development (5-7,10).
Soluble transforming growth factor alpha (TGF-α), amphiregulin (AR) and heparin-bindingepidermal growth factor (HB-EGF) are activating ligands of EGFR that are released inincreased quantities by epithelial cancer cells via TACE sheddase activity, and mediate in anautocrine/paracrine fashion cancer cell proliferation, survival and tumor growth (11-14). Inaddition, the TACE-generated soluble TNF and TNF receptors (TNFR) mediate pro-carcinogenic inflammation and protection of tumor cells from TNF killing, respectively, andare increased in cancer hosts (15-20). Therefore, TACE plays a critical role in malignanttransformation and tumorigenesis, and potentially represents a significant new diagnostic/prognostic cancer biomarker as well as a new target for cancer therapy.
Increased expression of TACE mRNA and/or protein has been consistently found in a varietyof human cancers (18,21-27). However, no correlation between increased TACE expressionin cancer tissues and cancer clinical stages or aggressiveness has been demonstrated. Thequantities and ratios of the two TACE forms, inactive pro-enzyme and active enzyme, vary intissues. Since the tumorogenic activity of TACE is mediated by the TACE active form and itssheddase activity, but not by the TACE inactive form (5-7), TACE activity is a better indictorof TACE biology and might be a better biomarker of tumorigenicity and cancer invasivenessthan TACE expression. To date, TACE enzymatic activity in cancer tissues has not beenexamined.
In the present study, we investigated TACE sheddase activity within HNC tissues, andcorrelated the results with HNC clinical stages and likelihood to recur. Our data show thatTACE sheddase activity is increased in HNC and can discriminate cancer from normal tissues,and primary tumors likely to recur from those unlikely to recur, implying that TACE activitycould be potentially an important cancer biomarker.
Ge et al. Page 2
Cancer Epidemiol Biomarkers Prev. Author manuscript; available in PMC 2010 November 1.
NIH
-PA Author Manuscript
NIH
-PA Author Manuscript
NIH
-PA Author Manuscript

Materials and MethodsCell lines
Established HNC cell lines PCI-4A, PCI-4B, PCI-15A, PCI-15B and PC1-13 were generatedin Dr. Theresa Whiteside's laboratory. The “A” and PCI-13 cell lines were derived fromprimary tumors and “B” cell lines were derived from lymph node metastases. The PCI-13-26cell clone was generated by limiting dilution of PCI-13 cells, and showed an increased abilityto release the TACE-generated tumor-protecting factor soluble TNFR1. Tumor cell lines werecultured in DMEM medium containing 10% fetal calf serum (FCS) (Life Technologies, LongIsland, NY). We also utilized three different cell lines of freshly isolated normal adult humankeratinocytes (NHEK, Cambrex Bioscience, Cottonwood, AZ). NHEK cell lines werepropagated in KGM serum-free culture medium (Cambrex Bioscience), while the experimentswith these cell lines were performed in DMEM medium containing 10% FCS.
Tumor tissues and patientsFresh tissue samples of 45 HNC primary tumors, 15 recurrent HNC tumors (R3), 12 lymphnode metastases paired with 12 HNC primary tumors, 3 unstaged HNC tumors, and 16 normaloral mucosa tissues were obtained by surgery, snap-frozen in liquid nitrogen, and provided tothe investigators by the University of Pittsburgh HNC SPORE Tissue Core. Dr. Jennifer Hunt,a trained pathologist, selected the tumor tissues for this study. Tumor samples containing morethan 75% cancer cells based on the cytopathology scrape analyses were obtained from theinterior of the main tumor mass. Sections of adjacent areas were histopathologically analyzedto confirm the high percentage of tumor cells. Tumor samples with necrosis or extensiveinflammatory infiltrates, or paucicelluar or fibrotic contents were not used in this study. Thetissue samples were maintained in the frozen state at −80° C until their use in each assessmentand were exclusively used in the studies described in the present manuscript. All tissue donorssigned the University of Pittsburgh IRB (#891206)-approved informed consent. Donors ofprimary tumor tissues were previously untreated HNC patients. Donors of recurrent tumortissues were HNC patients previously treated for primary tumors by surgery, radiation,chemotherapy or a combination, and remained untreated for at least 1 month before obtainingtumor tissues. Donors of normal tissues were individuals who underwent surgery for sleepapnea or chronic tonsillitis and were otherwise healthy. The primary tumor samples wereclassified according to the pathologically-determined tumor size and lymph node status as T1or T2 (T1/T2), T3 or T4 (T3/T4), lymph nodes without metastases (N0), and lymph nodes withmetastases (N+). They were also classified according to their ability to recur after initial therapyas either primary tumors that did not develop recurrences after therapy (NR1-T1/T2 and NR2-T3/T4) or primary tumors that developed recurrences after therapy (R1-T1/T2 and R2-T3/T4)(Table 1). The follow-up of HNC patients after therapy of primary tumors was at least twoyears (9 patients, 2 years; 21 patients, 3 years; 9 patients, 4 years; 18 patients, 5 years; and 6patients, 6 years) (median, 3.3 years; range, 2.0-6 years), which was expected to be sufficientperiod of time for the possible development of recurrent tumors. All tumors were squamous-cell carcinomas of the head and neck (oral cavity, tongue, pharynx or larynx).
Western blotCells from cultured lines (1 × 10⁶) or tissues (50 mg) were washed twice in cold PBS and thenlysed with 50 or 500 μL, respectively, of radioimmunoprecipitation assay (RIPA) cell-lysisbuffer (Upstate, Charlottesville, VA) containing EDTA-supplemented protease inhibitorcocktail (Roche Applied Science, Indianapolis, IN). The protein levels in the tissue lysateswere determined by Bradford's method using the Quick Starttm Bradford kit (Bio-RadLaboratories Inc., Hercules, CA). Ten μg of the lysate proteins were subjected to 8% SDS-polyacrylamide gel electrophoresis (PAGE), and transferred to polyvinylidene fluoride(PVDF) membranes (Perkin-Elmer, Fremont, CA). TACE and β-actin proteins were detected
Ge et al. Page 3
Cancer Epidemiol Biomarkers Prev. Author manuscript; available in PMC 2010 November 1.
NIH
-PA Author Manuscript
NIH
-PA Author Manuscript
NIH
-PA Author Manuscript
on Western blots using the rabbit polyclonal anti-TACE (ProSci, Poway, CA) and mouse anti-β-actin monoclonal (SIGMA-Aldrich, St. Louis, MO) antibodies, respectively.
ELISAELISA kits for human TACE, TNFR1, TNFR2, TGF-α and AR were purchased from R&DSystems (Minneapolis, MN). ELISAs were performed according to the manufacturer'sinstructions. TNFR1, TNFR2, TGF-α and AR were measured in cell culture conditioned mediaobtained by culturing 1 × 10⁶ cells/ml for 24 h. The quantity of TACE protein was measuredin cell or tissue lysates that were obtained as described above for the preparation of lysates forWestern blotting.
ImmunohistochemistryEight-micron thick cryotome sections of freshly frozen normal oral mucosa or HNC tumortissues were prepared. The tissue sections were fixed in ice-cold acetone and stained withunconjugated affinity-purified goat IgG antibodies to human TACE cytoplasmic domain(reactive with both non-activated and activated TACE forms) or control non-immunized goatIgG (R&D Systems). Subsequently, they were stained with R-phycoerythrin-conjugatedaffinity-purified F(ab')2 fragment of donkey anti-goat IgG (H+L) antibodies (JacksonImmunoResearch Laboratories, West Grove, PA). To visualize the tissue morphology, thesame tissue sections were stained with hematoxylin and examined, after immunofluorescencestaining images were captured. The tissue sections were examined, and photomicrographimages were generated by a Nikon Eclipse E800 fluorescence microscope equipped withstandard filters for rhodamine/phycoerythrin (Ex535/50, DM565, BA610/75) and using amanually set, fixed exposure time. Quantification of TACE expression was performed usingthe MetaMorph software that enabled setting of fluorescence threshold. Pixels (on a 0-255scale) above their average + 1.8 × SD of isotype control antibody-stained tissue sections wereconsidered positive and were measured. Data were presented as the number of TACE pixels/cell, which were computed from 549 normal tissue cells and 1077 HNC tissue cells analyzed;and TACE pixels/area of 0.015 mm2 of tissue section, which were computed from six areas ofnormal tissue section and eight areas of HNC tissue section analyzed. The number of cells wasdetermined by counting the number of nuclei in defined areas of tissue sections. Negative andpositive internal controls were TACE-expressing PCI-13 cells stained with normal goat IgGor anti-TACE antibodies, respectively (Supplementary Fig. 1). To estimate fractions of normalepithelial cells or tumor cells in normal or tumor tissues, respectively, we stained the tissueswith anti-cytokeratin antibodies (data not shown).
TACE sheddase activity assayThe assay was performed using the previously described method (28), modified by us asfollows. Briefly, cultured cells (1 × 10⁶) were lysed in 50 μl of lysis buffer, and fresh tissues(50 mg) were homogenized using the tissue grinder system (Fisher Scientific, Pittsburgh, PA)and lysed in 500 μl of lysis buffer on ice, for 1 h. The lysis buffer was composed of Tris-HCl(50 mM), NaCl (150 mM), SDS (0.1%), sodium deoxycholate (1%), Nonidet P40 (1%) andTriton X-100 (1%), and EDTA-free protease inhibitor cocktail (Roche Applied Science). Thelysates were centrifuged at 16,000 g for 20 min, and the supernatants were collected and tested.TACE enzymatic assay was performed with the 150 μl mixture of 10 μg lysate proteins, assaybuffer [Tris-HCl (50 mM, pH 7.4), NaCl (25 mM), glycerol (4%), EDTA-free protease inhibitorcocktail (Roche Applied Science)], and 50 μM of TACE-specific fluorophore/quencher-capped-end substrate with the amino-acid sequence Abz-Leu-Ala-Gln-Ala-Val-Arg-Ser-Ser-Ser-Arg-Dap(Dnp)-NH2 containing the TACE specific cleavage site Ala-Val (PeptideInternational, Louisville, KY). The enzymatic reaction was induced by the incubation of thelysate/substrate mixture at room temperature for 3 h. The fluorescence was measured in a LS55
Ge et al. Page 4
Cancer Epidemiol Biomarkers Prev. Author manuscript; available in PMC 2010 November 1.
NIH
-PA Author Manuscript
NIH
-PA Author Manuscript
NIH
-PA Author Manuscript

Luminescence Spectrometer (Perkin-Elmer, Fremont, CA) using an excitation wavelength(λex) of 320 nm and an emission wavelength (λem) of 420 nm. Recombinant TACE (rTACE)(1-100 ng), a specific inhibitor of TACE (recombinant tissue inhibitor of metalloproteases-3 -rTIMP-3,100 mM), a specific inhibitor of matrix metalloproteases (MMPs) (rTIMP-1, 100mM) (R&D Systems), and a general inhibitor of metalloproteases (EDTA, 10 mM) were usedto assess the specificity of the TACE sheddase assay. The data are presented as TACE activityunits, computed by the following formula: TACE activity units = Experimental sample meanfluorescence intensity (MFI) – Background sample MFI.
RNA interferenceA pool of three human TACE siRNA silencers with the sequences 614 –UAACAAAUCUCCAAAGUGGtt, CCACUUUGGAGAUUUGUUAtt; 784 –UUUCACUCGAUGAACAAGCtt, GCUUGUUCAUCGAGUGAAAtt; and 815 –UGUUCUUCAUGGGAUCUGGtt, CCAGAUCCCAUGAAGAACAtt was purchased fromSanta Cruz Biotechnology (Santa Cruz, CA); and individual TACE siRNA with the sequencess13718 - GUGGAUGGUAAAAACGAAtt, UUCGUUUUUACCAUCCACCac; s13719 -GGCGAUCACGAGAACAAUAtt, UAUUGUUCUCGUGAUCGCCac s13720 -GGAUGUAAUUGAACGAUUUtt, AAAUCGUUCAAUUACAUCCtg were obtained fromApplied Biosystems/Ambion (Austin, TX). Control siRNA with the sequenceUUCUCCGAACGUGUCACGUTT, ACGUGACACGUUCGGAGAATT was purchasedfrom Santa Cruz Biotechnology. Transduction of PCI-13 cells with siRNA was performedusing lipofectamine 2000 (Invitrogen, Carlsbad, CA). Briefly, PCI-13 cells were grown in six-well plates to 40-50% confluency. One to two hundred picomoles of siRNA solutions weremixed with 10 μl of lipofectamine in 200 μl of Opti-MEM I Reduced Serum Medium(Invitrogen). After 30 min of incubation at room temperature, the siRNA/lipofectamine mixturewas diluted with 800 μl of Opti-MEM I Reduced Serum Medium and added to PCI-13 cells.The cells and siRNA/lipofectamine mixture were incubated for 5 h at 37° C, supplementedwith 1 ml of DMEM medium containing 20% FCS, and cultured for 24 to 96 h. The siRNAtransfection efficiency was monitored using 6h co-transfection of PCI-13 cells with TACEsiRNA and siGLO Green fluorescent oligonucleotide transfection indicator (Thermo FisherScientific Dharmacon, Lafayette, CO), and measuring the cell fluorescence by flow cytometry.The flow cytometry data were analyzed and percentages of transfected cells were determinedusing the Summit v4.3 software and histogram subtraction tool (Dako Colorado Inc., FortCollins, CO).
StatisticsThe data are reported as means (± SD), and medians, quartiles and ranges. The statisticalsignificance of differences between the results was tested using a two-sided unpaired Student'st test. The results were considered significantly different when p≤0.05. Correlations betweendata were assessed using the Pearson's correlation coefficient test. Specificity and sensitivityof the TACE sheddase activity assay or TACE ELISA were assessed using the receiveroperating characteristic (ROC) curves. Cut-off was defined as a result which multiplication ofsensitivity and specificity gave the highest value. Cut-off was also defined by median. Risk oftumor recurrence was tested using Kaplan-Meier, multi-parametric Cox and binary logisticregression analyses. The statistical analyses were performed using NCSS 2000 StatisticalSoftware (Kaysville, UT).
ResultsTACE is overexpressed in HNC cells and tissues
To determine whether HNC cells and tissues overexpresses TACE, we investigated the levelof TACE protein expression in cultured HNC cells and NHEK keratinocytes, and fresh HNC
Ge et al. Page 5
Cancer Epidemiol Biomarkers Prev. Author manuscript; available in PMC 2010 November 1.
NIH
-PA Author Manuscript
NIH
-PA Author Manuscript
NIH
-PA Author Manuscript
and normal oral mucosal tissues (Fig. 1). Using Western blot analysis, we consistently detectedtwo characteristic immunoreactive protein bands, corresponding to the 120 kD immature(inactive) form and 100 kD mature (active) form of TACE in the blots of lysates of all testedcell lines and tissues, including cultured normal keratinocytes and HNC cell lines, andrandomly selected normal oral mucosa and HNC primary tumor tissues (Figs. 1a-b). The levelsof both immature and mature TACE forms in HNC cell lines and tissues were found to behighly increased relative to normal cell lines and tissues, respectively. However, the HNC celllines and tissues varied considerably in their TACE levels. Thus, the HNC cell lines derivedfrom metastases and the PCI-13-26 clone of the PCI-13 cell line, which released increasedlevels of TACE-dependent soluble TNFR1 (data not shown), contained notably higher levelsof both TACE forms than the cell lines derived from primary tumors or the uncloned PCI-13cell line, respectively.
These findings were confirmed and extended by quantitative measurement of total TACEprotein in the lysates of cells and tissues using TACE ELISA (Figs. 1c-d). Therefore, all testedHNC cell lines showed significantly higher total TACE protein levels than normalkeratinocytes, and the HNC cell lines derived from metastases and the PCI-13-26 clonecontained significantly higher levels of TACE protein than cell lines derived from primarytumors and the PCI-13 cell line, respectively (Fig. 1c). Remarkably, the median (0.44 ng) andrange (0.07-1.07 ng) values of TACE protein in HNC tumor tissues showed higher levels thanthe median (0.17 ng) and range (0.05-0.40 ng) values of TACE protein in normal oral mucosa.The difference between median values was 2.6 fold, and highly statistically significant(p<0.0001, Fig. 1d).
To determine which cells in normal oral mucosa and HNC tumors express TACE, weperformed fluorescence- and light-microscopic analyses of the tissue sections followingstaining with fluorescent anti-TACE antibodies and hematoxylin-eosin, respectively. Wefound that only a small proportion of the cell populations in normal oral mucosa, including thetiny tiers of basal layer and supra-basal layer cells of the stratified squamous epithelium liningand rare fibroblasts in the lamina propria, were weakly stained with anti-TACE antibodies(Figs. 1e-h). In sharp contrast, in HNC tumors, all cancer cells and especially those presentaround the blood vessels were strongly stained with anti-TACE antibodies, sharply contrastingwith the unstained cancer stroma consisting of normal connective tissue (Figs. 1g-h) and thelarge majority of normal oral mucosal epithelial and lamina propria cells (Figs. 1e-f).Fluorometric analyses showed that HNC tissue cells expressed significantly higher levels ofTACE than normal epithelial tissue cells (Supplementary Fig. 2). These findings confirm thatnormal oral mucosa express low levels of TACE while HNC tumors express high levels ofTACE, and demonstrate that the source of TACE in normal oral mucosa is mostly epithelialbasal layer cells, while in HNC tissues the source is exclusively cancer cells.
TACE sheddase activity assayThe levels of TACE mature (active) form did not consistently correspond to the levels of TACEimmature (inactive) form in Western blots of either cultured HNC cells or HNC tissues (Figs.1a-b), indicating that TACE sheddase activity might be a better marker of TACE function intumor tissues than TACE protein expression. However, while the activity of matrixmetalloproteinases in tumor tissues has been correlated with an aggressive tumor phenotype(4), TACE sheddase activity has not been investigated previously in tumor tissues. To studyTACE sheddase activity in HNC tissues, we modified a previously described TACE sheddaseactivity assay (28). The modified assay was based on the peptide substrate containing theTACE-specific TNF cleavage site Ala-Val. It reproducibly measured TACE sheddase activityin the solutions of rTACE or HNC cell lysates, and showed strong linear correlations betweenthe quantities of rTACE or HNC cell lysates and the levels of sheddase activity (Figs. 2a-b).
Ge et al. Page 6
Cancer Epidemiol Biomarkers Prev. Author manuscript; available in PMC 2010 November 1.
NIH
-PA Author Manuscript
NIH
-PA Author Manuscript
NIH
-PA Author Manuscript
In addition, both rTACE and HNC cell-derived sheddase activities were blocked by the TACE-specific inhibitor TIMP-3 or the general metalloprotease inhibitor EDTA, but not by thespecific inhibitor of matrix metalloproteases (MMPs) TIMP-1 (Fig. 2c). TACE siRNAtreatment consistently induced in PCI-13 cells similar and profound decreases in TACE proteinexpression and TACE activity (Experiment in Fig. 2d-e: 86% inhibition of both TACE proteinand TACE activity; Means of 10 experiments: TACE protein, 74% inhibition; TACE activity,70% inhibition). Therefore, in our experimental system the modified TACE sheddase activityassay was specific for TACE and was robust. The assay measured TACE sheddase activity innanograms of recombinant TACE and micrograms of cell lysates, and thus was highlysensitive. It ably discriminated the amounts of TACE sheddase activity in ranges of low,intermediate and high concentrations of recombinant TACE and cell lysates, and was highlyprecise. It was performed in 96-well plates, using multi-channel pipettes, which enabled highthroughput testing of a large number of samples in a short period of time, and was easy toperform. In addition, the assay demonstrated low intra- and inter-experimental variation, andwas reproducible.
TACE sheddase activity is increased in HNCUsing the modified TACE sheddase assay, we determined that the lysates of all tested HNCcell lines had significantly higher TACE activity than that of normal keratinocytes, and thelysates of cell lines derived from HNC metastases and the PCI-13-26 clone had significantlyhigher TACE sheddase activity than that of cell lines derived from primary tumors or theuncloned PCI-13 cell line, respectively (Fig. 3a). These data were similar to those of totalTACE protein expression assessed by ELISA (Fig. 1c). The median (17.9) and range (3.2-57.8)values of TACE activity units in HNC tissues were substantially higher than the median (5.2)and range (0.2-18.1) values of TACE activity units in normal oral mucosa tissues (Fig. 3b).The difference between the medians was 3.4-fold, and highly statistically significant(p<0.0001, Fig. 3b). In addition, the specific TACE activity per ng of TACE protein showedsignificant higher levels (p=0.0046, Fig. 3c) in HNC tissues relative to normal tissues. TACEELISA discriminated HNC from normal tissues with 90.3% sensitivity and 75.0% specificity,based on the ROC differentiation area of 89.7% and optimal cut-off of 0.24 TACE ng(p<0.0001). Similarely, the TACE sheddase activity assay discriminated HNC from normaltissue with 77.8% sensitivity and 93.7% specificity, resulting from the ROC differentiationarea of 91.6% and optimal cut-off of 10.9 TACE activity units (p<0.0001). Based on its largerROC differentiation area, it could be predicted that the TACE activity assay would betterdiscriminate HNC from normal tissue than the TACE ELISA.
These findings demonstrate that HNC cells and tissues have not only highly increased TACEprotein expression, but also a significantly and more consistently higher TACE sheddaseactivity relative to normal cells and tissues.
Increased TACE in HNC is biologically relevantTo determine the biological relevance of increased expression and activity of TACE in HNC,we examined the effect of TACE silencing by TACE siRNA on the shedding of TACE-dependent cancer growth factors AR and TGF-α, and cancer protecting factors TNFR1 andTNFR2 by HNC cells. The siRNA transfection was performed with a consistently highefficiency of 78 to 88%, as determined by PCI-13 cell co-transfection with TACE siRNA andsiGLO fluorescent probe and flow cytometry (Supplementary Fig. 3). The silencing ofTACE (Fig. 2d-e) resulted in a significant reduction of shedding of AR (84%, Fig. 4a), TGF-α (36%, Fig. 4b), TNFR1 (84%, Fig. 4c) and TNFR2 (78%, Fig. 4d). These findings indicatethat shedding of tumorogenic and tumor protective molecules is a function of TACE in HNCcells.
Ge et al. Page 7
Cancer Epidemiol Biomarkers Prev. Author manuscript; available in PMC 2010 November 1.
NIH
-PA Author Manuscript
NIH
-PA Author Manuscript
NIH
-PA Author Manuscript

Increased TACE activity is associated with HNC recurrenceThe increased TACE activity in cancer tissues might contribute to growth and survival of cancercells and therefore growth and recurrence of HNC tumors. We tested this possibility bycorrelating TACE protein expression and TACE sheddase activity with size, likelihood to recur(Fig. 5a-b), and lymph node metastases of HNC primary tumors. We found that both TACEprotein and TACE sheddase activity levels were higher in T3/T4 (A2) than in T1/T2 (A1)primary tumors. However, the differences were more prominent and only statisticallysignificant for TACE activity (p=0.05), but not for TACE protein expression (p=0.14). T1/T2-T3/T4 primary tumors that developed recurrences after initial therapy (R1-2) showedsignificantly increased levels of TACE sheddase activity (p=0.0012), but not of TACE protein(p=0.15) relative to T1/T2-T3/T4 primary tumors that did not develop recurrences (NR1-2).Recurrent tumors (R3) had significantly higher TACE protein and more prominently higherTACE activity levels than T1/T2 (A1) and NR1-2 primary tumors (TACE protein, Fig. 5a:p=0.0058 and p=0.026; TACE activity, Fig. 5b: p<0.0001 and p=0.0008, respectively). Inaddition, TACE sheddase activity, but not TACE protein expression, was significantly higherin R3 than in T3/T4 (A2) primary tumors (TACE protein, Fig. 5a: p=0.21; TACE activity, Fig.5b: p=0.042). In sharp contrast, neither TACE protein nor TACE sheddase activity differed inR1 vs R2, and in R1 or R2 vs R3 tumors; and in NR1 vs NR2 primary tumors indicating theirbiological similarity. Kaplan-Meier hazard assessment of tumor recurrence showed that therisk of tumor recurrence was significantly greater (p<0.0001) in HNC patients whose primarytumors had >17.5 TACE activity units per 10 μg of tissue lysate protein than in patients whoseprimary tumors had ≤17.5 (Fig. 5c). Moreover, Cox regression analysis showed without cut-off that the risk of tumor recurrence was dependent in HNC patients on the levels of TACEactivity in primary tumors (p=0.004, odds ratio 1.068, confidence interval 1.021-1.117, andincrease in recurrence risk of 6.8% for the increase of TACE activity units by 1). It alsoappeared that primary tumors with higher TACE activity had a higher likelihood of earlierrecurrence than those having lower TACE activity. ROC curve analysis, using 83.4%differentiation area and optimal cut-off of 17.5 TACE activity units, showed that the TACEsheddase activity assay was able to discriminate R1-2 from NR1-2 primary tumors with the92.3% sensitivity and 77.4% specificity (p<0.0001). The cut-off and related sensitivity andspecificity defined by ROC curve were very similar to those defined by the more commonlyused median-based method (17.1, 92.9% and 67.7%, respectively).
Fifty two percent of NR1-2 primary HNC tumors, which had lower TACE activity and did notrecur, were associated with lymph node metastases. In contrast, 71% of R1-2 primary HNCtumors, which had higher TACE activity and recurred after initial treatment, were associatedwith lymph node metastases. These data show that more R1-2 primary tumors than NR1-2primary tumors are associated with both increased TACE activity and lymph node metastases.In the context of our findings that the metastasis-originated HNC cells have increased TACEactivity relative to the primary tumor-originated HNC cells, the results indicate that theincreases in TACE activity in primary tumors may be related to lymph node metastases.However, Kaplan-Meier hazard analysis showed that, in sharp contrast to TACE activity,lymph node status (p=0.219), but also TACE protein levels (p=0.075) and size (p=0.152) ofprimary tumors were not risk factors of tumor recurrence. Similarly, multi-parametric Coxregression analysis demonstrated that only TACE sheddase activity (p=0.001, odds ratio 1.110,confidence interval 1.042-1.182, increase in recurrence risk of 11% for the increase of TACEactivity units by 1), but not TACE protein level (p=0.389, odds ratio 0.324, confidence interval0.025-4.203), size (p=0.390, odds ratio 0.773, confidence interval 0.430-1.390) and/or lymphnode status (p=0.152, odds ratio 2.476, confidence interval 0.716-8.566) of primary tumors,was risk factor of tumor recurrence. These findings indicate that TACE activity is anindependent prognostic factor that excludes other tested factors.
Ge et al. Page 8
Cancer Epidemiol Biomarkers Prev. Author manuscript; available in PMC 2010 November 1.
NIH
-PA Author Manuscript
NIH
-PA Author Manuscript
NIH
-PA Author Manuscript

These novel observations show the biological and clinical association of TACE sheddaseactivity and, to a lesser extent, TACE protein expression in HNC, and indicate that increasedTACE activation could play a role in HNC recurrence, and could be potentially a discriminativebiomarker of the likelihood of HNC tumors to recur after initial treatment.
DiscussionHNC is a life-threatening malignancy with a 50% mortality rate, which affects more than25,000 persons per year in the US (29). HNC is characterized by destructive/mutilating localgrowth and tissue invasion, and frequent development of regional lymph node metastases, butrare development of distant metastases. The major medical problem in HNC is local recurrencethat occurs following the initial therapy of primary tumors (30). Reliable identification ofaggressive tumors would be of a great importance for prognosis and effective treatment ofHNC as well as other cancers. Recent studies have suggested that increased quantity and/oractivity of EGFR and MMP-9 in cancer tissues and plasma might be significant biomarkers ofshortened relapse-free survival in HNC patients. However, no validated biomarkers arecurrently available to discriminate aggressive from non-aggressive tumors (1-4).
Our study shows that tissue levels of both TACE sheddase activity and TACE protein are highlyincreased in HNC and can distinguish HNC from normal oral mucosa. More importantly, thisstudy also demonstrates that increased TACE sheddase activity in primary tumors indicates asignificantly increased risk of cancer recurrence. The increased TACE activity is also a specificand sensitive biomarker that can discriminate between primary tumors that will recur afterinitial treatment and primary tumors that will not recur. The Kaplan-Meier analysis and COXmultivariate analysis indicated that only TACE sheddase activity assay, but not TACE ELISA,tumor size or lymph node status of primary tumors, could significantly predict the risk of HNCrecurrence. These findings suggest that TACE sheddase activity is a promising new cancerbiomarker that could be developed into a reliable and clinically useful marker for accurate earlydiscrimination of aggressive from non-aggressive HNC, and perhaps other cancers. Such abiomarker would enable clinicians to make an early precise prediction of the outcome of cancer,and timely choose and apply the most appropriate treatment for a given patient.
The increased TACE sheddase activity in cancer tissues reflects the cancer ability to releaseincreased levels of cancer growth and protective factors, and consequently the increased abilityof cancer to grow and recur. The increased EGFR expression in cancer tissues indicates thecancer increased ability to respond to TACE-generated cancer growth factors, andconsequently the cancer increased ability to grow. The increased MMP-9 activity reflects theincreased cancer ability to cleave extracellular matrix components, and consequently theincreased ability of cancer to invade surrounding tissues and generate metastases. Although itis unknown at this time which of these cancer biomarkers will prove to be the most clinicallyuseful for cancer prognosis, they are all highly promising and might be complementary. Thus,the individual and, perhaps more effectively, simultaneous analyses of two or more of thesebiomarkers might lead to the development of reliable prognostic tests for HNC, and possiblyother epithelial cancers. Large, prospective clinical studies of the multiple biomarkers on thesame groups of cancer patients using multivariate regression analyses will be needed todetermine these possibilities (31).
TACE sheddase activity assay is a high-throughput, highly sensitive and highly specific assaythat can be easily scalable for assessment of large numbers of clinical samples. The assay couldbe performed with relatively small quantities of tissue samples (i.e., 50 mg) that can be obtainedby surgical or core-needle biopsy of tumors. Therefore, the assay could be applicable in thelarge scale, routine clinical testing of tumor samples.
Ge et al. Page 9
Cancer Epidemiol Biomarkers Prev. Author manuscript; available in PMC 2010 November 1.
NIH
-PA Author Manuscript
NIH
-PA Author Manuscript
NIH
-PA Author Manuscript
In summary, our study is the first to investigate TACE sheddase activity in cancer tissues andto demonstrate increased TACE sheddase activity in HNC relative to normal tissues, and highincreases of TACE sheddase activity in primary HNC tumors likely to recur relative to thoseunlikely to recur. These novel findings could lead to the validation of TACE sheddase activityas a clinically valuable cancer biomarker, to discriminate aggressive from non-aggressivecancer, and to identify patients with aggressive cancer who may benefit from therapy.
Supplementary MaterialRefer to Web version on PubMed Central for supplementary material.
AcknowledgmentsThe authors thank Dr. Jonas T. Johnson for critical review of the manuscript; Dr. Hannah Rabinowich for help withthe siRNA efficiency experiments; and Jennifer Tan and Kublo Lyubov for technical assistance.
Financial support: This study was supported by research funding from the National Institute of Health grants PO1DE13059, RO1 DE14775 and RO1 DE17150, and from the Pennsylvania Department of Health grant to N.L.V.
References1. Brinkman BMN, Wong DTW. Disease mechanism and biomarkers of oral squamous cell carcinoma.
Current Opinion Oncology 2006;18:228–233.2. Almadori G, Busso F, Paludetti G. Should there be more molecular staging of head and neck cancer
to improve the choice of treatments and thereby improve survival? Current Opinion OtolaryngologyHead Neck Surgery 2008;16:117–126.
3. Bradley PJ, MacLennan K, Brankenhoff RH, Leemans CR. Status of primary tumor surgical marginsin squamous head and neck cancer: prognostic implications. Current Opinion Otolaryngology HeadNeck Surgery 2007;15:74–81.
4. Rosenthal EL, Matrisian LM. Matrix metalloproteases in head and neck cancer. Head Neck2006;28:639–648. [PubMed: 16470875]
5. Black RA, Doedens JR, Mahimkar R, et al. Substrate specificity and inducibility of TACE (tumornecrosis factor alpha-converting enzyme) revisited: the Ala-Val preference, and induced intrinsicactivity. Biochemical Society Symposia 2003;70:39–52.
6. Lee DC, Sunnarborg SW, Hinkle CL, et al. TACE/ADAM17 processing EGFR ligands indicates a roleas a physiological convertase. Ann NY Acad Sci 2003;995:22–38. [PubMed: 12814936]
7. Black RA. Tumor necrosis factor-alpha converting enzyme. Int J Biochem Cell Biol 2002;34:1–5.[PubMed: 11733179]
8. Gschwind A, Hart S, Sischer OM, Ullrich A. TACE cleavadge of proamphiregulin regulates GPCR-induced proliferation and motility of cancer cells. EMBO J 2003;22:2411–21. [PubMed: 12743035]
9. Zhang Q, Thomas SM, Lui VWY, et al. Phosphorylation of TNF-a converting enzyme by gastrin-releasing peptide induces amphiregulin release and EGF receptor activation. PNAS 2006;103:6901–6. [PubMed: 16641105]
10. Peschon JJ, Slack JL, Reddy P, Stocking KL, Sunnarborg SW, Lee SC. An essential role forectodomain shedding in mammalian development. Science 1998;282:1281–4. [PubMed: 9812885]
11. Normanno NC, Bianco, Deluca A, Salomon DS. The role of EGF-related peptides in tumor growth.Frontiers Bioscience 2001;6:D685–707.
12. Kenny PA, Bissell MJ. Targeting TACE-dependent EGFR ligand shedding in breast cancer. J ClinInvest 2007;117:337–45. [PubMed: 17218988]
13. Franovic A, Robert I, Smith K, et al. Multiple acquired renal carcinoma tumor capabilities abolishedupon silencing of ADAM17. Cancer Res 2006;66:8083–90. [PubMed: 16912185]
14. Borrell-Pages M, Rojo F, Albanell J, Baselga J, Arribas J. TACE is required for the activation of theEGFR by TGF-α in tumors. EMBO J 2003;22:1114–24. [PubMed: 12606576]
Ge et al. Page 10
Cancer Epidemiol Biomarkers Prev. Author manuscript; available in PMC 2010 November 1.
NIH
-PA Author Manuscript
NIH
-PA Author Manuscript
NIH
-PA Author Manuscript
15. Balkwill F, Mantovani A. Inflammation and cancer: back to Virchow? Lancet 2001;357:539–45.[PubMed: 11229684]
16. Cope AP, Liblau RS, Yang XD, et al. Chronic tumor necrosis factor alters T cell responses byattenuating T cell receptor signaling. J Exp Med 1997;185:1573–84. [PubMed: 9151895]
17. Isomaki P, Panesar M, Annenkov A, et al. Prolonged exposure of T cells to TNF down-regulatesTCRζ and expression of the TCR/CD3 complex at the cell surface. J Immunol 2001;166:5495–507.[PubMed: 11313388]
18. Balkwill F, Osborne R, Burke F, et al. Evidence for tumor necrosis factor/cachectin production incancer. Lancet 1987;2:1229–32. [PubMed: 2890853]
19. Soylu L, Ozcan C, Cetik F, et al. Serum levels of tumor necrosis factor in squamous cell carcinomaof head and neck. Amer J Otolaryn 1994;15:281–5.
20. Aderka D, Englemann H, Hornik V, et al. Increased serum levels of soluble receptors for tumornecrosis factor in cancer patients. Cancer Res 1991;51:5602–7. [PubMed: 1655258]
21. Lendeckel U, Kohl J, Arndt M, Carl-McGrath S, Donat H, Rocken C. Increased expression of ADAMfamily members in human breast cancer and breast cancer cell lines. Journal Cancer Research ClinicalOncology 2005;131:41–8.
22. Karan D, Lin FC, Bryan M, et al. Expression of ADAMs (a disintegrin and metalloproteases) andTIMP-3 (tissue inhibitor of metalloproteinase-3) in human prostatic adenocarcinomas. InternationalJournal Oncology 2003;23:1365–71.
23. Blanchot-Jossic F, Jarry A, Masson D, et al. Up-regulated expression of ADAM17 in human coloncarcinoma: co-expression with EGFR in neoplastic and endothelial cells. J Pathol 2005;207:156–63.[PubMed: 16041691]
24. Yoshimura T, Tomita T, Dixon MF, Axon ARR, Robinson PA, Crabtree JE. ADAMs (a disintegrinand metalloprotease) messenger RNA expression in Helicobacter pylori-infected, normal, andneoplastic gastric mucosa. J Infect Dis 2002;185:332–40. [PubMed: 11807715]
25. Tanaka Y, Miyamoto S, Suzuki SO, et al. Clinical significance of heparin-binding epidermal growthfactor-like growth factor and a disintegrin and metalloprotese 17 expression in human ovarian cancer.Clin Cancer Res 2005;11:4783–92. [PubMed: 16000575]
26. Ringel J, Jesnowski R, Moniaux N, et al. Aberant expression of a disintegrin and metalloproteinase17/tumor necrosis factor-α converting enzyme increases the malignant potential in human pancreaticductal adenocarcinoma. Cancer Res 2006;66:9045–53. [PubMed: 16982746]
27. Takamube Y, Ikebe T, Nagano O, et al. ADAM-17 associated with CD44 cleavage and metastasis inoral squamous cell carcinoma. Virchow's Arch 2007;450:169–77. [PubMed: 17180679]
28. Mohammed FF, Smookler DS, Taylor SEM, et al. Abnormal TNF activity in Timp3-/- mice leads tochronic hepatic inflammation and failure of liver regeneration. Nature Genetics 2004;36:969–77.[PubMed: 15322543]
29. Jemal A, Siegel R, Ward E, et al. Cancer statistics, 2008. CA Cancer J Clin. 200810.3322/CA,2007.0010
30. Vikram B. Changing patterns of failure in advanced head and neck cancer. Arch Otolaryngol1984;11:564–5. [PubMed: 6477272]
31. Sullivan-Pepe M, Etzioni R, Feng Z, et al. Phases of biomarker development for early detection ofcancer. J Natl Cancer Inst 2001;93:1054–61. [PubMed: 11459866]
Ge et al. Page 11
Cancer Epidemiol Biomarkers Prev. Author manuscript; available in PMC 2010 November 1.
NIH
-PA Author Manuscript
NIH
-PA Author Manuscript
NIH
-PA Author Manuscript
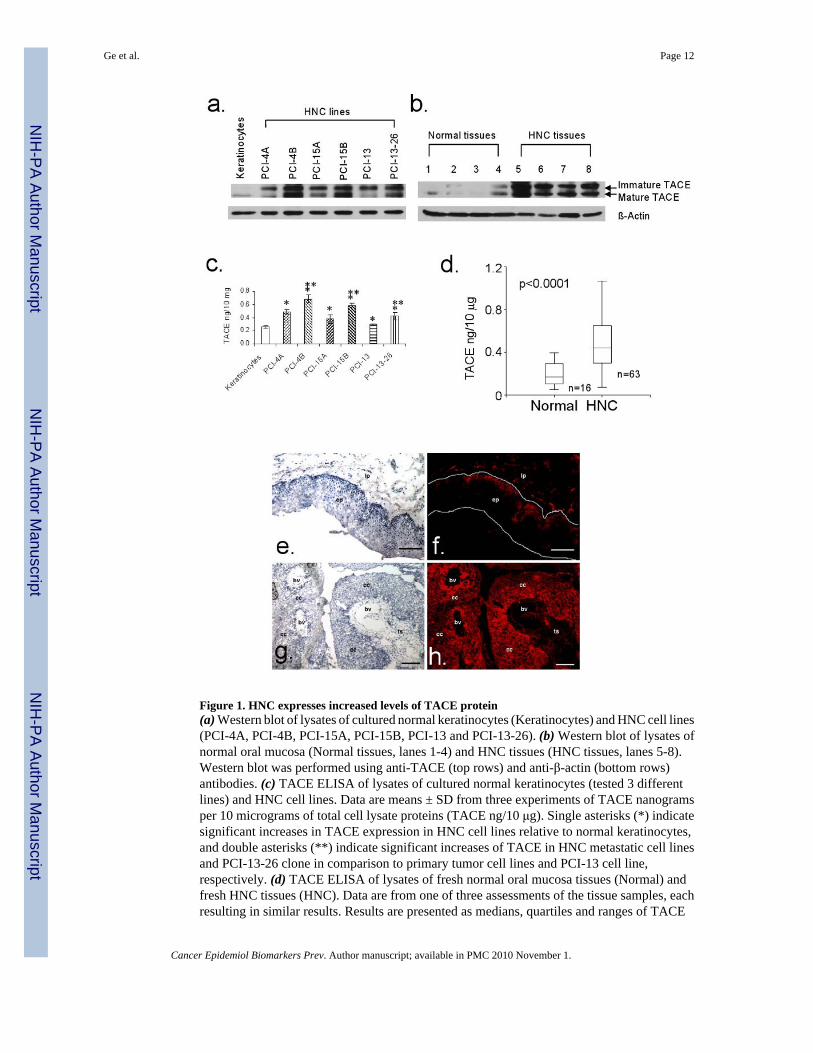
Figure 1. HNC expresses increased levels of TACE protein(a) Western blot of lysates of cultured normal keratinocytes (Keratinocytes) and HNC cell lines(PCI-4A, PCI-4B, PCI-15A, PCI-15B, PCI-13 and PCI-13-26). (b) Western blot of lysates ofnormal oral mucosa (Normal tissues, lanes 1-4) and HNC tissues (HNC tissues, lanes 5-8).Western blot was performed using anti-TACE (top rows) and anti-β-actin (bottom rows)antibodies. (c) TACE ELISA of lysates of cultured normal keratinocytes (tested 3 differentlines) and HNC cell lines. Data are means ± SD from three experiments of TACE nanogramsper 10 micrograms of total cell lysate proteins (TACE ng/10 μg). Single asterisks (*) indicatesignificant increases in TACE expression in HNC cell lines relative to normal keratinocytes,and double asterisks (**) indicate significant increases of TACE in HNC metastatic cell linesand PCI-13-26 clone in comparison to primary tumor cell lines and PCI-13 cell line,respectively. (d) TACE ELISA of lysates of fresh normal oral mucosa tissues (Normal) andfresh HNC tissues (HNC). Data are from one of three assessments of the tissue samples, eachresulting in similar results. Results are presented as medians, quartiles and ranges of TACE
Ge et al. Page 12
Cancer Epidemiol Biomarkers Prev. Author manuscript; available in PMC 2010 November 1.
NIH
-PA Author Manuscript
NIH
-PA Author Manuscript
NIH
-PA Author Manuscript
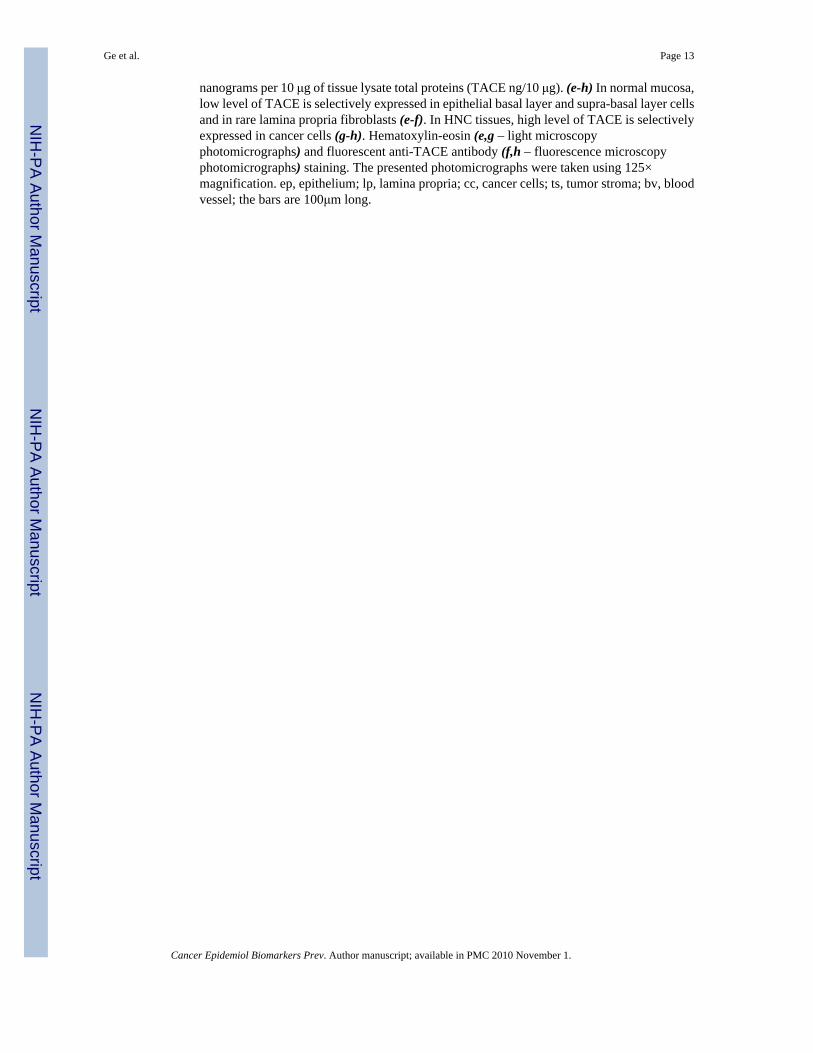
nanograms per 10 μg of tissue lysate total proteins (TACE ng/10 μg). (e-h) In normal mucosa,low level of TACE is selectively expressed in epithelial basal layer and supra-basal layer cellsand in rare lamina propria fibroblasts (e-f). In HNC tissues, high level of TACE is selectivelyexpressed in cancer cells (g-h). Hematoxylin-eosin (e,g – light microscopyphotomicrographs) and fluorescent anti-TACE antibody (f,h – fluorescence microscopyphotomicrographs) staining. The presented photomicrographs were taken using 125×magnification. ep, epithelium; lp, lamina propria; cc, cancer cells; ts, tumor stroma; bv, bloodvessel; the bars are 100μm long.
Ge et al. Page 13
Cancer Epidemiol Biomarkers Prev. Author manuscript; available in PMC 2010 November 1.
NIH
-PA Author Manuscript
NIH
-PA Author Manuscript
NIH
-PA Author Manuscript
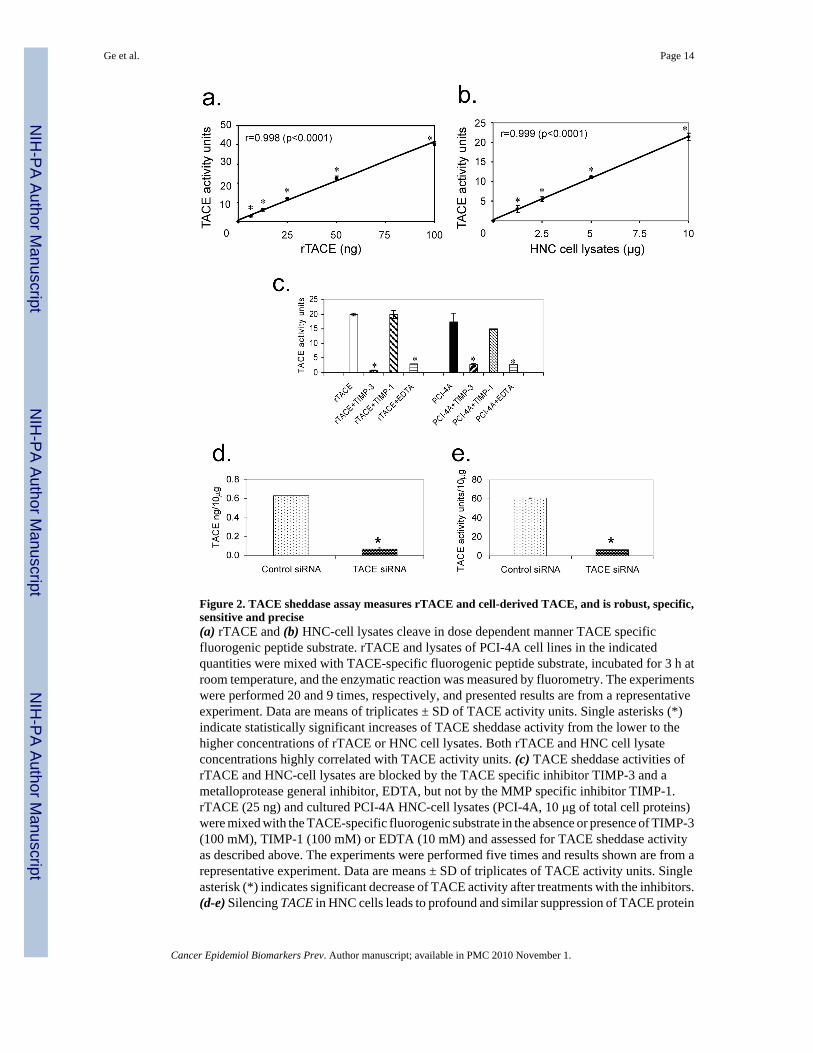
Figure 2. TACE sheddase assay measures rTACE and cell-derived TACE, and is robust, specific,sensitive and precise(a) rTACE and (b) HNC-cell lysates cleave in dose dependent manner TACE specificfluorogenic peptide substrate. rTACE and lysates of PCI-4A cell lines in the indicatedquantities were mixed with TACE-specific fluorogenic peptide substrate, incubated for 3 h atroom temperature, and the enzymatic reaction was measured by fluorometry. The experimentswere performed 20 and 9 times, respectively, and presented results are from a representativeexperiment. Data are means of triplicates ± SD of TACE activity units. Single asterisks (*)indicate statistically significant increases of TACE sheddase activity from the lower to thehigher concentrations of rTACE or HNC cell lysates. Both rTACE and HNC cell lysateconcentrations highly correlated with TACE activity units. (c) TACE sheddase activities ofrTACE and HNC-cell lysates are blocked by the TACE specific inhibitor TIMP-3 and ametalloprotease general inhibitor, EDTA, but not by the MMP specific inhibitor TIMP-1.rTACE (25 ng) and cultured PCI-4A HNC-cell lysates (PCI-4A, 10 μg of total cell proteins)were mixed with the TACE-specific fluorogenic substrate in the absence or presence of TIMP-3(100 mM), TIMP-1 (100 mM) or EDTA (10 mM) and assessed for TACE sheddase activityas described above. The experiments were performed five times and results shown are from arepresentative experiment. Data are means ± SD of triplicates of TACE activity units. Singleasterisk (*) indicates significant decrease of TACE activity after treatments with the inhibitors.(d-e) Silencing TACE in HNC cells leads to profound and similar suppression of TACE protein
Ge et al. Page 14
Cancer Epidemiol Biomarkers Prev. Author manuscript; available in PMC 2010 November 1.
NIH
-PA Author Manuscript
NIH
-PA Author Manuscript
NIH
-PA Author Manuscript
expression (d) and TACE activity (e). TACE was silenced in PCI-13 HNC cells by theirtransduction with a pool of six different TACE siRNAs (TACE siRNA). PCI-13 cellstransduced by scrambled siRNA served as controls (Control siRNA). Forty-eight hours afterthese treatments, the experimental and control samples of PCI-13 cells were lysed. The celllysates were tested for TACE protein expression using ELISA (d) and TACE sheddase activityusing TACE sheddase activity assay (e). The data shown are from a representative experimentof 10 similar experiments performed. d, means ± SD of triplicates TACE ng per 10 μg of celllysate proteins (TACE ng/10 μg); and e, means ± SD of triplicates TACE activity units per 10μg of cell lysate proteins (TACE activity units/10 μg). Single asterisk (*) indicates highlysignificant decreases of TACE protein expression (d, p<0.0001) or TACE sheddase activity(e, p<0.0001) following TACE siRNA treatment relative to control siRNA treatment of PCI-13cells.
Ge et al. Page 15
Cancer Epidemiol Biomarkers Prev. Author manuscript; available in PMC 2010 November 1.
NIH
-PA Author Manuscript
NIH
-PA Author Manuscript
NIH
-PA Author Manuscript
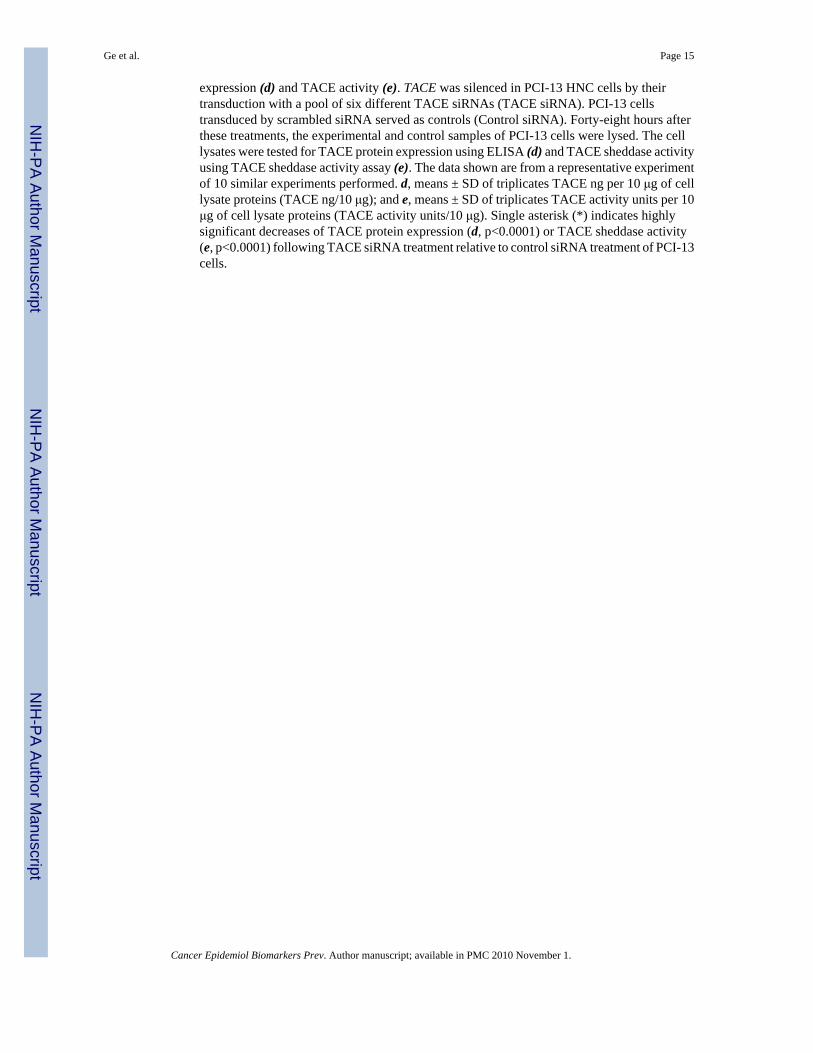
Figure 3. HNC contain increased TACE sheddase activity(a) TACE sheddase activity is enhanced in cultured HNC cells relative to cultured normalkeratinocytes, and in HNC cell lines originated from metastases or PCI-13-26 clone relativeto HNC cell lines originated from primary tumors or the uncloned PCI-13 cell line, respectively.Data are means ± SD of four individual experiments' means of TACE activity units per 10 μgof total cell lysate protein (TACE activity units/10μg). Single asterisk (*) indicates significantlyhigher level of TACE activity in lysates of HNC cell lines than in lysates of normalkeratinocytes (tested three different lines), and double asterisks (**) indicate significantlyhigher levels of TACE activity in cell lysates of metastasis- or PCI-13-26 clone-derived celllines relative to primary tumor-derived or uncloned PCI-13 cell lines, respectively. (b) TACEsheddase activity is significantly higher in HNC tissues (HNC) than in normal oral mucosatissues (Normal). The results are medians, quartiles and ranges of TACE activity units per 10μg of total tissue lysate proteins (TACE activity units/10μg). Data are from one of threeassessments of the same tissue samples, each resulting in similar findings. (c) Specific TACEsheddase activity per ng of TACE protein (TACE activity/TACE ng) is significantly higher inHNC tissues (HNC) relative to normal oral mucosa tissues (Normal).
Ge et al. Page 16
Cancer Epidemiol Biomarkers Prev. Author manuscript; available in PMC 2010 November 1.
NIH
-PA Author Manuscript
NIH
-PA Author Manuscript
NIH
-PA Author Manuscript

Figure 4. Silencing TACE in HNC cells leads to decreased production of TACE-dependent cancergrowth (a-b) and protecting (c-d) factorsTACE siRNA transduction induces suppression of PCI-13 HNC cell ability to release thecancer growth factors AR (a) and TGF-a (b) and the cancer protecting factors TNFR1 (c) andTNFR2 (d). Forty-eight hours after TACE siRNA transduction into PCI-13 cells, the cellculture-conditioned media were assessed by ELISA for the presence of soluble AR, TGF-α,TNFR1 and TNFR2. Data are from a representative experiment of 2 to 5 similar experimentsperformed. They are means ± SD of triplicates of ng of AR, TGF-α, TNFR1 or TNFR2 per 1ml of cell-culture conditioned media of 106 PCI-13 HNC cells (ng/ml/106 cells). Single asterisk(*) indicates significant decrease of a soluble product of PCI-13 cells following TACE siRNAtreatment relative to control siRNA treatment.
Ge et al. Page 17
Cancer Epidemiol Biomarkers Prev. Author manuscript; available in PMC 2010 November 1.
NIH
-PA Author Manuscript
NIH
-PA Author Manuscript
NIH
-PA Author Manuscript

Figure 5. Highly increased TACE sheddase activity in primary HNC tumors is associated with theirpotential to recurResults of HNC tissues presented in Fig. 1d (TACE ELISA) and Fig. 3c (TACE sheddaseactivity) were classified according to the pathological stages. Levels of TACE protein (a) orTACE sheddase activity (b) were compared in all T1/T2 primary tumors (A1), all T3/T4primary tumors (A2), T1/T2-T3/T4 primary tumors that did not recur after initial therapy(NR1-2), T1/T2-T3/T4 primary tumors that recurred after initial therapy (R1-2) and recurrenttumors (R3). The results are presented as medians, quartiles and ranges of TACE ng and TACEactivity units per 10 μg of total tissue proteins (a, TACE ng/10 μg; b, TACE activity unists/10μg), respectively. Statistical significance of data differences is shown. (c) Kaplan-Meier
Ge et al. Page 18
Cancer Epidemiol Biomarkers Prev. Author manuscript; available in PMC 2010 November 1.
NIH
-PA Author Manuscript
NIH
-PA Author Manuscript
NIH
-PA Author Manuscript

probability analysis of tumor recurrence shows the cumulative time-dependent appearance ofrecurrent tumors following treatment of primary tumors containing ≤17.5 (broken line) or>17.5 (continuous line) TACE activity units per 10 μg of HNC tissue lysate proteins. p valuein Fig. 5c is based on the presented Kaplan-Meier curve data.
Ge et al. Page 19
Cancer Epidemiol Biomarkers Prev. Author manuscript; available in PMC 2010 November 1.
NIH
-PA Author Manuscript
NIH
-PA Author Manuscript
NIH
-PA Author Manuscript

NIH
-PA Author Manuscript
NIH
-PA Author Manuscript
NIH
-PA Author Manuscript
Ge et al. Page 20
Table 1Characteristics and classification of patients and their tumors
Stage of disease Age Male Female
NR1-T1/T2-N0 42-81 7 0NR1-T1/T2-N+ 66-75 1 2R1-T1/T2-N0 58 1 0R1-T1/T2-N+ 49-66 2 0NR2-T3/T4-N0 53-88 7 1NR2-T3/T4-N+ 43-92 11 2R2-T3/T4-N0 55-90 2 1R2-T3/T4-N+ 32-78 7 1R3 (primary T1/T2-N0) 60-68 3 0R3 (primary T1/T2-N+) 54 2 0R3 (primary T3/T4-N0) 36-81 7 1R3 (primary T3/T4-N+) 52-64 3 0Unclassified Unknown 3 0Total 32-92 55 8
NR1-T1/T2, T1/T2 primary tumors that did not develop recurrences after initial therapy;
R1-T1/T2, T1/T2 primary tumors that developed recurrences after initial therapy;
NR2-T3/T4, T3/T4 primary tumors that did not develop recurrences after initial therapy;
R2-T3/T4, T3/T4 primary tumors that developed recurrences after initial therapy;
R3, recurrent tumors;
N0, lymph node without metastases;
N+, lymph node with metastases.
Cancer Epidemiol Biomarkers Prev. Author manuscript; available in PMC 2010 November 1.