Shared understanding and idiosyncratic expression in early vocabularies
15
Shared Understanding and Idiosyncratic Expression in Early Vocabularies Julien Mayor a & Kim Plunkett b a FPSE, University of Geneva, Switzerland b Department of Experimental Psychology, University of Oxford, United Kingdom E-mail: [email protected] To what extent do toddlers have shared vocabularies? We examined CDI data collected from 14607 infants and toddlers in five countries and measured the amount of variability between individual lexicons during development for both comprehension and production. Early lexicons are highly overlapping. However, beyond 100 words, toddlers share more words with other toddlers in comprehension than in production, even when matched for lexicon sizes. This finding points to a structural difference in early comprehension and production: Toddlers are generalists in comprehension but develop a unique, expressive voice. Variability in production decreases after two years of age, suggesting convergence to a common expressive core vocabulary. We discuss potential exogenous and endogenous contributions to the inverted U-shaped development observed in young children’s expressive lexical variability. Keywords: Early word learning; Comprehension vs. Production; Language acquisition; Overlap between vocabularies; Lexical diversity Introduction Knowing words that other people know is cru- cial to achieving successful communication. Ut- terances achieve their impact when there is an alignment between the speaker’s expressive vo- cabulary and the listener’s receptive vocabulary. Yet interactions with a restricted number of peo- ple early in life may lead infants and young chil- dren to develop idiosyncratic vocabulary knowl- edge. Several studies have highlighted the en- vironmental contribution to vocabulary develop- ment (Hart & Risley, 1995; Huttenlocher, 1991; Bradley, Caldwell, & Rock, 1988) but evidence is scant as to whether environmental factors influ- ence the composition of comprehension and pro- duction vocabularies evenly. Furthermore, rela- tively little is known about the amount of vari- ability between the composition of individual lex- icons, or the role played by environmental factors in modulating this variability. Environmental fac- tors may shape comprehension and production dif- ferently. A lag between comprehension and pro- duction in early vocabulary development is well attested (Goldin-Meadow, Seligman, & Gelman, 1976; Fenson et al., 1994) and the proportions of word types used in production differs from that found in comprehension (Benedict, 1979). Prag- matic constraints on communication may create a general pressure towards shared receptive vocabu- laries while permitting a greater degree of variabil- ity in expressive vocabularies. However, to date, it remains unclear whether the variability in the com- position of receptive vocabularies differs from the variability in the words infants produce or how this variability evolves during the first few years of life. Quantitative analyses of vocabulary checklists reveal that comprehension is more stable than pro- duction across development: early receptive vo- cabulary scores are more predictive of later scores than are early expressive scores (Fenson et al.,
Transcript of Shared understanding and idiosyncratic expression in early vocabularies
Shared Understanding and Idiosyncratic Expression in EarlyVocabularies
Julien Mayora & Kim PlunkettbaFPSE, University of Geneva, Switzerland
bDepartment of Experimental Psychology, University of Oxford, United KingdomE-mail: [email protected]
To what extent do toddlers have shared vocabularies? We examined CDI datacollected from 14607 infants and toddlers in five countries and measured theamount of variability between individual lexicons during development forboth comprehension and production. Early lexicons are highly overlapping.However, beyond 100 words, toddlers share more words with other toddlersin comprehension than in production, even when matched for lexicon sizes.This finding points to a structural difference in early comprehension andproduction: Toddlers are generalists in comprehension but develop a unique,expressive voice. Variability in production decreases after two years of age,suggesting convergence to a common expressive core vocabulary. We discusspotential exogenous and endogenous contributions to the inverted U-shapeddevelopment observed in young children’s expressive lexical variability.
Keywords: Early word learning; Comprehension vs. Production; Languageacquisition; Overlap between vocabularies; Lexical diversity
Introduction
Knowing words that other people know is cru-cial to achieving successful communication. Ut-terances achieve their impact when there is analignment between the speaker’s expressive vo-cabulary and the listener’s receptive vocabulary.Yet interactions with a restricted number of peo-ple early in life may lead infants and young chil-dren to develop idiosyncratic vocabulary knowl-edge. Several studies have highlighted the en-vironmental contribution to vocabulary develop-ment (Hart & Risley, 1995; Huttenlocher, 1991;Bradley, Caldwell, & Rock, 1988) but evidenceis scant as to whether environmental factors influ-ence the composition of comprehension and pro-duction vocabularies evenly. Furthermore, rela-tively little is known about the amount of vari-ability between the composition of individual lex-icons, or the role played by environmental factorsin modulating this variability. Environmental fac-
tors may shape comprehension and production dif-ferently. A lag between comprehension and pro-duction in early vocabulary development is wellattested (Goldin-Meadow, Seligman, & Gelman,1976; Fenson et al., 1994) and the proportions ofword types used in production differs from thatfound in comprehension (Benedict, 1979). Prag-matic constraints on communication may create ageneral pressure towards shared receptive vocabu-laries while permitting a greater degree of variabil-ity in expressive vocabularies. However, to date, itremains unclear whether the variability in the com-position of receptive vocabularies differs from thevariability in the words infants produce or how thisvariability evolves during the first few years of life.
Quantitative analyses of vocabulary checklistsreveal that comprehension is more stable than pro-duction across development: early receptive vo-cabulary scores are more predictive of later scoresthan are early expressive scores (Fenson et al.,
2 JULIEN MAYORA & KIM PLUNKETTB
1994). Recent statistical modelling based on theseparental checklists have attempted to provide moreaccurate estimates of receptive and vocabularysizes than raw checklist scores permit (Mayor &Plunkett, 2011). These analyses confirm the exis-tence of a substantial developmental lag betweencomprehension and production reported in earlierstudies. However, the results do not indicate theextent to which children share specific vocabu-lary items, neither in production nor comprehen-sion, despite the fact that the database comprisesparents’ judgements about their offspring’s knowl-edge of individual words. In the current paper, weextend Mayor and Plunkett’s (2011) analyses to es-timate the overlap, and hence variability, in the ex-pressive and receptive vocabularies of infants andyoung children.
MethodWe analyse databases compiled from vocabu-
lary checklists collected in five different countries:The MacArthur-Bates CDI, Words and Gestures(MCDI-WG) and Words and Sentences (MCDI-WS) (Fenson, Marchman, Thal, Dale, & Reznick,2007; Dale & Fenson, 1996), and what we willrefer to as “the Danish CDI” (Bleses, Vach, We-hberg, Kristensen, & Madsen, 2007), “the Nor-wegian CDI” (Kristoffersen, Simonsen, Eiesland,& Henriksen, 2012), the “German CDI” (Szagun,Stumper, & Schramm, 2009), all accessed viaCLEX (Jorgensen, Dale, Bleses, & Fenson, 2010),and the “Oxford CDI” (Hamilton, Plunkett, &Schafer, 2000). Details of the databases are pro-vided in Table 1.
Sigmoidal analysisWe apply the method developed for the
MacArthur-Bates CDI (Mayor & Plunkett, 2011).Only age groups consisting of at least 50 infants ortoddlers for each country are included in the analy-ses. The method was originally used to provide anestimate of vocabulary size from CDI scores, butcan also be used to measure the amount of over-lap between vocabularies. The advantages of thismethod are that (1) no detailed knowledge of in-dividual vocabularies is needed other than the per-centage of infants/toddlers knowing a given word
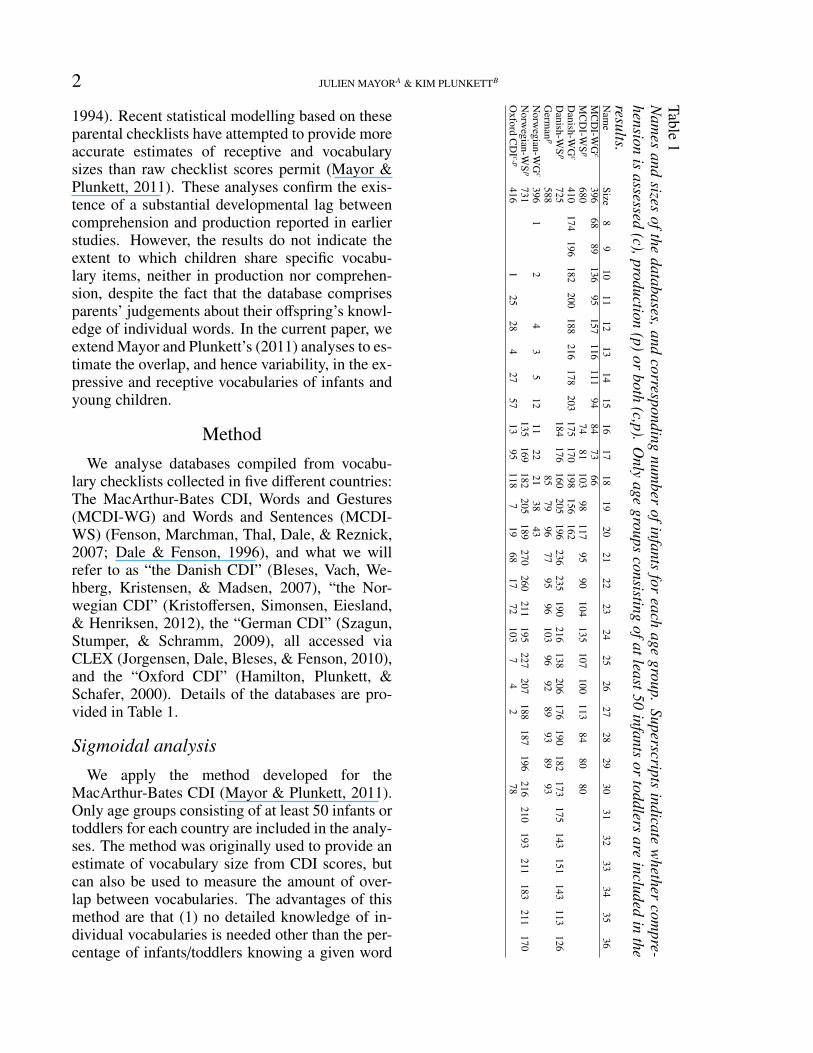
Table1
Nam
esand
sizesofthe
databases,andcorresponding
number
ofinfantsfor
eachage
group.Superscripts
indicatew
hethercom
pre-hension
isassessed
(c),production(p)
orboth
(c,p).O
nlyage
groupsconsisting
ofatleast50infants
ortoddlers
areincluded
inthe
results.N
ame
Size8
910
1112
1314
1516
1718
1920
2122
2324
2526
2728
2930
3132
3334
3536
MC
DI-W
Gc
39668
89136
95157
116111
9484
7366
MC
DI-W
Sp
68074
81103
98117
9590
104135
107100
11384
8080
Danish-W
Gc
410174
196182
200188
216178
203175
170198
156162
Danish-W
Sp
725184
176160
205196
236235
190216
138206
176190
182173
175143
151143
113126
Germ
anp
58885
7996
7795
96103
9692
8993
8993
Norw
egian-WG
c396
12
43
512
1122
2138
43N
orwegian-W
Sp
731135
169182
205189
270260
211195
227207
188187
196216
210193
211183
211170
Oxford
CD
I c,p416
125
284
2757
1395
1187
1968
1772
1037
42
78
LEXICAL OVERLAP 3
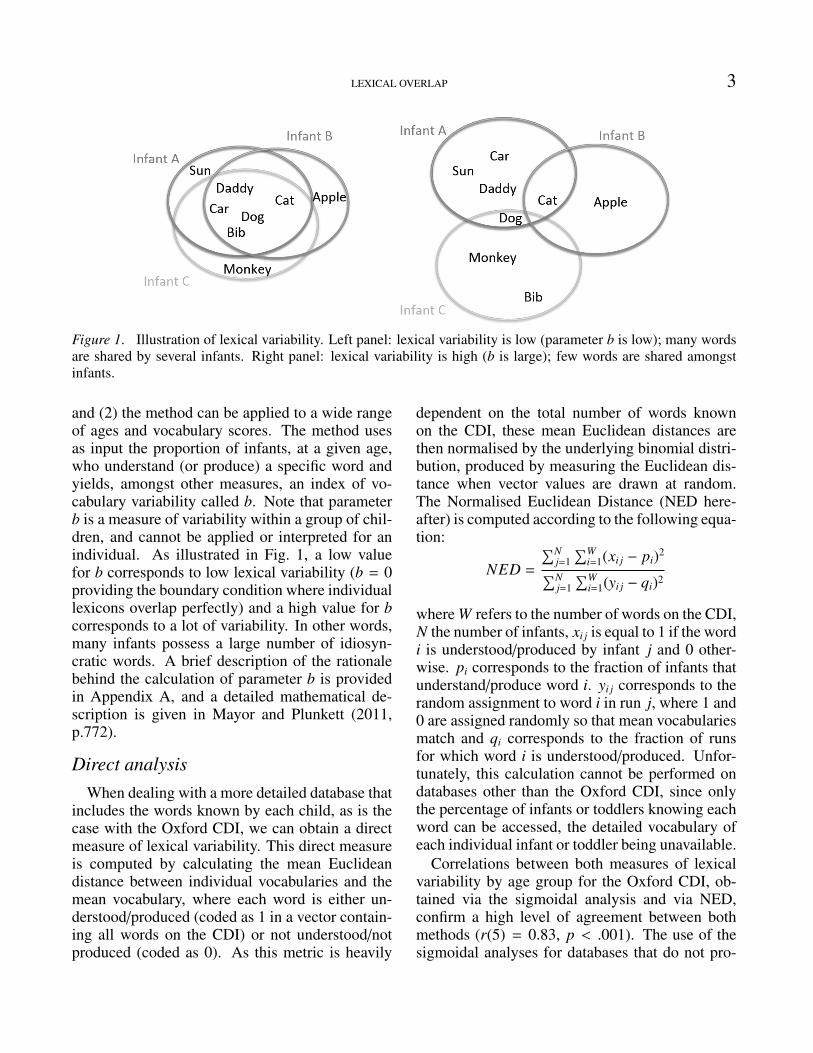
Figure 1. Illustration of lexical variability. Left panel: lexical variability is low (parameter b is low); many wordsare shared by several infants. Right panel: lexical variability is high (b is large); few words are shared amongstinfants.
and (2) the method can be applied to a wide rangeof ages and vocabulary scores. The method usesas input the proportion of infants, at a given age,who understand (or produce) a specific word andyields, amongst other measures, an index of vo-cabulary variability called b. Note that parameterb is a measure of variability within a group of chil-dren, and cannot be applied or interpreted for anindividual. As illustrated in Fig. 1, a low valuefor b corresponds to low lexical variability (b = 0providing the boundary condition where individuallexicons overlap perfectly) and a high value for bcorresponds to a lot of variability. In other words,many infants possess a large number of idiosyn-cratic words. A brief description of the rationalebehind the calculation of parameter b is providedin Appendix A, and a detailed mathematical de-scription is given in Mayor and Plunkett (2011,p.772).
Direct analysisWhen dealing with a more detailed database that
includes the words known by each child, as is thecase with the Oxford CDI, we can obtain a directmeasure of lexical variability. This direct measureis computed by calculating the mean Euclideandistance between individual vocabularies and themean vocabulary, where each word is either un-derstood/produced (coded as 1 in a vector contain-ing all words on the CDI) or not understood/notproduced (coded as 0). As this metric is heavily
dependent on the total number of words knownon the CDI, these mean Euclidean distances arethen normalised by the underlying binomial distri-bution, produced by measuring the Euclidean dis-tance when vector values are drawn at random.The Normalised Euclidean Distance (NED here-after) is computed according to the following equa-tion:
NED =
∑Nj=1∑W
i=1(xi j − pi)2∑Nj=1∑W
i=1(yi j − qi)2
where W refers to the number of words on the CDI,N the number of infants, xi j is equal to 1 if the wordi is understood/produced by infant j and 0 other-wise. pi corresponds to the fraction of infants thatunderstand/produce word i. yi j corresponds to therandom assignment to word i in run j, where 1 and0 are assigned randomly so that mean vocabulariesmatch and qi corresponds to the fraction of runsfor which word i is understood/produced. Unfor-tunately, this calculation cannot be performed ondatabases other than the Oxford CDI, since onlythe percentage of infants or toddlers knowing eachword can be accessed, the detailed vocabulary ofeach individual infant or toddler being unavailable.
Correlations between both measures of lexicalvariability by age group for the Oxford CDI, ob-tained via the sigmoidal analysis and via NED,confirm a high level of agreement between bothmethods (r(5) = 0.83, p < .001). The use of thesigmoidal analyses for databases that do not pro-
4 JULIEN MAYORA & KIM PLUNKETTB
vide details about individual vocabularies is, there-fore, fully justified and can be expected to be reli-able and accurate.
Results
Asymmetric development in the first twoyears of life
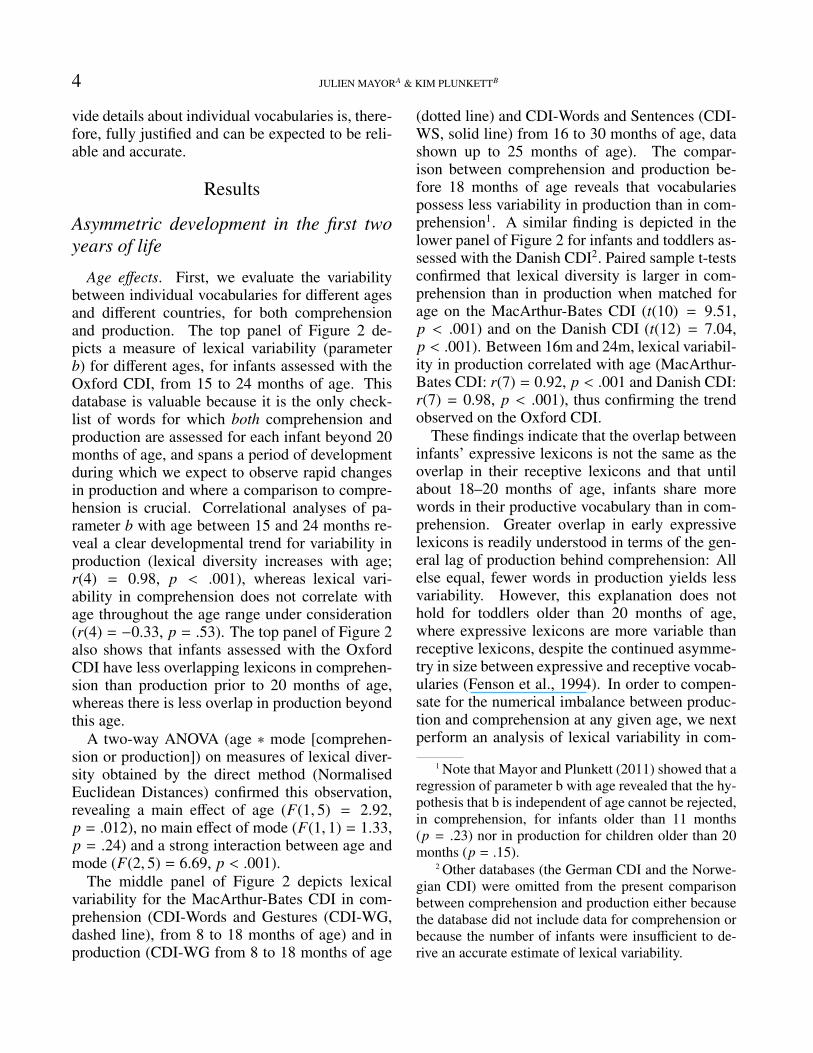
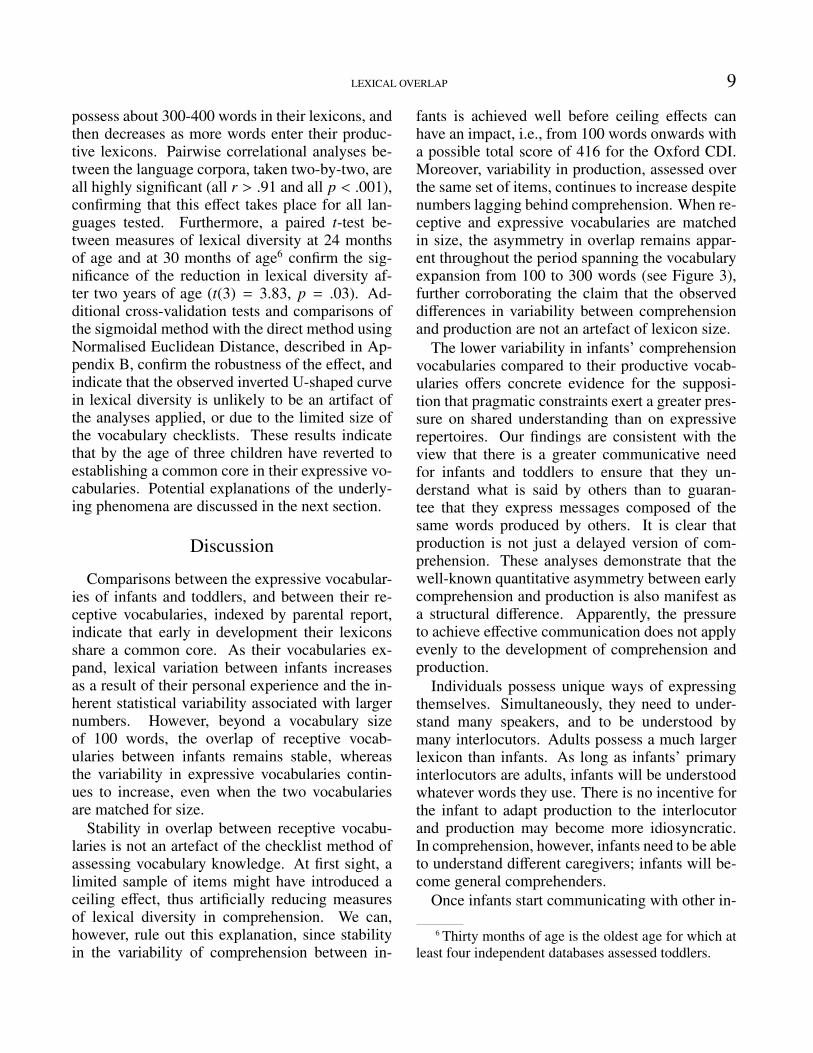
Age effects. First, we evaluate the variabilitybetween individual vocabularies for different agesand different countries, for both comprehensionand production. The top panel of Figure 2 de-picts a measure of lexical variability (parameterb) for different ages, for infants assessed with theOxford CDI, from 15 to 24 months of age. Thisdatabase is valuable because it is the only check-list of words for which both comprehension andproduction are assessed for each infant beyond 20months of age, and spans a period of developmentduring which we expect to observe rapid changesin production and where a comparison to compre-hension is crucial. Correlational analyses of pa-rameter b with age between 15 and 24 months re-veal a clear developmental trend for variability inproduction (lexical diversity increases with age;r(4) = 0.98, p < .001), whereas lexical vari-ability in comprehension does not correlate withage throughout the age range under consideration(r(4) = −0.33, p = .53). The top panel of Figure 2also shows that infants assessed with the OxfordCDI have less overlapping lexicons in comprehen-sion than production prior to 20 months of age,whereas there is less overlap in production beyondthis age.
A two-way ANOVA (age ∗ mode [comprehen-sion or production]) on measures of lexical diver-sity obtained by the direct method (NormalisedEuclidean Distances) confirmed this observation,revealing a main effect of age (F(1, 5) = 2.92,p = .012), no main effect of mode (F(1, 1) = 1.33,p = .24) and a strong interaction between age andmode (F(2, 5) = 6.69, p < .001).
The middle panel of Figure 2 depicts lexicalvariability for the MacArthur-Bates CDI in com-prehension (CDI-Words and Gestures (CDI-WG,dashed line), from 8 to 18 months of age) and inproduction (CDI-WG from 8 to 18 months of age
(dotted line) and CDI-Words and Sentences (CDI-WS, solid line) from 16 to 30 months of age, datashown up to 25 months of age). The compar-ison between comprehension and production be-fore 18 months of age reveals that vocabulariespossess less variability in production than in com-prehension1. A similar finding is depicted in thelower panel of Figure 2 for infants and toddlers as-sessed with the Danish CDI2. Paired sample t-testsconfirmed that lexical diversity is larger in com-prehension than in production when matched forage on the MacArthur-Bates CDI (t(10) = 9.51,p < .001) and on the Danish CDI (t(12) = 7.04,p < .001). Between 16m and 24m, lexical variabil-ity in production correlated with age (MacArthur-Bates CDI: r(7) = 0.92, p < .001 and Danish CDI:r(7) = 0.98, p < .001), thus confirming the trendobserved on the Oxford CDI.
These findings indicate that the overlap betweeninfants’ expressive lexicons is not the same as theoverlap in their receptive lexicons and that untilabout 18–20 months of age, infants share morewords in their productive vocabulary than in com-prehension. Greater overlap in early expressivelexicons is readily understood in terms of the gen-eral lag of production behind comprehension: Allelse equal, fewer words in production yields lessvariability. However, this explanation does nothold for toddlers older than 20 months of age,where expressive lexicons are more variable thanreceptive lexicons, despite the continued asymme-try in size between expressive and receptive vocab-ularies (Fenson et al., 1994). In order to compen-sate for the numerical imbalance between produc-tion and comprehension at any given age, we nextperform an analysis of lexical variability in com-
1 Note that Mayor and Plunkett (2011) showed that aregression of parameter b with age revealed that the hy-pothesis that b is independent of age cannot be rejected,in comprehension, for infants older than 11 months(p = .23) nor in production for children older than 20months (p = .15).
2 Other databases (the German CDI and the Norwe-gian CDI) were omitted from the present comparisonbetween comprehension and production either becausethe database did not include data for comprehension orbecause the number of infants were insufficient to de-rive an accurate estimate of lexical variability.
LEXICAL OVERLAP 5
0
100
200Oxford CDI
0
100
200MacArthur−Bates CDI
Overlap p
ara
mete
r b
8 10 12 14 16 18 20 22 240
100
200Danish CDI
Age [months]
Production
Comprehension
Prod. CDI−WG
Comp. CDI−WG
Prod. CDI−WS
Prod. CDI−WG
Comp. CDI−WG
Prod. CDI−WS
Figure 2. Amount of variability between individual vocabularies in comprehension and in production: a low valuefor parameter b corresponds to low variability whereas a high value means only few words are shared across thepopulation of children. Note that the proportion of shared words is only matched in comprehension and productionat around 20 months of age. For any other age, differences in the degree of overlap between individual lexiconsare present in comprehension and production. Error bars represent the interval around the optimal value b foundby regression, for which the residual error between the data and the fit do not exceed by more than 5% the errorassociated with the best fit.
prehension and production as a function of vocab-ulary size.
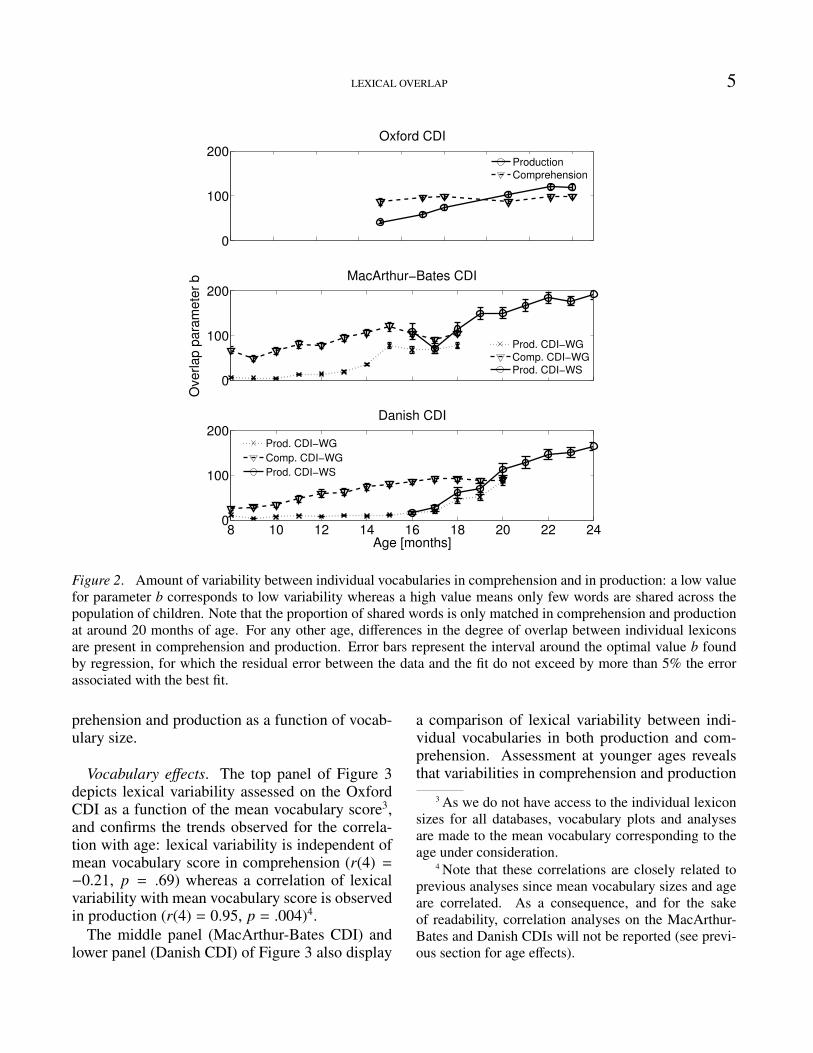
Vocabulary effects. The top panel of Figure 3depicts lexical variability assessed on the OxfordCDI as a function of the mean vocabulary score3,and confirms the trends observed for the correla-tion with age: lexical variability is independent ofmean vocabulary score in comprehension (r(4) =−0.21, p = .69) whereas a correlation of lexicalvariability with mean vocabulary score is observedin production (r(4) = 0.95, p = .004)4.
The middle panel (MacArthur-Bates CDI) andlower panel (Danish CDI) of Figure 3 also display
a comparison of lexical variability between indi-vidual vocabularies in both production and com-prehension. Assessment at younger ages revealsthat variabilities in comprehension and production
3 As we do not have access to the individual lexiconsizes for all databases, vocabulary plots and analysesare made to the mean vocabulary corresponding to theage under consideration.
4 Note that these correlations are closely related toprevious analyses since mean vocabulary sizes and ageare correlated. As a consequence, and for the sakeof readability, correlation analyses on the MacArthur-Bates and Danish CDIs will not be reported (see previ-ous section for age effects).
6 JULIEN MAYORA & KIM PLUNKETTB
0
100
200Oxford CDI
0
100
200MacArthur−Bates CDI
Overlap p
ara
mete
r b
0 50 100 150 200 250 3000
100
200Danish CDI
Vocabulary score
Production
Comprehension
Prod. CDI−WG
Comp. CDI−WG
Prod. CDI−WS
Prod. CDI−WG
Comp. CDI−WG
Prod. CDI−WS
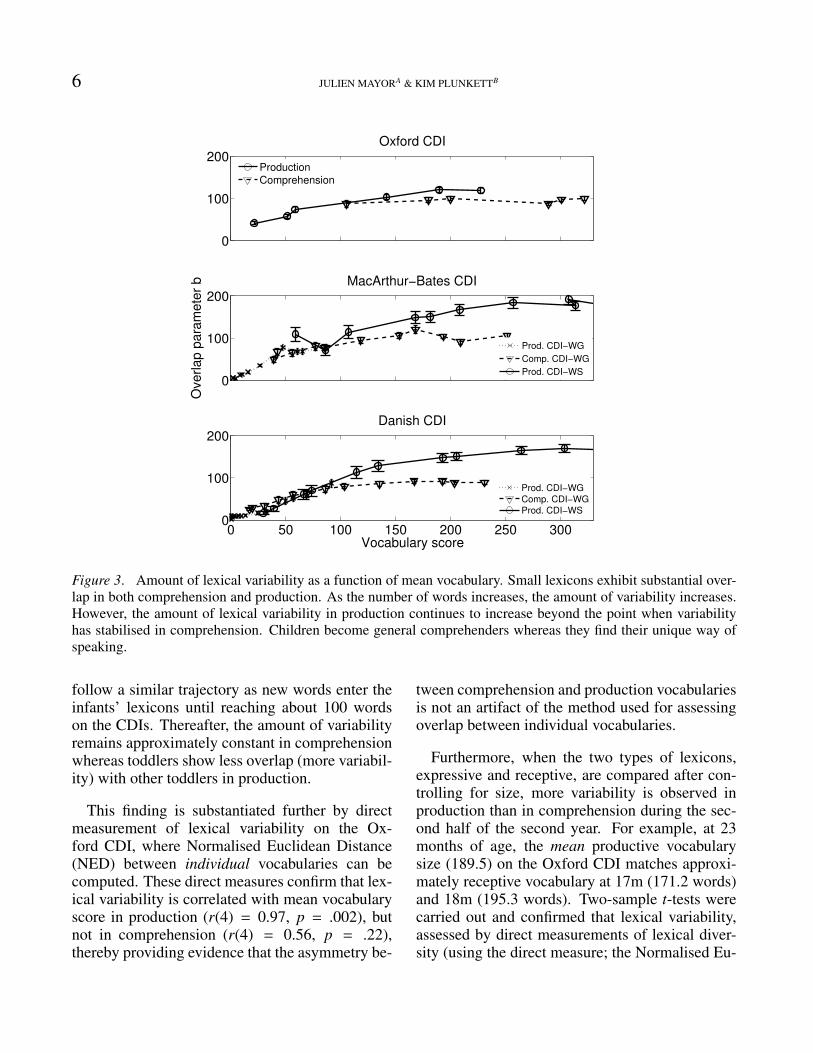
Figure 3. Amount of lexical variability as a function of mean vocabulary. Small lexicons exhibit substantial over-lap in both comprehension and production. As the number of words increases, the amount of variability increases.However, the amount of lexical variability in production continues to increase beyond the point when variabilityhas stabilised in comprehension. Children become general comprehenders whereas they find their unique way ofspeaking.
follow a similar trajectory as new words enter theinfants’ lexicons until reaching about 100 wordson the CDIs. Thereafter, the amount of variabilityremains approximately constant in comprehensionwhereas toddlers show less overlap (more variabil-ity) with other toddlers in production.
This finding is substantiated further by directmeasurement of lexical variability on the Ox-ford CDI, where Normalised Euclidean Distance(NED) between individual vocabularies can becomputed. These direct measures confirm that lex-ical variability is correlated with mean vocabularyscore in production (r(4) = 0.97, p = .002), butnot in comprehension (r(4) = 0.56, p = .22),thereby providing evidence that the asymmetry be-
tween comprehension and production vocabulariesis not an artifact of the method used for assessingoverlap between individual vocabularies.
Furthermore, when the two types of lexicons,expressive and receptive, are compared after con-trolling for size, more variability is observed inproduction than in comprehension during the sec-ond half of the second year. For example, at 23months of age, the mean productive vocabularysize (189.5) on the Oxford CDI matches approxi-mately receptive vocabulary at 17m (171.2 words)and 18m (195.3 words). Two-sample t-tests werecarried out and confirmed that lexical variability,assessed by direct measurements of lexical diver-sity (using the direct measure; the Normalised Eu-
LEXICAL OVERLAP 7
clidean Distance), was higher in production thanin comprehension in both cases (t(165) = 3.10,p = .002 and t(188) = 3.52, p < .001).
Production does not just lag behind comprehen-sion, it is more idiosyncratic than comprehension.Infants begin their apprenticeship with languageusing a vocabulary common to other infants, bothin production and comprehension. As vocabularygrows beyond approximately 100 words, toddlersuse an increasing number of words that are not pro-duced by other toddlers, whereas their receptivevocabularies remain aligned with other toddlersdespite substantial increases in vocabulary size.
Is lexical diversity distributed homoge-neously among children?
Access to a detailed database such as the OxfordCDI allows us to carry out further analyses whichcannot be performed on the other databases thatdo not report the detailed vocabulary of each in-dividual infant or toddler. However, the measureof lexical diversity, as assessed with Mayor andPlunkett’s (2011) method, fails to distinguish be-tween cases in which lexical diversity is regularlydistributed amongst all infants from cases in whichdistinct subgroups of infants differ dramaticallyfrom each other in terms of lexical composition,despite averaging to the same level of lexical vari-ability overall5. In order to evaluate whether lexi-cal diversity is distributed homogeneously amongour sample population, we applied several cluster-ing methods to identify the optimal (or natural)number of clusters of infants in the Oxford CDI.Consistent results across each test would point to asub-structure in lexical diversity, whereas any lackof agreement between a battery of clustering al-gorithms would suggest a relative homogeneity inlexical diversity in each age group. Furthermore,the application of these algorithms to artificial vo-cabulary datasets that are known to be either struc-tured or randomly generated in their distribution oflexical diversity provides a useful comparison forevaluating the relative homogeneity in the distribu-tion of lexical diversity across the Oxford CDI.
Table 2 reports the natural number of clus-ters at 21m of age in comprehension and inproduction, as obtained from the following al-
gorithms; Silhouette (Rousseeuw & Kaufman,1990), Davies-Boudin (Davies & Bouldin, 1979),Krzanowski-Lai (Krzanowski & Lai, 1988), Har-tigan (Hartigan, 1975) and Dunn (Dunn, 1973).There is a clear lack of agreement in the numberof clusters found by the different clustering meth-ods. However, when these clustering techniquesare applied to artificial vocabulary data containingthree clusters of lexical diversity, all methods con-verge on the same result, thereby confirming thatif a clustering existed, all of them would find it.When vocabulary data are randomised, any clus-tering disappears and, again, clustering methodsproduce different results from each other, confirm-ing the absence of subgroups in the data. This pat-tern of results suggests that lexical diversity is rel-atively homogeneously distributed among the in-fants reported in the Oxford CDI. Consequently,these clustering simulations indicate that the sig-moidal analysis as a tool for investigating lexi-cal diversity during development is appropriate forthis database.
Inverted U-shaped pattern in the overlapof vocabularies in production
The proportion of words shared by a populationof infants or toddlers is different in comprehen-sion and production. For lexicons larger than 100words (as assessed by CDIs), lexical variability incomprehension remains stable, whereas in produc-tion variability increases monotonically with vo-cabulary size, so that individual expressive lexi-cons share proportionally fewer words. The previ-ous analysis focused on toddlers up to 24 monthsof age. We now include older toddlers to evaluateif this trend is observed after two years of age. Theanalysis focuses exclusively on expressive vocab-ularies as comprehension is not typically assessedwith CDIs in these older age groups.
We measure lexical variability in production byanalysing CDIs for toddlers using the McArthur-Bates CDI, the Danish CDI, the Norwegian CDIand the German CDI, over an age range of 16 to36 months. As shown in the left panel of Figure 4,
5 We thank an anonymous reviewer for raising thisissue.
8 JULIEN MAYORA & KIM PLUNKETTB
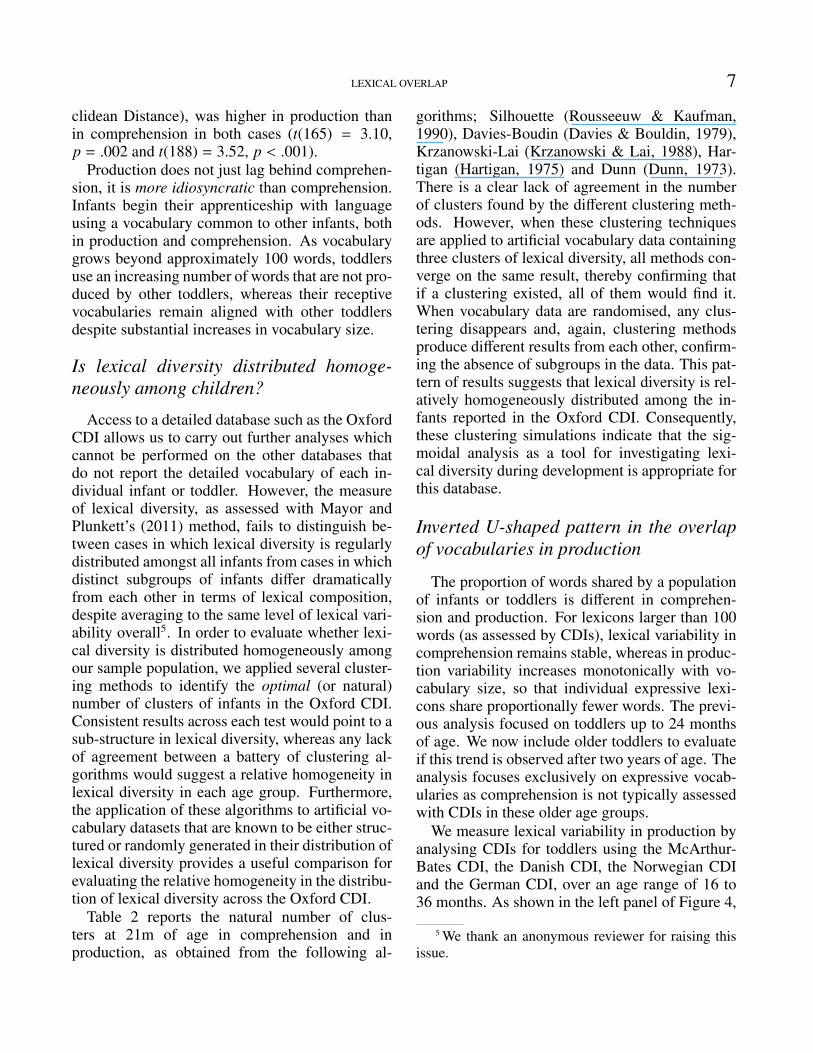
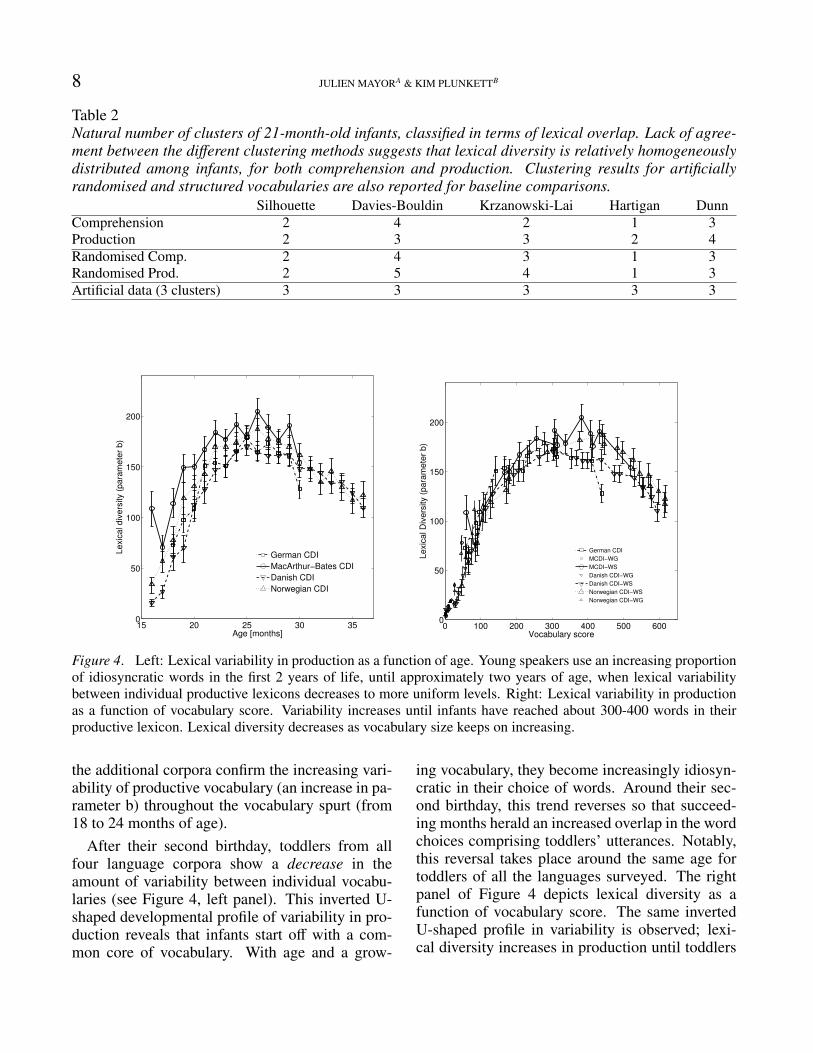
Table 2Natural number of clusters of 21-month-old infants, classified in terms of lexical overlap. Lack of agree-ment between the different clustering methods suggests that lexical diversity is relatively homogeneouslydistributed among infants, for both comprehension and production. Clustering results for artificiallyrandomised and structured vocabularies are also reported for baseline comparisons.
Silhouette Davies-Bouldin Krzanowski-Lai Hartigan DunnComprehension 2 4 2 1 3Production 2 3 3 2 4Randomised Comp. 2 4 3 1 3Randomised Prod. 2 5 4 1 3Artificial data (3 clusters) 3 3 3 3 3
15 20 25 30 350
50
100
150
200
Age [months]
Le
xic
al d
ive
rsity (
pa
ram
ete
r b
)
German CDI
MacArthur−Bates CDI
Danish CDI
Norwegian CDI
0 100 200 300 400 500 6000
50
100
150
200
Vocabulary score
Le
xic
al D
ive
rsity (
pa
ram
ete
r b
)
German CDI
MCDI−WG
MCDI−WS
Danish CDI−WG
Danish CDI−WS
Norwegian CDI−WS
Norwegian CDI−WG
Figure 4. Left: Lexical variability in production as a function of age. Young speakers use an increasing proportionof idiosyncratic words in the first 2 years of life, until approximately two years of age, when lexical variabilitybetween individual productive lexicons decreases to more uniform levels. Right: Lexical variability in productionas a function of vocabulary score. Variability increases until infants have reached about 300-400 words in theirproductive lexicon. Lexical diversity decreases as vocabulary size keeps on increasing.
the additional corpora confirm the increasing vari-ability of productive vocabulary (an increase in pa-rameter b) throughout the vocabulary spurt (from18 to 24 months of age).
After their second birthday, toddlers from allfour language corpora show a decrease in theamount of variability between individual vocabu-laries (see Figure 4, left panel). This inverted U-shaped developmental profile of variability in pro-duction reveals that infants start off with a com-mon core of vocabulary. With age and a grow-
ing vocabulary, they become increasingly idiosyn-cratic in their choice of words. Around their sec-ond birthday, this trend reverses so that succeed-ing months herald an increased overlap in the wordchoices comprising toddlers’ utterances. Notably,this reversal takes place around the same age fortoddlers of all the languages surveyed. The rightpanel of Figure 4 depicts lexical diversity as afunction of vocabulary score. The same invertedU-shaped profile in variability is observed; lexi-cal diversity increases in production until toddlers
LEXICAL OVERLAP 9
possess about 300-400 words in their lexicons, andthen decreases as more words enter their produc-tive lexicons. Pairwise correlational analyses be-tween the language corpora, taken two-by-two, areall highly significant (all r > .91 and all p < .001),confirming that this effect takes place for all lan-guages tested. Furthermore, a paired t-test be-tween measures of lexical diversity at 24 monthsof age and at 30 months of age6 confirm the sig-nificance of the reduction in lexical diversity af-ter two years of age (t(3) = 3.83, p = .03). Ad-ditional cross-validation tests and comparisons ofthe sigmoidal method with the direct method usingNormalised Euclidean Distance, described in Ap-pendix B, confirm the robustness of the effect, andindicate that the observed inverted U-shaped curvein lexical diversity is unlikely to be an artifact ofthe analyses applied, or due to the limited size ofthe vocabulary checklists. These results indicatethat by the age of three children have reverted toestablishing a common core in their expressive vo-cabularies. Potential explanations of the underly-ing phenomena are discussed in the next section.
Discussion
Comparisons between the expressive vocabular-ies of infants and toddlers, and between their re-ceptive vocabularies, indexed by parental report,indicate that early in development their lexiconsshare a common core. As their vocabularies ex-pand, lexical variation between infants increasesas a result of their personal experience and the in-herent statistical variability associated with largernumbers. However, beyond a vocabulary sizeof 100 words, the overlap of receptive vocab-ularies between infants remains stable, whereasthe variability in expressive vocabularies contin-ues to increase, even when the two vocabulariesare matched for size.
Stability in overlap between receptive vocabu-laries is not an artefact of the checklist method ofassessing vocabulary knowledge. At first sight, alimited sample of items might have introduced aceiling effect, thus artificially reducing measuresof lexical diversity in comprehension. We can,however, rule out this explanation, since stabilityin the variability of comprehension between in-
fants is achieved well before ceiling effects canhave an impact, i.e., from 100 words onwards witha possible total score of 416 for the Oxford CDI.Moreover, variability in production, assessed overthe same set of items, continues to increase despitenumbers lagging behind comprehension. When re-ceptive and expressive vocabularies are matchedin size, the asymmetry in overlap remains appar-ent throughout the period spanning the vocabularyexpansion from 100 to 300 words (see Figure 3),further corroborating the claim that the observeddifferences in variability between comprehensionand production are not an artefact of lexicon size.
The lower variability in infants’ comprehensionvocabularies compared to their productive vocab-ularies offers concrete evidence for the supposi-tion that pragmatic constraints exert a greater pres-sure on shared understanding than on expressiverepertoires. Our findings are consistent with theview that there is a greater communicative needfor infants and toddlers to ensure that they un-derstand what is said by others than to guaran-tee that they express messages composed of thesame words produced by others. It is clear thatproduction is not just a delayed version of com-prehension. These analyses demonstrate that thewell-known quantitative asymmetry between earlycomprehension and production is also manifest asa structural difference. Apparently, the pressureto achieve effective communication does not applyevenly to the development of comprehension andproduction.
Individuals possess unique ways of expressingthemselves. Simultaneously, they need to under-stand many speakers, and to be understood bymany interlocutors. Adults possess a much largerlexicon than infants. As long as infants’ primaryinterlocutors are adults, infants will be understoodwhatever words they use. There is no incentive forthe infant to adapt production to the interlocutorand production may become more idiosyncratic.In comprehension, however, infants need to be ableto understand different caregivers; infants will be-come general comprehenders.
Once infants start communicating with other in-
6 Thirty months of age is the oldest age for which atleast four independent databases assessed toddlers.
10 JULIEN MAYORA & KIM PLUNKETTB
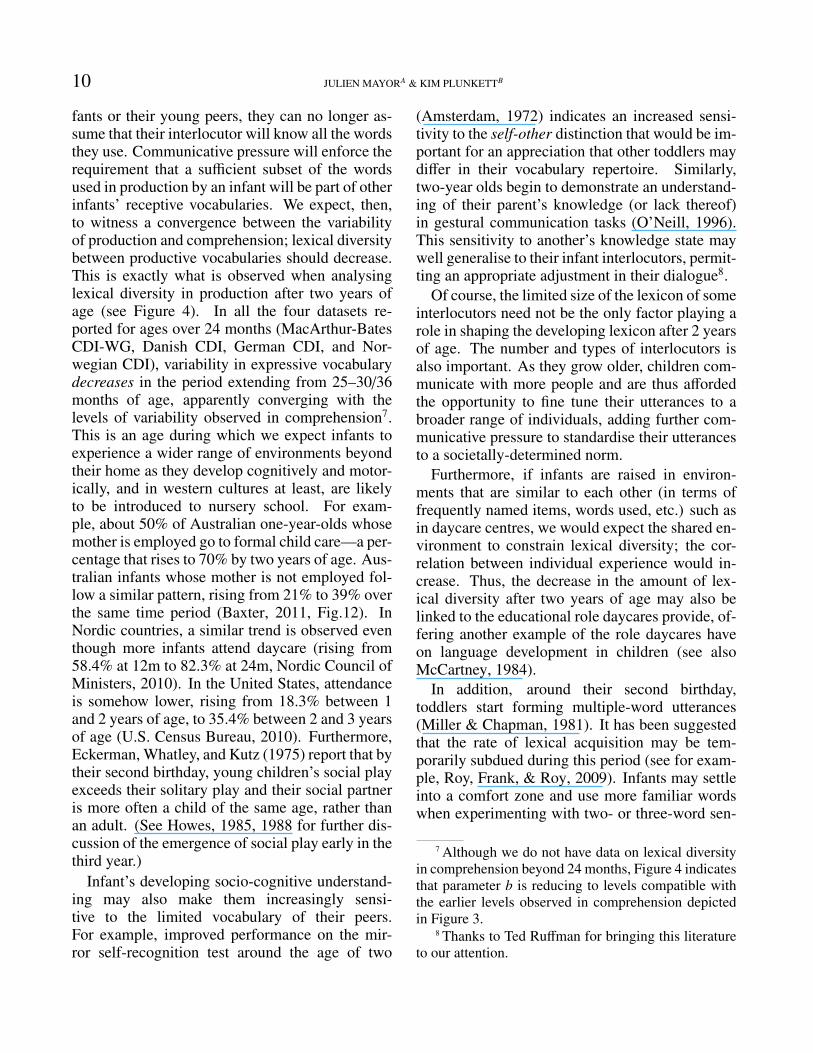
fants or their young peers, they can no longer as-sume that their interlocutor will know all the wordsthey use. Communicative pressure will enforce therequirement that a sufficient subset of the wordsused in production by an infant will be part of otherinfants’ receptive vocabularies. We expect, then,to witness a convergence between the variabilityof production and comprehension; lexical diversitybetween productive vocabularies should decrease.This is exactly what is observed when analysinglexical diversity in production after two years ofage (see Figure 4). In all the four datasets re-ported for ages over 24 months (MacArthur-BatesCDI-WG, Danish CDI, German CDI, and Nor-wegian CDI), variability in expressive vocabularydecreases in the period extending from 25–30/36months of age, apparently converging with thelevels of variability observed in comprehension7.This is an age during which we expect infants toexperience a wider range of environments beyondtheir home as they develop cognitively and motor-ically, and in western cultures at least, are likelyto be introduced to nursery school. For exam-ple, about 50% of Australian one-year-olds whosemother is employed go to formal child care—a per-centage that rises to 70% by two years of age. Aus-tralian infants whose mother is not employed fol-low a similar pattern, rising from 21% to 39% overthe same time period (Baxter, 2011, Fig.12). InNordic countries, a similar trend is observed eventhough more infants attend daycare (rising from58.4% at 12m to 82.3% at 24m, Nordic Council ofMinisters, 2010). In the United States, attendanceis somehow lower, rising from 18.3% between 1and 2 years of age, to 35.4% between 2 and 3 yearsof age (U.S. Census Bureau, 2010). Furthermore,Eckerman, Whatley, and Kutz (1975) report that bytheir second birthday, young children’s social playexceeds their solitary play and their social partneris more often a child of the same age, rather thanan adult. (See Howes, 1985, 1988 for further dis-cussion of the emergence of social play early in thethird year.)
Infant’s developing socio-cognitive understand-ing may also make them increasingly sensi-tive to the limited vocabulary of their peers.For example, improved performance on the mir-ror self-recognition test around the age of two
(Amsterdam, 1972) indicates an increased sensi-tivity to the self-other distinction that would be im-portant for an appreciation that other toddlers maydiffer in their vocabulary repertoire. Similarly,two-year olds begin to demonstrate an understand-ing of their parent’s knowledge (or lack thereof)in gestural communication tasks (O’Neill, 1996).This sensitivity to another’s knowledge state maywell generalise to their infant interlocutors, permit-ting an appropriate adjustment in their dialogue8.
Of course, the limited size of the lexicon of someinterlocutors need not be the only factor playing arole in shaping the developing lexicon after 2 yearsof age. The number and types of interlocutors isalso important. As they grow older, children com-municate with more people and are thus affordedthe opportunity to fine tune their utterances to abroader range of individuals, adding further com-municative pressure to standardise their utterancesto a societally-determined norm.
Furthermore, if infants are raised in environ-ments that are similar to each other (in terms offrequently named items, words used, etc.) such asin daycare centres, we would expect the shared en-vironment to constrain lexical diversity; the cor-relation between individual experience would in-crease. Thus, the decrease in the amount of lex-ical diversity after two years of age may also belinked to the educational role daycares provide, of-fering another example of the role daycares haveon language development in children (see alsoMcCartney, 1984).
In addition, around their second birthday,toddlers start forming multiple-word utterances(Miller & Chapman, 1981). It has been suggestedthat the rate of lexical acquisition may be tem-porarily subdued during this period (see for exam-ple, Roy, Frank, & Roy, 2009). Infants may settleinto a comfort zone and use more familiar wordswhen experimenting with two- or three-word sen-
7 Although we do not have data on lexical diversityin comprehension beyond 24 months, Figure 4 indicatesthat parameter b is reducing to levels compatible withthe earlier levels observed in comprehension depictedin Figure 3.
8 Thanks to Ted Ruffman for bringing this literatureto our attention.
LEXICAL OVERLAP 11
tences. These words are likely to be known toother children as a result of their early integrationinto the lexicon. Consequently, beyond a slowing-down in the rate of word learning during this tran-sition, the degree of lexical diversity in productionmay also decrease.
Finally, an alternative explanation for the in-verted U-shaped development observed in youngchildren’s expressive lexical variability can begiven in terms of infant’s phonological abilities9.There is evidence that infants start their vocabularydevelopment with a restricted number of phono-logical templates, templates that define a syllablestructure (Boysson-Bardies & Vihman, 1991) or aspecific consonant-vowel pair (Levelt, Schiller, &Levelt, 2000) that an infant is able to use produc-tively. These templates are initially idiosyncratic.When children’s expressive vocabularies begin toexpand, they are constrained to utter only wordsthat fit these templates. Therefore, the more wordsan infant adds to her expressive vocabulary, themore her expressive vocabulary reflects the ini-tial idiosyncratic starting templates and the moreit diverges from the vocabularies of infants withother phonological templates. When infants be-come more proficient speakers, they loosen thesetemplatic constraints. This permits them to startusing words that they previously avoided and soconverge towards other infants’ expressive vocab-ularies. It is assumed that phonological templatesapply only to production, thereby explaining whythe lexical overlap between receptive vocabular-ies is relatively constant. Further research willhelp distinguish between different potential expla-nations of these novel findings.
Acknowledgements
This work is supported by the Swiss NationalScience Foundation grant 131700 awarded toJulien Mayor and by the Economic and Social Re-search Council Grant RES-062-23-0194 awardedto Kim Plunkett.
ReferencesAmsterdam, B. (1972). Mirror self-image reactions be-
fore age two. Developmental psychobiology, 5(4),297–305.
Baxter, J. (2011). Parents working out work. Availablefrom www.aifs.gov.au/
Benedict, H. (1979). Early lexical development: Com-prehension and production. Journal of Child Lan-guage, 6, 183-200.
Bleses, D., Vach, W., Wehberg, S., Kristensen, K., &Madsen, T. (2007). Tidlig kommunikativ udvikling:Et værktøj til beskrivelse af sprogtilegnelse baseretpå CDI forældrerapport-undersøgelser af danskenormalthørende og hørehæmmede børn. SyddanskUniversitetsforlag Odense.
Boysson-Bardies, B. de, & Vihman, M. M. (1991).Adaptation to language: Evidence from babblingand first words in four languages. Language, 297–319.
Bradley, R., Caldwell, B., & Rock, S. (1988). Homeenvironment and school performance: A ten-yearfollow-up and examination of three models of en-vironmental action. Child development, 59(4), 852–867.
Dale, P., & Fenson, L. (1996). Lexical developmentnorms for young children. Behavior research meth-ods, instruments & computers, 28(1), 125–127.
Davies, D., & Bouldin, D. (1979). A cluster separa-tion measure. Pattern Analysis and Machine Intelli-gence, IEEE Transactions on(2), 224–227.
Dunn, J. (1973). A fuzzy relative of the isodata pro-cess and its use in detecting compact well-separatedclusters. J. Cybernetics, 3, 32–57.
Eckerman, C. O., Whatley, J. L., & Kutz, S. L. (1975).Growth of social play with peers during the secondyear of life. Developmental Psychology, 11(1), 42.
Fenson, L., Dale, P. S., Reznick, J. S., Bates, E.,Thal, D. J., & Pethick, S. J. (1994). Variability inearly communicative development (Vol. 59) (No. 5).Monographs of the Society for Research in ChildDevelopment.
Fenson, L., Marchman, V., Thal, D., Dale, P., &Reznick, J. (2007). MacArthur-Bates Commu-nicative Development Inventories: user’s guide andtechnical manual. 2nd Edition. Paul H. BrookesPub. Co.
Goldin-Meadow, S., Seligman, M., & Gelman, R.(1976). Language in the two-year-old. Cognition,4, 189-202.
Hamilton, A., Plunkett, K., & Schafer, G. (2000). In-fant vocabulary development assessed with a British
9 Many thanks to an anonymous reviewer for point-ing out this alternative explanation.
12 JULIEN MAYORA & KIM PLUNKETTB
communicative development inventory. Journal ofChild Language, 27, 689–705.
Hart, B., & Risley, T. (1995). Meaningful Differ-ences in the Everyday Experience of Young Amer-ican Children. Brookes Publishing Company, Inc.,Baltimore.
Hartigan, J. (1975). Clustering algorithms. John Wiley& Sons, Inc.
Howes, C. (1985). Sharing fantasy: Social pretend playin toddlers. Child Development, 1253–1258.
Howes, C. (1988). Peer interaction of young children.Monographs of the society for research in child de-velopment, i–92.
Huttenlocher, J. (1991). Early Vocabulary Growth: Re-lation to Language Input and Gender. Developmen-tal Psychology, 27(2), 236–48.
Jorgensen, R., Dale, P., Bleses, D., & Fenson, L.(2010). Clex: A cross-linguistic lexical normsdatabase. Journal of Child Language, 37(2), 10.
Kristoffersen, K. E., Simonsen, H. G., Eiesland, E. A.,& Henriksen, L. Y. (2012). Utvikling og variasjon ikommunikative ferdigheter hos barn som lrer norsken cdi-basert studie. Norsk tidsskrift for logopedi,58, 34–43.
Krzanowski, W., & Lai, Y. (1988). A criterion for de-termining the number of groups in a data set usingsum-of-squares clustering. Biometrics, 23–34.
Levelt, C. C., Schiller, N. O., & Levelt, W. J. (2000).The acquisition of syllable types. Language acqui-sition, 8(3), 237–264.
MacWhinney, B. (1991). The CHILDES project : Toolsfor analyzing talk. Hillsdale, NJ: Lawrence ErlbaumAssociates.
Mayor, J., & Plunkett, K. (2011). A statistical esti-mate of infant and toddler vocabulary size from CDIanalysis. Developmental Science, 14(4), 769–785.
McCartney, K. (1984). Effect of quality of day care en-vironment on children’s language development. De-velopmental Psychology, 20(2), 244.
Miller, J. F., & Chapman, R. S. (1981). The relationbetween age and mean length of utterance in mor-phemes. Journal of Speech, Language and HearingResearch, 24(2), 154.
Nordic Council of Ministers. (2010). Nordic statisticalyearbook 2010 (Vol. 48). (ISBN 978-92-893-2137-2)
O’Neill, D. K. (1996). Two-year-old children’s sen-sitivity to a parent’s knowledge state when makingrequests. Child Development, 67(2), 659–677.
Rousseeuw, P., & Kaufman, L. (1990). Finding groups
in data: An introduction to cluster analysis. John,John Wiley & Sons.
Roy, B., Frank, M., & Roy, D. (2009). Exploringword learning in a high-density longitudinal corpus.In Proceedings of the 31st annual cognitive scienceconference.
Szagun, G., Stumper, B., & Schramm, S. (2009).FRAKIS: Fragebogen zur fruhkindlichen Sprachen-twicklung (FRAKIS) und FRAKIS-K (Kurzform).Pearson.
U.S. Census Bureau. (2010). Survey of Income andProgram Participation (SIPP), 2008 Panel, Wave 5.Available from http://www.census.gov/
LEXICAL OVERLAP 13
Appendix ADerivation of the
measure of vocabularydiversity.
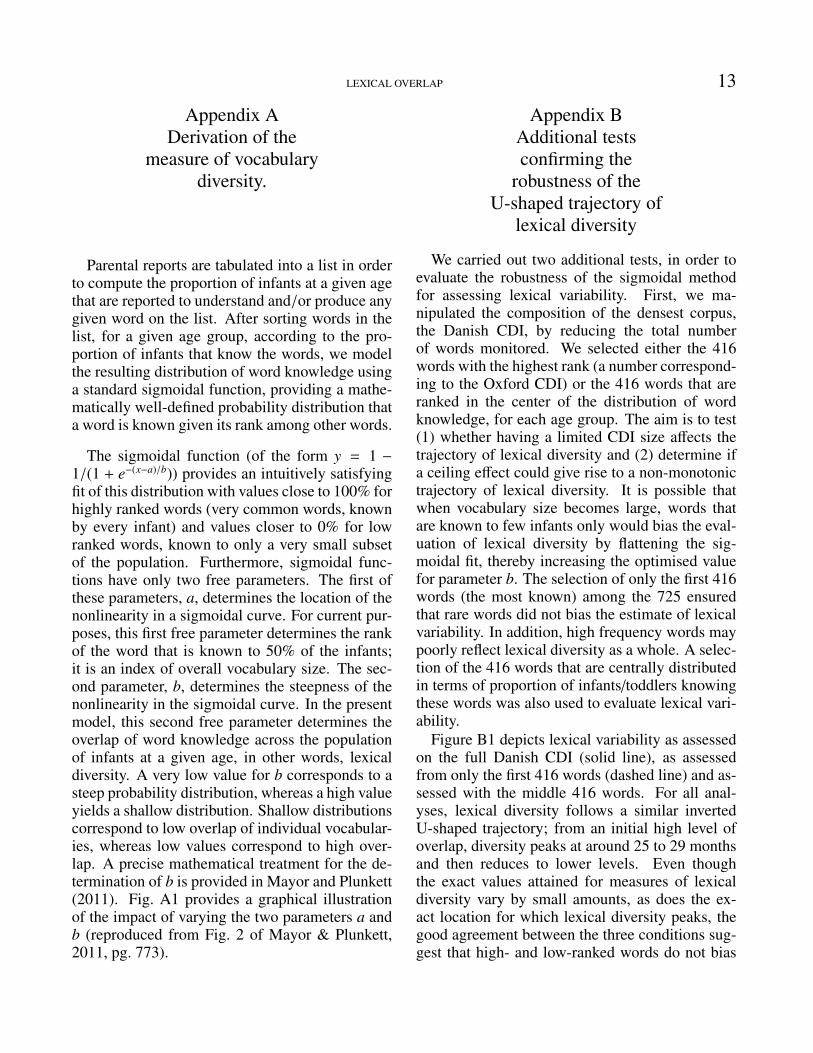
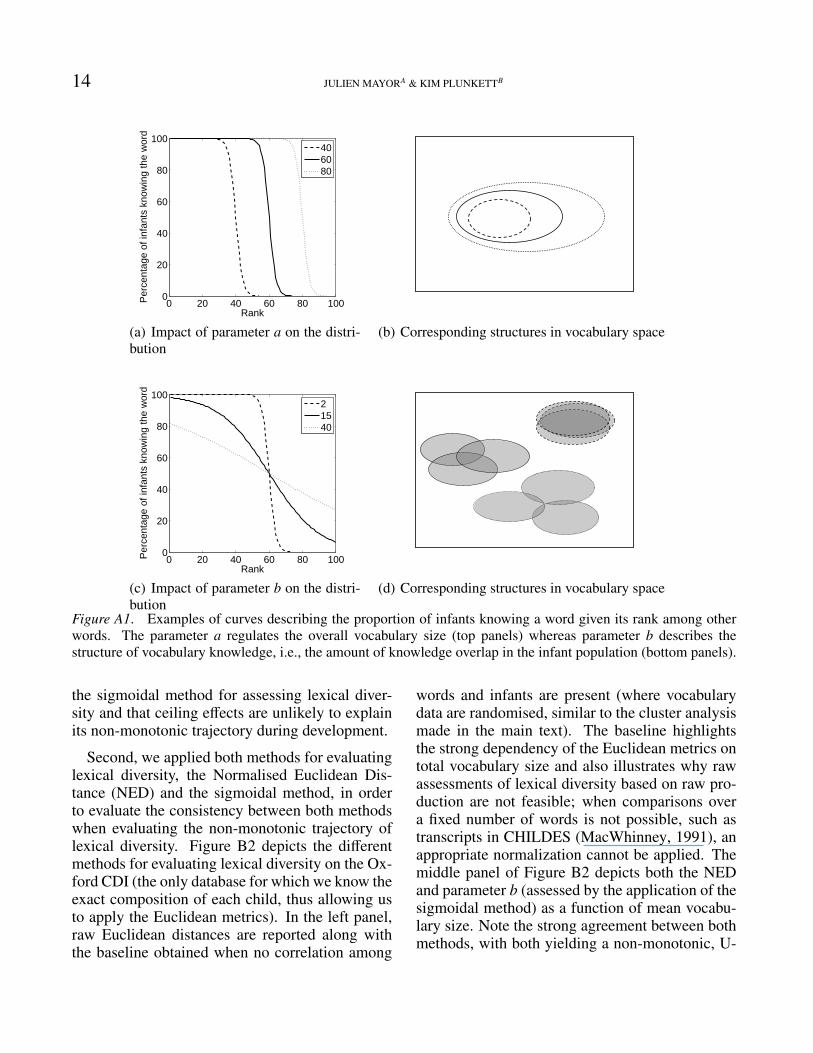
Parental reports are tabulated into a list in orderto compute the proportion of infants at a given agethat are reported to understand and/or produce anygiven word on the list. After sorting words in thelist, for a given age group, according to the pro-portion of infants that know the words, we modelthe resulting distribution of word knowledge usinga standard sigmoidal function, providing a mathe-matically well-defined probability distribution thata word is known given its rank among other words.
The sigmoidal function (of the form y = 1 −1/(1 + e−(x−a)/b)) provides an intuitively satisfyingfit of this distribution with values close to 100% forhighly ranked words (very common words, knownby every infant) and values closer to 0% for lowranked words, known to only a very small subsetof the population. Furthermore, sigmoidal func-tions have only two free parameters. The first ofthese parameters, a, determines the location of thenonlinearity in a sigmoidal curve. For current pur-poses, this first free parameter determines the rankof the word that is known to 50% of the infants;it is an index of overall vocabulary size. The sec-ond parameter, b, determines the steepness of thenonlinearity in the sigmoidal curve. In the presentmodel, this second free parameter determines theoverlap of word knowledge across the populationof infants at a given age, in other words, lexicaldiversity. A very low value for b corresponds to asteep probability distribution, whereas a high valueyields a shallow distribution. Shallow distributionscorrespond to low overlap of individual vocabular-ies, whereas low values correspond to high over-lap. A precise mathematical treatment for the de-termination of b is provided in Mayor and Plunkett(2011). Fig. A1 provides a graphical illustrationof the impact of varying the two parameters a andb (reproduced from Fig. 2 of Mayor & Plunkett,2011, pg. 773).
Appendix BAdditional testsconfirming the
robustness of theU-shaped trajectory of
lexical diversity
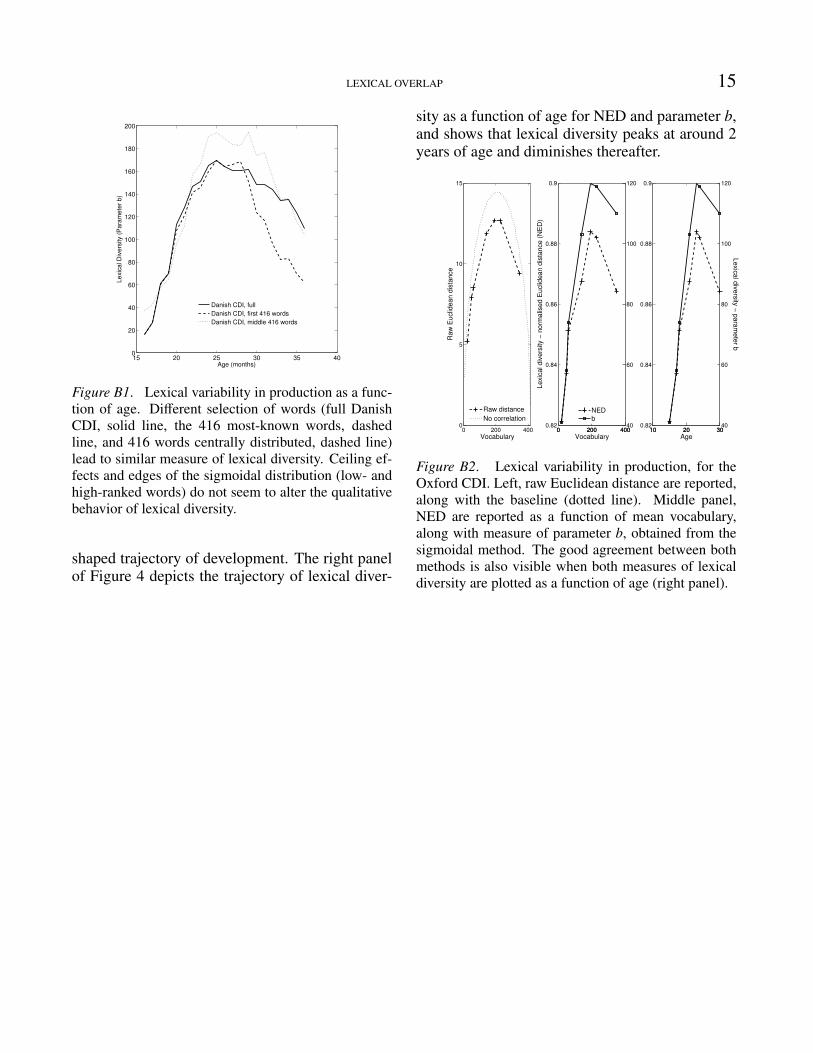
We carried out two additional tests, in order toevaluate the robustness of the sigmoidal methodfor assessing lexical variability. First, we ma-nipulated the composition of the densest corpus,the Danish CDI, by reducing the total numberof words monitored. We selected either the 416words with the highest rank (a number correspond-ing to the Oxford CDI) or the 416 words that areranked in the center of the distribution of wordknowledge, for each age group. The aim is to test(1) whether having a limited CDI size affects thetrajectory of lexical diversity and (2) determine ifa ceiling effect could give rise to a non-monotonictrajectory of lexical diversity. It is possible thatwhen vocabulary size becomes large, words thatare known to few infants only would bias the eval-uation of lexical diversity by flattening the sig-moidal fit, thereby increasing the optimised valuefor parameter b. The selection of only the first 416words (the most known) among the 725 ensuredthat rare words did not bias the estimate of lexicalvariability. In addition, high frequency words maypoorly reflect lexical diversity as a whole. A selec-tion of the 416 words that are centrally distributedin terms of proportion of infants/toddlers knowingthese words was also used to evaluate lexical vari-ability.
Figure B1 depicts lexical variability as assessedon the full Danish CDI (solid line), as assessedfrom only the first 416 words (dashed line) and as-sessed with the middle 416 words. For all anal-yses, lexical diversity follows a similar invertedU-shaped trajectory; from an initial high level ofoverlap, diversity peaks at around 25 to 29 monthsand then reduces to lower levels. Even thoughthe exact values attained for measures of lexicaldiversity vary by small amounts, as does the ex-act location for which lexical diversity peaks, thegood agreement between the three conditions sug-gest that high- and low-ranked words do not bias
14 JULIEN MAYORA & KIM PLUNKETTB
0 20 40 60 80 1000
20
40
60
80
100
Rank
Per
cent
age
of in
fant
s kn
owin
g th
e w
ord
406080
(a) Impact of parameter a on the distri-bution
(b) Corresponding structures in vocabulary space
0 20 40 60 80 1000
20
40
60
80
100
Rank
Per
cent
age
of in
fant
s kn
owin
g th
e w
ord
21540
(c) Impact of parameter b on the distri-bution
(d) Corresponding structures in vocabulary space
Figure A1. Examples of curves describing the proportion of infants knowing a word given its rank among otherwords. The parameter a regulates the overall vocabulary size (top panels) whereas parameter b describes thestructure of vocabulary knowledge, i.e., the amount of knowledge overlap in the infant population (bottom panels).
the sigmoidal method for assessing lexical diver-sity and that ceiling effects are unlikely to explainits non-monotonic trajectory during development.
Second, we applied both methods for evaluatinglexical diversity, the Normalised Euclidean Dis-tance (NED) and the sigmoidal method, in orderto evaluate the consistency between both methodswhen evaluating the non-monotonic trajectory oflexical diversity. Figure B2 depicts the differentmethods for evaluating lexical diversity on the Ox-ford CDI (the only database for which we know theexact composition of each child, thus allowing usto apply the Euclidean metrics). In the left panel,raw Euclidean distances are reported along withthe baseline obtained when no correlation among
words and infants are present (where vocabularydata are randomised, similar to the cluster analysismade in the main text). The baseline highlightsthe strong dependency of the Euclidean metrics ontotal vocabulary size and also illustrates why rawassessments of lexical diversity based on raw pro-duction are not feasible; when comparisons overa fixed number of words is not possible, such astranscripts in CHILDES (MacWhinney, 1991), anappropriate normalization cannot be applied. Themiddle panel of Figure B2 depicts both the NEDand parameter b (assessed by the application of thesigmoidal method) as a function of mean vocabu-lary size. Note the strong agreement between bothmethods, with both yielding a non-monotonic, U-
LEXICAL OVERLAP 15
15 20 25 30 35 400
20
40
60
80
100
120
140
160
180
200
Age (months)
Lexic
al D
ivers
ity (
Para
mete
r b)
Danish CDI, full
Danish CDI, first 416 words
Danish CDI, middle 416 words
Figure B1. Lexical variability in production as a func-tion of age. Different selection of words (full DanishCDI, solid line, the 416 most-known words, dashedline, and 416 words centrally distributed, dashed line)lead to similar measure of lexical diversity. Ceiling ef-fects and edges of the sigmoidal distribution (low- andhigh-ranked words) do not seem to alter the qualitativebehavior of lexical diversity.
shaped trajectory of development. The right panelof Figure 4 depicts the trajectory of lexical diver-
sity as a function of age for NED and parameter b,and shows that lexical diversity peaks at around 2years of age and diminishes thereafter.
0 200 4000
5
10
15
Raw
Euclid
ean d
ista
nce
Vocabulary
Raw distance
No correlation
0 200 4000.82
0.84
0.86
0.88
0.9
Lexic
al div
ers
ity −
norm
alis
ed E
uclid
ean d
ista
nce (
NE
D)
Vocabulary
0 200 40040
60
80
100
120
NED
b
10 20 300.82
0.84
0.86
0.88
0.9
Age10 20 30
40
60
80
100
120
Lexic
al d
ivers
ity −
para
mete
r b
Figure B2. Lexical variability in production, for theOxford CDI. Left, raw Euclidean distance are reported,along with the baseline (dotted line). Middle panel,NED are reported as a function of mean vocabulary,along with measure of parameter b, obtained from thesigmoidal method. The good agreement between bothmethods is also visible when both measures of lexicaldiversity are plotted as a function of age (right panel).