Controle de qualidade dos dados de radiossondagem da campanha WET-AMC/LBA
Upload
independentCategory
view
6download
0
Atmospheric Research 89 (2008) 1–11www.elsevier.com/locate/atmos
Review article
Shape parameter analysis using cloud spectra and gamma functionsin the numerical modeling RAMS during LBA Project
at Amazonian region, Brazil
F.L.T. Gonçalves a,⁎, J.A. Martins b, M.A. Silva Dias a,c
a Department of Atmospheric Sciences, IAG/USP, São Paulo, Brazilb Universidade Tecnológica Federal do Paraná, 86300-000, Cornélio Procópio, Paraná, Brazil
c Center for Weather Forecasting and Climate Studies, CPTEC/INPE, Cachoeira Paulista, 12630-000, SP, Brazil
Received 13 April 2007; received in revised form 20 December 2007; accepted 21 December 2007
Abstract
The microphysical variable shape parameters have been investigated considering a numerical simulation based on RAMS(Regional Atmospheric Modeling System), with focus on southwest Amazon Basin during the transition from dry to wet seasonswithin the scope of LBA (The Large Scale Biosphere Atmosphere Experiment in Amazonia). All data were obtained during thedry-to-wet campaign from September to October 2003. Three precipitation events were chosen during the campaign, classified aspolluted, intermediary and clean events. The dataset, for the description of the observed convective systems, includes airborneobservations with a microphysics airplane. The variables were cloud droplet contents and spectra, in several flights; radiosondelaunches; a 10 cm Doppler radar; visible and IR satellite maps and rain gauge network. The preliminary results have shown thatover polluted areas, shape parameters with higher values, from 5 to 7 are better fitted to cloud spectra observations, than the usualshape parameter 2 used in RAMS microphysics default table. For its turn, shape parameter 2 is related to the cleaner areas, i.e.,without biomass burning. On the other hand, the numerical simulations, reproducing as close as possible the microphysical variablespatial distributions in the observed dataset, have shown that the average total rainfall precipitation at the surface generallydecreases as the CCN concentration and shape parameter increases. CCN vertical and temporal profiles support that result,emphasizing that the higher CCN concentrations are related to biomass burning, where higher shape parameters are better fitted.Additionally, it is possible to conclude that different shape parameters and CCN concentrations may influence directly themaximum and average amount of precipitation and cloud water, implying that different regions should have each the properspecification characteristics. Shape parameters and CCN concentrations are quite useful tools in order to evaluate the spatial andtemporal cloud patterns as well as, the rainfall amount with regional implications.© 2008 Elsevier B.V. All rights reserved.
Keywords: Cloud droplet spectra; Shape parameter; Numerical modeling; Amazonia
⁎ Corresponding author. Rua do Matão, 1226, Cidade Universitária, USP, São Paulo, Brazil.E-mail address: [email protected] (F.L.T. Gonçalves).
0169-8095/$ - see front matter © 2008 Elsevier B.V. All rights reserved.doi:10.1016/j.atmosres.2007.12.005

2 F.L.T. Gonçalves et al. / Atmospheric Research 89 (2008) 1–11
Contents
1. Introduction . . . . . . . . . . . . . . . . . . . . . . . . . . . . . . . . . . . . . . . . . . . . . . . . . . . . . . . . 22. Methodology . . . . . . . . . . . . . . . . . . . . . . . . . . . . . . . . . . . . . . . . . . . . . . . . . . . . . . . 4
2.1. Data set description . . . . . . . . . . . . . . . . . . . . . . . . . . . . . . . . . . . . . . . . . . . . . . . . 42.2. Gamma function . . . . . . . . . . . . . . . . . . . . . . . . . . . . . . . . . . . . . . . . . . . . . . . . . . 52.3. Shape parameter analysis . . . . . . . . . . . . . . . . . . . . . . . . . . . . . . . . . . . . . . . . . . . . . 52.4. RAMS modeling . . . . . . . . . . . . . . . . . . . . . . . . . . . . . . . . . . . . . . . . . . . . . . . . . . 6
3. Results and discussion . . . . . . . . . . . . . . . . . . . . . . . . . . . . . . . . . . . . . . . . . . . . . . . . . . 63.1. Square coefficient correlation analysis . . . . . . . . . . . . . . . . . . . . . . . . . . . . . . . . . . . . . . . 63.2. The three events analysis . . . . . . . . . . . . . . . . . . . . . . . . . . . . . . . . . . . . . . . . . . . . . 6
3.2.1. September 23 — Ji-Paraná: the polluted event . . . . . . . . . . . . . . . . . . . . . . . . . . . . . . 63.2.2. October 5 — Acre: the clean event . . . . . . . . . . . . . . . . . . . . . . . . . . . . . . . . . . . 73.2.3. October 8 — Ji-Paraná: the intermediary event . . . . . . . . . . . . . . . . . . . . . . . . . . . . . 8
3.3. RMSE analysis. . . . . . . . . . . . . . . . . . . . . . . . . . . . . . . . . . . . . . . . . . . . . . . . . . . 93.4. RAMS simulation results . . . . . . . . . . . . . . . . . . . . . . . . . . . . . . . . . . . . . . . . . . . . . 9
4. Conclusions . . . . . . . . . . . . . . . . . . . . . . . . . . . . . . . . . . . . . . . . . . . . . . . . . . . . . . . 10Acknowledgements . . . . . . . . . . . . . . . . . . . . . . . . . . . . . . . . . . . . . . . . . . . . . . . . . . . . . . 10References . . . . . . . . . . . . . . . . . . . . . . . . . . . . . . . . . . . . . . . . . . . . . . . . . . . . . . . . . . 10
1. Introduction
Amazonian region biosphere atmosphere interactionprocesses have been deeply investigated over the lastyears in order to evaluate their importance to the localand global climate. Amazonia is the largest tropicalforest in the world and the highest source of energy tothe atmosphere from continental origin. Linked to that,the Amazon region also represents an unequivocalsource of humidity recycling with impacts on the waterresources during wet season for tropical and subtropicalSouth America. On the other hand, during the dryseason, it is a large source of aerosols from biomassburning, which directly impacts the air quality andindirectly the regional climate including the cloudmicrophysics processes.
The LBA project — Large Scale Biosphere Atmo-sphere Experiment in Amazonia, was developed as aninternational project lead by Brazil, initiated during1998, with the aim of understanding Amazon as aregional entity. The analysis of the effect of land usechanges on climate is also a goal of the project as well asthe climate response throughout the physical, chemicaland biological mechanisms and interactions. One of theLBA campaigns focused on the seasonal transitionbetween the end of the dry season (September) and thewet season (starting in October). Therefore, thecampaign started at September 15, 2003 lasting untilNovember 15, and was called by “Dry-to-Wet AMC/LBA Atmospheric Mesoscale Campaign”, developed inthe Rondonia State. The seasonality of the Rondonia
region may be identified directly by the surfaceparameter evolution. For example, the thermal ampli-tude decreases from the dry season to the wet season asthe precipitation gradually increases.
The scientific team involved in the LBA project hasinterdisciplinary profiles and represent several institutionsof the state of São Paulo, such as University of Sao Paulo(USP) and Institute of Spatial Research (INPE), andseveral international collaboratorswithin the LBAProject.
The “Dry-to-Wet AMC/LBA project” had as ageneral objective the understanding of the processescontrolling the transition season in southwest Amazo-nia. Specifically the main scientific questions were:
1. What is the comparative impact of remote climateforcing and of the regional effects of biomass burninggenerated aerosol on the beginning of the rainyseason?
2. What are the feedback mechanisms between theAmazon region and the global climate, specifically inthe transition season?
3. How does the surface heterogeneity influencevertical motion and cloud formation? What is theeffect of these processes on the regional and longdistant transport of heat, moisture, trace gases andaerosol?
4. Are the presently available models good enough tobe used in the analysis of future scenarios?This article's focus is on numbers 1 and 4.Clouds evolve during the seasonal transition, and are
strictly linked to the surface processes (Betts et al.,

3F.L.T. Gonçalves et al. / Atmospheric Research 89 (2008) 1–11
1996), through the heat fluxes (sensible and latent) andthe composition of aerosols and trace gases. Addition-ally, clouds are also important to the transport of gasesand aerosol through a regional or even long distancescale, depending upon their depth (Freitas et al., 2000a,b). On the other hand the cloud microphysical processesinvolve aerosol, their role as CCN and the evolution tocloud droplets and rainfall.
Microphysics parameterization schemes, whichinvolve a shape parameter of the cloud droplet spectrumhave been presented in the literature Walko et al. (1995)studied the prediction of a single moment of thehydrometeor size-spectra. This spectrum is usuallybased on generalized gamma size-spectrum based onmass mixing ratio of the hydrometeor species. Thiswork included the use of a generalized gamma size-spectrum, rather than only a Marshall–Palmer spectrum,the introduction of ice–liquid mixed phase hydrometeorcategories, a double moment spectrum for ice crystals,and new heterogeneous and homogeneous nucleationparameterizations in RAMS microphysics module. Inaddition, approximate solutions to the stochastic collec-tion equation based on Verlinde et al. (1990) are usedrather than the continuous accretion approximation.There is a trend in recent years to extend those earlierbulk microphysical schemes to include predictions on anadditional moment of the spectrum, namely theconcentration of the species (e.g., Ferrier, 1993 andWang and Chang, 1993).
A discussion about the different function character-istics in order to represent the cloud spectra can be foundin Liu and Daum (2004). This article deals with theparameterization of cloud droplet distribution using ageneralized gamma function. Clark and Hall (1983)used a series of distribution function to simulate thestochastic coalescence in a parcel framework. Themethod, which used solutions with 2 and 3 log-normaldistributions, is generally enough that it could beadapted to use gamma distributions for example.Previously, Clark (1976) used log-normal distributionto represent water droplet spectra to treating cloudphysical processes. On the other hand, with increasingcomputer power, explicit microphysics schemes arebecoming increasingly important in atmosphericmodels.
More recently, with respect to the cloud modelingand shape parameter, Tremblay et al. (2004) improvedthe quality of forecasts of mixed-phase clouds in winterstorms, and some aspects of a cloud scheme areexamined in detail. Modifications to the basic formalismand specification of selected parameters of the cloudmodel are studied, and simulation results are compared
with aircraft observations and satellite data. It has beenpossible from these comparisons to optimize the schemeand improve the quality of forecasts.
Milbrandt and Yau (2005a,b) demonstrated theimportance of the relative dispersion of the hydro-meteor size distribution in bulk microphysics para-meterizations and proposed a closure approach in anew multi-moment scheme. In this paper, the full three-moment version of the new scheme is tested in a 3Dsimulation of a severe hailstorm. The modeled micro-physical fields are examined, particularly with respectto its ability to accurately simulate maximum hail sizesat the ground.
Saleeby and Cotton (2004) have studied the micro-physics module of the version of the Regional Atmo-spheric Modeling System (RAMS) maintained atColorado State University. They have undergone aseries of improvements, including the addition of alarge-cloud-droplet mode from 40 to 80 μm in diameterand the prognostic number concentration of clouddroplets through activation of cloud condensation nuclei(CCN) and giant CCN (GCCN). Model response wasexplored in regard to the microphysics sensitivity to thelarge-droplet mode, number concentrations of CCN andGCCN, size distributions of these nuclei, and thepresence of nuclei sources and sinks.
On the other hand, Straka et al. (2005) studied acomparison of conservation of microphysical parame-terizations where a continuous gamma distributionfunction was fixed with shape parameter. The authorsfelt compelled to evaluate the veracity of some oftenused microphysical schemes.
There are no articles dealing recently with shapeparameters and observed cloud spectra. The goal of thisarticle, therefore, is a comparison between observeddroplet size distributions, sampled by aircraft flightsduring the transition from dry to wet seasons within thescope of the LBA experiment, and the gamma shapeparameters from numerical modeling default of RAMS(Regional Atmospheric Modeling System) with adiscussion on the potential effects on precipitation.Alternatively, there are many studies concerning theimpact aerosol on precipitation processes, such as Khainet al. (1999); Rosenfeld (1999), Andreae et al. (2004)and Harshvardhan et al. (2002). Those works emphasizethat there are strict relations between both aerosoldistribution and precipitation.
During a numerical simulation is important toreproduce as close as possible the observed hydrometeorspectra. As the cloud spectra can be simulated throughshape parameters, different models present differentfunctions. For instances, RAMS modeling default uses

4 F.L.T. Gonçalves et al. / Atmospheric Research 89 (2008) 1–11
shape parameter 2, based on gamma functions (Verlindeet al., 1990). There is no study about the impact onprecipitation using other shape parameters. Conse-quently, this article presents a study using the observeddata to define the RAMS modeling with different shapeparameters.
This article attempts to answer the followingquestions: comparing polluted and non-polluted areas,which is best shape parameter representing the localcloud droplet distribution? and, which is the impact onprecipitation modeling using different shape parametersin RAMS?
2. Methodology
The methodology is divided in the following items:Section 2.1 — data set description, Section 2.2 —gamma functions and comparison using correlationcoefficient and RMSE analysis and, Section 2.3 —precipitation simulation using RAMS.
2.1. Data set description
The dataset included airborne observations, collectedduring several flights which measured cloud dropletcontent and spectra; radiosonde launches, a 10 cmDoppler radar visible, IR satellite maps and pluviometernetwork in order to complete the description of theobserved convective systems. All data were obtained
Fig. 1. Map of the flight area with the main LBA sites: Cruzeiro do Sul (CS),Floresta (AF), and Fazenda Nossa Senhora (FNS).
during the Dry-to-Wet Campaign from September toNovember 2003, taking place in Western Amazonia(Fig. 1). The cloud droplet distributions were obtainedfrom a FSSP-100 (Forward Scattering SpectrometerProbe), which uses the scattering in order to sample thedroplet number. Calibration of this FSSP-100 isdescribed in “Signal processing package for opticalparticle counters — Model SPP-100, OperationsManual. Droplet Measurement Technologies Publica-tion.”, release date: 1 March, 2000. Available at: http://www.dropletmeasurement.com.
In order to show contrast between polluted and non-polluted areas, two groups of flights took place, duringthe dry season: with biomass burning, before the heavyrainfalls, from 23 to 26 to September and, after thatperiod with rainfalls, from October 5 to 8 (see Fig. 3).Consequently three specific events were chosen: 1 —September 23, with a biomass burning condition, duringdry season in central Rondonia which will be nominatedherein the polluted event, 2 – October 8, at the sameregion, with intermediary weather conditions – theintermediary event and 3 — October 5, over Acreregion, after a high rainfall event occurred duringOctober 4, nominated the clean event.
A total of 117 clouds were classified during the cleansituations, in which the flights were carried on duringmorning or afternoon. There were no significant differ-ences between both flights. Due to the remote position ofthe Acre flights, they have been used to exemplify non-
Rio Branco (RB), Porto Velho (PV), Ji-Paraná (JP), Vilhena (VL), Alta
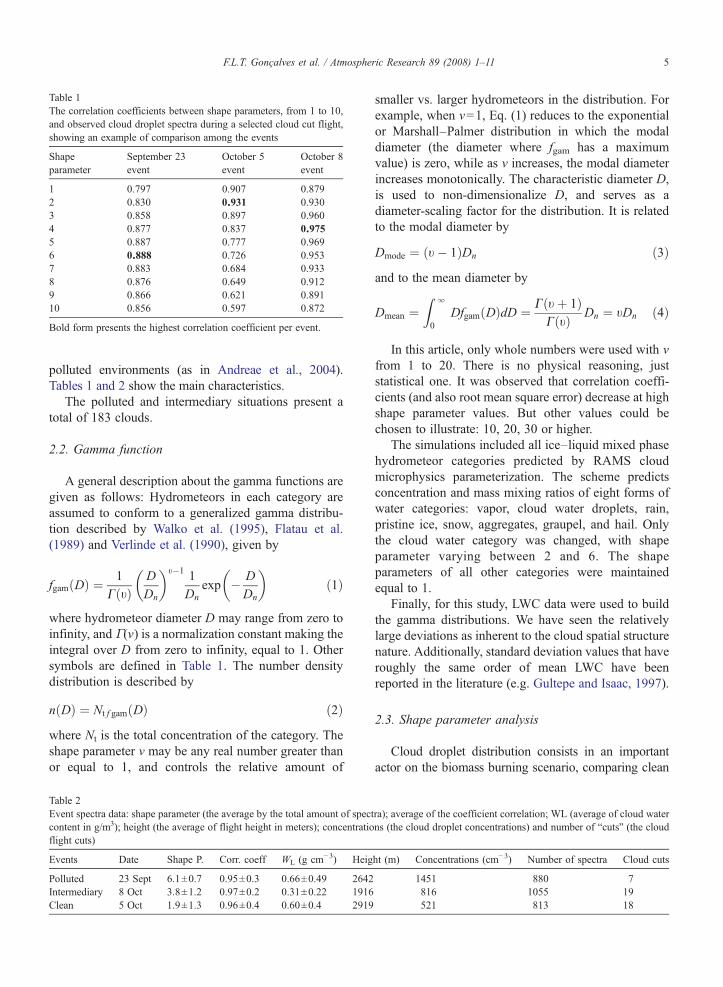
Table 1The correlation coefficients between shape parameters, from 1 to 10,and observed cloud droplet spectra during a selected cloud cut flight,showing an example of comparison among the events
Shapeparameter
September 23event
October 5event
October 8event
1 0.797 0.907 0.8792 0.830 0.931 0.9303 0.858 0.897 0.9604 0.877 0.837 0.9755 0.887 0.777 0.9696 0.888 0.726 0.9537 0.883 0.684 0.9338 0.876 0.649 0.9129 0.866 0.621 0.89110 0.856 0.597 0.872
Bold form presents the highest correlation coefficient per event.
5F.L.T. Gonçalves et al. / Atmospheric Research 89 (2008) 1–11
polluted environments (as in Andreae et al., 2004).Tables 1 and 2 show the main characteristics.
The polluted and intermediary situations present atotal of 183 clouds.
2.2. Gamma function
A general description about the gamma functions aregiven as follows: Hydrometeors in each category areassumed to conform to a generalized gamma distribu-tion described by Walko et al. (1995), Flatau et al.(1989) and Verlinde et al. (1990), given by
fgam Dð Þ ¼ 1
C tð ÞD
Dn
� �t�1 1
Dnexp � D
Dn
� �ð1Þ
where hydrometeor diameter D may range from zero toinfinity, and Γ(ν) is a normalization constant making theintegral over D from zero to infinity, equal to 1. Othersymbols are defined in Table 1. The number densitydistribution is described by
n Dð Þ ¼ Nt f gam Dð Þ ð2Þwhere Nt is the total concentration of the category. Theshape parameter v may be any real number greater thanor equal to 1, and controls the relative amount of
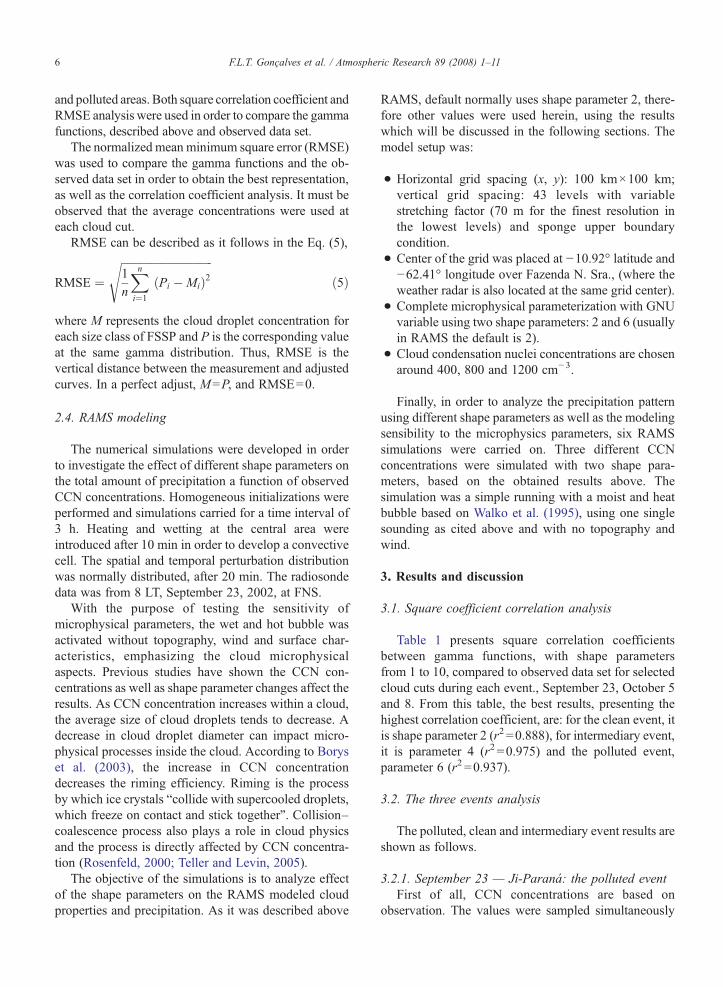
Table 2Event spectra data: shape parameter (the average by the total amount of spectcontent in g/m3); height (the average of flight height in meters); concentratioflight cuts)
Events Date Shape P. Corr. coeff WL (g cm−3) Heig
Polluted 23 Sept 6.1±0.7 0.95±0.3 0.66±0.49 2642Intermediary 8 Oct 3.8±1.2 0.97±0.2 0.31±0.22 1916Clean 5 Oct 1.9±1.3 0.96±0.4 0.60±0.4 2919
smaller vs. larger hydrometeors in the distribution. Forexample, when v=1, Eq. (1) reduces to the exponentialor Marshall–Palmer distribution in which the modaldiameter (the diameter where fgam has a maximumvalue) is zero, while as v increases, the modal diameterincreases monotonically. The characteristic diameter D,is used to non-dimensionalize D, and serves as adiameter-scaling factor for the distribution. It is relatedto the modal diameter by
Dmode ¼ t� 1ð ÞDn ð3Þand to the mean diameter by
Dmean ¼Z l
0Dfgam Dð ÞdD ¼ C tþ 1ð Þ
C tð Þ Dn ¼ tDn ð4Þ
In this article, only whole numbers were used with νfrom 1 to 20. There is no physical reasoning, juststatistical one. It was observed that correlation coeffi-cients (and also root mean square error) decrease at highshape parameter values. But other values could bechosen to illustrate: 10, 20, 30 or higher.
The simulations included all ice–liquid mixed phasehydrometeor categories predicted by RAMS cloudmicrophysics parameterization. The scheme predictsconcentration and mass mixing ratios of eight forms ofwater categories: vapor, cloud water droplets, rain,pristine ice, snow, aggregates, graupel, and hail. Onlythe cloud water category was changed, with shapeparameter varying between 2 and 6. The shapeparameters of all other categories were maintainedequal to 1.
Finally, for this study, LWC data were used to buildthe gamma distributions. We have seen the relativelylarge deviations as inherent to the cloud spatial structurenature. Additionally, standard deviation values that haveroughly the same order of mean LWC have beenreported in the literature (e.g. Gultepe and Isaac, 1997).
2.3. Shape parameter analysis
Cloud droplet distribution consists in an importantactor on the biomass burning scenario, comparing clean
ra); average of the coefficient correlation; WL (average of cloud waterns (the cloud droplet concentrations) and number of “cuts” (the cloud
ht (m) Concentrations (cm−3) Number of spectra Cloud cuts
1451 880 7816 1055 19521 813 18
6 F.L.T. Gonçalves et al. / Atmospheric Research 89 (2008) 1–11
and polluted areas. Both square correlation coefficient andRMSE analysis were used in order to compare the gammafunctions, described above and observed data set.
The normalized mean minimum square error (RMSE)was used to compare the gamma functions and the ob-served data set in order to obtain the best representation,as well as the correlation coefficient analysis. It must beobserved that the average concentrations were used ateach cloud cut.
RMSE can be described as it follows in the Eq. (5),
RMSE ¼ffiffiffiffiffiffiffiffiffiffiffiffiffiffiffiffiffiffiffiffiffiffiffiffiffiffiffiffiffiffiffiffiffi1n
Xni¼1
Pi �Mið Þ2s
ð5Þ
where M represents the cloud droplet concentration foreach size class of FSSP and P is the corresponding valueat the same gamma distribution. Thus, RMSE is thevertical distance between the measurement and adjustedcurves. In a perfect adjust, M=P, and RMSE=0.
2.4. RAMS modeling
The numerical simulations were developed in orderto investigate the effect of different shape parameters onthe total amount of precipitation a function of observedCCN concentrations. Homogeneous initializations wereperformed and simulations carried for a time interval of3 h. Heating and wetting at the central area wereintroduced after 10 min in order to develop a convectivecell. The spatial and temporal perturbation distributionwas normally distributed, after 20 min. The radiosondedata was from 8 LT, September 23, 2002, at FNS.
With the purpose of testing the sensitivity ofmicrophysical parameters, the wet and hot bubble wasactivated without topography, wind and surface char-acteristics, emphasizing the cloud microphysicalaspects. Previous studies have shown the CCN con-centrations as well as shape parameter changes affect theresults. As CCN concentration increases within a cloud,the average size of cloud droplets tends to decrease. Adecrease in cloud droplet diameter can impact micro-physical processes inside the cloud. According to Boryset al. (2003), the increase in CCN concentrationdecreases the riming efficiency. Riming is the processby which ice crystals “collide with supercooled droplets,which freeze on contact and stick together”. Collision–coalescence process also plays a role in cloud physicsand the process is directly affected by CCN concentra-tion (Rosenfeld, 2000; Teller and Levin, 2005).
The objective of the simulations is to analyze effectof the shape parameters on the RAMS modeled cloudproperties and precipitation. As it was described above
RAMS, default normally uses shape parameter 2, there-fore other values were used herein, using the resultswhich will be discussed in the following sections. Themodel setup was:
• Horizontal grid spacing (x, y): 100 km×100 km;vertical grid spacing: 43 levels with variablestretching factor (70 m for the finest resolution inthe lowest levels) and sponge upper boundarycondition.
• Center of the grid was placed at −10.92° latitude and−62.41° longitude over Fazenda N. Sra., (where theweather radar is also located at the same grid center).
• Complete microphysical parameterization with GNUvariable using two shape parameters: 2 and 6 (usuallyin RAMS the default is 2).
• Cloud condensation nuclei concentrations are chosenaround 400, 800 and 1200 cm−3.
Finally, in order to analyze the precipitation patternusing different shape parameters as well as the modelingsensibility to the microphysics parameters, six RAMSsimulations were carried on. Three different CCNconcentrations were simulated with two shape para-meters, based on the obtained results above. Thesimulation was a simple running with a moist and heatbubble based on Walko et al. (1995), using one singlesounding as cited above and with no topography andwind.
3. Results and discussion
3.1. Square coefficient correlation analysis
Table 1 presents square correlation coefficientsbetween gamma functions, with shape parametersfrom 1 to 10, compared to observed data set for selectedcloud cuts during each event., September 23, October 5and 8. From this table, the best results, presenting thehighest correlation coefficient, are: for the clean event, itis shape parameter 2 (r2 =0.888), for intermediary event,it is parameter 4 (r2 =0.975) and the polluted event,parameter 6 (r2 =0.937).
3.2. The three events analysis
The polluted, clean and intermediary event results areshown as follows.
3.2.1. September 23 — Ji-Paraná: the polluted eventFirst of all, CCN concentrations are based on
observation. The values were sampled simultaneously

Fig. 3. RMSE analysis for the different shape parameters at the threeevents: the polluted (♦), clean (▲) and intermediary (■).
Fig. 2. a Droplet size distributions for simulated cloud and theobserved cloud spectra from the flight and different cloud watercontents (550, 1000 and 2500 droplets mm−3), using shape parameter2. b Droplet size distributions with different cloud water contents (550,1000 and 2500 droplets cm−3), using shape parameter 6.
7F.L.T. Gonçalves et al. / Atmospheric Research 89 (2008) 1–11
with cloud droplet size distributions, by aircraft flightsduring the LBA experiment in September 2002. Acomplete discussion about the observed CCN spectra isgiven in a recent submitted paper: Martins et al., 2007:Cloud condensation nuclei from biomass burning duringthe Amazonian dry-to-wet transition season; which wassubmitted at Meteorology Atmospheric Physics.
During this event, 880 droplet spectra were collected,with 7 cloud flight cuts, which were analyzed andcompared to the gamma function, using shape para-meters as described at Section 2.2. As an example,Fig. 2a,b present the gamma functions based on shapeparameters 2 and 6, and the observed cloud dropletspectra, respectively, obtained from a particular cloud cutflight. From those figures, the shape parameter 6 isclearly the best fit, with observed data and presenting thehighest square correlation coefficients average; around0.95 (see also Table 2). On the other hand, shapeparameter 2 presents a lower square correlation coeffi-cient of 0.83. That means the gamma function using
shape parameter 6 could be a quite useful tool to modelthe cloud spectra in this particular event, instead of thenormally RAMS default shape parameter 2.
Table 2 shows the shape parameter 6 as the bestcorrelation coefficients for all cloud spectra (880),during the September 23 event. The spectra average is6.1, where the shape parameters, from 5 to 7, present thebest fit. Consequently, over polluted areas, shapeparameters have to shift from 2 to 6, due to high CCNconcentration. In order to support that last affirmative,Fig. 3 shows the CCN concentrations around 1000particles/cm3 during this event, from surface to 1800 mhigh, which is twice the value of the “clean event”(seealso Section 3.2.1), during the same period. Addition-ally, Fig. 4, showing the CCN vertical profile,emphasizes the high CCN concentrations at cloud baselevel (over 1000 m high), around 900 particles/cm3, andat 3000 m high, still very high, over 500 particles/cm3.Comparing to the other two events, it is a very highamount, almost double.
Table 3 shows the number of hot pixels over theflight area where Rondonia State presented a number of416, higher than the other events by three times. Thatinformation also supports the higher CCN concentra-tions as well.
The flight altitudes were between 1950 and 3300 mhigh, with altitude average around 2642 m (see Table 2),that means a large cloud depth flights. No significantchange on shape parameter was found at different levels,supporting the high CCN concentration profile (Fig. 4).
3.2.2. October 5 — Acre: the clean eventDuring the October 5 event, the flight collected a
total of 813 cloud spectra, corresponding to 18 differentcloud cuts (see Table 2). The flight was carried out overAcre State, far from the main mass burning focus (hot

Table 3Number of hot pixels in Rondonia and Acre States
Event Number of hot pixels
Acre Rondonia
Polluted — 23 Sept 128 416Intermediary — 8 Oct 0 3Clean — 5 Oct 43 145
Fig. 4. CCN concentrations in time evolution during LBA Dry-to-wetcampaign. It is import to note the highest number of CCN at surfaceand boundary layer during September 23 event and the lower valuesfor October 5 and 8 events.
8 F.L.T. Gonçalves et al. / Atmospheric Research 89 (2008) 1–11
pixels) in which occurs often over Rondonia State at thatperiod (see Table 3). In this area only 43 hot pixels werefound, and far from the flight area.
On Table 1, the highest square correlation coefficientoccurs at shape parameter 2 at a selected cloud cut.Additionally, on Table 2, the shape parameter 2 presentsthe best square correlation coefficients, on this event, forall cloud spectra (0.98), with the spectra average of 1.9,ranging from 1 to 3. It must be notified again that shapeparameter 2 is usually found at RAMS microphysicsdefault which could represent only clean conditions, asit will be discussed at Section 3.4. During this event, itappeared only one cloud cut where the best fit of theshape parameter was 5.
Fig. 3 shows the CCN concentrations around 300particles/cm3 from the surface to 1000 m heightdecreasing to around 200 particles/cm3 at 1800 mheight. Fig. 4 shows the CCN vertical profile emphasiz-ing the lower CCN concentrations, at cloud base levelaround 200 particles/cm3. At 3000 m height, theconcentration was the lowest, around 100 particles/cm3.
The flight altitudes were between 1600m and 4800 m,with average around 2919 m (see also Table 2). Thatdifference also means a large cloud depth and again therewas no significant change on shape parameters withrespect to altitude. The lowest flight altitude case presentsshape parameter 3 (one flight cut with 5, as cited above) asthe best fit and, the highest flight altitude presents shapeparameter 1 as the best fit.
3.2.3. October 8 — Ji-Paraná: the intermediary eventA total of 1055 cloud spectra were analyzed
compared to the gamma function crossing 19 differentclouds (see Table 2). During this event, the flight wascarried out in Rondonia State, over almost no focus of
biomass burning (see Table 3), due to strong rainfall (seealso Fig. 3) that occurred the day before. However, theCCN concentrations at lower levels were still high(Fig. 4). Therefore, we can nominate that event as the‘intermediary event’.
Fig. 3 shows the CCN concentrations from around300 particles/cm3 to a bit less at 1800 m, during thisevent. Fig. 4 shows the CCN vertical profile at the cloudbase level the CCN concentrations around 400 particles/cm3 (almost twice than the clean event and near thepolluted event) and at 3000 m, the concentration wasvery low, around 100 particles/cm3 (similar to the “cleanevent”). Those values emphasize lower CCN concentra-tions at higher levels, similar to the clean event, buthigher CCN concentrations at lower levels, 50% morethan that event.
Table 1 shows the shape parameter 4 presenting thebest square correlation coefficient at a selected flightcut. For all cloud spectra (1055), the shape parameteraverage was around 3.8. However, despite of the cleanevent presenting the same standard deviation; theintermediary event presents the largest range of shapeparameters, from 2 to 6, as the best fits, throughdifferent cloud flight cuts. A possible explanation is asit follows.
The flight altitudes were between 1400 m high and3250 m high with average around 1962 m, which alsomeans a large cloud depth flight cuts. Nevertheless, inthis event, there is a clear significant change on shapeparameter from the cloud base to the cloud top. Thelower flight cloud cuts present shape parameter 4 to 6 asthe best fits and, the highest flight cuts show shapeparameter 2 and 3 as the best fits. The vertical profile, atFig. 4, can also support this result. At lower levels, theCCN concentration is higher than the clean event,which means more amount of nuclei and, therefore,cloud spectra shift the shape parameter pattern,adjusting to higher shape parameter values (4–6).Opposite at the higher levels, with CCN concentrationssimilar to the clean event, that level presents as well as,similar shape parameter fits, around 2 and 3. Thereforeit was a clear mix of polluted and clean situation duringthis event.

Table 4Total water integrated on column and rainfall amount at the surfaceusing two shape parameters 2 and 6 and three CCN concentrations
Shape parameter 2 Shape parameter 6
Mcond
Mpcp
Avpcp
Stdpcp
Mcond
Mpcp
Avpcp
Stdpcp
CCN 400 4.45 21.62 0.52 2.79 7.84 15.33 0.32 3.88CCN 800 5.06 24.29 0.55 3.00 9.97 11.58 0.24 3.67CCN 1200 13.77 14.27 0.40 2.45 22.23 6.70 0.15 3.20
WhereM pcp is maximum accumulated precipitation (mm);M cond iscolumn integrated condensed water (mm); Av pcp is averageprecipitation (mm grid−1); Std pcp is normalized standard deviationof the accumulated precipitation.
9F.L.T. Gonçalves et al. / Atmospheric Research 89 (2008) 1–11
3.3. RMSE analysis
Fig. 5 shows an example of the three situations usingRMSE analysis. It was chosen a cloud cut at October 5, theclean event, another one, at October 8, the intermediaryand the last one, at September, 23, the polluted event.
It is clear seen that the shape parameter 2 has the bestfit to the observed data set, showing the smallest RMSEfor October 5; the shape parameter 4 has the best fit forOctober 8 and; the last one, for September 23, theparameter 6 presents the best fit. These resultsemphasize the previous sections, using square correla-tion coefficient and the event studies. Therefore, cloudswith different CCN concentration present specific shapeparameters as adjusted curves due to cloud dropletdistribution differences.
3.4. RAMS simulation results
The main results from the six simulations are shownon Table 4. The overall results present a great sensibilityof the microphysical parameters. From that table, it isobserved that the amount of condensed water (M cond)increases according to CCN concentration increase aswell as, increases while shape parameter increase.Similar result was observed to the precipitated watercolumn integrated (M pcp). It must be noted that theobserved column integrated liquid water is the differencebetween the total condensed and the precipitated water.
On the other hand, the average total rainfallprecipitation at the surface (Av pcp) generally decreasesaccording to the CCN concentration, while shape
Fig. 5. CCN vertical profiles obtained from the flights at the threestudied events. It is import to note the highest CCN concentration atSeptember 23, the “polluted event”, the intermediary event (for thelower flight levels) and the “clean event”.
parameter increase. However, there is a clear exceptiondealing with the maximum precipitation (M pcp). TheCCN concentration of 800 cm−3 shows the maximumprecipitation amount, 24.29 mm, for parameter 2, whileparameter 6 shows the maximum CCN concentration of400 cm−3, 15.33 mm. Standard deviation shows sametrends. That indicates the relation between maximumprecipitation on surface and CCN concentration couldnot be linear, being linear only at a specific shapeparameter, for parameter 6, for example.
Another result obtained from Table 4, comparing Mcond and Av pcp or M pcp, indicates the increase ofcondensed water is associated to the precipitated waterdecrease. That means a higher droplet concentration orlarger distributions are associated to clouds with lessefficient precipitation, which it is well documented onliterature (e.g. Rosenfeld, 1999). It is also linked tohigher shape parameters and, for its turn, to the pollutedevents, as cited above. Therefore, at different atmo-spheric conditions, linked to specific regions with orwithout mass burning, there is different fitting to thecloud droplet spectra, implying in different shapeparameters.
It is important to note that the absolute value ofprecipitation is function on the bubble initial conditions.There were no significant differences when theconvective cell is forced with more or less heating andhumidity. The forcing was introduced after 10 min ofsimulation in order to develop a convective cell. A totalof 6 km×6 km, in five levels, were forced in the centerof the domain. Temporal perturbation distributions werenormally distributed by 20 min and produced a total of4.5 °C of increase in temperature and 3.0 g/kg ofincrease in humidity.
Summarizing, different shape parameters, as well asCCN concentrations, affect directly the maximum andaverage amount of precipitation, which leads us to con-clude that different cloud droplet distributions, formed

10 F.L.T. Gonçalves et al. / Atmospheric Research 89 (2008) 1–11
over different atmospheric conditions, may also modifythe rainfall patterns.
4. Conclusions
As the main conclusion from the cloud spectraanalysis, over polluted areas, shape parameters withhigher values, from 5 to 7 are better fitted with cloudspectra than the usual shape parameter 2, normally usedin RAMS microphysics default. CCN vertical andtemporal profiles support that result, emphasizing thatthe higher CCN concentrations are related to massburning, where higher shape parameters are better fitted.On the other hand, at cleaner rainfall events, with few orno mass burning, associated or not with strong rainfalls,shape parameter 2 seems to be the best fit.
From the microphysics numerical modeling results, itis possible to conclude that different shape parametersand CCN concentrations influence directly the max-imum and average amount of precipitation and cloudwater contend, implying that each region and atmo-spheric condition should have their own specificationcharacteristics. Higher shape parameters are associatedto smaller amount of surface precipitation, on otherhand, to the higher amount of cloud liquid water. Thoseresults affect the scavenging processes, for instance, aswell as, many microphysics variables. That means theCCN concentrations and droplet spectra impact directlyon precipitation patterns, with many regional and globalimplications that derives from this affirmative.
Additionally, the transformation of cloud water intorainwater seems to be function of many simulationscenarios. Generally, the transformation efficiencydecreases with the increase of shape parameter generat-ing a total precipitation decrease. Nevertheless, at lowercloud droplet concentrations, this behavior is notevident, implying in a non-linear process.
According to the results of this work, the increase inCCN concentration and shape parameter cause oppositeeffects on precipitation process when compared to theresults from global models. On the other hand, toaddress any comparison it is necessary recognize thatglobal models use simple cloud parameterizations,which poorly represent the cloud microphysics interac-tions. Therefore, those models do not realisticallyrepresent situations when a polluted atmosphere impactson precipitation processes. An interesting observationthat can be noticed, from the results presented herein,concerning cloud droplet distributions, as mentionedabove. This implies that a cloud formed over a pollutedarea presents high cloud droplet concentration, leadingto a less efficient amount of precipitation. Consequently,
air pollution affects the precipitation patterns throughshape parameter and the inclusion of this parameter inglobal models may have an important impact on globalprecipitation.
Therefore, shape parameters are quite useful tools inorder to evaluate the spatial and temporal cloud patterns,being in accordance tomanyworks such asClark andHall(1983) and Milbrandt and Yau (2005). And finally,considering that CCN concentration and shape parameterare specifications chosen by the user, at RAMSmodeling,for instances, these results are very important concerningthe cloud spectra simulations, where those simulations tryto achieve as close as possible, the observed data.
Acknowledgements
We acknowledge CNPq and LBA Project as well asflight for Oliveira, J.C. Parente from UniversidadeFederal do Ceará. We also thank Prof. Dr. P. Artaxo,from IF-USP by the support of this study, being theleader of LBA Project.
References
Andreae, M.O., Rosenfeld, D., Artaxo, P., Costa, A.A., Frank, G.P.,Longo, K.M., Silva Dias, M.A.F., 2004. Smoking rain clouds overthe Amazon. Sience 303, 1337–1342.
Betts, A.K., Ball, J.H., Beljaars, A.C.M., Miller, M.J., Viterbo, P.,1996. The land-surface–atmosphere interaction: a review based onobservational and global modeling perspectives. J. Geophys. Res.101, 7209–7225.
Borys, Randolph, D., Lowenthal, Douglas H., Cohn, Stephen A.,Brown, William O.J., 2003. Mountaintop and radar measurementsof anthropogenic aerosol effects on snow growth and snowfall rate.Geophys. Res. Let. 30 (10), 1538. doi:10.1029/2002GL016855.
Clark, T.L., 1976. Use of log-normal distribution for numericalcalculations of condensation and collection. J. Atm. Sci. 33, 810–821.
Clark, T.L., Hall, W.D., 1983. A Cloud physical parameterizationmethod using movable basis functions: stochastic coalescenceparcel calculations. J. Atmos. Sci. 40, 1709–1728.
Ferrier, B.S., 1993. A double-moment multiple-phase four-class bulkice scheme. Part 1: description. J. Atmos. Sci. 5 (I), 249–280.
Flatau, P.J., Tripoli, G.J., Verlinde, J., Cotton, W.R., 1989. The CSU-RAMS cloud microphysical module: general theory and codedocumentation. Dept. of Atmos. Science Paper, 451. Colorado StateUniversity, Fort Collins.
Freitas, S.R., Artaxo, P., Andreae, M.O., Fischer, H., 2000a. Aconvective kinematic trajectory technique for low resolutionatmospheric models. J. Geophys. Res. 105 (D19), 24375–24386.
Freitas, S.R., Silva Dias, M.A.F., Silva Dias, P.L., 2000b. Modeling theconvective transport of trace gases by deep and moist convection.Hybrid Methods Eng. 3, 317–330.
Gultepe, I., Isaac, G.A., 1997. Liquid water content and temperaturerelationship from aircraft observations and its applicability to GCMs.J. Climate 10, 446–452.
Harshvardhan, Schwartz, S.E., Benkovitz,C.M., 2002.Aerosol influenceon cloud microphysics examined by satellite measurements andchemical transport modeling. J. Atmos. Sci. 59, 714–725.

11F.L.T. Gonçalves et al. / Atmospheric Research 89 (2008) 1–11
Liu, Y, Daum, P.H., 2004. Parameterization of the auto-conversionprocess. Part I: analytical formulation of the Kessler-typeparameterizations. J. Atmos. Sci. 61, 1539–1548.
Martins, J.A., Gonçalves, F.L.T., Morales, C.A., Fisch, G., Pinheiro,F.G.M., Leal Júnior, J.B.V., Oliveira, C.J., Silva, E.M., Oliveira,J.C.P., Costa, A.A., Silva Dias, M.A.F., 2007. Cloud condensationnuclei from biomass burning during the Amazonian dry-to-wettransition season Submitted at Meteorol. Atmos. Phys.
Milbrandt, J.A., Yau, M.K., 2005a. A multi-moment bulk micro-physics parameterization. Part I: analysis of the role of the spectralshape parameter. J. Atmos. Sci. 62, 3051–3064.
Milbrandt, J.A., Yau, M.K., 2005b. A multi-moment bulk micro-physics parameterization. Part II: a proposed three-moment closureand scheme description. J. Atmos. Sci. 62, 3065–3081.
Khain, A.P., Pokrovsky, A., Sednev, I., 1999. Some effects of cloud–aerosol interaction on cloud microphysics structure and precipita-tion formation: numerical experiments with a spectral micro-physics cloud ensemble model. Atmos. Res. 52, 195–220.
Milbrandt, J.A., Yau, M.K., 2005. A multimoment bulk microphysicsparameterization. Part II: a proposed three-moment closure andscheme description. J. Atmos. Sci. 62, 3065–3081.
Rosenfeld, D., 1999. TRMMobserved first direct evidence of smoke fromforest fires inhibiting rainfall. Geophys. Res. Lett. 26, 3105–3108.
Rosenfeld, D., 2000. Suppression of rain and snow by urban andindustrial air pollution science 10March 2000, p. 1793. doi:10.1126/science.287.5459.1793.
Saleeby, S.M., Cotton,W.R., 2004. A large-droplet mode and prognosticnumber concentration of cloud droplets in the Colorado StateUniversity Regional Atmospheric Modeling System (RAMS). Part I:module descriptions and supercell test simulations. J. Appl.Meteorol.43 (1), 182–195.
Straka, J.M., Gilmore, M.S., Kanak, K.M., Rasmussen, E.N., 2005. Acomparison of the conservation of number concentration for thecontinuous collection and vapor diffusional growth equationsusing one and two moments. J. Appl. Meteor. 44, 1884–1889.
Teller, A., Levin, Z., 2005. The effects of aerosols on precipitation anddimensions of subtropical clouds; a sensitivity study using a numeri-cal cloud model. Atmos. Chem. Phys. Discuss. 5, 7211–7245.
Tremblay, A., Vaillancourt, P.A., Cober, S.G., Glazer, A., Isaac, G.A.,2004. Improvements of a mixed-phase cloud scheme using aircraftobservations. Mon. Weather Rev. 131 (4), 672–686.
Verlinde, J., Flatau, P.J., Cotton, W.R., 1990. Analytical solutions tothe collection growth equation: Comparison with approximatemethods and application to cloud microphysics parameterizationschemes. J. Atmos. Sci. 47, 2871–2880.
Walko, R.L., Cotton ⁎, W.R., Meyers, M.P., Harrington, J.Y., 1995.New RAMS cloud microphysics parameterization Part I: thesingle-moment scheme. Atmos. Res. 38, 29–62.
Wang, C., Chang, J., 1993. A three dimensional numerical model ofcloud dynamics, microphysics, and chemistry I. Concepts andformulations. J. Geophys. Res. 98, 14827–14844.
Copyright © 2022 FDOKUMEN