Four years of vertebrate monitoring on an upper Amazonian river
25
1 23 Biodiversity and Conservation ISSN 0960-3115 Volume 20 Number 4 Biodivers Conserv (2011) 20:827-849 DOI 10.1007/s10531-010-9982- y Four years of vertebrate monitoring on an upper Amazonian river
-
Upload
independent -
Category
Documents
-
view
0 -
download
0
Transcript of Four years of vertebrate monitoring on an upper Amazonian river
1 23
Biodiversity andConservation ISSN 0960-3115Volume 20Number 4 Biodivers Conserv (2011)20:827-849DOI 10.1007/s10531-010-9982-y
Four years of vertebrate monitoring on anupper Amazonian river

1 23
Your article is protected by copyright and
all rights are held exclusively by Springer
Science+Business Media B.V.. This e-offprint
is for personal use only and shall not be self-
archived in electronic repositories. If you
wish to self-archive your work, please use the
accepted author’s version for posting to your
own website or your institution’s repository.
You may further deposit the accepted author’s
version on a funder’s repository at a funder’s
request, provided it is not made publicly
available until 12 months after publication.

ORI GIN AL PA PER
Four years of vertebrate monitoring on an upperAmazonian river
Nigel C. A. Pitman • Darren Norris • Jerry Martınez Gonzalez •
Eriberto Torres • Fernando Pinto • Hernan Collado • Wilberth Concha •
Raul Thupa • Edwin Quispe • Jorge Perez • Juan Carlos Flores del Castillo
Received: 8 January 2010 / Accepted: 23 December 2010 / Published online: 12 January 2011� Springer Science+Business Media B.V. 2011
Abstract Long-term monitoring of tropical forest animals lags far behind long-term
monitoring of tropical forest plants, compromising ecologists’ ability to identify parallel
trends. On 257 occasions over 4 years, park guards in a newly protected lowland Ama-
zonian forest in southeastern Peru tallied individuals of 31 reptile, bird, and mammal
species sighted along a 47-km stretch of river. Each survey entailed *3 h of observation
from a motorized boat; total survey effort was 892 h and *12,048 km. Our primary goals
were descriptive: to establish baseline sighting rates for these species and to document
trends over time and the influence of environmental and sampling factors on sightings. Our
secondary goals were to identify the advantages and disadvantages of river-based moni-
toring and to assess how useful these data are for ecologists and protected areas managers.
Over the 4 years of monitoring we observed 1.8 animals/km. More than 90% of recorded
individuals belonged to seven common taxa: two reptiles, four birds, and one mammal.
Season was the most frequent correlate of sighting frequency; sightings increased in dry
season. For the majority of taxa common enough to analyze, sightings increased over the
4 years of monitoring; this is possibly a result of reduced hunting since the establishment
of the protected area. Compared to forest-based surveys, river-based surveys were ineffi-
cient at recording most mammals. Results to date suggest that river-based surveys can be a
valuable, inexpensive tool for monitoring some ecologically important Amazonian ani-
mals, and especially those in protected areas.
N. C. A. Pitman � J. M. Gonzalez � E. Torres � F. Pinto � H. Collado � W. Concha � R. Thupa �E. Quispe � J. Perez � J. C. Flores del CastilloAmazon Conservation Association, Jiron Cusco 499, Puerto Maldonado, Madre de Dios, Peru
D. NorrisFundacao Ecologica Cristalino, Av. Perimetral Oeste, 2001, Alta Floresta, MT 78580-000, Brazil
N. C. A. Pitman (&)Center for Tropical Conservation, Nicholas School of the Environment, Duke University, Box 90381,Durham, NC 27708-0381, USAe-mail: [email protected]
123
Biodivers Conserv (2011) 20:827–849DOI 10.1007/s10531-010-9982-y
Author's personal copy

Keywords Animal surveys � Hunting � Riparian � Rivers
Introduction
Ecologists have increasingly good data on how Amazonian plant communities change over
time (e.g., Phillips et al. 2002, 2004; Laurance et al. 2004; Lewis et al. 2004a). The same
cannot be said for Amazonian animal communities. In the 30 years that ecologists have
been working in southwestern Amazonia—one of the richest and best-studied areas of the
basin—fewer than five studies have tracked population dynamics of an animal species for
more than 3 years (e.g., Goldizen et al. 1996; Groenendijk et al. 2001, 2005). In the
absence of long-term monitoring, it was possible for the region’s most abundant large
vertebrate to vanish from an area larger than Costa Rica for 12 years with no more than
anecdotal documentation by scientists (white-lipped peccaries in Madre de Dios, Peru,
1978–1990; Silman et al. 2003).
The peccaries’ disappearance appears to have doubled the seedling density of a dominant
tree species at one site (Silman et al. 2003); it likely produced other convulsions in the plant
community across the region (Dirzo and Miranda 1991; Wright et al. 2000; Terborgh et al.
2001, 2008; Peres and Palacios 2007). Given the interdependence between vertebrate seed
dispersers, canopy trees, and top predators in tropical forests, similar shifts in plant com-
munities are likely taking place across Amazonia as hunting decimates vertebrate com-
munities (e.g., Peres and Lake 2003). But since the dataset on global climate far outstrips the
dataset on Amazonian vertebrate communities, many of these changes in plant communities
may be attributed incorrectly to a changing climate (but see Lewis et al. 2004b).
The problem is compounded by the fact that the leading survey techniques for Ama-
zonian vertebrates (e.g., line-transects, point counts, quadrat surveys, camera traps) tend to
require trained experts or expensive equipment, making them expensive, time-consuming,
and difficult to sustain over long time periods (Danielsen et al. 2005, 2008; Gardner et al.
2007). All of this makes it a high priority to investigate simple, low-cost methods by which
local residents can collect monitoring data on Amazonian wildlife.
In this paper we describe results from 4 years of quantitative wildlife surveys by park
guards along a river in western Amazonia, in part to determine whether this low-cost
method might help supplement traditional monitoring efforts across the basin. We begin by
asking:
(1) What are the baseline sighting rates for the 31 target taxa? Which species were
commonly sighted and which were rare?
(2) How did sighting probability and the number of animals spotted vary over time, and
how did they vary under different survey and environmental conditions?
Since tropical river surveys are becoming increasingly common in the scientific liter-
ature (e.g., Renton 2002; Davenport 2003; Karubian et al. 2005; Townsend et al. 2005;
Cintra et al. 2007) and since little has been written about their effectiveness, we then ask:
(3) What are the biases of riparian monitoring, and what are the advantages? How do
results from riparian monitoring compare with those from more traditional
monitoring along forest transects?
(4) How useful are the data collected for ecologists, and which species are the most
promising for future work? How useful are results to date for protected area
managers?
828 Biodivers Conserv (2011) 20:827–849
123
Author's personal copy

Methods
Study area
Monitoring was carried out on the Los Amigos River, a tributary of the Madre de Dios
River at the base of the Andes in southern Peru (Figs. 1, 2). The 353-km Los Amigos
drains 4,415 km2 of lowland Amazonian forest between 225 and 600 masl. A low-gradient
whitewater river, the Los Amigos meanders through a 1–2 km-wide floodplain dotted with
oxbow lakes and flanked by forested terraces 30–40 m high.
Data in this paper were collected on a 47-km section of the Los Amigos between the
river’s mouth (12.57S 70.06W, 225 masl) and its confluence with the Amiguillos River
(12.44S 70.25W, 259 masl). The end points of this stretch of river are 24.3 km apart in a
straight line. River width here varies seasonally as dropping water levels expose large
sandy beaches, but the distance between the vegetation on opposite banks is 60–90 m year-
round. The most common vegetation types on this stretch of river are primary successional
forest and older floodplain forest (Terborgh and Petren 1991; Kalliola et al. 1992; Hamilton
et al. 2007). What an observer traveling the river sees is a strip of sky overhead, a wall of
vegetation to either side, and a curving expanse of water, snags, beaches, and riverbank
(Fig. 2). The majority of animals sighted during monitoring were on beaches (most cai-
mans, shorebirds, and terrestrial mammals), on snags in the river (most turtles), in the trees
along the bank (most primates), or airborne (most macaws).
No towns or villages have existed in the Los Amigos watershed over the last century,
and it has suffered no significant deforestation. Even so, during our study animal
Fig. 1 A map of the study area in southeastern Peru. The inset shows the 47-km stretch of the Los AmigosRiver along which the study was carried out. A star in the inset indicates the location of the Los AmigosBiological Station. The white portion of the map is below 500 m elevation; darker gradations show 500-mintervals. Dotted lines represent roads. Several rivers have been omitted for clarity
Biodivers Conserv (2011) 20:827–849 829
123
Author's personal copy

communities were recovering from significant hunting pressure. The stretch of river we
studied is inside the Los Amigos Conservation Concession (LACC), a 145,918-ha pro-
tected area managed by a Peruvian conservation organization since 2003 under the
supervision of the Peruvian forest service. Prior to the LACC’s establishment, dozens of
logging camps were active inside the Los Amigos watershed and both hunting and turtle
egg-collecting were common. Between May 2001 and March 2002, an average 1,000
loggers/day were estimated to be cutting scattered mahogany and tropical cedar trees inside
the watershed. Although this only gives a population density of 0.22 persons/km2, the
absence of roads in the watershed concentrated hunting pressure (mostly shotguns) in a
narrow band of forest along the river. Based on boat traffic data we collected at a point on
the lower Amigos in 2003 (before the new reserve was implemented), we estimate for that
period an average [5 boat trips per day with at least one hunter.
By the time our animal monitoring began in April 2004, all loggers had left the
watershed. Boat traffic on the stretch of river we studied was reduced to an average\1 trip
per day (mostly researchers and park guards), and both hunting and turtle-egg collecting
were reduced to essentially 0. While the border of the protected area runs close to the south
bank of the river for most of this stretch (Fig. 1), the adjacent lands (all logging conces-
sions) are also closed canopy forest where impacts during the study were limited to
selective logging several kilometers from the river and hunting was rare to absent. The
monitoring we report on here was carried out by the LACC’s park guards as part of their
frequent patrols of the Los Amigos River.
Data collection
Between 27 April 2004 and 21 April 2008, we recorded the number of individuals of 31
vertebrate species (hereafter ‘‘target species’’) observed during 257 boat trips traversing the
same 47-km stretch of the Los Amigos River, for a total of 12,047 km sampled (Table 1).
Each upstream trip took 3–4 h; downstream trips took 2.5 h. Trips were not made on a
Fig. 2 A dry-season photograph of a segment of the Los Amigos River monitored in this study. Duringmuch of the wet season, the sandbanks seen here are underwater. The distance between vegetation on theopposite banks is approximately 60 m. The logs littering the river are the result of natural erosion. Photocourtesy of Antonio Vizcaıno
830 Biodivers Conserv (2011) 20:827–849
123
Author's personal copy

Tab
le1
Sam
pli
ng
effo
rt,
spec
ies
div
ersi
ty,
and
the
nu
mb
ero
fin
div
idu
als
of
repti
les,
bir
ds,
and
mam
mal
ssi
gh
ted
per
km
du
ring
4y
ears
of
rip
aria
nm
on
ito
ring
on
the
Lo
sA
mig
os
Riv
erin
Am
azon
ian
Per
u
Mo
nit
ori
ng
yea
rT
rip
cou
nt
(wet
,d
ry)
To
tal
trip
dis
tan
ce(k
m)
To
tal
spec
ies
Mea
nn
um
ber
of
spec
ies
per
km
Mea
nin
div
idu
als
per
km
All
Rep
tile
sB
ird
sM
amm
als
16
3(2
4,
39
)2
,95
32
10
.11
(0.0
1–0
.13
)0
.93
(0.7
5–1
.19
)0
.33
(0.2
2–0
.53)
0.4
1(0
.32
–0
.51)
0.0
7(0
.03
–0
.11)
27
3(4
1,
32
)3
,42
22
30
.12
(0.0
1–0
.13
)1
.69
(1.3
7–2
.07
)0
.94
(0.7
0–1
.25)
0.4
4(0
.34
–0
.61)
0.1
4(0
.08
–0
.24)
36
3(3
0,
33
)2
,95
32
20
.14
(0.1
3–0
.15
)2
.38
(2.0
5–2
.92
)1
.40
(1.1
3–1
.72)
0.7
2(0
.59
–0
.90)
0.2
2(0
.16
–0
.30)
45
8(2
5,
33
)2
,71
92
10
.14
(0.1
3–0
.15
)2
.35
(1.8
7–2
.92
)1
.50
(1.0
8–2
.07)
0.9
3(0
.72
–1
.24)
0.2
3(0
.18
–0
.30)
All
yea
rs2
57
(12
0,
13
7)
12
,04
72
60
.13
(0.1
2–0
.15
)1
.60
(1.3
7–1
.94
)1
.06
(0.7
9–1
.47)
0.5
4(0
.42
–0
.68)
0.1
8(0
.11
–0
.26)
Mea
ns
wer
ees
tim
ated
via
aboots
trap
pin
gte
chniq
ue
and
are
acco
mpan
ied
by
95%
confi
den
cele
vel
sin
par
enth
eses
Biodivers Conserv (2011) 20:827–849 831
123
Author's personal copy

fixed schedule, but took advantage of the park guards’ patrols. Park guards made an
average of 5.4 trips per month (range 0–15). May and June had the highest mean number of
trips, September and December the lowest.
All boat travel was in 12-m wooden boats powered by 16-hp engines with a 3-m
driveshaft (locally known as peque-peques). Upstream velocity was 11–17 km/h; down-
stream velocity was 18–22 km/h. These motors are extremely noisy and can be heard from
up to 4 km away; most animals were recorded by sight. The median number of observers
per trip was two (range 1–5).
Data for each trip were recorded on a standardized paper form which included checklists
of target species and space to record trip information and environmental observations (see
form in Table 4—Appendix 1). Trip information included the names and number of
observers, the date and time of departure and arrival, and the presence or absence of other
boats on the same stretch of river the same day. Environmental data were qualitative
observations of river level (high, medium, low) and sunshine (sunny or not). On each trip
we recorded the total number of individuals observed of each target species.
The 31 target species included three aquatic reptiles (a turtle and two caimans), 16
mammals (seven primates, two mostly aquatic, and seven terrestrial), and 12 birds. These
species were selected because: (1) they are species of conservation interest potentially
recovering from past overharvesting in southeastern Peru (e.g., Melanosuchus niger [black
caiman], Podocnemis unifilis [yellow-spotted river turtle], Pteronura brasiliensis [giant
otter]), (2) because they reproduce in riparian areas and may be indicators of riverside impacts
(e.g., Rhynchops niger [Black Skimmer], Sterna superciliaris [Yellow-billed Tern]), or (3)
because their use of riverside habitat in Amazonia is poorly quantified (e.g., Atelocynusmicrotis [short-eared dog]). Five species are globally threatened: Ateles chamek (black-faced
spider monkey, VU), Lagothrix lagotricha (common woolly monkey, VU), P. unifilis (VU),
P. brasiliensis (EN), and Tapirus terrestris (South American tapir, VU; IUCN 2008).
Intensive inventories of reptiles, birds, and non-volant mammals at Los Amigos have
tallied 74 reptile, 552 bird, and 66 non-volant mammal species (R. von May, J. Tobias,
R. Leite Pitman and colleagues, pers. comm.). Thus the 31 target species in our monitoring
program represent a tiny percentage of the total vertebrate fauna in the region, biased
towards large, conspicuous, and threatened species.
The park guards who carried out the monitoring are long-time residents of Madre de
Dios who grew up surrounded by forest and can identify target species with ease. Bin-
oculars were not typically used. To minimize observer bias, park guards received a 1-h
field-and-classroom training session in identifying the more difficult-to-distinguish target
species, especially the smaller birds, before beginning the surveys. As a result of this
meeting, as well as monthly meetings throughout the surveys, various identification
problems were identified and resolved. For example, sightings of two macaw species (Arachloropterus and A. macao) were aggregated because flying individuals cannot always be
distinguished by sight alone (D. Brightsmith, pers. comm.).
Surveys conducted in October–March were classed as ‘‘wet season’’ and those in April–
September as ‘‘dry season,’’ based on seasonal rainfall patterns in southeastern Peru
(Amazon Conservation Association, unpublished data). For each trip, we calculated total
precipitation recorded in the 24 h preceding midday of the trip’s date by a weather station
at the Los Amigos Biological Station (12.56�S 70.10�W), 3.5 km from the mouth of the
Los Amigos River (Fig. 1). The time effect (i.e., the moment in which each survey began
during the four-year period) was modeled by creating a continuous variable ranging from 0
to 4; each trip during the 4 years of monitoring was assigned a value on this scale cor-
responding to its starting time and date.
832 Biodivers Conserv (2011) 20:827–849
123
Author's personal copy

In order to assess impacts of historical hunting on the survey results, we classified each
target species as never hunted, occasionally hunted, or commonly hunted, based on per-
sonal observations around Los Amigos and data from elsewhere in Madre de Dios (e.g.,
Schulte-Herbruggen 2003).
In order to compare river-based monitoring results with forest-based monitoring results,
we used diurnal data from five permanent *4-km transects in floodplain forest along or
near this stretch of the Los Amigos River (Amazon Conservation Association, unpublished
data). At monthly intervals between April 2005 and May 2008, two observers surveyed
mammals along these transects a total of 134 times (reptiles and birds were not recorded).
Each survey began at 6 a.m. and lasted for 4 h, following standard methods (Peres 1999).
Total survey effort was 561.3 km and approximately the same amount in hours. Transect
surveys were carried out by the same park guards who did riparian surveys.
Based on Danielsen et al.’s (2008) recent classification system for monitoring
approaches, river-based and transect-based monitoring at Los Amigos in 2004–2008
qualified as Category 3 (Collaborative Monitoring with External Data Interpretation).
Cost of data collection
A full accounting of the cost of these river-based surveys would take into account park
guard salaries, as well as training, gasoline, boat, and other expenses. However, because
river-based surveys were incorporated into the guards’ existing duties, monitoring itself
incurred very few additional costs. The one exception was the paper forms used during the
monitoring (Table 4—Appendix 1). Our estimate of the cost of forest transect-based
surveys by the park guards included travel, work, and fuel costs.
Statistical analyses
In order to standardize sampling effort and data distribution to compare sighting rates
between monitoring years, a resampling procedure was used to derive means and 95%
confidence intervals of individuals/km values for each monitoring year. The data were
resampled with replacement (Bootstrap) to create samples of 40 records for each year
(20 from dry season and 20 from wet season) with 10,000 iterations to provide stable
values. One outlier (a sighting of 200 peccaries) was replaced by 25, the mean number of
peccaries oberved per sighting on other occasions.
For a subset of 11 relatively common species we used generalized linear mixed effects
models to evaluate the influence of temporal, environmental and other factors on the survey
results (Pinheiro and Bates 2000). The 11 species included three reptiles [P. unifilis, M. niger,
and Caiman crocodilus (white caiman)], four birds [A. ararauna (Blue-and-yellow Macaw),
Anhima cornuta (Horned Screamer), Cairina moschata (Muscovy Duck), and Vanelluscayanus (Pied Lapwing)], and four mammals [Hydrochoerus hydrochaeris (capybara),
Alouatta seniculus (Colombian red howler monkey), A. chamek and Saimiri boliviensis(Bolivian squirrel monkey)]. Six of these were hunted in Los Amigos before 2002, and five
were not (see Table 3). Resampled values were not used in the mixed effects models.
To model the number of individual animals seen on a given trip, counts were first
square-root transformed to improve normality and reduce heteroscedascity. To model
sighting probability on a given trip, individual counts were transformed to binary presence/
absence data (binomial family). In both models we included observation time, season (wet
or dry), trip starting period (categorical with three levels: morning, midday, afternoon),
rainfall, sunshine, presence of other boats and direction of travel as fixed effects, and
Biodivers Conserv (2011) 20:827–849 833
123
Author's personal copy

month in year, trip starting hour and observer as uncrossed random effects. We did not
include interaction terms. Within the mixed effects model differences in the random effects
are accounted for by taking account of their contribution to the variance in response as
measured by a standard deviation in intercept and a standard deviation in slope (Crawley
2007). Modeling month within year as a random effect was used to account for the
anticipated non-normal (autocorrelated) errors resulting from our irregular timeseries.
Backwards selection was used to select the minimal adequate model for each species,
based on AIC and BIC values.
P values for the full models and the individual effects were derived for an upper-bound
n of denominator degrees of freedom computed as n of observations minus n of fixed
effects. As these P-values are potentially anti-conservative, we generated confidence
intervals from the posterior distribution of parameter estimates with Markov Chain Monte
Carlo methods, using the mcmcsamp function in the lme4 package with default specifi-
cations (e.g., n = 1,000 samples; locally uniform priors for fixed effects; locally non-
informative priors for random effects; Bates et al. 2008; Bolker et al. 2009; Baayen et al.
2008). Both procedures yielded the same results; we present those from the Markov Chain
Monte Carlo methods.
We used analysis of variance (ANOVA) to test if there was any significant variation in
the timing of trips between monitoring years (as surveys started in April, monitoring years
were defined as the 12 months from April to March).
Results
Baseline sighting rates
In the 12,047 km of river surveyed from 2004 to 2008, we observed 21,641 animals
belonging to 27 of the 31 target species (Table 5—Appendix 2): an overall sighting rate of
1.8 animals/km. Table 1 reports bootstrapped annual and overall sighting rates for reptiles,
birds, and mammals, as well as the mean number of species sighted per km surveyed.
Two reptile, four bird, and one mammal species were recorded on most trips, and these
seven taxa accounted for 90% of all individuals sighted (Table 2). Four target species
known to occur in the area, all mammals, were never observed: A. microtis, L. lagotricha,
Table 2 The seven species recorded on C49% of trips during 4 years of monitoring on the Los AmigosRiver, Amazonian Peru
Species Common name Percentageof all tripsrecorded
Percentage ofall individualsrecorded
Overallindividuals/km
Caiman crocodilus White caiman 49 4 0.08
Podocnemis unifilis Yellow-spotted river turtle 86 53 0.96
Ara chloropterusand A. macao
Red-and-green Macawand Scarlet Macaw
71 8 0.14
Ara ararauna Blue-and-yellow Macaw 73 16 0.29
Vanellus cayanus Pied Lapwing 63 6 0.10
Hydrochoerushydrochaeris
Capybara 50 3 0.05
These seven taxa accounted for 90% of all individuals recorded
834 Biodivers Conserv (2011) 20:827–849
123
Author's personal copy

Puma concolor (puma), and S. venaticus (bush dog). Two primate species are represented
in the database by a single individual (Pithecia irrorata [Gray’s bald-faced saki monkey]
and Cebus albifrons [White-fronted capuchin monkey]), and three bird species were
recorded three or fewer times (Platalea ajaja [Roseate Spoonbill], Neochen jubata[Orinoco Goose], and Phaetusa simplex [Large-billed Tern]).
Trends over time
The number of all animals recorded per km surveyed increased significantly from the first
to the fourth year of monitoring (Table 1). This was also the case for reptiles (a fourfold
increase), birds (a twofold increase), and mammals (a threefold increase; Fig. 3). In all
three taxa, every new year of monitoring saw an increase in sighting frequency compared
to the previous year. Annual increases were rarely significant, but variation between values
separated by two or more years was always positive and statistically significant 78% of the
time. The mean number of species recorded per km showed a steady but non-significant
increase from the first to the fourth year of monitoring. We found no significant variation in
the mean starting time of trips between monitoring years (ANOVA, F3,253 = 0.185,
P = 0.907) so can reject the hypothesis that there was any systematic change in the timing
of trips that could bias results over the four monitoring years.
The number of individuals recorded per trip increased over time for six of the eleven
species common enough to model, and for five of the six most commonly sighted species
(Table 3). Four species also showed a significant temporal trend in sighting probability.
Three species (C. crocodilus, H. hydrochaeris, and A. chamek) showed a positive trend in
both measures. Three species (P. unifilis, A. ararauna, and V. cayanus) showed a positive
Fig. 3 Changes in mean annual sighting frequency of 31 species of reptiles, birds, and mammals over4 years of riparian monitoring on the Los Amigos River, Amazonian Peru. Within a taxonomic group,means that share a letter are not significantly different
Biodivers Conserv (2011) 20:827–849 835
123
Author's personal copy

Tab
le3
Pre
dic
tors
of
rela
tive
abundan
cefo
r11
com
mon
ver
tebra
tes
on
the
Los
Am
igos
Riv
er,
Am
azonia
nP
eru
Sp
ecie
sN
o.
trip
ssi
gh
ted
Tem
po
ral
tren
dn
o.
ind
ivid
ual
s
Tem
po
ral
tren
dsi
gh
tin
gp
rob
abil
ity
Wet
seas
on
no
.in
div
idu
als
Wet
seas
on
sig
hti
ng
pro
bab
ilit
y
Oth
erco
rrel
atio
ns
Po
do
cnem
isu
nifi
lis§
22
20
.73*
**
(0.1
8)
-2
.30�
(0.4
1)
Rai
nfa
ll(-
),su
n(?
)
Mel
ano
such
us
nig
er6
0-
0.3
6*
*(0
.08
)-
1.8
08
6�
(0.3
78
3)
Caim
an
croco
dil
us§
12
70
.21*
(0.1
1)
0.3
26
2*
(0.1
362
)-
1.6
1�
(0.2
5)
-2
.456
4�
(0.3
19
0)
Boat
s(?
)
Ara
ara
rau
na
18
70
.51*
(0.2
1)
1.4
46
5*
**
(0.4
42
0)
Boat
s(-
)
An
him
aco
rnut
a1
21
-0
.043
29
(0.1
403
6)
-0
.29
*(0
.12
)-
0.3
89
99
(0.3
17
02
)
Ca
irin
am
osc
ha
ta§
83
Su
n(-
)
Va
nel
lus
caya
nus
16
30
.32*
*(0
.11
)-
1.3
7�
(0.2
4)
-1
.518
0*
**
(0.4
97
4)
Su
n(?
)
Hyd
roch
oer
us
hyd
roch
aer
is§
12
90
.43�
(0.0
7)
0.6
09
1�
(0.1
371
)-
0.5
3*
*(0
.15
)-
0.7
38
6*
*(0
.30
13
)A
fter
no
on
(?),
up
riv
er(?
)
Alo
ua
tta
sen
icul
us§
38
Rai
nfa
ll(?
)
Ate
les
cha
mek
§4
20
.14*
(0.0
5)
0.3
63
0*
*(0
.15
77
)
Sa
imir
ib
oli
vien
sis
39
Up
riv
er(?
)
Fo
rmer
lyh
un
ted
spec
ies
are
mar
ked
wit
h§
sym
bo
l.S
ign
ifica
nce
sym
bo
ls:
*\
0.0
5,
**\
0.0
1,
**
*\
0.0
01
,�\
0.0
00
1
836 Biodivers Conserv (2011) 20:827–849
123
Author's personal copy

trend in number of individuals sighted but no change in sighting probability. Just one of the
11 species showed a negative trend in either measure (A. cornuta, which showed a weak and
insignificant decrease in sighting probability with time). Four species (M. niger, C. mos-chata, A. seniculus and S. boliviensis) showed no trend in either measure. No difference was
found in the trends over the four-year study period between hunted and unhunted species.
Of the 12 species recorded in at least 10% of all trips, 11 had higher raw sighting rates
(individuals/km) in the fourth wet season than in the first, and the median increase was
137%. The comparable numbers for the first and fourth dry seasons are 10 species and a
median increase of 160% (Table 5—Appendix 2).
Sighting rates under varying conditions
After time, the most important fixed effect in the models was season. For five species, both the
number of individuals sighted and sighting probability declined significantly in wet season
(Table 3). Number of individuals sighted declined for one additional species. Four species
showed no seasonal effect, while one species increased in sighting probability during the wet
season (A. ararauna). Other correlations between abundance and fixed effects were scattered
and mostly unsurprising (e.g., more turtles recorded in sunny weather; see Table 3).
Cost of data collection
Because the park guards collected these data in the course of other duties, taking advantage
of time that was previously spent in unproductive boat travel, the cost of data collection
was close to 0. Survey forms were photocopied for\$10, giving a cost per km close to 0.
Extra gasoline, salaries, and food required to survey 20 km of forest transects cost
approximately $140/km/year.
Discussion
River-based monitoring by park guards in Amazonian Peru proved capable of detecting
significant temporal trends in faunal sighting rates at a cost more than two orders of magnitude
lower than more traditional monitoring methods in Amazonia (Gardner et al. 2007). While the
survey proved inappropriate for some species and the data it generated are not easily linked to
population density, the method shows significant promise for tracking long-term trends in the
world’s most diverse animal communities and strengthens similar findings for participatory
monitoring schemes elsewhere in the tropics (Danielsen et al. 2005, 2008).
Faunal rebound at our study site
The survey data from 2004 to 2008 suggest that the newly protected reptile, bird, and
mammal populations on the Los Amigos River are rebounding following a recent history
of logging, hunting, and egg collection (Fig. 3, Table 3). This conjecture relies, however,
on the untested assumption that higher sighting rates are an indicator of higher population
densities. Further studies are needed to distinguish this hypothesis from the alternative
hypotheses that higher sighting rates mostly reflect decreasing wariness of animals fol-
lowing the departure of hunters, or the improving skills of observers over time. For the
time being, we discount these hypotheses based on the observation that increasing sighting
rates were documented for species with a broad range of behavior under hunting pressure
Biodivers Conserv (2011) 20:827–849 837
123
Author's personal copy

and visual conspicuousness: noticeable animals, cryptic animals, animals that are spooked
by boats and animals that are not.
The number of individuals sighted per trip increased for a majority of the 11 species
common enough to analyze, but sighting rates of hunted species were no more likely to
increase than those of unhunted species. For example, we recorded significant increases in
sightings of the unhunted Pied Lapwing and Blue-and-yellow Macaw but not of the hunted
Muscovy Duck and howler monkey. This was an unexpected result that deserves more
study. In the meantime, it is worth repeating that the cessation of hunting in a large
protected area surrounded by intact wilderness resulted in a rebound in sighting rates that is
as significant for unhunted species as it is for hunted ones.
Commonly sighted taxa: reptiles
One turtle species (P. unifilis) accounted for more than half of all animal sightings. Our
data suggest that the Los Amigos watershed may protect a viable population of this
globally threatened species. To estimate the size of the watershed’s turtle population, we
divided the maximum number of turtles seen on a single trip (a conservative approximation
of the number of individuals resident in the 47-km stretch of river) by the trip distance.
This gives a mean population density of 7 individuals/km. Assuming a comparable density
along the rest of the 353-km Los Amigos River, a simple extrapolation gives *2,500
turtles living on the main river (i.e., not considering the several dozen tributaries and
lakes). However, while turtle sightings have increased dramatically on the lower Los
Amigos (Table 3; Table 5—Appendix 2), where harvests of the edible eggs ended in 2003,
the same is not necessarily the case for the upper stretches of the river. Approximately
20 km upriver from the stretch of river we studied, researchers have found turtle nests dug
up for food by uncontacted indigenous groups (A. Mansilla, pers. comm.).
Comparable published data on P. unifilis densities on other Amazonian rivers are few,
but Townsend et al. (2005) report similar maximum numbers of turtles sighted per km for a
rebounding population of P. unifilis along two rivers in eastern Ecuador. The key unan-
swered question about these populations is how much, and for how long, they will continue
to grow. Given that early European explorers marveled at immense Amazonian turtle
populations (e.g., Medina 1934), it may be that turtle populations in newly established
parks will continue growing for decades.
The consistently higher sightings of P. unifilis in dry season (Table 2; Table 5—
Appendix 2) reflect a combination of factors: more sunshine and sunning perches (exposed
snags) in dry season, and migration to adjacent oxbow lakes in wet season (A. Mansilla,
pers. comm.). Higher dry season sighting rates for many other reptiles, birds, and terrestrial
mammals (Table 2) are mostly due to the fact that lower river levels in dry season expose
large beaches on which animals are more easily observed.
Commonly sighted taxa: birds
Three macaw species were sighted on the Los Amigos River more frequently than any of
the other nine birds monitored (Table 2; Table 5—Appendix 2). Blue-and-yellow Macaws
(A. ararauna) were especially common, recorded more than twice as often as the other two
species combined. The number of A. ararauna sighted increased dramatically over the
4 years, though the probability of sighting at least one individual during a trip did not
change. We also observed that the A. ararauna sighting rate varied more strongly from one
dry season to another than it did between wet seasons. While the highest dry season
838 Biodivers Conserv (2011) 20:827–849
123
Author's personal copy

sighting rate on the Los Amigos (year 3) was nearly five times higher than the lowest (year
1), the difference between the highest and lowest wet season sighting rates was less than a
factor of two. Given the species’ large geographic range and its importance to the local
economy (e.g., Trivedi et al. 2004; Brightsmith and Bravo 2005), the strong increase in
sightings on the Los Amigos in 2004–2008 and the impressive variation in dry season
sighting rates merit further study.
For all 4 years of monitoring, sighting rates of A. ararauna on the Los Amigos were more
than 100% higher than those recorded in a similar survey on the nearby Manu River during the
wet and dry seasons of 1989 (Renton 2002). [The Manu is 100 km W of our study site; to
compare our data (individuals/km) to Renton’s data (individuals/h), we transformed our data
using the relationship 100 km = 6 h]. Like Renton, we found no difference in the numbers of
individuals recorded in wet and dry season. However, we did find a consistently higher
probability of observing at least one A. ararauna during trips in the wet season, which is when
the species breeds in this region of Peru (Brightsmith and Bravo 2005).
Combined sighting rates for the other two macaw species (Scarlet and Red-and-green
Macaws) were consistently lower on the Los Amigos than on the Manu (Renton 2002). The
highest wet season sighting rate on the Los Amigos (individuals/h for year 4) is roughly a
third of that recorded on the Manu in 1989; the lowest (year 1) was just 19%. Sightings of
Scarlet Macaws alone on the Manu in 1989 exceeded sightings of both species in seven of
eight seasons on the Los Amigos. Likewise, Red-and-green Macaws were more abundant
on the Manu in the 1989 wet season than both species were on the Los Amigos in all four
2004–2008 wet seasons.
When all the Los Amigos macaw data are combined, they do not support Renton’s
(2002) finding of ‘‘a significant threefold decline in the number of large macaws
encountered during the dry season compared to the rainy season.’’ Dry season sighting
rates at Los Amigos (7.5 individuals/h) were very similar to wet season rates (6.8 indi-
viduals/h). Monitoring underway on the nearby Manu and Tambopata rivers (A. Lee and
C. Kirkby, pers. comm.) should soon describe this regional and seasonal variation in a
more rigorous fashion.
Commonly sighted taxa: mammals
Capybaras (H. hydrochaeris), recorded on 50% of all trips, were the most commonly
sighted mammal on the Los Amigos. The species also shows one of the most striking
upward trends of all taxa studied (Table 3). In the first year of monitoring, observers
sighted capybaras on 32% of trips. By the fourth year, this figure had risen to 80%.
Likewise, the maximum number of individuals sighted on a single trip each year mounted
steadily throughout the study: 5, 9, 12, 24. While capybaras are not especially sought-after
by hunters in this area of Peru (Schulte-Herbruggen 2003), local villagers confirmed
that they were hunted for meat before the establishment of the conservation concession
(F. Espinoza, pers. comm.). A map of all H. hydrochaeris sighting localities on the Los
Amigos during this monitoring program suggests that during the first year capybaras were
largely absent from the lower *10 km of the Los Amigos—the portion of the river closest
to the nearest village—and subsequently recolonized that stretch over the next 3 years.
Rare species and other survey techniques
Several animal species that were rarely seen in river-based monitoring are frequently
recorded by other kinds of monitoring at Los Amigos. These include C. albifrons and
Biodivers Conserv (2011) 20:827–849 839
123
Author's personal copy

C. apella, two of the most commonly sighted primates along forest transects at Los
Amigos; T. pecari and P. tajacu, peccaries commonly recorded in camera-trap studies at
Los Amigos (Tobler et al. 2008); and P. irrorata, a primate that is not infrequent in forest
transect data from Los Amigos.
Most mammal species were recorded far less frequently from motorized boats along the
river than they were along permanent transects in the adjacent floodplain forest, suggesting
that river-based monitoring of this kind will never be a practical substitute for monitoring
many medium to large mammal species. There are exceptions, however. Howler monkeys
(A. seniculus) and jaguars (P. onca) were recorded more frequently on the river than inside
the forest, on a per-hour basis. A howler monkey was observed once every five hours on
the river, on average, versus once every 14 h on forest transects. Jaguars were recorded
twice as frequently on the river. Tapirs (T. terrestris), squirrel monkeys (S. boliviensis) and
spider monkeys (A. chamek) were recorded approximately twice as frequently in the forest.
Given that river-based monitoring by park guards was also less expensive than forest-
transect monitoring, these results raise the possibility that river-based monitoring of these
taxa—which make disproportionate contributions to predation, herbivory, and seed-dis-
persion in southeastern Peru (Terborgh et al. 2008; Tobler 2008)—may be more effective
than land-based surveys.
Low riparian sighting rates of some other species appear to reflect genuinely low
population sizes in the Los Amigos watershed. For example, puma (P. concolor) sightings
are consistently rarer than jaguar sightings not only in our river-based monitoring, but also
in camera trap studies (Tobler et al. 2008) and forest transects at Los Amigos (see also
Emmons 1987). S. venaticus, never recorded in the river monitoring, has never been
photographed by camera traps nor recorded in forest transect monitoring at Los Amigos,
though it has been sighted at Los Amigos at least twice in the last 10 years (Tobler et al.
2008, R. Leite Pitman, pers. comm.). At our study site it seems unlikely that river-based
monitoring of these very rare mammals, and of mammals which do not make regular use of
riverine habitat, will ever result in enough sightings to make more than anecdotal con-
tributions to science.
The rarity of many bird species in our dataset most likely reflects the paucity of optimal
habitat along the Los Amigos River. Many of these birds (J. mycteria, M. americana,
N. jubata, P. ajaja, P. simplex, and S. superciliaris) prefer large mudflats, large sandflats,
large marshy river margins, and other habitats that are common along larger rivers in the
region but rare to absent along the narrower Los Amigos (J. Tobias, pers. comm.). For
some of these species, the Los Amigos may be a sink that is reliant on source populations
along the larger Madre de Dios River. Effective tracking of these taxa will require mon-
itoring on the Madre de Dios itself (J. Tobias, pers. comm.).
Advantages, disadvantages, biases, and usefulness of river-based sampling
in Amazonia
A more complete discussion of the advantages, disadvantages, and possible biases of
monitoring programs such as the one described here is provided by Danielsen et al. (2005,
2008). In our study, the principal advantages relative to other monitoring programs were a
high data-to-cost ratio and a high potential for long-term continuation (because park guards
will continue patrolling the protected area for the foreseeable future). While we observed
few disadvantages to river-based monitoring per se, our simple sampling design posed
some limitations to analysis and could be improved (Fletcher and Hutto 2006). Likewise,
our river-based monitoring data was clearly biased against several species that are spooked
840 Biodivers Conserv (2011) 20:827–849
123
Author's personal copy

by the noise of boats, inactive during daylight hours, not commonly present along large
rivers, rare because appropriate habitat is absent, and/or hard to observe for other reasons.
The river-based monitoring program at Los Amigos is ongoing. The full dataset is
regularly updated and freely available from the authors or at http://www.acca.org.pe/
espanol/investigacion/programas/monitoreo.html, and the organization managing the
conservation concession aims to continue the program for the duration of its 40-year
management contract. One immediate benefit of the program is a boost in the morale of
park guards, who actively keep tabs on wildlife rather than simply manning guard posts or
patrolling borders, and see clear evidence that the work they do is helping wildlife
(Danielsen et al. 2005). Given that hunting and deforestation are expected to accelerate in
southeastern Peru in the near future (Killeen 2007), the accumulating data should also
eventually provide baseline sighting frequencies against which future data from Los
Amigos and neighboring areas can be compared.
Until then, park managers have several reasons to be skeptical about the data’s usefulness
for day-to-day operational decisions. First, sighting trends for some species may be a better
indication of conditions outside the park, or of a scarcity of appropriate natural habitat
inside the park, than of the quality of park management. Second, managers have few
historical or geographical yardsticks against which to interpret current sighting rates and
trends at Los Amigos. Third, day-to-day management of Peru’s Amazonian parks tends to
focus on keeping out loggers and hunters, a state of affairs that detailed data on animal
populations are unlikely to change in the short term. Finally, until further research provides
a better understanding of the relationship between sighting rates and population sizes, the
autecology of the species being monitored, and the causes behind increases and declines, the
appropriate management response to a given trend in sighting rates may not be obvious. It is
worth noting, however, that most of these criticisms apply to other monitoring programs in
the Amazon (e.g., Ferraz et al. 2007; Magnusson et al. 2008). It is also the case, in our
opinion, that many of these problems reflect a general lack of basic biodiversity data for
Amazonian protected areas—a shortcoming that itself may be partly overcome by tracking
trends in wildlife populations via monitoring like that described here.
Several aspects of the data presented here require further research. Fruitful comparisons
of monitoring data collected on different rivers (e.g., Davenport 2003) will require a better
understanding of the effects of differing river conditions like size, flooding intensity, area
of exposed beach, current speed, and the character of the floodplain landscape. Under-
standing how boat noise affects the sighting rates of target species is also a high priority.
Likewise, more exacting survey techniques may permit more refined interpretations of
sighting rate data (e.g., Fletcher and Hutto 2006).
In the meantime, hundreds of park guards and tourist boats travel rivers in the Amazon
basin every day. With little added cost in time or money, they could easily collect data of the
kind we describe here (e.g., Gray and Kalpers 2005; see costs in Table 1 of Danielsen et al.
2005). Given the ubiquity of rivers (Toivonen et al. 2007), the intensification of hunting
(Peres and Lake 2003), and the large number of permanent tree plots being monitored across
the basin (Lewis et al. 2004a), river-based animal monitoring programs in a few dozen
protected areas and ecotourism operations have the potential to provide valuable data that
are currently absent from the debate about ecological change in Amazonia.
Acknowledgments Most of the work described in this paper was funded by a grant from the Gordon andBetty Moore Foundation to the Amazon Conservation Association and its Peruvian sister organization, theAsociacion para la Conservacion de la Cuenca Amazonica. Additional funding was provided by a RuffordSmall Grant for Nature Conservation to NCAP. We appreciate the support of the Peruvian park service,
Biodivers Conserv (2011) 20:827–849 841
123
Author's personal copy

which authorized this research as part of the LACC’s management plan. We thank Nelson Gutierrez for themap in Fig. 1 and Antonio Vizcaıno/America Natural for the photograph in Fig. 2. The following peoplecontributed helpful information or reviewed the manuscript: F. Espinosa, D. Lebbin, R. Leite Pitman,N. Seddon, J. Terborgh, J. Tobias, R. Von May, R. Williams.
Appendix 1
See Table 4.
Table 4 Paper form filled out by data collectors for river-based monitoring on the Los Amigos River,Amazonian Peru
842 Biodivers Conserv (2011) 20:827–849
123
Author's personal copy

Ap
pen
dix
2
See
Tab
le5
.
Tab
le5
Raw
sig
hti
ng
rate
s(i
nd
ivid
ual
s/10
0k
m)
and
sig
hti
ng
pro
bab
ilit
ies
(%o
ftr
ips
wit
hat
leas
to
ne
reco
rd)
for
the
27
spec
ies
reco
rded
ov
er4
yea
rso
fri
par
ian
monit
ori
ng
on
the
Los
Am
igos
Riv
er,
Am
azonia
nP
eru,
clas
sifi
edby
yea
ran
dse
ason
Yea
r1
23
4A
llM
ax
Sea
son
Dry
Wet
Dry
Wet
Dry
Wet
Dry
Wet
Dry
Wet
All
Po
do
cnem
isu
nifi
lis
ind
./10
0k
m8
5.2
15
17
.15
41
19
.32
15
1.8
71
17
2.5
23
88
.38
21
47
.05
57
1.5
02
12
9.1
07
58
.14
59
5.9
73
33
3
%tr
ips
seen
89
.76
2.5
93
.88
0.5
10
0.0
93
.38
7.9
76
.09
2.7
79
.28
6.4
Mel
an
osu
chu
sn
iger
ind
./10
0k
m1
.805
0.1
78
1.6
66
0.3
12
1.0
34
0.2
84
1.4
87
0.3
41
1.5
10
0.2
84
0.9
38
7
%tr
ips
seen
41
.08
.33
4.4
9.8
30
.31
3.3
33
.38
.03
5.0
10
.02
3.3
Caim
an
croco
dil
us
ind
./10
0k
m6
.727
0.3
56
16
.79
81
.04
11
2.4
75
1.1
38
20
.23
21
.10
91
3.7
17
0.9
42
7.7
52
47
%tr
ips
seen
59
.01
2.5
78
.11
7.1
72
.72
6.7
84
.83
6.0
73
.02
2.5
49
.4
Ara
chlo
rop
teru
san
dA
.m
aca
o
ind
./10
0k
m6
.126
19
.02
08
.73
21
3.3
19
10
.53
61
4.4
34
20
.55
52
4.9
15
11
.27
31
7.1
54
14
.01
94
3
%tr
ips
seen
38
.58
7.5
62
.58
5.4
48
.58
6.7
75
.89
6.0
55
.58
8.3
70
.8
Ara
ara
rau
na
ind
./10
0k
m1
3.4
00
24
.88
62
0.5
98
14
.98
46
5.3
51
27
.51
73
8.0
73
31
.65
53
3.5
38
23
.57
12
8.8
84
98
%tr
ips
seen
43
.69
1.7
59
.48
2.9
78
.89
0.0
63
.68
4.0
60
.68
6.7
72
.8
Myc
teri
aam
eric
ana
ind
./10
0k
m0
.438
0.2
67
––
0.1
29
––
–0
.15
60
.053
0.1
08
3
%tr
ips
seen
10
.34
.2–
–6
.1–
––
4.4
0.8
2.7
Biodivers Conserv (2011) 20:827–849 843
123
Author's personal copy

Tab
le5
con
tin
ued
Yea
r1
23
4A
llM
ax
Sea
son
Dry
Wet
Dry
Wet
Dry
Wet
Dry
Wet
Dry
Wet
All
Jab
iru
myc
teri
a
ind
./10
0k
m2
.571
–0
.533
–1
.228
1.3
51
–0
.085
1.1
52
0.3
56
0.7
80
17
%tr
ips
seen
35
.9–
6.3
–9
.16
.7–
4.0
13
.92
.58
.6
Pla
tale
aa
jaja
ind
./10
0k
m0
.055
––
––
–0
.517
–0
.140
–0
.075
7
%tr
ips
seen
2.6
––
––
–6
.1–
2.2
–1
.2
An
him
aco
rnut
a
ind
./10
0k
m4
.047
1.9
55
2.4
00
1.1
97
3.4
26
2.2
04
2.7
80
1.8
77
3.2
07
1.7
42
2.5
23
8
%tr
ips
seen
56
.44
5.8
46
.93
4.1
51
.55
0.0
48
.54
4.0
51
.14
2.5
47
.1
Neo
chen
jub
ata
ind
./10
0k
m0
.109
––
0.1
04
––
––
0.0
31
0.0
36
0.0
33
2
%tr
ips
seen
2.6
––
2.4
––
––
0.7
0.8
0.8
Ca
irin
am
osc
hat
a
ind
./10
0k
m1
.696
1.2
44
1.7
33
0.9
89
0.3
88
1.3
51
4.0
08
3.4
98
1.9
46
1.6
53
1.8
09
15
%tr
ips
seen
35
.92
9.2
37
.51
9.5
15
.23
3.3
54
.53
6.0
35
.82
8.3
32
.3
Va
nel
lus
caya
nus
ind
./10
0k
m5
.141
2.4
00
15
.33
24
.422
18
.87
53
.413
18
.48
71
1.6
04
14
.04
45
.262
9.9
43
41
%tr
ips
seen
46
.23
7.5
87
.55
6.1
87
.94
6.7
81
.86
0.0
74
.55
0.8
63
.4
Ph
aet
usa
sim
plex
ind
./10
0k
m0
.273
––
––
––
–0
.078
–0
.042
3
%tr
ips
seen
5.1
––
––
––
–1
.5–
0.8
Ste
rna
sup
erci
lia
ris
ind
./10
0k
m–
–0
.400
0.2
08
0.0
65
0.0
71
0.1
94
–0
.156
0.0
89
0.1
25
4
%tr
ips
seen
––
12
.52
.43
.03
.36
.1–
5.1
1.7
3.5
844 Biodivers Conserv (2011) 20:827–849
123
Author's personal copy

Tab
le5
con
tin
ued
Yea
r1
23
4A
llM
ax
Sea
son
Dry
Wet
Dry
Wet
Dry
Wet
Dry
Wet
Dry
Wet
All
Alo
ua
tta
sen
icul
us
ind
./10
0k
m0
.875
0.0
89
1.1
33
1.5
61
1.7
45
1.2
80
1.2
93
1.6
21
1.2
46
1.2
09
1.2
28
8
%tr
ips
seen
7.7
4.2
12
.51
4.6
18
.22
3.3
15
.22
4.0
13
.11
6.7
14
.8
Ate
les
cha
mek
ind
./10
0k
m1
.039
2.1
33
0.8
00
1.8
73
1.3
57
3.6
97
3.2
97
3.8
40
1.6
04
2.7
91
2.1
58
17
%tr
ips
seen
7.7
16
.71
2.5
12
.29
.13
3.3
21
.22
4.0
12
.42
0.8
16
.3
Ceb
us
ap
ella
ind
./10
0k
m–
0.7
11
–0
.104
–0
.640
0.5
82
0.8
53
0.1
40
0.5
16
0.3
15
8
%tr
ips
seen
–4
.2–
2.4
–6
.79
.11
2.0
2.2
5.8
3.9
Ceb
us
alb
ifro
ns
ind
./10
0k
m–
––
––
–0
.06
5–
0.0
16
–0
.00
81
%tr
ips
seen
––
––
––
3.0
–0
.7–
0.4
Saim
iri
boli
vien
sis
ind
./10
0k
m3
.774
3.5
55
5.0
66
3.9
02
6.7
87
9.2
43
7.1
10
4.8
63
5.6
05
5.3
68
5.4
95
30
%tr
ips
seen
12
.88
.31
8.8
7.3
15
.22
0.0
24
.21
6.0
17
.51
2.5
15
.2
Pit
hec
iair
rora
ta
ind
./10
0k
m–
0.0
89
––
––
––
–0
.01
80
.00
81
%tr
ips
seen
–4
.2–
––
––
––
0.8
0.4
Pte
ron
ura
bra
sili
ensi
s
ind
./10
0k
m0
.656
–0
.067
–0
.065
0.2
84
0.4
52
0.3
41
0.3
27
0.1
42
0.2
41
6
%tr
ips
seen
7.7
–3
.1–
3.0
3.3
9.1
4.0
5.8
1.7
3.9
Tapir
us
terr
estr
is
ind
./10
0k
m0
.328
0.0
89
0.2
00
0.1
56
0.3
88
0.2
13
0.1
29
–0
.26
50
.12
40
.19
92
%tr
ips
seen
15
.44
.26
.37
.31
2.1
6.7
6.1
–1
0.2
5.0
7.8
Biodivers Conserv (2011) 20:827–849 845
123
Author's personal copy
Tab
le5
con
tin
ued
Yea
r1
23
4A
llM
ax
Sea
son
Dry
Wet
Dry
Wet
Dry
Wet
Dry
Wet
Dry
Wet
All
Hyd
roch
oer
us
hyd
roch
aer
is
ind
./10
0k
m2
.07
80
.800
2.6
00
2.8
61
6.9
16
5.4
04
15
.70
76
.31
46
.648
3.8
04
5.3
20
24
%tr
ips
seen
41
.01
6.7
28
.14
1.5
72
.76
0.0
78
.86
0.0
54
.74
5.0
50
.2
Ta
yass
up
eca
ri
ind
./10
0k
m1
.36
74
.000
–2
.081
–2
.275
2.2
62
–0
.934
2.0
80
1.4
69
40
%tr
ips
seen
2.6
8.3
–2
.4–
6.7
3.0
–1
.54
.22
.7
Pec
ari
taja
cu
ind
./10
0k
m0
.21
90
.622
–0
.104
––
0.1
29
–0
.093
0.1
60
0.1
25
5
%tr
ips
seen
2.6
8.3
–2
.4–
–3
.0–
1.5
2.5
1.9
Pa
nth
era
on
ca
ind
./10
0k
m0
.05
50
.089
0.0
67
–0
.194
––
–0
.078
0.0
18
0.0
50
1
%tr
ips
seen
2.6
4.2
3.1
–9
.1–
––
3.6
0.8
2.3
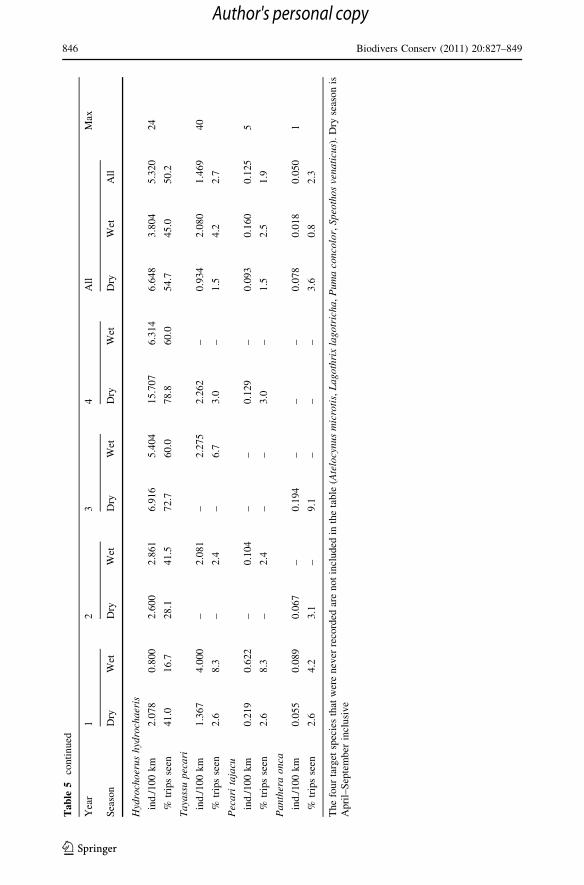
Th
efo
ur
targ
etsp
ecie
sth
atw
ere
nev
erre
cord
edar
en
ot
incl
ud
edin
the
tab
le(A
telo
cynus
mic
roti
s,L
ago
thri
xla
gotr
ich
a,P
um
aco
nco
lor,
Sp
eoth
os
ven
ati
cus)
.D
ryse
aso
nis
Ap
ril–
Sep
tem
ber
incl
usi
ve
846 Biodivers Conserv (2011) 20:827–849
123
Author's personal copy

References
Baayen RH, Davidson DJ, Bates DM (2008) Mixed-effects modeling with crossed random effects forsubjects and items. J Memory Lang 59:390–412
Bates DM, Maechler M, Dai B (2008) lme4: linear mixed-effects models using S4 classes. Available viaR-Forge. http://lme4.r-forge.r-project.org
Bolker BM, Brooks ME, Clark CJ, Geange SW, Poulsen JR, Stevens MHH, White JS (2009) Generalizedlinear mixed models: a practical guide for ecology and evolution. Trends Ecol Evol 24(3):127–135
Brightsmith D, Bravo A (2005) Ecology and management of nesting blue-and-yellow macaws (Ara ar-arauna) in Mauritia palm swamps. Biodivers Conserv 15(13):4271–4287
Cintra R, Ribeiro Simoes Dos Santos PM, Banks Leite C (2007) Composition and structure of the lacustrinebird communities of seasonally flooded wetlands of western Brazilian Amazonia at high water.Waterbirds 30(4):521–540
Crawley MJ (2007) The R book. Wiley, ChichesterDanielsen F, Burgess ND, Balmford A (2005) Monitoring matters: examining the potential of locally-based
approaches. Biodivers Conserv 14:2507–2542Danielsen F, Burgess ND, Balmford A, Donald PF, Funder M, Jones JPG, Alviola P, Balette DS, Blomley T,
Brashares J, Child B, Enghoff M, Fjeldsa J, Holt S, Hubertz H, Jensen AE, Jensen PM, Massao J,Mendoza MM, Ngaga Y, Poulsen MK, Rueda R, Sam M, Skielboe T, Stuart-Hill G, Topp-Jørgensen E,Yonten D (2008) Local participation in natural resource monitoring: a characterization of approaches.Conserv Biol 23:31–42
Davenport L (2003) La problematica de las aguas: los lobos de rıo y los habitats acuaticos de la ZonaReservada del Alto Purus. In: Leite Pitman R, Pitman NCA, Alvarez P (eds) Alto Purus: biodiversidad,conservacion y manejo. Center for Tropical Conservation, Lima
Dirzo R, Miranda A (1991) Altered patterns of herbivory and diversity in the forest understory: a case studyof the possible consequences of contemporary defaunation. In: Price PW, Lewingston T, Fernandes G,Benson W (eds) Plant–animal interactions: evolutionary ecology in tropical and temperate regions.Wiley, Chichester
Emmons LH (1987) Comparative feeding ecology of felids in a Neotropical rainforest. Behav Ecol So-ciobiol 20(4):271–283
Ferraz G, Marinelli CE, Lovejoy TE (2007) Biological monitoring in the Amazon: recent progress andfuture needs. Biotropica 40:7–10
Fletcher RJ Jr, Hutto RL (2006) Estimating detection probabilities of river birds using double surveys. Auk123(3):695–707
Gardner TA, Barlow J, Araujo IS, Avila-Pires TC, Bonaldo AB, Costa JE, Esposito MC, Ferreira LV, HawesJ, Hernandez MIM, Hoogmoed MS, Leite RN, Lo-Man-Hung NF, Malcolm JR, Martins MB, MestreLAM, Miranda-Santos R, Overal WL, Parry L, Peters SL, Ribeiro-Junior MA, da Silva MNF, da SilvaMotta C, Peres CA (2007) The cost-effectiveness of biodiversity surveys in tropical forests. Ecol Lett11(2):139–150
Goldizen AW, Mendelson J, van Vlaardingen M, Terborgh J (1996) Saddle-back tamarin (Saguinus fusc-icollis) reproductive strategies: evidence from a thirteen-year study of a marked population. Am JPrimatol 38(1):57–83
Gray M, Kalpers J (2005) Ranger based monitoring in the Virunga-Bwindi Region of East-Central Africa: asimple data collection tool for park management. Biodivers Conserv 14:2723–2741
Groenendijk J, Hajek F, Schenck C, Staib E (2001) Monitoreo del lobo de rıo (Pteronura brasiliensis) en laReserva de Biosfera del Manu: metodologıas y resultados. In: Rodrıguez LO (ed) El Manu y otrasexperiencias de investigacion y manejo de bosques neotropicales. Proyecto Aprovechamiento yManejo Sostenible de la Reserva de Biosfera y Parque Nacional del Manu (PRO-MANU), Lima
Groenendijk J, Hajek F, Duplaix N, Reuther C, Van Damme P, Schenck C, Staib E, Wallace R, WaldemarinH, Notin R, Marmontel M, Rosas F, de Mattos GE, Evangelista E, Utreras V, Lasso G, Jacques H,Matos K, Roopsind I, Botello JC (2005) Surveying and monitoring distribution and population trendsof the giant otter (Pteronura brasiliensis): guidelines for a standardisation of survey methods asrecommended by the Giant Otter Section of the IUCN/SSC Otter Specialist Group. Habitat 16:1–100
Hamilton SK, Kellndorfer J, Lehner B, Tobler M (2007) Remote sensing of floodplain geomorphology as asurrogate for biodiversity in a tropical river system (Madre de Dios, Peru). Geomorphology 89:23–38
IUCN 2008. 2008 IUCN Red list of threatened species. Available via the International Union for theConservation of Nature. http://www.iucnredlist.org
Kalliola R, Puhakka M, Salo J (1992) Intraspecific variation, distribution and ecology of Gynerium sag-ittatum (Poaceae) in the western Amazon. Flora 186:153–167
Biodivers Conserv (2011) 20:827–849 847
123
Author's personal copy

Karubian J, Fabara J, Yunes D, Jorgenson JP, Romo D, Smith TB (2005) Temporal and spatial patterns ofmacaw abundance in the Ecuadorian Amazon. Condor 107:617–626
Killeen TJ (2007) A perfect storm in the Amazonian wilderness: development and conservation in thecontext of the Initiative for the Integration of the Regional Infrastructure of South America (IIRSA).Adv Appl Biodivers Sci 7:1–99
Laurance WF, Oliveira AA, Laurance SG, Condit R, Nascimento HEM, Sanche-Thorin AC, Lovejoy TE,Andrade A, D’Angelo S, Ribeiro JE, Dick CW (2004) Pervasive alteration of tree communities inundisturbed Amazonian forests. Nature 428:171–175
Lewis SL, Phillips OL, Baker TR, Lloyd J, Malhi Y, Almeida S, Higuchi N, Laurance WF, Neill D, Silva N,Terborgh J, Torres Lezama A, Vasquez MR, Brown S, Chave J, Kuebler C, Nunez VP, Vinceti B(2004a) Concerted changes in tropical forest structure and dynamics: evidence from 50 SouthAmerican long-term plots. Philos Trans R Soc Lond Ser B 359:421–436
Lewis SL, Malhi Y, Phillips OL (2004b) Fingerprinting the impacts of global change on tropical forests.Philos Trans R Soc Lond Ser B 359:437–462
Magnusson WE, Costa F, Lima A, Baccaro F, Braga-Neto R, Laerte Romero R, Menin M, Penha J, HeroJ-M, Lawson BE (2008) A program for monitoring biological diversity in the Amazon: an alternativeperspective to threat-based monitoring. Biotropica 40(4):409–411
Medina J (1934) The discovery of the Amazon according to the account of Friar Caspar de Carvajal(Oveido’s version). In: Heaton HC (ed) Special Publication 17. American Geographical Society, NewYork
Peres CA (1999) General guidelines for standardizing line-transect surveys of tropical forest primates.Neotrop Primates 7(1):11–16
Peres CA, Lake IR (2003) Extent of nontimber resource extraction in tropical forests: accessibility to gamevertebrates by hunters in the Amazon basin. Conserv Biol 17:521–535
Peres CA, Palacios E (2007) Basin-wide effects of game harvest on vertebrate population densities inAmazonian forests: implications for animal-mediated seed dispersal. Biotropica 39:304–315
Phillips OL, Vasquez Martınez R, Arroyo L, Baker TR, Killeen T, Lewis SL, Malhi Y, Mendoza AM, NeillD, Vargas PN, Alexiades M, Ceron C, Flora AD, Erwin T, Jardim A, Palacios W, Saldias M, Vinceti B(2002) Increasing dominance of large lianas in Amazonian forests. Nature 418(6899):770–774
Phillips O, Baker T, Arroyo L, Higuchi N, Killeen T, Laurance WF, Lewis SL, Lloyd J, Malhi Y,Monteagudo A, Neill D, Nunez Vargas P, Silva N, Terborgh J, Vasquez Martınez R, Alexiades M,Almeida S, Brown S, Chave J, Comiskey JA, Czimczik CI, Di Fiore A, Erwin T, Kuebler C, LauranceSG, Nascimento HEM, Olivier J, Palacios W, Patino S, Pitman N, Quesada CA, Saldias M, TorresLezama A, Vinceti B (2004) Pattern and process in Amazon tree turnover, 1976–2001. Philos. Trans RSoc Lond Ser B 359(1443):381–408
Pinheiro JC, Bates DM (2000) Mixed-effects models in S and S-plus. Springer, New YorkRenton K (2002) Seasonal variation in occurrence of macaws along a rainforest river. J Field Ornithol
73(1):15–19Schulte-Herbruggen B (2003) Tala ilegal en la Zona Reservada del Alto Purus, a lo largo del rıo de Las
Piedras, Madre de Dios. In: Leite Pitman R, Pitman N, Alvarez P (eds) Alto Purus: Biodiversidad,conservacion y manejo. Center for Tropical Conservation, Lima
Silman MR, Terborgh JW, Kiltie RA (2003) Population regulation of a dominant rain forest tree by a majorseed-predator. Ecology 84(2):431–438
Terborgh J, Petren K (1991) Development of habitat structure through succession in an Amazonianfloodplain forest. In: Bell S, McCoy ED, Mushinsky HR (eds) Habitat structure: the physicalarrangement of objects in space. Chapman and Hall, New York
Terborgh J, Lopez L, Nunez VP, Rao M, Shahabuddin G, Orihuela G, Riveros M, Ascanio R, Adler GH,Lambert TD, Balbas L (2001) Ecological meltdown in predator-free forest fragments. Science294(5548):1923–1926
Terborgh J, Nunez-Ituri G, Pitman N, Cornejo Valverde FH, Alvarez P, Swamy V, Pringle B, Paine CET(2008) Tree recruitment in an empty forest. Ecology 89(6):1757–1768
Tobler MW (2008) The ecology of the lowland tapir in Madre de Dios, Peru: using new technologies tostudy large rainforest mammals. Dissertation, Texas A&M University
Tobler MW, Carrillo-Percastegui E, Leite Pitman R, Mares R, Powell G (2008) An evaluation of cameratraps for inventorying large and medium sized terrestrial rainforest mammals. Anim Conserv11:169–178
Toivonen T, Maki S, Kalliola R (2007) The riverscape of Western Amazonia: a quantitative approach to thefluvial biogeography of the region. J Biogeogr 34:1374–1387
Townsend WR, Borman A, Yiyoguaje Mendua L (2005) Cofan indians’ monitoring of freshwater turtles inZabalo, Ecuador. Biodivers Conserv 14:2743–2755
848 Biodivers Conserv (2011) 20:827–849
123
Author's personal copy

Trivedi MR, Cornejo FH, Watkinson AR (2004) Seed predation on Brazil nuts (Bertholletia excelsa) bymacaws (Psittacidae) in Madre de Dios, Peru. Biotropica 36(1):118–122
Wright SJ, Zeballos H, Dominguez I, Gallard MM, Moreno M, Ibanez R (2000) Poachers alter mammalabundance, seed dispersal, and seed predation in a Neotropical forest. Conserv Biol 14:227–239
Biodivers Conserv (2011) 20:827–849 849
123
Author's personal copy