
SFG1208 v2 - World Bank Documents
477
Public Disclosure Authorized Public Disclosure Authorized Public Disclosure Authorized Public Disclosure Authorized
-
Upload
khangminh22 -
Category
Documents
-
view
2 -
download
0
Transcript of SFG1208 v2 - World Bank Documents

Pub
lic D
iscl
osur
e A
utho
rized
Pub
lic D
iscl
osur
e A
utho
rized
Pub
lic D
iscl
osur
e A
utho
rized
Pub
lic D
iscl
osur
e A
utho
rized
WB406484
Typewritten Text
WB406484
Typewritten Text
SFG1208 v2
WB406484
Typewritten Text


i
Table of Contents
Table of Contents ............................................................................................................................ i
List of Tables ................................................................................................................................. xi
List of Figures .............................................................................................................................. xv
1. Introduction ......................................................................................................................... 1-1
1.1 Background.......................................................................................................... 1-1
1.2 Objective of the Study .......................................................................................... 1-2
1.3 Need of the Project .............................................................................................. 1-2
1.4 Scope of the EIA Study ............................................ Error! Bookmark not defined.
1.5 Study Limitations ..................................................... Error! Bookmark not defined.
1.6 Process Followed................................................................................................. 1-4
1.7 EIA Study Team ................................................................................................... 1-7
1.8 Report Structure ...................................................... Error! Bookmark not defined.
2. Legal and Legislative Frameworks, Regulations and Policy Considerations ............. 2-1
2.1 The Context ......................................................................................................... 2-1
2.2 The Perspective Plan 2010 - 2021 ....................................................................... 2-2
2.3 National Energy Policy 1996 and 2004 ................................................................ 2-2
2.4 Key Policies, Acts and Strategies ......................................................................... 2-3
2.4.1 The National Environment Policy - 1992 ....................................................... 2-3
2.4.2 Environmental Conservation Act - 1995 (and the Revisions) ......................... 2-4
2.4.3 Environmental Conservation Rules - 1997 (as amended in 2005) ................. 2-5
2.4.4 National Environment Quality Standards ....................................................... 2-6
2.4.5 The Environment Court Act - 2000 ................................................................ 2-6
2.5 Strategies and Plans ............................................................................................ 2-7
2.5.1 National Conservation Strategy - 1992.......................................................... 2-7
2.5.2 National Biodiversity Strategy and Action Plan for Bangladesh - 2004 .......... 2-8
2.6 Other Sectoral Policies ........................................................................................ 2-8
2.6.1 National Industrial Policy - 2010 .................................................................... 2-8
2.6.2 National Water Policy - 1999 ......................................................................... 2-8
2.7 Agencies and Institutions Mandated to Address and Ensure Environmental
Sustainability .................................................................................................................. 2-9
2.7.1 Department of Environment ........................................................................ 2-10
2.7.2 Forest Department ...................................................................................... 2-10
2.7.3 Ministry of Land .......................................................................................... 2-10

Table of Contents
ii
2.7.4 Ministry of Water Resources ....................................................................... 2-10
2.7.5 Ministry of Fisheries and Livestock ............................................................. 2-11
2.7.6 Ministry of Power, Energy and Mineral Resources ...................................... 2-11
2.7.7 Bangladesh Power Development Board ...................................................... 2-11
2.8 International Treaties Signed by GoB................................................................. 2-11
2.9 Implication of GoB Polices, Acts and Rules on the GPS Unit 4 Repowering Project
2-13
2.10 World Bank's Environmental Safeguard Policies ................................................ 2-15
2.10.1 Environmental Assessment (OP 4.01) ........................................................ 2-15
2.10.2 Natural Habitats (OP 4.04) .......................................................................... 2-16
2.10.3 Pest Management (OP 4.09) ...................................................................... 2-16
2.10.4 Indigenous Peoples (OP 4.10) .................................................................... 2-17
2.10.5 Physical Cultural Resources (OP 4.11) ....................................................... 2-17
2.10.6 Involuntary Resettlement (OP 4.12) ............................................................ 2-18
2.10.7 Forests (OP 4.36) ....................................................................................... 2-18
2.10.8 International Waterways (OP 7.50) ............................................................. 2-19
2.10.9 Access to Information ................................................................................. 2-19
2.10.10 Applicable World Bank Policies ................................................................... 2-19
2.11 Bangladesh Standards and International Guidelines .......................................... 2-21
2.11.1 ECR 1997 (as amended in 2005) ................................................................ 2-21
2.1.1 WHO Guidelines ......................................................................................... 2-21
2.11.2 WBG’s General Environment, Health and Safety Guidelines, 2007 ............. 2-21
2.11.3 WBG’s Environmental, Health, and Safety Guidelines for Thermal Power
Plants, 2008 ............................................................................................................. 2-22
2.11.4 WBG’s Good Practice Note: Asbestos, 2009 .............................................. 2-22
2.12 Public consultation and disclosure requirements by World Bank Group ....................
.......................................................................................................................... 2-22
2.13 Harmonized Environmental Safeguard Requirements of the GoB and the WBG .......
2-23
3. Project Data Sheet .............................................................................................................. 3-1
3.1 Project Proponent ................................................................................................ 3-1
3.2 Project Location and Area .................................................................................... 3-1
3.3 Project Impact Area ............................................................................................. 3-1
3.4 Nature and Size of the Project ............................................................................. 3-1
3.5 Project Concept ................................................................................................... 3-1
3.6 Project Components ............................................................................................ 3-1

Table of Contents
iii
3.6.1 Decommissioning of Existing Boiler .............................................................. 3-1
3.6.2 Power Generation ......................................................................................... 3-2
3.6.3 Heat Recovery Steam Generator (HRSG) .................................................... 3-2
3.6.4 Deaerator ...................................................................................................... 3-2
3.6.5 Turbine and Auxiliaries ................................................................................. 3-3
3.6.6 Exhaust system and stack ............................................................................ 3-3
3.6.7 Cooling System ............................................................................................. 3-3
3.7 Resources and Utility Demand ............................................................................. 3-4
3.8 Source of Natural Gas and Quality ....................................................................... 3-4
3.9 Pipelines for Natural Gas ..................................................................................... 3-5
3.10 Project activities and Schedule ............................................................................ 3-8
4. Project Description ........................................................................................................... 4-10
4.1 Overview of Existing Facility .............................................................................. 4-10
4.1.1 Description of Existing Unit 4 Boiler ............................................................ 4-11
4.1.2 Existing Steam Turbine ............................................................................... 4-14
4.1.3 Existing Cooling System ............................................................................. 4-16
4.1.4 Stack .......................................................................................................... 4-17
4.1.5 Other Equipment and process require refurbishments or upgrading ........... 4-17
4.2 Proposed Project Design ................................................................................... 4-18
4.2.1 Project Layout and Site Drainage ................................................................ 4-18
4.2.2 Plant components of the layout plan ........................................................... 4-20
4.2.3 Land Requirement ...................................................................................... 4-20
4.2.4 Fuel requirement and performance ............................................................. 4-20
4.2.5 Water requirement ...................................................................................... 4-20
4.2.6 Technology Selection and Process Description .......................................... 4-23
4.2.7 Improvement of Existing Steam Turbine ..................................................... 4-24
4.2.8 Description of Major Sub-systems ............................................................... 4-25
4.2.9 Material storage and handling ..................................................................... 4-32
4.2.10 Solid and liquid waste and air emission....................................................... 4-35
4.2.11 Water Balance ............................................................................................ 4-36
4.3 Human resources required during construction and operation ........................... 4-37
4.3.1 Construction Labor Camp ........................................................................... 4-37
4.4 Operation and Maintenance ............................................................................... 4-37
4.4.1 Emission Control system (Units and Devices especially for NOX reduction) 4-38
4.4.2 Emission Monitoring System ....................................................................... 4-38

Table of Contents
iv
4.4.3 Environmental Quality Monitoring System ................................................... 4-38
4.4.4 Power Evacuation ....................................................................................... 4-38
4.4.5 Life Cycle Overview (including Decommissioning) ...................................... 4-38
5. Analysis of Alternatives ..................................................................................................... 5-1
5.1 Introduction .......................................................................................................... 5-1
5.2 Framework for Assessment of Alternatives .......................................................... 5-1
5.3 Without Project Alternative ................................................................................... 5-2
5.3.1 Environmental and Social Impacts of Without Project Alternative .................. 5-2
5.4 Repowering Options ............................................................................................ 5-3
5.4.1 Feed water heating ....................................................................................... 5-3
5.4.2 Hot Wind Box Repowering ............................................................................ 5-4
5.4.3 Hybrid Repowering ....................................................................................... 5-7
5.4.4 Full Repowering ............................................................................................ 5-8
5.4.5 New Combined Cycle Power Plant ............................................................... 5-8
5.5 Plant Layout Alternatives ..................................................................................... 5-8
5.5.1 Layout of Hybrid / Mini Hybrid Repowering ................................................... 5-9
5.5.2 Layout of Full Repowering ............................................................................ 5-9
5.5.3 Layout of New CCPP at North East side of Unit 6 ....................................... 5-10
5.6 Alternatives for Cooling Water System ............................................................... 5-10
5.7 Alternatives for Water/Effluent Treatment .......................................................... 5-13
5.8 Selected and Recommended Options ................................................................ 5-15
6. Description of the Environment ........................................................................................ 6-1
6.1 Introduction .......................................................................................................... 6-1
6.2 Topography.......................................................................................................... 6-1
6.3 Land Use and Land Cover ................................................................................... 6-4
6.4 Geology ............................................................................................................... 6-6
6.5 Seismicity ............................................................................................................ 6-6
6.6 Surface Water Resources .................................................................................... 6-9
6.6.1 Surface water system ................................................................................... 6-9
6.6.2 Shitalakhya water availability assessment .................................................. 6-11
6.6.3 Water Balance during Base Condition (1981-2012) .................................... 6-11
6.6.4 Water level analysis .................................................................................... 6-12
6.6.5 Discharge analysis ...................................................................................... 6-13
6.6.6 Ground water system .................................................................................. 6-15
6.7 Natural hazards ................................................................................................. 6-15

Table of Contents
v
6.8 Physical Environment ........................................................................................ 6-16
6.8.1 Climate and Meteorology ............................................................................ 6-16
6.9 Ambient Air Quality ............................................................................................ 6-20
6.10 Acoustic Environment ........................................................................................ 6-23
6.11 Surface Water Quality ........................................................................................ 6-24
6.12 Soil quality ......................................................................................................... 6-28
6.13 Transportation System ....................................................................................... 6-29
6.14 Agriculture Resources ........................................................................................ 6-31
6.14.1 Cropping pattern and intensity ................................................................... 6-31
6.14.2 Crop production and damage ...................................................................... 6-31
6.15 Fisheries resources ............................................................................................ 6-32
6.15.1 Habitat characteristics ................................................................................. 6-32
6.15.2 Fish production ........................................................................................... 6-33
6.15.3 Fisheries Diversity - Species composition and biodiversity .......................... 6-33
6.15.4 Fish habitat degradation ............................................................................. 6-34
6.15.5 Fishermen status and effort ........................................................................ 6-34
6.16 Ecological Resources ........................................................................................ 6-34
6.16.1 Ecologically Critical Areas ........................................................................... 6-35
6.16.2 Ecological and conservation designations ................................................... 6-35
6.16.3 Ecosystems ...................................................... Error! Bookmark not defined.
6.17 Socio-Economic Resources ............................................................................... 6-41
6.17.1 Introduction ................................................................................................. 6-41
6.17.2 Population ................................................................................................... 6-41
6.17.3 Public Health............................................................................................... 6-44
6.17.4 Ownership and utilization of land ................................................................ 6-45
6.17.5 Occupations and livelihoods ....................................................................... 6-47
6.17.6 Labor Market.............................................................................................. 6-48
6.17.7 Standard of living ........................................................................................ 6-49
6.17.8 Poverty ....................................................................................................... 6-50
6.18 Other facilities in the Project area ...................................................................... 6-51
7. Environmental Impacts ...................................................................................................... 7-1
7.1 General ................................................................................................................ 7-1
7.2 Impact Assessment Methodology ........................................................................ 7-1
7.2.1 Impact Magnitude ......................................................................................... 7-1
7.2.2 Sensitivity of Receptor .................................................................................. 7-3

Table of Contents
vi
7.2.3 Assigning Significance .................................................................................. 7-3
7.3 Summary of Assessed Impacts ............................................................................ 7-3
7.4 Sustainability of Quality of Gas and Continuity of Supply ................................... 7-16
7.5 Impact of hazardous waste ................................................................................ 7-16
7.5.1 Hazardous Solid Waste .............................................................................. 7-16
7.5.2 Hazardous effluents .................................................................................... 7-16
7.6 Environmental impacts during boiler decommissioning stage ............................ 7-17
7.6.1 Impact on Ecosystem .................................................................................. 7-17
7.6.2 Impact on Ambient Air ................................................................................. 7-17
7.6.3 Impact on Ambient Noise ............................................................................ 7-17
7.6.4 Impact on Water Bodies .............................................................................. 7-18
7.6.5 Impact on Soil ............................................................................................. 7-18
7.6.6 Impact on Occupational Health and Safety of Workers ............................... 7-18
7.6.7 Hazardous Solid Waste Disposal ................................................................ 7-18
7.6.8 Social Impacts ............................................................................................ 7-19
7.7 Construction Stage Impact ................................................................................. 7-19
7.7.1 Impact on Landform .................................................................................... 7-19
7.7.2 Impact on Natural Resources ...................................................................... 7-19
7.7.3 Impact on Ecosystem .................................................................................. 7-19
7.7.4 Impact on Ambient Air ................................................................................. 7-19
7.7.5 Impact on Ambient Noise ............................................................................ 7-20
7.7.6 Impact on Water Bodies .............................................................................. 7-20
7.7.7 Impact on Soil ............................................................................................. 7-20
7.7.8 Impact on worker’s health and safety .......................................................... 7-20
7.7.9 Impact on Key Point Installations & others .................................................. 7-20
7.7.10 Solid Waste Disposal .................................................................................. 7-20
7.7.11 Social Impacts ............................................................................................ 7-21
7.7.12 Impact due to transportation of raw materials.............................................. 7-21
7.8 Operation Stage Impact ..................................................................................... 7-21
7.8.1 Impact on Natural Resources ...................................................................... 7-21
7.8.2 Impact on Ecosystems ................................................................................ 7-22
7.8.3 Impact on irrigation facility........................................................................... 7-22
7.8.4 Impact on Air quality (including dispersion modeling) .................................. 7-22
7.9 Air quality modeling data and methodology ........................................................ 7-23
7.10 Ghorashal Power Station Emission Parameters ................................................. 7-24

Table of Contents
vii
7.11 Meteorological Data ........................................................................................... 7-25
7.12 Receptors .......................................................................................................... 7-25
7.13 Air Quality Modeling ........................................................................................... 7-26
7.14 Maximum Ground Level Concentrations ............................................................ 7-43
7.15 Sensitivity Analysis for Stack Height .................................................................. 7-45
7.15.1 Impact on Ambient Noise ............................................................................ 7-46
7.16 Noise Generation and Potential Impacts ............................................................ 7-47
7.17 Noise Modelling ................................................................................................. 7-47
7.18 Baseline Scenario .............................................................................................. 7-48
7.19 Re-powering Scenario ....................................................................................... 7-49
7.20 Solid Waste Disposal ......................................................................................... 7-53
7.21 Impact on Soil .................................................................................................... 7-53
7.22 Impact of thermal plume (including modelling) ................................................... 7-53
7.22.1 Impact on Occupational Health and Safety ................................................. 7-59
7.22.2 Impact on Public Health and Safety ............................................................ 7-59
7.22.3 Impact on Traffic Movement ........................................................................ 7-59
7.22.4 Social Impact .............................................................................................. 7-60
7.23 Cumulative Impacts ........................................................................................... 7-60
7.23.1 Air Quality ................................................................................................... 7-60
7.23.2 Noise .......................................................................................................... 7-78
7.23.3 Impact on the flow of Water Bodies ............................................................. 7-79
8. Mitigation Measures ........................................................................................................... 8-1
8.1 Preamble ............................................................................................................. 8-1
8.2 Change in the project layout ................................................................................ 8-1
8.3 Engineering design .............................................................................................. 8-1
8.4 Mitigation measures for major impacts ................................................................. 8-2
8.4.1 Decommissioning Phase .............................................................................. 8-2
8.4.2 Construction Stage ....................................................................................... 8-4
8.4.3 Operation Phase ........................................................................................... 8-6
9. Environmental Management Plan ..................................................................................... 9-9
9.1 Objectives of EMP ............................................................................................... 9-9
9.2 Various Categories of mitigation measures .......................................................... 9-9
9.3 Inclusion of EMP in Contract Documents ............................................................. 9-9
9.4 Environmental Code of Practices ....................................................................... 9-10
9.5 Environmental Management Plans during Construction ..................................... 9-10

Table of Contents
viii
9.5.1 Site Preparation .......................................................................................... 9-10
9.5.2 Boiler decommissioning plan ...................................................................... 9-10
9.5.3 Construction Environmental Action Plan ..................................................... 9-19
9.5.4 Communication Plan ................................................................................... 9-21
9.6 EMP during operation phase .............................................................................. 9-22
9.6.1 Wastewater Management ........................................................................... 9-22
9.6.2 Solid waste management ............................................................................ 9-22
9.6.3 House keeping ............................................................................................ 9-22
9.6.4 Occupational health safety and environment .............................................. 9-22
9.6.5 Thermal Pollution Management .................................................................. 9-30
9.6.6 Air Quality Management ............................................................................. 9-31
9.6.7 Noise Management ..................................................................................... 9-31
9.6.8 Central Water Treatment Plant ................................................................... 9-32
9.7 Mitigation Plan ................................................................................................... 9-33
9.8 Emergency Response Plan ................................................................................ 9-41
9.9 Budget for EMP ................................................................................................. 9-41
10. Risk Assessment and Management ............................................................................... 10-1
10.1 Introduction ........................................................................................................ 10-1
10.2 Decommissioning Stage .................................................................................... 10-1
10.2.1 Risk/Hazard Identification ........................................................................... 10-1
10.2.2 Risk/Hazard Management ........................................................................... 10-2
10.3 Construction/Erection Stage .............................................................................. 10-6
10.3.1 Introduction ................................................................................................. 10-6
10.3.2 On-Site Risk Mitigation Measures ............................................................... 10-7
10.3.3 On-Site Emergency Response Plan .......................................................... 10-17
10.4 Operation Stage ............................................................................................... 10-17
10.4.1 Consequence Analysis-Onsite and Offsite ................................................ 10-17
10.4.2 Simulation of Flammable Area of Vapor Cloud Formation ......................... 10-19
10.4.3 Simulation of Blast Area of Vapor Cloud Formation: ................................. 10-20
10.4.4 Simulation of Jet Fire: ............................................................................... 10-20
10.4.5 Emergency Response Plan- Onsite and Offsite ........................................ 10-26
11. Environmental Monitoring Plan ...................................................................................... 11-1
11.1 Monitoring Plan .................................................................................................. 11-1
11.1.1 Compliance Monitoring ............................................................................... 11-1
11.1.2 Impacts Monitoring during Construction ...................................................... 11-1

Table of Contents
ix
11.1.3 Independent/External Monitoring ................................................................ 11-1
11.2 Implementation of Environmental Monitoring Plan ........................................... 11-16
11.2.1 Responsible Agency ................................................................................. 11-16
11.3 Action during Emergent Operation ................................................................... 11-16
11.4 Performance Indicators .................................................................................... 11-17
11.5 Reporting and Feedback Mechanism ............................................................... 11-17
11.6 Budgets for Monitoring ..................................................................................... 11-18
12. Indirect Project Benefits and Measures Proposed Beyond Compliance ................... 12-1
12.1 Preamble ........................................................................................................... 12-1
12.2 GHG Emission Reduction – An Indirect Project Benefit ..................................... 12-1
12.3 Measures under corporate social responsibility .................................................. 12-2
12.4 Use of cooling water discharge for irrigation – extending support for three years12-3
12.5 Greenbelt Development ..................................................................................... 12-4
12.6 Closing ............................................................................................................... 12-7
13. Institutional Arrangements and Capacity Building....................................................... 13-1
13.1 Profile of Key Governmental Institutions ............................................................ 13-1
13.1.1 Bangladesh Power Development Board ...................................................... 13-1
13.1.2 Project Implementation Unit ........................................................................ 13-2
13.1.3 Ghorashal Power Station (GPS) ................................................................. 13-4
13.1.4 Other Relevant Organizations ..................................................................... 13-6
13.1.5 Owner’s Engineer ....................................................................................... 13-6
13.1.6 Independent Monitor ................................................................................... 13-6
13.1.7 Contractors ................................................................................................. 13-6
13.1.8 Need for Institutional Strengthening ............................................................ 13-7
13.2 Proposed Institutional Strengthening of GPS ..................................................... 13-7
13.2.1 PIU Dedicated EHS Staff Requirements ..................................................... 13-7
13.2.2 Strengthening of the Proposed Environmental, Health and Safety Circle .... 13-8
13.2.3 Capacity Building Programs ...................................................................... 13-16
13.2.4 Formation of a Grievance Redress Committee ......................................... 13-17
13.2.5 Cost Estimates for Institutional Strengthening ........................................... 13-18
14. Public Consultation and Information Disclosure .......................................................... 14-1
14.1 Introduction and definitions ................................................................................ 14-1
14.2 Regulatory Requirements .................................................................................. 14-1
14.2.1 Bangladesh Guidelines ............................................................................... 14-1
14.2.2 World Bank Group Requirements ............................................................... 14-1

Table of Contents
x
14.3 Consultation Methodology .................................................................................. 14-2
14.4 Details of Consultation Meetings ........................................................................ 14-3
14.5 Consultation Outcome ....................................................................................... 14-5
14.5.1 Stakeholder Consultations .......................................................................... 14-5
14.5.2 Expert/Institution Consultation .................................................................. 14-12
14.6 Disclosure ........................................................................................................ 14-16
14.7 Grievance Redress Mechanism ....................................................................... 14-16
14.7.1 Local Grievance Redress Committee ........................................................ 14-19
14.7.2 Project Grievance Redress Committee ..................................................... 14-19
15. Discussions and Conclusion .......................................................................................... 15-1
16. References......................................................................................................................... 16-1
Annex 1.1: Terms-of-Reference of the EIA Study ...................................................................... 1
Annex 7-1: Gas Supply Confirmation .......................................................................................... 1
Annex 9-1: Environmental Code of Practices ............................................................................. 1
Annex 11-1: Terms of reference of the Independent Monitor ................................................... 1
Annex 11-2: Guidelines for electricity and electro-magnetic fields for work zones .............. 1
Annex 11-3: Detailed environmental monitoring costs ............................................................. 1
Annex 13-1: Terms of Reference of EHS Consultants of Owner’s Engineer .......................... 1
Annex 13-2: Scope of Work for Capacity Building and Training Consultant .......................... 1
Annex 14-1: Advertisement for Public Consultation Meeting ................................................... 1
Annex 14-2: List of Participants in the Public Consultation Meeting ...................................... 1
Annex 14-3: Comment Sheet used during Public Consultation ............................................... 1

Table of Contents
xi
List of Tables
Table 1-1: Summary of the power generation increase plan ....................................................... 1-3
Table 1-2: Team composition for the EIA Study ........................................................................... 1-7
Table 2-1: Treaty or Convention and Responsible Agency ........................................................ 2-11
Table 2-2: Triggering the World Bank Policies ........................................................................... 2-20
Table 3-1: Aerial distances of different facilities from the proposed project location ................... 3-1
Table 3-2: Major point sources of pollution around the Project site ............................................. 3-1
Table 3-3: Gas analysis report ...................................................................................................... 3-5
Table 3-4: Activities for Demolishing Boiler #4 ............................................................................ 3-8
Table 4-1: Boiler materials and design conditions ...................................................................... 4-12
Table 4-2: Chemical compositions of boiler drum, water wall, and boiler condenser ................ 4-12
Table 4-3: Number of piping of the boiler ................................................................................... 4-13
Table 4-4: List of insulation materials (partial) ............................................................................ 4-13
Table 4-5: Characteristics of existing steam turbine .................................................................. 4-15
Table 4-6: Indicative process values back calculated from the manualon existing steam turbine ...
......................................................................................................................................... 4-16
Table 4-7: Major components of the layout plan ........................................................................ 4-20
Table 4-8: Plant water balance ................................................................................................... 4-36
Table 4-9: Life cycle plant output and efficiency for repowering ................................................ 4-39
Table 4-10: Average Energy Requirements per kWh of net electricity produced (LHV basis) .. 4-41
Table 4-11: Energy Efficiency and Energy Ratio Definitions ...................................................... 4-41
Table 4-12: Efficiencies and Energy Ratio Results (LHV basis) ................................................ 4-42
Table 5-1: Criteria and sub-criteria used in evaluating project alternatives ................................. 5-2
Table 5-2: Comparison of various repowering options studied .................................................... 5-5
Table 5-3: Condenser cooling water alternatives ....................................................................... 5-11
Table 5-4: Water/effluent treatment alternatives ........................................................................ 5-13
Table 5-5: Recommended and selected options of Unit 4 Repowering ..................................... 5-17
Table 6-1: Land covers classification............................................................................................ 6-4
Table 6-2: Ambient air quality in the project area ....................................................................... 6-21
Table 6-3: Baseline noise level at different location around Ghorashal Power Plant ................ 6-23
Table 6-4: Baseline water quality data ....................................................................................... 6-26
Table 6-5: Measured ground water quality at Ghorashal Power Plant Complex ....................... 6-28
Table 6-6: Detailed soil quality of soils of AEZ 9, AEZ 16 and AEZ 28 ...................................... 6-29
Table 6-7: Cropping pattern of the study area ............................................................................ 6-31
Table 6-8: Crop production and damage of the study area ........................................................ 6-31
Table 6-9: Fisheries statistics of Palash Upazila ........................................................................ 6-32
Table 6-10: Fish habitat and production assessment ................................................................. 6-33

Table of Contents
xii
Table 6-11: Basic demographic profile of the study area ........................................................... 6-41
Table 6-12: Land tenure arrangement in the study area ............................................................ 6-46
Table 6-13: Indicators thresholds along with data sources for MPI calculation ......................... 6-50
Table 6-14: State of Multidimensional poverty ........................................................................... 6-51
Table 7-1: Parameters for Determining Impact Scale ................................................................. 7-2
Table 7-2: Criteria for Determining Sensitivity ............................................................................. 7-3
Table 7-3: Significance of Impact Criteria ..................................................................................... 7-3
Table 7-4: Potential impacts and their significance ...................................................................... 7-4
Table 7-5: Power Plant Emission Parameters ............................................................................ 7-24
Table 7-6: Summary of 2012, 2013 and 2014 Meteorological Data Input to AERMOD ............ 7-25
Table 7-7: Details of Sensitive Receptors .................................................................................. 7-25
Table 7-8: Ambient Background Concentrations (NOx and CO) ................................................ 7-27
Table 7-9: Ambient Background Concentrations (PM2.5 and PM10) ........................................... 7-27
Table 7-10: Converted Ambient Concentration Values .............................................................. 7-28
Table 7-11: Important NO2 Compliance Standards .................................................................... 7-29
Table 7-12: Tier-1 Predicted maximum ground level concentration of NO2 (Baseline &
Repowering)........................................................................................................................ 7-29
Table 7-13: Tier-2 Predicted maximum ground level concentration of NO2 (Baseline &
Repowering)........................................................................................................................ 7-30
Table 7-14: Predicted NO2 concentration at Sensitive Receptors ............................................. 7-30
Table 7-15: Air Quality Modeling – CO (Baseline & Repowering) ............................................. 7-34
Table 7-16: Predicted CO concentration at sensitive receptors ................................................. 7-34
Table 7-17: Predicted maximum concentrations of PM2.5 (Baseline & Repowering) ................. 7-35
Table 7-18: Predicted PM2.5 concentration at sensitive receptors ............................................. 7-36
Table 7-19: Predicted maximum concentrations of PM10 (Baseline & Repowering).................. 7-40
Table 7-20: Predicted PM10 concentration at sensitive receptors .............................................. 7-40
Table 7-21: Sensitivity Analysis for Stack Height (Unit 4) .......................................................... 7-46
Table 7-22: Sensitivity Analysis for Stack Height (Units 3 and 4) .............................................. 7-46
Table 7-23: Noise level in different sensitive receptors in Baseline Scenario............................ 7-49
Table 7-24: Noise level in different sensitive receptors in Re-powering Scenario ..................... 7-50
Table 7-25: Plume Model Input Parameter ................................................................................. 7-54
Table 7-26: Comparison of plume temperature with and without cooling tower ........................ 7-58
Table 7-27: Major Point Source Emissions in the Project Area ................................................. 7-61
Table 7-28: Major Area Sources in the Project Area .................................................................. 7-62
Table 7-29: Annual average daily traffic data used for air quality modeling .............................. 7-63
Table 7-30: NO2 Compliance Standards .................................................................................... 7-66
Table 7-31: Tier-2 Predicted maximum ground level concentration of NO2 (Baseline &
Repowering)........................................................................................................................ 7-66
Table 7-32: NO2 Source Contribution ......................................................................................... 7-67

Table of Contents
xiii
Table 7-33: Cumulative Impact NO2 concentration – Sensitive Receptors ............................... 7-68
Table 7-34: PM2.5 concentration (Cumulative) ............................................................................ 7-71
Table 7-35: Source Contribution ................................................................................................. 7-71
Table 7-36: Cumulative Impact of PM2.5 at Sensitive Receptors ................................................ 7-71
Table 7-37: PM10 concentration (Cumulative) ............................................................................ 7-74
Table 7-38: Source Contribution ................................................................................................. 7-74
Table 7-39: Cumulative Impact of PM10 at Sensitive Receptors ................................................ 7-74
Table 7-40: CO concentration (Cumulative) ............................................................................... 7-77
Table 7-41: Noise level in different sensitive receptors in Cumulative Scenario ....................... 7-78
Table 7-42: Detail description of option development ................................................................ 7-79
Table 7-43: Changes of monthly flow of Brahmaputra River in percentage .............................. 7-81
Table 7-44: Climate change impact on water availability in the catchment area ....................... 7-82
Table 7-45: Climate Change impact on seasonal water yield by 2050s for scenario RCP 4.5 . 7-83
Table 7-46: Statistical analysis on maximum and minimum water level for different return period ..
......................................................................................................................................... 7-83
Table 7-47: Average Monthly flow at project area on Shitalakhya River ................................... 7-84
Table 7-48: Environmental flow requirement of Shitalakhya River ............................................ 7-85
Table 9-1: Communication Plan Adopted for the Project ........................................................... 9-21
Table 9-2: OHSE Management Systems and key responsibilities register ................................ 9-24
Table 9-3: Expectation from the EPC Contactors ...................................................................... 9-30
Table 9-4: Mitigation Plan ........................................................................................................... 9-33
Table 9-5: Estimated cost of EMP .............................................................................................. 9-42
Table 10-1: Hazard identification during the decommissioning stage ........................................ 10-1
Table 10-2: Potential hazard, their consequences and suggested mitigation measures during
decommissioning process .................................................................................................. 10-2
Table 10-3: Potential hazard, their consequences and suggested risk management during
decommissioning process .................................................................................................. 10-4
Table 10-4: Location-wise hazard identification and management ............................................ 10-8
Table 10-5: Potential Hazard Points and Possible Hazards ................................................... 10-18
Table 10-6: Threat Zone of Vapor Cloud Formation ................................................................ 10-19
Table 10-7: Threat Zone of Flammable Vapor Cloud Formation ............................................. 10-20
Table 10-8: Threat Zone of Thermal Heat Radiation of a Jet Fire from gas leak .................... 10-24
Table 11-1: Environmental Compliance Monitoring Plan ........................................................... 11-3
Table 11-2: Impact Monitoring Plan ......................................................................................... 11-12
Table 11-3: Environmental Compliance Monitoring Cost ......................................................... 11-18
Table 11-4: Investment Cost of Environmental Monitoring ...................................................... 11-18
Table 11-5: Cost of Independent Monitor ................................................................................. 11-18
Table 12-1: GHG emissions in baseline and repowering conditions.......................................... 12-2
Table 12-2: Estimated budget for CSR ....................................................................................... 12-3

Table of Contents
xiv
Table 12-3: Species distribution and numbers for greenbelt program ....................................... 12-4
Table 12-4: Budget for plantation program ................................................................................. 12-7
Table 13-1: Qualification and Responsibilities of the PIU Staffs ................................................ 13-3
Table 13-2: Levels and ist and number of positions in Ghorashal Power Station and their current
status in terms of incumbency ............................................................................................ 13-4
Table 13-3: Proposed EHS Consultant of Owner’s Engineer .................................................... 13-6
Table 13-4: Budget for EHS Staffs of EHSU Circle .................................................................. 13-10
Table 13-5: Job descriptions and responsibility with qualifications of key EHS staffs ............. 13-10
Table 13-6: Training Subjects for Inclusion in Contractors Training Plan ................................ 13-16
Table 13-7: Proposed Budget for Institutional Strengthening and Capacity Building .............. 13-18
Table 14-1: Participants in the Public Consultation Meetings .................................................... 14-4
Table 14-2: Outcome of stakeholder consultations .................................................................... 14-6
Table 14-3: List of experts/institutions consulted and their opinion.......................................... 14-12

Table of Contents
xv
List of Figures
Figure 1-1: Power demand forecast for different scenarios (TEPCO 2010) ................................ 1-3
Figure 1-2: Process followed in the EIA study .............................................................................. 1-6
Figure 2-1: Process of obtaining Clearance certificate from DoE .............................................. 2-14
Figure 3-1: Base map of the study area showing the proposed Project site ................................ 3-3
Figure 3-2: Distances of administrative units from the proposed site .......................................... 3-4
Figure 3-3: Major components of Unit 4 repowering .................................................................... 3-5
Figure 3-4: Gas transmission network .......................................................................................... 3-6
Figure 3-5: Existing Ghorashal gas connection system ............................................................... 3-7
Figure 3-6: Proposed new gas supply connection system ........................................................... 3-7
Figure 3-7: Detailed activities and schedule of boiler decommissioning and repowering............ 3-9
Figure 4-1: Major equipments in Unit 4 ...................................................................................... 4-11
Figure 4-2: An inventory of maintenance and outage items ....................................................... 4-15
Figure 4-3: Full Repowering 1:1:1 configuration layout plan for Unit 4 ...................................... 4-19
Figure 4-4: Water balance diagram for Unit 4 ............................................................................ 4-21
Figure 4-5: Major industries in Project Impact Area ................................................................... 4-22
Figure 4-6: Process Flow Diagram of proposed CCPP .............................................................. 4-23
Figure 4-7: Proposed gas supply arrangements ........................................................................ 4-31
Figure 4-8: Plant layout with important component .................................................................... 4-34
Figure 4-9: System boundaries for electricity production using natural gas combined-cycle
process (including decommissioning) ................................................................................ 4-40
Figure 5-1: Different repowering options ...................................................................................... 5-3
Figure 5-2: Selected plant layout of full repowering ................................................................... 5-16
Figure 6-1: Digital Elevation Map of the study area ..................................................................... 6-2
Figure 6-2: Contour line map of the Project site ........................................................................... 6-3
Figure 6-3: General land use map ................................................................................................ 6-5
Figure 6-4: Project site shown on the Generalized tectonic map ................................................. 6-7
Figure 6-5: Project site shown on seismic zone map ................................................................... 6-8
Figure 6-6: Water resources system map of the study area ...................................................... 6-10
Figure 6-7: Water balance of the study area (a) annual and (b) monthly for the period 1981-2012
......................................................................................................................................... 6-12
Figure 6-8: Water level of Shitalakhya River near GPS (Base condition) .................................. 6-13
Figure 6-9: Average seasonal outflow from the basin during 1981-2008 .................................. 6-13
Figure 6-10: Historical annual outflow from the basin ................................................................ 6-14
Figure 6-11: Long profile of the Shitalakhya River from Lakhpur to Demra ............................... 6-15
Figure 6-12: Maximum water level of different years at Lakhpur ............................................... 6-16
Figure 6-13: Climatic zone of the proposed plant location ......................................................... 6-17

Table of Contents
xvi
Figure 6-14: Monthly maximum, minimum and average temperature........................................ 6-18
Figure 6-15: Monthly Maximum, Minimum and Average Rainfall ............................................... 6-18
Figure 6-16: Maximum, Minimum and Average Relative Humidity ............................................ 6-19
Figure 6-17: Wind rose at Dhaka station .................................................................................... 6-20
Figure 6-18: Annual wind rose for 2014 ..................................................................................... 6-20
Figure 6-19: Sampling locations of environmental components ................................................ 6-22
Figure 6-20: Spatial variation of NH3-N, COD, BOD5, DO, NO3-N and Organic-N along the
Shitalakhya River ................................................................................................................ 6-27
Figure 6-21: Road, railway and water ways networks of the study area .................................... 6-30
Figure 6-22: Bio-ecological zone of the study area .................................................................... 6-40
Figure 6-23: Distribution of households comprising member in each house ............................. 6-42
Figure 6-24: Age structure of the studied population ................................................................. 6-43
Figure 6-25: Categorical distribution of studied population ........................................................ 6-43
Figure 6-26: Sex ratio among the studied population ................................................................. 6-44
Figure 6-27: Percentage of women aged 15-49 with a birth by assistance during delivery ...... 6-45
Figure 6-28: Households by land holdings ................................................................................. 6-46
Figure 6-29: Employment Status ................................................................................................ 6-47
Figure 6-30: Employment status by field of activities ................................................................. 6-47
Figure 6-31: Distribution of population by sex and field of activity ............................................. 6-48
Figure 6-32: Housing condition in the study area ....................................................................... 6-49
Figure 6-33: Distribution of households by sanitation facilities .................................................. 6-50
Figure 6-34: Distribution of households by sources of drinking water facilities ......................... 6-50
Figure 6-35: Surrounding land use and associated communities .............................................. 6-52
Figure 7-1: Digital elevation model of the AERMOD Model Area .............................................. 7-24
Figure 7-2: Predicted NO2 Concentration (baseline scenario) ................................................... 7-32
Figure 7-3: Predicted NO2 Concentration (repowering scenario) ............................................... 7-33
Figure 7-4: Predicted PM2.5 concentration - Baseline case ........................................................ 7-38
Figure 7-5: Predicted annual average PM2.5 concentration - Repowering case ........................ 7-39
Figure 7-6: Predicted PM10 concentration - Baseline case ....................................................... 7-42
Figure 7-7: Predicted annual average PM10 concentration - Repowering case ....................... 7-43
Figure 7-8: MGLC of NO2 versus distance from the Power Plant .............................................. 7-44
Figure 7-9: MGLC of CO versus distance from the Power Plant ............................................... 7-44
Figure 7-10: MGLC of PM2.5 versus distance from the power plant ........................................... 7-45
Figure 7-11: MGLC of PM10 versus distance from the power plant ........................................... 7-45
Figure 7-12: Location of Sensitive Receptor of Noise during the Project Activities ................... 7-47
Figure 7-13: Simulation of Noise Propagation during Plant Operation in Baseline Scenario .... 7-48
Figure 7-14: Simulation of Noise Propagation during Plant Operation in Re-powering Scenario ....
......................................................................................................................................... 7-50

Table of Contents
xvii
Figure 7-15: Thermal plume dispersion from upstream to downstream during low tide ............ 7-56
Figure 7-16: Thermal plume dispersion during slack period ...................................................... 7-57
Figure 7-17: Thermal plume dispersion from downstream to upstream during high tide........... 7-57
Figure 7-18: Digital elevation model (All Major Sources) ........................................................... 7-61
Figure 7-19: Relative Emission Contributions (All Point, Line and Area Sources) .................... 7-64
Figure 7-20: Relative Emission Contributions (Major Point Sources) ........................................ 7-65
Figure 7-21: Project Area maximum predicted concentration points ......................................... 7-68
Figure 7-22: NO2 concentration-cumulative impacts .................................................................. 7-70
Figure 7-23: PM2.5 concentration-cumulative impacts ................................................................ 7-73
Figure 7-24: PM10 concentration-cumulative impacts ................................................................. 7-76
Figure 7-25: Simulation of Noise Propagation during Plant Operation in Cumulative Scenario .......
......................................................................................................................................... 7-79
Figure 7-26: Historical annual flow of the Old Brahmaputra River at Mymensingh ................... 7-81
Figure 7-27: Climate change impact on monthly water yield for climate scenario RCP 4.5 by
2050s .................................................................................................................................. 7-82
Figure 9-1: Asbestos removal preparedness during Boiler Decommissioning .......................... 9-11
Figure 9-2: Proposed plant layout with the location of asbestos disposal pit............................. 9-16
Figure 9-3: Pit with double composite liner ................................................................................. 9-17
Figure 9-4: Single Composite Wall Liner Land Fill ..................................................................... 9-17
Figure 10-1: Sequential Hazard Event from a Gas Leakage ................................................... 10-19
Figure 10-2: Threat Zone of Toxic Vapor Cloud resulted from a Gas Pipeline Leakage ......... 10-21
Figure 10-3: Threat Zone of Flammable Vapor Cloud resulted from a Gas Pipeline Leakage .........
....................................................................................................................................... 10-22
Figure 10-4: Threat Zone of Thermal Heat Radiation of a Jet Fire from gas leak ................... 10-23
Figure 10-5: The basic assumptions on climatic condition, site condition and release conditions ...
....................................................................................................................................... 10-26
Figure 11-1: Locations of monitoring .......................................................................................... 11-2
Figure 12-1: Schematic diagram showing plantation around the sludge disposal site .............. 12-5
Figure 12-2: Schematic diagram showing plantation around the proposed hazardous waste
disposal site ........................................................................................................................ 12-6
Figure 13-1: Organogram of BPDB ............................................................................................ 13-2
Figure 13-2: Revised Organogram of GPS ................................................................................ 13-5
Figure 13-3: Organogram of GPS Proposed by the Consultant ................................................. 13-9
Figure 13-4: Proposed Institutional Framework for EMP Implementation ............................... 13-18
Figure 14-1: Overall consultation approach ................................................................................ 14-2
Figure 14-2: Grievance Redress Mechanism ........................................................................... 14-18


1-1
1. Introduction
1.1 Background
1. Sustainable power supply is an important precondition for the socio-economic
development of Bangladesh. At present, about 60% (including off-Grid Renewable)
population of Bangladesh has access to electricity and per capita electricity generation is
only 348 KWh (including captive, FY 2014). The Government has therefore given top priority
to the development of the power sector and has formulated the Power System Master Plan
(PSMP), 2010. To this end, the government has set the goal of providing electricity to all
citizens by 2021. The present electricity demand growth is 12% per annum and current
installed generation capacity is around 10,817 MW including 4,437 MW from private sector,
and 500 MW of electricity import. At present most of the power plants are natural gas based.
Considering limited gas reserve of the country, BPDB has planned to generate electricity by
converting the existing simple cycle gas plants to combined cycle plants and by re-powering
the existing old steam power plants.
2. Existing Unit 4 of Ghorashal Power plant has a steam turbine with 210 MW
generation capacity, but due to its age (about 25 years), the plant has become unreliable
and less efficient. Currently, maximum output of this Unit is 180 MW. BPDB, therefore, has
taken the decision to repower the unit to a 403.5MW combined cycle power plant (CCPP).
This re-powering of the system will be done by installing one Heat Recovery Steam
Generator (HRSG), one Gas Turbine (GT) of 246MW capacity and re-furbishing the existing
210MW Steam Turbine (ST) along with decommissioning of the boiler.
3. The Project after re-powering will augment about 223.5 MW of electricity to the
national grid of which about 165 MW generation will be without additional, due to the
utilization of exhaust heat of the gas turbine. The Project upon completion is envisaged to
provide a reliable contribution in reducing the current power crisis and load shedding of the
country.
4. The proposed Project falls under the ‘Red’ category of industrial classification made
under the Environment Conservation Rules (ECR), 1997 of Bangladesh Government. The
BPDB therefore, has to take into consideration the environmental rules and regulations of
the country as well as the International Financial Institutions, such as the World Bank, who is
the prospective donor of the project.
5. In consideration of the above, the BPDB has entered into an agreement with the
Centre for Environmental and Geographic Information Services (CEGIS) for conducting the
Initial Environmental Examination (IEE) for site clearance certificate and Environmental
Impact Assessment (EIA) for securing approval of the Project from the Department of
Environment (DoE), Government of Bangladesh (GoB) to initiate project implementation.
The EIA also prepared to comply with the World Bank’s operational policies and guidelines
including the Environmental, Health and Safety Guidelines.
6. Based on the IEE report of March 2015, the BPDB secured exemption of site
clearance certificate from the DoE as the proposed site is located on the same facility within
the boundary of the existing plant. The DoE has also given its approval of the ToR for
completing the EIA study. The EIA report is prepared with reference to the approved ToR,
which is presented in Annex 1-1.

Introduction
1-2
7. CEGIS, as per the agreement and approved ToR, developed the methodology for
conducting the EIA study (which was presented in the Inception Report, February 2015) and
deployed a multidisciplinary team with relevant expertise. The team made several visits to
the Project site to get a better understanding of different issues and collect primary and
secondary data for the study. The team also consulted various groups of stakeholders of the
project site including representatives of the national agencies and local government
institutions. A number of focus group discussions were conducted to generate issue specific
information such as fisheries. Finally a number of public consultations were organized to
solicit feedback on the provisional study outcomes, which were subsequently been used to
finalize the report.
1.2 Objective of the Study
8. The objective of the study is to conduct an Environment Impact Assessment (EIA) for
the Unit 4 Repowering of Ghorashal Thermal Power Plant including decommissioning of the
existing boiler and associated infrastructure (additional gas pipeline for this project) to meet
the compliance requirement of the Government of Bangladesh (GoB)1 and the World Bank,
and secure approval of the DoE to implement the project.
9. The specific objective is -
To conduct Environmental Impact Assessment (EIA) with detail environmental
baseline survey, alternative analysis, prediction and evaluation of possible
environmental and socio-economic impacts, public consultation, and an
environmental management plan (EMP) addressing decommissioning and
risk/emergencies management and the institutional arrangements for
environmental management and monitoring.
1.3 Need of the Project
10. At present total installed electricity generation capacity is 10,817MW but actual
generation is 7,418 MW. The current electricity demand is 10,283 MW and the supply is
8,763 MW (during fiscal year 2014-2015).2 Around 68% of the population of the country has
access to electricity while electricity demand growth is 12% per annum. The Ministry of
Power, Energy and Mineral Resources (MoPEMR) has forecasted that the growth in power
demand in response to the desired economic growth of the country, will reach 13,000 MW in
2017 and 34,000MW by 2030. The PSMP also projected some scenarios of power demand
with reference to different GDP growth rates. All these variable projects are depicted in the
Figure 1-1.
1 The GoB requires 2 stages environmental assessment as per ECA’95 and ECR’97: (i) initial environmental examination
and site clearance; and (ii) environmental impact assessment and environmental clearance.
2 Power Sector Emergency Information, System Planning Department, BPDB, February 16, 2015.

Introduction
1-3
Figure 1-1: Power demand forecast for different scenarios (TEPCO 2010)3
11. To address the prevailing shortage of electricity supply as well as to achieve the
desired economic development of the country, the BPDB has adopted a power generation
enhancement plan up to 2021 in line with the PSMP, 2010 (Table 1-1). The plan includes
different initiatives to generate additional electricity by diversifying fuel mixes, rehabilitating
age-old power plants, and importing electricity from the neighboring countries. The proposed
Ghorashal Unit-4 Repowering Project is one such steps aiming to augment 224 MW
capacity and supply to the national grid for fulfilling the growing demand.
Table 1-1: Summary of the power generation increase plan
Year
Type 2015 2016 2017 2018 2019 2020 2021 Total
Public
(MW)
1,218 770 2,202 846 2,070 1,000 2,400 10,506
Private
(MW)
1,130 748 799 1,270 568 1,287 1,912 7,670
Import
(MW)
-- -- -- -- -- --
Total 2,348 1,518 3,001 2,116 2,634 2,247 4,312 18,176
Source: Power Sector Emergency Information, System Planning Department, BPDB, February 16,
2015
1.4 Scope of the EIA Study
12. The scope of the study is to carry out environmental impact assessment of the
proposed Project to address all the applicable environmental requirements, including the
3 TEPCO (2010); Power System Master Plan, Power Division, Ministry of Power, Energy and Mineral Resources,
Government of the Peoples Republic of Bangladesh, http://www.powerdivision.gov.bd/user/brec/112/58

Introduction
1-4
laws, bylaws and rules of Bangladesh Government and the World Bank Group’s operational
policies, guidelines including environment, health and safety guidelines.
13. In compliance to the GoB rules and the WB’s policies the EIA study presents its
analyses under the following headings.
a) Description of the proposed Project
b) Description of the Environment (baseline conditions)
i. Physical environment
ii. Biological environment
iii. Socio-cultural environment
c) Legislative and regulatory considerations
d) Determination of the potential impacts of the proposed Project
e) Analysis of alternatives to the proposed Project
f) Cumulative impact assessment
g) Development of an Environmental Management and Monitoring Plan (EMMP) covering decommissioning and emergency/risks, Institutional Arrangements and Capacity Building, and Estimation of budgets.
h) Consultation, Disclosure and Grievance Redress.
1.5 Study Limitations
14. As per the world standard and more importantly, instruction of the DoE, the EIA study
should be carried out considering all seasonal aspects including a complete hydrological
cycle. But because of the limited time allocated for this study, hydrological aspects for all
seasons could not be covered in the present study. However, DoE regulations also kept
provision that in case of priority projects and emergency of work, IEE and EIA could be
carried out over six months covering parts of both dry and wet seasons.
1.6 Process Followed
15. This environmental impact assessment followed a number of steps and process
presented in Figure 1-2. The main steps are:
Review of previous studies
Harmonization of Environmental Safeguard Requirements of the Government and the World Bank.
Scoping, baseline environmental quality monitoring and ecological and fisheries surveys and finalization of the ToR for the EIA Study
Screening of impacts and prioritization
Expert consultations with scientific and professional community
Conduct focus group discussions in project area
Public consultation with affected population, local government bodies, public representatives, NGOs and business communities to introduce the project components and anticipated impacts.
Prediction of impacts/risks and prepare mitigation/enhancement measures by field investigation, data analysis, and mathematical modelling.
Integration of environment with engineer’s design.
Preparation of Draft EIA Report, Environmental Management and Monitoring Plan, Boiler Decommissioning Plan, and emergency response and disaster management plan.

Introduction
1-5
Present Draft EIA Report in Public Consultation Meetings and disclosure in the BPDB, World Bank, and DOE websites for Public review and comments.
Revise the Draft and update EIA Report, EMP, Boiler Decommissioning Plan, and emergency response and disaster management plan based on comments by the BPDB Advisor, DOE, the World Bank and the public at large.
After incorporation of all comments, submit the Final EIA Report, EMMP, Boiler Decommissioning Plan, and emergency response and disaster management plan to DOE and the World Bank for Approval
Implement Boiler Decommissioning Plan during preconstruction, EMMP (including emergency response and disaster management plan) during construction and operation and maintenance (O/M) stages
Environmental auditing by assessing EIA process and feedback to future EIA Study
Implement measures beyond compliance.
16. Initial step of an EIA is the collection of primary and secondary data in addition to the
data collected at the IEE stage. Reviews of available literature from various sources,
interviews of experts and representatives of agencies and institutions, and consultation with
local stakeholders and site visits are conducted to collect baseline information for the
Project site as well as for the study area. Important Environmental and Social Components
(IESCs)/Valued Environmental Components (VECs) are identified through scoping session
based on the physical investigation, expert consultations and dialogues with local
stakeholders. Setting up of boundaries is an important step, as this takes into account
elements such as geographical boundary, time horizon for alternative actions and the
affected groups, etc. The bounding is done with reference to IECA/VEC which are covered
under the scoping.
17. A number of methods have been used to conduct impact assessment for the EIA
study. In this project, matrix methods by determining magnitude and sensitivity have been
used to identify significance of impacts of the proposed Project. Mitigation measures of the
identified significant impacts have been suggested and a comprehensive Environmental
Management Plan (EMP) has been proposed for the EIA study. The unresolved critical
issues and resolution of issues have been discussed in the EMP.
18. The EIA report of the proposed Project has been prepared to fulfil the requirements
of Environmental Conservation Rules (ECR) 1997, its subsequent amendment 2005 and
Noise Pollution (Control) Rules, 2006. The report was developed based on field
observations and consultation with various stakeholders. This study was initiated with
collection of environmental and socio-economic data from secondary sources. The primary
data and public opinions have been collected from the project site and the study area.
However, most of the data, which were used for outlining baseline condition, are from
secondary sources, especially repowering of Unit 3 EIA report. Remotely sensed satellite
images were procured, processed, verified with field condition (i.e., ground truthing) and
interpreted for enrichment of this EIA study. The various environmental standards
considered in this report were based on the standards set out in the ECR, 1997, its
subsequent amendment 2005 and Noise Pollution (Control) Rules, 2006.

Introduction
1-6
EIA Process
Study Stages
Review Previous Studies
Harmonized EA Requirements
Participation & Feedback
Expert Consultations
(scientific community and
decision makers )
Public Consultation
METHODOLOGY
Define methodology for IEE
and EIA
Comments on EIA TOR
Baseline Survey
Inception Stage
PREDICTION AND
MITIGATION
Identify Impacts/Risks
Propose Design Changes
and Mitigation Measures
Draft EIA Stage
Engineering FS Study, BPDB
Advisors, WB, DOE
Draft EIA Report,
Decom. & ER Plan
Present Draft EIA during
Public Consultations
Review
draft EIA by
BPDB, WB,
DOE
EIA Stage
Updated EIA
Reports, Decom. &
ER Plan
Final EIA Reports,
Decom. & ER Plan
Approval
by DOE
MANAGEMENT AND
MONITORING
Implement EMMP
Provide feedback for
future Studies
Audit,
Assess EIA
Process
Implementation
Operation and
Maintenance
Yes
Yes
Screening and Prioritization Initial Env. Exam.FGDs with affected
community
Cummulative and Climate
Change Impacts
Measures Beyond Compliance
Approval
by DOE
Site Clearance and
Approv. of EIA TOR
YesAlternative
Analysis
Figure 1-2: Process followed in the EIA study

Introduction
1-7
19. The baseline has covered a detail description of the physical environment, water
resources, land resources, agriculture, fisheries, eco-systems and socio-economic
conditions including identification of problems in respect of resources management.
20. Field visits were carried out for data collection as well as conducting public
consultation and disclosures as suggested in the EIA guidelines of the DoE. Baseline
situation of soil and climatic conditions (temperature, rainfall etc.) were established through
use of long term data that were at the disposal of different organizations like: Soil Resource
Development Institute (SRDI), Bangladesh Water Development Board (BWDB), Bangladesh
Small and Cottage Industries Corporation (BSCIC), Department of Fisheries (DoF),
Department of Public Health and Engineering (DPHE), Bangladesh Meteorological
Department (BMD), Department of Environment (DoE) and Upazila Offices of different
agencies. Furthermore, as part of baseline primary data on air quality, water quality, micro-
climatic parameters, fisheries, and ecological information were collected from the field. Most
of the social and economic data have been generated from the census reports of the
Bangladesh Bureau of Statistics (BBS). CEGIS’s own database for different resource
sectors, were also used in preparing the EIA report.
21. Data from secondary as well as primary sources on physical environment, water
resources, land resources, agriculture, fisheries, eco-systems and socio-economic
conditions have been collected for assessing environmental and social impact of the
proposed project and developing the environmental management plan.
22. In the impact assessment, various modeling software/tools were used for predicting
parameters of different aspects of the physical environment. For the prediction of air quality,
United States Environment Protection Agency (US-EPA) regulatory model AERMOD4 has
been used for air quality assessment. For noise modeling, CUSTIC model, CORMIX for
Thermal Plume modeling; ALOHA for chemical exposure modeling and SWAT tool for
hydrological and hydrodynamic analyses have also been used.
1.7 EIA Study Team
23. A multidisciplinary as per the ToR and the Technical Proposal carried out this study.
The study team and their responsibilities are presented in Table 1-2.
Table 1-2: Team composition for the EIA Study
Sl. No. Name of Professional Position Assigned
International Professional
1 Dr. Masud Karim ([email protected])
Team Leader/ Environment Impact Assessment Specialist
2 Dr. Mohan Shankar Deshpande Power System Engineer
3 Mr. Navin Bindra Air Quality Modeler
National Professional
3 Mr. Md. Sarfaraz Wahed Environmental Management Planning Specialist
4 Mr. Md. Golam Mostafa Air Quality Specialist
4 A steady-state plume model that incorporates air dispersion based on planetary boundary layer turbulence structure and
scaling concepts, including treatment of both surface and elevated sources, and both simple and complex terrain.

Introduction
1-8
Sl. No. Name of Professional Position Assigned
5 Dr. Maminul Haque Sarker Water Resources Specialist
6 Mr. Kazi Kamrull Hassan Water Quality Specialist
7 Mr. Md. Shibly Sadik Hazardous Waste Management Specialist
8 Dr. Anjan Kumar Datta Institutional Specialist
9 Mr. Mohammed Mukteruzzaman Ecologist
10 Mr. Mohammad Shafiqul Islam Occupational Health & Safety Specialist
11 Mr. Pronab Kumar Halder Technical Persons (air quality, water quality and other subjects as necessary)
24. In addition to the above mentioned professionals some additional professionals listed
below also provided valuable inputs into the study.
25.
Sl. No. Name of Professional Position Assigned
1 Mr. Jalal Ahmed Choudhury Co-Team Leader (Internal) and Power Plant Expert
2 Mr. Md. Azizul Haque Water Resources and Power Management Adviser
3 Mr. Mollah Md. Awlad Hossain Water Balance Specialist
4 Mr. M. Habibur Rahman GIS Specialist
5 Mr. Mohammad Saidur Rahman RS Analyst
6 Mr. Arup Kumar Biswas Junior Geotechnical Survey Specialist
7 Mr. Ashraful Alam Junior Water Resources Engineer
8 Mr. Zahid Hasan Dhali Agricultural Specialist
9 Mr. Muhammad Shifuddin Mahmud Socio-economic Specialist
10 Mr. Mohammad Kamruzzaman Ecology and Biodiversity Specialist
11 Mr. Redwan Hossain Jeshan Junior Health and Environment Specialist
12 Mr. Tanvir Ahmed Water Resources Modeller
1.8 Report Structure
26. The report has been prepared in accordance with the ToR, and it contains 16
chapters. These are as follows:
Chapter 1 describes the introduction containing background, purposes, and methodologies,
limitations of EIA study, need and importance of the project and concludes by introducing the
study team.
Chapter 2 is on legislative and regulatory aspect describing the relevant policy and legal
frameworks for the EIA process of the power plant Project.
Chapter 3 covers project data sheet of the proposed power plant comprising of Project
proponent, Project location and area, Project Impact Area, nature and size of the Project,
Project concept, Project components, Project activities, Project schedule, resources required
and their quality, and utilities demand etc.
Chapter 4 covers Project description depicting Project layout, fuel requirement and
performance, water requirement and hydrology of the Shitalakhya river, Description of the
Existing Boiler, Technology Selection and Process description, Description of Major Sub-

Introduction
1-9
Systems, Stack and Emission, Solid Waste Disposal, Emission Monitoring etc. of the
proposed power plant
Chapter 5 presents an analysis of various alternatives options for project component siting,
fuel type, technology selection, cooling water system, and water treatment system.
Chapter 6 describes the environmental and social baseline condition with detail on land use
and cover, physical environment, water resources, land resources, agricultural resources,
fisheries, ecological resources and socio-economic conditions.
Chapter 7 presents the potential impacts of Project during decommissioning of boiler, pre-
construction; construction and post-construction phases. This chapter also includes
cumulative impacts of identified VECs.
Chapter 8 identifies mitigation measures for various identified impacts, enhancements, and
compensation to restore including transport routes, disposal routes or locations of hazardous
waste, pollution control systems, waste treatment, engineering measures etc.
Chapter 9 describes the Environmental Management Plan (EMP) with mitigation measures
for minimizing the effect of the negative impacts and enhancement measures for increasing
the benefits of the positive impacts during decommissioning, pre-construction, construction,
and operation stages. Institution strengthening and capacity building, institutional
arrangements for the implementation of the EMP are also covered in this chapter.
Chapter 10 outlines all possible hazards and risks associated with the decommissioning and
proposed combined cycle thermal power plant, and management of the hazard and risks.
Chapter 11 describes the Environmental Monitoring Plan, Implementation of Monitoring
Plan, performance indicators, and reporting and feedback mechanisms.
Chapter 12 deals with measures beyond compliance including CDM intent, corporate social
responsibility, irrigation preference with cooling water discharge, and greenbelt development.
Chapter 13 outlines institutional arrangements and capacity building.
Chapter 14 presents the results of Public Consultation and Information Disclosure including
consultation with experts’ representatives of institutions and selected focus group
discussions.
Chapter 15 presents the conclusions and recommendations based on the study outcome.
27. Literature used in preparation of the report is listed under references at the end of the
report.


2-1
2. Legal and Legislative Frameworks, Regulations and Policy
Considerations
28. This Chapter presents a review of the national policy, legal, and regulatory
framework relevant to the environmental and social aspects of the Project. Also reviewed in
the Chapter are the World Bank Group (WBG) environmental and social safeguard policies
and health and safety guidelines.
2.1 The Context
29. The Bangladesh government is committed to accelerate inclusive economic growth
and reduce poverty. The government has articulated its development target in “The Vision
2021” document and these have been further elaborated in the Perspective Plan 2010-2021.
The Perspective Plan, according to the government, “is a lighthouse to point to the broad
directions of the development perspective envisioned. It draws on development planners'
viewpoints and the government’s development vision representing the hopes and aspirations
of the people of Bangladesh” (GoB: 2010:1). Review of the plan/policy documents of the
Bangladesh government, attest to the fact that the government wants to transform socio-
economic environment of Bangladesh and lift the country from a low income economy to the
middle income economy. The emphasis of government is not only to raise per capita
income, but also to give its citizens the opportunity to pursue livelihood activities and a
lifestyle of their choice, with higher standard of living, access to quality education, energy
availability to ensure per capita energy consumption of about 600 kWh (ibid. 2010:2)
30. The key policies, acts, plans and strategies of the government recognize that
economic growth, environmental protection and sustainability and poverty reduction are
inextricably linked and reinforce each other. According to available reports Bangladesh
though succeeded in reducing poverty from 40% to 27%, studies have also noted that due to
environmental degradation the country is paying a very high premium e.g., loss of nearly 4%
of GDP and 22% higher incidence of diseases are due to environmental degradation of
which water quality is a predominant factor (GoB 2015. Planning Commission. Environment,
Forestry and Biodiversity Conservation. Background Paper for the 7th Five Year Plan.
http://www.plancomm.gov.bd/7th-five-year-plan/).
31. In a densely populated country like Bangladesh where there is an intense pressure
on its natural resources, the manifestation of above noted conflicting processes are not a
total surprise, and also did not escape the government’s policy attention. Therefore to
redress some of the problems that came to the surface and also to prevent repetition of the
same in future, the government over the years enacted and/or adopted various Acts,
Legislations, Policies, Plans, Strategies and Guidelines to ensure environmental
sustainability of all development interventions. This Chapter aims to review and analyze the
key acts, legislations, policies etc that have direct relevance for designing and implementing
projects and programs in the ‘power sector’. Keeping in view the core objective of this report
(i.e., Environmental and Social Impact Assessment), and to set the context, this chapter
starts with a brief overview of Bangladesh Perspective Plan 2010-2021, followed by review
and analysis of environmental acts, legislations, rules and regulations and thereafter with
other relevant sectoral policies and legislations of Bangladesh, concluded with a short
summary. Next in the light of this analysis the mandate of the key institutions are discussed.

Legal and Legislative Frameworks, Regulations and Policy Considerations
2-2
Finally, the chapter analyses relevant policies and guidelines of the development partners. In
the context of this project they are the WBG.
32. It is however, important to note that the World Bank’s Operational Policy with
reference to environmental assessment (WB OP 4.01; 1999 revised April 2013) recognizes
that environmental impact assessment must take into consideration the national legislations,
action plans and policy frameworks as well as country’s obligations and commitments to
relevant international environmental treaties and agreements pertaining to project activities
(WB 2013:1).5
2.2 The Perspective Plan 2010 - 2021
33. The Perspective Plan 2010-2021 elucidates the country’s aspiration, and this is
clearly reflected in the preamble, which notes that the Plan “is a lighthouse to point to the
broad directions of the development perspective envisioned” (GoB 2010:1) The Plan
envisages Bangladesh as a nation with “food and energy security, with low level of
unemployment and poverty” and emphasizes on human development through greater
access to education and health for them to take advance of science and technologies among
others the information and communication technologies for establishment of a Digital
Bangladesh.
34. The chapter 9 of the Perspective Plan elaborated government vision with respect to
“power sector” under the title ‘Ensuring Adequate Supply of Electricity and Fuel’. In the Plan
electricity has been considered as “an essential ingredient for development in both economic
and social arena” (GoB 2010:89) and to ensure dependable electricity supply to its citizens
at a reasonable price outlined its power generation strategy based on diversified sources of
fuel such as gas, coal, liquid fuels as well as through renewable sources, for example, solar,
wind and micro hydro (ibid. 90). This vision was further elaborated in the Power System
Master Plan (February 2011). The “Master Plan aims to acquire a 25% share of domestic
coal and a 20 percent share of domestic natural gas, and a 5% share of national hydropower
and renewable energy, thus ensuring the self-sufficiency of the primary energy resource to
be over 50 percent by Year 2030” (GoB 2011: 2-4).
2.3 National Energy Policy 1996 and 2004
35. The first National Energy Policy (NEP) of the county was formulated in 1996 “to
ensure proper exploration, production, distribution and rational use of energy sources to
meet the growing energy demand of different zones, consuming sectors and consumers
groups on a sustainable basis” (GoB 2004:2). However, in recognition of the importance of
energy in socio-economic development, the government decided to update the NEP as an
integral part of the overall development of the energy sector, and this was accomplished in
May 2004. The NEP 2004 covers issues pertaining to “survey, exploration, exploitation and
distribution of indigenous natural gas; establishment of petroleum refining facility and
distribution systems; and establishment of power generation plants and networks for
transmission and distribution of electricity” (GoB 2004:1).
36. The NEP 2004 recognized that “policy formulation is a continuing process for
decision making at different levels by different institutions and individuals” and hence for
5 http://web.worldbank.org/WBSITE/EXTERNAL/PROJECTS/EXTPOLICIES/EXTOPMANUAL/0,,contentM
DK:20064724~menuPK:4564185~pagePK:64709096~piPK:64709108~theSitePK:502184,00.html. web
accessed on 7 April 2015.

Legal and Legislative Frameworks, Regulations and Policy Considerations
2-3
operationalizing the NEP there is a need to ensure that these “decisions are taken in a
synchronized manner at macro level, sectoral level as well as sub-sector (utility) level” to
achieve the stated objectives (GoB 2004:17). The NEP also stated that implementation of
the NEP “will necessitate introduction of new Acts and modifications of the relevant Acts and
Ordinances in this regard and Environmental issues to be considered under National Energy
Policy are to be mandated under National Environment Policy and Environment Act” (ibid.
22, emphasis added).
37. The NEP 2004 devoted a section on Environment Policy, which deserves closer
attention with reference to this project and hence we give an extensive quote as under. As
regards to environment, the NEP 2004 (ibid 27-28) outlined 10 policy measures and they
include the following;
a. Carrying out environmental impact assessment (including a consideration of social
impact) should be made mandatory and should constitute an integral part of any new
energy development project.
b. Use of economically viable environmental friendly technology is to be promoted.
c. Use of fuel wood is to be discouraged and replacement fuels are to be made
available at an affordable price.
d. Popular awareness to be promoted regarding environmental conservation.
e. In case of coal based power plants, disposal of ash and reduction of environmental
emission are to be considered in technology selection.
f. Use of lead free petrol is mandatory.
g. Use of low sulfur content Diesel will be encouraged.
h. Production of liquid fuels like Petrol, Kerosene, and Diesel Oil from Natural Gas (NG)
will be encouraged.
i. Other technical options such as use of Catalytic Converter and Diesel Particulate
Filter will be encouraged to reduce vehicular emissions.
j. For improving the environment condition in the country, producing energy from
wastes will be encouraged.
2.4 Key Policies, Acts and Strategies
2.4.1 The National Environment Policy - 1992
38. The National Environment Policy 1992 sets out the basic framework for
environmental action together with a set of broad sector guidelines. The Environment Policy
provides the broader framework of sustainable development in the country. The core
objective of the policy is to ensure the protection and improvement of the environment. It
outlined actions that need to be pursued while planning development interventions by any
sectors to facilitate long term sustainable use of all natural resources.
39. It embraces 15 broad sectors including energy to deal with overall environmental
issues. Under the energy sector in section 3.4 of the policy it articulated the following
objectives:6
6 Unofficial translation from Bengali text.

Legal and Legislative Frameworks, Regulations and Policy Considerations
2-4
o Reduce and discourage use of fuels that adversely impact the environment, and promote environment-friendly fuel use
o Reduce use of wood and agricultural residues as fuel and encourage alternative sources
o Adopt adequate precaution measures to safeguard environment while using nuclear energy
o Promote innovation of fuel saving technologies and ensure dissemination of such technologies and knowledge for public uses
o Ensure proper preservation of country’s all energy resources
o Conduct comprehensive environmental impact assessment study before undertaking any intervention for exploitation of energy and other minerals in support of energy production.
40. The policy also gave the direction of amending the existing laws, formulating the new
laws and implementing the same. To this effect, the policy assigned the Ministry of
Environment and Forests to coordinate the implementation of the policy and to constitute a
high level National Environmental Committee with the head of the government as the
chairperson to give the direction, and ensure supervision and overseeing the implementation
of the policy.
2.4.2 Environmental Conservation Act - 1995 (and the Revisions)
41. The Bangladesh Environment Conservation Act 1995 (ECA 1995) is currently the
main Act governing environmental protection in Bangladesh. The ECA 1995 replaced the
earlier environment pollution control ordinance of 1992 and provides the legal basis for
Environmental Conservation Rules, 1997 (ECR 1997). The main objectives of ECA 1995
are: conservation of the natural environment and improvement of environmental standards,
and control and mitigation of environmental pollution. The main strategies of the Act can be
summarized as:
o Declaration of ecologically critical areas, and restriction on the operation and process, which can be continued or cannot be initiated in the ecologically critical areas.
o Regulation in respect of vehicles emitting smoke harmful for the environment.
o Environmental clearance.
o Remedial measures for injury to ecosystem
o Regulation of the projects and other development activities - discharge permit.
o Promulgation of standards for quality of air, water, noise and soil for different areas for different purposes.
o Promulgation of standard limit for discharging and emitting waste.
o Formulation and declaration of environmental guidelines.

Legal and Legislative Frameworks, Regulations and Policy Considerations
2-5
42. The Act is implemented by Department of Environment (DoE), under the Ministry of
Environment and Forest. Under the Act, for any new development project, the project
proponent must take Environmental Clearance from the DoE. The procedures to take such
clearance are in place. Failure to comply with any part of ECA 1995 may result in
punishment by a maximum of 10 years imprisonment or a maximum fine of Tk. 100,000 or
both.
43. Bangladesh Environmental Conservation Act (Amendment 2000) focuses on: (1)
ascertaining responsibility for compensation in cases of damage to ecosystems, (2)
increased provision of punitive measures both for fines and imprisonment and (3) fixing
authority on cognizance of offences. This Act was amended in 2002 (Bangladesh
Environmental Conservation Act - Amendment 2002) and added the following under the
purview of the Act: (1) restriction on polluting automobiles, (2) restriction on the sale and
production of environmentally harmful items like polythene bags, (3) assistance from law
enforcement agencies for environmental actions, (4) break up of punitive measures and (5)
authority to try environmental cases. In 2010 the Act was further amended and the
Bangladesh Environmental Conservation Act (Amendment 2010) elaborates on (1)
demarcation of wetlands and water bodies, (2) Hazardous waste import, transportation,
storage etc., (3) Cutting of hills, mountains (4) Ecologically Critical Areas.
2.4.3 Environmental Conservation Rules - 1997 (as amended in 2005)
44. Environmental Conservation Rules 1997 (ECR 1997) and amended in 2005 consists
of a set of rules to implement the ECA 1995, which elaborated the following:
o Categorized list of the projects as green, orange and red,
o Procedure to take environmental clearance,
o Ambient standards in relation to water pollution, air pollution (as amended in 2005) and noise, as well as permitted discharge/emission levels of water and air pollutants and noise by the project’s Environmental Categories.
45. ECR 1997 classifies projects by potential environmental impact and assigns different
assessment and management requirements as follows:
Green projects are those with positive environmental impacts or negligible negative
impacts such as plantation and nursery. Clearance for these is obtained on the basis
of project description, initial screening and No Objection Certificate (NOC) by the
local authority.
Orange projects fall into two categories i.e., Orange A and Orange B. Orange A
projects are those with minor and mostly temporary environmental impacts for which
there are standard mitigation measures, such as the installation of tube wells, pond
sand filter, tank/reservoir, sanitary latrines etc. Application for DoE’s environmental
clearance requires general information, a feasibility report, a process flow diagram
and schematic diagrams of facilities, environmental screening form, NOC from local
authority. Orange B projects are those with moderately significant environmental
impacts for which mitigation measures are easily identified, such as construction/re-
construction of earthen roads, culverts, community centers, office buildings for
general services, re-excavation of canals, repairing embankments, and school fields,
etc. Such interventions require environmental clearance certificate from DoE, based
on an Initial Environmental Examination report and an Environmental Management
Plan, among others.

Legal and Legislative Frameworks, Regulations and Policy Considerations
2-6
Red projects are those which may cause ‘significant adverse’ environmental impacts
such as the construction of bridge, industrial factories, flood shelter, embankment,
water control structures, etc. Projects under this category require IEE report to obtain
the Site Clearance Certificate, and subsequently a full EIA report for environmental
clearance certificate, along with the information required for other Categories. A
number of sectoral EIA guidelines have been prepared to assist the EIA process.
46. Environmental standards also promulgated under the Environment Conservation
Rules 1997 are prescribed for varying water sources, ambient air, noise, odors, industrial
effluents and emission discharges, vehicular emission, etc. with the aim of limiting the
volume and concentrations of pollution discharged into the environment. A number of
surrogate pollution parameters like Biochemical Oxygen Demand, or Chemical Oxygen
Demand; Total Suspended Solids, etc. are specified in terms of concentration and/or total
allowable quality discharged in case of waste water and solid wastes. Additionally specific
parameters are specified such as phenol, cyanide, copper, zinc, chromium, and various
types of particulate, sulfur dioxide, nitrogen oxides, volatile organic compounds and other
substances.
2.4.4 National Environment Quality Standards
47. Under the Environment Conservation Rules of 1997 the government has
promulgated environmental standards and they are in operation. The standards have been
defined for varying water sources, ambient air, noise, odor, industrial effluent and emission
discharges, vehicular emissions, etc. Under the rule, the government imposes restrictions on
the volume and concentrations of wastewater, solid waste and gaseous emissions
discharged into the environment. In addition, a number of surrogate pollution parameters like
biochemical oxygen demand, or chemical oxygen demand; total suspended solids, etc. are
specified in terms of concentration and/or total allowable quality discharged in case of
wastewater and solid waste. Additionally, specific parameters depending on the
manufacturing process are specified such as phenol, cyanide, copper, zinc, chromium, etc.
Air emission quality standards refer mostly to concentration of mass emission of various
types of particulate, sulfur dioxide, oxides of nitrogen and in some cases volatile organic
compounds and other substances. For defining the air quality standards, the 2005
Amendment to the ECR, 1997 has been considered and incorporated in this report.
48. The Bangladesh standards in general are less stringent compared to that of the
developed countries. This is to promote and encourage industrialization in the country. The
Bangladesh standards are not for any specific period of time and there is no provision for
partial compliance either.
49. The Environmental Quality Standards are legally binding. There is a separate
schedule on industry specific standards, other than the general industrial emission and
effluent standards. This schedule covers a wide range of industries – fertilizer, tannery,
integrated textile, food, cement, etc.
2.4.5 The Environment Court Act - 2000
50. The Environment Court Act - 2000 has been enacted in order to establish
environmental courts in each administrative division of Bangladesh. Under this Act, the court
has concurrent jurisdiction i.e. to try both civil and criminal cases. The basis for instituting a
case is a violation of the “environmental law”, meaning the Bangladesh Environment

Legal and Legislative Frameworks, Regulations and Policy Considerations
2-7
Conservation Act - 1995 and Rules made there under. In particular the environment court is
empowered to:
o Impose penalties for violating court orders;
o Confiscate any article, equipment and transport used for the commission of the offence;
o Pass any order or decree for compensation;
o Issue directions to the offender or any person (a) not to repeat or continue the offence; (b) to take preventive or remedial measures with relation to any injury, specifying the time limit and reporting to the DoE regarding the implementation of the directions.
51. Under this Act the Director General of the DoE has the power to impose penalties to
polluters who, for example, are dumping untreated wastewater into the environment or not
operating their legally mandated effluent treatments plants.
52. The Environment Court Act - 2000 allowed the government to form court only at
divisional headquarters. According to this law, a person might be jailed for maximum three
years or fined Taka 300,000 for polluting environment. But the new legislation increased the
jail term up to five years and the fine up to Taka 500,000. Both the special magistrate's court
and the environment court will enjoy authority to realize fines from the offenders. Besides,
the courts may order to meet expenses for conducting cases and give the money in
compensation to the affected individuals or organizations.
53. The Parliament also passed bills in 2010 for increasing the number of environment
courts and their authority to take stern actions against polluters, making provision for
establishing a trust to tackle adverse impacts of climate change. A new bill was also placed
in parliament seeking to enact a law to punish illegal sand extraction and to lease sand
quarries in an environmentally friendly way. The new legislation, which was passed
repealing the existing Environment Court Act - 2000, aims to expedite trial of environment
related offences and offers setting up environment court at every district headquarters with
expanded jurisdiction to take stern actions against all sorts of polluters.
2.5 Strategies and Plans
2.5.1 National Conservation Strategy - 1992
54. Bangladesh National Conservation Strategy was drafted in late 1991 and submitted
to the Government in early 1992. This was approved in principle; however the Cabinet is yet
to give its final approval of the document. For sustainable development in the energy sector,
the strategy document offered various recommendations but none was there concerning the
present specific project execution program or related matter. Major relevant
recommendations are:
o To use minimum possible area of land in exploration sites;
o Rehabilitate site when abandoned;
o To take precautionary measures against Environmental Pollution from liquid effluent, condensate recovery and dehydration plants; and
o Technology assessment for selection of appropriate technologies.

Legal and Legislative Frameworks, Regulations and Policy Considerations
2-8
2.5.2 National Biodiversity Strategy and Action Plan for Bangladesh - 2004
55. “The National Biodiversity Strategy and Action Plan of Bangladesh (NBSAP) provides
a framework for conservation, sustainable use and sharing the benefits of biodiversity of the
country” (GoB 2004: v). The core focus of NBSAP has been ensuring cross-sectoral linkages
and provides a framework for securing the necessary environmental settings to reduce
poverty and ensure sustainable development. Sixteen strategies have been developed to
shape and direct the actions towards achieving the goals and objectives of the NBSAP. The
NBSAP emphasizes on integration of biodiversity conservation into the national development
planning and processes.
56. From this perspective, the proposed project needs to recognize the value and
importance of biodiversity and adopt measures to ensure that the integrity of the ecosystems
is not adversely impacted by project activities in any stages of project implementation and
operations. This is also reflected in the National Energy Policy of 1995 which committed “to
ensure environmentally sound sustainable energy development programs causing minimum
damage to environment".
2.6 Other Sectoral Policies
2.6.1 National Industrial Policy - 2010
57. The National Industrial Policy – 2010 outlined with the vision to accelerate “economic
development that will, by 2021, witness the creation of a strong industrial sector in which the
percentage of GDP with industrial ancestry will grow from the present 28% to 40%, and
where the proportion of the labor force employed will rise from the present 16% to 25%”
(GoB 2010:5-6).
58. The policy, presents an integrated strategy for rapid industrialization taking into
consideration the government’s determination to achieve the Millennium Development Goals
(MDGs) by 2015, and halve the number of the unemployed and hunger- and poverty-stricken
people by 2017. To realize this vision the policy emphasized on taking environmentally-
friendly and technologically-modern initiatives to facilitate growth of all important industrial
sectors such as energy and fuel, agriculture and forestry, acquiring and processing of
minerals, tourism and hospitality, construction, information and communications technology
by mobilizing capital and manpower.
59. The policy aims to ensure a high rate of investment by the public and private sectors,
a strong productive sector, direct foreign investments, development of labor intensive
industries, and introduction of new appropriate technologies, women's participation,
development of small and cottage industries, entrepreneurship development, high growth of
export, infrastructure development, and environmentally sound industrial development.
2.6.2 National Water Policy - 1999
60. The National Water Policy of 1999 was adopted by the government “to manage the
water resources of the country in a comprehensive, integrated and equitable manner…..to
ensure continued progress towards fulfilling the national goals of economic development,
poverty alleviation, food security, public health and safety, decent standard of living for the
people and protection of the natural environment” (GoB 1999:2). Hon. Prime Minister in the
Foreword of the policy noted that “the declaration of the National Water Policy is a bold step
towards good governance in Bangladesh ……… by bringing order and discipline in the
exploration, management and use of water resources in Bangladesh…….and unequivocally
declares the intention of the government that all necessary means and measures will be

Legal and Legislative Frameworks, Regulations and Policy Considerations
2-9
taken to manage the water resources of the country in a comprehensive, integrated and
equitable manner”.
61. The policy “aims to provide directions” to all agencies and institutions working in the
water sector and/or are related to water in one form or another, to ensure efficient and
equitable management of water resources, proper harnessing and development of surface
and ground water, availability of water to all concerned, and institutional capacity building for
water resource management. It has also addressed issues like river basin management,
water rights and allocation, public and private investment, water supply and sanitation and
water needs for agriculture, industry, fisheries, wildlife, navigation, recreation, environment,
preservation of wetlands, etc.
62. It provides the framework for the management of water resources of the country in a
comprehensive, integrated and equitable manner. The policy recognizes that water is
essential for human survival, socio-economic development of the country, and preservation
of its natural environment. It is vital that the continued development and management of the
nation's water resources should include the protection, restoration, and preservation of the
environment and its bio-diversity. The policy emphasized on development of knowledge and
capability to design future water resources management plans addressing economic
efficiency, gender equity, social justice and environmental needs through broad public
participation.
63. With reference to “water and industry” the policy noted concern about the excessive
salinity of water, especially in the southwest region of the country, and identified this as a
major deterrent to industrial development. The discharge of untreated effluents from various
industrial centers has been identified as an important source of pollution affecting the ground
and surface water resources system, and defined as a core water management issue. With
respect to industry, the policy outlined four actions namely (a) zoning regulations for
establishment of new industries in consideration of fresh and safe water availability and
effluent discharge possibilities; (b) monitoring of effluent disposal by relevant Government
agencies to prevent water pollution; (c) setting standards of effluent disposal into common
watercourses by WARPO in consultation with DoE, and (d) polluting industries under the lay
will be required to pay for the cleanup of water- body polluted by them (GoB 199:12).
2.7 Agencies and Institutions Mandated to Address and Ensure Environmental Sustainability
64. In Bangladesh, the Ministry of Environment and Forest (MoEF) is the apex body with
the mandate for matters relating to national environmental policy and regulatory issues and
to guide and monitor all activities pertaining to the state of the environment in the country.
Realizing the ever-increasing importance of environmental issues, the MoEF was
established in 1989 and a permanent member of the Executive Committee of the National
Economic Council, which is the decision-making body for economic policy and is also
responsible for approving public investment projects. Under the MoEF, there are several
agencies which undertake specific tasks within the framework of the MoEF’s mandate. They
are:
o Department of Environment (DoE)
o Department of Forest (DoF)
o Forest Industries Development Corporation
o Bangladesh Forest Research Institute and Institute of Forestry

Legal and Legislative Frameworks, Regulations and Policy Considerations
2-10
o Forestry Division of the Bangladesh Agricultural Research Council and
o National Herbarium
65. Of the above agencies, in view of the present project objectives, descriptions of the
DoE and DoF are presented below.
2.7.1 Department of Environment
66. The Department of Environment (DoE), established in 1989 under the jurisdiction of
the MoEF, is the executing agency for planning and implementing environmental issues
including, but not limited to, the following activities.
o Reviewing environmental impact assessments and issuing environmental clearance where appropriate;
o Implementing environmental monitoring programs and enforcement measures;
o Developing and maintaining environmental data bases, and
o Coordinating international events with the MoEF (e.g., representing Bangladesh in the meetings of various multi-lateral environmental agreements, international seminars, workshops, etc.).
67. The DoE is headed by a Director General (DG) who is supported by a team of
Directors, Deputy Directors, Assistant Directors, Engineers, and other technical staff (e.g.,
chemists and laboratory technicians). The DoE has regional offices in Sylhet, Rajshahi,
Khulna, and Barisal monitoring stations and several laboratories.
2.7.2 Forest Department
68. The Forest Department (FD), under the Ministry of Environment and Forest, is
responsible for protection and management of the Reserve Forests, National Parks, and
Sanctuaries in the country. The department manpower extends down to Union levels in
areas where reserve forests exist. Officers of the FD are responsible for protection of wildlife
in these forest areas.
69. In addition to the MoEF there are several other ministries and departments which are
also relevant to the project activities, and they are:
2.7.3 Ministry of Land
70. The Ministry of Land (MoL) manages revenue generation for Government-owned
land (called khas), excluding agency-owned lands controlled by the Bangladesh Water
Development Board (BWDB), Roads & Highways, etc. The MoL controls open water bodies
(rivers, beels, and haors) above a specified size, except for those that were transferred to
the Ministry of Fisheries and Livestock under the public water bodies (Jalmohal)
Management Policy, 2009. The MoL must approve the process where the Government
acquires private land on behalf of a private development program.
2.7.4 Ministry of Water Resources
71. The Ministry of Water Resources (MoWR) is responsible for the water management
program of the country. This includes preparation and implementation of water master plans,
flood control measures, surface and ground water hydrology data-collection, modeling,
monitoring and planning irrigation and drainage projects. Bangladesh Water Development
Board is the executing agency of the MoWR.

Legal and Legislative Frameworks, Regulations and Policy Considerations
2-11
2.7.5 Ministry of Fisheries and Livestock
72. The Ministry of Fisheries and Livestock is responsible for all policy matters in the field
of fisheries resources management. The Directorate of Fisheries advises the Ministry on
policy matters and is also responsible for managing the fish seed farms which are spread all
over the country and managing 152 open water bodies which includes open rivers,
depressed basins (haors), oxbow lakes (baors) and other large inland permanent water
bodies (beels).
2.7.6 Ministry of Power, Energy and Mineral Resources
73. The Ministry of Power, Energy and Mineral Resources is the apex body with
responsibility for exploration, production and marketing of all forms of primary energy
sources. These primary energy sources encompass natural gas, petroleum, coal and peat.
This Ministry also deals with all issues related to the generation, transmission, distribution
and sales of electricity.
2.7.7 Bangladesh Power Development Board
74. The Bangladesh Power Development Board (BPDB), an autonomous body under the
jurisdiction of the Ministry of Power, Energy and Mineral Resources, is responsible for
generation, transmission and distribution of electricity in the country. The BPDB is the
proponent of the current project.
2.8 International Treaties Signed by GoB
75. Bangladesh has signed most international treaties, conventions and protocols on
environment, pollution control, bio-diversity conservation and climate change, including the
Ramsar Convention, the Bonn Convention on migratory birds, the Rio de Janeiro Convention
on biodiversity conservation and the Kyoto protocol on climate change. An overview of the
relevant international treaties signed by GoB is presented in Table 2-1.
Table 2-1: Treaty or Convention and Responsible Agency
Treaty Year Brief Description Relevant
Department
Protection of birds (Paris) 1950 Protection of birds in wild state DoE/DoF
Ramsar Convention 1971 Protection of wetlands DoE/DoF
Protocol Waterfowl Habitat 1982 Amendment of Ramsar Convention
to protect specific habitats for
waterfowl
DoE/DoF
World Cultural and Natural
Heritage (Paris)
1972 Protection of major cultural and
natural monuments
DoArch
CITES convention 1973 Ban and restrictions on international
trade in endangered species of wild
fauna and flora
DoE/DoF
Bonn Convention 1979 Conservation of migratory species of
wild animals
DoE/DoF
C139 - Occupational Cancer
Convention, 1974
1974 Convention concerning Prevention
and Control of Occupational Hazards
MoH

Legal and Legislative Frameworks, Regulations and Policy Considerations
2-12
Treaty Year Brief Description Relevant
Department
caused by Carcinogenic Substances
and Agents
C148 - Working Environment
(Air Pollution, Noise and
Vibration) Convention, 1977
1977 Convention concerning the
Protection of Workers against
Occupational Hazards in the Working
Environment Due to Air Pollution,
Noise and Vibration
MoH
C155 - Occupational Safety
and Health Convention, 1981
1981 Convention concerning Occupational
Safety and Health and the Working
Environment
MoH
C161 - Occupational Health
Services Convention, 1985
1985 Convention concerning Occupational
Health Services
MoH
Convention on oil pollution
damage (Brussels)
1969 Civil liability on oil pollution damage
from ships
DoE/MoS
Civil liability on transport of
dangerous goods (Geneva)
1989 Safe methods for transport of
dangerous goods by road, railway
and inland vessels
MoC
C170 - Chemicals
Convention, 1990
1990 Convention concerning Safety in the
use of Chemicals at Work
DoE
Convention on oil pollution 1990 Legal framework and preparedness
for control of oil pollution
DoE/MoS
Vienna convention 1985 Protection of ozone layer DoE
London Protocol 1990 Control of global emissions that
deplete ozone layer
DoE
UN framework convention on
climate change (Rio de
Janeiro)
1992 Regulation of greenhouse gases
emissions
DoE
Convention on Biological
Diversity (Rio de Janeiro)
1992 Conservation of bio-diversity,
sustainable use of its components
and access to genetic resources
DoE
International Convention on
Climate Changes (Kyoto
Protocol)
1997 International treaty on climate
change and emission of greenhouse
gases
DoE
Protocol on biological safety
(Cartagena protocol)
2000 Biological safety in transport and use
of genetically modified organisms
DoE
Convention on persistent
Organic Pollutants,
Stockholm.
2004 Eliminate dangerous POPs, support
the transition to safer alternatives,
target additional POPs for action,
cleanup old stockpiles and
equipment containing POPs, and
work together for a POPs-free future
DoE

Legal and Legislative Frameworks, Regulations and Policy Considerations
2-13
2.9 Implication of GoB Polices, Acts and Rules on the GPS Unit 4 Repowering Project
76. The legislations relevant for environmental assessment for Unit 4 Repowering are the
Environmental Conservation Act 1995 (ECA 1995) and the Environmental Conservation
Rules 1997 (ECR 1997). Department of Environment (DoE), under the Ministry of
Environment and Forest (MoEF), is the regulatory body responsible for enforcing the ECA
1995 and ECR 1997. According to the Rule 7 (1) of the Environmental Conservation Rules
1997; for the purpose of issuance of Environmental Clearance Certificate (ECC), every
industrial units or projects, in consideration of their site and impact on the environment, will
be classified into four categories and they are: Category I (green), Category II (Orange-A),
Category III (Orange B) and Category IV (Red). The Project which is a gas based combined
cycle thermal power plant fall under the ‘red’ category according to the Bangladesh
Environment Conservation Rules 1997 (Amendment, 2005). For project under this category,
it is mandatory to carry out EIA including Environmental Management Plan and where
necessary develop a resettlement plan for getting environmental clearance from the
Department of Environment. The responsibility to review EIAs for the purpose of issuing
Environmental Clearance Certificate rests on DoE. The procedures for “Red” Category
include submission of:
An Initial Environmental Examination (IEE)
An Environmental Impact Assessment (EIA)
An Environmental Management Plan (EMP)
77. Environment clearance has to be obtained by the respective implementing agency or
project proponent from Department of Environment. The environmental clearance
procedure for Red Category projects can be summarized as follows:
78. Application to DoE → Obtaining Site Clearance →Applying for Environmental
Clearance → Obtaining Environmental Clearance → Clearance Subject to annual renewal.
Steps to be followed for obtaining Environmental Clearance Certificate (ECC) (under Red
Category) from DoE are outlined in Figure 2-1.
79. Public participation or consultation is not a condition in the ECR 1997 and or EIA
Guidelines, however, DoE prefers the proponent to engage in public participation and put
conditions while providing site clearance or during the approval of the EIA ToR.

Legal and Legislative Frameworks, Regulations and Policy Considerations
2-14
Application for Site Clearance
Application should enclose:
1. Prescribed application form
2. Application fee
3. IEE Report of the proposed project (including ToR for EIA)
4. Location map/layout plan, etc.
5. No Objection Certificate (NOC) from local government authority
6. Preliminary Feasibility Study Report/ DPP of the proposed project, if available
Obtaining Site Clearance and
approved ToR for EIA
Site visit by DoE and applicant
ageny, if required
Applicant agency will conduct EIA study for the proposed
project
Application for Environmental Clearance
Application should enclose:
1. Prescribed application form
2. EIA Report of the proposed project including EMP
4. Outline of relocation, rehabilitation plan, if applicable Location map/layout plan, etc.
5. Feasibility Study Report of the proposed project, if available
Obtaining Environmental
Clearance
Renewal of the Clearance after
each one-year period
Presentation on the EIA and EMP
by the applicant agency to DoE
Figure 2-1: Process of obtaining Clearance certificate from DoE
Legal and Legislative Frameworks, Regulations and Policy Considerations
2-15
2.10 World Bank's Environmental Safeguard Policies
80. The World Bank has developed a number of Safeguard Policies to ensure that all
possible impacts are considered and mitigation measures are spelled out prior to the
implementation of any proposed project. These policies ensure uniformity of the quality of
operations is across different settings worldwide. If the decision is taken that a Safeguard
Policy should be applied, mitigation measures and plans must be developed and be in place
before the implementation of a proposed project.
81. The Bank requires environmental screening and classification for all investment
projects (including ones financed by Trust Funds, Project Preparation Facilities and
Guarantees) proposed for Bank financing, to help ensure that they are environmentally and
socially sound and sustainable. Screening and classification take into account the natural
environment (air, water, and land); human health and safety; social aspects (involuntary
resettlement, indigenous peoples); cultural property; and trans-boundary and global
environmental aspects.
82. The objectives of environmental screening and classification are: to evaluate the
environmental risks associated with a proposed operation; to determine the depth and
breadth of Environmental Assessment (EA); and to recommend an appropriate choice of EA
instrument(s) suitable for a given project. The Bank recognizes that environmental screening
and classification is not absolute and involves professional judgment on a case by case
basis. When screening, careful consideration needs to be given to potential environmental
impacts and risks associated with the proposed project. Judgment is exercised with
reference to the policy expectations and guidance; real impacts on the ground; and
established regional and Bank-wide precedence and good practice.
2.10.1 Environmental Assessment (OP 4.01)
83. EA requirement. The World Bank requires environmental assessment (EA) of
projects proposed for the Bank support to ensure that they are environmentally sound and
sustainable, and thus to improve decision making. The Bank Policy OP 4.01 considers that
EA is a process whose breadth, depth, and type of analysis depend on the nature, scale,
and potential environmental impact of the proposed project. EA evaluates a project's
potential environmental risks and impacts in its area of influence; examines project
alternatives; identifies ways of improving project selection, siting, planning, design, and
implementation by preventing, minimizing, mitigating, or compensating for adverse
environmental impacts and enhancing positive impacts; and includes the process of
mitigating and managing adverse environmental impacts throughout the project
implementation period. EA takes into account the natural environment (air, water and land);
human health and safety; social aspects (involuntary resettlement, indigenous peoples and
physical cultural resources); and trans-boundary and global environmental aspects. The
Bank Policy also envisages that the borrower Government is responsible for carrying out the
EA and the Bank advises the borrower on the Bank's EA requirements.
84. The present EIA has been prepared in compliance with this OP.
85. EA classification. The World Bank classifies the proposed project into one of the
four categories, depending on the type, location, sensitivity, and scale of the project and the
nature and magnitude of its potential environmental impacts. These categories are defined
below.
Category A: A proposed project is classified as Category A if it is likely to have
significant adverse environmental impacts that are sensitive, diverse, or

Legal and Legislative Frameworks, Regulations and Policy Considerations
2-16
unprecedented. These impacts may affect an area broader than the sites or facilities
subject to physical works.
Category B: A proposed project is classified as Category B if its potential adverse
environmental impacts on human populations or environmentally important areas--
including wetlands, forests, grasslands, and other natural habitats--are less adverse
than those of Category A projects.
Category C: A proposed project is classified as Category C if it is likely to have
minimal or no adverse environmental impacts. Beyond screening, no further EA
action is required for a Category C project.
Category FI: A proposed project is classified as Category FI if it involves investment
of Bank funds through a financial intermediary (FI), in subprojects that may result in
adverse environmental impacts.
86. The proposed project has been classified as Category A, since some of the potential
impacts are likely to be significant and diverse.
2.10.2 Natural Habitats (OP 4.04)
87. The Policy describes the conservation of natural habitats, like other measures that
protect and enhance the environment, to be essential for long-term sustainable
development. The Bank therefore supports the protection, maintenance, and rehabilitation of
natural habitats and their functions in its economic and sector work, project financing, and
policy dialogue. The Bank also supports, and expects borrowers to apply a precautionary
approach to natural resource management to ensure opportunities for environmentally
sustainable development. The Bank- promotes and supports natural habitat conservation
and improved land use by financing projects designed to integrate into national and regional
development, the conservation of natural habitats and the maintenance of ecological
functions. Furthermore, the Bank promotes the rehabilitation of degraded natural habitats.
The Bank does not support projects that involve the significant conversion or degradation of
critical natural habitats.
88. The activities under the proposed project will not alter the natural habitat hence this
policy is not triggered.
2.10.3 Pest Management (OP 4.09)
89. Through this OP, the WB supports a strategy that promotes use of biological or
environmental control methods and reduces reliance on synthetic chemical pesticides. Rural
development and health sector projects have to avoid using harmful pesticides. Other
pesticides can be used, but only as an element of an Integrated Pest Management Plan
(IPMP) that emphasizes environmental and biological controls.
90. The project will not promote the use of chemical pesticides and fertilizers. Hence, this
policy is not triggered.

Legal and Legislative Frameworks, Regulations and Policy Considerations
2-17
2.10.4 Indigenous Peoples (OP 4.10)
91. For purposes of this Policy, the term ‘Indigenous Peoples’ is used in a generic sense
to refer to a distinct, vulnerable, social and cultural group possessing the following
characteristics in varying degrees:7
self-identification as members of a distinct indigenous cultural group and recognition
of this identity by others;
collective attachment to geographically distinct habitats or ancestral territories in the
project area and to the natural resources in these habitats and territories;
customary cultural, economic, social, or political institutions that are separate from
those of the dominant society and culture; and
an indigenous language, often different from the official language of the country or
region.
92. The OP defines the process to be followed if the project affects the indigenous
people.
93. There are no indigenous communities residing in the project area and therefore, no
impacts on them are expected under the project. Therefore, this OP is not triggered.
2.10.5 Physical Cultural Resources (OP 4.11)
94. The World Bank’s general policy regarding cultural properties is to assist in their
preservation, and to seek to avoid their elimination. The specific aspects of the Policy are
given below. 8
The Bank normally declines to finance projects that will significantly damage non-
replicable cultural property, and will assist only those projects that are sited or
designed so as to prevent such damage.
The Bank will assist in the protection and enhancement of cultural properties
encountered in Bank-financed projects, rather than leaving that protection to chance.
In some cases, the project is best relocated in order that sites and structures can be
preserved, studied, and restored intact in situ. In other cases, structures can be
relocated, preserved, studied, and restored on alternate sites. Often, scientific study,
selective salvage, and museum preservation before destruction is all that is
necessary. Most such projects should include the training and strengthening of
institutions entrusted with safeguarding a nation’s cultural patrimony. Such activities
should be directly included in the scope of the project, rather than being postponed
for some possible future action, and the costs are to be internalized in computing
overall project costs.
Deviations from this policy may be justified only where expected project benefits are
great, and the loss of or damage to cultural property is judged by competent
authorities to be unavoidable, minor, or otherwise acceptable. Specific details of the
justification should be discussed in project documents.
7 Excerpts from the OP 4.10.WB Operational Manual, July 2005.
8 Excerpts from the OPN 11.03.WB Operational Manual. September 1986.

Legal and Legislative Frameworks, Regulations and Policy Considerations
2-18
This policy pertains to any project in which the Bank is involved, irrespective of
whether the Bank is itself financing the part of the project that may affect cultural
property.
95. As part of the environmental assessment study for the project, a full baseline
assessment has been carried out, including consultations, to identify any physical cultural
resources (PCR) in the project area. Since, this project is a repowering project within the
existing property line, no impact on PCR is expected. However, the ‘chance find’ procedures
are included in the EMP.
2.10.6 Involuntary Resettlement (OP 4.12)
96. The WB’s experience indicates that involuntary resettlement under development
projects, if unmitigated, often gives rise to severe economic, social, and environmental risks:
production systems are dismantled; people face impoverishment when their productive
assets or income sources are lost; people are relocated to environments where their
productive skills may be less applicable and the competition for resources greater;
community institutions and social networks are weakened; kin groups are dispersed; and
cultural identity, traditional authority, and the potential for mutual help are diminished or lost.
This policy includes safeguards to address and mitigate these impoverishment risks.9
97. The overall objectives of the Policy are given below.
Involuntary resettlement should be avoided where feasible, or minimized, exploring
all viable alternative project designs.
Where it is not feasible to avoid resettlement, resettlement activities should be
conceived and executed as sustainable development programs, providing sufficient
investment resources to enable the persons displaced by the project to share in
project benefits. Displaced persons should be meaningfully consulted and should
have opportunities to participate in planning and implementing resettlement
programs.
Displaced persons should be assisted in their efforts to improve their livelihoods and
standards of living or at least to restore them, in real terms, to pre-displacement
levels or to levels prevailing prior to the beginning of project implementation,
whichever is higher.
98. Since the proposed Project will be located within the property line of the GPS facility.
No requirements of land acquisition is expected and hence this OP is not triggered.
2.10.7 Forests (OP 4.36)
99. This Policy recognizes the need to reduce deforestation and promote sustainable
forest conservation and management in reducing poverty. The Bank believes that forests are
very much essential for poverty reduction and sustainable development irrespective of their
location in the world. The Bank assists borrowers with forest restoration activities that
maintain or enhance biodiversity and ecosystem functionality. The Bank also assists
borrowers with the establishment and sustainable management of environmentally
appropriate, socially beneficial, and economically viable forest plantations to help meet
growing demands for forest goods and services. The Bank does not finance projects that, in
its opinion, would involve significant conversion or degradation of critical forest areas or
9 Excerpts from WB OP 4.12.WB Operational Manual. December 2001.

Legal and Legislative Frameworks, Regulations and Policy Considerations
2-19
related critical natural habitats. Furthermore, the Bank does not finance projects that
contravene applicable international environmental agreements.
100. Though the proposed project will support some compensatory tree plantation, this
OP is not triggered since the project is not located in any forested area and will therefore not
have any direct or indirect impact on forests. The tree plantation will nonetheless be carried
out fully in compliance with the relevant paragraph of OP 4.36 on plantations (paragraph 7),
which states: “The Bank does not finance plantations that involve any conversion or
degradation of critical natural habitats, including in Project footprint or in Project influence
area with critical natural habitats. When the Bank finances plantations, it gives preference to
siting such projects on unforested sites or lands already converted (excluding any lands that
have been converted in anticipation of the project). In view of the potential for plantation
projects to introduce invasive species and threaten biodiversity, such projects must be
designed to prevent and mitigate these potential threats to natural habitats.”
2.10.8 International Waterways (OP 7.50)
101. Projects on International Waterways may affect the relations between the World
Bank and its borrowers, and between riparian states. Therefore, the Bank attaches great
importance to the riparian making appropriate agreements or arrangements for the entire
waterway, or parts thereof, and stands ready to assist in this regard. A borrower must notify
other riparian countries of planned projects that could affect water quality or quantity,
sufficiently far in advance to allow them to review the plans and raise any concerns or
objections. The project is located on the Shitalakhya River, which is a distributary of Old
Brahmaputra River, a tributary of Dhaleshwari River, both these rivers are located within
Bangladesh. In addition, there is no international traffic in Shitalakhya River. Therefore OP
7.50 is not applicable.
2.10.9 Access to Information
102. This BP deals with the World Bank policy on disclosure of information. It is a
mandatory procedure to be followed by the borrower and Bank and supports public access
to information on environmental and social aspects of projects.
103. Once finalized, the EIA including EMP and Bengali translation of its executive
summary will be disclosed to the public and will also be available on the official website of
the BPDB. EIA and EMP will also be sent to the WB InfoShop.
2.10.10 Applicable World Bank Policies
104. The project is classified as a Category A project, due to the complexity of
environmental issues associated with project activities involving major civil works by
repowering and decommissioning of existing boilers. Since the area is densely populated
and of ecological sensitivity, certain negative environmental impacts may occur during the
implementation and operational phase of the project. There may be localized impacts on the
natural habitats especially on the fish spawning areas close to the outfalls and jetty
renovation works.
105. The environment assessment (OP/BP 4.01) has been triggered for the proposed
operation. The status of the environmental and social safeguard policies of the World Bank
is summarized below in Table 2-2.

Legal and Legislative Frameworks, Regulations and Policy Considerations
2-20
Table 2-2: Triggering the World Bank Policies
Directive Policy Triggered Comments
Environmental Assessment
OP/BP 4.01
Yes As the Project falls into Category A, the present full EIA has been carried out.
Natural Habitats OP/BP 4.04
No Not triggered. Closed cycle cooling system and NOx control measures are proposed in repowering and hence no major impact expected in the natural habitats.
Pest Management
OP 4.09 No Not triggered. Because, no agro-chemicals will be used in any of the project activities or promoted
Indigenous Peoples
OP 4.10 No Not triggered since no Indigenous People or ethnic minorities are living in the area.
Physical Cultural Resources (PCR)
OP 4.11 No Not triggered. The Project will not affect any PCR, as the proposed repowering will be limited to the existing property line. However, ‘chance find’ procedures have been included in the environmental management plan (EMP).
Involuntary Resettlement
OP/BP 4.12
No Not triggered. No land acquisition is expected.
Forests OP/BP 4.36
No Not triggered since the project activities will not impact any forests or associated resources. However, a total of 25 trees will need to be cut in the proposed gas turbine location. Compensatory tree plantation will be carried out to mitigate this impact. This tree plantation will be carried out in accordance with the provisions of this OP (para 7).
Projects in International Waterways
OP/BP/GP 7.50
No The Project is located on Shitalakhya River, which is a distributary of Old Brahmaputra River, a tributary of Dhaleshwari River, both these rivers are located within Bangladesh. In addition, there is no international traffic in Shitalakhya River
Access to Information
Yes World Bank has developed a new approach to the disclosure of information, transparency and sharing of knowledge. The public will have access to a broad range of information about the project in preparation and implementation. The EIA report will be disclosed on BPDB website and also sent to WB InfoShop. Consultations have been held while conducting EIA. The first public consultation was held in Palash Upazila Convention Hall on 11 April 2015; 2nd Public consultation and disclosures will be carried out with the affected community after the submission of the draft EIA Report. The EIA Executive Summary will be translated in Bangla and will be placed on BPDB website and also in relevant offices in the project influence area, and will be sent to WB InfoShop.

Legal and Legislative Frameworks, Regulations and Policy Considerations
2-21
2.11 Bangladesh Standards and International Guidelines
2.11.1 ECR 1997 (as amended in 2005)
106. Under the Environment Conservation Rules of 1997 (as amended in 2005) the
government has promulgated environmental standards and they are in operation. The
standards have been defined for varying water sources, ambient air, noise, odor, industrial
effluent and emission discharges, vehicular emissions, etc. Under the rule, the government
imposes restrictions on the volume and concentrations of wastewater, solid waste and
gaseous emissions discharged into the environment. In addition, a number of surrogate
pollution parameters like biochemical oxygen demand, or chemical oxygen demand; total
suspended solids, etc. are specified in terms of concentration and/or total allowable quality
discharged in case of wastewater and solid waste. The standards, commonly known as
Environmental Quality Standards (EQS), are legally binding. The following standards will be
applicable to the project:
Schedule 2, Clause 12 (as amended in 2005): Air Quality Standards
Schedule 3, Rule 12: Water Quality Standards (A. Inland Surface Water Quality Standards (e) industrial use water including cooling and other processes, B. Potable water quality)
Schedule 4, Rule 12: Noise Quality Standards
2.1.1 WHO Guidelines
107. The World Health Organization (WHO) is the directing and coordinating authority for
health within the United Nations system. It is responsible for providing leadership on global
health matters, shaping the health research agenda, setting norms, standards, and guideline
values articulating evidence-based policy options, providing technical support to countries
and monitoring and assessing health trends.
108. WHO Guidelines relevant to the Project include:
Guideline values for drinking water
Air Quality Guidelines, 2005
Air Quality Guidelines for Europe, 2000 for risk estimates of asbestos
109. WHO also develops global guidelines such as the WHO Guideline on HIV/AIDS
which are also relevant to the Project.
2.11.2 WBG’s General Environment, Health and Safety Guidelines, 2007
110. The General Environment, Health, and Safety (EHS) Guidelines 10 contain the
performance levels and measures that are generally considered to be achievable in new
facilities or project by existing technology at reasonable costs.
111. The variables and the thresholds that are suggested in the EHS guidelines under the
four themes ‘environment, occupational health and safety; community health and safety and
construction and decommissioning’ have distinct merits and on several counts will
10 EHS Guidelines available at:
http://www.gcgf.org/wps/wcm/connect/554e8d80488658e4b76af76a6515bb18/Final%2
B-%2BGeneral%2BEHS%2BGuidelines.pdf?MOD=AJPERES

Legal and Legislative Frameworks, Regulations and Policy Considerations
2-22
complement and enhance the efficacy of the Bangladesh national environmental quality
standards as discussed above. However, there are some areas, for example,
communication and training, biological and radiological hazards with respect to occupational,
health, and safety; for which it will be an obligation on the part of the BPDB to take a
cohesive management approach. These Guidelines will be applicable to the Project.
2.11.3 WBG’s Environmental, Health, and Safety Guidelines for Thermal Power Plants,
2008
112. These guidelines include information relevant to combustion processes fueled by
gaseous, liquid and solid fossil fuels and biomass and designed to deliver electrical or
mechanical power, steam, heat, or any combination of these, regardless of the fuel type
(except for solid waste which is covered under a separate Guideline for Waste Management
Facilities), with a total rated heat input capacity above 50 Megawatt thermal input (MWth) on
Higher Heating Value (HHV) basis. 11 It applies to boilers, reciprocating engines, and
combustion turbines in new and existing facilities. Annex A of this guidelines contains a
detailed description of industry activities for this sector, and Annex B contains guidance for
Environmental Assessment (EA) of thermal power projects. Emissions and effluent
guidelines applicable to facilities with a total heat input capacity of less than 50 MWth are
presented in Section 1.1 of the General EHS Guidelines. Emissions and Effluent Guidelines
from this Guidelines will be applicable to this Project.
2.11.4 WBG’s Good Practice Note: Asbestos, 2009
113. The purpose of this Good Practice Note is to increase the awareness of the health
risks related to occupational asbestos exposure, provide a list of resources on international
good practices available to minimize these risks, and present an overview of some of the
available product alternatives on the market. Good practice is to minimize the health risks
associated with ACM by avoiding their use in new construction and renovation, and, if
installed asbestos-containing materials are encountered, by using internationally recognized
standards and best practices to mitigate their impact.
2.12 Public consultation and disclosure requirements by World Bank Group
114. The WBG reaffirms its recognition and endorsement of the fundamental importance
of transparency and accountability to the development process. Accordingly, it is Bank’s
policy to be open about its activities and to welcome and seek out opportunities to explain its
work to the widest possible audience. According to ‘OP 4.01: Environmental Assessment’ of
World Bank, the following conditions applies to the GPS Unit 4 Repowering Project.
115. Consultations. For all Category A (e.g., GPS Unit 4 repowering) and B projects the
borrower should consult the project-affected groups and local nongovernmental
organizations (NGOs) about the project's environmental aspects and takes their views into
account. The borrower should initiate such consultations as early as possible. For Category
A projects, the borrower should consult these groups at least twice: (a) shortly after
environmental screening and before the terms of reference for the EIA are finalized; and (b)
once a draft EIA report is prepared. In addition, the borrower should consult with such
groups throughout project implementation as necessary to address EIA-related issues that
affect them. In line with these requirements, extensive consultations have been carried out in
the project area; details are presented in Chapter 14 of this document.
11 Total capacity applicable to a facility with multiple units.`

Legal and Legislative Frameworks, Regulations and Policy Considerations
2-23
116. Disclosure. For a Category A project, the borrower should provide relevant
information on project interventions in a timely manner prior to consultation and in a form
and language that are understandable and accessible to the groups being consulted. The
borrower should provide a summary of the proposed project's objectives, description, and
potential impacts for the initial consultation. For consultation after the draft EIA report is
prepared, the borrower should provide a summary of the EIA's conclusions. In addition, for a
Category A project, the borrower makes the draft EIA report available at a public place
accessible to project-affected groups and local NGOs. The borrower also ensures that EIA
reports for Category A project are made available in a public place accessible to affected
groups and local NGOs. The document needs to be translated into Bengali. Public
availability of the EIA report for Category A project in the borrowing country and official
receipt by the Bank are prerequisites to Bank appraisal of these projects.
2.13 Harmonized Environmental Safeguard Requirements of the GoB and the WBG
117. In view of the possibilities of support from the World Bank, the environmental
assessment of the Project will need to satisfy the requirements of the Government as well as
those of WBG. It is appropriate therefore to develop a harmonized environmental safeguard
framework for conducting the EIA study for the GPS Unit 4 Repowering project. Accordingly,
a harmonized environmental safeguard framework is developed and presented in Annex 2-1.


3-1
3. Project Data Sheet
3.1 Project Proponent
118. The Proponent of the Project is the Bangladesh Power Development Board (BPDB),
established in 1972 as an autonomous body and one of the major power generation wings of
the Ministry of the Power, Energy and Mineral Resources (MoPEMR) of the Government of
Bangladesh.
3.2 Project Location and Area
119. Ghorashal Power Station (GPS) is located in Palash Mauza of the Ghorashal
Municipality under Palash Upazila of Narsingdi district (Figure 3-1). The site is located at 4.2
km northeast of the Ghorashal Municipality Office, 4 km northeast of the Railway Bridge and
3.7 km northeast of the Palash Upazila Headquarters. The site is aerially 36 km northeast of
Dhaka Zero Point (Table 3-1 and Figure 3-2). The major point sources of pollution around
the Project site is shown in Table 3-2. Details of the emissions of pollutants are given in
Section 7.10 for the considered sources for air quality modelling activities.
120. The site is located at around 23°58′52.9″ N latitude and 90°38′13.5″ E longitude
within the boundary of the GPS on the left bank of the river Shitalakhya and on the northwest
side of the Palash-Issakhali Road.
Table 3-1: Aerial distances of different facilities from the proposed project location
Sl. No.
Facility Name Distance (km) Sl. No.
Facility Name Distance
(km)
1 Ghorashal Municipality 4.2 11 Gazaria Union HQ 7.2
2 Palash Upazila HQ 3.7 12 Panchdona Union HQ 7.8
3 Jinardi Union HQ 6.6 13 Panchdona Road Morr 10.0
4 Bahadursadi Union HQ 2.7 14 Railway line 4.6
5 Jamalpur Union HQ 2.5 15 Zero point at Dhaka 36.0
6 Moktarpur Union HQ 3.1
16 Shahjalal International
Airport 28.0
7 Char Sindur Union HQ 4.2 17 Aggreko Rental Power 0.404
8 Tongi Power Station 24.7 18 Max Power Station 0.373
9 Regent Power 1.175 19 Ghorashal Fertilizer 0.895
10 Palash Fertilizer 0.936
Source: Imagery and NWRD using GIS tool
Table 3-2: Major point sources of pollution around the Project site
Sl.
No. Name/Type of Industry/Pollution Source
Within Aerial Distance from
the Plant Location
1 Ghorashal Fertilizer Factory 1 km
2 Palash Urea Fertilizer Factory 1 km
3 Ghorashal 108 MW Rental (Regent) Power plant 1 km
4 Max Power Plant 1 km
5 Aggreko Power Plant 1 km
6 Janata Jute Mill 5 km
7 Pran Agro Food Processing Industry 5 km

Project Data Sheet
3-2
Sl.
No. Name/Type of Industry/Pollution Source
Within Aerial Distance from
the Plant Location
8 Siam Bangla agro Industry 5 km
9 Deshbandhu sugar mill 5 km
10 Gazi Textile 5 km
11 Brick Field (7 nos.) 5 km
12 Brick Field (31 nos.) 10 km
13 N I N Embroidery 10 km
14 Master Cement Paper Mills ltd 10 km
15 Bandhob Textile 10 km
16 GHB Glassware 10 km
17 Mom Tex Ltd. (Pakiza) 10 km
18 Ishaque Textile Ltd. 10 km
19 Hamid Fabrics ltd. Unit-2 10 km
20 Hamid Weaving Mills Ltd. 10 km
21 Tazrian Weaving Mills Ltd. 10 km
22 Abdullah Dyeing 10 km
23 R K Dyeing 10 km
24 Chondrima Textile 10 km
25 Akhondo Textile 10 km
26 Talukder Textile 10 km
27 Sakibul Textile 10 km
28 Samiul Textile 10 km
29 Pran RFL 10 km
30 Pubali Jute Mill 10 km
31 Seven Rings cement 10 km
32 Mahim ceramics 10 km
Source: Development of GIS based industrial database of the DoE, 2015 (Ongoing)
121. The current boiler (Boiler no. 4: Russian made TGME-206-COB) of Unit 4 will be de-
commissioned. For storing the decommissioned boiler components, space will be required
close to the boiler. The warehouse beside Unit-4 will be dismantled. The present steam
turbine (ST) will be overhauled and retrofitted. The proposed Gas Turbine (GT) and the Heat
Recovery Steam Generator (HRSG) will be installed at the northern side of the Unit 4 boiler.
The new equipments will be sited in the 8 acres of land designated for the repowering work,
which is now covered by grasses and bushes and occupied by some old warehouse
structures. The land belongs to BPDB and is within the boundary of the GPS, hence, no new
land acquisition is required. There are a number of other major point sources in the airshed
and the details are provided in Section 7.22.1 and their distance from GPS is presented in
Table 3-2.
122. Installation of major components of the proposed repowering of Unit 4, will require a
land space with 55 m width (27.5 m on either sides of the stack) and 223 m length from the
northeast side of the existing stack (Figure 3-3).

Project Data Sheet
3-3
Figure 3-1: Base map of the study area showing the proposed Project site

Project Data Sheet
3-4
Figure 3-2: Distances of administrative units from the proposed site

Project Datasheet
3-5
Figure 3-3: Major components of Unit 4 repowering

Project Datasheet
3-1
3.3 Project Impact Area
123. Siting of project components will require 55m x 223 m land within the GPS property
boundary. The Department of Environment (DoE) requires a 10 km radius area as minimum
centering the stack location of the proposed repowering plant. This 10km radius is used for
environmental quality baseline and ecology and fisheries impact assessment. In the
cumulative impact assessment, an airshed of 50 km x 50 km is considered centering the
stack of Unit 4 for air quality impact, water quality impact in the Shitalakhya, and water
demand assessment.
3.4 Nature and Size of the Project
124. The project involves decommissioning of the existing Unit 4 boiler (Russian made
TGME-206-COB) The nature of the proposed Project is a retrofitted/ refurbished combined
cycle power plant with an HRSG having supplementary firing facility and a 246 MW Gas
turbine with dry-low NOx burners- a fuel NOx control technology. The power generation
capacity of the proposed Project after refurbishment will be 403.5 MW.
3.5 Project Concept
125. The proposed Project is a repowering of 210MW gas-fired steam power unit to a
403.50MW combined cycle power unit by installing one heat recovery steam generator
(HRSG) with supplementary firing, one heavy duty gas turbine (GT) for indoor installation
(GE 9FB version 2003 Frame F) and retrofitting/refurbishing the existing steam turbine (ST).
The hot exhaust gas of GT will generate steam in HRSG which will be directed to the
retrofitted/refurbished steam turbine making combined cycle plant output to 403.50MW.
About 67.3 MMSCFD natural gas for the proposed gas turbine and supplementary firing will
be supplied by Titas gas transmission and Distribution Company through the existing gas
network and the proposed Regulating Metering Station (RMS).
126. The surface water from the Shitalakhya River will be used for closed-cycle cooling
(cooling water of 0.38194 m3/s), auxiliary cooling (0.06528 m3/s), other plant use (0.00742
m3/s, HRSG (0.01083 m3/s) etc.
127. Generated Power of gas turbine will be evacuated through the proposed 230kV Gas
Insulated System (GIS) switchyard and that of steam turbine will be evacuated through Bay
No. 6 of the existing 230 kV Air Insulated System (AIS) switchyard.
3.6 Project Components
3.6.1 Decommissioning of Existing Boiler
128. The existing steam boiler of TGME-206C0b type, made at Taganrog Manufacturing
plant is of drum type with two-stage evaporating system. The boiler is mainly fired with
natural gas and equipped with two rotating air heaters and flue gas recirculation. The high
pressure water-steam loop encompasses an economizer, a HP drum, HP evaporator,
a low temperature ceiling super heater (SH), a radiant wall SH, a platen SH and a
convective final SH. Between each SH stage injection coolers control the steam
temperature. After the HP steam passed through HP turbine, the steam (cold re-heat steam)
is returned to the intermediate pressure (IP) boiler. Steam is reheated in two steps: (a) an
injection cooler controls the steam temperature between step one and two and (b) reheated
(hot- heat steam) returns and passes through IP and LP turbine. LP steam is condensed in
the condenser and returned back to economizer of the boiler through condensate and feed

Project Description
3-2
water cycle. The boiler has a left and right part which are clearly separated, without any
cross-linking. The boiler has 2 layers with 6 back side gas burners installed. The air pre-
heater is situated after the rotating type economizer (end of boiler). After air pre heaters flue
gas passes to atmosphere through a 60 meter high stack. A boiler decommissioning plan is
prepared and presented in Vol. 3. The hazardous waste generated from the boiler
decommissioning will be treated as per the WBG General EHS Guidelines, 2007 and WBG’s
Good Practice Note: Asbestos: 2009.
3.6.2 Power Generation
129. The power plant mainly consists of one heavy duty 246 MW gas turbine (GE Frame
F) for indoor installation, one heat recovery steam generator (HRSG) with supplementary
firing for outdoor installation and one condensing type 165 MW retrofitted/refurbished steam
turbine for indoor installation (1:1:1 configuration). Other significant components are surface
water intake and outfall, effluent treatment plant, generator switch gear, gas insulated
system (GIS) and air insulated system (AIS) sub-stations, air supply system, emergency
diesel generating set, etc. Electricity is expected to be produced at the rate of 2448.5
GWh/year at 70% plant factor. The main plant consists of three interconnected structures
namely one gas turbine building, HRSG structure, and steam turbine building. Emission
factors for gas turbine for CO and NOx are taken from USEPA AP 42, 5th Edition and for
PM10 and PM2.5 are taken from National Energy Technology Laboratory, United States
Department of Energy. Emission factors for CO and NOx are considered as 14.3 lb/MMSCF
and 94.1 lb/MMBTU, respectively. On the other hand, emission factors for PM10 and PM2.5
are considered as 0.00259 lb/MMBTU and 0.00017 lb/MMBTU, respectively. More detailed
information is presented in Section 7.10. Specifications of the Gas Turbine are as follows:
Baseload Efficiency (%): 38.3 simple cycle, 59.3 combined cycle (109FB)
Emissions: 50 mg/Nm3 NOx (at 15% O2), 30 mg/Nm3 NOx (at 15% O2) option
Emission compliant turndown (% CC baseload): 45%
Start time (minutes for CC hot start): 35 minutes
Combustion Interval (hours/starts): 12k/450
HGP Interval (hours/starts): 24k/900
Major Interval (hours/starts): 48k/1800
Rotor Maintenance (hours/starts): 144k/5000.
3.6.3 Heat Recovery Steam Generator (HRSG)
130. An HRSG consist of four major components: the economizer, evaporator, super-
heater and water pre-heater. It has a steam drum and an evaporator where water is
converted into steam. In horizontal type HRSG, the exhaust hot gas of GT flows horizontally
over vertical tubes and through main stack to the atmosphere and generates high pressure
(HP) superheated steam. This steam is then directed to the steam turbine to spin it and
generate electricity.
3.6.4 Deaerator
131. A deaerator is a device used for removing oxygen and other dissolved gases from
the feed water of a steam-generating device. The current Hydrazine based treatment of
feedwater will be replaced by more environment friendly chemicals, as explained in earlier
Section. The horizontal tray-type deaerator has a vertical domed deaeration section

Project Description
3-3
mounted above a horizontal feed water storage vessel. Feed water enters the vertical
deaeration section above the perforated trays and flows downward through the perforations.
Low-pressure deaeration steam enters below the perforated trays and flows upward through
the perforations. The steam causes the dissolved gases to release and exit via the vent at
the top of the domed section. It may be mentioned that in the existing plants (other than Unit
4), the replacement of hydrazine will not be immediately possible because of the existing
stock and disposal of them may be a critical issue. All the Units in GPS are expected to be
progressively repowered and hydrazine will be phased out.
3.6.5 Turbine and Auxiliaries
132. A turbine is a rotating machine that extracts energy from a fluid flow and converts it
into useful work. Moving fluid acts on its blades and impart rotational energy to the rotor. The
rotor drives the mechanically coupled electrical generator and thus, generates electrical
power.
a) Steam Turbine
133. The steam generated in a boiler or HRSG is delivered to the steam turbine that
extracts thermal energy from pressurized steam and causes rotation of its shaft that drives
the mechanically coupled electrical generator and thus, generates electrical power. Exhaust
steam living the steam turbine is condensed in the condenser. The condensate is then
pumped from the condenser hot well by condensate extraction pumps to the deaerator inlet
of the boiler or HRSG and thus completing the feed water-steam cycle.
b) Gas Turbine
134. A gas turbine is a type of internal combustion engine that has an upstream rotating
compressor coupled with a downstream turbine and a combustion chamber in-between. In
the combustor gas is mixed with compressed air and is ignited. The hot gas thus produced is
directed to the turbine blades where it expands and loses energy. This loss of energy is
ultimately converted to electrical power through the rotation of the turbo generator.
3.6.6 Exhaust system and stack
135. Gas turbine unit shall be equipped with an exhaust duct and a suitable bypass stack
with hydraulic diverter damper for prolonged continuous simple cycle operation. The exhaust
system shall have a silencer to reduce the sound level of 65 dB when measured at a
distance of 100 meter from the plant operating at full load. The duct shall be supplied
complete with all necessary expansion joints thermal and acoustic insulation, manholes,
drains, supports, bolting and jointing. It shall be arranged in such a way that normal
maintenance can be carried out on any component without dismantling the duct. A 50 m
stack height with 3 m inner diameter is considered in the design. The exhaust flow at the
stack is considered as 176.75 m3/s and flue gas temperature is 90.80 C.
3.6.7 Cooling System
136. Condenser cooling system of a thermal power plant is either of closed cycle or of
open cycle system. Existing cooling system is open cycle (once through cooling) for which a
large quantity of water is required. On the other hand, the closed cycle cooling system (with
cooling towers) requires lesser quantity of water but it has associated cost involved.
Temperature increase by thermal discharge from cooling system of Unit 4 is currently
violating WBG Guidelines in the thermal plume zone of influence. Based on water balance
analysis and water quality information in Shitalakhya River, quantity and quality of water will

Project Description
3-4
not pose any immediate threat to the repowering Project. However, closed cycle cooling
system is considered to bring the Unit under compliance with WBG Effluent Guidelines.
137. It has been found from our study that there will not be any shortage of water in the
Shitalakhya River during the plant life of the project. Though environmental flow for the river
during dry season may get shortfall by only about 10% after withdrawing of required water
for whole GPS (details of e-flow is given in Section: 7.22.3). On the other hand, the water
quality cannot be ensured suitable for Plant intake, because Shitalakhya River flows through
an industrial area. There are many industries on both banks of Shitalakhya and many more
will come. So, a realistic regulation of industrial waste disposal in the river cannot be
ensured.
3.7 Resources and Utility Demand
138. Resources required to develop the project include soil, construction material,
manpower etc. The site is a part of the existing power plant and of the same level, therefore
will need only minor earth dressing. Local construction material will be used for the proposed
project and the project will provide employment opportunity for unskilled, semi-skilled and
skilled categories. Employment opportunities will be available with the start of construction
activities and continue through the operation phase, mainly in service sector.
139. Electricity demand during construction phase will be met by the existing sub-station
and distribution facility. During the construction period, water can be fetched from the nearby
Shitalakhya River and drinking water can be drawn from underground sources such as Deep
Tube well. Natural gas as fuel will be available under the existing allocation of the Petro
Bangla from nearby Regulating and Metering Station (RMS) for Units 3 and 4. Waste will be
disposed of in the approved designated site preferably apart from the Plant site.
140. For reducing the outage time of the existing power station during construction period
of the new gas turbine, the Gas Turbine Generator and HRSG shall be installed first at the
north side of Unit 4 for full repowering. The old existing control system of the target unit shall
be completely replaced by new state-of-the-art control system during shutdown of the
concerned unit for interfacing between existing and new system.
141. A temporary sanitation facility for the workers during pre-construction and
construction phases will be developed with septic tank with adequate capacity. The
sewerage system will be connected to the existing facility.
142. A temporary road and drainage system will be developed in addition to the existing
system until a final road and drainage system is designed and developed.
3.8 Source of Natural Gas and Quality
143. At present the gas is supplied to the Ghorashal Power Station by the Titas Gas
Transmission and Distribution Co. Ltd (TGTDCL) of Petro Bangla through a 16˝ diameter
pipeline and a Regulating and Metering Station (Titas RMS) situated at the Northeast corner
of the GPS complex. The fuel gas is supplied under a contract for 190 MMSCFD. The
contract needs to be reviewed and enhanced to meet the future demand of gas.
144. In the existing distribution system, Gas from Titas RMS flows to the gas distribution
Plant (GDP 1-5) via gas metering and regulating sections through a 1.8 Km long 10˝ dia
pipe. The gas through GDP-2 goes to Boiler 3 and 4.
145. The proposed Gas Turbine needs a stable gas pressure of 30 bar and hence
installation of gas booster has been proposed. Due to the space restriction in the existing

Project Description
3-5
Titas RMS a new gas station will be required to be installed in the space available at the
Northeast of the unused fuel oil tanks, i.e., at the Northwest of the proposed HRSG site. A
16˝ diameter gas pipeline from inlet header of the Titas RMS up to the bus of the proposed
gas station mentioned above is to be constructed. From this bus, a number of gas pipelines
will be branched out and will lead through individual gas compressor and associated facilities
to the individual unit to be repowered. Existing and proposed gas supply arrangement are
presented in Figure 3-5 and Figure 3-6 and the composition of gas used in the plant is
presented in Table 3-3.
Table 3-3: Gas analysis report
Gas Composition % Mole
Nitrogen 0.788
CO2 0.008
Methane 97.644
Ethane 1.544
Propane 0.006
Normal Butane 0.002
Hexane Plus 0.008
Source: Bangladesh Gas Fields Company Ltd. Ref. Letter No: 105.0000.020/2011/03
3.9 Pipelines for Natural Gas and new Gas Regulating and Metering System
146. At present the gas is supplied to Ghorashal Power Station from Titas Gas
Transmission and Distribution Company Ltd. (TGTDCL). A Gas transmission line
constituting 46.31 km distance from Titas field through one DN16 diameter pipeline with
1,000 psi pressure come to Narsingdi. From Narsingdi VS#12, 2 nos. DN 14 of 23.31 km
transmission line with the same pressure of 1,000 psi connect to a Regulating & Metering
Station (RMS) situated at the north east corner of the Ghorashal Power Station (Figure 3-4).
Gas inlet pressure of Titas RMS varies from 420 psi to 600 psi. This pressure is likely to
decrease in future. The proposed GT needs a stable gas pressure of 460 psi and hence
installation of a gas booster has been proposed. Due to the space restriction in the existing
Titas RMS, a new gas station is needed and will be installed in the space available at the
Northeast of the unused fuel oil tanks, i.e., in the Northwest of the proposed HRSG site. A
16˝ diameter gas pipeline from inlet header of the Titas RMS up to the bus of the proposed
gas station will be constructed. From this bus, a number of gas pipelines will branch out and
will lead through individual gas compressors and associated facilities to the individual unit to
be repowered. Compressor fouling is a common event and dependent on the quality of the
ambient air, the quality of the inlet filters, and the washing regime. The gas booster will be
installed within the property line of GPS and no new land acquisition is required. The new
RMS is included in the bidding document for Unit 4. This will be constructed by the EPC
contractor with supervision of the Gas supplier TGTDCL. This RMS will be within the
Ghorashal boundary and adjacent to the existing RMS.

Project Description
3-6
Figure 3-4: Gas transmission network

Project Description
3-7
Figure 3-5: Existing Ghorashal gas connection system
Figure 3-6: Proposed new gas supply connection system

Project Description
3-8
3.10 Project activities and schedule
147. There are two main project activities, (a) Decommissioning of existing Boiler and (b)
Full Repowering of Unit #4. The main activities of decommission of boilers are dismantling of
the following: Heavy boiler drum, Economizer, Water tubes, Steam pipes, FD, ID &
recirculating Fans, Chimney, Air ducts, etc., Insulation sheets and material, and demolishing
of the foundations. Detailed activities for the decommissioning of boiler is presented in Table
3-4. On the other hand, main activities related to full repowering are: commissioning of Gas
Turbine, construction of HRSG, rehabilitation of Steam Turbine, replacement work of existing
old control system of STG and interfacing of control system, interfacing of control system of
the combined cycle power plant, and commissioning of HRSG & STG. Detailed activities and
time Schedule for completion of repowering is presented in Figure 3-7.
Table 3-4: Activities for Demolishing Boiler #4
Sl Description
1
Remove the insulation from all around the boiler, segregate asbestos containing
material, pack and store them at the designated place and final disposal to on-site
asbestos pit
2 Disassemble the air ducts, bring down and store them at the designated place
3 Disassemble the Gas recirculation ducts/ gas ducts, bring down and store them at the
designated place
4 Disassemble the RAH, bring down and store them at the designated place and
remove the foundation
5 Disassemble and remove the chimney and remove the foundation
6 Remove the FD fans, ID fan & Gas recirculation Fans and store them at the
designated place and remove the foundation
7 Disconnect all pipes to and from the boiler drum
8 Disconnect the down corner pipes from boiler drum and from water wall headers
down and bring them down and store them at the designated place
9 Bring down the boiler drum and store them at the designated place
10 Disconnect the feed water pipe from the economizer with proper support
11 Dismantle, bring down the economizer and store them at the designated place
12 Disconnect the miscellaneous pipes
13 Disconnect interconnection between headers of different super heater coils and
reheater coils
14 Disconnect the Main Steam pipes line, reheater inlet and outlet pipe lines providing
proper supports
15 Remove the ceiling super heater and store them at the designated place
16 Remove the other super heater coil (SH & RH) and store them at the designated
place
17 Remove the Boiler condenser (Right & Left) and store them at designated place
18 Remove the Steam super heater (Right and Left) and store at the designated place
19 Remove the water walls and store them at the designated place
20 Remove the scaffoldings, stairs etc. and store them at the designated place
21 Remove the supporting structures, if necessary and store them at the designated
place
22 Remove the foundations of Boiler, if necessary.

Project Description
3-9
Notes: D: Design, M: Manufacture, Tr: Transportation, E: Erection, and T: Testing
Figure 3-7: Detailed activities and schedule of boiler decommissioning and
repowering

Project Description
4-10
4. Project Description
4.1 Overview of Existing Facility
148. The Ghorashal Power Station (GPS) is a major power generation center of
Bangladesh Power Development Board (BPDB) located on the eastern bank of river
Shitalakhya in the Palash Upazilla of Narsingdi District. Currently, it has six generating units
with a nominal generating capacity of 950MW (2x55 MW and 4x210 MW) based on gas fired
conventional steam turbine technology. The average efficiency of the units at is around 31%
which is quite poor compared to the efficiency of around 55% for the modern combined cycle
power plants.The purpose of the current project is to repower Unit 4 (nominal capacity of 210
MW) of Ghorashal power station. The project involves the repowering of the current steam
plant with a more efficient combined cycle plant. As part of the new plant, a gas turbine will
be installed and the present boiler will be replaced by a HRSG (Heat Recovery Steam
Generator).
Boiler Turbine Hall

Project Description
4-11
Effluent Canal Stack
Irrigation Canal Waste disposal site
Figure 4-1: Major equipments in Unit 4
4.1.1 Description of Existing Unit 4 Boiler
149. The existing boiler of Unit 4 is a conventional drum boiler and is fired with natural
gas. The boiler was designed and built by Taganrog (a Russian Manufacturing Company)
and is a type TGME-206 COB. The boiler has two rotating air heaters and flue gas
recirculation. The high pressure water-steam loop encompasses an economizer, a HP drum,
HP evaporator, a low temperature ceiling super heater (SH), a radiant wall SH, a platen SH
and a convective final SH. Between each SH, stage injection coolers control the steam
temperature. After the HP steam passes the HP turbine, the steam returns to the boiler as
intermediate pressure (IP) steam and is reheated in two steps. An injection cooler controls
the steam temperature between step one and two. Boiler materials and design conditions
are presented in Table 4-1.

Project Description
4-12
Table 4-1: Boiler materials and design conditions
Component Dimensions
(mm) Material
P op (bar)
T design Medium (°C)
HP BOILER Inlet header economizer 219×26 CS
Economizer tube size 28×4 CS 157.8927 344
Outlet header economizer 219×36 CS Steam Drum
High Strength
Steel 154.95
Inside diameter 1,600 Thickness 112 Length of drum 225,000 Down comer
157.89 345
Vertical Tube 465×40 CS Lower Header tube 159×15 CS Water wall tube 60×60 CS 156.912 405
Transfer line eco outlet header to Steam Drum 108×12 CS
Radiant SUPERHEATER(SH)
154.95 525
Vertical Header 159×18 Alloy steel U- shaped tube size 42×5 Alloy steel Platen SUPERHEATER(SH)
149.06 561
Headers 159×18 Alloy steel U-shaped vertical tube size 32×5 Alloy steel Celling SUPERHEATER(SH)
Steel-20
Inlet Header 219×36 Tube size(front block) 32×5
156.912 Tube size(rear block) 32×5
Saturates Steam Header 159×15 CS
Tube size 60×6 CS
150. The boiler drum is made of high strength alloy steel with an operating capacity of 640
ton/h, inner diameter 1.6 meter, wall thickness of 0.112 meter, and length 24.31 meter. The
water Wall is made of Steel 20 and Boiler Condenser is made of carbon steel. Chemical
compositions of the boiler drum, water wall and boiler condenser are presented in Table 4-2.
The boiler has numerous pipes, Table 4-3 presents component-wise number of piping.
Table 4-2: Chemical compositions of boiler drum, water wall, and boiler condenser
Element Chemical Composition in %
Boiler Drum Water Wall Boiler Condenser
Alloy Steel Steel 20 Carbon Steel
C 0.17 0.2 0.2
Mn 0.92 0.43 0.47
Si 0.2 0.21 0.26
P 0.005 0.008 0.008
S 0.019 0.018 0.012
Cu 0.14 0.1 0.15
Ni 1.06 0.12 0.19
Cr 0.2 0.18 0.09
Mo 0.47 Fe 3.184

Project Description
4-13
Table 4-3: Number of piping of the boiler
Water wall 640 tubes
Back wall 224 tubes
Each platen has 2 header
Front wall 224 tubes
16 u-shaped vertical coils
Side (left) wall 96 tubes Ceiling Superheater
Side (Right) wall 96 tubes
8 front blocks
Radiant Superheater
8 rear blocks
Six blocks
Front block consist of inlet header 219*366mm
2 blocks each on front wall and rear wall
32*5mm tubes
1 blocks each on side wall Economizer
Each block contains of 2 vertical header
2 parts
19 u-shaped coil
Each parts is made of 8 blocks
Platen Superheater
Upper header transfer the load to 32 suspension tubes
24 platen arrange in one row
151. The boiler consists of various insulation materials such as mineral wool, glass fiber,
asbestos, aluminum powder, glass, and steel. A partial list of insulation materials were
retrieved from the erection reports available in the GPS library and are presented in Table
4-4. However, even after extensive search and consultation with GPS staffs, the full-list of
the boiler materials was not available. The feasibility study report also did not account the
insulation materials. Hence, it is recommended that the boiler decommissioning contractor
make an estimate of the full-list with quantities.
152. The standards of asbestos for the ambient air12 are: (i) at outdoor: an average of
3x10⁻⁵ fibers per cubic centimeters (f/cc) for fibers >5 microns; (ii) at indoor: concentrations
of fibers > 5 microns generally average about 5x10⁻⁵ to 2x10⁻⁴ (f/cc), with an overall average
of about 1x10⁻⁴ f/cc (U.S EPA, 2013); for occupational health13 0.1 f/cc of air at eight (8)-
hour -weighted average and (ii) 1.0 f/cc at 30 minutes weighted-average (29 CFR,
1910.1001, n.d.); for drinking water14 the maximum contaminant level (MCL) for asbestos is
7 million fiber per liter (MFL) for fibers >10 microns (ATSDR, 2014).
Table 4-4: List of insulation materials (partial)
Materials used Possible use Unit Quantity
Mineral Wool Insulation m3 2729.06
Glass-Fabric Insulation m3 1459.3
Asbestos15 Insulation tons 17.67
12 U.S EPA (2013). Summary of Published Measurements of Asbestos Levels in Ambient Air.
Retrieved from http://www2.epa.gov/sites/production/files/2013-
08/documents/libbyasbestos_ambientairlitsearch5-20-2013.pdf
13 OSHA (n.d.). 29 CFR, 1910.1001(c)(1) and 1910.1001(c)(2): Asebstos. Retrieved from
https://www.osha.gov/pls/oshaweb/owadisp.show_document?p_table=STANDARDS&p_id=9995
14 ATSDR (2012). Asbestos Toxicity. Retrieved from
http://www.atsdr.cdc.gov/csem/asbestos_2014/docs/asbestos.pdf
15TOR states that the total quantity of asbestos is about 50 tons. However, the Consultant was not able to get any
reference of this quantity.

Project Description
4-14
Materials used Possible use Unit Quantity
Zinc-Coated Sheet Steel
Insulation/cladding/making and installing diaphragms
tons 276.45
Carbon Steel Supporting structures/making and installing small structures
tons 9.43
Alloyed Steel Supporting structures/making and installing small structures
tons 9.83
Aluminium Powder Cladding kg 197.5
Sovelite Slab Insulation m3 11.52
Steel Braided Net (Zinc Coated) Making frame
m2 13825
Glass Twisted Complex kg 287.6
Glass Canvas m3 61.34
Glass Fibric (Length) m 13192
Steel tons 3.6447
Others kg 86.4
Source: TPP Ghorashal, 2ndPhase, Unit4, Working Project of Heat Insulation Code: 087-04-11-TN;
Book-I- Explanatory Note.
153. The existing boiler has now become old and is not repairable for the proposed
repowering project. It is therefore redundant and has to be demolished and removed. The
boiler plant and associated parts will be removed one by one and stored at temporary sites
before being transported to the final disposal site and/or collected by recycling companies.
There is sufficient space available in the northwestern side of the existing boiler, the area is
mostly covered with grass and bushes and is marked as laydown area in Figure 4-3. Further
northeast some temporary old warehouse structures may be demolished and used as a
designated site for temporary storage of decommissioned materials. However, the
decommissioning contractor is responsible for dismantling the boiler in consultation with the
GPS authority. The GPS authority will make the final decisions on the location of the
temporary storage areas. The last item in the decommissioning work is the demolishing of
the boiler foundations. It is estimated that it will take about 6 months to demolish and remove
the existing boiler and this is critical to the implementation of inter-connection of the 210MW
Steam Turbine with the heat recovery boiler. Proper precautions need to be taken by
workers who will dismantle and remove heavy parts during the decommissioning phase.
There are always risks involved in decommissioning projects, but they can be minimized and
mitigated through proper training and by taking all necessary precautions.
154. Proper sequence of dismantling is considered very important. For example, air ducts
are to be dismantled first, so that parts that are higher up can be brought down. The stack
should be demolished before other sections to make space for the crane to enter in to
strategic points to reach the super structures. Precautionary measures must be adopted by
the EPC contractor at the time of implementation of the project; and bidders will be required
to submit their proposal taking into consideration adequate safety measures and the time
frame. During dismantling the boiler dust from breaking of insulation, flume from cutting
different pipes and other pollutants maybe emitted. The release of toxic substances such as
asbestos will have to be carefully monitored and controlled.
4.1.2 Existing Steam Turbine
155. The existing steam turbine Type K210-130-3 of Unit-4 is designed and built by LMZ
(Russian Manufacturer). It consists of an HP cylinder, an IP cylinder and a double LP
cylinder. The HP and IP cylinder are in opposite positions to balance the axial force from the
pressure differences. There are two condensers placed at the bottom of the LP Cylinder.

Project Description
4-15
The turbine is provided with an electro hydraulic governing system. The blades are mainly of
the impulse type. The principal characteristics of the steam turbine are presented in Table
4-5.
Table 4-5: Characteristics of existing steam turbine
Steam consumption at 210 MW (t/h) 636 (~177 kg/s)
Steam consumption in condenser at 210 MW (t/h) (with normal steam extraction for e.g. Pre-heaters)
423 (~118 kg/s)
Pressure of HP steam (bar) 130
Temperature of HP steam (°C) 540
Pressure of IP steam (bar) 25.8
Temperature of IP steam (boiler outlet) (°C) 540
156. The HP turbine is equipped with 12 stages, including the control stage and four
control valves in a common steam chest. The IP turbine consists of 11 stages including the
control stage and four control valves in a common steam chest. The LP turbine consists of
two sections with four stages. The total shaft train (including generator) has seven radial
journal bearings and one thrust bearing, located between the HP and IP turbine. Coupling
between HP and IP turbine is a bolted, rigid, and flange type coupling. The connection
between IP and LP turbine consists of a flexible type coupling connected with keys on the
journals. The coupling between LP turbine and generator is a fixed bushing connected with
keys on the journal ends. The bushing is separable at the bolted flanges and contains the
turning gear wheel.
Figure 4-2: An inventory of maintenance and outage items
157. A graph of the inventory of maintenance and outage items for the period 2000- 2011
is shown in Figure 4-2. The graph shows that the “bearings” and “expansion” are the
frequently responsible for Unit 4 outage. It has been noted that Unit 4 has also substantial
condenser problems, as can be seen by the replacement with (new tubes in the turbine hall).
In Unit 4 approximately 30% of turbine condenser tubes had already been blocked due to

Project Description
4-16
leakage. Frequent Turbine condenser leakage of this unit has resulted in high hardness of
condensate water. Boiler dismantling should be synchronized to clear the site and steam
pipes to and from turbine should be cut and isolated at the entrance point of turbine hall to
be welded with the new pipes of HRSG.
158. A technical issue of repowering is that in an existing power plant, the amount of
steam in the steam turbine is decreasing from the high pressure part to the low pressure part
because of the extraction of steam. In a modern combined cycle steam turbine, the amount
of steam is increasing from high to low pressure due to the two/three pressure operation in
the HRSG. For Unit 4, this means that after repowering the electrical output of the steam
cycle will decrease by approximately 10%. In this perspective, the Feasibility Study
conducted some back calculations taking into considerations the design parameters from the
manual. The results are presented in Table 4-6 (data sourced from the manual is underlined).
Table 4-6: Indicative process values back calculated from the manual on existing
steam turbine
Steam flow Situation Power max MW
Flow steam P- chamber ~bar % (%) kg/s (t/h)
100 (105.3) Max 215 186 (670) 98
95 (100) Nominal 210 177 (636) 88
92.5 (97.5) HP bleeds
closed 200 172 (620) 84
88.7 (93.4) LP bleeds
closed 184 165 (594) 77
80.7 (85.0) HP/LP bleeds closed
175 150 (541) 64
159. The calculations show that the LP steam turbine can consume about 150 kg/s steam
as the amount of HP steam is about the same as the input amount of the LP turbine while
the bleeds are closed. In normal (nominal) situation with the bleeds open the end of the LP
turbine will consume about 122 kg/s steam.
160. The capacity of 150 kg/s steam should result in a power of about 175 MW. The
repowering option ~125 kg/s steam is chosen as a base for the feed of the steam turbine in
case the bleeds are all closed and only some bleed steam for de-aerating is used.
4.1.3 Existing Cooling System
161. The present condenser cooling system is a once through open cycle cooling
system. About 27,500 m3/h of surface water from the Shitalakhya River is withdrawn
using two out of three circulating water pumps (CW Pump). The hot water (after it goes
through the condenser) flows through a long open channel for natural cooling. A portion of
this water is channeled to the nearby agriculture fields for irrigation purpose and the rest
is returned back to the river at temperature close to the ambient temperature (outside the
mixing zone). During winter when Shitalakhya water is relatively low or during any break
down of CW pumps, cooling tower is used to support the existing cooling. Out of the
27,500 m3/h water, about 300 m3/h of water after due treatment is applied for other
cooling, boiler makeup and etc. The plant’s effluent after being neutralized in the
neutralizing pond is returned back to the Shitalakhya River. The effluent pH at the
neutralizing tank is maintained slightly more than 7 °C to keep the property of effluent
basic. Usually, the acidic effluents and the basic effluents are mixed in the neutralizing

Project Description
4-17
basin where they react to form salts and get neutralized. In special cases during acid
cleaning, caustic soda and calcium oxide are added for neutralization of the effluents
coming from different sources in the neutralizing pond. The sludge gradually settles at the
bottom of the tank and after a couple of years the sludge is collected and disposed in a
location to the west-side of a pond within the GPS boundary.
162. Condensate water from the condenser hot well is delivered through condensate
extraction pumps to the de-aerator. The existing cooling tower is not operating properly
due to poor maintenance for a long period of time. Most of the blower fans and motors
including the induced fan at the top of the tower are not working and require replacement.
4.1.4 Stack
163. The existing stack (main stack) for Unit 4 is a steel structure of about 50 meters
height and inner diameter of 3 meters. The exit velocity of the stack is 22-25 m/s and gas
temperature is 125-130 0C.
4.1.5 Other Equipment and process require refurbishments or upgrading
164. There is no specified list of items for refurbishment in the Feasibility Report of Unit 4.
However, the following items have been listed from the Tender Document of Unit 3 which is
similar to the Unit 4.
165. Existing steam turbine generator and its auxiliaries need to be renovated/ modified/
retrofitted to maximum capacity for using as a steam turbine for combined cycle operation. In
general:
all system/components belonging to turbine (HP,IP, LP) parts, turning gear
assembly,
main oil pump, AC Aux lube oil pumps, AC control oil pump, DC emergency
lube oil pump, oil coolers, vapor exhauster, oil filters, valves and etc.,
gland steam system with gland steam condenser and valves,
feed water system: Corrosion is a major problem in steam systems with high
consumption of make-up water. Fresh water contains dissolved oxygen.
Oxygen together with the high temperature is highly corrosive for the carbon
steel piping used in steam systems. To avoid corrosion, the oxygen in the
make-up water for saturated steam production needs to be removed.
Currently hydrazine is used in GPS as a scavenger chemical to remove
oxygen. Hydrazine is a toxic chemical (a carcinogen) which requires proper
treatment prior to disposal in the river, which also supports food processing
systems in up and downstream. There are a number of environmentally
friendly alternatives to hydrazine, (a) Erythorbic acid and its sodium salt can
replace scavenger chemicals like Hydrazine as oxygen scavengers. Sodium
Erythorbate is a non-toxic oxygen scavenger that can be used also in food
processing systems and (b) HELAMIN is formulations consisting of poly-
carboxylates and surface-active fatty alkyl polyamines in combination with
other amines of varying volatility. The use of HELAMIN in the preparation of
boiler make-up water has a synergetic effect. The poly-carboxylate (as
sodium salt) causes alkalization at every temperature because of hydrolysis.
As a polyelectrolyte it has greater affinity to bivalent cations (e.g. Fe++ or
Ca++), like a weak acidic ion exchanger. Hence, quite stable calcium or iron
salts are formed which can be removed by blow down. At the stoichiometric

Project Description
4-18
limits any residual hardness is kept in solution. The EPC contractor in their
proposal states a possible environmentally friendly alternative to replace
hydrazine as the scavenger chemical. Owner’s engineer will review the
proposal and in consultation with GPS a final decision will be made.
control valves required for open cycle, close cycle, and combined cycle
operation,
condensate water system, circulating water (CW) system and their
auxiliaries(vacuum pump, drainage pump, delivery valve, etc.),
fire-fighting system,
cooling system including blower fans, ad motors and the induced fan, and
generator rotor, stator, generator other auxiliaries (gas cooling pump, stator
cooling pump, sealing oil pump) and etc.
166. The existing instrumentation and control are old and obsolete in view of the latest
control systems currently available. It is very difficult, time consuming and costly to
interface the outdated control system with the state-of-the-art control system of the
modern Gas Turbine. A visit to the control room of Unit 4 indicates that insulations in two
doors have been damaged and noise level in the control room is a little higher than expected.
These doors require replacements.
4.2 Proposed Project Design
4.2.1 Project Layout and Site Drainage
167. The detailed layout plan showing all structures, road network, drainage network,
different pollution abatement measures, waste water and effluent treatment facilities shall be
developed by the EPC contractor before construction. The EPC contractor shall be
appointed after receiving approval of the EIA report from DoE. BPDB shall submit the final
layout plan to DoE for their review and comments considering availability of land, landscape,
ground features, elevation, environmental aspects and social concerns recommended by the
EIA study. However, a preliminary layout plan of the proposed repowering project prepared
by the feasibility study Consultant is presented in Figure 4-3. A layout plan showing
proposed components of the EIA findings in addition to the components mentioned in the
feasibility study of the Unit-4 is given above in Figure 3-3. The EPC contractor will need to
show waste storage and sorting areas as well as a secured disposal location on the layout
plan. Given the sensitivity of the decommissioning activity, it is recommended that the EPC
Contractor is certified on OHSAH 18000. The Environmental Management Plan (EMP) and
the Emergency Preparedness Plan in this report provides more details.
168. There is an existing drainage network in GPS for storm water runoff. Runoff is
collected through open drains and stored in a common basin for sedimentation and the
overflow is then connected with another drain to finally discharge to the condenser cooling
water discharge channel for ultimate disposal to the Shitalakhya River.
169. The runoff drainage network of GPS requires improvement with the repowering as
new equipment will be installed and existing structures will be demolished. Segregation of
stormwater runoff and cooling water discharge may be required to avoid possible
contamination at the disposal site close to the jetty area. Moreover, it is recommended to
avoid decommissioning work during the monsoon season.

Figure 4-3: Full Repowering 1:1:1 configuration layout plan for Unit 4

Project Description
4-20
4.2.2 Plant components of the layout plan
170. The major components of the proposed Plant layout are listed in Table 4-7.
Table 4-7: Major components of the layout plan
Sl. No.
Components Sl. No.
Components
1 Proposed underground gas line 6 Jetty
2 230 KV sub-station 7 Existing gas station for unit 1-6
3 Go down/warehouse 8 Oil Tanks
4 Intake pump house 9 Boundary Wall
5 Unit 2 and4 Turbine hall 10 Asbestos disposal facility
Source: Feasibility report, BPDB
171. Drainage of storm water and effluent generated from the condenser cooling will
follow the existing drainage system of the GPS. The new drainage network to be built for the
proposed Plant will be connected with the existing drainage network.
4.2.3 Land Requirement
172. The area of the proposed project site is about 8 acres including the required land
area for the construction of the new RMS. The site is partially fallow land on the northern
side of the existing Unit 4 and near to the oil tanks having bushes, trees and tin shed
warehouses exist. Adequate land is available within the property line of GPS and no land
acquisition will be required for the proposed expansion.
4.2.4 Fuel requirement and performance
173. The Full Repowering option for Unit 4 requires a gas supply of 67.28 MMSCFD
(20.86 Nm3/s) for the gas turbine including supplementary firing of the HRSG. The current
natural gas required for Unit 4 amounts to 49.17 MMSCFD based on 180 MW gross power
output. When Unit 4 will be fully repowered, the increase in gas consumption will be 18.11
MMSCFD (5.62 Nm3/s), which is 37% more gas consumption compared to the current
consumption of Unit 4. Unit 4 has a design efficiency of 37.79%, however the current
efficiency of the unit is 33.63%. After repowering, the net efficiency will be 54.6%.
4.2.5 Water requirement
174. At present, approximately 8.9629 m3/s of surface water from the Shitalakhya River is
used for condenser cooling, other cooling systems like ST generator stator cooler, ST
generator sealing oil cooler, cooling water pumps, generator gas cooler and etc. The design
condition for the exhaust of the LP-turbine of the existing steam turbine is 125 kg/s
exhausted steam. In the Full Repowering option, the amount of exhaust steam is expected
to be 122.7 kg/s. This is slightly less (98.2% of 125 kg/s) than the design value. In
repowering, close cycle cooling system is recommended to replace the existing once
through cooling system. A water balance diagram is presented in Figure 4-4 for the full
repowering option. Water consumption will be significantly reduced from 8.9629 m3/s to
0.46583 m3/s, due to close cycle cooling system. There are a number of small-medium
industries along the upstream of Shitalakhya River. In the 10km project impact area,
industries that abstract water from the river are Desh-Bandu Sugar Mills, Ghazi Textile, and
Ghorashal and Polash Urea fertilizer factories. The locations of these industries are
presented in Figure 4-5. The project impact area also includes brick fields, which require
minimal water consumption.

Project Description
4-21
Figure 4-4: Water balance diagram for Unit 4

Figure 4-5: Major industries in Project Impact Area

4.2.6 Technology Selection and Process Description
175. In the full repowering case, the existing gas fired boiler will be replaced with one gas
turbine and heat recovery steam generators (HRSG). The exhaust gases of the gas turbine
are fed into the HRSG. The steam generated in the HRSG is supplied to the existing steam
turbine and convert the plant into a combined cycle power plant. It is considered that noise
generated from the gas turbine is 90 dBA.
176. The waste heat of a simple cycle gas turbine plant is used to generate steam in a
heat recovery steam generator (HRSG) to drive a steam turbine and generate additional
electrical power. The advantages are 1) higher efficiency and consequently less fuel
consumption, 2) augmentation of power generation at steam turbine end with less fuel, and
3) less emission of flue gas
177. A typical flow diagram of a gas based CCPP with HRSG is shown in Figure 4-6.
Figure 4-6: Process Flow Diagram of proposed CCPP
178. The rated capacity of Unit 4 is 210 MW but the present maximum power generation
capacity is 180 MW. After repowering the total gross output will be 411.7MW and net Unit
output will be 403.5 MW (Ambient condition) and average net capacity over life time will be
391.4 MW (auxiliary power use of 8.2 MW and impact of ageing and fouling of 12.1 MW).
179. The compressed natural gas is mixed with compressed air in the combustor to
perform firing. The hot gas is directed to the gas turbine where the hot gas expands and
loses its pressure and temperature and finally generates 246 MW electrical power in the
generator. The exhaust hot gas of the GT will pass through the HRSG. The HRSG in turn
will generate HP steam that will be directed to the steam turbine; this will in turn generate
165.7 MW of power making plant output to 403.5 MW (combined cycle). The condensed
steam in the condenser will be pumped by condensate extraction pumps to the HRSG
deaerator. The deaerated water will be pumped to the HRSG drums by feed water pumps
Air Compressor
HRSG
Gas Turbine
(GT)
Gas Compressor
Combustor
Deaerator
HP
Hot gas
Flue Gas
Steam
Generator
Unit X-Former
(2 x 125 MVA)
Ele
ctr
icity
Unit X-Former
(340 MVA 23/
230 KV)
Ele
ctr
icity
Co
nd
en
sa
te
fro
m
co
nd
en
se
r
Water
Hot Gas
Existing AIS
230 KV S/S
Ele
ctr
icity
Proposed GIS
230 KV S/S
IP LP
Condenser
Hot Well
230KV to Tongi

and thus a steam feed water cycle will be completed. All existing feed cycle equipments and
piping will be retained and used in proposed repowering of Unit 4.
180. In combined cycle power plants the heat rejected by the higher temperature cycle is
recovered and used by the lower temperature cycle to produce additional power and gives
high efficiency. Some of the common advantages of combined cycle over conventional
reheat cycle (steam turbine) are presented below:
The efficiency of the combined cycle plant is better or higher than the turbine
cycle or steam cycle plant.
The capital cost of combined cycle power plant with supplementary firing is
slightly higher than the simple gas turbine plant and much below those of the
classical steam turbine power plant of the same capacity.
The combined cycle power plant is more suitable for rapid start and shutdown
than the steam power plant. Therefore these plants accepts load variations
quickly and helps in maintaining the stability in the electrical grid.
The cooling water requirement of the combined cycle plant is much lower than
the normal steam turbine power plant having same capacity output. In these
type of plants almost 2/3rd of the power is generated by the gas turbine plant
which requires very little or no cooling water. Conventional cooling water
system (once through) or recycle system is adopted. In case of lack of sufficient
water at the site, dry cooling system can also be provided for cooling. Less
water requirement for combine cycle plants is also major advantage while
selecting the site of the plant.
The combined system offers self-sustained feature. For example if the plant is
shut down due to any fault or maintenance, no start up power supply can be
required to start the unit. Gas turbine offers to start the plant and supply power
to plant auxiliary loads. Therefore combined cycle plants has advantage of self
sustaining feature.
Maintenance duration (down time) for combined cycle power plant is
significantly low. This improves the plant availability feature
The superior efficiency of the combine cycle power plants over conventional
reheat cycle plants not only conserves the fossil fuels but also drastically
reduces the emissions and waste per unit of electricity generated.
4.2.7 Improvement of Existing Steam Turbine
181. Due to the fact that the repowering option must operate for at least 20-25 years, it is
advisable to keep the process conditions below the design conditions. As a starting point
the steam from the HRSG will have a temperature of 530 ºC. The pressure of steam
produced by the existing boiler will not exceed 120 bars (the pressure which will arise
depends on steam turbine load and function of the steam control valve). The original design
for the steam turbine is 540 ºC and 130 bars.
182. The stack temperature of the HRSG can be quite low due to the condensate
temperature of 40-45 ºC from the condenser. The total heat to be delivered by the HRSG
with or without additional burning has to be according to: (a) heating up condensate to
saturated water and a pressure of about 125 bar (drum pressure) including evaporation
heat and superheating of the steam takes about 3,245 kJ/kg energy and (b) reheating a
thermal input in the water/steam system for a flow of ~125 kg/s, which is about 460 MJ/s.
183. These considerations have led to the following assumptions for the steam turbine:
Approximately 125 kg/s of steam;

Steam temperature of 530 ºC;
HRSG exhaust gas inlet temperature minimal of 570 ºC to produce the needed
steam temperature.
184. The most obvious approach for the existing steam turbine would be to rehabilitate
without major efficiency modifications. It is therefore recommended to slightly de-rate the
original steam parameters of the turbine. A slight de-rating will be necessary as it will be
difficult to find a gas turbine of proven design with an exhaust gas temperature over 560 -
570 °C, unless duct firing is added to the HRSG. Duct firing however has a consequence of
more complex HRSG. Another, beneficial effect of de-rating is that the remaining life of the
high temperature turbine parts increases. With this in mind, de-rating with 10 °C in steam
temperature and ~10 bar in pressure for the HP-steam and 10 °C and ~5 bar for the IP
steam are recommended.
4.2.8 Description of Major Sub-systems
a) Power station facilities
185. The gas turbine and HRSG will be designed in a way that the generated steam
amount and conditions match with the requirements of the existing steam turbine producing
the highest feasible output. The original steam turbine, condenser and its auxiliary
equipment can be used. The new gas turbine and HRSG can fit in place of the existing
boiler. The new gas turbine transformer will be connected to the external grid. The existing
station transformers can stay in place. Modifications for this option will be as follows:
Installment of new gas turbine + generator + HRSG,
Adjustment in balance of plant (BOP) in case of higher condensate flow,
Large expansion switch yard and grid due to augmented power output,
Possibly a gas compressor needed to augment natural gas pressure for gas
turbine(s),
Control system has to be renewed. The same system is not available anymore, and
control system has to be modified because of incorporation of Gas Turbine,
Bypass stack(s) for flexibility, shorter start-up time, gas turbine(s) can run in open
cycle mode,
Demolition of existing boiler and parts of BOP, and
Overhaul steam turbine, bringing back close to original efficiency.
b) Plant control system
186. In full repowering,a digital PLC based distributed control system compatible with the
HART communicator and with analogue to digital converter and vice versa is proposed. An
interface will be developed to integrate the old and new digital control system as a mitigation
measure.
187. The plant control system will be integrated with the control, instrumentation and
alarm equipment of the plant, to maximize automation of the plant. The design of the control
and monitoring system as well as its constructive feature will be guided by the following
principles:
Standardization and interchangeability,
Modular concept of control system,

On line testing of critical parameters, and
Fail safe operation.
188. The plant system consists of redundant controllers. The control system will be
designed in distributed process control system based on the microprocessor technology and
will be operated by auto/manual operations on the monitor located in UCR.
189. The Distributed Control and Information System (DCIS) will be provided for control &
monitoring of the combined cycle power plant. The manufacturer’s standard packaged
control system will be provided for GTG’s, HRSG etc., for respective control and monitoring
facilities. However, a standard control system will be required to be procured for the steam
turbine and generator. The standard packaged control system includes instrumentation
and alarm system and is integrated with the DCIS for centralized control, monitoring, and
supervision. The DCIS will provide for the safe, efficient and reliable operation of the plant. It
is integrated with subsystem control of steam turbine, generator, gas turbine and HRSG with
their packaged auxiliaries systems control and supervision will be performed by this
integrated plant control system. The DCIS will provide modulating and digital control
monitoring, alarm, indication and data acquisition for overall CCPP and its auxiliaries.
190. The DCIS operator stations, ST operator stations, and GT operator stations will be
placed in the UCR. The local control stations for GT will be placed in GT local electrical and
control enclosure close to the GTG. The DCIS provides for supervisory control to the GT, ST
and other essential packages. The HRSG will be controlled directly from the DCIS.
191. During normal operation of the plant the operator carries out his tasks from the UCR.
The essential plant operation and management functions of start-up, shut down, and normal
load operation will be done with the operator of the DCIS.
192. The auxiliary package control system will have redundant control systems to avoid
plant outage in case a single controller fault causes trouble for continuous operation of plant.
c) Functional Description of Control and Information System
General
193. Centralized supervision and automatic operation of plant startup, shutdown,
and normal load change will be performed by the use of operator stations through the
Distributed Control and Information System (DCIS). The DCIS functions will include control,
monitoring and data blogging.
194. The control system for load output is only adjusted by the power output from GT
controller. The steam turbine valves are normally full-open and the power output is
adjusted according to the amount of heat supplied from the GT system. The steam cycle
is operated with sliding pressure and the steam turbine inlet valves are fully opened for high
efficiency and low wetness at the steam turbine exhaust during normal partial load operation.
195. The DCIS integrates the total plant system. The DCIS will provide automatic
operation and supervision ranging from unit start-up, load operation and unit shutdown.
196. The functions of plant control are as follows:
Automatic Plant Start-up/Shutdown Control (APS)
Automatic Power Regulation Control (APR)
Modulating Control
Binary Control

Automatic Plant Startup/ Shutdown Control (APS)
197. Automatic plant startup/shutdown control function (APS) is provided in order to
control the startup and shutdown of the gas turbine, HRSG, and steam turbine. The APS
produces the command signals for each control system, including gas turbine control
system, HRSG control system, steam turbine control system and auxiliary control system
after completion of manual preparation steps.
Automatic Power Regulation Control (APR)
198. The APR will modulate the generating unit equipment as a whole including the gas
turbine generator and steam turbine generator. The APR is designed to accept unit load
demand signal (MW) from central load dispatch system, or unit load demand setting by the
operator. Commands to increase or decrease power generation are usually received as a
series of pulses representing an increment of generation (e.g., MW/pulse). APR produces
demand signals for gas turbine from unit load demand. The maximum load demand
signal is limited to unit load, which is achievable with the equipment currently in service.
199. The APR includes provisions for automatic control or for manual control of any
element of the process equipment by the operator at the unit control console. The operator
interface will permit the operator to adjust the following factor:
Maximum and minimum unit load limits
Maximum load rate or change
Manual load set points
Central load dispatch system (enable/disable)
Unit Protection System
200. Unit protection scheme is applied to assure safe operation of the overall plant. This
system will consist of Steam Turbine trip interlock and HRSG trip interlock system. The
critical plant safety system of GT, HRSG, and ST will be configured in triplet channel with 2-
out-of-3 redundant sensors. Once the emergency shutdown has been set, then the plant
is blocked from restarting again until the fault is rectified and acknowledged by the operator.
Conversion of manually operated valves into electrically driven valves
201. Most of the valves of the turbine house including all drain valves are manual
operated. For a fully automated system all these valves are to be converted to electrically
driven valves. However, this matter is to be taken up during designing of the repowering unit.
d) Cooling water system
202. The existing cooling system is a once through cooling system using about 8.9629
m3/s of water from the Shitalakhya River. River water is first siphoned to the pump suction pit
and then pumped to the intake channel by two pumps of 16,200 m3/h capacity each. Unit 3
and 4 are cooled by cooling water towers or direct cooling depending on the amount of river
water available. The cooling system is a common system so each unit can take cooling
water out of the common cooling system. The cooling towers comprise of five open air
coolers (one is spare), each with 6 fans. The drain of the cooling system and the evaporation
losses are supplied by water from the river. The cooling water after extracting heat from
condenser flows through the open channel and divides into two parts. One part is sent to the
nearby agriculture field and the other part finally discharges to the downstream of the River.
The typical temperature of cooling water discharge is about 380C. The locations of outfalls

and irrigation discharge is presented in Figure 4-3. In case of non-availability of any pump,
the shortage of cooling water is compensated by using the standby cooling tower.
203. The existing cooling tower will be refurbished by maintenance work and replacement
of blower fans and motors including the induced fan. Existing cooling systems will be
augmented by the construction of new towers to meet the required capacity of close-cycle
cooling of Unit 4 repowering.
e) Central Water treatment system
204. A central water and effluent treatment plant (CETP) is recommended for Unit 4
repowering. The CETP will be an integral part of the Environmental Infrastructure of the Unit
4. This centralized facility will meet all statutory norms laid by the DoE. It will be a state-of-
the-art technology based on Sequential Batch Reactor (SBR) System. It will be an
environmentally sustainable and cost viable system for the collection, treatment and ultimate
discharge of effluents from the Unit 4. The CETP will consists of the following systems:
205. Water supply and treatment system: There are two sources of water supply; (i)
Shitalakhya River for once through condenser cooling and other cooling system like ST
generator auxiliaries, GT generator auxiliaries, gas boosters and etc., and (ii) existing plant’s
coagulated water (based on the experience of Ghorashal Unit 3, this may be finalized during
Contractor’s bidding) with due treatment in water treatment plant (WTP) shall be used for
production of demineralized water for HRSG make up and cooling system makeup.
Coagulated water will also be used as make up water of cooling tower, service water and
potable water. The effluent from the water treatment plant and other places like clarifier is
collected in the neutralizing tank where the sludge gradually settles at the bottom of the tank
and after couple of years the sludge is collected and buried in the southwest side of the
existing pond within the GPS property line.
206. The typical water balance for the GPS (including proposed Unit 4 repowering) is
presented in Figure 4-4. The generated waste water from various sources including runoff,
sewerage, and cooling system can be reused as cooling tower makeup or discharged to the
Shitalakhya River after proper treatment and meeting the DoE’s standard for effluent
discharge in Inland Water.
207. Raw and waste water treatment system: Waste water treatment system comprises
of clarifiers, filters, chlorination plant, de-mineralization plant, liquid waste effluent treatment
plant and etc. No waste water shall be discharged to the river without appropriate treatment
and satisfying effluent standard as defined in ECR 1997.
208. Clarifiers remove large quantities of suspended and organic matter from the raw
water. The type of clarifier to be used is dependent on the level of suspended solids and
type of suspended materials in the water.
209. Filters (after clarification) are required for removing a large percentage of suspended
particulate from the water by straining it through various media. The type of filters to be used
will be based on flow rate, the quality and properties of water.
210. De-mineralization (DM) Plant: The configuration of De-mineralization plant is as
follows:
a. Pre-treatment have two number clarifiers.
b. Mechanical filters- 3 nos.
c. Cation first Stage- 3 nos.
d. Cation second stage- 3 nos.

e. Anion first stage- 3 nos.
f. Anion second stage- 3 nos.
g. Mixed Bed- 3 nos.
211. Demineralization is the process of removing mineral salts from water by using the ion
exchange process. Demineralized water is completely free (or almost) of dissolved minerals
and is used as feed water makeup for HRSGs. It includes degasification and polishing.
During normal operation stream, two clarifiers remain in service and one as stand by.
Capacity of present plant is 250 m3/h. This should meet the make-up water requirement of
all four units. When all four units were operating at rated load, it was difficult to meet the
requirement of makeup water (this was observed in past when all four units were operating
at 210 MW).
f) Augmentation of DM water capacity for full repowering
212. As mentioned above, it is difficult to meet makeup water requirement of all four units
with the present DM plant. DM water requirement will be increased after full repowering of
Units 3 and 4 and addition of new 365 MW combined cycle unit. The following parameters
should be considered to design a new DM Plant:
The auxiliary cooling water for present gas turbine accessories requires treated DM
water. The amount of water requirement shall be worked out during detailed
engineering stage.
Due to this additional DM water requirement, new plant shall be installed at
appropriate location. DM Plant capacity shall be decided whether all four units are
likely to be converted by full repowering.
It is proposed that a Reverse Osmosis (RO) plant is established for combine use of
the entire plant to replace current resin based demineralization. The plant capacity
can be finalized based on the detailed design. Economic analyses has demonstrated
that when the total dissolved solids content of feed water is above 200 mg/l, RO is
the most cost-effective demineralization technology.16Based on the water quality
analysis TDS content observed is between 210-239 mg/l.
213. Effluent Treatment Plant/system to be provided to maintain the standards of
Industrial Waste as mentioned in the Environment Conservation Rules, 1997 and
amendment, 2005. A central monitoring basin (CMB) of RCC construction shall be provided
to collect all plant effluents. Quality of the effluents shall be measured, monitored and
treated. Through a set of waste effluent disposal pumps and piping, the effluents shall be
disposed of from CMB up to final disposal point at a safe distance.
g) Septic tank and sewage handling
214. The sludge to be generated from the proposed repowering will be treated and
discharged into the underground pit with concrete revetment or encircled with durable
polythene sheet. For monitoring the effluent quality, a monitoring system has also been
considered in the design. As long the effluent shall be discharged satisfying ECR, 1997
16The Dow Chemical Company (2009-2013),
http://www.dowwaterandprocess.com/en/Industries%20and%20Applications/Industrial_
Water/Boiler_Feed_and_Process_Water/Demineralization/Reverse_Osmosis, Page visited on
May 16, 2015

defined standard, there will be no danger to existing water systems in the project area. The
following measures are included in the project design:
EPC Contractor will provide septic tank for a building or cluster of buildings or connect to existing septic tank depending upon the layout to be decided during detailed engineering for the new buildings. The maximum size of septic tank is foreseen to be 4.6m × 1.15m.
The sludge removal from the septic tanks is expected to be done once a year or as per the requirement of local laws and regulations by the Project Proponent.
h) Sludge from water and effluent treatment plants
215. Sludge may be generated from a number of sources of the proposed power plant.
These are: raw water pre-treatment plant or clarifier, water treatment plant, effluent
treatment plant, cooling tower blowdown, and other discarded material, including solid,
liquid, semisolid, or contained gaseous material resulting from power plant operations. It
needs to be evaluated on a case-by-case basis to establish whether it constitutes a
hazardous or a non-hazardous waste.
216. About 0.0036 m3/s of wastewater is generated in the pre-treatment system which will
be transferred to the effluent pit. About 0.0034 m3/s of wastewater will be transferred to
effluent pit from reverse osmosis system. The sludge generated in the effluent pit will be
transferred to effluent treatment plant prior to dispose to the environment after ensuring ECR
1997 standards.
217. Possible components of sludge may include; asbestos, oil and grease, chlorine,
copper, zinc, lead, arsenic, mercury, lead, suspended solid particles, sewage,
demineralizers, and other chemicals used to manage the quality of water in feed water and
cooling systems. Sludge characterization (analysis) will be done to determine various
contents, both hazardous and non-hazardous. Some of the analysis may include BOD,
COD, presence of coliform, metals (iron, copper, lead, mercury, arsenic etc.) etc. to
determine the hazard potential of the sludge. It may affect the groundwater quality and
receiving water bodies if comes into contact to the sludge. Appropriate treatment measures
will be taken based on the sludge characteristics, to treat them prior to final disposal to the
natural environment.
218. The chemical and oil contaminated water will be collected separately and treated in
specialized plants within the CETP. All oil contaminated drains from process area (HRSG,
turbines, steam turbine hall, storage tanks, etc.) will be collected in retention basins of
sufficient size and will then be treated by oil separators.
219. All waste containing particles shall be collected and treated in the collection and
sedimentation tank or basin of the sludge treatment plant before discharge. The collection
and sedimentation tank or basin shall feature sludge scrappers at the bottom. The
Contractor may enhance the process by dosing coagulant or flocculent into the tank or
basin, primarily to collect metals and suspended solids. The clear water effluents are then
transferred to the central effluent monitoring sump, where these are further monitored and
treated for bacterial contents before being discharged into the river.
i) Natural gas pipeline relocation including RMS
220. At present the gas is supplied to Ghorashal power station by Titas Gas Transmission
and Distribution Co. Ltd. (TGTDCL) of Petro Bangla through a 16˝ diameter pipeline and
Regulating and Metering Station (Titas RMS) situated in the Northeast corner of the
Ghorashal Power Station.

221. In the existing distribution system, gas from the Titas RMS flows to the Gas
Distribution Plant (GDP 1-5) via gas metering and regulating sections through a 1.8 km long
10˝dia pipe. Gas through GDP-2 goes to Units 3 and 4.
222. The proposed GT needs a stable gas pressure of 30 bar and hence installation of a
gas booster has been proposed. Due to the space restriction in the existing Titas RMS, a
new gas station is needed and will be installed in the space available at the Northeast of the
unused fuel oil tanks, i.e., in the Northwest of the proposed HRSG site. A 16˝ diameter gas
pipeline from inlet header of the Titas RMS up to the bus of the proposed gas station will be
constructed. A Layout map of the proposed repowering is presented in Figure 4-3 and shows
the existing and new RMS. From this bus, a number of gas pipelines will be branched out
and will lead through individual gas compressor and associated facilities to the individual unit
to be repowered. It is considered that noise generated from the RMS is 100 dBA and from
associated gas pipes are 90 dBA. The proposed gas supply arrangements are shown in
Figure 4-7.
Figure 4-7: Proposed gas supply arrangements
j) Transportation of large equipment
223. Both Chittagong and Mongla sea ports are well connected to Ghorashal Power
Station through rail, road, and waterways. For transportation of heavy equipment for the
proposed repowering of 128 MW and 298 MW gas turbines, both Chittagong and Mongla
ports can be used and subsequently river transportation to GPS is the best transportation
route.
224. There is a heavy capacity jetty at the river side very close to GPS site with a 125 ton
capacity crane on the jetty. But the condition of the crane is poor and cannot be used without

major overhauling. The capacity of the crane even after overhauling will be very much limited
and may not be suitable for handling major equipment. Moreover, the Jetty will also need
strengthening. The heaviest piece of cargo of the proposed repowering plant would be
around 300 tons. The site of the proposed power plant is about 750 m from the jetty. The
heavy cargoes may be unloaded on the jetty by a crane of appropriate handling capacity
which will be brought with the barge or rented from other sources at home or abroad.
225. The River Meghna is navigable throughout the year for transporting large cargoes.
The River Shitalakhya is also navigable during the monsoon period for 500 to 1000 ton
barges up to GPS site. So, it will be advisable to schedule the transportation of heavy
cargoes during the monsoon season. There exists free space at the jetty site for unloading
cargoes by crane and transport them to the plant site by a low buoy truck. Only some civil
concrete pillars need to be dismantled on the way to GPS.
k) Firefighting and emergency management
226. Fire hazards are generally reduced through proper handling and storage of
flammable materials. For fire prevention and reduction of fire risk, it is required that all fuel
and ignition sources be removed from the site or reduced as much as practically
possible.Smoking is only allowed in designated areas as identified in the Emergency
Response Plan (ERP). For emergency firefighting, a diesel engine for running at off grid
system was setup during plant erection of Units 1 and 2. The pump is now out of order from
2002 and there is no DC firefighting pump available.
227. Appropriate firefighting and protection systems must be designed and constructed for
the proposed repowering. Standard local (e.g., Bangladesh National Building Code) and
international codes will be followed for this purpose. Regular checking and monitoring of the
firefighting equipment will be carried out during the operation phase of the project. Also, fire
drills are planned in the ERP and will be carried out at regular intervals.
4.2.9 Material storage and handling
a) Hazardous Waste
228. Hazardous waste disposed at GPS includes asbestos sheets, and soot removed
from the cleaning of the boilers operating on fuel oil. There is no facility available for storage
of hazardous waste at the plant. Currently hazardous waste is buried underground in a
location close to the jetty (Figure 4-8). A secured onsite asbestos disposal Facility will be
constructed close to the existing disposal site to store the hazardous waste including
asbestos, mineral wool, glass wool and etc. It is estimated that 50 tons of asbestos will be
removed from the existing Unit 4 boiler insulation materials17. A partial list of insulation
materials with quantity is presented in Table 4-4. The capacity of asbestos disposal facility
should be designed to consider the hazardous waste generated from Unit 3 and future
decommissioning of older boilers. The decommissioning Contractor of Unit 4 should
coordinate with Unit 3 contractors to resolve any scheduling conflicts that may arise during
these works. PCB containing equipment such as transformers and condensers are usually
found in old power stations. However, GPS does not use PCB as coolants for transformers
and there is no historical disposal or storage of PCB within GPS compound. Condensate is
generated at gas regulating and metering stations, which requires proper handling and
storage.
17TOR of the EIA for GPS Unit 4 repowering.


Figure 4-8: Plant layout with important component

Project Description
4-35
b) Non-Hazardous
229. Other non-hazardous solid waste generated at the plant includes mainly metallic
wastes and other materials removed during plant maintenance and are currently stored in an
open area located at the northeastern side of Unit 4. Approximately 1.55 ton/d of solid waste
is produced from the GPS staff colony and 0.18 ton/d from the administrative building and
other offices. Municipal wastes generated in the housing colony are stored in designated
garbage disposal areas (made of concrete) for collection by the Ghorashal Municipality
waste collection system.
4.2.10 Solid and liquid waste and air emission
a) Solid Hazardous Waste
230. About 50 tons of asbestos material will be removed from the boiler insulation material
from Unit 4 boiler. This material will be temporarily stored in the laydown area and finally
disposed at the proposed hazardous material disposal site close to the jetty area.
b) Solid Non-Hazardous Waste
231. Wastes generated during the construction phase (including decommissioning) of the
project include boiler materials (containing large metal pipes, tubes, alloyed steel, carbon
steel, zinc coated sheet), construction debris and wastes (e.g., scrap iron, wooden frames,
glass canvas, etc.),and some other solid wastes (e.g., from construction camps). Non-
hazardous solid waste will be disposed of at designated sites. Scrap material will be sold to
recycling companies and the remaining waste will be collected by the Ghorashal municipality
for final disposal to designated landfill sites.
c) Sanitary Sewage
232. Sanitary sewage will be generated from people working at the project site (e.g., from
construction camps), and some liquid waste from construction activities. In addition, sanitary
sewage will also be generated from the administrative buildings and staff colonies during the
operation stage. The appropriately designed wastewater disposal facilities (septic tank
system) of the proposed repowering will take care of the human wastes to be generated
within the plant. It should be noted that human waste generated within the complex (e.g.,
from residential buildings, schools, power plant offices and other facilities within the
complex) is disposed through a septic tank system. While the sullage is disposed of directly
into the Shitalakhya river. Solid wastes, e.g., those from offices of the power plant, to be
generated during the operation of the power plant will not be significant and should be
handled locally.
d) Air Emissions
233. Air emissions will include those from the operation of construction equipment and
machineries, vehicles transporting construction materials to the site and construction debris
out of the site. If construction equipment such as stone (aggregate) crushers is used at the
site, this may result in emission of particulate matter during its operation. Since construction
of the proposed repowering would involve significant earthworks, an increase in particulates
in the air from wind-blown dust will also be a concern, especially considering the close
proximity of the high school and the staff colony (and also the residential area) to the project

Project Description
4-36
site. During the operation phase, air emissions will also be generated due to the operations
of the existing, repowered and new GPS units.
4.2.11 Water Balance
234. The plant liquid waste that will be generated during plant operation may include, but
is not limited to (1) cooling water blow down, (2) demineralizer waste, (3) oily water and
chemical area drains, (4) sanitary waste, (5) HRSG blow down and etc. An estimate of the
amount of liquid waste to be generated may include cooling tower purge, water treatment
plant rejection, HRSG purge and oily water. All plant process wastewater and industrial
wastewater effluents shall be collected and treated by chemical neutralization, physical,
chemical and biological treatment methods to comply with the effluent discharge limit criteria
set forth in ECR 1997.
235. The existing water balance for the GPS and Unit 4 is summarized in Table 4-8.
Current total uses of water for the entire GPS including the office use and staff colony are
(40.30 m3/s and 8.971 m3/s for Unit 4 and the operation of the coagulator/clarifier where
coagulated silt is removed and returned back to the river as coagulator blow down (0.002
m3/s for GPS and 0.0004 m3/s for Unit 4). Other uses include the boilers, offices, and the
housing colony. The water balance presented in Table 4-8 is for the peak requirement in the
month of July for existing GPS and Unit 4, and repowering of Unit 4. It is expected that due
to repowering with close cycle cooling system there will be a significant reduction in water
requirements of cooling water systems. In existing once through cooling system, water
requirement for cooling water system is 7.6389 m3/s while it is 0.38194 m3/s in the proposed
close cycle cooling system. Similarly, for auxiliary cooling, water requirement for existing
unit-4 is 1.3056 m3/s while it is 0.06528 m3/s for the proposed system.
Table 4-8: Plant water balance
Items
m3/s
Total GPS Existing Unit 4
Repowering Unit 4
Supply 40.30 8.971 0.4686
Distribution
Cooling Water System 34.29 7.6389 0.38194
Coagulator Flushing 0.002 0.0004 0.00036
Boilers (for existing) & HRSG (for proposed) 0.049 0.0108 0.01083
Other Plant Uses 0.033 0.0074 0.00742
Auxiliary Cooling 5.875 1.3056 0.06528
Offices 0.00633 0.0011 0.00083
Housing Colony 0.042 0.0070 0.00194
Total Distribution (A) 40.30 8.971 0.46861
Waste Generated
Coagulator Blow Down 0.002 0.0004 0.00036
Other Plant Wastewater 0.0003 0.0001 0.00007
Auxiliary Cooling 5.8163 1.2925 0.06463
Other Water
Condenser Cooling Water 27.22 6.04 0.000
Total Returned to the River (B) 33.04 7.330 0.065

Project Description
4-37
Items
m3/s
Total GPS Existing Unit 4
Repowering Unit 4
Boiler Blow Down and Demi Plant Waste 0.015 0.003 0.003
Office Septic Tanks 0.00146 0.000243 0.0002
Total to Evaporation Pond (C) 0.017 0.004 0.004
Wastewater Drained Outside from Office (D) 0.00487 0.00081 0.00064
Wastewater Drained Outside from Housing Colony (E) 0.042 0.007 0.00194
Total Wastewater (F=B+C+D+E) 33.10 7.34 0.07
Losses, Evaporation and Uses
Condenser Cooling Water Evaporation 0.69 0.153 0.3056
Cooling Tower Blowdown 0.00 0.000 0.0764
Other Losses and Uses (Irrigation) 6.38 1.449 0
Other Plant uses 0.03 0.0073 0.0073
Auxiliary Cooling Evaporation 0.059 0.0131 0.00065
Boiler (for existing) and HRSG (for proposed) use 0.03 0.007 0.007
Total (G) 7.20 1.63 0.40
Total Waste, Losses and Uses (F+G) 40.30 8.9711 0.4686
4.3 Human resources required during construction and operation
236. The estimated number of workers required during (i) Construction and (ii) Operation
phase are as follows:
During construction, EPC contractor is expected to have manpower around 700 at
peak, including unskilled, skilled, supervisors, engineers, management staffs, etc.
BPDB employees will be around 35.
During O&M phase, EPC Contractor will employ 3 persons for the period of warranty
(i.e., 2 years from plant take over) and BPDB employees are expected to be around
219 (139 present + 80 additional).
4.3.1 Construction Labor Camp
237. Ghorashal is an industrial area located in Ghorashal Municipality. Many workers
skilled or unskilled from different parts of Bangladesh come to Ghorashal for work. They live
in rented houses on monthly basis locally available and work in the industries. Renting
houses has become a lucrative additional source of monthly income of the local people.
During site visit and discussion with the local BPDB authority it is learnt that the EPC
contractor can easily rent houses and accommodate all workers with water, electricity and
sanitation facilities just outside the boundary of Ghorashal power station.
4.4 Operation and Maintenance
238. The actual operating times of the power station will be largely dependent on supply
and demand conditions in the electricity market. Peak use typically occur during morning and
afternoon periods during the summer and winter months. However, the power station is
required to be available to operate at any time should it be required to respond to system

Project Description
4-38
emergency or security situations. Economically, the power station is very unlikely to increase
its operation to intermediate or base load operation due to the high operating costs of the
facility and due to the low efficiency.
4.4.1 Emission Control system (Units and Devices especially for NOX reduction)
239. Natural gas of Bangladesh is known as sweet gas. Its sulfur content is negligible and
hence the emission of Sulphur dioxide (SO2) is negligible and emission of particulates (PM)
is fairly low. Modern Gas turbines are provided with dry low NOX burners to keep the NOX
level below 25 ppmv. During repowering, dry low NOx burners will be installed to reduce
NOx emissions.
4.4.2 Emission Monitoring System
240. Online continuous emission monitoring system (CEMS) will be installed consisting of
electronic emission analyzers like CO, CO2, NOx, PM, SO2 and etc. that will take flue gas
samples from the stack. A periodic (once every shift) flue gas analysis will be carried out in
the chemical laboratory to cross check the values obtained by the CEMS.
4.4.3 Environmental Quality Monitoring System
241. Two ambient air quality monitoring stations (to monitor CO, NOx, PM2.5, PM10 and
SO2) and one weather station to monitor meteorological parameters (wind speed, direction,
temperature, rainfall, humidity and etc.) are recommended in the project impact area. The
locations of the stations will be based on the dispersion modeling output of maximum ground
level concentrations in downwind directions. Noise level will be monitored at the same
locations where environmental quality baseline monitoring were conducted. In addition, two
monitoring wells are recommended, one close to the newly proposed hazardous waste
disposal site and one close to the neutralization pond to monitor groundwater quality.
4.4.4 Power Evacuation
242. Power generated from the gas turbine will be evacuated through the proposed
230KV gas insulated sub-station (GIS) switchyard and 230 KV high voltage Tongi
transmission line via 340 MVA unit transformer. While power generated from the steam
turbine will be evacuated through the existing bay of the 230 KV Air insulated sub-station
(AIS) switchyard via the existing 2x125 MVA unit transformers. Location of GIS and
distribution line have been shown in
243. Figure 4-8. No land acquisition is expected for GIS.
4.4.5 Life Cycle Overview (including Decommissioning)
244. Project development for Ghorashal Unit 4 repowering has proceeded to preparation
phase. There are a number of important points for the plant life cycle that must be carefully
considered. These include (i) the current planning phase, (ii) decommissioning of boiler and
old installations including re-orientation of gas pipelines, cable lines, overhead electrical
lines, water pipelines, (iii) rehabilitation of steam turbine, (iii) replacement of existing old
control system with state-of-the-art control system of STG and interfacing with GTG and
HRSG, (iv) foundation of GTG, unit transformer, and HRSG, (v) erection of GTG,
transformer, and HRSG, and (vi) decommissioning of the plant either completely or partially
at the end of current economic life (25 years). In addition, energy consumption due to natural

Project Description
4-39
gas feedstock including drilling/extraction, processing, and pipeline transport are also
considered in the life cycle analysis.
245. A total overview of the full repowering option including the total plant output and
efficiency under ambient conditions in repowering and averaged over the life time is shown
in Table 4-9.
Table 4-9: Life cycle plant output and efficiency for repowering
Items Unit Impact Outcome
Heat input gas turbine MJ/s
668.5
Supplementary Firing MJ/s
70.0
Total Thermal input MJ/s
738.5
Natural gas consumption (LHV 950 BTU/scf) in the plant MSCFD
67.3
Net output gas turbine, ambient conditions MW
246.0
Gross output steam turbine, ambient conditions MW
165.7
Auxiliary power (steam system, gas compressor) MW
-8.2
Total net plant output, ambient conditions, repowering MW
403.5
Impact of ageing and fouling MW 3% -12.1
Average net capacity over life time MW
391.4
Net efficiency ambient conditions, repowering %
54.6
Impact ageing and fouling % 1.5% -0.8
Average net efficiency over life time %
53.8
System boundaries
246. An assessment is made to track the material and energy flows between the process
blocks within the system and is presented in Figure 4-9. The solid lines in Figure 4-9
represent actual material and energy flows, while the dotted lines indicate logical
connections between process blocks. The steps associated with obtaining the natural gas
feedstock are drilling/extraction, processing, and pipeline transport.

Project Description
4-40
Raw material
extraction
Production and
transport of
equipment
Construction of
transportation
equipment
Transport of
equipment to
powerplant
Production and
distribution of
natural gas
Construction of
equipment and
natural gas
pipeline
Exacavation
and landfilling
Recycling and
disposal
(include boiler)
Power Plant
E- Energy
Em - Emission
HM - Hazardous Material
M - Material
RM - Raw material
RM
Em
RM Em
RM
Em
E
E
E
E
RM Em
E RM Em
HM M
E
RM
EM
EM
E RM
E
RM
Em
Em
E
EM
Figure 4-9: System boundaries for electricity production using natural gas combined-
cycle process (including decommissioning)
Life cycle energy consumption and system energy balance
247. Table 4-10 shows the energy balance for the repowering system (LHV basis). The
majority, 79.5%, of the total energy consumed is that contained in the natural gas feedstock.
The upstream fossil energy, which accounts for 20.5% of the total energy consumption,
includes the energy of the natural gas that is lost to the atmosphere.18 Although not listed
separately in Table 4-10, this energy loss is equal to 2.2 MJ/kWh or 1.4% of the total energy
consumed by the system.
18Spath, P. and Mann, M. (2000); Life Cycle Assessment of Natural Gass Combined Cycle Power Generation
System, NREL, Colorado, USA.

Project Description
4-41
Table 4-10: Average Energy Requirements per kWh of net electricity produced (LHV
basis)
System
total (MJ/kWh)
% of total
% of total from construction &
decommissioning (a)
% of total from natural gas production,
distribution and use
Energy in the natural gas to power plant 8.53
79.50% N/A 100.00%
Non-feedstock energy consumed by system (b) 2.20
20.50% 1.40% 97.90%
Total energy consumed by system 10.73 N/A N/A N/A
248. The energy use within the system was tracked so the net energy production could be
assessed. Several types of efficiencies can be defined to study the energy budget. As stated
earlier, the power plant efficiency for this repowering system is 54.6% (LHV basis). This is
defined as the energy to the grid divided by the energy in the natural gas feedstock to the
power plant. Four other types of efficiencies/energy ratios can be defined as shown in Table
4-11.
Table 4-11: Energy Efficiency and Energy Ratio Definitions
Life cycle efficiency
(%) (a)
External energy
efficiency (%) (b)
Net energy ratio (c) External energy ratio
(d)
where: -
Eg = electric energy delivered to the utility grid
Eu = energy consumed by all upstream processes required to operate power plant
En = energy contained in the natural gas fed to the power plant
Eff = fossil fuel energy consumed within the system (e)
Notes:
(a) Includes the energy consumed by all of the processes.
(b) Excludes the heating value of the natural gas feedstock from the life cycle efficiency formula.
(c) Illustrates how much energy is produced for each unit of fossil fuel energy consumed.
(d) Excludes the energy of the natural gas to the power plant.
(e) Includes the natural gas fed to the power plant since this resource is consumed within the
boundaries of the system.
249. The net energy ratio is a more accurate and rigorous measure of the net energy yield
from the system than the external energy ratio because it accounts for all of the fossil energy
inputs. However, the external definitions give a better understanding of upstream energy
consumption. It is important to have these four definitions because the fossil fuel fed to the

Project Description
4-42
power plant overshadows the energy consumption from other process steps. Table 4-12
contains the resulting efficiencies and energy ratios for the system, given on an LHV basis.
Table 4-12: Efficiencies and Energy Ratio Results (LHV basis)
System Life cycle efficiency
(%)
External energy
efficiency (%)
Net energy ratio
External energy ratio
Re-powering -51.66 48.34 0.39 1.92
250. Since the natural gas is not a renewable resource, the life cycle efficiency (which
gives the total energy balance for the system) is negative, indicating that more energy is
consumed by the system than is produced in the form of electricity. Excluding the
consumption of the natural gas feedstock, the low values of the external energy efficiency
and the external energy ratio indicate that upstream processes are large consumers of
energy. Although not derived from the information in Table 4-12, disregarding the energy in
the natural gas feedstock, 97.9% of the total energy consumption comes from natural gas
production and distribution (Table 4-10). This process block can be further broken up into
natural gas extraction, processing, transmission, storage, and distribution. Of these, the
largest consumers of energy are the natural gas extraction and pipeline transport steps.
Diesel oil is combusted to meet the energy requirements of the drilling equipment, while
pipeline transport uses a combination of grid electricity and natural gas to move the natural
gas from its point of origin to its destination. Additionally, the net energy ratio in the Table
4-12 shows that for every 1 MJ of fossil energy consumed 0.39 MJ of electricity is produced.

5-1
5. Analysis of Alternatives
5.1 Introduction
251. This chapter presents alternative analysis of the Project components in terms of
infrastructure sitting, selection of repowering options, technology options, selection of cooling
water system , various water and effluent treatment system, and a comparison with ‘no’
Project scenario. Alternatives are compared in terms of potential social and environmental
impacts, costs, technical requirements, constructability, operation and maintenance
requirements. The alternative analysis has been carried out in reasonable detail to enable
the Power Development Board, World Bank and other stakeholders, if any, to appreciate the
recommended options and confident on the preferred options. Further details about the
selected options are included in other chapters of this report.
5.2 Framework for Assessment of Alternatives
252. Consideration and evaluation of project alternatives are
important parts of the environmental and social impact
assessment process. An alternative analysis has been conducted
in terms of project options including: location, repowering options,
technology selection, cooling water system, water and effluent
treatment system, and operation and maintenance procedures. A
comparison of the proposed project alternatives is made with the
without-project alternative to provide a fuller picture of the pros and
cons of implementing the proposed re-powering project.
Alternatives are compared in terms of technical requirements, e.g.,
constructability, operation and maintenance, economic and
financial viability, and potential environmental and social impacts
(Table 5-1). The overall feasibility of the project alternatives is
considered based on the combination of the criteria upon which
the alternative components are evaluated.
253. This chapter provides an overview of considered
alternatives, with particular attention to environmental and social
impacts accounted for in the evaluation and selection process and
potentially needing mitigation during project implementation.

Analysis of Alternatives
5-2
Table 5-1: Criteria and sub-criteria used in evaluating project alternatives
Criteria Sub-Criteria
Technical Requirements
Life time extension
Capacity/output
Efficiency improvement
Fuel Consumption / energy requirements
Constructability
Suitability of construction/erection
Materials/ Machineries required as per the considered options
are available.
Disposal of non/hazardous waste
Operation and
Maintenance
Availability of fuel
Automated Control System
Operation and maintenance ease.
Cost / Economic Viability
Construction Cost
Operation Cost (including Maintenance and Energy Cost)
Economic rate of return
Environment
Air pollution and noise
GHG emission benefits
Benefits in thermal pollution
Solid waste
Centralized water/effluent treatment system
Social Improved Power Supply Security
Employment Potential
5.3 Without Project Alternative
254. No project alternative in simple term means without implementing the proposed
project of re-powering and converting the plant to a combined cycle plant.
255. This without project scenario is not recommendable because at present Bangladesh
is suffering from acute shortage of electrical power which is seriously hindering the economic
growth of the country as well as achieving the Government’s millennium development
program. This project is a part of total effort of BPDB to achieve the targeted generation of
34,000 MW by 2030 in a most economic and efficient way and fulfillment of Government’s
commitment to provide electricity to all by 2021.
256. Implementation of the project will increase the present power plant generation from
180 MW to 404 MW (gross). If the project is not implemented the plant will remain in its
present low efficiency level with 180 MW derated capacity and augmented generation of
about 224 MW due to combined cycle technology with relatively less fuel requirements will
be lost.
5.3.1 Environmental and Social Impacts of Without Project Alternative
257. The without project alternative has some positive impacts (benefit) that it will avoid
the negative impacts of the project implementation during decommissioning of boiler,
construction and operation phase such as generation of hazardous waste, fugitive
particulate matter, gaseous pollutants, release of solid waste, toxic chemicals etc. However,
these are limited to decommissioning and construction period only and are mitigable with
proper mitigation and compensation measures. The most significant negative impact of the

Analysis of Alternatives
5-3
without project alternative is the continued thermal pollution of Shitalakhya River water
through warm effluent discharge generated from the condenser cooling. Potential of
hydrazine based deoxygenated water and resin based demineralization effluent discharge to
the river.
258. The most important negative social impacts of no project alternative are the loss of
new job opportunity of un-skilled, semi-skilled and skilled people and the loss of additional
economic activity in the communities and national development from the augmented power
generation.
5.4 Repowering Options
Feed water
Heating
Hot wind box
repowering
Hybrid
repowering
Full
RepoweringNew CCPP
Single
Pressure
CCPP
Triple
Pressure
CCPP
Upgrade LP
steam
turbine and
condenser
Use existing
bleeds from
steam
turbine
Single gas
turbine with
HRSG
Two gas
turbines with
HRSG
Full Hybrid
Mini Hybrid
Figure 5-1: Different repowering options
259. Different repowering options are presented in Figure 5-1. The green shaded box was
finally chosen as the best option. The following sections provides the process configuration
of each of the options. The advantages,disadvantages and investment costs are discussed
for each option and the preferred alternative was chosen that was taken for investigation for
repowering of GPS.
5.4.1 Feed water heating
260. For feed water heating repowering a new gas turbine is required, in which the heat in
the exhaust gas is used to heat the feed water. Therefore, the quantity of steam extraction
from the steam turbine bleeds to the feed water heaters is reduced or eliminated. This steam
can expand to the condenser and produce additional power in the steam turbine. The

Analysis of Alternatives
5-4
increased power output of the plant comprises of the power generated by the gas turbine
and the additional power of the steam turbine. Feed water heating will increase the efficiency
with 2 to 4 percent.
261. Advantages of this option will be:
Small efficiency increase 2 to 4% points because of usage of a gas turbine cycle which has a higher efficiency than a conventional cycle
Investment would be relatively low compared to other options.
262. Disadvantages of this option will be:
Small increase of power output
Small efficiency increase
The gas turbine would be very small because it is only used for feed water preheating.
The power output of the steam turbine would become lower if no modifications are applied. This is because the turbine bleeds will be closed. Because these bleeds are closed, less steam can be fed to the high pressure and intermediate pressure cylinders.
263. Because of many limitations and disadvantages of feed water preheating, this option
was not studied further.
5.4.2 Hot Wind Box Repowering
264. Repowering installation of a new gas turbine is required. The exhaust gas is used as
hot combustion air for the existing boiler. The exhaust gas could be pre-cooled before
entering the existing boiler. The original fuel is still burned in the boiler. The efficiency will
increase with 4 to 5 percent with hot windbox repowering.
265. Advantages of Hot Windbox Repowering are:
Total efficiency of the power plant will increase with 4 to 5%.
Old boiler can be re-used but have to be modified
O2 content in the flue gases of the gas turbine can be used for burning of the fuel in the boiler
The regenerative air pre-heaters are not used anymore because the exhaust gases from the gas turbine have a temperature of 400 ºC to 550 ºC, depending on the gas turbine chosen
Because of the lower oxygen content of the exhaust gases less fuel can be combusted, resulting in a lower average boiler temperature and strong decrease of the NOx emissions.
266. Disadvantages of Hot Windbox Repowering are:
Hot windbox repowering of the units shows a relatively large reconstruction and extension works of the existing boiler
A gas turbine has to be selected with approximately the same exhaust gas quantity as the design combustion air quantity of the boiler. This will give a relatively small size of the gas turbine compare to the total size of the plant

Analysis of Alternatives
5-5
The total power output will only be slightly higher compare to the original power output because the steam turbine will produce less power
This efficiency gain is mainly due to shifting of fuel supply from the steam process to the gas turbine process. Moreover, hot exhaust gases from the gas turbine considerably reduce the fuel supply to the boiler. However, it is essential that the entire quantity of heat of the gas turbine exhaust gases is effectively used by the boiler steam turbine cycle. In practice this means that the exhaust heat of the gas turbine must be absorbed by the condensate and feed water through LP and HP economizers
Down time for modification will be approximately 6 to 9 months
After repowering, if the gas turbine is out of service, the unit can still operate but the efficiency will be lower due to lack of air pre-heaters.
267. Because of the above mentioned disadvantages of hot windbox repowering, this
option was not be studied further.
268. By eliminating feed water heating and hot wind box repowering for detailed study.
Three other options were studied further and a comparison of the options are presented in
Table 5-2.
Table 5-2: Comparison of various repowering options studied
Criteria Selected Option Alternative 1 Alternative 2 Alternative 3
Description of
Alternatives
Full re-powering
Full Hybrid Mini hybrid New CCPP
Technical Requirements
Life time
extension
25 years is
considered
25 years is
considered
25 years is
considered
25 years is
considered
Power output
and efficiency
Expected higher
output (404MW)
and efficiency
(54.6%)
Expected output
of 265.7MW,
efficiency 43.2%
Expected output
of 291.5MW,
efficiency 41%
Total plant output of
single pressure is
374.4 MW and
efficiency 57%, and
the triple pressure is
393.4MW and
efficiency is 59.9%.
Fuel
Consumption 20.86
m3/s or
(0.05
m3/s/MW),
additional
2.27 m3/s
17.38
m3/s
(0.06
m3/s/MW)
additional
5.17 m3/s
20.10
m3/s
(0.07
m3/s/MW)
additional
5.98 m3/s
18.85 m3/s
(0.05
m3/s/MW
single
pressure),
(0.047
m3/s/MW
triple
pressure)
with and
HRSG,
respectively.
Constructability
Local Suitability Suitable Suitable Suitable Suitable

Analysis of Alternatives
5-6
Criteria Selected Option Alternative 1 Alternative 2 Alternative 3
Available
Materials
Construction
Materials
Available.
Machineries need
to be imported
Construction
Materials
Available.
Machineries need
to be imported
Construction
Materials
Available.
Machineries need
to be imported
Construction
Materials Available.
Machineries need to
be imported
Operation and maintenance
Availability of
fuel
Fuel available for
the life of the
project. New
agreement with
Titas required.
Fuel available for
the life of the
project. New
agreement with
Titas required.
Fuel available for
the life of the
project. New
agreement with
Titas required.
Fuel available for
the life of the
project. New
agreement with
Titas required.
Distributed
Control System
New DCS will be
required to
replace obsolete
control system
Since ST and
boiler are old,
some of the
control system
may be still in
use.
Since ST and
boiler are old,
some of the
control system
may be still in use.
Completely new
DCS
Operation and
maintenance
ease
Only steam
turbine is
refurbished. Other
components GT
and HRSG are
new.So there will
be more
maintenance than
option 4
Steam turbine
with existing boiler
will stay. GT and
HRSG will be
new. Boiler is a
very old one and
its overall
condition is very
bad. So here
maintenance will
be same as Mini
hybrid option.
Steam turbine
with existing boiler
will stay. GT and
HRSG will be
new. Boiler is old
and its overall
condition is very
bad. So higher
maintenance
compared to
repowering and
new plant option.
The plant is
completely new. So
maintenance will be
very low.
Cost
Capital cost USD 264 million
(augmented Cost
USD1,183/kW )
USD 145 million
(augmented Cost
USD1,690/kW)
USD 141 million
(augmented Cost
USD1,263/kW)
USD 311 million for
Single pressure and
407 million for Triple
Pressure HRSG
Annual O&M
Cost Variable Cost US
$ 6.0 million.
Fixed cost US$
0.9 million
Variable cost
US$ 4.0 million,
Fixed cost US$
0.6 million
Variable cost US
$ 4.3 million.
Fixed cost US$
0.7 million.
Variable cost US$
5.6 million
Fixed cost US $
0.9 million.
Environmental Issues
Emission Air and GHG
emission (488 g
CO2/kWh) will be
less as the fuel
consumption is
less
Higher GHG
emission (618 g
CO2/kWh) due to
no-control system
for air emissions
Higher GHG
emission (651 g
CO2/kWh) due to
no-control system
for air emissions
Equal or less GHG
emission (423 g
CO2/kWh for single
pressure and 402 g
CO2/kWh for triple
pressure) of
repowering
Thermal
pollution
Less pollution with
a closed-cycle
cooling system
Less pollution
due to less water
use and less
generation
Less pollution
due to less water
use and less
generation
Less pollution with
a closed-cycle
cooling system

Analysis of Alternatives
5-7
Criteria Selected Option Alternative 1 Alternative 2 Alternative 3
Non/Hazardous
waste
Management of
boiler material
including
hazardous waste
will require special
attention
Existing boiler
will be used
Existing boiler
will be used
-
Social
Improved
power supply
security
224MW additional
power in the grid
98MW additional
power in the grid
124MW additional
power in the grid
-
Employment
potential
Fewer number of
people required
More people
required since
boiler will remain
with the plant
More people
required since
boiler will remain
with the plant
Similar as
repowering
5.4.3 Hybrid Repowering
Full Hybrid
269. For Full Hybrid Repowering it is considered to install a 128 MW E-class gas turbine
with HRSG alongside the running of the existing boiler. The heating up of the full condensate
/feed water flow is done in the HRSG. Both the HRSG and existing boiler will produce
superheated steam. By this way heat requirement in the boiler will be less and the efficiency
of total plant afterward will increase to 43.2%. Total plant net output after Hybrid Repowering
will be 265.7 MW (ambient conditions, new state).
Mini Hybrid
270. In the case of Mini Hybrid Repowering, a variant of Full Hybrid Repowering, the
condensate flow will be preheated additionally by bleed steam from the steam turbine. This
will give a maximum output of the steam turbine of 192 MW and total plant net output after
Mini Hybrid Repowering will be approximately 291.5 MW (ambient conditions, new state).
However the efficiency will be slightly lower (41%) compared to Hybrid Repowering.
271. Advantages of hybrid repowering are:
Higher power output due to additional combined cycle
Efficiency improvement due to addition of a combined cycle
Very flexible, different kinds of operation modes possible
Outage time will be relatively short if first combined cycle is build and then coupling with existing system is done
HRSG can be tuned optimally to existing system
Existing station transformers and connections to the external grid can be kept. Only the new gas turbine transformer requires an additional connection.
272. Disadvantage of hybrid repowering is:
If no bleed steam is needed for pre-heaters, the steam turbine will have to be modified or will otherwise be restricted.

Analysis of Alternatives
5-8
5.4.4 Full Repowering
273. For Full Repowering the feasibility explored 2-gas turbine option and 1-gas-turbine
(GT) option. Full Repowering with the 1-gas turbine option is the most suitable because of
higher exhaust gas temperature of the GT and less expenditure due to single GT and
HRSG. But to achieve required flow and temperature of superheated steam, for both cases
supplementary firing is required. Expected efficiency of 1-GT option is 54.6% and an output
of approximately 403.5 MW.
274. Advantages of Full Repowering are:
Efficiency improvement is much higher than any of the other options.
Considerable higher power output and total output would be more than two times of existing output
State-of-the-art plant, everything almost new (except the steam turbine)
With bypass stack very short start-up time and high flexibility. If the steam turbine is out of order, power output is still possible
Because of re-usage of existing steam turbine and condenser, lower investment costs than a complete new combined cycle plant.
275. Disadvantages of Full Repowering option are:
Relatively long down time of the unit. Existing boiler will be demolished, new combined cycle(s) have to be installed
Restrictions to design because of usage of existing steam turbine. Because of this also not the highest obtainable efficiency (which would be around 60% with a completely new combined cycle).
5.4.5 New Combined Cycle Power Plant
276. A probably alternative for repowering was to study a new combined cycle of 450 MW
capacity. Four options have been elaborated two with single pressure (option A and B) and
two with triple pressure steam operation (option C and D) and on the foundation of a current
unit or at the north east side of the complex. The total plant output of the single pressure
option under ambient conditions is approximately 375 MW and the triple pressure 390 MW
under new state. The efficiencies of the single and triple pressure steam cycle are 57% and
59%, respectively.
5.5 Plant Layout Alternatives
277. Layout of the different repowering options are presented below:
Layout for Hybrid/mini Hybrid Repowering;
Layout for Full Repowering
New Combined Cycle Power Plant on foundation of Unit 4.
New Combined Cycle Power Plant on east side of the Complex.
278. For layout planning of the above options, the following assumptions were taken into
consideration:
a) The various installations, store buildings, some temporary sheds and low voltage overhead lines on the north side of the complex shall be demolished to accommodate new gas regulating station, along with gas compressor, GIS

Analysis of Alternatives
5-9
substation, gas pipe lines, HV cable lines and lay down area during construction. The existing gas regulating station for Units 1 to 4 and 5 & 6 will be retained.
b) New gas regulating station with Gas Compressor is to be installed south of the existing fuel oil tanks, so that the gas pressure is maintained at a minimum of 460 psi.
c) There are no obstacles along the proposed routes of the gas pipe lines and HV cable lines. However, at one point HV cable going out from gas turbine generator for each such unit to GIS sub-station will cross the Gas line where appropriate protection will be required.
d) The large equipment shall be transported via the River Shitalakhya up to the existing Jetty. The heavy cargoes shall be unloaded on the Jetty by crane of appropriate capacity which may be brought with the barge or rented from other sources for unloading the cargoes. There shall be no obstacles for transportation from the existing Jetty up to the proposed site of the equipment to be installed.
e) For reducing the outage time of the existing power station during construction period of the new gas turbine, the Gas Turbine Generator and HRSG shall be installed first at the north side of the target Unit 4 for Hybrid/Mini Hybrid and Full Repowering options.
f) The old existing control system of the target unit shall be completely replaced by new state-of-the-art control system during shutdown of the concerned unit for interfacing between existing and new system.
5.5.1 Layout of Hybrid / Mini Hybrid Repowering
279. For layout of Hybrid/Mini Hybrid Repowering, the assumptions considered for layout
planning indicated in Section 5.5 are applicable. For Hybrid repowering, new gas turbine,
gas turbine generator, and HRSG will be installed parallel to the existing boiler and the
present boiler and steam cycle can be used. The steam supply of the de-rated original boiler
and new HRSG can be connected with each other and feed the existing turbine. The ground
plan size of gas turbine, gas turbine generator and HRSG including BOP are estimated to be
35 m x 85 m.
280. The following equipment has been considered for layout planning:
Installation of new gas turbine generator (GE9E) at the north of the Unit 4
Installation of new HRSG (Equivalent Capacity) at the north of the Unit 4
Adjustment of Balance of Plant
New GIS Substation for the gas turbine generator
Installation of a new gas regulating station along with Gas Compressor to
maintain gas pressure at minimum 460 psi at the location probably south of the
existing Fuel Oil Tanks(these fuel tanks will be maintained)
Installation of a bypass stack.
281. The footprint of Hybrid and Mini Hybrid Repowering will be the same.
5.5.2 Layout of Full Repowering
282. In Full Repowering the existing boiler is replaced with one or more gas turbines and
heat recovery steam generators (HRSG). The exhaust gases of the gas turbine are fed into
the HRSG. The steam generated in the HRSG is supplied to the existing steam turbine. For
layout of Full Repowering, the assumptions considered for the layout planning indicated in
Section 5.5 are applicable.

Analysis of Alternatives
5-10
283. The following equipment has been taken into consideration for layout planning of Full
Repowering:
Installation of new gas turbine generator
Installation of HRSG (Equivalent Capacity)
Adjustment of Balance of Plant
New GIS substation for the gas turbine generator
Installation of a new gas regulating station along with of Gas Compressor to
maintain gas pressure at minimum 460 psi to be installed south of the existing
Fuel Oil Tanks (will be maintained)
Installation of a bypass stack.
284. The footprint of the new equipment require for repowering, such as gas turbine
generator and HRSG including BOP are estimated to be 45 m x 110 m. Two layout options
are considered, one for 1:1:1 configuration, i.e., 1 Gas Turbine, 1 HRSG and 1 Steam
Turbine and one for 2:2:1 configuration, i.e., 2 Gas Turbines, 2 HRSG and 1 Steam Turbine.
5.5.3 Layout of New CCPP at North East side of Unit 6
285. The possible layout of a new Combined Cycle Power Plant unit near Unit 6 on the
North East side of the premises has been investigated. For this new combined cycle unit, a
complete new cooling water system will be required. Also the connections of the steam
turbine and gas turbine generators require new installation. The same gas turbine generator,
steam turbine generator and HRSG of the above option in Section 5.5 for new CCPP on the
foundation of the existing units have been considered for this option as well. For New
Combined Cycle Power Plant on foundation of Unit 4, the assumptions considered in Section
5.5 are applicable except Item f. It may be mentioned that, BPDB has already decided to
install a new 365MW combined cycle power plant at the same location for which tender has
already been invited.
5.6 Alternatives for Cooling Water System
286. Present cooling system of Unit 4 is once through open cooling system supported by
cooling tower during winter or during maintenance of cooling water (CW) pumps.The design
cooling water quantity is 27,500 m3/h for the 210MW generation plant. Present generation is
180 MW. But due to maintenance problems some plant components like HP heaters are not
in service and hence all HP extractions are closed resulting an increased steam flow to
condenser. During winter or during any breakdown of CW pumps an additional support from
the existing cooling tower is required. Due to lack of maintenance some cooling tower
components like blower motors, induced draft fan etc. are not working properly, resulting in a
more extensive thermal plume (about 90C warmer than the ambient water temperature). For
this the additional cooling tower support is needed. The present status is that due to the tidal
flow of the river the intake water temperature is escalating from the ambient water
temperature due to the thermal plume discharge at the downstream (higher thermal plume),
resulting a warmer water intake. BPDB is currently considering closed-cycle cooling system
for all new power generation projects including proposed 365MW CCPP in GPS and
Siddirganj 335MW CCPP.
287. The feasibility study has recommended to study water balance in Shitalakhya River
for the life of the project and make a decision. Based on the water balance modeling results,

Analysis of Alternatives
5-11
it is predicted that Shitalakhya will have sufficient water available for condenser cooling, and
based on existing study19 water quality will not pose any immediate threat to the repowering
Project in Ghorashal. However, temperature increase by thermal discharge from cooling
system of Unit 4 is currently violating WBG Guidelines in the thermal plume zone of
influence. Hence, the Consultant would like to recommend that a closed-cycle cooling
system is considered in the repowering of Unit 4 to bring the Unit under compliance with
WBG Effluent Guidelines. By introducing close-cycle cooling water requirements will be
significantly reduced from 6.04 m3/s to 0.0191 m3/s. A comparison of new cooling tower,
refurbishment of existing cooling tower, and open cycle cooling is presented in Table 5-3.
Table 5-3: Condenser cooling water alternatives
Condenser
Cooling water
Refurbishment of
existing cooling
system
New cooling tower
(closed cycle)
Open Cycle
Cooling System
Technical requirement
Temperature
increase by
thermal discharge
from cooling
system (30C)
Yes, but capacity may
be a concern to serve
repowering unit,
eventually unable to
maintain WBG guideline
of effluent discharge
quality
Yes. New cooling
tower with adequate
capacity (existing
tower can also be
used if found suitable)
can serve repowering
No. Can’t maintain
the WBG
guideline of
effluent discharge
quality
Efficiency Less efficiency due to
old system
Higher efficiency due
to new construction
-
Energy
consumption
Less energy
consumption due to low
capacity
Higher energy
consumption due to
large capacity,
however, reduction in
pumping of Rawwater
will offset the overall
energy consumption
Energy
consumption in
pumping only
Life time Less life time due to old
system
Full life time due to
new system
Not applicable
Constructability
Available Materials Refurbishment Materials
Available. Blower motors
and induced draft fan
may require import
Construction Materials
mostly Available.
Some of the
components may
require import
The system is
already working.
No new
construction
required, except
increasing the raw
water quantity
Disposal or recycling of
old materials
Dismantling of
existing towers will
generate solid waste
for disposal
No solid waste
generation
19 Alam, M. A., Badruzzaman, A. B. M, and Ali, M. A (2012); Spatiotemporal Assessment of Water Quality of
the Sitalakhya River, Bangladesh, Intl. Journal of Engineering and Technology Volume 2 No. 6, pp. 953-962

Analysis of Alternatives
5-12
Condenser
Cooling water
Refurbishment of
existing cooling
system
New cooling tower
(closed cycle)
Open Cycle
Cooling System
Operation and Maintenance
Maintenance Regular maintenance
with chlorine required to
clear bacteria
Regular maintenance
with chlorine required
to clear bacteria
Maintenance of
CW pumps
required
Operation Water circulates in a
closed cycle and is
subjected to alternate
cooling and heating.
Heat is dissipated in the
atmosphere through
Water circulates in a
closed cycle and is
subjected to alternate
cooling and heating.
Simple operation
Cost
Investment cost Refurbishment cost is
estimated as US $12
million
Construction cost of
new cooling system is
estimated as US $16
million
Construction of a
retention pond
may be required
Yearly O&M Cost Proposed one will be
completely new. So
O&M cost of existing
one will be more than
the proposed one.
Much less than the
proposed one.
O&M costs
involve CW
pumping and
operation
Environmental
Thermal pollution May be difficult to fulfil
thermal plume
requirements, as the
capacity of the existing
system may not be
sufficient to fulfil the
requirements of all
repowering units
May or may not fulfil
thermal plume
requirements, as the
capacity will be design
to cater the
requirements of all
cooling water needs
of the plant
Can’t fulfil thermal
plume
requirements,
unless further
investment in
retention pond or
dilution effluents
with additional
water before the
discharge
Water
requirements
7.6389 m3/s of water
required for cooling
water system
0.38194 m3/s of water
required for cooling
water system
7.6389 m3/s of
water required for
condenser cooling
Generation of solid
waste
Disposal of refurbished
parts and components
Disposal of existing
cooling tower
materials
No solid waste is
generated
Noise Level Generation of noise Generation of noise No noise
generation
Social
Irrigation water Not possible to continue
irrigation water supply to
agriculture field.
Not possible to
continue irrigation
water supply to
agriculture field.
Positive impact by
irrigating 4,000
acre of croplands

Analysis of Alternatives
5-13
5.7 Alternatives for Water/Effluent Treatment
288. Currently, existing water/effluent treatment systems consists of, (a) effluent treatment
is currently done by neutralizing effluents using acid and alkali, (b) a demineralization plant
with capacity about 94 ton/h with two cells, (c) a rawwater treatment plant with capacity 300
ton/h having clarifier, coagulator, filter etc., and uses aluminum sulfate to treat Rawwater,
and (d) There is no sludge treatment plant in GPS. Currently hydrazine is used in GPS as
scavenger chemicals to remove oxygen in the boiler feed water system. Hydrazine is a toxic
chemical (a carcinogen) which require proper treatment prior to disposal at the river, which
also supports food processing systems in up and downstream.
289. A new separate effluent treatment plant (ETP) along with the water treatment plant
(WTP) is recommended with state-of-art equipment to treat raw and effluent water and
sludge produced in Unit-4. The new plant will have (a) an effluent treatment plan with a
capacity of 450 tons/h. A central monitoring basin (CMB) of RCC construction shall be
provided to collect all plant effluents. Quality of the effluents shall be measured, monitored
and treated. Through a set of waste effluent disposal pumps and piping, the same shall be
disposed of from CMB up to final disposal point at a safe distance, (b) a reverse osmosis
(RO) system to treat demineralization water with capacity of about 225 ton/h (3 cells @
75ton/h), two cells in service and one standby. The proposed RO plant is designed for the
combine use of the entire plant to replace current resin based demineralization. Economic
analyses have demonstrated that when the total dissolved solids content of feed water is
above 200 mg/l, RO is the most cost-effective demineralization technology. Based on the
water quality analysis TDS content observed in between 210-239 mg/l, (c) rawwater
treatment plant with capacity 450 ton/h, and (d) sludge treatment plant with capacity 100
ton/h.
290. There are a number of environmentally friendly alternatives to hydrazine, (a)
Erythorbic acid and its sodium salt can replace scavenger chemicals like Hydrazine as
oxygen scavengers. Sodium Erythorbate is a non-toxic oxygen scavenger that can be used
also in food processing systems and (b) HELAMIN is formulations consisting of poly-
carboxylates and surface-active fatty alkyl polyamines in combination with other amines of
varying volatility. EPC contractor in their proposals states a possible environmental friendly
alternatives to replace hydrazine as scavenger chemicals in the feed water of new HRSG.
Owner’s engineer will review the proposal and in consultation with GPS a final decision will
be made.Various alternatives for water/effluent treatment is presented in Table 5-4.
Table 5-4: Water/effluent treatment alternatives
Criteria/Sub criteria Existing Plant Proposed CWT Plant
Technical Requirements
Life time/extension
Capacity (a) No effluent treatment plant
exist, only a neutralization pond.
(b) Demin plant capacity is about
94 ton/h with two cells.
(c) Rawwater treatment plant
capacity is 300 ton/h having
clarifier, coagulator, filter etc.
and uses of aluminum sulfate.
(d) Hydrazine is used as
(a) A new CWTP with capacity to
treat 450 tons/h of water
(Effluent).
(b) A reverse osmosis for demin
plant with capacity about 225
(3x75) ton/h, two cells in service
and one standby.
(c) Rawwater treatment plant with
capacity 450 ton/h.

Analysis of Alternatives
5-14
Criteria/Sub criteria Existing Plant Proposed CWT Plant
scavenger chemicals to remove
oxygen in the boiler feed water
system.
(e) No sludge treatment plant
(d) More environment friendly
alternatives (Sodium Erythorbate
or Helamin) of hydrazine are
proposed to treat feed water.
€ Sludge treatment plant capacity
100 ton/h.
Life time extension With maintenance the plant may
run for few more years
25 years or more.
Efficiency
improvement
Very old plant. May have
present efficiency 35-40%
90%
Fuel
consumption/energy
requirement
Will need more energy as the
plant is old with outdated
technology
Will need less energy as the plant
is new with latest technology
Constructability
Suitability of
construction /erection
Existing Suitable for construction
Materials/Machineries
required as per the
considered options are
available
Not applicable Construction Materials available.
Machineries need to be imported
Disposal of
non/hazardous waste
Municipal people collects non-
hazardous waste periodically
and liquid non-hazardous waste
flows to river.
Municipal people collects non-
hazardous waste periodically and
liquid non-hazardous waste flows
to river.
Operation and Maintenance
Automated Control
System
Semi-automatic Full automatic
Operation and
Maintenance ease
Old and less efficient, needs
more man power, more
expenditures
Easy to operate, easy to maintain,
less man power, less expenditure
Cost
Construction Cost -------- US $ 8 Million
Operation Cost
(including Maintenance
and Energy cost)
US $1.25Million About US $1Million
Environment
Water pollution Toxic chemicals from hydrazine
and resin based
demineralization posed greater
threat
State-of-art non-toxic chemicals
are proposed for various system.
Reverse Osmosis is proposed to
make demi water
Effluent quality Poor boiler water quality,
inefficient effluent treatment
Will produce high quality boiler,
better neutralization of effluent
Social
Employment Potential Will use the same number of
staffs
Some people may lose job but
some job opportunity will be
created for highly skilled people.

Analysis of Alternatives
5-15
5.8 Selected and Recommended Options
291. Selected and preferred option of various components of the project are finalized
based on the Engineering Design and EIA study. The Figure 5-2 shows the overall layout of
the project components selected for inclusion in the project design. Table 5-5 provides a
summary of the selected alternatives for each component included in the project.

Figure 5-2: Selected plant layout of full repowering

Analysis of Alternatives
5-17
Table 5-5: Recommended and selected options of Unit 4 Repowering
Component Design Features Included in Engineering Design Report
Repowering
Options Full Repowering is technically the most attractive option for repowering of
Unit 4 Ghorashal PowerStation because the expected output and efficiency
is much higher compared to the hybrid repowering solutions.
Plant Layout
Alternatives
For full repowering 1 Gas Turbine, 1 HRSG and 1 Steam Turbine
configuration has been chosen over other options. First gas turbine
generator will be placed and commissioned, then existing boiler will be shut
down and dismantled and the new HRSG will be installed at the footprint of
the existing boiler. Limitation of space is one of the major reason for
rejecting 2:2:1 configuration.
Cooling water
system
Closed-cycle cooling system with new cooling tower construction is
considered in the repowering of Unit 4 to comply with the WBG guideline of
effluent discharge quality (30C difference between effluent water at mixing
zone and ambient water temperature)
Water/effluent
treatment
plant
New central water treatment plant is recommended with state-of-art
equipment to treat raw and effluent water and sludge produced in the GPS
including the requirements of repowering and new 365 MW combined cycle
power unit. The new plant will have (a) an effluent treatment plan with a
capacity of 450 tons/h, (b) a reverse osmosis (RO) system to treat
demineralization water with capacity of about 225 ton/h (3 cells @ 75ton/h),
two cells in service and one standby, (c) rawwater treatment plant with
capacity 450 ton/h, and (d) sludge treatment plant with capacity 100 ton/h.

6-1
6. Description of the Environment
6.1 Introduction
292. This chapter on environmental and social baseline has been prepared using both
primary and secondary data collected for the proposed Project site and defined study area.
The baseline condition has been defined in respect of physical environment (e.g., including
meteorological, hydrological, geological components and processes), biological environment
(e.g., including flora, fauna, and ecosystems), land use pattern, agriculture practices, cultural
activities, economic status, and hazards of the study area.
6.2 Topography
293. The study area mostly lies in flat topography. Presently, the area is dominated by
agricultural practices followed by settlements, fishing during wet season. The ground
elevation gently lowers from east to west. The Project site is situated at the elevation ranges
between 7-12 m PWD (Figure 6-1). The entire area is vulnerable to occasional riverine flood.
Topographic survey has been conducted to collect the spot level and to prepare the
elevation contour of the area. Figure 6-2 envisages contour lines of the site.

Analysis of Alternatives
6-2
Figure 6-1: Digital Elevation Map of the study area

Analysis of Alternatives
6-3
Figure 6-2: Contour line map of the Project site

Analysis of Alternatives
6-4
6.3 Land Use and Land Cover
294. An overview of the land use and land cover pattern has been prepared based on the
satellite images and presented using Geographical Information System (GIS). The total land
of the study area is 31,415 hectares. The land cover of the study area is derived from multi-
spectral color Rapid Eye satellite images of 15th February, 2013 and 29th March, 2014. The
major classes extracted from the images are as follows: agricultural land, char
land/sandbars, forest, industrial area and other land uses (i.e., road, rural settlement with
homestead vegetation, built-up area and water bodies). Figure 6-3 shows the detailed
general land use map of the study area.
295. The area is mostly surrounded by agriculture land (15,457 ha, which is 49.2% of the
total area) followed by rural settlement with homestead vegetation of 38.5%, water bodies
5.74%, built-up area amounting to 1.7%, forest land cover of 1.5%, industrial area (including
Ghorashal Power Plant) of 1.3%, road coverage 1.01%, other land uses of 0.78% and char
land/sandbar occupying a very insignificant area of 0.04%. The detail area coverage of each
class and sub class is given in the Table 6-1.
Table 6-1: Land covers classification
Major Class Sub-Class Area (ha) (%)
Agricultural Land
Aman-Fallow-Fallow 141.7 0.45
Aman-Boro-Fallow 6208.3 19.76
Aman-Boro-Other Crops 2753.6 8.76
Fallow-Boro-Fallow 5240.1 16.68
Permanent Fallow 15.0 0.05
Fallow-Fallow-Robi Crops 1098.3 3.50
Built-up Area Built-up Area 554.5 1.77
Char Land/Sand Char Land/Sand 13.1 0.04
Forest Plantation 21.2 0.07
Vegetation 448.7 1.43
Industrial Area Industrial Area 433.9 1.38
Other Land Uses
Area Under Development 63.1 0.20
Brick-field 182.4 0.58
Chatal 0.2 0.00
Road
Access Road 17.2 0.05
National Road 21.1 0.07
Railway 24.6 0.08
Regional Road 36.1 0.11
Rural Road 126.6 0.40
Zila Road 92.2 0.29
Rural Settlement with Homestead Vegetation
Rural Settlement with Homestead Vegetation
12121.6 38.58
Water Bodies
Beel 197.7 0.63
Canal 14.2 0.05
Ditch 348.6 1.11
Pond 472.4 1.50
River 750.3 2.39
Seasonal Waterbody 18.6 0.06
Total 31415.5 100
Source: Satellite image analysis

Analysis of Alternatives
6-5
Figure 6-3: General land use map

Analysis of Alternatives
6-6
6.4 Geology
296. Physiographically, the area falls partly in the Young Brahmaputra – Jamuna
floodplain and Madhupur tract which are marked respectively as code 3 and 16b on the
physiographic map of Bangladesh. The area is located in the central part of the Bengal
basin– an extensive alluvial plain of the quaternary sediments laid down by the Ganges-
Brahmaputra-Meghna river system.
297. The surface of the area is covered by paludal deposit. The thickness of this section
ranges from 7 to 9 meters. It is composed of Holocene river alluvium, meander, inter-stream,
swamp deposit, marsh clay and peat. Immediate below this section underlies 16,000 m thick
sequence of quaternary sediments. Lithology shows that the area comprises of alternation of
sand/silt and clay sequences.
298. As per tectonic classification, the area falls under Madhupur Tripura threshold of
eastern platform flank of the Bengal basin. Tectonically this area is inactive and no apparent
major structure like fault or fold exists in the region that might be geologically significant
(Figure 6-4).
6.5 Seismicity
299. Ghorashal was under Zone II with design Peak Ground Acceleration (PGA) value of
0.15g (Z=0.15) according to the seismic zoning map of Bangladesh provided in BNBC
(Bangladesh National Building Code 1993). This level of acceleration may be considered as
more or less equivalent to a seismic intensity of VII. Historical information reveals that
earthquakes of magnitude around 6 stroke in the past in the vicinity of Ghorashal. Thus, the
nearby areas were considered as the Medium Risk Zone for earthquakes.
300. However, the BNBC adopted new code in 2010 after Bangladesh experienced
several shock wave of higher intensity. This proposed seismic zoning map based on PGA
values for a return period of 2475 years. The country is divided into four seismic zones with
zone coefficient Z equal to 0.12 (Zone 1), 0.2 (Zone 2), 0.28 (Zone 3) and 0.36 (Zone 4).
301. In the newer adopted code of BNBC 201020 (Figure 6-5), it is observed that the
Project area is on the border line of the Seismic Zone II (seismic coefficient 0.20 g) and
Seismic Zone III (seismic coefficient 0.28 g). This zone has the mediocre vulnerability for
earthquake in Bangladesh with a risk of possible earthquake of magnitude 6 (on Richter
scale).
20 Sarraz A., Ali M. K., Das D. C., 2015; Seismic Vulnerability Assessment of Existing Buildings
Stocks at Chandgaon in Chittagong city, Bangladesh, American Journal of Civil Engineering 2015;
3(1): 1-8, retrieved from http://www.sciencepublishinggroup.com/j/ajce

Analysis of Alternatives
6-7
Figure 6-4: Project site shown on the Generalized tectonic map

Analysis of Alternatives
6-8
Figure 6-5: Project site shown on seismic zone map

Analysis of Alternatives
6-9
6.6 Surface Water Resources
302. The Shitalakhya River is main water system that flows in close proximity of the
proposed site of the project, is a distributary of the Old Brahmaputra River (Figure 6-6). It
receives fresh water flow from the Old Brahmaputra and the Lower Banar River. The off-take
of the Shitalakhya River is Old Brahmaputra River at Monohordi Upazila under Narsingdi
district and drains into the Dhaleswari River in Narayanganj district. Due to the desertion of
the original link to the Old Brahmaputra River, the Shitalakhya River receives most of its
freshwater flow presently through the Lower Banar River as shown in Figure 6-6. The
relatively inert geo-morphological characteristics of the Shitalakhya River guarantee fairly
suitable water depths for navigation, throughout the year.
6.6.1 Surface water system
303. Shitalakhya is a tidal river and the maximum average variation of water level is 20 cm
between high tide and low tide. The river is perennial in nature and the average lowest
discharge is during dry season (January) with a flow of 83 m3/s and the average lowest
water level during low tide is 0.94 mPWD close to the study area. The average highest flow
observed during rainy season (Jul- Sept) and varies from 1,181 m3/s to 1,066 m3/s and the
average maximum water level during the high tide is 6.62 mPWD. There is no other
significant surface water system found around the project area.
304. The river inundates nearby agricultural lands during monsoon and remains navigable
round the year. The tendency of the river erosion is very low. Based on water availability and
navigation facilities, a large number of industries have been established along its banks both
up and downstream. Bangladesh Inland Water Transport Authority (BIWTA) declared this
river as a class III route of Bangladesh. The relatively inert geo-morphological characteristics
of the Shitalakhya River guarantee fairly suitable water depths for navigation, throughout the
year.

Analysis of Alternatives
6-10
Figure 6-6: Water resources system map of the study area

Analysis of Alternatives
6-11
6.6.2 Shitalakhya water availability assessment
305. The Shitalakhya River was one of the main distributaries of the Brahmaputra River in
the eighteenth century. The Banar River was also contributing flow to the Shitalakhya River.
During the middle of the twentieth century, the avulsion process of the Brahmaputra was
completed and, like the Shitalakhya River, the Old Brahmaputra received a small amount of
flow from the Jamuna River. During this period the main link channel from the Old
Brahmaputra to the Shitalakhya River became abandoned.
6.6.3 Water Balance during Base Condition (1981-2012)
306. Water balance is the assessment of water resources and its use in the system. The
main principle of water balance is that the difference between total incoming water and total
losses should equal to the storage change in the system. The calibrated and validated model
has been simulated for the period of 1981 to 2012 to estimate the availability of water for the
study area. The simulation results of the annual and monthly water balance for the study
area are shown in Figure 6-7.

Analysis of Alternatives
6-12
Figure 6-7: Water balance of the study area (a) annual and (b) monthly for the period
1981-2012
307. The average annual rainfall is 2,055 mm. The monsoon starts from April and reaches
its peak in July. There is a decreasing trend of rainfall during the month of August, a slight
increase in September and then rapidly decrease again. The maximum monthly precipitation
is about 375 mm.
308. Rainfall in watersheds/catchments is main inflow whereas the evapo-transpiration
and percolation and other abstraction are losses. The balance contributed into the river as
surface runoff and subsurface flow. The annual actual evapo-transpiration of the area is 776
mm which is 37% of the annual rainfall. The evapo-transpiration is maximum during April
and May and which is about 107 mm per month. The evapo-transpiration rate is minimum
during November to February. The percolation rate for the study area is 575 mm per year
which is 28% of the annual rainfall. The percolation rate follows similar trend like rainfall and
the maximum rate is 112 mm per month. After the losses of water through evapo-
transpiration and percolation, the remaining water contributes to stream flow as overland
flow and lateral (subsurface) flow. Around 43% (874 mm) of rainfall contributes to stream
flow through surface runoff while the lateral flow is negligible only 83 mm.
6.6.4 Water level analysis
309. Shitalakhya is a tidal river where dry season tidal range is about 20 cm which
reduces to a few centimeters during the monsoon. The average maximum and minimum
water level varies seasonally from 5.86 mPWD to 1.24 mPWD respectively at the project site
during the base condition. Generally, the river reaches its highest water level in the months
between July and September and the lowest in the months between January and March.
The historical highest and lowest water level was found at the project site for base condition
is about 8.00 and 0.70 mPWD, respectively, as shown in Figure 6-8.

Analysis of Alternatives
6-13
Figure 6-8: Water level of Shitalakhya River near GPS (Base condition)
6.6.5 Discharge analysis
a) Average Seasonal Flow (1981-2012)
310. The annual discharge distributed seasonally in Shitalakhya is about 7% (980 Mm3) in
dry (December-March), 6% (842 Mm3) in pre monsoon (April-May), 72% (10,545 Mm3) in
monsoon (June-September), and 16% (2,300 Mm3) in post-monsoon (October-November)
seasons. The flows are mainly concentrated during the monsoon period (highest) and pre
monsoon (lowest), as shown in Figure 6-9.
Figure 6-9: Average seasonal outflow from the basin during 1981-2008
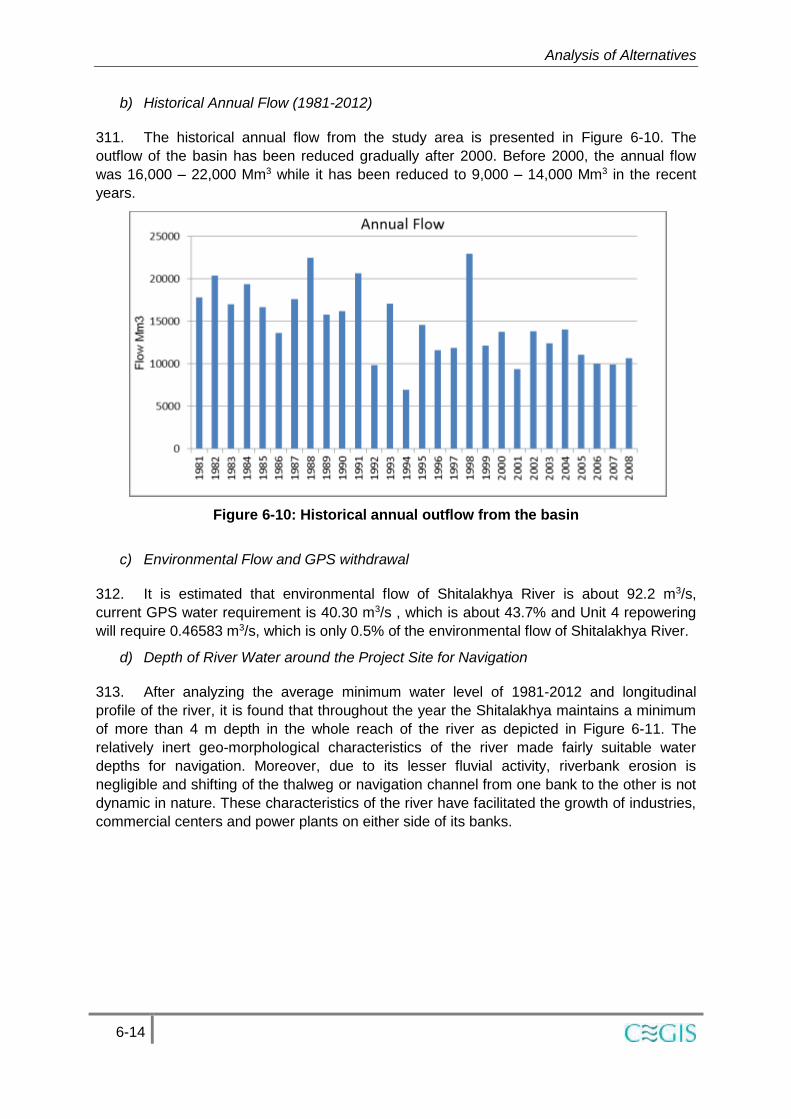
Analysis of Alternatives
6-14
b) Historical Annual Flow (1981-2012)
311. The historical annual flow from the study area is presented in Figure 6-10. The
outflow of the basin has been reduced gradually after 2000. Before 2000, the annual flow
was 16,000 – 22,000 Mm3 while it has been reduced to 9,000 – 14,000 Mm3 in the recent
years.
Figure 6-10: Historical annual outflow from the basin
c) Environmental Flow and GPS withdrawal
312. It is estimated that environmental flow of Shitalakhya River is about 92.2 m3/s,
current GPS water requirement is 40.30 m3/s , which is about 43.7% and Unit 4 repowering
will require 0.46583 m3/s, which is only 0.5% of the environmental flow of Shitalakhya River.
d) Depth of River Water around the Project Site for Navigation
313. After analyzing the average minimum water level of 1981-2012 and longitudinal
profile of the river, it is found that throughout the year the Shitalakhya maintains a minimum
of more than 4 m depth in the whole reach of the river as depicted in Figure 6-11. The
relatively inert geo-morphological characteristics of the river made fairly suitable water
depths for navigation. Moreover, due to its lesser fluvial activity, riverbank erosion is
negligible and shifting of the thalweg or navigation channel from one bank to the other is not
dynamic in nature. These characteristics of the river have facilitated the growth of industries,
commercial centers and power plants on either side of its banks.

Analysis of Alternatives
6-15
Ch 0.00 km at Lakhpur; Ch 8.40 km at near Ghorashal power plant and Ch 47.65 km at Demra
Figure 6-11: Long profile of the Shitalakhya River from Lakhpur to Demra
6.6.6 Ground water system
314. In the GPS, potable water is generally used from the ground water source while river
water is used for condenser cooling and other plant purposes. It is reported from the DPHE
that the average depth of the shallow tube well in the project area is 61 m (200 ft). According
to Bangladesh Water Development Board, the ground water level of Palash Upazila is about
6.5 m. There is a good availability of ground water abstracted using tubewells for drinking
and domestic purposes. Most of the industries are using water from deep tube wells in their
premises to meet the water requirements. The scattered homesteads are using hand tube
well (HTW) to meet their domestic demand having no specific complaint about non-
availability of ground water.
6.7 Natural hazards
315. Bangladesh is susceptible to several natural hazards, such as, flood, drought, river
bank erosion, cyclone etc. This is due to its combination of geographic, physiographic,
morphological and other natural features which have led to the direct loss of life and
properties, and sometimes on a massive scale. Among these various natural hazards flood
is the most recurring one, hence analyzed within the framework of this study.
316. Flood: Bangladesh is receptor of flows from three major rivers namely the Ganges,
the Brahmaputra and the Meghna. The origin of these rivers are located outside its national
boundary. It was observed that extreme flood events occurred due to excessive rainfall in
the catchments mostly upper basins. When a water level in the major river systems rises
simultaneously and crosses the danger levels, the flood usually occurs all over the country.
This was observed during the three major floods of 1987, 1988, and 1998. Water levels
crossing the danger levels start occurring from mid-July and continue till mid-September.
Inundated area during 1987, 1988 and 1998 were 66%, 68% and 70%, respectively.
Duration of the extreme flood events usually extends from 15 days to 45 days occurred
during 1998. Sometimes, Individual River may also experiences extreme flood events due to
excessive rainfall in the respective river catchments independently.
317. According to the topographical survey, land alleviation of the proposed Project site
has a formation level of 10 m.PWD. The nearest water level station is situated at Lakhpur in
the Shitalakhya River which is at about 8 km upstream of the proposed project site. Analyses

Analysis of Alternatives
6-16
of the historical water level data of this station show that the maximum water level reached
at about 8 m.PWD since 1980 (Figure 6-12). The highest water level was recorded 7.84
m.PWD in 1988 which was an extreme flood event in Bangladesh. These observation
indicates that the proposed project site is not vulnerable to flooding unless any extreme
natural hazards occur in future.
4
5
6
7
8
9
1980 1985 1990 1995 2000 2005
Wat
er
Leve
l (m
PW
D)
Year
Maximum Water Level at Lakhpur
Figure 6-12: Maximum water level of different years at Lakhpur
6.8 Physical Environment
6.8.1 Climate and Meteorology
318. The project site is located in Dhaka Division. According to Köppen climate
classification, it falls under Aw category which is characterized by tropical wet and dry
climate. Hence, it experiences hot and humid summer and dry winter. According to the
climatic characteristics, Bangladesh is divided into 7 different climatic sub-regions. The study
area of the project falls under category “G”, which is the south-central climatic zone of the
country (Figure 6-13).

Analysis of Alternatives
6-17
Figure 6-13: Climatic zone of the proposed plant location
319. The summary of the analysis of the climatic and meteorological parameters are
discussed in the following sections:
320. Temperature: Temperature data of Dhaka Station from Bangladesh Meteorological
Department (BMD) for 34 years (from January 1980- December 2013) has been analyzed to
see the monthly variation of the average maximum temperature which is between 39.60C to
30.10C. The monthly variation of the average minimum temperature is 22.50C to 6.50C. The
maximum recorded temperature in Dhaka station was 39.60C, which occurred on March,
1999 and April, 2009. On January 1995, the minimum temperature was recorded as 6.50C in
Proposed Site

Analysis of Alternatives
6-18
Dhaka. The warmest month of the year is April and the coldest month of the year is
January. Figure 6-14 shows the maximum, minimum, average of maximum and average of
minimum temperature of Dhaka station from 1980 to 2013.
Figure 6-14: Monthly maximum, minimum and average temperature
321. Rainfall: Monsoon is a prominent season in this area. The average monthly rainfall
during monsoon (June-September) season from 1980-2013 is 332 mm/month. The variance
in the maximum rainfall during monsoon season is 836 mm/month to 552 mm/month,
whereas the variance in the minimum rainfall is 136 mm/month to 59 mm/month. The
maximum 836 mm/month rainfall was recorded during September of the year 2004. Annual
average rainfall is 2066 mm/year and the highest recorded yearly rainfall was 3028 mm in
the year 1984. The driest period of the year is winter when the average monthly rainfall
varies from 21 mm/month to 7.21 mm/month. Figure 6-15 shows the maximum, minimum
and average rainfall from 1980-2013.
Figure 6-15: Monthly Maximum, Minimum and Average Rainfall
Humidity
322. Humidity: The average relative humidity remains higher during the monsoon
season. The variance in the average relative humidity throughout the year is 83.77% to

Analysis of Alternatives
6-19
62.47%, whereas during monsoon the variance is 83.77% to 82.40%. Figure 6-16 shows the
maximum, minimum and average relative humidity of Dhaka station from January 1980 to
January 2013.
Figure 6-16: Maximum, Minimum and Average Relative Humidity
323. Wind Speed and Direction: The direction of wind varies depending on the seasons.
Therefore, whole year has been categorized into four clusters of months and these are:
Cluster-1: December-March, Cluster 2: April-June, Cluster 3: July to September, and Cluster
4: October to December. Wind speed data and direction have been collected from the Dhaka
BMD station at a height of 10 m from the ground level. During clusters 1 and 4 months wind
direction is predominantly from northwest to southeast direction, inclined towards east and
for clusters 2 and 3 it is predominantly from south and southeast to north and northwest. In
cluster 1 calm wind prevails for 27.2% of total period, similarly it is 11.0% for cluster 2,
12.5% for cluster 3, and 56.9% for cluster 4, respectively. Figure 6-17 (a, b, c and d) present
wind speed and direction graphically round the year.
December – March
April – June
(a): Wind rose diagram for December-March (b): Wind rose diagram for April-June

Analysis of Alternatives
6-20
July – September
October – December
(c): Wind rose diagram for July-September (d): Wind rose diagram for October-December
Figure 6-17: Wind rose at Dhaka station
324. The Figure 6-18 shows wind speed and direction round the year for 2014 based on
data collected at Dhaka Station and calm wind prevails for 24.8 % time of the year.
Figure 6-18: Annual wind rose for 2014
6.9 Ambient Air Quality
325. Air quality monitoring data from the Continuous Ambient Monitoring Station (CAMS)
in Narayanganj is used to establish the ambient air quality in the project site. The usage of

Analysis of Alternatives
6-21
this data was deemed appropriate since Narayanganj is located approximately 30 km away
from the project site and shares the same airshed. Hourly measurements for NO2, CO, O3,
PM10 and PM2.5 were available from November 2012 to May 2015. USEPA NAAQS
guidelines along with other guidelines were used to refine the data and find ambient
concentrations for 8-hr, 24-hr and annual averaging periods (Table 6-2).
326. Table 6-2 shows the results of the ambient air quality measurements along with
applicable standards and guidelines. The ambient concentrations for NO2, CO and O3 in the
airshed were found to be within the ECR 1997 (amended in 2005) and WHO guidelines. The
ambient concentrations for PM10 and PM2.5 exceed Bangladesh National standards and
WHO Guidelines for both 24-hr and annual averaging periods. The ambient 24-hr SO2
concentration exceeds WHO guidelines but is in compliance with Bangladesh National
standard.
327. Sampling locations of ambient air along with other environmental quality and
ecological and fisheries survey points are presented in Figure 6-19.
Table 6-2: Ambient air quality in the project area
Pollutant Averaging
Time
µg/m3
Measured
Value
Standard
Deviation
WHO
Guidelines
Bangladesh
NAAQS
PM10
24 hour 488.0 - 50 150
Annual 204.0 160.5 20 50
PM2.5 24 hour 311.8 - 25 65
Annual 106.6 104.3 10 16
SO2
24 hour 113.0 - 20 365
Annual 25.4 37.0 - 80
NO2
1 hour 93.0 - 200 -
Annual 22.6 19.9 40 100
CO 1 hour 5,969 - 30,000 40,000
8 hour 4,056 - 10,000 10,000
O3
1 hour 87.3 - 235
8 hour 66.5 120 157
Notes:
1) Annual average for PM2.5, PM10, SO2 and NO2 found by taking arithmetic mean of hourly
data from November 2012 to May 2015.
2) 24-hour average for PM2.5, PM10 and SO2 found by taking 98th percentile of maximum
daily values from November 2012 to May 2015.
3) 1-hour average for NO2 found by taking the 98th percentile of 1-hour daily maximum
concentrations, averaged over 3 years.
4) 1-hr and 8-hr average for CO and O3 found by taking 2nd highest value of measured data
for 2015.

Analysis of Alternatives
6-22
Figure 6-19: Sampling locations of environmental components

Analysis of Alternatives
6-23
6.10 Acoustic Environment
328. Ghorashal power plant has six units among which 5 units were functional during the
collection of baseline noise data. These 5 units, 2 RMS units, construction work of Max-
power plant and operation of Aggreko power plant were the major sources of noise in the
area. Noise levels were measured at 23 locations including 19 sensitive receptors inside and
outside GPS. The locations are shown in Figure 6-19. The measured baseline noise levels
are depicted in Table 6-3.
329. The permissible level of noise as per ECR 1997 for industrial area is 75 dBA (as per
WBG Guidelines it is 70 dBA) during day (7:00-22:00) and 70 dBA during night time (22:00-
7:00) and for residential/institutional/educational zone are 50 dBA during day time (as per
WBG Guidelines it is 55 dBA) and 40 dBA during night time (as per WBG Guidelines it is 45
dBA).
330. The measures noise levels in the project area are compared with both ECR 1997 and
WBG Guidelines and are presented in Table 6-3 (marked red are non-compliant by either
ECR 1997 or WBG Guidelines).
Table 6-3: Baseline noise level at different location around Ghorashal Power Plant
Place Notation Type
Noise Level (LAeq)
Day
Day time standard Night
Night time standard
(dBA) (dBA)
WBG Guideline
Bangladesh standard
WBG Guideli
ne
Bangladesh
standard
Administrative building SR-1 Industrial 68
70 75
70 70
Turbine Area
Industrial 91.1 91.1
Control Room
Industrial 70.2
Mosque/Accounts office of GPS
SR-2 Industrial 58.6 58.2
Near RMS SR-3 Industrial 91
Near Fertilizer Factory SR-4 Industrial 71 71.6
Ghorashal boundary near Aggreko
SR-9 Industrial 68.1 67.3
Inside Aggreko-Max SR-10 Industrial 69.2
Aggreko Gate SR-11 Industrial 69.6 67.6
Outside the plant (Commercial)
SR-12 Industrial/
Commercial 54.3 60.6
Corner of Substation SR-14 Industrial 59.7 60.7
Bazar SR-19 Industrial/
Commercial 68.8 66.7
Near Titas RMS
Industrial 73.5
Kathali Para
Industrial/ Commercial
64.1
Residence in Fertilizer Factory (FF) (West side)
SR-5 Residential 63.3
55 55
45 45
Resident Fertilizer Factory (Outside Boundary)
SR-6 Residential 65.1
Residence Mosque FF SR-7 Residential 60
Residence FF Near Aggreko
SR-8 Residential 67.7
Army Residence SR-13 Residential 55.4 56.1
Residential Area SR-15 Residential 49.3 58.5

Analysis of Alternatives
6-24
Photo 6-3: Water sampling
Place Notation Type
Noise Level (LAeq)
Day
Day time standard Night
Night time standard
(dBA) (dBA)
WBG Guideline
Bangladesh standard
WBG Guideli
ne
Bangladesh
standard
School-Hospital SR-16 Residential 53.8 49.6
Central Residential Mosque
SR-17 Residential 51.6 51
Ghorashal Residence SR-18 Residential 51.4 55.5
6.11 Surface Water Quality
331. All water usage at GPS including Unit 4 are withdrawn from the Shitalakhya River
using symphonic technology. The current water requirement for Unit 4 is about 8.971 m3/s
for condenser cooling, auxiliary cooling, producing demineralized water and other Plant
uses. On the contrary, water requirement for same purposes for the entire GPS is about 40.3
m3/s. The estimated waste water coming from above mentioned usages Unit 4 is about
0.6.05 m3/s (detailed out in Section on Water Balance). Out of which about 0.003 m3/s is
being sent to the neutralization pond and generated sludge from this pond are being kept in
the wastewater pond. The condenser cooling water discharges into the river after passing
through a 1-km long concrete canal (Photo 6-1) where it loses about 2 to 30C before the
disposal at the outfall near the Palash Bazar Bridge (Photo 6-2).
Photo 6-1: Condenser cooling water
discharge canal
Photo 6-2: Condenser cooling water
outfall at Palash Bazar
332. Baseline water quality samples were collected
(during February 27 to 28, 2015) for laboratory analysis
and the sampling locations are shown in Figure 6-19.
Water sampling locations are shown in Photo 6-3. The
results of the analysis are presented in Table 6-4. From the
result, it is observed that only 3 parameters out of 12 were
beyond the ECR 1997 and WBG Guideline values in
selected samples and they were DO, COD and iron levels.
The concentration of Nitrate in the Shitalakhya River is
very high due to human excreta, industrial activities and
agrochemicals. A study was conducted by Alam, et. al.

Analysis of Alternatives
6-25
(2012)21 in Shitalakhya River water quality from Ghorashal bridge to Narayanganj and found
that total ammonia concentrations (expressed as NH3-N) varied from 0.05 to 13.42 mg/l
along the Shitalakhya River in dry season (Figure 6-20). Location of GPS is upstream of
Ghorashal Bridge. Higher concentrations of ammonia were observed in dry season (7.95
mg/l) than in wet season (0.07 mg/l) near Saidabad WTP intake point along with the Bridge
point. Generally, nitrate concentration (expressed as NO3-N) varied from 0.2 to 1.8 mg/L.
However 14.5 mg/l of NO3-N was recorded upstream of Kanchpur bridge on 6th April 2009.
This was probably due to oxidation of large amount of ammonia just prior to sampling.
Concentrations of nitrate were found to be higher during dry season than in wet season.
Dissolved oxygen varied from 0.07 to 7.52 mg/l along the Shitalakhya River in dry season.
Maximum DO of 7.52 mg/l was found near Kanchan Bridge in April 2008 and minimum DO
of 0.07 mg/l was found near and downstream of Saidabad WTP intake in March 2009. It is
observed from Figure 6-20 that NH3-N, COD, and BOD levels in Ghorashal bridge and
upstream are lower (close to GPS) than the downstream range. On the other hand, DO and
NO3-N concentrations show higher level close to GPS compared to the downstream range.
21 Alam, M. A., Badruzzaman, A. B. M., and Ali, M. A. (2012) Spatiotemporal Assessment of Water Quality of
the Sitalakhya River, Bangladesh, Int’l Journal of Engineering and Technology Volume 2 No. 6, pp. 953-962.

Description of the Environment
6-26
Table 6-4: Baseline water quality data
Parameters Unit 2015 Sample* 2013 Sample** WBG
Effluent
Guidelines,
2008
ECR 1997 Standards for Inland Surface
Water (water usable by various
process and cooling)
Sampling Location
Jetty point
[N-23o59’0.9”
E-90o38’0.2”]
(SW-1)
Intake point ( in front of pump 7 and
8)
[N-
23o58’48.9”
E-
90o37’56.5”]
(SW-2)
Discharge point
[N-
23o58’32.0”
E-90o37’49.0”]
(Effluent)
Mid river (near discharge
point)
[N-23o58’35.2”
E-90o37’46.0”]
(SW-3)
Mid river (500 m d/s from
discharge point)
[N-23o58’24.6”
E-90o37’31.7”] (SW-4)
Intake point
Discharge point
Temperature °C 30.4 30.8 38.9 32.5 36.0
pH 8.3 8.6 7.9 8.2 7.6 6-9 6.5-8.5
BOD mg/L 2.4 5.0 6.5 6.2 6.1 ≤10
Dissolved Oxygen
mg/L 7.3 6.5 4.2 4.5 5.7 ≥5
Total Dissolved Solid (TDS)
mg/l 213 239 224 210 212 -
Ammonia (NH3) mg/l 0.12 0.12 0.12 0.12 0.12 -
Nitrate (NO3) mg/l 66 64 60 62 63 -
Chemical Oxygen Demand (COD)
mg/l 32 16 20 20 20 12 -
Arsenic (As) mg/l 0.002 0.002 0.003 0.003 0.002 0.001 0.002 0.5 -
Iron (Fe) mg/l 1.04 0.28 0.37 0.32 0.34 0.35 0.73 1.0 -
Lead (Pb) mg/l 0.003 0.002 0.002 0.002 0.002 0.002 0.002 0.5 -
Mercury (Hg) mg/l <0.00015 <0.00015 <0.00015 <0.00015 <0.00015
<0.00015
<0.00015 0.005 -
*Source: DPHE, Dhaka for CEGIS, 2015; **Source: DPHE, Dhaka for CEGIS, 2013; ***Source: Ghorashal 3rd Unit Repowering Project done by CEGIS,
August, 2012

Description of the Environment
6-27
Figure 6-20: Spatial variation of NH3-N, COD, BOD5, DO, NO3-N and Organic-N along
the Shitalakhya River
Ground Water Quality
333. Groundwater samples were collected and laboratory analyzed and the result is
presented in Table 6-5. Most of the parameters of groundwater fall within or less than the
Bangladesh Standards. However, iron level exceeds Bangladesh Standards. It should be
noted that, on a previous test conducted for Ghorashal 3rd Unit Re-powering project, the

Description of the Environment
6-28
level of iron on the groundwater was much lower and was below the Bangladesh Standards.
However, since iron concentration in ECR 1997 is not a health-based standard and rather an
acceptability-based standard (aesthetic consideration), intake of water with this iron
concentration will not pose any health effect. Groundwater will not be used in this plant
feedwater. In any case, demineralization plant will remove all TDS in the HRSG’s feedwater
system.
Table 6-5: Measured ground water quality at Ghorashal Power Plant Complex
Parameters Unit
Sampling Location (2015)*
[N-23058’30.0”
E-90038’21.05”] (GW)
Nearby Project site (2012)**
Ghorashal Power Plant
Complex (2012)**
ECR 1997
Temperature °C 27.4 20-30
pH
7.2 7.1 6.5-8.5
Dissolved Oxygen mg/L 18.5 6
Turbidity NTU 2.7 4
Alkalinity (HCO3-) mg/L 190 78.0 135 -
Total Hardness Mg/L 205 68 95 200-500
Total Dissolved Solid (TDS)
mg/L 162 90.0 1000
Phosphate (PO4) mg/L 1.22 6
Chloride (Cl-) mg/L 10 16.4 12 150-600
Ammonia (NH3) mg/L 0.12 0.50
Nitrate (NO3) mg/L <0.10 10.0
Chemical Oxygen Demand (COD)
mg/L 16 4
Arsenic (As) mg/L <0.001 <0.001 0.05
Calcium (Ca) mg/L 19 75.0
Iron (Fe) mg/L 1.29 0.8 .29 0.3-1.0
Lead (Pb) mg/L 0.010 <0.002 0.05
Magnesium (Mg) mg/L 13 35.0
Mercury (Hg) mg/L <0.00015 <0.00015 0.001
Potassium (K) mg/L 2 12.0
Sodium (Na) mg/L 23 200
Source: DPHE, Dhaka for CEGIS, 2015
6.12 Soil quality
334. In general, most of the top soils are acidic and sub-soils are neutral to slightly
alkaline. On the other hand, in AEZ 9 top soils are very strongly acidic to neutral and sub
soils are neutral in reaction, in AEZ 16, top soils are strongly acidic to neutral in medium low
and low land soils and the sub soils are slightly acidic to slightly alkaline and in case of AEZ
28 the top soils are mainly very strongly acidic in reaction but ranges up to slightly acidic with
low to medium status of organic matter, low moisture holding capacity and low fertility level.
General fertility level is low to medium organic matter content and very high CEC and K
status. There are limitations of high exchangeable Na and low Ca / Mg ratio. The Zn status is
low to medium and the B and S status is medium to optimum. Details are presented in Table
6-6.

Description of the Environment
6-29
Table 6-6: Detailed soil quality of soils of AEZ 9, AEZ 16 and AEZ 28
Major land type
Soil pH
Soil OM
Nutrients status
N P K S Ca Mg Zn B Mo
High land 3.8-6.5 L-M VL-L VL-L L VL-L M-Opt M-Opt L-M VL-L Opt
Medium highland
4.5-7.2 L-M VL-L VL-L L-M VL-L M-Opt M-Opt VL-L VL-L Opt
Lowland 4.0-6.7 L-M VL-L L-M. L-M L-M M-Opt M-Opt L-M L Opt
OM=Organic matter; VL=Very low; L=Low; M=Medium; Opt=Optimum
Source: Fertilizer Recommendation Guide, BARC, 2012
6.13 Transportation System
335. The proposed Project site is accessible by three different modes of communication.
These are: roads, railway and waterway. One of the major regional highway (R-301) from
Tongi to Ghorashal via Kaliganj passes through the project area. Another important regional
highway adjacent to the project area is the Dhaka Bypass road which is a shorter route
between Dhaka-Chittagong highway and the Jamuna Bridge. From these regional roads,
there are Upazila roads to access the GPS.
336. Ghorashal Railway Station is the nearest railway facilities from the GPS and the
distance from the site is about 5 km in the south. The Shitalakhya River is a scheduled
navigation route which provides 22 km of water ways. Figure 6-21 shows the different
communication systems to access the project area.
Photo 6-4: Village road communication
system
Photo 6-5: Water way beside the proposed
Project site

Description of the Environment
6-30
Figure 6-21: Road, railway and water ways networks of the study area

Description of the Environment
6-31
6.14 Agriculture Resources
6.14.1 Cropping pattern and intensity
337. The most prominent cropping pattern of the study area is Fallow - Fallow - HYV Boro
which covers about 21% of net cultivated area (NCA), then Fallow – T Aman –HYV Boro
which covers about 20% followed by others as shown in Table 6-7. The project site is a
fallow land having warehouses, trees etc. The single, double and triple cropped area is
about 21%, 69% and 10% of the NCA, respectively. Cropping intensity of the study area is
about 189%.
Table 6-7: Cropping pattern of the study area
Study Location
Land type Kharif-I
(Mar-Jun) Kharif-II (Jul-Oct)
Rabi (Nov-Feb)
Area (ha) % of NCA
Study Area
High land (F0)
Vegetables Fallow Vegetables 773 5
Vegetables HYV Aman HYV Boro 773 5
Fallow HYV Aman HYV Boro 2,164 14
Lt. Aus Fallow HYV Boro 155 1
HYV Aus HYV Aman Vegetables 773 5
Fallow HYV Aman Vegetables 1,546 10
Medium high land
(F1)
Jute Fallow HYV Boro 618 4
Fallow Lt. Aman Mustard 1,082 7
Fallow Lt. Aman Wheat 464 3
Fallow Lt.Aman Kheshari 773 5
Fallow Lt. Aman HYV Boro 3,091 20
Low land (F3)
Fallow Fallow HYV Boro 3,246 21
Total 15,457 100
Project Area - Fallow Fallow Fallow 3 100
Cropping intensity-189%
Source: CEGIS estimation based on field information, March, 2015
6.14.2 Crop production and damage
338. The Project site is surrounded by fertilizer factory and its colony, Shitalakhya River,
bazaar, residents, jute mills etc. Crop fields are located around 1.5 to 2 km away from the
site. In the study area, total cropped area is about 29,214 ha of which rice is about 74% and
the non-rice is about 26%. Total crop production is about 129,335 tons. The annual total rice
production is about 59,717 tons after the loss of 4,739 tons due to manmade pollution like
industrial wastes, drought, shortage of surface water, pest and disease infestation etc.
Among the rice crops, Lt Aman, HYV Aman, HYV Aus and HYV Boro is contributing about
14%, 24%, 3% and 59% of the total rice production respectively. Annual non-rice production
is about 69,618 tons, of which Jute 2%, Mustard 2%, wheat 2%, Kheshari 1%, winter
vegetables 67% and summer vegetables 27%. Details are presented in Table 6-8.
Table 6-8: Crop production and damage of the study area
Crop name Crop Area (ha)
Damage free area Damaged area Total production
(ton)
Production lost (ton)
Production%
Area (ha)
Yield (ton/ha)
Area (ha)
Yield (ton/ha)
Study area

Description of the Environment
6-32
Crop name Crop Area (ha)
Damage free area Damaged area Total production
(ton)
Production lost (ton)
Production%
Area (ha)
Yield (ton/ha)
Area (ha)
Yield (ton/ha)
Lt. Aman 5,410 4,598 1.6 811 1.1 8,250 406 14
HYV Aman 5,255 4,467 2.9 788 1.5 14,137 1,104 24
Lt. Aus 155 131 1.4 23 1.1 209 7 0
HYV Aus 773 657 2.8 116 1 1,955 209 3
HYV Boro 10,047 8,540 3.8 1507 1.8 35,165 3,014 59
Total rice crops
21,640 18,394 0 3,246 0 59,717 4,739 100
Jute 618 618 2.6 0 0 1,608 0 2
Mustard 1082 1082 1 0 0 1,082 0 2
Wheat 464 464 2.5 0 0 1,159 0 2
Kheshari 773 773 1.1 0 0 850 0 1
W. vegetables
3,091 3091 15 0 0 46,371 0 67
S. vegetables
1,546 1546 12 0 0 18,548 0 27
Non-rice crops
7,574 7,574 0 0 0 69,618 0 100
Total 29,214 25,968 0 3,246 0 129,335 4,739 0
Source: Estimation from field information; 2015 *Indicates cleaned rice
6.15 Fisheries resources
6.15.1 Habitat characteristics
339. The seasonal and perennial Beels (depressions) along with floodplains of the study
area become connected to the Shitalakhya River during pre-monsoon through a number of
drainage canals (Khals). Connectivity is usually restored on the onset of monsoon and Beels
become inundated earlier followed by the vast floodplains. These seasonal and perennial
water bodies function as fresh water fish habitats. Open water fish habitats that are found in
the study area are; (i) river, (ii) Khal, (iii) Beel and (iv) floodplain (Figure 6-6). A number of
Beels such as Chinadi Beel, Buri Beel, Nali Beel, are perennial in nature as well as many
seasonal Beels, e.g Bagdi Beel, Nargana Beel, etc. serve as fish over wintering refuges,
mother fishery, feeding and breeding grounds of the study area.
340. The dominant fish culture practice of the study area is the improved extensive culture
in commercial fish ponds though there is a recent introduction of excavated pond merely for
intensive fish culture. Statistics of Palash Upazila fisheries is given in Table 6-9.
Table 6-9: Fisheries statistics of Palash Upazila
Particulars Quantity Particulars Quantity Particulars Quantity
Pond 2,718 nos. Fish production 3,170 tons Fish whole seller 03 nos.
River 02 nos. Fish demand 3,474 tons Fish retailer 12 nos.
Drainage canal 02 nos. Fishermen 350 nos. Fry seller 15 nos.
Beel (depression) 15 nos. Fish farmers 1,987 nos. Fish Arat 09 nos.
Nursery farm 09 nos. Fisher Assoc. 01 no. Hat/Bazar 21 nos.
Fry production/yr 41.9 Lakh Farmer Assoc. 08 nos. Ice factory 04 nos.
Source: Upazila Fisheries Office, Palash, 2014
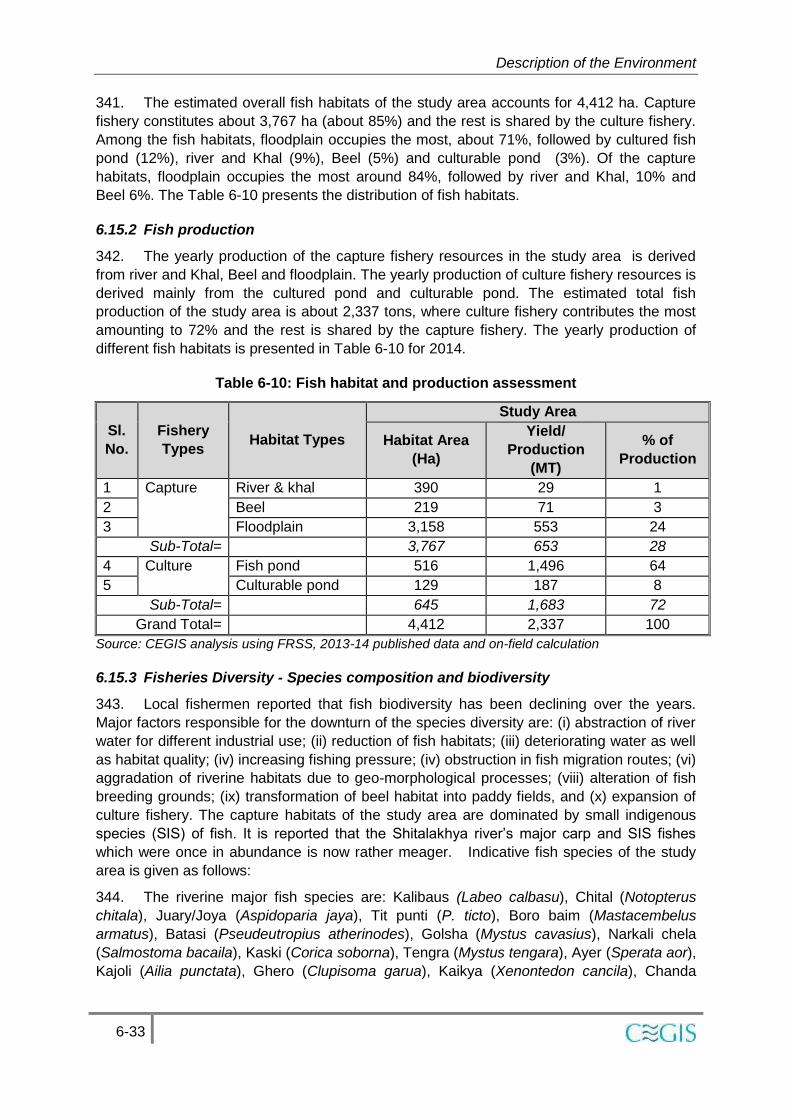
Description of the Environment
6-33
341. The estimated overall fish habitats of the study area accounts for 4,412 ha. Capture
fishery constitutes about 3,767 ha (about 85%) and the rest is shared by the culture fishery.
Among the fish habitats, floodplain occupies the most, about 71%, followed by cultured fish
pond (12%), river and Khal (9%), Beel (5%) and culturable pond (3%). Of the capture
habitats, floodplain occupies the most around 84%, followed by river and Khal, 10% and
Beel 6%. The Table 6-10 presents the distribution of fish habitats.
6.15.2 Fish production
342. The yearly production of the capture fishery resources in the study area is derived
from river and Khal, Beel and floodplain. The yearly production of culture fishery resources is
derived mainly from the cultured pond and culturable pond. The estimated total fish
production of the study area is about 2,337 tons, where culture fishery contributes the most
amounting to 72% and the rest is shared by the capture fishery. The yearly production of
different fish habitats is presented in Table 6-10 for 2014.
Table 6-10: Fish habitat and production assessment
Source: CEGIS analysis using FRSS, 2013-14 published data and on-field calculation
6.15.3 Fisheries Diversity - Species composition and biodiversity
343. Local fishermen reported that fish biodiversity has been declining over the years.
Major factors responsible for the downturn of the species diversity are: (i) abstraction of river
water for different industrial use; (ii) reduction of fish habitats; (iii) deteriorating water as well
as habitat quality; (iv) increasing fishing pressure; (iv) obstruction in fish migration routes; (vi)
aggradation of riverine habitats due to geo-morphological processes; (viii) alteration of fish
breeding grounds; (ix) transformation of beel habitat into paddy fields, and (x) expansion of
culture fishery. The capture habitats of the study area are dominated by small indigenous
species (SIS) of fish. It is reported that the Shitalakhya river’s major carp and SIS fishes
which were once in abundance is now rather meager. Indicative fish species of the study
area is given as follows:
344. The riverine major fish species are: Kalibaus (Labeo calbasu), Chital (Notopterus
chitala), Juary/Joya (Aspidoparia jaya), Tit punti (P. ticto), Boro baim (Mastacembelus
armatus), Batasi (Pseudeutropius atherinodes), Golsha (Mystus cavasius), Narkali chela
(Salmostoma bacaila), Kaski (Corica soborna), Tengra (Mystus tengara), Ayer (Sperata aor),
Kajoli (Ailia punctata), Ghero (Clupisoma garua), Kaikya (Xenontedon cancila), Chanda
Sl.
No.
Fishery
Types Habitat Types
Study Area
Habitat Area
(Ha)
Yield/
Production
(MT)
% of
Production
1 Capture River & khal 390 29 1
2 Beel 219 71 3
3 Floodplain 3,158 553 24
Sub-Total= 3,767 653 28
4 Culture Fish pond 516 1,496 64
5 Culturable pond 129 187 8
Sub-Total= 645 1,683 72
Grand Total= 4,412 2,337 100

Description of the Environment
6-34
(Chanda nama), Bele (Glossogobius giuris), Golda chingri (Macrobrachium rosenbergii),
Gura chingri (Leander styliferus), Taki (Channa punctatus).
345. The floodplain and beel fish species include: Meni (Nandus nandus), Shol (Channa
striatus), Taki (C. punctatus), Punti (Puntius spp.), Shingi (Heteropneustes fossilis), Magur
(Clarias batrachus), Bujuri tengra (Mystus vitatus), Foli (Notopterus notopterus), Guchi baim
(Mastacembelus pancalus), Kolisha/chopra (Colisa fasciatus), Boicha (C. lalia), Boal
(Wallago attu), Koi (Anabas testudineus), Rui (L. rohita), Katol (Catla catla), Gura chingri
(Leander styliferus), etc.
346. Culture fish species include: Rui (Labeo rohita), Katol (Catla catla), Kalibaus (Labeo
calbasu), Mrigel (Cirrhina mrigala), Silver carp (Hypophthalmichthyes molitrix), Grass carp
(Ctenopharyngodon idela), Mirror carp (C. carpio.), Common carp (Cyprinus carpio), Thai
pangus (Pangasius sutchi), Tilapia (Tilapia mossambicus), Nilotica (Tilapia nilotica),
Sharpunti (Puntius sarana), etc.
347. Rarely available fish species are: Rani, Tara baim, Baghayer, Shilong, Kajoli, Chital,
etc.
6.15.4 Fish habitat degradation
348. River water quality has been degrading due to discharge of untreated or improperly
treated effluents of cement factory, fertilizer factory, paper and pulp industry, dying factory,
etc. Power plant also contributes in deteriorating water quality by raising effluent water
temperature higher than the allowable limit. At the same time, it entertains some fish species
those prefer velocity. The industrial discharge of effluents and municipal sewages into the
neighboring rivers, dust and cement from the cement factory contaminate river water.
Cumulative effects of all contaminants along with the untreated effluents of the industries
and power plants cause fatality to fish species along with other aquatic eco-elements. Local
people as well as fishermen reported that suffocating fishes are seen occasionally
particularly during dry season when water remains very low and suspected the release of
untreated effluents and gaseous substances from the fertilizer factory are responsible for
such death toll of fish. Mostly affected fish include carps, Bata, Ayeer etc.
6.15.5 Fishermen status and effort
349. There are several fishermen villages around the study area, namely (i) Alinagar; (ii)
Betua; (iii) Raban; (iv) Nasra all situated along the Shitalakhya River. There are about 350
fishermen carry their livelihood by catching fish in different habitats. Pollutants come from
various point and non point sources are responsible for the decline of fish growth and fish
production. The water quality of Shitalakhya is very poor for fish to survive during dry season
and this has been the case for an extended period of time. Decline of capture fishery is a
countrywide challenge and not specifically relevant to GPS (especially to Unit 4 repowering).
Thus, it may not be appropriate to prepare compensation plan for the fisherman. Various
types of gears that are used for catching fish are seine net, cast net, lift net, push net, pull
net, gill net etc.
6.16 Ecological Resources
350. Ecological resources considered eco-elements in the range of vegetation to wildlife of
the aquatic and terrestrial ecosystems. The study area contains general types of eco-
elements with low to medium biodiversity and does not possess any kinds of specialized

Description of the Environment
6-35
habitat or hot spot. The identified major ecosystems include homestead/settlements, crop-
field, roadside, woodland, Sal forest, riverine, seasonal wetlands, etc.
6.16.1 Ecologically Critical Areas
351. The Government of Bangladesh in 2009 declared 4 rivers around Dhaka city
(Buriganga, Shitalakhya, Balu and Turag) as Ecologically Critical Areas (ECAs). Most of the
ECAs are suffering from encroaching, pollution and management problems in terms of
sustainability. ECAs are already degraded areas and needs special protection and care.
There are government restrictions on setting-up polluting industries in ECAs. By repowering
of GPS Unit 4, there will be improvements in effluent quality to Shitalakhya River by
introducing closed-cycle cooling system (and therefore, minimizing thermal effluent) and
installation of a CETP.
6.16.2 Ecological and conservation designations
352. The designation of tracts of land for ecology and landscape conservation is an
important consideration of many national policies. Conservation agenda is also being
embedded in land use strategies to response to changing social needs and environmental
conditions. Field investigation revealed that there is no ecological hot-spot within the study
area.
6.16.3 Ecosystems
353. The entire study area possesses both terrestrial and aquatic ecosystem having
moderate to low floral and faunal diversity.
a) Terrestrial Ecosystem
354. The major terrestrial ecosystems of the area are as follows: (i)
Homestead/settlements; (ii) Crop-field; (iii) Roadside; (iv) Woodland; and (v) Sal forest.
b) Homesteads/Settlement Ecosystem
355. This type of ecosystem is usually evolved by the interaction of vegetation planted by
the owners for their interests and the dependent wild fauna.
Homestead Flora
356. The major plant species of this ecosystem are: Tal (Borassus flabelifer), Kanthal
(Artocarpus heterophyllus), Narikel (Cocos nucifera), Pepey (Carica papaya), Aam
(Mangifera indica), Jarul (Lagerstomia speciosa), Rendi Koroi (Albizia saman), Akashmoni
(Acacia auriculiformis), Euc alyptus (Eucalyptus citriodora), Bansh (Bambusa Spp.) etc.
Besides these, there ecologically important herbs and shrubs also exist in this ecosystem.
Homestead Fauna
357. The homestead vegetation plays an important role in sheltering a variety of wild
animals. Among them, the major ones are: Common Toad (Duttaphrynus melanostictus),
Cricket Frog (Fejervarya limnocharis), Common Tree Frog (Polypedates maculates) under
amphibian group; House Gecko (Hemidactylus frenatus), Common Garden Lizard (Calotes
versicolor), Bengal Monitor (Varanus bengalensis), Common Skink (Mabuya carinata) as
reptiles; Common Myna (Acridotheres tristis), Asian Pied Starling (Sturnus contra), Red-
vented Bulbul (Pycnonotus cafer), Oriental Magpie Robin (Copsychus saularis), Spotted
Dove (Streptopelia chinensis), Blue Rock Pigeon (Columba livia), Coppersmith Barbet

Description of the Environment
6-36
(Megalaima haemacephala) and Black-hooded Oriole (Oriolus xanthornus) under avifauna;
Common Mongoose (Herpestes edwardsii), Small Indian Mongoose (Herpestes
auropunctatus), Asian Palm Civet (Paradoxurus hermaphroditus), Common House Rat
(Rattus rattus), Irrawaddy Squirrel (Callosciurus pygerythrus), Greater Short-nosed Fruit Bat
(Cynopterus sphinx) and Indian Pipistrelle (Pipistrellus coromandra) as mammals.
358. Functionally, this ecosystem provides various goods and services, such as bamboos
are inevitable elements for engraving the corpse of the villagers and also contribute in
earning of the villagers. In addition, the homestead vegetation supports in meeting food,
fuel, medicine and other household requirements.
c) Crop-field Ecosystem
359. This ecosystem is developed by the cultivation of crops and by the interaction of
vegetation grows in that field supported with favorable wildlife.
Crop-field Flora
360. This ecosystem supports vegetation in association with the crop varieties like rice,
jute, pineapple, etc. Detail information on cropping pattern is discussed in the agricultural
section. The crop-field vegetation under ecology has considered the different species of
weeds: Echinochloa colonum, Paspalum distichum, Heliotropium indicum, Drypopteris Sp,
Nicotiana plumbaginifolia, Croton bonplandianum, Chynodon dactylon,Panicum repens,
Cheratopteris Sp, Heliotropium indicum, Amaranthus spinosus, Centipeda orbicularis,
Cyperus Sp. etc. This type of vegetation provides feeding habitats to wildlife.
Crop-field Fauna
361. The faunal diversity of this ecosystem is a mixture of terrestrial and aquatic wildlife as
the crop fields possess both terrestrial and aquatic habitats. The major wild fauna of this
ecosystem are: Indian Bullfrog (Hoplobatrachus tigerinus) as amphibian; Checkered
Keelback (Xenochrophis piscator) and Buff-striped Keelback (Amphiesma stolata) under
reptiles; of the avian fauna Black Drongo (Dicrurus macrocercus), Crested Serpent Eagle
(Spilornis cheela), Brahminy Kite (Heliastur indus), White-breasted Kingfisher (Halcyon
smyrnensis), Pied Kingfisher (Ceryle rudis) and Brown Fish Owl (Ketupa zeylonensis)
available in this type of ecosystem. Among them Brown Fish Owl considered as vulnerable
(VU) as well as Crested Serpent Eagle categorized as Critically Endangered (CR) species.
Of the mammals, Little Indian Field Mouse (Mus booduga), Common Mongoose (Herpestes
edwardsii) and Bengal Fox (Vulpes bengalensis) have seen during the major field
investigation.
d) Roadside Ecosystem
362. The roadside vegetation is part of a web of life in which there are intimate and
essential relationships between plants and the road, between plants and other plants,
between plants and animals. This vegetation represents ecologically meaningful examples of
human-created ecosystem. Interactions between plant and soil communities (hereafter plant-
soil interactions) are of major importance in understanding the role of biotic control in
ecosystem functioning.
Roadside Flora
363. The slopes and edges of top of the roads are functioned as roadside ecosystem and
supports with moderate diversity of species. The forest department and villagers plant trees
under social forestry concept with the aim of financial benefits as well as protection of roads
from soil degradation. Strip plantation with the mixture of exotic and local species on both

Description of the Environment
6-37
sides of the rail line is implemented by the Bangladesh Railway. The major species are
Rendi Koroi (Albizia saman), Mahogany (Swietenia mahagoni), Eucalyptus (Eucalyptus
citriodora), Goraneem (Melia azadirachta), Sil Koroi (Albizia procera), Bansh (Bambusa
tulda), Akashmoni (Acacia auriculiformis) and Sisu (Dalbergia sissoo). The roadside
vegetation supports a variety of wildlife.
Roadside Fauna
364. This ecosystem consists of following wildlife such as Common Tree Frog
(Polypedates maculates) and Ornate Microhylid (Microhyla ornata) under amphibians;
Common Garden Lizard (Calotes versicolor), Bengal Monitor (Varanus bengalensis),
Common Skink (Mabuya carinata), Checkered Keelback (Xenochrophis piscator) and Buff-
striped Keelback (Amphiesma stolata), etc. under reptiles; Common Myna (Acridotheres
tristis), Asian Pied Starling (Sturnus contra), Red-vented Bulbul (Pycnonotus cafer), Oriental
Magpie Robin (Copsychus saularis), Spotted Dove (Streptopelia chinensis), Blue Rock
Pigeon (Columba livia), Coppersmith Barbet (Megalaima haemacephala) and Black-hooded
Oriole (Oriolus xanthornus), etc. under avifauna; and Common Mongoose (Herpestes
edwardsii), Oriental Civet (Viverra zibetha), Little Indian Field Mouse (Mus booduga),
Irrawaddy Squirrel (Callosciurus pygerythrus), and Indian Pipistrelle (Pipistrellus
coromandra), etc. as mammals.
e) Woodland Ecosystem
365. Woodland is a habitat where trees are the dominant plant form. The individual tree
canopies generally overlap and interlink, often forming a more or less continuous canopy
which shades the ground to varying degrees. Depending on the amount of light reaching the
ground through the tree canopy, there will be a great variety of other plants. These will
include mosses, ferns and lichens, as well as small flowering herbs, grasses and shrubs.
The more different kinds of plants there are, the greater the animal diversity will be in the
woodland.
Woodland Flora
366. Woodland ecosystem is generally observed in the premises of industrial units, power
plants, offices within the study area. This ecosystem supports a limited variety of exotic and
local plant species. These are: Mahogony (Swietenia mahagoni), Rendi Koroi (Albizia
saman) and Akashmoni (Acacia auriculiformis). This ecosystem also possesses mosses,
ferns and lichens of different species. This ecosystem supports the community with providing
timber, fuel wood and safeguarding natural disaster like Tornado, cyclone, etc. Some
woodland developed with a single species as practice of monoculture which resulted less
diversification of this ecosystem.
Woodland Fauna
367. The major woodland fauna includes Common Garden Lizard (Calotes versicolor),
Common Skink (Mabuya carinata), etc. under reptiles; Common Myna (Acridotheres tristis),
Asian Pied Starling (Sturnus contra), Red-vented Bulbul (Pycnonotus cafer), Oriental Magpie
Robin (Copsychus saularis), Spotted Dove (Streptopelia chinensis) under avifauna; and
Irrawaddy Squirrel (Callosciurus pygerythrus) and Indian Pipistrelle (Pipistrellus coromandra)
as mammalian species.
f) Sal Forest Ecosystem
368. Geomorphologically, Madhupur Garh is a part of the Madhupur Tract and
topographically it is raised a few metres above the level of the surrounding flood plains. This

Description of the Environment
6-38
ecosystem is situated in Gazipur district falls under the study area and the prominent
species of this forest is Sal (Shorea robusta). Until beginning of the 20th century Sal forests
existed as a large continuous belt with rich biological resources, but increasing human
pressure has triggered the decline of such ecosystem by around 70%.
Sal Forest Flora
369. It is a deciduous forest comprising of Sal or Gajari as a major species but due to poor
coppicing capability and poor management practices there population is now very restricted.
Majority of the area has been replanted by short rotation exotic species and some have been
brought under social forestry or participatory agroforestry schemes. Biodiversity has declined
rapidly and many animal species have become locally extinct. The abundant plant species of
this ecosystem may include: Sal (Shorea robusta), Koroi (Albizzia spp.), Raintree (Albizzia
saman), Sissoo (Dalbergia sissoo), Bohera (Terminalia belerica), Horitaki (Terminalia
chebula), Kanchan (Bauhinia acuminata), Polash (Butea monosperma) etc.
Sal Forest Fauna
370. This ecosystem supports a variety of wildlife, such as Monkey (Macaca mulatta),
Barking deer (Muntiacus muntjac), Spotted deer (Axis axis), Langur, Fishing cat, Marbled
cat, Jackel (Canis aureus), Common Mongoose (Herpestes edwardsii), Irrawaddy Squirrel
(Callosciurus pygerythrus), and Indian Pipistrelle (Pipistrellus coromandra), and Bengal Fox
(Vulpes bengalensis) etc. under mammals; Common Garden Lizard (Calotes versicolor),
Bengal Monitor (Varanus bengalensis), under reptiles; Common Myna (Acridotheres tristis),
Asian Pied Starling (Sturnus contra), Oriental Magpie Robin (Copsychus saularis), Spotted
Dove (Streptopelia chinensis) and Black-hooded Oriole (Oriolus xanthornus), etc. under
avian fauna;. Common Palm Civet habituated in forests, and plantations, farmed areas and
human habitations, sal and mixed-evergreen forests in the study area. The Common Palm
Civet and Common Mongoose considered as vulnerable (VU) species respectively to the
country (IUCN-Bangladesh, 2000).
Homesteads vegetation Crop-field vegetation Road-side vegetation
Woodland vegetation Sal forest
Photo 6-6: Terrestrial vegetation of the study area

Description of the Environment
6-39
371. The aquatic ecosystem consists of different wetlands like rivers, canals, ponds and
ditches. The wetlands are divided into two types based on the duration of inundation namely-
i) Seasonal wetland, and ii) Perennial wetland.
Shitalakhya River System Wetland in Kanthaliapara of Palash
Photo 6-7: Views of aquatic ecosystem

Description of the Environment
6-40
Figure 6-22: Bio-ecological zone of the study area

Description of the Environment
6-41
Aquatic Flora
372. The inundated area supports numerous hydrophytes in this study area i.e Shapla
(Nymphaea nouchaali), Helencha (Enhydra fluctuans), Padma (Nelumbo nucifera) etc.
Shapla and Padma are the main aquatic plants of the seasonal wetlands during the
monsoon. The dominant aquatic species are Kachuripana (Eicchornia crassipes), Helencha
(Enhydra fluctuans), Dhol Kolmi (Ipomoea carnea), Keshordam (Ludwigia repens),
Topapana (Pistia strateotes), Tetulpana (Salvinia natans) and Kutipana (Azolla pinnata).
Aquatic Fauna
373. The life cycle of aquatic fauna depends on the natural fluctuations of water and
connection with the Sitalakshya River and other closer wetlands during monsoon. The
Skipper Frog (Euphlictys cyanophlytis), Indian Pond Heron (Ardeola grayii), Little Egret
(Egretta garzetta), Cattle Egret (Bubulcus ibis), White-throated Kingfisher (Halcyon
smyrnensis), Common Kingfisher (Alcedo atthis), Asian Openbill (Anastomus oscitans), Little
Cormorant (Microcarbo niger) and River Dolphin (Platanista gangetica) were seen during the
field investigation.
6.17 Socio-Economic Resources
6.17.1 Introduction
374. Baseline scenario of the socio-economic environment is assessed based on primary
and secondary data considering 22 unions of five (5) upazilas of Narsingdi and Gazipur.
6.17.2 Population
375. Demography: The study area is the home of 526,463 people belonging to 114,503
households. Of the total population; 261,856 (49.7%) are male and 264,607 (50.3%) female.
The average household size is 4.6, which is slightly higher than the national average of 4.50
[BBS, (HIES) 201022]. The average population density is 2,088 per square kilometer which is
more than double compared to national average of 1,055 (Table 6-11).
Table 6-11: Basic demographic profile of the study area
District Upazila Unions/
Paurasavas HHs23
Population HH size
Population density
[sq. km] Male Female Total
Gazipur Kaliganj
Bahadursadi 6,659 15,511 16,303 31,814 4.8 1709
Baktarpur 3,325 6,957 7,421 14,377 4.3 1111
Jamalpur 7,323 16,400 16,404 32,804 4.5 1652
Jangalia 1,088 2,535 2,657 5,192 4.8 785
Kaliganj Paurashava
8,219 20,580 17,842 38,422 4.7 1456
Moktarpur 8,691 19,400 19,735 39,135 4.5 1049
Kapasia Chandpur 601 1,408 1,380 2,788 4.6 732
22 HIES 2010 refers to Household Income and Expenditure Survey conducted by the Bangladesh Bureau of
Statistics (BBS) in 2010.
23 HHs refers to households

Description of the Environment
6-42
District Upazila Unions/
Paurasavas HHs23
Population HH size
Population density
[sq. km] Male Female Total
Durgapur 3,574 7,681 8,326 16,007 4.5 956
Narsingdi
Narsingdi Sadar
Amdia 1,922 4,731 4,644 9,375 4.9 2078
Chinishpur 5,516 12,880 12,559 25,440 4.6 10672
Narsingdi Paurashava
6,804 15,873 16,150 32,024 4.7 2150
Panchdona 5,720 13,507 13,168 26,675 4.7 2491
Silmandi 3,276 7,848 7,277 15,125 4.6 3301
Palash
Char Sindur 5,959 12,817 13,354 26,171 4.4 1902
Danga 4,916 11,609 11,191 22,800 4.6 2659
Gazaria 5,693 12,829 13,330 26,159 4.6 1968
Ghorashal Paurashava
6,755 14,803 15,447 30,250 4.5 2250
Jinardi 6,755 14,803 15,447 30,250 4.5 1190
Shibpur
Dulalpur 4,648 10,187 11,030 21,218 4.6 475
Masimpur 3,076 6,938 7,508 14,446 4.7 1587
Putia 9,533 21,412 21,800 43,212 4.5 2458
Sadhar Char 4,449 11,146 11,633 22,779 5.1 1302
Total/Average 114,503 261,856 264,607 526,463 4.6 2088
Source: Housing and Population Census, BBS, 2011
376. In the study area, households with four members are the dominant. 24% households
belong to this category (Figure 6-23). Although average household size is 4.6, 45%
households have 5 or more than five members.
Source: Housing and Population Census, BBS, 2011
Figure 6-23: Distribution of households comprising member in each house

Description of the Environment
6-43
377. Age Structure: In the study area, the highest number of population (24%) belongs to
age category of 30 to 49 years old. Only 3% people are in 60 to 64 years category. The
young population (under age 15) would need more investment in schools, while size of older
populations (ages 65 and over) would call for more invest in health sector.
378. According to the International Labour Organization (ILO) the population of 15 to 64
years is categorized as labor force whereas populations below 14 years and above 65 years
are considered as dependent.
379. Therefore, the population data when analyzed to ascertain the size of (potentially)
active working population then it appears that 61% percent population who are in the age
bracket of 15-64 can be classified under this category. A small percentage (5%) is over 65
years old. The total dependency ratio24 is 63 in which child dependency ratio is 56 and aged
dependency ratio is 8. It illustrates that total 63 persons are dependent on 100 labour forces
in which 56 are children and 8 are elderly people.
Source: Housing and Population Census, BBS, 2011
Figure 6-24: Age structure of the studied
population
Figure 6-25: Categorical distribution of
studied population
380. Sex Composition: Sex ratio when analyzed per Upazila appears to be almost similar.
According to BBS (2011) data in the study area overall male-female sex ratio is 99, which
means females are comparatively higher (100) than that of males (99). Male population is
higher in Kaliganj (101) and also in Narsingdi Sadar Upazila (102), when the lower ratio is in
Kapasia (96) Palash (98) and Shibpur (95) upazilas. The data indicates that like national
average (100.3), the discrepancy between male-female numbers is gradually decreasing.
However, in unions there is higher ratio of female population over male population.
24 Total dependency ratio=
Child dependency ratio=
Aged dependency ratio=

Description of the Environment
6-44
Source: Housing and Population Census, BBS, 2011
Figure 6-26: Sex ratio among the studied population
6.17.3 Public Health
381. Access to Health Services: Access to health services and facilities refer to availability
and adequacy of supply, affordability, physical accessibility and socio-cultural acceptability.
Field data shows that there are 4 Upazila Health Complexes (UHC) at Upazila level and one
district hospital in Narsingdi Sadar. Besides, there are few community clinics at union level
and several private health service providers also provide services to the local people. People
stated that the existing services are almost inaccessible to rural poor therefore, a substantial
number of population tends to receive services from the local chemists and/or “village
doctors” either self educated or locally trained who have some basic knowledge about health
and medicines. They stated that most of the community clinics are located at preferable
location of local political leaders therefore; remote villagers have limited access than that of
these adjacent villagers. However, people complained that no hospitals/community clinics
have special unit for treating respiratory diseases although this disease is predominant in the
Ghorashal Paurashava area; even the fertilizer industry has no such facility for the affected
people.
382. Child and Mothers’ Health: In the study area infant mortality rate (IMR) is 46. IMR is
defined as the number of deaths of infants under one year old per 1,000 live births. On the
other hand, the under five mortality rate (U5MR) is 59.40; it also indicates the number of
deaths of infants under five years old per 1,000 live births. This rate is comparatively lower
than that of national average which is 49 for IMR and 64 for U5MR (source: Progoti Pathey,
MICS, 2009). The child mortality is due to malnutrition, having scarcity of trained attendants
at delivery, lack of timely initiation of breast feeding etc.
383. Field findings show that respiratory disease such as Asthma is alarming in Ghorashal
Paurashava particularly in Ward #1. The disease became epidemic due to contaminated air
with ammonia absorbent led by the fertilizer industry particularly at the time of releasing gas.
This contamination infests preferably children and pregnant mother. Local people stated a
few cases of child deaths due to respiratory syndrome.
384. The following figure confirms that about 49% women aged 15-49 years with a birth in
the 2 years preceding the survey can breastfeed their baby within one hour of birth and

Description of the Environment
6-45
about 91% can breastfeed within one day of birth. Data also shows that the highest
percentage (49%) of delivery was assisted by traditional birth attendant, about 17% by
medical doctor and about 16% by nurse/midwife. It is noticeable that assistance to mother
during child birth is still provided mostly by traditional untrained birth attendants and
relatives.
Source: Progotir Pathey, MICS, 2009
Figure 6-27: Percentage of women aged 15-49 with a birth by assistance during
delivery
385. Assistance at delivery by the untrained personnel also leads to higher mortality rate.
The household size (Figure 6-23) indicates household vulnerability leading to poor
socioeconomic development which also leads to child and maternal mortality.
6.17.4 Ownership and utilization of land
386. The Census of Agriculture, 2008 conducted by BBS classified land holdings into two
broad categories- one is farm-holdings and another is non-farm holdings. A farm holding is
defined as being an agricultural production unit having cultivated land equal to or more than
0.05 acre. Conversely, non-farm holding includes landless households and households
having lands up to 0.04 acre. The study area shows that out of total holdings 51.5% is farm-
holder and the rest 48.5% is non-farm holders.
387. According to BBS 2008 data on land holding distributions, in the study area 4.7%
households are absolute landless i.e. they have no lands either homesteads or cultivated.
43.7% households belong to functional landless category, who have land up to 0.04 acres.
Among them 41.7% households have only homestead lands and 2% have homestead
plus farm land within the limit of 0.04 acre These households mainly own land adjacent to
their homestead and being used as kitchen garden that are primarily used by the female
members for household consumption.

Description of the Environment
6-46
Source: The Census of Agriculture, 2008, BBS
Figure 6-28: Households by land holdings
388. On the other hand, farm holding distribution shows that 30.6% households belong to
marginal farmer (0.05 to 0.99 acre), 16.4% belong to small farmer (1.00 to 2.49 acre), 4.3%
belong to medium farmer (2.5 to 7.49 acre) and 0.2% belong to large farmer (7.5+ acre)
categories. It is evident that land fragmentation decreases the holding size therefore; large
and medium farmers are gradually being converted to marginal farmers.
389. In land tenure arrangement of farm holdings, it was found that 66.7% households
belong to owner category, and they belong to various landownership categories such as
marginal (61.5%), small (29.1%), medium (8.9%) and large (0.5%) land holders. It is evident
that most of the owners are marginal and small landowners therefore; their lands are usually
operated by themselves. A few from medium and large owners tend to lease out their lands
to the tenants.
Table 6-12: Land tenure arrangement in the study area
Tenancy type Farmer by holding category (%)
Total Marginal Small Medium Large
Owner 61.5 29.1 8.9 0.5 66.7
Owner-cum-Tenant 54.7 37.7 7.4 0.2 32.3
Tenant 81.8 16.7 1.5 0.0 1.0
Source: The Census of Agriculture, 2008, BBS
390. The second dominant category is owner-cum-tenant which accounts 32.3% of the
households. It comprises of 54.7% marginal, 37.7% small, 7.4% medium and 0.2% large
land holders. As it is documented that small and marginal farmer is predominant (47% out of
total farm holding), this owner-cum-tenant farm holder is to operate by leasing and or
sharecropping to maintain their livelihoods. However, it is surprising that although the study
area has a substantial percentage of landless households (48.5%) (both absolute and
functional), only 1% is tenants those are belonging mostly to marginal category. Field data
proved that this large numbers of landless populations usually adopt alternative livelihood
options, for instances; farm and non-farm laboring, driving, working for industries and other
manual works.
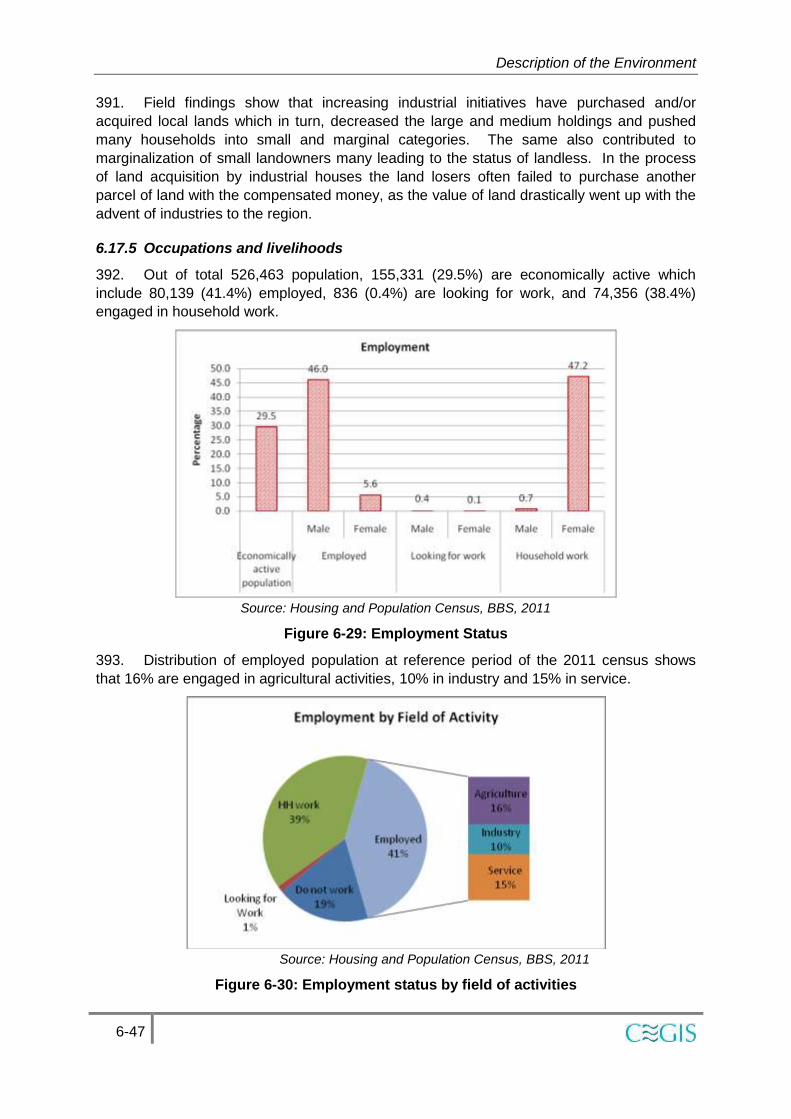
Description of the Environment
6-47
391. Field findings show that increasing industrial initiatives have purchased and/or
acquired local lands which in turn, decreased the large and medium holdings and pushed
many households into small and marginal categories. The same also contributed to
marginalization of small landowners many leading to the status of landless. In the process
of land acquisition by industrial houses the land losers often failed to purchase another
parcel of land with the compensated money, as the value of land drastically went up with the
advent of industries to the region.
6.17.5 Occupations and livelihoods
392. Out of total 526,463 population, 155,331 (29.5%) are economically active which
include 80,139 (41.4%) employed, 836 (0.4%) are looking for work, and 74,356 (38.4%)
engaged in household work.
Source: Housing and Population Census, BBS, 2011
Figure 6-29: Employment Status
393. Distribution of employed population at reference period of the 2011 census shows
that 16% are engaged in agricultural activities, 10% in industry and 15% in service.
Source: Housing and Population Census, BBS, 2011
Figure 6-30: Employment status by field of activities

Description of the Environment
6-48
6.17.6 Labor Market
394. The employment25 rate26 in the study area is 51.6 whereas the unemployment rate27
is 48.4. It is evident that about half of the total economically active population is still
unemployed. Most of the unemployment populations are females who are solely involved in
household work, and only 0.5% populations are looking for work.
395. There are a number of trained groups who are working contractually for power plant
projects for instances, as plumber, mechanic, earth-worker etc. These trained laborers are
organized and work under a group leader called “sarder”. Although these groups were
originally formed to work in the Ghorashal power plant, currently they work for other power
plants located outside the region.
Source: Housing and Population Census, BBS, 201
Figure 6-31: Distribution of population by sex and field of activity
396. The above figure demonstrates that female participation in industry and service
sectors is higher (10%) than that of agriculture (0.8%). According to our field research
women involved in the industrial sector mostly work in textile industries.
397. Wage level varies regarding type of work. In agricultural sector laborers get daily
wages in the range of Taka 300-400, whereas in industrial sector mostly textiles workers
receive per day/per production basis. However, the trained group working for power plant
received comparatively higher wages.
25 The ILO defines employed persons of those who, (1) do any work at all as paid employees, work in
their own business or profession or on their own farm, or work 15 hours or more as unpaid workers in a family-operated enterprise; and (2) all those who do not work but had jobs or businesses from which they were temporarily absent due to illness, bad weather, vacation, childcare problems, labor dispute, maternity or paternity leave, or other family or personal obligations — whether or not they were paid by their employers for the time off and whether or not they were seeking other jobs.
26 Employment Rate =
27 Unemployment Rate= 100-Employment Rate

Description of the Environment
6-49
398. During field visit, people stated that there is no in-migration of laborers for agricultural
sector. However, in the industrial sector a number of in-migrant laborers are working, but this
trend is gradually increasing.
6.17.7 Standard of living
399. Data shows that about 84.5% households are under electricity coverage. It is evident
that the GPS is the major power generation center of BPDB. It generates power and
distributes through Power Grid Company Bangladesh Ltd. (PGCB). Besides, there is a
private power producer (quick rental) within the study area. The study area has access to
both and benefited from generated power which in turn improved the standard of living.
400. The study area shows the predominance of kutcha houses (66%) compared to other
three types of houses such pucka, semi-pucka and jhupri. 23% houses are semi-pucka, 10
pucka and one percent is still jhupri. Most of the pucka houses are located in municipal
areas, whereas semi-pucka are predominant at the peripheral areas of municipality. Kutcha
houses are predominant in the rural area (Figure 6-32).
Source: Housing and Population Census, BBS, 2011
Figure 6-32: Housing condition in the study area
401. In the study area 33% households use non-sanitary latrines, 44% use non water-
sealed sanitary latrines and 19% use sanitary water-sealed latrines. However, there are 4%
houses, which have no sanitation facilities but tend to use sanitary facilities on shared basis
and in some cases use open spaces (Figure 6-33).

Description of the Environment
6-50
Figure 6-33: Distribution of households by
sanitation facilities
Figure 6-34: Distribution of households
by sources of drinking water facilities
Source: Housing and Population Census, BBS, 2011
402. Collection of drinking water from tube-well is predominant (92%) throughout the
study area. Supply of “tap water” is mainly used in municipal areas on rental basis. This
supply system is dependent on abstraction of ground water. However, 3% households are
still depending on open water bodies as sources of drinking water.
403. Fuel consumption shows that almost all houeholds located within the municipal area
have gas supply. Titas Gas Transmission and Distribution Company Ltd. is the service
provider that maintains two separate lines for transmission; one is for Ghorashal power plant
and another for domestic distribution. However, hoseuholds in rural area usually use
firewood, cowdung, chips for fuel etc.
6.17.8 Poverty
404. In the study area, poverty has been measured following the Multidimensional Poverty
Index (MPI) method. The indicator and the thresholds for defining poverty are presented in
Table 6-13.
Table 6-13: Indicators thresholds along with data sources for MPI calculation
Dimensions Indicators Definitions/threshold Data sources
Education
School
attainment
No household member has completed at
least six years of schooling.
Housing and
Population Census,
2011, BBS
School
attendance
A school-age child (up to grade 8) is not
attending school.
Housing and
Population Census,
2011, BBS
Health Child
mortality
A child has died in the household within the
five years prior to the survey
Progothir Pathey,
MICS, 2009, BBS
Standard of
living
Electricity Not having access to electricity
Housing and
Population Census,
2011, BBS
Drinking
water
Not having access to clean drinking water
or if the source of clean dirking water is
located more than 30 minutes away by
Housing and
Population Census,
2011, BBS

Description of the Environment
6-51
Dimensions Indicators Definitions/threshold Data sources
walking
Sanitation Not having access to improved sanitation
or if improved, it is shared
Housing and
Population Census,
2011, BBS
Cooking fuel Using “dirty” cooking fuel (dung, wood or
charcoal )
Field investigation,
CEGIS, 2015
Housing Having a home with dirt floor
Housing and
Population Census,
2011, BBS
405. Analyzing poverty status, it is found that about 27% households are multidimensional
poor (index value 0.27 out of 1= MPI). About 53% populations are living in these poor
households (poverty head count=H) and on average 52% poor people are deprived of any
indicator (intensity of deprivation=A).
Table 6-14: State of Multidimensional poverty
Dimensions Indicators
Deprivation per
indicator
(%)
Contribution of deprivation in
dimension to overall poverty
(%)
Education School attainment 53
22.6 School attendance 17
Health Child mortality 11 14.7
Standard of
living
Electricity 15
70.6
Drinking water 3
Sanitation 81
Cooking fuel 56
Housing 67
Source: CEGIS calculation
406. Illustrating contribution of deprivation in dimension to overall poverty, the highest
deprivation (70.6%) found in standard of living dimension as 81% populations have no
access to improved sanitation facility (water-seal sanitation), 67% are living on dirt floored
households (considering semi-pucca, kutcha and jhupri), 56% are using dirt fuel (considering
all types of fuel except gas facilities), 15% households have no grid electricity coverage and
3% households still collect drinking water from unsafe sources (ponds, river etc.).
6.18 Other facilities in the Project Area
407. The site is surrounded by the Ghorashal Fertilizer Factory on the north, the
Shitalakhya River on the west, Unit-5, 6, Agrekko Quick Rental and Max Power Rental
Power Plant on the east and administrative buildings within the GPS boundary and Jute mills
on the south. Following Figure 6-35 showing the establishments and settlements around the
study area are presented on image as below:

Description of the Environment
6-52
Figure 6-35: Surrounding land use and associated communities
408. The establishments around the proposed area are stated below (all the distances are
measured from Google Earth):
1. Pran factory is 1.81 km away on the southwest from the site.
2. Janata Jute mill is 1.17 km away on the southwest from the site.
3. Ghorashal 108 MW Rental power plant is 1.16 km away on the southeast from the
site.
4. Palash Urea Fertilizer factory is 0.86 km away on the north from the site.
5. Palash Bus Stand and Palash Upazila Heath Complex respectively are 0.93 km and
2.37 km away on the east side of the site.
6. Palash Jam-e-Mosque is 1.34 km away on the northeast from the site.
7. Desh Bandhu Sugar mill is 3.0 km away on the north from the site. and
8. There are six units of steam turbine gas based power plant along with two rental
plants within the Ghorashal Power Plant Complex.
Settlement
Settlement
Settlement
Settlement

7-1
7. Environmental Impacts
7.1 General
409. The existing GPS Unit 4 is a simple cycle power plant and has been in operation for
more than 25 years. The proposed repowering of Unit 4 will augment the current electricity
generation and enhance operational regime of the system. The proposed major activities will
involve renting labor accommodation, site preparation, transportation of machinery and
ancillaries, storage of equipment and materials for construction, civil works (in-terms of
construction of foundation structures), erection of GT, boiler decommissioning (including
removal of foundation), segregation of hazardous materials and their transportation to on-site
disposal pit, construction of gas pipeline, erection of HRSG and operation of the CCPP. Land
acquisition is not required for the construction of the GT and HRSG, and for the improvement
of access road along the right bank of the Shitalakhya River. These activities will have
diversified impacts on the environment and socio-economy with various natures and
magnitudes. Among the impacts from the proposed activities, some are temporary or short-
term in nature and limited to pre-construction and construction period, and others are
permanent in nature during the operation period. Based on the experience of other similar
power generation projects, many of the environmental issues are mainstreamed in the
project design (e.g., minimize NOx emission by using low NOx burner, lower the relative
water requirement for condenser cooling and minimize thermal effluent using closed-cycle
cooling, decrease specific-relative fuel requirement, etc.). Inhalation of airborne asbestos
fiber during boiler decommissioning, elevated noise level from the operation of heavy
equipment, felling of trees during site preparation, and labor camp induced sanitation and
social stress are the significant impacts of the construction works. A small number (about 25)
wood tree will be cut which may have ecological fragmental effect and lead to loss of bird
habitats. . The overall positive impact of the project during operation is the augmentation of
the generation capacity of the electricity and improving the socio-economic condition and
lifestyle of the country’s population, reduction in thermal effluent in Shitalakhya River, which
will facilitate in restoring habitats of fish species and easing habitat for others aquatic
organisms along with benthic habitats.
7.2 Impact Assessment Methodology
410. Potential environmental and social impacts were identified on the basis of the review
of feasibility reports, field visits, environmental quality baseline monitoring, ecological and
fisheries surveys, and stakeholder consultations. The significance of potential impacts was
assessed using the criteria and methodology given below.
7.2.1 Impact Magnitude
The potential impacts of the project have been categorized as major, moderate, minor or
nominal based on consideration of the parameters such as: i) duration of the impact; ii)
spatial extent of the impact; iii) reversibility; iv) likelihood; and v) Compliance to Legal
Standards before Mitigation Measures.
The magnitude of potential impacts of the Project has generally been identified according to
the categories outlined in Table 7-1.

Environmental Impacts
7-2
Table 7-1: Parameters for Determining Impact Scale
Parameter Major Moderate Minor Minimal
Duration of potential impact
Long term
(more than 15 years)
Medium Term
(5 to 15 years)
Limited to construction period
Temporary with no detectable potential impact
Spatial extent of the potential impact
Widespread far beyond project
boundaries
Beyond immediate
project components,
site boundaries or local area
Within project boundary
Specific location within project component or
site boundaries with no detectable potential
impact
Reversibility of potential impacts
Potential impact is effectively permanent,
requiring considerable
intervention to return to baseline
Potential impact requires a year
or so for recovering with
some interventions to
return to baseline
Baseline returns naturally or with
limited intervention within a few
months
Baseline remains almost constant
Compliance to Legal Standards before Mitigation Measures
Breaches national
standards and or international
guidelines/ obligations
Complies with limits given in
national standards but
breaches international
lender guidelines in one
or more parameters
Meets minimum national
standard limits or international
guidelines
Not applicable
Likelihood of potential impacts occurring
Occurs under typical operating
or construction conditions
(Certain)
Occurs under worst case
(negative impact) or best case (positive
impact) operating
conditions (Likely)
Occurs under abnormal,
exceptional or emergency conditions
(occasional)
Unlikely to occur

Environmental Impacts
7-3
7.2.2 Sensitivity of Receptor
411. The sensitivity of a receptor has been determined based on review of the population
(including proximity / numbers / vulnerability) and presence of features on the site or the
surrounding area. Each detailed assessment has defined sensitivity in relation to the topic.
Criteria for determining receptor sensitivity of the Project’s potential impacts are outlined in
Table 7-2.
Table 7-2: Criteria for Determining Sensitivity
Sensitivity Determination
Definition
Very High Vulnerable receptor with little or no capacity to absorb proposed
changes or minimal opportunities for mitigation.
High Vulnerable receptor with little or no capacity to absorb proposed
changes or limited opportunities for mitigation.
Medium Vulnerable receptor with some capacity to absorb proposed
changes or moderate opportunities for mitigation
Low Vulnerable receptor with good capacity to absorb proposed
changes and/or good opportunities for mitigation
7.2.3 Assigning Significance
412. Following the assessment of magnitude, the quality and sensitivity of the receiving
environment or potential receptor has been determined and the significance of each potential
impact established using the impact significance matrix shown in Table 7-3.
Table 7-3: Significance of Impact Criteria
Magnitude of Impact Sensitivity of Receptors
Very High High Medium Low
Major Critical Major Moderate Minimal
Moderate Major Major Moderate Minimal
Minor Moderate Moderate Minor Minimal
Minimal Minimal Minimal Minimal Minimal
7.3 Summary of Assessed Impacts
413. The project’s potential impacts and their significance have been assessed using the
methodology described in Section 7.2 above. A summary of these impacts and their
significance is presented in Table 7-4.

Environmental Impacts
7-4
Table 7-4: Potential impacts and their significance
Issues Potential Impacts from various Activities Sensitivity Magnitude
Significance
Prior to
Mitigation
Compliance to
laws, regulation or
accepted national
or international
standards,
protected status
of site or species
Environmental impacts during boiler decommissioning
A. Ecosystem
A1. Terrestrial
vegetation
Vegetation clearance due to temporary storage of
boiler parts, segregation and scientific disposal of
insulation materials after demolition of boiler.
Medium Moderate Moderate adverse
A2. Wildlife habitat Vegetation clearance will affect dependent wildlife
habitat.
Medium Moderate Moderate adverse
B. Ambient Air
B1. Airborne asbestos
fiber
Inhalation of airborne asbestos fiber during
segregation of hazardous materials and their
transportation is injurious to lung leading to lung
cancer and other lung diseases or respiration
complexity.
Skin and eye irritation of the workers may cause due
to contact with dust particles.
Very High Major Critical adverse WHO Air Quality
Guidelines for
Asbestos in
Europe, 2000
C. Ambient noise
C1. Noise pollution Elevated noise level due to cutting boiler parts using
gas cutter, grinding, loading boiler materials on
truck/lorry and its transportation.
Medium Moderate Moderate adverse ECR 1997
D. Water bodies

Environmental Impacts
7-5
Issues Potential Impacts from various Activities Sensitivity Magnitude
Significance
Prior to
Mitigation
Compliance to
laws, regulation or
accepted national
or international
standards,
protected status
of site or species
D2. Water quality Contamination of nearby water bodies by asbestos
containing effluent generated during the water spray to
control airborne asbestos fiber.
High Major Major adverse WBG’s Good
Practice Note:
Asbestos:
Occupational and
Community Health
Issues, 2009
E. Soil
E1. Soil quality Contamination of soil by asbestos containing effluent
generated during the water spray to control airborne
asbestos fiber.
High Major Major adverse WBG General EHS
Guidelines
E2. Top soil Loss of topsoil due to earthworks for creating asbestos
disposal pit which will impact the fertile top soils that
are enriched with nutrients required for afforested and
naturally grown plant growth.
Medium Minor Minor adverse
F. Occupational Health and Safety
F1. Pressure on
existing sanitation
facilities
Stressing existing sanitation facilities of the rented
accommodations, in which 50-60 workers for boiler
decommissioning may co-locate.
Medium Minor Minor adverse Labour Law, 2006
WBG General EHS
Guidelines
F2. Occupational
health and safety
Space constraint in the rented accommodation may
cause the break out of contagious disease like
diarrhea, dysentery, skin diseases, scabies, etc.
Belongings or stuffs insecurity may be a concern for
Medium Moderate Moderate adverse

Environmental Impacts
7-6
Issues Potential Impacts from various Activities Sensitivity Magnitude
Significance
Prior to
Mitigation
Compliance to
laws, regulation or
accepted national
or international
standards,
protected status
of site or species
the workers.
Injuries leading to casualty, or death may be caused
from the wrecking activities of the boiler as it involves
cutting, grinding, lifting of heavy machineries,
segregating solid wastes, working at heights, etc.
High Major Major adverse WBG General EHS
Guidelines
F3. Safety, security,
and vandalism
Inadequate construction site security poses a
significant risk to assets, construction materials and
property. Theft/vandalism of assets, materials and
property would increase construction costs and cause
delays in project completion.
Medium Moderate Moderate adverse
Improper security measures may pose security risk for
construction workers and especially foreign staff on
construction sites.
Medium Moderate Moderate adverse
G. Solid Waste Disposal
G1. Hazardous solid
waste disposal
Generation of hazardous solid wastes from the boiler
decommissioning containing mostly asbestos fiber,
rock and glass wool in insulation materials. Airborne
asbestos particles, rock and glass wool fiber are
harmful for human health.
Very high High Critical adverse WBG General EHS
Guidelines, 2007,
WBG’s Good
Practice Note:
Asbestos:
Occupational and
Community Health
Issues, 2009
G2. Non hazardous
solid waste
Generation of huge quantity of metals as scrap may
cause aesthetic hazards.
Medium Moderate Moderate adverse WBG General EHS
Guidelines, 2007

Environmental Impacts
7-7
Issues Potential Impacts from various Activities Sensitivity Magnitude
Significance
Prior to
Mitigation
Compliance to
laws, regulation or
accepted national
or international
standards,
protected status
of site or species
H. Social Impacts due to boiler decommissioning
H1. Increased pressure
on accommodation
Extra burden on human habitation, religious places,
purchasing capacity due to migrant workers
accommodation in the nearby communities.
Medium Minor Minor adverse
H2. Labor migration Aggravated risks of HIV/AIDS and STI due to the flow
of migrant workers.
Medium Moderate Moderate adverse WHO Guideline
H3. Cultural conflicts Possible cultural conflicts between migrant workers,
and communities. Migrant workers will come from
different parts of the country and abroad having
diverse cultural background.
Medium Minor Minor adverse
H4. Movement of construction vehicles and heavy equipment
Congestion in local roads due to increased
construction traffic will affect access to the trading
center and, houses close to the road, deteriorate
safety (especially for the school children), spillage of
fuels and chemicals, and damage to infrastructures
and properties due to vibration.
Medium Minor Minor adverse
H6. Employment of local people
Generation of employment of local population will bring
positive impression towards the Project.
Medium Minor Minor beneficial
Environmental impacts during construction stage:
I. Ecosystem
I1. Aquatic habitat
quality
During transportation of machinery and ancillaries,
disposal of waste water like ballast and bilge water
from the ship/cargo into the river having oil and grease
High Minor Moderate adverse

Environmental Impacts
7-8
Issues Potential Impacts from various Activities Sensitivity Magnitude
Significance
Prior to
Mitigation
Compliance to
laws, regulation or
accepted national
or international
standards,
protected status
of site or species
contaminants might affect the local aquatic habitat
quality.
Impact on aquatic habitats including benthic habitat
due to dredging operation for creating sufficient
navigation channel for ship carrying heavy plant
equipment.
High Minor Moderate adverse
I2. Terrestrial
vegetation
Felling of about 25 hard wood trees along with
clearance of a large number of naturally grown
vegetation including herbs and shrubs for the
construction of gas pipeline, RMS, machinery
unloading area and storing of imported machinery and
ancillaries would be an environmental concern.
Medium Moderate Moderate adverse
I3. Wildlife habitat In consequence of vegetation clearance, dependent
wildlife will lose their abodes and shift to nearby
bushes and create pressure on the wildlife of the new
area and its quality.
Medium Minor Minor adverse
J. Ambient Air
J1. Dust and gases
generated from
excavation,
construction
equipments, and
vehicles
Emissions of dust and gases will be generated from
excavation of trenches for laying gas pipes; RMS,
turbine and HRSG foundation, operation of
construction equipment and vehicles, and material
transport, which is injurious to human health.
Medium Moderate Moderate adverse ECR 1997
WBG General EHS
Guidelines, 2007
K. Ambient noise

Environmental Impacts
7-9
Issues Potential Impacts from various Activities Sensitivity Magnitude
Significance
Prior to
Mitigation
Compliance to
laws, regulation or
accepted national
or international
standards,
protected status
of site or species
K1. Noise level Noise will be generated from the moving and idling
vehicles, welding operations during laying of gas
pipes, and heavy machineries.
Medium Moderate Moderate adverse ECR 1997
WBG General EHS
Guidelines, 2007
L. Water bodies
L1. Water pollution Improper storage and handling of fuels, lubricants,
chemicals, hazardous goods/materials on-site, wash
down of plant and equipment, and potential spills may
harm the environment or health of construction
workers.
Medium Moderate Moderate adverse
M. Soil
M1. Top soil Loss of topsoil due to earthworks for creating space for
gas turbine which will impact the fertile top soils that
are enriched with nutrients required for afforested and
naturally grown plant growth.
Medium Minor Minor adverse
N. Occupational Health and Safety
N1. Health and safety
hazard
Injuries leading to casualty, or death may be caused
during transportation of machinery and equipments
from the ship to site, and their installation/erection,
lifting heavy materials, working at heights, etc. .
Medium Moderate Moderate adverse Labour Law, 2006
WBG General EHS
Guidelines
N2. Fire hazards Welding operations during laying of pipeline may
cause fire accidents if proper care is not taken
Medium Moderate Moderate adverse Labour Law, 2006
WBG General EHS
Guidelines

Environmental Impacts
7-10
Issues Potential Impacts from various Activities Sensitivity Magnitude
Significance
Prior to
Mitigation
Compliance to
laws, regulation or
accepted national
or international
standards,
protected status
of site or species
O. Key Point Installations & others
O1. Security issue During construction a large number of workers will be
engaged inside the GPS. Security matters will be of
concern for the Key Point Installation.
Medium Minor Minor adverse
P. Solid Waste Disposal
P1. Storage space and
visual effect
Poor aesthetic view due the storage and disposal of
old and used equipments and materials. Moreover,
spillage and leakage from improper storage can result
in contamination to soil.
High Minor Moderate adverse
Q. Social Impact
Q1. Increased pressure
on accommodation
Extra burden on human habitation, religious places,
purchasing capacity due to 100-125 migrant workers
accommodation in the nearby communities.
Medium Moderate Moderate adverse
Q2. Labor migration Aggravated risks of HIV/AIDS and STI due to the flow
of migrant workers.
Medium Moderate Moderate adverse WHO Guideline
Q3. Cultural conflicts Possible cultural conflicts between migrant workers,
and communities. Migrant workers will come from
different parts of the country and abroad having
diverse cultural background.
Medium Minor Minor adverse
Q4. Movement of construction vehicles and heavy equipment
Congestion in local roads due to increased
construction traffic will affect access to the trading
center and, houses close to the road, deteriorate
safety (especially for the school children), spillage of
Medium Minor Minor adverse

Environmental Impacts
7-11
Issues Potential Impacts from various Activities Sensitivity Magnitude
Significance
Prior to
Mitigation
Compliance to
laws, regulation or
accepted national
or international
standards,
protected status
of site or species
fuels and chemicals, and damage to infrastructures
and properties due to vibration.
Q5. Employment of local people
Generation of employment of local population will bring
positive impression towards the Project.
Medium Moderate Moderate
beneficial
R. Transportation of construction materials
R1. Public safety Uncontrolled transportation of construction materials
may cause safety and health hazard due to increased
traffic and flying objects, sand and dust from the
carriers, etc.
Medium Moderate Moderate adverse
Environmental impacts during operation stage:
S. Ecosystem
S1. Disturbance to
local aquatic habitat
Raw water abstraction through intake pumps may
destabilize habitats of aquatic organisms including fish
and causing the alterations to substrates and aquatic
community structure and diversity. Low velocity
tolerant species become trapped and died. This will
continue.
Medium Moderate Moderate adverse
S2. Restoration of
aquatic habitat by
eliminating thermal
pollution
Restoration of aquatic habitat for fish and other aquatic
organisms by eliminating a significant quantity thermal
effluent discharge in Shitalakhya
High Major Major beneficial WBG’s EHS
Guidelines for
Thermal Power
Plants, 2008
S3. Irrigation of
farmland
Reduction of 6.04 m3/s condenser cooling water to the
irrigation canal due to the introduction of closed-cycle
Medium Moderate Moderate adverse

Environmental Impacts
7-12
Issues Potential Impacts from various Activities Sensitivity Magnitude
Significance
Prior to
Mitigation
Compliance to
laws, regulation or
accepted national
or international
standards,
protected status
of site or species
cooling system in Unit 4 repowering. The water can
still be made available from operating Units 1, 2 and 5.
T. Ambient air
T1. Maximum ground
level concentration of
pollutants
Emission of exhaust gas from the stack may contribute
elevated ground concentration of NOx, PM10, and
PM2.5 etc. at the downwind direction.
Medium Moderate Moderate adverse ECR 1997
WBG General EHS
Guidelines
U. Ambient noise
U1. Noise level Hearing complexity and loss along with increase blood
pressure, disturbances and discomfort to the
technicians and workers and surrounding communities
due to noise generated from rotator machineries at
exceedance level.
High Moderate Major adverse ECR 1997
WBG General EHS
Guidelines
V. Water bodies
V1. Pollution of
receiving water bodies
Sludge generated from the chemical assisted raw
water at pretreatment and water treatment plants may
impact groundwater quality and receiving water bodies
if come in contact to sludge.
Very high Moderate Major adverse ECR 1997
WBG General EHS
Guidelines
V2. Storm water runoff Typically storm water runoff contains suspended
sediments, metals, petroleum hydrocarbons, coliform,
etc. may contaminate waterbodies.
Medium Moderate Moderate adverse
V3. Thermal plume in
receiving water bodies
Temperature increase by thermal plume from
condenser cooling water discharge in receiving water
body is violating WBG Effluent Guidelines.
Medium Moderate Moderate adverse WBG
Environmental,
Health, and Safety

Environmental Impacts
7-13
Issues Potential Impacts from various Activities Sensitivity Magnitude
Significance
Prior to
Mitigation
Compliance to
laws, regulation or
accepted national
or international
standards,
protected status
of site or species
Guidelines for
Thermal Power
Plants, 2008
W. Occupational Health and Safety
W1. Work at height Fall from height may cause casualty and life loss of the
workers in GPS.
Medium Moderate Moderate adverse Labour Law, 2006
WBG General EHS
Guidelines
W2. Working in tight
and confined spaces
Working in tight and confined spaces, low light
conditions and other specialized work space may pose
threats due to oxygen deficiency and others.
Medium Moderate Moderate adverse Labour Law, 2006
WBG General EHS
Guidelines
W3. Working with live
electrical equipment
Worker hazard due to higher Exposure to electric and
magnetic fields
Medium Moderate Moderate adverse Labour Law, 2006
WBG General EHS
Guidelines
W4. Working in heated
areas
Worker hazard due to heat exposures especially in the
turbine halls
Medium Moderate Moderate adverse Labour Law, 2006
WBG General EHS
Guidelines
X. Waste Disposal
X1. Disposal of non-
hazardous solid waste
Solid wastes in terms of institutional waste, kitchen
waste, human waste, etc. generated from GPS and
staff colony may cause environmental impacts if not
managed properly.
Medium Moderate Moderate adverse

Environmental Impacts
7-14
Issues Potential Impacts from various Activities Sensitivity Magnitude
Significance
Prior to
Mitigation
Compliance to
laws, regulation or
accepted national
or international
standards,
protected status
of site or species
X2. Disposal of
hazardous waste
Generation of hazardous solid wastes, condensate
from RMS, and petrochemicals from plant operation
are harmful for human health
Very high Minor Moderate adverse WBG General EHS
Guidelines
X3. Disposal of liquid
effluents containing
toxic chemicals like
hydrazine and resin
Improvement in water quality in Shitalakhya River by
eliminating the use of hydrazine as scavenger
chemicals in feed water system and resin based
demineralization, which are threats to food processing
industries up and downstream which use river water
Very high Major Extremely beneficial
Y. Risks and emergency
Y1. Accidental risks Accidental firing, explosion of gas pipeline may cause
casualty and life loss of the workers in GPS
Medium Moderate Moderate adverse WBG General EHS
Guidelines
Y2. Operational
emergency
Immediate medical evacuation due to personnel injury,
leakage of hazardous materials (asbestos), civil
disturbance/riot, and gas leak/explosion.
Medium Moderate Moderate adverse WBG General EHS
Guidelines
Y3. Corrosion of gas
pipes
Corrosion on the internal wall of a natural gas pipeline
can occur when the pipe wall is exposed to water and
contaminants in the gas, such as O2, H2S, CO2, or
chlorides
High Moderate Major adverse WBG General EHS
Guidelines
Y4. Gas compressor
fouling
Polymer deposits on compressor internals which
increases frictional losses and alters flow pattern and
lead to loss of compressor efficiency, pressure drop
increase in after coolers, potential for unbalancing,
rotor, and seal damage.
Medium Moderate Moderate adverse

Environmental Impacts
7-15
Issues Potential Impacts from various Activities Sensitivity Magnitude
Significance
Prior to
Mitigation
Compliance to
laws, regulation or
accepted national
or international
standards,
protected status
of site or species
Y5. Gas pipeline leak Poor tieing-in may cause leak of significant amount of
gas from the pipe
Medium Moderate Moderate adverse
Z. Social Impacts
Z1. Contribution of the
Project to the local
livelihoods and
economy of the country
Increased power generation due to repowering of the
unit, reducing energy shortfall and reviving associated
economy.
Very high Moderate Major beneficial
Z2. Employment
generation
Additional employment opportunities, resulting in
increased prosperity and wellbeing due to higher and
stable incomes of employed people.
High Moderate Major beneficial
Z3. Availability of
irrigation water
By introducing close cycle cooling system, total
available condenser cooling water discharge will be
reduced from 27.22 m3/s to 21.18 m3/s
Medium Moderate Moderate adverse

Environmental Impacts
7-16
7.4 Sustainability of Quality of Gas and Continuity of Supply
414. Natural gas is the only fuel for the proposed repowering of Unit 4, Ghorashal Power
Plant. The gas requirement of existing Unit 4 is 49.17 MMSCFD, after repowering the
requirement will be increased to 67.28 MMSCFD. This means with an additional 18.11
MMSCFD of gas will be required for the proposed repowering. This additional gas
consumption will augment about 224 MW of power generation and supply to national grid.
This implies the specific consumption of gas will be low. On the other hand, the present fuel
(natural gas) requirement of Units 1-5 is 183 MMSCFD. After the proposed repowering of
Unit 4, the new gas demand will be about 201 MMSCFD without Unit 6 which is currently
under maintenance and Unit 7 which is under construction.
415. Additional gas supply has been confirmed verbally by MOPEMR via the existing gas
supply arrangement (Annex 7-1) and through the proposed RMS with booster from TGTDCL
of Petro bangla for meeting the turbine manufacturer’s requirements. The gas shortfall for
the power plant will be alleviated by fuel diversification including the introduction of LNG,
coal fired power generation, and the Government incentive plan for switching from natural
gas to other fuels. Through these measures, the gas shortfall issue is expected to be
resolved by 2016 (PSMP, 2010). So, sustainability of gas supply could be ensured by
TGTDCL to the Ghorashal Power Station. But there are some risk associated to maintain the
gas supply, allocated for the existing units along with the proposed units. These are: slow
gas exploration by the BAPEX, non-availability of gas resulting from Political Force Majeure
Events, or interruption of the supply of gas by the gas supplier and other usages.
7.5 Impact of hazardous waste
7.5.1 Hazardous Solid Waste
416. It is expected that during the decommissioning of the existing boiler, one of the major
hazardous materials that may come out as solid waste is asbestos containing material
(ACM). As per the ToR of this study, the total weight of the boiler installation is expected to
be several thousand tons with ACM probably more than 50 tons. Unit 4 boiler consists of
various insulation materials like mineral wool, glass fiber, asbestos, aluminum powder, glass,
and steel. A partial list of insulation materials were retrieved from the erection reports28
available in the GPS library. A partial list of ACM indicate 17 tons of asbestos containing
materials (ACM) in the insulation pipes. Asbestos is considered as a hazardous material
(CAS# 1332-21-4) and its use is banned in many countries especially in developed nations.
The airborne asbestos fiber when inhaled may cause various respiratory ailments including
‘asbestosis’ with long term exposure leading to the development of cancerous tumors in the
lungs. Thus, abatement measures to control airborne asbestos fiber must be taken before
boiler demolition. Airborne fibers generated from other toxic materials include metal rust,
rock and glass wool may also cause respiratory difficulties when breathed in high quantity.
7.5.2 Hazardous effluents
417. Spraying of water is usually done on insulation materials, such as asbestos, rock and
glass wool, metal rust, etc. in order to prevent the release and dispersion of such fibers or
28 TPP Ghorashal (Bangladesh) 2nd Phase: Power Unit #4 Working Project of Heat Insulation. Code 087-04-11-
TN, Book I- Explanatory note. Volumes of Work and materials.
Environmental Impacts
7-17
dusts in the ambient air. Therefore, contaminated sprayed waters may pollute soil and the
nearby water bodies through leaching. Since asbestos and other insulating materials are not
soluble in water, they might be ingested by fishes or may be ingested by the local residents
when untreated contaminated water is disposed to receiving water bodies. The potential
toxic effluent may include hydrazine which is used for deoxygenation of feed water, resin for
demineralization of raw water and acids and alkalis, which are used to maintain the pH level
of various water usage as well as removing any dissolved impurities. Hydrazine is a
carcinogen if disposed in river water untreated, may affect food processing industries, which
use Shitalakhya water up and downstream. Some oily substance, such as lube oil, used in
rotatory parts, may also leak from them and get into the river via effluent discharge. These
materials, when discharged into the river in large quantities, may affect the growth and
development of aquatic ecosystem, including fishes, frogs and other aquatic flora and fauna.
Other terrestrial animals and plants those are dependent on the river may also be affected.
7.6 Environmental impacts during boiler decommissioning stage
7.6.1 Impact on Ecosystem
418. Vegetation clearance from the space required for storing boiler parts, segregation
and scientific disposal of insulation materials after demolition of boiler would be an
environmental concern. The vegetation constitutes mainly naturally grown herbs and shrubs
which have multiple functions, such as habitation for birds and other wildlife, supplying of
fire wood, protecting soil from erosion and overall keeping the natural balance for human-
living. As such clearance of or damage to vegetation has wide range of adverse
environmental impacts. These are: loss or shifting of habitats for dependent birds and wildlife
to nearby bushes and create pressure on the wildlife of the new area and its quality; invading
of affected wildlife to the nearby locality may cause annoyance to the inhabitants. This
impact is characterized as Moderate Adverse, as given in Table 7-4.
7.6.2 Impact on Ambient Air
419. Airborne asbestos fibers or dusts generated from various activities like,
decommissioning of boiler, segregation and isolation of insulation materials, excavation
work, and removal of boiler foundation, transportation of scrap and insulation materials, and
construction of asbestos pit are health sensitive. The major hazardous waste is the airborne
asbestos fiber that comes out from the asbestos containing materials, such as steam
carrying pipes, boiler drum roof and boiler walls. Other toxic materials also include metal
rust, rock and glass wool fibers, which have air contamination potential when mixed with the
local air. Inhalation of such fiber or dust particles generated from the above mentioned
sources during segregation of hazardous materials and their transportation is injurious to
lungs and may cause ‘asbestosis’ leading to lung cancer or tumor and other lung diseases or
respiratory complexity. Skin and eye irritation of the workers may cause due to acute contact
with such dust particles. This impact is characterized as Critical Adverse, as given in Table
7-4.
7.6.3 Impact on Ambient Noise
420. High noise level may cause hearing related disturbances, increase in blood pressure,
amnesia, distaste to food, etc to the workers and nearby residents due to excessive noise
generated from different activities of boiler decommissioning. Among the major activities,
cutting of boiler parts using gas cutter, grinders, loading of boiler materials on truck/lorry, and

Environmental Impacts
7-18
its transportation are important. This impact is characterized as Moderate Adverse, as given
in Table 7-4.
7.6.4 Impact on Water Bodies
421. Fibers or dusts generated from the hazardous waste materials, having potential to
affect human being, are friable particles that can be easily dispersed in ambient air. Spraying
of water is usually done on insulation materials, such as ACM, rock and glass wool, metal
rust, etc. to prevent the release and dispersion of such fibers or dusts. Thus, contaminated
sprayed waters may pollute receiving water bodies if not treated. Since, asbestos and other
insulating materials are not soluble in water, they might be ingested by fishes or may be
ingested by the local residents when untreated contaminated water is disposed to receiving
water bodies.. Ingestion of high amounts of asbestos may lead to intestinal polyps or tumors.
This impact is characterized as Major Adverse, as given in Table 7-4.
7.6.5 Impact on Soil
422. Fibers or dusts generated from the hazardous waste materials, potential to affect
human being, are friable particles that can be easily dispersed in ambient air. Spraying of
water is usually done on insulation materials, such as ACM, rock and glass wool, metal rust,
etc. to prevent the release and dispersion of such fibers or dusts. Thus, contaminated
sprayed waters may pollute soil and the nearby water bodies through leaching if not
collected in a lined pond and treated. Asbestos may stay deposited in soil and, if not
managed properly, the dry asbestos particles may be blown away by winds during dry
season and may pose threat of being inhaled by nearby bystanders. This impact is
characterized as Major Adverse, as given in Table 7-4.
7.6.6 Impact on Occupational Health and Safety of Workers
423. Safety issues that are concerned with decommissioning of boiler include cutting and
welding, segregation of solid waste, and transportation of insulation materials and metals,
working at heights, and lifting of heavy materials,. Workers may be susceptible to injuries,
such as burns and cuts, from cutting and welding activities; lung disease and eye irritation
while segregating insulation materials; broken bones, and casualties. Working at heights and
falling rubbles may cause accidents and casualties. This impact is characterized as Major
Adverse, as given in Table 7-4.
7.6.7 Hazardous Solid Waste Disposal
424. Aesthetic hazards and dispersion contaminants (e.g., airborne fiber or dust, rust
mixed water, etc..) from the likely prolonged piling up of solid wastes, such as asbestos, rock
and glass wool, metal rust, metals, etc. due to decommissioning of boiler. Environmental
contamination of chrysotile asbestos and its toxic effects on growth and physiological and
biochemical parameters of plant species (e.g., Lemna gibba, a duck weed) is evidenced29.
These particles may be dispersed into the environment during segregation of the hazardous
materials. These airborne fibers or dust particles may be deposited on soil, leaves of plants
and fruits, limiting photosynthesis. Chrysotile asbestos may cause oxidative stress and
phytotoxicity to vegetation leading to retardation of plant growth. Apart from these small toxic
29 29 http://www.ncbi.nlm.nih.gov/pubmed/15386121

Environmental Impacts
7-19
particles, other metals will be coming out as scrap, which would be sold to recycling
companies. This impact is characterized as Critical Adverse, as given in Table 7-4.
7.6.8 Social Impacts
425. Sexually transmitted diseases like HIV/AIDS, etc., which might become epidemic due
to the engagement of engineers, technicians and workers from abroad for boiler
decommissioning if not taken preventive measures. This impact is characterized as
Moderate Adverse, as given in Table 7-4.
7.7 Construction Stage Impact
7.7.1 Impact on Landform
426. Natural landform of the Project site and adjoining area covered with bushes and
grasses might be affected due to excavation of trenches, construction of buildings and
sheds, movement of traffic, widening and improvement of existing earth road, etc.
7.7.2 Impact on Natural Resources
427. Gas as fuel and water for cooling of different Plant components are the major natural
resources used in power generation in GPS. No extra pressure will be created on gas as
electricity needed for construction activities will be taken from existing distribution system.
Water from the nearby river using low lift pump (LLP) or ground water using shallow tube
well may be used for civil construction, washing, cooking and sanitary purposes for the
stationed construction workers and staff members. Apart from these, the construction
process would not cause any burden on the natural resources.
7.7.3 Impact on Ecosystem
Impact on terrestrial vegetation
428. The ecological survey in the Project site did not recorded any tree species which
have national and international conservation significance. Impact on terrestrial vegetation is
discussed in Section 7.6.1. This impact is characterized as Moderate Adverse, as given in
Table 7-4.
Impact on fisheries and their habitat
429. The ship/cargo that will carry machineries and ancillaries may discharge ballast and
bilge waste water into the river. This ballast and bilge water may have oil, grease, food
waste and other contaminants which might affect the fisheries resources and their habitat
quality. Having disposed of such harmful substances into the river water a localized and
temporary disturbance to fish breathing may lead some species to die. Dredging for
accessing ship to the jetty may also disturb the benthic habitat which may require a
substantial time to recover. Discharge of wash water from the construction site may increase
the turbidity of the local fish habitat. This would affect the food supply for fishes temporarily.
7.7.4 Impact on Ambient Air
430. Fugitive dust particles may be generated due to site preparation, material transport,
piling up of construction materials, excavation of trenches for gas pipes and preparation of
foundations for HRSG, RMS and new gas turbine, operation of batch mixing plant, etc. In

Environmental Impacts
7-20
addition to these, operation of construction equipment and vehicles may generate CO, CO2,
NOx, SOx, etc. Prolonged inhalation of dusts by the site engineers and workers will suffer
from lung diseases with symptoms of shortness of breath, coughing, wheezing; chest pain;
loss of appetite; tiredness etc. This impact is characterized as Moderate Adverse, as given in
Table 7-4.
7.7.5 Impact on Ambient Noise
431. Noise and vibration during construction period may be generated due to operation of
different machineries and equipment, and welding during tieing-in of gas pipes. The
generated noise and vibration from stationary and mobile sources may have an impact on
existing acoustic environment. Prolonged exposure to such high noise, the staffs of offices,
construction workers, site engineers, residents and school children close to the construction
site may feel disturbances like hearing difficulties, discomfort, loss of concentration, high
blood pressure, etc. This impact is characterized as Moderate Adverse, as given in Table 7-
4.
7.7.6 Impact on Water Bodies
432. Construction material wash-water and spillage of oils and lubricants from
machineries may leach into the surface water and contaminate it particularly during wet
season. These contaminants may turbid water around the discharge point and may create oil
slick both of which is detrimental to the aquatic organisms including fisheries. This impact is
characterized as Moderate Adverse, as given in Table 7-4.
7.7.7 Impact on Soil
433. During site preparation, earthworks will impact the fertile top soils that are enriched
with nutrients required for afforested and naturally grown plant growth. This impact is
characterized as Moderate Adverse, as given in Table 7-4.
7.7.8 Impact on worker’s health and safety
434. During transportation of machinery and heavy equipments from the ship to site, lifting
heavy machineries and equipments using cranes and their erection and working at heights,
during welding of pipe tieing may cause injuries to the workers, even casualty. The major
health risk may come from the toppling of structures or falling of heavy
machineries/equipments from high heights. This impact is characterized as Moderate
Adverse, as given in Table 7-4.
7.7.9 Impact on Key Point Installations & others
435. During construction stage, the noise generated from the construction activities may
affect the residents of the colony of Fertilizer Factory closed to the site. Loud noise will also
affect the daily activities of the residents of the GPS. Educational institutes including school,
madrasah and mosque, situated inside the GPS. This impact is characterized as Minor
Adverse, as given in Table 7-4.
7.7.10 Solid Waste Disposal
436. A variety of solid waste may be generated from construction activities. These wastes
may include cleared vegetation from the site, construction debris, excavated spoils,
abandoned or broken machine parts, etc. Moreover, food waste, plastic, papers, cock sheet,

Environmental Impacts
7-21
carton, metal or plastic binders, etc.. Space for storage and disposal of materials generated
during construction along with existing solid wastes is limited. Unarranged piling up of such
materials and equipments will cause poor aesthetic and spillage and leakage from improper
storage may contaminate soil. This impact is characterized as Moderate Adverse, as given
in Table 7-4.
7.7.11 Social Impacts
437. The construction of GT and HRSG would require recruitment of foreign erectors and
skilled technicians. The flow of concerned manpower from abroad mean that they might
bring with them diseases such as sexually transmitted diseases, e.g., HIV/AIDS, which might
become epidemic if not taken preventive measures from the beginning.
438. Problems associated with maintaining 100-125 skilled, semi-skilled and non-skilled
workers being, accommodating them in the community settlements outside the project
boundary on rental basis might create extra burden on human habitation, worship places,
purchasing capacity, etc. Migrant workers coming from different parts of the country would
have cultural diversity. So, there might be cultural conflicts between workers and
communities. Increased traffic on access road due to movement of construction vehicles
might also affect easy access of the inhabitants to the local market and houses close to the
road, deteriorate safety (especially the school children). Labor migration and associated
impact of HIV/AIDS is characterized as Moderate Adverse, as given in Table 7-4.
7.7.12 Impact due to transportation of raw materials
439. Natural gas, would be supplied by TGTDCL via underground pipelines and hence it
would not have any impact. However, the transportation of construction materials may have
impact In-terms of spillages and leakages of construction materials while being transported
to the construction site. The vehicles carrying the construction materials might also get into
an accident. The resultant construction materials might be spilled to nearby water bodies,
affect the environment. Explosion/fire caused by the accident, might damage nearby
properties, buildings, people and the ambient environment itself. This impact is characterized
as Moderate Adverse, as given in Table 7-4.
7.8 Operation Stage Impact
7.8.1 Impact on Natural Resources
440. The natural resources used by the Unit 4 are water and natural gas. Operation of the
Plant with close cycle technology would reduce the current Plant water requirement (8.971
m3/s) drastically to about 95% (0.4686 m3/s) . In terms of saving resources, this will result as
the conservation of water resources which is already under stressed condition. Moreover,
current temperature increase by thermal discharge from cooling system of 7-90C from the
ambient water temperature would be minimized under the proposed repowering due to
closed-cycle cooling system. So, water resource would be relieved from the effect of
increased temperature.
441. Repowering of the proposed unit from 180 MW to 403.5 MW will require an additional
gas requirement of 18.11 MMSCFD which will be supplied from TGTDCL. As a result Gas
consumption will be reduced in this Project for the same quantity of augmented power.

Environmental Impacts
7-22
7.8.2 Impact on Ecosystems
Impact on fisheries and their habitat
442. Small amount of water (0.4686 m3/s) will be withdrawn from Shitalakhya River under
repowering. In the intake pump, local fish habitats may be destabilize due to alteration of
substrates of the intake area in the river. As a result, aquatic community structure and
diversity may be affected. This impact is characterized as Moderate Adverse, as given in
Table 7-4.
Restoration of aquatic habitat
443. Shifting of technology, from once through cooling system to close cycle cooling
system will require less water, leading to no discharge of condenser cooling water to the
river. Under the proposed system, water will be recycled and stress will be reduced on river,
the fish habitats and other aquatic organisms by reducing thermal discharge in Shitalakhya.
This impact is characterized as Major Beneficial, as given in Table 7-4.
7.8.3 Impact on irrigation facility
444. Currently, diversion of condenser cooling water through irrigation canal established
by BADC covers the irrigation of about 1,619 ha of farmlands. With this irrigation, about
6,000 tons of rice is produced annually from the irrigated field. This is very much cost
effective for the farmers as they are paying only about Tk. 800/ha/season, while for using
low lift pump (LLP) from the Shitalakhya River the cost is about Tk. 6,500/ha/season. In
addition, this irrigation indirectly benefiting vegetation growth, bird wading area, aquatic and
amphibian habitats, fish aquaculture, etc.
445. Transformation of once through cooling system to close cycle cooling system will
reduce the quantity of condenser cooling water discharge (about 22.2%) from Unit 4 to
overall GPS discharge of 27.22 m3/s. However, condenser cooling water discharge from
other operating units can continue supplying irrigation water to BADC irrigation network.
Hence, the crop production of the area will be continued. GPS will bear 6 years of pump
operating costs (3 years during construction and 3 years during operation). However, BADC
will take responsibility from the 7th year of operation to maintain the pumps. This impact is
characterized as moderate adverse, as given in Table 7-4.
7.8.4 Impact on Air quality (including dispersion modeling)
a) Pollutants of Concern
446. Pollutants of concern released from natural gas fired power stations are nitrogen
oxides (NOx), Carbon Monoxide (CO) and VOC’s. Particulate Matter is generally not of
major concern from the combustion of natural gas. The combustion of gaseous fuels does
not result in a high production of particulates. Particulate matter resulting from natural gas
combustion is mostly 30. However, currently no
regulations and standards exist for particles of this fine, therefore emissions from the power
plant will be evaluated and compared to applicable standards for PM2.5 (Particles < 2.5 µm in
size) and PM10 (Particles < 10 µm in size). The pollutant of most concern from natural gas
fired power plants is NOx. The formation of thermal NOx is dependent on 3 factors during
30 USEPA AP 42, Fifth Edition Compilation of Air Pollutant Emission Factors, Volume 1: Stationary Point and
Area Sources, 2009.

Environmental Impacts
7-23
combustion; (i) oxygen concentration, (ii) peak temperature, and (iii) time of exposure at
peak temperature30. Natural gas combustion releases NOx which is composed of NO and
NO2. NO2 is of particular concern and is considered a criteria pollutant. NO2 is used as the
indicator for the larger group of nitrogen oxides (NOx). In addition to contributing to the
formation of ground-level ozone, and fine particle pollution, NO2 is linked with a number of
adverse effects on the respiratory system. Significant health risks are associated with high
levels of ambient NO2, CO and PM2.5 concentrations. Carbon Dioxide (CO2), Methane (CH4)
and Nitrous Oxide (N₂O) are the major greenhouse gases that are emitted from the power
station.
447. Emissions from the power plant are estimated for two scenarios (i) Baseline scenario
and (ii) Re-powering scenario (after the re-powering of Units 3 and 4).
b) Air quality modeling input data and methodology
448. The latest version of the USEPA regulatory model AERMOD was used to predict and
simulate the effects of criteria pollutants from major emission sources in the project area and
analyze the effect on ambient air quality for NO2, CO, PM2.5 and PM10. Since there was very
little information available on the power plant emissions, criteria emissions were calculated
based on plant fuel consumption and emission factors from USEPA AP 42 and other
sources. This is considered a conservative approach to modeling. Greenhouse gas
emissions were calculated using fuel consumption and IPCC greenhouse gas emission
factors. A Tier-1 and Tier-2 (Ambient Ratio Method) modeling approach was used for NO2
prediction as per USEPA guidelines31. In the Tier-1 approach it is assumed that 100% of the
NOx emissions are converted into NO2, this approach gives the most conservative results
and tends to over predict maximum ground level concentrations. In the tier-2 (ARM) a
regional NO2/NOx ratio representative of area wide quasi-equilibrium conditions is applied to
the model predicted values, this gives more realistic results for maximum ground level NO2
concentration. NO2 is the pollutant of concern and is used as an indicator for nitrogen oxides
(NOx) in general.
I. Project Area
449. An area, 50 km by 50 km centering the stack of Ghorashal Power Station Unit 4 was
selected for the air quality analysis. A digital elevation model (DEM) of the area was
prepared based on ground elevations for input into the AERMOD Software. The DEM of the
model area is shown in the Figure 7-1.
31 USEPA: Clarification on the Use of AERMOD Dispersion Modeling for Demonstrating Compliance with the N02
National Ambient Air Quality Standard, 2014.

Environmental Impacts
7-24
Figure 7-1: Digital elevation model of the AERMOD Model Area
II. Ghorashal Power Station Emission Parameters
450. The stack emissions and parameters for the power plant (baseline and repowering)
are given in Table 7-5 below.
Table 7-5: Power Plant Emission Parameters
Power Plant No. of
Stack
Capacity
(MW)
Stack
Height
(m)
Inner Dia.
(m)
Flu Gas
Temp.
(K)
Emission Rate (g/s)
NO2 CO PM2.5 PM10
Ghorashal Power
Station –Unit 1 1 55 40 2.5 398 8.62 7.25 0.66 0.66
Ghorashal Power
Station –Unit 2 1 55 40 2.5 398 8.62 7.25 0.66 0.66
Ghorashal Power
Station –Unit 3 1 210 50 3 383 46.07 20.35 1.85 1.85
Ghorashal Power
Station –Unit 3
(After Re-powering)
1 411.65 50 3 363.8 33.23 5.05 0.06 0.87
Ghorashal Power
Station –Unit 4 1 210 50 3 383 46.07 20.35 1.85 1.85
Ghorashal Power
Station –Unit 4
(After Re-powering)
1 411.65 50 3 363.8 33.23 5.05 0.06 0.87
Ghorashal Power
Station –Unit 5 1 210 50 3 398 46.07 20.35 1.85 1.85
Ghorashal Power
Station –Unit 6 1 210 50 3 398 46.07 20.35 1.85 1.85

Environmental Impacts
7-25
III. Meteorological Data
451. Pre-processed hourly meteorological data for 2012, 2013 and 2014 from the Dhaka
Airport (WMO number 419220, symbol VGHS, location at 23.85N, 90.40E, elevation 9.0
meters) and upper air surrounding data from an upper air station at 23.78N, 91.18E was
purchased and used in the model. A monthly summary of the meteorological data is given in
Table 7-6 and wind roses data was presented in Chapter 6.
Table 7-6: Summary of 2012, 2013 and 2014 Meteorological Data Input to AERMOD
Month Wind Temperature (oC) Relative Humidity
(%)
Max. Speed
(m/s)
Predominant
Direction
Min Max Min Max
Jan 7.7 ESE 8 30 30 100
Feb 8.2 ESE 13 34 20 100
Mar 15.4 N 20 40 13 94
Apr 11.3 N 20 43 9 100
May 12.9 N 22 40 35 100
Jun 10.3 N 25 38 41 100
Jul 9.3 N 27 36 51 94
Aug 9.3 N 26 36 58 94
Sept 12.9 N 24 36 40 100
Oct 10.3 N 22 36 37 100
Nov 6.2 SE 16 33 20 100
Dec 5.1 E 12 31 23 100
IV. Receptors
452. A uniform Cartesian grid was used to model the receptors in the model. The 50km
by 50 km model area was divided into a grid with an interval of 1,000 m, where receptors are
located on the corner of each grid for plotting of air quality data for the model project area.
Sensitive receptor areas close to the project site were also included in the grid area. The
effects on air quality at these sensitive sites were also assessed in more detail. The list of
sensitive receptors, their locations and details are given in Table 7-7.
Table 7-7: Details of Sensitive Receptors
SI Name of Sensitive Receptors Location
Latitude Longitude
1 Residential (Ghorashal PP) 23.97538 90.63505
2 School (Ghorashal PP) 23.97519 90.6357
3 School 23.97667 90.6315
4 School 23.97122 90.62837
5 School 23.98772 90.65382
6 School 23.9836 90.6482
7 School 23.96726 90.64661

Environmental Impacts
7-26
c) Air Quality Modeling
453. In this section, the predicted maximum ground level concentration results and
contour maps for maximum concentration levels in ambient air are presented for NO2, PM2.5,
PM10 and CO for both the baseline and repowering scenario. Only emissions from the
Ghorashal power station (Units 1 to 6) were modeled and a measured ambient background
concentration was added to the modeled results to predict the concentration at the sensitive
receptors.
I. Background Concentrations
454. Background ambient NOx and CO measurements32 were obtained for a location close
to the Ghorashal power station from the EIA of Unit 3 Report33. The background ambient
32 Background data from EIA of Unit 3 Report was used instead of baseline air quality data from Chapter 6
because Unit 3 Report measurements were taken further away from the power station and considered to be more
representiive of actual background concentrations. Where as the baseline data meaursements are from within
the power station complex.
8 Hospital (Palash) 23.97955 90.65019
9 High School 23.9771 90.65495
10 Thana Health Complex (Palash) 23.97455 90.66035
11 Madrasa (Garapara) 23.97031 90.6399
12 School (Dhaladia) 23.95751 90.63963
13 Madrasa (Dakshin Palash) 23.95167 90.62877
14 School 23.95075 90.62414
15 Hospital 23.94438 90.61981
16 Girls' school (Ghorashal Palash) 23.94406 90.62147
17 Dakhil Madrasa (Paiksha) 23.94473 90.62343
18 RFL Public school (RFL, Palash) 23.93835 90.62951
19 School (10 No. Ghorashal) 23.94279 90.63733
20 College (Kaliganj) 23.92651 90.5553
21 School 23.92108 90.56616
22 Primary School 23.94437 90.61508
23 Kindergarten School 23.9614 90.61517
24 Madrasa (Sahida Mohila) 23.97711 90.60766
25 School 23.97828 90.60637
26 Madrasa 23.98084 90.60397
27 School 23.99052 90.58494
28 Madrasa 23.98956 90.58004

Environmental Impacts
7-27
NO2 and CO concentrations were measured to be 28 and 204 µg/m3 respectively for an 8-
hour averaging period. This ambient concentration has contribution from the GPS as well.
Thus, to adjust for the contribution to the background NO2 and CO by the power plant
emissions, AERMOD was used to assess the contribution of each pollutant from the power
plant at this location during the period of measurement. The modeling was done for Units 1
to 5; unit 6 was not included since it was not operational at the time the ambient
measurements were taken. The model results were then subtracted out to obtain a more
accurate representation of the ambient background concentration excluding the plant
emissions (Table 7-8).
455. Measurements for PM10 were taken inside the GPS under this EIA study. The
background ambient PM10 concentration was then found by taking the average of the values.
The background ambient PM2.5 concentration was calculated based on measured PM10 and
Narayanganj CAMS data factor for PM10/PM2.5 as discussed in section 6.9 Ambient Air
Quality. The background ambient PM2.5 and PM10 concentrations were calculated to be 57
and 115 µg/m3, respectively for a 24-hour averaging period. This ambient concentration has
contribution from the GPS as well, so the values were adjusted using the same methodology
as for NO2 and CO presented in Table 7-9.
Table 7-8: Ambient Background Concentrations (NOx and CO)
Table 7-9: Ambient Background Concentrations (PM2.5 and PM10)
456. The NO2 and CO ambient background concentration values are for an 8-hour
averaging period and have to be converted to 1-hour and annual averaging periods. While
the PM2.5 and PM10 measurements are for a 24-hour averaging period and have to be
converted to an annual averaging period. Conversions were done using the power law
relationship given below:
Clong = Cshort (tshort/tlong)P
where:
Clong= the concentration for the longer averaging time
Cshort= the concentration for the shorter averaging time
33 Environmental Impact Assessment (EIA) of Re-Powering of Ghorashal Existing 3rd Unit With Gas Based
Combined Cycle Capacity of 400 MW Site Conditions, June 2014.
Pollutant
Concentration (µg/m3) Coordinates
Measured Ambient value (8-hr averaging
period)
Power plant contribution -AERMOD (8-hr
averaging period)
Adjusted Ambient value (8-hr averaging
period)
East (m) North (m)
NO2 28 9.94 18.06 259982.45 2652954.92
CO 204 6.36 197.7 259982.45 2652954.92
Pollutant
Concentration (µg/m3) Coordinates
Ambient value (24-hr
averaging period)
Power plant contribution -
AERMOD (24-hr averaging period)
Adjusted Ambient value
(24-hr averaging period)
East (m) North (m)
PM2.5 57 1.77 55.23 259663.08 2653707.50
PM10 115 1.90 113.1 259663.08 2653707.50

Environmental Impacts
7-28
Tshort = the shorter averaging time (in minutes)
Tlong = the longer averaging time (in minutes)
p = the power law exponent
457. For ambient air assessments a p value of 0.28 is used. This methodology is deemed
to give conservative estimates and thus is deemed appropriate for this case. The converted
background ambient pollutant values are given below (Table 7-10).
458. The background ambient concentration values were added to the modeled 1-hr, 8-hr
and annual concentration values.
Table 7-10: Converted Ambient Concentration Values
Pollutant
Concentration (µg/m3)
Average Adjusted
Ambient value (8-hr averaging
period)
Converted Ambient Concentration (1-
hr averaging period)
Converted Ambient Concentration (24-
hr averaging period)
Converted Ambient Concentration
(Annual averaging period)
NO2 18.06 32.2 - 2.5
CO 197.7 353 - -
PM2.5 - - 55.23 10.6
PM10 - - 113.1 21.68
459. Note the background PM2.5 and PM10 values for 24-hour and annual averaging period
are within the Bangladesh National standards. The 24-hour average concentration of PM2.5
meets the Interim target-1 (75 µg/m³) but is above the guideline of 25 µg/m3 for 24-hour
averaging period. The PM2.5 annual average meets the WHO interim target-3 (15 µg/m3) but
is above the guideline of 10 µg/m3. The PM10 value for 24-hour and annual averaging meet
WHO Interim target-1 (150 µg/m3) and Interim target-2 (30 µg/m3), respectively. However,
both values are above the WHO guidelines. Interim targets are provided in recognition of the
need for a staged approach to achieving the recommended guidelines for developing
countries. An air shed is considered to have poor air quality if the guideline value is
exceeded significantly. Thus the air shed can be considered degraded with respect to
ambient particulate matter concentrations.
II. Concentration of Nitrogen Dioxide (NO2)
460. For NO2 the maximum ground level concentrations were modeled for 1-hour
averaging period and annual averaging period to compare with the national standards (ECR
1997, amended in 2005) and WHO Guidelines.
461. For short-term compliance modeling, percentiles are used in order to account for
unusual metrological events and AERMOD’s tendency to overestimate concentrations on
low wind days. There are two distinct methods to model 1-hr NO2 compliance
concentrations; USEPA method and EU method. Both methods were used to predict
maximum ground level NO2 concentrations.
462. In the USEPA compliance method, the 1-hour NO2 modeled value is based on the
98th percentile of the maximum daily 1-hour values, which is represented by the eighth-
highest of the maximum daily 1-hour values across the year (averaged over 3 years). In the
EU method, the 99.8 percentile of the max NO2 value is taken. The annual average is the
same for both methods, it is simply the arithmetic mean averaged over a 3 year period.

Environmental Impacts
7-29
463. Preliminary modeling results indicated high maximum ground level concentrations of
NO2 close to the power plant. Also numerous residents who live close to the power plant
complained of breathing issues and surveys showed high levels of asthma and other
respiratory issues in the communities surrounding the project site. Therefore, a refined grid
analysis was conducted for NO2 emissions. A refined grid (4 km by 4 km) was modeled with
receptors every 150 m apart in the project area.
464. Table 7-11 shows the Bangladesh, World Bank, EU and USEPA standards for NO2.
Table 7-11: Important NO2 Compliance Standards
465. Table 7-12 below shows the Tier-1 predicted results for 1-hour average (using both
EU and USEPA method) and the annual average concentration. The predicted results
include the background concentration. Tier-1 assumes 100% conversion of hourly NOx
emissions into NO2.
Table 7-12: Tier-1 Predicted maximum ground level concentration of NO2 (Baseline &
Repowering)
466. The predicted results indicated exceedances for the 1-hour averaging period for both
baseline and repowering case. Since the Tier-1 approach tends to over predict
concentrations, a Tier-2 (Ambient Ratio Method) was applied to the predicted 1-hr maximum
ground level concentrations to get more realistic results.
467. The ARM uses the ratio of the average NO2 and NOx ambient concentrations
measured at a representative site. It uses an ambient equilibrium NO2/NOx ratio (annual
average) which is calculated based on local monitoring data34. Theoretically, equilibrium
occurs when the rate of NO2 formation (from oxidation of NO) equals the rate of dissociation
34 Journal of the Air and Waste Management Assocaition: The Plume Volume Molar Ratio Method for
Determining NO2/NOx Ratios in Modeling—Part I: Methodology, 2011.
Pollutant Averaging
Time
Concentration (µg/m³)
ECR 1997 (as
amended in
2005)
WHO
Guidelines
EU
Guidelines
USEPA
Standards
(NAQQS)
NO₂ 1-hr N/A 200 200 188
Annual 100 40 40 100
Scenario Averaging
Time
Concentration (µg/m³) Coordinates of Max Point (UTM)
Max Value
(USEPA
Method)
Max Value (EU
Method) East (m)
North
(m)
Baseline 1-hr 253.17 231.8 259107 2654110
Annual 21.3 21.3 259557.1 2654710
Re-
powering
1-hr 227.2 210.8 259107 2654110
Annual 19.2 19.2 259557.1 2654710
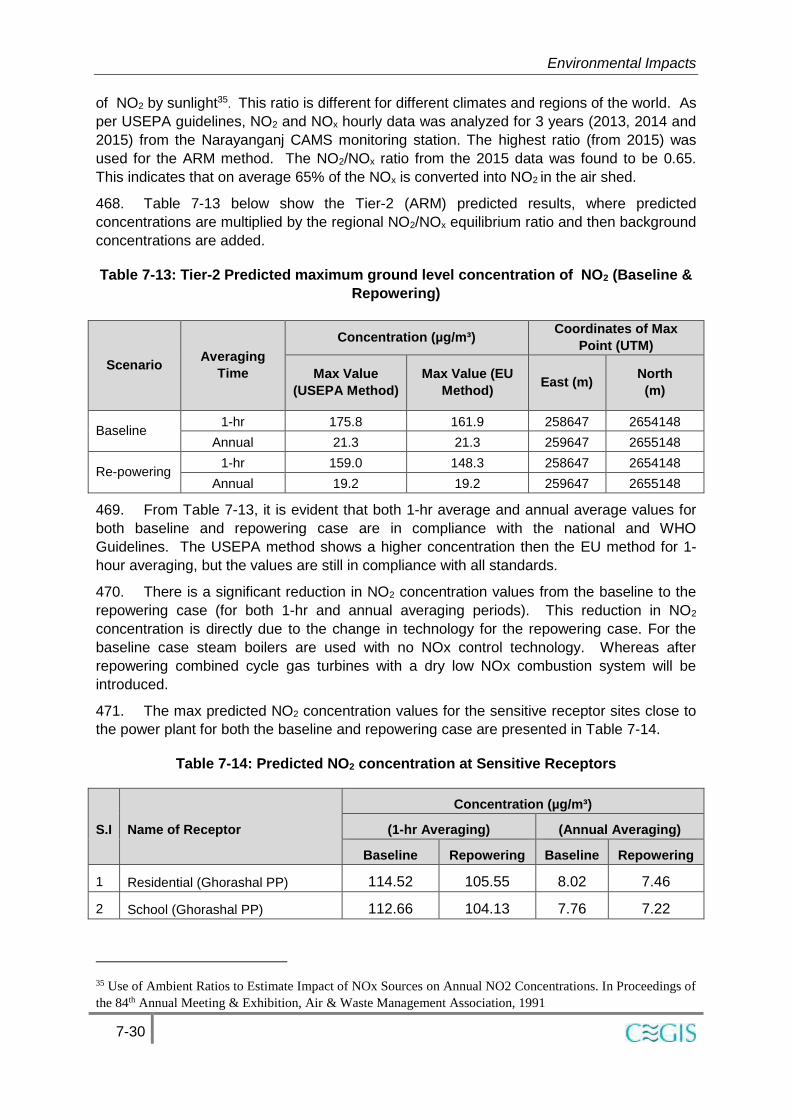
Environmental Impacts
7-30
of NO2 by sunlight35. This ratio is different for different climates and regions of the world. As
per USEPA guidelines, NO2 and NOx hourly data was analyzed for 3 years (2013, 2014 and
2015) from the Narayanganj CAMS monitoring station. The highest ratio (from 2015) was
used for the ARM method. The NO2/NOx ratio from the 2015 data was found to be 0.65.
This indicates that on average 65% of the NOx is converted into NO2 in the air shed.
468. Table 7-13 below show the Tier-2 (ARM) predicted results, where predicted
concentrations are multiplied by the regional NO2/NOx equilibrium ratio and then background
concentrations are added.
Table 7-13: Tier-2 Predicted maximum ground level concentration of NO2 (Baseline &
Repowering)
469. From Table 7-13, it is evident that both 1-hr average and annual average values for
both baseline and repowering case are in compliance with the national and WHO
Guidelines. The USEPA method shows a higher concentration then the EU method for 1-
hour averaging, but the values are still in compliance with all standards.
470. There is a significant reduction in NO2 concentration values from the baseline to the
repowering case (for both 1-hr and annual averaging periods). This reduction in NO2
concentration is directly due to the change in technology for the repowering case. For the
baseline case steam boilers are used with no NOx control technology. Whereas after
repowering combined cycle gas turbines with a dry low NOx combustion system will be
introduced.
471. The max predicted NO2 concentration values for the sensitive receptor sites close to
the power plant for both the baseline and repowering case are presented in Table 7-14.
Table 7-14: Predicted NO2 concentration at Sensitive Receptors
35 Use of Ambient Ratios to Estimate Impact of NOx Sources on Annual NO2 Concentrations. In Proceedings of
the 84th Annual Meeting & Exhibition, Air & Waste Management Association, 1991
Scenario Averaging
Time
Concentration (µg/m³) Coordinates of Max
Point (UTM)
Max Value
(USEPA Method)
Max Value (EU
Method) East (m)
North
(m)
Baseline 1-hr 175.8 161.9 258647 2654148
Annual 21.3 21.3 259647 2655148
Re-powering 1-hr 159.0 148.3 258647 2654148
Annual 19.2 19.2 259647 2655148
S.I Name of Receptor
Concentration (µg/m³)
(1-hr Averaging) (Annual Averaging)
Baseline Repowering Baseline Repowering
1 Residential (Ghorashal PP) 114.52 105.55 8.02 7.46
2 School (Ghorashal PP) 112.66 104.13 7.76 7.22

Environmental Impacts
7-31
*Tier-2 (ARM) 1-hr averaging values calculated by EU method (99.8 percentile value)
472. Table 7-14 shows that the NO2 concentration for 1-hr and annual average is within
the compliance limit for both the baseline and repowering case, there is no exceedance of
standards. There is a reduction in the NO2 at all sensitive receptor sites after the repowering
case. The highest NO2 was found at a school located close to the power plant, although this
is still within the standards and guideline values.
473. Figure 7-2 and Figure 7-3 show the 1-hr and annual averaging contour diagrams for
the baseline and repowering case, respectively.
474.
3 School 117.16 107.43 8.93 8.25
4 School 72.19 67.72 5.50 5.17
5 School 60.57 57.32 4.57 4.34
6 School 89.82 83.22 7.34 6.81
7 School 67.80 63.73 5.32 5.01
8 Hospital (Palash) 91.37 84.68 8.38 7.74
9 High School 72.49 68.01 6.49 6.05
10 Thana Health Complex (Palash) 59.85 56.68 5.26 4.95
11 Madrasa (Garapara) 80.87 75.21 6.09 5.69
12 School (Dhaladia) 48.07 46.11 3.60 3.48
13 Madrasa (Dakshin Palash) 42.19 41.02 3.20 3.12
14 School 42.78 41.52 3.26 3.18
15 Hospital 41.03 40.04 3.16 3.09
16 Girls' school (Ghorashal Palash) 40.78 39.76 3.13 3.06
17 Dakhil Madrasa (Paiksha) 40.64 39.80 3.11 3.04
18 RFL Public school (RFL, Palash) 38.30 37.65 2.95 2.90
19 School (10 No. Ghorashal) 39.68 38.81 3.07 3.00
20 College (Kaliganj) 38.56 37.81 2.97 2.92
21 School 37.64 36.97 2.94 2.89
22 Primary School 41.28 40.48 3.20 3.13
23 Kindergarten School 45.98 44.46 3.65 3.52
24 Madrasa (Sahida Mohila) 54.17 51.73 4.73 4.49
25 School 54.25 51.67 4.77 4.53
26 Madrasa 55.13 52.88 4.68 4.44
27 School 41.96 40.81 3.40 3.29
28 Madrasa 42.84 41.71 3.42 3.32

Environmental Impacts
7-32
1-Hr Average
Annual Average
Figure 7-2: Predicted NO2 Concentration (baseline scenario)

Environmental Impacts
7-33
1-Hr Average
Annual Average
Figure 7-3: Predicted NO2 Concentration (repowering scenario)
475. In Figure 7-2 and Figure 7-3, it is seen that the plume is predominately towards the
north, this is expected as this is predominate wind direction. The highest predicted maximum
ground level concentration areas occur close to the power plant. There is a decrease in
concentrations from the baseline to repowering case. The wind carries the plume away from
the major population centers of Dhaka and Ghorashal as seen in the contours.

Environmental Impacts
7-34
III. Concentration of Carbon Monoxide (CO)
476. For CO the predicted maximum ground level 1-hr and 8-hr averaging values are
given in Table 7-15, the highest predicted concentration reached for a particular averaging
period (1-hr or 8-hr) based on 3 years meteorological data as per the Bangladesh standards.
There is no WHO Guidelines for CO.
Table 7-15: Air Quality Modeling – CO (Baseline & Repowering)
477. For both the baseline and repowering case the 1-hr and 8-hr averaging values are
well below the Bangladesh standards. There is a reduction in the CO concentration from the
baseline to repowering case. This reduction is expected since the repowering case will
employ more up to date combined cycle technology – even though the repowered system
will use more fuel and generate a much higher amount of electricity.
478. The predicted CO concentration at the sensitive receptors for both baseline and
repowering cases are given in Table 7-16.
Table 7-16: Predicted CO concentration at sensitive receptors
Pollutant
Concentration (µg/m³) Coordinates of Max
Point (UTM)
Averaging
Time
ECR 1997
(as
amended in
2005)
WHO
Guidelines
Max
Value East
(m) North (m)
Baseline 1-hr 40,000 N/A 487.55 259366.2 2653520
8-hr 10,000 N/A 270.64 259647 2655148
Repowering 1-hr 40,000 N/A 441.67 259007.1 2653669
8-hr 10,000 N/A 245.24 259647 2655148
S.I Name of Receptor
Concentration (µg/m³)
(1-hr Averaging) (8-hr Averaging)
Baseline Repowering Baseline Repowering
1 Residential (Ghorashal PP) 487.55 440.75 261.23 240.19
2 School (Ghorashal PP) 483.67 439.06 254.60 236.31
3 School 485.78 441.67 265.32 242.81
4 School 437.84 409.95 229.84 219.48
5 School 428.89 403.91 218.60 211.84
6 School 458.89 424.25 246.07 230.41
7 School 422.30 399.50 220.43 213.09
8 Hospital (Palash) 437.56 409.55 240.15 226.47
9 High School 437.59 409.70 235.11 222.98
10 Thana Health Complex (Palash) 446.04 415.14 227.78 218.10
11 Madrasa (Garapara) 443.23 411.84 237.99 224.62

Environmental Impacts
7-35
479. The table above shows that the CO concentration for 1-hr and 8-hr average is well
within the compliance limit for both the baseline and repowering cases. There is a reduction
in the CO concentration at all sensitive receptor sites after the repowering case.
IV. Concentration of PM2.5
480. For PM2.5 the predicted maximum ground level 24-hr and annual concentrations for
various averaging time are given in Table 7-17. As was noted above, the background PM2.5
concentration for 24-hour and annual averaging time exceeds WHO guidelines but meet the
WHO interim target-1 and interim target-3, respectively. The background concentration for
the 24-hour and annual averaging period was found to be 55.23 and 10.6 µg/m³,
respectively. This indicates that for baseline and repowering case the power station’s
contribution to ambient PM2.5 concentration is fairly low.
Table 7-17: Predicted maximum concentrations of PM2.5 (Baseline & Repowering)
12 School (Dhaladia) 404.13 387.04 209.04 205.39
13 Madrasa (Dakshin Palash) 391.71 378.83 208.83 205.23
14 School 388.00 376.58 209.18 205.40
15 Hospital 381.45 371.78 207.73 204.47
16 Girls' school (Ghorashal Palash) 382.20 372.33 207.81 204.53
17 Dakhil Madrasa (Paiksha) 382.09 372.29 207.98 204.65
18 RFL Public school (RFL, Palash) 380.98 371.55 203.83 201.88
19 School (10 No. Ghorashal) 403.76 386.63 206.24 203.38
20 College (Kaliganj) 372.62 366.28 207.60 204.37
21 School 371.83 365.72 203.86 201.84
22 Primary School 381.57 372.14 207.97 204.50
23 Kindergarten School 395.29 381.41 216.41 210.29
24 Madrasa (Sahida Mohila) 410.00 391.44 213.62 208.43
25 School 416.10 395.47 217.18 210.79
26 Madrasa 421.12 398.71 219.76 212.42
27 School 400.75 384.98 205.66 203.03
28 Madrasa 398.39 383.09 205.26 202.72
Pollutant
Concentration (µg/m³) Coordinates of Max
Point (UTM)
Averaging
Time
ECR 1997 (as
amended in
2005)
WHO
Guidelines
Max
Value
East
(m)
North
(m)
Baseline 24-hr 65 25 58.71 259647 2655148
Annual 15 10 11.23 259647 2655148
Repowering 24-hr 65 25 57.15 259647 2655148
Annual 15 10 10.96 259647 2655148

Environmental Impacts
7-36
481. After repowering both 24-hour and annual averaging values show a decrease in the
PM2.5 concentration. Thus, the repowering case brings the ambient concentration closer to
the WHO standards and is an improvement over the baseline condition.
482. The predicted concentration at the sensitive receptor sites for both baseline and
repowering cases are given in Table 7-18.
Table 7-18: Predicted PM2.5 concentration at sensitive receptors
S.I Name of Receptor
Concentration (µg/m³)
(24-hr Averaging) (Annual Averaging)
Baseline Repowering Baseline Repowering
1 Residential (Ghorashal PP) 57.28 56.42 10.85 10.75
2 School (Ghorashal PP) 57.02 56.28 10.84 10.74
3 School 57.88 56.76 10.89 10.77
4 School 56.62 56.04 10.74 10.68
5 School 56.11 55.74 10.69 10.65
6 School 56.98 56.24 10.82 10.72
7 School 56.21 55.79 10.73 10.67
8 Hospital (Palash) 56.86 56.18 10.86 10.75
9 High School 56.55 56.00 10.78 10.70
10 Thana Health Complex
(Palash) 56.27 55.84 10.72 10.67
11 Madrasa (Garapara) 56.68 56.06 10.76 10.69
12 School (Dhaladia) 55.71 55.50 10.65 10.63
13 Madrasa (Dakshin Palash) 55.53 55.40 10.63 10.62
14 School 55.60 55.44 10.63 10.62
15 Hospital 55.61 55.45 10.63 10.62
16 Girls' school (Ghorashal
Palash) 55.59 55.43 10.63 10.62
17 Dakhil Madrasa (Paiksha) 55.56 55.42 10.63 10.62
18 RFL Public school (RFL,
Palash) 55.41 55.34 10.62 10.61
19 School (10 No. Ghorashal) 55.56 55.42 10.63 10.61
20 College (Kaliganj) 55.47 55.37 10.62 10.61
21 School 55.46 55.36 10.62 10.61
22 Primary School 55.66 55.48 10.63 10.62
23 Kindergarten School 55.87 55.60 10.65 10.63

Environmental Impacts
7-37
483. Table 7-18 shows that the predicted daily and annual average PM2.5 concentration at
sensitive receptors is within the Bangladesh national standards and meet the WHO Interim-1
and interim-3 target, respectively. There is a reduction in the PM2.5 concentration at all
sensitive receptor sites after the repowering case.
484. The combustion of gaseous fuels such as natural gas does not produce a significant
amount of particulate matter pollution. Also, natural gas from Bangladesh is naturally very
low in contaminants such as sulfur and is considered pure. It is estimated that a significant
portion of the PM2.5 concentration in Bangladesh is trans-boundary in nature (secondary
pollutants formed from NOx and SOx after chemical transformation in the ambient air),
predominately from West Bengal and North India.42 Studies show that on average 35% of
the PM2.5 concentration is trans-boundary in nature and can be as high as 67% depending
on the season and direction of the wind.42
485. Figure 7-4 and Figure 7-5 show the predicted daily and annual average contour
diagrams for the baseline and repowering cases, respectively.
24 Madrasa (Sahida Mohila) 55.99 55.67 10.70 10.66
25 School 56.03 55.69 10.70 10.66
26 Madrasa 56.14 55.75 10.70 10.66
27 School 55.51 55.39 10.64 10.62
28 Madrasa 55.55 55.41 10.64 10.62

Environmental Impacts
7-38
24-Hr Average
Annual Average
Figure 7-4: Predicted PM2.5 concentration - Baseline case

Environmental Impacts
7-39
24-Hr Average
Annual Average
Figure 7-5: Predicted annual average PM2.5 concentration - Repowering case
486. From the diagrams above, it is seen that the plume dispersion is predominately
towards the north as was the case for NO2. The highest concentration areas occur close to
the power station. There is a decrease in concentrations from the baseline to repowering
case. The wind carries the plume away from the major population centers of Dhaka,
Narsingdi and Ghorashal.
V. Concentration of PM10
487. For PM10 the predicted maximum ground level 24-hr and annual concentrations for
various averaging times are given in Table 7-19. As was noted above, the background
concentration of PM10 values for 24-hour averaging and annual averaging time exceeds

Environmental Impacts
7-40
WHO guidelines but meet the WHO interim target-1 (150 µg/m³) and interim target-3 (30
µg/m³), respectively. The modeling results indicate that for both baseline and repowering
condition the power station’s contribution to ambient PM10 concentration in the air shed is
fairly low. The predicted 24-hour averaging and annual PM10 concentration for both baseline
and repowering cases are within national Bangladesh standards.
Table 7-19: Predicted maximum concentrations of PM10 (Baseline & Repowering)
488. After repowering both 24-hour and annual averaging concentration values show a
slight decrease in the PM10 concentration. The predicted concentration at the sensitive
receptor sites for both baseline and repowering cases are given in Table 7-20.
Table 7-20: Predicted PM10 concentration at sensitive receptors
Pollutant
Concentration (µg/m³) Coordinates of Max
Point (UTM)
Averaging
Time
ECR 1997 (as
amended in
2005)
WHO
Guidelines
Max
Value
East
(m)
North
(m)
Baseline 24-hr 150 50 116.73 259647
265514
8
Annual 50 20 22.29 259647
265514
8
Repowering 24-hr 150 50 115.9 259647
265514
8
Annual 50 20 22.16 259647
265514
8
S.I Name of Receptor
Concentration (µg/m³)
(24-hr Averaging) (Annual Averaging)
Baseline Repowering Baseline Repowering
1 Residential (Ghorashal PP) 115.49 114.99 21.92 21.87
2 School (Ghorashal PP) 115.15 114.73 21.91 21.87
3 School 116.16 115.50 21.97 21.91
4 School 114.55 114.24 21.81 21.78
5 School 114.30 114.04 21.77 21.75
6 School 115.16 114.73 21.89 21.84
7 School 114.13 113.91 21.80 21.78
8 Hospital (Palash) 114.85 114.48 21.93 21.88
9 High School 114.59 114.27 21.85 21.82
10 Thana Health Complex (Palash) 114.30 114.04 21.80 21.77
11 Madrasa (Garapara) 114.62 114.29 21.84 21.80
12 School (Dhaladia) 113.65 113.54 21.73 21.72

Environmental Impacts
7-41
489. Table 7-20 shows that the predicted daily average and annual average PM10
concentration at sensitive receptors is within the Bangladesh standards and meets the WHO
Interim-1 target and Interim -3 target, respectively. However, the power station’s contribution
to the PM10 concentration is minimal at the sensitive receptor sites and high values are due
to the high background concentration. There is a slight reduction in the PM10 concentration at
all sensitive receptor sites after the repowering case.
490. Figure 7-6 and Figure 7-7 show the predicted daily and annual average PM10 contour
diagrams for the baseline and repowering cases, respectively.
13 Madrasa (Dakshin Palash) 113.47 113.39 21.71 21.70
14 School 113.51 113.44 21.71 21.71
15 Hospital 113.61 113.51 21.71 21.70
16 Girls' school (Ghorashal Palash) 113.57 113.48 21.71 21.70
17 Dakhil Madrasa (Paiksha) 113.50 113.42 21.71 21.70
18 RFL Public school (RFL, Palash) 113.32 113.27 21.70 21.70
19 School (10 No. Ghorashal) 113.47 113.39 21.70 21.70
20 College (Kaliganj) 113.44 113.36 21.70 21.70
21 School 113.37 113.32 21.70 21.70
22 Primary School 113.67 113.56 21.71 21.70
23 Kindergarten School 113.90 113.74 21.73 21.72
24 Madrasa (Sahida Mohila) 113.96 113.79 21.78 21.76
25 School 114.11 113.91 21.78 21.76
26 Madrasa 114.16 113.94 21.78 21.76
27 School 113.38 113.32 21.72 21.71
28 Madrasa 113.42 113.35 21.72 21.71

Environmental Impacts
7-42
24-Hr Average
Annual Average
Figure 7-6: Predicted PM10 concentration - Baseline case

Environmental Impacts
7-43
24-Hr Average
Annual Average
Figure 7-7: Predicted annual average PM10 concentration - Repowering case
491. From the diagrams above, it is seen that the plume dispersion is predominately
towards the north as is the case for the other pollutants. The highest concentration areas
occur close to the power station. There is a slight decrease in concentrations from the
baseline to repowering case. The wind carries the plume away from the major population
centers of Dhaka, Narsingdi and Ghorashal.
d) Maximum Ground Level Concentrations

Environmental Impacts
7-44
492. The distance emissions disperse from the stack depends on various factors,
including the height of stack, wind speed, direction, mixing heights, temperature of the flue
gas and air, flue gas exit velocity, and surrounding air. Figures 7-8, 7-9, 7-10 and 7-11
present the distance vs. maximum ground level concentration (MGLC) baseline and re-
powering cases for NO2, CO, PM2.5 and PM10 respectively.
Figure 7-8: MGLC of NO2 versus distance from the Power Plant
Figure 7-9: MGLC of CO versus distance from the Power Plant

Environmental Impacts
7-45
Figure 7-10: MGLC of PM2.5 versus distance from the power plant
113.5
114
114.5
115
115.5
116
116.5
117
0 1,000 2,000 3,000 4,000 5,000 6,000 7,000 8,000 9,000 10,000
Co
nce
ntr
atio
n (μ
g/m
3 )
Distance from the Power Plant (m)
Baseline
Repowering
648.25 m
Figure 7-11: MGLC of PM10 versus distance from the power plant
493. The distance of maximum concentration was the same in the baseline and
repowering cases for the pollutants NO2, PM2.5 and PM10 at 549.6 m, 699.24 m and 648.25
m, respectively. For CO, the maximum concentration for baseline was found at a distance of
550 m, whereas for repowering it was found to be at 650 m. All four pollutants hit a
maximum concentration at a certain distance away. The maximum ground level
concentration then gradually decreases and plateau’s as the distance from the power station
increases.
e) Sensitivity Analysis for Stack Height
494. A sensitivity analysis was conducted by varying stack heights to predict maximum
concentrations using both USEPA and EU methods (Tier-2 Method), to assess the effects of

Environmental Impacts
7-46
increasing stack heights on the maximum predicted ground level concentration. Table 7-21
shows sensitivity of stack height to predicted concentration for only Unit 4 and Table 7-22
shows for both Units 3 and 4.
Table 7-21: Sensitivity Analysis for Stack Height (Unit 4)
Stack Height
(m)
USEPA Method (1-hr
average )
EU Method (1-
hr average)
Coordinates of Max Point
(UTM)
(µg/m³) (µg/m³) East (m) North (m)
50 159.0 148.3 258647 2654148
60 157.8 146.3 260720.5 2654408.2
70 156.2 144.1 260720.5 2654408.2
Table 7-22: Sensitivity Analysis for Stack Height (Units 3 and 4)
Stack Height
(m)
USEPA Method (1-hr
average)
EU Method (1-
hr average)
Coordinates of Max Point
(UTM)
(µg/m³) (µg/m³) East (m) North (m)
50 159.0 148.3 258647 2654148
60 156.4 144.18 260720.5 2654408.2
70 154.1 140.6 260720.5 2654408.2
495. When the stack height is increased by 10 m for only Unit 4 there is not much
difference in the maximum concentration value. When stack heights are changed for both
Units 3 and 4, there are more pronounced decrease in the maximum concentration values.
Increasing the stack height by 20 meters for both units lowered the NO2 concentration by 4.9
and 7.7 µg/m3 for the USEPA and EU methods, respectively.
Air quality impact is characterized as Major Adverse, as given in Table 7-4.
7.8.5 Impact on Ambient Noise
496. Sensitive receptors of noise were identified close to GPS, which include
administrative buildings, residence, education institutions, hospitals and clinics etc. Figure
7-12 presents the distribution of sensitive receptors in the Project area.

Environmental Impacts
7-47
Figure 7-12: Location of Sensitive Receptor of Noise during the Project Activities
7.8.6 Noise Generation and Potential Impacts
497. It is envisaged that noise level in the complex would increase during the activities of
demolition of the existing Unit 4 boiler and construction and erection of new equipment in
Unit 4. Moreover, due to the operation of the existing units and the future repowering units,
the power station area would experience a high level of noise. For understanding the level of
noise dispersed from the Project activities in different locations of sensitive receptors, noise
propagation modelling was conducted for three different scenarios, which are baseline, re-
powering, and cumulative impacts of future development and other major sources nearby.
498. In general, persistence exposure to the high level of noise can have adverse health
impacts and can increase the level of stress of the susceptible individuals. It can also cause
permanent damage to the hearing ability of the exposed person. Next section presents noise
modeling output for both baseline and repowering scenarios. Cumulative noise impacts are
presented in Section 7.9.
a) Noise Modelling
499. A simulation of the noise propagation during the operation of the plant was done by
using CUSTIC 3.2 software. CUSTIC noise model was developed by Canarina
Environmental Software Solutions, which is widely used for noise propagation modeling and
is approved by European Environment agency.
500. For running the model, the average daytime temperature and relative humidity was
considered as 300C and 70%, whereas average night time temperature and relative humidity
was considered as 200C and 90%, respectively. A boundary wall of 3 meter height with
density of 150-220 kg/m3 and with sound attenuation level of 34 dBA was considered around
the project site. Moreover, the obstacles of trees and other major buildings inside the plant
boundary were also kept in consideration. In case of trees, the average height was
considered as 6 meter and the sound attenuation level was considered as 10 dBA. In case

Environmental Impacts
7-48
of building, the average height was considered as 3 meter with sound attenuation level of 34
dBA.
I. Baseline Scenario
501. The first scenario is the baseline scenario where all six units of the plant and 2 RMS
units and their associated pipelines were considered as the source of noise. In this scenario,
the noise levels of each of the units of the plant were considered as 90, each of the RMS
units were considered as 100 dBA and the associated pipelines were considered as a
series of 90 dBA noise source (noise levels were measured during field visit). The result of
the modelling in this scenario is presented in the Figure 7-13.
Figure 7-13: Simulation of Noise Propagation during Plant Operation in Baseline
Scenario
502. The level of noise predicted in different sensitive receptors for baseline condition is
presented in Table 7-23. It can be seen from the table that, in this scenario, 8 (eight) of the
sensitive receptors experiences higher level of noise than the standard of ECR 1997 and
WHO Guideline values, as marked in red in Table 7-23.

Environmental Impacts
7-49
Table 7-23: Noise level in different sensitive receptors in Baseline Scenario
Place Notation Type Noise Level (dBA)
[Baseline]
Administrative
building SR-1
Industrial
66.70
Mosque/Accounts
Office SR-2
Industrial
66.70
Near RMS SR-3 Industrial 91.72
Near Fertilizer Factory SR-4 Industrial 75.04
Unit-4 boundary SR-9 Industrial 66.70
Inside Aggreko-Max SR-10 Industrial 58.37
Aggreko Gate SR-11 Industrial 58.37
Outside the
plant/Commercial SR-12
Industrial/
Commercial 58.37
Corner of Substation SR-14 Industrial 58.37
Bazaar SR-19
Industrial/
Commercial 41.69
Residence in fertilizer
factory (West side) SR-5
Residential
58.37
Residence in Fertilizer
Factory (Outside
Boundary) SR-6
Residential
66.70
Residence Mosque
Fertilizer Factory SR-7
Residential
58.37
Residence in FF Near
Aggreko SR-8
Residential
58.37
Army Residence SR-13 Residential 60
Residential Area SR-15 Residential 58.37
School-Hospital SR-16 Residential 50.03
Central Residential
Mosque SR-17
Residential
50.03
Ghorashal Residence SR-18 Residential 50.03
*Here IS= Insignificant
II. Re-powering Scenario
503. In the re-powering scenario, noise from unit 1, 2, 5, and 6, proposed repowering
Units 3 and 4 and 2 RMS units were considered. The noise level of units 1, 2, 5, 6 and re-
powering of Units 3 and 4 were considered. As measured during field visits, the level of
impacts of noise from existing units (1, 2, 5, and 6) and of the RMS unit were found 90 dBA
and 100 dBA, respectively. The associated pipelines were considered as a series of 90 dBA
source of noise (the noise levels were measured during field visit). The noise level from both
of the re-powering Units (3 and 4) was considered 90 dBA. The results of the modeling in
this scenario are represented in the Figure 7-14.

Environmental Impacts
7-50
Figure 7-14: Simulation of Noise Propagation during Plant Operation in Re-powering
Scenario
504. The predicted noise level in sensitive receptors in this scenario is presented in Table
7-24. It can be seen from the table that, in this scenario, 8 (eight) of the sensitive receptors
experience higher level of noise than the standard of ECR 1997 and WHO Guideline values.
Table 7-24: Noise level in different sensitive receptors in Re-powering Scenario
Place Notation Type Noise Level (dBA)
[Repowering]
Administrative building SR-1 Industrial 67.15
Mosque/Accounts Office SR-2 Industrial 67.15
Near RMS SR-3 Industrial 92.33
Near Fertilizer Factory SR-4 Industrial 75.54
Unit-4 boundary SR-9 Industrial 67.15
Inside Aggreko-Max SR-10 Industrial 58.76
Aggreko Gate SR-11 Industrial 58.76
Outside the
plant/Commercial SR-12
Industrial/ Commercial
58.76
Corner of Substation SR-14 Industrial 58.76
Bazaar SR-19 Industrial/ Commercial 41.9
Residence in fertilizer
factory (West side) SR-5
Residential
58.76
Resident Fertilizer
Factory (Outside
Boundary) SR-6
Residential
67.15
Residence Mosque SR-7 Residential 58.76

Environmental Impacts
7-51
Place Notation Type Noise Level (dBA)
[Repowering]
Fertilizer Factory
Residence FF Near
Aggreko SR-8
Residential
58.76
Army Residence SR-13 Residential 61
Residential Area SR-15 Residential 58.76
School-Hospital SR-16 Residential 50.36
Central Residential
Mosque SR-17
Residential
50.36
Ghorashal Residence SR-18 Residential 50.36
III. Noise modeling with barrier
505. As the noise levels in the Ghorashal Power Plant Complex exceed the standard of
ambient noise level in numerous receptors, additional simulation was conducted considering
noise barriers in selected locations to attenuate noise. A brick boundary wall of 3 m height
was considered before the residential area with length XX m. Moreover, thick plantation and
green cover was also considered in the vacant land immediately before the wall. Some
greenbelts were also considered outside the boundary wall of Ghorashal complex in the side
of fertilizer factory residence. The resultant noise level in different sensitive receptors
considering the barriers is presented in Figure 7-15 and is compared with the re-powering
scenario (Table 7-25). With noise barriers noise levels comply with ECR 1997 and WBG
Guideline values in most of the receptors but exceeds in three receptor locations. One is
close to the RMS and other two (SR-4 and SR-6) are close the the fertilizer factory.
Table 7-25: Comparison of noise level without and with barrier during re-powering
scenario
Place Notation Type Noise Level (dBA)
[Repowering]
Noise Level
(dBA)
[with barrier]
Administrative
building SR-1
Industrial
67.15
66.94
Mosque/Accounts
Office SR-2
Industrial
67.15
66.94
Near RMS SR-3 Industrial 92.33 92.04
Near Fertilizer
Factory SR-4
Industrial
75.54
75.31
Unit-4 boundary SR-9 Industrial 67.15 66.94
Inside Aggreko-Max SR-10 Industrial 58.76 58.57
Aggreko Gate SR-11 Industrial 58.76 58.57
Outside the
plant/Commercial SR-12
Industrial/
Commercial
58.76 58.57
Corner of Substation SR-14 Industrial 58.76 58.57

Environmental Impacts
7-52
Place Notation Type Noise Level (dBA)
[Repowering]
Noise Level
(dBA)
[with barrier]
Bazaar
SR-19
Industrial/
Commercial
41.9 18.74
Residence in fertilizer
factory (West side) SR-5
Residential 58.76 50.21
Resident Fertilizer
Factory (Outside
Boundary) SR-6
Residential 67.15 58.57
Residence Mosque
Fertilizer Factory SR-7
Residential 58.76 50.21
Residence FF Near
Aggreko SR-8
Residential 58.76 33.47
Army Residence SR-13 Residential 61 33.47
Residential Area SR-15 Residential 58.76 Insignificant
School-Hospital SR-16 Residential 50.36
Central Residential
Mosque SR-17
Residential
50.36
Insignificant
Ghorashal Residence SR-18 Residential 50.36 18.74

Environmental Impacts
7-53
Figure 7-15: Simulation of noise propagation with noise barrier
506. This impact is characterized as Major Adverse, as given in Table 7-4.
7.8.7 Solid Waste Disposal
507. Solid wastes in terms of institutional and official daily waste (paper), kitchen waste,
human waste, etc. generated from the people involved in official activities and residing in the
residences may become burden to environment if not managed properly.
7.8.8 Impact on Soil
508. Accidental falling of solid wastes on the land during transportation to the municipal
landfill area may cause damage to soil quality. In addition, during plant operation various
scrap metals and other solid wastes both hazardous and non-hazardous will be generated
and
7.8.9 Impact of thermal plume (including modelling)
509. Condenser cooling water from Ghorashal Power Station discharges directly into
Shitalakhya River after traveling 1 km distance through an open channel. At the outfall of
discharge channel, water temperature is recorded as 39°C. Usually, after condenser cooling
the outlet temperature would be 60-70C higher than the intake temperature at the beginning
of this power plant. After a long period of operation, a number of equipment like high-
pressure steam extractor of unit-4 is not functioning well. Therefore, same volume of intake
water is now cooling high amount of steam in condenser results increasing the outlet
temperature. Regular tidal variations especially in dry season in Shitalakhya play significant
role of thermal plume dispersion.
510. During baseline study, water temperature in the outfall and the mixing zone has been
found higher than the ambient temperature. Present thermal plume dispersion is not in
compliant with the mixing zone temperature requirements (temperature of wastewater prior
to discharge does not result in an increase greater than 3°C of ambient temperature at the
edge of a scientifically established mixing zone) of international standards36. The ambient
temperature of the river has been recorded (30.5oC) almost 5 km upstream from the outfall
point of Shitalakhya River.
511. In order to predict the thermal plume dispersion properly, Cornell Mixing Zone Expert
System (CORMIX3) software is used to predict unsteady and steady-state mixing behavior
and plume geometry. It is a USEPA-supported mixing zone model and decision support
system for environmental impact assessment of regulatory mixing zones resulting from
continuous point source discharge. The model input data both for ambient and discharge
parameters have been presented in Table 7-26. In the baseline study, once through cooling
is considered (without cooling tower) but after the repowering of unit-4, close cycle cooling
(with cooling tower) and refurbishment of the equipments of unit-4 as well as other units are
considered. Therefore, water requirements and the effect of thermal plume will reduce for
entire GPS.
512. The cooling tower of Unit 4 will be operated to cool the condenser cooling water at
the rate of 7.3 m3/s. At the same time, the condenser cooling systems of other units will be
improved which collectively reduce around 2oC of thermal plume temperature. It is assumed
36WBG’s General EHS Guidelines: Environmental, Wastewater and Ambient Water Quality, 2007

Environmental Impacts
7-54
that, in discharge channel after traveling 1 km distance, thermal discharge will lose around
10C temperature. However, thermal plume temperature will be around 36.50C at outfall point
in future operation of GPS.
Table 7-26: Plume Model Input Parameter
Unit Low Tide (Unsteady State)
Slack Period Steady State
Low Tide (Unsteady State
Sources of Data
AMBIENT PARAMETERS:
Cross-section bounded bounded bounded Field observation
Width m 200 200 200 Schematized of Cross section
Channel regularity 2 2 2 Field Survey
Ambient flow rate (Baseline)
m3/s 64.8 44.8 87.0 H-D model simulated data*
Ambient flow rate (With CT)) m3/s 72.0 43.4 96.0
Average depth (Baseline) m 2.7 2.8 2.9 Schematized of Cross section
Average depth (With CT) 3.0 3.1 3.2
Depth at discharge (Baseline)
m 2.6 2.7 2.8 Field Survey
Depth at discharge (With CT)
m 2.9 3.0 3.1
Darcy-Weisbach friction factor
0.051 0.05 0.05 Field Observation
Calculated from Manning's 0.03 0.03 0.03
Wind velocity m/s 3.1 3.1 3.1 Wind Rose
TIDAL SIMULATION at time hours 1h (4:0PM)
Before the slack
Avg. of 3 h 1h(9:0PM) After the Slack
Instantaneous ambient velocity
m/s 0.12 0.07 0.15 H-D model simulated data*
Maximum tidal velocity m/s 0.17 - 0.17 H-D model simulated data*
Rate of tidal reversal (m/s)/hour
0.12 - 0.15
Period of reversal hours 12.4 - 12.4
Surface temperature 0C 30.5 30.5 30.5 Field survey

Environmental Impacts
7-55
Unit Low Tide (Unsteady State)
Slack Period Steady State
Low Tide (Unsteady State
Sources of Data
Bottom temperature 0C 30.5 30.5 30.5 Field survey
Calculated FRESH-WATER DENSITY
kg/m3 995.49 995.49 995.49
DISCHARGE PARAMETERS: Surface Discharge
Discharge located on From bank
left right right Field survey
Discharge configuration Discharge
flush flush flush Field Observation
Distance from bank to outlet m 0 0 0 Field survey
Discharge angle 0C 110 110 110 Field survey
Depth near discharge outlet m 2 2 2 Field survey
Bottom slope at discharge 0C 15 15 15 Field survey
Rectangular discharge:
Discharge cross-section area
m2 12 12 12 Field survey
Discharge channel width m 12 12 12 Field survey
Discharge channel depth m 1 1 1 Field survey
Discharge flow rate (Baseline)
m3/s 33.02 33.02 33.02 Water balance
report
Discharge flow rate (With CT)
m3/s 25.72 25.72 25.72
Discharge temperature (Baseline)
0C 39 39 39 Field survey
Discharge temperature (With CT)
0C 36.5 36.5 36.5
(Note: *10th January 2005, 5:00 PM-9:00 PM)
( Note: *10th January 2005, 5:00 PM-9:00 PM)
513. The thermal plume dispersion to the river depends on the plant operation capacity,
seasonal water diversion to the agricultural field and river tidal flow. Renovation and
enhancement of existing cooling system will reduce the amount of thermal plume at the rate
of 7.3 m3/s. The worst case scenario is assumed for dry season when the river experience
lean flow. During dry season, significant amount of irrigated water has been diverted at the
rate of 6.18 m3/s to agricultural field. Considering all circumstance, the thermal plume will
discharge into the river at the rate of 25.72 m3/s at 36.50C considering cooling tower in
operation.

Environmental Impacts
7-56
514. The Hydro-dynamic simulated data of winter (5:00PM – 9:00 PM) 10th January, 2005
has been used for ambient worst case scenario generation after checking years of
hydrological data of Shitalakhya River. Slack period has been considered for 3 hrs.
CORMIX3 model has been run considering tidal fluctuation before and after 1 hr of the slack
period.
515. The plume discharge flow rate 25.72 m3/s is greater than and equal to the ambient
flow rate during the slack period causes insignificant physical dilution. Therefore, steady
state condition has been considered for slack period as the dilution value would
asymmetrically reach the initial condition of the plume discharge. However, unsteady state
has been considered both for before and after the slacks. Figure 7-16 shows for 1-hr before
the slack, Figure 7-17 shows for slack period and Figure 7-18 shows for 1-hr after the slack
considering the cooling tower. The result of thermal plume modeling has been generated
resting on the worst-case scenarios.
0
10
20
30
40
50
60
0 20 40 60 80 100 120 140 160 180 200 220 240
Acro
ss the R
iver
(m)
Along the River (m)
Centerline Plume Path
Plume Boundary
Temperature (deg C)
33.433.533.7
34.0
34.3
33.033.133.2
33.332.932.9
36.5
Dis
charg
e
34.8
Figure 7-16: Thermal plume dispersion from upstream to downstream during low tide

Environmental Impacts
7-57
0
10
20
30
40
0 20 40 60 80 100 120 140 160 180 200 220 240
Acro
ss the R
iver
(m)
Along the River (m)
Centerline Plume Path
Plume Boundary
Temperature (deg C)
Dis
ch
arg
e
32.432.532.632.733.033.233.9
33.9
34.6
32.4 32.4 32.3
36.5
Figure 7-17: Thermal plume dispersion during slack period
0
10
20
30
40
50
0 10 20 30 40 50 60 70 80
Acro
ss the R
iver
(m)
Along the River (m)
Centerline Plume Path
Plume Boundary
Temperature (deg C) 35.2035.23
35.3
35.42
39.0
Dis
ch
arg
e
35.55
35.36
35.26
35.15
Figure 7-18: Thermal plume dispersion from downstream to upstream during high tide
516. During low tide period e.g., 1-hr before the slack, the plume will dispersed to the
downstream and attach to the left bank of the river. At this situation, the centerline
temperature will reduce to 33.0 0C at 100 m distance from the outfall. Without considering
the cooling tower, the centerline thermal plume temperature would be 35.10C at 100 m
downstream distance from the outfall.
517. During slack period, the plume will disperse widely upstream of the river. Around 33.0 0C will be the plume temperature in comparison to 33.7 0C without using cooling tower at
100m upstream distance from the outfall. After 1-hr slack (initial stage of high tide) tidal
water will force the thermal plume to the upstream region. Around 35.10Cwill be the plume
temperature at 85 m for using cooling tower in comparison to 37.40C at 85m at distance

Environmental Impacts
7-58
upstream distance from the outfall at present. For this condition, mixed water from the
previous half-cycle becomes re-entrained into the near field of the discharge. However, a
pool of mixed water formed at slack tide will be advected downstream in this phase.
Therefore, dispersed thermal plume temperature at the intake points which is 500m
upstream from the outfall cannot be predicted for considering unsteady state.
518. Without considering the cooling tower, the rate of thermal plume discharge will be
33.02 m3/when all units run simultaneously. During worst case scenario, irrigation water will
not be diverted and other ambient factors considered same as previous one. Table 7-27
shows a comparative assessment of spatial temperature variations with and without close-
cycle cooling system in Unit 4. All ambient and discharge parameters are assumed to be the
same except the discharge volume. The intake point of the power plant is considered as
sensitive receptors for thermal plume dispersion modeling.
Table 7-27: Comparison of plume temperature with and without cooling tower
Sl.
No
Parameter Description Unit Without Cooling
Tower/ Baseline
Installing
Cooling
Tower
1 Plume Discharge Irrigation water is
diverted (6.38
m3/s) in dry season
m3/s 33.02 25.72
2 Low tide (Unsteady
State)
100 m distance
from out fall
0C
35.1 33.5
3 Slack Period
(Steady State)
100 m distance
from out fall
0C
33.7
33.0
4 High tide (Unsteady
State)
85 m distance from
the out fall
0C 37.4 35.1
5 Intake Point (High
tide Steady State)
500 m distance to
the Upstream
0C 32.9 31.8
519. The intake point is mainly influenced by thermal plume at the time of high tide period.
However, the predicted temperature at intake point would be 31.8oC after using cooling
tower complying with WBG Guideline values (i.e., 33.50C) at the distance of 100m from the
outfall and without using cooling tower the temperature would be 32.9oC. From the modeling
output of thermal plume, it is evident that although the repowering of Unit 4 (with cooling
tower) reduces the total heat waste stream by 19%, the effect on the water quality scenario
(with respect to the thermal plume) is negligible. There would be some improvement but
thermal plume generated from the rest of the units of GPS would still be non-compliant to
WBG Guidelines in some cases. It is stressed that in order to improve the water quality
scenario (with respect to thermal plume and its effects) the other units need to install cooling
towers to minimize the effect of their thermal effluent. The GPS has already started moving
in this direction by including closed cooling in its new Unit-7. This option is expected to be
considered by GPS in repowering of other units in future. Once repowering is done, Units 1

Environmental Impacts
7-59
and 2 will be decommissioned and eventually this will lead to reduction of the thermal load
on Shitalakhya River.
7.8.10 Impact on Occupational Health and Safety
520. The operation of the Plant may cause occupational health and safety risk due to
explosion caused by gas leak from underground pipes, mechanical failure of machineries,
faulty electrical equipments/transmission lines and spillage of flammable chemicals and oily
substances. Possible health and safety risk also include contact with fine insulation particles
(made of glass wool, asbestos etc.) while repairing old insulated pipelines. These particles
could be inhaled by the workers accidentally and may cause breathing difficulties, irritations
if proper PPE is not worn. They may also slip and accidentally fall from high heights,
resulting in severe injuries and fatalities. Furthermore, health risk may be caused if proper
safety measures are not followed.
7.8.11 Impact on Public Health and Safety
In case of any serious accident, the Plant may become a risk factor for those people who are
living/working adjacent to it. Particularly, it may cause safety risk to the nearby residential
areas, school and offices. It is apprehended that fatalities may take place if any accident
occurs.
7.8.12 Impact on Traffic Movement
521. Movement of various Cargoes and Lorries, carrying lube oils, chemicals and other
volatile substances, may cause them to spill in the event of an accident. These materials
may be then washed away into nearby vegetation area; or could be leached into the river via
storm water drainage system, if the spillages are not promptly managed. These chemicals
may cause harm to the aquatic ecosystem if they enter into the river. Road accidents due to
these spilled chemicals may also cause injuries to passerby, GPS residents and workers.
They may even cause damage to properties and structures.
7.8.13 Gas pipeline corrosion
522. Corrosion on the internal wall of buried gas pipeline can occur when the pipe wall is
exposed to water and contaminants in the gas, such as O2, H2S, CO2, or chlorides. The
nature and extent of the corrosion damage that may occur are functions of the concentration
and particular combinations of these various corrosive constituents within the pipe, as well
as of the operating conditions of the pipeline. For example, gas velocity and temperature in
the pipeline play a significant role in determining if and where corrosion damage may occur.
In other words, a particular gas composition may cause corrosion under some operating
conditions but not others. Corrosion may also be caused or facilitated by the activity of
microorganisms living on the pipe wall. Referred to as microbiologically influenced corrosion,
or MIC, this type of corrosion can occur when microbes and nutrients are available and
where water, corrosion products, deposits, etc., present on the pipe wall provide sites
favorable for the colonization of microbes. Microbial activity, in turn, may create
concentration cells or produce organic acids or acid-producing gases, making the
environment aggressive for carbon steel. The microbes can also metabolize sulfur or sulfur
compounds to produce products that are corrosive to steel or that otherwise accelerate the
attack on steel. This impact is characterized as major adverse, as given in Table 7-4.

Environmental Impacts
7-60
7.8.14 Gas compressor fouling
523. Compressor fouling is dependent on the quality of the ambient air, inlet filters, and
the washing regime. Polymer deposits on compressor internals which increases frictional
losses and alters flow pattern and lead to loss of compressor efficiency, pressure drop
increase in after coolers, potential for unbalancing, rotor, and seal damage. Initially
increasing speed compensates efficiency loss, later it limits plant capacity, energy
consumption increases all the time, increase in suction pressure reduces furnace yields, and
increase in maintenance efforts and cost. This impact is characterized as moderate adverse,
as given in Table 7-4.
7.8.15 Gas pipeline leak
524. Poor tieing-in, old age, aged welds, construction defects, corrosion, third party
ruptures, and natural/environmental reasons may cause leak of significant amount of gas
from the pipe. Gas leak and subsequent fire outbreak or loss of contaminant being primarily
an environmental risk can also escalate to asset damage and loss of life. A small leak
undetected can result in enormous damage. This impact is characterized as moderate
adverse, as given in Table 7-4.
7.8.16 Social Impact
Impact on Tourism
525. The Project has no direct impact on tourism. However, the development of existing
and new units would attract various new industries and entrepreneurs. Development of
various industries would facilitate the development of various recreational facilities, such as
shops, parks, restaurants etc. in future. This will promote further development of Ghorashal
area and might bring people in for tourism.
Impact due to transportation of primary fuels
526. Natural gas, primary fuel for the Plant, will be supplied by Titas Gas Transmission
and Distribution Company Ltd. (TGTDCL) via underground pipelines and hence it would not
have any impact except accidental explosion.
7.9 Cumulative Impacts
7.9.1 Air Quality
527. The cumulative impact of all major emission sources in the air-shed is assessed. The
assessment includes emissions from the proposed 365 MW combined cycle gas turbine
power plant which will be located within the property line of Ghorashal power station.
a) Project Area
528. An area, 50 km by 50 km centering the stack of Ghorashal Power Station Unit 4 was
selected for the cumulative analysis. The DEM37 of the model area and major emissions
sources in the air shed are shown in Figure 7-18.
37 DEM data from SRTM, ASTER GDEM and various other sources at 3" resolution from
<http://www.viewfinderpanoramas.org/>

Environmental Impacts
7-61
Figure 7-19: Digital elevation model (All Major Sources)
b) Major Emission Sources in the Air shed
529. Emission inventories were prepared for all major point, area, and line sources within
the selected airs shed. The major point sources within the model area were identified as
follows:
Ghorashal Power Station (950 MW);
Ghorashal Quick Rental Aggreko (100 and 45 MW);
Ghorashal Quick Rental Max Power (78 MW);
Ghorashal Regent Energy & Power (108 MW);
Tongi Power Station (100 MW);
Ghorashal Fertilizer Factory, PP 1, 2 & 3; and
Palash Urea Fertilizer Factory, PP1 & 2.
530. Major line sources of pollution considered in the model are traffic along the major
roads and highways, which include the: N-3, N-105, R-301, R-311, R-302, R-114, R-211, R-
310 and R-203. Brick kilns located in the project area were grouped together and modeled
as area sources.
531. The stack emissions and stack parameters of all point sources are given in Table
7-26. The stack emissions and parameters of the Ghorashal Power Station were given in
Table 7-5.
Table 7-28: Major Point Source Emissions in the Project Area
Power Plant No. of
Stack
Capacity
(MW)
Stack
Height
(m)
Inner
Dia.
(m)
Flu Gas
Temp. (K)
Emission Rate (g/s)
NO2 CO PM2.5 PM10
Ghorashal Quick 120 100 3 0.6 823 18.6 36.57 2.20E-02 3.40E-01

Environmental Impacts
7-62
Power Plant No. of
Stack
Capacity
(MW)
Stack
Height
(m)
Inner
Dia.
(m)
Flu Gas
Temp. (K)
Emission Rate (g/s)
NO2 CO PM2.5 PM10
Rental Aggreko -1
Ghorashal Quick
Rental Aggreko -2 54 45 3 0.6 823 8.37 16.47 1.00E-02 1.50E-01
Ghorashal Quick
Rental Max Power 2 78 19.5 3.4 723 35.06 8.94 1.90E-02 2.80E-01
Ghorashal Regent
Energy & Power 34 108 20 0.67 663.15 13.83 2.10 2.40E-02 3.60E-01
Tongi Power
Station 1 100 45 3 773 25.03 6.38 1.30E-02 2.00E-01
Ghorashal Fertilizer
Factory PP 1 1 8 25 2 823 2.56 0.65 1.35E-03 2.00E-02
Ghorashal Fertilizer
Factory PP 2 1 8 25 2 823 2.56 0.65 1.35E-03 2.00E-02
Ghorashal Fertilizer
Factory PP 3 1 18 25 2 823 5.70 1.45 3.01E-03 5.00E-02
Palash Urea
Fertilizer Factory
PP1
1 6 25 1.7 723 2.20 0.56 1.16E-03 2.00E-02
Palash Urea
Fertilizer Factory
PP2
1 6 25 1.7 723 2.20 0.56 1.16E-03 2.00E-02
New Proposed
Ghorashal CCGT
Power Plant
1 365 50 3 393 35.84 5.45 6.00E-02 9.40E-01
532. The emission rate, release height and source area considered for the brick kilns are
presented in Table 7-28.
Table 7-29: Major Area Sources in the Project Area
Name
Emission Rate (g/s-m2) Source
Area
(m2)
Release
Height
(m) NO2 CO PM2.5 PM10
Brick Field 1 2.7869E-07 4.37161E-07 4.75412E-07 1.05465E-06 942,494 38.1
Brick Field 2 2.2019E-06 3.4539E-06 3.75612E-06 8.33253E-06 668,033 38.1
Brick Field 3 1.6913E-06 2.65301E-06 2.88515E-06 6.4004E-06 403,788 38.1
Brick Field 4 4.365E-06 6.84705E-06 7.44617E-06 1.65185E-05 72,210 38.1
Brick Field 5 1.279E-06 2.0063E-06 2.18185E-06 4.84019E-06 410,728 38.1
Brick Field 6 4.8222E-06 7.56419E-06 8.22605E-06 1.82486E-05 10,894 38.1
Brick Field 7 7.4493E-06 1.16852E-05 1.27077E-05 2.81906E-05 7,052 38.1

Environmental Impacts
7-63
Name
Emission Rate (g/s-m2) Source
Area
(m2)
Release
Height
(m) NO2 CO PM2.5 PM10
Brick Field 8 2.5324E-06 3.97244E-06 4.32003E-06 9.5835E-06 62,232 38.1
Brick Field 9 3.3458E-06 5.24834E-06 5.70757E-06 1.26616E-05 15,701 38.1
Brick Field 10 2.0024E-06 3.14102E-06 3.41586E-06 7.57772E-06 157,409 38.1
Brick Field 11 1.033E-05 1.62041E-05 1.76219E-05 3.90923E-05 25,427 38.1
Brick Field 12 1.0143E-06 1.59106E-06 1.73027E-06 3.83842E-06 310,753 38.1
Brick Field 13 2.0446E-05 3.20722E-05 3.48785E-05 7.73742E-05 7,708 38.1
Brick Field 14 1.824E-06 2.86116E-06 3.11151E-06 6.90255E-06 115,204 38.1
Brick Field 15 1.1615E-05 1.82189E-05 1.98131E-05 4.39532E-05 4,523 38.1
Brick Field 16 1.7652E-05 2.76896E-05 3.01124E-05 6.68011E-05 2,976 38.1
Brick Field 17 1.9644E-06 3.08136E-06 3.35098E-06 7.43378E-06 133,714 38.1
Brick Field 18 2.8017E-05 4.39489E-05 4.77945E-05 0.000106027 1,875 38.1
Brick Field 19 2.9534E-06 4.63275E-06 5.03811E-06 1.11765E-05 53,362 38.1
533. The annual average daily traffic data along the highways N-3, N-105, R-301, R-311,
R-302, R-114, R-211, R-310, and R-203 that was used in the modeling is given in Table
7-29.
Table 7-30: Annual average daily traffic data used for air quality modeling
Source: Roads and Highways Department, http://www.rhd.gov.bd/RoadDatabase/
534. The relative emission contributions from major point, area and line sources in the air
shed is given in Figure 7-19. The relative emission contribution of all point source emissions
is given in Figure 7-20.
NO2 CO
Name of
Road
(AADT)
Heavy
Truck
Medium
Truck
Large
Truck
Large
Bus
Medium
Bus
Micro
Bus Utility Car
Auto
Ricks-
haw
Motor
Cycle
Total
N-3 385 6,176 6,331 8,059 6,455 6,906 1,790 10,436 6,492 3,451 56,481
N-105 130 2,045 375 58 60 398 121 294 2,777 289 6,547
R-301 102 759 698 586 284 788 109 989 1,267 495 6,077
R-311 99 145 84 445 308 26 305 961 452 933
R-302 260 218 356 215 119 146 765 320 2,399
R-114 99 80 56 80 4 66 1,920 142 2,447
R-211 231 69 82 339 80 7 85 673 218 1,784
R-310 2 492 666 710 852 1014 369 948 1,419 827 7,299
R203 11 10 0 12 6 10 666 86 800

Environmental Impacts
7-64
Point Sources96%
Area Sources2%
Line Sources2%
PM2.5 PM10
Point Sources23%
Area Sources44%
Line Sources33%
Point Sources22%
Area Sources54%
Line Sources24%
Figure 7-20: Relative Emission Contributions (All Point, Line and Area Sources)
Point Sources66%
Area Sources5%
Line Sources29%

Environmental Impacts
7-65
NO2 CO
PM2.5 PM10
Figure 7-21: Relative Emission Contributions (Major Point Sources)
1) Note: Difference between PM2.5 and PM10 contributions is due to the fact that for natural gas boilers same
emission factor is used for PM2.5 and PM10 (As per USEPA Guidelines38). This is deemed appropriate since most
of particulates emitted in natural gas boiler combustion are less than or equal to 1 µm in diameter. For gas
turbine combustion, different emission factors are used for PM2.5 and PM10.
2) GPS – Ghorashal Power Station, TPS – Tongi Power Station.
38 USEPA AP 42, Fifth Edition, Volume I: Chapter 1: External Combustion Sources – Natural Gas Combustion,
1998.
GPS47%
Ghorashal Fertilizer 2%
TPS5%
Max Power1%
Aggreko38%
Regent Energy & Power
2%
Palash Urea Fertilizer 1%
Proposed CCGT4%
GPS58%
Ghorashal Fertilizer 4%
TPS8%
Max Power3%
Aggreko9%
Regent Energy & Power
5%
Palash Urea Fertilizer 1%
Proposed CCGT12%
GPS97%
All Other Sources3%
GPS74%
Ghorashal Fertilizer
1%
TPS2%
Max Power3%
Aggreko5%
Regent Energy & Power
4%
Palash Urea Fertilizer
1%Proposed
CCGT10%

Environmental Impacts
7-66
c) Cumulative NO2 Concentration
535. For NO2 cumulative impact assessment, the maximum ground level concentrations
were modeled for 1-hour and annual averaging period to compare with national standards,
WHO guidelines and other internationally recognized standards.
536. Preliminary modeling results indicated high maximum ground level concentrations of
NO2 close to the project site, especially close to the Aggreko power plant complex. The
Aggreko plant has 120 stacks each only 3 m in height. Therefore, a refined grid analysis was
conducted for NO2 emissions. A fine grid was considered in an area of 4km x 4km close to
GPS was modeled with receptors at every 150 m apart and a further fine grid of 500m x
500m area with receptors at every 50 m apart was modeled around the Aggreko power
plant.
537. Table 7-30 shows important NO2 compliance standards and Table 7-31 shows the
Tier-2 (ARM) predicted results, where 1-hr predicted concentrations are adjusted by the
regional NO2/NOx equilibrium ratio. The predicted annual average concentration exceeds the
WHO Guideline but meets the Bangladesh National Standard. The maximum predicted 1-hr
average concentration exceeds the WHO Guideline and the corresponding EPA standard by
a significant amount.
538. As noted previously, the USEPA method models the 1-hour NO2 value based on the
98th percentile of the maximum daily 1-hour values, which is represented by the eighth-
highest of the maximum daily 1-hour values across the year (averaged over 3 years). In the
EU method, the 99.8 percentile of the max NO2 value is taken. The annual average is the
same for both methods, it is simply the arithmetic mean averaged over a 3 year period.
Table 7-31: NO2 Compliance Standards
Table 7-32: Tier-2 Predicted maximum ground level concentration of NO2 (Baseline &
Repowering)
Pollutant Averaging
Time
Concentration (µg/m³)
ECR 1997 (as
amended in
2005)
WHO
Guidelines
EU
Guidelines
USEPA
Standards
(NAQQS)
NO₂ 1-hr N/A 200 200 188
Annual 100 40 40 100
Scenario Averaging
Time
Concentration (µg/m³) Coordinates of Max Point
(UTM)
Max Value
(USEPA Method)
Max Value (EU
Method) East (m) North (m)
Cumulative 1-hr 453.88 337.35 260015.5 2654310
Annual 65.80 65.80 260015.5 2654260

Environmental Impacts
7-67
539. Table 7-32 shows the NO2 contribution from all major sources in the air-shed for the
maximum predicted 1-hr and annual averaging concentrations. The Aggreko quick rental
plants contribute a significant portion of the 1-hr and annual average NO2 concentration
(76% and 86%, respectively) even though their emission contribution is only 8.6%
Contribution from the Ghorashal Power Station is only 17% and 9.8% for 1-hr and annual
averaging periods, respectively. The Aggreko quick rental plants contribute such a high
percentage to the NO2 concentration due to their stacks being only 3 m in height and not
high enough to adequately disperse the emissions. The new proposed CCGT power plant is
expected to contribute 2.2% and 1% to the maximum 1-hr and annual NO2 concentration.
Table 7-33: NO2 Source Contribution
540. Figure 7-21 shows the location of maximum 1-hr averaging and annual concentration
points. Both high points are located close to the Aggreko Quick Rental Plant. The highest
1-hr concentration occurs about 62 m North of Aggreko’s complex and the maximum annual
concentration is about 13 m to the North.
S.I Source
% of Total
Emissi-ons
1-hr Averaging
Annual Averaging
NO2 Concentrat
ion (µg/m³)
% of NO2
Contribution
NO2 Concentr
ation (µg/m³)
% of NO2
Contribution
1 Ghorashal Power Station 55.8 58.27 17.27 6.45 9.80
2 Ghorashal Quick Rental Max Power (78 MW) 3.4 1.27 0.38 0.11 0.17
3 Ghorashal Regent Energy & Power 4.4 6.11 1.81 1.35 2.05
4 Tongi Power Station 8.0 0.12 0.03 0.014 0.02
5 Ghorashal Fertilizer Factory PP 1, 2 & 3 3.4 3.75 1.11 0.31 0.47
6 Palash Urea Fertilizer Factory PP 1 & 2 1.4 1.95 0.58 0.16 0.24
7 Ghorashal Quick Rental Aggreko (145 MW) 8.6 257.07 76.20 56.65 86.09
8 New Proposed Power Plant (C.C.G.T) 11.4 7.52 2.23 0.64 0.97
9 Brick Fields (All) 1.9 0.44 0.13 0.042 0.06
10 Roads (All) 1.7 0.86 0.25 0.076 0.12
Total 100.0 337.35 100.0 65.80 100.0

Environmental Impacts
7-68
Figure 7-22: Project Area maximum predicted concentration points
541. The maximum NO2 concentration values for some sensitive receptor sites close to
the power plant are given in Table 7-33. NO2 concentration values at all sensitive receptors
are within the applicable standards.
Table 7-34: Cumulative Impact NO2 concentration – Sensitive Receptors
S.I Name of Receptor
Concentration (µg/m³)
(1-hr Averaging) (Annual
Averaging)
1 Residential (Ghorashal PP) 157.90 11.17
2 School (Ghorashal PP) 148.02 11.07
3 School 147.66 11.49
4 School 79.26 5.90
5 School 69.83 4.24
6 School 130.58 9.18
7 School 86.83 6.87
8 Hospital (Palash) 149.20 11.41
9 High School 97.36 7.76
10 Thana Health Complex (Palash) 73.26 5.70
11 Madrasa (Garapara) 94.94 7.20
12 School (Dhaladia) 39.33 2.21
13 Madrasa (Dakshin Palash) 30.66 1.73
14 School 32.82 1.85

Environmental Impacts
7-69
542. Figure 7-22 shows the cumulative impact of 1-hr and annual average NO2
concentration contour diagrams. The contours show that the maximum concentration area
is close to the project site. There is also a high concentration area around the N-3 Highway
(Tongi Station Road to Board Bazar).
15 Hospital 28.58 1.59
16 Girls' School (Ghorashal Palash) 28.04 1.54
17 Dakhil Madrasa (Paiksha) 27.97 1.52
18 RFL Public school (RFL, Palash) 16.20 1.14
19 School (10 No. Ghorashal) 19.28 1.24
20 College (Kaliganj) 35.95 3.73
21 School 25.78 4.46
22 Primary School 27.21 1.61
23 Kindergarten School 37.08 2.49
24 Madrasa (Sahida Mohila) 69.53 4.80
25 School 74.59 5.00
26 Madrasa 76.30 4.90
27 School 27.50 2.09
28 Madrasa 30.26 2.15

Environmental Impacts
7-70
1-hr Average
Annual Average
Figure 7-23: NO2 concentration-cumulative impacts

Environmental Impacts
7-71
d) Cumulative PM2.5 concentration
543. The maximum 24-hr and annual average concentration of PM2.5 for the cumulative
case are given in Table 7-34. Both the 24-hr and annual average values are above the
Bangladesh national standards and WHO Guidelines. Table 7-35 shows that most of the
PM2.5 at this point is the result of the N-3 highway and all other sources contribute a
negligible amount.
Table 7-35: PM2.5 concentration (Cumulative)
Table 7-36: Source Contribution
544. Table 7-36 shows the maximum predicted ground level concentration of PM2.5 at the
sensitive receptor sites close to the power plant for the cumulative impact case. The PM2.5
concentration is very low at the sensitive receptor sites. This is the case since natural gas
combustion releases a very small amount of particulate emissions. Receptor sites (#20 and
#21) which are further away from the project site and closer to major highways show higher
levels of PM2.5 concentrations.
Table 7-37: Cumulative Impact of PM2.5 at Sensitive Receptors
S.I Name of Receptor
Concentration (µg/m³)
(24-hr Averaging) (Annual
Averaging)
1 Residential (Ghorashal PP) 3.54 0.65
2 School (Ghorashal PP) 3.78 0.65
3 School 3.06 0.67
4 School 1.94 0.53
5 School 2.00 0.36
6 School 3.93 0.54
Pollutant
Concentration (µg/m³) Coordinates of Max
Point (UTM)
Averaging Time
Bangladesh National
Standards
World Bank Guidelines
Max Value
East (m)
North (m)
Cumulative 24-hr 65 25 67.6 238647 2677148
Annual 15 10 16.7 238647 2677148
S.I Source % of Total Emissions
1-hr Averaging
Annual Averaging
PM2.5 Concentration
(µg/m³)
% of PM2.5 Contribution
PM2.5 Concentration
(µg/m³)
% of PM2.5 Contribution
1 N-3 Highway 21.9 66.28 98.0 16.53 99.0
2 All Other Sources 78.1 1.32 2.0 0.17 1.0
Total 100.0 67.6 100.0 16.7 100.0

Environmental Impacts
7-72
S.I Name of Receptor
Concentration (µg/m³)
(24-hr Averaging) (Annual
Averaging)
7 School 3.53 0.46
8 Hospital (Palash) 3.75 0.68
9 High School 3.29 0.51
10 Thana Health Complex (Palash) 2.85 0.43
11 Madrasa (Garapara) 2.48 0.44
12 School (Dhaladia) 1.81 0.28
13 Madrasa (Dakshin Palash) 1.47 0.28
14 School 1.44 0.28
15 Hospital 2.02 0.29
16 Girls' school (Ghorashal Palash) 1.80 0.28
17 Dakhil Madrasa (Paiksha) 1.84 0.27
18 RFL Public school (RFL, Palash) 1.69 0.29
19 School (10 No. Ghorashal) 1.74 0.24
20 College (Kaliganj) 15.64 4.48
21 School 15.52 6.82
22 Primary School 1.87 0.35
23 Kindergarten School 1.94 0.36
24 Madrasa (Sahida Mohila) 2.11 0.55
25 School 2.08 0.57
26 Madrasa 2.23 0.58
27 School 3.38 0.71
28 Madrasa 3.48 0.75
545. Figure 7-23 shows the 24-hr and annual average PM2.5 concentration contour
diagrams for the cumulative case. As can be seen from the contours the maximum
predicted ground level PM2.5 concentrations in the air shed are found close to the N-3
highway, which is quite far away from the project site (approximately 28 km). PM2.5
concentrations in and around the project site are fairly low and well within the standards.

Environmental Impacts
7-73
24-Hr Average
Annual Average
Figure 7-24: PM2.5 concentration-cumulative impacts
e) Cumulative PM10 concentration
546. The maximum predicted 24-hr and annual average concentration of PM10 for the
cumulative case are given in Table 7-37. Both the 24-hr and annual average values are
above the WHO guidelines but meet the Bangladesh national standards. Table 7-38 shows
that most of the PM10 at this point is the result of the N-3 highway and all other sources
contribute a negligible amount.

Environmental Impacts
7-74
Table 7-38: PM10 concentration (Cumulative)
Table 7-39: Source Contribution
547. Table 7-39 shows the maximum predicted ground level concentration values for the
sensitive receptor sites close to the power plant for the cumulative impact case. The PM10
concentration is very low at the sensitive receptor sites. This is the case since natural gas
combustion releases a very small amount of particulate emissions. Receptor sites (#20 and
#21) which are further away from the project site and closer to major highways show higher
levels of PM10 concentrations.
Table 7-40: Cumulative Impact of PM10 at Sensitive Receptors
Pollutant
Concentration (µg/m³) Coordinates of Max
Point (UTM)
Averaging Time
Bangladesh National
Standards
WHO Guidelines
Max Value
East (m)
North (m)
Cumulative 24-hr 150 50 94.88 238647 2677148
Annual 50 20 22.1 238647 2677148
S.I Source % of Total Emissions
1-hr Averaging
Annual Averaging
PM10
Concentration (µg/m³)
% of PM10 Contribution
PM10 Concentration
(µg/m³)
% of PM10 Contribution
1 N-3 Highway 15.9 91.65 96.6 21.78 98.6
2 All Other Sources 84.1 3.23 3.4 0.32 1.4
Total 100.0 94.88 100.0 22.1 100.0
S.I Name of Receptor
Concentration (µg/m³)
(24-hr Averaging) (Annual
Averaging)
1 Residential (Ghorashal PP) 3.79 0.75
2 School (Ghorashal PP) 3.96 0.74
3 School 3.87 0.78
4 School 3.15 0.77
5 School 2.92 0.50
6 School 4.30 0.63
7 School 5.41 0.56
8 Hospital (Palash) 4.04 0.70
9 High School 3.21 0.58
10 Thana Health Complex (Palash) 3.17 0.52
11 Madrasa (Garapara) 4.40 0.60
12 School (Dhaladia) 3.82 0.42
13 Madrasa (Dakshin Palash) 2.82 0.42
14 School 2.99 0.43
15 Hospital 5.31 0.45

Environmental Impacts
7-75
548. Figure 7-24 shows the 24-hr and annual averaging concentration of PM10 contour
diagrams for the cumulative case. As can be seen from the contours the maximum
predicted ground level PM10 concentrations in the air shed are found close to the N-3
highway (as was the case with PM2.5), which is quite far away from the project site
(approximately 28 km). PM10 concentrations in and around the project site are fairly low and
well within the standards.
16 Girls' school (Ghorashal Palash) 4.51 0.43
17 Dakhil Madrasa (Paiksha) 4.50 0.42
18 RFL Public school (RFL, Palash) 3.18 0.45
19 School (10 No. Ghorashal) 3.53 0.38
20 College (Kaliganj) 25.58 6.41
21 School 24.79 9.97
22 Primary School 3.81 0.55
23 Kindergarten School 4.28 0.55
24 Madrasa (Sahida Mohila) 5.17 0.77
25 School 4.87 0.79
26 Madrasa 5.31 0.83
27 School 7.53 1.32
28 Madrasa 7.98 1.41

Environmental Impacts
7-76
24-Hr Average
Annual Average
Figure 7-25: PM10 concentration-cumulative impacts

Environmental Impacts
7-77
f) Cumulative CO Impact
549. The cumulative case maximum 1-hr and 8-hr averaging concentration of CO are
given in Table 7-40. The maximum values were found to be well within the standards, thus
were not assessed further.
Table 7-41: CO concentration (Cumulative)
g) Air shed Assessment
550. The cumulative impact assessment showed that predicted maximum ground level
concentrations of NO2, PM2.5 and PM10 exceed the Bangladesh standards and WHO
guidelines in selected locations only. The high predicted NO2 concentrations are predicted at
receptors very close to Aggreko and the execeedances are due primarily to the stacks of
insufficient height to adequately disperse emissions. On the other hand, the high PM2.5 and
PM10 concentrations are predicted at receptors close to the N-3 highway, and primarily
caused by heavily congested traffic far from the project site (28 km away)-. The cumulative
impact of particulates (both PM10 and PM2.5) show a lower concentration compared to the
baseline and repowering scenario, since, background concentration of these pollutants were
included in the baseline and repowering which was very high in Bangladesh (may include
the transboundary pollution).
551. As per WBG guidelines an airshed should be considered as having poor air quality if
nationally legislated air quality standards or WHO Air Quality Guidelines are exceeded
significantly. Therefore, it can be concluded that the airshed is polluted/degraded based on
the cumulative assessment results.
552. For degraded airshed the WBG Health, Safety, and Emission Guidelines, 2008 states
the following:
The project should explore and implement site-specific offsets that result in no net increase in the total emissions of those pollutants (e.g., particulate matter, nitrogen dioxide) that are responsible for the degradation of the airshed.
Suitable offset measures could include reductions in emissions of particulate matter, nitrogen dioxide, as necessary through (a) the installation of new or more effective controls at other units within the same power plant or at other power plants in airshed.
Wherever possible, the offset provisions should be implemented within the framework of an overall air quality management strategy designed to ensure that air quality in the airshed is brought into compliance with ambient standards.
553. For the rehabilitation of existing plants, WBG Guidelines state that:
For projects to rehabilitate existing facilities, case-by-case emission requirements should be established by the EA considering (i) the existing emission levels and
Pollutant
Concentration (µg/m³) Coordinates of Max
Point (UTM)
Averaging Time
Bangladesh National
Standards
World Bank
Guidelines
Max Value
East (m)
North (m)
Cumulative 1-hr 40,000 N/A 2,910 238647 2677148
8-hr 10,000 N/A 1,163 238647 2677148

Environmental Impacts
7-78
impacts on the environment and community health, and (ii) cost and technical feasibility of bringing the existing emission levels to meet these new facilities limits.
554. With the implementation of this project the above criteria are being met, in fact there
is a significant reduction in emissions from the baseline to repowering case for the
Ghorashal power station. After repowering, NOx, PM2.5 and PM10 emissions from GPS
decrease by 810 tons/yr (13%), 113 tons/yr (41%) and 62 tons/yr (23%), respectively. BPDB
(GPS) have taken the initiative for repowering of Unit 3. They will also repower Units 5 and 6
and will decommission of Units 1 and 2 gradually. The Quick rental Aggreko (145 MW) plant
will be retired in 2018 according to the present contract. These initiatives, when
implemented, will further reduce the cumulative emission.
555. Therefore, with the implementation of this project the air quality in the airshed will be
brought closer to compliance with national ambient air quality standards and WHO
Guidelines.
7.9.2 Noise
556. In the cumulative scenario, 4 existing units, 2 re-powering units, 2 existing RMS
units, 1 proposed RMS unit, Max and Aggreko rental power plants were considered as the
major sources of noise. Noise levels from 4 existing units, 2 re-powering units and Max
power plant were assigned 90 dBA each. As there is no technical specification available for
the Aggreko power plant units, the level of noise generated from this power plant was
estimated conducting a back calculation from the model output and measured noise level. It
was estimated that Aggreko generates 110 dBA noise level. The result of the modelling in
this scenario is represented in Figure 7-25.
557. The analysis of the noise propagation modeling in cumulative scenario is
summarized in Table 7-41 which shows the resultant noise level in different sensitive
receptors. The locations, where noise level exceeds both day and night time standard
according to ECR 1997 and WHO Guideline values, are marked in red in Table 7-41. In
places, where only the night time standard is exceeded, noise level is marked in orange
color.
Table 7-42: Noise level in different sensitive receptors in Cumulative Scenario
Place Notation Type Noise Level (dBA)
[Cumulative]
Administrative building SR-1 Industrial 51
Mosque/Accounts Office SR-2 Industrial 51
Near RMS SR-3 Industrial 68
Near Fertilizer Factory SR-4 Industrial 51
Unit-4 boundary SR-9 Industrial 59.5
Inside Aggreko-Max SR-10 Industrial 102
Aggreko Gate SR-11 Industrial 51
Outside the plant/Commercial SR-12
Industrial/
Commercial 35
Corner of Substation SR-14 Industrial 42.5
Bazaar SR-19
Industrial/
Commercial 18
Residence in fertilizer factory
(West side) SR-5
Residential
25.5

Environmental Impacts
7-79
Place Notation Type Noise Level (dBA)
[Cumulative]
Resident Fertilizer Factory
(Outside Boundary) SR-6
Residential
51
Residence Mosque Fertilizer
Factory SR-7
Residential
25.5
Residence FF Near Aggreko SR-8 Residential 59.5
Army Residence SR-13 Residential 42.5
Residential Area SR-15 Residential 34
School-Hospital SR-16 Residential 34
Central Residential Mosque SR-17 Residential 34
Ghorashal Residence SR-18 Residential 18
Figure 7-26: Simulation of Noise Propagation during Plant Operation in Cumulative
Scenario
7.9.3 Impact on the flow of Water Bodies
a) Option development
558. For assessment of water availability of Shitalakhya River, the models (hydrological
and hydrodynamic) has been simulated for four scenarios; baseline condition, future without
project, future with project and other developments including the consideration of upstream
flow reduction and climate change impacts. The detail description of various scenario is
presented in Table 7-42.
Table 7-43: Detail description of option development
Scenario Condition Implication
Base
condition
Average (1 in 2.33
year return period) of
Model has been derived for the existing
situation considering historical hydrological and

Environmental Impacts
7-80
Scenario Condition Implication
last 31 years (1981 –
2012)
meteorological data (water level, GW level and
rainfall and air temperature) for the year 1981
through 2012.
Present water demand (agriculture, domestic,
industrial etc.) has been assessed and
integrated in the model.
Option 01
(Without
project
scenario)
Future without project
scenario considering
Climate change
Model has been simulated for the next 30 years
(2015-2045) considering without project with
climate change condition.
The change in upstream flow due to climate
change has been considered during model
setup.
Future domestic, industrial and agricultural
water demand has been assessed and
incorporated in the model.
Option 02
(With project)
Future with project
considering Climate
change and future
water demand
Model has been simulated for the next 30 years
(2015-2045) considering future climate change
condition.
Water abstraction (40.3 m3/s) for the power
plant has been included into the model.
The change in upstream flow due to climate
change has been considered during model
setup.
Future domestic, industrial and agricultural
water demand has also been incorporated in
the model.
Option 03
(With project)
Future with project
considering Climate
change, reduction of
upstream flow and
future water demand
Model has been simulated for the next 30 years
(2015-2045) considering future climate change
condition.
Water abstraction (40.3 m3/s) for the power
plant has been included into the model.
The upstream flow is considered to be reduced
by 25 % in future according to the rate of the
Old Brahmaputra River.
Future domestic, industrial and agricultural
water demand has also been incorporated in
the model.
b) Climate change impact on Ganges, Brahmaputra and Meghna basins

Environmental Impacts
7-81
559. CEGIS has carried out water availability assessment for the Ganges, Brahmaputra
and Meghna basins under different climate change scenarios (A1B, A2 and B1). The study
was financed under the Abu Dhabi Dialogue Knowledge Forum Small Grants Program
(ADDKF-SGP) of the World Bank and coordinated by the International Centre for Integrated
Mountain Development (ICIMOD), Nepal. Based on this study it was found that about 8% of
monsoon flow and about 17% dry season flow of the Brahmaputra River will increase by
2050. Change of monthly flow of Brahmaputra River is given in Table 7-43.
Table 7-44: Changes of monthly flow of Brahmaputra River in percentage
Month Jan Feb Mar Apr
Ma
y Jun Jul Aug Sep Oct Nov Dec Annual
Percentag
e change
of monthly
flow
11.1 16.3 24.3 1.6 0.6 -2.6 7.8 14.2 12.8 16.9 17.2 17.8 9
560. From the historical data analysis, it has been found that the annual flow of the
Brahmaputra River is increasing due to climate change but flow of the Old Brahmaputra
River is decreasing which is mainly due to the change in off-take morphology of the Old
Brahmaputra River. It has been estimated that around 268 Mm3 flow reduced per year in the
Old Brahmaputra River (Figure 7-26).
y = -268x + 550,659
0
5000
10000
15000
20000
25000
1975 1980 1985 1990 1995 2000 2005
An
nu
al
flo
w (
Mm
3)
Year
Annual flow of the Old Brahmaputra River at Mymensingh
Figure 7-27: Historical annual flow of the Old Brahmaputra River at Mymensingh
561. For assessment of water availability of Shitalakhya River, the models (hydrological
and hydrodynamic) has been simulated for four scenarios; base condition, future without
project considering climate change, future with project considering climate change and future
water demand, and future with project considering climate change, future water demand,
and reduction of upstream flow.
c) Climate Change Impact on Water balance
562. The precipitation and temperature are assumed to be changed in future under
different climate change scenarios. To understand the climate change impact for the next 30
years (2015 - 2045), the model was run for RCP 4.5 scenario and the results are shown in
Table 7-44.

Environmental Impacts
7-82
Table 7-45: Climate change impact on water availability in the catchment area
Sl.
No.
Hydrological
parameters
Base condition
(mm)
Climate change
condition (mm)
Difference
(mm)
Percentage of
change
1 Precipitation 2055 2255 (+) 200 (+)10
2 Evapotranspiration 776 795 (+)19 (+) 2.4
3 Percolation 575 593 (+)18 (+) 3
4 Surface Runoff 874 1006 (+)132 (+)15
5 Base flow 83 40 (-) 43 (-) 52
(+) indicates increasing and (-) is for decreasing
563. The climate change impact on annual water balance for the study area is given in
Table 7-44 for climate change scenario RCP 4.5 in 2050s.The annual average rainfall for the
study area will be 2255 mm which is about 10% more than the base condition. The surface
runoff also increases (15%) as there is an increase in annual rainfall. There is a little
increase in annual evapotranspiration (19 mm) which is mainly due to the increase of
temperature. There is also a bit increase in annual percolation due to climate change.
However, base flow will be decreased by 52% as ground water extraction rate will be
increased in future.
d) Water yield
564. The generated water yields were estimated and compared with base condition to
assess the impact of climate change on water availability. Water yield is the net amount of
water that contributes to stream (water yield = surface runoff +lateral flow + base flow- total
loss- abstraction). The monthly water yield for the base and climate change condition is
given in Figure 7-27.
565. The availability of water will increase during February to June as there is an increase
in rainfall during that period. During the dry period (November-January), the water availability
will decrease due to climate change by 2050s.
Figure 7-28: Climate change impact on monthly water yield for climate scenario RCP
4.5 by 2050s

Environmental Impacts
7-83
566. Variations of seasonal water yield due to climate change scenario RCP 4.5 by 2050s
are shown in Table 7-45. The table shows increase in seasonal water yield during dry
season and pre-monsoon as 36% and 22%, respectively. Water yields during pre-monsoon
and monsoon are almost similar to the base condition.
Table 7-46: Climate Change impact on seasonal water yield by 2050s for scenario RCP
4.5
Season Water Yield during base (mm) Change in water yield due to CC (%)
Pre-monsoon (Apr-May) 149 22
Monsoon (Jun-Sep) 651 4
Post-monsoon (Oct-Nov) 135 9
Dry (Dec-Mar) 52 36
567. Water level: Frequency analysis has been done using Gumbel Distribution method
(Gumbel, 1958)39 with respect to maximum and minimum water level shown in Table 7-46.
The key observation is that this river is tidally influenced under the low flow regimes such
that reverse flow (down stream flow) will tend to maintain constant water level despite of
surface water (40.3 m3/s) withdrawal from river for the cooling purpose of GPS. As a result,
hydrological analyses for different options indicate that the changes of average minimum
water level are insignificant.
Table 7-47: Statistical analysis on maximum and minimum water level for different
return period
Return
Period
(year)
Maximum Water Level (mPWD) Minimum Water Level (mPWD)
Base
condition
Option 1 (Without
project
scenario)
Option
2 (with
project
consideri
ng
Climate
change
and
future
water
demand)
Option
3 (with
project
consideri
ng
Climate
change,
reduction
of
upstream
flow and
future
water
demand)
Base
condition
Option
1 Option 2
Option
3
2.33 6.62 6.79 6.77 6.29 0.94 0.99 0.92 0.91
5 7.19 7.40 7.40 6.84 0.85 0.90 0.84 0.81
10 7.66 7.89 7.90 7.29 0.78 0.83 0.77 0.74
20 8.12 8.37 8.39 7.72 0.71 0.77 0.70 0.66
39 Gumbel EJ (1958) Statistics of Extremes, Columbia University Press, New York, USA

Environmental Impacts
7-84
30 8.38 8.64 8.67 7.97 0.67 0.73 0.66 0.62
50 8.70 8.98 9.02 8.28 0.61 0.68 0.61 0.57
100 9.14 9.44 9.49 8.69 0.55 0.62 0.54 0.50
e) Monthly average discharge for different scenarios
568. The average monthly discharge of Shitalakhya River at project site varies from about
84 m3/s to 1181 m3/s for the base condition. The highest discharge occurs during the month
of July and the lowest in January. The average monthly flow of Shitalakhya River at the
project site for different condition is given in Table 7-47.
Table 7-48: Average Monthly flow at project area on Shitalakhya River
Month
Base Condition
(Flow, m3/s)
Option 1 (Without project
scenario)
(Flow, m3/s)
Option 2 (with project
considering Climate
change and future
water demand)
(Flow, m3/s)
Option 3 (with project
considering
Climate change,
reduction of
upstream flow and
future water
demand)
(Flow, m3/s)
January 83.39 100.13 98.96 96.8
February 83.71 100.46 98.95 96.7
March 90.01 107.18 104.27 102.2
April 111.76 125.74 124.98 121.2
May 202.60 211.64 211.75 181.3
June 563.69 555.85 556.03 435.9
July 1181.43 1275.22 1275.12 891.5
August 1177.86 1339.54 1339.38 889.4
September 1066.69 1205.27 1205.42 808.8
October 692.91 807.62 807.45 527.4
November 170.98 192.57 192.26 157.1
December 109.09 125.73 125.19 116.9
569. As the dry season flow of the Brahmaputra River is expected to change due to
climate change, the dry season flow to the Shitalakhya River may also change, depending
on the off-take morphology. The difference of dry season flow between Option 1, Option 2
and Option 3 is insignificant because after withdrawing 40.3 m3/s of river water for the power
plant, reverse flow will mount up from downstream and maintain the constant water level of
the Shitalakhya River. Furthermore, flooding would be increased immediately which may
increase the flood flow in the Shitalakhya River for Option 1 and Option 2. However, flood
flow will be reduced in Option-3 because Shitalakhya River receives 25% less water from old
Brahmaputra River.
f) Assessment of Environmental flow (E-flow)
570. The increasing demand for river water conflicts with the environmental needs for
sustaining flows during drought and low flow periods, leads to competition between water
demand and river flow needs. Tennant (or Montana) method (1976) is the most common

Environmental Impacts
7-85
hydrological method to assess the environmental flow requirements as percentage of mean
annual flow. According to Bari and Marchand (2006)40, the monsoon flow requirement with
respect to environmental flow for flushing is 200% of the mean annual flow, while dry season
requires 20% of mean annual flow for the good condition of aquatic habitat.
571. E-flow requires for flushing is about 922 m3/s for the base condition, while about
1,181 m3/s (21.9 % more) flow is available shown in Table 7-48. Similarly, during monsoon
E-flow will also adequate for Option 1, Option 2 and Option 3.
572. During dry season, E-flow for base condition is 92.2 m3/s whereas 83.4 m3/s is
available which is partially sufficient for the good condition of aquatic habitat. However, due
to climate change impact in 2050s, dry season flow of Shitalakhya River will be increased for
Option 1 and Option 2. Consequently, environmental flow will be increased in that period.
Dry season flow for those scenarios (Option 1 and Option 2) is fairly available to meet the E-
flow in future.
573. Besides, Option 3 is considered as worse scenario whereas, E-flow is also sufficient
(31% more flow is available) during dry period.
Table 7-49: Environmental flow requirement of Shitalakhya River
Seasons
Base condition Option 1 Option 2 Option 3
E-
flow
(m3/s)
Available
flow
(m3/s)
E-
flow
(m3/s)
Available
flow
(m3/s)
E-
flow
(m3/s)
Available
flow
(m3/s)
E-
flow
(m3/s)
Available
flow
(m3/s)
Dry
season
(20%)
92.2 83.4 102.4 100.1 102.3 98.9 73.8 96.7
Monsoon
(200%) 922.4 1181.4 1024.5 1339.5 1023.3 1339.4 737.6 889.4
574. The environmental flow for the Shitalakhya River during dry season is expected not
to be a major concern as there is a tidal influence during that period. Even, if water is
diverting from this river, downstream flow (tide) will even out the withdrawal and maintain a
constant water level. Besides, the major part of the diverted amount will return to the river as
return flow after the condenser cooling process.
The observations on above analyses as follows:
Flow of Shitalakhya River is expected to be increased in near future due to climate
change and adequate flow will be available at the project site.
Current abstraction of surface water at the rate of 40.3 m3/s for condenser cooling
and other operational purposes will have no or slight impact on availability of water in
Shitalakhya River for the next 30 years.
Monsoon flow will be increased in 2050s which may intensify the flood level in and
around the study area.
40 Bari, M F and Marchand, M. 2006. Introducing Environmental Flow Assessment in Bangladesh:
Multidisciplinary Collaborative Research. BUET-TUDelft.

Environmental Impacts
7-86
Dry season flow and water level will also increase in future which will further facilitate
the navigation.
In options 2 and 3, without considering climate change, both dry and wet season
flows will roughly be reduced by 10%. The E-flows in option 2 would be 920.7 m3/s
(available flow 1,205 m3/s) and in option 3 would be 664 m3/s (available flow 800
m3/s). So even without climate change, the flow would be sufficient during monsoon
season and dry period (considering tidal impact).

8-1
8. Mitigation Measures
8.1 Preamble
575. The proposed repowering of Unit 4 is environmentally friendly refurbishments of old
technology as described in Chapter 4. Since, the Unit is part of an existing operating power
plant, which contain other old units, it requires particular attention to harmonize with the
existing and other proposed operations in the facility. Specific design changes proposed in
this project are presented in the following sections.
8.2 Change in the project layout
576. It is proposed to include the following items in the project layout developed by the
engineering consultant:
An on-site secured hazardous waste (asbestos) disposal facility near the existing Jetty,
Gas insulated sub-station (GIS) near the pond and Jetty,
A storm water drainage system around the new plant and the hazardous waste disposal facility and link it with the existing drainage network of the plant, and
A temporary storage area for scrap materials of boiler-4 by demolishing the existing old structure in the north east side of Unit 4.
Central water/effluent treatment plant.
8.3 Engineering design
577. Enhancement of condenser cooling system: The existing open cycle cooling system
supported by cooling tower has been proposed to a full closed cycle cooling system with
new cooling towers.
578. It is learnt from the operation staffs during site visit that the existing cooling tower is
inadequate, only to provide support to the existing open cycle cooling system by cooling a
small portion of hot water and adding the same to cold water channel during dry season
(when Shitalakhya River flow is minimal) and occasionally during cooling water pump
maintenance. The condition of existing cooling towers is poor and requirement major
refurbishments. Most of its blower fans including the induced draft fan are not working mainly
due to the defective motors and other mechanical problems. With all these equipment
defects the present cooling system is unable to reduce impacts of the thermal plume
generated from Unit 4. Although the availability of Shitalakhya water for next 25 years is
confirmed, the adverse impacts of the thermal plume will be a continuous threat to the river
and its eco-system. Considering this factor it is proposed to replace the present open cycle
cooling system to close cycle cooling system constituting refurbishment of existing cooling
towers and addition of new cooling towers to meet the capacity of the repowering of Unit 4
and other Units’ requirements. This will drastically reduce the present cooling water demand
of 7.64 m3/s to 0.38 m3/s and bring the Unit under compliance with WBG Guidelines on
thermal plume discharge.
579. Central Water/Effluent Treatment Plant: The existing water treatment plant at GPS is
an old plant with low capacity. It has no effluent treatment and sludge treatment systems. It
uses Hydrazine as oxygen scavenger in the boiler feed water system, resin based
demineralization and aluminum sulfate for raw water treatment.

Environmental Management Plan
8-2
580. It is proposed that the repowering of Unit 4 include a central water treatment plant
containing effluent treatment plant, a sludge treatment plant, and a reverse osmosis plant for
de-mineralized water with two cells in service and one in standby. The plant will use more
environment friendly chemicals, such as, Sodium Erythorbate or Helamin as alternatives to
hydrazine to treat feed water and reverse osmosis technology to replace resin based
demineralization.
8.4 Mitigation measures for major impacts
581. The following sections present the mitigation measures for the major impacts
identified in Chapter 7 of the EIA report. Minor and some moderate impacts will be managed
and mitigated using environmental code of practices (presented in Annex 9.1) and
Contractors’ good practice.
8.4.1 Decommissioning Phase
B. Ambient Air
B1. Airborne asbestos fiber
582. Mitigation Measures: The decommisioning area must be protected by temporary
peripherial G.I sheet fence of 3 m height both for existing boiler and asbestos disposal site
for regulating trespassing of unauthorized people. The decommsioning workers shall use
appropriate personal protective equipments (PPEs) during decommisioning of existing boiler.
They should be prevented from consuming food and smoking inside the protected boundary.
They must follow the OHSAS 18000/18001 guidelines. The worker must always adhere to
the guidelines of the decommisioning plan. Water sprinkling should be done before
comencing the work. Under this study a separate supplementary report captioned Vol. 3:
Boiler Decommisioning Plan has been prepared in which asbestos risk and associated
mitigation measures are presented to combat untoward situation, which may arise during
boiler decommisioning as well as handling of asbestos and ACM. This Plan could be treated
as a guideline for the EPC Contractor/Proponent for avoiding/reducing the magnitude of
accidental events.
D. Water Bodies
D2. Water quality
583. Mitigation Measures: Waste containing more than 0.1 percent asbestos is classed
as hazardous/special waste.41 Therefore, the project will deal with this waste as hazardous
waste. Proper drainage system must be developed at the decommisioning premises before
starting the decommision activities. Waste water from the decommisioning site will be
collected at a sump for temporary storage and treated in effluent treatment plant (ETP)
before final disposal to the proposed on-site asbestos facility.
584. Chemical substances and scrap will be kept on a specified covered areas so that
contaminants from thse substances are not come into the natural environment. The
Contractor will train workers on handling abnormal or emergency sitution like oil spill,
asbestous release, chemical spill etc., as detailed in Vol 5: Emergency Response Plan.
41 Asbestos Essentials Task Manual (2001); www.hse.gov.uk/asbestos/essentials/index.htm

Environmental Management Plan
8-3
E. Soil
E1. Soil quality
585. Mitigation Measures: Asbestos containing effluent water could degrade soil quality if
allowed to flow into the soil. A leak-proof sump will be constructed and the asbestos
containing effluent water will be drained safely into the sump for collection. The boundary of
the sump will be protected so that effluent waters does not wash away to the nearby
vegetation or into the surface water during heavy rainfall.
F. OCCUPATIONAL HEALTH AND SAFETY
F2. Occupational health and safety
586. Mitigation Measures: Decommissioning activities , such as boiler dismantling, cutting,
grinding, lifting heavy machineries, segregating materials, working at heights, etc. may lead
to injuries, casualties or deaths of the workers involved in these activities. Proper health and
safety training on how to handle equipments and hazard identification must be assessed
before starting the decommissioning activities. Use of appropriate PPEs will be made
mandatory during decommisioning of existing boiler.The Contractor’s Occupational health
and safety (OHS) officer, entrusted with worker’s safety, should follow the Vol. 4:
Occupational Health, Safety and Environment Plan as a guildeline and must ensure that the
equipments and safety control mechanisms are working properly before the workers start
their work. In case of the discovery of faulty equipments and safety harness, they must be
replaced promptly. They must also ensure workers hygiene and health status. An on-site
medical team will be set up and emergency first-aid medical kit will be at hand in case of any
accidental injuries (burns, cuts, broken bones etc.). They will also conduct monthly health
check up to check the worker’s health condition and provide appropriate treatment for any
ailments. Finally, the contractors will ensure all compliance issues for the workers during the
course of the decommissioning and construction process, as per Bangladesh Labour Act,
2006.
G. SOLID WASTE DISPOSAL
G1. Hazardous solid waste
587. Mitigation Measures: Decommisioning of boiler will be done following the specialized
guidelines provided in the decommisioning plan (Vol. 3). Special handling methods will be
followed for segragating asbestos from insulation and other boiler materials. At first,
asbestos containing waste will be segregated from demolished material before disposal. The
contractor will establish a means to prevent any visible emissions outside the temporary and
on-site asbestos disposal pit during handling, segregation, and final disposal operations.
They must maintain the integrity of leak-tight containers and/or packaging at all times during
the handling and disposal operations. Minimize the release and exposure of asbestos
containing material after placement in the asbestos pit without compaction of the waste prior
to application of cover. Finally, in presence of the official of BPDB the asbestos pit will be
sufficiently covered to ensure complete coverage of the disposed asbestos and prevent re-
exposure during continuing disposal operations. During the operation, the worker must follow
the guidelines of WBG’s Good Practice Note: Asbestos: Occupational and Community
Health Issues, 2009 on hazardous materials management.

Environmental Management Plan
8-4
H. SOCIAL IMPACT
H2. Labor migration
588. Mitigation measures: The flow of migrant workers may aggravate the risk of
HIV/AIDS and STI. Awareness programs on HIV/AIDS infection through well-designed
campaign needs to be implemented; targeting all risk prone groups. Acclimatization with the
customs and rituals of local people can also reduce the chances of spreading the infection.
Adopting and carrying out Behavior Change Communication (BCC) among target groups
may also reduce the spread of the disease. The EPC Contractor will put in place a referral
healthcare facility to deal with medical aspects of HIV/AIDS treatment with specialized
services. The in-house medical facility will diagnose for STD/STI and TB infection in workers
and provide treatment as necessary. Serious cases of infection may be referred to
specialized treatment facilities of the region. Women are also an integral part in curbing the
spread of STD infection. Creating awareness on HIV infection amongst the women involved
in construction activities may prevent the spread of the infection.
8.4.2 Construction Stage
I. ECOSYSTEM
I1. Aquatic habitat quality
589. Mitigation measures: Dredging operation would gravely impact aquatic habitats,
particularly the benthic habitats. Dredging operation will be carried out in the routes having
minimum aquatic habitats. Appropriate benthic survey will be carried out prior to the
dredging activities. Various ships/cargos navigating in these routes might also disturb
aquatic habitats and thus the shipping companies must ensure that the ship/cargo carrying
machineries and ancillaries, construction materials and other raw materials, obey the
appropriate International Maritime Laws .
J. AMBIENT AIR
J1. Generation of dust and pollutants
590. Mitigation measures: During excavation of trenches for laying gas pipes; RMS,
turbine and HRSG foundation, operation of construction equipment and vehicles, and
material transport, will generate dust and pollution which is injurious to human health. Casing
will be used when buried pipes cross a road. The minimum depth of cover shall be
measured from the top of the pipe to the surface of the working grade. Crown materials
along the surface of the ground level will not be considered as a part of the depth of cover.
The specified depth of trench can be varied as suggested by the Engineer or his
representatives considering the site condition. The trench shall be carefully cut so that the
pipe is evenly bedded throughout its length with sufficient joint holes and trial holes made
where necessary. Before any back filing is performed, the pipeline will be evenly bedded
upon the bottom of the trench throughout its length and will be correctly positioned. Holiday
detector shall be used to detect holiday if any and shall be repaired before backfilling.
Compaction of back filling material shall be performed by an approved method to prevent
any subsequent settlement. Pipes should be strung only on the right-of-way which has been
cleared and where grading has been completed. The Contractor shall ensure that the pipe is
strung for proper placement of the pipe size. Pipes shall be raised on sandbags.
K. Ambient noise

Environmental Management Plan
8-5
K1. Noise level
591. Mitigation measures: During construction activity, noise might be generated from
welding operation, the moving and idling vehicles and operation of heavy machineries. The
machines/equipments/vehicles, thus, will be turned off in idle status, to minimize noise
generation. The workers working in the construction site will also use PPEs during work
close to noisy operation.
L. Water bodies
L1. Water pollution
592. Mitigation measures: Improper storage and handling of fuels, lubricants, chemicals,
hazardous goods/materials on-site; wash down of plants and equipments; and potential
spills may contaminate the water bodies and harm the environment and health of
construction workers. Oils, lubricants and other hazardous materials will be bunded and
stored separately to minimze spills. Workers will be trained on safety precautions on
using/handling hazardous materials. They will also be encouraged to use PPEs everytime
when handling petro-chemicals and other hazardous materials.
N. Occupational Health and Safety
N1. Health and safety hazard
593. Mitigation measures: Transportation of machineries and equipments from the ship to
the site; their installation/erection; lifting of heavy materials; handling of hazardous materials,
working at heights and other construction-related activities may lead to casualties or deaths
of the workers. Proper health and safety training on hazard identification, handling of
hazardous material and equipments, and training of staff who can potentially come into
contact with the material to avoid damage and prevent exposure before starting
decommissioning and construction activities, as detailed in Vol. 4 OHSE. They should also
use the appropriate PPEs during construction activities.The health and safety officer,
entrusted with worker’s safety, must ensure that the equipments and safety control
mechanisms are working properly before the workers start their work. In case of the
discovery of faulty equipments and safety harness, they must be replaced promptly. They
must also ensure workers hygiene and health status. An on-site medical team will be set up
and emergency first-aid medical kit will be available in case of any accidental injuries (burns,
cuts, broken bones etc.). They will also conduct monthly health check up to check the
worker’s health condition and provide appropriate treatment for any ailments.
N2. Fire hazards
Mitigation measures: All arc welding and cutting operations shall be shielded by
noncombustible or flameproof screens which will protect welders and other persons working
in the vicinity from the direct rays of the arc. In addition, the welders should use (i) hand
shields to protect against flashes and radiant energy, (ii) see his skin is covered completely
to prevent burns and other damage by ultraviolet rays, (iii)Welding helmets shall be free of
leaks and openings, and free of highly reflective surface, and (iv) welding trucks shall be
equipped with approved fire extinguishers and first aid.
P. Solid Waste Disposal

Environmental Management Plan
8-6
P1. Storage area and visual effect
594. Mitigation measures: Unplanned disposal of old and used equipments and other solid
wastes can lead to poor aesthetic view. Moreover, spillage and leakage from improper
storage can result in contamination of soil. During construciton, rubbles generated from the
construciton site will be stored in approriate bins/skips; will be well-covered and later buried
in an approved landfill sites. All solid wastes generated from the decommissioning and
construction site, both hazardous and non-hazardous, will be disposed off in on-site
asbestos pit and a designated space, respectively. Food waste and other bio-degradable
waste, generated by workers and power plant staff memebers, will be placed at designated
site prior to final collection and disposal by local municipality.
8.4.3 Operation Phase
T. AMBIENT AIR
T1. Maximum ground level concentration of air pollutants
595. Mitigation measures: The present repowering of Unit 4 will reduce emission of criteria
pollutants (NO2, CO, PM2.5, and PM10). Built-in Low-NOx burner in GT will reduce the NOx
emission below 25 ppmv. All modern GT manufacturers give the guaranty of having NOx
less than 25 ppmv with their dry low-NOx burner. BPDB will take initiative at the policy level
to limit the emission of NO2 of the adjacent Aggreko Rental Power Plant . This Power Plant
is the most polluting source in the airshed due to their low height stacks (3 m) and requires
to raise their stacks either individually or collectively for reducing the generated heat wave to
the adjacent areas as well as reducing NOx level to the sensitive receptors.
U. AMBIENT NOISE
U1. Noise level
596. Mitigation measures: Based on the measured and predicted noise level from the
plant operation, it has been confirmed that elevated noise levels are observed and predicted
at sensitive receptors. Based on the baseline noise measurements presented in Table 6-3
and forecasted noise leval at selected receptors (Table 7-24), it is observed that noise
levels exceed both ECR 1997 and WHO Guidelines. Higher noise level can lead to hearing
complexity and loss along with increased blood pressure; disturbances and discomfort to the
technicians, workers and surrounding communities. The machines/ equipments/vehicles,
which are not is use, will be turned off to limit noise generation. Install acoustic enclosures
for equipment (turbines, pumps, fans etc.) casing radiating noise. Noise attenuation
measures (barriers such as brick walls and thick vegetation) are recommended around the
RMS and gas pipes, to limit ambient noise at plant property lines, especially where sensitive
noise receptors are present. In Section 7.8.6, it is indicated that with noise barriers noise
levels comply with ECR 1997 and WBG Guideline values in most of the receptors. However,
exceedance of noise standard values are still expected in some receptors. Therefore, it is
receommended to conduct periodic noise monitoring during operation. If the monitoring
found constant exceedance of the noise standards, additional noise measures will be
considered and implemented. Workers working inside the power plant must use appropriate
PPEs (soundproof earpiece, mufflers etc.). Replace two doors in the control room and install
proper insulation in other doors and windows of the control room to attenuate noise to the
ECR 1997 recommended level.

Environmental Management Plan
8-7
V. WATER BODIES
V1. Pollution of receiving water bodies
597. Mitigation measures: Sludge generated from the chemical assisted raw water at
pretreatment, water, and effluent treatment plants may impact groundwater quality and
receiving water bodies if come in contact to untreated sludge. Construction of a leak-proof
sump will be made to store sludge temporarily and limit the spills. Effluent will then be
transferred to sludge treatment plant for treatment. The sump will be monitored and
maintained by GPS chemists and technicians and ensure the quality of effluent and spill
control.
598. GPS through their waste treatment action plan will practice the following to reduce
the generation of other waste and subsequent treatment:
Establish waste management priorities at the outset of activities based on an understanding of potential Environmental, Health, and Safety (EHS) risks and impacts and consider waste generation and its consequences;
Establish a waste management hierarchy that considers prevention, reduction, reuse, recovery, recycling, removal and finally disposal of wastes;
Avoid or minimize the generation of waste materials, as far as practicable;
Recover and reuse when waste generation cannot be avoided; and
Treat, destroy, and dispose of waste in an environmentally sound manner, when cannot be recovered or reused.
599. If waste materials are still generated after the implementation of feasible waste
prevention, reduction, reuse, recovery and recycling measures, waste materials will be
treated prior to disposal. Selected management approaches should be consistent with the
characteristics of the waste and DoE regulations, and may include one or more of the
following:
600. On-site or off-site biological, chemical, or physical treatment of the waste material to
render it nonhazardous prior to final disposal
601. Treatment or disposal at permitted facilities specially designed to receive the waste.
Examples include: composting operations for organic non-hazardous wastes; properly
designed, permitted and operated landfills or incinerators designed for the respective type of
waste; or other methods known to be effective in the safe, final disposal of waste materials
such as bioremediation.
V3. Thermal plume in receiving water bodies
602. Close cycle cooling system in Unit 4 will reduce the thermal plume in Shitalakhya
River. However, other units in GPS will continue discharging warm water and thermal plume
from other operating units of GPS will be non-compliant to WBG Guidelines. Therefore, it is
recommended that BPDB consider a combined close cycle cooling system for all current and
future units to bring the plant in compliant to WBG Guidelines in thermal plume discharge.
Y. Risks and emergency
Y3. Corrosion of gas pipes
603. Mitigation measures: The pipeline will be coated using 3 layer polyethylenes (3 LPE).
Buried pipes and fittings shall be protected against corrosion by means of external coating
and wrapping. Holiday detector shall be used to detect any holiday and shall be repaired.
Cathodic protection test points shall be installed and connected to temporary cathodic

Environmental Management Plan
8-8
protection facilities in accordance with the specification as the final operation of lowering or
tieing-in is in progress. The installation shall require inspection before back-fill is placed.
Y4. Gas compressor fouling
604. Mitigation measures: A cleaning regime in Bangladesh would be a combination of
on-line cleaning and semi-annual off-line washing. On-line cleaning is intended to avoid the
build-up of a layer of dirt. The first measures to be implemented after the start of commercial
operation should include daily washing of the compressor with fully demineralized water. As
the unit accumulates more operating hours, the owner will have to decide whether an
optimum cleaning interval can be achieved by taking into account all possible influences.
The on-line nozzle system comprises nozzles that are mounted on the inner cone upstream
of the spider which supports the compressor bearing in the casing. The hollow cone spray
nozzles in the on-line nozzle system generate a water spray that covers the full airfoil height.
On-line nozzles are connected to a distribution ring line mounted in the inner cone.
605. Off-line cleaning with an appropriate cleaner will result in more intensive cleaning at
crank speeds. Depending on the kind of fouling, the cleaning cycle can be repeated to
improve the cleaning effect with the aim to achieve a further increase in output and
efficiency. If practicable under the existing operating conditions, off-line cleaning should be
performed once per month or on appropriate occasions (but at least 4 to 6 times per year).
The off-line nozzle system comprises the nozzles that are mounted on the inner cone
upstream of the spider that supports the compressor bearing in the casing. The spray
nozzles in the off-line nozzle system generate a water spray, which covers the full airfoil
height. Off-line nozzles are connected to a distribution ring line mounted in the inner cone.
Y5. Gas pipeline leak
606. Mitigation measures: Separate welded joint sections of the pipeline shall be tied into
a continuous system in such a manner that no stress will be induced into the pipe as a
consequence of the tieing-in operation. The pipeline shall be commissioned following
hydrostatic testing, pigging and dewatering. All installation facilities shall be purged with
Nitrogen prior to commissioning and provision shall also be made for Nitrogen to be used in
the pipeline commissioning phase. Upon completion of the commissioning and appropriate
reinstatement and clean up of the ROW including installation of cathodic protection test
points, ROW markers and aerial markers etc in accordance with the programme and
procedures, to the satisfaction of the engineer, the pipeline system will be taken over for
operation by the company.
Z. SOCIAL IMPACTS
Z3. Availability of irrigation water
607. Mitigation measures: In Unit 4 repowering, close cycle cooling is recommended. In
addition, all future repowering projects may follow the same recommendation, which would
mean that condenser cooling water supply for irrigation may not be made available. This is
detrimental to the current irrigation practices in the project area. Under the close cycle
cooling the water demand from Shitalakhya River will be significantly reduced and some of
the pumps may become redundant. Considering, the severance of the issue and the
significant benefits to the communities, it is recommended that one pump will be dedicated
for the irrigation water for at least three years of project operation. GPS should coordinate
with BADC to handover the pumps and watermain for irrigation services. The operation and
maintenance costs after three years should be borne by BADC.

Environmental Management Plan
9-9
9. Environmental Management Plan
608. The Environmental Management Plan (EMP) includes several plans for implementing
mitigation and enhancement measures, emergency response, occupational health and
safety, and Environmental Code of Practices. Generally, the impacts, which are minor or
moderate, are to be mitigated by adopting Environmental Code of Practices (ECP) and
Contractor’s good practices during project implementation. On the other hand, impacts and
risks which are critical or major will be mitigated or prevented by adopting mitigation
measures discussed in Chapter 8 and specific plans discussed in this Chapter.
9.1 Objectives of EMP
609. The basic objective of the EMP is to manage adverse impacts of project interventions
in a way, which minimizes the impacts on the environment and people of the Project area.
The specific objectives of the EMP are to:
Facilitate the implementation of the mitigation measures identified during the present EIA to comply with regulatory requirements and discussed earlier in the document.
Maximize potential project benefits and control negative impacts.
Draw responsibilities for project proponent, contractors, consultants, and other members of the Project team for the environmental management of the Project; and
Maintain essential ecological process, preserving biodiversity, and where possible restoring degraded natural resources.
610. The EMP will be managed through a number of tasks and activities. One purpose of
the EMP is to record the procedure and methodology for management of mitigation and
enhancement measures identified for each negative impacts of the Project. The
management will clearly delineate the responsibility of various participants and stakeholders
involved in planning, implementation, and operation of the Project.
9.2 Various Categories of mitigation measures
611. The EMP includes various categories of mitigation measures and plans: (i) general
and non-site-specific measures in the form of environmental codes of practices (ECPs)
presented in Annex 9-1 to address general construction and operation matters identified as
moderate and minor in significance prior to mitigation in Table 7-4; (ii) project specific and to
the extent possible, site-specific mitigation measures discussed in Chapter 8 and
summarized in Table 9-2; (iii) Boiler Decommissioning Action Plan to be prepared by the
Contractor, and (iv) Construction Environmental Action Plan (CEAP) with site-specific and
contract-specific management plans to be prepared by the contractor, which include
pollution prevention, occupational health, safety and environment, and emergency response.
9.3 Inclusion of EMP in Contract Documents
612. In order to make the Contractors fully aware of the implications of the EMP and
responsible for ensuring compliance, technical specifications in the tender documents will
include compliance with mitigation measures proposed in the EIA as well as WBG’s General
Environmental Health and Safety Guidelines. The Contractor must be made accountable

Environmental Management Plan
9-10
through contract documents for the obligations regarding the environmental and social
components of the project.
9.4 Environmental Code of Practices
613. A set of environmental code of practice (ECPs) has been prepared for various
environmental and social management aspects: ECP 1: Waste Management; ECP 2: Fuels
and Hazardous Goods Management; ECP 3: Water Resources Management; ECP 4:
Drainage Management; ECP 5: Soil Quality Management; ECP 6: Erosion and Sediment
Control; ECP 7: Top Soil Management; ECP 8: Topography and Landscaping; ECP 9:
Quarry Areas Development and Operation; ECP 10: Air Quality Management; ECP 11:
Noise and Vibration Management; ECP 12: Protection of Flora; ECP 13: Protection of
Fauna; ECP 14: Protection of Fisheries; ECP 15: Road Transport and Road Traffic
Management; ECP 16: Construction Camp Management; ECP 17: Cultural and Religious
Issues; ECP 18: Workers Health and Safety, and ECP 19: Construction and Operation
Phase Security. The Contractors will be contractually obligated to comply with these ECPs,
presented in Annex 9-1.
614. The Contractors will prepare one Boiler Decommissioning Action Plan based on
terms and conditions provided in Vol. 3: Boiler Decommissioning Plan and one Construction
Environmental Action Plan to address pollution prevention, occupational health, safety and
environment, and emergency response including the requirements of ECPs and EMP. These
will be reviewed and approved by Owner’s Engineer (OE), EHSU Circle, and PIU before
implementation of construction works.
9.5 Environmental Management Plans during Construction
9.5.1 Site Preparation
615. The site preparation would require base stripping, felling of 25 wooden trees and
clearance of some bushes. The contractor will prepare a site preparation plan on the basis of
ECP 4, ECP 5, ECP 7, ECP 8, ECP 12, and ECP 13 to ensure safeguarding of environment.
This plan must be submitted to OE for review and approval.
9.5.2 Boiler decommissioning plan
616. One of the major components of the proposed repowering is decommissioning of the
existing boiler. Asbestos containing materials (ACM) are available in the insulation material
of the boiler and associated steam pipes. Therefore, environmental safeguard including
control of asbestos contamination has to be ensured. A detail Plan of boiler
decommissioning, asbestos handling and safety operation has been prepared and provided
in Volume 3: Boiler Decommissioning Plan. The general principle on which the boiler
decommissioning plan is based on is safe handling and disposal of asbestos and safety
procedure. ‘Wet removal’ approach will be strictly applied during removing of asbestos
containing insulation from boiler and steam pipes. In general the plan includes the following:
Preparedness for removing ACM
Measures to avoid soil and water contaminations, i.e., confining the boiler area with
water proofed barrier, polythene sheet cladding to arrest stray asbestos dust,
drainage system for managing effluent water (Figure 9-1)

Environmental Management Plan
9-11
Measures to avoid air pollution, i.e., use of thick plastic sheet to confined the boiler
structure, water spray system, concrete water proof system for collected sprayed
contaminated water, asbestos contaminated water collection system, treatment and
final disposal of effluent water (Figure 9-1)
Asbestos disposal plan
Code of Practices for Asbestos Handling, Removal and Disposals
Procedure of permits to work
Safety measures for personnel
Process of Dismantling of boilers
Managing Asbestos in Working Place
Monitoring Plan (continuous groundwater monitoring using monitoring well and
periodic soil quality using borehole samples)
Figure 9-1: Asbestos removal preparedness during Boiler Decommissioning
9.5.2.1 Statutory Requirements
617. The statutory clearances are required before starting Decommissioning work of
Boiler. Statutory compliance shall be divided into two broad categories:
Owner’s statutory requirements
Contractor’s statutory requirements
618. Detailed list of permits required covered in the full report presented in Volume 3.
9.5.2.2 Safety Preparation before starting removal of Asbestos
619. During decommissioning of boiler first activity will be removal of insulation from main
boiler and steam piping. The unit was installed in year 1989, insulations contain asbestos
containing material. Hence, due precautions are required to be implemented before starting
removal of asbestos. Following implementation measures are explained in detailed in the
full report.
Polythene
sheet cladding
to arrest stray
asbestos dust
Secondary
drain collection
tank
Primary drain
collection tank
Concrete
Water
proofed Bund
Barricaded GI
Sheet
Concrete Water
Proofed Slope

Environmental Management Plan
9-12
Asbestos related health risks.
Measures to avoid soil contamination
Measures to avoid Air Pollution.
Measures to avoid Noise pollution.
Base line data collection.
9.5.2.3 Pre- Requisite before taking Dismantling of Boiler
620. Before taking up actual dismantling of boiler all necessary perquisite were covered in
report along with responsibility matrix, mainly,
Minimum permits requirement
Development of the mass balance and disposal concept(s)
Development of dismantling strategy
Detailed Engineering study
Tender document preparation and floating of enquiry
Awarding decommissioning contract.
Safety requirements during entire Decommissioning process.
9.5.2.4 Dismantling of Boiler
621. As existing boiler becomes redundant and has to be demolished and removed. Once
the boiler decommissioned same area will be utilized for installation of HRSG. Main parts of
the boiler are,
Heavy oiler drum
Economizer
Water tubes
Steam pipes
FD, ID & recirculating Fans
Chimney
Air ducts, etc.
Insulation sheets and material
622. The boiler parts mentioned above and its auxiliary systems shall have to be removed
one by one, and stored at designated site(s). The last item is the demolishing of the
foundations.
623. It is estimated that time required to implement the demolishing and removal of the
existing boiler will be critical. The implementation and inter - connection of existing Steam
Turbine with the Heat Recovery Steam Generator. Dismantling should be so synchronized
that the site is clear as scheduled and steam pipes to and from turbine are cut and isolated
at the entrance point of turbine hall to be welded with the new pipes from HRSG.
624. It is necessary to adopt very careful handling of the dismantling sequence and
removal of heavy parts safely. Considering these a sequence of dismantling the existing
boiler has been prepared. The sequence has shown interrelated activities in critical path.

Environmental Management Plan
9-13
9.5.2.5 Asbestos handling, asbestos removal standards
625. Asbestos is recognized as a cause of various diseases and cancers and is
considered a health hazard if inhaled. Therefore, it is very important to implement necessary
precautions to safeguard workers, ambient air, soil and every effect of it in future.
626. Because of the major health risks associated with exposure to asbestos fiber, global
health and worker organizations, research institutes, and some governments have enacted
bans on the commercial use of asbestos and they urge the enforcement of national
standards to protect the health of workers, their families, and communities exposed to
asbestos through an International Convention.
627. The full boiler decommissioning plan report lists all important international standards
and details of International Convention held for working with Asbestos.
9.5.2.6 WBG’s Approach to Asbestos Health Risk
628. The WBG’s General EHS Guidelines are technical reference documents with general
and industry-specific examples of Good International Industry Practice.
629. The WBG’s EHS Guidelines specify that the use of ACM should be avoided in new
buildings and construction or as a new material in remodeling or renovation activities.
Existing facilities with ACM should develop an asbestos management plan that clearly
identifies the locations where the ACM is present, its condition, procedures for monitoring its
condition, procedures to access the locations where ACM is present to avoid damage, and
training of staffs who can potentially come into contact with the material to avoid damage
and prevent exposure.
630. The plan should be made available to all persons involved in operations and
maintenance activities. Repair or removal and disposal of existing ACM in buildings/industry
should be performed only by specially trained personnel following host country requirements
or, if the country does not have its own requirements, internationally recognized procedures.
Decommissioning sites may also pose a risk of exposure to asbestos that should be
prevented by using specially trained personnel to identify and carefully remove asbestos
insulation and structural building elements before dismantling or demolition.
9.5.2.7 How to manage and control Asbestos in work place
631. The Code of Practice on how to manage and control asbestos in the workplace is an
approved code of practice of the Workplace Health and Safety Act (the WHS Act).
632. An approved code of practice is a practical guide to achieving the standards of
health, safety and welfare required under the WHS Act and the Workplace Health and Safety
Regulations (the WHS Regulations).
633. A code of practice applies to anyone who has a duty of care in the circumstances
described in the code. In most cases, following an approved code of practice would achieve
compliance with the occupational health and safety duties in the WHS Act, in relation to the
subject matter of the code. Like regulations, codes of practice deal with particular issues.
The health and safety duties require duty holders to consider all risks associated with work,
not only those for which regulations and codes of practice exist.
634. The full report covers in detailed the following aspects of how to manage asbestos
related risk:

Environmental Management Plan
9-14
Managing risk associated with asbestos.
Asbestos register
Asbestos management plan
Managing other asbestos related risks
Managing exposure to the asbestos
Controlling the risk.
Sampling process
Examples of warning signs and labels
Templates on asbestos register
9.5.2.8 Asbestos Management Plan
635. GPS management must ensure that a written asbestos management plan is
prepared for the facility, which can be applied during decommissioning and dismantling of
boiler, construction of asbestos pit, managing existing asbestos burial site, etc. The
identification of asbestos or asbestos containing material has to be done before starting
Boiler Decommissioning and updated as the work proceeds.
636. The asbestos management plan must be maintained to ensure the information is up-
to-date. The full report covers detailed procedure and practices for asbestos management
plan.
9.5.2.9 Asbestos Disposal Procedure
637. In the EIA study, it is recommended that due to the absence of specialized contractor
to handle ACM in Bangladesh, an on-site asbestos disposal pit is developed with sufficient
capacity to accommodate all ACM generated from current and future repowering and plant
refurbishment work. There exists free space at the jetty site for disposal of asbestos. A pit
will be designed and constructed for disposal of present operating plant, asbestos generated
during repowering of Unit 4 and 3, to accommodate any future disposal need.
638. Asbestos handling and disposal procedure, packaging and labeling and
documentation procedure, precaution to be taken during transportation are covered in Vol. 3:
Decommissioning Plan.
639. Based on the Unit 4 EIA ToR, approximately 50 tons of asbestos exists in the boiler
insulation materials. The Consultant after spending substantial time in GPS library identified
some old erection report of Unit 4 and estimated the existence of about 17.65 tons of
asbestos, however, this is a partial list of the asbestos in Unit 4 boiler.Considering the total
amount referred in the TOR, the decommissioning of Unit 4 boiler may produce 50 tons and
repowering of Unit 3 will also generate similar quantity and in future other Units may also be
repowered and as a result more asbestos containing material (ACM) will be generated.
Presently, some hazardous waste (including asbestos) has been buried and placed two
meter below the top soil in the form of trench. The trench has concrete pad at the bottom but
no synthetic liners are placed and there are neither storm water diversion channels nor any
arrangement for collection and treatment of the leachates. Therefore, it is essential that all
these issues require consideration while developing an on-site asbestos pit. Since, the total
quantity of asbestos containing material is unknown, it is recommended that boiler

Environmental Management Plan
9-15
decommissioning contractor shall study carefully the ACM in the boiler and in consultation
with GPS make the final judgement on the capacity of on-site asbestos pit.
9.5.2.10 Asbestos Disposal Location and Arrangement
640. In the EIA study, it is recommended that due to the absence of specialized contractor
to handle ACM in Bangladesh, an on-site asbestos disposal pit is developed with sufficient
capacity to accommodate all ACM generated from current and future repowering and plant
refurbishment work. There exists free space at the jetty site for disposal of asbestos (Figure
9-2).
641. A pit of required capacity will be constructed for disposal of ACM. There will be three
compartments to accommodate all ACM. One compartment will be reserved for operating
plant waste.

Environmental Management Plan
9-16
Figure 9-2: Proposed plant layout with the location of asbestos disposal pit (top left corner)

Environmental Management Plan
9-17
642. Typical design for Asbestos pit is shown in Figure 9-3. As the location of the pit is
close proximity to the river it is recommended to have “Double Composite Liner”, while
designing the pit. Third pit for operating plant solid disposal may be designed as single
composite wall lining (Figure 9-4), to economize the investment cost.
643.
644.
Figure 9-3: Pit with double composite liner
645.
Figure 9-4: Single Composite Wall Liner Land Fill
646. Department of Environment Bangladesh has no asbestos handling and disposal
standards especially for secured asbestos disposal and landfill. As Bangladesh has rivers

Environmental Management Plan
9-18
flowing all over and especially Shitalakhya River is close to Ghorashal plant the water table
is quite high. Similar situation is observed in countries like the Netherlands as it is located at
sub sea level. Hence, it is advisable to follow Standards of Asbestos Waste Disposal of the
Netherlands.
9.5.2.11 Occupational health and safety during asbestos management
647. The full report on boiler decommissioning covers in detail the workers’ occupational
health and safety procedures at work place while handling ACM. Necessary International
standards are also referred in the report. The following are few of the highlights on the
occupational health and safety procedures while managing asbestos:
All employees must wear respiratory protection on-site during the preparation of work
areas for asbestos removal.
The respiratory protection must have a minimum protection factor of 50, and
be approved by NIOSH for protection against asbestos.
When using respirators, follow the procedures of the equipment manufacturer
Employees shall be properly trained about using and fitting of respirator.
The respirator must be fitted so that there is an effective seal between the respirator
and the employee’s face.
Where practicable, assign a respirator to an employee for the employee’s exclusive
use.
Reusable respirators must be cleaned, disinfected and inspected: after use; at least
once each shift.
When not in use, maintain and store reusable respirators in a clean and sanitary
location.
Respirator shall be provided by the employer.
Every employee who enters the work site; consists of full body covering, including
head covering, with snug fitting cuffs at the wrists, ankles and neck, (disposable
coveralls are strongly recommended).
648. Following special precautions will be taken for workers inside the removal area:
Eating, drinking, chewing or smoking inside the change room, shower room, hall
ways, storage room(s) or removal area are strictly prohibited.
Complete decontamination is required prior to eating, drinking, chewing or smoking
when come out of working area.
Respiratory protective equipment is not removed inside the asbestos work area.
Employees take coffee breaks and have lunch in an area completely separate from
the asbestos removal area.
649. The following medical check-up of workers will be conducted during boiler
decommissioning:
Employees shall be periodically checked for asbestos effect.
If an employee found affected by asbestos he shall be immediately stopped working
in asbestos removal area and necessary treatment shall be extended to him.
Employee’s family shall be periodically checked for asbestos effect.
Provide proper medication to every employee such as tonic tablets, etc. during
execution of work.

Environmental Management Plan
9-19
9.5.2.12 Schedule of Plan and Sequence of Dismantling of the Existing Boiler
650. Schedule of plan and sequence of dismantling of the existing boiler are presented
below:
9.5.3 Construction Environmental Action Plan
The following are some of the plans proposed in this EMP to guide the Contractor to prepare
a Construction Environmental Action Plan (CEAP). The Contractor will expand the plan to
address site specific measures.
9.5.3.1 Erosion, sediment and drainage control plan
651. An Erosion, sediment and drainage control plan will be necessary to manage rainfall
run off in the construction site. This plan will be prepared by each contractor on the basis of
ECP 4 and 6, and the mitigation measures given in EIA. The Plan will be submitted to the
OE for review and approval before contractor mobilization.
9.5.3.2 Pollution Prevention Plan
652. Pollution Prevention Plan will be prepared and implemented by the Contractor on the
basis of ECP 1, ECP 2, ECP 11, and WBG General EHS Guidelines (2007), as well as the

Environmental Management Plan
9-20
mitigation plans given in EIA. The Plan will be submitted to the OE for review and approval
before contractor mobilization.
9.5.3.3 Waste Disposal and Effluent Management Plan
653. Waste Disposal and Effluent Management Plan is mandatory to manage the
construction waste and effluent including waste and effluent from labor sheds. A detail plan
will be prepared and implemented by the Contractor on the basis of ECP 1, ECP 4, and
WBG EHS Guidelines (2007), as well as the mitigation plans given in this EIA. The Plan will
be submitted to the OE for review and approval before contractor mobilization.
9.5.3.4 Traffic Management Plan
654. During construction a number so vehicle will be running from/to construction site. To
avoid the impacts of this additional traffic there must be a management plan for traffic
operation. A detail plan will be prepared by each Contractor on the basis of ECP 15 and also
the mitigation plans given in this EIA, after discussion with PMU and authorities responsible
for roads and traffic. The Plan will be submitted to the OE for their review and approval
before contractor mobilization. The OE will facilitate the integration and coordination of the
plans prepared by various contractors to prepare an overall Plan.
9.5.3.5 Borrow Area Management and Restoration Plan
655. An environmental plan for management and restoration of borrow areas will be
prepared by the Contractor on the basis of ECPs 8 and 9 and other requirements described
in the mitigation plans. This Plan will aim at minimizing the environmental and social impacts
during borrowing activities and restoring as much as possible the original natural situation of
these sites by various measures (refill, levelling or smoothening). Restoration methodologies
will be included in the Plan. The Plan will be approved by the OE and PMU.
9.5.3.6 Drinking Water Supply and Sanitation Plan
656. A Separate water supply and sanitation provisions might be needed for the
temporary facilities, labor camp and workshops, in order not to cause shortages and/or
contamination. A Plan will be prepared by the Contractor on basis of ECP 3. The Plan will be
submitted to the OE for review and approval before contractor mobilization.
9.5.3.7 Good Handling and Operation of Construction Equipment
657. The equipments and machinery from construction activities should be handled and
operated in a way that would ensure low noise, low emission of SOx, NOx, smoke, no oil
leaks, no accidental event, etc. A detail plan of handling and operation of construction
equipment will be prepared by each Contractor on the basis of ECP 2, 10 and 11. The Plan
will be submitted to the OE for review and approval before contractor mobilization.
9.5.3.8 Fuel and Hazardous Substances Management Plan
658. The plan will be prepared by each Contractor on the basis of ECP 2 as well as the
mitigation plans given in this EIA and in accordance with the standard operating procedures,
relevant guidelines, and where applicable, material safety data sheets. The Plan will include
the procedures for handling oils and chemical spills. The Plan will be submitted to the OE for
review and approval before contractor mobilization.

Environmental Management Plan
9-21
9.5.4 Communication Plan
659. A communication plan has been prepared and presented in Table 9-1 While carrying
out the communication plan modifications of process and planning may be done as per the
projects requirement.
Table 9-1: Communication Plan Adopted for the Project
Stakeholder Information/Message Communication
Means Timing/Frequency Responsibility
PAPs Project awareness (general project information, etc.)
Consultations Scoping session in the preparation of Draft EIA
EIA Consultant, supervised by Project Implementation Unit (PIU)- BPDB
Project findings (environmental and social concerns)
Disclosures: World Bank through Info seek website; DoE through presentation; public through BPDB website and formal consultations
Immediately after preparation of Draft EIA
EIA Consultant, WB, BPDB, supervised by PIU
Employment opportunities
Government procedure: for new recruitment at AE position informed public by TV, radio, newspaper (English / Bangla); for others, BPDB internal system.
4 weeks before recruitment / job opening
PIU, BPDB
Implementation of Repowering Project
Consultations At the start of re-powering plant implementation and boiler decommissioning
EPC, OE, independent monitor, supervised by PIU-BPDB
Operation of the proposed Plant (grievance redress)
Consultations At the commissioning of the Plant
Independent monitor, supervised by PIU-BPDB
General population (Local)
Skilled and unskilled labour employment opportunities
Poster, local daily newspaper
3 to 4 weeks before recruitment
PIU-BPDB
Fire Service Incidents of disasters Telephone, cell phone
Immediately when any incident is detected
Shift Engineer (PIU)
Police Station Incidents of disasters and security issues
Telephone, cell phone
Immediately when any incident is detected
Shift Engineer (PIU)

Environmental Management Plan
9-22
9.6 EMP during operation phase
660. With reference to the possible significant environmental impacts during operation
stage identified in Chapter 7, impact specific Environmental Management Plans have been
prepared to address those impacts. The plans are prepared on the basis of mitigation
measures proposed in Chapter 8. In the following sections these plans are discussed.
9.6.1 Wastewater Management
661. Presently rejected water, sludge and slurry from different water treatment plants (e.g.
coagulation, clarification, demineralization, etc.) are drained to a central neutralization pond
for neutralization and disposal. A Central Water/Effluent Treatment Plant (CETP) is
proposed for Unit 4 repowering to treat raw and effluent water generated from Unit. The
CETP will include a central Effluent Treatment Plant, Sludge and Slurry Treatment Plant,
Sludge and Slurry disposal system, Treatment facilities for feedwater using environment
friendly oxygen scavenger (e.g., Helamin, Sodium Erythorbate) and demineralization water
using reverse osmosis process, domestic waste water treatment facilities, etc. The
Contractor will design the plant according to the type, characteristics, quantity, and
regulatory guideline of DoE and WBG EHS Guidelines on Water and Sanitation. All waste
water generated from various processes of Unit 4, and liquid wastes will be treated in the
CETP before discharging or disposing to the natural environment.
662. BPDB may consider increasing the capacity of the CETP to treat raw and effluent
water of other units of GPS and nearby industries, and Power Plants by charging a fee to
others. BPDB may take this matter to the policy level with the support of DoE.
9.6.2 Solid waste management
663. GPS shall develop a waste prevention strategy, which will significantly reduce the
total amount of waste. The strategy will focus on recycling and the facility wise
implementation of recycling plans, considering the following items (as per WBG Guidelines):
Evaluation of waste production processes and identification of potentially recyclable
materials
Identification and recycling of products that can be reintroduced into the operation of
the plant
Investigation of external markets for recycling by other power plant operations
located in the neighborhood or region of the facility (e.g., waste exchange)
Establishing recycling objectives and formal tracking of waste generation and
recycling rates
Providing training and incentives to employees in order to meet these objectives.
9.6.3 House keeping
664. GPS should implement a good house-keeping practice, such as the sorting and
placing loose materials or demolition debris in established areas away from common
workspace, cleaning up excessive waste debris and liquid spills regularly, locating electrical
cords and ropes in common areas and marked corridors.
9.6.4 Occupational health safety and environment
665. A detail Occupational Health, Safety and Environment (OHSE) Plan has been
prepared and presented in Volume 4. The Plan includes the following:

Environmental Management Plan
9-23
Occupational Hazard Identification and Control Plan
Inspection and Auditing Plan
Leadership and Administration Plan
OHSE Communication Plan
Required PPEs
Site Security Plan
HSE Program for the Contractors/Sub-Contractors
Preventative Maintenance Plan
Incident Investigation Mechanism
Safe Work Practices and Procedures.
666. The plan has been prepared in a way, which will be applicable for entire life cycle of
the project. Application of the OHSE plan is responsibility of all including management,
employee, contractors, sub-contractors, vendors in their daily activities. The plan also
proposes a management and administration system (organogram) for OHSE Plan
application. It is suggested that BPDB develops an OHSE Management System program
activities and commitment and ensure the program are implemented during each phases of
the repowering project. Table 9-2 presents OHSE management systems and key
responsibilities, for detailed information specific Section number in the detailed report are
referenced.

Environmental Management Plan
9-24
Table 9-2: OHSE Management Systems and key responsibilities register
OHSE program activities EHSU Manager-BPDB
(to implement)
OHSE program activities Superintendent Engineer –BPDB
( to ensure)
Employees (Includes EPC and other contractors) (to follow)
1. Policy and commitment
Make a draft OHSE Policy for Project director for approval (Guideline-refer to Section 2)
Communicate policy. Provide leadership in line with policy commitments. Assess any changes to organization structures,
activities, processes, etc. for OHSE implications.
Feedback ideas for changes to policy. Understand policy and follow intent. Follow OHSE processes.
Collate changes and publish. Assist with important changes.
2. Legal & other requirements (Guideline-Refer to Section 1.4 and Section 1.5, Vol. 4)
Monitor legal requirements and produce a monthly report to communicate relevant changes to the business.
Implement actions required to ensure legal compliance. Communicate requirements, including any changes to
work programs or practices, to staff.
Follow procedures, work instructions etc. as these should be in compliance with legal and other requirements.
Report issues where procedures / work instructions may not be in compliance with legal requirements to Manager or OHSE representatives.
Develop corrective and preventative actions to ensure that relevant changes to legal requirements are incorporated into OHSE documentation.
Update OHSE processes. Assist with important changes.
3. Hazard identification & risk management (Guideline- Refer to Section 7 and chapter 10 of EIA report)
Coordinate strategic risk assessment process within lines of business.
Ensure risk assessments are carried out and registers are updated.
Understand key risks and mitigation measures.
Understand key risks and mitigation measures relevant to their own areas.
Report new risks and hazards. Participate in risk reviews. Report potential gaps in controls.
Facilitate Site Hazard Register development and maintenance.
Coordinate Site Hazard Register development and maintenance, including providing adequate resources.
Provide OHSE technical advice on the development of project risk assessments and plans.
Ensure controls are in place to control identified risks.
Provide technical advice on the development of operational risk assessments and plans.
Coordinate development and implementation of operational risk assessment and plans, including providing adequate resources.
4. Planning & objectives (Guideline- Refer to Section 3, Vol. 4)
Coordinate the development of strategic OHSE plans. Engage and provide resources to enable strategic assessment and subsequent plans to be developed.
Be involved in the development and implementation of OHSE objectives, targets and programs. Advise and propose OHSE objectives, targets and

Environmental Management Plan
9-25
OHSE program activities EHSU Manager-BPDB
(to implement)
OHSE program activities Superintendent Engineer –BPDB
( to ensure)
Employees (Includes EPC and other contractors) (to follow)
improvement activities.
Facilitate the development of OHSE programs and advise on OHSE strategy.
5. Accountability & Leadership (Guideline- Refer to Section 4, Vol. 4)
Ensure that OHSE accountabilities, roles and responsibilities are clearly documented in OHSE documentation and communicated in OHSE training.
Ensure OHSE accountabilities and requirements are identified and documented in Work Plans and Position Descriptions.
Lead and support OHSE system requirements. Provide adequate supervision and leadership to staff
(especially new starters).
Ensure OHSE requirements are understood and met
Participate in the continual improvement of the OHSE system.
6. Awareness, training & competency (Guideline- Refer to Section 5, Vol. 4)
Coordinate OHSE training needs analysis for the development of a comprehensive training requirements register.
Conduct OHSE training needs assessment for the team.
Ensure teams’ training requirements are communicated to OHSE representatives for inclusion in the OHSE training program.
Incorporate core OHSE training requirements in the training requirements register.
Facilitate OHSE training program. Understand training and competency requirements for personnel they are responsible for (including contractors).
Sign up to and attend training. Understand competency requirements
and make sure they are met.
Coordinate and deliver some in house training (e.g. OHSE system training, OHSE inductions, OHSE risk management, etc.).
Ensure staff (including contractors) are trained and competent to do the work assigned to them.
Maintain records of training required, training attendance and competencies awarded (via HR).
Incorporate OHSE training requirements into data management system.
Make people available to attend training. Ensure records of training and competency
requirements, training attendance and competencies awarded are documented within their jurisdiction.
Provide evidence of prior learning, licences or other relevant competencies required to do the assigned work.
Provide feedback on training suitability and quality.
7. Communication, consultation & involvement (Guideline- Refer to Section 6, Vol. 4)

Environmental Management Plan
9-26
OHSE program activities EHSU Manager-BPDB
(to implement)
OHSE program activities Superintendent Engineer –BPDB
( to ensure)
Employees (Includes EPC and other contractors) (to follow)
Ensure that management and staff are consulted when changes are made to the OHSE system.
Ensure staff are consulted when change are made to assets and operations that might effect OHSE policies and procedures.
Participate in team meetings and communicate/raise OHSE concerns, issues, key learning and wins.
Participate in OHSE policies / procedures review.
Provide monthly OHSE report with key learning. Communicate OHSE issues at team meetings (e.g. monthly stats and key learning).
Engage with and discuss monthly reports and key learning.
Compose and circulate OHSE alerts. Respond to OHSE issues / concerns.
Compose and circulate program newsletters and updates.
Read OHSE communication items and attend communication sessions.
Communicate changes to OHSE policies and procedures to management.
Communicate relevant information on OHSE system changes to staff.
Develop and maintain OHSE Essentials web portal.
8. Document & record management (Guideline- Refer to section 8, Vol. 4)
Maintain OHSE documentation, including: Filing OHSE records such as assessments, plans
and reports. Developing and distributing monthly report for
project director. Developing and maintaining internet sites to enable
ease of access to OHSE documents and information Reviewing and updating OHSE documentation. Maintaining OHSE documents and records in
accordance with OHSE system requirements.
Ensure resources are available to manage documents and records.
Ensure documents and records are adequately managed.
Manage documents and records as required.

Environmental Management Plan
9-27
OHSE program activities EHSU Manager-BPDB
(to implement)
OHSE program activities Superintendent Engineer –BPDB
( to ensure)
Employees (Includes EPC and other contractors) (to follow)
Manage OHSE document change requests. Ensure area-specific OHSE process requirements are appropriately documented.
Provide input into development of OHSE documents.
Raise OHSE document change requests where gaps or issues are identified.
9. Assets & operations (Guideline- Refer to Vol. 3: boiler decommissioning plan)
Administer OHSE operational control processes.
Identify OHSE risks associated with assets and operations, ensuring they are recorded in OHSE risk registers.
Ensure controls and processes are implemented to adequately manage OHSE risks.
Be involved in the development of OHSE risk management programs, plans and processes.
Facilitate strategic and operational risk management processes to enable the development and implementation of appropriate control measures.
Document all monitoring and measuring processes implemented in order to demonstrate that controls are effective.
Implement / follow OHSE risk control measures.
Provide professional advice to business units on OHSE management and improvement initiatives.
10. Project management (Guideline- Refer to Section 6, Vol. 4)
Provide advice and support to project managers in the development and implementation of project OHSE Management Plans.
Project Team Managers: Ensure that OHSE Risk Assessments are conducted
for all projects. Understand their OHSE accountabilities.
Project Managers: Ensure that project OHSE
management plans are developed and implemented.
Lead and participate in project-related OHSE initiatives.
Participate in, and inform staff of, project-related OHSE initiatives.
Ensure other OHSE procedures support project management (e.g. Hazard ID and Risk Management, Audit, Management of Contractors & Suppliers)
11. Management of contractors & suppliers (Guideline- Refer to section 11, Vol. 4)
Document process to ensure OHSE risks associated with contractors and suppliers comply with legal requirements (OHSE and Contracts & Procurement
Ensure process for managing contractors and suppliers are in place and followed.
Ensure relevant personnel are trained in contractor and
Follow OHSE processes around contractors and suppliers.
Monitor contractor / supplier

Environmental Management Plan
9-28
OHSE program activities EHSU Manager-BPDB
(to implement)
OHSE program activities Superintendent Engineer –BPDB
( to ensure)
Employees (Includes EPC and other contractors) (to follow)
processes)
supplier management, as required (e.g. project managers).
compliance with OHSE system requirements.
12. Emergency preparedness
Facilitate strategic emergency assessment and planning processes. Guideline- Refer to Emergency management Plan that attached in the EIA report
Identify potential OHSE emergency situations. Understand roles and responsibilities in Emergency Response Plan situations
Provide advice on assessing emergency risk and planning adequate responses.
Ensure adequate response plans are resourced, developed and maintained
Ensure adequate drills, training and response equipment are resourced, maintained and in place.
Attend OHSE emergency training and participate in drills.
Be involved in debriefs and response plan improvements.
Facilitate the development of emergency response plans, when required.
13. Monitoring & measuring (Guideline- Refer to Section 10, Vol. 4)
Provide data to measure OHSE performance
Review performance data and agree on improvement programs
Recommend programs based on review of OHSE performance
Ensure equipment used to monitor OHSE performance is maintained , calibrated etc people are trained e.g., gas detectors
Ensure relevant procedures are followed
14. Incident management (Guideline – Refer to Section 15, Vol. 4)
Provide technical advice on incident investigations and the development of corrective actions.
Ensure OHSE incidents are reported and investigated as per the procedure.
Ensure root causes are identified and actions implemented to prevent recurrence.
Complete and submit incident reports for all health, safety or environmental incidents, hazards and near-misses.
Participate in incident investigations as required.
Lead Severity 3 incident investigations. Audit the Incident Management procedure. Analyze incident data to identify trends and communicate them to management.
15. Audit (Guideline- Refer to Section 9, Vol. 4)
Develop and facilitate annual internal OHSE audit programs
Consider audit requirements and nominate projects or processes to be audited.

Environmental Management Plan
9-29
OHSE program activities EHSU Manager-BPDB
(to implement)
OHSE program activities Superintendent Engineer –BPDB
( to ensure)
Employees (Includes EPC and other contractors) (to follow)
Conduct OHSE audits
Participate in audits. Make staff and resources available to auditors. Develop and implement actions from audits.
Participate in audits. Develop and implement actions from
audits
Facilitate OHSE certification process (ISO 14001 and OHSAS 18001)
16. Management review (Guideline- Refer to Section 17, Vol. 4)
Facilitate OHSE management review processes.
Conduct OHSE management reviews. Develop actions and programs aimed at continual
improvement of OHSE performance. Communicate and implement OHSE improvement
programs.
Participate in OHSE management review process through employee representatives attending Executive Safety Team meetings.
Participate in relevant improvement programs.
Provide data analysis and information for OHSE management review processes.

Environmental Management Plan
9-30
667. EPC contractors will prepare site specific OHSE plans based on the guidelines
provided in the OHSE plan presented in Volume 4 and present to OE and PIU for approval.
The plan should address all pertinent issues to create a work place that protects worker
health and safety with due respect to the environment, and promote an atmosphere to grow
employee learning and opportunity in a way that is fulfilling, recognized and fairly rewarded
during decommissioning and construction phase of the project. Table 9-3 presents general
expectations from the EPC contractor while implementing the OHSE plan.
Table 9-3: Expectation from the EPC Contactors
Commitment and
Leadership
Management shall provide strong visible commitment, leadership and
personal involvement in health, safety and the environment.
Management shall make available the resources necessary to achieve
BPDB’s OHSE objectives
Policies and
Objectives
Develop and communicate policies demonstrating a commitment to
OHSE that is consistent with, and at least equal to, other business
aims. Supporting objectives shall be defined, deployed and maintained
at all organizational levels
Organization,
Resources and
Documentation
Define, document and communicate the roles, responsibilities and
accountabilities to enable every individual to fulfill their role in
improving OHSE performance
Risk Evaluation
and Management
Continually evaluate the OHSE risks to the workforce, customers and
the environment. Continually evaluate processes and activities for
specific hazards- assess potentials, record and control the subsequent
risk to a tolerable level.
Planning OHSE considerations shall be integral to all aspects of business
planning or changes in the design, development, purchasing and
delivery of our products and services.
Implementation,
Recording and
Monitoring
Determine and record whether those actions are effective. Activities
shall be conducted in accordance with defined standards, and
continuous improvement shall be promoted and monitored through
active employee participation
Audit and Review
Audits and reviews shall be conducted to verify the implementation and
effectiveness of the OHSE Management System and its conformation
to this specification.
9.6.5 Thermal Pollution Management
668. On the basis of the findings of the Impact Assessment practice discussed in Chapter
7 and mitigation measures in Chapter 8, closed cycle cooling system is recommended with
cooling towers to prevent thermal plume discharge into the river. It is recommended that
GPS consider converting all existing once through cooling system to close-cycle cooling
system. GPS has already started moving to this direction by including closed cycle cooling in

Environmental Management Plan
9-31
its new Unit 7. Once repowering is done, Units 1 and 2 will be decommissioned and
eventually this will lead to reduction of the thermal load on the river.
9.7 EMP to Address Cumulative Impacts
9.7.1 Air Quality Management
669. The proposed repowering would decrease the emission of NOx, PM and CO from the
Unit 4 of GPS. But, other pollutant emitting industries in the airshed include Agrekko and
Max Power Quick Rental, Fertilizer Factories, Brick Fields, etc. Based on cumulative impact
assessments of ambient air quality, AERMOD dispersion modelling predicted that both PM2.5
and PM10 concentrations exceed both ECR 1997 (as amended in 2005) and WHO
Guidelines and NO2 concentration meets the ambient air quality standards marginally. Major
contributor of NO2 is Agrekko Quick Rental. Scientific study42 available, which indicates that
PM2.5 concentration in Bangladesh is mostly trans-boundary (secondary pollutants formed
from NOx and SOx after chemical transformation in the ambient air).The combustion of
gaseous fuels such as natural gas does not produce significant particulate matter. Also,
natural gas from Bangladesh is naturally very low in contaminants such as sulfur and is
considered sweet. This study conclude that on average 35% of the PM2.5 concentration is
trans-boundary in nature and can be as high as 67% depending on the season. Therefore,
BPDB should take initiative at the policy level to reduce emissions from selected facility.
DOE can take action to bring specific facility in compliance. In addition, a trade-off between
heavy and low polluting industries should be established with the initiative of DoE. For
ensuring a sustainable development and pollution free airshed, some policy intervention and
strategic initiatives are very much required. For PM2.5, Bangladesh Government should
coordinate with Indian Government for a possible joint scientific study on trans-boundary
pollution to ascertain cause of high PM2.5 concentration.
9.7.2 Noise Management
670. A comprehensive plan for noise reduction and attenuation is required to control
ambient noise limit within the permissible level. Therefore, the contractor should develop an
integrated plan on the basis of ECP 11. The following mitigation measures have been
proposed in Chapter 8 that also need to be considered in the Noise Management Plan:
Development of a Greenbelt near Army Camp that will separate the Plant area and
from the residential areas.
Rise of boundary wall between Fertilizer Factory and GPS, and also development of
greenbelt along the boundary wall
Replace two doors in the control room and install proper insulation in other doors and
windows of the control room to attenuate noise to the ECR 1997 recommended level.
671. In addition, BPDB needs to take initiatives to construct a 3 m high brick wall having
capacity of noise attenuation at outer boundary of Power Plant of Agrekko Ltd to buffer noise
propagating to nearest community.
42 Billah, M., Chatani, S., and Sudo, K. (2009); Application of WRF-CMAQ Modeling System to Study of
Urban and Regional Air Pollution in Bangladesh, 8th Annual CMAS Conference, Chapel Hill, NC, October 19-
21, 2009

Environmental Management Plan
9-32
9.7.3 Central Water Treatment Plant
672. Presently a number of industries are running around GPS and discharging their
effluent into the river. The baseline water quality of Shitalakhya River indicate that the water
is already degraded (high BOD, low DO and presence of other pollutants). It is not out-of-
subject to mention that GPS has an obligation to treat wastewater complying ECR 1997
before disposing to the river, as Shitalakhya River has been designated as an ecologically
critical area by DoE in 2009 among four rivers within the close proximity of Dhaka. Existing
water and effluent treatment in Unit 4 is done through individual plant and not in an
integrated way. Therefore, it is proposed to develop a Central Water/Effluent Treatment
Plant (CETP) for Unit 4 repowering. The CETP will be an integral part of the Environmental
Infrastructure of the Unit 4. This CETP will meet ECR 1997 and WBG EHS Guidelines. The
CETP will be environmentally sustainable and cost viable system for the collection,
treatment and ultimate discharge of effluents from the Unit 4. The CETP will consists of, (a)
Rawwater supply and treatment system, (b) Waste water treatment system, (c)
demineralization plant, (d) effluent treatment system, and (e) sludge treatment and disposal
system.
673. As a law enforcement Agency, Department of Environment may take an initiative at
policy makers’ level to find a way to build a Central Water Treatment Plant. BPDB may also
take initiative of constructing a large scale CETP and commercially offer effluent treatment
services to different industries. Government may also invite private partnership to construct
possible CETP where the industries would contribute as polluter-pay basis (based on the
nature and quantity of its effluent) to the CETP authority for treating their water and effluents.

Environmental Management Plan
9-33
9.8 Mitigation Plan
674. The mitigation plan presented in Table 9-4 is organized around various project activities and includes various actions identified under
the mitigation measures discussed in Chapter 8, define responsibilities for implementation as well as supervision of each action, and also
indicate the timing of these actions. Should any changes to the Project design or methods of construction and operation take place, post this
assessment stage, the impacts and mitigation measures discussed may need to be revised to reflect such changes to allow the environmental
and social implications of these changes to be addressed.
Table 9-4: Mitigation Plan
VECs/Issues Environmental
Impacts Mitigation Measures
Institutional Responsibilities
Implementation Supervision
1. DECOMMISSIONING PHASE
B. Ambient Air
B1. Airborne
asbestos fiber
Inhalation of airborne
asbestos fiber during
segregation of hazardous
materials and their
transportation is injurious to
lung leading to lung cancer
and other lung diseases or
respiration complexity.
Skin and eye irritation of the
workers may cause due to
contact with dust particles.
Boiler area must be protected by temporary peripherial G.I. Sheet fence of 3m height both for existing boiler and asbestos disposal site for preventing trespasserscome close proximity of the decommissioning site.
The workers should use the appropriate PPEs during decommisioning of existing boiler.
Workers must follow the OHSAS 18000 guideline and observe onsite safety precautions regularly.
Water spraying should be done on all asbestos containing materials in the morning especially before commencing the work and subsequently when required to prevent asbestos particles disperse in the ambient air.
Contractor Owner’s
Engineer (OE)
and Project
Implementation
Unit (PIU)-
BPDB
D. Water Bodies
D2. Water quality
Contamination of nearby
water bodies by asbestos
containing effluent
generated during water
spray control airborne
asbestos fiber.
Proper installation of water management system i.e., proofed bund, water proofed slope, water drains and tanks as suggested in the boiler decommissioning plan
In addition, a secondary drain and collection tank will be installed at the outskirt of the primary water bund to prevent water leakage to nearby area
The details of the plan is described in Vol. 3: Boiler Decommissioning Plan
Contractor OE and PIU-
BPDB

Environmental Management Plan
9-34
VECs/Issues Environmental
Impacts Mitigation Measures
Institutional Responsibilities
Implementation Supervision
Asbestos containing effluent then pump to the effluent treatment plant for treatment. The treated water will finally be discharged to the river and the collected residual asbestos will be buried in the on-site asbestos pit.
E. Soil
E2. Soil quality
Contamination of soil by
asbestos containing effluent
generated during the water
spray to control airborne
asbestos fiber.
The existing boiler floor has been damaged in many places. The floor requires repair with concrete layer of three inches thickness with slope towards ID fan side.
After proper curing of concrete and finishing, apply a coat of water proofed layer to prevent water seepage through the floor.
On the perimeter of boiler floor, install a side wall of one foot height. After curing, apply water proofed coat to prevent water leakage on nearby area.
On ID fan side of boiler, construct two concrete tanks side by side of size 6 ft x 6 ft x 4 ft. The concrete base as well as all side walls shall be water proofed. One of these tanks shall be connected with proper double valve to collect asbestos laden effluent.
EPC Contractor Health and
Safety Officer,
The Proponent
F. OCCUPATIONAL HEALTH AND SAFETY
F2. Occupational
health and safety
Injuries leading to casualty
or death may be caused
from the wrecking activities
of the boiler as it involves
cutting, grinding, lifting
heavy machineries,
segregating, working at
heights, etc.
Proper health and safety training on how to handle equipments and hazard identification must be provided to the workers before starting with the decommissioning activities.
The health and safety officer will make sure that the equipments and safety control mechanisms are working properly before the workers start their work. If faulty equipments are identified they must be replaced promptly.
An on-site medical team should be available and emergency first-aid kit should be at hand in case of any accidental injuries (burns, cuts, broken bones etc.).
The workers should use the appropriate PPEs and wear appropriate cloths during decommisioning of existing boiler.
Ensure workers hygiene and health status. Conduct
Contractor and
Health and
Safety Officer
OE/EHSU

Environmental Management Plan
9-35
VECs/Issues Environmental
Impacts Mitigation Measures
Institutional Responsibilities
Implementation Supervision
monthly health check up to check their health condition and provide appropriate treatment for any ailments.
The contractors should ensure all type of compliance issues for the workers during the course of the decommissioning and construction process, as per Bangladesh Labour Act, 2006.
G. Solid waste handling and disposal
G1. Hazardous
solid waste
handling
Generation of hazardous
solid wastes from the boiler
decommissioning
containing mostly asbestos
fiber, rock and glass wool in
insulation materials.
Airborne asbestos particles,
rock and glass wool fiber
are harmful for human
health.
At first, asbestos containing waste should be segregated from other solid wate before disposal. The contractor will establish the means to prevent any potentialdispersion outside the designated asbestos disposal area during handling and disposal operations.
Place two layers of polythene sheet, approximately 200 µm (0.2 mm) thick for packaging, in the cargo-carrying compartment of the vehicle.
Place ACM carefully on polythene sheet to a height of less than 1 m and completely wrap the articles. Seal with adhesive tape. Packages should be small enough to be handled easily.
Workers must maintain the integrity of leak-tight containers and/or packaging at all times during the handling and disposal operations.
Minimize the release and exposure of asbestos containing waste after placement in the disposal area without compaction of the waste prior to use of cover.
Finally, in presence of the official of BPDB, the asbestos containing disposal site is to be sufficiently covered to ensure complete coverage of the disposed asbestos and prevent re-exposure during continuing disposal operations. During this operation, the worker must follow the guidelines of OHSAS 18001 for hazardous waste management.
Contractor Health and
Safety Officer,
The Proponent
H. Social impact
H2. Labor
migration
Aggravated risks of
HIV/AIDS and STI due to
the flow of migrant workers.
Create awareness on HIV/AIDS infection and diseases through a well-designed campaign and implementation plan targeting all risk-prone groups
The migrated worker must respect the local customs and
Contractor BPDB

Environmental Management Plan
9-36
VECs/Issues Environmental
Impacts Mitigation Measures
Institutional Responsibilities
Implementation Supervision
rituals
Adopting and carrying out Behavior Change Communication (BCC) among target groups;
Put in place a referral healthcare facility to deal with medical aspects of HIV/AIDS treatment with specialized services;
Diagnose and treat STD/STI and TB through in-house medical facility constituted by the Contractor for workers’ safety;
Serious cases of infection may be referred to specialized treatment facilities;
Empowering women through employment in the construction work;
Frequent medical check-up would also be helpful in controlling the spreading of diseases. Emergency medical services and adequate first aid facilities should always be available at the site.
CONSTRUCTION PHASE
I. ECOSYSTEM
I1. Aquatic habitat
quality
Impact on aquatic habitats,
including benthic habitat,
due to dredging operation
for creating sufficient
navigation channel for ship
carrying heavy plant
equipment.
Dredging operation should be carried out in the route having minimum aquatic habitats. Appropriate benthic survey must be carried out prior to any dredging activities.
The shipping company must ensure that the ship carrying construction materials and other raw materials, obey the appropriate International Maritime Laws.
Contractor OE/EHSU
J. Ambient air
J1. Dust and gases generated from excavation, construction
Emissions of dust and
gases will be generated
from excavation of trenches
for laying gas pipes; RMS,
turbine and HRSG
Casing will be used when buried pipes cross a road. The minimum depth of cover shall be measured from the top of the pipe to the surface of the working grade. Crown materials along the surface of the ground level will not be considered as a part of the
Contractor OE/ESHSU
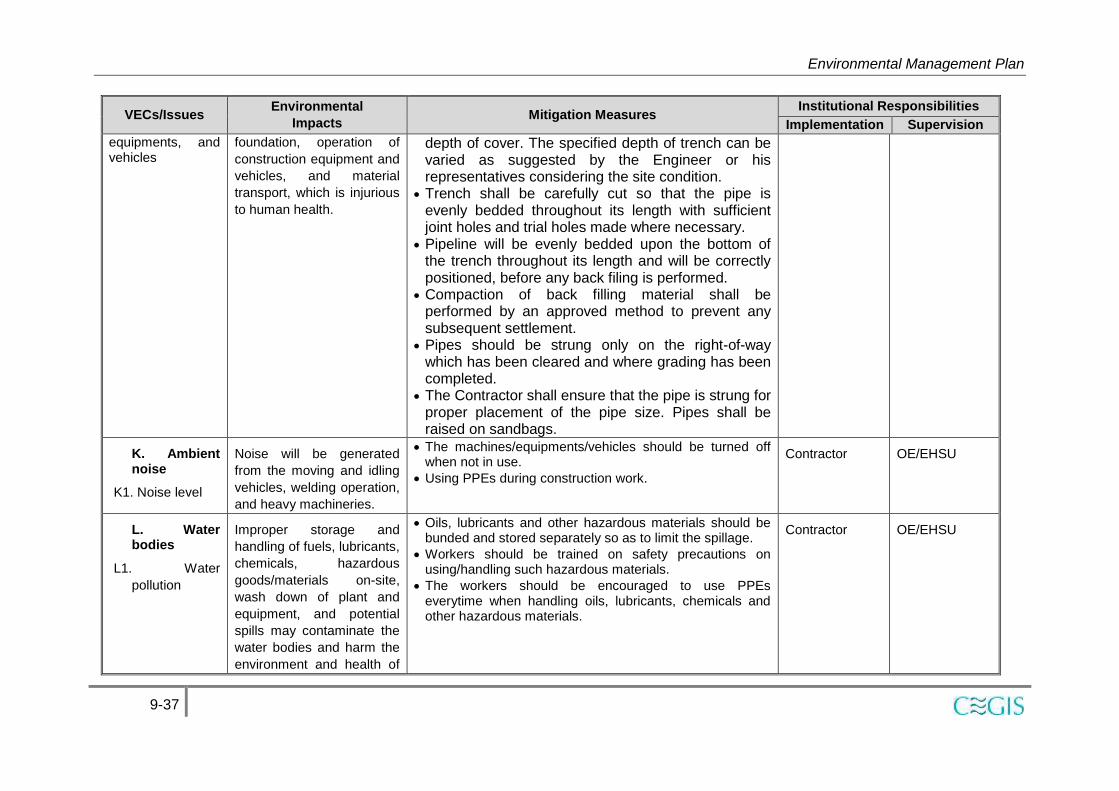
Environmental Management Plan
9-37
VECs/Issues Environmental
Impacts Mitigation Measures
Institutional Responsibilities
Implementation Supervision
equipments, and vehicles
foundation, operation of
construction equipment and
vehicles, and material
transport, which is injurious
to human health.
depth of cover. The specified depth of trench can be varied as suggested by the Engineer or his representatives considering the site condition.
Trench shall be carefully cut so that the pipe is evenly bedded throughout its length with sufficient joint holes and trial holes made where necessary.
Pipeline will be evenly bedded upon the bottom of the trench throughout its length and will be correctly positioned, before any back filing is performed.
Compaction of back filling material shall be performed by an approved method to prevent any subsequent settlement.
Pipes should be strung only on the right-of-way which has been cleared and where grading has been completed.
The Contractor shall ensure that the pipe is strung for proper placement of the pipe size. Pipes shall be raised on sandbags.
K. Ambient noise
K1. Noise level
Noise will be generated
from the moving and idling
vehicles, welding operation,
and heavy machineries.
The machines/equipments/vehicles should be turned off when not in use.
Using PPEs during construction work.
Contractor OE/EHSU
L. Water bodies
L1. Water
pollution
Improper storage and
handling of fuels, lubricants,
chemicals, hazardous
goods/materials on-site,
wash down of plant and
equipment, and potential
spills may contaminate the
water bodies and harm the
environment and health of
Oils, lubricants and other hazardous materials should be bunded and stored separately so as to limit the spillage.
Workers should be trained on safety precautions on using/handling such hazardous materials.
The workers should be encouraged to use PPEs everytime when handling oils, lubricants, chemicals and other hazardous materials.
Contractor OE/EHSU

Environmental Management Plan
9-38
VECs/Issues Environmental
Impacts Mitigation Measures
Institutional Responsibilities
Implementation Supervision
construction workers.
N. Occupational Health and Safety
N1. Health and
safety hazard
Injuries leading to casualty,
or death may be caused
during transportation of
machinery and equipments,
from the ship to site, and
their installation/erection,
lifting heavy materials,
working at heights, etc.
Proper health and safety training on hazard identification
and how to handle hazardous equipments must be
provided to the workers before starting any construction
activities.
The health and safety staffof contractor must ensure that the equipments and safety harness are working properly before the workers start their work. In identification of a faulty equipment, they must be promptly replaced.
An on-site medical team should be set up and emergency first-aid kit should be at hand in case of any accidental injuries (burns, cuts, broken bones etc.).
The workers should use the appropriate PPEs.
Ensure workers hygiene and health status. Conduct monthly health check up to monitor their health condition and provide appropriate treatment for any ailments.
Contractor EHSU
N2. Fire hazards from welding,
Welding operations during
laying of pipeline may
cause fire accidents if
proper care is not taken
All arc welding and cutting operations shall be
shielded by noncombustible or flameproof screens
which will protect welders and other persons working
in the vicinity from the direct rays of the arc.
In addition, the welders should use (i) hand shields to
protect against flashes and radiant energy, (ii) see
his skin is covered completely to prevent burns and
other damage by ultraviolet rays, (iii)Welding helmets
shall be free of leaks and openings, and free of
highly reflective surface, and (iv) welding trucks shall
be equipped with approved fire extinguishers and
first aid.
Contractor OE/EHSU
P. Solid Waste
Poor aesthetic view due to Rubbles generated from the construciton site should be
stored in approriate bins/skips, well-covered and later Contractor Health and

Environmental Management Plan
9-39
VECs/Issues Environmental
Impacts Mitigation Measures
Institutional Responsibilities
Implementation Supervision
Disposal
P1. Storage space
and visual effect
the storage and disposal of
old and used equipments
and materials. Moreover,
spillage and leakage from
improper storage can result
in contamination in soil.
buried in an approved landfill site.
All solid wastes, hazardous and non-hazardous, should be stored in designated sites prior to final disposal
Safety Officer
2. OPERATION PHASE
T. AMBIENT AIR
T1. Maximum
ground level
concentration of
air pollutants
Emission of exhaust gas
from the stack may
contribute elevated ground
level concentration of NOx,
PM2.5 etc. at the downwind
direction.
Introduction of Low-NOx burner in GT machine will reduce NOx emission below 25 ppmv.
High officials of BPDB should take initiative at policy level to limit emission from the adjacent Power Plants (i.e., Aggreko and Max Power Rental).
Agrekko Power Planthas 134 gas generators with stack height of 3 m, which generates excessive emission and het waves to the the nearby communities. The plant requires raise their stacks individually or collectively for reducing the heat wave as well as NOx level to the sensitive receptors.
BPDB EHSU
U. Noise level
U1. Noise
levelinside the
control room,
turbine hall
Hearing complexity and
loss along with increase
blood pressure,
disturbances and
discomfort to the
technicians and workers
and surrounding
communities due to noise
generated from rotator
machineries at exceedance
level.
Install 3 m high brick boundary walls and thick plantation to attenuate noise in the sensitive receptors.
Replace two doors of the control room with proper insulation. Insulation in all other doors and windows in the control room and other workspace to attenuate noise.
The machines/equipments/vehicles should be turned off when not in use.
The turbines, pumps, fans etc. should be covered with soundproof dampeners to limit the spread of noise.
Greenbelts should be developed around the power plant area to limit the spread of noise to the nearby community.
Workers should use appropriate PPEs (soundproof earpiece, mufflers etc.) while working close to noise equipment.
Contractor EHSU
V. Water Sludge generated from the Construction of a leak-proof sump should be made to
BPDB and EHS BPDB and EHS

Environmental Management Plan
9-40
VECs/Issues Environmental
Impacts Mitigation Measures
Institutional Responsibilities
Implementation Supervision
bodies
V1. Pollution of
receiving water
bodies
chemical assisted raw
water at pretreatment and
water treatment plants may
impact groundwater quality
and receiving water bodies
if come in contact to sludge.
store sludge temporarily and limit their spillage. They should then be transferred to sludge treatment plant for treatment.
The sump should be monitored and maintained by on board chemist and technicians and make sure everything (e.g. pollutant content, spill control etc.) goes smoothly
officers officers
Y. Risks and emergency
Y3. Corrosion of gas pipes
Corrosion on the internal
wall of a natural gas
pipeline can occur when the
pipe wall is exposed to
water and contaminants in
the gas, such as O2, H2S,
CO2, or chlorides
Pipe will be coated using 3 layer polyethylenes (3 LPE).
Buried pipes and fittings shall be protected against corrosion by means of external coating and wrapping.
Holiday detector shall be used to detect any holiday and shall be repaired.
Cathodic protection test points shall be installed and connected to temporary cathodic protection facilities in accordance with the specification as the final operation of lowering or tieing-in is in progress.
Conduct inspection after all installation before back-filling.
Contractor OE/EHSU
Y4. Gas compressor fouling
Polymer deposits on
compressor internals which
increases frictional losses
and alters flow pattern and
lead to loss of compressor
efficiency, pressure drop
increase in after coolers,
potential for unbalancing,
rotor, and seal damage.
A cleaning regime in Bangladesh would be a combination of on-line cleaning and semi-annual off-line washing.
Contractor OE/ESHSU
Y5. Gas pipeline leak
Poor tieing-in may cause
leak of significant amount of
gas from the pipe
Separate welded joint sections of the pipeline shall be tied into a continuous system in such a manner that no stress will be induced into the pipe as a consequence of the tieing-in operation.
Contractor OE/ESHSU

Environmental Management Plan
9-41
9.9 Emergency Response Plan
675. An Emergency Response Plan (ERP) is prepared and presented in Chapter 10 and
detailed in Volume 5. Each Contractor after assessing potential emergencies that could be
encountered during construction phase should prepare site specific ERPs (guidance can be
taken from the ERP proposed in this EIA) and include in their Construction Environmental
Action Plan (CEAP). The CEAP will be submitted to the OE for review and approval before
contractor mobilization.
676. The ERP proposed for BWDB identified possible emergency events during
construction and operational phase. The emergencies could be immediate medical
evacuation due to personnel injury, traffic accidents (road), leakage of hazardous materials
(airborne asbestos particles), terrorist events/threats and gas leakage/explosion, kidnap
and/or extortion, bomb threat, pandemic, significant business loss, pollution incident, fire and
explosion, gas leak and structure collapse.
677. The ERP outlines the framework of Emergency Response Strategy which will be
followed by the contractor’s, operation and maintenance staffs of BPDB during
decommissioning, construction, and erection and operation and maintenance phases.
9.10 Budget for EMP
678. The cost of implementing the EMP including monitoring is USD 26.8 million. Details
of EMP and associated costs are given in Table 9-5.

Environmental Management Plan
9-42
Table 9-5: Estimated cost of EMP
Sl Unit Quantity
Unit Rate
(USD)
Amount
(USD)
1
Boiler Decommissioning No 1 4,000,000 4,000,000
Continuous Stack Emission Monitoring System No 1 250,000 250,000
Continuous Effluent Quality Monitoring Instrument No 1 150,000 150,000
Central Water and Effluent Treatment Plant (Included in Cooling Tower System)
Continuous Ambient Air Quality Monitoring Stations No 2 250,000 500,000
Noise attenuation measures LS 1 15,000 15,000
Micro Weather Station No 1 40,000 40,000
Environmental Laboratory No 1 400,000 400,000
New Closed-cycle Cooling Tower System No 1 16,000,000 16,000,000
EHS Staffs of Contractor (3) MM 78 5,000 390,000
Contractor's HIV/AIDS Management LS 59,000
2
Plantation Program 2,828
Emergency Response Plan 2,010,000
3
Boiler Decommissioning (6 months) 40,440
Pre-Construction and Construction (3 years) 475,540
Independent Monitoring (3 years of Operation) 134,563
4
EHS Consultant of Owner's Engineer 942,000
EHS Staffs of EHSU Circle (6 years)1445,112
Capacity Building and Training 131,725
Independent Monitor (Fees) 813,780
Total 26,799,988 Notes:
1 3 years during construction and 3 years during operation
Items
EPC Contract
Environmental Management Plan
Environmental Monitoring
Institutional Arrangements

10-1
10. Risk Assessment and Management
10.1 Introduction
679. This Chapter contains the risk assessment and management strategy concerning
Ghorashal Power Plant (GPS) of the Bangladesh Power Development Board. This risk
assessment and management strategy has been developed as part of the repowering of Unit
4 of GPS from a Steam Turbine to Combined Cycle Power Unit. This strategy is applicable
to decommissioning (currently boiler decommissioning for both Units 3 and 4), construction/
erection of plant equipment, and operation and maintenance stages of the entire GPS.
10.2 Decommissioning Stage
10.2.1 Risk/Hazard Identification
680. The main requirement during decommissioning is the implementation of safety
measures and the receipt of the necessary permits. The potential hazard points during
decommissioning are listed in Table 10-1.
Table 10-1: Hazard identification during the decommissioning stage
Hazard category Hazard points
Mechanical Falling debris or machineries
Fall from heights
Cuts, burns and bruises from handling machineries and equipment, slips and falls
Toxic chemical exposure Inhalation of asbestos dust, glass wool dust, metal rusts and other small dust particles
Failure mode hazard Non-functional equipment
Non-functional safety straps
Non-functional construction pulleys and cranes
Non-functional personal protective equipment (PPEs)
Roads and Highway hazard Road accidents
Rollover of vehicles and machineries
Demolition of properties and structures

Risk Assesment and Management
10-2
10.2.2 Risk/Hazard Management
Onsite
681. The potential on-site hazards and their risk management during decommissioning are presented in Table 10-2.
Table 10-2: Potential hazard, their consequences and suggested mitigation measures during decommissioning process
Event Causes/comment Possible Consequences Prevention/ Protection
Lifting of machineries and equipment’s from tall heights
Use of generators for powering up machineries and equipment
Use of jackhammers, electric drills and welders for dismantling of structures
Improper safety procedures and use of PPEs while dismantling heavy machineries
Mechanical failure of lorries/cranes/ pulleys
Use of improper safety harness/cranes/pulleys in bringing down machineries
Negligence while working.
Faulty structures/equipment/machineries
Unconsciousness of workers.
Injury
Loss of lives
Damage to properties/landscapes.
Regular inspection and maintenance
Dismantling of heavy machineries/structures into smaller portions
Use of PPEs
Asbestos, glass wool dust,
metal rust and other small dust
particles in insulation materials
Improper safety procedures while dismantling heavy machineries containing hazardous material (especially asbestos containing material)
Improper handling of liquid waste containing asbestos and other hazardous materials
Lack of awareness among the workers
Negligence while working.
Impact on environment (e.g., in-terms of airborne asbestos particles, liquid waste) and nearby ecosystem
Injury to workers due to inhalation of toxic dust particles
Skin and eye irritation of the workers due to contact with dust particles.
Regular inspection and maintenance.
Spraying of water using low-pressure sprayer to minimize dust (e.g., airborne asbestos particles) cloud formation.
Collection of liquid waste containing asbestos in a lined collection lagoon and final disposal to on-site hazardous waste disposal site.
Maintaining safety procedures, such as, putting appropriate asbestos warning signs in equipments and areas involved in asbestos removal work.

Risk Assesment and Management
10-3
Event Causes/comment Possible Consequences Prevention/ Protection
Proper training to workers in handling and safe removal of asbestos.
Sealing of asbestos waste in a tightly sealed bag (labeled with appropriate asbestos hazard label) and transport and dispose them in on-site hazardous waste disposal site.
Use of respiratory protective equipments, safety goggles, gloves, footwear and other necessary PPEs during asbestos removal work.
Cutting and welding Electric failure
Equipment failure
Lack of training
Exposure to workers and passerby
Burn injuries
Electric shocks
Injuries to eyes
Proper training on health and safety measures
Proper training on handling equipments for dismantling boilers.
Adoption of welding standard practice
Wearing PPEs during welding activities
Putting up warning signal/danger signs for passerby
Working at heights Faulty safety harness
Negligence towards safety measures
Unconsciousness of workers
Injuries
Loss of lives
Proper training and implementation of health and safety measures
Proper inspection of safety harness before starting work
Use of PPE
Motor vehicle Mechanical failure
Negligence of road and safety guidelines
Driving in a bad health condition
Injuries
Loss of lives
Maintaining traffic safety measures
Regular inspection of

Risk Assesment and Management
10-4
Event Causes/comment Possible Consequences Prevention/ Protection
vehicles/lories/cranes; servicing and maintenance of vehicles
Awareness of warning and hazardous signs.
Inspecting the physical/mental status of drivers.
Off-site
682. The potential off-site hazards and their risk management during decommissioning process are shown in Table 10-3.
Table 10-3: Potential hazard, their consequences and suggested risk management during decommissioning process
Event Cause/comment Possible Consequences Prevention/Protection
Lifting of machineries and equipments from tall heights
Use of generators for powering up machineries and equipment
Use of jackhammers, electric drills and welders for dismantling of structures
Improper safety procedures and use of PPEs while dismantling heavy machineries
Mechanical failure of lorries/cranes/ pulleys
Use of improper safety harness/cranes/pulleys in bringing down machineries
Negligence while working.
Faulty structures/equipment/machineries
Unconsciousness of workers.
Injury
Loss of lives
Damage to properties/landscapes.
Regular inspection and maintenance
Dismantling of heavy machineries into smaller portions.
Covering the boiler area and its peripheral areas with boundaries made of cloth.
Blocking off at least 360 m radial area around the boiler decommissioning zone and putting up warning signal/danger signs to warn passerby
Enlisting security officials to restrict the movement of passerby and residential members during decommissioning stage.
Asbestos and other Improper safety procedures while transporting Impact on environment and Regular inspection and

Risk Assesment and Management
10-5
Event Cause/comment Possible Consequences Prevention/Protection
dust particles and final disposal
Lack of awareness among the workers
Negligence while working.
nearby ecosystem
Passerby and power plant residential members would get exposed to various health problems due to inhalation of toxic dust particles
Irritation to the eyes of the passerby and power plant residential members due to contact with dust particles.
maintenance.
Spraying of water using low-pressure sprayer to minimize dust cloud formation.
Maintaining safety procedures, such as, putting appropriate asbestos warning signs in equipments and areas involved in asbestos removal work; so that worker’s and others are warned.
Prior announcement of decommissioning work to the residents of the neighboring towns and power plant residential area.
Noise from heavy
equipment and
vehicles
Noise from plant equipment and vehicle engines and horns
Mechanical failure
Not following traffic rules
Injuries
Loss of lives
Demolition of public properties and structures
Maintaining traffic safety measures
Regular inspection of vehicles/ lories/cranes; servicing and maintenance of vehicles
Development of a greenbelt to attenuate noise generated from decommissioning activities.
Limit decommissioning work during 8AM to 7PM.

Risk Assesment and Management
10-6
10.3 Construction/Erection Stage
10.3.1 Introduction
683. Leakage of flammable natural gas is a potential hazard associated with the proposed
site. This could cause injury or damage resulting from a fire or explosion incident. The possible
factors involved in such incident are:
- When the pipelines, vessel or equipment fail in a particular mode causing a release. There are several possible causes of failure, the main ones being corrosion and damage by external agents;
- If the released material come into contact with a source of ignition. In some cases this may be heat or sparks generated by mechanical damage while in others, the possible ignition source could include non-flame proof equipment, vehicles, or flames at some distance from the release;
- Depending on the release conditions, including the mass of flammable material involved and how rapidly it got ignited, the results may be a localized fire (for example a jet fire), a flash fire or an explosion of the vapor cloud formed through the release;
- Finally, human dimension of such hazards and degree of risk would be dependent if there is presence of people within the harmful range (consequence distance) of the fire or explosion. Degree of close proximity of people will determine the nature and extent of any injuries or fatalities due to such incidence. Environmental damage from gas fire incidents are generally associated with a failure to control fire water used.
684. Natural gas is a buoyant, flammable gas which is lighter than air (density of air is 1.225
kg/m3 and natural gas is 0.712 kg/m3). On release into the open space the non-ignited gas
tends to disperse rapidly at high altitude. Ignition at the point of release is possible, in which
case the gas would burn as a jet (or torch) flame. On release in an enclosed area (for example
within the gas turbine housing) an explosion or a flash fire is possible.
685. The gas is non-toxic, posing only an asphyxiation hazard. Due to its buoyancy, any
release of credible proportions from operations of this scale, in the open, would not present an
asphyxiation hazard. With standard confined space entry procedures and appropriate security
arrangements to prevent unauthorized access to any of the facilities, the risk associated with
asphyxiation from natural gas should be minimal.
686. Locally, the pressure of the compressed gas may be hazardous in case of an
uncontrolled release. These hazards, would adversely affect people working at the site, but do
not have implications beyond the immediate location of the release unless the released gas is
ignited. Therefore, the risk associated with non-ignited compressed gas does not form part of
the scope of the present risk assessment.
687. This potential risk would however need to be closely managed through job safety
analysis (JSA) and/or other risk assessment practices used by management and operators of
the facility.
688. Other potential hazards are associated with the handling and use of combustible liquids
(i.e., the lubricants used for pumps, compressors, turbines etc.).

Risk Assesment and Management
10-7
689. Minor quantities of flammable acetone (used for cleaning) will also pose a potential fire
hazard.
10.3.2 On-Site Risk Mitigation Measures
690. The Hazard Identification and management program, included in Table 10-4, provides a
summary of the hazardous incidents identified for the GPS and their associated mitigating
features. Each potential location of the Power Station and associated pipelines was assessed to
determine the potentially hazardous scenarios relevant to that location. The potential locations
studied were:
Section 1 -Natural gas lateral supply pipeline to the Power Station boundary
Section 2-Gas receiving station (Regulating Metering Station) and on-site gas transport at the Power Station;
Section 3-Turbine enclosure construction/installation
Section 4- Carbon dioxide (or other asphyxiant fire quenching gas) storage;
Section-5: Whole site (including supply pipeline).
691. Table 10-4 provides an overview of the preventative and protective features proposed
and recommended for the site.

Risk Assesment and Management
10-8
Table 10-4: Location-wise hazard identification and management
Event Cause/Comments Possible Consequences Prevention/ Protection
SECTION 1: Natural Gas Lateral Supply Pipeline (from Gas Pipeline to the Site Boundary)
1. Mechanical impact causes
release of flammable gas.
3rd party involvement digging or
trenching, or other earth work.
Massive release of natural gas
(NG). If ignition, then possibility
of flash or jet fire.
- Gas supply pipeline runs for its
entirety within Ghorashal pipeline
easement.
- Pipe is buried (minimum 750mm
or 450mm in rock)
- Signage along pipe route,
including Dial Before You Dig
information. Drawings available to
Dial Before You Dig.
- Resistance of pipelines to
penetration through use of pipe
thickness and low design factor.
- Rapid shut down from low
pressure trips if massive leak at
pipelines prevents backflow from
Plant and uncontrolled flow from
Gas pipeline.
- Manual shut down (by isolating
manually at the Gas pipeline off-
take point and/or at gas receiving
station.
- NG disperses readily upwards,
minimizing chances of ignition.
Explosion not credible in
unconfined situation.
The risk associated with this
scenario is evaluated
quantitatively.

Risk Assesment and Management
10-9
Event Cause/Comments Possible Consequences Prevention/ Protection
2. Corrosion causes release of
flammable gas.
Damage of pipeline coating due
to excavation inspection damage
leads to corrosion
If ignition, a jet fire is possible. - Cathodic protection for external
corrosion with regular inspections
and testing as per AS2885.
- Internal corrosion virtually absent
with clean hydrocarbon.
- Coating on external surfaces of
pipelines.
- Regular patrolling of pipelines.
Vegetation browning off around
ground leak (lack of oxygen) aid
detection. Further, a small hole
will be sonic – possible detection
through high pitched sound.
- NG disperses readily upwards,
minimizing chances of ignition.
The risk associated with this
scenario will be evaluated
quantitatively.
3. Valve gland nut of flange leak
causes release of flammable
gas.
Maintenance failure at valves.
Wear and tear.
Impact.
Release of natural gas. If
ignition, then possibility of fire.
- Periodic surveillance of pipe and
valve points.
- Valves will be exercised
periodically.
- Gas detectors at valve stations.
- Icing up at leak point improves
detection.
- Valve stations contained on site.
- Minimum number of flanges.
Welded connections wherever
possible.
The risk associated with this

Risk Assesment and Management
10-10
Event Cause/Comments Possible Consequences Prevention/ Protection
scenario will be evaluated
quantitatively.
4. Terrorism / vandalism
damages pipe or valve causing
release of flammable gas.
Terrorism / vandalism Massive release of natural gas. If
ignited, then possibility of flash or
jet fire.
- Terrorism and severe vandalism
is highly improbable in
Bangladesh.
- Buried pipelines and no valve
points at public areas.
- Valve station fenced.
- Regular and periodic
surveillance.
- Intruder detection.
This scenario does not require
further action for this site.
5. Explosion at neighboring
natural gas (Gas) Trunk line
causes damage to gas supply
pipeline.
Failure of maintenance of Trunk
line.
Hot tapping by error.
Massive release of natural gas
(NG). If ignited, then possibility of
flash or jet fire.
- Internal risk management
procedures / systems by pipeline
operators.
- Pipeline integrity plan (incl.
protection, pigging etc. to monitor
integrity of pipeline and coating
inspection).
- 24 hour monitoring of natural gas
and ethane pipelines.
- NG disperses readily upwards,
minimizing chances of ignition.
Explosion not credible in
unconfined situation.
- Buried natural gas Trunk line.
- Thickness and grade of
pipelines.
- Hot tapping is a specialist field

Risk Assesment and Management
10-11
Event Cause/Comments Possible Consequences Prevention/ Protection
with highly trained personnel.
This scenario does not require
further action for this site.
6. Pressure excursion leading to
failure of the pipeline.
Operational error up or
downstream of gas supply
pipeline.
Release of natural gas. If ignited,
then possibility of fire. - The pipelines are to be hydro
tested at a minimum of 1.4 times
the MAOP (maximum allowable
operating pressure).
- The pipelines can operate
against closed head (i.e. the main
valve at the entrance to the site
may be closed).
- 24 hour monitoring of Trunk line
and lateral supply gas pipeline.
- Continuous monitoring of
pressure of the pipelines
supplying natural gas to the power
plant.
- High and low pressures of the
natural gas supply will be
monitored and if required (as
defined in detailed HAZOP),
associated with an automatic trip /
shut down, see Recommendation.
The risk associated with this
scenario will be evaluated
quantitatively.

Risk Assesment and Management
10-12
Event Cause/Comments Possible Consequences Prevention/ Protection
7. Spontaneous loss of integrity
of pipe.
Construction defect or operational
error (repeated)
Massive release of natural gas. If
ignited, then possibility of flash or
jet fire.
- All welds are x-rayed (100%).
- Thickness of pipe material and
temperature cycling make this
scenario highly unlikely.
- Cathodic protection.
- Design for pipelines to prevent
crack propagation.
This scenario does not require
further action for this site.
8. Land subsiding causes
damage to pipe and release of
flammable gas.
Mining activities in area or
earthquake
Release of natural gas. If
ignition, then possibility of flash
or jet fire.
- See Event number 17 and 18
below (for the whole site)
SECTION -2 : Gas Conditioning Station and On-Site Natural Gas Transport at the Power Station
9. Leak of natural gas to
atmosphere from gas pipes on-
site (outside the turbine
housings).
Mechanical impact, weld failure,
operational error corrosion,
sabotage etc.
Release of odorized natural gas.
If ignition source available (or if
ignited at source), then flash fire
or jet fire possible.
- Use of fully welded pipework
wherever possible. Minimize pipe-
runs (pipe lengths). Pipes of
robust design.
- Detectors positioned strategically
at high risk leak areas.
- The use of fusible tubing around
high risk leak piping to be
investigated, see
Recommendation.
- Overpressure protection.
- Communication systems.
- Actuated isolation valve at
receiving station inlet.
- Fire protection system to be
installed, incl. fixed sprinkler or
water/hose system.

Risk Assesment and Management
10-13
Event Cause/Comments Possible Consequences Prevention/ Protection
The risk associated with this
scenario will be evaluated
quantitatively.
10. Venting of gas from process. Maintenance work, shutdown,
flaring.
Release of flammable gas or
heat to process area. Fire
hazard.
- Releases to be piped to safe
area (flare). Vents to elevated
point.
Standard design practices to be
applied.
11. An explosion within piping or
inside a vessel.
Failure of maintenance activities
creates ingress of air into natural
gas piping and vessels and
subsequent start-up without
adequate purging.
Possible explosion. Due to the
limited quantities of gas involved
the effects of the explosion would
however not be expected to pose
a threat to nearby land uses.
- This scenario is only theoretically
possible during start-up, shut-
down and maintenance
operations;
- Piping normally operated at a
positive pressure, preventing
ingress of air;
- Prevention of ingress of air will
be considered throughout the
design and operation of the facility
(for example in the preparation of
start-up, shut-down and
maintenance procedures).
This scenario does not require
further action for this site.
SECTION-3 : Turbine Enclosure Construction/Installation
12. Leak of natural gas to inside
of turbine housing due to failure
of pipe.
Mechanical impact, weld failure,
operational error corrosion,
sabotage etc.
Release of odorized natural gas
(NG). If ignition source available
(or if ignited at source), then
flash fire or jet fire possible.
If confinement sufficient then an
explosion is possible with
- The detailed design of the
turbine housing and associated
equipments need to demonstrate
that explosive situations do not
arise and need to clearly outline

Risk Assesment and Management
10-14
Event Cause/Comments Possible Consequences Prevention/ Protection
overpressure effects and
projectiles.
Due to the limited quantities of
gas involved and the size of the
site, the effects of the explosion
would however not be expected
to pose a threat to nearby land
uses.
the basis of safety used to this
end
- Training of operators and
maintenance workers.
- System put in place to ensure
removal of safety critical functions
is subject to careful scrutiny (see
Recommendation).
- Permit to Work procedures,
including for entry into Confined
Space.
- Emergency procedures and
drills.
The risk associated with this
scenario will be evaluated
quantitatively.

Risk Assesment and Management
10-15
Event Cause/Comments Possible Consequences Prevention/ Protection
13. Leak of natural gas to inside
of turbine housing due to
projectile.
Violent mechanical failure of
rotating machine (compressor,
turbine) creates projectile.
Projectile would be ejected with
high energy.
Personnel hazard if in the
vicinity.
If a gas pipe is hit by the
projectile or associated
equipment / instrumentation then
it may fail, causing gas release
and fire / explosion if ignition
source.
- Preventative maintenance of
rotating machines.
- Vibration monitoring.
- Shut down of machine and repair
if out of alignment.
- Rotating machines to be
designed such that risk associated
with projectile is minimized (gas
pipelines protected or not in
probable line of projectile, people
protected substation and
electricity facility not in direct line
of projectile or protected etc.).
- Buried pipeline is not at risk from
such projectiles.
The risk associated with this
scenario will be evaluated
quantitatively
SECTION-4: Carbon dioxide (or other asphyxiant fire quenching gas) Storage
14. Release of carbon dioxide
(or of other fire quenching
material to be used for fire
protection) into turbine housing.
Leaking cylinders, flanges, pipes
into enclosed area.
Potential asphyxiation of person
inside the enclosed area if
concentrations reach hazardous
levels.
- Small quantities, impact
localized to enclosed area.
- Permit to Work requirements.
- Alarm (visual and audible) inside
enclosed area allowing personnel
escape prior to offloading carbon
dioxide / other fire quenching
material.
The consequences of this
scenario are local only to the
immediate vicinity of the

Risk Assesment and Management
10-16
Event Cause/Comments Possible Consequences Prevention/ Protection
release. No off-site
consequences expected.
SECTION-5: Whole Site (including supply pipeline)
16. Flooding results in process
upsets.
Uncontrolled flooding of site Potential for damage to process /
storage facilities resulting in
release of hazardous material
(particularly natural gas)
- Topography prevents flooding
from any rivers or streams
17. Land subsidence due to
mining activity.
Land subsiding due to mining
activities in area creates failure of
pipes / pipeline resulting in
potential for rupture or massive
leak.
Release of natural gas. If ignited,
then possibility of flash or jet fire. - Thick walled pipe and pipe grade
can withstand considerable plastic
deformation.
- Subsidence issue to be taken
into account during detailed
design, including requirements for
thrust blocks on pipelines to be
over-sized and prevented from
separating from the pipe.
- Pipelines located above ground
where possible.
The risk associated with this
scenario will need to be
addressed through design (i.e.
inherent safety to be
incorporated into the detailed
design)
18. Earthquake results in
process upsets, potential
damage to process / storage
facilities resulting in hazardous
releases.
Earthquake Potential damage to process /
storage facilities resulting in
hazardous releases, fire /
explosion.
- Structures and plant are
designed to withstand earthquake
effects using well-established
procedures in accordance with
relevant national or international
standards.

Risk Assesment and Management
10-17
10.3.3 On-Site Emergency Response Plan
692. Possible emergency events during construction phase could be immediate medical
evacuation due to personnel injury, traffic accidents (road), leakage of hazardous materials
(airborne asbestos particles), civil disturbance/riot, structure collapse, terrorist events/threats
and gas leakage/explosion.
693. An Emergency Response Plan (ERP) is to provide a systematic approach to the
protection of employees, assets and the environment from the impact of serious incidents. It
can be defined as a plan that encompasses organizing, coordinating and implementing a
range of procedures to prevent, mitigate, respond to and recover from the consequences of
an emergency event. The concept is designed to be applied to all incidents, regardless of
nature, severity, or location. Although it is flexible in nature, acceptance and application of
the concept should be viewed as a critical factor in our ability to organize and manage
incident response
694. A well-constructed ERP will prevent a minor incident from becoming a disaster, save
lives, prevent injuries and minimize damage to property and the environment. It facilitates a
rapid and effective emergency response and recovery; provides assistance to emergency
and security services; implements an effective evacuation plan if required and
communicates vital information to all relevant persons involved in the emergency (both
internal personnel and external agencies) with a minimum of delay. It outlines the necessary
resources, personnel, and logistics, which allow for a prompt, coordinated, and rational
approach to an accident. The plan will contain sufficient detail to enable those involved in the
response to effectively carry out their duties.
695. The goals of the ERP are to:
Provide for clear lines of authority and communication during incident and crisis
events;
Provide a means by which trained people and resources are available to those
managing the incident or crisis event.
696. The emergency management strategy and organization structure is defined and
included in Vol. 5: Emergency Response Plan of this EIA report.
10.4 Operation Stage
10.4.1 Consequence Analysis-Onsite and Offsite
Leakage from Gas Pipe Line:
697. Natural gas is a flammable chemical which is enlisted as explosive under the
Explosive Act of 1884 of Bangladesh. The natural gas to be used for the proposed plant
consists of mostly Methane (96% by volume) and ethane, propane, butane and other
alkanes. Though methane is highly flammable gas, its explosion limit is low, 5% - 15%.
Leakage of gas from pipeline and other associated facilities may cause series of hazards. In
the following section potential hazards and consequences are discussed.
698. Presently, gas is supplied from a Titas Gas Transmission & Distribution System
located outside the GPS, nearly at 750 away from the power plant. Gas is supplied by a 16
inch diameter pipeline and a Regulating and Metering Station (RMS) situated at north east
corner of the GPS complex. For the proposed Unit 4, a new RMS with 16 inch dia pipeline

Risk Assesment and Management
10-18
will be installed at the western side of the proposed repowering plant. Leakage from these
Gas supply facilities may lead to series of hazards that may ultimately results in damage of
the property and loss of human life. Table 10-5 lists all identified major potential hazards and
hazard sourcing points related to natural gas during plant operation.
Table 10-5: Potential Hazard Points and Possible Hazards
Hazard Points Possible Hazards Consequences
Regulatory and Metering Station Gas Leak leads to:
Toxic Vapor Cloud
Formation
Vapor Cloud
Explosion
Jet Fire
Limited Space
Explosion
Over Pressure
Explosion
Fire
Poisoning
Suffocation
Damage to Structure
Health Loss
16” Gas Pipeline, valves
699. Leakage from pipeline or RMS may lead a sequential hazard. A pipeline of 1,320m
long, 16 inch diameter will supply gas to the power plant. The gas pipeline may experience
leakage due to any fracture or failure of the pipeline. ALOHA (Areal Locations of Hazardous
Atmospheres) software has been used to simulate the consequence of gas leakage. ALOHA
is a modeling program to estimate threat zones associated with hazardous chemical
releases, including toxic gas clouds, fires, and explosions. The simulation considers that it is
possible to close off the gas supply connection through valve installed at RMS. ALOHA has
been applied to simulate the following sequential hazards
Toxic Area of Vapor Cloud Formation
Flammable Area of Vapor Cloud Formation
Blast Area of Vapor Cloud Formation
700. The basic assumptions on climatic condition, site condition and release conditions
are provided in Figure 10-1. One of the key assumptions is wind direction, which has been
considered as ‘South East’ on the basis of the analysis of the wind rose diagrams provided
in Figure 6-17 in Chapter 6. The windrose indicates that most of the time in a year wind flows
from South East. Wind speed has been considered as 3 m/s. Most of the time in a year wind
speed remains in between 3– 5 m/s (see Figure 6-17) at 10m height. The pipeline area is
surrounded by main plant structure and vegetation that obstruct free flow of wind at 3m
height. Considering this fact, the lower limit of the frequent wind speed range (3 – 5 m/s) has
been considered.
701. Both ends of the gas pipe between plant and RMS is regulated by valves. Both of the
valves are operated by DCS. In ALOHA, it is assumed that the release duration would be 1
minute considering DCS operated valves, pipe length, and possible amount of gas in the
pipe. As the valves are operated by DCS, therefore, 1 minute is enough to shut down the
valve.
702. Simulation of Toxic Area of Vapor Cloud Formation- ALOHA estimates that toxicity
may spread up to 288 m. Death threatening toxicity may spread up to 69 m towards
windward. Figure 10-1 presents the threat zone area of toxic vapor cloud formation. In
addition, Table 10-6 presents a brief summary of the toxicity.

Risk Assesment and Management
10-19
Leakage of Gas
Vapor Cloud Formation
toward windward direction
Ignition & Unconfined vapor
cloud explosion
Jet fire, leading to pressure
rise and weakening of the
Pipe
Limited Explosion: Bursting of pipeline
Fire ball causing shock wave and heat radiation
Toxic Exposure to
Community and
Ecosystem
Sequential Hazard event Likely Consequence
Local Areas of Flame
can occur
Health hazard or
ecosystem damage due
to fire
Life and Health hazard
or ecosystem damage
Property Damage
Figure 10-1: Sequential Hazard Event from a Gas Leakage
Table 10-6: Threat Zone of Vapor Cloud Formation
Items Red Threat Zone
(meter)
Orange Threat Zone
(meter)
Yellow Threat Zone
(meter)
Definition PEC 3: Concentration
<17000 PPM
More than one hour
exposure to this
concentration threats
adverse health effect or
death
PEC 2: concentration <
2900 PPM,
More than one hour
exposure to this
concentration threats
irreversible or other
serious, long-lasting,
adverse health effects
or an impaired ability to
escape
< 1000 PPM,
exposure to this
concentration threats
discomfort, irritation, or
certain asymptomatic,
non-sensory effects
Toxic Area 69 m 167 m 288 m
Note: PAC: Protective Action Criteria
10.4.2 Simulation of Flammable Area of Vapor Cloud Formation
703. The vapor cloud formed from a leakage of a gas pipeline has flammability. ALOHA
has been applied to estimate the possible flammable area of the vapor cloud. The explosion
limit of methane is low, only 5% (LEL) - 15% (UEL). The local area of flame can occur even
though the concentration is below the lowest explosion limit (LEL). ALOHA considers 60% of
the LEL to cause a flame.
704. 60% of the LEL level i.e., 30,000 ppm concentration has been considered as high
threat zone (red) of occurring flame. 30% of LEL i.e., 15,000 ppm concentration has been
considered as moderate threat zone (orange) and 10% of LEL i.e., 5,000 ppm is considered

Risk Assesment and Management
10-20
low threat zone (yellow) of occurring flame. The model estimated the high threat zone might
spread up to 72m. The details of the simulation results are shown in Figure 10-3 and Table
10-7.
Table 10-7: Threat Zone of Flammable Vapor Cloud Formation
Red Threat Zone
(meter)
Orange Threat Zone
(meter)
Yellow Threat Zone
(meter)
Definition LOC: > 30,000 PPM
Which is 60% of the
Lowest Explosion Limit
(LEL) of Methane. LEL
of Methane if
50,000ppm
LOC: > 15,000 PPM
Which is 30% of the
Lowest Explosion Limit
(LEL) of Methane. LEL
of Methane if
50,000ppm
LOC: > 5000 PPM
Which is 10% of the
Lowest Explosion Limit
(LEL) of Methane. LEL
of Methane if
50,000ppm
Toxic Area 72 m 103 m 179 m
Note: LOC: Level of Concern
10.4.3 Simulation of Blast Area of Vapor Cloud Formation:
705. ALOHA defines three Level of concern for classifying threat zones on the basis of
overpressure formed by the shock wave created from blast:
High Threat Zone, 8 psi pressure which is destructive for buildings
Moderate Threat Zone, 3.5 psi pressure serious injury
Low Threat Zone, 1.0 psi pressure that is enough to shatter window glass
706. The model predicts that, the possible blast of the flammable vapor cloud would not
be strong enough to create any pressure above 1 psi to shatter even a window glass.
10.4.4 Simulation of Jet Fire:
707. Methane gas leakage from a pipeline may cause a jet fire if it ignites with fire, come
close proximity to thermal radiation, heat and toxic byproducts. ALOHA software has been
applied for estimating the threat zone of thermal radiation of the possible jet fire. The Figure
10-2 shows the predicted areas of different threat zone and Table 10-8 gives a narrative
summary of the prediction.

Risk Assesment and Management
10-21
a)
Note: Assumptions: Wind Direction SE, Temperature: 390C, Wind Speed 3m/s,
Figure 10-2: Threat Zone of Toxic Vapor Cloud resulted from a Gas Pipeline Leakage

Risk Assesment and Management
10-22
a)
b)
Note: Assumptions: Wind Direction SE, Temperature: 390C, Wind Speed 3m/s,
Figure 10-3: Threat Zone of Flammable Vapor Cloud resulted from a Gas Pipeline
Leakage

Risk Assesment and Management
10-23
a)
b)
Note: Assumptions: Wind Direction SE, Temperature: 390C, Wind Speed 3m/s,
Figure 10-4: Threat Zone of Thermal Heat Radiation of a Jet Fire from gas leak

Risk Assesment and Management
10-24
Table 10-8: Threat Zone of Thermal Heat Radiation of a Jet Fire from gas leak
Red Threat Zone
(meter)
Orange Threat Zone
(meter)
Yellow Threat Zone
(meter)
Definition LOC: 10 kw/m2
Potentially lethal within
60 sec exposure
LOC: 5 /m2
2nd degree burn within
60 sec exposure
LOC: 2 kw/m2
Pain within 60 sec
exposure
Toxic Area 28 m 47 m 76 m
Note: LOC: Level of Concern
708. The simulation of the threat zone (Figure 10-4, b) shows that, the moderate risk zone
(orange threat zone, Table 10-8) of the area of flammable vapor cloud reaches to HFO
storage tank (in case of a gas leak when the wind direction is SE and wind speed is 3 m/s).
However, based on a discussion with GPS officials, it was learnt that HFO tanks are not
operational for long period of time and these will be dismantled by the BPDB. Therefore, no
further risk of explosion of HFO tanks is involved. This dismantling or relocation of the HFO
will mitigate potential risk of explosion.

Risk Assesment and Management
10-25
SITE DATA:
Location: GHORASHAL POWER STATION,
BANGLADESH
Building Air Exchanges per Hour: 0.44 (sheltered double
storied)
Time: May 11, 2015 1632 hours ST (user specified)
CHEMICAL DATA:
Chemical Name: METHANE Molecular Weight:
16.04 g/mol
PAC-1: 2900 ppm PAC-2: 2900 ppm PAC-3: 17000
ppm
LEL: 50000 ppm UEL: 150000 ppm
Ambient Boiling Point: -161.5° C
Vapor Pressure at Ambient Temperature: greater than 1
atm
Ambient Saturation Concentration: 1,000,000 ppm or
100.0%
ATMOSPHERIC DATA: (MANUAL INPUT OF DATA)
Wind: 3 m/s from SE at 3 m height (refer Figure 6-18)
Ground Roughness: urban or forest Cloud Cover: 3
tenths
Air Temperature: 39° C Stability Class: D
No Inversion Height Relative Humidity: 75%
SOURCE STRENGTH:
Flammable gas escaping from pipe (not burning)
Pipe Diameter: 16 inches Pipe Length: 132
meters
Unbroken end of the pipe is closed off
Pipe Roughness: smooth Hole Area: 201 sq in
Pipe Press: 30 atmospheres Pipe Temperature:
39° C
Release Duration: 1 minute
Max Average Sustained Release Rate: 5.18
kilograms/sec
(Averaged over a minute or more)
Total Amount Released: 311 kilograms
THREAT ZONE:
Model Run: Gaussian
Red : 69 meters --- (17000 ppm = PAC-3)
Orange: 167 meters --- (2900 ppm = PAC-2)
Yellow: 288 meters --- (1000 ppm)
THREAT AT POINT:
Concentration Estimates at the point:
Downwind: 272 meters Off Centerline: 161
meters
Note: Concentration not drawn because there is no
significant concentration at the point selected.
SITE DATA:
Location: GHORASHAL POWER STATION,
BANGLADESH
Building Air Exchanges per Hour: 0.44 (sheltered double
storied)
Time: May 11, 2015 1632 hours ST (user specified)
CHEMICAL DATA:
Chemical Name: METHANE Molecular Weight:
16.04 g/mol
PAC-1: 2900 ppm PAC-2: 2900 ppm PAC-3: 17000
ppm
LEL: 50000 ppm UEL: 150000 ppm
Ambient Boiling Point: -161.5° C
Vapor Pressure at Ambient Temperature: greater than 1
atm
Ambient Saturation Concentration: 1,000,000 ppm or
100.0%
ATMOSPHERIC DATA: (MANUAL INPUT OF DATA)
Wind: 3 m/s from SE at 3 m height
Ground Roughness: urban or forest Cloud Cover: 3
tenths
Air Temperature: 39° C Stability Class: D
No Inversion Height Relative Humidity: 75%
SOURCE STRENGTH:
Flammable gas escaping from pipe (not burning)
Pipe Diameter: 16 inches Pipe Length: 132
meters
Unbroken end of the pipe is closed off
Pipe Roughness: smooth Hole Area: 201 sq in
Pipe Press: 30 atmospheres Pipe Temperature:
39° C
Release Duration: 1 minute
Max Average Sustained Release Rate: 5.18 kilograms/sec
(Averaged over a minute or more)
Total Amount Released: 311 kilograms
THREAT ZONE:
Threat Modeled: Flammable Area of Vapor Cloud
Model Run: Gaussian
Red : 72 meters --- (30000 ppm = 60% LEL = Flame
Pockets)
Orange: 103 meters --- (15000 ppm)
Yellow: 179 meters --- (5000 ppm = 10% LEL)
SITE DATA:
Location: GHORASHAL POWER STATION,
BANGLADESH
Building Air Exchanges per Hour: 0.44 (sheltered
double storied)
Time: May 11, 2015 1632 hours ST (user specified)
CHEMICAL DATA:
Chemical Name: METHANE Molecular
Weight: 16.04 g/mol
PAC-1: 2900 ppm PAC-2: 2900 ppm PAC-3:
17000 ppm
LEL: 50000 ppm UEL: 150000 ppm
Ambient Boiling Point: -161.5° C
Vapor Pressure at Ambient Temperature: greater than
1 atm
Ambient Saturation Concentration: 1,000,000 ppm or
100.0%
ATMOSPHERIC DATA: (MANUAL INPUT OF DATA)
Wind: 3 m/s from SE at 3 m height
Ground Roughness: urban or forest Cloud Cover: 3
tenths
Air Temperature: 39° C Stability Class: D
No Inversion Height Relative Humidity:
75%
SOURCE STRENGTH:
Flammable gas is burning as it escapes from pipe
Pipe Diameter: 16 inches Pipe Length: 132
meters
Unbroken end of the pipe is closed off
Pipe Roughness: smooth Hole Area: 201 sq
in
Pipe Press: 30 atmospheres Pipe
Temperature: 39° C
Flame Length: 32 meters Burn Duration: 20
seconds
Burn Rate: 631 kilograms/sec
Total Amount Burned: 311 kilograms
THREAT ZONE:
Threat Modeled: Thermal radiation from jet fire
Red : 28 meters --- (10.0 kW/(sq m) = potentially
lethal within 60 sec)
Orange: 47 meters --- (5.0 kW/(sq m) = 2nd degree
burns within 60 sec)
Yellow: 76 meters --- (2.0 kW/(sq m) = pain within 60
sec)
Model set up for simulating Toxic
Area of Vapor Cloud Formation
Mode Setup for simulating Flammable
Area of Vapor Cloud Explosion Model Setup for simulating
Thermal Radiation from Jet Fire

Risk Assesment and Management
10-26
Figure 10-5: The basic assumptions on climatic condition, site condition and release
conditions
10.4.5 Emergency Response Plan- Onsite and Offsite
709. Possible emergency events during operational phase could be immediate medical
evacuation due to personnel injury, kidnap and/or extortion, bomb threat, pandemic,
significant business loss, pollution incident, fire and explosion, gas leak and structure
collapse.
Emergency Management Strategy
710. This ERP during operation is intended to provide information, strategies and
procedures relating to all aspects of emergency management which comprise:
a. Prevention of emergencies,
b. Preparation for emergencies.
c. Response to an emergency. and
d. Recovery following an emergency.
Emergency Management Organization
The Incident Response Team (IRT)

Risk Assesment and Management
10-27
711. The Incident Response Team (IRT), based at Ghorashal plant location, is trained and
responsible for dealing with all envisaged incidents and emergency situations which may
occur at the location. Where additional support in the way of resources and advice may be
required by the IRT at a remote location this will be requested through and provided by the
Emergency Response Group (ERG) of Dhaka Office. On all occasions when an IRT is
mobilized due to an incident or emergency situation the ERG Manager must be notified
immediately.
712. The IRT is chaired by the Plant Manager and includes senior staff from the Human
Resources (HR), Health Safety Environment (HSE) and Logistics department within the
plant.
713. The IRT is responsible for monitoring the safety of the repowering of existing plant
and coordinating and responding to all emergency events during the decommissioning and
construction of combine unit and directly report to the ERG Manager.
The Emergency Response Group (ERG)
714. The Emergency Response Group (ERG) is based in the BPDB Head Office in
Dhaka, and is responsible for providing tactical response, support, assistance and advice to
all incident and emergency situations at site/location and for providing operational response
to any emergency situation which may occur. This plan describes how the ERG should
handle both the "technical" crises e.g. fire, explosion, oil spill, and "social" crises e.g. illness,
injury, kidnap, civil unrest. On all occasions that the ERG is mobilized due to an incident or
emergency situation the Incident Response Chair must be notified immediately.
715. The function of the ERG is to coordinate and oversee arrangements to ensure that
the IRT meets its emergency management obligations. The Chief Engineer of Power Station
Construction of BPDB will be the Chair of the ERG and will nominate an Emergency
Response Coordinator to coordinate with representatives from various agencies and also
senior staff from HR, Finance, HSE, Logistic, Security, IT, and public affairs department
within the BPDB.
The Incident Management Team (IMT)
716. The Incident Management Team (IMT) is the corporate body located in the BPDB
headquarters in Dhaka, with the responsibility to define and control strategy for major
incidents. A strategic response is defined as a situation arising from a single or multiple
incidents or emergencies that escalate to a point beyond which significant damage to the
Company’s business could result, including commercial and reputation damage, significant
financial loss, shareholders’ loss of confidence and damages resulting from litigation. When
a potential strategic situation appears the IMT will be mobilized to manage issues pertaining
to the reputation and the continued commercial wellbeing of the Company. The IMT may
however also be called upon to address some of the tactical roles that would normally be the
responsibility of the ERG, for example, if the Dhaka Office were out of action or in the event
of an evacuation from a country, which may equally limit the ERG’s capability.
717. The IMT is chaired by the Member-Generation of BPDB and includes high level
representation from the Ministry of Power, Energy and Mineral Resources, Army, Police
Department, Fire Department, District Commissioner’s Office and the Disaster Management
Bureau (DMB) of the Bangladesh Government.

Risk Assesment and Management
10-28
718. The detailed Emergency Response Plan is prepared separately and included in Vol.
5 of this EIA.

11-1
11. Environmental Monitoring Plan
11.1 Monitoring Plan
719. A three tier monitoring program has been proposed comprising compliance
monitoring, impact monitoring, and external or independent monitoring, as the key elements
of the EIA. The main purpose of this monitoring program is to ensure that the various tasks
detailed in the environmental management plan, particularly the mitigation measures are
implemented in an effective manner, and also to evaluate project’s impacts on the key
environment and social parameters. Various types of monitoring are presented in the
following sections and the locations of monitoring are presented in Figure 11-1.
11.1.1 Compliance Monitoring
720. Compliance monitoring is a very important aspect of environmental management to
safeguard the protection of environment. The compliance monitoring plan is presented in
Table 11-1. The monitoring will comprise surveillance to check whether the contractor is
meeting the provisions of the contract during construction and operation of the Project
including the responsible agencies for implementation and supervision.
721. For monitoring of physico-chemical parameters, any location near the baseline
sampling points is suggested. Actual monitoring time and location will be decided by OE and
BPDB. The Contractor will be responsible for carrying out, or contracting to an approved
third party, the monitoring of all the parameters as required frequency as shown in the table
by his own cost during the construction phase. The measurement values are to be
compared with the WBG’s General EHS Guidelines, where relevant standards are specified,
or the national standards (Environmental Conservation Rules, 1997 and amended in 2005),
where WBG’s General EHS guidelines do not provide a specific parameter or value, for
compliance.
11.1.2 Impacts Monitoring during Construction
722. The purpose of the impacts monitoring is to ensure that the contractor implements
the mitigation measures given in the EMP effectively and implements timely. This
monitoring will generally be carried out by the Owners Engineer (OE) with the help of
checklists prepared on the basis of the impact monitoring Plan (Table 11-2).
11.1.3 Independent/External Monitoring
723. The BPDB will engage an independent organization to monitoring of the EMP
implementation. The main purpose of the Independent monitoring will be to ensure that all
key entities including EHSU, Owner’s Engineer, and contractors are effectively and
adequately fulfilling their designated role for EMP implementation, and that all the EMP
requirements are being implemented in a timely and effective manner. The ToR of the
Independent monitor is presented in Annex 11-1.

Environmental Monitoring Plan
11-2
Figure 11-1: Locations of monitoring

Environmental Monitoring Plan
11-3
Table 11-1: Environmental Compliance Monitoring Plan
Sl no Components of
EHS Monitoring
Monitoring
Indicators Locations Frequency
Type/Duration of
Sampling
Implemented by
Monitoring Supervision
1. Boiler Decommissioning
1.1. Air Quality Asbestos Dust,
Fiber
Two Samples:
100 m downwind and
upwind of the Confined
area for Boiler
Decommissioning
Weekly 24hr Contractor OE, BPDB
1.2. Soil Quality
Pb, Cd, Cr, Cu,
Zn, Mn, As, Se
Hg, and oil/grease
Soil surrounding of
boiler area, asbestos
disposal area
Bi-annual Composite Sampling Contractor OE, BPDB
1.3. Water Quality
Oil and Grease,
Total Residual Cl,
alkalinity,
Ammonium
Nitrogen, Free
Ammonia, Total
Cr, Fe, Ca, Zn,
Cu, etc.
Water bodies and
nearby Tube well (if
any)
Bi-annual Grab Sampling Contractor OE, BPDB
1.4. Noise LAeq, L10, L90
7 locations in and
around GPS as
mentioned in Figure
11- 1
Twice
Weekly
Three Sample during
day time and one
sample during night,
15 min sampling each
time.
Contractor OE, BPDB
1.5. Occupational health
and Safety
Noise (LAeq)
Two Location:
Construction site
Labor Shed
Weekly
Three Sample during
day time and one
sample during night,
15 min sampling each
time.
Contractor OE, BPDB
Use of PPEs and
practice of Safety
Procedure
Employers involved in
Boiler
Decommissioning
activities
Daily
Purposive Sampling
from Employers
involved in Boiler
Decommissioning
Contractor OE, BPDB

Environmental Monitoring Plan
11-4
Sl no Components of
EHS Monitoring
Monitoring
Indicators Locations Frequency
Type/Duration of
Sampling
Implemented by
Monitoring Supervision
activities
Health Checkup Monthly Contractor OE, BPDB
2. Environmental Monitoring during Pre-construction and Construction Phase
2.1. Ambient Air Quality
NOx, SOx, SPM,
PM10, PM2.5, CO,
O3
a. 1.5km North-westward of the Plant
b. 1.5 km South-eastward of the plant
Twice
Weekly 24 hour Contractor OE, BPDB
2.2. Ambient Noise
Day time (6:00 –
21:00) and Night
time (21:00 –
6:00) L10, L90
7 locations in and
around GPS as
mentioned in Figure
11-1
Twice
Weekly
Three Sample during
day time and one
sample during night,
15 min sampling each
time.
Contractor OE, BPDB
2.3. Water Quality
pH, TSS, TDS, Oil
and Grease, Total
Residual Cl, Total
Cr, Fe, Ca, Zn,
Pb, Cd, Hg, As,
total alkalinity,
Ammonium
Nitrogen, Free
Ammonia, BOD5,
COD, EC
Temperature
outside the mixing
zone, etc.
a. At the point of effluent discharge
b. 500m u/s of the discharge point
c. 500m d/s of the discharge point
Bi-monthly Grab Sampling Contractor OE, BPDB
2.4. Ecosystem and
Biodiversity
Plant Growth,
Canopy
Coverage,
Disease, etc.
Green belt area within
GPS Complex
Yearly Plot Survey Contractor OE, BPDB
Tree felling Construction Site,
Stack Yards Monthly Direct Counting Contractor OE, BPDB
2.5. Fish Diversity and Diversity Index, River reach 1: Three Quarterly Fish Catch Contractor OE

Environmental Monitoring Plan
11-5
Sl no Components of
EHS Monitoring
Monitoring
Indicators Locations Frequency
Type/Duration of
Sampling
Implemented by
Monitoring Supervision
Composition Richness,
Composition,
Habitat Suitability
Index, etc.
(3) km reach u/s of the
intake point
River reach 2: Three
(3) km reach d/s of the
discharge point
Assessment, Fishers’
interview
2.6. Agricultural
Production
Crop Production
Loss
Five locations: Two
locations at Khanpur;
One at Jamalpur, one
at ChhotaTaragaon,
and one at Palash.
Six monthly
following
cropping
patterns
Agricultural Survey Contractor OE
2.7. Occupational Noise LAeq
Two locations:
Construction site,
Labor shed
Twice
weekly
Three Sample during
day time and one
sample during night,
for noise 15 min
sampling each time.
by using: ANSI Type II
Noise Meter, and
vibration meter
Contractor OE
2.8. Exposure to Electro-
magnetic Field43
Electrical Field,
Magnetic Field
Outside the safety
fence of Substation,
Power evacuation bay,
along HV line
Quarterly One time sampling
using EMF meter Contractor OE
2.9. Health and
Sanitation
Availability of
Potable Water,
Drinking water
quality,
Availability of
Hygienic Toilet
Power Plant Complex Monthly
Inspection and
interview of labor,
project personnel
Contractor OE
2.10. Community Health,
Safety and Security
Implementation of
EMP
As specified in the
EMP Quarterly
Inspection and
interview of labor, Contractor OE
43 See Annex 11-2 for the standards related to electro-magnetic field.

Environmental Monitoring Plan
11-6
Sl no Components of
EHS Monitoring
Monitoring
Indicators Locations Frequency
Type/Duration of
Sampling
Implemented by
Monitoring Supervision
project personnel
followed by a checklist
3. Environmental Monitoring During Operation
3.1. Physical Environment
Stack Emission NOx Stack Continuous Continuous ESHSU
/GPS
Independent
Monitor/
BPDB
Ambient Air Quality
NOx, SOx, SPM,
PM10, PM2.5, CO,
O3
1. 1.5km North-westward of the Plant
2. 1.5 km South-eastward of the plant
Continuous 24 hour ESHSU/
GPS
Independent
Monitor/
BPDB
Ambient Noise
Day time (6:00 –
21:00) and Night
time (21:00 –
6:00) LAeq, L10,
L90
1. Housing colony 2. Township Area 3. Fertilizer Factory
(Outside Boundary)
4. Nearest Community
Monthly
Three Sample during
day time and one
sample during night,
15 min sampling each
time.
ESHSU/GP
S
Independent
Monitor/
BPDB
Gas flow
measurement
(a) The water dew
point, and (b) The
HC dew point
Regulating and metering station
Monthly Gas chromatographic
analysis ESHSU
Independent
Monitor/
BPDB
Leak detection Along corridors to
locate secondary
indicators and
walking the
corridor with a
“sniffer”
RMS and pipeline corridor
Every 3-5
years
Visual Observation for
stressed vegetation
and with a “sniffer” ESHSU
Independent
Monitor/
BPDB
Meteorology
Temperature,
Rainfall, Humidity,
Evaporation, Sun
shine hour, wind
Plant Area Continuous Continuous GPS
Independent
Monitor/
BPDB

Environmental Monitoring Plan
11-7
Sl no Components of
EHS Monitoring
Monitoring
Indicators Locations Frequency
Type/Duration of
Sampling
Implemented by
Monitoring Supervision
speed, wind
direction
Effluent (Waste
Water)
pH, TSS, TDS,
Temperature, EC
Effluent Discharge
Channel
Continuous Continuous GPS
Independent
Monitor/
BPDB
Oil and grease,
Total Residual Cl,
Cu, Fe, Zn, Pb,
Cd, Hg, As, COD,
BOD
Effluent Discharge
Channel
Weekly Grab Sampling GPS
Independent
Monitor/
BPDB
Storm Water As above Combined Discharge
Channel Monthly Grab Sampling GPS
Independent
Monitor/
BPDB
Water Quality:
Surface Water
pH, TSS, TDS, Oil
and Grease, Total
Residual Cl, Total
Cr, Fe, Ca, Zn,
Pb, Cd, Hg, As,
total alkalinity,
Ammonium
Nitrogen, Free
Ammonia, BOD5,
COD, EC ,
Temperature
outside the mixing
zone, etc.44
1. At the point of effluent discharge
2. 500m u/s of the discharge point
3. 500m d/s of the discharge point
Monthly Grab Sampling GPS
Independent
Monitor/
BPDB
Water Quality:
Ground Water
pH, Total
Hardness, Color,
Cl, Total Coliform,
Plant Area Monthly Grab Sampling GPS
Independent
Monitor/
BPDB
44 These monitoring parameters will be revised after monitoring the effluent water quality from the discharge channel. Some parameters might become redundant
if the effluent water does not contain them.

Environmental Monitoring Plan
11-8
Sl no Components of
EHS Monitoring
Monitoring
Indicators Locations Frequency
Type/Duration of
Sampling
Implemented by
Monitoring Supervision
F, Fe, Mn, As,
PO4, SO4, etc.
3.2. Waste Generation and Management
Generation of Non
Hazardous Solid
Waste (Domestic
waste, Office
Waste,)
Types and
Quantity,
Characteristics
Waste Disposal Point Quarterly Visual Inspection,
waste classification IM GPS/ BPDB
Generation of
Hazardous Solid
Waste
Types and
Quantity,
Characteristics
Waste Disposal Point,
Waste Generation
Sources
Quarterly Visual Inspection,
waste classification IM GPS/ BPDB
Generation of
Hazardous Liquid
Waste, Sludge
(return from Water
Treatment Plant,
Sludge from clarifier,
neutralization pond)
Quality of Water
in effluent pit e.g.,
corrosivity,
reactivity.
Hazardous Liquid
Waste and Sludge
Disposal site (i.e.
effluent pit)
Quarterly Visual Inspection,
waste classification IM GPS/ BPDB
Waste Management
Condition of
waste bins, waste
transportation
vans,
N/A Quarterly Visual inspection and
document checking IM GPS/ BPDB
Capacity of Waste
Disposal Site Waste Disposal Point Quarterly
Visual inspection and
document checking IM GPS/ BPDB
leaks, drips or
other indications
of waste spill
during handling
and transporting
From Waste
generation to disposal
site
Quarterly Visual inspection, and
document checking IM GPS/ BPDB
Hazardous Waste
Management
Labeling of
Hazardous
Materials,
hazardous waste,
Chemical Storage,
Hazardous Material
Storage area,
Hazardous Waste
Quarterly Visual inspection, and
document checking IM GPS/ BPDB

Environmental Monitoring Plan
11-9
Sl no Components of
EHS Monitoring
Monitoring
Indicators Locations Frequency
Type/Duration of
Sampling
Implemented by
Monitoring Supervision
documentation of
hazardous
chemical use, etc.
Disposal Area.
3.3. Ecosystem and Biodiversity
3.3.1. Plant Health
Plant Growth,
Canopy
Coverage,
Disease, etc.
1. Proposed Green belt area near neutralization Pond
2. Proposed Greenbelt area near Asbestos Disposal Site
3. Other Greenbelt area in GPS Complex
Yearly
Proposed Greenbelt
area around the
Neutralization pond
and asbestos disposal
site: Whole area
Survey
Other Vegetative area
in GSP:
Four Plots of 25m X
25m (one plot at each
corner of GSP
Complex )
Plot Survey
IM GPS/ BPDB
3.3.2. Occurrence of
Wildlife
Species
Composition and
Status
Same as above Six monthly Same as above IM GPS/ BPDB
3.3.3. Fish Diversity and
Composition
Diversity Index,
Richness,
Composition,
Habitat Suitability
Index, etc.
River reach 1: Three
(3) km reach u/s of the
intake point
River reach 2: Three
(3) km reach d/s of the
discharge point
Quarterly GPS IM GPS/ BPDB
3.4. Land and Agricultural Resources
3.4.1. Land use and Land
Cover change
Land cover and
Land use
5km buffer area of the
plant
Once in
three years
Satellite Image (5km
buffer area of GPS)
Analysis
IM GPS/ BPDB
3.4.2. Agricultural
Production
Crop Production
Loss
Agricultural land
around the GPS
complex
Yearly
Farmers’ Interview,
Secondary Data from
DAE
IM GPS/ BPDB

Environmental Monitoring Plan
11-10
Sl no Components of
EHS Monitoring
Monitoring
Indicators Locations Frequency
Type/Duration of
Sampling
Implemented by
Monitoring Supervision
3.5. Occupational Health and Safety
3.5.1. Occupational Noise
and vibration
LAeq, L10, L90,
Noise Exposure
a. Inside Plant Area (Turbine hall, RMS, etc.)
b. Control room c. Administrative
building
Quarterly
Three Samples during
day time and one
sample during night,
for noise 15 min
sampling each time.
by using: ANSI Type II
Noise Meter
Inspection of record of
shifting hour, workers’
roster
GPS
Independent
Monitor/
BPDB
3.5.2. Exposure to Electro-
magnetic Field
Electrical Field,
Magnetic Field
Outside the safety fence of Substation, Power evacuation bay, other EHV area
Quarterly
Measurement by EMF
Meter
Inspection of workers’
roster shifting hours
etc.
GPS
Independent
Monitor/BPD
B
3.5.3. Worker Health
General Health
Condition,
Hearing health,
skin disease, etc.
Workers involved in the Plant operation and maintenance
Quarterly Health Check up IM GPS/ BPDB
3.6. Labor and Working Condition
3.6.1.
Health and
Sanitation
Availability of
Potable Water Power Plant Complex Monthly
Visual Inspection and
Record Checking IM GPS/ BPDB
Drinking water
quality (pH, TS,
EC, F, Cl, As, Mn,
Fe, Total
Hardness, Total
Coliform, PO4,
SO4)
Water Supply System Monthly
Three samples from
Drinking water supply
system
IM GPS/ BPDB
Availability of
Hygienic Toilet
Office Building,
Township Area, Monthly Visual Inspection IM GPS/ BPDB

Environmental Monitoring Plan
11-11
Sl no Components of
EHS Monitoring
Monitoring
Indicators Locations Frequency
Type/Duration of
Sampling
Implemented by
Monitoring Supervision
Common Places, etc.
3.7. Community Health, Safety and Security
3.7.1. Community Health
Status of
Communicable
Diseases Township Area,
Nearest Community
Two times
in a year
Inspection of Disease
Profile/Records in
Health Camps/Clinic in
GPS, nearby area
Hospital
IM
IM
GPS/ BPDB
GPS/ BPDB Status of Vector
Borne Diseases
3.7.2. Safety and Security
Emergency
Preparedness and
Response of GPS
N/A Two times
in a year
Visual Inspection and
Record Checking IM GPS/ BPDB
Community
Relation Program/
Community
Awareness
Program, Training
N/A Two times
in a year IM GPS/ BPDB
3.8. Measures beyond compliance
3.8.1. Social Development
Program
Number of
benefited
person/family
Nearest Community Two times
in a year
Inspection of
Documents, records IM GPS/ BPDB
3.8.2. Sustenance of
irrigation network
Number of
additional
hacterage of
farmland
Nearest Community Two times
in a year
Visual Inspection and
record checking IM GPS/ BPDB
3.8.3. HealthCare/Develop
ment Program
Number of
benefited
person/family
Nearest Community Two times
in a year
Inspection of
Documents, records IM GPS/ BPDB
3.8.4. Other Aid to
Community
Number of
benefited
person/family
Nearest Community Two times
in a year
Inspection of
Documents, records IM GPS/ BPDB

Environmental Monitoring Plan
11-12
Table 11-2: Impact Monitoring Plan
Parameter /
Activity Location
Means of
Monitoring Frequency
Responsible Agency
Implemente
d By
Supervised
By
Boiler Decommissioning
Removal of
insulation
materials
containing
asbestos
Boiler, steam
pipes and its
surrounding
area
Visual inspection to
see whether the
polythene sheet
cladding are used
to arrest stray
asbestos dust
Twice
Weekly Contractor
OE/Independe
nt Monitor
Visual inspection to
ensure that the
concrete water
proofed bund are
installed and they
are working
effectively
Twice
Weekly Contractor
OE/Independe
nt Monitor
Visual inspection to
ensure that
barricaded GI
sheets are installed
to physically isolate
the boiler and
gated with security
staff so that
unauthorized entry
is restricted
Twice
Weekly Contractor
OE/Independe
nt Monitor
Visual inspection to
ensure that
asbestos fibers
appear in the air
are removed by
manually operated
water spray to
minimize spreading
of asbestos fibers
in atmosphere.
Twice
Weekly Contractor
OE/Independe
nt Monitor
Visual inspection to
ensure that
asbestos fibers
appear in the air
are removed by
manually operated
water spray to
minimize spreading
of asbestos fibers
in atmosphere.
Weekly Contractor OE/Independe
nt Monitor
During Construction
Hydrocarbon
and
chemical
Construction
camps
Visual Inspection of
storage facilities Monthly Contractor
OE/Independe
nt Monitor

Environmental Monitoring Plan
11-13
Parameter /
Activity Location
Means of
Monitoring Frequency
Responsible Agency
Implemente
d By
Supervised
By
storage
Damage to
local roads
Approach
Roads to the
construction
sites
Visual inspection to
ensure local roads
are not damaged Monthly Contractor
OE/Independe
nt Monitor
Traffic
Safety
Haul Roads Visual inspection to
see whether proper
traffic signs are
placed and flag-men
for traffic
management are
engaged
Monthly Contractor OE/Independe
nt Monitor
Air Quality
(dust, -
smoke)
Construction
sites
Visual inspection to
ensure good
standard equipment
is in use and dust
suppression
measures (e.g.,
spraying of waters)
are in place.
Daily Contractor OE/Independe
nt Monitor
Batch mixing
Plant
Visual inspection to
ensure batch plant is
located >500 m from
residential areas
Monthly Contractor OE/Independe
nt Monitor
Material
storage sites
Visual inspection to
ensure dust
suppression work
plan is being
implemented
Monthly Contractor OE/Independe
nt Monitor
Noise Construction
sites
Physical inspection to
ensure good
standard equipment
are in use;
Twice
Weekly Contractor
OE/Independe
nt Monitor
Construction
sites
Visual inspection to
ensure ear plugs are
in use by the
construction workers
Twice
Weekly Contractor
OE/Independe
nt Monitor
Ensure work
restriction between
20:00-06:00 close to
the sensitive
locations
Twice
Weekly Contractor
OE/Independe
nt Monitor
Plantation Designated
sites
Visual inspection to
observe growth of
saplings around
neutralization pond
and asbestos
Monthly Contractor OE/Independe
nt Monitor

Environmental Monitoring Plan
11-14
Parameter /
Activity Location
Means of
Monitoring Frequency
Responsible Agency
Implemente
d By
Supervised
By
disposal site
Waste
Management
Construction
camps
Visual inspection that
solid waste is
disposed at
designated site
Solid Wastes are
managed in efficient
way
Monthly Contractor OE/Independe
nt Monitor
Hazardous
Waste
Handling
Hazardous
Material
Storage Area
Hazardous
Waste Disposal
Area
Visual Inspection of
safe handling and
storage of hazardous
waste and hazardous
materials
Monthly Contractor OE/Independe
nt Monitor
Drinking
water and
sanitation
Camps, offices Ensure the
construction workers
are provided with
potable water and
sanitation facilities in
the site
Weekly Contractor OE/Independe
nt Monitor
Cultural and
archeologica
l Sites
At all work sties
Visual observation for
chance finds
Daily
Contractor
OE,Independe
nt Monitor,
BPDB
Restoration
of Work
Sites
All Work Sites
Visual Inspection After
completion
of all
works
Contractor
OE,
Independent
Monitor,
BPDB
Safety of
workers
Monitoring
and
reporting
accidents
At work sites Usage of Personal
Protective equipment,
Safety Sign, Safety
Documentation,
safety training, etc.
Monthly Contractor
OE,
Independent
Monitor,
BPDB
Emergency
Response
Plan
At work sites Inspection of
Emergency
Preparedness and
Response
mechanism
Monthly Contractor
OE,
Independent
Monitor,
BPDB
Grievance
Mechanism
At work site Visual inspection and
enquiry to know the
Grievance
Mechanism.
Monthly Contractor
OE,
Independent
Monitor,
BPDB
During Operation and Maintenance
Monitoring of
Environment
al Quality
As specified
inTable11.1
Inspection and
Record checking of
Monitoring activities
Quarterly Independent
Monitor BPDB

Environmental Monitoring Plan
11-15
Parameter /
Activity Location
Means of
Monitoring Frequency
Responsible Agency
Implemente
d By
Supervised
By
(Ambient Air,
Noise,
Water,
effluent, Soil,
etc.)
carried out by EHSU
circle of GPS
Environment
al Laboratory
GPS Complex Inspection of
laboratory Condition,
accreditation and
certification (from
GOB) status
Six-
monthly PIU
Independent
Monitor,
BPDB
Meteorologic
al Condition
GPS Checking and
compiling climatic
data collected and
recorded by micro
weather station
installed in GPS
Quarterly Independent
Monitor BPDB
Ambient
Noise Level
Township
area,
Administrative
area and
nearby
community
Noise nuisance/
disturbance
perceived by power
plant personnel and
nearby community to
be surveyed by
interview and FGD
Six-
monthly
Independent
Monitor BPDB
Fisheries Shitalakhya
River around
the water intake
point, effluent
discharge point
Visual inspection of
fish mortality
Interviewing local
fishermen
Six-
monthly
Independent
Monitor BPDB
Plant Health Blooming of
flowers and
fruits in plants
within the GPS,
number of tree
felling
Visual inspection Six-
monthly
Independent
Monitor BPDB
Land use
and land
cover
50km buffer
area of the plant
Satellite image
analysis of land use
and land cover
yearly Independent
Monitor BPDB
Hazardous
Waste and
Hazardous
Material
Handling
Hazardous
Material Storage
Area and Use
Area
Hazardous
Waste Disposal
Area
Visual Inspection of
safe handling and
storage hazardous
waste and
hazardous materials
Quarterly EHS Circle
Independent
Monitor,
BPDB
At monitoring
well location
Grievance
Mechanism
GPS complex
and nearby Interview of local
population to check Quarterly
EHSU
Circle Independent
Monitor,

Environmental Monitoring Plan
11-16
Parameter /
Activity Location
Means of
Monitoring Frequency
Responsible Agency
Implemente
d By
Supervised
By
community whether grievance
mechanism is
working or not.
Checking records of
complaints and
redresses
BPDB
Emergency
Response
Plan
At work sites Inspection of
Emergency
Preparedness and
Response
mechanism
Quarterly EHSU
Circle
Independent
Monitor,
BPDB
Health and
Safety
Preparednes
s
GPS Complex Inspection of training
list, safety meetings
records, means of
awareness growing
Quarterly EHSU
Circle
Independent
Monitor,
BPDB
Community
Relation
GPS Complex,
Nearby
Community
Inspection of
community relation
maintaining
procedures, relation
building activities,
FGD with community
Quarterly EHSU
Circle
Independent
Monitor,
BPDB
CSR
Program
GPS Complex,
Nearby
Community
Inspection of record
completed and
planned CSR
programs and
activities
Six-
monthly
Independent
Monitor BPDB
11.2 Implementation of Environmental Monitoring Plan
11.2.1 Responsible Agency
724. The Chief Engineer, Power Station Construction (PSC) is the responsible authority
for administrating and implementing the Project and the Project Director GPS Unit 4
Repowering will implement environmental monitoring program during construction and the
Chief Engineer Operation will implement monitoring plan during operation stage. During
construction stage, the Environmental Compliance Monitoring will be conducted by the
Contractor(s) supervised by the Owner’s Engineer (OE) and Environmental Impact
Monitoring will be carried out by the by the Owner’s Engineer (OE) in support from the
Contractor(s). In addition, an independent Monitor will also be retained by PIU during three
years of construction and by GPS during three years of post-construction (operation stage).
The EHSU Circle of GPS will implement the monitoring program during operation stage.
11.3 Action during Emergent Operation
725. The plant can have an Emergent operation if there is a major failure of control
system, plant component, grid failure, etc. Normally the modern distributed control system
(DCS) is good enough to handle all such emergencies. Otherwise, the plant operator/shift in-
charge can change the plant control to manual mode and adjust the process variables and

Environmental Monitoring Plan
11-17
finally change the plant back to auto mode. The proposed project will have DCS control
system with modern sensors and a proper interface with the existing old sensors/system.
726. The plant will be operated ensuring all pollution control devices are in order. In case
of any event of malfunction of a pollution control device, immediate action of resolving the
problem will be taken. If any emergent situation arises during operation, the shift in-charge
will be immediately notified to take corrective measures and action.
11.4 Performance Indicators
727. For evaluating the performance of the environmental management and monitoring
plan, performance indicators are identified to, for efficient and timely implementation of
measures/actions proposed in EMP. The indicators are defined both for construction and
operation phases. OE will be responsible for compiling the information on these indicators
and report to BPDB.
728. Separate performance indicators for each environmental issue have been specified
in Table 11-1 and Table 11-2. To measure the overall environmental performance of the
project, an additional list of performance indicators is provided below:
Number of inspections carried out by OE per month
Number of non-compliances observed by OE or EHSU.
Continuous period of non-compliance
Number of grievances received.
Number of grievances resolved.
Number of construction and occupational related accidents.
Timely reporting of documents (as defined in EMP and monitoring plan)
Availability of environmental and H&S specialists in EHSU.
Availability of environmental and H&S specialists in OE.
Availability of environmental specialists and H&S with contractors.
Number of trainings imparted to stakeholders/other capacity building initiatives
11.5 Reporting and Feedback Mechanism
729. The monitoring activities will require proper documentation. In case of Independent
monitor, the monitoring results and relevant document should be properly reported to the
project implementation authority. The project authority would submit the report to the
Department of Environment and to the Financer (World Bank in this case).
730. During construction stage, the environmental specialist of OE will be engaged in
monthly discussion meeting with the project implementation unit and the Contractor(s) for
giving necessary feedback. The project implementation unit may arrange a discussion
meeting quarterly with the financer regarding environmental compliance.
731. During the operation phase, the EHSU Circle will carry out the monitoring activities
and keep all the records and results of monitoring with proper documentation and will
produce quarterly reports on Environmental Monitoring. Besides, the third party Independent
Monitor would prepare and submit environmental compliance monitoring report annually to
the power plant authority. All the reports should be submitted to DoE which is a condition of

Environmental Monitoring Plan
11-18
renewing the Environmental Clearance Certificate from DoE and to the World Bank for post-
completion monitoring and evaluation of the project.
732. During operation, the EHSU Circle will give necessary feedback instantly to the
person in concern. The EHSU Circle will arrange a monthly meeting to disclose the results of
environmental monitoring to the personnel.
11.6 Budgets for Monitoring
733. Summary costs of monitoring including investments costs are presented in Table
11-3, Table 11-4, and Table 11-5. The detailed breakdown is presented in Annex 11-3.
Table 11-3: Environmental Compliance Monitoring Cost
Sl
no Activities
Estimated Cost
(USD)
During pre-construction and Construction (borne by EPC Contractor)
1 Environmental quality (air, water, noise, soil) monitoring 393,120
2 Occupational health, safety, and sanitation 78,060
3 Ecosystem, Biodiversity, Fisheries Resources and
Agricultural Resources Monitoring 44,800
Subtotal 515,980
During 3 years of operation (to be included in O/M cost)
1 Environmental quality (air, water, effluent, noise, soil)
monitoring
76,500
2 Waste Generation and Management 6,300
3 Ecosystem and biodiversity 12,000
4 Land and agriculture resources 6,500
5 Health, safety, and sanitation 14,130
6 Monitoring beyond compliance 6,900
Subtotal 122,330
Total Monitoring 638,310
Table 11-4: Investment Cost of Environmental Monitoring
Sl
no Activities
Estimated Cost
(USD)
1 Continuous Stack Emission Monitoring System 250,000
2 Continuous Ambient Air Quality Monitoring Stations
(2)
500,000
3 Continuous Effluent Quality Monitoring Instrument 150,000
4 Micro Weather Station 40,000
5 Environmental Laboratory 400,000
Estimated Total Cost 1,340,000
Table 11-5: Cost of Independent Monitor
Sl
no Activities
Estimated Cost
(USD)
1 Independent Monitor for a six (6) years period
including 3 years of operation (only fees and cost) 813,780

Environmental Monitoring Plan
12. Indirect Project Benefits and Measures Proposed Beyond
Compliance
12.1 Preamble
734. The re-powering Project is designed as environmentally sound in comparison to the
existing operation regime of Unit 4 as described in Chapter 4. Even then, the Project might
have sensitivity to environment and thus measures to go beyond regulatory requirements
are introduced in the EIA and EMP. Aspects such as GHG emission reduction, corporate
social responsibility, extending support to use of condenser cooling water for irrigation, and
measures such as, green belting of asbestos pit and neutralization pond are therefore
proposed.
12.2 GHG Emission Reduction – An Indirect Project Benefit
735. Since, the repowering will improve efficiency from 33.9% to 54.1% there will be a net
benefit in greenhouse gas (GHG) emissions. The implementation of combined cycle would
further reduce the emission of greenhouse gases as the flue gas emitted from the gas
turbine is used again in the Heat Recovery Steam Generator. Such power generation
process combined with the implementation of energy efficiency programs in power sectors
and in other infrastructures would not only make the production cost-effective but also
reduces greenhouse gas emissions. Natural gas-fired, primarily combined-cycle fleet
consumes significantly less fuel to generate power than conventional boiler/steam turbine
power plants and emits fewer GHG emissions per MWh of power produced as compared to
coal-fired or oil fired power plants. The proposed project thus demonstrates a case of
voluntary GHG emission reduction. These reductions may qualify Clean Development
Mechanism (CDM).
736. The clean development mechanism was designed to meet a dual objective: (a) to
help developed countries fulfill their commitments to reduce emissions, and (b) to assist
developing countries in achieving sustainable development. CDM projects earn tradable,
saleable certified emission reduction (CER) credits that can be used by industrialized
countries to meet a part of their emission reduction targets under the Kyoto Protocol.
Benefits of CDM projects include investment in climate change mitigation projects in
developing countries, transfer or diffusion of technology in the host countries, as well as
improvement in the livelihood of communities through the creation of employment or
increased economic activity.
737. Table 12-1 summarizes approximate annual GHG emissions from the natural gas-
fired, combined-cycle power plant (repowering) in comparison to the gas based steam-cycle
generation (baseline). It is estimated that 1,439,264 ton/y of CO2 emission generates from
the baseline scenario (steam cycle) and 901,868 ton/y of CO2 emission produced from the
repowering case for the equal amount of power (412 MW), respectively. The net CO2
emission benefit is estimated as 537,396 ton/y and a total of 13,434,904 ton in the entire
project life (25 years).
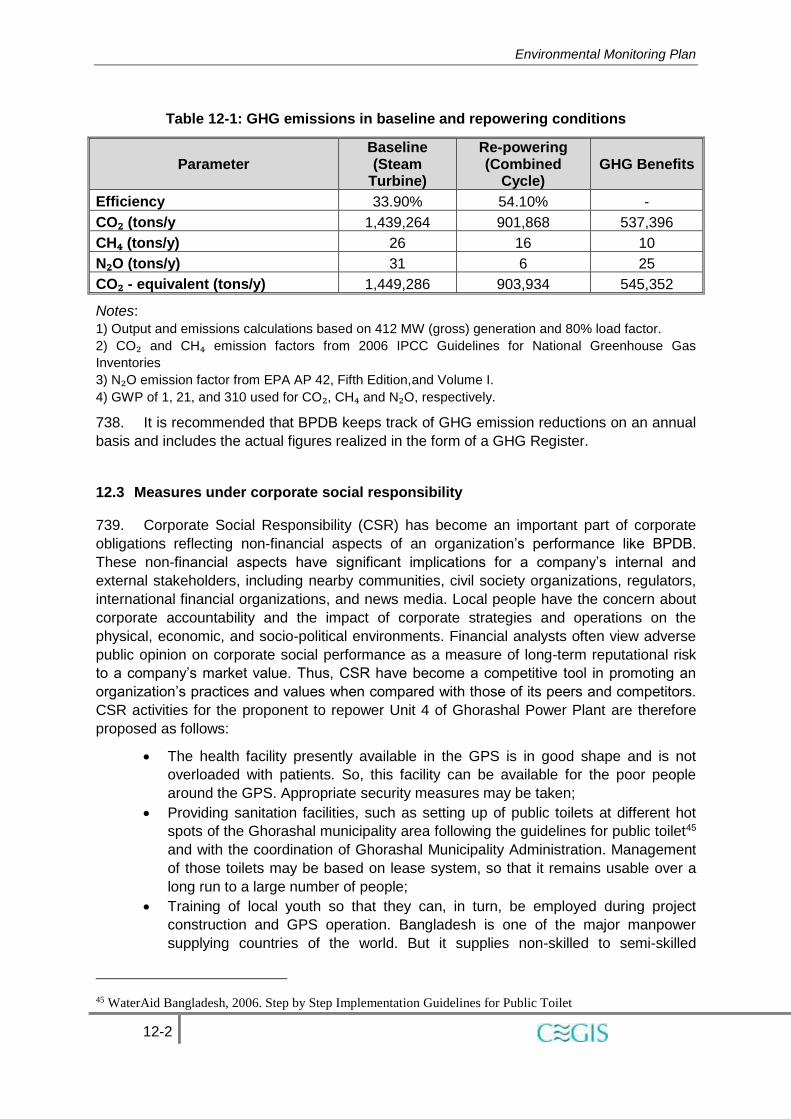
Environmental Monitoring Plan
12-2
Table 12-1: GHG emissions in baseline and repowering conditions
Parameter Baseline (Steam
Turbine)
Re-powering (Combined
Cycle) GHG Benefits
Efficiency 33.90% 54.10% -
CO₂ (tons/y 1,439,264 901,868 537,396
CH₄ (tons/y) 26 16 10
N₂O (tons/y) 31 6 25
CO₂ - equivalent (tons/y) 1,449,286 903,934 545,352
Notes:
1) Output and emissions calculations based on 412 MW (gross) generation and 80% load factor.
2) CO₂ and CH₄ emission factors from 2006 IPCC Guidelines for National Greenhouse Gas
Inventories
3) N₂O emission factor from EPA AP 42, Fifth Edition,and Volume I.
4) GWP of 1, 21, and 310 used for CO₂, CH₄ and N₂O, respectively.
738. It is recommended that BPDB keeps track of GHG emission reductions on an annual
basis and includes the actual figures realized in the form of a GHG Register.
12.3 Measures under corporate social responsibility
739. Corporate Social Responsibility (CSR) has become an important part of corporate
obligations reflecting non-financial aspects of an organization’s performance like BPDB.
These non-financial aspects have significant implications for a company’s internal and
external stakeholders, including nearby communities, civil society organizations, regulators,
international financial organizations, and news media. Local people have the concern about
corporate accountability and the impact of corporate strategies and operations on the
physical, economic, and socio-political environments. Financial analysts often view adverse
public opinion on corporate social performance as a measure of long-term reputational risk
to a company’s market value. Thus, CSR have become a competitive tool in promoting an
organization’s practices and values when compared with those of its peers and competitors.
CSR activities for the proponent to repower Unit 4 of Ghorashal Power Plant are therefore
proposed as follows:
The health facility presently available in the GPS is in good shape and is not
overloaded with patients. So, this facility can be available for the poor people
around the GPS. Appropriate security measures may be taken;
Providing sanitation facilities, such as setting up of public toilets at different hot
spots of the Ghorashal municipality area following the guidelines for public toilet45
and with the coordination of Ghorashal Municipality Administration. Management
of those toilets may be based on lease system, so that it remains usable over a
long run to a large number of people;
Training of local youth so that they can, in turn, be employed during project
construction and GPS operation. Bangladesh is one of the major manpower
supplying countries of the world. But it supplies non-skilled to semi-skilled
45 WaterAid Bangladesh, 2006. Step by Step Implementation Guidelines for Public Toilet

Environmental Monitoring Plan
12-3
manpower particularly in the Middle East and South East Asian countries and
earns low foreign currency compared to the countries which provide skilled
manpower. There is a huge demand of power related technicians. So, there is a
scope of developing manpower in power sector in technician category and as
such they can earn more foreign currency. In this connection, this Project can
facilitate capacity development of the local youths through relevant training
programs using knowledge hub of the Ghorashal Power Station.
Develop socio-cultural facilities such as mosques, playgrounds and community
centers for the community.
Table 12-2: Estimated budget for CSR
Sl Items Quantity Amount (US$)
1 Public toilets 3 10,500
2 Training of local youths 200 15,000
3 Socio-cultural facilities 3 30,000
12.4 Use of cooling water discharge for irrigation – extending support for three years
740. The existing units of the Ghorashal Power Station are being operated by the once-
through condenser cooling system and use a large quantity of Shitalakhya River water. This
large quantity of water maintains the same quality of river water except the water
temperature. Currently, GPS is diverting about 7.79 m3/s of water from the effluent discharge
canal to an irrigation network for the benefits of local farmers. About 4,000 acres (1,619 ha)
of farmland is cultivated using this water. At present, 6,152 ton of boro rice is produced per
season using the condenser cooling water discharge. During the public consultation local
farmers expressed their gratitude to GPS and requested to continue this services and if
possible to increase the quantity of water for irrigating additional land. Before the existence
of this canalized irrigation system, using condenser cooling water discharge, this area had
been hugely suffering from shortage of water to irrigate cropland despite having deep tube
wells. The tube-wells were also producing insufficient volume of water which was just
meeting the domestic demand for water, i.e., for cleaning of utensils and drinking purposes.
In the given circumstances, the local inhabitants could not grow crops in all of their croplands
and the yield was relatively low. Taking the opportunity of the availability and considering the
usefulness of cooling water discharge, the Bangladesh Agricultural Development
Corporation (BADC) facilitated development of canalized surface water irrigation to the
farmlands of the Palash Upazila, and during 1992-93 this service delivery system was
formalized between BPDB and BADC. To make the irrigation system effective, the BADC
developed different structures, such as culverts, canals, footbridges and sluice gates, which
were considered relevant and necessary to ensure supply of water to the remote agriculture
lands.
741. The cooling water discharge has a temperature of 7° - 9°C higher than the ambient
temperature in the river water. However, when this cooling water passes through a long
distance through the irrigation network to reach the agricultural lands, the water loses its
temperature and returns near to its ambient temperature. However, the near-field croplands
experience higher temperature at the intake point of irrigation network.

Environmental Monitoring Plan
12-4
742. The irrigation cost per hectare of land is about Taka 6,500.00 if the water is directly
withdrawn from the Shitalakhya River. But the use of condenser cooling water discharge in
irrigation cost the farmers only Taka 800 per hectare. Overall the cost benefits of the desired
implementation measures on irrigation outweigh the cost of farmers in using other irrigation
methods.
743. Notwithstanding the above benefits, use of cooling water discharge for irrigation in
some instances become detrimental to some croplands those are located in low lying lands
due to accumulation of warm stagnant water. This particularly the case, where the water
passes through the earthen canals and do not lose sufficient temperature.
744. In the repowering proposal of Unit 4, close cycle cooling is recommended. In
addition, all future repowering projects may follow the same recommendation, which would
mean that condenser cooling water supply for irrigation may not be made available. This is
detrimental to the current irrigation practices in the project impact area. Under the close
cycle cooling the water demand from Shitalakhya River will be significantly reduced and
some of the pumps may become redundant. Considering, the severance of the issue and the
significant benefits to the communities, it is recommended that one pump can be dedicated
for the irrigation water for at least three years of project operation. GPS should coordinate
with BADC to handover the pumps and watermain for irrigation services. The operation and
maintenance costs after three years should be borne by BADC. Current annual operation
and maintenance costs of one pump is about BDT 10 million, however, for irrigation purpose
much less operation cost will be required.
12.5 Greenbelt Development
745. There will be about 25 trees of mahogany species, shrubs, and grasses require
clearing for the project footprint, which requires compensation by 3-5 times per tree felt to
comply with DoE requirements. In addition, wildlife habitat especially bird species will be
affected. To compensate the trees and wildlife habitat loss, a plantation program under the
project is considered in terms of green belt development beyond compliance within the
project boundary. The greenbelt will minimize the ambient noise generated from the power
plant. As well as help attenuate the dust. Indigenous tree species that are pollution resistant
and with thick foliage will be selected for green belt development. Table 12-3 presents the
distribution and number of each species for the plantation program. It is proposed that
saplings should be planted in rows around the existing sludge disposal site (Figure 12-1),
proposed hazardous waste disposal site (Figure 12-2), and close to the new gas turbine and
HRSG plant. The saplings will be planted and maintained by GPS authority. Table 12-4
presents the budget for greenbelt development program.
Table 12-3: Species distribution and numbers for greenbelt program
Local Name Scientific Name Number
Chambol Albizia richardiana 18
Mahagoni Swietenia Mahagoni 8
Weeping Debdaru Polyalthia sp. 152
Neem Azadirachta indica 46
Dumur Ficus hispida 176
Total 400

Environmental Monitoring Plan
12-5
0 15 30 45 60
01
53
04
5
Distance (m.)*Scale is not in actual
Dis
tan
ce (
m.)
*Sc
ale
is
no
t in
ac
tua
l
Pond
Neem (Azadirachta indica)
Chambol (Albizia richardiana)
Weeping Debdaru (Polyalthia sp.)
5
10
Tree Height*
(m.)
*Scale is not in actual
15
Dumur (Ficus hispida)
Walk way Pond bank
Shitki (Phylanthus carolinensis)
Figure 12-1: Schematic diagram showing plantation around the sludge disposal site

Environmental Monitoring Plan
12-6
Required Number of Sapling for Plantation
Mahagoni (Swietenia mahagoni) = 8
Neem (Azadirachta indica) = 14
Shewra/Kolkasunda (Cassia/Streblus spp.) = 71
Grasses and Flower Plants = as per required
Layer 1
Layer 2
Layer 3
Swietenia mahagoni
Cassia /
Streblus sp
Azadirachta indica
Layer 4Grasses and
Flower plant
Se
rvic
e W
ay
12
4
8
Plant Height* (m.)*Scale is not in actual
Distance (m.)
0 5 10
Shewra/Kolkasunda (Cassia/Streblus)
Mahagoni (Swietenia mahagoni)
Neem (Azadirachta indica)
Plant Legend
Grasses and Flower Plants
Figure 12-2: Schematic diagram showing plantation around the proposed hazardous
waste disposal site

Environmental Monitoring Plan
12-7
Table 12-4: Budget for plantation program
Items Amount (USD)
Saplings 1,242.95
Labor cost for planting 358.97
Others 1,000.00
Total 2,601.92
12.6 Closing
746. The re-powering Project is designed as environmentally sound project and an
environmental management plan has been devised to take care of the environmental issues.
With the apprehension that the Project might still have sensitivity to the environment,
measures discussed above are considered to enhance environmental and social conditions
of the project area. These measures are essentially beyond compliance requirements and
can provide inspiration to other companies and corporations in Bangladesh to follow.

Environmental Monitoring Plan
13-1
13. Institutional Arrangements and Capacity Building
13.1 Profile of key government institutions
13.1.1 Bangladesh Power Development Board
747. The Bangladesh Power Development Board (BPDB) was created as a statutory
public sector organization through the Presidential Order No. 59 in 1972. The aim was to
increase the power generation capacity to meet the demand of independent Bangladesh.
The BPDB is responsible for planning and development of country’s power generation and
distribution infrastructures as well as operation of many of nation’s power generation
facilities. At present, the BPDB is main agency responsible for generation and distribution of
electricity mainly in urban areas of the country. The BPDB falls under the auspices of the
Power Division, Ministry of Power, Energy and Mineral Resources, Government of
Bangladesh. The organogram of the BPDB is presented in Figure 13-1.
748. Since the mid-seventies, the Government recognized the need and importance of
providing electricity to rural households, particularly to achieve desirable social improvement
and stimulate rural industries in the country. To this end a different approach was adopted,
and in October 1977, the government established the Rural Electrification Board (REB).
Subsequently, in 1991 Dhaka Electric Supply Authority (DESA), now renamed as Dhaka
Power Distribution Company (DPDC) was created. The latter was created basically to
operate and develop distribution system in and around Dhaka (including the metropolitan
city), collect revenues and provide better customer services. The DPDC was also entrusted
with these responsibilities to lessen administrative burden of BPDB.
749. In all these efforts, public investments and State ownership have been the case and
the power sector remained under government control.

Institutional Arrangements and Capacity Building
13-2
CHAIRMANCHIEF STAFF
OFFICER (SE)
DIRECTOR
PUBLIC RELATIONS
DEPUTY DIRECTOR-2
SECRETARY ADDI. DIR-1
DS-3 (DS. LEGAL-1)
DEPUTY DIRECTOR-1
MEMBER
ADMINISTRATION
DS. ADMIN
(DD)MEMBER
FINANCE
DS. FINANCE
(DD)
MEMBER
PLANNING &
DEVELOPMENT
DS. P & D
(XEN)MEMBER
DISTRIBUTIONDS. DIST (XEN)
MEMBER
COMPANY
AFFAIRS
DS. COMPANY
AFFAIRS (XEN)MEMBER
GENERATION
DS.
GENERATION
(XEN)
Chief Engineer,
GPS
Chief Engineer,
PSC
Figure 13-1: Organogram of BPDB
13.1.2 Project Implementation Unit
750. For the operation of Ghorashal Unit-4 Power Plant, the BPDB has created a project
implementation unit (PIU), under the office of the Chief Engineer, Power Station
Construction (PSC). The PIU consists of one Project Director (PD), one Executive Engineer,
and an Assistant Director-cum- Accountant.
751. To strengthen the PIU additional resources are needed. A Development Project
Proforma (DPP) with a provision of additional man power of 22 engineers and an assistant

Institutional Arrangements and Capacity Building
13-3
director (accounts) has been submitted to the Government for approval. This DPP has been
prepared and submitted to implement the project within the approved time and budget.
Detailed qualification, required number of people in each post and responsibility of each
position is depicted in Table 13-1.
Table 13-1: Qualification and Responsibilities of the PIU Staffs
Sl
no. Name of the post Quantity Qualification Responsibility
1 Project Director
(Chief Engineer)
1
B.Sc. Engineering
or as per BPDB’s
Service Rule
Responsible to implement the project
on time and furnishing both financial
and physical progress report of the
project for deliberation on the progress
in the monthly Pre-steering and
Steering meetings.
Deputy Project
Director
(Superintending
Engineer)
1
B.Sc. Engineering
or as per BPDB’s
Service Rule
To assist the Project Director in all
respect. In the absence of the PD,
responsible for implementing the
project
2 Superintending
Engineer (S E)
2
B.Sc. Engineering
or as per BPDB’s
Service Rule
Supervision of contractor’s work during
the construction of the proposed power
plant as per the design and scope of
works outlined in the contract
document. Report on work progress
from time to time to the CE/PD.
Monitor all issues related to
environment, health and safety (EHS).
One of the two Superintending
Engineers should be fully assigned to
cover EHS issues.
3 Executive
Engineer 2
B.Sc. Engineering
or as per BPDB’s
Service Rule
To provide all supports to the SE in the
execution of the EPC contractor’s
works engaged for the construction of
the proposed power plant project.
Executive
Engineer (EHS)
1
B.Sc. Engineering
(environment) or as
per BPDB’s Service
Rule
To provide all supports to the SE in the
execution of the EPC contractor’s
works engaged for EHS issues of the
construction of the proposed
repowering project. One Executive
Engineer will be dedicated to EHS
issues.
4 Sub-Divisional
Engineer 2
B.Sc. Engineering
or as per BPDB’s
Service Rule
Providing all support to the Executive
Engineer in the supervision of file
works of proposed power plant project.
Sub-Divisional
Engineer (EHS)
1
B.Sc. Engineering
(environment) or as
per BPDB’s Service
Rule
Providing all support to the Executive
Engineer (EHS) in the supervision of
file works related to EHS issues of
proposed repowering project. One sub-
divisional engineer will be dedicated to
EHS issues.
5 Assistant
Engineers 4
B.Sc. Engineering
or as per BPDB’s
Providing all support to the Executive
Engineer in the supervision of file

Institutional Arrangements and Capacity Building
13-4
Sl
no. Name of the post Quantity Qualification Responsibility
Service Rule works of proposed power plant project.
Assistant
Engineers (EHS)
2
B.Sc. Engineering
(environment) or as
per BPDB’s Service
Rule
Providing all support to the Executive
Engineer in the supervision of file
works of proposed repowering project.
These assistant engineers will be
dedicated to EHS issues. One must
have previous experience in
environmental management and one in
occupational health, and safety issues.
6 Assistant Director
(Accounts)
1
Masters/Graduate Maintaining general ledger book,
processing of contractor’s bill for
payment, preparation of monthly
accounts statement for the project
related financial transaction. Also
responsible for all personnel and
administrative matters as per
delegation of authority.
7 Sub-Assistant
Engineer 6
Diploma
Engineering
Providing all support to the Executive
Engineer/ /SDE/AE in supervision of
field works of proposed power plant
project.
13.1.3 Ghorashal Power Station (GPS)
752. Ghorashal Power Station is the largest power station in Bangladesh. The station
started its operation in 1974. The station is headed by a Chief Engineer and four operation
and maintenance managers. Table 13-2 gives a summary of actual approved posts, posts
currently having personnel and posts that are vacant. The revised organogram as proposed
by BPDB is presented in Figure 13-2.
Table 13-2: Levels and ist and number of positions in Ghorashal Power Station and
their current status in terms of incumbency
Designation Allocation Posted Vacant
Chief Engineer 1 1 -
Manager (Superintending Engineer) 4 3 1
Executive Engineer 31 27 4
Sub-Divisional Engineer 39 9 30
Assistant Engineer 45 27 18
Sub-Assistant Engineer 74 80 -
Non-Technical Officers 30 25 5
3rd & 4th Class Staff (Technical) 729 697 32
3rd & 4th Class Staff (Non-Technical) 289 167 122
Total 1,242 1,036 212

Institutional Arrangements and Capacity Building
13-5
Chief Engineer
(CEO of SBU)
Senior Medical
Officer
Manager
Operation
Assistant Chief
Engineer (XEN)
Deputy Director
(RAO)
Deputy Director
(Admin)
Manager
(Mechanical
Maintenance)
Manager
(Electrical
Maintenance)
Manager (EHS
and Utility
Service)
Deputy Manager
(XEN) 1-2
XEN GT 3
Persons
Chief Chemist
(Lab)
XEN Efficiency
Chief Chemist
(Plant)
XEN-6 Persons
Deputy Manager
(XEN) 5-6
Deputy Manager
(XEN) 3-4
XEN GT-4
XEN GT-3 & 6
XEN Boiler/
HRSG 5-6
XEN Boiler/
HRSG 1-4
XEN Turbine 5-6
XEN Turbine 1-4
Deputy Manager
XEN
(Mechanical)
Deputy Manager
(XEN) Electrical
XEN Electrical
(GT)
XEN I&C (GT)
XEN Substation
XEN Control 2
Persons
XEN
Instrumentation
2 persons
XEN Generator
5-6
XEN Generator
1-4
XEN (RE)
Deputy Director
Security
Deputy Manager
(XEN) Civil
Deputy Manger
(XEN)
Workshops and
HVAC
Deputy Manager
(XEN) Vehicle
Deputy Manager
(XEN) Store
Deputy Manager
(XEN) Foreign
Procurement
Figure 13-2: Revised Organogram of GPS

Institutional Arrangements and Capacity Building
13-6
13.1.4 Other Relevant Organizations
753. Other relevant organizations involved in the implementation of EMP are: (a)
Department of Environment (DOE) oversee implementation of all development projects in
the country verifying that the environmental requirements are fulfilled, government guidelines
and procedures followed and environmental quality standards are maintained properly. DOE
will be consulted in case of complicated issues and if it requires any further environmental
clearance certificates (ECC), (b) Department of Fisheries (DoF) is responsible for fisheries
resources, (c) Department of Public Health Engineering (DPHE) is responsible for
maintaining the quality of drinking water and addressing sanitation issues, and (d) District
administration and municipality are responsible for traffic management, law and order and
resolving the social disputes that may arise during construction activities.
13.1.5 Owner’s Engineer
754. PIU will recruit an Owner’s Engineer for supervision of implementation of boiler
decommissioning, EPC contractor involving in civil works, erection of turbine and HRSG,
including supervision and implementation of EMP. The Owner’s Engineer will consist of an
environmental unit with 2 international and 3 national environmental experts. The proposed
positions and man month requirements of environmental specialists of the Owner’s Engineer
are given in Table 13-3. The terms of reference for the environmental consultants of Owner’s
Engineer are given in Annex 13-1. Environmental specialists of Owner’s Engineer, in
coordination with EU staff, will ensure the implementation of environmental management
practices at each stage of the project activities. The Owner’s Engineer will also be
responsible for updating EMP, if required.
Table 13-3: Proposed EHS Consultant of Owner’s Engineer
Sl. No Expertise Input (PM)
A International Consultants
1 Intl. Environmental Specialist 18
Subtotal (A) 18
B National Consultants
1 Environmental Specialist 36
2 Occupational, Health, and Safety Specialist 36
3 Field Surveyor 36
Subtotal (B) 108
Total (A+B) 126
13.1.6 Independent Monitor
755. Besides internal monitoring and evaluation by the PIU/BPDB for environmental
management and monitoring, independent/external monitors will be retained by BPDB, to
undertake monitoring of all compliance and effects monitoring components. These external
monitors will carry out monitoring implementation of the different components and submit an
independent monitoring and appraisal report to the PIU, BPDB and to the World Bank.
13.1.7 Contractors
756. Each Contractor procured under this Project (especially boiler decommissioning
Contractor and EPC Contractor) will be recommended to be a compliant of ISO 14001

Institutional Arrangements and Capacity Building
13-7
Environmental Management System (EMS) certification. Further conditions of compliancy for
OHSAH 18000 (2007) related Occupational Health and Safety (OHS) and SA 8000 (Social
Accountability) could also be imposed on the Contractors. Each contractor will be
recommended to have one Environmental Specialist and one Occupational, Health and
Safety Specialist, who will be working in close coordination with the environmental staff of
Owner’s Engineer and PIU.
13.1.8 Need for Institutional Strengthening
757. Presently, the GPS has four circles which are Operation, Mechanical Maintenance,
Electrical Maintenance and Civil. However, currently there is no dedicated Environment,
Health, and Safety (EHS) Circle to address environmental management and occupational
health and safety issues. A proposal has been made to create an EHS and Utility Services
Circle headed by a manager and two deputy managers, one for environment and one for
health and safety. One EHS consultant is also proposed under the manager of this circle to
advise the circle on environmental, health, and safety issues. The circle is currently
responsible for plant security and utility services (electricity and water distribution to offices
and staff colonies). The staffs are deputed from other wings/circles of the GPS or from other
departments in BPDB. After completion of development projects, the staffs return to their
parent circle from where they were deputed. Currently GPS has no staff with previous
experience in implementing environmental management and monitoring plan.
758. Generally, GPS/PIU outsource key services to consulting firm or relevant academic
institutions well-suited to the environmental, socio-political and socio-economic conditions in
Bangladesh. Furthermore, the manager and Deputy Managers for EHS are appointed on
deputation from other circles of GPS having relevant experience, are often not dedicated to
do their jobs. These deputed workers do not consider the EHSU Circle as their own work
place. This gets further complicated by the fact the deputed/seconded staff gets transferred
within 2-3 years.
759. In order to implement the environmental management plan (EMP) as proposed in this
EIA, an effective PIU with dedicated staff will be of crucial significance. Without qualified full
time staff it would be nearly impossible to minimize and/or eliminate the effects of
environmental hazards and risks and ensuring a safe working environment for the workers,
staffs and staff family members, who are residing in the project compound.
13.2 Proposed Institutional Strengthening of GPS
13.2.1 PIU Dedicated EHS Staff Requirements
760. Under the proposed DPP there is a request for additional 20 staff to strengthen the
PIU. However, in the DPP no provisions have been made for dedicated staff to ensure
compliance to EHS issues. For effective and meaningful implementation of the EMP, it is
recommended that one Executive Engineer, with requisite training and practical experiences
in implementing and/or monitoring environmental, health and safety issues pertaining to
power sector are recruited. The executive engineer (EHS) will be supported by one Sub-
Divisional Engineer (EHS), and two Assistant Engineers (one experienced in environmental
management, and other in Occupational Health and Safety). Table 13-1 presents some of
the key required qualifications of these staffs.
761.

Institutional Arrangements and Capacity Building
13-8
13.2.2 Strengthening of the Proposed Environmental, Health and Safety Circle
762. In order to comply with the EMP requirements that has been proposed in this EIA, an
effective EHSU Circle with experienced and dedicated staffs are essential. After a careful
review of the proposed organogram of GPS, the Consultant made a proposal to strengthen
the proposed organization structure, which is presented in Figure 13-3. The key highlights of
the strengthening are presented below:
Two deputy managers one for environment and one for occupational health and safety.
Two Sub-Division Engineers or Assistant Engineers with Environment background under deputy manager environment
Two Occupational health and safety officers under deputy manager occupational health and safety
Two chemists under deputy manager environment.
Environment engineers and occupational health and safety officers must have qualifications in their relevant areas of expertise.
Since, it will be difficult to get staffs within BPDB who has experience in environmental, health and safety background, it is recommended that EHSU should be supported by an EHS Consultant in environmental, health, and safety aspects of the project implementation.

Institutional Arrangements and Capacity Building
13-9
Chief Engineer
(CEO of SBU)
Senior Medical
Officer
Manager
Operation
Assistant Chief
Engineer (XEN)
Deputy Director
(RAO)
Deputy Director
(Admin)
Manager
(Mechanical
Maintenance)
Manager
(Electrical
Maintenance)
Manager (EHS
and Utility
Service)
Manager (365
MW CCPP)
Deputy Manager
(XEN) 1-2
XEN GT 3
Persons
Chief Chemist
(Lab)
XEN Efficiency
XEN-6 Persons
Deputy Manager
(XEN) 5-6
Deputy Manager
(XEN) 3-4
XEN GT-4
XEN GT-3 & 6
XEN Boiler/
HRSG 5-6
XEN Boiler/
HRSG 1-4
XEN Turbine 5-6
XEN Turbine 1-4
Deputy Manager
XEN
(Mechanical)
Deputy Manager
(XEN) Electrical
XEN Electrical
(GT)
XEN I&C (GT)
XEN Substation
XEN Control 2
Persons
XEN
Instrumentation
2 persons
XEN Generator
5-6
XEN Generator
1-4
XEN (RE)
Deputy Manager
(XEN) Health
and Safety
Deputy Manger
(XEN)
Environment
Deputy Director
Security
Deputy Manager
(XEN) Civil
Deputy Manger
(XEN)
Workshops and
HVAC
Deputy Manager
(XEN) Vehicle
Deputy Manager
(XEN) Store
Deputy Manager
(XEN) Foreign
Procurement
XEN Elcetrical
XEN Mechanical
XEN Operation
Deputy Manager
(XEN)
EHS Consultant
SDE/AE Environment-
2 Persons
Chemist-2, SDE/AE-1
Safety Engineer-2
Persons
Chief Chemist
(Plant)
Proposed
Position
Moved From
Other Circle
Figure 13-3: Organogram of GPS Proposed by the Consultant
763. The budget of the EHS staffs of EHSU Circle during three years of construction and
three years of operation is presented in Table 13-4. The job descriptions of the key EHS
staffs of EHSU Circle with preferred responsibilities and qualifications are presented in Table
13-5.

Institutional Arrangements and Capacity Building
13-10
Table 13-4: Budget for EHS Staffs of EHSU Circle
Sl Items Amount (USD)
1 Staff Budget (8 staffs x 6 years) 209,612
2 EHS Consultant 180,000
2 Library 5,000
3 Furniture, Computers, Printer 15,500
4 Filming/Media/Publicity of Project Activities 10,000
5 Surveys, Analysis and Reports 25,000
Total 445,112
Table 13-5: Job descriptions and responsibility with qualifications of key EHS staffs
Positions No. of
positions Job Responsibilities Qualifications
Manager EHS
and Utility
Services
1 Supervise environmental management plan during construction and operation stages including compliance and effects monitoring
Ensure the occupational health and safety and security of all employees and supervise contractors’ compliance of EMP obligations.
Maintain the EHS management system and ensure all electricity generation related work in compliance with all the requirements of health and safety programs. Maintenance of all documentation.
Initiate actions for improvement of all environmental and health & safety programs based on periodical audits of the EHS management system.
Working closely with deputy managers of EHS and Chief Chemist to ensure all works are done in compliance with ISO 14000 and ISO 31000 standards.
Monitor the progress of boiler decommissioning and safe disposal of Hazardous Wastes.
Ensure compliance with all
At least a Master’s Degree in Environmental Engineering or Environmental Science with experience in Occupational Health and Safety or related field.
At least 15 years of experience in power sector and a minimum of 5 years working experience in development Bank financed Projects preferably in power sector.
Must have adept knowledge of national policies, such as the Labour Act, 2006, The Factories Act, 1965, Environmental Conservation Rules, 1997 as well as International OHSA standards such as ISO 14001, ISO 31000 and other related OHSA guidelines.

Institutional Arrangements and Capacity Building
13-11
Positions No. of
positions Job Responsibilities Qualifications
BPDB policies and administrative rules, including the Health and Safety policy and other environmental requirements.
Practice safe work habits in accordance with Occupational Safety & Health Administration (OSHA) guidelines, Factories Act, 1965 and Environmental Conservation Rules, 1997.
Deputy Manager
(Environment)
1 Manage and supervise environmental management and monitoring activities of the plant.
Monitor environmental mitigation and compensation measures carried out by the contractors along with the consultants as outlined in the project’s EMP.
Conduct periodic consultations with various stakeholders, focus group discussions, and community consultation to monitor the progress of the EMP implementation.
Participate in grievance redress committee and resolve issues related to environmental concerns raised by the communities.
Assists in the preparation, implementation, monitoring and controlling of annual budget for the Circle.
Review quarterly and annual environmental monitoring reports and submit them to GPS, BPDB, and development partners.
Play a lead role in acquiring environmental permits, licenses, and approvals from regulatory agencies (e.g., DoE) in support of boiler decommissioning and
Master’s degree from a reputed institution on Environmental Engineering or Science or any related field
Must have good knowledge on various environmental policies and standards, both national and international.
Minimum 10 years of working experience on power sector projects or any environmental related projects that are funded by development Banks

Institutional Arrangements and Capacity Building
13-12
Positions No. of
positions Job Responsibilities Qualifications
new boiler erection projects.
Perform any other relevant and lawful duties as assigned by the Manager of EHSU from time to time.
The Environmental Specialist should adhere to the rules and regulations of Bangladesh and of development partners such as World Bank, ADB, etc.
Deputy Manager
(Occupational
Health and
Safety)
1 Advise GPS management of areas not in compliance with Environmental Conservation Rules, 1997; Factory Act, 1965; Bangladesh Labour Act, 2006 and OSHA guidelines.
Train workers on how to recognize hazards; environmental and OSHA regulations; how to properly use personal protective equipments (PPEs); fire safety drills etc.
Evaluate the probability and severity of accidents. Supervise the preparation of accident reports and continually update these reports and inform them to the EHSU Manager.
Review existing safety procedures and risk assessments for work activities conducted by employees, contractors and others to ensure adherence with internal standards and project’s EMP and to promote worker/contractor safety; identifies non-compliant, incomplete or substandard procedures, revises existing procedures or develops new procedures for activities involving employees and contractors where sound practical knowledge of occupational safety is required.
Ensure a safe and healthy
At least a Master’s degree in Occupational Health and Safety from an international accredited institution and a minimum 10 years of working experience or a diploma in OHS from a reputed institution (e.g. NEBOSH or anything similar) and at least 15 years of working experience.
Must have adept knowledge of national policies, such the Labour Act, 2006, the Factories Act, 1965, Environmental Conservation Rules, 1997 as well as International OHSA standards such as ISO 14001, ISO 31000 and other related OHSA guidelines.
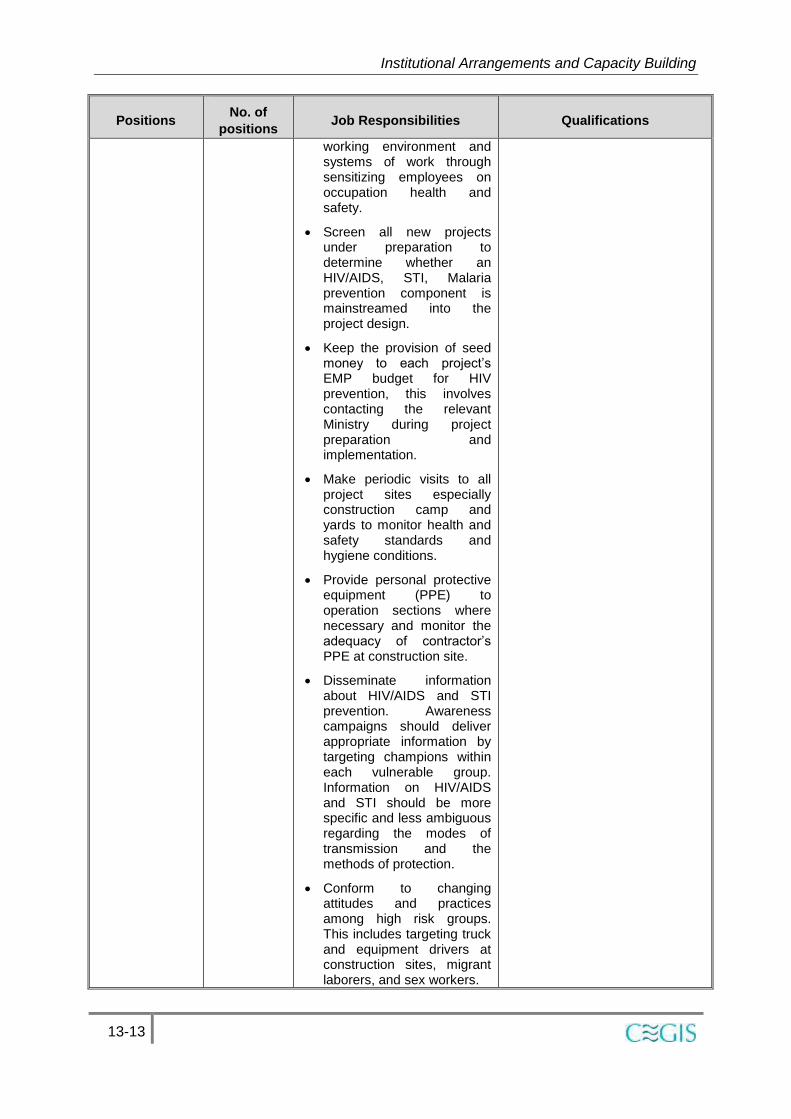
Institutional Arrangements and Capacity Building
13-13
Positions No. of
positions Job Responsibilities Qualifications
working environment and systems of work through sensitizing employees on occupation health and safety.
Screen all new projects under preparation to determine whether an HIV/AIDS, STI, Malaria prevention component is mainstreamed into the project design.
Keep the provision of seed money to each project’s EMP budget for HIV prevention, this involves contacting the relevant Ministry during project preparation and implementation.
Make periodic visits to all project sites especially construction camp and yards to monitor health and safety standards and hygiene conditions.
Provide personal protective equipment (PPE) to operation sections where necessary and monitor the adequacy of contractor’s PPE at construction site.
Disseminate information about HIV/AIDS and STI prevention. Awareness campaigns should deliver appropriate information by targeting champions within each vulnerable group. Information on HIV/AIDS and STI should be more specific and less ambiguous regarding the modes of transmission and the methods of protection.
Conform to changing attitudes and practices among high risk groups. This includes targeting truck and equipment drivers at construction sites, migrant laborers, and sex workers.

Institutional Arrangements and Capacity Building
13-14
Positions No. of
positions Job Responsibilities Qualifications
Prepare monthly and quarterly reports on occupational health and safety and providing updates on health and safety issues.
Perform any other relevant and lawful duties as may be reasonably assigned.
SDE/AE
Environment
2 Conduct environmental screening and scoping and assist in environmental impact assessments of all GPS and donor funded projects.
Monitor environmental mitigation and compensation measures carried out by the contractors along with the consultants as outlined in the project’s EMP.
Conduct periodic consultations with various stakeholders, focus group discussions, and community consultation to monitor the progress of the EMP implementation.
Participate in grievance redress committee and resolve issues related to environmental concerns raised by the communities.
Prepare the implementation of a range of environmental compliance documents required for project approval and implementation, such as IEE, EIA, EMPs, etc.
Perform any other relevant and lawful duties as assigned by the Manager of EHSU from time to time.
Bachelor of Science degree in Civil Engineering with major in Environmental Engineering from a reputed institution
Must have good knowledge on various environmental policies and standards, both national and international.
Working experience in power sector projects or any environmental related projects are preferred.
Occupational
health and
safety officer
2 Monitor all health and safety activities carried out by the contractors along with the consultants as outlined in the project’s EMP.
Conduct, arrange and report periodic inspections of all
Bachelor of Science degree in occupational Health and safety or public health or related field from an international accredited institution and a minimum 2 years of working experience

Institutional Arrangements and Capacity Building
13-15
Positions No. of
positions Job Responsibilities Qualifications
installations/ laboratories/ workshops to identify risks and safeguard of all persons from death or injury.
Provide personal protective equipment (PPE) to operation sections where necessary and monitor the adequacy of contractor’s PPE at construction site.
Conduct fire safety audits on all GPS buildings to ensure that facilities are compliant with safety rules and ensure that appropriate procedures to minimize risks are in place.
Disseminate information about HIV/AIDS and STI prevention. Awareness campaigns should deliver appropriate information by targeting champions within each vulnerable group. Information on HIV/AIDS and STI should be more specific and less ambiguous regarding the modes of transmission and the methods of protection.
Prepare monthly and quarterly reports on occupational health and safety and providing updates on health and safety issues.
Perform any other relevant and lawful duties as may be reasonably assigned.
or a diploma in OHS from a reputed institution.
Must have adept knowledge of national policies, such the Labour Act, 2006, The Factories Act, 1965, Environmental Conservation Rules, 1997 as well as International OSHA standards such as ISO 14001, ISO 31000 and other related OSHA guidelines.
Chemists 2 Preparing test solutions, compounds, and reagents for conducting test.
Assisting chief chemist in analyzing organic and inorganic compounds to determine chemical and physical properties, composition, structure, relationships, and reactions, utilizing chromatography, spectroscopy, and spectrophotometry
At least a Master’s degree in Chemistry, or Applied Chemistry or analytical chemistry from a reputed national or international institution
Must have good experience in laboratory analysis and techniques (e.g., HPLC, Gas Chromatography, Mass Spectrometry etc.)
Must be organized in maintaining good logbook

Institutional Arrangements and Capacity Building
13-16
Positions No. of
positions Job Responsibilities Qualifications
techniques.
Developing, improving, and customizing products, equipment, formulas, processes, and analytical methods.
Direct, coordinate, and advise lab assistants in test procedures for analyzing components and physical properties of materials.
Helping Deputy Manager (Environment) in preparing written reports on analysis, maintaining computer database and meeting deadlines for report submission.
practices
At least 5 years of working experience in sampling and analytical laboratories.
13.2.3 Capacity Building Programs
764. The environmental and social trainings will help to ensure that the requirements of
the EMP are clearly understood and followed by all project personnel. The primary
responsibility of providing these trainings to all project personnel will be that of the
contractor, Owner’s Engineer, and a designated training consultant. The trainings will be
provided to different professional groups separately such as managers, skilled personnel,
unskilled labors, and camp staff. Capacity building will be aimed at strengthening the PIU
and EHSU Circle of GPS staffs in the field of environmental management and occupational
health and safety. Members of the EHSU Circle and PIU staffs responsible for supervision of
environmental mitigation measures would be trained in environmental management,
environmental quality control, ecology, environmental awareness, participatory approach
and occupational health and safety. The contractor will also be required to provide
environmental and health and safety trainings to its staff, to ensure effective implementation
of the EMP. A budget of USD 0.13 million has been earmarked for capacity building of PIU
and GPS staffs and the scope of work is included in Annex 13-2. The contractors’ training
plan shall include a program for the delivery of intermittent training, to cover the subjects
included in Table 13-6. Training should be carried out initially at induction of staff and
repeated throughout the project.
Table 13-6: Training Subjects for Inclusion in Contractors Training Plan
Training Subject Target Audience
Handling, use & disposal of hazardous material Construction workers with authorized access to hazardous material storage areas and required to use hazardous material during their works
Waste Management All staff (construction and camp staff)
Efficient & safe driving practices, including road & vehicle restrictions
Drivers & mobile plant operators
Actions to be taken in the event of major or All construction staff

Institutional Arrangements and Capacity Building
13-17
Training Subject Target Audience
minor pollution event on land
Use of flexible booms and surface skimmers in event of pollution event in water
All construction staff working on the jetty renovation (if required)
Pollution prevention: Best practice All staff
Refuelling of water borne plant – pollution prevention
Operators of water borne plant & vehicles
Health & Safety: Safe way to work & hazard awareness
All construction staff
Health & Safety: Safe use of plant & equipment Operators of plant & equipment
Health & Safety: Working at height Boiler decommissioning, turbine hall, HRSG and cooling tower refurbishment construction staff
Health & Safety: Working near/on water All staff working on jetty strengthening and unloading heavy equipment from ship
Health & Safety: Use of PPE All construction staff
Emergency procedures and evacuation All staff
Fire fighting All staff
Site inductions, including requirements under the Environmental Management Plan & details of environmentally sensitive areas of the site
All staff
Culturally sensitive awareness rising on HIV/AIDS and the spread of sexually transmitted diseases. Awareness raising on risks, prevention and available treatment of vector-borne diseases
All staff
Cultural sensitivities of the local population On induction of all non-local staff
13.2.4 Formation of a Grievance Redress Committee
765. Two grievance redress committees (GRCs) will be formed: local grievance redress
committee (LGRC); and project grievance redress committee (PGRC). Most of the
grievances would be resolved at LGRC within 7 days of receipt of compliant, while a few
might be forwarded to PGRC, which will take two weeks to resolve the complaint. More
detailed information is presented in Chapter 14. Institutional Framework for Implementing
EMP
766. Proposed Institutional Framework for Implementation of EMP is shown in Figure
13-4.

Institutional Arrangements and Capacity Building
13-18
GPS
Chief Engineer/
CEO of SBU
Project
Director/ PIU
EHS and
Utility
Services
Decommissioning
and EPC Contractors
Owner's
Engineer
EMP
DOE, DoF, DPHE, BADC,
Municipality, Fertilizer
Factory, IPPs, Titas
Command line
Coordination Line
Grievance
Redress
Committee
Advisor
External
Monitor
The World Bank
Chief Engineer
PSC
Figure 13-4: Proposed Institutional Framework for EMP Implementation
13.2.5 Cost Estimates for Institutional Strengthening
767. The cost estimates for all the institutional strengthening measures proposed in this
chapter are given in the Table 13-7.
Table 13-7: Proposed Budget for Institutional Strengthening and Capacity Building
Sl. Strengthening/Capacity Building Measure Amount, USD
1 Strengthening of EHSU Circle (Table 13-4) 445,112
2 EHS Consultants of Owner’s Engineer (Annex 13-1) 942,000
3 Capacity Building and Training (Annex 13-2) 131,675
Total 1,518,787

Environmental Monitoring Plan
14-1
14. Public Consultation and Information Disclosure
14.1 Introduction and definitions
768. The Environmental Impact Assessment (EIA) process included public participation
and consultation to assist BPDB and MoPEMR to achieve public acceptance of the Project.
Public consultation is a regulatory process by which the public's input on matters affecting
the community is involved and their suggestions solicited.
769. Public consultation is preferred for the EIA study of any development Project
according to the DoE Guidelines of Environmental Assessments, 1997. The World Bank
Operation Policy require that public consultations to be included in the EIA process.
14.2 Regulatory Requirements
14.2.1 Bangladesh Guidelines
770. The EIA guideline formulated by DoE in 1997 (Chapter 4, Section 4.11) stated that
since the general public is the ultimate recipient of the economic benefit and environmental
damages, an EIA study should involve the public as part of decision making process
development. To achieve effective public participation, it is necessary to communication with
as many people as possible, as early as possible and through as many different ways as
possible. This requires pre-planning, resources, identification of target groups and several of
techniques for effective communication.
14.2.2 World Bank Group Requirements
771. Consultation: The World Bank recognizes and endorses the fundamental importance
of transparency and accountability to the development process. Bank’s policy is to be open
about its activities and to welcome and seek out opportunities to explain its work to the
widest possible audience. According to ‘OP 4.01: Environmental Assessment’ for a Category
A projects the borrower should consult the project-affected groups and local
nongovernmental organizations (NGOs) about the project's environmental aspects and takes
their views into account. Consultations should be conducted twice: (a) shortly after
environmental screening and before the terms of reference for the EIA are finalized; and (b)
once a draft EIA report is prepared. In addition, the borrower should consult with such
groups throughout project implementation as necessary to address EIA-related issues that
affect them.
772. Disclosure: For a Category A project, the borrower should provide relevant
information on project interventions in a timely manner prior to consultation and in a form
and language that are understandable and accessible to the groups being consulted. The
borrower should provide a summary of the proposed project's objectives, description, and
potential impacts for the initial consultation. For consultation after the draft EIA report is
prepared, the borrower should provide a summary of the EIA's conclusions. In addition, for a
Category A project, the borrower makes the draft EIA report available at a public place
accessible to project-affected groups and local NGOs. The borrower also ensures that EIA
reports for Category A project are made available in a public place accessible to affected
groups and local NGOs. The document needs to be translated into Bengali. Public

Public Consultation and Information Disclosure
14-2
availability of the EIA report for Category A project in the borrowing country and official
receipt by the Bank are prerequisites to Bank appraisal of these projects.
14.2.2.1 Grievance Redress
773. The borrower will respond to concerns of the project-affected communities related to
the project in a timely manner. For this purpose, the borrower will provide a grievance
mechanism, process or procedure to receive and facilitate resolution of stakeholders’
concerns and grievance regarding the Borrower’s environmental and social performance.
The grievance mechanism will be scaled to the risks and potential adverse impacts of the
project. Where possible, such grievance mechanism will utilize existing formal or informal
grievance mechanisms suitable for project purpose, supplemented as needed with project-
specific arrangements.
a) The grievance mechanism, process or procedure is expected to address concerns
promptly and effectively, in a transparent manner that is culturally appropriate and
readily accessible to all segments of the project-affected communities, at no cost and
without retribution. The Borrower will inform the project-affected communities about
the grievance process in the course of its course of its community engagement
activities, and will make publicly available a record documenting the responses to all
grievances received; and
b) Handling of grievances will be done in a culturally appropriate manner and be
discreet, objective, sensitive and responsive to the needs and concerns of the
project-affected communities. Where there is threat of reprisal, the mechanism will
also allow for anonymous complaints to be raised and addressed.
14.3 Consultation Methodology
774. Consultation Approach: Participatory
approach was followed for identifying the
stakeholders for conducting consultations (Figure
14-1). The study team consulted the project
proponent (BPDB) for understanding the project brief
and identifying the potential stakeholders. Therefore,
the key stakeholders include occupational groups,
such as farmers, fishermen, traders, elite persons,
etc. whose activities are likely to be impacted due to
the implementation of the proposed project.
Furthermore, local population, interested groups, and
BPDB officials were considered as the potential
stakeholders and were also consulted at this EIA
stage.
775. An expert multidisciplinary team made a
number of visits to the study area for conducting informal consultations with the predefined
stakeholders. Furthermore, a formal public consultation meeting was held at Ghorashal
Paurashava informing the stakeholders through paper advertisement and also
communicating formally by invitation letters. A comment sheet was prepared, covering all
potential environmental and social issues of the project and distributed to the participants.
This comment sheet was used in the meeting to unveil peoples’ perception and opinion on
the proposed project along with suggestions (comment sheet is attached in Annex 14-2).
Figure 14-1: Overall consultation
approach
Enabling Participatory Environment
The Project AuthorityProject
Proponent
The
Consultant
Primary
&
Secondary
The
Stakeholders
Pa
rtic
ipa
tory
Inte
ractio
n
Top
Down
IEE/EIA Study Team

Public Consultation and Information Disclosure
14-3
The team also informed the stakeholder about the project activities and potential impacts
that may surface during implementation and eventually during operation of the Plant. The
team sought stakeholders’ views on various aspects of the Project, and recorded all findings
for analysis and eventual incorporation in the report.
776. Stakeholder identification: Stakeholders include all those who affect and are being
affected by policies, decisions or actions within a particular system. Stakeholders can be
groups of people, organizations, institutions and sometimes even individuals. Stakeholders
can be divided into primary and secondary stakeholder categories.
777. Primary stakeholders are people who would be directly benefited or impacted by the
proposed project. In this context, people who have/had land within the project boundary
were considered as the primary stakeholders.
778. The second category of stakeholders (secondary stakeholders) pertains to those who
may not be directly affected but have interests that could contribute to the study, play a role
in implementation at some stage, or affect decision making on Project aspects. In this project
local elite persons, people who are living at the close vicinity, occupational groups,
government departments and line agencies fall under this category.
14.4 Details of Consultation Meetings
779. The details of consultation meetings are presented below:-
780. Informal consultation: A number of occupational groups and other relevant
stakeholders were consulted informally. These consultations were made on spot when the
team was visited in the project area. This was done to create awareness and clear any
misunderstanding about the project and eventually obtain support from the local
communities to conduct baseline environmental, ecological, fisheries, and socio-economic
surveys. No formal questionnaire was used rather peoples were consulted by the individual
team member in terms of sectors (i.e. agriculture, fishery, socio-economic, etc.) to which
he/she is assigned.
781. Expert/Institution Consultation: Experts were consulted through individual and group
meetings, during early stage of the study, selected individuals and organizations with
professional knowledge of EIA processes. The meetings were conducted at a very early
stage (Scoping Stage) of the EA with the objective to identify people to be consulted, to brief
stakeholders about the project components, and to discuss potential environmental and
social impacts of the Project. The outcomes of those consultations were used to identify
valued environmental components, stakeholders for public consultation and institutional
strengthening of BPDB to implement the EMP.
782. Focus Group Discussion: FGDs were held on 19th April, 2015 with agriculture and
fisheries groups to obtain feedback on the proposed repowering of Unit 4. FGD with
agriculture group was conducted at Ghorashal municipality and FGD for fisheries group was
conducted at Danga village. The purpose of the FGDs were to harness knowledge on issues,
such as, how noise and air pollution are affecting the nearby communities (e.g., hearing
difficulties, respiratory ailments and problems related with pregnancies), whether the
discharge of hot water and effluents affecting the fishermen and farmers and whether the
proposed project will aid in any socio-economic development or not; availability of
construction materials close to the project site; availability of local labors; site safety and
security; community involvement, and sustainable environmental management. The
outcomes of these discussions were used to prioritize impacts and risks, and to structure the

Public Consultation and Information Disclosure
14-4
EMP. Public Consultation: A formal public consultation meeting was held at 10:00 am on 11th
April, 2015 (Saturday) at Conference Room of Ghorashal Paurashava. Affected people were
invited through advertisement in locally published newspaper called Dainik Grameen
Dorpan. Additionally, they were communicated through the local representatives and leaders
for ensuring their presence. Saturday being a public holiday in Bangladesh, was chosen for
conducting the public consultation meeting as it will allow for the participation of various local
resident officers and people of different occupational levels. The day was sunny and was a
fine day for holding the meeting. The target number of participants crossed well over the
expected number of participants (50). A total of 61 participants had attended (Table 14-1),
which comprised of local government representatives, occupation groups, NGO
representative, businessmen, etc. A list of participants is presented in Annex 14-1.
Table 14-1: Participants in the Public Consultation Meetings

Public Consultation and Information Disclosure
14-5
14.5 Consultation Outcome
14.5.1 Stakeholder Consultations
783. Table 14-2 presents the comments, suggestions, and concerns obtained and action
points taken to address them during FGDs, informal discussions and formal public
consultations.

Public Consultation and Information Disclosure
14-6
Table 14-2: Outcome of stakeholder consultations
Groups/
Sectors Comments/Suggestions/ Concerns Action Points
Socio-
economic
784. The participants stated that
they have no objection on Ghorashal
power plant project. Rather they
thought it will expedite local, regional
and national development as power is
the main driving force of development.
785. They also believe that the
successful operation of the proposed
project will yield considerable
employment opportunities for local
people.
786. The proposed plant would have
a positive impact in curbing load-
shedding, socio-economic
development and continuous supply of
electricity to residential and other
commercial and industrial sectors,
according to the opinion of the
participants.
787. They stated that noise is a
serious problem in this area that is
produced from other rental power
plants. If this repowering project
produces noise as such it will
exacerbate this problem.
788. Respiratory disease is alarming
in the study area that is brought out by
the fertilizer company due to ammonia
absorbent. The participants urged that
the produced power should not
encourage such type of chemical
based industries in the area.
789. Child labor is also found
notable in the study area. The
participants stated that if produced
power eventually encourages industrial
expansion the current rate of child
labor may be increased.
790. Possible mitigation
measures suggested includes
soundproofing turbines or
structures that emit loud noise,
plantation around the plant area
which will act as noise barriers,
noise dampening wall etc.
BPDB will take up ammonia release issue from fertilizer factories to relevant government agencies.
791. Child labor will be
prohibited in the construction work
of the proposed GPS repowering
project.
EMP has covered mitigation and enhancement measures for the impacts of air pollution and risk of hazardous materials.
Water
Resource
792. Ghorashal power plant
complex is directly dependent on the
water system of the Shitalakhya River.
795. Refurbishment of cooling
water with enhancements will
reduce thermal plume significantly

Public Consultation and Information Disclosure
14-7
Groups/
Sectors Comments/Suggestions/ Concerns Action Points
When the entire power plant runs with
full capacity, two pump houses with
maximum flow rate of 40.25 m3/s water
are abstracted from the Shitalakhya
River. Around 90% of the intake water
returns to the same river with the
temperature of around 370C to the
downstream discharge point. A
significant amount of heated water
diverts to the agricultural fields for
irrigation. Discharge of thermal plume
in the Shitalakhya River is one of the
major causes of reducing the fish
population close to the discharge
point. Local population living at the
bank of the Shitalakhya River near the
discharge point expressed their
concern about this warm water
discharge. They also reckon about the
deterioration of river water quality due
to the effluent discharge from other
industries such as, oily substances,
chemicals and other pollutants. They
believe that discharged of such
effluents might affect the water quality
of the Shitalakhya River.
793. Measures should be taken,
such setting up an effluent treatment
plant so that pollutants are
treated/removed before they are
discharged into the river and setting up
of cooling tower for cooling purposes
instead of using river water.
794. Local people reported that
periodically the river water becomes
highly polluted with bad odor. This is
because of periodical release of
ammonia gas from the fertilizer factory,
wastes from Pran Agro Industry,
release of temperature borne effluent
from power plant, etc. Sometimes
water becomes unusable.
Groundwater has been depleting due
to over exploitation. Local people gave
emphasis on not to use ground water
for the proposed plant.
Shitalakhya River.
796. The design has
considered the treatment of
effluent by construction of an ETP
plant.
797. Effluent treatment
complying with national and
international standards before
discharge is recommended.
798. Power plant authority
should be abstained from using
underground water instead they
can conserve water through the
use of water efficient technology.
799. Local communities were
advised to raise their concern
through local administration about
the release of ammonia from
fertilizer factory.

Public Consultation and Information Disclosure
14-8
Groups/
Sectors Comments/Suggestions/ Concerns Action Points
Fisheries
800. According to the opinion of the
participants, before the emergence of
various industries, once the area had
lots of open water bodies that were
habitats for various fisheries including
seasonal floodplains, beels and
interconnected canals that connected
Shitalakhya River.
801. Decades ago there were lots of
fishermen fishing in those water
bodies. However, their numbers are
greatly reduced.
802. The main reasons being the
unavailability/decreased availability of
fishes in and around the Shitalakhya
River.
803. One of the major reasons for
this decreased availability of fishes in
those habitats is because of the
lowering of the water level of the
Shitalakhya river due to the
unavailability of water from old
Brahmaputra River during the dry
season.
804. According to the participants
the development of various industries
has caused the people to expand the
land areas towards the river through
encroachment, which means
narrowing down the river conveyance
area. This narrowing down of the river
causes increased river erosion which
leads up to the accumulation of silt,
decreasing the river area and depth,
as a result aquatic habitats has been
depleted.
805. Overfishing, by fine mesh nets,
also lead to the death of many
fingerlings and fish species.
806. The development of various
industries close to the river bank
discharge untreated effluent causing
severe water pollution. They believe
the fertilizer factory near the bank of
812. Effluent treatment
complying with national and
international standards before
discharge is recommended.
813. BPDB will take up
ammonia release issue from
fertilizer factories to relevant
government agencies.
814. Design has considered the
renovation of cooling water
system which will discharge
relatively cool water.

Public Consultation and Information Disclosure
14-9
Groups/
Sectors Comments/Suggestions/ Concerns Action Points
the Shitalakhya River, in particular,
released untreated-toxic gas into the
river that has been killing many fish.
Periodically the river reach along the
Ghorashal Fertilizer factory and its
surrounding reach become void of fish.
807. Water pollution of the
Shitalakhya River from different point
and non-point sources creates havoc
for fisheries.
808. The participants also stated
that the warm water discharge from
the current Ghorashal Power Station
contributes higher temperature of river
water killing many small and soft fish
and fingerlings or causing them to
migrate away from the Shitalakhya
River.
809. The lack of availability of fish
caused many fishermen to look for
alternative sources of income.
810. Participants also stated that
fish was one of the major sources of
protein and due to the depletion of fish
species in Shitalakhya River, people
are deprived of the source of protein
and are now suffering from various
protein-deficient diseases.
811. They suggested appropriate
measures, such as, cooling the
discharged water before dumping
them into the river water and arrange
proper advocacy measures so that the
fertilizer factory could stop the release
of untreated toxic gas into the river by
setting up appropriate treatment
plants.
Agriculture
815. Before the development of the
Power Plant Ghorashal had very little
ground water reserve for agriculture.
Deep tube wells were used for
irrigation, which was costly and as a
result crop productivity was less in
Palash Upazila.
826. Adoption of close cycle
cooling technology with
refurbishment of existing cooling
system and construction of new
cooling tower to meet the capacity
of Unit-4 repowering will reduce
the condenser cooling water in the

Public Consultation and Information Disclosure
14-10
Groups/
Sectors Comments/Suggestions/ Concerns Action Points
816. Previously agricultural activities
were only reserved to areas close to
the river bank. Farmers used to collect
river water via low lift pumps.
However, this method of drawing water
was costly (Tk. 6,500 per hectare).
817. According to the opinion of the
participants, the majority of them
expects the proposed project will not
affect their irrigation practices.
818. The development of Ghorashal
Power Plant, on the contrary, has
helped agricultural productivity
significantly. Farmers are now able to
use the condenser cooling water
discharge for irrigation. With the help
of Bangladesh Agricultural
Development Corporation (BADC),
condenser cooling water discharge is
distributed through an irrigation
network cultivating twelve thousand
bighas (1,667 hectare) of land. The
process is also relatively cheap (Tk.
800 per hectare) compared to
abstracting water from the
groundwater via LLPs.
819. The availability of water would
ensure appropriate soil moisture
content. Since the discharge water is
full of nutrients it would facilitate the
growth of trees, particularly the various
fruit-bearing ones. This would increase
the growth and development of
seasonal fruits for local people to
consume while the extra amount could
be sold for profit.
820. Overall the use of discharge
water would benefit the agricultural
industry in the Ghorashal region. This
would, in the long run, would elevate
the socio-economic standards for the
people in the region.
821. Since the benefits of
discharged water in agricultural sector
discharge channel. With reduction
of discharges from the Unit 4, the
remaining operating units will be
sufficient for existing irrigation
facilities.
827. Water allocation for
irrigation can be continued as
usual by arranging one of the
intake pumps dedicated for
irrigation facilities. It is possible as
the pumps dedicated for Unit 4
will have the limited use after
adopting the close cycle cooling
system. BADC can go for an
agreement with the GPS in this
regard.
828. BPDB will take up
ammonia release issue from
fertilizer factories to relevant
government agencies.
829. Effluent treatment
complying with national and
international standards before
discharge is recommended.

Public Consultation and Information Disclosure
14-11
Groups/
Sectors Comments/Suggestions/ Concerns Action Points
are huge, the participants suggested
that such facilities remain
uninterrupted in the coming days and
should increase the allocation to cover
additional farming land.
822. Despite the positive outlook of
condenser cooling water on irrigation,
experts, however, think that there
might be possible adverse effects on
agriculture because of the hot
water/oily water discharge from the
plant.
823. Since, the people are
dependent on the Shitalakhhya River
for cultivation, the experts fear that the
chemicals and oily substances
discharged into the river from the
proposed plant might hamper their
agricultural productivity. It might also
affect the growth of nearby plants and
trees.
824. Precautionary and preventive
measures are thus suggested so that
the temperature of the water is kept as
close to ambient temperature as
possible and be removed of any
pollutants before being discharged into
the river.
825. Steps should also be taken to
prevent water-logging as it is one of
the major concerns of agricultural loss.
Ecology
830. Aquatic ecosystem is under
serious threat and being destroyed by
the untreated gaseous emission from
fertilizer factory, power plant etc.;
untreated or improperly treated effluent
of different industries and dumping of
wastes into the nearby Shitalakhya
River
831. The discharged hot water and
chemicals/oily substances released
into the river might kill off various
zooplankton, phytoplankton, fish roes
and fish larvae.
834. Treatment of effluent is
being considered in the design
prior to discharge to Shitalakhya
River.
835. BPDB will take up
ammonia release issue from
fertilizer factories to relevant
government agencies
836. Design has considered the
renovation of cooling water
system which will significantly
lessen warm water in the
discharge channel. Consequently,

Public Consultation and Information Disclosure
14-12
Groups/
Sectors Comments/Suggestions/ Concerns Action Points
832. The lack of fish species, algae,
zooplankton and phytoplankton might
drive other higher species of plants
and animals into extinction such as
lizards, iguanas etc.
833. Measures should be taken to
curb these adverse impacts.
the reduction in warm water
discharge, due to closed cycle
cooling system, to the discharge
channel would contribute to less
warm being discharged into the
river as a whole. River water
would be less warm and would
facilitate the dispersion of these
warm waters via tidal current. This
phenomenon would facilitate
aquatic habitat restoration.
14.5.2 Expert/Institution Consultation
837. Table 14-3 presents list of experts and institutions consulted and their opinion on
different aspects of the proposed GPS repowering project.
Table 14-3: List of experts/institutions consulted and their opinion
Name Organization &
Position Expert Opinion Action points
Mr. Syed Javed
Hossain
(Upazila
Chairman)
Palash Upazila No environmental concern is being observed from the GPS except the quick rental and peaking power plants.
Canalized irrigation which is facilitated by BADC based on the condenser cooling water discharge of the GPS is the blessings for the farmers. It should be continued and more agricultural areas should be brought into the irrigation network.
Excessive warm water is harmful for the aquatic organisms at around the effluent discharge point in Shitalakhya River.
Ammonia gas that releases from the fertilizer factory may cause respiratory problem.
Livelihood will be facilitated after the operation of the proposed power plant.
Skilled manpower particularly the technician has been developed due to
Upazila chairman should consult with GPS and BADC for more use of cooling water discharge and expand the irrigation network
Adoption of close cycle cooling technology with refurbishment and modernization of existing cooling tower; or construction of new cooling tower for Unit-4 will significantly lessen warm water in the discharge channel. Even after the withdrawal of discharges from the Unit-4, the remaining water from other plants will be sufficient for existing irrigation facilities.
Mr. Md. Alam
Mollah
(Vice
Chairman)
Their
associates.

Public Consultation and Information Disclosure
14-13
Name Organization &
Position Expert Opinion Action points
power station; this manpower is supplied to different countries particularly to the Middle East countries.
Consequently the reduction in warm water discharge, due to closed cycle cooling system, to the discharge channel would contribute to less warm being discharged into the river as a whole. River water would be less warm and would facilitate the dispersion of these warm waters via tidal current. This phenomenon would facilitate aquatic habitat restoration. Close cycle cooling will reduce warm water discharge, which will reduce thermal plume in the river. This will facilitate aquatic habitat restoration.
BPDB will take up ammonia release issue from fertilizer factories to relevant government agencies.
Mr. Md. Amirul
Islam
(Upazila
Agriculture
Officer)
Department of
Agriculture
Extension, Palash
Gas released from the Palash Fertilizer Factory is responsible for the yellowish color of the paddy which is less productive.
Radiation of heat may adversely affect the biodiversity close by.
Reduction of birds of this area has been affecting negatively the integrated pest management (IPM) i.e. perching pest control of the crop fields.
Noise and heat radiation may cause sterile to useful insects. This may affect the pollination of the fruiting
BPDB will take up ammonia release issue from fertilizer factories to relevant government agencies.
The repowering project through combined cycle power generation will release less thermal pollution in the atmosphere.
EMP has considered plantation program in the project area,

Public Consultation and Information Disclosure
14-14
Name Organization &
Position Expert Opinion Action points
trees as well as paddy. During winter season irrigation
is highly required which is currently supported by the plant cooling water. Adoption of new technology with low water requirement may affect the present irrigation water demand.
which may provide bird habitats in the future.
Mr. Sajjad
Hossain
(Tubewell
Mechanic)
DPHE, Palash Due to aquifer loss less water
is coming out through shallow tube well during dry season.
Ground water of this area is with less arsenic contamination.
Ground water withdrawal for the power plant if done may decline the ground water availability.
Abstraction of
groundwater is limited
to only potable water
(colony and office use)
Mr. Mosarraf
Hossain
(Sub Assistant
Engineer)
BADC, Palash Depending on the operation of
the units of the GPS water availability differs. Water availability is reduced when units are tripped.
Irrigation facilities linked with GPS covers following unions fully or partially, such as Danga, Jinardi, Char Sindur and Gazaria.
Design has considered the renovation of cooling water system which will discharge relatively cool water and eventually improve current warm water discharge for crop production.
Mr. Mohammad
Azibur Rahman
(Upazila
Fisheries
Officer)
Department of
Fisheries, Palash
Risen temperature in the effluent of condenser cooling that has been discharging into the Shitalakhya River is detrimental for soft fish species like Small Indigenous Species (SIS) including Bele, Mola, and Katchki particularly in the dry season.
Warm water spreads over up to Kauadi close by Desh Bandhu Sugra Mill is not only detrimental to aquatic organisms but also to the microbes essential for fish feed and biodegradation.
Periodical gas released from the fertilizer factory, wastes
Design has considered the renovation of cooling water system which will reduce thermal plume in Shitalakhya River. BPDB will take up ammonia release issue from fertilizer factories to relevant government agencies. The contractors will be encouraged to employ local people in the construction work.

Public Consultation and Information Disclosure
14-15
Name Organization &
Position Expert Opinion Action points
from the Pran Factory, polluted water from dying factories all are harmful for the aquatic organisms as well as for the consumers.
Numbers of fishermen are reduced to around 400 which were about 1,260 in a decade ago in Palash Upazila.
Lakshmi Saha
(Office
Assistant)
Social Welfare
Department
Social safety net is the major
function of the department.
Observance of the corporate
social responsibility (CSR) by
the BPDB parallel to Social
welfare department may
reduce the stress on the social
safety net program.
BPDB will liaison with
Social Welfare
Department for CSR
program under the
proposed repowering
project
Mr. Khabir
Uddin
(Junior
Statistical
Assistant)
Ms. Tania Akter
(Junior
Statistical
Assistant)
Statistical
Department
In-migration of laborers and other service holders from other areas had the down trend due to laying-off of jute mills one after another. Accordingly, economical activities were declining. But construction of the proposed Project may cause the in-migration of different professional people and retrieve the economic activities. [After the shut-down of Fuji Jute Mill a sum of about 500HHs has been shifted to other areas from the Palash Upazila].
Though there will be a population pressure but the local people will be benefitted from getting more house rent.
Periodical gas released from the fertilizer factory has been causing death to aquatic organisms including fishes.
Crop land is reducing over the years; in that case the proposed site is appreciable.
There is no defined kitchen waste dumping area.
The contractors will be
encouraged to employ
local people in the
construction work.

Public Consultation and Information Disclosure
14-16
Name Organization &
Position Expert Opinion Action points
Increased human pressure may cause more stress on waste dumping areas.
Wastes from the Pran Factory have been polluting river water which is harmful for the aquatic organisms.
Female contribution in family level income mainly based on labor selling is increasing in this area.
Mr. Borhan
Ahmed
Titas Gas
Transmission and
Distribution Co.
Ltd. (TGTDCL),
Palash
Gas pipeline connected to GPS from TGTDCL is 100 psig while gas inlet from NSD-TGTDCL for GPS in the range of 350-800 psig.
The diameter of the pipeline from NSD=GPS is 16˶.
The length of the pipeline is about 21 km from Narsingdi to Palash .
These information will
be used by EPC
Contractor while
conducting the gas
related work.
14.6 Disclosure
838. The EIA, documenting the mitigation measures and consultation process, will be
made available for public review in both English and Bengali. The Executive Summary of the
EIA will be published on the BPDB, DOE, and the World Bank’s websites, and the full EIA
will be made available upon request from the World Bank and will also be accessible in
BPDB website. During the consultations, the affected people and the local communities
expressed support for the Project as they clearly saw the benefit to the community as well as
in country. Consultations and public disclosure of information will continue during project
implementation through:
(i) The preparation and dissemination of a brochure in Bengali, explaining the affected peoples’ entitlements and the procedures for obtaining compensation for the loss of trees, crops, and land and the procedure for recording grievances; and
(ii) Setting up of two grievance redress committees (GRCs): local grievance redress committee (LGRC); and project grievance redress committee (PGRC) with a representation from GPS, Ward Councilor, Member, women representative, representative of Civil Society, Owner’s Engineer, and the Contractor in the project area to ensure participatory process and to allow voices of the affected communities in the grievance procedures.
839. The draft EIA will be shared with the stakeholders during a second public
consultation in the project area and in a national workshop in Dhaka. Once finalized, the EIA
will be submitted to the DoE for their review and clearance.
14.7 Grievance Redress Mechanism
840. Grievances are actual or perceived problems that might give grounds for complaints.
As a general policy, Project Implementation Unit (PIU) in association with EHSU Circle will

Public Consultation and Information Disclosure
14-17
work proactively towards preventing grievances through the implementation of impact
mitigation measures and community liaison activities that anticipate and address potential
issues before they become grievances. Minor issues will be resolved by the Contractor in
consultation with Owner’s Engineer.
841. The project will establish a grievance redress mechanism (GRM) for addressing
grievances and complaints received from the project-affected persons. The claims and
complaints will need to be brought to the attention of the Ward Councilor. They will then
forward grievances to the higher levels of authorities as desired. The Grievance Redress
Mechanism is shown in Figure 14-2. The fundamental objective of GRM will be to resolve
any project-related grievances locally in consultation with the aggrieved party to facilitate
smooth implementation of the environmental management plans. Another important
objective is to democratize the development process at the local level and to establish
accountability to the affected people. The procedures will however not a person’s right to go
to the courts of law. It needs to be highlighted that other units of GPS do not have a GRM.
However, with the introduction of GRM in Unit 4, other units may adopt a similar GRM, as
well.

Public Consultation and Information Disclosure
14-18
Complainant
Grievance
Written
Verbal
Action
Taken
Contractor/
Engineer
Local Grievance
Redress Committee
Written
Confirmation
Proceedings
Recoded in database
Action
taken
Proceedings
Recoded in database
Action
taken
No
Yes
Project Grievance
Redress Committee
No
Yes
Categorization
(air, noise, WQ etc.)
Recorded in
Database
Action
pending
No
YesYes
Action
pending
Yes
No
Action
pending
Yes
Figure 14-2: Grievance Redress Mechanism
842. Under the GRM, two grievance redress committees (GRCs) will be formed: local
grievance redress committee (LGRC); and project grievance redress committee (PGRC).
Most of the grievances would be resolved at LGRC within 7 days of receipt of compliant,
while a few might be forwarded to PGRC, which will take two weeks to resolve the
complaint. These GRCs are described below.

Public Consultation and Information Disclosure
14-19
14.7.1 Local Grievance Redress Committee
843. The following LGRC composition has been proposed for the project:
Deputy Manager/Executive Engineer (Environment)– EHSU Circle, GPS: Convener
Ward Councilor: Member Secretary
Environmental Specialist, Owner’s Engineer: Member
Community Representative(s)46: Members
Representative of Women affected persons (APs): Member
Contractors Representative: Member
844. LGRC meetings will be held in the convener’s office in the project impact area or
other location(s) as agreed by the Committee members. If needed, LGRC members may
undertake field visits to verify and review the issues, including mistakes related to temporary
disturbance due to construction works, unauthorized disposal of solid and hazardous
wastes, noise and vibration due to the use of heavy equipment, access restrictions, etc.
14.7.2 Project Grievance Redress Committee
845. The grievances that are not resolved at the LGRC will be forwarded to the PGRC.
The PGRC will be empowered to take a decision, which would be binding on BPDB but it will
require approval of the Project Director for implementation of the decision. The Project
Director will head the PGRC. The composition of the PGRC will be as follows:
Project Director: Chair Person
Manager EHSU Circle, GPS: Member Secretary (Environmental Specialist of Owner’s
Engineer will assist the Member Secretary in grievance redress mechanism).
Representative of Civil Society: Member (nominated by Project Director with the help of
Owner’s Engineer).
846. The Secretary of PGRC with the help of Environmental Specialist of Owner’s
Engineer will provide necessary knowledge and information regarding relevant project
policies and agreements with development partner. The provision of PGRC will further
establish fairness and transparency in the resolution of grievances of the project-affected
persons. In case of technical nature of environmental issues, or any legal matters,
Environmental Specialist of Owner’s Engineer will advise the PGRC. In specific cases,
external legal and or technical advice may also be sought, if required.
46 This may be, for example, any community member representing project affected persons and one woman.


15-1
15. Discussions and Conclusion
847. The project is indispensable to meet the objectives of the nation’s power plan and in
view of the serious shortage of natural gas, the primary energy produced in the country.
Through repowering, the plant’s energy efficiency will increase form 31% to 54%; thus
augmenting power generation with less fuel consumption. As a repowering plant, the
location of the plant is fixed and only alternative analysis in respect of technology was
undertaken and best available technologies have been chosen for the plant and its
subsystems. The plant is going to be one of most cost effective investment in the power
sector delivering power at near lowest price in the country. The knock on economic benefits
will be substantial in industry, business, employment generation, tax revenue and other
sectors. Because of increased energy efficiency of the plant, there will be considerable
emission reduction of CO2 which is a greenhouse gas on per MW basis.
848. This ESIA process was designed to ensure that all potentially significant
environmental impacts are identified and assessed. The ESIA for the plant includes
assessment of the topic areas: air quality, water quality and quantity, the aquatic
environment, terrestrial ecology, ground conditions and flood risk, noise, transport, cultural
heritage, landscape and visual impacts and socio-economic impacts. The ESIA process
included a wide ranging consultation program to inform the local communities and other
stakeholders of the proposed development. The feedback and comments received have
been taken into account during the drafting of the ESIA document where appropriate. The
assessment of environmental impacts have been done using mostly secondary data
available in view of the time constraint. However, the essential conclusions from current
assessment are unlikely to be impacted when more data are available.
849. It will be the obligation of the EPC contractor to submit their Environmental
Management Action Plan (EMAP) before commencement of work since they will be
responsible for the implementation of the EMP during boiler decommissioning, plant
construction and operation. The EMP implementation during the project implementation is
included in the bidding document and its cost will be included the project cost. The EMP will
take care of all the EHS issues in compliance with WBG guidelines and advisory. A
document on existing boiler decommissioning plan has been prepared as part of ESIA.
Implementation of decommissioning plan is included in the EPC contract.
850. The plant is located in an Airshed degraded in respect of particulate matter i.e., both
PM10 and PM2.5. The Airshed is compliant in NAAQS (National Ambient Air Quality
Standards) in respect of other criteria pollutants NO2, SO2, CO and O3. However, because of
the use of sulfur free natural gas and advance combustion technology, the emission levels of
the plant are low for all pollutants including PM. Cumulative impact assessment shows that
the contribution of the plant to PM emission in the Airshed is almost negligible. With the
implementation of this project there is a significant reduction in emissions from the baseline
to repowering case for the Ghorashal power station. Thus, with the implementation of this
project the air quality in the airshed will be brought closer to compliance with national
ambient air quality standards and WHO Guidelines. Continuous ambient air quality
monitoring stations will be installed at the maximum ground level concentration location
during operation phase to keep tract of air quality change with time.

Discussions and Conclusion
15-2
851. The new plant like the old one, will withdraw water from river Shitalakhya. So, the
quantity and quality of water that may be available have been carefully evaluated over a 30
years’ time horizon; the expected life of the plant. Based on these assessment and also the
thermal plume dispersion analysis, the cooling system has been changed to closed cycle
cooling system from the present once through cooling system. This will reduce the water
requirement for the plant by more than 90% and will ensure that the operation of the plant
will not contribute to the thermal effluent stream of the rest of the units of GPS. The essential
water quality data will be generated during the operation phase as part of the environment
monitoring plan to monitor river water quality. The cooling tower is included in the bid
document and a financial allocation of $16 million has been made for this in the EMP budget.
852. The demolition of the existing boiler will produce considerable amount of asbestos
containing material. Asbestos being a hazardous material with be handled and disposed as
per WBG’s Good Practice note on Asbestos (2009) and other international best practice
documents as required to ensure health and safety of both worker and general public. An
on-site concrete lined secured asbestos facility will be constructed within the GPS premises
to dispose and isolate the debris. One of the chemicals, i.e., Hydrazine used in the water
treatment system is a hazardous substance and a carcinogen. Hydrazine will be replaced
with a less hazardous material.
853. Noise level has been identified as a significant potential impact of the proposed
power plant during both the construction and operation phases as RMS, gas pipes, and gas
turbine which are the major components of the plant generate significant noise. However,
noise would not impact major receptors such as schools, residential areas because of the
distance. The EMP has suggested measures to minimize this impact of noise during
construction and operation phases of the plant.
854. An emergency response plan (ERP) for the plant has been prepared for effective
response to deal effectively and efficiently with any emergency, major accident or natural
disaster.
855. A management structure for EMP implementation has been proposed in the EIA
document. During the construction period overall responsibility for implementation of EHS
provision will be the responsibility of EPC Contractor as specified in the contract document.
The EPC contractor will be supervised by owner’s engineer and the environment team of the
PIU. During operation EMP implementation will be the responsibility of the BPDB, i.e.,
project management. Technical Assistance for capacity building for EMP implementation is
included in the project.
856. Overall, it is expected that by repowering, Unit 4 will be more environmentally friendly
compared to the current condition as discussed above. In addition, the unit will substantially
reduce greenhouse gas emissions during its entire lifetime.

16-1
16. References
1. Alam, M. A., Badruzzaman, A. B. M, and Ali, M. A (2012). Spatiotemporal
Assessment of Water Quality of the Shitalakhya River, Bangladesh. International
Journal of Engineering and Technology, 2 (6), pp. 953-962.
2. Asbestos Essentials Task Manual (2001);
www.hse.gov.uk/asbestos/essentials/index.htm
3. Bangladesh Power Development Board (2015). Power Sector Emergency
Information, System Planning Department
4. Bari, M F and Marchand, M. (2006). Management of Rivers for Instream
Requirement and Ecological Protection: Introducing Environmental Flow Assessment
in Bangladesh: Multidisciplinary Collaborative Research. BUET-DUT Linkage Project,
Phase III. Capacity Building in the Field of Water Resources Engineering and
Management. 12 pages.
5. Billah, M., Chatani, S., and Sudo, K. (2009). Application of WRF-CMAQ Modeling
System to Study of Urban and Regional Air Pollution in Bangladesh. Retrieved from
https://www.cmascenter.org/conference/2009/abstracts/billah_application_wrf-
cmaq_2009.pdf
6. Ghorashal Thermal Power Plant, 2nd Phase, Unit4. Working Project of Heat
Insulation. Code: 087-04-11-TN; Book I Explanatory Note - Volumes of Work and
materials .
7. Government of Bangladesh Planning Commission (2015). Background Paper for the
7th Five Year Plan. Environment, Forestry and Biodiversity Conservation. Retrieved
from http://www.plancomm.gov.bd/7th-five-year-plan/
8. Government of the People’s Republic of Bangladesh (2012). Perspective Plan Of
Bangladesh 2010-2021: Making Vision 2021 A Reality. Retrieved from
http://www.plancomm.gov.bd/wp-content/uploads/2013/09/Perspective-Plan-of-
Bangladesh.pdf
9. Government of the People’s Republic of Bangladesh - Ministry Of Power, Energy
And Mineral Resources (2004). National Energy Policy. Retrieved from
http://www.petrobangla.org.bd/NEP_2004_fulldoc.pdf
10. Gumbel, E. J. (1958). Statistics of Extremes, pp 375. Columbia University Press,
New York.
11. Hanrahan, P.L. (1999). The Plume Volume Molar Ratio Method for Determining
NO2/NOx Ratios in Modeling—Part I: Methodology. Journal of the Air & Waste
Management Association, 49(11), pp 1324-1331.
12. International Finance Corporation (2007). Environmental, Health, and Safety General
Guidelines. Retrieved from
http://www.gcgf.org/wps/wcm/connect/554e8d80488658e4b76af76a6515bb18/Final
%2B-%2BGeneral%2BEHS%2BGuidelines.pdf?MOD=AJPERES
13. Ontario Ministry of the Environment and Climate Change (2004). Air Dispersion
Modelling Guideline for Ontario. Ministry of the Environment, Canada.
14. Sarraz A., Ali M. K., Das D. C. (2015). Seismic Vulnerability Assessment of Existing
Buildings Stocks at Chandgaon in Chittagong city, Bangladesh. American Journal of

References
16-2
Civil Engineering, 3(1), pp 1-8. Retrieved from
http://www.sciencepublishinggroup.com/j/ajce
15. Spath, P. and Mann, M. (2000). Life Cycle Assessment of Natural Gas Combined
Cycle Power Generation System. Retrieved from
http://library.umac.mo/ebooks/b28020261.pdf.
16. Sarraz A., Ali M. K., Das D. C., 2015; Seismic Vulnerability Assessment of Existing
Buildings Stocks at Chandgaon in Chittagong city, Bangladesh, American Journal of
Civil Engineering 2015; 3(1): 1-8, retrieved from
http://www.sciencepublishinggroup.com/j/ajce
17. TEPCO (2010). Power System Master Plan, Power Division. Ministry of Power,
Energy and Mineral Resources, Government of the Peoples Republic of Bangladesh.
Retrieved from http://www.powerdivision.gov.bd/user/brec/112/58.
18. The Dow Chemical Company (n.d.). Retrieved on 16th May, 2015 from
http://www.dowwaterandprocess.com/en/Industries%20and%20Applications/Industria
l_Water/Boiler_Feed_and_Process_Water/Demineralization/Reverse_Osmosis
19. The Environment Conservation Rules (1997). Retrieved from
https://www.elaw.org/system/files/Bangladesh+--
+Environmental+Conservation+Rules,+1997.pdf.
20. The Environmental Conservation Act (1995). Retrieved from
http://faolex.fao.org/docs/pdf/bgd42272.pdf.
21. The World Bank (1999). OP 4.11 - Cultural Property. Retrieved from
http://siteresources.worldbank.org/INTFORESTS/Resources/OP411.pdf.
22. The World Bank (2012). OP 7.50 – Projects on International Waterways. Retrieved
from
https://www.se.gob.ar/contenidos/archivos/permer/PoliticaAguasInternacionales2001
23. The World Bank (2013a). OP 4.01 - Environmental Assessment. Retrieved on 7th
April, 2015 from
http://web.worldbank.org/WBSITE/EXTERNAL/PROJECTS/EXTPOLICIES/EXTOPM
ANUAL/0,,contentMDK:20064724~menuPK:4564185~pagePK:64709096~piPK:6470
9108~theSitePK:502184,00.html
24. The World Bank (2013b). OP 4.10 - Indigenous Peoples. Retrieved from
http://www.bicusa.org/wp-content/uploads/2013/10/FINAL-BANK-IP-
SAFEGUARD.pdf.
25. The World Bank (2013c). OP 4.12 - Involuntary Resettlement. Retrieved from
http://www.bicusa.org/wp-content/uploads/2013/10/FINAL-BANK-IR-
SAFEGUARD.pdf.
26. Trivedi, A.K., Ahmad, I., Musthapa, M.S., Ansari, F.A. and Rahman, Q. (2004).
Environmental contamination of chrysotile asbestos and its toxic effects on growth
and physiological and biochemical parameters of Lemna gibba. Archives of
Environmental Contamination and Toxicity, 47(3), pp 281-289.
27. U.S. Environmental Protection Agency (2009). USEPA AP 42 Compilation of Air
Pollutant Emission Factors, 5th ed., vol. 1: Stationary Point and Area Sources.
Retrieved from http://www.epa.gov/ttn/chief/ap42/index.html.
28. U.S. Environmental Protection Agency (2010). Applicability of Appendix W Modeling
Guidance for the 1-hour N02 National Ambient Air Quality Standard. Retrieved from

References
16-3
http://www.epa.gov/scram001/guidance/clarification/ClarificationMemo_AppendixW_
Hourly-NO2-NAAQS_FINAL_06-28-2010.pdf
29. U.S. Environmental Protection Agency (2014). Clarification on the Use of AERMOD
Dispersion Modeling for Demonstrating Compliance with the NO2 National Ambient
Air Quality Standard. Retrieved from
http://www.epa.gov/scram001/guidance/clarification/NO2_Clarification_Memo-
20140930.pdf
30. Water Aid Bangladesh (2006). Step by Step Implementation Guidelines for Public
Toilet. Retrieved from
file:///C:/Users/Redwan/Downloads/public%20toilet%20guidelines%20rural.pdf
31. WBG’s General EHS Guidelines: Environmental, Wastewater and Ambient Water
Quality, 2007
32. WBG Environmental, Health, and Safety Guidelines for Thermal Power Plants, 2008
33. WBG’s Good Practice Note: Asbestos, 2009
34. WHO Air Quality Guidelines for Asbestos in Europe, 2000
35. WHO Air Quality Guidelines, 2005
36. WHO Guidelines for Drinking-water Quality, 2010

ANNEXES

Annex 1-1
Annex 1.1-1
Annex 1.1: Terms-of-Reference of the EIA Study
ENVRONMENTAL ASSESSMENTFOR REPOWERING OF UNIT-4
GHORASHAL POWER STATION
A.Background
1. Ghorashal is a major power generation center of BPDB located on the eastern bank of river
Shitalakhya in the Palash Upazilla of Narsingdi District. Currently, it has six generating units with a
nominal generating capacity of 950MW (2x55MW and 4x210 MW) based on gas fired conventional
steam turbine technology. The average efficiency of the plants at Ghorashal is around 31% which is
quite poor compared to the efficiency of around 55% for the modern combined cycle power plants.
Studies have shown that repowering of Ghorashal plants is technically feasible and highly beneficial
economically. BPDP is already in the process of repowering three of the four 210 MW units and there
is no reason why other units will also not be upgraded given the benefits. Thus, eventually the
capacity of Ghorashal will probably be around 2000MWor more. Such capacity increase will call for
upgrading of infrastructure of the Ghorashal complex both physical and environmental. As the plants
are expected to have lifetime of 30 years or more, the environmental infrastructures such as water
supply have to be planned for all the units (i.e., based on strategic overview) as piecemeal changes
may not be efficient or cost effective. The same is true for land use planning.
2. The purpose of the current project is to repower unit-4 (nominal capacity of 210 MW) of the
Ghorashal power plant. The World Bank has agreed to finance the project. The project involves the
replacement of the current steam plant with a more efficient combined cycle plant. As part of new
plant, a gas turbine will be installed and the present boiler will be replaced by a HRSG (Heat
Recovery Steam Generator). The steam turbine may or may not be retained depending on the
assessment of its residual life. This means that the current boiler has to be decommissioned.
Environmental issues remain the biggest and most costly items to address as part of
decommissioning. The boiler for the unit-4 power plant is quite a massive installation. It consists
mainly of steel structures containing sheet metals, beams, bars and carbon-steel pipes. The steam
carrying pipes are insulated with asbestos and fiber glass according to information available. The total
weight of the boiler installation is expected to be several thousand tons with asbestos containing
material probably more than 50 tons. Asbestos is considered as a hazardous material (CAS# 1332-
21-4) and its use is banned in many countries especially in developed ones. Thus, Asbestos
abatement must occur before any demolition. The guidelines on hazardous materials have to be
followed in addition to general EHS 47 (Environmental Health and Safety) guidelines during
decommissioning of the boiler installation.
3. With the proposed repowering, the needed quantity and quality of water will also change. A
comprehensive assessment of water requirement for next 30 years in terms of quality, quantity,
treatment technology, cooling water options, heat plume dispersion etc. have to be carried out. It is to
be noted that HRSGs require high-purity water because of the use of the IP drum steam for turbine
injection (i.e., for reducing NOx emission). Dissolved solids must be kept to a bare minimum in these
units. Hydrazine(CAS# 302-01-2), which is currently being used as de-oxygenator for boiler feed
water, is considered as a highly hazardous material and a carcinogen. As per WBG's guideline
hydrazine can no longer be used as less toxic alternative is available (i.e.,Carbohydrazide). In addition
to being less toxic, carbohydrazide is also an extremely effective metal passivator.
47 WBG Environmental, Health, and Safety Guidelines for Thermal Power Plants, 2008

Annex 1-1
Annex 1.1-2
4. Water from primary treatment appears to contain rather high TDS (i.e.,reportedly 250mg/l).
Use of high TDS feed water for the deionization plant require regeneration of resin columns at short
intervals (i.e., reportedly every three minutes or so). For frequent resin regeneration, more acid and
alkali are required and this also reduces the life of the resin. It appears essential to reduce the TDS
level of feed water to the demineralization plant by using technologies like RO (Reverse Osmosis).
5. It may be noted that not more than 10% of water flow can be intercepted from the river as per
WBG's guidelines. The Shitalakhya River is a distributary of the old Bhramaputra River. The water
flow in the old Bhramaputra River has decreased considerably in recent times (i.e., last 30 years). So,
it is not unlikely that in next 30 years the flow may decrease even further which may lead to drastic
decrease of water flow in Shitalakhya River (i.e., currently reported to be 74 m3/s) especially during
the dry season (i.e., Nov – May). Thus, it may be necessary to move away from once through cooling
currently in use, to closed cycle cooling. Such a change if decided will add additional cost for the
project for cooling towers.
6. In the repowering process, the best available technologies will be used that will also minimize
environmental pollution levels. In addition to the repowering, the proposed project includes new gas
pipeline with Regulating & Metering Station (RMS) in the Ghorashal Power Plant Complex.With the
purpose of obtaining Site Clearance and Environmental Clearance Certificates from Department of
Environment of Bangladesh it is required to carry out Initial Environmental examination (IEE) and
Environmental Impact Assessment (EIA) studies. For financing by the World Bank, the EIA document
has to compatible with Bank’s operational policies and guidelines.
7. The Bangladesh Power Development Board (BPDB) is to hire a consulting firm (the
Consultant) to carry out an Environmental Assessment (EA) of the proposed project i.e., repowering
and new gas pipeline with RMS
B. Objective of the Assignment
8. The objective of the assignment is to prepare the Environment Assessment (EA) report of the
repowering of the Unit-4 and associated infrastructure (gas pipeline within Ghorashal Power Plant
Complex) to meet the compliance requirement of the Government of Bangladesh (GoB)48 and the
World Bank.
9. The specific objectives are:
i. Conduct Initial Environmental Examination to identify possible environmental and socio-
economic impacts with possible mitigation measures and a tentative Environmental
Management Plan; and
ii. Conduct Environmental Impact Assessment with detail environmental baseline survey,
prediction and evaluation of possible environmental and socio-economic impacts, and detail
Environmental Management Plan.
10. The consultant will assess as appropriate, the impacts of a range of reasonable and
technically feasible alternatives as well as the proposed project. The alternatives to the project must
include a “no action” alternative, indicating what would happen in the absence of the proposed project
as well as consideration of best practices that may not otherwise have been incorporated in the
proposed project. Other alternatives should be developed as needed to address significant issues
with the proposal.
48 The GoB requires 2 stages environmental assessment as per ECA’95 and ECR’97: (i) initial environmental examination and
site clearance; and (ii) environmental impact assessment and environmental clearance.

Annex 1-1
Annex 1.1-3
11. The assessment will consider all relevant plans related to the proposed project, for example,
engineering and site preparation plans, operations and decommissioning/closure, environmental
management, and mitigation in whatever form these may take.
12. The consultant will prepare a water balance for the different uses of water from the
Shitalakhya River for the next 30 years and assess whether any rehabilitation of river would be
required to sufficient water for the power plant needs and other consumers of the water. If the
upgrade of the river front structures would be required, the impact of the upgrade as well as mitigation
and monitoring measures will be covered under this assignment.
13. In addition to the impacts of the proposed project activities, the EA will also investigate
possible cumulative impacts through the combination of project impacts and background
concentrations and impacts from other economic activities (‘domino’ impacts).
14. The consultant will consider uncertainty and how that uncertainty will be addressed through
monitoring and contingency plans as may be needed to reduce risk of adverse impacts in the future.
15. The EA report will provide specific plans on the responsibility as to how the environmental
actions, monitoring, reporting and auditing will be done.
16. The consultant will make presentations on EIA report to the client, World Bank and DoE at the
draft and final stage.
17. The consultant will respond to DOE’s and the World Bank clarifications and queries in respect
of application submitted for DOE’s environmental clearance certificate and the World Bank’s
clearance on EIA report.
18. The Erection, Procurement and Construction (EPC) Contractor will be selected after the EA
report has been prepared. As a consequence, the EA report will not capture the details on design or
technology choices, but it will be based on the assessment of available information and standards to
be met. Based on the EA report, the EPC contractor will prepare the detailed environmental action
plan with the implementation schedule considering the detailed design and technology options.
C. EA Requirement
19. The Government’s Environment Conservation Act (amended 2010) is currently the main
legislation relating to environment protection in Bangladesh. This Act is promulgated for environment
conservation, environmental standards development and environment pollution control and
abatement. Environment Conservation Rules (ECR), 1997 and Amendments provide categorization of
industries and projects and identify types of environmental assessment required against respective
categories of industries or projects. The proposed project is ‘Red’ category project as the ECR’97. In
addition, the Consultant will also need to identify any other government laws, regulations and
guidelines applicable for the project.
20. The Bank requires environmental assessment (EA) of projects proposed for Bank financing to
help ensure that they are environmentally sound and sustainable, and thus decision making. EA will
take into account the natural environment (air, water, and land), human health and safety, social
aspects (involuntary resettlement, indigenous people, and physical cultural resources), transboundary
and global environmental aspects. The borrower is responsible for carrying out the EA.
21. The proposed project will fall under ‘Category A’ as per the World Bank policies and BPDB
requires an Independent Environmental Assessment Firm (not affiliated with the project) to carry out
the environmental assessment (EA). According the policy, the EA is closely integrated with project’s
economic, financial, institutional, social and technical analyses to ensure that environmental
considerations are given adequate weight in project selection, siting and design decisions.
22. Again, when one or more members of the World Bank Group are involved in a project, the
Environmental, Health, and Safety (EHS) Guidelines are applied as required by their respective

Annex 1-1
Annex 1.1-4
policies and standards. These EHS Guidelines are technical reference documents with general and
industry-specific examples of Good International Industry Practice (GIIP). There are General EHS and
Industry/Sector specific EHS Guidelines. The General EHS Guidelines are designed to be used
together with the relevant Industry/Sector EHS Guidelines which provide guidance to users on EHS
issues in specific industry sectors.
D. Scope of Initial Environmental Examination (IEE)49
23. The scope of works includes mainly preparation of IEE reports and activities essential for the
preparation of the reports. The scope of the services is detailed below:
Selection of the proposed site which involves minimum agricultural land, minimum habitats to
be displaced, minimum/avoiding hilly area, use maximum Government land (if available) and
develop suitable layouts.
Land acquisition plan from the office of the Deputy Commissioner’s office (if required).
Land use/ Land cover including ecologically critical area, national parks, forest, orchard,
cultural heritage site etc., if any, in the site selected for the power plant.
Topographical survey of the selected project site.
Meteorological data collection of the site from Bangladesh Meteorological Department (BMD).
Hydrological and morphological data collection from BWDB and BIWTA.
Agro-ecological zones data collection from AEZ report.
Agricultural data collection from BBS and DAE.
Water resources and soil salinity data collection from BWDB and SRDI.
Collection of data on access to site
Soil investigation of the selected site.
Seismicity analysis.
Sources of water during construction and operation.
Effluent disposal point(s).
Data on water quality, air quality and noise level.
Transportation of raw material and fuel.
Collection of Preliminary planning, design and drawing of power plants.
Specific statutory requirements applicable in Bangladesh.
Establishment of the environmental and social baseline condition in respect of water
resources, air quality, noise level, land resources including land use/land cover, agriculture,
fisheries, ecosystems and socio-economic condition.
Public consultation and disclosure
Identification of Important Environmental and Social Components (IESC).
Assessment of impacts of the proposed power plant on the environmental and social
components.
Preliminary Environmental Management Plan (EMP).
Risk and hazard analysis.
Terms of Reference (TOR) for the Environmental Impact Assessment (EIA) study for approval
by DOE.
Produce an IEE report, which shall form the basis of obtaining location/ site clearance from
the DOE.
E. Scope of Environmental Impact Assessment (EIA)
24. The scope of works includes carrying out environmental impact assessment of the proposed
project that will satisfy the applicable environmental requirements, including the laws, bylaws and
49 This is requirement of ECR’97. The World Bank Policy does not require IEE report.

Annex 1-1
Annex 1.1-5
rules of Bangladesh and World Bank Group’s operational policies, guidelines including health and
safety guidelines. The scope of the services is detailed below:
Task 1. Describe the proposed project
25. Elaborate project description including location of all project-related development sites,
including offsite investments, general layout of facilities at project-related development sites, drawings
of facilities, size, capacity, flow through of unit operations, including pollution control technology, pre-
construction activities including decomissioning of exstig boiler, construction activities and schedule,
commissioning, operation and maintenance activities, staffing and support for different phases,
facilities and services,life expectancy for major components.
Task 2. Description of the Environment(baseline conditions)
26. Assemble and evaluate baseline data on the physical, biological and socioeconomic
characteristics of the project area and area of influence. The environemntal parameters have to be
collected, measured and presented in ways which are consistent with applicable environmental
standards, norms, and requirements of both national (i.e., ECR’97 and its latter amendents) and
international (i.e., WB operational policies and guidelines). Include information on any changes
anticipated before the project commences.
(a) Physical Environment: geology (e.g., stratigraphy and seismic history of project areas),
topography (e.g., drainage patterns around construction areas),climate and meteorology (e.g.,
prevailing wind patterns around stacks and other sources of emissions, precipitation patterns at
residue disposal sites),noise level, ambient air quality (e.g., ability to assimilate emissions and
maintain air quality standards), input from other major pollutant generators in the area (if any), surface
water hydrology including flood hazard potential, water resources (e.g., adequacy of water supplies),
receiving water quality (e.g., ability to assimilate effluent discharges and maintain water quality
standards for desired uses, input from major pollutant generators in the area, if any); significant
pollutant sources in the area and prospect for their mitigation.
(b) Biological environment: flora (e.g., types and diversity), fauna (e.g., resident and
migratory), rare or endangered species within or in areas adjacent to project, sensitive habitats,
including wetlands, parks or reserves, significant natural habitats within or in areas downstream/down
gradient of project area, species of commercial importance in areas affected by the project.
(c) Socio-cultural environment: (both present and projected in the sourrounded area of the
Glorashal power plant): e.g., population, land use (i.e., year-round and seasonal), community
structure, employment and labor market, distribution of income, goods and services, recreation, public
health; education; cultural properties (e.g., archaeological and historically significant sites), indigenous
peoples and traditional tribal lands; customs, aspirations and attitudes.
Task 3. Legislative and Regulatory Considerations
27. Review the pertinent policies, laws, regulations and standards governing environmental
quality, health and safety (please refer to section C of this ToR) and explain the possible implication of
the policies, laws, regulations and standards on the proposed project.
Task 4. Determination of the Potential Impacts of the Proposed Project
28. The consultant will predict and assess all significant impacts that the project is likely to
generate, in quantitative terms as far as possible. These may include, but not be limited to, changes in
the following: wastewater effluents and atmospheric emissions and solid wastes (empahsis on waste
characteristics of decomissioned unit and repowered plants and means to reduce pollution emissions

Annex 1-1
Annex 1.1-6
and effluents as part of the production process), land use, infrastructure, exposure to disease, noise,
and traffic, socio-cultural behavior). Assess the impacts from changes brought about by the project
on baseline environmental conditions as described under Task 2.
29. In this analysis, the consultant will distinguish between significant positive and negative
impacts, direct, indirect and cumulative impacts, and immediate and long-term impacts. Include indirect
impacts from the increased power supply (e.g., industrial expansion and increased urbanization).
Identify impacts that may occur due to accidental events (e.g., leakage from a gas pipeline).Identify
impacts that are unavoidable or irreversible. Wherever possible, describe impacts quantitatively, in
terms of environmental costs and benefits. Assign economic values when feasible.The impact
analysis will be divided into decommissioning of boiler impacts, other pre-construction impacts,
construction impacts and operations impacts. The followings are some key specific scopes under
Task 4.
(a) Carry out in-depth impact assessment of decomssionig of the boiler and other assoicated
equipment. Special attention will be provided on asbestos of steam carrying pipes and hydrazine used
as de-oxygenerator for bioler feed water. The risk and hazard assessment will extensively cover how
the hazardous materials will be collected, handled and managed.
(b) Assess the overall potential impacts and risks associated with collection and disposal of
liquid waste and solid waste from decommisioning, other pre-construction activities, construction and
operation operation facility.
(c) Assess impact of project decomissinoning, storage, construction and operation on the
gorund water from potential leaching and/or percolation of toxic or harmful substance.
(d) Assess impact of the project decomissioning, construction and operation on the biological
environment with particular focus on endangared, threatended and protected species.
(e) Carry out a comprehensive water need assessment including hydrological
investigations.A comprehensive assessment of water requirement for next 30 years in terms of
quality, quantity, treatment technology, cooling water options, heat plume dispersion etc. will be
carried out. It is to be noted that HRSGs require high-purity water because of the use of the IP drum
steam for turbine injection (i.e., for reducing NOx emission). Assessment will include the option to
move away from once through cooling currently in use, to closed cycle cooling.
(f) Identify plant’s impacts on air quality especially due to PM2.5, PM10 and NOx on the local
environment using dispersion modelling. Identify exhaust stack requirements (as per DOE rules)
applicable to the plant so that concentration of NOx and particulate matter in the surrounding area is
within standards.
(g) Assess impact of the project with respect to generation of noise and vibrations (with focus
on workers, neighboring communities and business, and sensitive natural receptors) on account of
construction equipment and construction activities.
(h) Conduct thermal plume modelling to evaluate hot water discharge into Shitalakhya River
so that it complies with the WB guidelines (i.e., <3oC), considering the proposed power plant and
planned changes for other units.
(i) Assess the occupational health and safety risk of the proposed project at different phases.
Evaluate the issues related to comply with all health and safety and environmental laws of
Bangladesh and the requirements of the World Bank Group. Identify any restriction that will
reasonably be imposed on the developers of the power generation projects to ensure that expansion
projects can be designed, constructed and operated in compliance with all such laws, regulations and
requirements and also international obligations.
Task 5. Analysis of Alternatives to the Proposed Project
30. The EA will include a systematic analysis of feasible alternatives to meet the ultimate project

Annex 1-1
Annex 1.1-7
objectives. This analysis may suggest designs that are sounder from an environmental perspective
than the originally proposed project. Include the "no action" alternative (no major development work) to
demonstrate environmental conditions without it. Alternatives will also include the following: the
alternative of upgrading (repowering) existing facilities, alternative means of meeting the energy
requirements, complete replacement of existing power plant, alternative design, and alternative
methods of construction, including costs and reliability.
31. The consultant will make an comparison of altenatives in terms of: potential environmental
impacts, feasibility of mitigating impacts, capital and operating costs, suitability under local conditions
(e.g., skill requirements, public cooperation, availability of parts, level of technology), and institutional,
training, and monitoring requirements. When describing the impacts of alternatives, the consultant
will indicate which impacts would be irreversible or unavoidable and which may be mitigated.
32. To the extent possible, the consultant will quantify the costs and benefits of each alternative,
incorporating the estimated costs of any associated mitigating measures. Describe the reasons for
selecting the proposed project over the other alternatives on environemntal prespective.
Task 6. Cummulative Impact Assessment
33. The consultant will carry out the cumulative impact assessment to identify cumulative
impacts on Valued Environmental Components (VECs) like as water bodies or watercourses,
community health, atmospheric environment (air quality), acoustic environment (noise) etc. due to
the cumulative effects of existing and future activities in the influence area (within and beyond the
Ghorashal power plant) from the power plants and other economic activities. The scopes of the
cummulative impact assessment are:
(a) Identify the VECs associated with the proposed project in consultation with stakeholders, communities, local NGOs and define the assessment goals.
(b) Establish the geographic scope for the analysis.
(c) Establish the timeframe for the analysis.
(d) Identify the other actions affecting the VECs (including resources, ecosystem and communities).
(e) Characterize the VECs in terms of their responses to change and capacity to withstand stresses.
(f) Characterize the stresses affecting VECs.
(g) Review the baseline defined under Task-2 and if required, uodate the baseline to include selected VECs.
(h) Identify the important cause-and-effect relationship between human activities and VECs.
(i) Determine the magnitude and significance of cummulative effects.
(j) Modify or add alternatives to avoid, minimize or mitigate significant cummulative effects.
Task 7. Development of an Environmental Management Plan (EMP)
34. The consultant will recommend feasible and cost-effective measures to prevent or reduce
significant negative impacts to acceptable levels. This will include measures to address emergency
response requirements for accidental events and occupational health & safety.
35. The consultant will estimate the impacts and costs of those measures, and of the institutional

Annex 1-1
Annex 1.1-8
and training requirements to implement them. Prepare a management plan including proposed work
programs, budget estimates, schedules, staffing and training requirements, and other necessary
support services to implement the mitigating measures. Provide environmental protection clauses for
application by EPC contractor and consultant.
36. The consultant will prepare a detailed plan to monitor the implementation of mitigating measures
and the impacts of the project of other inputs (such as training and institutional strengthening) needed
to conduct it during construction and operation. This will include an estimation of capital and operating
costs and a description of other inputs (such as training and institutional strengthening) needed to
implement the plan.
37. The detailed scope for EMP includes:
(a) Prepare a set of mitigation and management measures to be taken during
decommissioning, other pre-constructions, construction and operation period to avoid, reduce,
mitigate, or compensate for adverse environmental impacts.
(b) Prepare separate plan for (i) boiler decomissioning, (ii) occupational health & Safety and
(iii) emergency response & disaster management.
(c) Describe each mitigation measure with technical details, including the type of impact to
which it relates and the conditions under which it is required (for instance, continuously or in the event
of contingencies), together with designs, equipment descriptions, and operating procedures, as
appropriate.
(d) Quantify and assign financial and economic values to mitigating methods and also
quantify associated costs.
(e) Delineate the desired outcomes of each item of the management plan as measurable
events to the extent possible, such as performance indicators, targets or acceptance criteria that can
be tracked over defined time periods.
(f) Prepare environmental monitoring program, which should ensure that the mitigation plans
are respected including the technical aspects of monitoring, measurement methodologies, data
analysis, and reporting schedules, and detailed budget & procurement schedules of environment
related equipment and materials.
(g) Describe mitigation, monitoring and reporting procedures and responsibilities to ensure
early detection of conditions that necessitate particular mitigation measures and document the
progress and results of mitigation.
(h) Describe the desired outcomes as measurable events to the extent possible, such as
performance indicators, targets, or acceptance criteria that can be tracked over defined time periods.
(i) Describe institutional or organizational arrangements, such as, who is responsible for
carrying out the mitigation and monitoring measures including capital and recurring cost and
describes the sources of fund.
(j) Prepare plan to strengthen environmental, and occupational health & safety management
capability: technical assistance programs, training programs, procurement of equipment and supplies
related to environmental management and monitoring, and organizational changes.
Task 8.Consultation, Disclosure and Grievance Redress
38. The Consultant will assist BPDB in coordinating the EA with relevant stakeholders and to
facilitate consultation with communities, local NGOs and other stakeholders on the environmental
aspects of the proposed project. These groups will be consulted at least twice: in meetings held during
scoping of the study and when a draft EA is available (a summary of the EA in local language will be
available prior to the meeting). The draft EA should also be available in a public place accessible to
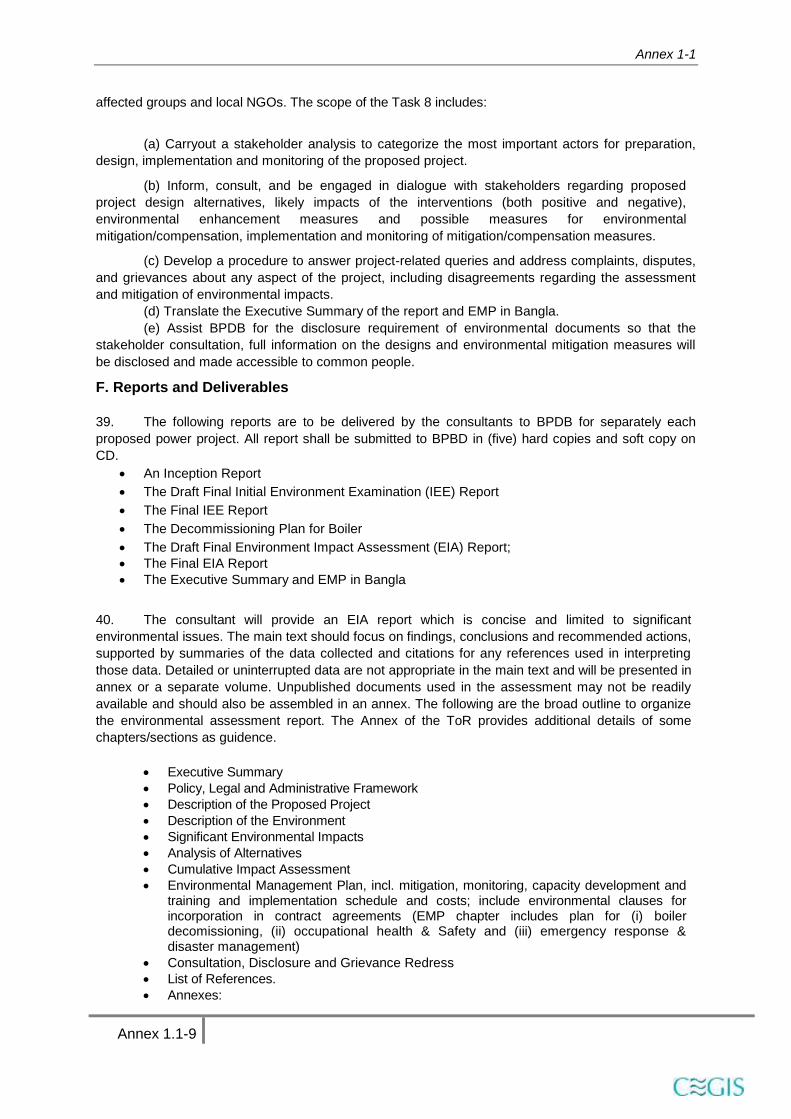
Annex 1-1
Annex 1.1-9
affected groups and local NGOs. The scope of the Task 8 includes:
(a) Carryout a stakeholder analysis to categorize the most important actors for preparation,
design, implementation and monitoring of the proposed project.
(b) Inform, consult, and be engaged in dialogue with stakeholders regarding proposed
project design alternatives, likely impacts of the interventions (both positive and negative),
environmental enhancement measures and possible measures for environmental
mitigation/compensation, implementation and monitoring of mitigation/compensation measures.
(c) Develop a procedure to answer project-related queries and address complaints, disputes,
and grievances about any aspect of the project, including disagreements regarding the assessment
and mitigation of environmental impacts.
(d) Translate the Executive Summary of the report and EMP in Bangla.
(e) Assist BPDB for the disclosure requirement of environmental documents so that the
stakeholder consultation, full information on the designs and environmental mitigation measures will
be disclosed and made accessible to common people.
F. Reports and Deliverables
39. The following reports are to be delivered by the consultants to BPDB for separately each
proposed power project. All report shall be submitted to BPBD in (five) hard copies and soft copy on
CD.
An Inception Report
The Draft Final Initial Environment Examination (IEE) Report
The Final IEE Report
The Decommissioning Plan for Boiler
The Draft Final Environment Impact Assessment (EIA) Report;
The Final EIA Report
The Executive Summary and EMP in Bangla
40. The consultant will provide an EIA report which is concise and limited to significant
environmental issues. The main text should focus on findings, conclusions and recommended actions,
supported by summaries of the data collected and citations for any references used in interpreting
those data. Detailed or uninterrupted data are not appropriate in the main text and will be presented in
annex or a separate volume. Unpublished documents used in the assessment may not be readily
available and should also be assembled in an annex. The following are the broad outline to organize
the environmental assessment report. The Annex of the ToR provides additional details of some
chapters/sections as guidence.
Executive Summary
Policy, Legal and Administrative Framework
Description of the Proposed Project
Description of the Environment
Significant Environmental Impacts
Analysis of Alternatives
Cumulative Impact Assessment
Environmental Management Plan, incl. mitigation, monitoring, capacity development and training and implementation schedule and costs; include environmental clauses for incorporation in contract agreements (EMP chapter includes plan for (i) boiler decomissioning, (ii) occupational health & Safety and (iii) emergency response & disaster management)
Consultation, Disclosure and Grievance Redress
List of References.
Annexes:

Annex 1-1
Annex 1.1-10
- List of Environmental Assessment Preparers - Records of Communications and consultation - Data and Unpublished Reference Documents
G. Responsibilities of Consultants
41. The consultant shall carry out the services as detailed in “Scope of Works” in the best interest
of the BPDB with the reasonable care, skill and diligence with sound engineering administrative and
financial practices and shall be responsible to the executive agency (BPDB) for discharge of
responsibilities. In addition, the consultant will address the comments of the BPDB, DoE, World Bank
and any other independent reviewer appointed by the government or the World Bank. The consultant
will provide clarification and revise the report accordingly.
H. Responsibility of the Clients
42. The client, Bangladesh Power Development Board will provide all necessary information on
project design, process and data as per requirement of Department of Environment. In addition, the
client will facilitate the study with necessary support and references in collecting data from different
Government Departments.
I. Resources Requirement/Qualification of Professionals
43. The EA requires interdisciplinary analysis. The general skills required of an EA team are:
Environment Assessment Specialist, Power System Engineer, Environmental Management Planner,
Air Quality Modeling Specialist, Water Resources Specialist, Water Quality Specialist, Hazardous
Waste Management Specialist, Institutional Specialist, Ecologist and Occupational Health & Safety
Specialist particular esperience in desommissioning. The consulting team must be able to
demonstrate appropriate skill mix and depth of experience to cover all areas of the proposed analysis,
including incorporation of other specialized skill sets where required. The consulting team shall be led
by a Team Leader with at least 10 years of experience leading EIA studies, including prior
international experience on similar types of power projects, and prior experience as either team leader
or deputy team leader on major infrastructure EAs for World Bank/ADB funded projects.
44. Following is an indicative allocation of manpower for the study. The Consultant is free to
employ resources i.e. support staff as they see fit to carry out the assignment within stipulated time and
meet the requirement of this service.
Annex- Reports
The IEE report has to be completed following the DoE’s guideline. The EIA report should be
prepared following the Format provided in section E. The following are additional and
detailed points of some chapters/sections. The consultant is also required to include the
points given below. However, these do not represent the table of contents of the EIA report.
The broad EIA report content has been presented in the section E of the ToR. The followings
are additional guidance which the consultants have to follow based on their judgment for
best presentation of the report.
I. Acronyms and abbreviations
All acronyms and abbreviations used in the document should be defined, so that the reader will
not have to look for their first occurrence.
II. Executive Summary
The ES should mirror the main report both in form and content. It should be about 10% of the
report in length.
III. Introduction
III.1. Background

Annex 1-1
Annex 1.1-11
III.2. Purpose of the Study
III.3. Need of the Project
III.4. Importance of the Project
III.5. Scope of EIA Study
III.6. EIA Team
IV. Legal and Legislative Framework, Regulations and Policy Considerations
(including inter alia National Policies, Laws and rules on relevant issues such as
Environment , Energy , Industry, Water , , Land use, , Fisheries , Natural gas
policy, etc.; Relevant WB operational policies and Guidelines, Relevant international
Treaties and obligations )
V. Project Data Sheet
V.1. Project Proponent
V.2. Project location and area
V.3. Nature and Size of the Project
V.4. Project Concept
V.5. Project Components
V.6. Project Activities
V.7. Project schedule
V.8. Resources and utilities demand
V.9. Sources of NG and Quality
V.10. Pipelines for NG
VI. Project Description
VI.1. Project Site
VI.2. Project Layout including site drainage
VI.3. Land Requirement
VI.4. Fuel Requirement
VI.5. Water Requirement and Hydrology of Shitalakhya
VI.6. Technology Selection and Process Description
VI.7. Description of Major Sub-Systems
VI.7.1 Power station facilities (CC, HRSG, Steam Generator)
VI.7.2 Plant Control System
VI.7.3 Cooling Water system
VI.7.4 Water Supply and Treatment System
V1.7.5 Wastewater Treatment System
V1.7.6 Sludge Treatment
VI. 7.7 Boiler Blowdown
V1.7.8 Cooling Tower (if any)
VI. 7.9 Cooling water discharge

Annex 1-1
Annex 1.1-12
VI. 7.10 Gas pipeline with RMS construction
VI. 7.11 Material Storage and Handling
VI. 7.12 Fire Fighting and emergency management
VI.8. Material Balance
VI.9 Construction
VI.9.1 Site Preparation
VI.9.2 Existing Boiler Decommissioning (A separate decommissioning plan should be
produced and only a summary may be included here)
VI.9.3 Access Roads
VI.9.4 Natural Gas pipeline relocation including RMS
VI.10 Operation and Maintenance
VI.11 Pollution Mitigation Measures (Units & Devices especially for NOx reduction)
VI.12 Dispatch of Power
VI.13 Life Cycle Overview (including decommissioning)
VII. Analysis of Suitability for Different Alternatives (this analysis shall be performed,
among other approaches, in a GIS based Spatial Decision Support System (SDSS)
presenting the suitability of different options for both the interventions)
VIII. Detail description of the land cover/land use (with all the existing resource classes
along with area coverage shall be shown in the respective maps derived from
updated image of proper spatial and spectral resolution. Basic information (name of
satellite, date and time of acquisition with atmospheric condition, spatial resolution,
color composite etc.) of the image data to be used for making land use/land cover
maps shall be mentioned; Should also include land use plan map for Ghorashal
power complex showing all current and planned activities within the compound.)
VIII. Description of Baseline Environment
VIII.1 Study Area (10 Km. radius), Period, Component and methodology (Seasonal
Variation should be covered)
VIII.2 Topography
VIII.3 Seismicity
VIII.4 Hydrogeology
VIII.5 Meteorology
VIII.6 Ambient Air Quality
VIII.7 Ambient Noise Quality
VIII.8 Surface & Ground Water Quality
VIII.9 Aquatic Monitoring
VIII.10 Soil Quality
VIII.11 Ecology
VIII.12.1 Forests
VIII.12.2 Flora
VIII.12.3 Fauna

Annex 1-1
Annex 1.1-13
VIII.12 Demography Profile and Occupational Pattern
VIII.13 Land use and Cropping Pattern
VIII.14 Socio-economic and cultural Scenarios
VIII.15 Distance to urban and rural communities (proximity to sensitive receptors)
VIII.16 Transmission capacity/options for linking to grid
VIII.17 Distance to existing infrastructure such as roads, etc.
VIII.18 Current and surrounding land use and associated communities
IX. Environmental Impacts
IX.1 Identification of Impact
IX.2 Sustainability of Quality of Gas and Continuity of Supply
IX.3 Construction Stage Impact
IX.3.1 Impact on Landform
IX.3.2 Impact on Natural Resources
IX.3.3 Impact on Eco-systems
IX.3.4 Impact on Ambient Air
IX.3.5 Impact on Ambient Noise
IX.3.6 Impact on Water Bodies
IX.3.7 Impact on Soil
IX.3.8 Impact on Workers Health, Sanitation and Safety
IX.3.9 Impact on Key Point Installations & others
IX.3.10 Solid Waste Disposal
IX.3.11 Social Impact due to industrial set up and harnessing of coal and
other resources locally (if any)
IX.3.12 Impact due to transportation of raw materials
IX.4 Operation Stage Impact
IX.4.1 Impact on Natural Resource
IX.4.2 Impact on eco-systems
IX.4.3 Impact due to collection of Resources from Local Sources within the
Country (if any)
IX.4.4 Impact on Ambient Air (including dispersion modelling)
IX.4.4.1 Cumulative Effect on Ambient Air quality
IX.4.4.2 Greenhouse Gas Emission
IX.4.5 Impact on Ambient Noise (including modelling for noise profile)
IX.4.6 Impact on Water Bodies (both surface & ground)
IX.4.7 Solid Waste Disposal
IX.4.8 Soil and Agriculture
IX.4.9 Impact on Ground Water
IX.4.10 Impact of Cooling water discharge including heat plume modelling

Annex 1-1
Annex 1.1-14
IX.4.11 Ecology (Flora and Fauna)
IX.4.12 Impact on Occupational Health
IX.4.13 Impact on Public Health and Safety
IX.4.14 Impact on Traffic Movement
IX.4.15 Social Impact
IX.4.16 Impact on Tourism
IX.4.16 Impact due to transportation of primary fuels
X. Evaluation of Impacts
The impacts should be evaluated in terms of their local, regional and national
importance. The impact should be assessed in terms of the magnitude, significance,
frequency of the occurrence, duration and probability. The confidence level in the
prediction must be stated. The judgment of significance of impacts can be based on
one or more of the following, depending on the environmental factor being evaluated.
These are:
i. comparison with laws, regulation or accepted national or international standards ii. reference to pre-set criteria such as conservation or protected status of a site,
feature or species iii. consistency with pre-set policy objectives iv. consultation and acceptability with the relevant decision makers, civil society,
local community or the general public.
XI. Mitigation of Impacts
Mitigation measures which may be of the following categories and coverage:
i. changing project layout, transport routes, disposal routes or locations, timing or engineering design
ii. introducing pollution controls, waste treatment, phased implementation and construction, engineering measures, monitoring, landscaping, social services or public education;
iii. rehabilitation, compensation to restore, relocate or provision of concession for damage
XII. Environmental Management Plan
XII.1 EMP during Construction Phase
XII.1.1 Site Preparation including boiler decommissioning plan
XII.1.2 Infrastructure Services
XII.1.3 Construction Equipment
XII.1.4 Safety Measures
XII.2 EMP during Operation Phase
XII.2.1 Air Pollution Management
XII.2.1.1 Transportation and handling of raw materials
XII.2.1.2 Operation Stage
XII.2.2 Waste Water Management
XII.2.3 Used Lubricant Management
XII.2.4 Noise Management
XII.2.5 Solid Waste Management
XII.2.6 House Keeping

Annex 1-1
Annex 1.1-15
XII.2.7 Safety and Occupational Health
XII.3 Greenbelt Development
XII.4 Rain Water Harvesting Plan
XII.5 Rehabilitation and Resettlement Plan
XII.6 Thermal pollution management
XII.7 CDM Intent
XII.8 Budget for EMP
XII.9 Contingency Plans
The project authority shall:
a) Provide a conceptual contingency plan that considers environmental effects
associated with operational upset conditions such as serious malfunctions or
accidents;
b) Describe the flexibility built into the plant design and layout to accommodate
future modifications required by any change in emission standards, limits and
guidelines.
XIII. Risk Assessment
XIII.1 Consequence Analysis
XIII.2 Emergency Response Plan
XIII.3 Risk Mitigation Measures
XIV. Environment Monitoring Plan
XIV.1 Monitoring Plan
XIV.1.1 Stack Emission
XIV.1.2 Ambient Air
XIV.1.3 Meteorological
XIV.1.4 Ambient Noise
XIV.1.5 Surface Water & Waste Water
XIV.1.5.1 River Morphology
XIV.1.5.2 Ambient River Temperature
XIV.1.5.3 Cooling water
XIV.1.5 Ground Water XIV.1.6 Solid & Hazardous Waste including used
lubricant XIV.1.7 Flora and Fauna
XIV.1.8 Workers Health and Safety XIV.1.9 Community Health XIV.1.10 EMP
Implementation
XIV.1.11 Monitoring and CSR
XIV.2 Action during Abnormal Operating conditions
XIV.3 Budgets for Monitoring
XIV.4 Reporting
XV. Public Consultation and Information Disclosure
XV,1 Introduction and definitions
Annex 1-1
Annex 1.1-16
XV.2 Regulatory Requirements
XV.2.1 Bangladesh Guidelines
XV.2.2 World Bank Guidelines
XV.3 Consultation Methodology
XV.4 Results of Consultation
XV.4.1 Stakeholder Identification
XV.4.2 Local Level Consultation
XV.4.3 National Level Consultation
XV.4.4 Integration of Public Consultation Findings into EIA
XV.5 Disclosure
XV.5.1 Information Materials and Responsibilities
XV.5.2 Project Level Disclosure
XV.5.3 Disclosure in WB Infoshop
XV.6 Grievance Redress Mechanism
XVI. Project Benefits with Benefit-Cost analysis that covers among others,
Environmental and Social Cost
XVI. Discussion and Conclusions

Annex 2-1
Annex 2.1-1
Annex 2. 1: Harmonization between Environment Safeguard of GOB, the WBG Safeguard Policies to
draft Operational Framework for GPS Unit 4 Repowering Project
Aspect of
Operational
Framework
GOB World Bank IFC Harmonized Operational Framework
Environmental
Policy and
Regulations
Environment Conservation Act (1995)
Environment Conservation Rules (1997) and amendment on 2005
EIA guidelines on Industrial projects, 1997
National Water Policy - 1999
Policy on Disclosure of Information, May 2002
Operational Policy 4.01 Environmental Assessment and associated BP 4.01
General Environment, Health and Safety Guidelines, 2007
Environmental, Health, and Safety Guidelines for Thermal Power Plants, 2008
Screening and Categorisation
The ECA (1995) and ECR (1997) has set out screening criteria to categorize projects into Green, Orange A, Orange B and Red.
These screening criteria are generally based on project type only irrespective of its scale and location. In some cases, order of investment is indicated to reflect on the magnitude of the impact.
Categorization determines the level of EIA or environmental examination a project requires.
The Bank undertakes environmental screening of each proposed project to determine the appropriate extent and type of EA
Categorization into Category A, B, C, FI
Categorization takes into account the type, location, sensitivity, and scale of the project and the nature and magnitude of its potential environmental impact
The categorization defines the level of EIA that has to be conducted
Screen each proposed project as early
as possible to define the scope of Environmental Assessment (EA) covering all project components.
Categorization should take into account the type, location, sensitivity, and scale of the project and the nature and magnitude of its potential environmental impactAccording to GoB rules as outlined in the ECA 1995 and ECR 1997 the proposed project fall in category Red and hence a detailed EIA is mandatory.

Annex 2-1
Annex 2.1-2
Aspect of
Operational
Framework
GOB World Bank IFC Harmonized Operational Framework
Scoping The impacts assessed in the GOB’s EIA system include components such as Air, Noise, Land, Water, Biological and Socio-Economic aspects.
Scoping is a step in the EIA process as per EIA guidelines. s
EIA Guidelines consider IEE as the milestone where scoping is to be carried out.
EA evaluates - project's potential
environmental risks and impacts in its area of influence;
- examines project alternatives;
- identifies ways of improving project selection, siting, planning, design, and implementation by preventing, minimizing, mitigating, or compensating for adverse environmental impacts and enhancing positive impacts;
- includes the process of mitigating and managing adverse environmental impacts throughout project implementation
EA takes into account natural environment (air, water, and land); human health and safety; social aspects (involuntary resettlement, indigenous peoples, physical cultural resources; transboundary and global environmental aspects
It also takes into account variations in project and country conditions; findings of country environmental studies; national environmental action plans; the country's overall policy
Conduct the Environmental
Assessment taking into account the national laws and policies as well as relevant directives/policies of the donors to ensure that the assessment takes an integrated approach in identifying and valuating all the potential environmental (including labor, health, and safety) risks and impacts of the project.
EA must take into account natural environment (air, water, and land); human health and safety; social aspects (involuntary resettlement, indigenous peoples, physical cultural resources; trans-boundary and global environmental aspects
EA should also address potential impact of the climate change on the project design, alternatives and operations, as well as project’s potential contribution to climate change
Ensure that the project is designed and carried out in compliance with environmental laws and regulations of the country where the operation is being implemented, including national obligations established under ratified Multilateral Environmental Agreements (MEAs).

Annex 2-1
Annex 2.1-3
Aspect of
Operational
Framework
GOB World Bank IFC Harmonized Operational Framework
framework, national legislation, and institutional capabilities related to the environment and social aspects
obligations of the country, pertaining to project activities, under relevant international environmental treaties and agreements
Exclusions and Sensitivities
The ECA (1995) and ECR (1997) have clear stipulation what can be done where and to what extent.
Avoid or mitigate adverse
impacts on physical cultural
resources from development
projects that it finances (OP
4.11).
The impacts on physical
cultural resources resulting
from project activities, including
mitigating measures, should not
contravene either the
borrower’s national legislation,
or its obligations under relevant
international environmental
treaties and agreements.
Given the fact under the GoB rules
intervention in legally protected area is prohibited, it is advisable to avoid such areas
Proceed only if there are no technically and financially feasible alternatives, and overall benefits from the project substantially outweigh the environmental costs, but with adequate provision of all possible mitigation measures.
Do not implement project activities that involve or are likely to result directly or indirectly in the significant conversion or degradation of critical habitats.
If a project is located within a legally protected area, implement additional programs to promote and enhance the conservation aims of the protected area
Use a precautionary approach to the use, development and management of renewable natural resources
Conserve physical cultural resources (PCR) and avoid their destruction or damage by using field based surveys

Annex 2-1
Annex 2.1-4
Aspect of
Operational
Framework
GOB World Bank IFC Harmonized Operational Framework
with qualified and experienced expert(s) during environmental assessment
Alternatives ECA (1995) and ECR (1997) do
not explicitly ask for
identification and assessment
of alternatives.
EIA Guidelines however include
identification and assessment
of alternatives under IEE (page
12 of EIA Guidelines for
Industrial Projects).
In the preparation of EIA,
alternatives
(site/routes/process/raw
materials) are looked at as part
of the mitigation measures
(page 28 of EIA Guidelines for
Industrial Projects)
EA is initiated as early as possible in project processing and is integrated closely with the economic, financial, institutional, social, and technical analyses of a proposed project
The EA may recommend alternative emission levels and approaches to pollution prevention and abatement for the project taking into account borrower country legislation and local conditions
The EA report must provide full and detailed justification for the levels and approaches chosen for the particular project or site
Examination of financially and
technically feasible alternatives to the project location, design, technology and components, their potential environmental and social impacts
Documentation of the rationale for selecting a particular alternative(s) proposed, where relevant
For the project, alternatives should be examined for repowering option, technology selection, cooling water system, and plant layout alternative
Standards/ Guideline values
GOB has issued emission as
well as ambient standards
under ECR 1997. These
standards are in general at par
with the international standards
and in some cases even
stricter. The workspace or
occupational standards are
directed under the Factories
Act.
The Pollution Prevention and Abatement Handbook describes pollution prevention and abatement measures and emission levels
General Environment, Health and Safety Guidelines, provides guidelines for effluent discharge quality, occupational health and safety, hazardous materials management
Achieve environmental standards that
are stricter (either GOB’s or
international), and justify deviations in
the EA report when alternatives to the
standards for the project or site are
selected.
For the Project, agreeing on ambient air
quality standards for the NOx/NO2 will be
important.

Annex 2-1
Annex 2.1-5
Aspect of
Operational
Framework
GOB World Bank IFC Harmonized Operational Framework
DOE has updated their air
quality (only ambient air quality)
standards and set some new
standards for motor vehicles
emission on July 2005 by a
GOB Gazette notification.
EMP DOE requires Environmental
Management Plan (EMP) as an
outcome of EIA. Under the
guidelines, DOE prescribes
conduct of special studies as
relevant. These studies include
aspects such as Risk analyses
(when there is storage and
handling of hazardous and toxic
substances), Resettlement and
Rehabilitation (when more than
1000 people are displaced),
Compensatory Afforestation
(when deforestation involves
more than 5 ha area),
Severance etc. Prevention and
recycling are to be followed as
the first options (Pages 29 and
30 of EIA Guidelines for
Industrial Projects).
In addition to this EMP must be
supplied with the work plan,
budget/cost estimate;
implementation schedule and
EMP consists of the set of mitigation, monitoring, and institutional measures to be taken during implementation and operation to eliminate adverse environmental and social impacts, offset them, or reduce them to acceptable levels
Preparation of Management Plan includes
- identification of responses to potentially adverse impacts;
- determining requirements for ensuring that those responses are made effectively and in a timely manner;
- describing the means for meeting those requirements
EMP includes the following components
- Mitigation - Monitoring - Capacity Development and
Training
implementation Schedule and Cost Estimates
EMP consists of the set of mitigation,
measures to be taken during implementation and operation to eliminate adverse environmental and social impacts, offset them, or reduce them to acceptable levels
Monitoring includes compliance, impact and independent external monitoring
Institutional arrangements of the EMP implementation include strengthening of project implementation and supervising offices, capacity building and training, and grievance management
Preparation of Management Plan includes
- identification of responses to potentially adverse impacts;
- determining requirements for ensuring that those responses are made effectively and in a timely manner;
- describing the means for meeting those requirements
EMP includes the following components
- Mitigation

Annex 2-1
Annex 2.1-6
Aspect of
Operational
Framework
GOB World Bank IFC Harmonized Operational Framework
monitoring requirements (Page
31 of EIA Guidelines for
Industries) monitoring plan and
project scheduling.
- Monitoring - Capacity Development and Training
implementation Schedule and Cost Estimates
EMP also provide for workers - safe and healthy working conditions, and prevent accidents, injury, and disease
Establish preventive and emergency preparedness and response measures to avoid, minimize the adverse impacts and risks to the health and safety of the local communities
For the Project, EMP should be presented for pre-construction, construction and operational phases. It should include construction safety and emergency preparedness plan to address gas leaks/explosion and risk/ hazard management during boiler decommissioning and erection.
EMP should not just address mitigative measures but enhancement measures well e.g. green belt development plan, irrigation use of cooling water discharge etc.
EMP should also address other major source contribution and policy issues considering cumulative impacts of the other facilities (especially Ghorashal and Palash fertilizer factories, Aggreko, Max power etc.) that are not in the scope of the present project.
EMP should interface with boiler decommissioning of Unit 3, new 365 MW

Annex 2-1
Annex 2.1-7
Aspect of
Operational
Framework
GOB World Bank IFC Harmonized Operational Framework
CCPP, and BADC for irrigation water distribution.
Consultation The EIA Guidelines of DOE
states that a Summary, not too
technical, should be prepared
for the purpose of
communication to public (Page
32 of EIA Guidelines for
Industries).
Section 4.11 of the Guidelines
encourages Public Participation
in EIA.
However as per ECA (1995) or
ECR (1997), public consultation
and participation is not
mandatory. No time-frames are
however fixed for prior
disclosure of EIA to the public.
No Grievance mechanism
facility is mentioned in the
regulations
The DOE makes the minutes of
the meetings on Environmental
Clearance available at its
website (http://www.doe-
bd.org/minutes.php)
For all Category A and B projects proposed for IBRD or IDA financing, during the EA process, the borrower consults project-affected groups and local nongovernmental organizations (NGOs) about the project's environmental aspects and takes their views into account
The borrower initiates such consultations as early as possible
For Category A projects, the borrower consults these groups at least twice:
(a) shortly after environmental screening and before the terms of reference for the EA are finalized (b) once a draft EA report is prepared
In addition, the borrower consults with such groups throughout project implementation as necessary to address EA-related issues that affect them
The borrower provides relevant material in a timely manner prior to consultation and in a form and language that are understandable and accessible
Free, prior and informed consultation
with stakeholders to solicit feedback and ensure their participation as early as possible and throughout the project implementation.
Disclosure in local language with understandable content during public consultation.
Ensure community engagement free of external manipulation, interference, or coercion, and intimidation, and conducted on the basis of timely, relevant, understandable and accessible information.
Establish a grievance mechanism to receive and facilitate resolution of the affected communities’ concerns and grievances about the borrower’s environmental performance.
For the Project, expert/ institution consultation, focus group discussion and two stage formal public consultations have adopted.

Annex 2-1
Annex 2.1-8
Aspect of
Operational
Framework
GOB World Bank IFC Harmonized Operational Framework
to the groups being consulted
For the initial consultation a summary of the proposed project's objectives, description, and potential impacts is provided by the borrower
For consultation after the draft EA report is prepared, the borrower provides a summary of the EA's conclusions
In addition, the borrower makes the draft EA report available at a public place accessible to project-affected groups and local NGOs
Independent Review
Preparation and submission of
EIA report is the responsibility
of the project proponent, in
accordance to the TOR
approved by the DOE.
DOE has the liberty to send any
EIA report for external review
by an independent institute of
person. DOE applies its
judgement on the merits of
such feedback and if needed
send the report back for further
revision.
The borrower is responsible for carrying out the EA
For Category A projects, the borrower retains independent EA experts not affiliated with the project to carry out the EA.
For Category A projects that are highly risky or contentious or that involve serious and multidimensional environmental concerns, the borrower should normally also engage an advisory panel of independent, internationally recognized environmental specialists to advise on all aspects of the project relevant to the EA
For the Project, BPDB should use
inputs from Independent Environment Advisor for independent review.
For the project TOR for EIA was approved by the DOE.
The EIA report is prepared based on the approved TOR. DOE may wishes to send the EIA report for external review, if DOE is not convinced of the conclusions and the EMP proposed.
Monitoring and Disclosure
EIA Guidelines for Industrial
Projects recommend
The borrower reports on
- compliance with measures agreed with the Bank on the
Compliance with measures agreed
with the DOE and the Bank on the basis of the findings and results of the

Annex 2-1
Annex 2.1-9
Aspect of
Operational
Framework
GOB World Bank IFC Harmonized Operational Framework
preparation of a Post-Project
Monitoring Program. This
program is to be included in the
EIA report and on review gets
reflected as a condition in
granting ECC.
There is a process of
renewable of ECC that requires
monitoring and assessment.
DOE has the responsibility of
follow up and monitoring of
ECC conditions. DOE makes
the proponent compliance
reports available on its website
to the public
There are no formal provisions
to obtain independent
assessment of EIA report if
found necessary. There is also
no formal mechanism or a
program at DOE that conducts
independent audit of approved
projects.
Third party monitoring is
recommended through
approved laboratories.
GOB passed The Environment
Court Act, 2000 (Act No. 11 of
2000) to allow making of
basis of the findings and results of the EA, including implementation of any EMP, as set out in the project documents;
- status of mitigation measures; and findings of monitoring programs
EIA, including implementation of the EMP proposed.
DOE may ask for periodic reports on the status of mitigation measures; and findings of monitoring programs, which could be the basis for extending the EC and/or suspension of the same.
Monitoring the effectiveness of EMP implementation
Documentation of monitoring results, including development and implementation of corrective actions
Disclosure of periodic progress reports

Annex 2-1
Annex 2.1-10
Aspect of
Operational
Framework
GOB World Bank IFC Harmonized Operational Framework
appeals from public on non-
compliance with the ECA
(1995) and ECR (1977).
Climate Change Compliance with the GOB’s
climate change strategy and
national action plan
Follow GOB’s climate change strategy
and action plan

Annex 7-1
Annex 7.1-1
Annex 7-1: Gas Supply Confirmation

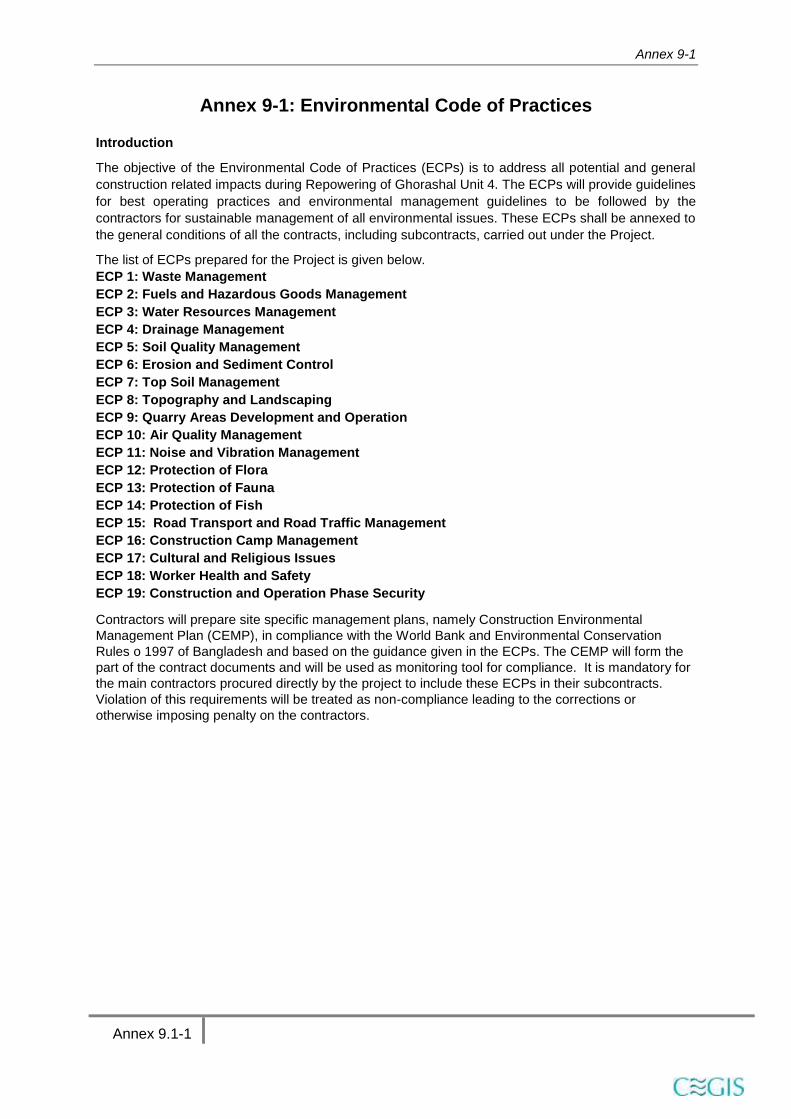
Annex 9-1
Annex 9.1-1
Annex 9-1: Environmental Code of Practices
Introduction
The objective of the Environmental Code of Practices (ECPs) is to address all potential and general
construction related impacts during Repowering of Ghorashal Unit 4. The ECPs will provide guidelines
for best operating practices and environmental management guidelines to be followed by the
contractors for sustainable management of all environmental issues. These ECPs shall be annexed to
the general conditions of all the contracts, including subcontracts, carried out under the Project.
The list of ECPs prepared for the Project is given below.
ECP 1: Waste Management
ECP 2: Fuels and Hazardous Goods Management
ECP 3: Water Resources Management
ECP 4: Drainage Management
ECP 5: Soil Quality Management
ECP 6: Erosion and Sediment Control
ECP 7: Top Soil Management
ECP 8: Topography and Landscaping
ECP 9: Quarry Areas Development and Operation
ECP 10: Air Quality Management
ECP 11: Noise and Vibration Management
ECP 12: Protection of Flora
ECP 13: Protection of Fauna
ECP 14: Protection of Fish
ECP 15: Road Transport and Road Traffic Management
ECP 16: Construction Camp Management
ECP 17: Cultural and Religious Issues
ECP 18: Worker Health and Safety
ECP 19: Construction and Operation Phase Security
Contractors will prepare site specific management plans, namely Construction Environmental
Management Plan (CEMP), in compliance with the World Bank and Environmental Conservation
Rules o 1997 of Bangladesh and based on the guidance given in the ECPs. The CEMP will form the
part of the contract documents and will be used as monitoring tool for compliance. It is mandatory for
the main contractors procured directly by the project to include these ECPs in their subcontracts.
Violation of this requirements will be treated as non-compliance leading to the corrections or
otherwise imposing penalty on the contractors.

Annex 9-1
Annex 9.1-2
ECP 1: Waste Management
Project Activity/
Impact Source Environmental Impacts Mitigation Measures/ Management Guidelines
General Waste
Soil and water pollution
from the improper
management of wastes
and excess materials from
the construction sites.
The Contractor shall
Develop site specific waste management plan for various waste streams (e.g., reusable waste, flammable waste, construction debris, food waste etc.) prior to commencing of construction and submit to supervision consultant for approval.
Organize disposal of all wastes generated during construction in the designated disposal sites approved by the Project authority.
Minimize the production of waste materials by 3R (Reduce, Recycle and Reuse) approach.
Segregate all wastes, wherever practical.
Vehicles transporting solid waste shall be totally confined within an enclosed vehicle or is fully covered with a tarp to prevent spilling waste along the route.
Tarp must be undamaged (not torn or frayed) properly secured to the body of the vehicle or trailer with ropes, chains, straps, or cords so that no waste is exposed. The edges of the tarps shall extend 12 inches over the permanent sides and back of the open top vehicle or trailer and must be secured to the permanent vehicle. All loads must be tarped from the point of origin of the waste to the tipping area of the final disposal/landfill.
Train and instruct all personnel in waste management practices and procedures as a component of the environmental induction process.
Provide refuse containers at each worksite.
Request suppliers to minimize packaging where practicable.
Place a high emphasis on good housekeeping practices.
Maintain all construction sites clean, tidy and safe and provide and maintain appropriate facilities as temporary storage of all wastes before transporting to final disposal.
Potable water should be supplied in bulk containers to reduce the quantity of plastic waste (plastic bins). Plastic bag use should be avoided.
Hazardous
Waste
Health hazards and
environmental impacts
due to improper waste
management practices
The Contractor shall
Collect chemical wastes in 200 liter drums (or similar sealed container), appropriately labeled for safe transport to an approved chemical waste depot.

Annex 9-1
Annex 9.1-3
Project Activity/
Impact Source Environmental Impacts Mitigation Measures/ Management Guidelines
Store, transport and handle all chemicals avoiding potential environmental pollution.
Store all hazardous wastes appropriately in bunded areas away from water courses.
Make available all Material Safety Data Sheets (MSDS) for hazardous materials on-site during construction.
Collect hydrocarbon wastes, including lube oils, for safer transport off-site to reuse, recycle, treatment or disposal at approved locations.
Construct concrete or other impermeable hard-stand to prevent seepage in case of spills.
Keep sufficient stock of absorbents for generally used chemicals or for petrochemicals (e.g., dirt, sawdust, etc.) within the storage area to contain accidental spills.
ECP 2: Fuels and Hazardous Goods Management
Project
Activity/ Impact
Source
Environmental Impacts Mitigation Measures/ Management Guidelines
Fuels and
hazardous
goods.
Materials used in
construction have a
potential to be a source of
contamination. Improper
storage and handling of
fuels, lubricants,
chemicals, hazardous
goods/materials on-site,
wash down of plant and
equipment, and potential
spills may harm the
environment or health of
construction workers.
The Contractor shall
Prepare spill control procedures and submit them for supervision consultant for approval.
Train the relevant construction personnel in handling of fuels and spill control procedures.
Refueling shall occur only within bunded areas.
Store dangerous goods in bunded areas on top of a sealed plastic sheet away from watercourses. Store all liquid fuels in fully bunded storage containers, with appropriate volumes, a roof, a collection point and appropriate filling/decanting point.
Store and use fuels in accordance with material safety data sheets (MSDS). Make available MSDS for chemicals and dangerous goods on-site.
Store hazardous materials at above flood level,determined for construction.
Make sure all containers, drums, and tanks that are used for storage are in good condition and are labeled with expiry date. Any container, drum, or tank that is dented, cracked, or rusted might eventually leak. Check for leakage regularly to identify potential problems before they occur.
Sit containers and drums in temporary storages in clearly marked areas, where they will not be run-over by vehicles or heavy machinery. The

Annex 9-1
Annex 9.1-4
Project
Activity/ Impact
Source
Environmental Impacts Mitigation Measures/ Management Guidelines
area shall preferably drain to a safe collection area in the event of a spill.
Take all precautionary measures when handling and storing fuels and lubricants, avoiding environmental pollution.
All machinery is to be stored and away from any water body, drainage inlets or natural drainage area, where practical. Environmental control measures such as appropriate barriers (i.e. bunding, sediment fence, etc.) will be considered and/or implemented to control runoff away from the machinery and prevent any washout in to adjacent water body, drainage inlets or natural drainage area.
Transport waste of dangerous goods, which cannot be recycled, to an approved waste disposal facility. Safe transport of fuel or other hazardous liquids to and from the storage container will be facilitated through the provision detailed within the Material Safety Data Sheets (MSDS).
Wash down of plant and equipment and vehicle servicing will be performed only in isolated impervious areas away from drainage inlets, connecting the drainage with an oil interceptor. Pits/bunds located away from waterways will be provided for concrete wash near construction areas. The contractor’s environmental officer with assistance from supervisors is to ensure that pits/bunds are available, maintained at capacity and drivers instructed regarding the location and required procedures.
Keep stock of absorbent and containment material (e.g., absorbent matting, dirt, sawdust, etc.) where hazardous material are used and stored; and ensure staffs are trained in their correct use.
Oil and chemical spills and washouts shall be cleaned up and collected immediately, where safety permits. Disposal of remediated / cleanup/ washout materials shall be to an approved waste disposal facility. Materials shall be transported by an approved / licensed transporter. Contaminated Material to be removed from site as soon as reasonably practical after the incident.
Provide appropriate personal protective equipment (protective clothing, safety boots, helmets, masks, gloves, goggles, etc.) to the construction personnel, depending on the materials handled.
Avoid the use of material with greater potential for contamination by substituting them with more

Annex 9-1
Annex 9.1-5
Project
Activity/ Impact
Source
Environmental Impacts Mitigation Measures/ Management Guidelines
environmentally friendly materials.
ECP 3: Water Resources Management
Project
Activity/
Impact Source
Environmental Impacts Mitigation Measures/ Management Guidelines
Hazardous
material and
Waste
Water pollution from the
storage, handling and
disposal of hazardous
materials and general
construction waste, and
accidental spillage
The Contractor shall
Follow the management guidelines proposed in ECP 1and ECP 2: Fuels and Hazardous Goods Management..
Minimize the generation of spoils, oil and grease, excess nutrients, organic matter, litter, debris and any form of waste (particularly petroleum and chemical wastes). These substances must not enter waterways or storm water systems.
Discharge from
construction
sites
Construction activities,
sewerages from
construction sites and
work camps may affect
the surface water quality.
The construction works
will modify groundcover
and topography, changing
the surface water
drainage patterns of the
area. These changes in
hydrological regime lead
to increased rate of runoff,
increase in sediment and
contaminant loading,
increased flooding, and
effect habitat of fish and
other aquatic biology.
The Contractor shall
Install temporary drainage works (channels and check dams) in areas required for sediment and erosion control and around storage areas for construction materials.
Install temporary sediment lagoons, where appropriate, to capture sediment-laden run-off from work site.
Divert runoff from undisturbed areas around the construction site.
Stockpile materials away from drainage lines.
Prevent all solid and liquid wastes entering waterways by collecting spoils, oils, chemicals, bitumen spray waste and wastewaters from brick, concrete and asphalt cutting where possible and transport to an approved waste disposal site or recycling depot.
Wash out ready-mix concrete agitators and concrete handling equipment at washing facilities off site or into approved bunded areas on site. Ensure that tires of construction vehicles are cleaned in the washing bay (constructed at the entrance of the construction site) to remove the mud from the wheels. This should be done in every exit of each construction vehicle to ensure the local roads are kept clean.
Soil erosion and
siltation
Soil erosion and dust from
the material stockpiles will
increase the sediment
and contaminant loading
of surface water bodies.
The Contractor shall
Stabilize the cleared areas not used for construction activities with vegetation or appropriate surface water treatments as soon as practicable following earthwork to minimize

Annex 9-1
Annex 9.1-6
Project
Activity/
Impact Source
Environmental Impacts Mitigation Measures/ Management Guidelines
erosion.
Ensure that roads used by construction vehicles are swept regularly to remove dust and sediment.
Water the loose material stockpiles, access roads and bare soils on an as needed basis to minimize dust. Increase the watering frequency during periods of high risk (e.g. high winds).
Construction
activities in
water bodies
Dredging/ excavation
activities associated with
construction of pipelines,
bulkheads and river
training works, and
buildings for a facility can
cause turbidity and
sedimentation in nearby
waters, degraded water
quality, and substrate
alterations.
The Contractor Shall
Dewater sites by pumping water to a sediment basin prior to release off site – do not pump directly off site.
Monitor the water quality in the runoff from the site or areas affected by dredge/excavation plumes, and improve work practices as necessary.
Protect water bodies from sediment loads by silt screen or other barriers.
Minimize the generation of sediment, oil and grease, excess nutrients, organic matter, litter, debris and any form of waste (particularly petroleum and chemical wastes). These substances must not enter waterways or storm water systems.
Do not discharge cement and water curing used for cement concrete directly into water courses and drainage inlets.
Highly motile adult and
juvenile life stages of
most fishes could flee
when construction is
ongoing, however, egg
and larval stages as well
as non-motile benthic
organisms will likely not
be able to avoid impacts.
As a general rule, the
severity of adverse effects
tends to be greatest for
early life stages and for
adults of some highly
sensitive species.
The Contractor shall
Avoid dredged material disposal activities in areas containing sensitive or unique benthic habitats (e.g., spawning and feeding sites).
Restrict construction during December-February when appropriate to avoid temporary impacts to habitat during critical life history stages (e.g., spawning, egg and embryo development, and juvenile growth).
Drinking water Untreated surface water is
not suitable for drinking
purposes due to presence
of suspended solids and
Ecoli.
The Contractor Shall
Provide drinking water that meets National and WHO Drinking Water standards. Drinking water to be chlorinated at source, and ensure presence of residual chlorine 0.1 ~ 0.25 ppm as minimum after 30 minutes of chlorine contact

Annex 9-1
Annex 9.1-7
Project
Activity/
Impact Source
Environmental Impacts Mitigation Measures/ Management Guidelines
time.
ECP 4: Drainage Management
Project Activity/
Impact Source
Environmental
Impacts Mitigation Measures/ Management Guidelines
Excavation and
earth works, and
construction
yards
Lack of proper drainage
for rainwater/liquid
waste or wastewater
owing to the
construction activities
harms environment in
terms of water and soil
contamination, and
mosquito growth.
The Contractor shall
Prepare drainage management procedures and submit them for supervision consultant for approval.
Prepare a program to prevent/avoid standing waters, which supervision consultant will verify in advance and confirm during implementation.
Provide alternative drainage for rainwater if the construction works/earth-fillings cut the established drainage line.
Establish local drainage line with appropriate silt collector and silt screen for rainwater or wastewater connecting to the existing established drainage lines already there.
Rehabilitate road drainage structures immediately if damaged by contractors’ road transports.
Build new drainage lines as appropriate and required for wastewater from construction yards connecting to the available nearby recipient water bodies. Ensure wastewater quality conforms to National Standards, before it is being discharged into the recipient water bodies.
Ensure that there will be no water stagnation at the construction sites and camps.
Provide appropriate silt collector and silt screen at the inlet and manholes and periodically clean the drainage system to avoid drainage congestion.
Protect natural slopes of drainage channels to ensure adequate storm water drains.
Regularly inspect and maintain all drainage channels to assess and alleviate any drainage congestion problem.
Ponding of water Health hazards due to
mosquito breeding
Do not allow ponding of water especially near the waste storage areas and construction camps.
Discard all the storage containers that are capable of storing of water, after use or store them in inverted position.

Annex 9-1
Annex 9.1-8
ECP 5:Soil Quality Management
Project Activity/
Impact Source Environmental Impacts Mitigation Measures/ Management Guidelines
Storage of
hazardous and
toxic chemicals
Spillage of hazardous
and toxic chemicals will
contaminate the soils
The Contractor shall
Strictly manage the wastes management plans proposed in ECP 1and storage of materials and ECP 2: Fuels and Hazardous Goods Management..
Construct appropriate spill containment facilities for all fuel storage areas.
Establish and maintain a hazardous material register detailing the location and quantities of hazardous substances including the storage, and their disposals.
Train personnel and implement safe work practices for minimizing the risk of spillage.
Identify the cause of contamination, if it is reported, and contain the area of contamination. The impact may be contained by isolating the source or implementing controls around the affected site.
Remediate the contaminated land using the most appropriate available method.
Construction
material stock
piles
Erosion from construction
material stockpiles may
contaminate the soils
The Contractor shall
Protect the toe of all stockpiles, where erosion is likely to occur, with silt fences, straw bales or bunds.
ECP 6: Erosion and Sediment Control
Project Activity/
Impact Source Environmental Impacts Mitigation Measures/ Management Guidelines
Clearing of
construction sites
Cleared areas and slopes
are susceptible for erosion
of top soils, which affects
the growth of vegetation
and causes ecological
imbalance.
The Contractor shall
Prepare site specific erosion and sediment control measures and submit them for supervision consultant for approval.
Reinstate and protect cleared areas as soon as possible.
Cover unused area of disturbed or exposed surfaces immediately with mulch/grass turf/tree plantations.
Construction
activities and
material
stockpiles
The impact of soil erosion
are (i) Increased run off and
sedimentation causing a
greater flood hazard to the
downstream and silt
accumulation and (ii)
destruction of aquatic
The Contractor shall
Locate stockpiles away from drainage lines.
Protect the toe of all stockpiles, where erosion is likely to occur, with silt fences, straw bales or bunds.
Remove debris from drainage paths and sediment control structures.

Annex 9-1
Annex 9.1-9
Project Activity/
Impact Source Environmental Impacts Mitigation Measures/ Management Guidelines
environment by erosion
and/or deposition of
sediment damaging the
spawning grounds of fish
Cover the loose sediments of construction material and water them if required.
Divert natural runoff around construction areas prior to any site disturbance.
Install protective measures on site prior to construction, for example, sediment traps.
Install ‘cut off drains’ on large cut/fill batter slopes to control water runoff speed and hence erosion.
Observe the performance of drainage structures and erosion controls during rain and modify as required.
Restrict construction during December-February July when appropriate to avoid temporary impacts to habitat during critical life history stages (e.g., spawning, egg and embryo development, and juvenile growth).
Soil erosion and
siltation
Soil erosion and dust from
the material stockpiles will
increase the sediment and
contaminant loading of
surface water bodies.
The Contractor shall
Stabilize the cleared areas not used for construction activities with vegetation or appropriate surface water treatments as soon as practicable following earthwork to minimize erosion.
Ensure that roads used by construction vehicles are swept regularly to remove sediment.
Water the material stockpiles, access roads and bare soils on an as required basis to minimize dust. Increase the watering frequency during periods of high risk (e.g. high winds).
ECP 7: Top Soil Management
Project Activity/
Impact Source Environmental Impacts Mitigation Measures/ Management Guidelines
Land clearing and
earth works
Earthworks will impact the
fertile top soils that are
enriched with nutrients
required for plant growth or
agricultural development.
The Contractor shall
Strip the top soil to a depth of 35 cm and store in stock piles of height not exceeding 2m.
Remove unwanted materials from top soil like grass, roots of trees and others.
The stockpiles will be done in slopes of 2:1 to reduce surface runoff and enhance percolation through the mass of stored soil.
Locate topsoil stockpiles in areas outside drainage lines and protect from erosion.
Construct diversion channels and silt fences around the topsoil stockpiles to prevent erosion and loss of topsoil.

Annex 9-1
Annex 9.1-10
Project Activity/
Impact Source Environmental Impacts Mitigation Measures/ Management Guidelines
Spread the topsoil to maintain the physico-chemical and biological activity of the soil. The stored top soil will be utilized for covering all disturbed area and along the proposed plantation sites.
Prior to the re-spreading of topsoil, the ground surface will be ripped to assist the bunding of the soil layers, water penetration and revegetation
Transport Vehicular movement outside
ROW or temporary access
roads will affect the soil
fertility of the agricultural
lands
Limit equipment and vehicular movements to within the approved construction zone.
Plan construction access to make use, if possible, of the final road alignment.
ECP 8: Topography and Landscaping
Project Activity/
Impact Source Environmental Impacts
Mitigation Measures/ Management
Guidelines
Land clearing and
earth works
Construction activities
especially earthworks will
change topography and disturb
the natural rainwater/flood
water drainage as well as
change the local landscape.
The Contractor shall
Prepare landscaping and plantation plan and submit the plan to supervision consultant for approval.
Ensure the topography of the final surface of all raised lands (construction yards, approach roads and rails, access roads, etc.) are conducive to enhance natural draining of rainwater/flood water.
Keep the final or finished surface of all the raised lands free from any kind of depression that causes water logging.
Undertake mitigation measures for erosion control/prevention by grass-turfing and tree plantation, where there is a possibility of rain-cut that will change the shape of topography.
Cover immediately the uncovered open surface that has no use of construction activities with grass-cover and tree plantation to prevent soil erosion and better landscaping.
Reinstate the natural landscape of the
ancillary construction sites after
completion of works.
ECP 9: Quarry Areas Development and Operation
Project Activity/
Impact Source Environmental Impacts Mitigation Measures/ Management Guidelines
Development and Borrow areas will have The Contractor shall

Annex 9-1
Annex 9.1-11
Project Activity/
Impact Source Environmental Impacts Mitigation Measures/ Management Guidelines
operation of
borrow areas
impacts on local
topography, landscaping
and natural drainage.
Prepare borrow/quarry area management plan and submit the plan for supervision consultant approval.
Use only approved quarry and borrow sites.
Identify new borrow and quarry areas in consultation with the client, if required.
Reuse excavated or disposed material available in the project to the maximum extent possible.
Store top soil for reinstatement and landscaping.
Develop surface water collection and drainage systems, anti-erosion measures (berms, revegetation etc.) and retaining walls and gabions where required. Implement mitigation measures in
ECP 3: Water Resources Management, ECP 6: Erosion and Sediment Control
The use of explosive should be used as low as possible to reduce noise, vibration, and dust.
Control dust and air pollution by application of watering and implementing mitigation measures proposed in ECP 10: Air Quality Management
Noise and vibration control by ECP 11: Noise and Vibration Management.
ECP 10: Air Quality Management
Project
Activity/
Impact Source
Environmental
Impacts Mitigation Measures/ Management Guidelines
Construction
vehicular traffic
Air quality can be
adversely affected by
vehicle exhaust
emissions and
combustion of fuels.
The Contractor shall
Prepare air quality management plan (under the Pollution Prevention Plan) and submit the plan for supervision consultant approval.
Fit vehicles with appropriate exhaust systems and emission control devices. Maintain these devices in good working condition.
Operate the vehicles in a fuel efficient manner.
Cover hauling vehicles carrying dusty materials moving outside the construction site.
Impose speed limits on all vehicle movement at the worksite to reduce dust emissions.
Control the movement of construction traffic.
Water construction materials prior to loading and transport.
Service all vehicles regularly to minimize

Annex 9-1
Annex 9.1-12
Project
Activity/
Impact Source
Environmental
Impacts Mitigation Measures/ Management Guidelines
emissions.
Limit the idling time of vehicles not more than 2 minutes.
Construction
machinery
Air quality can be
adversely affected by
emissions from
machinery and
combustion of fuels.
The Contractor shall
Fit machinery with appropriate exhaust systems and emission control devices. Maintain these devices in good working condition in accordance with the specifications defined by their manufacturers to maximize combustion efficiency and minimize the contaminant emissions. Proof of maintenance register shall be required by the equipment suppliers and contractors/subcontractors.
Pay special attention to control emissions from fuel generators.
Machinery causing excessive pollution (e.g., visible smoke) will be banned from construction sites.
Service all equipment regularly to minimize emissions.
Provide filtering systems, dust collectors or humidification or other techniques (as applicable) to the concrete batching and mixing plant to control the particle emissions in all stages, including unloading, collection, aggregate handling, cement application, circulation of trucks and machinery inside the installations.
Construction
activities
Dust generation from
construction sites,
material stockpiles and
access roads is a
nuisance in the
environment and can be
a health hazard, and
also can affect the local
crops
The Contractor shall
Water the material stockpiles, access roads and bare soils on an as needed basis to minimize the potential for environmental nuisance due to dust. Increase the watering frequency during periods of high risk (e.g. high winds). Stored materials such as gravel and sand shall be covered and confined to avoid their being wind-drifted.
Minimize the extent and period of exposure of the bare surfaces.
Restore disturbed areas as soon as practicable by vegetation/grass-turfing.
Store the cement in silos and minimize the emissions from silos by equipping them with filters.
Establish adequate locations for storage, mixing and loading of construction materials, in a way that dust generation is minimized during such operations.
Not use water as dust suppression on potentially contaminated areas, to prevent generation of liquid waste stream.
Crushing of rock and aggregate materials shall be

Annex 9-1
Annex 9.1-13
Project
Activity/
Impact Source
Environmental
Impacts Mitigation Measures/ Management Guidelines
wet-crushed, or performed with particle emission control systems.
Not permit the burning of solid waste.
ECP 11: Noise and Vibration Management
Project
Activity/
Impact Source
Environmental Impacts Mitigation Measures/ Management Guidelines
Construction
vehicular traffic
Noise quality will be
deteriorated due to
vehicular traffic
The Contractor shall
Prepare a noise and vibration management plan (under the Pollution Prevention Plan) and submit the plan for supervision consultant approval.
Maintain all vehicles in order to keep it in good working condition in accordance with manufactures maintenance procedures.
Make sure all drivers will comply with the traffic codes concerning maximum speed limit, driving hours, etc.
Perform the loading and unloading of trucks, and handling operations minimizing construction noise on the work site.
Construction
machinery
Noise and vibration may
have an impact on people,
property, fauna, livestock
and the natural
environment.
The Contractor shall
Appropriately organize all noise generating activities to avoid noise pollution to local residents.
Use the quietest available plant and equipment in construction work.
Maintain all equipment in order to keep them in good working order in accordance with manufactures maintenance procedures. Equipment suppliers and contractors shall present proof of maintenance register of their equipment.
Install acoustic enclosures around generators to reduce noise levels.
Fit high efficiency mufflers to appropriate construction equipment.
Avoid unnecessary use of alarms, horns and sirens.
Construction
activity
Noise and vibration may
have an impact on people,
property, fauna, livestock
and the natural
environment.
The Contractor shall
Notify adjacent landholders prior to typical noise events outside of daylight hours.
Educate the operators of construction equipment on potential noise problems and the techniques to minimize noise emissions.
Employ best available work practices on-site to

Annex 9-1
Annex 9.1-14
Project
Activity/
Impact Source
Environmental Impacts Mitigation Measures/ Management Guidelines
minimize occupational noise levels.
Install temporary noise control barriers where appropriate.
Notify affected people if major noisy activities will be undertaken, e.g. blasting.
Plan activities on site and deliveries to and from site to minimize impact.
Monitor and analyze noise and vibration results and adjust construction practices as required.
Avoid undertaking the noisiest activities, where possible, when working at night near the residential areas.
ECP 12: Protection of Flora
Project
Activity/
Impact Source
Environmental Impacts Mitigation Measures/ Management Guidelines
Vegetation
clearance
Local flora are important
habitats for birds, provide
fruit harvest, timber/fire
wood, protect soil from
erosion and overall keep
the natural balance for
human-living. As such
damage to flora has wide
range of adverse
environmental impacts.
The Contractor shall
Prepare a plan to protect flora and submit the plan for supervision consultant approval.
Minimize disturbance to surrounding vegetation.
Use appropriate type and minimum size of machine to avoid disturbance to adjacent vegetation.
Get approval from supervision consultant for clearance of vegetation.
Make selective and careful pruning of trees where possible to reduce need of tree removal.
Control noxious weeds by disposing of at designated dump site or burn on site.
Clear only the vegetation that needs to be cleared in accordance with the engineering plans and designs. These measures are applicable to both the construction areas as well as to any associated activities such as sites for stockpiles, disposal of fill, etc.
Not burn off cleared vegetation – where feasible, chip or mulch and reuse it for the rehabilitation of affected areas, temporary watermain and valve access or landscaping. Mulch provides a seed source, can limit embankment erosion, retains soil moisture and nutrients, and encourages re-growth and protection from weeds.
Return topsoil and mulched vegetation (in areas of native vegetation) to approximately

Annex 9-1
Annex 9.1-15
Project
Activity/
Impact Source
Environmental Impacts Mitigation Measures/ Management Guidelines
the same location from where it came from.
Avoid work within the drip-line of trees to prevent damage to the tree roots and compacting the soil.
Minimize the length of time the ground is exposed or excavation left open by clearing and re-vegetate the area at the earliest practically possible.
Ensure excavation works occur progressively and re-vegetation done at the earliest.
Provide adequate knowledge to the workers regarding nature protection and the need of avoid felling trees during construction
Supply appropriate fuel in the work camps to prevent fuel wood collection.
ECP 13: Protection of Fauna
Project
Activity/
Impact Source
Environmental Impacts Mitigation Measures/ Management Guidelines
Construction
activities
The location of
construction activities can
result in the loss of wild life
habitat and habitat quality,
The Contractor shall
Prepare a plan for protection of fauna and submit the plan for supervision consultant approval.
Limit the construction works within the designated sites allocated to the contractors.
Check the site (especially trenches) for trapped animals, and rescue them by the help of a qualified person.
Provide temporary access to the animals to cross the trenches.
Impact on local and
migratory birds, their
habitats and active nests
The Contractor shall
Not be permitted to destruct active nests or eggs of birds.
Minimize the tree removal during the bird breeding season. If works must be continued during the bird breeding season, a nest survey will be conducted by a qualified biologist prior to commence of works to identify and locate active nests.
If bird nests are located/ detected within the right-of-way and roadside embankments then those areas should be avoided.
Petroleum products should not come in contact with the natural and sensitive ecosystems. Contractor must minimize the release of oil, oil wastes or any other substances harmful to migratory birds’

Annex 9-1
Annex 9.1-16
Project
Activity/
Impact Source
Environmental Impacts Mitigation Measures/ Management Guidelines
habitats, to any waters, wetlands or any areas frequented by migratory birds.
Vegetation
clearance
Clearance of vegetation
may impact shelter,
feeding and/or breeding
and/or physical destruction
and severing of habitat
areas
The Contractor shall
Restrict the tree removal to the minimum numbers required.
Relocate hollows, where appropriate.
Fell the hollow bearing trees in a manner which reduces the potential for fauna mortality. Felled trees will be inspected after felling for fauna and if identified and readily accessible will be removed and relocated or rendered assistance if injured. After felling, hollow bearing trees will remain unmoved overnight to allow animals to move of their own volition. Care should be taken to make sure bird habitats are not destroyed. If there is no option available, rehabilitate them in other neighboring trees. Also protect and rehabilitate injured or orphaned birds.
Night time
lighting
Lighting from construction
sites and construction
camps may affect the
visibility of night time
migratory birds that use the
moon and stars for
navigation during their
migrations.
The Contractor shall
Use lower wattage flat lens fixtures that direct light down and reduce glare, thus reducing light pollution,
Avoid flood lights unless they are absolutely required.
Use motion sensitive lighting to minimize unneeded lighting.
Use, if possible, green lights that are considered as bird’s friendly lighting instead of white or red colored lights.
Install light shades or plan the direction of lights to reduce light spilling outside the construction area.
Construction
camps
Illegal poaching The Contractor shall
Provide adequate knowledge to the workers regarding protection of flora and fauna, and relevant government regulations and punishments for illegal poaching.
Ensure that staff and Subcontractors are
trained and empowered to identify, address
and report potential environmental problems.
Provide sufficient food allowance to the
workers so that they don’t engage in illegal
poaching or hunting.

Annex 9-1
Annex 9.1-17
ECP 14: Protection of Fish
Project
Activity/
Impact Source
Environmental Impacts Mitigation Measures/ Management Guidelines
Construction
activities in
River
The main potential impacts
to fisheries are dredging,
hydrocarbon spills and
leaks from riverine
transport, and disposal of
wastes into the river.
The Contractor shall
Prepare procedures for protection of fish and submit them for supervision consultant approval.
Restrict dredging and piling in the intake area during fish breeding and spawning season to avoid hindrance or blockage of fish breeding and spawning.
Ensure the construction equipment used in the river are well maintained and do not have oil leakage to contaminate river water.
Contain oil immediately on river in case of accidental spillage from equipment; make an emergency oil spill containment plan (under the Fuels and Hazardous Substances Management Plan) to be supported with enough equipment, materials and human resources.
Do not dump wastes, be it hazardous or non-hazardous into the nearby water bodies or in the river.
Construction
activities on the
land
The main potential impacts
on river are increased
suspended solids from
earthworks erosion,
sanitary discharge from
work camps, and
hydrocarbon spills
The Contractor shall
follow mitigation measures proposed
ECP 3: Water Resources Management and
ECP 4: Drainage Management.
ECP 15: Road Transport and Road Traffic Management
Project
Activity/
Impact Source
Environmental Impacts Mitigation Measures/ Management Guidelines
Construction
vehicular traffic
Increased traffic use of road
by construction vehicles will
affect the movement of
normal road traffics and the
safety of the road-users.
The Contractor shall
Prepare a traffic management plan and submit the plan for supervision consultant approval.
Strictly follow the Project’s ‘Traffic Management Plan’ and work with close coordination with the Traffic Management Unit.
Prepare and submit additional traffic plan, if any of his traffic routes are not covered in the Project’s Traffic Management Plan, and
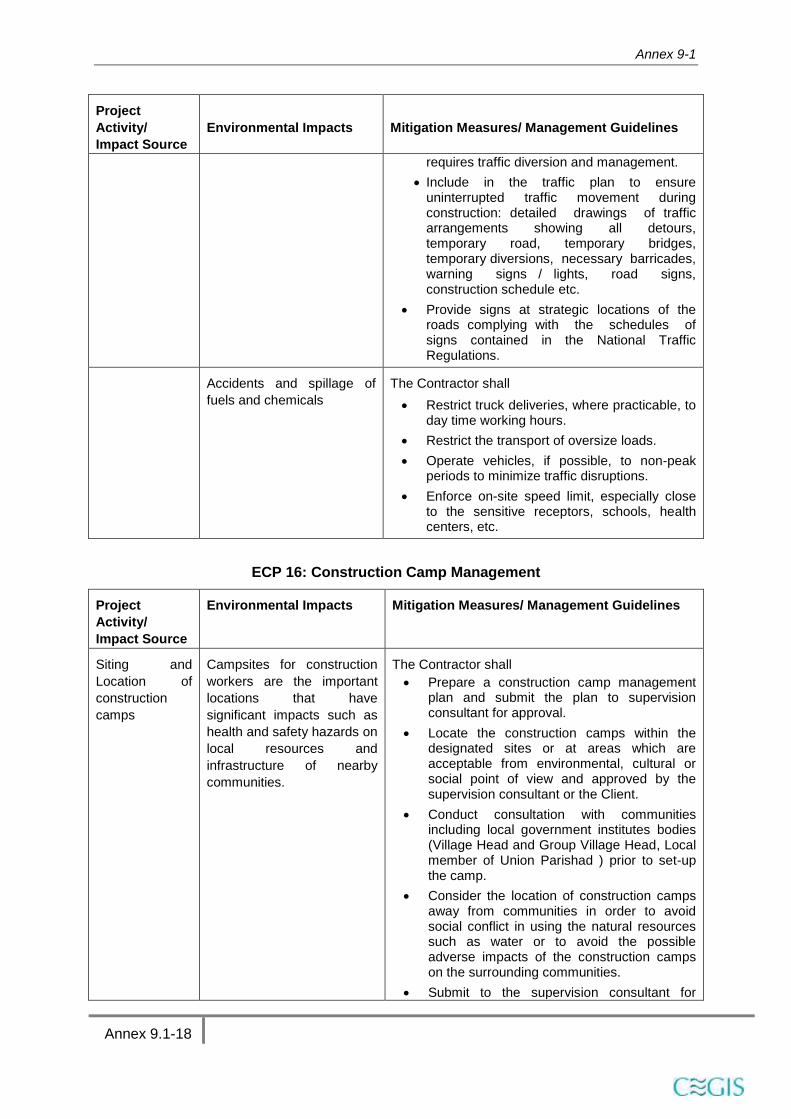
Annex 9-1
Annex 9.1-18
Project
Activity/
Impact Source
Environmental Impacts Mitigation Measures/ Management Guidelines
requires traffic diversion and management.
Include in the traffic plan to ensure uninterrupted traffic movement during construction: detailed drawings of traffic arrangements showing all detours, temporary road, temporary bridges, temporary diversions, necessary barricades, warning signs / lights, road signs, construction schedule etc.
Provide signs at strategic locations of the roads complying with the schedules of signs contained in the National Traffic Regulations.
Accidents and spillage of
fuels and chemicals
The Contractor shall
Restrict truck deliveries, where practicable, to day time working hours.
Restrict the transport of oversize loads.
Operate vehicles, if possible, to non-peak periods to minimize traffic disruptions.
Enforce on-site speed limit, especially close to the sensitive receptors, schools, health centers, etc.
ECP 16: Construction Camp Management
Project
Activity/
Impact Source
Environmental Impacts Mitigation Measures/ Management Guidelines
Siting and
Location of
construction
camps
Campsites for construction
workers are the important
locations that have
significant impacts such as
health and safety hazards on
local resources and
infrastructure of nearby
communities.
The Contractor shall
Prepare a construction camp management plan and submit the plan to supervision consultant for approval.
Locate the construction camps within the designated sites or at areas which are acceptable from environmental, cultural or social point of view and approved by the supervision consultant or the Client.
Conduct consultation with communities including local government institutes bodies (Village Head and Group Village Head, Local member of Union Parishad ) prior to set-up the camp.
Consider the location of construction camps away from communities in order to avoid social conflict in using the natural resources such as water or to avoid the possible adverse impacts of the construction camps on the surrounding communities.
Submit to the supervision consultant for

Annex 9-1
Annex 9.1-19
Project
Activity/
Impact Source
Environmental Impacts Mitigation Measures/ Management Guidelines
approval a detailed layout plan for the development of the construction camp showing the relative locations of all temporary buildings and facilities that are to be constructed together with the location of access roads, fuel storage areas (for use in power supply generators), solid waste management and dumping locations, and drainage facilities, prior to the development of the camps.
Local authorities responsible for health, religious and security shall be duly informed on the set up of camp facilities so as to maintain effective surveillance over public health, social, and security matters.
Construction
Camp Facilities
Lack of proper infrastructure
facilities, such as housing,
water supply, and sanitation
facilities will increase
pressure on the local
services and generate
substandard living standards
and health hazards.
Contractor shall provide the following facilities in
the campsites
Adequate housing for all workers.
Safe and reliable water supply, which should meet national/WHO standards. Drinking water to be chlorinated at source, and ensure presence of residual chlorine 0.1 ~ 0.25 ppm as minimum after 30 minutes of chlorine contact time (WHO guideline).
Hygienic sanitary facilities and sewerage system. The toilets and domestic waste water will be collected through a common sewerage. Provide separate latrines and bathing places for males and females with total isolation by location. The minimum number of toilet facilities required is one toilet for every ten persons.
Treatment facilities for sewerage of toilet and domestic wastes.
Storm water drainage facilities.
Paved internal roads.
Provide child crèches for women working at construction site. The crèche should have facilities for dormitory, kitchen, indoor and outdoor play area. Schools should be attached to these crèches so that children are not deprived of education whose mothers are construction workers.
Provide in-house community/common entertainment facilities. Dependence of local entertainment outlets by the construction camps to be discouraged/prohibited to the extent possible.

Annex 9-1
Annex 9.1-20
Project
Activity/
Impact Source
Environmental Impacts Mitigation Measures/ Management Guidelines
Disposal of
waste
Management of wastes is
crucial to minimize impacts
on the environment
The Contractor shall
Ensure proper collection and disposal of solid wastes within the construction camps.
Insist waste separation by source; organic wastes in one container and inorganic wastes in another container at household level.
Store inorganic wastes in a safe place within the household and clear organic wastes on daily basis to waste collector. Establish waste collection, transportation and disposal systems with the manpower and equipment/vehicles needed.
Do not establish site specific landfill sites. All solid waste will be collected and removed from the work camps and disposed in approved waste disposal sites.
Fuel supplies
for cooking
purposes
Illegal sourcing of fuel wood
by construction workers will
impact the natural flora and
fauna
The Contractor shall
Provide fuel to the construction camps for their domestic purpose, in order to discourage them to use fuel wood or other biomass.
Made available alternative fuels like natural gas or kerosene on ration to the workforce to prevent them using biomass for cooking.
Conduct awareness campaigns to educate workers on preserving the protection of biodiversity and wildlife of the project area, and relevant government regulations and punishments on wildlife protection.
Health and
Hygiene
There will be a potential for
diseases to be transmitted
including malaria,
exacerbated by inadequate
health and safety practices.
There will be an increased
risk of work crews spreading
sexually transmitted
infections and HIV/AIDS.
The Contractor shall
Provide adequate health care facilities within construction sites.
Provide first aid facility round the clock. Maintain stock of medicines in the facility and appoint fulltime designated first aider or nurse.
Provide ambulance facility for the laborers during emergency to be transported to nearest hospitals.
Initial health screening of the laborers coming from outside areas.
Train all construction workers in basic sanitation and health care issues and safety matters, and on the specific hazards of their work.
Provide HIV awareness programming, including STI (sexually transmitted infections)

Annex 9-1
Annex 9.1-21
Project
Activity/
Impact Source
Environmental Impacts Mitigation Measures/ Management Guidelines
and HIV information, education and communication for all workers on regular basis.
Provide adequate drainage facilities throughout the camps to ensure that disease vectors such as stagnant water bodies and puddles do not form. Regular mosquito repellant sprays during rainy season in offices and construction camps and yards.
Not dispose food waste openly as that will attract rats and stray dogs.
Carryout short training sessions on best hygiene practices to be mandatorily participated by all workers. Place display boards at strategic locations within the camps containing messages on best hygiene practices.
Security and
Safety
Inadequate security and
safety provision in
construction camps may
create security and safety
problems of workforces and
assets and fire hazards
The Contractor shall
Provide appropriate security personnel (police or private security guards) and enclosures to prevent unauthorized entry in to the camp area.
Maintain register to keep a track on a head count of persons present in the camp at any given time.
Encourage use of flameproof material for the construction of labor housing / site office. Also, ensure that these houses/rooms are of sound construction and capable of withstanding wind storms/cyclones.
Provide appropriate type of firefighting equipment suitable for the construction camps.
All construction material storage should be sit a visible location secured with fence or solid walls with locks to avoid theft and vandalism.
Display emergency contact numbers clearly and prominently at strategic places in camps.
Communicate the roles and responsibilities of laborers in case of emergency in the monthly meetings with contractors.
Site Restoration Restoration of the
construction camps to
original condition requires
demolition of construction
camps.
The Contractor shall
Dismantle and remove from the site all facilities established within the construction camp including the perimeter fence and lockable gates at the completion of the construction work.
Dismantle camps in phases and as the work gets decreased and not wait for the entire work to be completed.
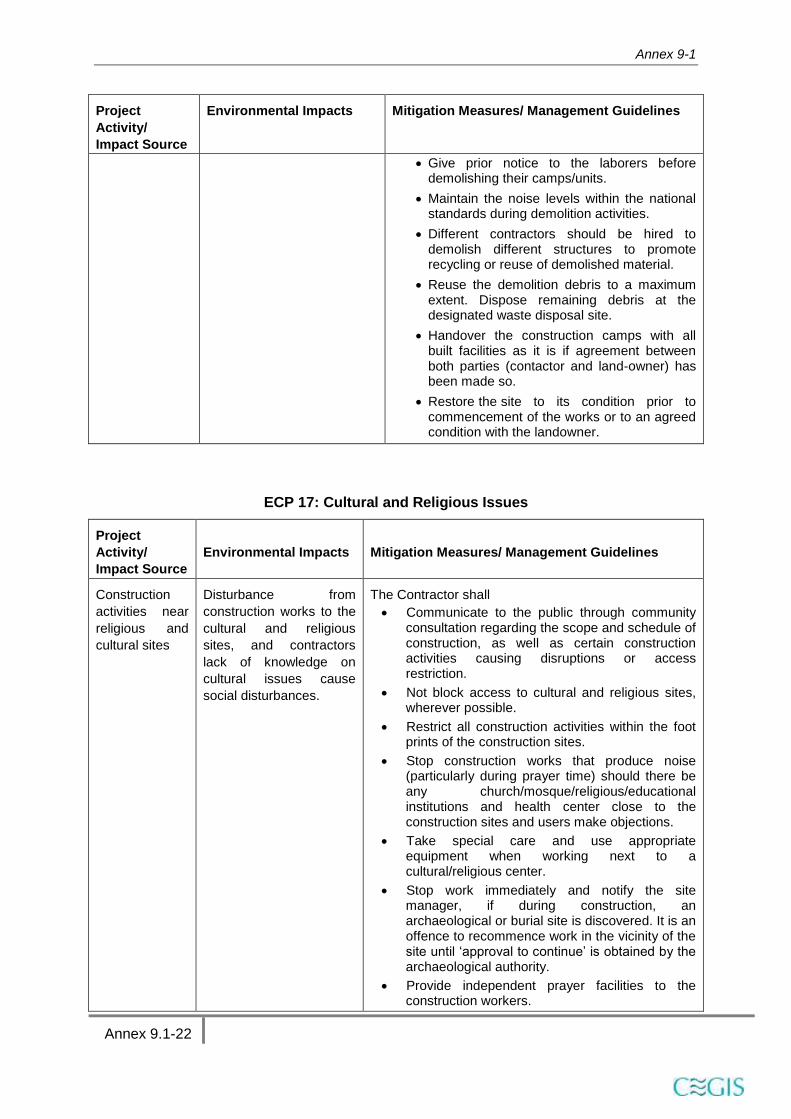
Annex 9-1
Annex 9.1-22
Project
Activity/
Impact Source
Environmental Impacts Mitigation Measures/ Management Guidelines
Give prior notice to the laborers before demolishing their camps/units.
Maintain the noise levels within the national standards during demolition activities.
Different contractors should be hired to demolish different structures to promote recycling or reuse of demolished material.
Reuse the demolition debris to a maximum extent. Dispose remaining debris at the designated waste disposal site.
Handover the construction camps with all built facilities as it is if agreement between both parties (contactor and land-owner) has been made so.
Restore the site to its condition prior to commencement of the works or to an agreed condition with the landowner.
ECP 17: Cultural and Religious Issues
Project
Activity/
Impact Source
Environmental Impacts Mitigation Measures/ Management Guidelines
Construction
activities near
religious and
cultural sites
Disturbance from
construction works to the
cultural and religious
sites, and contractors
lack of knowledge on
cultural issues cause
social disturbances.
The Contractor shall
Communicate to the public through community consultation regarding the scope and schedule of construction, as well as certain construction activities causing disruptions or access restriction.
Not block access to cultural and religious sites, wherever possible.
Restrict all construction activities within the foot prints of the construction sites.
Stop construction works that produce noise (particularly during prayer time) should there be any church/mosque/religious/educational institutions and health center close to the construction sites and users make objections.
Take special care and use appropriate equipment when working next to a cultural/religious center.
Stop work immediately and notify the site manager, if during construction, an archaeological or burial site is discovered. It is an offence to recommence work in the vicinity of the site until ‘approval to continue’ is obtained by the archaeological authority.
Provide independent prayer facilities to the construction workers.

Annex 9-1
Annex 9.1-23
Project
Activity/
Impact Source
Environmental Impacts Mitigation Measures/ Management Guidelines
Show appropriate behavior with all construction workers especially women and elderly people.
Allow the workers to participate in praying during construction time, if there is a request.
Resolve cultural issues in consultation with local leaders and supervision consultants.
Establish a mechanism that allows local people to raise grievances arising from the construction process.
Inform the local authorities responsible for health, religious and security duly informed before commencement of civil works so as to maintain effective surveillance over public health, social, and security matters.
ECP 18: Worker Health and Safety
Project
Activity/
Impact Source
Environmental Impacts Mitigation Measures/ Management Guidelines
Best practices Construction works may
pose health and safety risks
to the construction workers
and site visitors leading to
severe injuries and deaths.
The population in the
proximity of the construction
site and the construction
workers will be exposed to a
number of (i) biophysical
health risk factors, (e.g.,
noise, dust, chemicals,
construction material, solid
waste, waste water, vector
transmitted diseases, etc.),
(ii) risk factors resulting from
human behavior (e.g., STD,
HIV/AIDS, etc.) and (iii)
road accidents from
construction traffic.
The Contractor shall
Prepare an Occupational Health and Safety plan and submit the plan for supervision consultant's approval.
Implement suitable safety standards for all workers and site visitors, with sufficient provisions to comply with international standards (e.g. International Labor Office guideline on ‘Safety and Health in Construction; World Bank Group’s ‘Environmental Health and Safety Guidelines’) and contractor’s own safety standards, in addition to complying with national standards.
Provide the workers with a safe and healthy work environment, taking into account inherent risks in its particular construction activity and specific classes of hazards in the work areas.
Provide personal protective equipment (PPE) for workers, such as safety boots, helmets, masks, gloves, protective clothing, goggles, full-face eye shields, and ear protection. Maintain the PPE properly by cleaning dirty ones and replacing the damaged ones.
Safety procedures include provision of information, training and protective clothing to workers involved in hazardous operations and proper performance of their job.
Appoint an environment, health and safety manager to look after the health and safety of the workers.

Annex 9-1
Annex 9.1-24
Project
Activity/
Impact Source
Environmental Impacts Mitigation Measures/ Management Guidelines
Inform the local authorities responsible for health, religious and security duly informed before commencement of civil works and establishment of construction camps so as to maintain effective surveillance over public health, social and security matters.
Child and pregnant labor The Contractor shall
not hire children of less than 14 years of age and pregnant women or women who delivered a child within 8 preceding weeks.
Accidents Lack of first aid facilities and
health care facilities in the
immediate vicinity will
aggravate the health
conditions of the victims
The Contractor shall
Ensure health care facilities and first aid facilities are readily available. Appropriately equipped first-aid stations should be easily accessible throughout the place of work.
Document and report occupational accidents, diseases, and incidents.
Prevent accidents, injury, and disease arising from, associated with, or occurring in the course of work by minimizing, so far as reasonably practicable, the causes of hazards, in a manner consistent with good international industry practice.
Identify potential hazards to workers, particularly those that may be life-threatening and provide necessary preventive and protective measures.
Provide awareness to the construction drivers to strictly follow the driving rules.
Provide adequate lighting in the construction area, inside the tunnels, inside the powerhouse cavern and along the roads.
Construction
Camps
Lack of proper infrastructure
facilities, such as housing,
water supply and sanitation
facilities will increase
pressure on the local
services and generate
substandard living
standards and health
hazards.
The Contractor shall provide the following facilities
in the campsites to improve health and hygienic
conditions as mentioned in ECP 16: Construction
Camp Management:
Adequate ventilation facilities
Safe and reliable water supply.
Hygienic sanitary facilities and sewerage system.
Treatment facilities for sewerage of toilet and domestic wastes
Storm water drainage facilities.
Recreational and social facilities
Safe storage facilities for petroleum and other chemicals in accordance with ECP 2
Solid waste collection and disposal system in accordance with ECP1.

Annex 9-1
Annex 9.1-25
Project
Activity/
Impact Source
Environmental Impacts Mitigation Measures/ Management Guidelines
Arrangement for trainings
Paved internal roads.
Security fence at least 2 m height and security guards at entrances and every corner of the facility.
Sick bay and first aid facilities
Water and
sanitation
facilities at the
construction
sites
Lack of Water sanitation
facilities at construction
sites cause inconvenience
to the construction workers
and affect their personal
hygiene.
The contractor shall
Provide portable toilets at the construction sites with workforce size 25 people or more, work the whole day for a month. Location of portable facilities should be at least 6 m away from storm drain system and surface waters. These portable toilets should be cleaned once a day and all the sewerage should be pumped from the collection tank once a day and should be brought to the common septic tank for further treatment.
Provide safe drinking water facilities to the construction workers at all the construction sites.
Other ECPs Potential risks on health and
hygiene of construction
workers and general public
The Contractor shall follow the following ECPs to
reduce health risks to the construction workers and
nearby community
ECP 2: Fuels and Hazardous Goods Management
ECP 4: Drainage Management
ECP 10: Air Quality Management
ECP 11: Noise and Vibration Management
ECP 15: Road Transport and Road Traffic Management
Trainings Lack of awareness and
basic knowledge in health
care among the
construction workforce,
make them susceptible to
potential diseases.
The Contractor shall
Train all construction workers in basic sanitation and health care issues (e.g., how to avoid malaria, transmission of sexually transmitted infections (STI), and HIV/AIDS.
Train all construction workers in general health and safety matters, and on the specific hazards of their work. Training should consist of basic hazard awareness, site specific hazards, safe work practices, and emergency procedures for fire, evacuation, and natural disaster, as appropriate.
Implement malaria, HIV/AIDS and STI education campaign targeting all workers hired, international and national, female and male, skilled, semi- and unskilled workforces, at the time of recruitment and thereafter pursued throughout the construction phase on ongoing and regular basis. This should be

Annex 9-1
Annex 9.1-26
Project
Activity/
Impact Source
Environmental Impacts Mitigation Measures/ Management Guidelines
complemented by easy access to condoms at the workplace as well as to voluntary counseling and testing.
ECP 19: Construction and Operation Phase Security
Project
Activity/
Impact
Source
Impacts /Concerns Mitigation Measures/ Management Guidelines
Construction
Phase Inadequate
construction site
security poses a
significant risk to
assets, construction
materials and
property.
Theft/vandalism of
assets, materials and
property would
increase construction
costs and cause
delays in project
completion.
The Contractor shall:
Provide appropriate security personnel (i.e. security guards) to prevent unauthorized entry into the camp area.
Employ night watchman for periods of significant on-site storage or when the area necessitates.
Ensure all assets (i.e., tools, equipment, etc.) and construction materials at construction site are identified, inventoried and tracked as closely as possible. All assets should be clearly labeled and marked. Keep records of tool serial numbers and check inventory on a regular basis.
All tools and equipment should have a check out/in system, if not in use should be secured and stored in a proper place to prevent theft or loss. Provide storage sheds for the secure storage of equipment and tools when not in use.
Ensure there is proper fencing around construction site perimeter. Fencing should be chain-link at least 2.4 m high and secured with a steel chain and lock. If possible the entire site should be fenced; if this is not possible, make sure construction trailer and any equipment storage areas are fenced.
Ensure construction site has controlled access points (one or two entry points at most), allowing for close monitoring of comings and goings from the site.
Workers should be easily identified and have credentials that indicate site access.
No trespassing signs should be posted in conspicuous areas throughout the job site.
List of employees who have after hour access to the property should be available to the BWB PMU and local authorities.
Ensure job site is properly lighted at night. Well-lit areas should include any office trailers and equipment storage trailers. Floodlights operated by sensors should also be installed where appropriate.
Pre-employment screening investigations should be used to verify the applicants relating to their

Annex 9-1
Annex 9.1-27
employment, education and criminal history background.
Improper security
measures may pose
security risk for
construction workers
and especially foreign
staff on construction
sites.
The Contractor shall:
Prepare site specific security plan.
Maintain register to keep track of number of persons present in the camp at any given time.
Provide appropriate security personnel at job sites as mentioned above.
Ensure proper fencing as mentioned above.
Ensure controlled access points to job site as mentioned above.
Ensure works have easily identified credentials as mentioned above.
Ensure job sites are properly lighted at night, as mentioned above.
Operation
Phase
Vandalism/damage
(including use of
explosives) of water
transmission mains,
transfer stations Plant,
Gas Pipelines, RMS,
control stations and
storage reservoirs.
Theft of infrastructure
(i.e. metals and etc.) is
also of concern.
Patrol Men and Pipeline Community Policing Forum shall routinely conduct patrols and inspections of transmission mains Plant area and facilities.
They shall monitor suspicious activity and notify local authorities and BWB GPS along with VH/GVH/TA’s in event of any such occurrence/incident.
Ensure strategic infrastructure sites such as reservoirs RMS, Gas Pipelines, and main Plant transfer stations are secure and fenced with controlled access points. Fencing should be chain-link at least 2.4 m high and secured with a steel chain and lock.


Annex 11-1
Annex 11.1-1
Annex 11-1: Terms of reference of the Independent Monitor
A. Background
857. Ghorashal is a major power generation center of BPDB located on the eastern bank
of river Shitalakhya in the Palash Upazilla of Narsingdi District. Currently, it has six
generating units with a nominal generating capacity of 950MW (2x55MW and 4x210 MW)
based on gas fired conventional steam turbine technology. The average efficiency of the
plants at Ghorashal is around 31% which is quite poor compared to the efficiency of around
55% for the modern combined cycle power plants. Government has decided to repower the
unit-4 (nominal capacity is 210 MW) of the Ghorashal Power Plants. Accordingly the
feasibility study and EIA has been conducted. The World Bank is financing the project. The
project involves the replacement of the current steam plant with a more efficient combined
cycle plant. As part of new plant, a gas turbine will be installed and the present boiler will be
replaced by a HRSG (Heat Recovery Steam Generator).
858. The ECR 1997 of MoEF and EHS guideline of World Bank require detail
environmental monitoring during pre-construction, construction and operation of the plant.
The monitoring includes environmental compliance monitoring, impact monitoring and
monitoring of environmental quality.
B. Objectives
859. A detailed EMP has been prepared as part of the present EIA study. As one of the
key elements of the EMP, a three-tier monitoring program has been proposed comprising
compliance monitoring, impact monitoring, and Independent monitoring. The main purpose
of the monitoring program is to ensure that the various tasks detailed in the EMP particularly
the mitigation measures are implemented in an effective manner, and also to evaluate
project’s impacts on the key environment and social parameters.
860. The main purpose of the Independent monitoring – the third tier of the monitoring
program - will be to ensure that all the key entities including EHSU Circle, OE, and
contractors are effectively and adequately fulfilling their designated role for EMP
implementation, and that all the EMP requirements are being implemented in a timely and
effective manner. The primary objective for engaging an independent monitor is to review
the efficacy of EMP implementation as well as internal monitoring, and conduct periodic third
party monitoring and provide feedback to BPDB and WB on policy improvement and
enhancement of implementation process. The Independent Monitoring Consultants (IMC)
will review implementation process as per set procedures and tasks given in the EMP and
assess the achievement of overall environmental management objectives.
861. The Independent Monitoring Consultant should have good experience in carrying out
Environmental Monitoring including Environmental Compliance Monitoring of Power Plant.
The Consulting Institute/Firm should have well equipped and certified laboratory for
necessary analysis or should have arrangement with other laboratories which are certified by
the relevant statutory body of the country.
C. Scope of Work
862. The scope of work of the IMC will include the following specific tasks:
To develop specific monitoring indicators, checklists, and questionnaires to
undertake external monitoring (a preliminary list of monitoring indicators has been
given in the EMP) in consultation with BPDB and WB.

Annex 11-1
Annex 11.1-2
To review and verify the implementation progress of various EMP elements,
particularly, mitigation plan, compliance and impact monitoring, environmental
trainings, documentation, and grievance redress mechanism.
To review and verify the functioning of the key entities – EHSU circle, OE, and
contractors - for environmental management.
Identify the strengths and weaknesses of the design of EMP and its implementation,
and also the entities tasked to undertake various tasks detailed in the EMP.
Evaluate and assess the institutional arrangements established for the environmental
management of the project. Evaluate and assess the effectiveness and
appropriateness of the key personnel of EHSU Circle, OE, and contractors tasked to
implement various aspects of the EMP.
Evaluate and assess the adequacy of the mitigation measures proposed in the
Mitigation Plan in addressing the potentially negative impacts of the project activities
and propose changes as appropriate.
Review results of internal monitoring (compliance and impact monitoring) and verify
its effectiveness through community consultations, spot checks, and field
observations.
Review the process and outcome of environmental trainings conducted by different
project entities in line with the training program given in the EMP.
Review the process and outcome of the documentation and reporting being carried
out by various project entities in line with the EMP requirements.
Identify, quantify, and qualify the types of EMP-related conflicts and grievances
reported and resolved and the consultation and participation procedures.
Provide a summary of whether EMP is being effectively implemented
Describe any outstanding actions that are required to bring EMP implementation in
line with the GoB and WB requirements as stated in the EIA. Describe further
mitigation measures and or corrective actions needed to ensure that the project
remains environmentally and socially acceptable. Provide a timetable and define
budget requirements for these supplementary mitigation measures / corrective
actions.
Describe any lessons learned that might be useful for environmental assessment and
management of future projects.
D. Approach and Methodology
863. The general approach will include monitoring of EMP implementation activities and to
identify any environmental impacts actually caused by the project. The IMC will conduct
quarterly field visits for external monitoring. During the field visits, the IMC will carry out
meetings with the key project entities including PMU, EHSU Circle, OE, and contractors;
review reports and record of IMP implementation; conduct consultation meetings with key
stakeholders particularly communities and local government officials; carry out field
investigations including spot checks and visual observations, and identify need of any
sampling and laboratory analysis.
864. The IMC will prepare checklists and questionnaires for the field investigations,
comprising both qualitative and quantitative parameters. After each field visit, the IMC will

Annex 11-1
Annex 11.1-3
prepare external monitoring report comprising field observations and findings, assessment of
EMP implementation, key gaps identified, conclusions, and recommendations for addressing
the gaps.
865. E. Responsibility of BPDB
866. The BPDB through its PIU will ensure timely supply of background references, data
and project options to the IMC. It will ensure uninterrupted access to work sites, relevant
offices of the GOB and BPDB in particular. The IMC will participate in quarterly coordination
meetings with the BPDB in presence of the OE.
867. Recommendation based on the result of the external monitoring will be provided to
BPDB to cover up the deficiencies identified by the IMC. BPDB will accept the
recommendations of the IMC if they are within the scope of work and there is nothing
incorrect in the report.
F. Responsibility of Owner’s Engineer
868. The OE will provide appropriate protocol at site or at its Project Office for the field
visit of the IMC. It will on behalf of BPDB ensure free access to work sites, impact areas and
the database on EMP implementation. The OE will ensure timely intimation of its works
planning as and when made or updated during the construction period and keep the IMC
informed.
G. Team Composition of the IMC
869. The tasks of the key members of the IMC are given below:
Position/expertise Qualification and experience
1. Team Leader/ EMP
Implementation
Specialist
B.Sc. in environment engineering or environmental science, with
M. Sc.in relevant field with 15 years (including 5 years of
development bank funded project) experience in planning,
implementation and monitoring of environmental management for
large infrastructure projects. Experience in institutional capacity
analysis, preparation and implementation of EMPs, monitoring
reports, and knowledge of latest environmental safeguard policies
of the international financial institutions are required.
2. Environment
Specialist(s)
B.Sc. in environment engineering or environmental science with
10 years working experience in environmental impact assessment
including field surveys, stakeholder consultations, and analyzing
environmental impacts to identify mitigation measures in
compliance with environmental safeguard policies of the
international financing institutions and national legislations.
Experience of preparing and implementing EMP for externally
financed projects is essential.
3. Ecology and
Fisheries Specialist
Masters in biological sciences with 10 years working experience
in relevant fields. Thorough knowledge of ecological issues
(natural vegetation, terrestrial as well as aquatic fauna, fish, and
birds) and their implications for development projects; research
and work experience relating to ecological issues; and knowledge
of techniques for data collection and analysis.
4. Occupational Health Masters in Occupational health and safety or relevant fields with

Annex 11-1
Annex 11.1-4
Position/expertise Qualification and experience
and Safety
Specialist
10 years of experience in IEE, EIA, EMP planning, environment
monitoring, and occupational health and safety Issues.
5. Data Base Specialist Graduate in relevant field with working experience and knowledge
of software, those are commonly used in Bangladesh;
demonstrated ability to design and implement automated MIS(s)
for monitoring progress, comparing targets with achieved
progress and the procedural steps.
6. Junior
Environmental
Monitoring
Specialist (s)
B.Sc. in environment engineering or environmental science with
minimum three (3) years of experience in Environmental
monitoring, data collection and analysis, environmental analysis,
or relevant environmental field.
H. Time Frame and Reporting
870. The IMC will be employed over a period of five years with intermittent inputs from the
professional team to continue one year after completion of the Power Plant Commissioning.
871. Quarterly and annual monitoring reports should be submitted to the BPDB with
copies to the WB. An evaluation report at the end of the Project should be submitted to the
BPDB and WB with critical analysis of the achievement of the programs and the
environmental performance of Ghorashal unit-4.
872. The IMC will provide monitoring and evaluation report covering the following aspects:
Field observations, results of any field investigations and or laboratory analysis
Assessment of whether the EMP is being implemented as planned and budgeted
Assessment of the extent to which the specific EMP objectives and the expected
outcomes/results have been achieved and the factors affecting their achievement or
non achievement
Major areas of improvement and key risk factors
Major lessons learnt and
Recommendations.
873. Formats for collection and presentation of monitoring data will be designed in
consultation with BPDB.
E. Budget and Logistics
The budget should include all expenses such as staff salary, office accommodation, training,
computer/software, transport, field expenses and other logistics necessary for field activities,
data collection, processing and analysis for monitoring and evaluation work. Additional
expense claims whatsoever outside the proposed and negotiated budget will not be
entertained. VAT, Income Tax and other charges admissible will be deducted at source as
per GOB laws.

Annex 11-1
Annex 11.1-5
Sl.. Item Unit Qty Rate, USD Amount, USD
Remuneration
1 Team Leader/EMP Implementation
Specialist man-month 24 6,000 144,000
2 Environmental Specialist man-month 36 4,000 144,000
3 Ecology and Fisheries Specialist man-month 24 4,000 96,000
4 Occupational Health and Safety
Specialist man-month 24 4,000 96,000
5 Data Base Specialist man-month 36 3,000 108,000
6 Junior Environmental Monitoring
Specialist (s) man-month 72 1,500 108,000
Subtotal 696,000
Reimbursable Cost
1 Vehicle Rental Months 36 800 28,800
2 Vehicle Fuel LS
5,000
3 Logistics LS
10,000
4 Monitoring Costs (3 years of operation) 122,330
Subtotal 166,130
Contingency (10%) 86,213
Total 948,343

Annex 11-2
Annex 11.2-1
Annex 11-2: Guidelines for electricity and electro-magnetic
fields for work zones
According to the WBG’s General Health and Safety Guidelines, 2007 following standards
presented in Table A11-2 (a) should be maintained for ensuring work place safety related to
high voltage power lines.
Table A11-2(a): No Approach Zones for High Voltage Power Lines
Nominal Phase to phase voltage rating Minimum distance (m)
750 or more volts, but no more than 150,000
volts
3
More than 150,000 volts, but no more than
250,000 volts
4.5
More than 250,000 volts 6
In addition, WBG Guidelines on Thermal Power Plants (2008) recommended additional
indicators specifically applicable to electric power sector activities, which include the ICNIRP
exposure limits for occupational exposure to electric and magnetic fields listed in Table A11-
2 (b).
Table A11-2 (b): ICNIRP Exposure limits for occupational exposure to electric and
magnetic fields
Frequency Electric Field (V/m) Magnetic Field (µT)
50 Hz 10,000 500
60 Hz 8300 415
Source: INCIRP (1998): ‘Guideline for limiting exposure to time varying electric, magnetic,
and electromagnetic fields (up to 300 GHz) in WBG (2008): EHS Guidelines for Thermal
Power Plants

Annex 11-3
Annex 11.3-1
Annex 11-3: Detailed environmental monitoring costs
Sl Components of EHS Monitoring
Monitoring Indicators Nos of sample
Frequency (yearly)
Total NOS of
Samples
Cost Estimate (USD)
Rate Total
1. Boiler Decommissioning (six month) 1.1. Air Quality Asbestos Fiber 2 96 48 500 24,000.00
1.2. Soil Quality Asbestos, Pb, Cd, Cr, Cu, Zn, Mn, As, Se Hg, and oil/grease
3 2 3 750 2,250.00
1.3. Water Quality Asbestos, Oil and Grease, Total Residual Cl, alkalinity, Ammonium Nitrogen, Free Ammonia, Total Cr, Fe, Ca, Zn, Cu, etc.
3 2 3 250 750
1.4. Ambient Noise LAeq, L10, L90 (day time only) 1 96 48 15 720
1.5. Occupational health and Safety
Noise (LAeq) 2 48 48 15 720
Use of PPEs and practice of Safety Procedure LS 6,000.00
Health Checkup LS 6,000.00
Subtotal 40,440
2. Environmental Monitoring during Pre-construction and Construction Phase (3 years)
2.1. Ambient Air Quality
NOx, SOx, SPM, PM10, PM2.5, CO, O3 2 96 576 500 288,000.00
2.2. Ambient Noise LAeq, L10, L90 (day and Night time) 7 96 2016 25 50,400.00
2.3. Water Quality
pH, TSS, TDS, Oil and Grease, Total Residual Cl, Total Cr, Fe, Ca, Zn, Pb, Cd, Hg, As, total alkalinity, Ammonium Nitrogen, Free Ammonia, BOD5, COD, EC Temperature outside the mixing zone, etc
3 12 108 250 27,000.00
2.4. Ecosystem and Biodiversity
Plant Growth, Canopy Coverage, Disease 1 1 3 7,000.00 21,000.00
Tree felling LS 10,000.00
2.5. Fish Diversity and Composition
Diversity Index, Richness, Composition, Habitat Suitability Index, etc.
2 4 24 450 10,800.00
2.6. Agricultural Production
Crop Production Loss 5 2 30 100 3,000.00
2.7. Occupational Noise (Day and Night time)
LAeq, vibration 2 96 576 25 14,400.00

Annex 11-3
Annex 11.3-2
Sl Components of EHS Monitoring
Monitoring Indicators Nos of sample
Frequency (yearly)
Total NOS of
Samples
Cost Estimate (USD)
Rate Total
2.8. Exposure to Electro-magnetic Field
Electrical Field, Magnetic Field 3 4 36 15 540
2.9. Health and Sanitation
Inspection of Availability of Potable Water, Drinking water quality, Availability of Hygienic Toilet
1 12 36 700 25,200.00
2.10. Community Health, Safety and Security
Implementation of EMP 1 12 36 700 25,200.00
Subtotal 475,540
Total 515,980
Sl Components of EHS
Monitoring Monitoring Indicators
Location No
Frequency Total
Sample in 3 year
Cost Estimate (USD)
Rate Total
3 Environmental Monitoring During 3 years of Operation
3.1 Physical Environment
3.1.1 Ambient Noise LAeq, L10, L90 (day and Night time) 5 Monthly 180 25 4,500.00
3.1.2 Effluent (Waste Water) Oil and grease, Total Residual Cl, Cu, Fe, Zn, Pb, Cd, Hg, As, COD, BOD
1 Weekly 144 250 36,000.00
3.1.3 Water Quality: Surface Water
pH, TSS, TDS, Oil and Grease, Total Residual Cl, Total Cr, Fe, Ca, Zn, Pb, Cd, Hg, As, total alkalinity, Ammonium Nitrogen, Free Ammonia, BOD5, COD, EC , ACM, Temperature outside the mixing zone, etc. [1]
3 Monthly 108 250 27,000.00
3.1.4 Ambient Water Quality: Ground Water
pH, Total Hardness, DO, CL, Total Coliform, F, Fe, Mn, As, PO4, SO4, ACM, etc
1 Monthly 36 250 9,000.00
3.2 Waste Generation and Management
3.2.1 Generation of Non Hazardous Solid Waste (Domestic waste, Office Waste,)
Types and Quantity, Characteristics Quarterly LS 900
3.2.2 Generation of Hazardous Solid Types and Quantity, Characteristics Quarterly LS 900

Annex 11-3
Annex 11.3-3
Sl Components of EHS
Monitoring Monitoring Indicators
Location No
Frequency Total
Sample in 3 year
Cost Estimate (USD)
Rate Total
Waste
3.2.3
Generation of Hazardous Liquid Waste, Sludge (return from Water Treatment Plant, Sludge from clarifier, neutralization pond)
Quality of Water in Neutralization Pond (e.g., corrosivity, reactivity), Presence of carcinogenic chemicals (e.g., hydrazine)
Quarterly LS 900
3.2.4 Non Hazardous Waste Management
Condition of waste bins, waste transportation vans,
Quarterly LS 900
Capacity of Waste Disposal Site Quarterly LS 900
Leaks, drips or other indications of waste spill during handling and transporting
- Quarterly LS 900
3.2.5 Hazardous Waste Management Labeling of Hazardous Materials, hazardous waste, documentation of hazardous chemical use, etc.
- Quarterly LS 900
3.3 Ecosystem and Biodiversity
3.3.1 Plant Health Plant Growth, Canopy Coverage, Disease, etc. 3 Yearly LS 4,500.00
3.3.2 Occurrence of Wildlife Species Composition and Status 3 Yearly LS 1,500.00
3.3.3. Fish Diversity and Composition Diversity Index, Richness, Composition, Habitat Suitability Index, etc.
3 Quarterly LS 6,000.00
3.4 Land and Agricultural Resources
3.4.1 Land use and Land Cover change
Land cover and Land use - Once in three years
1/3 of the
total LS cost
5,000.00
3.4.2 Agricultural Production Crop Production Loss 1 Yearly 3 500 1,500.00
3.5 Occupational Health and Safety
3.5.1 Occupational Noise LAeq, L10, L90, Noise Exposure (Day and Night time)
3 Quarterly 36 25 900
3.5.2 Exposure to Electro-magnetic Field
Electrical Field, Magnetic Field 3 Quarterly 36 15 540
3.5.3 Worker Health General Health Condition, Hearing test, skin disease, etc.
1 Quarterly 9 50 450
3.5 Labor and Working Condition
3.5.1 Health and Sanitation Availability of Potable Water 2 Monthly 72 10 720

Annex 11-3
Annex 11.3-4
Sl Components of EHS
Monitoring Monitoring Indicators
Location No
Frequency Total
Sample in 3 year
Cost Estimate (USD)
Rate Total
Drinking water quality (Ph, TS, EC, F, Cl, As, Mn, Fe,Total Hardness, Total Coliform, PO4, SO4)
1 Monthly 36 200 7,200.00
Availability of Hygienic Toilet 2 Monthly 72 10 720
3.6 Community Health, Safety and Security
3.6.1 Community Health Status of Communicable Diseases 2 Half yearly 6 250 1,500.00
3.6.2 Safety and Security Emergency Preparedness and Response of GPS
1 Half yearly 6 250 1,500.00
Community Relation Program/ Community Awareness Program, Training
1 Half yearly 6 100 600
3.7 Measures beyond compliance
3.7.1 Public Toilets and socio-cultural facilities
Condition of toilets and socio-cultural facilities, number of benefited person/family
3 Half yearly 18 50 900
3.7.3 Training of youths Number of youths trained, quality of training, and perception of youth about the training
1 Half yearly 6 500 3,000.00
3.7.4 Free healthcare service to poor Number of patients served and perception of population about the service
1 Half yearly 6 500 3,000.00
Total 122,330

Annex 13-1
Annex 13.1-1
Annex 13-1: Terms of Reference of EHS Consultants of
Owner’s Engineer
A. Objective
The primary objectives of the consulting services of supervising environmental and health
and safety management during decommissioning and construction are to:
ensure that the construction methods as proposed by the contractor for carrying out the works are satisfactory, with particular references to the technical requirements of sound environmental standards on the basis of safeguard requirements (proposed in the EIA, this includes Government and the World Bank environmental guidelines), inspection of contractors’ construction equipment, review contractor’s health and safety standards, inspect construction yards and work camps, interview contractors’ personnel and general public;
Prepare checklist of monitoring factoring WBG’s EHS Guidelines on occupational health and safety procedure and practice, sanitation condition, implementation of EMP, and waste management practices and efficiency.
Supervise contractor in implementing EMP, environmental monitoring plan, and ensuring environmental social safeguarding during construction activities.
Ensure that the recommendations of the environmental management plan (EMP), environmental monitoring plan and environmental code of practices (ECPs) are strictly followed by the contractors;
prepare quarterly environmental and health and safety monitoring and annual reports of implementing these plans as part of project implementation report, and carry out environmental management seminars for contractors and BPDB staffs; and
monitor the implementation of the health and safety program at work site including the information and education campaign on sexually-transmitted diseases and HIV/AIDS (human immunodeficiency virus/acquired immunodeficiency syndrome) as required by the civil works contracts
B. Resources
The consulting services will require the following input:
Sl. No Expertise Input (PM)
A International Consultants
1 Intl. Environmental Specialist 15
2 Asbestos Management Specialist 3
Subtotal (A) 18
B National Consultants
3 Environmental Specialist 36
4 Occupational Health and Safety Specialist 36
5 Social Specialist 12
6 Field Surveyors 36
Subtotal (B) 120
Total (A+B) 138

Annex 13-1
Annex 13.1-2
C. International Consultants
1. International Environmental Specialist
The duties of the Consultant shall include, but not limited to:
Update the EMP provided in the EIA which will be a part of the Tender Documents of EPC Contractor
Prepare checklist of monitoring on occupational safety procedure and practice, health and sanitation condition, implementation of EMP, and waste management practices and efficiency
Ensure that the construction methods as proposed by the contractor for carrying out the works are satisfactory, with particular references to the technical requirements of sound environmental and social safeguard standards on the basis of the EIA
Carry out environmental and social management seminars for contractors and BPDB staffs
Prepare quarterly environmental and social monitoring and annual reports of implementing the EMP as part of project implementation report
2. Asbestos Management Specialist
The Owner’s Engineer will engage an Asbestos Management Specialist to manage removal
and disposal of asbestos during decommissioning of boiler. The specialist shall have
relevant training and three years of experience in managing removal and disposal of
asbestos. Specific responsibilities include:
a. Undertake assessment of the facility to determine the presence of asbestos, estimate their volume, and assess their condition (intact, degraded, friable, etc.)
b. Assist International Environmental Specialist in preparing the checklist for the monitoring work
c. Plan removal and disposal work including volume of asbestos to be removed
d. Train the removal workers in removal of asbestos
e. Ensure that required PPE is available before start of the work
f. Supervise removal and disposal work
g. Prepare regular progress reports
D. National Consultants
1. Environmental Specialist
The duties of the national environmental specialist shall include, but not limited to:
Assist international environmental specialist in updating the EMP provided in the EIA
Based on the checklist conduct monitoring on implementation of EMP, sanitation condition, and waste management practices and efficiency
Supervise the construction methods as proposed by the contractor for carrying out the works are satisfactory, with particular references to the technical requirements of sound environmental and social safeguard standards on the basis of the EIA
Assist the international environmental specialist in conducting environmental and

Annex 13-1
Annex 13.1-3
social management seminars for contractors and BPDB staffs
Assist in the preparation of quarterly environmental monitoring and annual reports of implementing the EMP as part of project implementation report
2. Occupational Health, and Safety Specialist
The duties of the Consultant shall include, but not limited to:
Assist international environmental specialist in ensuring that that the construction methods as proposed by the contractor for carrying out the works are satisfactory, with particular references to the technical requirements of sound environmental standards on the basis of EMP
Based on the checklist conduct monitoring on occupational safety procedure and practice
Assist international environmental specialists in preparing quarterly environmental monitoring and annual report of implementing this plan as part of project implementation report, and carry out environmental management seminars for contractors and BPDB staff
Assist in plantation and community forest development work along the Rawwater transmission main corridor, community woodlots, and other project site as proposed in the EMP
Ensure worksite health and safety aspects of the contractors’ work as per EMP and ECPs
Ensure that the contractors do not damage the existing plantations
3. Social Specialist
The social specialist will be responsible for the following:
Reviewing the EMP including mitigation and monitoring plan, enhancement plan pertaining to social aspects;
Inspect working and labor condition
Ensure priorities are giving to the local labor during recruitment of construction labor
Ensure that gender aspects are adequately covered as per the EMP
monitor the implementation of the information and education campaign on sexually-transmitted diseases and HIV/AIDS (human immunodeficiency virus/acquired immunodeficiency syndrome) as required by the civil works contracts
Monitor grievance redress mechanism
provide inputs to the quarterly and annual reports
4. Field Surveyors (2)
The Field Surveyors will be responsible for:
Work under the guidance of the team to collect data and monitor ecological resources, HIV/AIDS program, plantation program in bi-monthly basis as recommended in the ESIA through various defined methodologies such as technical sampling, planting activities, etc.
Inspect the construction activities to ensure activities are carrying out in line with the EMP under the guidance of the team
Exclusively engaged in the project site and influence area and responsible for collecting secondary data from the concerned agencies.
Exclusively engaged to work in close association with the local government institutions, NGOs and maintaining all sorts of liaisons with different institutions and officials.

Annex 13-1
Annex 13.1-4
E. Budget
Sl. Item Unit Qty Unit Cost
(USD)
Amount,
USD
International Consultants
1 Intl Environmental Specialist MM 15 25,000 375,000
2 Asbestos Management Specialist MM 3 25000 75,000
National Consultants
3 Environmental Specialist MM 36 5,000 180,000
4
Occupational Health and Safety
Specialist
MM
36 5,000 180,000
5 Social Development Specialist MM 12 5,000 60,000
6 Field Surveyors MM 36 1,000 36,000
4 International Travel - Airfare RT 9 4,000 36,000
Total 942,000

Annex 13-2
Annex 13.2-1
Annex 13-2: Scope of Work for Capacity Building and
Training Consultant
A. Background
A capacity building program in environmental impact assessment, environmental management and occupational health and safety has been proposed fir PIU and GPS staffs. The program will (a) prepare training plan in environmental, health and safety, and (b) conduct training programs to improve the capability of ‘implementation staff’ in monitoring the implementation of environmental management and monitoring plan (EMMP) of the Project including hazardous waste management and occupational health and safety. This will be done through a program of technical assistance and training over a period of 3 months.
B. Objectives of the Services
The objectives of the services are: (a) to make PIU and EHSU Circle staffs familiar with environmental issues and impacts related to the project and to improve their skills in management and evaluation of the EMP (b) to develop and deliver training on hazardous waste management, (c) to develop and deliver training programs on occupational health and safety, and (d) to develop and deliver training on environmental monitoring, evaluation, and reporting.
C. Scope of Work
Task 1: Preparation of Training Modules on Environmental Management and
Monitoring:
The purpose of this task is to develop training modules on (i) environmental issues and impacts related to the project, (ii) hazardous waste management in the project, (iii) occupational health and safety in the project, and (iv) environmental monitoring, evaluation, and reporting.
Training in Module 1 on environmental issues and impacts will broadly include:
Fundamentals of Environmental Impact Assessment and the EIA Process at DoE and at the World Bank
Typical Environmental Issues in thermal power projects
Analyses of Alternatives and Identification of Preferred Option
Case studies on Scoping of Issues and Assessment of Alternatives for thermal generation Projects
Identification and Prioritization of Issues
Conducting Baseline Environmental and Socio-economic Information
Case studies on Collection of Baseline Information in EIA of thermal generation Projects
Prediction and Assessment of Impacts – Tools and Case studies
Conducting cumulative impacts and climate change assessments
Building an Environmental Management Plan
How to Review an EIA Report?
Public Consultation and Information Disclosure – The process with case studies
Training in Module 2 on hazardous waste management will broadly include:
Overview of hazardous waste regulations (US DOT, USEPA, OSHA, WBG etc.)
What is hazardous waste?

Annex 13-2
Annex 13.2-2
What are the hazardous waste in thermal power stations?
What to do with hazardous waste? Segregation, transportation and disposal to permanent site.
Emergency response
Training in Module 3 on occupational health and safety in the project will broadly include:
Overview of Labor Act, Factory Act, and international Acts (e.g., the Occupational Safety and Health Act)
General construction related standards, such as, scaffolding, fall protection, excavations, ladders, head protection, etc.
Walking-Working Surfaces, Means of Egress, Powered Platforms, Man lifts, and Vehicle-Mounted Work Platforms
Occupational Health and Environmental Control
Use of Personal Protective Equipment
Access to Medical and First Aid
HIV/AIDS and other STD management
Fire Protection Procedure
Handling and working with Compressed Gas and Compressed Air Equipment
Machinery and Machine Guarding, especially extremely heated environment
Use of Hand and Portable Powered Tools and Other Hand-Held Equipment, precautions in Welding, Cutting, and Brazing
Working with live electrical equipment
Commercial Diving Operations
Toxic and Hazardous Substances
Training in Module 4 on monitoring, evaluation, and reporting will broadly include:
Monitoring techniques and methods for various components of EMP
Environmental Monitoring Plan and Institutional Arrangements
Identify parameters to be monitored
Collection and analysis of environmental quality data, and Interpretation of monitoring parameters
Internal and external monitoring needs during construction and operation
Organizational responsibilities and implementation schedules
Reporting requirements of monitoring
Task 2: Deliver Training on Environmental Management and Monitoring:
The purpose of this task is to deliver a series of training programs for all the activities proposed in Task 1 to all the implementing agencies of the Project (BPDB, PIU, and GPS).
Based on the above scope of works, the consultant will carry out the following activities:
Undertake training need assessment for stakeholders including the implementation / construction personnel.
Devise training programs based on EIA report and site visits to the Project area
Prepare a staff training plan and associated materials (modules).
Evaluate the trainings.
Modify the training modules as necessary.
Hand over the final training modules to the BPDB/GPS for use in future training.
Prepare training reports.

Annex 13-2
Annex 13.2-3
D. Organization and Staffing
The services are expected to be provided over a 3 months period by a team comprising one environmental specialist/team leader and one occupational health and safety specialist. Details of proposed professionals and their required input are shown below.
Table 16-1: Details of Proposed Consultants
Items Input (Man Months)
Key Professional Staff
1. Int’l Environmental Specialist/Team Leader 3
2. Nat’l Occupational health and safety (including HIV/AIDS) 3
E. Supervision
The team will work in association with the PIU, reporting to the project director on a day-to-day basis. Overall supervision will be done by the EHSU Circle of GPS.
F. Outputs
The team’s outputs will include: (i) an inception report after one week of mobilization, (iii) a
draft final report at the end of 8th week, containing a description of achievements, details of
the training services provided, including all materials, an assessment of their effectiveness in
meeting objectives and recommendations for further training assistance, (iii) and a final
report at the end of assignment. All reports will be submitted in English
In addition, the team will prepare training materials for both training programs. Each training
program will consist of about 4 modules including some case studies and worked out
examples. The draft training modules should be submitted to the PIU and GPS before
conducting training programs for evaluation and final training modules will be presented at
the end of assignment.
G. Budget
Following Table presents the estimated budget for the capacity building and training
program.
Item Unit Unit Cost,
US$ Quantity
Total Cost,
US$
A. Remuneration and Per Diems
i. Key Professional Staff
Intl. Team Leader and Environmental Specialist
man-
month 25,000 3 75,000
Natl Occupational health and safety Specialist
(including HIV/AIDS)
man-
month 5,000 3 15,000
Sub Total A 90,000
B. Airfare and Transport
i. Local Transport Day 100 60 6,000
ii. Airfare RT 5,000 2 10,000
Sub Total B 16,000
C. Training Module Preparation and
Production No 2,500 1 2,500
D. Trainee Allowance days 75 150 11,250
E. Contingency (10% of subtotal, A+B+C) LS 1 11,975
Grand Total (A+B+C+D+E) 131,675


Annex 14-1
Annex 14.1-1
Annex 14-1: Advertisement for Public Consultation Meeting


Annex 14-2
Annex 14.2-1
Annex 14-2: List of Participants in the Public Consultation Meeting

Annex 14-2
Annex 14.2-2

Annex 14-2
Annex 14.2-3


Annex 14-3
Annex 14.3-1
Annex 14-3: Comment Sheet used during Public Consultation

Annex 14-3
Annex 14.3-2