SEVENTH NATIONAL COMMUNICATION ON CLIMATE ...
331
REPUBLIC OF BULGARIA SEVENTH NATIONAL COMMUNICATION ON CLIMATE CHANGE UNITED NATIONS FRAMEWORK CONVENTION ON CLIMATE CHANGE SOFIA, 2018
-
Upload
khangminh22 -
Category
Documents
-
view
0 -
download
0
Transcript of SEVENTH NATIONAL COMMUNICATION ON CLIMATE ...
REPUBLIC OF BULGARIA
SEVENTH
NATIONAL COMMUNICATION
ON CLIMATE CHANGE UNITED NATIONS
FRAMEWORK CONVENTION ON CLIMATE CHANGE
SOFIA, 2018
1
TABLE OF CONTENTS
LIST OF ABBREVIATIONS ................................................................................................................... 4
INTRODUCTION .................................................................................................................................... 5
1. Executive summary ......................................................................................................................... 7
1.1. Introduction ......................................................................................................................................... 7
1.2. National Circumstances ....................................................................................................................... 8
1.3. Inventories of Greenhouse Gas Emissions by Sources and Removals by Sinks ................................. 12
1.4. Policies and Measures ....................................................................................................................... 14
1.5. Projections and Total Effect of Policies and Measures ..................................................................... 16
1.6. Vulnerability Assessment, Climate Change Influence and Adaptation Measures .............................. 17
1.7. Financial resources and transfer of technology, including information under Articles 10 and 11, of
the Kyoto Protocol ........................................................................................................................................... 19
1.8. Education, Training and Public Awareness ....................................................................................... 20
1.9. Research projects and systematic observation ................................................................................... 20
2. National circumstances relevant to greenhouse gas emissions and removals ................................... 28
2.1. Government Structure ........................................................................................................................ 28
2.2. Geographic Profile ............................................................................................................................ 28
2.3. Climate Profile ................................................................................................................................... 29
2.4. Population Profile .............................................................................................................................. 32
2.5. Economic Profile ............................................................................................................................... 34
2.6. Sectors ................................................................................................................................................ 39 2.6.1. Land Use and National Resources ................................................................................................. 40 2.6.2. Agriculture .................................................................................................................................... 42 2.6.3. Forestry ......................................................................................................................................... 43 2.6.4. Biodiversity ................................................................................................................................... 46 2.6.5. Taxes and Tax Policy .................................................................................................................... 47 2.6.6. Energy and Industrial Profile ........................................................................................................ 48 2.6.7. Transport ....................................................................................................................................... 51 2.6.8. Waste ............................................................................................................................................. 54
3. Greenhouse gas inventory information .......................................................................................... 61
3.1. Introduction ....................................................................................................................................... 61
3.2. Background information on supplementary information required under Article 7, paragraph 1, of the
Kyoto Protocol and international agreements ................................................................................................. 61
3.3. Description of the National inventory arrangement .......................................................................... 62 3.3.1. Institutional, legal and procedural arrangements ........................................................................... 62 3.3.2. Overview of inventory planning, preparation and management.................................................... 65
3.4. Inventory preparation, data collection, processing and storage ....................................................... 67 3.4.3. Collection of activity data by ExEA .............................................................................................. 67 3.4.4. Inventory preparation .................................................................................................................... 68 3.4.5. Documentation and data archiving ................................................................................................ 71 3.4.6. Quality assurance, quality control and verification ....................................................................... 72
3.5. Brief general description of methodologies (including tiers used) and data sources used ................ 78
2
3.6. Brief description of key categories ..................................................................................................... 81
3.7. General uncertainty evaluation, including data on the overall uncertainty for the inventory totals . 83
3.8. Trends in greenhouse gas emissions .................................................................................................. 84 3.8.7. Energy ........................................................................................................................................... 91 3.8.8. Industrial Processes and Product use ............................................................................................. 92 3.8.9. Agriculture .................................................................................................................................... 93 3.8.10. Land-Use Change and Forestry ................................................................................................ 94 3.8.11. Waste ........................................................................................................................................ 95 3.8.12. Indirect greenhouse gases and sulphur oxides .......................................................................... 96
3.9. Recalculations .................................................................................................................................... 96
3.10. Information on the National Registry System .................................................................................... 96
4. Policies and measures .................................................................................................................. 101
4.1. Climate policy framework ................................................................................................................ 101
4.2. Policy - making process ................................................................................................................... 101
4.3. Domestic and regional programmes, legislative arrangements. ...................................................... 103
4.4. Policies and measures and their effects ........................................................................................... 124
4.5. Status of implementation and quantitative evaluation of the sectoral policies ................................ 192
4.6. Policies and measures pursuant to Article 2 of the Kyoto Protocol ................................................ 204
4.7. Information on minimization of adverse effects (including adverse effects of climate change) on
developing countries in the implementation of policies and measures .......................................................... 205
4.8. Policies and measures no longer in place ........................................................................................ 206
5. Projections and total effect of policies and measures .................................................................... 208
5.1. Emission projection scenarios ......................................................................................................... 208
5.2. Sectoral forecast .............................................................................................................................. 208 5.2.1. Energy ......................................................................................................................................... 208 5.2.2. Manufacturing Industries and Construction .............................................................................. 216 5.2.3. Transport Sector ......................................................................................................................... 217 5.2.4. Households and Services Sector ................................................................................................. 219 5.2.5. Industrial Processes and Product Use .......................................................................................... 221 5.2.6. Waste Sector................................................................................................................................ 223 5.2.7. Agriculture Sector ....................................................................................................................... 225 5.2.8. Land Use, Land Use Change and Forestry (LULUCF) ................................................................... 228
5.3. Projections of total GHG emissions and total effect of policies and measures................................ 229
5.4. Supplementary relating to mechanisms under Article 6, 12 and 17, of the Kyoto Protocol ............ 230
5.5. Methodology used for the presented GHG emission projections ..................................................... 240
5.6. Economic analysis of the possibility to undertake measures by sectors .......................................... 242 5.6.1. Energy ......................................................................................................................................... 243 5.6.2. Energy efficiency ........................................................................................................................ 244 5.6.3. Industry ....................................................................................................................................... 245 5.6.4. Transport ..................................................................................................................................... 245 5.6.5. Agriculture .................................................................................................................................. 246 5.6.6. Land use, land use change and forestry ....................................................................................... 248 5.6.7. Waste ........................................................................................................................................... 249
5.7. Projections, sensitivity analysis, focused on the key input variables. .............................................. 250
5.8. Specific assumptions related to the with measures scenario for GHG emissions ............................ 250
3
6. Vulnerability assessment, climate change impacts and adaptation measures ................................ 252
6.1. Background ...................................................................................................................................... 252
6.2. Expected Impacts of Climate Change for Eastern Europe including Bulgaria ................................ 259 6.2.1. Climate Scenarios for 2050 ......................................................................................................... 259 6.2.2. Climate Scenarios for the 2080s and end of 21 Century ............................................................. 262
6.3. Vulnerability Assessment ................................................................................................................. 266 6.3.1. Agriculture .................................................................................................................................. 270 6.3.2. Forestry ....................................................................................................................................... 272
6.4. Adaptation Policy and Measures ..................................................................................................... 280 6.4.1. Agriculture .................................................................................................................................. 282 6.4.2. Forestry ....................................................................................................................................... 287 6.4.3. Vulnerability assessment, climate change influence and adaptation measures ........................... 293
6.5. Soils .................................................................................................................................................. 293
7. Financial resources and transfer of technology ............................................................................ 294
7.1. Provision of new and additional financial resources ....................................................................... 294
7.2. Assistance to developing country Parties that are particularly vulnerable to climate change ........ 294
7.3. Provision of financial resources, including financial resources under Article 11 of the Kyoto
Protocol 294
7.4. Activities related to transfer of technology ...................................................................................... 294
8. Research projects and systematic observation .............................................................................. 300
8.1. General policy on research and systematic observation .................................................................. 300
8.2. Research ........................................................................................................................................... 300
8.3. Systematic Observation .................................................................................................................... 306
9. Education, training and public awareness .................................................................................... 314
9.1. Introduction ..................................................................................................................................... 314
9.2. Education ......................................................................................................................................... 314
9.3. Environmental Education in Schools ............................................................................................... 316
9.4. Development of Specific Syllabuses for Training of Teachers and Lecturers .................................. 317
9.5. Ecotourism ....................................................................................................................................... 317
ANNEX I –Biennial report ................................................................................................................... 318
1. Introduction ................................................................................................................................ 320
2. Information on greenhouse gas emissions and trends ................................................................... 320
3. Quantified economy-wide emission reduction target .................................................................... 322
4. Progress in achievement of quantified economy-wide emission reduction targets and relevant
information .......................................................................................................................................... 323
5. Projections ................................................................................................................................... 327
6. Provision of financial, technological and capacity-building support to developing country Parties 328
7. Other reporting matters .............................................................................................................. 329
4
LIST OF ABBREVIATIONS
a.s.l. above see level
BAS Bulgarian Academy of Sciences
DSSAT Decision Support System for Agrotechnology Transfer
EC European Commission
EE Energy Efficiency
SEDA Sustainable Energy Development Agency
EPER European Pollutant Emission Register
EU European Union
EU ETS European Union Emission Trading Scheme
ExEA Executive Environmental Agency
FCCC Framework Convention on Climate Change
FEC Final Energy Consumption
FEC Final Energy Consumption
GDP Gross Domestic Product
GEF Global Environmental Facility
GHG Green House Gases
GVA Gross Value Added
HPP Hydro Power Plant
IMCCC Inter-Ministerial Committee on Climate Change
IPPC Integrated Pollution Prevention and Control
ISPA, PHARE,
SAPHARD European Union funds and programmes
IWG Interministerial Working Group
JI Joint Implementation
JISC Joint Implementation Steering Committee
KP Kyoto Protocol
LULUCF Land Use, Land Use Change and Forestry
MAF Ministry of Agriculture and Food.
MEE Ministry of Economy and Energy
MEYS Ministry of Education, Youth and Science
MF Ministry of Finance
MFA The Ministry of Foreign Affairs
MOEW Ministry of Environment and Water
MRD Ministry of Regional Development
NAPCC National Action Plan on Climate Change
NFD National Forestry Directorate
NGO Nongovernmental Organization
NIMH National Institute of Meteorology and Hydrology
NPP Nuclear Power Plant
NSI National Statistical Institute
PEC Primary Energy Consumption
PRTR Pollutant Release and Transfer Register
R&D Research and Development
RES Renewable Energy Sources
SAF State Agricultural Fund
SC Steering Committee
SME small and medium-sized enterprises
TPP Thermal Power Plant
UN United Nations
UNFCCC United Nations Framework Convention on Climate Change
5
INTRODUCTION
The United Nations Framework Convention on Climate Change (UNFCCC) sets an overall
framework for intergovernmental efforts to tackle the challenge posed by climate change. It
recognizes that the climate system is a shared resource whose stability can be affected by
industrial and other emissions of carbon dioxide and other greenhouse gases.
The ultimate goal of UNFCCC is to achieve stabilization of greenhouse gas concentrations
in the atmosphere at a level that would prevent dangerous anthropogenic interference with
the climate system. Such a level has to be achieved within a time frame sufficient to allow
ecosystems to adapt naturally to climate change; to ensure sufficient food production and to
enable sustainable economic development.
UNFCCC entered into force on 21 March 1994. Bulgaria is signatory to the Convention
since June 1992 and a Party to it after ratification by the Bulgarian Parliament since 1995. In
conformity with Article 4.6 and 4.2(b) of UNFCCC, Bulgaria as a country in transition
adopted 1988 as a base year for the implementation of the Convention instead of 1990. As
an Annex I Party to UNFCCC Bulgaria adopted the target to stabilize emissions of
greenhouse gases by 2000 at a level not exceeding the level in 1988, which was
overachieved. Оn 11 December 1997 in Kyoto, Japan was adopted the Kyoto Protocol - an
international agreement linked to the UNFCCC, setting internationally binding emission
reduction targets for its Parties. It entered into force on 16 February 2005.
The Kyoto Protocol was ratified by the Bulgarian Parliament on July 17, 2002. According to
Annex B of KP the quantified emission reduction commitment of Bulgaria for the first
commitment period (2008-2012) was 92.0 % of the base year (1988) emissions.
The First and Second National Communications of Bulgaria were elaborated by the
Interministerial Committee supported by independent organizations and experts. The work
was coordinated by the Ministry of Environment and Water.
The Third and Fourth National Communications of Bulgaria were elaborated for the
Ministry of Environment and Water by the Energy Institute on a contractual basis and under
coordination by the Interministerial Committee on Climate Change supported by
independent organizations and experts in cooperation with the competent institutions - the
Ministry of Agriculture and Forestry, Ministry of Economy and Energy, National Institute
of Meteorology and Hydrology and Energy Efficiency Agency. They represent a further step
in elaborating and implementing the national climate change policy and the new
international commitments.
The Fifth National Communication was prepared for the Ministry of Environment and
Water by the Energy Institute on a contractual basis in cooperation with the Ministry of
Agriculture and Food, Ministry of Industry, Energy and Tourism and National Institute of
Meteorology and Hydrology.
The Sixth National Communication was prepared for the Ministry of Environment and
Water in cooperation with the Ministry of Agriculture, Food and Forestry, Ministry of
Energy, Ministry of Transport, Information Technology and Communications, National
Institute of Meteorology and Hydrology and Bulgarian Academy of Science.
The Seventh National Communication follows the requirements of the Common tabular
format for “UNFCCC biennial reporting guidelines for developed country Parties” (decision
19/CP.18); UNFCCC biennial reporting guidelines for developed country Parties (Annex,
decision 2/CP.17); Guidelines for the preparation of the information under Art. 7 of the
6
Kyoto Protocol (Annex, decision 15/CMP.1), the “Annotated Outline for Fifth National
Communications of Annex I Parties under the UNFCCC, including Reporting Elements
under the Kyoto Protocol” and the UNFCCC reporting guidelines on national
communications (FCCC/CP/1999/7).
It outlines the national policy in the field of climate change and reflects the respective
mitigation measures envisaged in the Third National Action Plan on Climate Change 2013 –
2020, approved by the Council of Ministers by Decision No 439/01.06.2012.
The Third National Action Plan on Climate Change provides specific measures for reduction
of greenhouse gas emissions across all sectors and these measures are consistent with both
the national policy on climate change and the potential of the national economy to reduce
emissions. The overall effect of the measures will ensure the implementation of the
commitments taken under the international agreements and the achievement of the legally
binding objectives under the European legislation. In the Sixth National Communication
projections for GHG emissions until 2020 are made, with accounting of the applied and
planned measures.
Two projection scenarios are defined and clearly delimitated: “with existing measures” and
“with additional measures”. In the scenario “with existing measures” only the applied and
accepted measures are reported, while in the scenario “with additional measures” are
considered also the measures planned for the time after the initial year of the projection.
The implementation of the country’s climate change policy is responsibility of the Ministry
of Environment and Water (MOEW). Given the horizontal nature of the climate change
policy, the principle of integrating the climate considerations in key sectoral policies such as
energy, households and services, industry, transport, agriculture, forestry and waste
management is applied when envisaging the measures in the Third NAPCC. Taking into
account the close interaction of the policies in these areas with the strategic planning related
to climate change, the implementation and enforcement of the NAPCC requires an active
involvement and commitment of all institutions responsible for carrying out the relevant
policies.
The Communication presents the overall situation in the country for the period since the
Sixth National Communication till the end of 2015.
7
1. Executive summary
1.1. Introduction
The United Nations Framework Convention on Climate Change (UNFCCC) sets an overall
framework for intergovernmental efforts to tackle the challenge posed by climate change.
UNFCCC entered into force on 21 March 1994. Bulgaria is signatory to the Convention
since June 1992 and a Party to it after ratification by the Bulgarian Parliament since 1995.
Оn 11 December 1997 in Kyoto, Japan was adopted the Kyoto Protocol - an international
agreement linked to the UNFCCC, setting internationally binding emission reduction targets
for its Parties. It entered into force on 16 February 2005. The Kyoto Protocol was ratified by
the Bulgarian Parliament on July 17, 2002.
The First and Second National Communications of Bulgaria were elaborated by the
Interministerial Committee supported by independent organizations and experts. The work
was coordinated by the Ministry of Environment and Water.
The Third and Fourth National Communications of Bulgaria were elaborated for the
Ministry of Environment and Water by the Energy Institute on a contractual basis and under
coordination by the Interministerial Committee on Climate Change supported by
independent organizations and experts in cooperation with the competent institutions - the
Ministry of Agriculture and Forestry, Ministry of Economy and Energy, National Institute
of Meteorology and Hydrology and Energy Efficiency Agency. They represent a further step
in elaborating and implementing the national climate change policy and the new
international commitments.
The Fifth National Communication was prepared for the Ministry of Environment and
Water by the Energy Institute on a contractual basis in cooperation with the Ministry of
Agriculture and Food, Ministry of Industry, Energy and Tourism and National Institute of
Meteorology and Hydrology.
The Sixth National Communication was prepared for the Ministry of Environment and
Water in cooperation with the Ministry of Agriculture, Food and Forestry, Ministry of
Energy, Ministry of Transport, Information Technology and Communications, National
Institute of Meteorology and Hydrology and Bulgarian Academy of Science.
The Seventh National Communication follows the requirements of the Common tabular
format for “UNFCCC biennial reporting guidelines for developed country Parties” (decision
19/CP.18); UNFCCC biennial reporting guidelines for developed country Parties (Annex,
decision 2/CP.17); Guidelines for the preparation of the information under Art. 7 of the
Kyoto Protocol (Annex, decision 15/CMP.1), the “Annotated Outline for Fifth National
Communications of Annex I Parties under the UNFCCC, including Reporting Elements
under the Kyoto Protocol” and the UNFCCC reporting guidelines on national
communications (FCCC/CP/1999/7).
It outlines the national policy in the field of climate change and reflects the respective
mitigation measures envisaged in the Third National Action Plan on Climate Change 2013 –
2020, approved by the Council of Ministers by Decision No 439/01.06.2012.
The Third National Action Plan on Climate Change provides specific measures for reduction
of greenhouse gas emissions across all sectors and these measures are consistent with both
the national policy on climate change and the potential of the national economy to reduce
emissions. In the Sixth National Communication projections for GHG emissions until 2020
are made, with accounting of the applied and planned measures.
8
Two projection scenarios are defined and clearly delimitated: “with existing measures” and
“with additional measures”. In the scenario “with existing measures” only the applied and
accepted measures are reported, while in the scenario “with additional measures” are
considered also the measures planned for the time after the initial year of the projection.
1.2. National Circumstances
The Republic of Bulgaria is a parliamentary democracy. The Bulgarian unicameral
parliament, the National Assembly consists of 240 deputies who are elected for 4-year-terms
by popular vote. The Head of state is the President (Rumen Radev since January 2017)
directly elected for a 5-year term with the right to one re-election. Executive power is
exercised by the government. Legislative power is vested in both the government and the
National Assembly. The Judiciary is independent of the executive and the legislature.
The Council of Ministers is the principal organ of the executive branch, being chaired by the
Prime Minister (Boiko Borisov since May 2017).
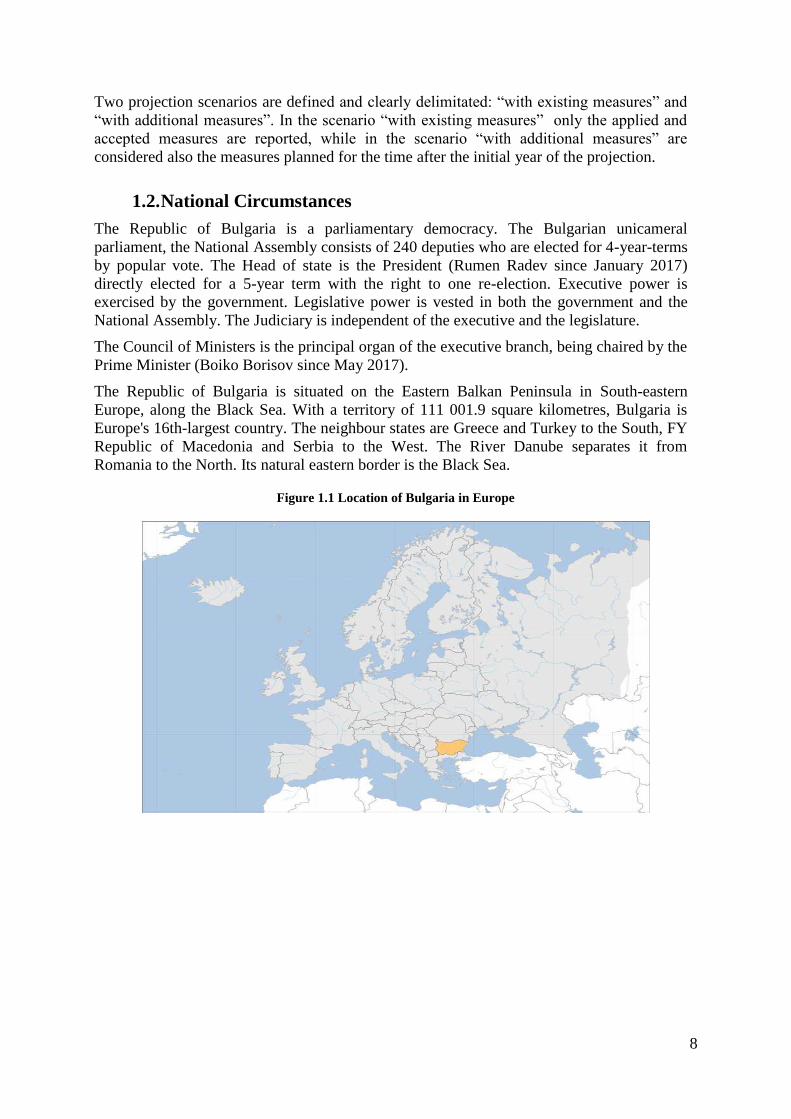
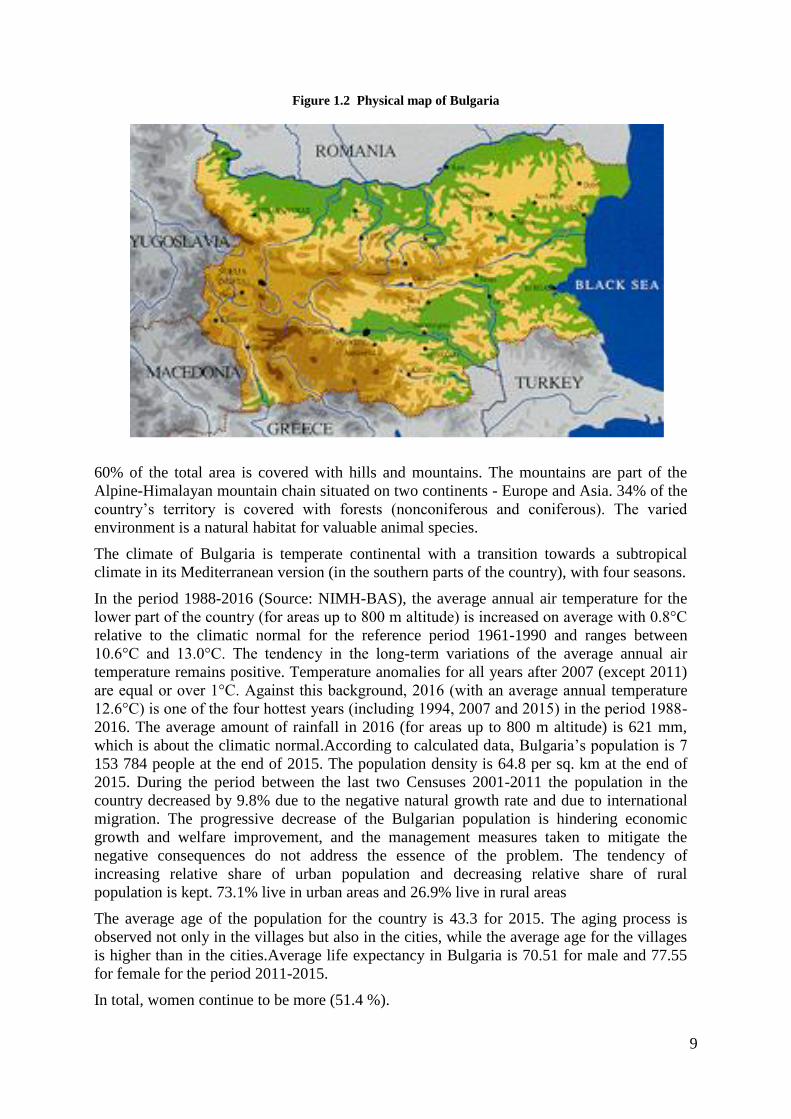
The Republic of Bulgaria is situated on the Eastern Balkan Peninsula in South-eastern
Europe, along the Black Sea. With a territory of 111 001.9 square kilometres, Bulgaria is
Europe's 16th-largest country. The neighbour states are Greece and Turkey to the South, FY
Republic of Macedonia and Serbia to the West. The River Danube separates it from
Romania to the North. Its natural eastern border is the Black Sea.
Figure 1.1 Location of Bulgaria in Europe
9
Figure 1.2 Physical map of Bulgaria
60% of the total area is covered with hills and mountains. The mountains are part of the
Alpine-Himalayan mountain chain situated on two continents - Europe and Asia. 34% of the
country’s territory is covered with forests (nonconiferous and coniferous). The varied
environment is a natural habitat for valuable animal species.
The climate of Bulgaria is temperate continental with a transition towards a subtropical
climate in its Mediterranean version (in the southern parts of the country), with four seasons.
In the period 1988-2016 (Source: NIMH-BAS), the average annual air temperature for the
lower part of the country (for areas up to 800 m altitude) is increased on average with 0.8°C
relative to the climatic normal for the reference period 1961-1990 and ranges between
10.6°C and 13.0°C. The tendency in the long-term variations of the average annual air
temperature remains positive. Temperature anomalies for all years after 2007 (except 2011)
are equal or over 1°C. Against this background, 2016 (with an average annual temperature
12.6°C) is one of the four hottest years (including 1994, 2007 and 2015) in the period 1988-
2016. The average amount of rainfall in 2016 (for areas up to 800 m altitude) is 621 mm,
which is about the climatic normal.According to calculated data, Bulgaria’s population is 7
153 784 people at the end of 2015. The population density is 64.8 per sq. km at the end of
2015. During the period between the last two Censuses 2001-2011 the population in the
country decreased by 9.8% due to the negative natural growth rate and due to international
migration. The progressive decrease of the Bulgarian population is hindering economic
growth and welfare improvement, and the management measures taken to mitigate the
negative consequences do not address the essence of the problem. The tendency of
increasing relative share of urban population and decreasing relative share of rural
population is kept. 73.1% live in urban areas and 26.9% live in rural areas
The average age of the population for the country is 43.3 for 2015. The aging process is
observed not only in the villages but also in the cities, while the average age for the villages
is higher than in the cities.Average life expectancy in Bulgaria is 70.51 for male and 77.55
for female for the period 2011-2015.
In total, women continue to be more (51.4 %).
10
Bulgaria has an emerging market economy in the upper middle income range where the
private sector accounts for more than 80 per cent of GDP. From a largely agricultural
country with a predominantly rural population in 1948, by the 1980s, Bulgaria had
transformed into an industrial economy with scientific and technological research at the top
of its budgetary expenditure priorities. The loss of COMECON (Council for Mutual
Economic Assistance) markets in 1990 and the subsequent "shock therapy” of the planned
system caused a steep decline in industrial and agricultural production, ultimately followed
by an economic collapse in 1997.
The country has successfully achieved and continues to deliver macroeconomic stability
after 1998. The introduced Currency Board, sound fiscal policy, limited pay raise, etc. have
been rules, administrative in their nature, which are in the basis of the macroeconomic and
financial stability. The functioning of the companies of the real economy, despite some
positive trends, mainly in the sales growth, is still not leading to overcome the crisis in the
real economy.
After the introduction of the currency board and the denomination of the lev in 1999, a slow
increase in GDP is witnessed in the country. The economic growth is stable and within a
moderate range. Still, GDP levels are far below the desired levels.
GDP growth is at moderate, balanced pace with no sudden fluctuations, typical for past
periods. During the last few years of the analysis, the pace of GDP growth is bigger due to
favourable economic climate in the country.
Real GDP grew 3% in 2015, driven mainly by exports and falling oil prices. Growth in 2015
was stronger than in 2014 mainly because of higher net exports.
Bulgaria covers more than 70% of its gross energy demand by imports. The dependency on
import of natural gas and crude oil is very high and has a traditional single origin - the
Russian Federation. The Russian natural gas is supplied by one route through the Ukraine.
Besides, our country relies completely on the import of nuclear fuel from Russia, although
nuclear energy, according to a Eurostat methodology, is considered as indigenous energy
source.
The prevailing quantity of heat is produced on the basis of natural gas and the risks for the
final consumers are much lower. The prevailing quantity of heat is produced on the basis of
natural gas and the risks for the final consumers are much lower. The structure of the Final
Energy Consumption (FEC) for the Bulgarian economy predetermines a big share of
secondary energies and necessity of transformation of a significant quantity of energy
resources and lost of energy resources in the transformation processes.
Industry is the biggest energy consumer in Bulgaria’s economy, but it’s share in 2015
decreased with 55.5% compared to 1990. Instead energy consumption in transport sector in
2015 has doubled from 15% to 34.7% of the final energy consumption.
The largest relative share of input fuels for electricity production was occupied by gaseous
fuels - 48.8%, followed by imported coal - 31.8%, local coal - 16.8%, nuclear energy -
2.1%, liquid fuels - 0.3% and biofuels - 0.2 %.
In the past, the main industry sectors of Bulgaria were metallurgy, machine manufacture,
chemicals, and agriculture. Recently, however, the priority has shifted to sectors like energy,
tourism, transportation, IT and telecommunications, food and beverage, pharmaceuticals,
and textile and clothing.
The governmental policy of rapid privatization led to almost complete privatization of
industrial installations. As a result, the most inefficient enterprises were closed. The new
11
owners introduce various measures to save energy which are mainly of organizational nature
and “no cost” or “low cost” measures.
Currently, the ‘Industry’ comprises the activity of industrial enterprises, classified in the
mining and quarrying industry, manufacturing, electricity, gas, steam and air conditioning
supply and water supply, sewerage, waste management and remediation activities.
The privatization of the road transport, the significant reduction of subsidies for the railway
transport and the closure of railway routes lead to a shift in the transport structure – from rail
to road – which is a reason for the registered relative growth in GHG emissions. The
country’s transport infrastructure is developing as an integral part of the common European
transport network. The share of railway transport in Bulgaria is relatively not high. The clear
tendency for further increase of the share of road transport will lead to a significant increase
in passenger and goods flows as well as in GHG emissions. Priorities of the Government’s
policy in transportation include active investment strategies for developing a modern
infrastructure, stabilization and modernization of the state-owned railway transportation and
railway infrastructure companies through financing from the Government, EU funds, and
other funding sources.
Agriculture sustains a major part of the Bulgarian economic landscape. The country enjoys a
number of favourable geostrategic, climatic and natural endowments, which have
significantly contributed to the development of century long traditions in both plant-growing
and livestock breeding strong and promising sectors are the growing of roses, cotton and
tobacco in the South Central parts of the country. Underdeveloped because of economic
factors remain pepper, tomatoes, grapes and apples production, which are otherwise
favoured by natural conditions. In terms of livestock breeding and livestock products
processing, the country has excellent outlooks for increasing the exports of specific high
quality milk and dairy commodities, as well as meat products. Predisposed by climatic and
natural conditions, organic farming is also gaining speed in recent years. Investments in
organic production are strongly encouraged by both Bulgarian and European authorities.
Today, agricultural entrepreneurs in Bulgaria enjoy a number of competitive advantages and
investment favourable factors. As a member of the EU, the country benefits from free access
to the growing European market and are also subject to financial and technical support by
the EU. Favourable conditions for the development of the sector are skilled and inexpensive
workforce, sector supporting institutions, food and research centres, agricultural colleges,
etc.
Forestry is a traditional important economic sector for Bulgaria with significant state
investments for the last 40 years.
The forests cover some 34 % of the total area of the country, support valuable ecosystems
and control erosion. A big share of these forests (39.8 %) has special function – protective
and rehabilitation. A potential problem in the sector is the slow pace of reforms and
restructuring. The tax policy of the Bulgarian Government in its main components is
oriented to preservation of the stability of the economy in the conditions of economic crisis,
stimulation of the business and the investment activities by means of:
Relief in the taxation of the business and achieving minimal levels of taxation within
the European Union;
Simplification of the tax system and refining the tax legislation to eliminate internal
contradictions and imperfections in the practices of taxation and control, and with the
objective of a greater transparency and intelligibility to the taxpayers;
Preserving the tax rates of the direct taxes in combination with lower social insurance
burden to the employers in benefit of the economic growth and the employment;
12
Preserving the higher share of the indirect taxes in comparison to the direct taxes.
The policy of the Government in the field of taxation is oriented towards decreasing the
share of the shadow economy and combat tax evasion and avoidance.
The governmental programmes have set targets and have already achieved tangible
reduction of waste generation. The measures for reduction of GHG emissions that are
planned in this sector are related, most of all, to the management of solid municipal waste.
The capture and recovery of landfill gas is not a common practice in Bulgaria and the whole
amount of gas from the landfills is emitted into the atmosphere or (in rare cases) it is burnt.
The use of landfills is widespread in the country. The policy in this area foresees building of
a system of 54 regional landfills and closing of all landfills that are not compliant with the
legal requirements. The construction of these regional landfills will ensure environmentally
sound waste disposal in the country.
1.3. Inventories of Greenhouse Gas Emissions by Sources and
Removals by Sinks
Information for the annual GHG Inventory in Bulgaria for the period 1988-2015is presented.
This Inventory is prepared according to the UNFCCC Guideline approved by the Subsidiary
Body for Scientific and Technological Appliance. The rules and the structure of the National
GHG Inventory Report are formed by these Guidelines. The report is elaborated in
compliance with the 2006 IPCC Guidelines.
The Single Entity responsible for the preparation of National GHG inventories is ExEA.
The annual inventory and reporting of greenhouse gas emissions and removals provide an
information base for the planning and monitoring of climate policy. The Kyoto Protocol
obliges its parties to establish a national greenhouse gas inventory system by the end of
2006. Bulgaria’s National Greenhouse Gas Inventory System was set up at the beginning of
2007.
The national system produces data and background information on emissions and removals
for the UNFCCC, the Kyoto Protocol and the EU Commission. In addition, the scope of the
system covers the archiving of the data used in emission estimations, the publishing of the
results, participation in inventory reviews and the quality management of the inventory.
The National Inventory Report (NIR) of Bulgaria for the 2017 submission to the EU, the
UNFCCC and the Kyoto Protocol includes data of the anthropogenic emissions by sources
and removals by sinks of all greenhouse gases (GHGs) not controlled by the Montreal
Protocol, i.e. carbon dioxide (CO2), methane (CH4), nitrous oxide (N2O), perfluorocarbons
(PFCs), hydrofluorocarbons (HFCs), nitrogen trifluoride (NF3) and sulphur hexafluoride
(SF6).
13
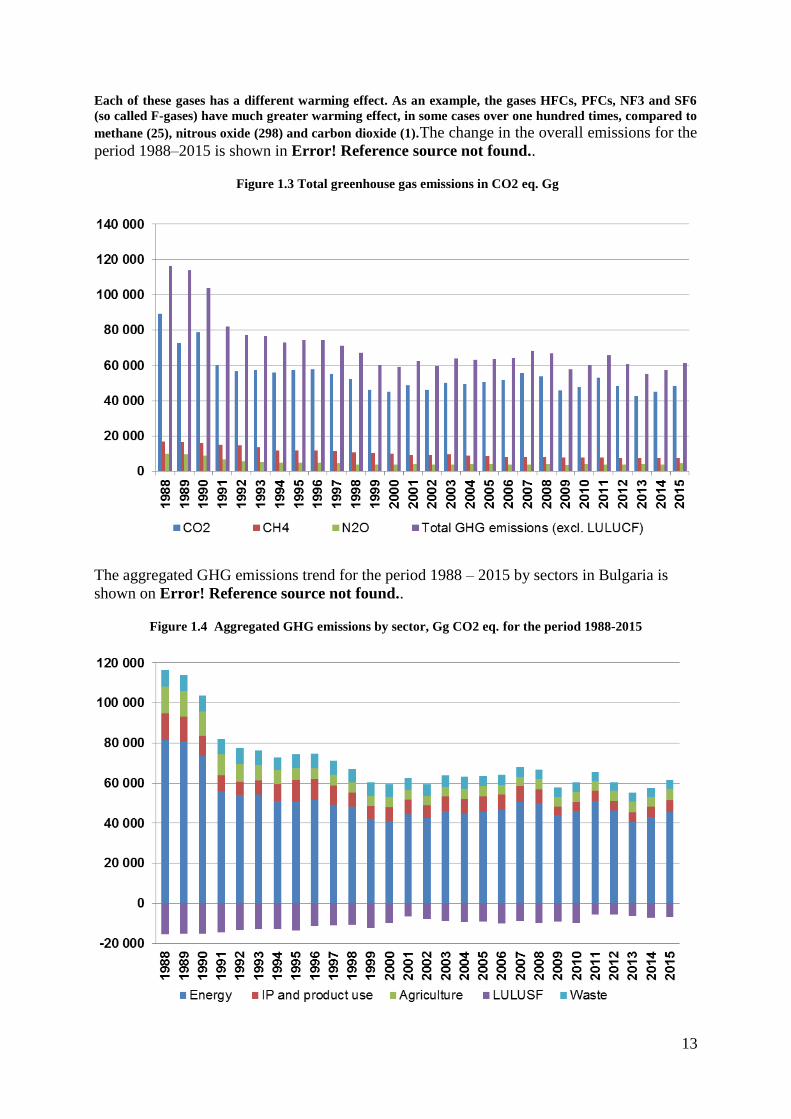
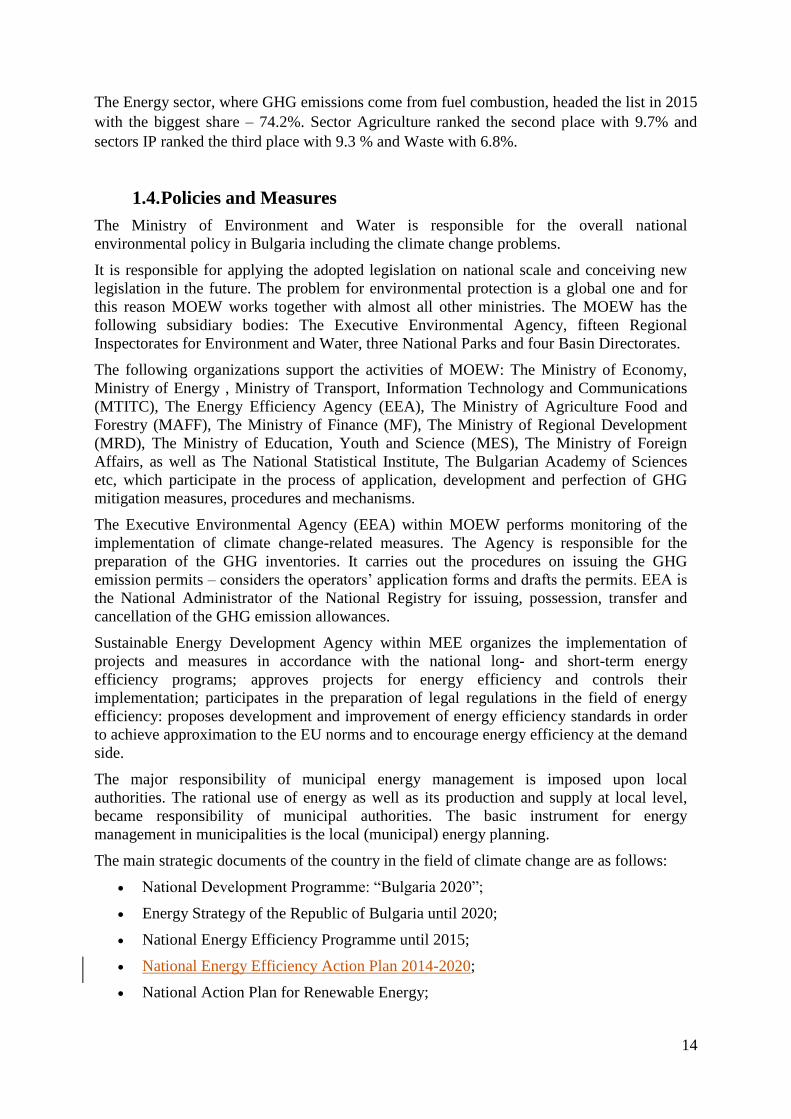
Each of these gases has a different warming effect. As an example, the gases HFCs, PFCs, NF3 and SF6
(so called F-gases) have much greater warming effect, in some cases over one hundred times, compared to
methane (25), nitrous oxide (298) and carbon dioxide (1).The change in the overall emissions for the
period 1988–2015 is shown in Error! Reference source not found..
Figure 1.3 Total greenhouse gas emissions in CO2 eq. Gg
The aggregated GHG emissions trend for the period 1988 – 2015 by sectors in Bulgaria is
shown on Error! Reference source not found..
Figure 1.4 Aggregated GHG emissions by sector, Gg CO2 eq. for the period 1988-2015
14
The Energy sector, where GHG emissions come from fuel combustion, headed the list in 2015
with the biggest share – 74.2%. Sector Agriculture ranked the second place with 9.7% and
sectors IP ranked the third place with 9.3 % and Waste with 6.8%.
1.4. Policies and Measures
The Ministry of Environment and Water is responsible for the overall national
environmental policy in Bulgaria including the climate change problems.
It is responsible for applying the adopted legislation on national scale and conceiving new
legislation in the future. The problem for environmental protection is a global one and for
this reason MOEW works together with almost all other ministries. The MOEW has the
following subsidiary bodies: The Executive Environmental Agency, fifteen Regional
Inspectorates for Environment and Water, three National Parks and four Basin Directorates.
The following organizations support the activities of MOEW: The Ministry of Economy,
Ministry of Energy , Ministry of Transport, Information Technology and Communications
(MTITC), The Energy Efficiency Agency (EEA), The Ministry of Agriculture Food and
Forestry (MAFF), The Ministry of Finance (MF), The Ministry of Regional Development
(MRD), The Ministry of Education, Youth and Science (MES), The Ministry of Foreign
Affairs, as well as The National Statistical Institute, The Bulgarian Academy of Sciences
etc, which participate in the process of application, development and perfection of GHG
mitigation measures, procedures and mechanisms.
The Executive Environmental Agency (EEA) within MOEW performs monitoring of the
implementation of climate change-related measures. The Agency is responsible for the
preparation of the GHG inventories. It carries out the procedures on issuing the GHG
emission permits – considers the operators’ application forms and drafts the permits. EEA is
the National Administrator of the National Registry for issuing, possession, transfer and
cancellation of the GHG emission allowances.
Sustainable Energy Development Agency within MEE organizes the implementation of
projects and measures in accordance with the national long- and short-term energy
efficiency programs; approves projects for energy efficiency and controls their
implementation; participates in the preparation of legal regulations in the field of energy
efficiency: proposes development and improvement of energy efficiency standards in order
to achieve approximation to the EU norms and to encourage energy efficiency at the demand
side.
The major responsibility of municipal energy management is imposed upon local
authorities. The rational use of energy as well as its production and supply at local level,
became responsibility of municipal authorities. The basic instrument for energy
management in municipalities is the local (municipal) energy planning.
The main strategic documents of the country in the field of climate change are as follows:
National Development Programme: “Bulgaria 2020”;
Energy Strategy of the Republic of Bulgaria until 2020;
National Energy Efficiency Programme until 2015;
National Energy Efficiency Action Plan 2014-2020;
National Action Plan for Renewable Energy;
15
Third National Climate Change Action Plan (2013 – 2020);
National Programme for Promotion of the Biofuels Use in the Transport Sector
2008-2020;
Integrated Transport Strategy for the period until 2030;
Strategic Plan for Development of the Forestry Sector in the Republic of Bulgaria
2014-2023;
National Strategy for the Development of the Forestry Sector in the Republic of
Bulgaria for the period 2013-2020;
National Strategic Plan for management of building demolution waste 2011-2020;
National Strategic Plan for management of the sludge from urban wastewater
treatment plants 2014-2020;
National waste prevention programme (NWPP) 2014 – 2020;
National Waste Management Plan (NWMP) 2014 – 2020;
National Regional Development Strategy.
The Third National Action Plan on Climate Change provides specific measures for reduction
of greenhouse gas emissions across all sectors and these measures are consistent with both
the national policy on climate change and the potential of the national economy to reduce
emissions. The overall effect of the measures will ensure the implementation of the
commitments taken and the achievement of the legally binding European objectives.
NAPCC presents an assessment of the status and trends of greenhouse gas emissions in
Bulgaria until 2009 in various sectors and the scenarios and projections of the emissions in
these sectors by 2030 before and after the implementation of the measures.
The policies and measures planned to achieve the objectives of the country with regard to
climate change are presented by sectors and represent the most significant and voluminous
part of the Third Action Plan on Climate Change. The process of selection of specific
measures in each sector includes consultations with the relevant government institutions,
numerous consultations with stakeholders, businesses, NGOs and academic circles. The
received comments and opinions on the proposed policies and measures have been taken
into account. Thus transparency and coordination in preparing the Plan is ensured.
After specifying the policies and measures by sector, their feasibility was analyzed from
economic point of view. The effective reduction of greenhouse gas emissions was assessed
without need to reduce the production and the consumption on the basis of the baseline
scenario for the economic development of the country by 2030.
NAPCC pays special attention to the administrative capacity necessary to implement the
planned measures, as well as to the responsibilities for monitoring and reporting the
implementation of the Plan. Besides the leading role of the competent institutions it
underlines the specific role and functions of municipalities. A special feature of the activities
on climate change is that they cover a large number of institutions and bodies both from the
central and the local authorities because of their horizontal and cross-cutting nature.
The Energy Sector has the largest share in the total emissions of greenhouse gases in the
country and that defines its paramount importance for the implementation of the national
targets for reducing GHG emissions. The production of electricity and thermal energy from
coal contributes for over 90% of the GHG emitted in the sector where the major potential for
reduction of emissions is concentrated. The policies and measures in the Energy Sector
16
provided in this Plan are based on those set out in the Energy Strategy of Bulgaria until 2020
and the National Action Plan for Renewable Energy. The implementation of the planned
additional measures in this sector will lead to reduction of GHG emissions by 12.2%
compared to the levels of the baseline scenario by 2020.
A particularly important sector with very high potential for emission reductions is the Waste
Sector. The expected reductions after the implementation of the measures envisaged in the
Plan are equivalent to 18.4% compared to the emissions in 2005. The sector is one of the
major sources of GHGs in three main areas - emissions from waste landfills, wastewater
treatment and waste incineration. The measures are focused mainly in the Waste Landfilling
Subsector which has the largest share in the level of emissions. Many of the measures
planned for this sector can be achieved by implementing the existing legislation without
investments of very large financial resources which makes them highly effective.
The importance of taking steps in the Transport Sector is due to the fact that it is one of the
largest emitters of GHGs with sustainable growth, but largely ignored until recently in terms
of its impact on climate change. The most significant emitters of greenhouse gases are
private cars, followed by the heavy-freight vehicles. In this regard, the main measures in the
sector are aimed at achieving an optimal balance in the use of the potential of different types
of transport. The implementation of the planned additional measures in the sector will lead
to reduction of GHG emissions by 11.3% compared to those in the baseline scenario.
1.5. Projections and Total Effect of Policies and Measures
The most recent GHG projections were elaborated taking in consideration the trends of key
macro-economic, technological, demographic and other indicators that determine the
economic development of the country. The prognosis are developed based on the inventory
reported in 2017.
Projections are based on the following documents, procedures and assumptions:
Analysis of the emissions projections reported in the Third National Action Plan on
Climate Change 2013 - 2020.
Accounting for the actual GHG emissions and the underlying reasons for the trends
(national and external factors).
Sectoral plans for agriculture, forestry, industry and waste
New rules and Directives after accession of Bulgaria to the EU
Accounting for the influence of the world economic crisis 2008-2009 on the GHG
emission forecasts.
As a result, two scenarios for GHG emission projections until 2030 were developed,
analysed and compared:
Scenario “with existing measures” - WEM
Scenario “with additional measures” - WAM
The scenario with existing measures reflects all approved and implemented policies and
measures to reduce GHG emissions in the country by the end of 2015.
The scenario with additional measures reflects all adopted policies and measures to reduce
GHG emissions in the country after 2015 and includes the impact of policies and measures
presented in this report that have a quantitative assessment at this stage.
17
.
.
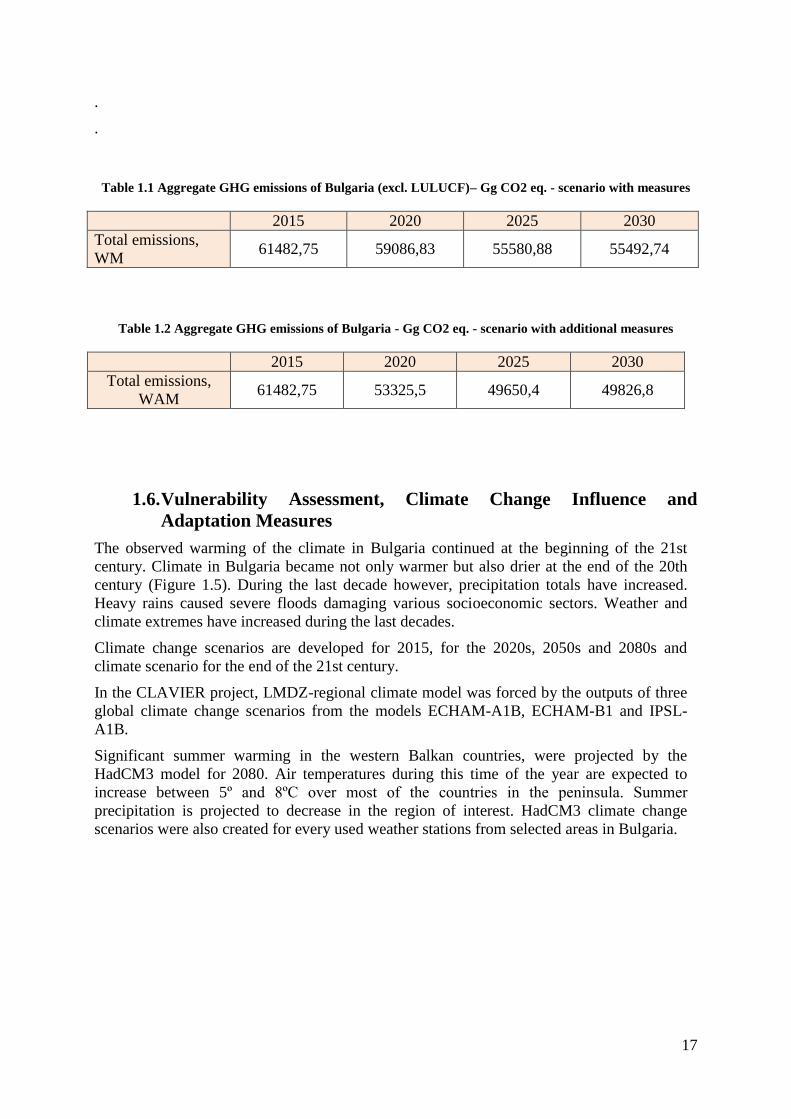
Table 1.1 Aggregate GHG emissions of Bulgaria (excl. LULUCF)– Gg CO2 eq. - scenario with measures
2015 2020 2025 2030
Total emissions,
WM 61482,75 59086,83 55580,88 55492,74
Table 1.2 Aggregate GHG emissions of Bulgaria - Gg CO2 eq. - scenario with additional measures
2015 2020 2025 2030
Total emissions,
WAM 61482,75 53325,5 49650,4 49826,8
1.6. Vulnerability Assessment, Climate Change Influence and
Adaptation Measures
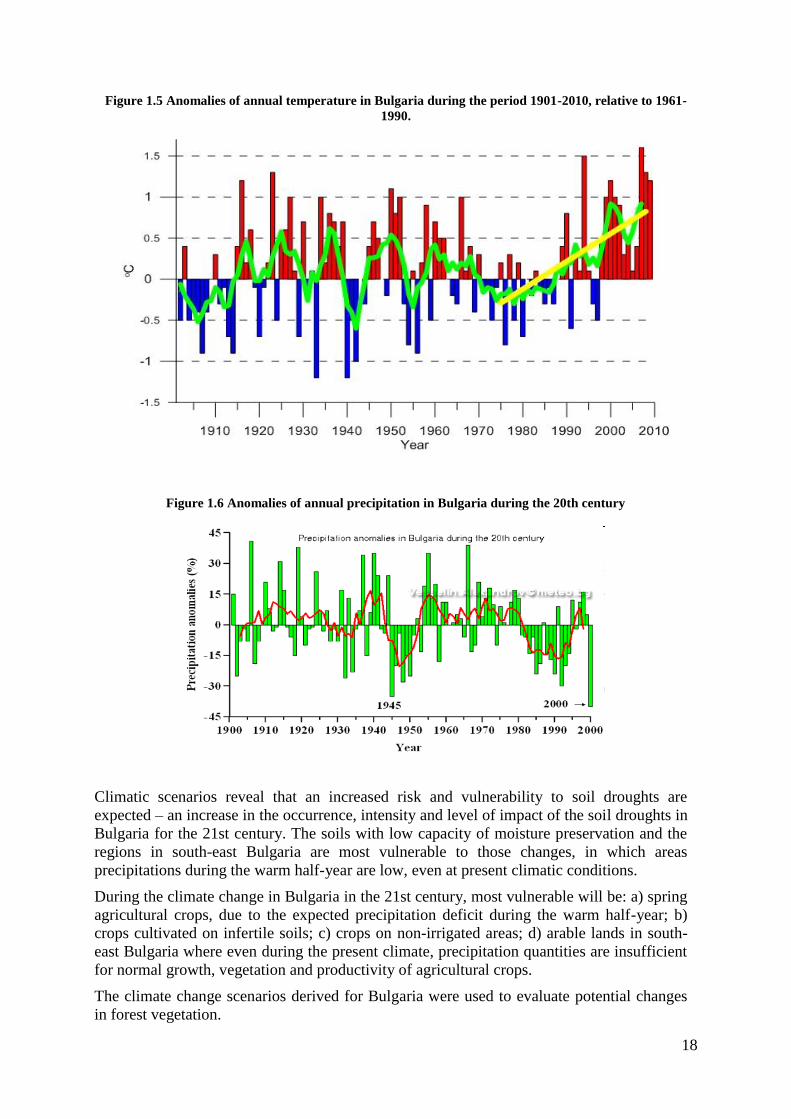
The observed warming of the climate in Bulgaria continued at the beginning of the 21st
century. Climate in Bulgaria became not only warmer but also drier at the end of the 20th
century (Figure 1.5). During the last decade however, precipitation totals have increased.
Heavy rains caused severe floods damaging various socioeconomic sectors. Weather and
climate extremes have increased during the last decades.
Climate change scenarios are developed for 2015, for the 2020s, 2050s and 2080s and
climate scenario for the end of the 21st century.
In the CLAVIER project, LMDZ-regional climate model was forced by the outputs of three
global climate change scenarios from the models ECHAM-A1B, ECHAM-B1 and IPSL-
A1B.
Significant summer warming in the western Balkan countries, were projected by the
HadCM3 model for 2080. Air temperatures during this time of the year are expected to
increase between 5º and 8ºC over most of the countries in the peninsula. Summer
precipitation is projected to decrease in the region of interest. HadCM3 climate change
scenarios were also created for every used weather stations from selected areas in Bulgaria.
18
Figure 1.5 Anomalies of annual temperature in Bulgaria during the period 1901-2010, relative to 1961-
1990.
Figure 1.6 Anomalies of annual precipitation in Bulgaria during the 20th century
Climatic scenarios reveal that an increased risk and vulnerability to soil droughts are
expected – an increase in the occurrence, intensity and level of impact of the soil droughts in
Bulgaria for the 21st century. The soils with low capacity of moisture preservation and the
regions in south-east Bulgaria are most vulnerable to those changes, in which areas
precipitations during the warm half-year are low, even at present climatic conditions.
During the climate change in Bulgaria in the 21st century, most vulnerable will be: a) spring
agricultural crops, due to the expected precipitation deficit during the warm half-year; b)
crops cultivated on infertile soils; c) crops on non-irrigated areas; d) arable lands in south-
east Bulgaria where even during the present climate, precipitation quantities are insufficient
for normal growth, vegetation and productivity of agricultural crops.
The climate change scenarios derived for Bulgaria were used to evaluate potential changes
in forest vegetation.
19
Soil diversity in Bulgaria is enormous. Soils have different characteristics, fertility and
vulnerability to climate change. The temperature rise will increase the water deficit in soils
with low precipitation rates that are prone to droughts. The most serious impacts will be
observed for soils with light mechanical content and bad water characteristics and partly for
heavy clay soils. About 30 % of the soils in Bulgaria are prone to wind erosion.
The objectives of adaptation measures in agriculture are to support and sustain the
agricultural production and to bring to minimum the impact of climate change by reducing
the vulnerability of the agricultural crops. The adaptation to climate change will be carried
out in various forms, including technological innovations, changes in arable land, changes in
irrigation, etc. Technological innovations include the creation of new cultivars and hybrids,
which have higher productivity during changes in the climate. Farmers can start growing
other cultures or cultures, prone to drought and diseases. The sowing dates of spring crops in
Bulgaria could shift under the GCM climate change scenarios in order to reduce the yield
loss caused by temperature increase. Another option for adaptation is to use different
hybrids and cultivars. There is an opportunity for cultivation of more productive, later or
earlier-maturing, disease and pest tolerant hybrids and cultivars. Switching from maize
hybrids with a long to a short or very short growing season projected an additional decrease
of final yield under a potential warming in Bulgaria. However, using hybrids with a medium
growing season would be beneficial for maize productivity. Technological innovations,
including the development of new crop hybrids and cultivars that may be bred to better
match the changing climate, are considered as a promising adaptation strategy. However, the
cost of these innovations is still unclear.
For the forests in the low parts of the country (under 800 m a.s.l.), where the most
significant impact from climate change is expected, the strategic objective of the
management must be adaptation towards drought and improving forest sustainability.
For the forests in the higher parts of the country, i.e. those above 800 m a.s.l., where
expected changes are not likely to be drastic, the objectives are preservation of biodiversity,
eco system sustainability, multifunctional management, system of protected nature
territories.
The natural and introduced forest wood and shrub species in Bulgaria have great potential
for a good adaptation towards possible climate change in the present century.
1.7. Financial resources and transfer of technology, including
information under Articles 10 and 11, of the Kyoto Protocol
Despite the fact that Bulgaria is an Annex I Party of the UNFCCC, as a country with
economy in transition, it has no commitments to provide financial resources and technology
transfer to developing countries.
In terms of technologies transfer, as a country in transition, Bulgaria has no obligations to
support technology transfer, under Article 11 of the Kyoto Protocol, for countries out of
Annex I of the Convention.
Article 10 of the Protocol
Until the in-country review in 2009 the country has not formulated programs to improve the
quality of local emission factors, activity data and models which reflect national conditions.
The country is more active in the field of development and implementation of national
programs containing measures to mitigate climate change. In relation to the decision of the
enforcement branch of the Compliance Committee to cease the eligibility of the country,
20
specific inventory improvement programmes were developed and communicated to the
enforcement branch.
1.8. Education, Training and Public Awareness
Public interest in climate changes has been significant. Various governmental, non-
governmental and social non-economic organizations have raised the issue on various
occasions. However, the more serious problem is that a vast amount of people do not realize
the increasing by the hour environmental threat for our planet. In this respect, each one of
us, being direct or indirect component of the environment, can and must contribute to the
protection of the environmental balance.
The role of the Government, media and communication channels in the raising of the public
awareness are closely intertwined and hardly distinctive. What should be done in this area
is:
Issuing and distribution of brochures and other materials;
Inclusion of climate change days in the national environmental campaigns;
Information and education for the business for participation in the EU ETS;
Distribution of adapted scientific findings and information on climate change;
Popularization through their integrating in various specialized information flows;
Regular actualization of the information about the current climate change policy at the
MOEW web site.
Although they do not lead directly to measurable reductions in emissions NAPCC envisages
measures in the field of education and science to promote targeting of R&D and educational
activities on issues related to climate change.
The measures entail strengthening of this topic in the educational process (priority axis 1)
and focus of research on its sectoral aspects (priority axis 2). 90 mln. BGN are foreseen for
their implementation and the results thereof are to be considered in the long term and in the
context of the flagship initiatives under the Strategy for Smart and Sustainable Growth
“Europe 2020” related to promotion of innovations and transition to a more efficient use of
resources and a low-carbon economy.
1.9. Research projects and systematic observation
The R&D system includes human resources and institutions. According to statistical data
about 17 000 scientists are involved in research work most of whom are concentrated in
public R&D organizations. Very few researchers (about 13% of their total number) are
concentrated in business structures. For comparison, in some of the new EU countries this
figure is over 30% and in others - over 60%. (Programme for Development of Education,
Science and Youth Policies in the Republic of Bulgaria (2009-2013). In European countries
the predominant share of people employed in research and development (R&D) works in the
private sector and in the system of higher education. In Bulgaria almost 60% of the people
engaged in R&D are in the public sector and paid from the budget, compared an average
level of 13% in the EU (National Strategy for R&D Development 2020).
21
The aim of patenting and licensing activities is to provide links to practice and to encourage
the search and implementation of new and/or updated products, technologies and services.
The number of applications from European and world patent organizations is low, while the
number of applications and patents granted to foreign organizations is higher than the
number of national applicants. In Bulgaria there is no coordinated policy of activities
concerning the relationship between science and innovation (Programme for Development
of Education, Science and Youth Policies in the Republic of Bulgaria (2009-2013). The
existing offices are inefficient and there is an insufficient number of transfer offices to
provide a link with industry and to encourage the demand and implementation of new and/or
updated products, technologies and services (Programme for Development of Education,
Science and Youth Policies in the Republic of Bulgaria (2009-2013). Less than 10% of the
active innovation companies have links with R&D organizations (National Strategy for
R&D Development 2020). The different elements of the Bulgarian innovation system are
not connected – the fundamental and sectoral studies develop separately.
The performance of Bulgaria, Latvia, Lithuania and Romania is well below that of the EU27
average in 2011. These countries are ‘Modest innovators’.
Bulgaria, Estonia, Romania, Portugal and Slovenia are the growth leaders with an average
annual growth rate well above 5%. There continues to be a steady convergence, where less
innovative Member States have – on average – been growing faster than the more innovative
Member States.
Bulgaria is one of the modest innovators with a below average performance - 4,4% growth
rate and defined as "Growth leader" in the "Modest innovators" group.
Infrastructural capacity
According to data provided by Ministry of Education regarding the financing of the
purchased scientific equipment for the period 2005-2008 there is no funding for the
infrastructure in the field of energy sources. A single purchase of expensive equipment
without ensuring the necessary conditions for conducting research and an available long-
term scientific program leads to its inefficient use and therefore to increase in the cost of the
services for the business. This leads to a paradox in some cases where Bulgaria disposes of
unique scientific equipment, but research organizations and companies send samples for
research in other EU Member States due to lower prices.
A National Roadmap for R&D Infrastructure, developed by MEYS was approved in
September 2010 by decision of the Council of Ministers. The map covers major scientific
centres serving specific economic and social needs of the country, the region of South-
eastern Europe and Pan-European infrastructures in which Bulgaria will participate. The
main priority of the scientific infrastructure is in the field of energy, marine research, new
materials for various applications, information and communication technologies, social
studies. (National Strategy for R&D Development 2020).
Financial capacity
Since 2006 the total expenditure on R&D in Bulgaria is about 0.45% of the GDP without a
significant upward trend. The structure of R&D financing is inversely proportional to that in
EU countries. The largest percentage is paid from the state budget – more than 2/3, and 1/3
– by the business. This ratio has remained steady over the past 10 years.
The Research and Development Fund is a national instrument supporting research projects
on competitive basis. Another instrument is the National Innovation Fund that finances
22
applied scientific research projects and technical and economic projects that introduce new
products, processes and services or improve existing ones. These two national funds are
potential sources of financing also for the measures proposed under this action plan.
With regard to international scientific programs, Bulgaria is presented in the Seventh
Framework Programme and the Programme COST. The country is represented also in the
programme Intelligent Energy for Europe which includes the extension of the programmes
SAVE - energy efficiency and ALTENER - renewable energy. The revenues from
international scientific programs are currently allocated as follows: 40% for the business,
35% for universities and about 25% for BAS and the Agricultural Academy.
Main fields of scientific research
For the purposes of the National Action Plan a study and research was conducted on the
main topics covered by the Bulgarian educational and scientific institutions, the NGOs and
the other organizations.
The main fields of research and educational activities are:
• Meteorology, climatology and hydrology
These activities study the basic climate elements (air temperature, precipitation, atmospheric
circulation) in Bulgaria and more specifically in its mountainous areas which are particularly
sensitive to climate change.
The studies focus also on the climatic changes in the geological history of Earth in order to
assess the effects of astronomical factors, earth’s internal forces and environmental factors
on climate formation. The analysis of time series and extreme events is improved and
models are created of nonlinear systems, including climatic systems. The wind-solar
renewable energy sources are studied with a view to establishing the wind and the solar
energy potential on the territory of the country in meso- and macro-climatic aspects. The
methods of monitoring climatic elements are automated.
Air pollution
A single methodology for inventory of emissions of harmful substances was developed.
Different scale models of atmospheric components were made in order to assess the quality
of air environment and the origin/transportation of pollution on a large and on a small scale.
A methodology was developed for calculating emissions and sinks of greenhouse gases from
the plant cover. Research is conducted on the optimization of waste management in order to
reduce greenhouse gases. Ground, oceanographic and space systems for monitoring of
various objects in the environment, including in the air environment, are being improved.
Technologies
Mathematical and computer models are created of the transportation of air pollutants and
tested with model and real meteorological and emission data on the first Bulgarian
supercomputer IBM Blue Gene/P. The possibilities and the costs of implementing Directive
97/68/EC on emissions of gaseous and particulate pollutants from non-road mobile
machinery are studied. Materials, technologies and devices for efficient transformation of
solar energy in two main areas - photovoltaic and photothermal – are developed and tested.
23
Technologies involving the use of biomass and hydrogen raw materials as renewable energy
sources are investigated. Unmanned flying systems for monitoring and GIS-interpretation of
meteorological are introduced that determine the pollution of air. Energy saving and water
saving technologies for production of good agricultural produce are being developed.
Forests, Forestry and Agriculture; Land Use
Good agricultural practices leading to minimization of greenhouse gas emissions are being
developed. The role of underground plant biomass in the annual fixation of CO2 by forest
ecosystems is studied. The bio- and the energy potential of non-traditional plant species is
examined. The applicability of the principles of forest management as a means of entering
the carbon market is investigated; the amount of carbon dioxide presently stored in forest
ecosystems in some areas is being estimated.
Territorial structure
– The Climate Friendly Cities Project aims to assist the development of a spatial
structure of cities that is favourable for the climate through planning and zoning.
– An index of regional “climate security” was established under the Regions for
Sustainable Change Project based on data of greenhouse gas emissions, energy data,
policy framework, institutional capacity, socio-political situation, financial
instruments The index is adjusted to Bulgaria and applied to the monitoring system
of regional development plans.
Transport
The Green Corridor Development Programme ensures the development of pedestrian and
bicycle routes both for tourism and transport. An online tool is currently being developed for
planning a bicycle journey in Sofia as a measure to reduce the emissions in the city. The
project “One Planet Mobility” aims to reduce CO2 emissions from transport under which
several computer models were developed to project the reduction of emissions from
transport in Sofia.
On 28 July 2011, the Bulgarian Parliament adopted the National Strategy for Research and
Development 2020. At national level, the Strategy provides scientific organisations,
universities and the academic research community with a research development framework
with a set of priorities for the development of science in Bulgaria. These include:
Energy, energy efficiency and transportation
Development of green and eco-technologies
Health and quality of life, biotechnology and organic food
New materials and technologies, cultural and historical heritage
Information and communication technologies.
Over the past 10 years there has been a trend of increased scientific interest in climate
change: global, regional and national scale. The topic of climate change includes a number
of scientific aspects. The Bulgarian Academy of Sciences BAS works in different directions:
fluctuations and climate change, vulnerability assessment and adaptation of individual
sectors (e.g. water resources, agriculture, forests, etc.) under climate change, solar-terrestrial
24
influences and more. On the topic of climate change in more than 10 units of the Bulgarian
Academy of Sciences, work but the major one is the National Institute of Meteorology and
Hydrology.
The Bulgarian Academy of Sciences (BAS) carries out research and other activities on
climate change. Work is going on not only on planned tasks with national financing but also
in cooperation with research organizations from EU member countries within the Sixth and
Seventh Framework Programme.
Comprehending the significance of this problem, BAS established a National Coordination
Centre for Global Change. The Scientific Coordination Centre for Global Change of the
Bulgarian Academy of Sciences (SCCGC-BAS) is a voluntary association of representatives
of academic research and development institutes and units, universities and higher
educational establishments, institutions, agencies, organizations, companies and other
entities in Bulgaria which organizes and conducts activities related to global change in
environment, as well as to the economic, political, social and spiritual aspects of global
change on society
The SCCGC-BAS is a consultative/advisory body of the Steering Committee of the
Bulgarian Academy of Sciences on global change in Bulgaria. The SCCGC-BAS is a centre
for coordination of research and scientific-methodological activities under the
implementation of national and international projects and contracts in the field of global
change.
The section on Systematic observations activities in the country follows the detailed
guidance for required information as provided in the UNFCCC reporting guidelines on
global climate observing systems. It includes summary information on the current status of
national plans, programs and support for ground and space-based climate observing systems.
It should be pointed out that up to now activities in this field have been undertaken
separately from the climate change policies and measures. They were more closely linked to
the general commitments of the country in the field of meteorology.
There are no GSN (Global Surface Network) and GUAN (Global Upper Air Network)
stations located in Bulgaria. There is only one GAW (Global Atmosphere Watch) station in
the country (Rojen).
The National Institute of Meteorology and Hydrology in Sofia, Bulgaria has several weather
stations included within the Regional Basic Synoptic Network (RBSN) and Regional Basic
Climatological Network (RBCN) in RA VI (Europe):
An important and irrevocable part of the activities of The Geophysical Institute (GPhI)
“Acad. L. Krastanov” is the unique for our country scientific and operative activity,
concerning registration, processing, analysis and interpretation of the seismicity,
geomagnetic field, the status of the ionosphere and UV radiation level above the country and
surrounding lands. The unique for the country international geomagnetic standard with
absolute and comparative geomagnetic measurements is maintained in Geomagnetic
Observatory “Panagyurishte”. The parameters of the Earth’s Magnetic Field are registered
daily and maps of variations of the elements are drawn. Main users of the collected
information are Military Geographic service of the MA, Cadaster Agency at the Ministry of
Regional Development of Bulgaria and all organizations working in the area of underground
resources research with geomagnetic methods. Geomagnetic field data are used for
navigation and radio-connections services as well.
25
The Institute of Oceanology, every year carries out complex seasonal expeditions studying
physical, chemical and biological parameters of sea water and bed at the western part of
Black Sea. Weather observations are done at every location of interest: air temperature, sea
level pressure, wind speed and direction. The institute is currently trying to recover and
improve some oceanographic systems for observations such as VOS (Volunteer Observing
Ship) and TIDE GAUGES as well as to include them within international programmers.
The Bulgarian Institute for Space Research is participating in space-based observing
programmes by development and execution of national and international space programmes
as well as development of complex research tools.
An important way related to participation in space-based observing programmes is
development, analyses and interpretation of space satellite images.
Bulgaria utilizes observations from satellites: satellite images with very high (IKONOS,
QuickBird, EROS) high (IRS, SPOT) and moderate (Landsat, ASTER) space resolution are
used. The satellite images are used for research and scientific experiments as well as a basic
source of information under development of geoinformation systems.
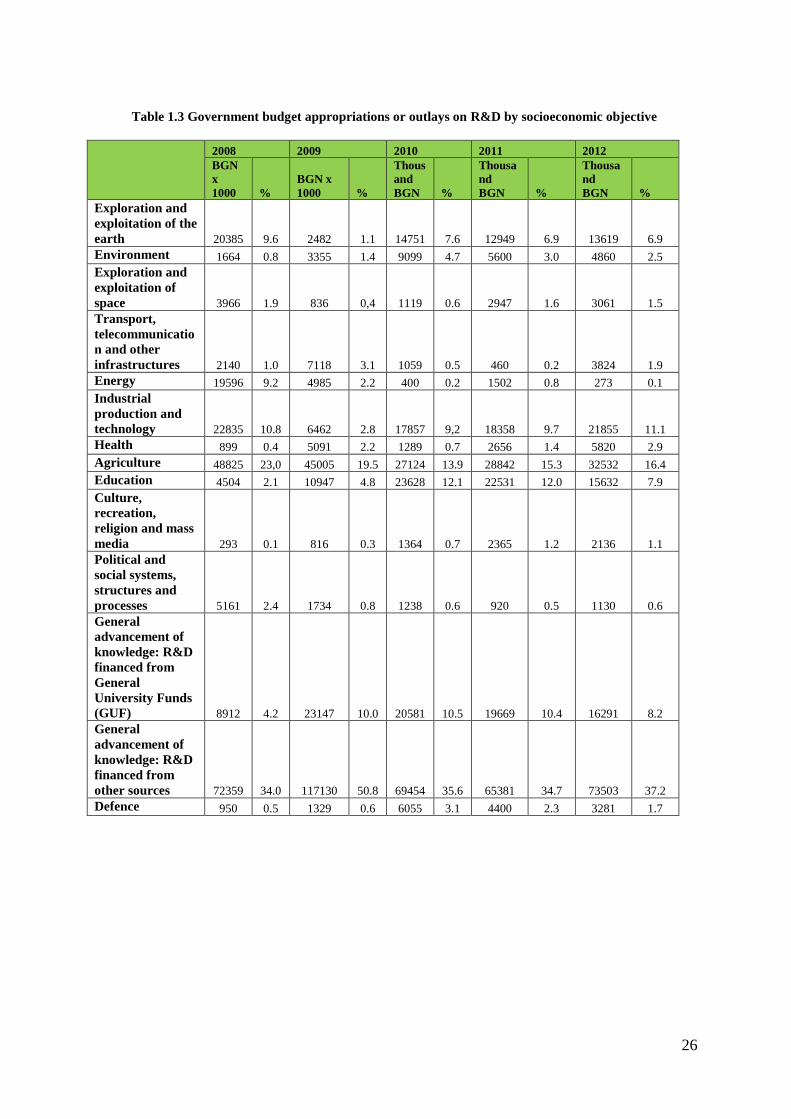
26
Table 1.3 Government budget appropriations or outlays on R&D by socioeconomic objective
2008 2009 2010 2011 2012
BGN
x
1000 %
BGN x
1000 %
Thous
and
BGN %
Thousa
nd
BGN %
Thousa
nd
BGN %
Exploration and
exploitation of the
earth 20385 9.6 2482 1.1 14751 7.6 12949 6.9 13619 6.9
Environment 1664 0.8 3355 1.4 9099 4.7 5600 3.0 4860 2.5
Exploration and
exploitation of
space 3966 1.9 836 0,4 1119 0.6 2947 1.6 3061 1.5
Transport,
telecommunicatio
n and other
infrastructures 2140 1.0 7118 3.1 1059 0.5 460 0.2 3824 1.9
Energy 19596 9.2 4985 2.2 400 0.2 1502 0.8 273 0.1
Industrial
production and
technology 22835 10.8 6462 2.8 17857 9,2 18358 9.7 21855 11.1
Health 899 0.4 5091 2.2 1289 0.7 2656 1.4 5820 2.9
Agriculture 48825 23,0 45005 19.5 27124 13.9 28842 15.3 32532 16.4
Education 4504 2.1 10947 4.8 23628 12.1 22531 12.0 15632 7.9
Culture,
recreation,
religion and mass
media 293 0.1 816 0.3 1364 0.7 2365 1.2 2136 1.1
Political and
social systems,
structures and
processes 5161 2.4 1734 0.8 1238 0.6 920 0.5 1130 0.6
General
advancement of
knowledge: R&D
financed from
General
University Funds
(GUF) 8912 4.2 23147 10.0 20581 10.5 19669 10.4 16291 8.2
General
advancement of
knowledge: R&D
financed from
other sources 72359 34.0 117130 50.8 69454 35.6 65381 34.7 73503 37.2
Defence 950 0.5 1329 0.6 6055 3.1 4400 2.3 3281 1.7
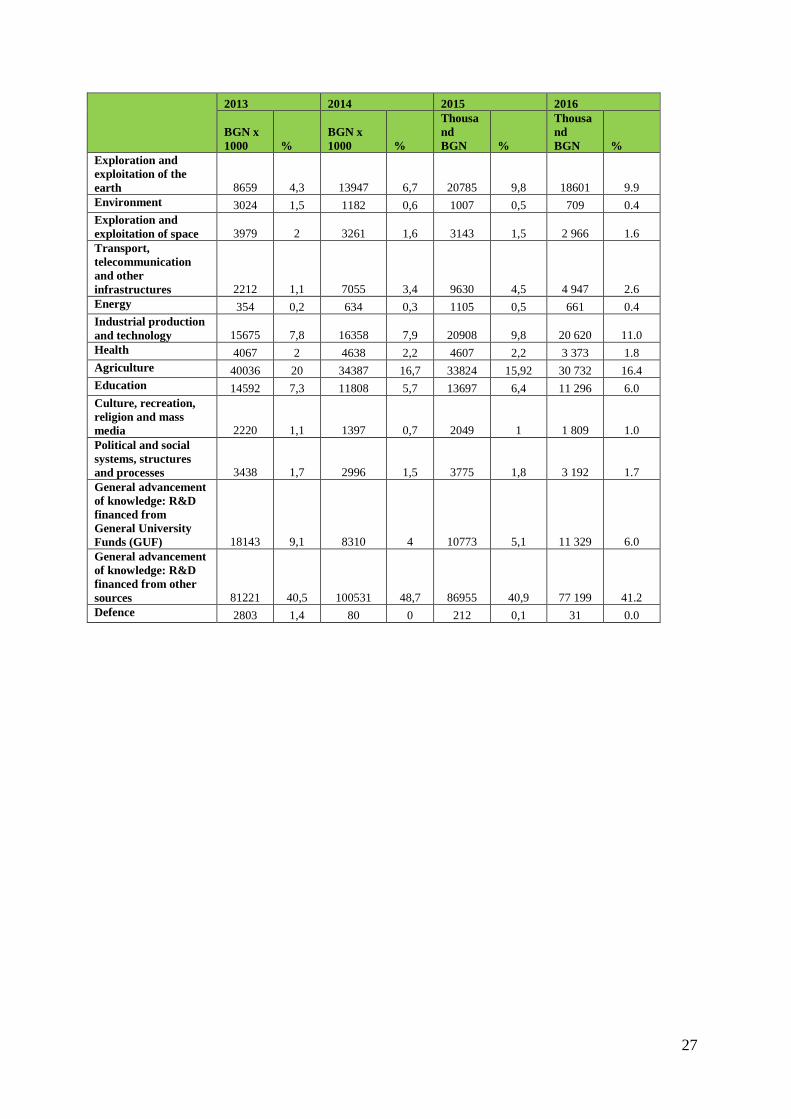
27
2013 2014 2015 2016
BGN x
1000 %
BGN x
1000 %
Thousa
nd
BGN %
Thousa
nd
BGN %
Exploration and
exploitation of the
earth 8659 4,3 13947 6,7 20785 9,8 18601 9.9
Environment 3024 1,5 1182 0,6 1007 0,5 709 0.4
Exploration and
exploitation of space 3979 2 3261 1,6 3143 1,5 2 966 1.6
Transport,
telecommunication
and other
infrastructures 2212 1,1 7055 3,4 9630 4,5 4 947 2.6
Energy 354 0,2 634 0,3 1105 0,5 661 0.4
Industrial production
and technology 15675 7,8 16358 7,9 20908 9,8 20 620 11.0
Health 4067 2 4638 2,2 4607 2,2 3 373 1.8
Agriculture 40036 20 34387 16,7 33824 15,92 30 732 16.4
Education 14592 7,3 11808 5,7 13697 6,4 11 296 6.0
Culture, recreation,
religion and mass
media 2220 1,1 1397 0,7 2049 1 1 809 1.0
Political and social
systems, structures
and processes 3438 1,7 2996 1,5 3775 1,8 3 192 1.7
General advancement
of knowledge: R&D
financed from
General University
Funds (GUF) 18143 9,1 8310 4 10773 5,1 11 329 6.0
General advancement
of knowledge: R&D
financed from other
sources 81221 40,5 100531 48,7 86955 40,9 77 199 41.2
Defence 2803 1,4 80 0 212 0,1 31 0.0
28
2. National circumstances relevant to greenhouse gas emissions
and removals
2.1. Government Structure
The government type in Republic of Bulgaria is a parliamentary democracy. The Bulgarian
unicameral parliament - the National Assembly consists of 240 deputies who are elected for
4-year-terms by popular vote. The Head of state is the President (Rumen Radev since
January 2017) directly elected for a 5-year term with the right to one re-election. Executive
power is exercised by the government. Legislative power is vested in both the government
and the National Assembly. The Judiciary is independent of the executive and the
legislature.
The Council of Ministers is the principal organ of the executive branch, being chaired by the
Prime Minister (Boiko Borisov since May 2017), The central administration consists of 20
ministries. The main competencies and responsibilities related to climate change lie in the
Ministry of Environment and Water. The Executive Environment Agency is responsible for
the National inventories of GHG emissions, for monitoring, reporting and verification and
for GHG permit issuance.
Given the horizontal nature of the climate change policy, the principle of integrating the
climate considerations in key sectoral policies such as energy, households and services,
industry, transport, agriculture, forestry and waste management is applied. Taking into
account the close interaction of the policies in these areas with the strategic planning related
to climate change, the government aims at an active involvement and commitment of all
institutions responsible for carrying out the relevant policies.
2.2. Geographic Profile
The Republic of Bulgaria is situated on the Eastern Balkan Peninsula in South-eastern
Europe, along the Black Sea. With a territory of 111 001.9 square kilometres, Bulgaria is
Europe's 16th-largest country. The neighbour states are Greece and Turkey to the South, FY
Republic of Macedonia and Serbia to the West. The River Danube separates it from
Romania to the North. Its natural eastern border is the Black Sea. 60% of the total area is
covered with hills and mountains with lowlands in north and southeast. The mountains are
part of the Alpine-Himalayan mountain chain situated on two continents - Europe and Asia,
34% of the country’s territory is covered with forests (deciduous and coniferous). The varied
environment is a natural habitat for valuable animal species.
The most notable topographical features are the Danubian Plain, the Balkan Mountains, the
Thracian Plain, and the Rhodope Mountains. The southern edge of the Danubian Plain
slopes upward into the foothills of the Balkans, while the Danube defines the border with
Romania. The Thracian Plain is roughly triangular, beginning southeast of Sofia and
broadening as it reaches the Black Sea coast.
The Balkan mountains run laterally through the middle of the country. The mountainous
southwest of the country has two alpine ranges—Rila and Pirin, which border the lower but
more extensive Rhodope Mountains to the east. Bulgaria is home to the highest point of the
Balkan Peninsula, Musala, at 2,925 metres and its lowest point is sea level. Plains occupy
about one-third of the territory, while plateaus and hills occupy 41 per cent. The country has
a dense network of about 540 rivers, most of which are relatively small and with low water
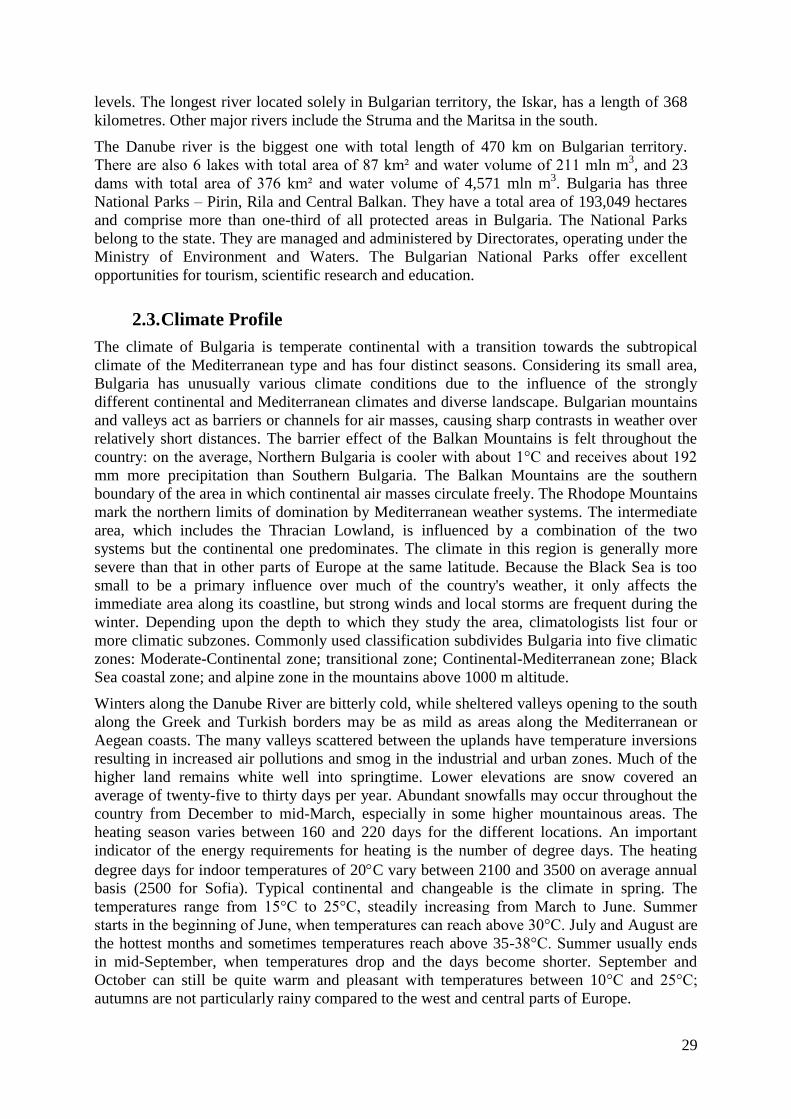
29
levels. The longest river located solely in Bulgarian territory, the Iskar, has a length of 368
kilometres. Other major rivers include the Struma and the Maritsa in the south.
The Danube river is the biggest one with total length of 470 km on Bulgarian territory.
There are also 6 lakes with total area of 87 km² and water volume of 211 mln m3, and 23
dams with total area of 376 km² and water volume of 4,571 mln m3. Bulgaria has three
National Parks – Pirin, Rila and Central Balkan. They have a total area of 193,049 hectares
and comprise more than one-third of all protected areas in Bulgaria. The National Parks
belong to the state. They are managed and administered by Directorates, operating under the
Ministry of Environment and Waters. The Bulgarian National Parks offer excellent
opportunities for tourism, scientific research and education.
2.3. Climate Profile
The climate of Bulgaria is temperate continental with a transition towards the subtropical
climate of the Mediterranean type and has four distinct seasons. Considering its small area,
Bulgaria has unusually various climate conditions due to the influence of the strongly
different continental and Mediterranean climates and diverse landscape. Bulgarian mountains
and valleys act as barriers or channels for air masses, causing sharp contrasts in weather over
relatively short distances. The barrier effect of the Balkan Mountains is felt throughout the
country: on the average, Northern Bulgaria is cooler with about 1°C and receives about 192
mm more precipitation than Southern Bulgaria. The Balkan Mountains are the southern
boundary of the area in which continental air masses circulate freely. The Rhodope Mountains
mark the northern limits of domination by Mediterranean weather systems. The intermediate
area, which includes the Thracian Lowland, is influenced by a combination of the two
systems but the continental one predominates. The climate in this region is generally more
severe than that in other parts of Europe at the same latitude. Because the Black Sea is too
small to be a primary influence over much of the country's weather, it only affects the
immediate area along its coastline, but strong winds and local storms are frequent during the
winter. Depending upon the depth to which they study the area, climatologists list four or
more climatic subzones. Commonly used classification subdivides Bulgaria into five climatic
zones: Moderate-Continental zone; transitional zone; Continental-Mediterranean zone; Black
Sea coastal zone; and alpine zone in the mountains above 1000 m altitude.
Winters along the Danube River are bitterly cold, while sheltered valleys opening to the south
along the Greek and Turkish borders may be as mild as areas along the Mediterranean or
Aegean coasts. The many valleys scattered between the uplands have temperature inversions
resulting in increased air pollutions and smog in the industrial and urban zones. Much of the
higher land remains white well into springtime. Lower elevations are snow covered an
average of twenty-five to thirty days per year. Abundant snowfalls may occur throughout the
country from December to mid-March, especially in some higher mountainous areas. The
heating season varies between 160 and 220 days for the different locations. An important
indicator of the energy requirements for heating is the number of degree days. The heating
degree days for indoor temperatures of 20C vary between 2100 and 3500 on average annual
basis (2500 for Sofia). Typical continental and changeable is the climate in spring. The
temperatures range from 15°C to 25°C, steadily increasing from March to June. Summer
starts in the beginning of June, when temperatures can reach above 30°C. July and August are
the hottest months and sometimes temperatures reach above 35-38°C. Summer usually ends
in mid-September, when temperatures drop and the days become shorter. September and
October can still be quite warm and pleasant with temperatures between 10°C and 25°C;
autumns are not particularly rainy compared to the west and central parts of Europe.
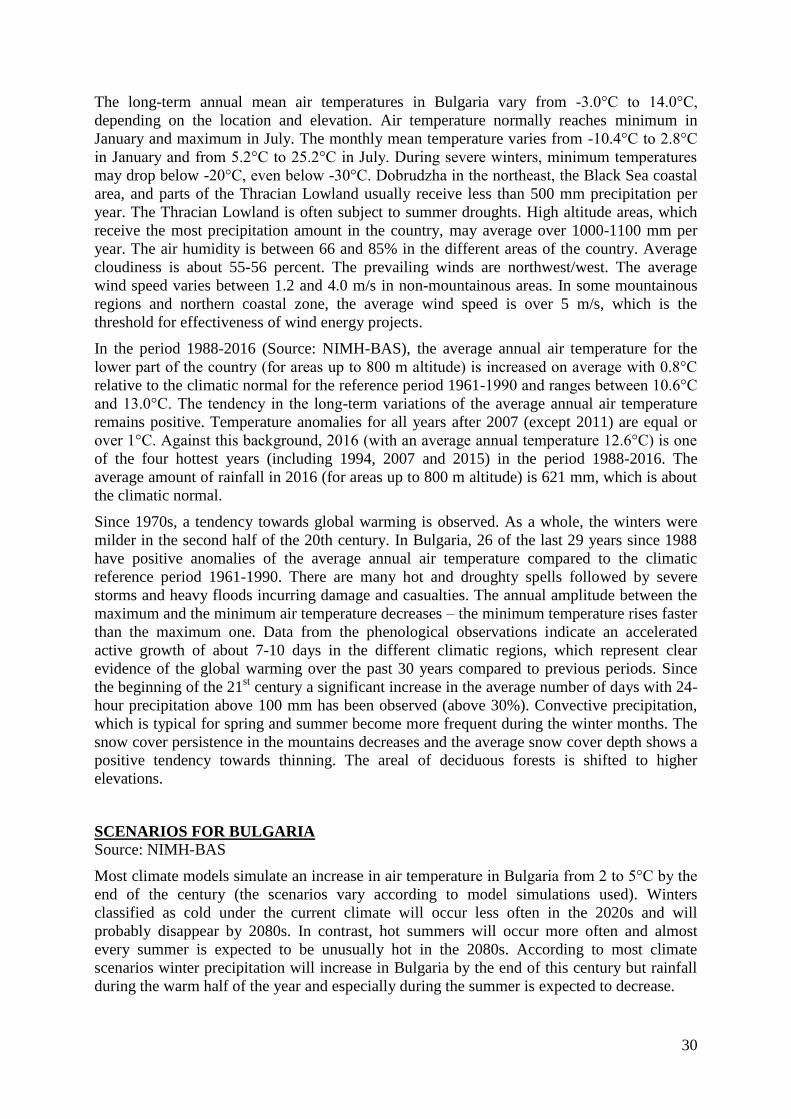
30
The long-term annual mean air temperatures in Bulgaria vary from -3.0°C to 14.0°C,
depending on the location and elevation. Air temperature normally reaches minimum in
January and maximum in July. The monthly mean temperature varies from -10.4°C to 2.8°C
in January and from 5.2°C to 25.2°C in July. During severe winters, minimum temperatures
may drop below -20°C, even below -30°C. Dobrudzha in the northeast, the Black Sea coastal
area, and parts of the Thracian Lowland usually receive less than 500 mm precipitation per
year. The Thracian Lowland is often subject to summer droughts. High altitude areas, which
receive the most precipitation amount in the country, may average over 1000-1100 mm per
year. The air humidity is between 66 and 85% in the different areas of the country. Average
cloudiness is about 55-56 percent. The prevailing winds are northwest/west. The average
wind speed varies between 1.2 and 4.0 m/s in non-mountainous areas. In some mountainous
regions and northern coastal zone, the average wind speed is over 5 m/s, which is the
threshold for effectiveness of wind energy projects.
In the period 1988-2016 (Source: NIMH-BAS), the average annual air temperature for the
lower part of the country (for areas up to 800 m altitude) is increased on average with 0.8°C
relative to the climatic normal for the reference period 1961-1990 and ranges between 10.6°C
and 13.0°C. The tendency in the long-term variations of the average annual air temperature
remains positive. Temperature anomalies for all years after 2007 (except 2011) are equal or
over 1°C. Against this background, 2016 (with an average annual temperature 12.6°C) is one
of the four hottest years (including 1994, 2007 and 2015) in the period 1988-2016. The
average amount of rainfall in 2016 (for areas up to 800 m altitude) is 621 mm, which is about
the climatic normal.
Since 1970s, a tendency towards global warming is observed. As a whole, the winters were
milder in the second half of the 20th century. In Bulgaria, 26 of the last 29 years since 1988
have positive anomalies of the average annual air temperature compared to the climatic
reference period 1961-1990. There are many hot and droughty spells followed by severe
storms and heavy floods incurring damage and casualties. The annual amplitude between the
maximum and the minimum air temperature decreases – the minimum temperature rises faster
than the maximum one. Data from the phenological observations indicate an accelerated
active growth of about 7-10 days in the different climatic regions, which represent clear
evidence of the global warming over the past 30 years compared to previous periods. Since
the beginning of the 21st century a significant increase in the average number of days with 24-
hour precipitation above 100 mm has been observed (above 30%). Convective precipitation,
which is typical for spring and summer become more frequent during the winter months. The
snow cover persistence in the mountains decreases and the average snow cover depth shows a
positive tendency towards thinning. The areal of deciduous forests is shifted to higher
elevations.
SCENARIOS FOR BULGARIA
Source: NIMH-BAS
Most climate models simulate an increase in air temperature in Bulgaria from 2 to 5°C by the
end of the century (the scenarios vary according to model simulations used). Winters
classified as cold under the current climate will occur less often in the 2020s and will
probably disappear by 2080s. In contrast, hot summers will occur more often and almost
every summer is expected to be unusually hot in the 2080s. According to most climate
scenarios winter precipitation will increase in Bulgaria by the end of this century but rainfall
during the warm half of the year and especially during the summer is expected to decrease.
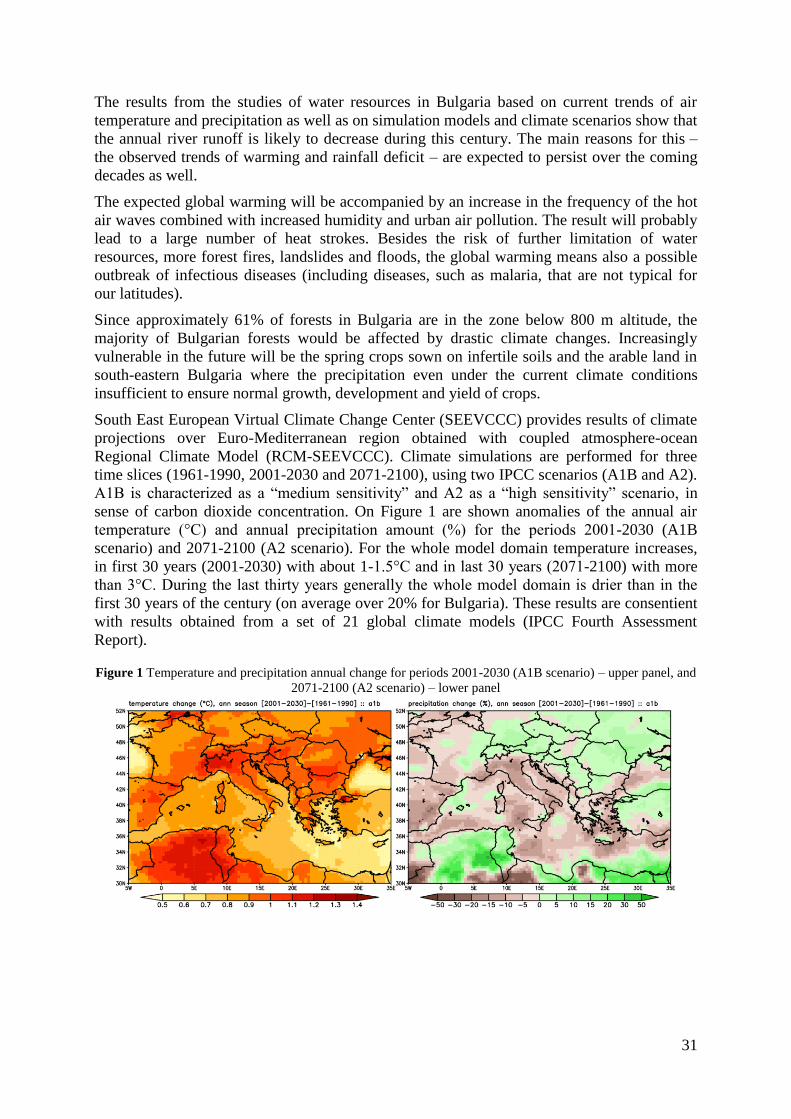
31
The results from the studies of water resources in Bulgaria based on current trends of air
temperature and precipitation as well as on simulation models and climate scenarios show that
the annual river runoff is likely to decrease during this century. The main reasons for this –
the observed trends of warming and rainfall deficit – are expected to persist over the coming
decades as well.
The expected global warming will be accompanied by an increase in the frequency of the hot
air waves combined with increased humidity and urban air pollution. The result will probably
lead to a large number of heat strokes. Besides the risk of further limitation of water
resources, more forest fires, landslides and floods, the global warming means also a possible
outbreak of infectious diseases (including diseases, such as malaria, that are not typical for
our latitudes).
Since approximately 61% of forests in Bulgaria are in the zone below 800 m altitude, the
majority of Bulgarian forests would be affected by drastic climate changes. Increasingly
vulnerable in the future will be the spring crops sown on infertile soils and the arable land in
south-eastern Bulgaria where the precipitation even under the current climate conditions
insufficient to ensure normal growth, development and yield of crops.
South East European Virtual Climate Change Center (SEEVCCC) provides results of climate
projections over Euro-Mediterranean region obtained with coupled atmosphere-ocean
Regional Climate Model (RCM-SEEVCCC). Climate simulations are performed for three
time slices (1961-1990, 2001-2030 and 2071-2100), using two IPCC scenarios (A1B and A2).
A1B is characterized as a “medium sensitivity” and A2 as a “high sensitivity” scenario, in
sense of carbon dioxide concentration. On Figure 1 are shown anomalies of the annual air
temperature (°C) and annual precipitation amount (%) for the periods 2001-2030 (A1B
scenario) and 2071-2100 (A2 scenario). For the whole model domain temperature increases,
in first 30 years (2001-2030) with about 1-1.5°C and in last 30 years (2071-2100) with more
than 3°C. During the last thirty years generally the whole model domain is drier than in the
first 30 years of the century (on average over 20% for Bulgaria). These results are consentient
with results obtained from a set of 21 global climate models (IPCC Fourth Assessment
Report).
Figure 1 Temperature and precipitation annual change for periods 2001-2030 (A1B scenario) – upper panel, and
2071-2100 (A2 scenario) – lower panel
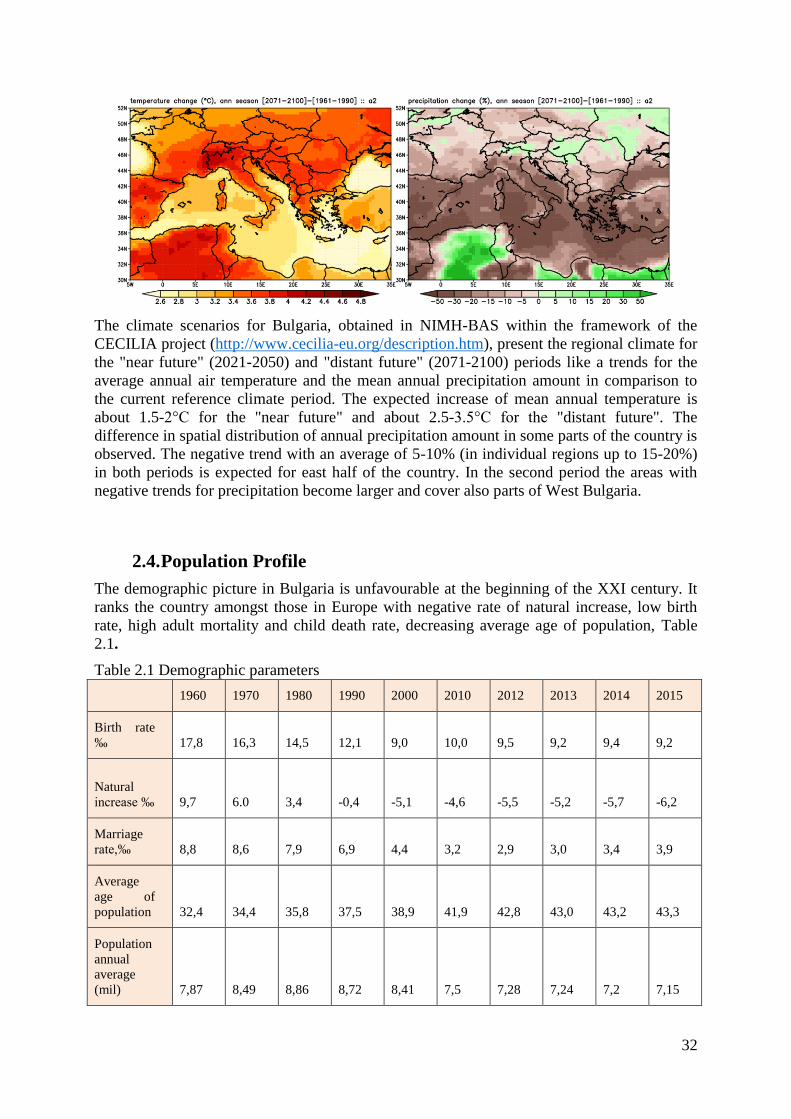
32
The climate scenarios for Bulgaria, obtained in NIMH-BAS within the framework of the
CECILIA project (http://www.cecilia-eu.org/description.htm), present the regional climate for
the "near future" (2021-2050) and "distant future" (2071-2100) periods like a trends for the
average annual air temperature and the mean annual precipitation amount in comparison to
the current reference climate period. The expected increase of mean annual temperature is
about 1.5-2°C for the "near future" and about 2.5-3.5°C for the "distant future". The
difference in spatial distribution of annual precipitation amount in some parts of the country is
observed. The negative trend with an average of 5-10% (in individual regions up to 15-20%)
in both periods is expected for east half of the country. In the second period the areas with
negative trends for precipitation become larger and cover also parts of West Bulgaria.
2.4. Population Profile
The demographic picture in Bulgaria is unfavourable at the beginning of the XXI century. It
ranks the country amongst those in Europe with negative rate of natural increase, low birth
rate, high adult mortality and child death rate, decreasing average age of population, Table
2.1.
Table 2.1 Demographic parameters
1960 1970 1980 1990 2000 2010 2012 2013 2014 2015
Birth rate
‰ 17,8 16,3 14,5 12,1 9,0 10,0 9,5 9,2 9,4 9,2
Natural
increase ‰ 9,7 6.0 3,4 -0,4 -5,1 -4,6 -5,5 -5,2 -5,7 -6,2
Marriage
rate,‰ 8,8 8,6 7,9 6,9 4,4 3,2 2,9 3,0 3,4 3,9
Average
age of
population 32,4 34,4 35,8 37,5 38,9 41,9 42,8 43,0 43,2 43,3
Population
annual
average
(mil) 7,87 8,49 8,86 8,72 8,41 7,5 7,28 7,24 7,2 7,15
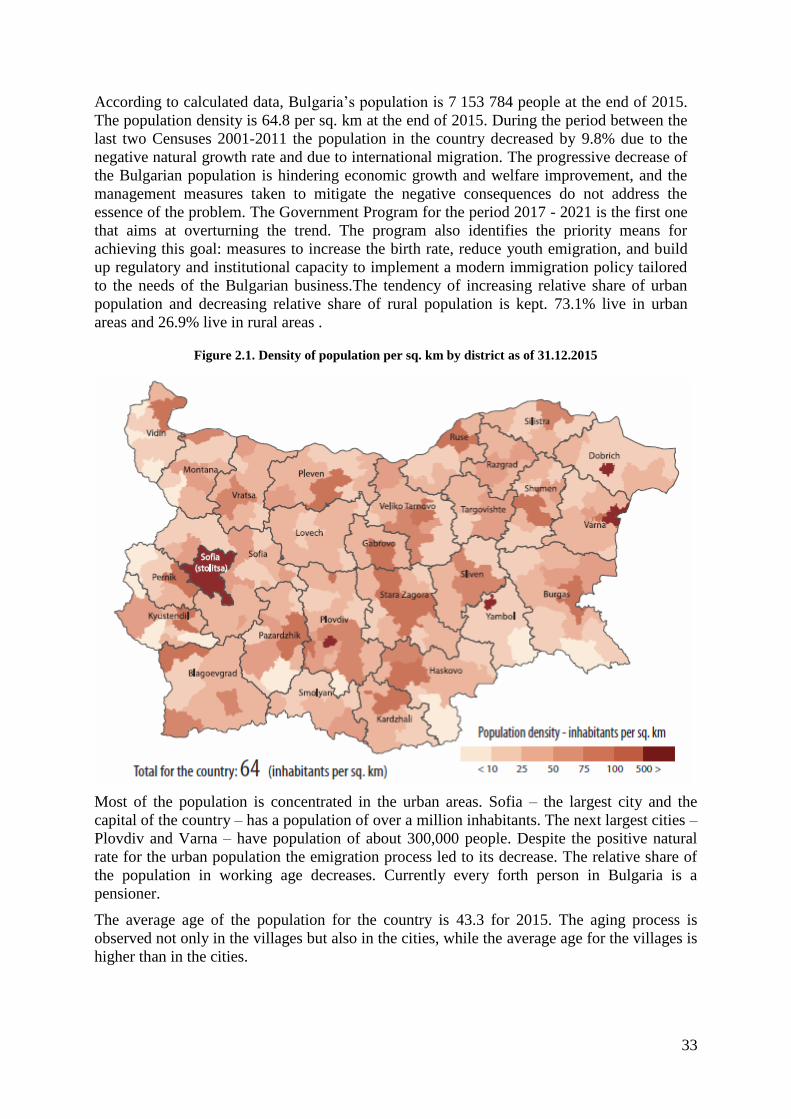
33
According to calculated data, Bulgaria’s population is 7 153 784 people at the end of 2015.
The population density is 64.8 per sq. km at the end of 2015. During the period between the
last two Censuses 2001-2011 the population in the country decreased by 9.8% due to the
negative natural growth rate and due to international migration. The progressive decrease of
the Bulgarian population is hindering economic growth and welfare improvement, and the
management measures taken to mitigate the negative consequences do not address the
essence of the problem. The Government Program for the period 2017 - 2021 is the first one
that aims at overturning the trend. The program also identifies the priority means for
achieving this goal: measures to increase the birth rate, reduce youth emigration, and build
up regulatory and institutional capacity to implement a modern immigration policy tailored
to the needs of the Bulgarian business.The tendency of increasing relative share of urban
population and decreasing relative share of rural population is kept. 73.1% live in urban
areas and 26.9% live in rural areas .
Figure 2.1. Density of population per sq. km by district as of 31.12.2015
Most of the population is concentrated in the urban areas. Sofia – the largest city and the
capital of the country – has a population of over a million inhabitants. The next largest cities –
Plovdiv and Varna – have population of about 300,000 people. Despite the positive natural
rate for the urban population the emigration process led to its decrease. The relative share of
the population in working age decreases. Currently every forth person in Bulgaria is a
pensioner.
The average age of the population for the country is 43.3 for 2015. The aging process is
observed not only in the villages but also in the cities, while the average age for the villages is
higher than in the cities.
34
Average life expectancy in Bulgaria is 70.51 for male and 77.55 for female for the period
2011-2015. In comparison, the average life expectancy for 1935-1939 was respectively 50.98
and 52.56, and for the period 1984-1986 it was 68.17 for male and 74.44 for female.
In total, women continue to be more (51.4 %).
The severe demographic decline is explained with low birth rates, high mortality rates and
significant emigration. Bulgaria’s age structure has changed radically. Its median age
increased from 30 in 1960 to 43,5 in 2015,.
2.5. Economic Profile
Bulgaria has an emerging market economy in the upper middle income range where the
private sector accounts for more than 80 per cent of GDP. From a largely agricultural
country with a predominantly rural population in 1948, by the 1980s, Bulgaria had
transformed into an industrial economy with scientific and technological research at the top
of its budgetary expenditure priorities. The loss of COMECON (Council for Mutual
Economic Assistance) markets in 1990 and the subsequent "shock therapy” of the planned
system caused a steep decline in industrial and agricultural production, ultimately followed
by an economic collapse in 1997.
The country has successfully achieved and continues to deliver macroeconomic stability
after 1998. The introduced Currency Board, sound fiscal policy, limited pay raise, etc. have
been rules, administrative in their nature, which are in the basis of the macroeconomic and
financial stability. The functioning of the companies of the real economy, despite some
positive trends, mainly in the sales growth, is still not leading to overcome the crisis in the
real economy.
Economic indicators have worsened amid the late-2000s financial crisis. After several
consecutive years of high growth, GDP contracted with 5.5 per cent in 2009 and
unemployment remains above 12 per cent. Industrial output declined with 10 per cent,
mining with 31 per cent, and ferrous and metal production marked a 60 per cent drop.
Positive growth was restored in 2010, although investments and consumption continue to
decline steadily due to rising unemployment. The same year, intercompany debt exceeded
51 billion euro, meaning that 60 per cent of all Bulgarian companies were mutually
indebted. By 2012, it had increased to 83 billion euro, or 227 per cent of GDP. The
government implemented strict austerity measures with IMF and EU encouragement to
some positive fiscal results, but the social consequences of these measures have been
serious. Economic activities are fostered by the lowest personal and corporate income tax
rates in the EU and the second-lowest public debt of all member states at 16.5 per cent of
GDP in 2012. In 2012, GDP (PPP) was estimated at $104 billion, with a per capita value of
$14,235. Sofia and the surrounding Yugozapaden planning area are the most developed
region of the country with a per capita PPS GDP of $23,162 in 2009. Bulgaria is a net
receiver of funds from the EU. The absolute amount of received funds was 589 million euro
in 2009.
The labour force is 2.45 million people, of whom 7.1 per cent are employed in agriculture,
35.2 per cent are employed in industry and 57.7 per cent are employed in the services sector.
Extraction of metals and minerals, production of chemicals, machinery and vehicle
components, petroleum refinement and steel are among the major industrial activities.
Mining and its related industries employ a total of 120,000 people and generate about five
per cent of the country's GDP. Bulgaria is Europe's sixth-largest coal producer. Local
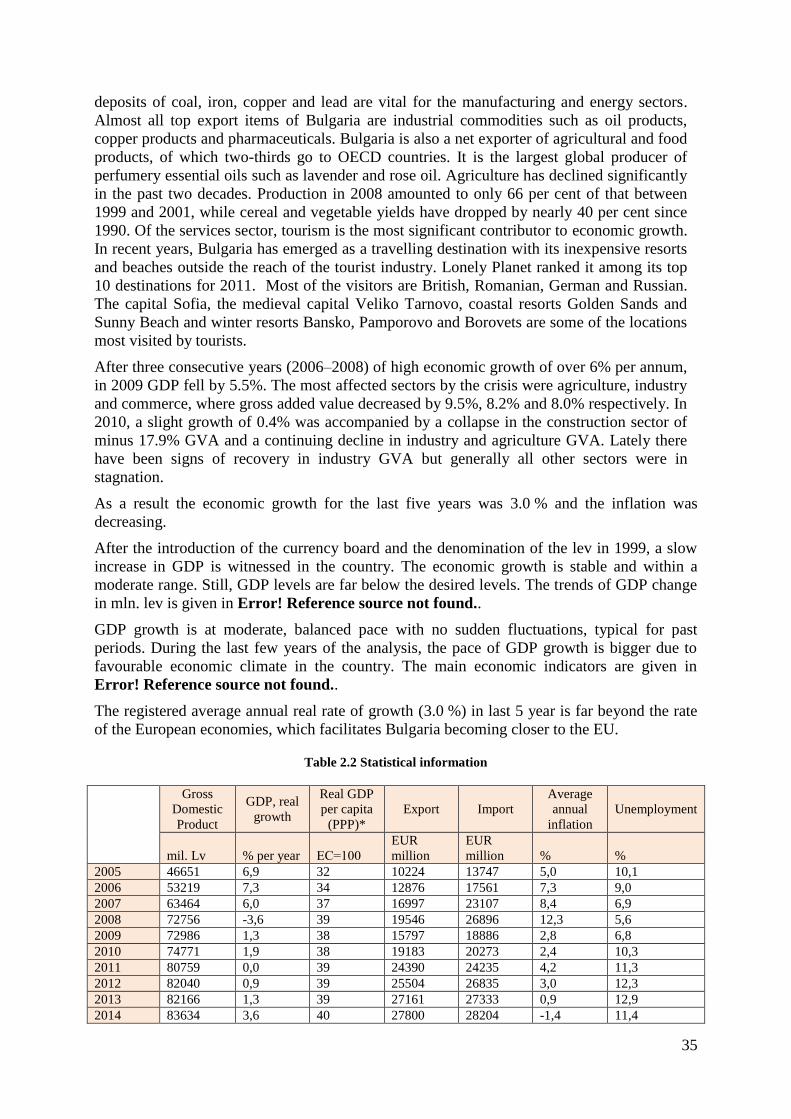
35
deposits of coal, iron, copper and lead are vital for the manufacturing and energy sectors.
Almost all top export items of Bulgaria are industrial commodities such as oil products,
copper products and pharmaceuticals. Bulgaria is also a net exporter of agricultural and food
products, of which two-thirds go to OECD countries. It is the largest global producer of
perfumery essential oils such as lavender and rose oil. Agriculture has declined significantly
in the past two decades. Production in 2008 amounted to only 66 per cent of that between
1999 and 2001, while cereal and vegetable yields have dropped by nearly 40 per cent since
1990. Of the services sector, tourism is the most significant contributor to economic growth.
In recent years, Bulgaria has emerged as a travelling destination with its inexpensive resorts
and beaches outside the reach of the tourist industry. Lonely Planet ranked it among its top
10 destinations for 2011. Most of the visitors are British, Romanian, German and Russian.
The capital Sofia, the medieval capital Veliko Tarnovo, coastal resorts Golden Sands and
Sunny Beach and winter resorts Bansko, Pamporovo and Borovets are some of the locations
most visited by tourists.
After three consecutive years (2006–2008) of high economic growth of over 6% per annum,
in 2009 GDP fell by 5.5%. The most affected sectors by the crisis were agriculture, industry
and commerce, where gross added value decreased by 9.5%, 8.2% and 8.0% respectively. In
2010, a slight growth of 0.4% was accompanied by a collapse in the construction sector of
minus 17.9% GVA and a continuing decline in industry and agriculture GVA. Lately there
have been signs of recovery in industry GVA but generally all other sectors were in
stagnation.
As a result the economic growth for the last five years was 3.0 % and the inflation was
decreasing.
After the introduction of the currency board and the denomination of the lev in 1999, a slow
increase in GDP is witnessed in the country. The economic growth is stable and within a
moderate range. Still, GDP levels are far below the desired levels. The trends of GDP change
in mln. lev is given in Error! Reference source not found..
GDP growth is at moderate, balanced pace with no sudden fluctuations, typical for past
periods. During the last few years of the analysis, the pace of GDP growth is bigger due to
favourable economic climate in the country. The main economic indicators are given in
Error! Reference source not found..
The registered average annual real rate of growth (3.0 %) in last 5 year is far beyond the rate
of the European economies, which facilitates Bulgaria becoming closer to the EU.
Table 2.2 Statistical information
Gross
Domestic
Product
GDP, real
growth
Real GDP
per capita
(PPP)*
Export Import
Average
annual
inflation
Unemployment
mil. Lv % per year ЕС=100
EUR
million
EUR
million % %
2005 46651 6,9 32 10224 13747 5,0 10,1
2006 53219 7,3 34 12876 17561 7,3 9,0
2007 63464 6,0 37 16997 23107 8,4 6,9
2008 72756 -3,6 39 19546 26896 12,3 5,6
2009 72986 1,3 38 15797 18886 2,8 6,8
2010 74771 1,9 38 19183 20273 2,4 10,3
2011 80759 0,0 39 24390 24235 4,2 11,3
2012 82040 0,9 39 25504 26835 3,0 12,3
2013 82166 1,3 39 27161 27333 0,9 12,9
2014 83634 3,6 40 27800 28204 -1,4 11,4
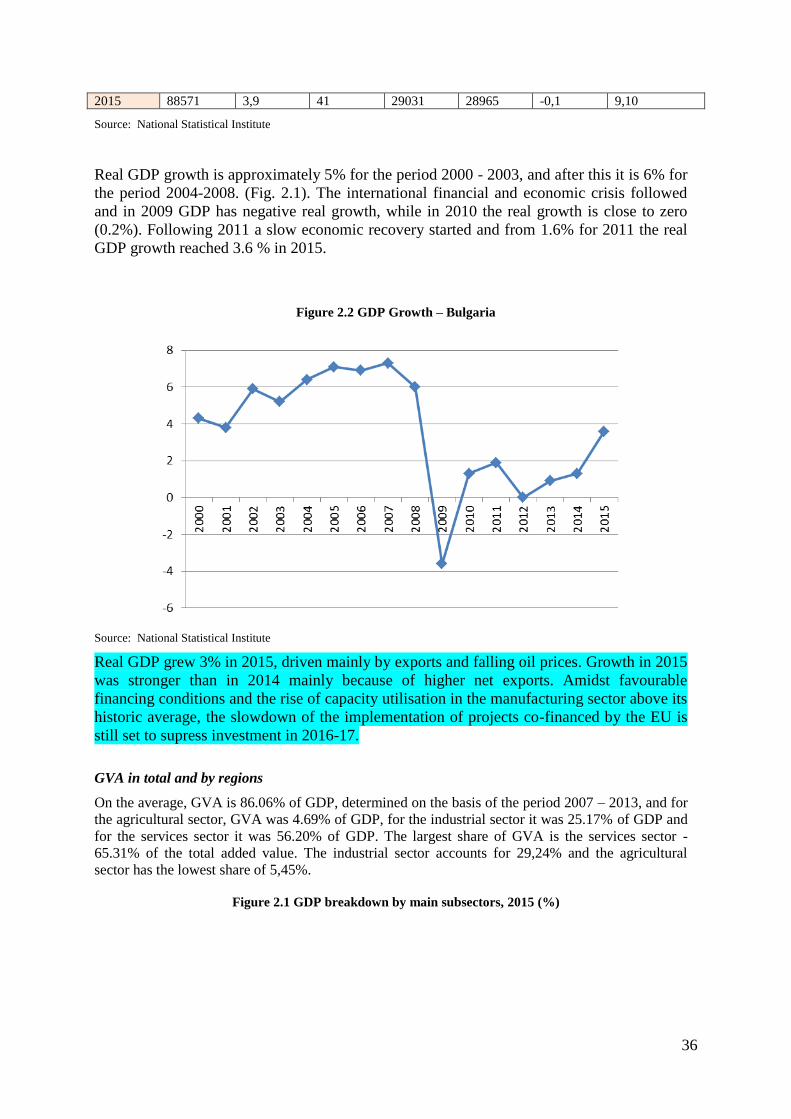
36
2015 88571 3,9 41 29031 28965 -0,1 9,10
Source: National Statistical Institute
Real GDP growth is approximately 5% for the period 2000 - 2003, and after this it is 6% for
the period 2004-2008. (Fig. 2.1). The international financial and economic crisis followed
and in 2009 GDP has negative real growth, while in 2010 the real growth is close to zero
(0.2%). Following 2011 a slow economic recovery started and from 1.6% for 2011 the real
GDP growth reached 3.6 % in 2015.
Figure 2.2 GDP Growth – Bulgaria
Source: National Statistical Institute
Real GDP grew 3% in 2015, driven mainly by exports and falling oil prices. Growth in 2015
was stronger than in 2014 mainly because of higher net exports. Amidst favourable
financing conditions and the rise of capacity utilisation in the manufacturing sector above its
historic average, the slowdown of the implementation of projects co-financed by the EU is
still set to supress investment in 2016-17.
GVA in total and by regions
On the average, GVA is 86.06% of GDP, determined on the basis of the period 2007 – 2013, and for
the agricultural sector, GVA was 4.69% of GDP, for the industrial sector it was 25.17% of GDP and
for the services sector it was 56.20% of GDP. The largest share of GVA is the services sector -
65.31% of the total added value. The industrial sector accounts for 29,24% and the agricultural
sector has the lowest share of 5,45%.
Figure 2.1 GDP breakdown by main subsectors, 2015 (%)
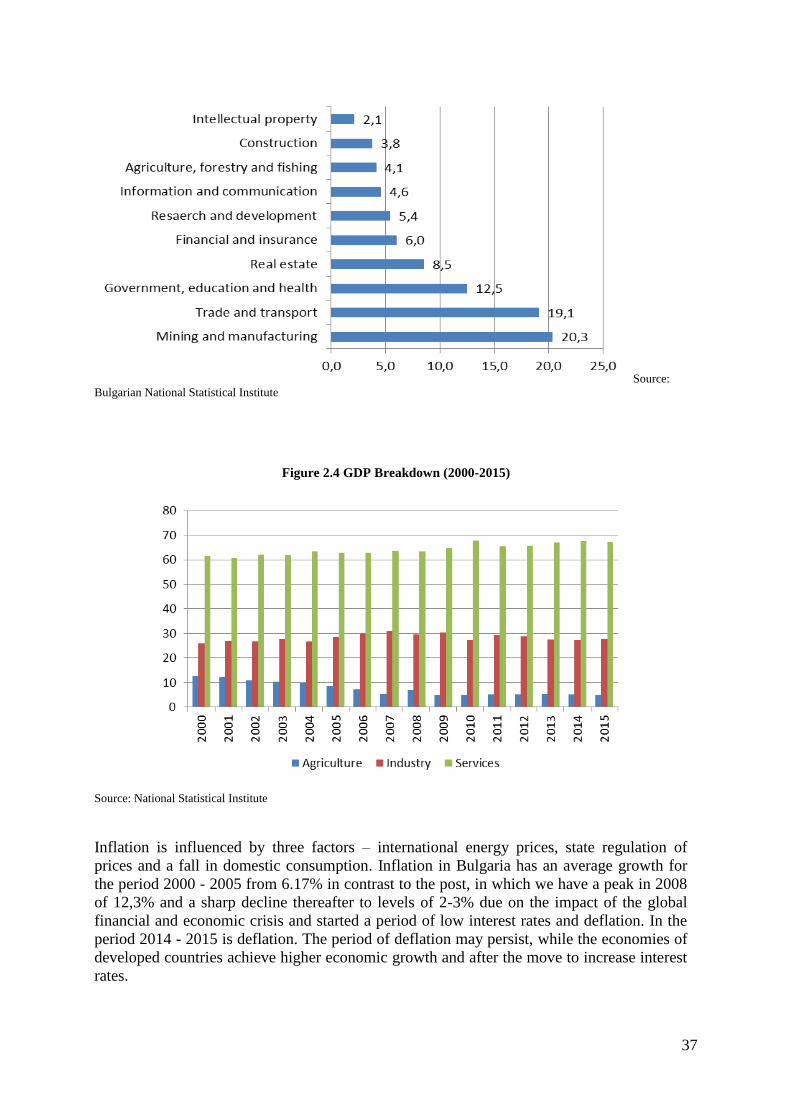
37
Source:
Bulgarian National Statistical Institute
Figure 2.4 GDP Breakdown (2000-2015)
Source: National Statistical Institute
Inflation is influenced by three factors – international energy prices, state regulation of
prices and a fall in domestic consumption. Inflation in Bulgaria has an average growth for
the period 2000 - 2005 from 6.17% in contrast to the post, in which we have a peak in 2008
of 12,3% and a sharp decline thereafter to levels of 2-3% due on the impact of the global
financial and economic crisis and started a period of low interest rates and deflation. In the
period 2014 - 2015 is deflation. The period of deflation may persist, while the economies of
developed countries achieve higher economic growth and after the move to increase interest
rates.
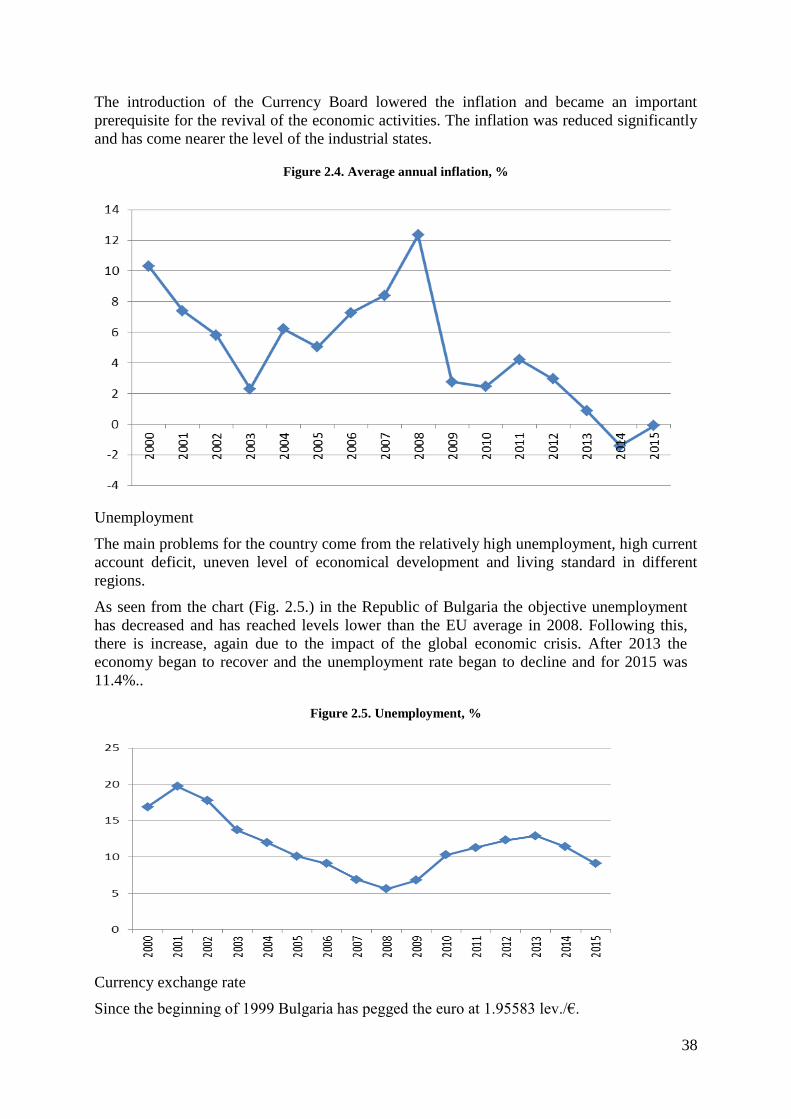
38
The introduction of the Currency Board lowered the inflation and became an important
prerequisite for the revival of the economic activities. The inflation was reduced significantly
and has come nearer the level of the industrial states.
Figure 2.4. Average annual inflation, %
Unemployment
The main problems for the country come from the relatively high unemployment, high current
account deficit, uneven level of economical development and living standard in different
regions.
As seen from the chart (Fig. 2.5.) in the Republic of Bulgaria the objective unemployment
has decreased and has reached levels lower than the EU average in 2008. Following this,
there is increase, again due to the impact of the global economic crisis. After 2013 the
economy began to recover and the unemployment rate began to decline and for 2015 was
11.4%..
Figure 2.5. Unemployment, %
Currency exchange rate
Since the beginning of 1999 Bulgaria has pegged the euro at 1.95583 lev./€.
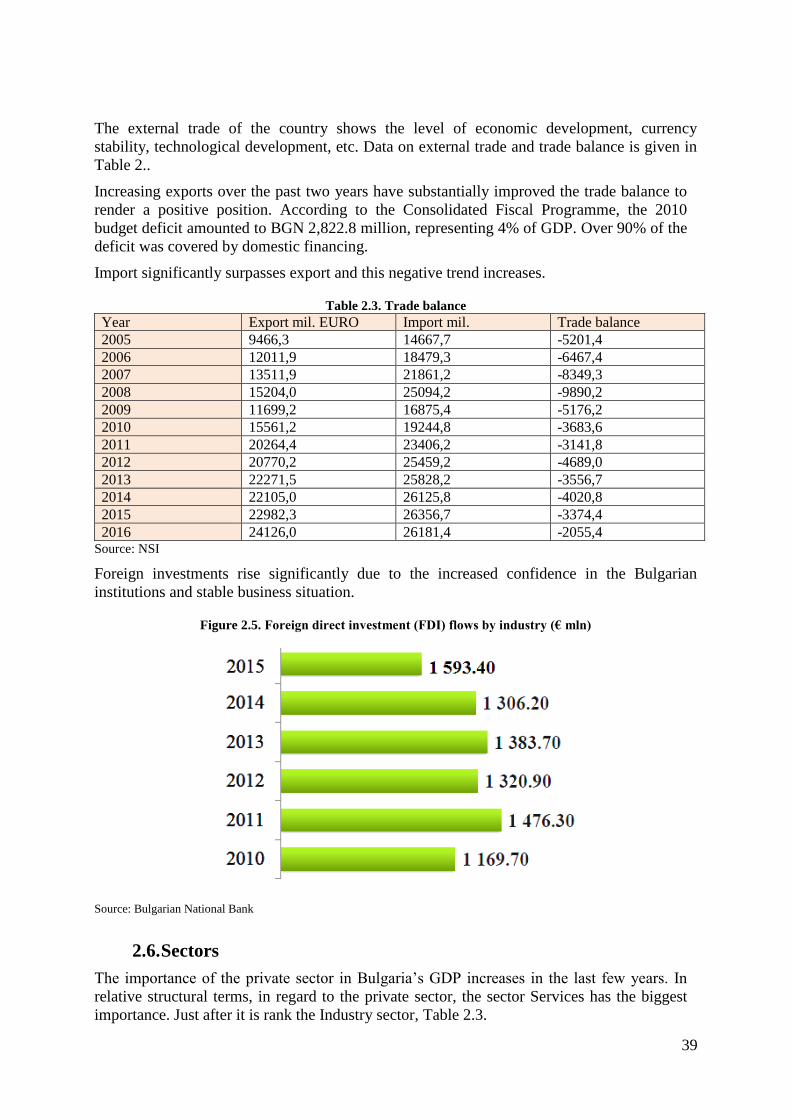
39
The external trade of the country shows the level of economic development, currency
stability, technological development, etc. Data on external trade and trade balance is given in
Table 2..
Increasing exports over the past two years have substantially improved the trade balance to
render a positive position. According to the Consolidated Fiscal Programme, the 2010
budget deficit amounted to BGN 2,822.8 million, representing 4% of GDP. Over 90% of the
deficit was covered by domestic financing.
Import significantly surpasses export and this negative trend increases.
Table 2.3. Trade balance
Year Export mil. EURO Import mil. Trade balance
2005 9466,3 14667,7 -5201,4
2006 12011,9 18479,3 -6467,4
2007 13511,9 21861,2 -8349,3
2008 15204,0 25094,2 -9890,2
2009 11699,2 16875,4 -5176,2
2010 15561,2 19244,8 -3683,6
2011 20264,4 23406,2 -3141,8
2012 20770,2 25459,2 -4689,0
2013 22271,5 25828,2 -3556,7
2014 22105,0 26125,8 -4020,8
2015 22982,3 26356,7 -3374,4
2016 24126,0 26181,4 -2055,4 Source: NSI
Foreign investments rise significantly due to the increased confidence in the Bulgarian
institutions and stable business situation.
Figure 2.5. Foreign direct investment (FDI) flows by industry (€ mln)
Source: Bulgarian National Bank
2.6. Sectors
The importance of the private sector in Bulgaria’s GDP increases in the last few years. In
relative structural terms, in regard to the private sector, the sector Services has the biggest
importance. Just after it is rank the Industry sector, Table 2.3.
40
Table 2.3 Relative share of the private sector in GDP (%)
YEAR 2000 2001 2002 2003 2004 2005
Agriculture and forestry 12,6 12,1 11,0 10,4 9,9 8,6
Industry 25.8 27.0 26.8 27.7 26.8 28.4
Services 61.6 60.9 62.2 61.9 63.3 63.0
YEAR 2006 2007 2008 2009 2010 2011
Agriculture and forestry 7.3 5.5 7.0 4.9 4.8 7.3
Industry 29.9 30.8 29.6 30.4 27.4 29.3
Services 62.8 63.7 63.4 64.7 67.8 65.5
YEAR 2012 2013 2014 2015
Agriculture and forestry 5.3 5.3 5.3 4.8
Industry 28.9 27.6 27.1 27.9
Services 65.8 67.1 67.6 67.3
Source: NSI
The indicator “GVA, private sector” is the Gross Value Added from producers, classified
according to the type of property in the private sector: private, non-finance finance
enterprises, households, non-trade organizations, service households.
It is necessary to take into account the increased importance of the private sector in the
Bulgarian economy for the analysed period. The Services sector remains the biggest with
largest relative share in the travelled way toward market economy.
One disturbing fact is the drop in the agricultural sector. This is an important sector for the
Bulgarian economy together with Tourism, taking into consideration the geographic location
of the country and its climate profile. This negative trend is since the year 2000. To
overcome this trend, the country must adequately use the EC agricultural structural funds, to
introduce preferential state policy in the sector and initiate entrepreneur training of the
Bulgarian farmers regarding their entrepreneurial spirit.
2.6.1. Land Use and National Resources
2.6.1.1.Land use
Common information on the Land Use in Bulgaria is shown on Table 2.4.
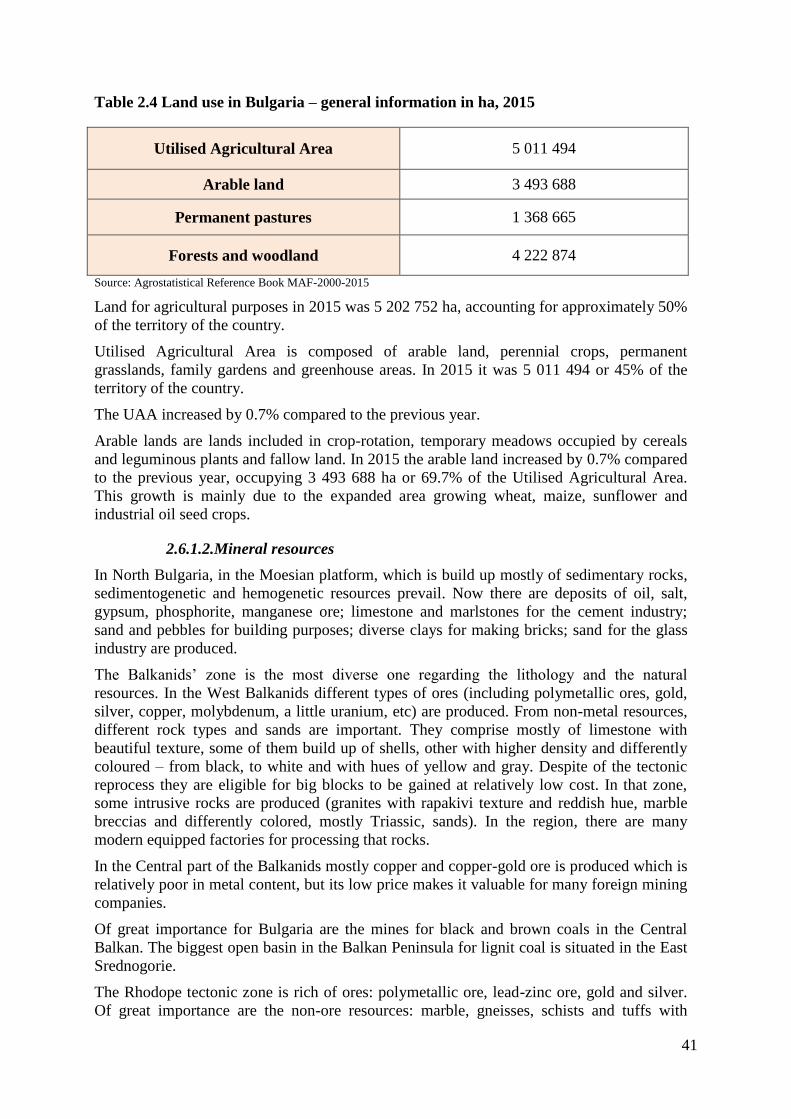
41
Table 2.4 Land use in Bulgaria – general information in ha, 2015
Utilised Agricultural Area 5 011 494
Arable land 3 493 688
Permanent pastures 1 368 665
Forests and woodland 4 222 874
Source: Agrostatistical Reference Book MAF-2000-2015
Land for agricultural purposes in 2015 was 5 202 752 ha, accounting for approximately 50%
of the territory of the country.
Utilised Agricultural Area is composed of arable land, perennial crops, permanent
grasslands, family gardens and greenhouse areas. In 2015 it was 5 011 494 or 45% of the
territory of the country.
The UAA increased by 0.7% compared to the previous year.
Arable lands are lands included in crop-rotation, temporary meadows occupied by cereals
and leguminous plants and fallow land. In 2015 the arable land increased by 0.7% compared
to the previous year, occupying 3 493 688 ha or 69.7% of the Utilised Agricultural Area.
This growth is mainly due to the expanded area growing wheat, maize, sunflower and
industrial oil seed crops.
2.6.1.2.Mineral resources
In North Bulgaria, in the Moesian platform, which is build up mostly of sedimentary rocks,
sedimentogenetic and hemogenetic resources prevail. Now there are deposits of oil, salt,
gypsum, phosphorite, manganese ore; limestone and marlstones for the cement industry;
sand and pebbles for building purposes; diverse clays for making bricks; sand for the glass
industry are produced.
The Balkanids’ zone is the most diverse one regarding the lithology and the natural
resources. In the West Balkanids different types of ores (including polymetallic ores, gold,
silver, copper, molybdenum, a little uranium, etc) are produced. From non-metal resources,
different rock types and sands are important. They comprise mostly of limestone with
beautiful texture, some of them build up of shells, other with higher density and differently
coloured – from black, to white and with hues of yellow and gray. Despite of the tectonic
reprocess they are eligible for big blocks to be gained at relatively low cost. In that zone,
some intrusive rocks are produced (granites with rapakivi texture and reddish hue, marble
breccias and differently colored, mostly Triassic, sands). In the region, there are many
modern equipped factories for processing that rocks.
In the Central part of the Balkanids mostly copper and copper-gold ore is produced which is
relatively poor in metal content, but its low price makes it valuable for many foreign mining
companies.
Of great importance for Bulgaria are the mines for black and brown coals in the Central
Balkan. The biggest open basin in the Balkan Peninsula for lignit coal is situated in the East
Srednogorie.
The Rhodope tectonic zone is rich of ores: polymetallic ore, lead-zinc ore, gold and silver.
Of great importance are the non-ore resources: marble, gneisses, schists and tuffs with
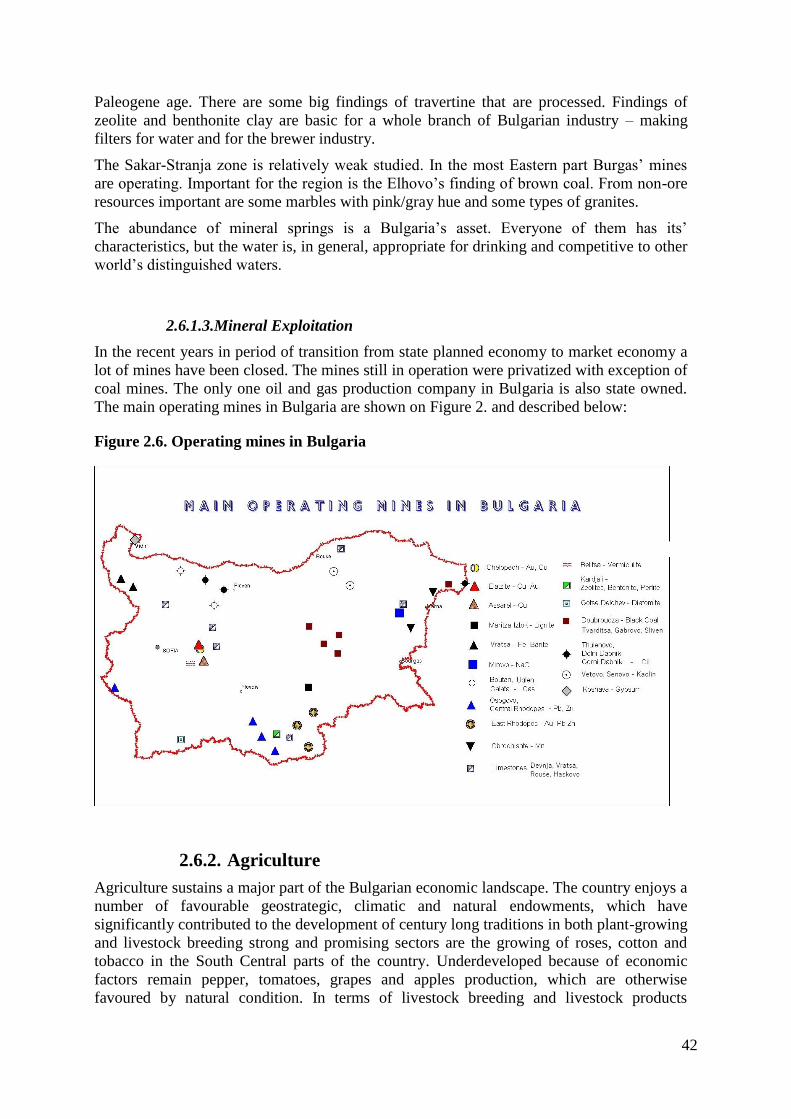
42
Paleogene age. There are some big findings of travertine that are processed. Findings of
zeolite and benthonite clay are basic for a whole branch of Bulgarian industry – making
filters for water and for the brewer industry.
The Sakar-Stranja zone is relatively weak studied. In the most Eastern part Burgas’ mines
are operating. Important for the region is the Elhovo’s finding of brown coal. From non-ore
resources important are some marbles with pink/gray hue and some types of granites.
The abundance of mineral springs is a Bulgaria’s asset. Everyone of them has its’
characteristics, but the water is, in general, appropriate for drinking and competitive to other
world’s distinguished waters.
2.6.1.3.Mineral Exploitation
In the recent years in period of transition from state planned economy to market economy a
lot of mines have been closed. The mines still in operation were privatized with exception of
coal mines. The only one oil and gas production company in Bulgaria is also state owned.
The main operating mines in Bulgaria are shown on Figure 2. and described below:
Figure 2.6. Operating mines in Bulgaria
2.6.2. Agriculture
Agriculture sustains a major part of the Bulgarian economic landscape. The country enjoys a
number of favourable geostrategic, climatic and natural endowments, which have
significantly contributed to the development of century long traditions in both plant-growing
and livestock breeding strong and promising sectors are the growing of roses, cotton and
tobacco in the South Central parts of the country. Underdeveloped because of economic
factors remain pepper, tomatoes, grapes and apples production, which are otherwise
favoured by natural condition. In terms of livestock breeding and livestock products
43
processing, the country has excellent outlooks for increasing the exports of specific high
quality milk and dairy commodities, as well as meat products. Predisposed by climatic and
natural conditions, organic farming is also gaining speed in recent years. Investments in
organic production are strongly encouraged by both Bulgarian and European authorities.
Today, agricultural entrepreneurs in Bulgaria enjoy a number of competitive advantages and
investment favourable factors. As a member of the EU, the country benefits from free access
to the growing European market and is also subject to financial and technical support by the
EU. Within the framework of the Common Agricultural Policy (CAP) and other cohesion
funding policies of the EU, Bulgaria is due to utilize more than € 7 billion for the period
2007-2013, of which a total of € 3 241 million are for rural areas development.
In the period from 2014 to 2020, around €7.4 billion1 is expected to be invested in
Bulgaria's farming sector and rural areas through the CAP. Certain key political priorities
for which CAP funding should be used have been defined at European level - jobs and
growth, sustainability, modernisation, innovation and quality. However, Bulgaria also has
the flexibility to adapt both direct payments and its rural development programme to its
specific needs.
The 2014-2020 rural development programme for Bulgaria focuses on the following
priorities:
• improving the competitiveness of the agricultural sector and farm viability and ensuring
quality food production (around 24 % of the funding)
• preserving ecosystems and the sustainable use of natural resources in agriculture, forestry
and food processing (around 46 %)
• the economic and social development of rural areas – creating jobs, reducing poverty,
improving social inclusion and quality of life (around 30 %).
.
2.6.3. Forestry
Forestry is a traditional important economic sector for Bulgaria, where significant state
investments for the last 40 years have created a potential for significant and sustainable
logging in the future, when young plantations will grow and become suitable for felling.
The forests cover some 34 % of the total area of the country, support valuable ecosystems
and control erosion. A big share of these forests (39.8 %) has special function – protective
and rehabilitation. A potential problem in the sector is the slow pace of reforms and
restructuring.
In the following two tables – Table 2.5 and Table 2.6, data for the forest areas in Bulgaria is
given and also – activities for afforestation.
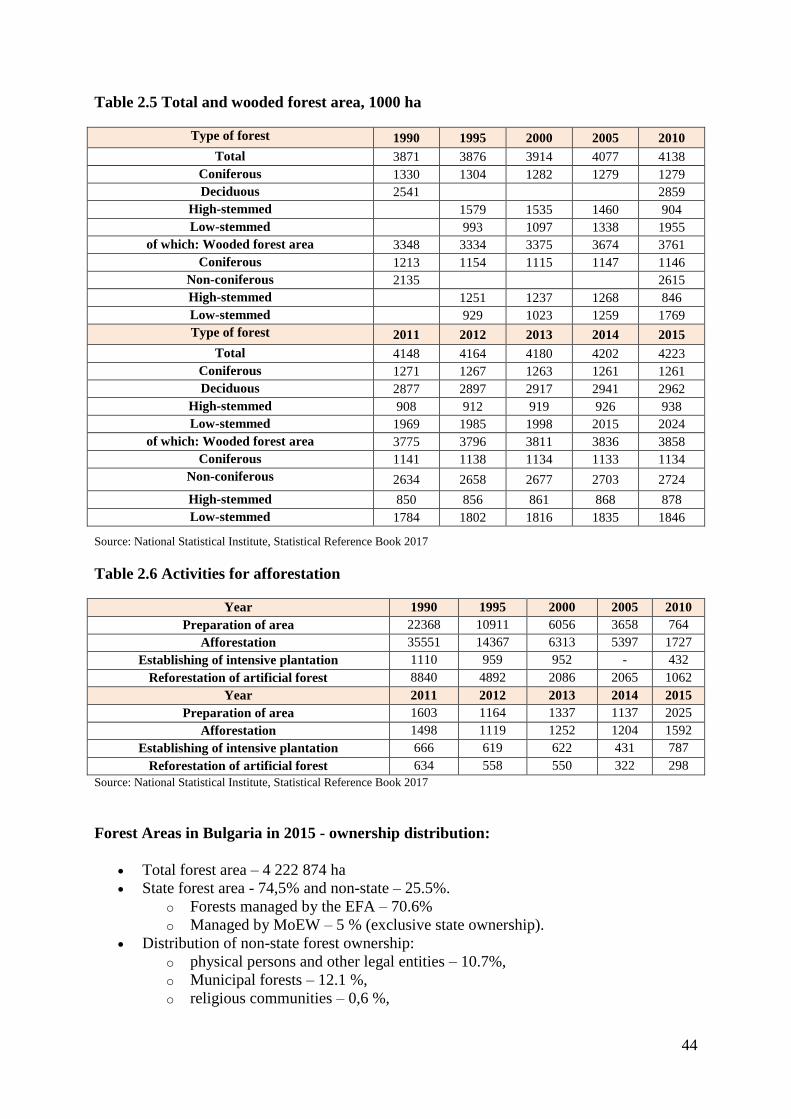
44
Table 2.5 Total and wooded forest area, 1000 ha
Type of forest 1990 1995 2000 2005 2010
Total 3871 3876 3914 4077 4138
Coniferous 1330 1304 1282 1279 1279
Deciduous 2541 2859
High-stemmed 1579 1535 1460 904
Low-stemmed 993 1097 1338 1955
of which: Wooded forest area 3348 3334 3375 3674 3761
Coniferous 1213 1154 1115 1147 1146
Non-coniferous 2135 2615
High-stemmed 1251 1237 1268 846
Low-stemmed 929 1023 1259 1769
Type of forest 2011 2012 2013 2014 2015
Total 4148 4164 4180 4202 4223
Coniferous 1271 1267 1263 1261 1261
Deciduous 2877 2897 2917 2941 2962
High-stemmed 908 912 919 926 938
Low-stemmed 1969 1985 1998 2015 2024
of which: Wooded forest area 3775 3796 3811 3836 3858
Coniferous 1141 1138 1134 1133 1134
Non-coniferous 2634 2658 2677 2703 2724
High-stemmed 850 856 861 868 878
Low-stemmed 1784 1802 1816 1835 1846
Source: National Statistical Institute, Statistical Reference Book 2017
Table 2.6 Activities for afforestation
Year 1990 1995 2000 2005 2010
Preparation of area 22368 10911 6056 3658 764
Afforestation 35551 14367 6313 5397 1727
Establishing of intensive plantation 1110 959 952 - 432
Reforestation of artificial forest 8840 4892 2086 2065 1062
Year 2011 2012 2013 2014 2015
Preparation of area 1603 1164 1337 1137 2025
Afforestation 1498 1119 1252 1204 1592
Establishing of intensive plantation 666 619 622 431 787
Reforestation of artificial forest 634 558 550 322 298
Source: National Statistical Institute, Statistical Reference Book 2017
Forest Areas in Bulgaria in 2015 - ownership distribution:
Total forest area – 4 222 874 ha
State forest area - 74,5% and non-state – 25.5%.
o Forests managed by the EFA – 70.6%
o Managed by MoEW – 5 % (exclusive state ownership).
Distribution of non-state forest ownership:
o physical persons and other legal entities – 10.7%,
o Municipal forests – 12.1 %,
o religious communities – 0,6 %,
45
o There are 1,9% forest afforested over abandoned agricultural lands
The forests of individual owners are small most are less than1 ha.
Only 150 of the individual estates > 50 ha
Municipal forests - usually several hundreds of ha
Main documents:
National Strategy for Development of the Forest Sector in the Republic Bulgaria
(NSDFSRB) 2013–2020 is an integrated document for the development of the forest sector
until 2020, defining the national priorities, in relevance with the European framework for
planning in the sector. The vision, mission and aims of the NSDFSRB 2013-2020 are defined
in the context of strategic vision and main targets for the development of the country, set in
the National Programme for Development: Bulgaria 2020. The NSDFSRB is developed after
broad analyses on the forest sector and on the implementation of the previous strategic
documents, including climate change modeling. It consists of 3 strategic aims, 4 priorities and
20 measures.
The strategic aims are: 1) Ensuring sustainable development of the forest sector by achieving
optimal balance between the ecological functions of the forests and their long term ability to
support material goods and services; 2) Strengthening the role of the forests for supporting the
economic growth of the country and more balanced territorial social-economic development;
3) Increasing the contribution of the forest sector in the green economy.
The Strategic plan for the development of the forest sector for the period 2014 – 2023 has
20 Operational targets (OT), corresponding with the NSDFSRB and 102 Activities for their
achievement. All Operational Targets are related to climate change adaptation as some of
them are as follows:
„Increasing the forests area, growing stock and carbon storage in the forest territories”;
„Improvement of the management and utilization of the forests”;
„Increasing the effectiveness of the prevention from forest fires and illegal activities in
the forests, and restoration of the damages from them”;
„Increasing the sustainability and ability for adaptation of the forest ecosystems
towards the climate changes”;
„Improvement of the system for planning and conducting of activities, connected with
the protection of biological and landscape diversity in the forest territories;
“Development of the protected areas network, including by extending the
implementation of the financial mechanisms for improvement of the forest
management in the NATURA 2000 protected zones;
„Maintenance and development of the system for protection of the forest genetic
resources”;
„Improvement and increasing the populations of game and fish species for the
protection of the biological diversity and sustainable development of the forest
ecosystems;
„Ensuring a sustainable planning of the activities in the forest territories”;
„Sustainable production and usage of biomass as renewable energy source”;
„Supporting the process of certification of the forest territories”;
„Effective and sustainable usage of the touristic potential of forests and development
of recreation activities in them”;
„Establishment of conditions for sustainable and paid usage of ecosystem services,
ensured by the forest territories”.
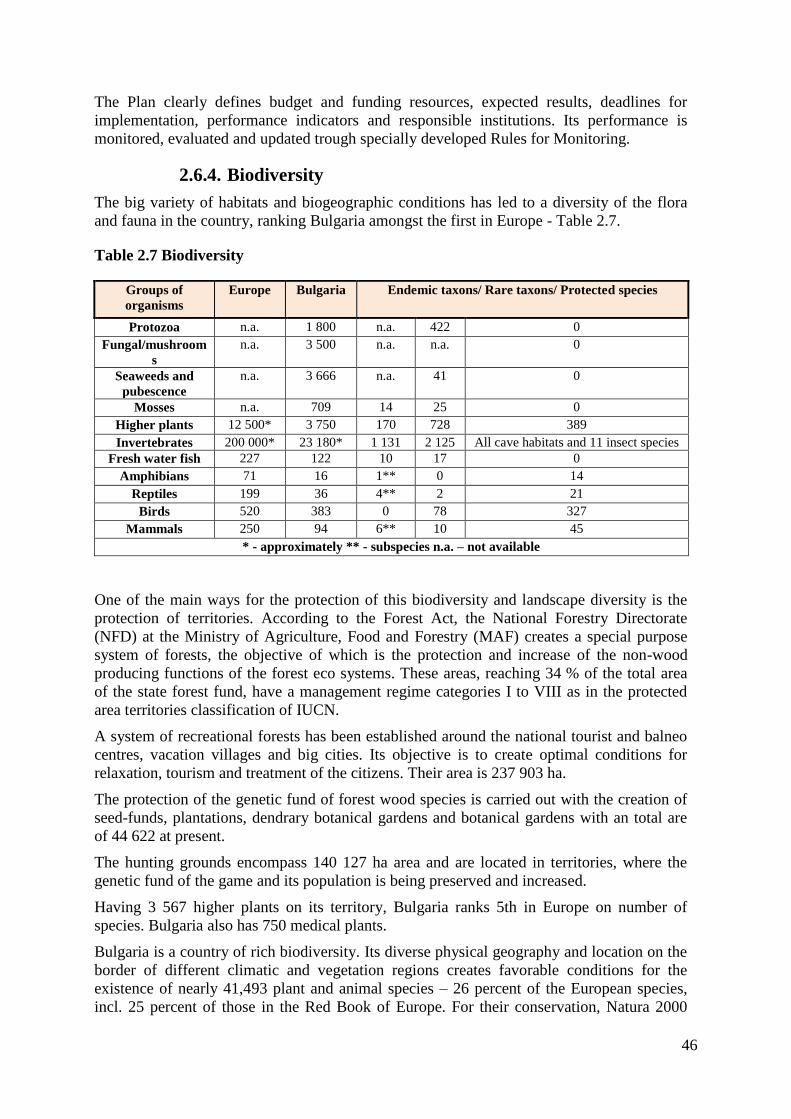
46
The Plan clearly defines budget and funding resources, expected results, deadlines for
implementation, performance indicators and responsible institutions. Its performance is
monitored, evaluated and updated trough specially developed Rules for Monitoring.
2.6.4. Biodiversity
The big variety of habitats and biogeographic conditions has led to a diversity of the flora
and fauna in the country, ranking Bulgaria amongst the first in Europe - Table 2.7.
Table 2.7 Biodiversity
Groups of
organisms
Europe Bulgaria Endemic taxons/ Rare taxons/ Protected species
Protozoa n.a. 1 800 n.a. 422 0
Fungal/mushroom
s
n.a. 3 500 n.a. n.a. 0
Seaweeds and
pubescence
n.a. 3 666 n.a. 41 0
Mosses n.a. 709 14 25 0
Higher plants 12 500* 3 750 170 728 389
Invertebrates 200 000* 23 180* 1 131 2 125 All cave habitats and 11 insect species
Fresh water fish 227 122 10 17 0
Amphibians 71 16 1** 0 14
Reptiles 199 36 4** 2 21
Birds 520 383 0 78 327
Mammals 250 94 6** 10 45
* - approximately ** - subspecies n.a. – not available
One of the main ways for the protection of this biodiversity and landscape diversity is the
protection of territories. According to the Forest Act, the National Forestry Directorate
(NFD) at the Ministry of Agriculture, Food and Forestry (MAF) creates a special purpose
system of forests, the objective of which is the protection and increase of the non-wood
producing functions of the forest eco systems. These areas, reaching 34 % of the total area
of the state forest fund, have a management regime categories I to VIII as in the protected
area territories classification of IUCN.
A system of recreational forests has been established around the national tourist and balneo
centres, vacation villages and big cities. Its objective is to create optimal conditions for
relaxation, tourism and treatment of the citizens. Their area is 237 903 ha.
The protection of the genetic fund of forest wood species is carried out with the creation of
seed-funds, plantations, dendrary botanical gardens and botanical gardens with an total are
of 44 622 at present.
The hunting grounds encompass 140 127 ha area and are located in territories, where the
genetic fund of the game and its population is being preserved and increased.
Having 3 567 higher plants on its territory, Bulgaria ranks 5th in Europe on number of
species. Bulgaria also has 750 medical plants.
Bulgaria is a country of rich biodiversity. Its diverse physical geography and location on the
border of different climatic and vegetation regions creates favorable conditions for the
existence of nearly 41,493 plant and animal species – 26 percent of the European species,
incl. 25 percent of those in the Red Book of Europe. For their conservation, Natura 2000
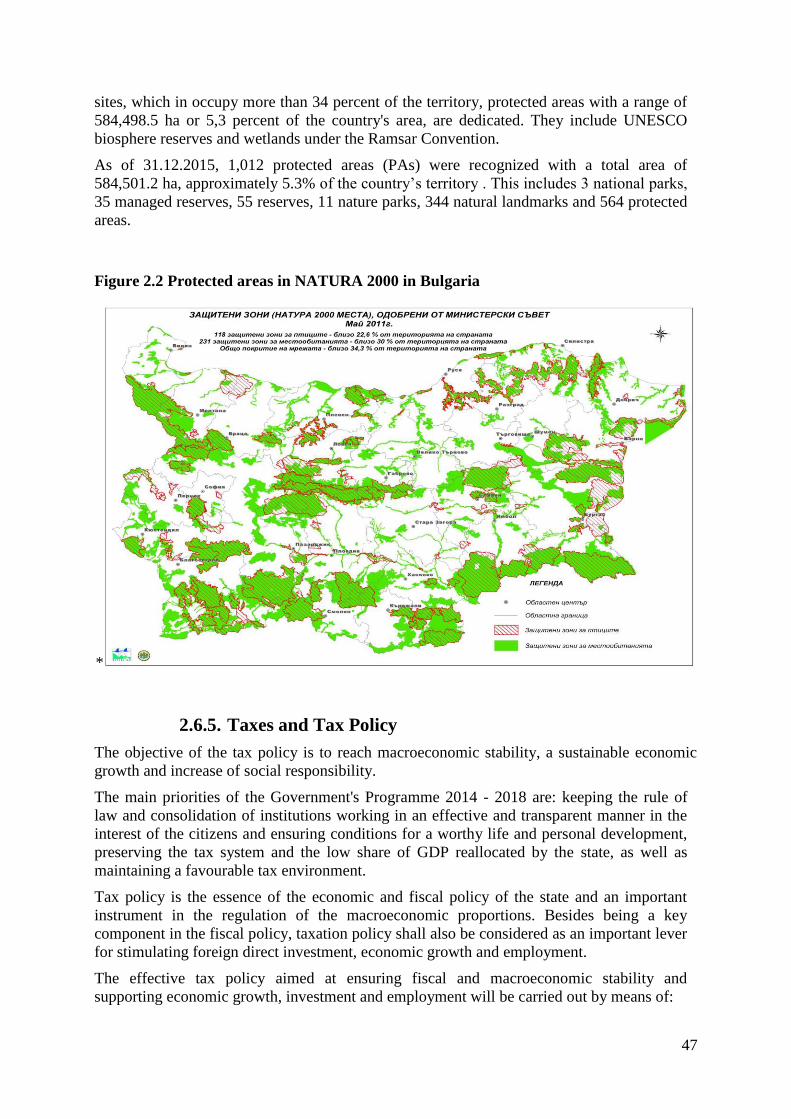
47
sites, which in occupy more than 34 percent of the territory, protected areas with a range of
584,498.5 ha or 5,3 percent of the country's area, are dedicated. They include UNESCO
biosphere reserves and wetlands under the Ramsar Convention.
As of 31.12.2015, 1,012 protected areas (PAs) were recognized with a total area of
584,501.2 ha, approximately 5.3% of the country’s territory . This includes 3 national parks,
35 managed reserves, 55 reserves, 11 nature parks, 344 natural landmarks and 564 protected
areas.
Figure 2.2 Protected areas in NATURA 2000 in Bulgaria
*
2.6.5. Taxes and Tax Policy
The objective of the tax policy is to reach macroeconomic stability, a sustainable economic
growth and increase of social responsibility.
The main priorities of the Government's Programme 2014 - 2018 are: keeping the rule of
law and consolidation of institutions working in an effective and transparent manner in the
interest of the citizens and ensuring conditions for a worthy life and personal development,
preserving the tax system and the low share of GDP reallocated by the state, as well as
maintaining a favourable tax environment.
Tax policy is the essence of the economic and fiscal policy of the state and an important
instrument in the regulation of the macroeconomic proportions. Besides being a key
component in the fiscal policy, taxation policy shall also be considered as an important lever
for stimulating foreign direct investment, economic growth and employment.
The effective tax policy aimed at ensuring fiscal and macroeconomic stability and
supporting economic growth, investment and employment will be carried out by means of:
48
• Making a comprehensive analysis of the taxation policy of the Republic of Bulgaria;
• Elaboration of a concept paper for a new effective model of tax policy and reforms relating
to tax relief in accordance with EU's state aid legislation in the 2014-2020 period;
• Making an assessment of the impact of the new tax policy model on budget revenues,
economic development, investment and employment;
• Holding a public debate on the country's overall tax policy;
• Making a roadmap for implementation of the new tax policy and reform model in the tax
system;
• Making an analysis of the tax system by types of taxes and structural elements;
• Reducing the administrative burden and expenses for businesses and citizens;
• Effective tax concessions urging investment, innovation and employment.
The Government's taxation policy is oriented towards decreasing the share of the shadow
economy and combating tax evasion and avoidance.
In Bulgaria income of any individual is subject to a flat income tax rate of 10% in
2015.
Exemptions are granted to taxpayers with specific types of income.
The standard rate of tax for a Bulgarian corporate tax in 2015 is 10%.
A special tax rate is applicable for companies dealing in shipping as well as companies
engaged in games of chance and gambling.
2.6.6. Energy and Industrial Profile
Energy Profile
Bulgaria covers more than 70% of its gross energy demand by imports. The dependency on
import of natural gas and crude oil is very high and has a traditional single origin - the
Russian Federation. The Russian natural gas is supplied by one route through the Ukraine.
Besides, our country relies completely on the import of nuclear fuel from Russia, although
nuclear energy, according to a Eurostat methodology, is considered as indigenous energy
source.
The prevailing quantity of heat is produced on the basis of natural gas and the risks for the
final consumers are much lower. The structure of the Final Energy Consumption (FEC) for
the Bulgarian economy predetermines a big share of secondary energies and necessity of
transformation of a significant quantity of energy resources and lost of energy resources in
the transformation processes.
Data on the structure of energy consumption in Bulgaria are given in Table 2.9 and Table
2.10.
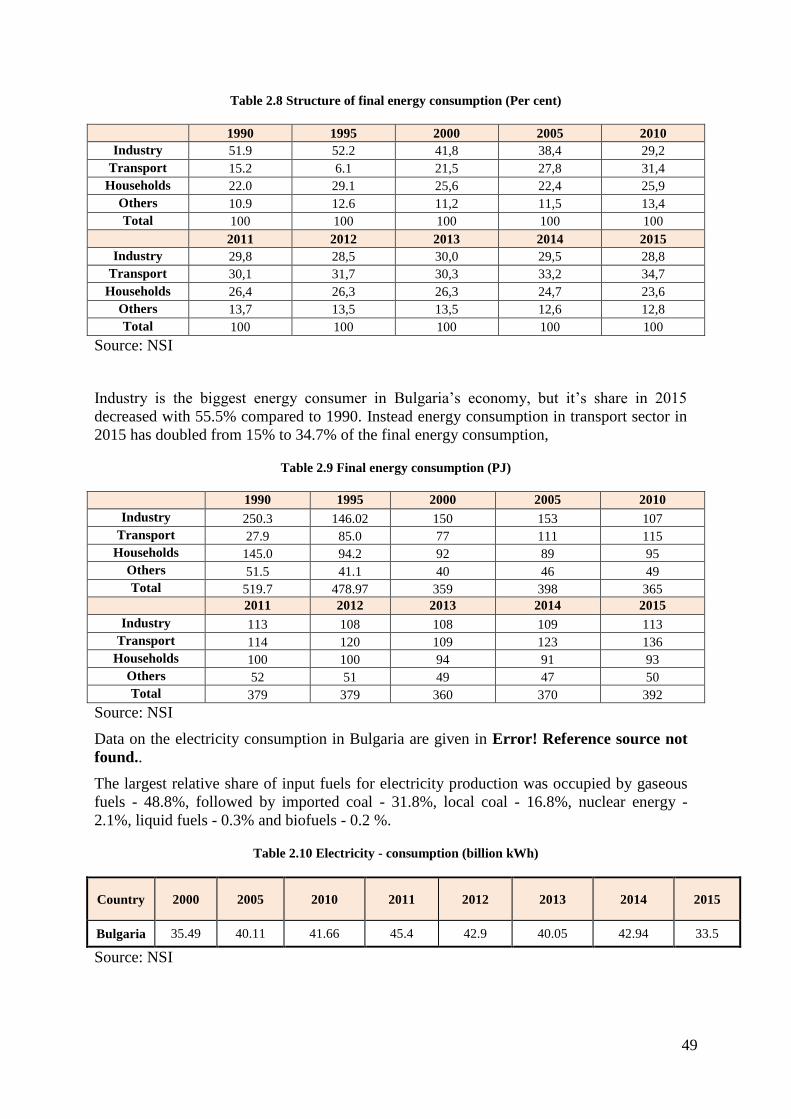
49
Table 2.8 Structure of final energy consumption (Per cent)
1990 1995 2000 2005 2010
Industry 51.9 52.2 41,8 38,4 29,2
Transport 15.2 6.1 21,5 27,8 31,4
Households 22.0 29.1 25,6 22,4 25,9
Others 10.9 12.6 11,2 11,5 13,4
Total 100 100 100 100 100
2011 2012 2013 2014 2015
Industry 29,8 28,5 30,0 29,5 28,8
Transport 30,1 31,7 30,3 33,2 34,7
Households 26,4 26,3 26,3 24,7 23,6
Others 13,7 13,5 13,5 12,6 12,8
Total 100 100 100 100 100
Source: NSI
Industry is the biggest energy consumer in Bulgaria’s economy, but it’s share in 2015
decreased with 55.5% compared to 1990. Instead energy consumption in transport sector in
2015 has doubled from 15% to 34.7% of the final energy consumption,
Table 2.9 Final energy consumption (PJ)
1990 1995 2000 2005 2010
Industry 250.3 146.02 150 153 107
Transport 27.9 85.0 77 111 115
Households 145.0 94.2 92 89 95
Others 51.5 41.1 40 46 49
Total 519.7 478.97 359 398 365
2011 2012 2013 2014 2015
Industry 113 108 108 109 113
Transport 114 120 109 123 136
Households 100 100 94 91 93
Others 52 51 49 47 50
Total 379 379 360 370 392
Source: NSI
Data on the electricity consumption in Bulgaria are given in Error! Reference source not
found..
The largest relative share of input fuels for electricity production was occupied by gaseous
fuels - 48.8%, followed by imported coal - 31.8%, local coal - 16.8%, nuclear energy -
2.1%, liquid fuels - 0.3% and biofuels - 0.2 %.
Table 2.10 Electricity - consumption (billion kWh)
Country 2000 2005 2010 2011 2012 2013 2014 2015
Bulgaria 35.49 40.11 41.66 45.4 42.9 40.05 42.94 33.5
Source: NSI
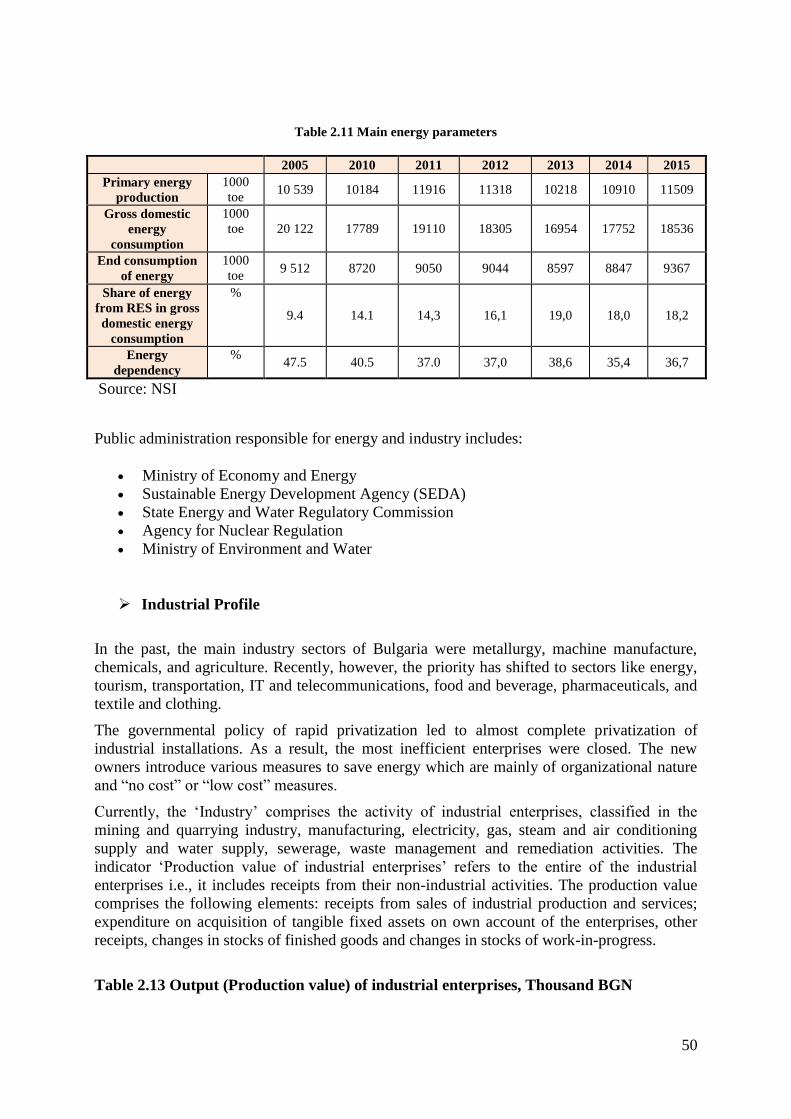
50
Table 2.11 Main energy parameters
2005 2010 2011 2012 2013 2014 2015
Primary energy
production
1000
toe 10 539 10184 11916 11318 10218 10910 11509
Gross domestic
energy
consumption
1000
toe 20 122 17789 19110 18305 16954 17752 18536
End consumption
of energy
1000
toe 9 512 8720 9050 9044 8597 8847 9367
Share of energy
from RES in gross
domestic energy
consumption
%
9.4 14.1 14,3 16,1 19,0 18,0 18,2
Energy
dependency
% 47.5 40.5 37.0 37,0 38,6 35,4 36,7
Source: NSI
Public administration responsible for energy and industry includes:
Ministry of Economy and Energy
Sustainable Energy Development Agency (SEDA)
State Energy and Water Regulatory Commission
Agency for Nuclear Regulation
Ministry of Environment and Water
Industrial Profile
In the past, the main industry sectors of Bulgaria were metallurgy, machine manufacture,
chemicals, and agriculture. Recently, however, the priority has shifted to sectors like energy,
tourism, transportation, IT and telecommunications, food and beverage, pharmaceuticals, and
textile and clothing.
The governmental policy of rapid privatization led to almost complete privatization of
industrial installations. As a result, the most inefficient enterprises were closed. The new
owners introduce various measures to save energy which are mainly of organizational nature
and “no cost” or “low cost” measures.
Currently, the ‘Industry’ comprises the activity of industrial enterprises, classified in the
mining and quarrying industry, manufacturing, electricity, gas, steam and air conditioning
supply and water supply, sewerage, waste management and remediation activities. The
indicator ‘Production value of industrial enterprises’ refers to the entire of the industrial
enterprises i.e., it includes receipts from their non-industrial activities. The production value
comprises the following elements: receipts from sales of industrial production and services;
expenditure on acquisition of tangible fixed assets on own account of the enterprises, other
receipts, changes in stocks of finished goods and changes in stocks of work-in-progress.
Table 2.13 Output (Production value) of industrial enterprises, Thousand BGN
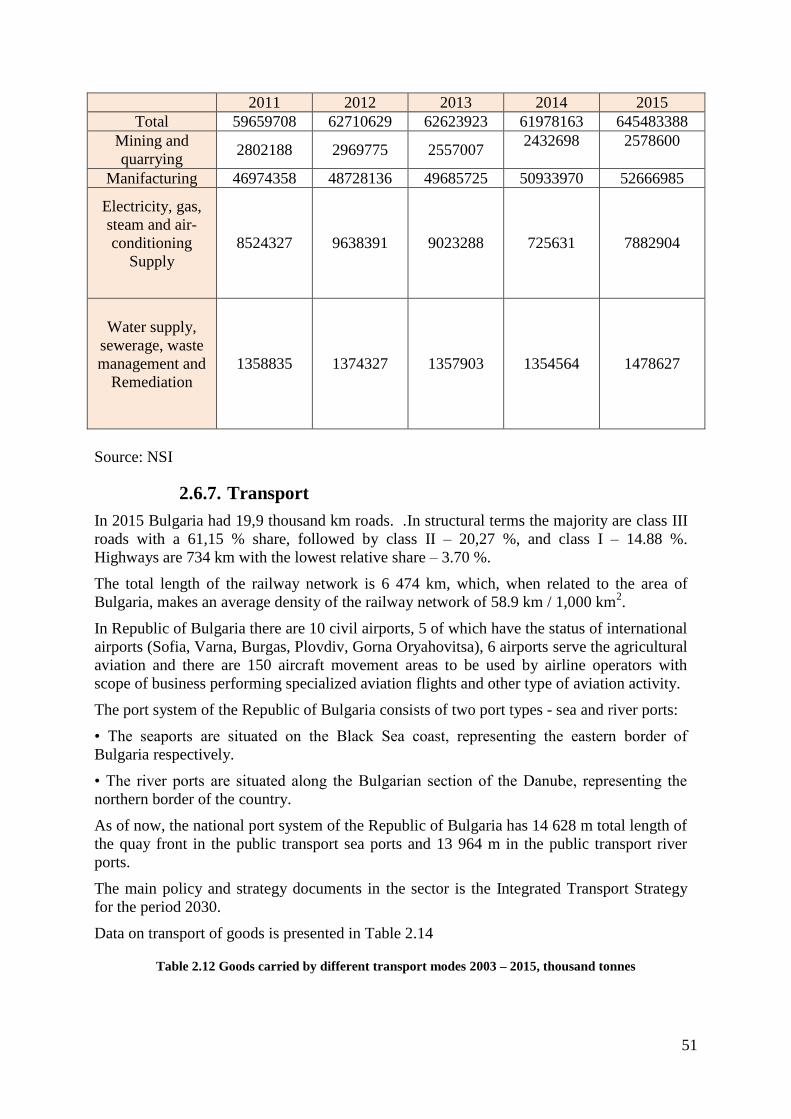
51
2011 2012 2013 2014 2015
Total 59659708 62710629 62623923 61978163 645483388
Mining and
quarrying 2802188 2969775 2557007
2432698
2578600
Manifacturing 46974358 48728136 49685725 50933970 52666985
Electricity, gas,
steam and air-
conditioning
Supply
8524327 9638391 9023288 725631 7882904
Water supply,
sewerage, waste
management and
Remediation
1358835 1374327 1357903 1354564 1478627
Source: NSI
2.6.7. Transport
In 2015 Bulgaria had 19,9 thousand km roads. .In structural terms the majority are class III
roads with a 61,15 % share, followed by class II – 20,27 %, and class I – 14.88 %.
Highways are 734 km with the lowest relative share – 3.70 %.
The total length of the railway network is 6 474 km, which, when related to the area of
Bulgaria, makes an average density of the railway network of 58.9 km / 1,000 km2.
In Republic of Bulgaria there are 10 civil airports, 5 of which have the status of international
airports (Sofia, Varna, Burgas, Plovdiv, Gorna Oryahovitsa), 6 airports serve the agricultural
aviation and there are 150 aircraft movement areas to be used by airline operators with
scope of business performing specialized aviation flights and other type of aviation activity.
The port system of the Republic of Bulgaria consists of two port types - sea and river ports:
• The seaports are situated on the Black Sea coast, representing the eastern border of
Bulgaria respectively.
• The river ports are situated along the Bulgarian section of the Danube, representing the
northern border of the country.
As of now, the national port system of the Republic of Bulgaria has 14 628 m total length of
the quay front in the public transport sea ports and 13 964 m in the public transport river
ports.
The main policy and strategy documents in the sector is the Integrated Transport Strategy
for the period 2030.
Data on transport of goods is presented in Table 2.14
Table 2.12 Goods carried by different transport modes 2003 – 2015, thousand tonnes
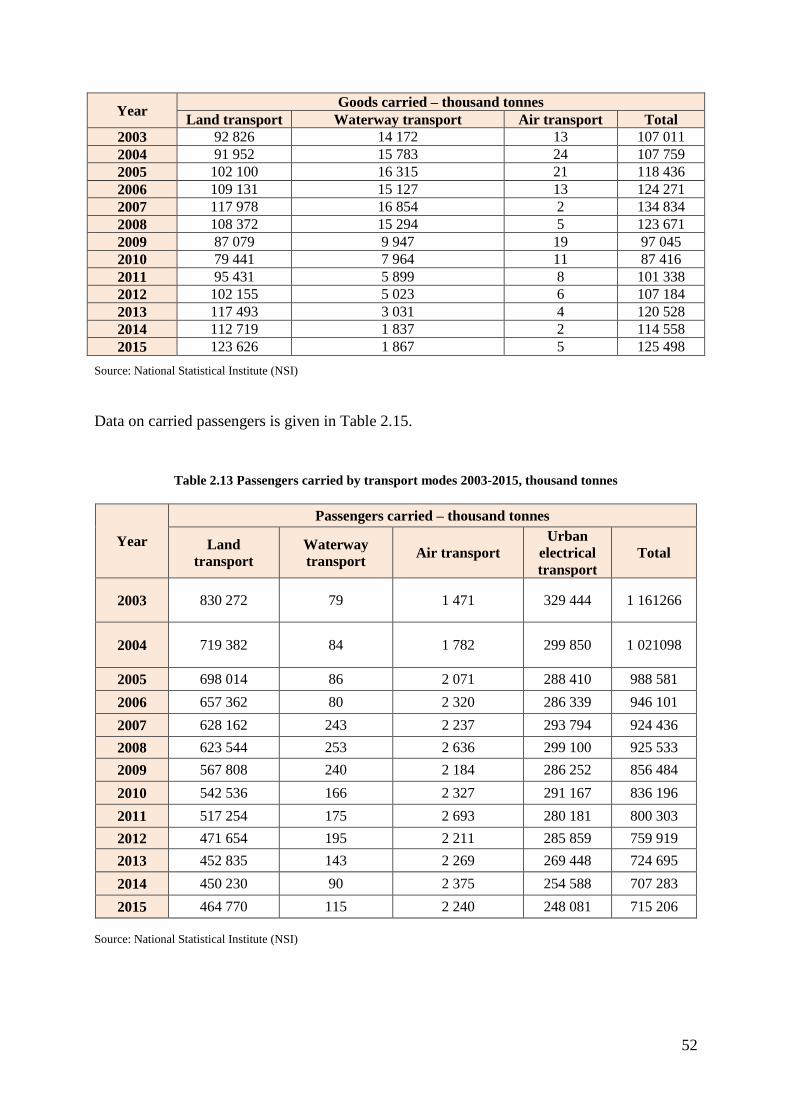
52
Year Goods carried – thousand tonnes
Land transport Waterway transport Air transport Total
2003 92 826 14 172 13 107 011
2004 91 952 15 783 24 107 759
2005 102 100 16 315 21 118 436
2006 109 131 15 127 13 124 271
2007 117 978 16 854 2 134 834
2008 108 372 15 294 5 123 671
2009 87 079 9 947 19 97 045
2010 79 441 7 964 11 87 416
2011 95 431 5 899 8 101 338
2012 102 155 5 023 6 107 184
2013 117 493 3 031 4 120 528
2014 112 719 1 837 2 114 558
2015 123 626 1 867 5 125 498
Source: National Statistical Institute (NSI)
Data on carried passengers is given in Table 2.15.
Table 2.13 Passengers carried by transport modes 2003-2015, thousand tonnes
Year
Passengers carried – thousand tonnes
Land
transport
Waterway
transport Air transport
Urban
electrical
transport
Total
2003 830 272 79 1 471 329 444 1 161266
2004 719 382 84 1 782 299 850 1 021098
2005 698 014 86 2 071 288 410 988 581
2006 657 362 80 2 320 286 339 946 101
2007 628 162 243 2 237 293 794 924 436
2008 623 544 253 2 636 299 100 925 533
2009 567 808 240 2 184 286 252 856 484
2010 542 536 166 2 327 291 167 836 196
2011 517 254 175 2 693 280 181 800 303
2012 471 654 195 2 211 285 859 759 919
2013 452 835 143 2 269 269 448 724 695
2014 450 230 90 2 375 254 588 707 283
2015 464 770 115 2 240 248 081 715 206
Source: National Statistical Institute (NSI)
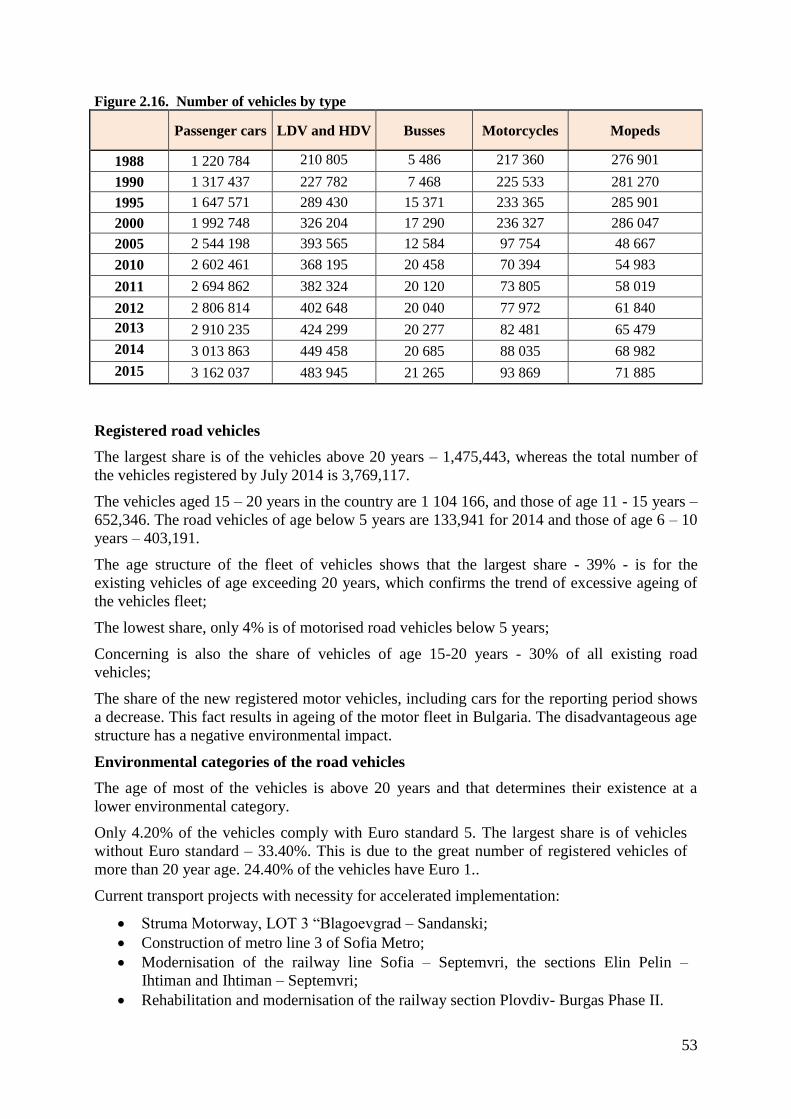
53
Figure 2.16. Number of vehicles by type
Passenger cars LDV and HDV Busses Motorcycles Mopeds
1988 1 220 784 210 805 5 486 217 360 276 901
1990 1 317 437 227 782 7 468 225 533 281 270
1995 1 647 571 289 430 15 371 233 365 285 901
2000 1 992 748 326 204 17 290 236 327 286 047
2005 2 544 198 393 565 12 584 97 754 48 667
2010 2 602 461 368 195 20 458 70 394 54 983
2011 2 694 862 382 324 20 120 73 805 58 019
2012 2 806 814 402 648 20 040 77 972 61 840
2013 2 910 235 424 299 20 277 82 481 65 479
2014 3 013 863 449 458 20 685 88 035 68 982
2015 3 162 037 483 945 21 265 93 869 71 885
Registered road vehicles
The largest share is of the vehicles above 20 years – 1,475,443, whereas the total number of
the vehicles registered by July 2014 is 3,769,117.
The vehicles aged 15 – 20 years in the country are 1 104 166, and those of age 11 - 15 years –
652,346. The road vehicles of age below 5 years are 133,941 for 2014 and those of age 6 – 10
years – 403,191.
The age structure of the fleet of vehicles shows that the largest share - 39% - is for the
existing vehicles of age exceeding 20 years, which confirms the trend of excessive ageing of
the vehicles fleet;
The lowest share, only 4% is of motorised road vehicles below 5 years;
Concerning is also the share of vehicles of age 15-20 years - 30% of all existing road
vehicles;
The share of the new registered motor vehicles, including cars for the reporting period shows
a decrease. This fact results in ageing of the motor fleet in Bulgaria. The disadvantageous age
structure has a negative environmental impact.
Environmental categories of the road vehicles
The age of most of the vehicles is above 20 years and that determines their existence at a
lower environmental category.
Only 4.20% of the vehicles comply with Euro standard 5. The largest share is of vehicles
without Euro standard – 33.40%. This is due to the great number of registered vehicles of
more than 20 year age. 24.40% of the vehicles have Euro 1..
Current transport projects with necessity for accelerated implementation:
Struma Motorway, LOT 3 “Blagoevgrad – Sandanski;
Construction of metro line 3 of Sofia Metro;
Modernisation of the railway line Sofia – Septemvri, the sections Elin Pelin –
Ihtiman and Ihtiman – Septemvri;
Rehabilitation and modernisation of the railway section Plovdiv- Burgas Phase II.
54
Transport generates effects with negative impact on the environment and people by
emissions of pollutants and greenhouse gases. The limitation thereof is an element of the
sustainable development of the transport system. The key indicators for the assessment of
the negative impact of transport on the environment and human health are the energy
consumption, emissions of pollutants (ozone precursors, unsyav, acidifying substances and
precursors of PM10) and greenhouse gases.
2.6.8. Waste
After the global economic and political change and regime change of government in our
country start to lay the groundwork for approval of plans and strategies outlining guidelines
on sustainable management.
At the beginning of the nineties years in the country began to develop practices for separate
collection of household waste and their subsequent recycling.
During the last couple of years the measures in national legislation aimed at decreasing CH4
emissions from landfills - limiting the disposal of municipal waste, measures for closure and
rehabilitation of municipal landfills with terminated operation; coverage of all household
waste in a managed system of waste treatment, including all waste to be disposed of in
managed landfills and capturing, utilizing or flaring of landfill gas.
New waste management law 2012 - separate bio-waste collection (yards, park and
garden wastes, green wastes must be treated via composting or anaerobic digestion);
reducing the amount of biodegradable waste, sent to landfills).
National strategic plan for diversion of biodegradable waste going to landfills (2010-
2020)
National strategic plan on sewage sludge management (2012-2020)
Ordinance for the treatment of bio-waste and separate bio-waste collection (2016)
Third National Action Plan on Climate Change (2013-2020)
National Waste Management Plan (2014-2020)
Bulgarian legislation introduce the specific quantitative targets for separate collection,
recycling and recovery of municipal bio waste as well as targets for diverting biodegradable
municipal waste from landfills. The provisions of the Waste Management Act require that
by 31 December 2020 there shall be limiting the amount of biodegradable municipal waste
to 35 percent of the total of those wastes in the Republic of Bulgaria in 1995. This is
compliant with the requirements of the European directive on the landfill of waste.
The effect of the legislative measures will be visible in the future. Currently, some positive
tendencies are observing, concerning SWD on the managed and unmanaged disposal sites.
Since 2000 the share of population, land filling on unmanaged sites decreases and the share
of population, which dispose of wastes on managed sites is increasing.
The landfills are classified as managed and unmanaged (see below: Activity data).
As the main criteria for whether landfills are managed and unmanaged, is considered the
fact if the landfills meet the requirements laid down in EU Directive 1999/31/EC on the
landfill of waste.
Landfilling as a method of waste disposal still holds the biggest share in the management of
municipal waste, but there is a steady decline in this indicator in recent years (the percentage
55
of waste disposed in landfills drop from 95% in 1990 to 66% in 2015). Recyclable waste
collection, which was a scarce practice at the beginning of the nineties, has been increased.
In 2013, legislation on bio-waste management was promulgated, which combined with the
existing economic instruments as well as the introduced in 2011 landfill tax per ton led to
the present positive trends.
The total amount of municipal waste generated in Bulgaria in 2015 is 3 011 kt which is in
average 1.15 kg per capita. The total amount of municipal waste generated in the country is
following a positive trend towards permanent decrease.
The amounts of separately collected fractions from municipal waste are gradually
increasing. Since 2009, collection schemes have been improved for management of six
special waste categories - packaging waste, waste oils, end-of-life vehicles, waste electrical
and electronic equipment, waste tires, batteries and accumulators. This resulted in increased
quantities of collection and recovery of those waste streams and decrease in per capita waste
generation. Bulgaria is among the member-states with close to the average level of recycling
in recent years.
In the country exist regional systems for waste management where before land filling the
waste is subjected to pre-treatment (separation) as recyclable fractions such as paper and
cardboard, metals, glass, plastics and wood are sent to recycling facilities. This practice
reduces the amount of waste which going to landfills, additionally development of
composting activities concerning the decreased land filled degradable fraction of MSW.
The emissions from SWDS are emitted from MSW (including AMSW-assimilated
municipal solid waste and sludge from wastewater treatment plant) which are landfilled.
MSW are disposed of on managed and unmanaged disposal sites as from 2000 the share of
population, landfilling waste on unmanaged is decreasing and the share of population,
landfilling on managed MSW sites is increasing.
Generally the number of MSW disposal sites in the country is decreasing gradually since
2000 and after 2010 this tendency is increasing which is in line with national legislation.
Sludge from wastewater treatment plants has also been considered, because it can be
disposed of at the same landfills as municipal solid waste, once it meets a specific
requirements. The fraction of sludge, disposed at ladfill sites has been estimated to be 17.9
Gg in 2004 (extrapolated value) decreasing to 8.53 Gg in 2015.
On the basis of its characteristics, sludge from wastewater treatment plants is also used in
agriculture, in compost production with red Californian worms, landfilled or temporarily
stored on special platforms.
Information about sludge is available from 2005 (Regulation EC No 2150/2002 on waste
statistics).
Data are collected by NSI from public water supply companies, dealing with water
collection, treatment, water supply and wastewater collection, discharge and treatment
(water supply companies/urban wastewater treatment plants operators and irrigation
systems).
Another source of information is Executive Environment Agency through National
legislation (Ordinance on the way of recovery of sludge from wastewater treatment through
its use in agriculture; Оrdinance No 1 on the procedures and forms for providing
information about waste management activities and the procedure for keeping public
records).
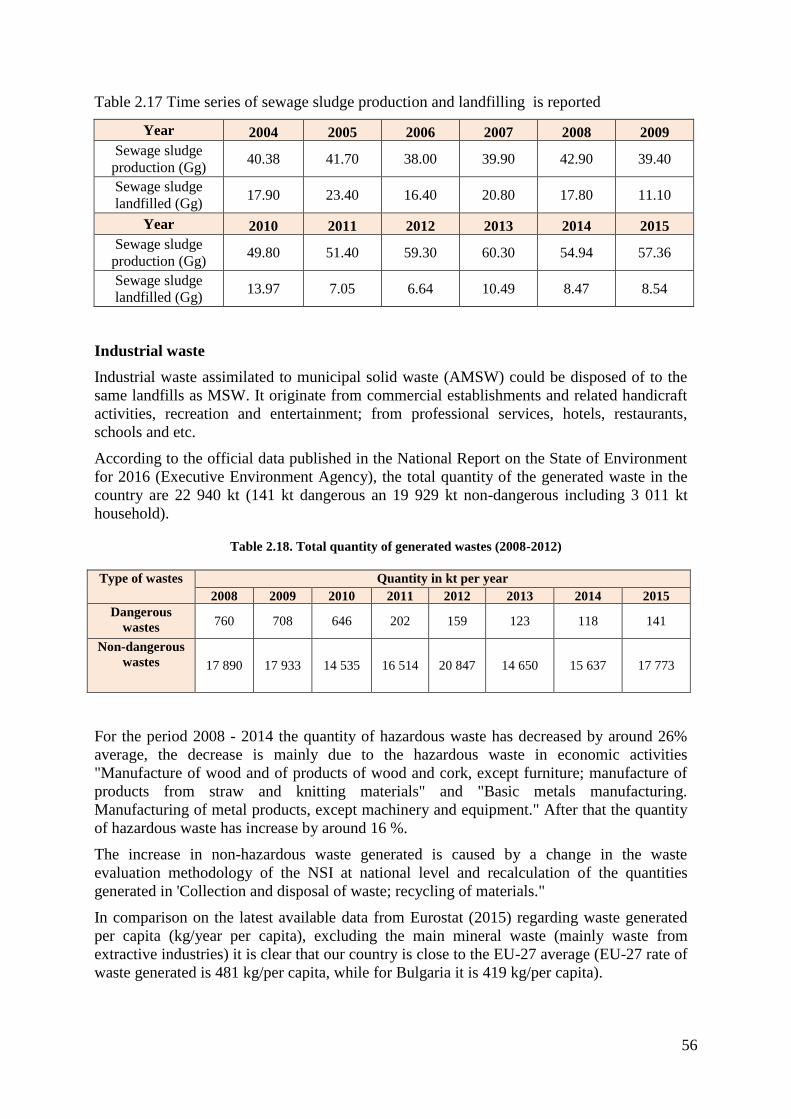
56
Table 2.17 Time series of sewage sludge production and landfilling is reported
Year 2004 2005 2006 2007 2008 2009
Sewage sludge
production (Gg) 40.38 41.70 38.00 39.90 42.90 39.40
Sewage sludge
landfilled (Gg) 17.90 23.40 16.40 20.80 17.80 11.10
Year 2010 2011 2012 2013 2014 2015
Sewage sludge
production (Gg) 49.80 51.40 59.30 60.30 54.94 57.36
Sewage sludge
landfilled (Gg) 13.97 7.05 6.64 10.49 8.47 8.54
Industrial waste
Industrial waste assimilated to municipal solid waste (AMSW) could be disposed of to the
same landfills as MSW. It originate from commercial establishments and related handicraft
activities, recreation and entertainment; from professional services, hotels, restaurants,
schools and etc.
According to the official data published in the National Report on the State of Environment
for 2016 (Executive Environment Agency), the total quantity of the generated waste in the
country are 22 940 kt (141 kt dangerous an 19 929 kt non-dangerous including 3 011 kt
household).
Table 2.18. Total quantity of generated wastes (2008-2012)
Type of wastes Quantity in kt per year
2008 2009 2010 2011 2012 2013 2014 2015
Dangerous
wastes 760 708 646 202 159 123 118 141
Non-dangerous
wastes 17 890 17 933 14 535 16 514 20 847 14 650 15 637 17 773
For the period 2008 - 2014 the quantity of hazardous waste has decreased by around 26%
average, the decrease is mainly due to the hazardous waste in economic activities
"Manufacture of wood and of products of wood and cork, except furniture; manufacture of
products from straw and knitting materials" and "Basic metals manufacturing.
Manufacturing of metal products, except machinery and equipment." After that the quantity
of hazardous waste has increase by around 16 %.
The increase in non-hazardous waste generated is caused by a change in the waste
evaluation methodology of the NSI at national level and recalculation of the quantities
generated in 'Collection and disposal of waste; recycling of materials."
In comparison on the latest available data from Eurostat (2015) regarding waste generated
per capita (kg/year per capita), excluding the main mineral waste (mainly waste from
extractive industries) it is clear that our country is close to the EU-27 average (EU-27 rate of
waste generated is 481 kg/per capita, while for Bulgaria it is 419 kg/per capita).
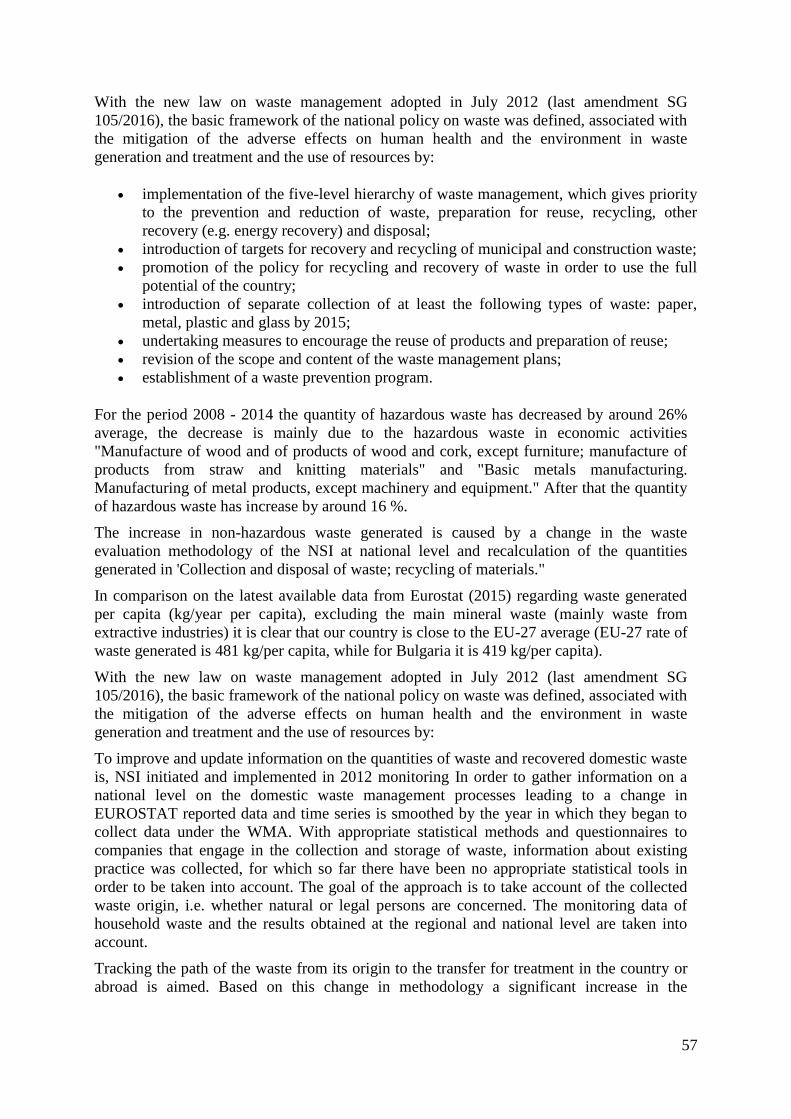
57
With the new law on waste management adopted in July 2012 (last amendment SG
105/2016), the basic framework of the national policy on waste was defined, associated with
the mitigation of the adverse effects on human health and the environment in waste
generation and treatment and the use of resources by:
implementation of the five-level hierarchy of waste management, which gives priority
to the prevention and reduction of waste, preparation for reuse, recycling, other
recovery (e.g. energy recovery) and disposal;
introduction of targets for recovery and recycling of municipal and construction waste;
promotion of the policy for recycling and recovery of waste in order to use the full
potential of the country;
introduction of separate collection of at least the following types of waste: paper,
metal, plastic and glass by 2015;
undertaking measures to encourage the reuse of products and preparation of reuse;
revision of the scope and content of the waste management plans;
establishment of a waste prevention program.
For the period 2008 - 2014 the quantity of hazardous waste has decreased by around 26%
average, the decrease is mainly due to the hazardous waste in economic activities
"Manufacture of wood and of products of wood and cork, except furniture; manufacture of
products from straw and knitting materials" and "Basic metals manufacturing.
Manufacturing of metal products, except machinery and equipment." After that the quantity
of hazardous waste has increase by around 16 %.
The increase in non-hazardous waste generated is caused by a change in the waste
evaluation methodology of the NSI at national level and recalculation of the quantities
generated in 'Collection and disposal of waste; recycling of materials."
In comparison on the latest available data from Eurostat (2015) regarding waste generated
per capita (kg/year per capita), excluding the main mineral waste (mainly waste from
extractive industries) it is clear that our country is close to the EU-27 average (EU-27 rate of
waste generated is 481 kg/per capita, while for Bulgaria it is 419 kg/per capita).
With the new law on waste management adopted in July 2012 (last amendment SG
105/2016), the basic framework of the national policy on waste was defined, associated with
the mitigation of the adverse effects on human health and the environment in waste
generation and treatment and the use of resources by:
To improve and update information on the quantities of waste and recovered domestic waste
is, NSI initiated and implemented in 2012 monitoring In order to gather information on a
national level on the domestic waste management processes leading to a change in
EUROSTAT reported data and time series is smoothed by the year in which they began to
collect data under the WMA. With appropriate statistical methods and questionnaires to
companies that engage in the collection and storage of waste, information about existing
practice was collected, for which so far there have been no appropriate statistical tools in
order to be taken into account. The goal of the approach is to take account of the collected
waste origin, i.e. whether natural or legal persons are concerned. The monitoring data of
household waste and the results obtained at the regional and national level are taken into
account.
Tracking the path of the waste from its origin to the transfer for treatment in the country or
abroad is aimed. Based on this change in methodology a significant increase in the
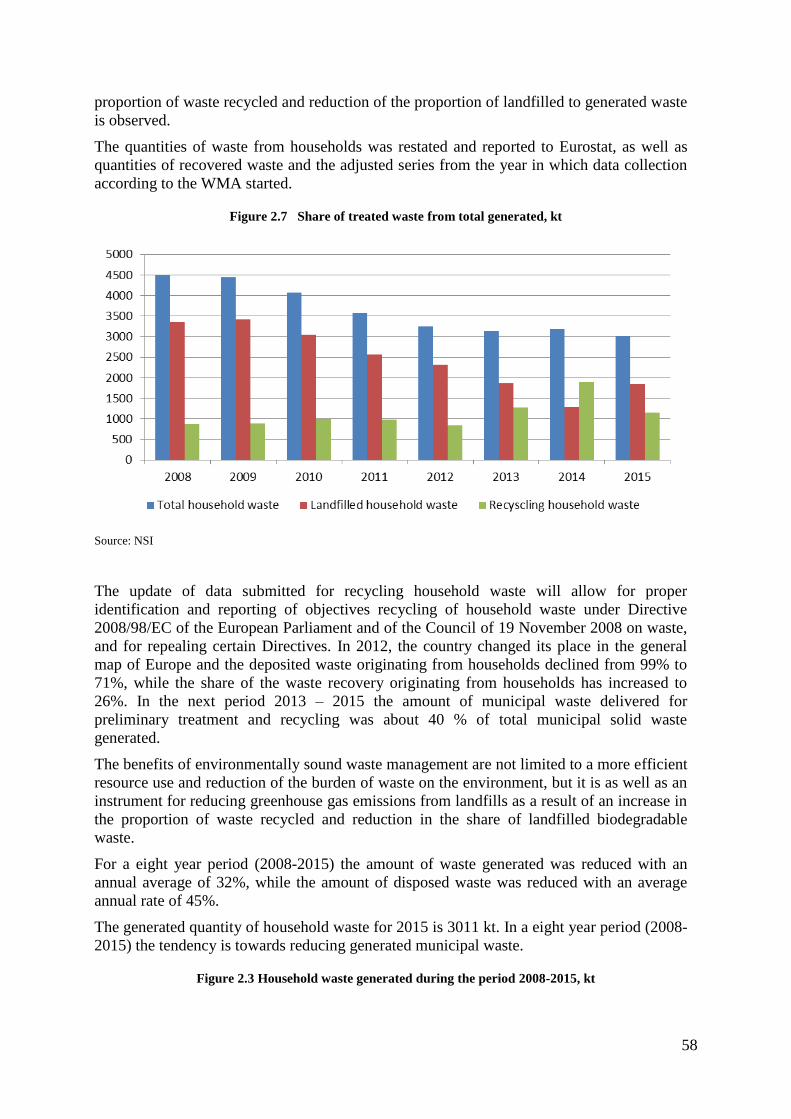
58
proportion of waste recycled and reduction of the proportion of landfilled to generated waste
is observed.
The quantities of waste from households was restated and reported to Eurostat, as well as
quantities of recovered waste and the adjusted series from the year in which data collection
according to the WMA started.
Figure 2.7 Share of treated waste from total generated, kt
Source: NSI
The update of data submitted for recycling household waste will allow for proper
identification and reporting of objectives recycling of household waste under Directive
2008/98/EC of the European Parliament and of the Council of 19 November 2008 on waste,
and for repealing certain Directives. In 2012, the country changed its place in the general
map of Europe and the deposited waste originating from households declined from 99% to
71%, while the share of the waste recovery originating from households has increased to
26%. In the next period 2013 – 2015 the amount of municipal waste delivered for
preliminary treatment and recycling was about 40 % of total municipal solid waste
generated.
The benefits of environmentally sound waste management are not limited to a more efficient
resource use and reduction of the burden of waste on the environment, but it is as well as an
instrument for reducing greenhouse gas emissions from landfills as a result of an increase in
the proportion of waste recycled and reduction in the share of landfilled biodegradable
waste.
For a eight year period (2008-2015) the amount of waste generated was reduced with an
annual average of 32%, while the amount of disposed waste was reduced with an average
annual rate of 45%.
The generated quantity of household waste for 2015 is 3011 kt. In a eight year period (2008-
2015) the tendency is towards reducing generated municipal waste.
Figure 2.3 Household waste generated during the period 2008-2015, kt
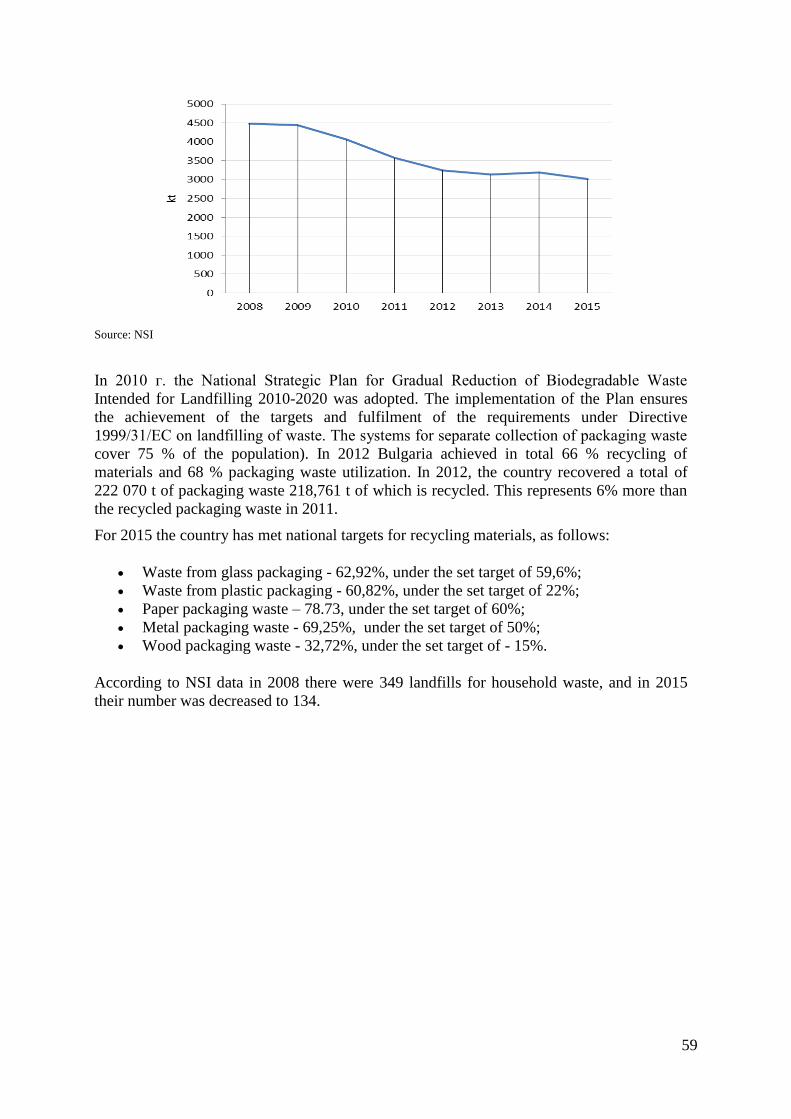
59
Source: NSI
In 2010 г. the National Strategic Plan for Gradual Reduction of Biodegradable Waste
Intended for Landfilling 2010-2020 was adopted. The implementation of the Plan ensures
the achievement of the targets and fulfilment of the requirements under Directive
1999/31/ЕС on landfilling of waste. The systems for separate collection of packaging waste
cover 75 % of the population). In 2012 Bulgaria achieved in total 66 % recycling of
materials and 68 % packaging waste utilization. In 2012, the country recovered a total of
222 070 t of packaging waste 218,761 t of which is recycled. This represents 6% more than
the recycled packaging waste in 2011.
For 2015 the country has met national targets for recycling materials, as follows:
Waste from glass packaging - 62,92%, under the set target of 59,6%;
Waste from plastic packaging - 60,82%, under the set target of 22%;
Paper packaging waste – 78.73, under the set target of 60%;
Metal packaging waste - 69,25%, under the set target of 50%;
Wood packaging waste - 32,72%, under the set target of - 15%.
According to NSI data in 2008 there were 349 landfills for household waste, and in 2015
their number was decreased to 134.
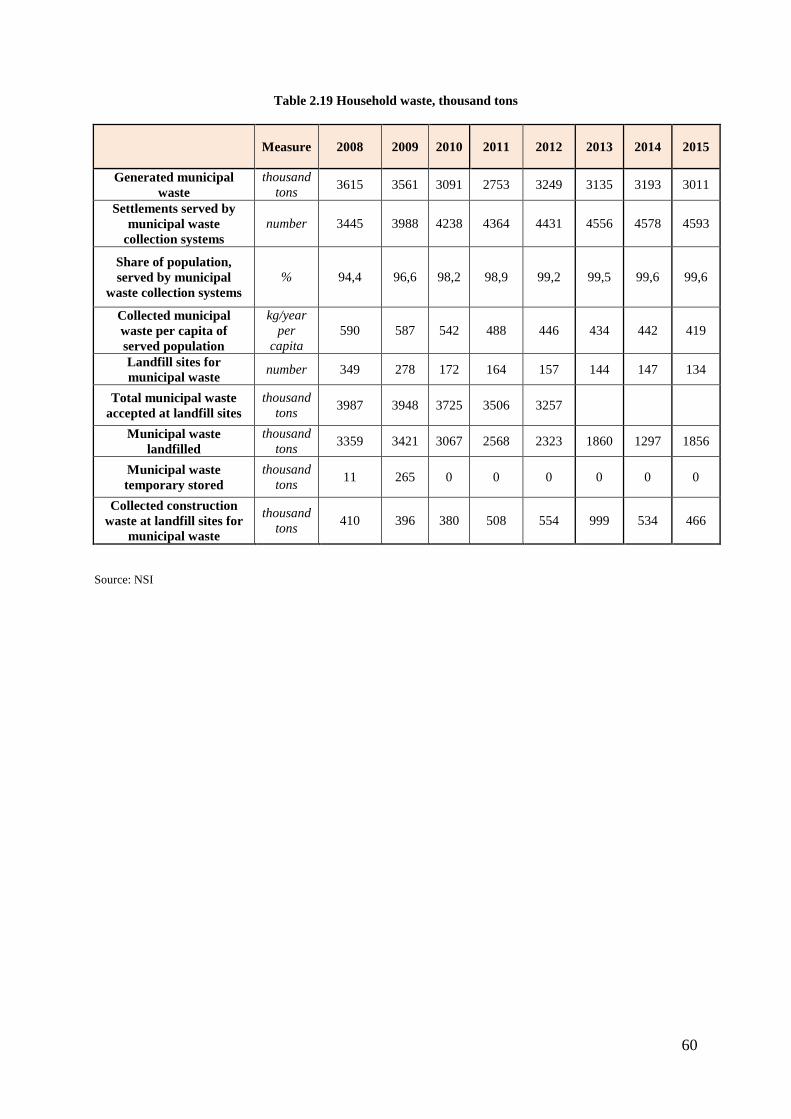
60
Table 2.19 Household waste, thousand tons
Measure 2008 2009 2010 2011 2012 2013 2014 2015
Generated municipal
waste
thousand
tons 3615 3561 3091 2753 3249 3135 3193 3011
Settlements served by
municipal waste
collection systems
number 3445 3988 4238 4364 4431 4556 4578 4593
Share of population,
served by municipal
waste collection systems
% 94,4 96,6 98,2 98,9 99,2 99,5 99,6 99,6
Collected municipal
waste per capita of
served population
kg/year
per
capita
590 587 542 488 446 434 442 419
Landfill sites for
municipal waste number 349 278 172 164 157 144 147 134
Total municipal waste
accepted at landfill sites
thousand
tons 3987 3948 3725 3506 3257
Municipal waste
landfilled
thousand
tons 3359 3421 3067 2568 2323 1860 1297 1856
Municipal waste
temporary stored
thousand
tons 11 265 0 0 0 0 0 0
Collected construction
waste at landfill sites for
municipal waste
thousand
tons 410 396 380 508 554 999 534 466
Source: NSI
61
3. Greenhouse gas inventory information
3.1. Introduction
This chapter presents information about the National Inventory System and greenhouse
gases emissions trends for the period 1988-2015 in Bulgaria. The source of information is
the National Inventory Report 2017, prepared by the Executive Environmental Agency.
The annual inventory and reporting of greenhouse gas emissions and removals provide an
information base for the planning and monitoring of climate policy. The Kyoto Protocol
obliges its parties to establish a national greenhouse gas inventory system by the end of
2006. Bulgaria’s National Greenhouse Gas Inventory System was set up at the beginning of
2007.
The national system produces data and background information on emissions and removals
for the UNFCCC, the Kyoto Protocol and the EU Commission. In addition, the scope of the
system covers the archiving of the data used in emission estimations, the publishing of the
results, participation in inventory reviews and the quality management of the inventory.
The National Inventory Report (NIR) of Bulgaria for the 2017 submission to the EU, the
UNFCCC and the Kyoto Protocol includes data of the anthropogenic emissions by sources
and removals by sinks of all greenhouse gases (GHGs) not controlled by the Montreal
Protocol, i.e. carbon dioxide (CO2), methane (CH4), nitrous oxide (N2O), perfluorocarbons
(PFCs), hydrofluorocarbons (HFCs), nitrogen trifluoride (NF3) and sulphur hexafluoride
(SF6).
Each of these gases has a different warming effect. As an example, the gases HFCs, PFCs,
NF3 and SF6 (so called F-gases) have much greater warming effect, in some cases over one
hundred times, compared to methane (25), nitrous oxide (298) and carbon dioxide (1).
Because of that, a common assessment criterion for the effect of each GHG on the
atmosphere warming should be introduced. This criterion is the so-called Global Warming
Potential (GWP), representing GHG emissions as CO2-eq. emissions. It allows totalling the
effect of all GHGs, adjusted to a common base.
For defining of GWP, the Parties to the Convention and Kyoto Protocol accept values, over
a time horizon of 100 years, as mentioned in the IPCC Fourth Assessment Report of 2007.
As an Annex I Party to the Convention, Bulgaria reports annually its GHG inventory
emissions from the base year to the year proceeding the year of reporting.
Annex I Parties to the KP should report also additional elements as assigned amount
information, changes in national system, changes in national registry and voluntary
submission of information relating to activities under Articles 3, paragraphs 3 and 4, of the
Kyoto Protocol.
3.2. Background information on supplementary information required
under Article 7, paragraph 1, of the Kyoto Protocol and
international agreements
Bulgaria has made a commitment to follow the United Nations Framework Convention on
Climate Change that entered into force on 21 March 1994. The Kyoto Protocol negotiated in
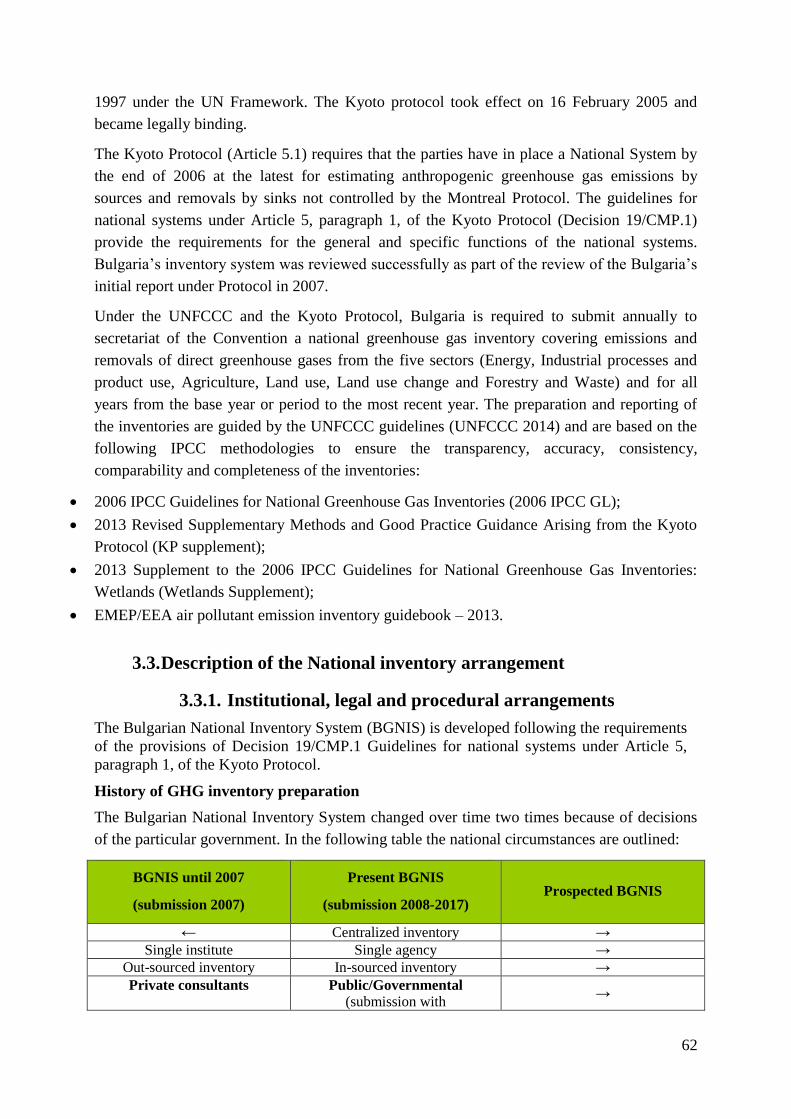
62
1997 under the UN Framework. The Kyoto protocol took effect on 16 February 2005 and
became legally binding.
The Kyoto Protocol (Article 5.1) requires that the parties have in place a National System by
the end of 2006 at the latest for estimating anthropogenic greenhouse gas emissions by
sources and removals by sinks not controlled by the Montreal Protocol. The guidelines for
national systems under Article 5, paragraph 1, of the Kyoto Protocol (Decision 19/CMP.1)
provide the requirements for the general and specific functions of the national systems.
Bulgaria’s inventory system was reviewed successfully as part of the review of the Bulgaria’s
initial report under Protocol in 2007.
Under the UNFCCC and the Kyoto Protocol, Bulgaria is required to submit annually to
secretariat of the Convention a national greenhouse gas inventory covering emissions and
removals of direct greenhouse gases from the five sectors (Energy, Industrial processes and
product use, Agriculture, Land use, Land use change and Forestry and Waste) and for all
years from the base year or period to the most recent year. The preparation and reporting of
the inventories are guided by the UNFCCC guidelines (UNFCCC 2014) and are based on the
following IPCC methodologies to ensure the transparency, accuracy, consistency,
comparability and completeness of the inventories:
2006 IPCC Guidelines for National Greenhouse Gas Inventories (2006 IPCC GL);
2013 Revised Supplementary Methods and Good Practice Guidance Arising from the Kyoto
Protocol (KP supplement);
2013 Supplement to the 2006 IPCC Guidelines for National Greenhouse Gas Inventories:
Wetlands (Wetlands Supplement);
EMEP/EEA air pollutant emission inventory guidebook – 2013.
3.3. Description of the National inventory arrangement
3.3.1. Institutional, legal and procedural arrangements
The Bulgarian National Inventory System (BGNIS) is developed following the requirements
of the provisions of Decision 19/CMP.1 Guidelines for national systems under Article 5,
paragraph 1, of the Kyoto Protocol.
History of GHG inventory preparation
The Bulgarian National Inventory System changed over time two times because of decisions
of the particular government. In the following table the national circumstances are outlined:
BGNIS until 2007
(submission 2007)
Present BGNIS
(submission 2008-2017) Prospected BGNIS
← Centralized inventory →
Single institute Single agency →
Out-sourced inventory In-sourced inventory →
Private consultants Public/Governmental
(submission with →
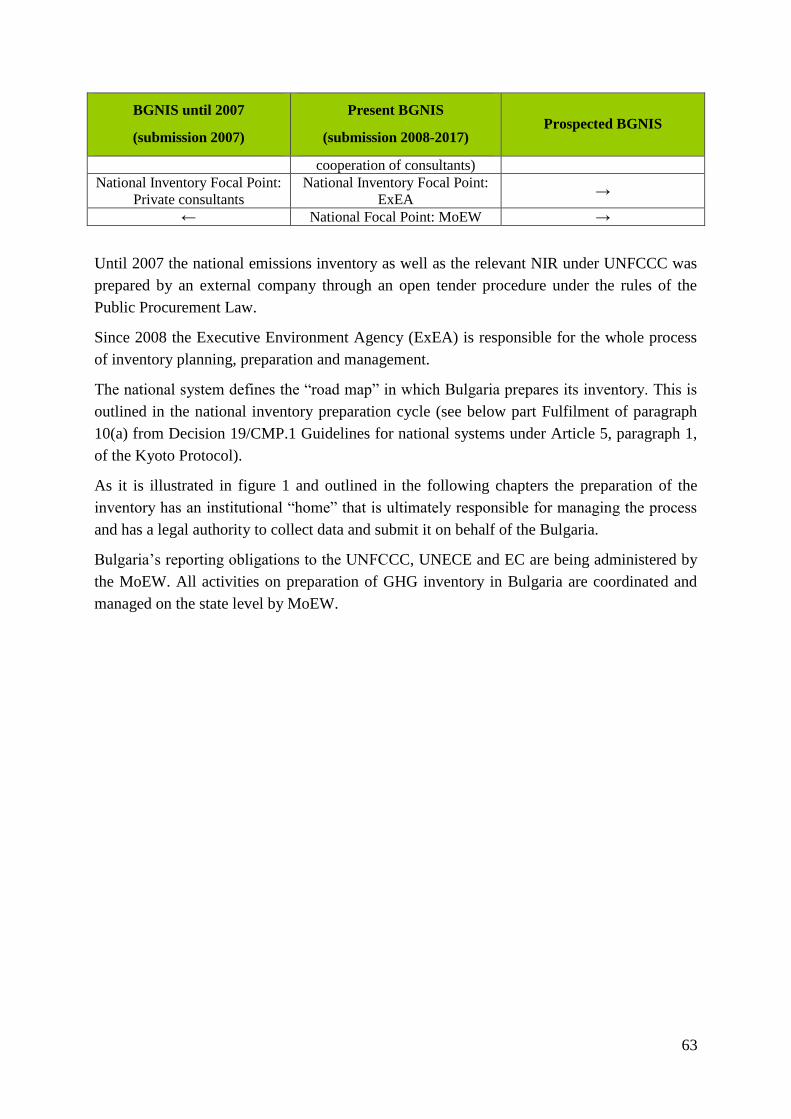
63
BGNIS until 2007
(submission 2007)
Present BGNIS
(submission 2008-2017) Prospected BGNIS
cooperation of consultants)
National Inventory Focal Point:
Private consultants
National Inventory Focal Point:
ExEA →
← National Focal Point: MoEW →
Until 2007 the national emissions inventory as well as the relevant NIR under UNFCCC was
prepared by an external company through an open tender procedure under the rules of the
Public Procurement Law.
Since 2008 the Executive Environment Agency (ExEA) is responsible for the whole process
of inventory planning, preparation and management.
The national system defines the “road map” in which Bulgaria prepares its inventory. This is
outlined in the national inventory preparation cycle (see below part Fulfilment of paragraph
10(a) from Decision 19/CMP.1 Guidelines for national systems under Article 5, paragraph 1,
of the Kyoto Protocol).
As it is illustrated in figure 1 and outlined in the following chapters the preparation of the
inventory has an institutional “home” that is ultimately responsible for managing the process
and has a legal authority to collect data and submit it on behalf of the Bulgaria.
Bulgaria’s reporting obligations to the UNFCCC, UNECE and EC are being administered by
the MoEW. All activities on preparation of GHG inventory in Bulgaria are coordinated and
managed on the state level by MoEW.
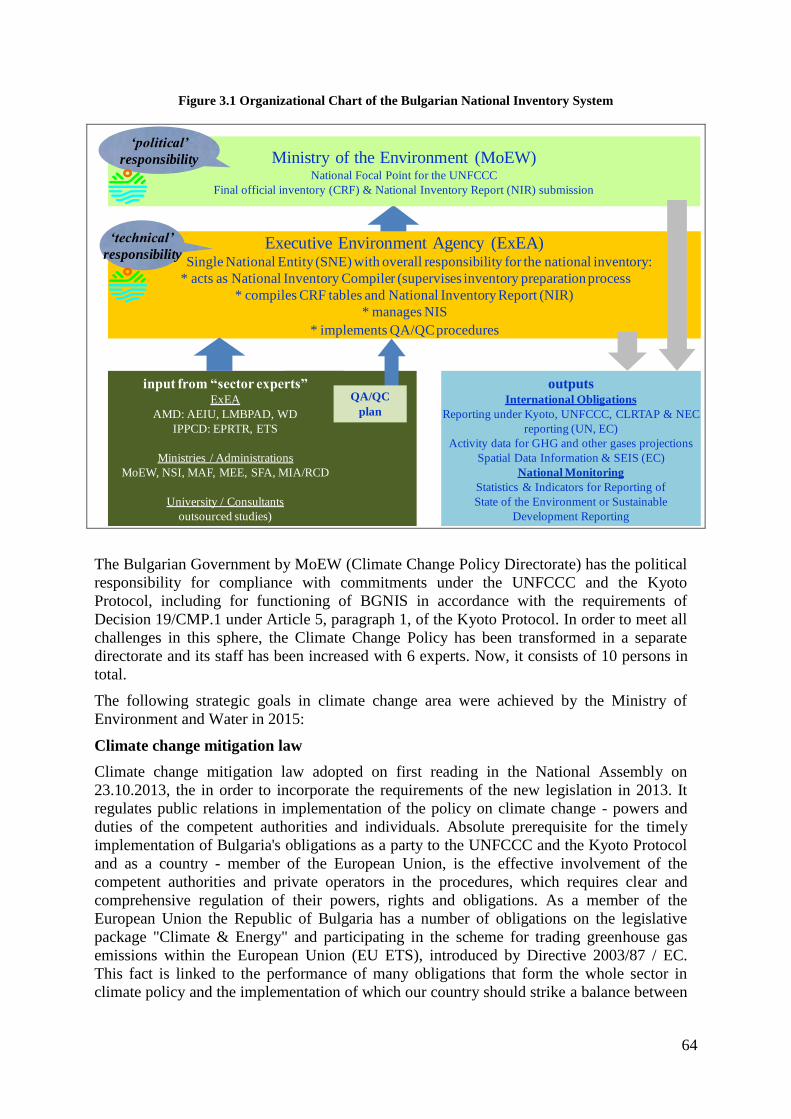
64
Figure 3.1 Organizational Chart of the Bulgarian National Inventory System
Ministry of the Environment (MoEW)National Focal Point for the UNFCCC
Final official inventory (CRF) & National Inventory Report (NIR) submission
Executive Environment Agency (ExEA)Single National Entity (SNE) with overall responsibility for the national inventory:
* acts as National Inventory Compiler (supervises inventory preparation process
* compiles CRF tables and National Inventory Report (NIR)
* manages NIS
* implements QA/QC procedures
input from “sector experts”ExEA
AMD: AEIU, LMBPAD, WD
IPPCD: EPRTR, ETS
Ministries / Administrations
MoEW, NSI, MAF, MEE, SFA, MIA/RCD
University / Consultants
outsourced studies)
outputsInternational Obligations
Reporting under Kyoto, UNFCCC, CLRTAP & NEC
reporting (UN, EC)
Activity data for GHG and other gases projections
Spatial Data Information & SEIS (EC)
National Monitoring
Statistics & Indicators for Reporting of
State of the Environment or Sustainable
Development Reporting
QA/QC
plan
‘political’
responsibility
‘technical’
responsibility
The Bulgarian Government by MoEW (Climate Change Policy Directorate) has the political
responsibility for compliance with commitments under the UNFCCC and the Kyoto
Protocol, including for functioning of BGNIS in accordance with the requirements of
Decision 19/CMP.1 under Article 5, paragraph 1, of the Kyoto Protocol. In order to meet all
challenges in this sphere, the Climate Change Policy has been transformed in a separate
directorate and its staff has been increased with 6 experts. Now, it consists of 10 persons in
total.
The following strategic goals in climate change area were achieved by the Ministry of
Environment and Water in 2015:
Climate change mitigation law
Climate change mitigation law adopted on first reading in the National Assembly on
23.10.2013, the in order to incorporate the requirements of the new legislation in 2013. It
regulates public relations in implementation of the policy on climate change - powers and
duties of the competent authorities and individuals. Absolute prerequisite for the timely
implementation of Bulgaria's obligations as a party to the UNFCCC and the Kyoto Protocol
and as a country - member of the European Union, is the effective involvement of the
competent authorities and private operators in the procedures, which requires clear and
comprehensive regulation of their powers, rights and obligations. As a member of the
European Union the Republic of Bulgaria has a number of obligations on the legislative
package "Climate & Energy" and participating in the scheme for trading greenhouse gas
emissions within the European Union (EU ETS), introduced by Directive 2003/87 / EC.
This fact is linked to the performance of many obligations that form the whole sector in
climate policy and the implementation of which our country should strike a balance between
65
the interests of industry and the ambitious EU targets for the progressive reduction of
greenhouse gases.
National Green Investment Scheme
In order to exploit the possibilities for financing projects to reduce greenhouse gas emissions
through the National Green Investment Scheme is a decision of the Council of Ministers №
546/12 September 2013 for addition to the agreement with Austria for the purchase of
AAUs in Scheme green investments. It is accepted and a decision of the Council of
Ministers № 547/12 September 2013 in connection with the implementation of projects
under the Green Investment Scheme.
The funds from the sale of AAUs of the Republic of Austria have implemented projects for
energy efficiency of the 77 public facilities state and municipal property in Bulgaria. Public
projects to improve energy efficiency in municipal buildings, kindergartens and primary
schools. Realized are energy efficiency projects at 13 public sites throughout the country.
National adaptation strategy
Steps have been taken to prepare national adaptation strategies in order to determine the
necessary adaptation measures for vulnerable sectors to the impacts of changing climatic
conditions in the region and climatic zone (due to climate change). As a first step was draft
document "Analysis of the contribution of the insurance sector and financial instruments to
the prevention of risks posed by climate change and the management of loss and damage in
Bulgaria" prepared by the Ministry, with the support of the World Bank. His purpose is to
analyze the role and importance of the insurance business for the prevention of risks that
occur as a result of climate change and taking measures to adapt. The analysis will be
included in the national adaptation strategy.
The ExEA has been identified as the responsible organization for preparation of Bulgaria’s
National GHG Inventory under the UNFCCC and the Kyoto Protocol and designated as
single national entity.
The ExEA’s directorates and departments, which are directly involved in operation of the
BGNIS, are Environmental Monitoring and Assessment Directorate with the Emission
Inventory Department (EID) and Waste Department (WD) and Permit Regime Directorate
with the Integrated Pollution Prevention and Control Department (IPPCD) and Emission
Trading Permit Department (ETPD).
3.3.2. Overview of inventory planning, preparation and
management
Legal basis of the Bulgarian NIS – General functions
Fulfillment of paragraph 10(a)
The Republic of Bulgaria joined the UNFCCC in 1992 and the Parliament ratified it in
March 1995. As an Annex I Party to the Convention, Bulgaria is committed to conduct
annual inventories on greenhouse gas (GHG) emissions by sources and removals by sinks,
using the GHG inventory methodology, approved by the UNFCCC. The inventories started
with the country base year – 1988. The first inventories covered the period 1988-1994 as a
part of the international project “Country Study to Address Climate Change“.
Legal basis of the BGNIS
As illustrated in Figure 3.1 and outlined shortly the Bulgaria’s reporting obligations to the
UNFCCC, UNECE and EC are being administered by the MoEW. All activities on
66
preparation of GHG inventory in Bulgaria are coordinated and managed on the state level by
MoEW. The Bulgarian Government by MoEW has the political responsibility for
compliance with commitments under the Kyoto Protocol, including for functioning of
BGNIS in accordance with the requirements of Decision 19/CMP.1 under Article 5,
paragraph 1, of the Kyoto Protocol:
National Focal Point;
QA experts from Climate Change Policy Directorate;
Approval of inventory;
Submission of CRF / NIR / Kyoto Tables / SEF.
ExEA has the technical responsibility for the national inventory:
acts as National Inventory Compiler (supervises inventory preparation process);
manages BGNIS;
compiles CRF tables and NIR;
coordinates the work of engaged consultants for supporting inventory;
coordinates and implements the activity of National QA/QC Plan;
National Inventory Focal Point.
The bases for BGNIS are:
Environmental Protection Act (EPA, State Gazette No. 91/25.09.2002; corrected, SG No.
96/2002; last amendment November 2012);
Statute on the organization and structure of ExEA (Decision of Council of ministers
162/03.08.2012 – final update 25.03.2014);
Order № 296/04.12.2015 by the Executive Director of ExEA (Sector experts/QC experts);
Order № RD-218/05.03.2010 by the Minister of Environment and Water (QA experts).
Regulation of the Council of Ministers 261/05.09.2014 SG 76/2014 on the way and order of
organization of the National Inventories of hazardous substances and greenhouse gases in the
ambient air
Institutional arrangements
In order to strengthen the institutional arrangements and to fulfil the required general and
specific functions of BGNIS official agreements between MoEW and the main data providers
were signed in 2010:
National Statistical Institute (RD21-35/12.02.2010);
Ministry of Agriculture and Food and its body Executive Forest Agency (04-00-
517/26.02.2010 and RD 50-47/15.03.2010);
Ministry of Economy, Energy and Tourism (14/06/2010);
Ministry of Interior (MI) (08/06/2010).
67
The agreements ensure the support from these organisations regarding the choice of the
activity data and EFs and methods, in the compilation of emission estimates and QA/QC of
these estimates.
The ExEA as Single National Entity coordinates all activities, related to collecting inventory
data and aggregates the data relevant for GHG emissions on a national level by the following
state authorities:
National Statistics Institute (NSI);
Ministry of Agriculture and Food (MAF) and their relevant services (Agrostatistic
Directorate and Executive Forest Agency);
Ministry of Energy (ME);
Ministry of Interior (MI);
Ministry of Environment and Water (MoEW);
Ministry of Transport, Information Technologies and Communications (МТIТС).
Other arrangements of the Bulgarian National inventory system
The Executive Environment Agency (ExEA) coordinates all activities, related to the large
industrial plants and Branch Business Associations.
Large industrial plants – official letters (questionnaire)
Branch Business Associations – official letters (questionnaire)
For validation of the activity data we gather reliable country specific data from Branch
Business Associations in Bulgaria and aggregate the data relevant for GHG emissions on a
national level. Please see the list of all branch business associations in Bulgaria:
http://www.bia-bg.com/memberCategory/278. The data must be representative for the whole
period since 1988 (base year for Bulgaria).
3.4. Inventory preparation, data collection, processing and storage
3.4.3. Collection of activity data by ExEA
The information is collected on the annual basis.
The ExEA sends every year letters with request for provision of the necessary activity data to
every one of the information sources, including the deadline for response.
For NSI, MAF, MI and ME the type of the necessary data, as well as the deadlines for
submissions to the ExEA are regulated by the official agreements mentioned above as well as
by the Regulation of the Council of Ministers 261/05.09.2014 (SG 76/2014).
The annual national energy and material balances as well as the data related to the solid waste
generation and the wastewater treatment are prepared by NSI. NSI uses up-to-date statistical
methods and procedures for data collection, summarizing and structuring that are harmonized
with EUROSTAT.
The GHG inventory use data, received directly from large point sources in the energy sector
and in the industry and these data are summarized by ExEA.
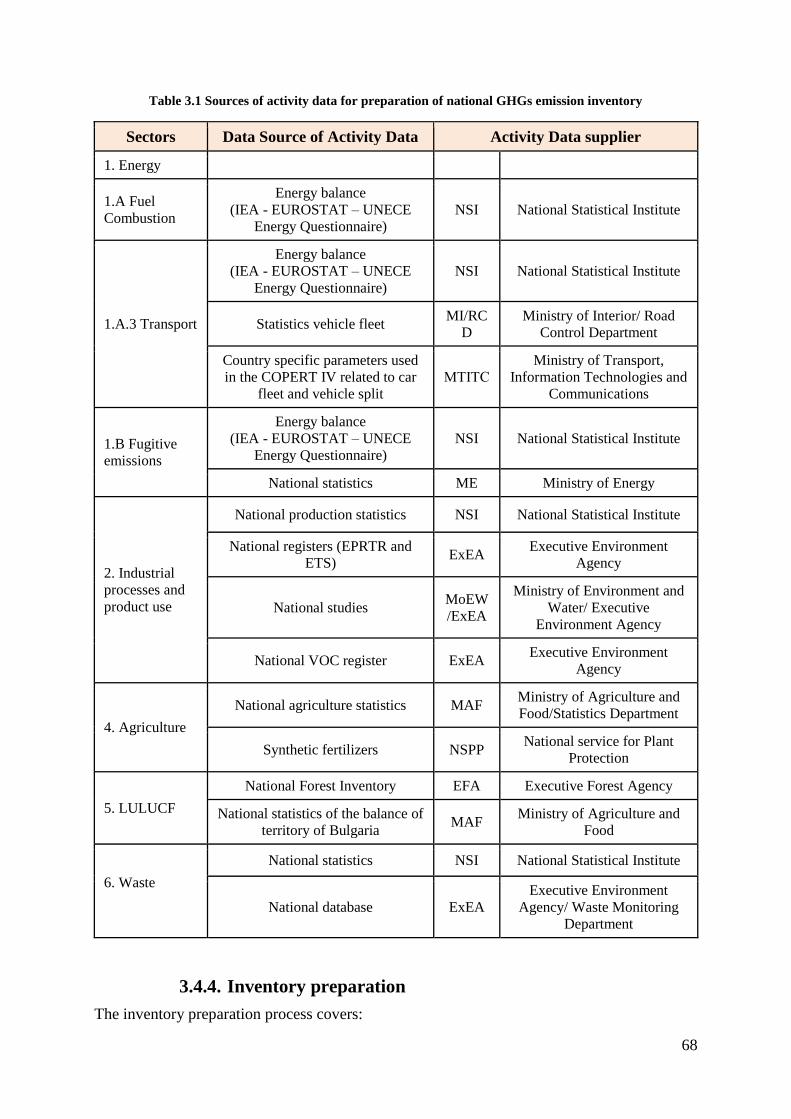
68
Table 3.1 Sources of activity data for preparation of national GHGs emission inventory
Sectors Data Source of Activity Data Activity Data supplier
1. Energy
1.A Fuel
Combustion
Energy balance
(IEA - EUROSTAT – UNECE
Energy Questionnaire)
NSI National Statistical Institute
1.A.3 Transport
Energy balance
(IEA - EUROSTAT – UNECE
Energy Questionnaire)
NSI National Statistical Institute
Statistics vehicle fleet MI/RC
D
Ministry of Interior/ Road
Control Department
Country specific parameters used
in the COPERT IV related to car
fleet and vehicle split
МТIТС
Ministry of Transport,
Information Technologies and
Communications
1.B Fugitive
emissions
Energy balance
(IEA - EUROSTAT – UNECE
Energy Questionnaire)
NSI National Statistical Institute
National statistics ME Ministry of Energy
2. Industrial
processes and
product use
National production statistics NSI National Statistical Institute
National registers (EPRTR and
ETS) ExEA
Executive Environment
Agency
National studies MoEW
/ExEA
Ministry of Environment and
Water/ Executive
Environment Agency
National VOC register ExEA Executive Environment
Agency
4. Agriculture
National agriculture statistics MAF Ministry of Agriculture and
Food/Statistics Department
Synthetic fertilizers NSPP National service for Plant
Protection
5. LULUCF
National Forest Inventory EFA Executive Forest Agency
National statistics of the balance of
territory of Bulgaria MAF
Ministry of Agriculture and
Food
6. Waste
National statistics NSI National Statistical Institute
National database ExEA
Executive Environment
Agency/ Waste Monitoring
Department
3.4.4. Inventory preparation
The inventory preparation process covers:
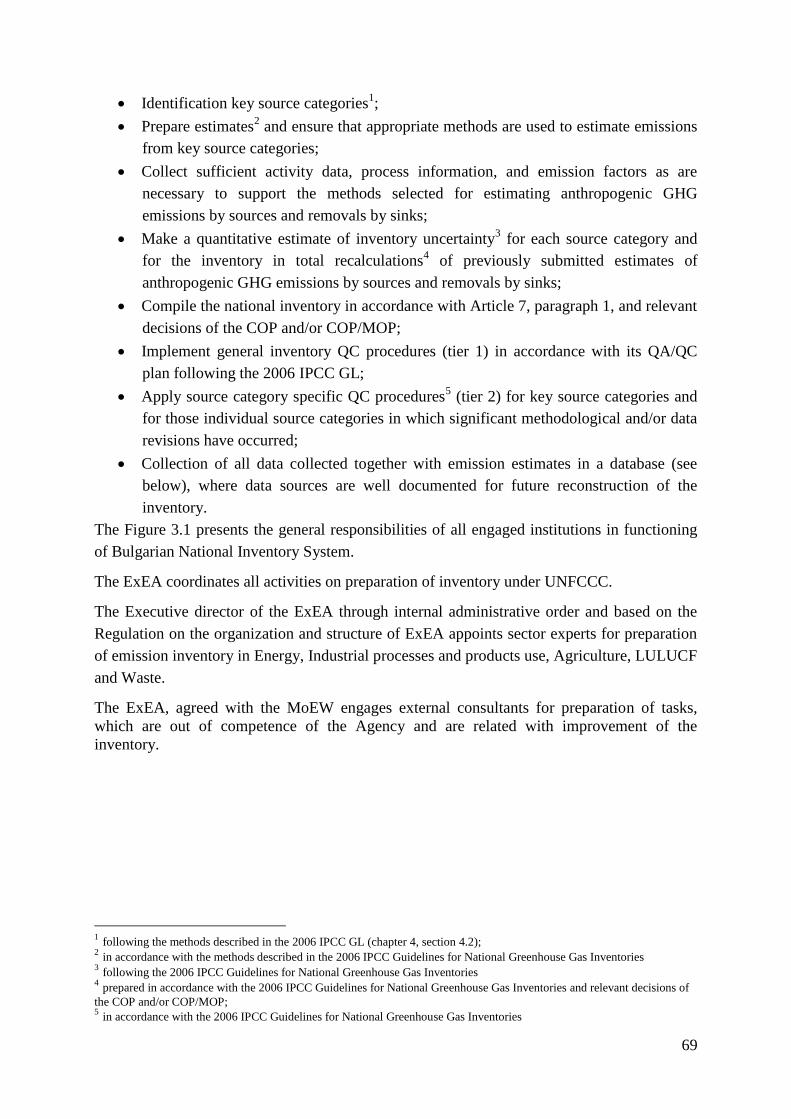
69
Identification key source categories1;
Prepare estimates2 and ensure that appropriate methods are used to estimate emissions
from key source categories;
Collect sufficient activity data, process information, and emission factors as are
necessary to support the methods selected for estimating anthropogenic GHG
emissions by sources and removals by sinks;
Make a quantitative estimate of inventory uncertainty3 for each source category and
for the inventory in total recalculations4 of previously submitted estimates of
anthropogenic GHG emissions by sources and removals by sinks;
Compile the national inventory in accordance with Article 7, paragraph 1, and relevant
decisions of the COP and/or COP/MOP;
Implement general inventory QC procedures (tier 1) in accordance with its QA/QC
plan following the 2006 IPCC GL;
Apply source category specific QC procedures5 (tier 2) for key source categories and
for those individual source categories in which significant methodological and/or data
revisions have occurred;
Collection of all data collected together with emission estimates in a database (see
below), where data sources are well documented for future reconstruction of the
inventory.
The Figure 3.1 presents the general responsibilities of all engaged institutions in functioning
of Bulgarian National Inventory System.
The ExEA coordinates all activities on preparation of inventory under UNFCCC.
The Executive director of the ExEA through internal administrative order and based on the
Regulation on the organization and structure of ExEA appoints sector experts for preparation
of emission inventory in Energy, Industrial processes and products use, Agriculture, LULUCF
and Waste.
The ExEA, agreed with the MoEW engages external consultants for preparation of tasks,
which are out of competence of the Agency and are related with improvement of the
inventory.
1 following the methods described in the 2006 IPCC GL (chapter 4, section 4.2); 2 in accordance with the methods described in the 2006 IPCC Guidelines for National Greenhouse Gas Inventories 3 following the 2006 IPCC Guidelines for National Greenhouse Gas Inventories 4 prepared in accordance with the 2006 IPCC Guidelines for National Greenhouse Gas Inventories and relevant decisions of
the COP and/or COP/MOP; 5 in accordance with the 2006 IPCC Guidelines for National Greenhouse Gas Inventories
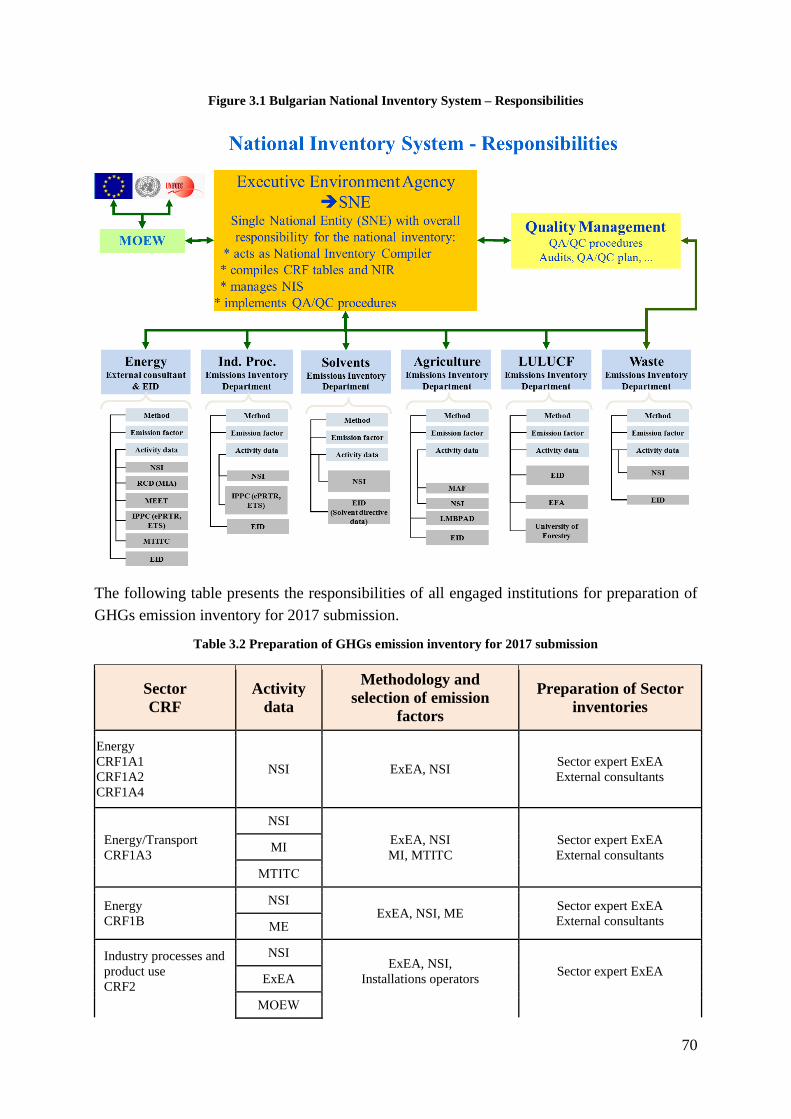
70
Figure 3.1 Bulgarian National Inventory System – Responsibilities
The following table presents the responsibilities of all engaged institutions for preparation of
GHGs emission inventory for 2017 submission.
Table 3.2 Preparation of GHGs emission inventory for 2017 submission
Sector
CRF
Activity
data
Methodology and
selection of emission
factors
Preparation of Sector
inventories
Energy
CRF1A1
CRF1A2
CRF1A4
NSI ExEA, NSI Sector expert ExEA
External consultants
Energy/Transport
CRF1A3
NSI
ExEA, NSI
MI, MTITC
Sector expert ExEA
External consultants MI
МТIТС
Energy
CRF1B
NSI ExEA, NSI, ME
Sector expert ExEA
External consultants МE
Industry processes and
product use
CRF2
NSI ExEA, NSI,
Installations operators
Sector expert ExEA
ExEA
МОEW
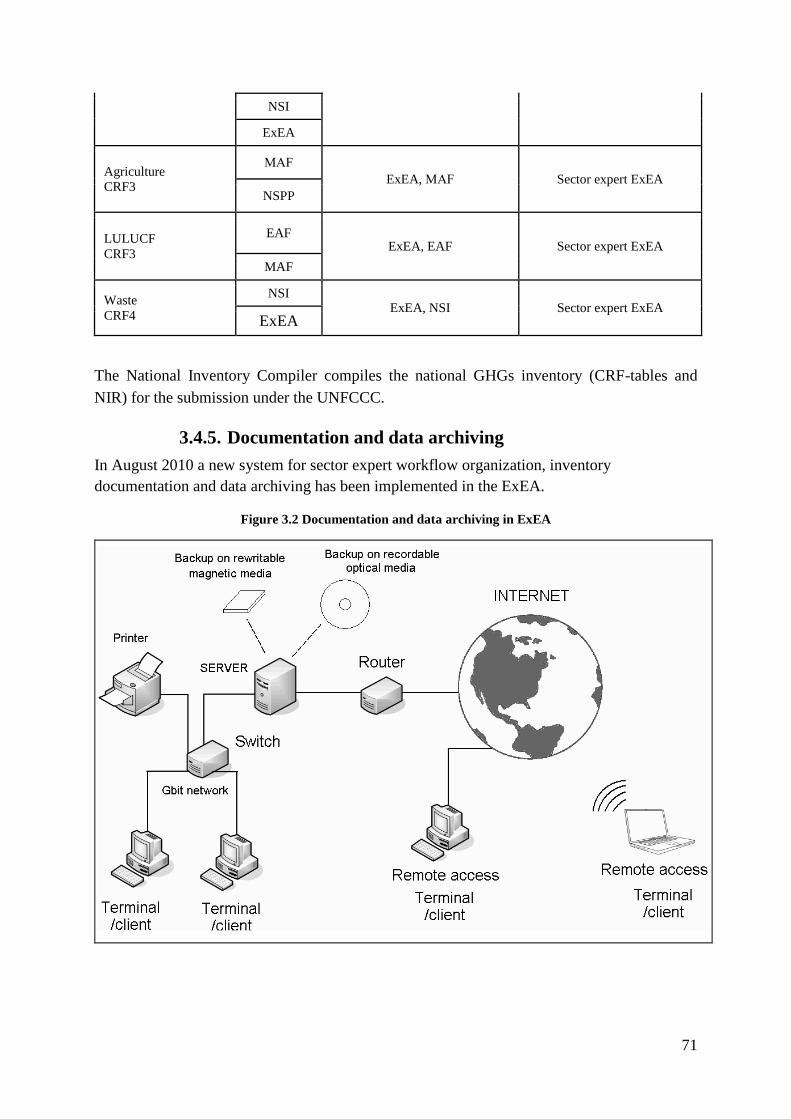
71
NSI
ExEA
Agriculture
CRF3
МAF
ExEA, МAF
Sector expert ExEA
NSPP
LULUCF
CRF3
EAF ExEA, EAF Sector expert ExEA
MAF
Waste
CRF4
NSI ExEA, NSI Sector expert ExEA
ExEA
The National Inventory Compiler compiles the national GHGs inventory (CRF-tables and
NIR) for the submission under the UNFCCC.
3.4.5. Documentation and data archiving
In August 2010 a new system for sector expert workflow organization, inventory
documentation and data archiving has been implemented in the ExEA.
Figure 3.2 Documentation and data archiving in ExEA
72
3.4.6. Quality assurance, quality control and verification
Fulfilment of paragraph 12(d)
As it is written above the Executive Environment Agency is responsible for the preparation of
the GHGs Emission Inventory and the relevant National Inventory Reports under UNFCCC.
The ExEA is also responsible for coordination and implementation of QA/QC activities for
the national inventory. A quality manger is in place.
The Bulgarian Quality Management System was established in the frame of project with
Bulgarian Academy of Science, Geophysical Institute. The project was carried out and
finished in 2008.
The QA/QC plan is an internal document to organise, plan and implement QA/QC activities.
Once developed for the next submission, it is referenced and used in subsequent inventory
preparation, or modified as appropriate.
The QA/QC plan has been updated in 2014 in order to implement the new established legal,
institutional and procedural arrangements within the BGNIS. The updated National QA/QC
Plan was approved by the Ministry of Environment and Water in December 2014.
National QA/QC Plan includes following elements:
Responsible institutions;
Data collection;
Preparation of inventory;
Category-specific QC procedures;
QA and review procedures;
Uncertainty analyses;
Organisation of the activities in quality management system;
Verification activities;
Reporting, documentation and archiving.
Figure 3.3 National quality assurance and quality control program
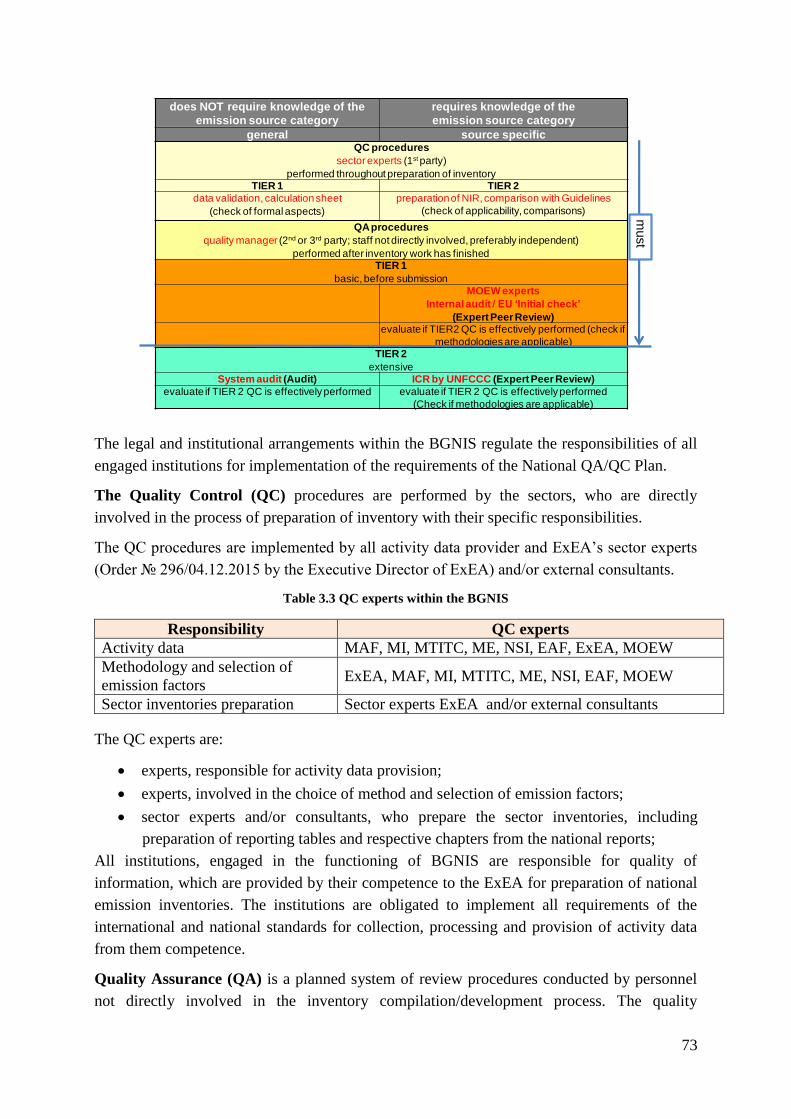
73
does NOT require knowledge of the
emission source category
requires knowledge of the
emission source category
general source specificQC procedures
sector experts (1st party)
performed throughout preparation of inventoryTIER 1 TIER 2
data validation, calculationsheet
(check of formal aspects)
preparation of NIR, comparison with Guidelines
(check of applicability, comparisons)
QA procedures
quality manager (2nd or 3rd party; staff not directly involved, preferably independent)
performed after inventory work has finishedTIER 1
basic, before submissionMOEW experts
Internal audit / EU ‘Initial check’
(Expert Peer Review)evaluate if TIER2 QC is effectively performed (check if
methodologies are applicable)TIER 2
extensiveSystem audit (Audit) ICR by UNFCCC (Expert Peer Review)
evaluate if TIER 2 QC is effectively performed evaluate if TIER 2 QC is effectively performed
(Check if methodologies are applicable)
must
The legal and institutional arrangements within the BGNIS regulate the responsibilities of all
engaged institutions for implementation of the requirements of the National QA/QC Plan.
The Quality Control (QC) procedures are performed by the sectors, who are directly
involved in the process of preparation of inventory with their specific responsibilities.
The QC procedures are implemented by all activity data provider and ExEA’s sector experts
(Order № 296/04.12.2015 by the Executive Director of ExEA) and/or external consultants.
Table 3.3 QC experts within the BGNIS
Responsibility QC experts
Activity data MAF, MI, MTITC, ME, NSI, EAF, ExEA, MOEW
Methodology and selection of
emission factors ExEA, MAF, MI, MTITC, ME, NSI, EAF, MOEW
Sector inventories preparation Sector experts ExEA and/or external consultants
The QC experts are:
experts, responsible for activity data provision;
experts, involved in the choice of method and selection of emission factors;
sector experts and/or consultants, who prepare the sector inventories, including
preparation of reporting tables and respective chapters from the national reports;
All institutions, engaged in the functioning of BGNIS are responsible for quality of
information, which are provided by their competence to the ExEA for preparation of national
emission inventories. The institutions are obligated to implement all requirements of the
international and national standards for collection, processing and provision of activity data
from them competence.
Quality Assurance (QA) is a planned system of review procedures conducted by personnel
not directly involved in the inventory compilation/development process. The quality
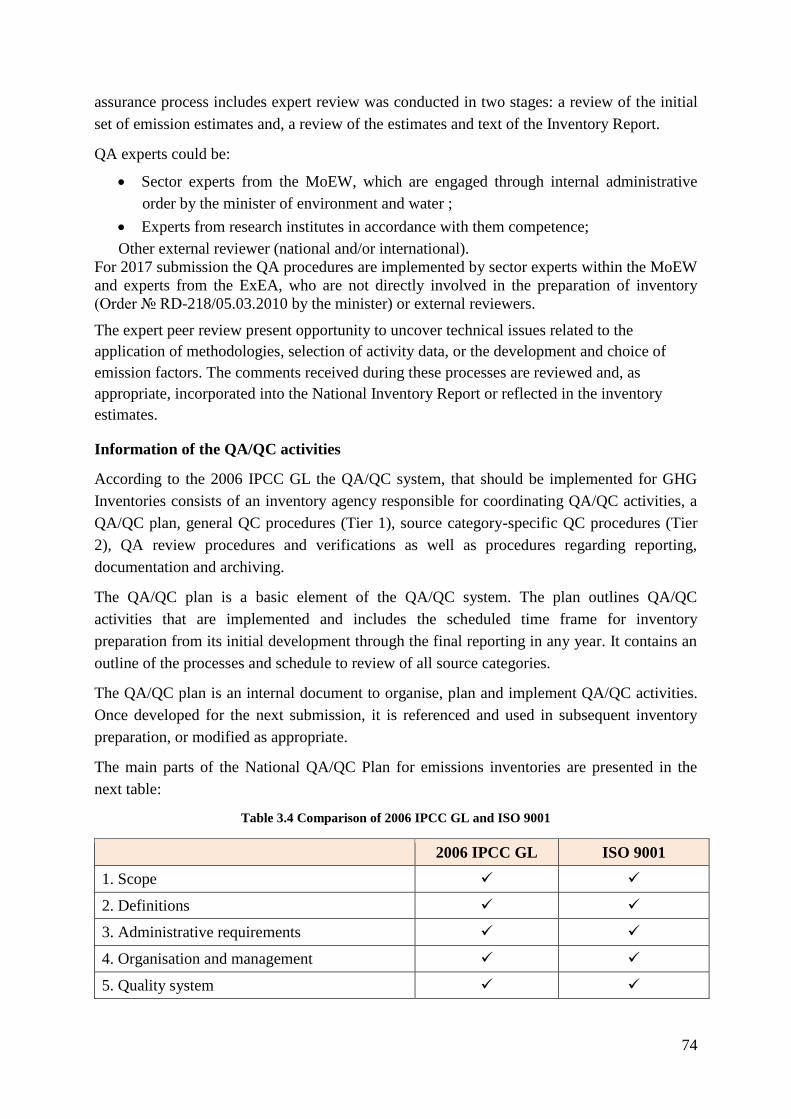
74
assurance process includes expert review was conducted in two stages: a review of the initial
set of emission estimates and, a review of the estimates and text of the Inventory Report.
QA experts could be:
Sector experts from the MoEW, which are engaged through internal administrative
order by the minister of environment and water ;
Experts from research institutes in accordance with them competence;
Other external reviewer (national and/or international).
For 2017 submission the QA procedures are implemented by sector experts within the MoEW
and experts from the ExEA, who are not directly involved in the preparation of inventory
(Order № RD-218/05.03.2010 by the minister) or external reviewers.
The expert peer review present opportunity to uncover technical issues related to the
application of methodologies, selection of activity data, or the development and choice of
emission factors. The comments received during these processes are reviewed and, as
appropriate, incorporated into the National Inventory Report or reflected in the inventory
estimates.
Information of the QA/QC activities
According to the 2006 IPCC GL the QA/QC system, that should be implemented for GHG
Inventories consists of an inventory agency responsible for coordinating QA/QC activities, a
QA/QC plan, general QC procedures (Tier 1), source category-specific QC procedures (Tier
2), QA review procedures and verifications as well as procedures regarding reporting,
documentation and archiving.
The QA/QC plan is a basic element of the QA/QC system. The plan outlines QA/QC
activities that are implemented and includes the scheduled time frame for inventory
preparation from its initial development through the final reporting in any year. It contains an
outline of the processes and schedule to review of all source categories.
The QA/QC plan is an internal document to organise, plan and implement QA/QC activities.
Once developed for the next submission, it is referenced and used in subsequent inventory
preparation, or modified as appropriate.
The main parts of the National QA/QC Plan for emissions inventories are presented in the
next table:
Table 3.4 Comparison of 2006 IPCC GL and ISO 9001
2006 IPCC GL ISO 9001
1. Scope
2. Definitions
3. Administrative requirements
4. Organisation and management
5. Quality system
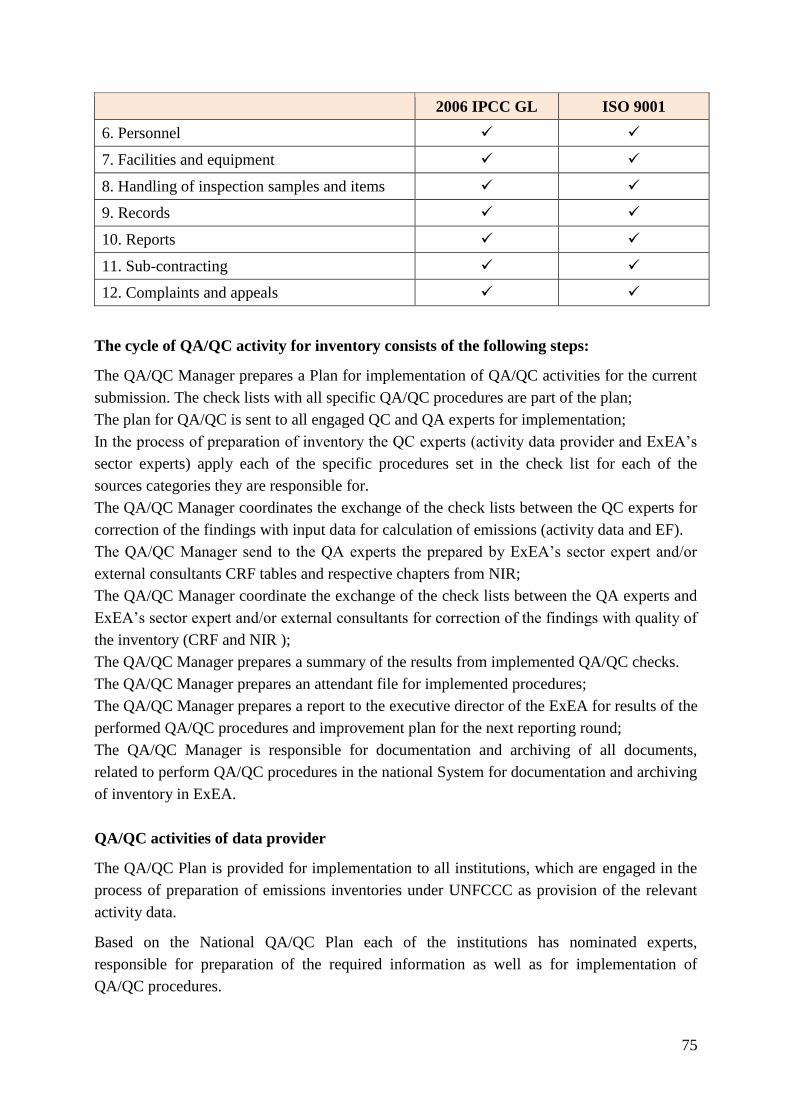
75
2006 IPCC GL ISO 9001
6. Personnel
7. Facilities and equipment
8. Handling of inspection samples and items
9. Records
10. Reports
11. Sub-contracting
12. Complaints and appeals
The cycle of QA/QC activity for inventory consists of the following steps:
The QA/QC Manager prepares a Plan for implementation of QA/QC activities for the current
submission. The check lists with all specific QA/QC procedures are part of the plan;
The plan for QA/QC is sent to all engaged QC and QA experts for implementation;
In the process of preparation of inventory the QC experts (activity data provider and ExEA’s
sector experts) apply each of the specific procedures set in the check list for each of the
sources categories they are responsible for.
The QA/QC Manager coordinates the exchange of the check lists between the QC experts for
correction of the findings with input data for calculation of emissions (activity data and EF).
The QA/QC Manager send to the QA experts the prepared by ExEA’s sector expert and/or
external consultants CRF tables and respective chapters from NIR;
The QA/QC Manager coordinate the exchange of the check lists between the QA experts and
ExEA’s sector expert and/or external consultants for correction of the findings with quality of
the inventory (CRF and NIR );
The QA/QC Manager prepares a summary of the results from implemented QA/QC checks.
The QA/QC Manager prepares an attendant file for implemented procedures;
The QA/QC Manager prepares a report to the executive director of the ExEA for results of the
performed QA/QC procedures and improvement plan for the next reporting round;
The QA/QC Manager is responsible for documentation and archiving of all documents,
related to perform QA/QC procedures in the national System for documentation and archiving
of inventory in ExEA.
QA/QC activities of data provider
The QA/QC Plan is provided for implementation to all institutions, which are engaged in the
process of preparation of emissions inventories under UNFCCC as provision of the relevant
activity data.
Based on the National QA/QC Plan each of the institutions has nominated experts,
responsible for preparation of the required information as well as for implementation of
QA/QC procedures.
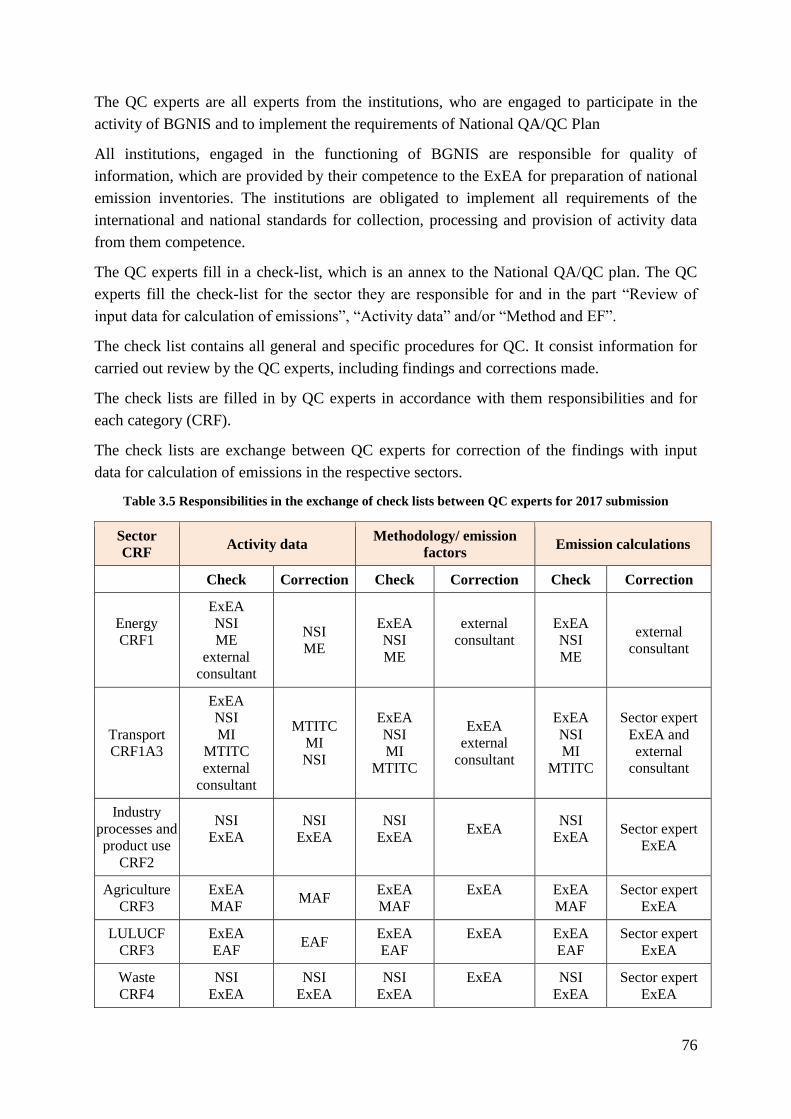
76
The QC experts are all experts from the institutions, who are engaged to participate in the
activity of BGNIS and to implement the requirements of National QA/QC Plan
All institutions, engaged in the functioning of BGNIS are responsible for quality of
information, which are provided by their competence to the ExEA for preparation of national
emission inventories. The institutions are obligated to implement all requirements of the
international and national standards for collection, processing and provision of activity data
from them competence.
The QC experts fill in a check-list, which is an annex to the National QA/QC plan. The QC
experts fill the check-list for the sector they are responsible for and in the part “Review of
input data for calculation of emissions”, “Activity data” and/or “Method and EF”.
The check list contains all general and specific procedures for QC. It consist information for
carried out review by the QC experts, including findings and corrections made.
The check lists are filled in by QC experts in accordance with them responsibilities and for
each category (CRF).
The check lists are exchange between QC experts for correction of the findings with input
data for calculation of emissions in the respective sectors.
Table 3.5 Responsibilities in the exchange of check lists between QC experts for 2017 submission
Sector
CRF Activity data
Methodology/ emission
factors Emission calculations
Check Correction Check Correction Check Correction
Energy
CRF1
ExEA
NSI
ME
external
consultant
NSI
ME
ExEA
NSI
ME
external
consultant
ExEA
NSI
ME
external
consultant
Transport
CRF1A3
ExEA
NSI
MI
MTITC
external
consultant
MTITC
MI
NSI
ExEA
NSI
MI
MTITC
ExEA
external
consultant
ExEA
NSI
MI
MTITC
Sector expert
ExEA and
external
consultant
Industry
processes and
product use
CRF2
NSI
ExEA
NSI
ExEA
NSI
ExEA
ExEA
NSI
ExEA
Sector expert
ExEA
Agriculture
CRF3
ExEA
MAF MAF
ExEA
MAF
ExEA
ExEA
MAF
Sector expert
ExEA
LULUCF
CRF3
ExEA
EAF EAF
ExEA
EAF
ExEA
ExEA
EAF
Sector expert
ExEA
Waste
CRF4
NSI
ExEA
NSI
ExEA
NSI
ExEA
ExEA
NSI
ExEA
Sector expert
ExEA
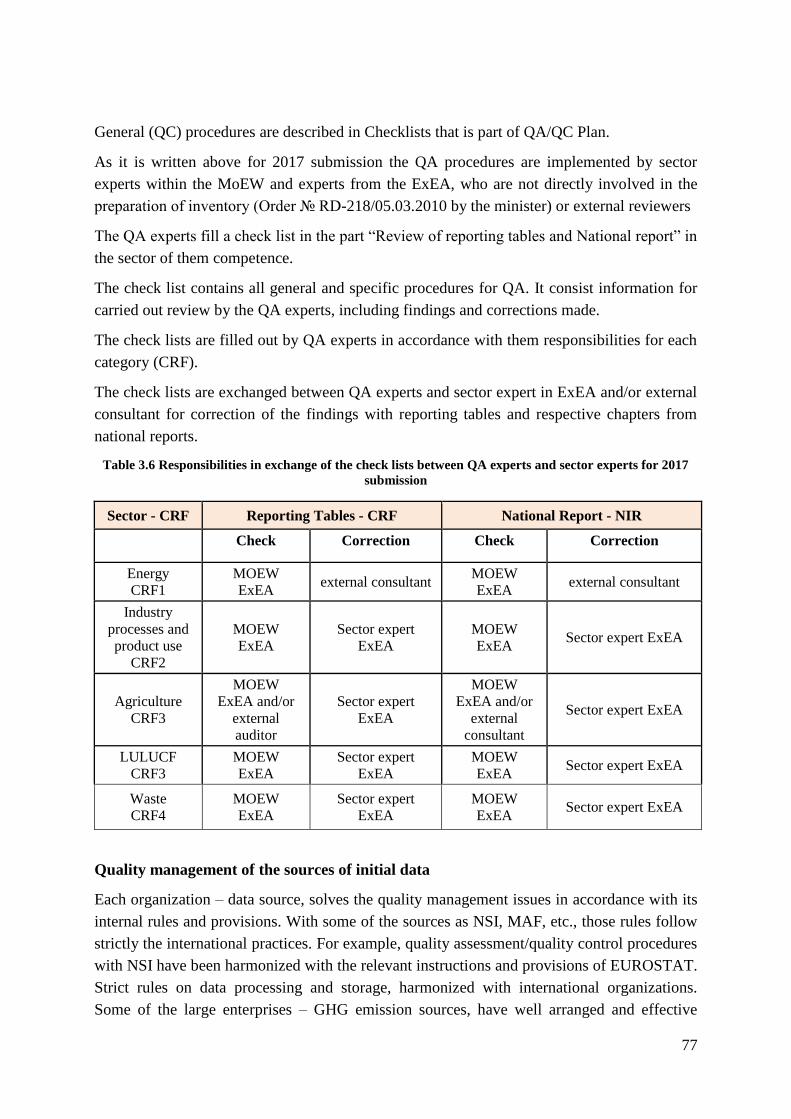
77
General (QC) procedures are described in Checklists that is part of QA/QC Plan.
As it is written above for 2017 submission the QA procedures are implemented by sector
experts within the MoEW and experts from the ExEA, who are not directly involved in the
preparation of inventory (Order № RD-218/05.03.2010 by the minister) or external reviewers
The QA experts fill a check list in the part “Review of reporting tables and National report” in
the sector of them competence.
The check list contains all general and specific procedures for QA. It consist information for
carried out review by the QA experts, including findings and corrections made.
The check lists are filled out by QA experts in accordance with them responsibilities for each
category (CRF).
The check lists are exchanged between QA experts and sector expert in ExEA and/or external
consultant for correction of the findings with reporting tables and respective chapters from
national reports.
Table 3.6 Responsibilities in exchange of the check lists between QA experts and sector experts for 2017
submission
Sector - CRF Reporting Tables - CRF National Report - NIR
Check Correction Check Correction
Energy
CRF1
MOEW
ExEA external consultant
MOEW
ExEA external consultant
Industry
processes and
product use
CRF2
MOEW
ExEA
Sector expert
ExEA
MOEW
ExEA Sector expert ExEA
Agriculture
CRF3
MOEW
ExEA and/or
external
auditor
Sector expert
ExEA
MOEW
ExEA and/or
external
consultant
Sector expert ExEA
LULUCF
CRF3
MOEW
ExEA
Sector expert
ExEA
MOEW
ExEA Sector expert ExEA
Waste
CRF4
MOEW
ExEA
Sector expert
ExEA
MOEW
ExEA Sector expert ExEA
Quality management of the sources of initial data
Each organization – data source, solves the quality management issues in accordance with its
internal rules and provisions. With some of the sources as NSI, MAF, etc., those rules follow
strictly the international practices. For example, quality assessment/quality control procedures
with NSI have been harmonized with the relevant instructions and provisions of EUROSTAT.
Strict rules on data processing and storage, harmonized with international organizations.
Some of the large enterprises – GHG emission sources, have well arranged and effective
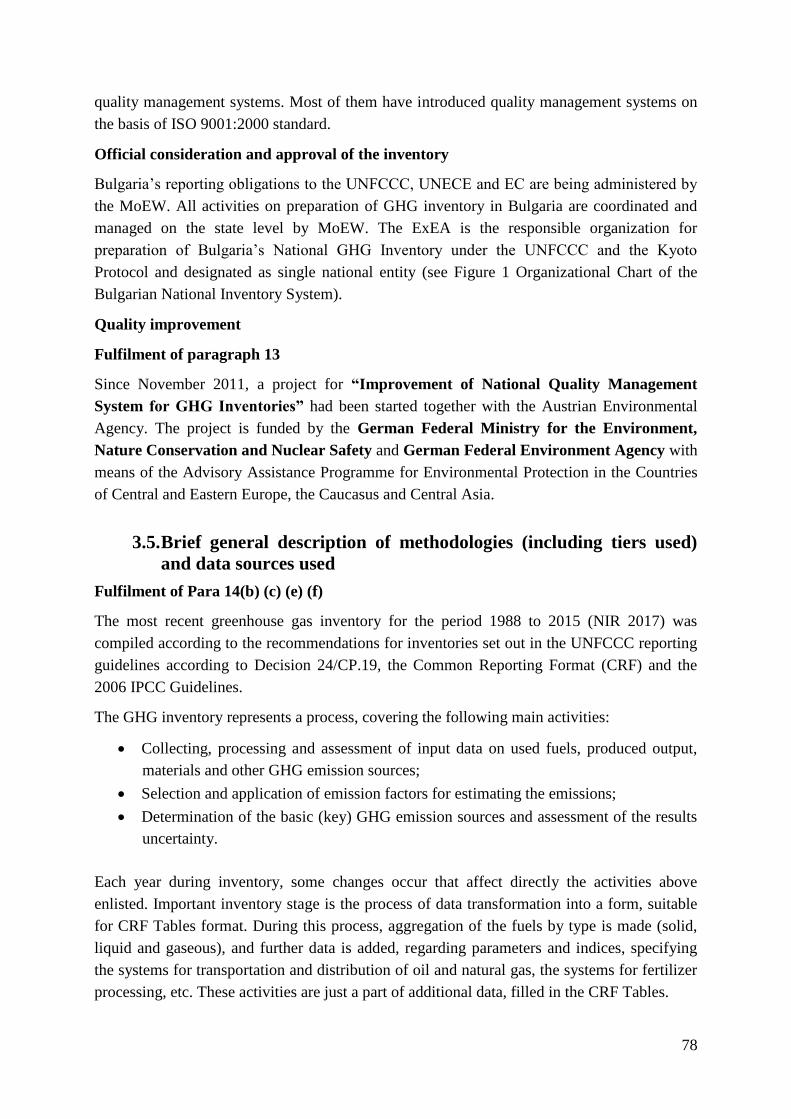
78
quality management systems. Most of them have introduced quality management systems on
the basis of ISO 9001:2000 standard.
Official consideration and approval of the inventory
Bulgaria’s reporting obligations to the UNFCCC, UNECE and EC are being administered by
the MoEW. All activities on preparation of GHG inventory in Bulgaria are coordinated and
managed on the state level by MoEW. The ExEA is the responsible organization for
preparation of Bulgaria’s National GHG Inventory under the UNFCCC and the Kyoto
Protocol and designated as single national entity (see Figure 1 Organizational Chart of the
Bulgarian National Inventory System).
Quality improvement
Fulfilment of paragraph 13
Since November 2011, a project for “Improvement of National Quality Management
System for GHG Inventories” had been started together with the Austrian Environmental
Agency. The project is funded by the German Federal Ministry for the Environment,
Nature Conservation and Nuclear Safety and German Federal Environment Agency with
means of the Advisory Assistance Programme for Environmental Protection in the Countries
of Central and Eastern Europe, the Caucasus and Central Asia.
3.5. Brief general description of methodologies (including tiers used)
and data sources used
Fulfilment of Para 14(b) (c) (e) (f)
The most recent greenhouse gas inventory for the period 1988 to 2015 (NIR 2017) was
compiled according to the recommendations for inventories set out in the UNFCCC reporting
guidelines according to Decision 24/CP.19, the Common Reporting Format (CRF) and the
2006 IPCC Guidelines.
The GHG inventory represents a process, covering the following main activities:
Collecting, processing and assessment of input data on used fuels, produced output,
materials and other GHG emission sources;
Selection and application of emission factors for estimating the emissions;
Determination of the basic (key) GHG emission sources and assessment of the results
uncertainty.
Each year during inventory, some changes occur that affect directly the activities above
enlisted. Important inventory stage is the process of data transformation into a form, suitable
for CRF Tables format. During this process, aggregation of the fuels by type is made (solid,
liquid and gaseous), and further data is added, regarding parameters and indices, specifying
the systems for transportation and distribution of oil and natural gas, the systems for fertilizer
processing, etc. These activities are just a part of additional data, filled in the CRF Tables.

79
National Inventory Methodology
According to Clean Air Act, article 25 (6) The Minister of Environment and Water in co-
ordination with the interested ministers issues an order for the approval of a Methodology for
the calculation, with balance methods, of the emissions of harmful substances (pollutants),
emitted in the ambient air. The national Methodology (approved with Order RD 77 from
03.02.2006 of MEW) is harmonized with CORINAIR methodology for calculation of the
emissions according to the UNECE/LRTAP Convention.
During 2007, MEW/ExEA had a project for development of Common methodology for
emissions inventory under UNECE/LRTAP Convention and UNFCCC, i.e. to update the
present Methodology under article 25 (6) CAA. (Approved with Order RD 40 from
22.01.2008 of MEW). The aim of the project was harmonization of the national Methodology
with IPCC, including the three main greenhouse gases – CO2, CH4 and N2O (plus relevant
ODS and SF6).
The Bulgarian national GHGs inventory and NIR are compiled according to requirements of
the following documents:
2006 IPCC Guidelines for National Greenhouse Gas Inventories (2006 IPCC GL)
EMEP/EEA air pollutant emission inventory guidebook – 2013
The emission factors are mainly from:
2006 IPCC Guidelines for National Greenhouse Gas Inventories (2006 IPCC GL)
EMEP/EEA air pollutant emission inventory guidebook – 2013.
Country-specific
The following tables summarise the ‘Applied method’ and ‘Emission factor’ of the inventory
2015, submission 2017.
Table 3.7 Methods and the emission factors applied (CO2, CH4, N2O)
GREENHOUSE GAS SOURCE
AND SINK CATEGORIES
CO2 CH4 N2O
Method
applied
Emissio
n factor
Method
applied
Emissio
n factor
Method
applied
Emissio
n factor
1. Energy T1,T2 CR,CS,D T1,T2 CR,D NA,T1,T2 CR,D,NA
A. Fuel combustion T1,T2 CR,CS,D T1,T2 CR,D NA,T1,T2 CR,D,NA
1. Energy industries T1,T2 CS,D T1 D NA,T1 D,NA
2. Manufacturing industries and construction T1,T2 CS,D T1 D T1 D
3. Transport T1,T2 CR,CS,D T1,T2 CR,D T1,T2 CR,D
4. Other sectors T1,T2 CS,D T1 D T1 D
5. Other T1,T2 CS,D T1 D T1 D
B. Fugitive emissions from fuels NA NA NA NA NA NA
1. Solid fuels NA NA NA NA NA NA
2. Oil and natural gas NA NA NA NA NA NA
C. CO2 transport and storage NA NA
2. Industrial Processes D,T1,T2 CR,CS,D,
PS D,NA D,NA T1,T3 CS,D,PS
A. Mineral industry T1,T2 CS,D,PS
B. Chemical industry T2 CS,PS D D T3 PS
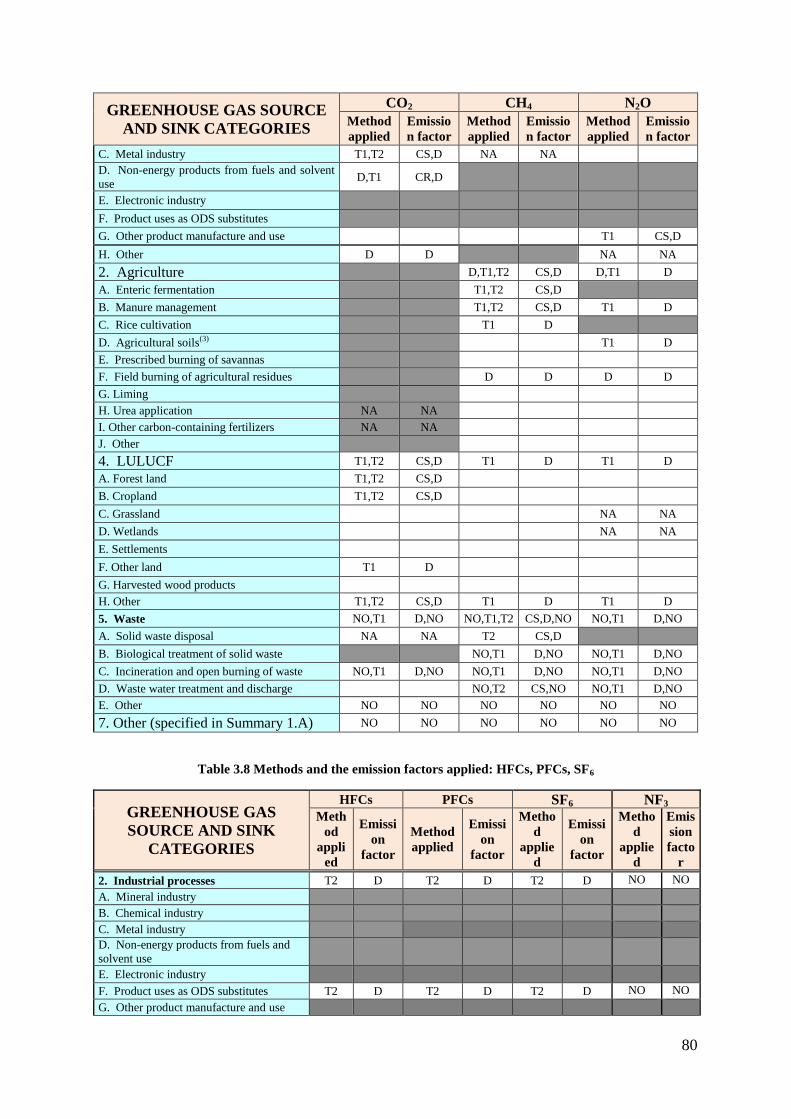
80
GREENHOUSE GAS SOURCE
AND SINK CATEGORIES
CO2 CH4 N2O
Method
applied
Emissio
n factor
Method
applied
Emissio
n factor
Method
applied
Emissio
n factor
C. Metal industry T1,T2 CS,D NA NA
D. Non-energy products from fuels and solvent
use D,T1 CR,D
E. Electronic industry
F. Product uses as ODS substitutes
G. Other product manufacture and use T1 CS,D
H. Other D D NA NA
2. Agriculture D,T1,T2 CS,D D,T1 D
A. Enteric fermentation T1,T2 CS,D
B. Manure management T1,T2 CS,D T1 D
C. Rice cultivation T1 D
D. Agricultural soils(3) T1 D
E. Prescribed burning of savannas
F. Field burning of agricultural residues D D D D
G. Liming
H. Urea application NA NA
I. Other carbon-containing fertilizers NA NA
J. Other
4. LULUCF T1,T2 CS,D T1 D T1 D
A. Forest land T1,T2 CS,D
B. Cropland T1,T2 CS,D
C. Grassland NA NA
D. Wetlands NA NA
E. Settlements
F. Other land T1 D
G. Harvested wood products
H. Other T1,T2 CS,D T1 D T1 D
5. Waste NO,T1 D,NO NO,T1,T2 CS,D,NO NO,T1 D,NO
A. Solid waste disposal NA NA T2 CS,D
B. Biological treatment of solid waste NO,T1 D,NO NO,T1 D,NO
C. Incineration and open burning of waste NO,T1 D,NO NO,T1 D,NO NO,T1 D,NO
D. Waste water treatment and discharge NO,T2 CS,NO NO,T1 D,NO
E. Other NO NO NO NO NO NO
7. Other (specified in Summary 1.A) NO NO NO NO NO NO
Table 3.8 Methods and the emission factors applied: HFCs, PFCs, SF6
GREENHOUSE GAS
SOURCE AND SINK
CATEGORIES
HFCs PFCs SF6 NF3 Meth
od
appli
ed
Emissi
on
factor
Method
applied
Emissi
on
factor
Metho
d
applie
d
Emissi
on
factor
Metho
d
applie
d
Emis
sion
facto
r
2. Industrial processes T2 D T2 D T2 D NO NO
A. Mineral industry
B. Chemical industry
C. Metal industry
D. Non-energy products from fuels and
solvent use
E. Electronic industry
F. Product uses as ODS substitutes T2 D T2 D T2 D NO NO
G. Other product manufacture and use
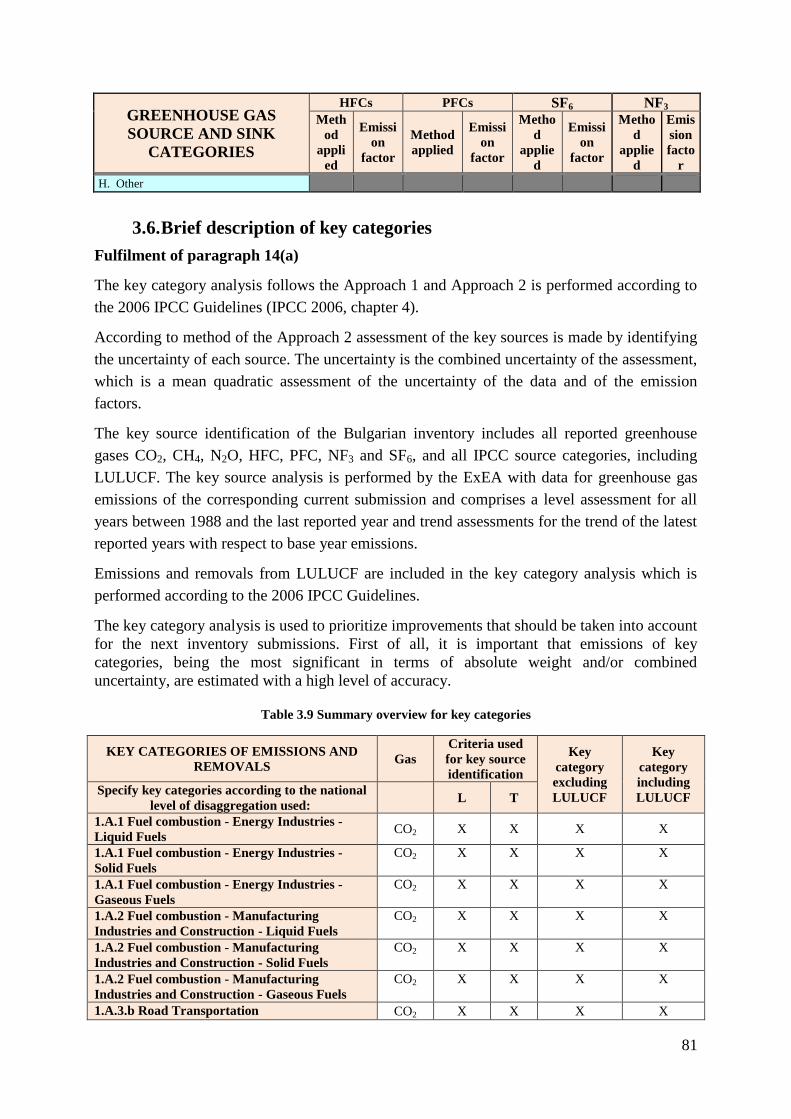
81
GREENHOUSE GAS
SOURCE AND SINK
CATEGORIES
HFCs PFCs SF6 NF3 Meth
od
appli
ed
Emissi
on
factor
Method
applied
Emissi
on
factor
Metho
d
applie
d
Emissi
on
factor
Metho
d
applie
d
Emis
sion
facto
r
H. Other
3.6. Brief description of key categories
Fulfilment of paragraph 14(a)
The key category analysis follows the Approach 1 and Approach 2 is performed according to
the 2006 IPCC Guidelines (IPCC 2006, chapter 4).
According to method of the Approach 2 assessment of the key sources is made by identifying
the uncertainty of each source. The uncertainty is the combined uncertainty of the assessment,
which is a mean quadratic assessment of the uncertainty of the data and of the emission
factors.
The key source identification of the Bulgarian inventory includes all reported greenhouse
gases CO2, CH4, N2O, HFC, PFC, NF3 and SF6, and all IPCC source categories, including
LULUCF. The key source analysis is performed by the ExEA with data for greenhouse gas
emissions of the corresponding current submission and comprises a level assessment for all
years between 1988 and the last reported year and trend assessments for the trend of the latest
reported years with respect to base year emissions.
Emissions and removals from LULUCF are included in the key category analysis which is
performed according to the 2006 IPCC Guidelines.
The key category analysis is used to prioritize improvements that should be taken into account
for the next inventory submissions. First of all, it is important that emissions of key
categories, being the most significant in terms of absolute weight and/or combined
uncertainty, are estimated with a high level of accuracy.
Table 3.9 Summary overview for key categories
KEY CATEGORIES OF EMISSIONS AND
REMOVALS Gas
Criteria used
for key source
identification
Key
category
excluding
LULUCF
Key
category
including
LULUCF Specify key categories according to the national
level of disaggregation used:
L T
1.A.1 Fuel combustion - Energy Industries -
Liquid Fuels CO2 X X X X
1.A.1 Fuel combustion - Energy Industries -
Solid Fuels
CO2 X X X X
1.A.1 Fuel combustion - Energy Industries -
Gaseous Fuels
CO2 X X X X
1.A.2 Fuel combustion - Manufacturing
Industries and Construction - Liquid Fuels
CO2 X X X X
1.A.2 Fuel combustion - Manufacturing
Industries and Construction - Solid Fuels
CO2 X X X X
1.A.2 Fuel combustion - Manufacturing
Industries and Construction - Gaseous Fuels
CO2 X X X X
1.A.3.b Road Transportation CO2 X X X X
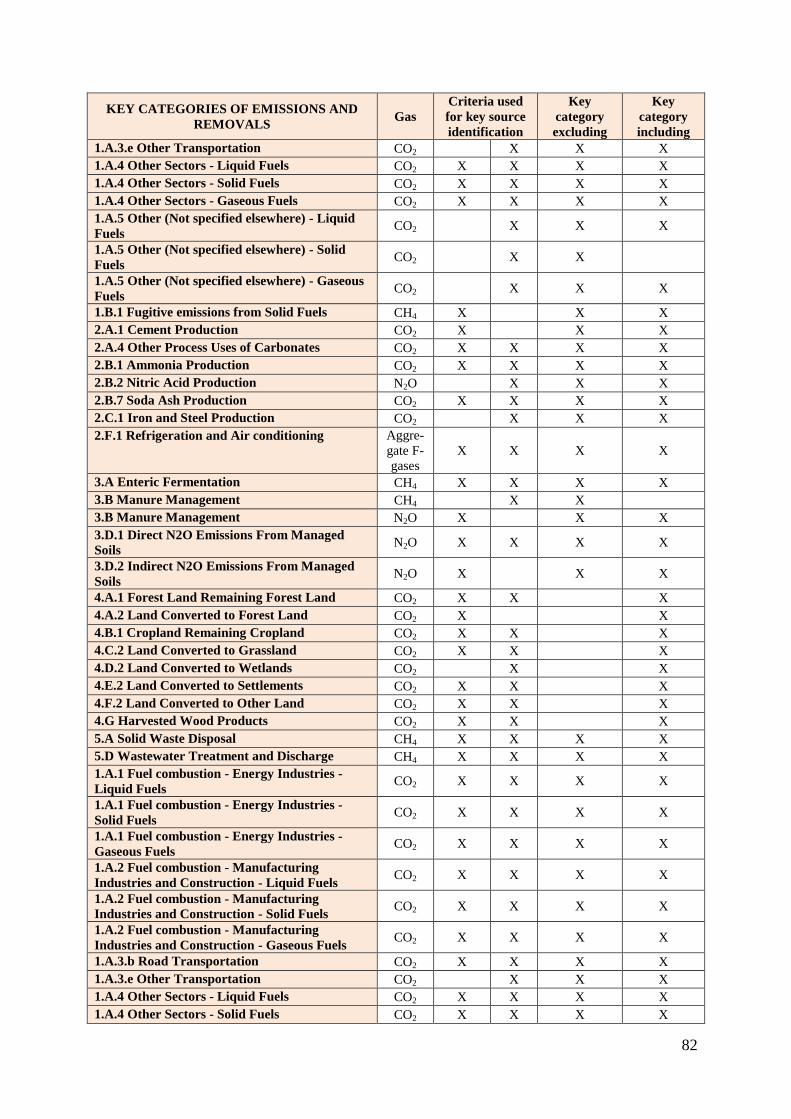
82
KEY CATEGORIES OF EMISSIONS AND
REMOVALS Gas
Criteria used
for key source
identification
Key
category
excluding
LULUCF
Key
category
including
LULUCF 1.A.3.e Other Transportation CO2 X X X
1.A.4 Other Sectors - Liquid Fuels CO2 X X X X
1.A.4 Other Sectors - Solid Fuels CO2 X X X X
1.A.4 Other Sectors - Gaseous Fuels CO2 X X X X
1.A.5 Other (Not specified elsewhere) - Liquid
Fuels CO2
X X X
1.A.5 Other (Not specified elsewhere) - Solid
Fuels CO2
X X
1.A.5 Other (Not specified elsewhere) - Gaseous
Fuels CO2
X X X
1.B.1 Fugitive emissions from Solid Fuels CH4 X
X X
2.A.1 Cement Production CO2 X
X X
2.A.4 Other Process Uses of Carbonates CO2 X X X X
2.B.1 Ammonia Production CO2 X X X X
2.B.2 Nitric Acid Production N2O
X X X
2.B.7 Soda Ash Production CO2 X X X X
2.C.1 Iron and Steel Production CO2 X X X
2.F.1 Refrigeration and Air conditioning Aggre-
gate F-
gases
X X X X
3.A Enteric Fermentation CH4 X X X X
3.B Manure Management CH4 X X
3.B Manure Management N2O X
X X
3.D.1 Direct N2O Emissions From Managed
Soils N2O X X X X
3.D.2 Indirect N2O Emissions From Managed
Soils N2O X
X X
4.A.1 Forest Land Remaining Forest Land CO2 X X
X
4.A.2 Land Converted to Forest Land CO2 X
X
4.B.1 Cropland Remaining Cropland CO2 X X
X
4.C.2 Land Converted to Grassland CO2 X X
X
4.D.2 Land Converted to Wetlands CO2 X
X
4.E.2 Land Converted to Settlements CO2 X X
X
4.F.2 Land Converted to Other Land CO2 X X
X
4.G Harvested Wood Products CO2 X X
X
5.A Solid Waste Disposal CH4 X X X X
5.D Wastewater Treatment and Discharge CH4 X X X X
1.A.1 Fuel combustion - Energy Industries -
Liquid Fuels CO2 X X X X
1.A.1 Fuel combustion - Energy Industries -
Solid Fuels CO2 X X X X
1.A.1 Fuel combustion - Energy Industries -
Gaseous Fuels CO2 X X X X
1.A.2 Fuel combustion - Manufacturing
Industries and Construction - Liquid Fuels CO2 X X X X
1.A.2 Fuel combustion - Manufacturing
Industries and Construction - Solid Fuels CO2 X X X X
1.A.2 Fuel combustion - Manufacturing
Industries and Construction - Gaseous Fuels CO2 X X X X
1.A.3.b Road Transportation CO2 X X X X
1.A.3.e Other Transportation CO2 X X X
1.A.4 Other Sectors - Liquid Fuels CO2 X X X X
1.A.4 Other Sectors - Solid Fuels CO2 X X X X
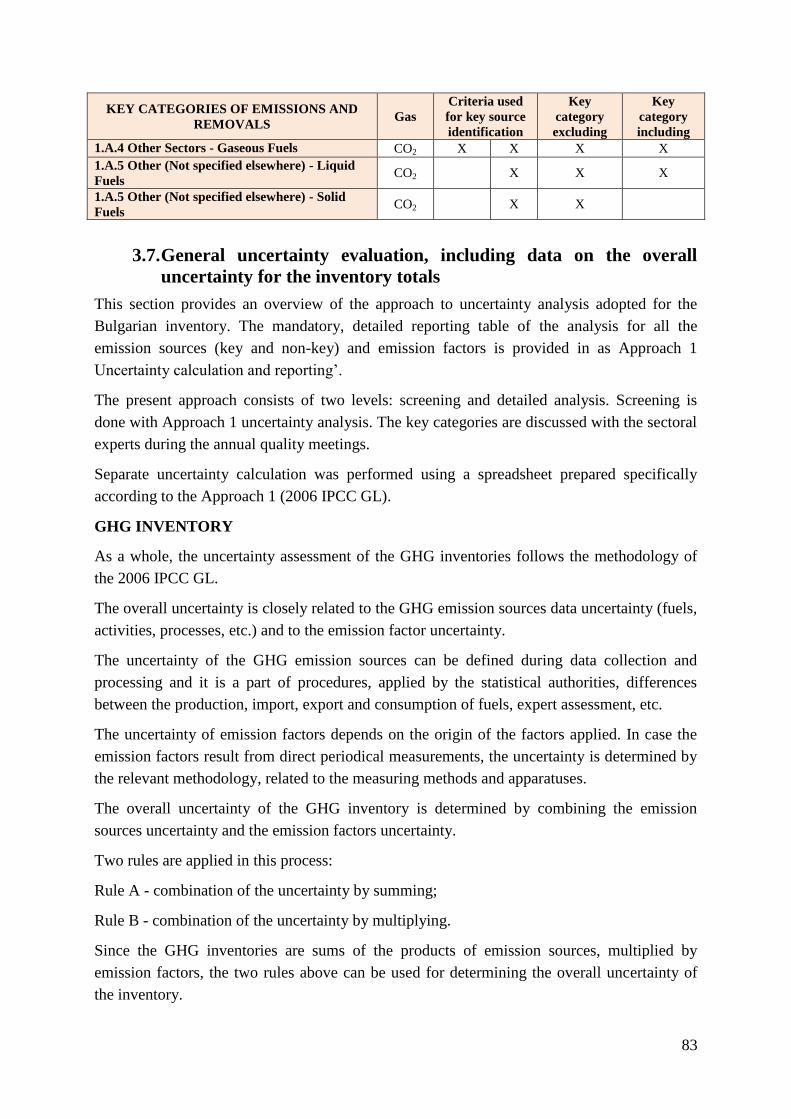
83
KEY CATEGORIES OF EMISSIONS AND
REMOVALS Gas
Criteria used
for key source
identification
Key
category
excluding
LULUCF
Key
category
including
LULUCF 1.A.4 Other Sectors - Gaseous Fuels CO2 X X X X
1.A.5 Other (Not specified elsewhere) - Liquid
Fuels CO2
X X X
1.A.5 Other (Not specified elsewhere) - Solid
Fuels CO2
X X
3.7. General uncertainty evaluation, including data on the overall
uncertainty for the inventory totals
This section provides an overview of the approach to uncertainty analysis adopted for the
Bulgarian inventory. The mandatory, detailed reporting table of the analysis for all the
emission sources (key and non-key) and emission factors is provided in as Approach 1
Uncertainty calculation and reporting’.
The present approach consists of two levels: screening and detailed analysis. Screening is
done with Approach 1 uncertainty analysis. The key categories are discussed with the sectoral
experts during the annual quality meetings.
Separate uncertainty calculation was performed using a spreadsheet prepared specifically
according to the Approach 1 (2006 IPCC GL).
GHG INVENTORY
As a whole, the uncertainty assessment of the GHG inventories follows the methodology of
the 2006 IPCC GL.
The overall uncertainty is closely related to the GHG emission sources data uncertainty (fuels,
activities, processes, etc.) and to the emission factor uncertainty.
The uncertainty of the GHG emission sources can be defined during data collection and
processing and it is a part of procedures, applied by the statistical authorities, differences
between the production, import, export and consumption of fuels, expert assessment, etc.
The uncertainty of emission factors depends on the origin of the factors applied. In case the
emission factors result from direct periodical measurements, the uncertainty is determined by
the relevant methodology, related to the measuring methods and apparatuses.
The overall uncertainty of the GHG inventory is determined by combining the emission
sources uncertainty and the emission factors uncertainty.
Two rules are applied in this process:
Rule A - combination of the uncertainty by summing;
Rule B - combination of the uncertainty by multiplying.
Since the GHG inventories are sums of the products of emission sources, multiplied by
emission factors, the two rules above can be used for determining the overall uncertainty of
the inventory.
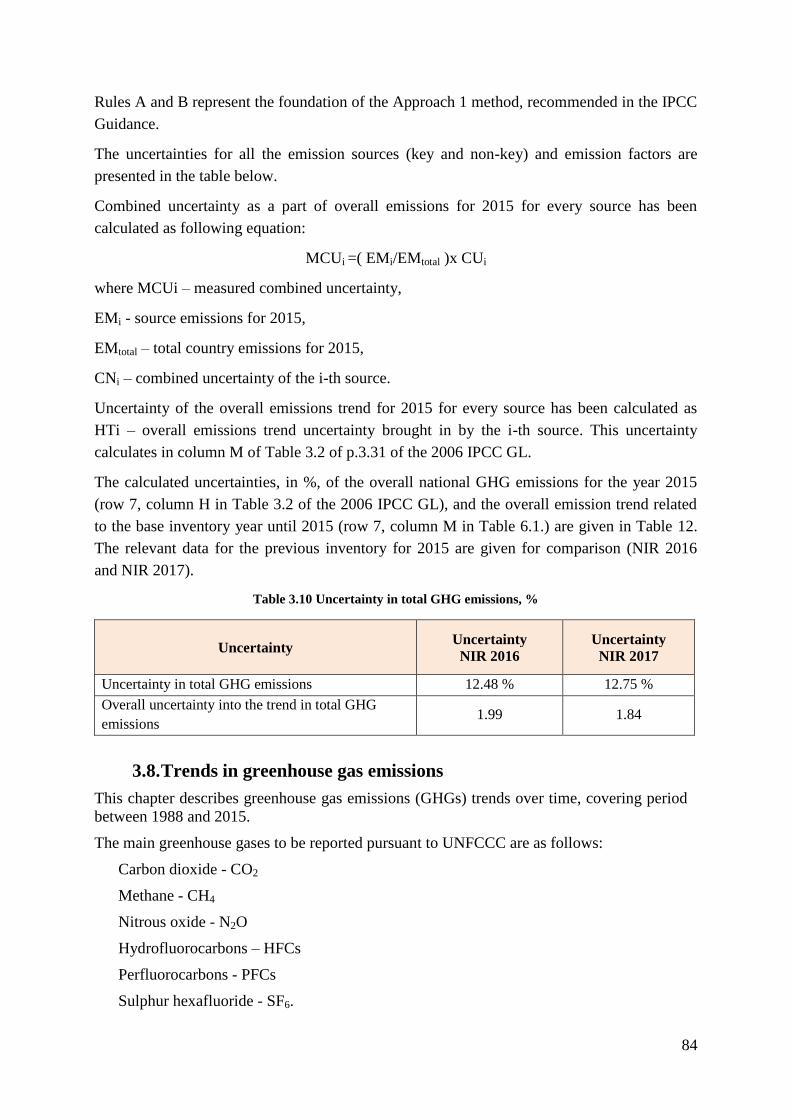
84
Rules A and B represent the foundation of the Approach 1 method, recommended in the IPCC
Guidance.
The uncertainties for all the emission sources (key and non-key) and emission factors are
presented in the table below.
Combined uncertainty as a part of overall emissions for 2015 for every source has been
calculated as following equation:
MCUi =( EMi/EMtotal )x CUi
where MCUi – measured combined uncertainty,
EMi - source emissions for 2015,
EMtotal – total country emissions for 2015,
CNi – combined uncertainty of the i-th source.
Uncertainty of the overall emissions trend for 2015 for every source has been calculated as
HTi – overall emissions trend uncertainty brought in by the i-th source. This uncertainty
calculates in column M of Table 3.2 of p.3.31 of the 2006 IPCC GL.
The calculated uncertainties, in %, of the overall national GHG emissions for the year 2015
(row 7, column H in Table 3.2 of the 2006 IPCC GL), and the overall emission trend related
to the base inventory year until 2015 (row 7, column M in Table 6.1.) are given in Table 12.
The relevant data for the previous inventory for 2015 are given for comparison (NIR 2016
and NIR 2017).
Table 3.10 Uncertainty in total GHG emissions, %
Uncertainty Uncertainty
NIR 2016
Uncertainty
NIR 2017
Uncertainty in total GHG emissions 12.48 % 12.75 %
Overall uncertainty into the trend in total GHG
emissions 1.99 1.84
3.8. Trends in greenhouse gas emissions
This chapter describes greenhouse gas emissions (GHGs) trends over time, covering period
between 1988 and 2015.
The main greenhouse gases to be reported pursuant to UNFCCC are as follows:
Carbon dioxide - CO2
Methane - CH4
Nitrous oxide - N2O
Hydrofluorocarbons – HFCs
Perfluorocarbons - PFCs
Sulphur hexafluoride - SF6.

85
Each of these gases has a warming effect which can be distinguished by its amount. As an
example, the gases HFCs, PFCs and SF6 (so called F-gases) have much greater warming
effect compared to methane, nitrous oxide and carbon dioxide.
The table below represents the emission trends of the basic GHGs, the overall emissions
(excluding LULUCF).
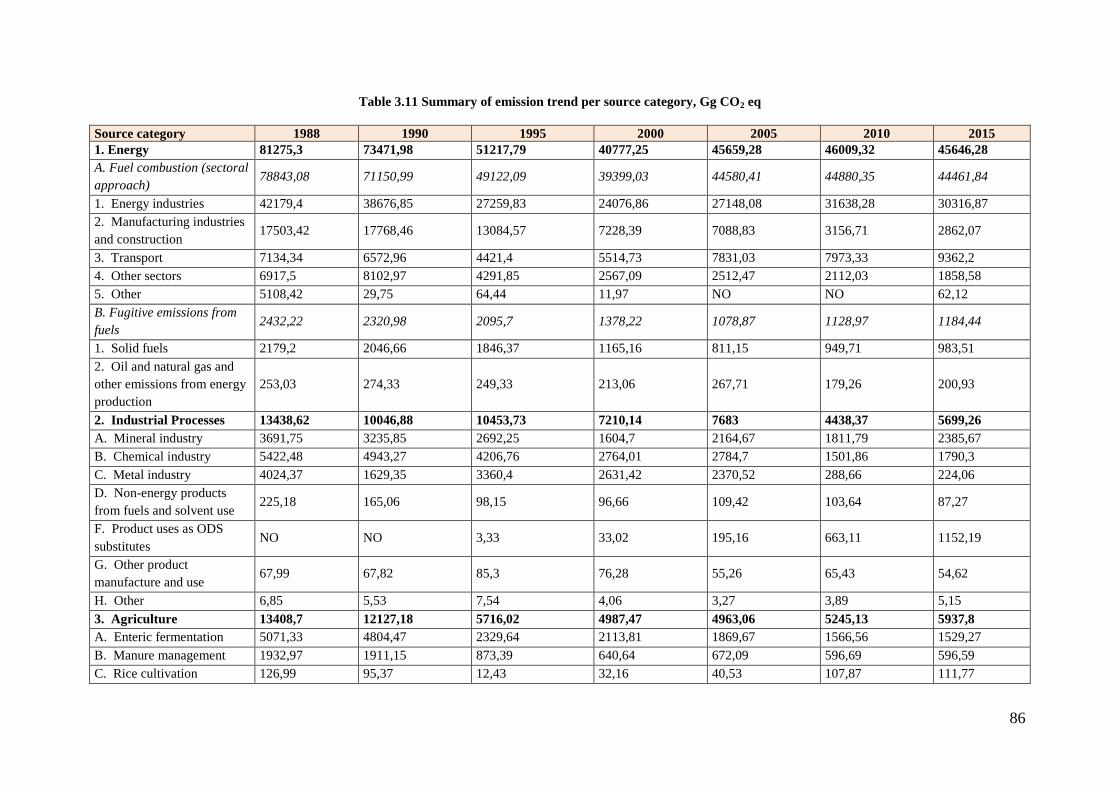
86
Table 3.11 Summary of emission trend per source category, Gg CO2 eq
Source category 1988 1990 1995 2000 2005 2010 2015
1. Energy 81275,3 73471,98 51217,79 40777,25 45659,28 46009,32 45646,28
A. Fuel combustion (sectoral
approach) 78843,08 71150,99 49122,09 39399,03 44580,41 44880,35 44461,84
1. Energy industries 42179,4 38676,85 27259,83 24076,86 27148,08 31638,28 30316,87
2. Manufacturing industries
and construction 17503,42 17768,46 13084,57 7228,39 7088,83 3156,71 2862,07
3. Transport 7134,34 6572,96 4421,4 5514,73 7831,03 7973,33 9362,2
4. Other sectors 6917,5 8102,97 4291,85 2567,09 2512,47 2112,03 1858,58
5. Other 5108,42 29,75 64,44 11,97 NO NO 62,12
B. Fugitive emissions from
fuels 2432,22 2320,98 2095,7 1378,22 1078,87 1128,97 1184,44
1. Solid fuels 2179,2 2046,66 1846,37 1165,16 811,15 949,71 983,51
2. Oil and natural gas and
other emissions from energy
production
253,03 274,33 249,33 213,06 267,71 179,26 200,93
2. Industrial Processes 13438,62 10046,88 10453,73 7210,14 7683 4438,37 5699,26
A. Mineral industry 3691,75 3235,85 2692,25 1604,7 2164,67 1811,79 2385,67
B. Chemical industry 5422,48 4943,27 4206,76 2764,01 2784,7 1501,86 1790,3
C. Metal industry 4024,37 1629,35 3360,4 2631,42 2370,52 288,66 224,06
D. Non-energy products
from fuels and solvent use 225,18 165,06 98,15 96,66 109,42 103,64 87,27
F. Product uses as ODS
substitutes NO NO 3,33 33,02 195,16 663,11 1152,19
G. Other product
manufacture and use 67,99 67,82 85,3 76,28 55,26 65,43 54,62
H. Other 6,85 5,53 7,54 4,06 3,27 3,89 5,15
3. Agriculture 13408,7 12127,18 5716,02 4987,47 4963,06 5245,13 5937,8
A. Enteric fermentation 5071,33 4804,47 2329,64 2113,81 1869,67 1566,56 1529,27
B. Manure management 1932,97 1911,15 873,39 640,64 672,09 596,69 596,59
C. Rice cultivation 126,99 95,37 12,43 32,16 40,53 107,87 111,77
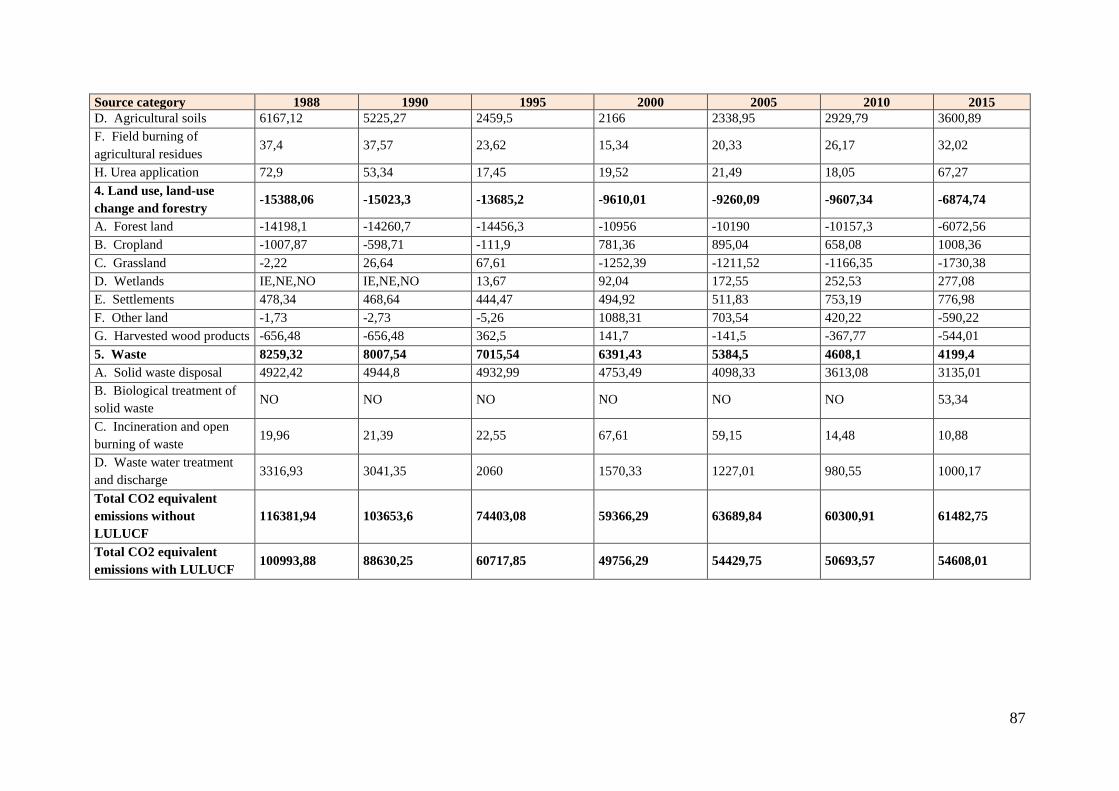
87
Source category 1988 1990 1995 2000 2005 2010 2015
D. Agricultural soils 6167,12 5225,27 2459,5 2166 2338,95 2929,79 3600,89
F. Field burning of
agricultural residues 37,4 37,57 23,62 15,34 20,33 26,17 32,02
H. Urea application 72,9 53,34 17,45 19,52 21,49 18,05 67,27
4. Land use, land-use
change and forestry -15388,06 -15023,3 -13685,2 -9610,01 -9260,09 -9607,34 -6874,74
A. Forest land -14198,1 -14260,7 -14456,3 -10956 -10190 -10157,3 -6072,56
B. Cropland -1007,87 -598,71 -111,9 781,36 895,04 658,08 1008,36
C. Grassland -2,22 26,64 67,61 -1252,39 -1211,52 -1166,35 -1730,38
D. Wetlands IE,NE,NO IE,NE,NO 13,67 92,04 172,55 252,53 277,08
E. Settlements 478,34 468,64 444,47 494,92 511,83 753,19 776,98
F. Other land -1,73 -2,73 -5,26 1088,31 703,54 420,22 -590,22
G. Harvested wood products -656,48 -656,48 362,5 141,7 -141,5 -367,77 -544,01
5. Waste 8259,32 8007,54 7015,54 6391,43 5384,5 4608,1 4199,4
A. Solid waste disposal 4922,42 4944,8 4932,99 4753,49 4098,33 3613,08 3135,01
B. Biological treatment of
solid waste NO NO NO NO NO NO 53,34
C. Incineration and open
burning of waste 19,96 21,39 22,55 67,61 59,15 14,48 10,88
D. Waste water treatment
and discharge 3316,93 3041,35 2060 1570,33 1227,01 980,55 1000,17
Total CO2 equivalent
emissions without
LULUCF
116381,94 103653,6 74403,08 59366,29 63689,84 60300,91 61482,75
Total CO2 equivalent
emissions with LULUCF 100993,88 88630,25 60717,85 49756,29 54429,75 50693,57 54608,01
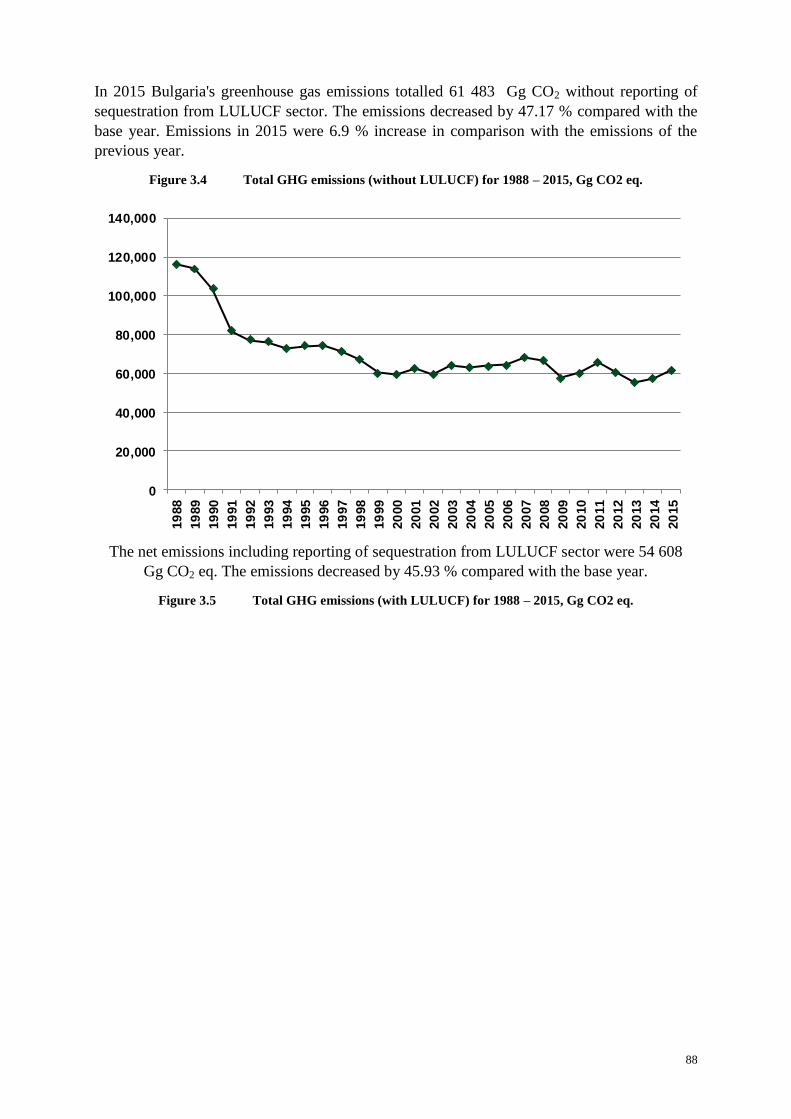
88
In 2015 Bulgaria's greenhouse gas emissions totalled 61 483 Gg CO2 without reporting of
sequestration from LULUCF sector. The emissions decreased by 47.17 % compared with the
base year. Emissions in 2015 were 6.9 % increase in comparison with the emissions of the
previous year.
Figure 3.4 Total GHG emissions (without LULUCF) for 1988 – 2015, Gg CO2 eq.
0
20,000
40,000
60,000
80,000
100,000
120,000
140,000
19
88
19
89
19
90
19
91
19
92
19
93
19
94
19
95
19
96
19
97
19
98
19
99
20
00
20
01
20
02
20
03
20
04
20
05
20
06
20
07
20
08
20
09
20
10
20
11
20
12
20
13
20
14
20
15
The net emissions including reporting of sequestration from LULUCF sector were 54 608
Gg CO2 eq. The emissions decreased by 45.93 % compared with the base year.
Figure 3.5 Total GHG emissions (with LULUCF) for 1988 – 2015, Gg CO2 eq.
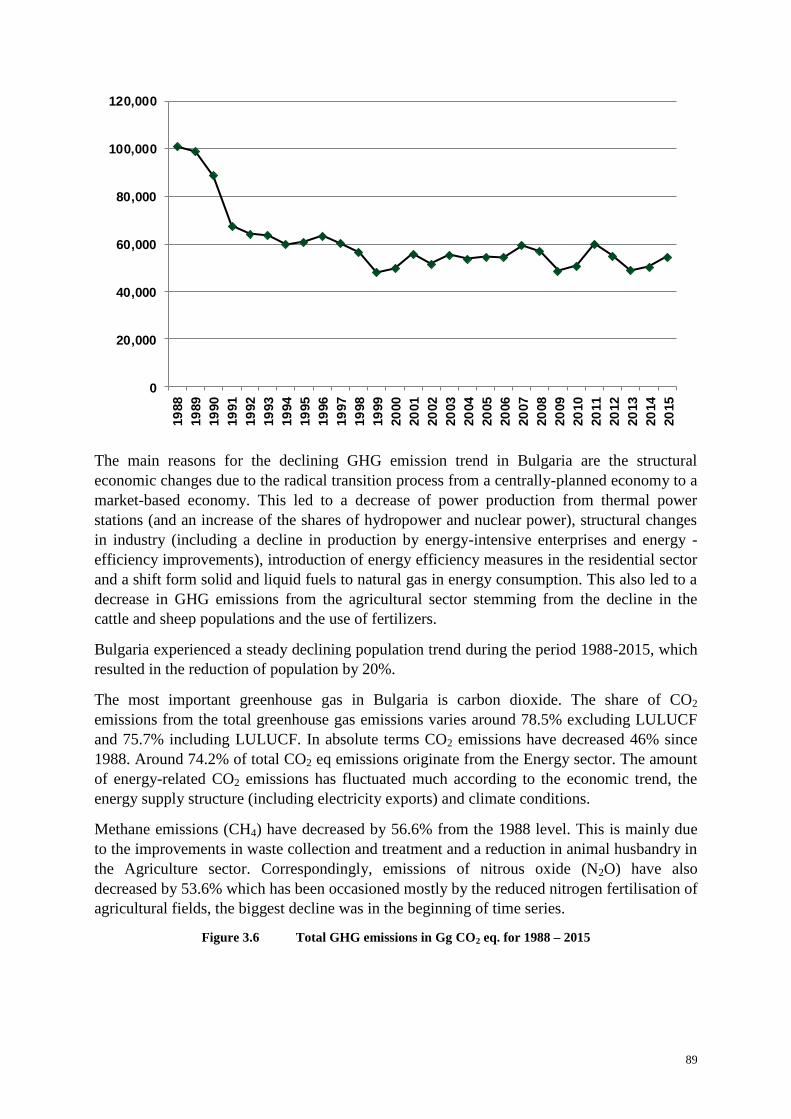
89
0
20,000
40,000
60,000
80,000
100,000
120,000
19
88
19
89
19
90
19
91
19
92
19
93
19
94
19
95
19
96
19
97
19
98
19
99
20
00
20
01
20
02
20
03
20
04
20
05
20
06
20
07
20
08
20
09
20
10
20
11
20
12
20
13
20
14
20
15
The main reasons for the declining GHG emission trend in Bulgaria are the structural
economic changes due to the radical transition process from a centrally-planned economy to a
market-based economy. This led to a decrease of power production from thermal power
stations (and an increase of the shares of hydropower and nuclear power), structural changes
in industry (including a decline in production by energy-intensive enterprises and energy -
efficiency improvements), introduction of energy efficiency measures in the residential sector
and a shift form solid and liquid fuels to natural gas in energy consumption. This also led to a
decrease in GHG emissions from the agricultural sector stemming from the decline in the
cattle and sheep populations and the use of fertilizers.
Bulgaria experienced a steady declining population trend during the period 1988-2015, which
resulted in the reduction of population by 20%.
The most important greenhouse gas in Bulgaria is carbon dioxide. The share of CO2
emissions from the total greenhouse gas emissions varies around 78.5% excluding LULUCF
and 75.7% including LULUCF. In absolute terms CO2 emissions have decreased 46% since
1988. Around 74.2% of total CO2 eq emissions originate from the Energy sector. The amount
of energy-related CO2 emissions has fluctuated much according to the economic trend, the
energy supply structure (including electricity exports) and climate conditions.
Methane emissions (CH4) have decreased by 56.6% from the 1988 level. This is mainly due
to the improvements in waste collection and treatment and a reduction in animal husbandry in
the Agriculture sector. Correspondingly, emissions of nitrous oxide (N2O) have also
decreased by 53.6% which has been occasioned mostly by the reduced nitrogen fertilisation of
agricultural fields, the biggest decline was in the beginning of time series.
Figure 3.6 Total GHG emissions in Gg CO2 eq. for 1988 – 2015
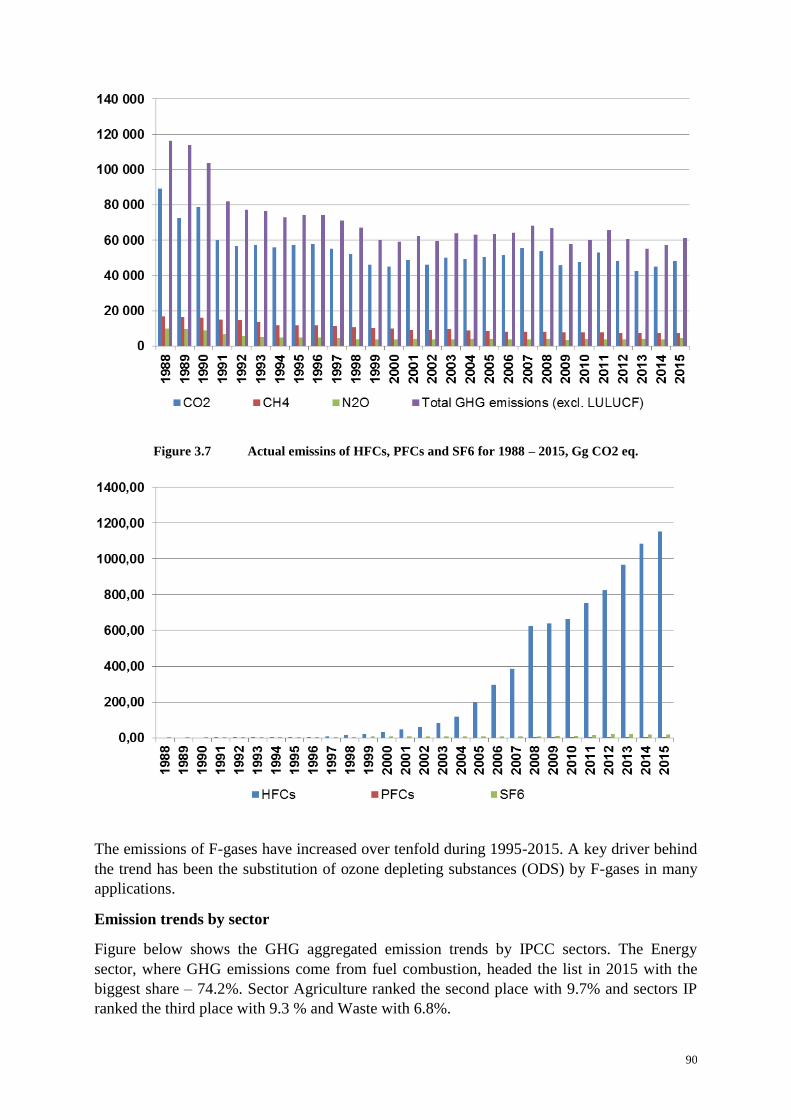
90
Figure 3.7 Actual emissins of HFCs, PFCs and SF6 for 1988 – 2015, Gg CO2 eq.
The emissions of F-gases have increased over tenfold during 1995-2015. A key driver behind
the trend has been the substitution of ozone depleting substances (ODS) by F-gases in many
applications.
Emission trends by sector
Figure below shows the GHG aggregated emission trends by IPCC sectors. The Energy
sector, where GHG emissions come from fuel combustion, headed the list in 2015 with the
biggest share – 74.2%. Sector Agriculture ranked the second place with 9.7% and sectors IP
ranked the third place with 9.3 % and Waste with 6.8%.
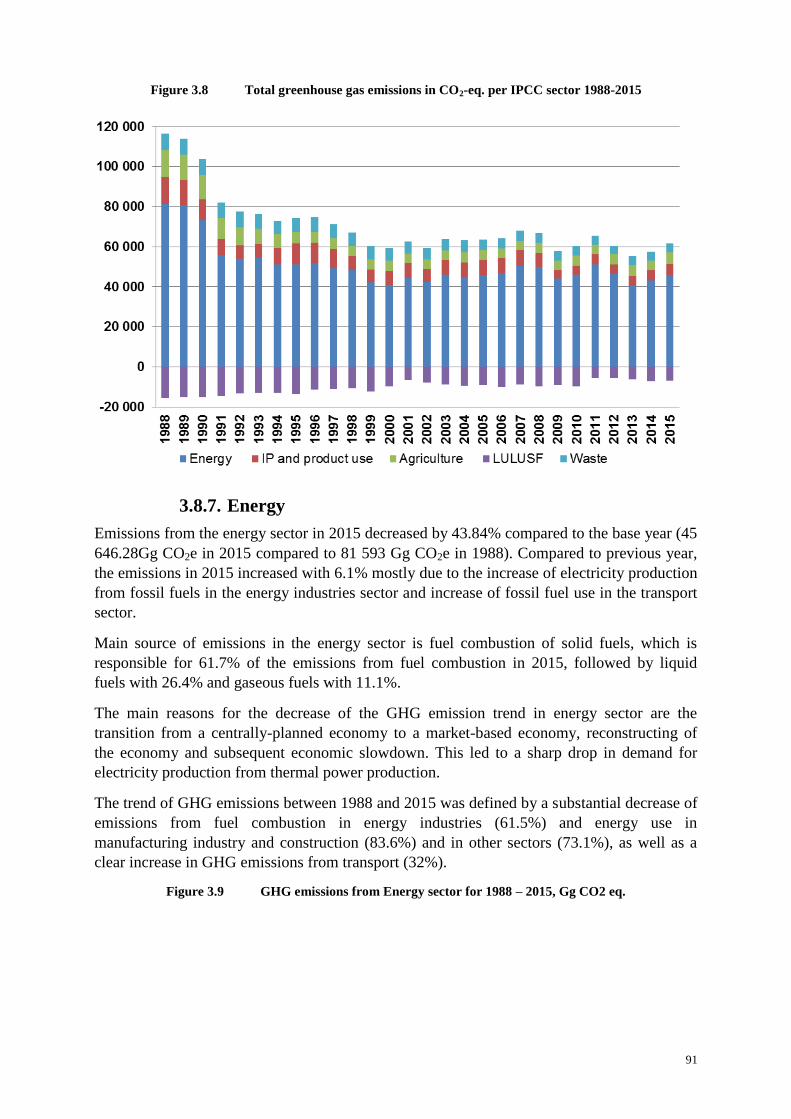
91
Figure 3.8 Total greenhouse gas emissions in CO2-eq. per IPCC sector 1988-2015
3.8.7. Energy
Emissions from the energy sector in 2015 decreased by 43.84% compared to the base year (45
646.28Gg CO2e in 2015 compared to 81 593 Gg CO2e in 1988). Compared to previous year,
the emissions in 2015 increased with 6.1% mostly due to the increase of electricity production
from fossil fuels in the energy industries sector and increase of fossil fuel use in the transport
sector.
Main source of emissions in the energy sector is fuel combustion of solid fuels, which is
responsible for 61.7% of the emissions from fuel combustion in 2015, followed by liquid
fuels with 26.4% and gaseous fuels with 11.1%.
The main reasons for the decrease of the GHG emission trend in energy sector are the
transition from a centrally-planned economy to a market-based economy, reconstructing of
the economy and subsequent economic slowdown. This led to a sharp drop in demand for
electricity production from thermal power production.
The trend of GHG emissions between 1988 and 2015 was defined by a substantial decrease of
emissions from fuel combustion in energy industries (61.5%) and energy use in
manufacturing industry and construction (83.6%) and in other sectors (73.1%), as well as a
clear increase in GHG emissions from transport (32%).
Figure 3.9 GHG emissions from Energy sector for 1988 – 2015, Gg CO2 eq.
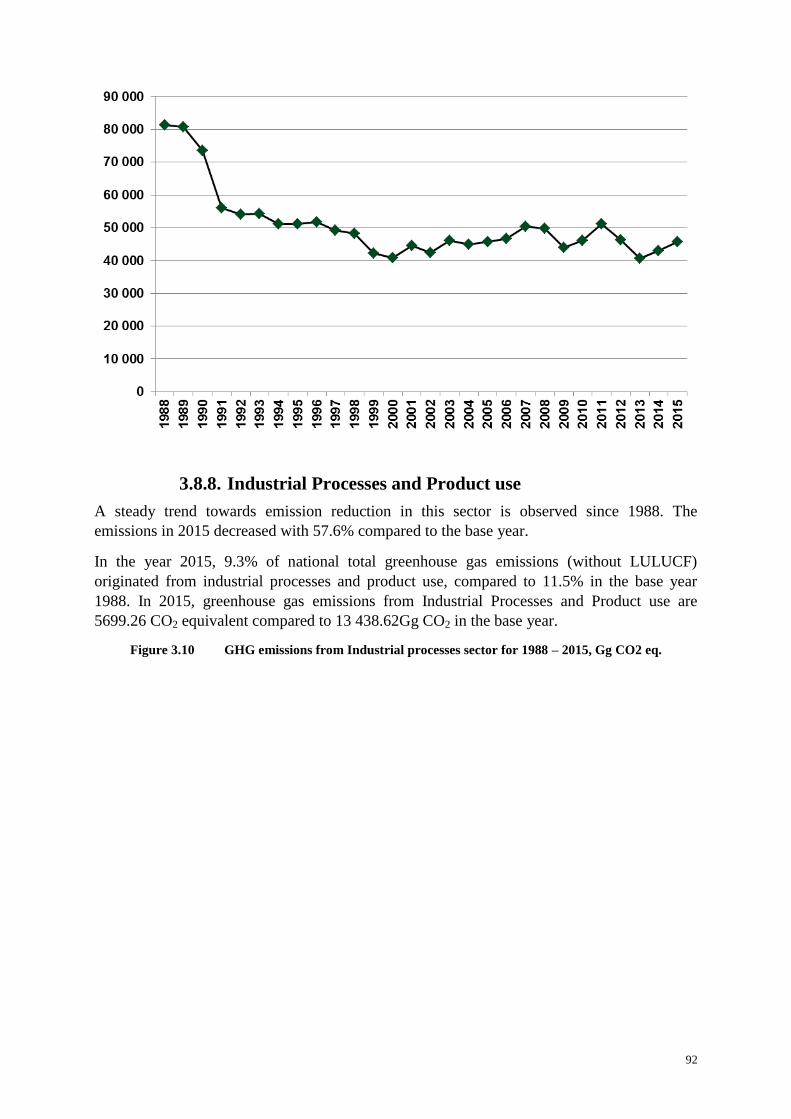
92
3.8.8. Industrial Processes and Product use
A steady trend towards emission reduction in this sector is observed since 1988. The
emissions in 2015 decreased with 57.6% compared to the base year.
In the year 2015, 9.3% of national total greenhouse gas emissions (without LULUCF)
originated from industrial processes and product use, compared to 11.5% in the base year
1988. In 2015, greenhouse gas emissions from Industrial Processes and Product use are
5699.26 CO2 equivalent compared to 13 438.62Gg CO2 in the base year.
Figure 3.10 GHG emissions from Industrial processes sector for 1988 – 2015, Gg CO2 eq.
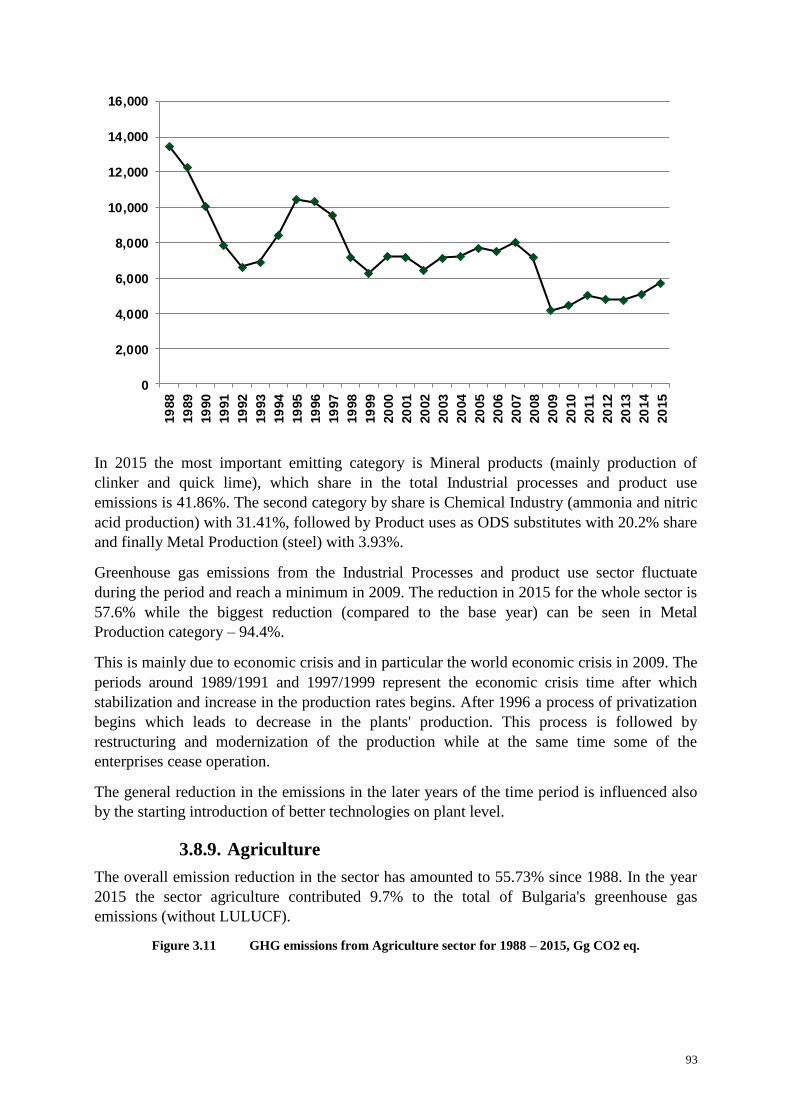
93
0
2,000
4,000
6,000
8,000
10,000
12,000
14,000
16,000
19
88
19
89
19
90
19
91
19
92
19
93
19
94
19
95
19
96
19
97
19
98
19
99
20
00
20
01
20
02
20
03
20
04
20
05
20
06
20
07
20
08
20
09
20
10
20
11
20
12
20
13
20
14
20
15
In 2015 the most important emitting category is Mineral products (mainly production of
clinker and quick lime), which share in the total Industrial processes and product use
emissions is 41.86%. The second category by share is Chemical Industry (ammonia and nitric
acid production) with 31.41%, followed by Product uses as ODS substitutes with 20.2% share
and finally Metal Production (steel) with 3.93%.
Greenhouse gas emissions from the Industrial Processes and product use sector fluctuate
during the period and reach a minimum in 2009. The reduction in 2015 for the whole sector is
57.6% while the biggest reduction (compared to the base year) can be seen in Metal
Production category – 94.4%.
This is mainly due to economic crisis and in particular the world economic crisis in 2009. The
periods around 1989/1991 and 1997/1999 represent the economic crisis time after which
stabilization and increase in the production rates begins. After 1996 a process of privatization
begins which leads to decrease in the plants' production. This process is followed by
restructuring and modernization of the production while at the same time some of the
enterprises cease operation.
The general reduction in the emissions in the later years of the time period is influenced also
by the starting introduction of better technologies on plant level.
3.8.9. Agriculture
The overall emission reduction in the sector has amounted to 55.73% since 1988. In the year
2015 the sector agriculture contributed 9.7% to the total of Bulgaria's greenhouse gas
emissions (without LULUCF).
Figure 3.11 GHG emissions from Agriculture sector for 1988 – 2015, Gg CO2 eq.
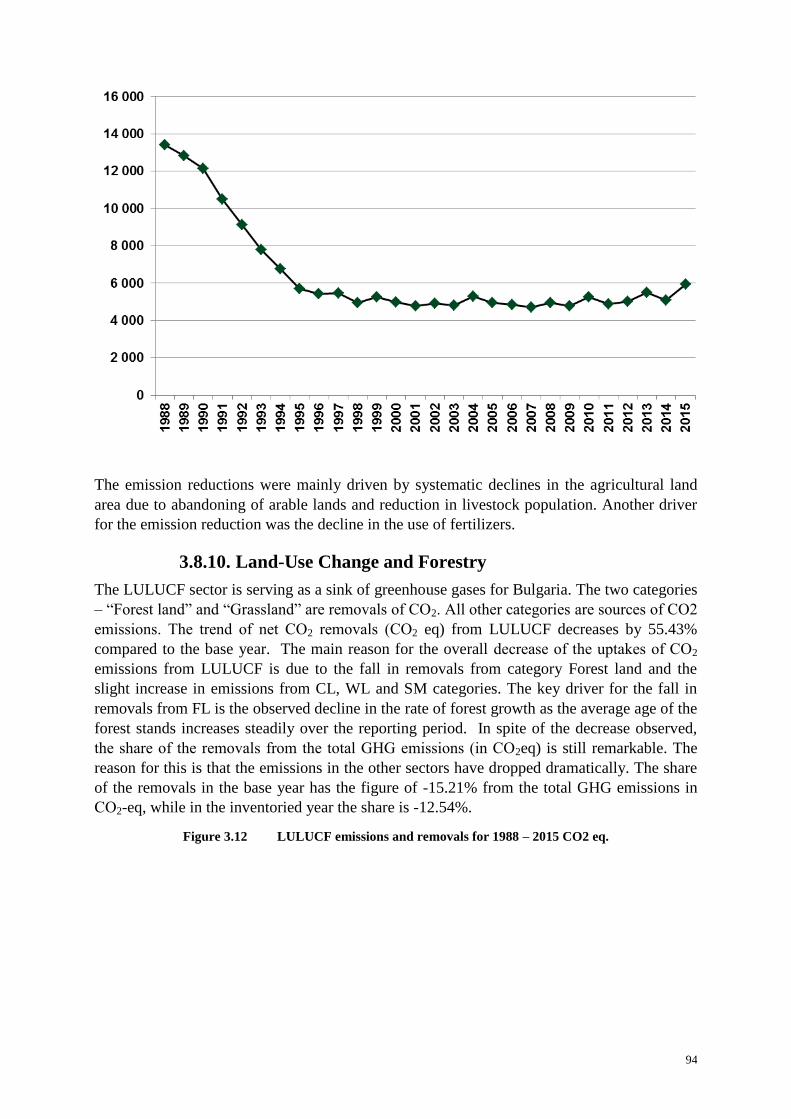
94
The emission reductions were mainly driven by systematic declines in the agricultural land
area due to abandoning of arable lands and reduction in livestock population. Another driver
for the emission reduction was the decline in the use of fertilizers.
3.8.10. Land-Use Change and Forestry
The LULUCF sector is serving as a sink of greenhouse gases for Bulgaria. The two categories
– “Forest land” and “Grassland” are removals of СО2. All other categories are sources of СО2
emissions. The trend of net СО2 removals (СО2 eq) from LULUCF decreases by 55.43%
compared to the base year. The main reason for the overall decrease of the uptakes of СО2
emissions from LULUCF is due to the fall in removals from category Forest land and the
slight increase in emissions from CL, WL and SM categories. The key driver for the fall in
removals from FL is the observed decline in the rate of forest growth as the average age of the
forest stands increases steadily over the reporting period. In spite of the decrease observed,
the share of the removals from the total GHG emissions (in СО2eq) is still remarkable. The
reason for this is that the emissions in the other sectors have dropped dramatically. The share
of the removals in the base year has the figure of -15.21% from the total GHG emissions in
СО2-eq, while in the inventoried year the share is -12.54%.
Figure 3.12 LULUCF emissions and removals for 1988 – 2015 CO2 eq.
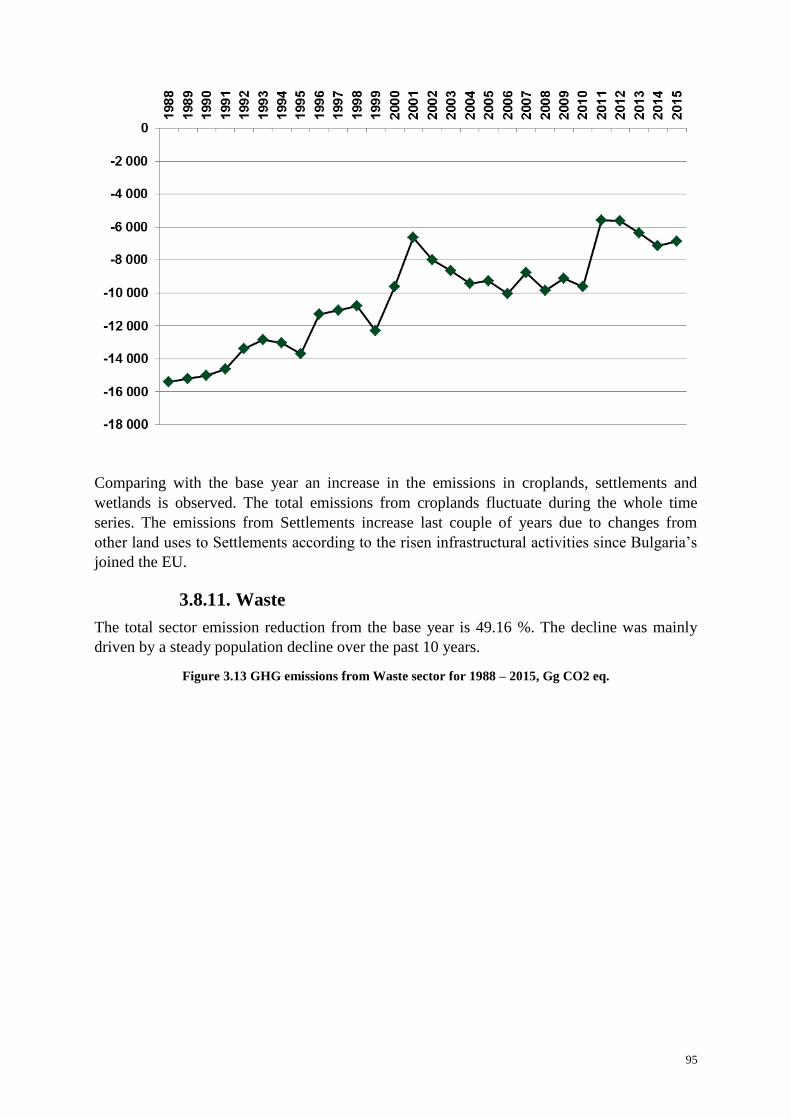
95
Comparing with the base year an increase in the emissions in croplands, settlements and
wetlands is observed. The total emissions from croplands fluctuate during the whole time
series. The emissions from Settlements increase last couple of years due to changes from
other land uses to Settlements according to the risen infrastructural activities since Bulgaria’s
joined the EU.
3.8.11. Waste
The total sector emission reduction from the base year is 49.16 %. The decline was mainly
driven by a steady population decline over the past 10 years.
Figure 3.13 GHG emissions from Waste sector for 1988 – 2015, Gg CO2 eq.
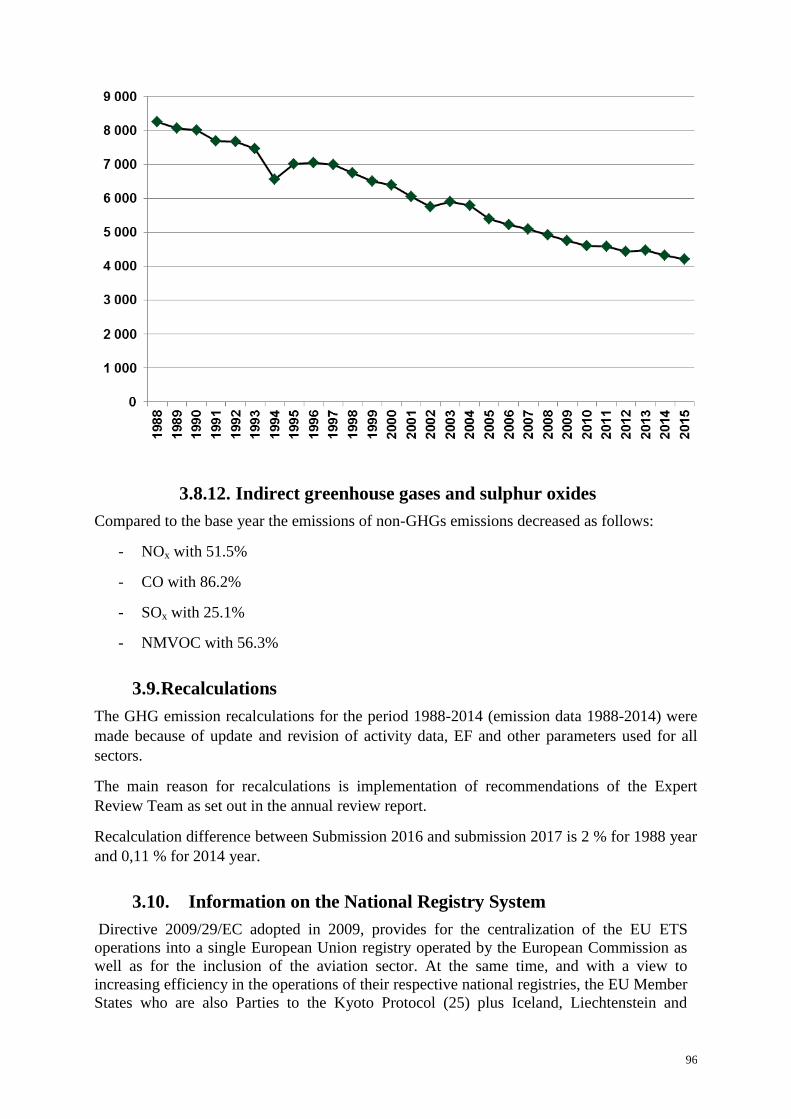
96
3.8.12. Indirect greenhouse gases and sulphur oxides
Compared to the base year the emissions of non-GHGs emissions decreased as follows:
- NOx with 51.5%
- CO with 86.2%
- SOx with 25.1%
- NMVOC with 56.3%
3.9. Recalculations
The GHG emission recalculations for the period 1988-2014 (emission data 1988-2014) were
made because of update and revision of activity data, EF and other parameters used for all
sectors.
The main reason for recalculations is implementation of recommendations of the Expert
Review Team as set out in the annual review report.
Recalculation difference between Submission 2016 and submission 2017 is 2 % for 1988 year
and 0,11 % for 2014 year.
3.10. Information on the National Registry System
Directive 2009/29/EC adopted in 2009, provides for the centralization of the EU ETS
operations into a single European Union registry operated by the European Commission as
well as for the inclusion of the aviation sector. At the same time, and with a view to
increasing efficiency in the operations of their respective national registries, the EU Member
States who are also Parties to the Kyoto Protocol (25) plus Iceland, Liechtenstein and
97
Norway decided to operate their registries in a consolidated manner in accordance with all
relevant decisions applicable to the establishment of Party registries - in particular Decision
13/CMP.1 and decision 24/CP.8.
With a view to complying with the new requirements of Commission Regulation 920/2010
and Commission Regulation 1193/2011, in addition to implementing the platform shared by
the consolidating Parties, the registry of EU has undergone a major re-development. The
consolidated platform which implements the national registries in a consolidated manner
(including the registry of EU) is called Consolidated System of EU registries (CSEUR) and
was developed together with the new EU registry.
Publicly accessible information
Section E of the annex to decision 15/CMP.1 outlines provisions for the national registry to
support, via a user-interface, non-confidential information being made available to the public.
Bulgaria has made this information available on the Executive Environment Agency’s
website:
http://eea.government.bg/
The actual internet address of the Bulgarian registry in the Union registry is:
https://ets-registry.webgate.ec.europa.eu/euregistry/BG/index.xhtml
The following information has been made accessible to the public in line with the
requirements. This information is non-confidential. Bulgaria considers all information to be
confidential that is determined to be confidential according to article 110 of the Commission
Regulation (EU) No 389/2013. Accounts’ holding’s publicly accessible information:
http://eea.government.bg/bg/r-r/r-te/registry/main3
The registry terms and conditions, operators guide, forms and guidance for opening the
holding accounts are available at the website of Executive Environment Agency:
http://eea.government.bg/bg/r-r/r-te/registry/main7
http://eea.government.bg/bg/r-r/r-te/registry/main8
http://eea.government.bg/bg/r-r/r-te/registry/main9
http://eea.government.bg/bg/r-r/r-te/registry/main10
Joint implementation (JI) projects’ publicly accessible information:
http://eea.government.bg/bg/r-r/r-te/registry/main3
The information of approved Joint Implementation projects and their documentation is added
on the website of the competent authority (Ministry of the Environment and Waters) of JI
projects and can be downloaded from the following link:
http://www.moew.government.bg/bg/guvkavi-pazarni-mehanizmi/
Information according to paragraph 45 - 48 of the annex to decision 13/CMP.1:
(a) Account name: the holder of the account;
98
(b) Account type: the type of account (holding, cancellation or retirement);
(c) Commitment period: the commitment period with which a cancellation or retirement
account is associated;
(d) Representative identifier: the representative of the account holder, using the Party
identifier (the two-letter country code defined by ISO 3166) and a number unique to that
representative within the Party’s registry;
(e) Representative names nominated by the account holder and authorized to work with
the account.
The Information includes the following Article 6 project information, for each project
identifier if the Party has issued ERUs for a project:
(a) Project name: a unique name for the project;
(b) Project location: the Party and town or region in which the project is located;
(c) Years of ERU issuance: the years in which ERUs have been issued as a result of the
Article 6 project;
(d) Reports: downloadable electronic versions of all publicly available documentation
relating to the project, including proposals, monitoring, verification and issuance of ERUs,
where relevant, subject to the confidentiality provisions in decision 9/CMP.1.
The information includes the following holding and transaction information relevant to the
national registry, by serial number, for each calendar year:
(a) The total quantity of ERUs, CERs, AAUs and RMUs in each account at the beginning
of the year (displayed in the year X+5, according to the Commission Regulation (EU) No
389/2013 the information is confidential until the year X+5);
(b) The total quantity of AAUs issued on the basis of the assigned amount pursuant to
Article 3, paragraphs 7 and 8 (displayed in the year X+1);
(c) The total quantity of ERUs issued on the basis of Article 6 projects (displayed in the
year X+1);
(d) The total quantity of ERUs, CERs, AAUs and RMUs acquired from other registries
and the identity of the transferring accounts and registries (displayed in the year X+5,
according to Commission Regulation (EU) No 389/2013 the information is confidential until
the year X+5);
(e) The total quantity of RMUs issued on the basis of each activity under Article 3,
paragraphs 3 and 4 (displayed in the year X+1)
(f) The total quantity of ERUs, CERs, AAUs and RMUs transferred to other registries
and the identity of the acquiring accounts and registries (displayed in the year X+5, according
to Commission regulation (EU) No 389/2013 the information is confidential until the year
X+5)
(g) The total quantity of ERUs, CERs, AAUs and RMUs cancelled on the basis of
activities under Article 3, paragraphs 3 and 4 (displayed in the year X+1)
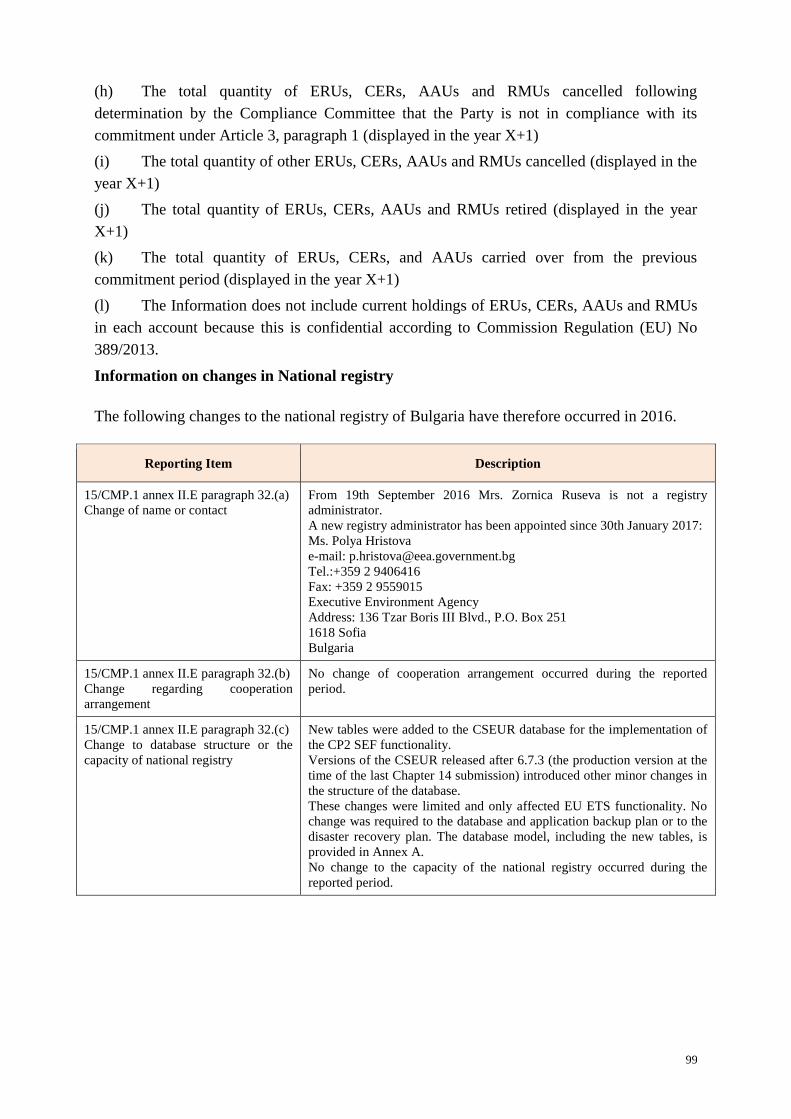
99
(h) The total quantity of ERUs, CERs, AAUs and RMUs cancelled following
determination by the Compliance Committee that the Party is not in compliance with its
commitment under Article 3, paragraph 1 (displayed in the year X+1)
(i) The total quantity of other ERUs, CERs, AAUs and RMUs cancelled (displayed in the
year X+1)
(j) The total quantity of ERUs, CERs, AAUs and RMUs retired (displayed in the year
X+1)
(k) The total quantity of ERUs, CERs, and AAUs carried over from the previous
commitment period (displayed in the year X+1)
(l) The Information does not include current holdings of ERUs, CERs, AAUs and RMUs
in each account because this is confidential according to Commission Regulation (EU) No
389/2013.
Information on changes in National registry
The following changes to the national registry of Bulgaria have therefore occurred in 2016.
Reporting Item Description
15/CMP.1 annex II.E paragraph 32.(a)
Change of name or contact
From 19th September 2016 Mrs. Zornica Ruseva is not a registry
administrator.
A new registry administrator has been appointed since 30th January 2017:
Ms. Polya Hristova
e-mail: [email protected]
Tel.:+359 2 9406416
Fax: +359 2 9559015
Executive Environment Agency
Address: 136 Tzar Boris III Blvd., P.O. Box 251
1618 Sofia
Bulgaria
15/CMP.1 annex II.E paragraph 32.(b)
Change regarding cooperation
arrangement
No change of cooperation arrangement occurred during the reported
period.
15/CMP.1 annex II.E paragraph 32.(c)
Change to database structure or the
capacity of national registry
New tables were added to the CSEUR database for the implementation of
the CP2 SEF functionality.
Versions of the CSEUR released after 6.7.3 (the production version at the
time of the last Chapter 14 submission) introduced other minor changes in
the structure of the database.
These changes were limited and only affected EU ETS functionality. No
change was required to the database and application backup plan or to the
disaster recovery plan. The database model, including the new tables, is
provided in Annex A.
No change to the capacity of the national registry occurred during the
reported period.
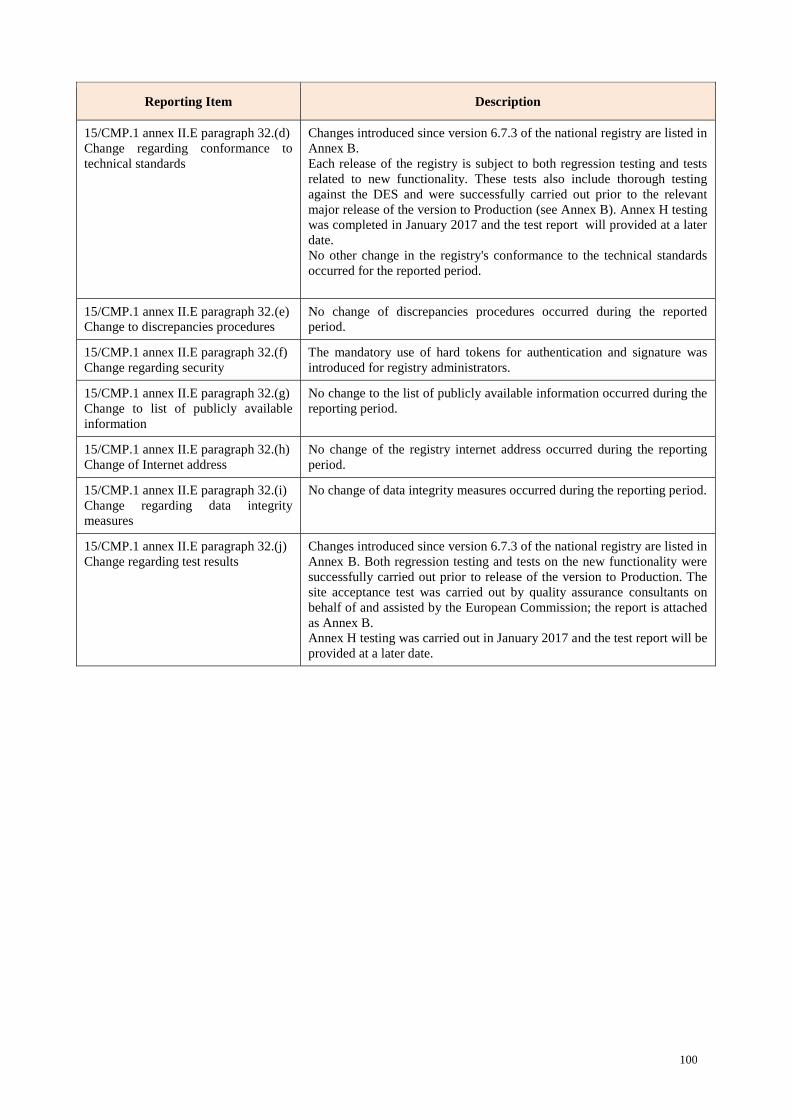
100
Reporting Item Description
15/CMP.1 annex II.E paragraph 32.(d)
Change regarding conformance to
technical standards
Changes introduced since version 6.7.3 of the national registry are listed in
Annex B.
Each release of the registry is subject to both regression testing and tests
related to new functionality. These tests also include thorough testing
against the DES and were successfully carried out prior to the relevant
major release of the version to Production (see Annex B). Annex H testing
was completed in January 2017 and the test report will provided at a later
date.
No other change in the registry's conformance to the technical standards
occurred for the reported period.
15/CMP.1 annex II.E paragraph 32.(e)
Change to discrepancies procedures
No change of discrepancies procedures occurred during the reported
period.
15/CMP.1 annex II.E paragraph 32.(f)
Change regarding security
The mandatory use of hard tokens for authentication and signature was
introduced for registry administrators.
15/CMP.1 annex II.E paragraph 32.(g)
Change to list of publicly available
information
No change to the list of publicly available information occurred during the
reporting period.
15/CMP.1 annex II.E paragraph 32.(h)
Change of Internet address
No change of the registry internet address occurred during the reporting
period.
15/CMP.1 annex II.E paragraph 32.(i)
Change regarding data integrity
measures
No change of data integrity measures occurred during the reporting period.
15/CMP.1 annex II.E paragraph 32.(j)
Change regarding test results
Changes introduced since version 6.7.3 of the national registry are listed in
Annex B. Both regression testing and tests on the new functionality were
successfully carried out prior to release of the version to Production. The
site acceptance test was carried out by quality assurance consultants on
behalf of and assisted by the European Commission; the report is attached
as Annex B.
Annex H testing was carried out in January 2017 and the test report will be
provided at a later date.
101
4. Policies and measures
4.1. Climate policy framework
After Bulgaria joined the European Union (EU) on 1 January 2007 the context of climate
policy in the country changed considerably because apart from the international
commitments under the UN Framework Convention on Climate Change (UNFCCC) and
the Kyoto Protocol (KP) it is now aligned with the existing and newly adopted European
legislation in this area. Over the period 2008-2012 the national climate change policy and
legislation were harmonized with those of the EU and the National Action Plan on Climate
Change (NAPCC) has not been updated during that process. The following steps were
undertaken to comply with the commitments taken as a result of Bulgaria’s full membership
in the EU:
• the provisions of Directive 2003/87/EC establishing a Community greenhouse gas
emission allowance trading scheme were introduced;
• steps were undertaken to introduce the newly adopted EU climate related legislation (the
legislative package “Climate and Energy”), and the legislation for inclusion of aviation in
the Community Emissions Trading Scheme (Directive 2008/101/EC);
• the National System for Greenhouse Gas Inventory was reviewed and revised in 2010 in
order to improve reporting according to the UNFCCC guidelines and the requirements of
the European legislation;
• a functioning Green Investment Scheme was set up to fund projects leading to reduction
of greenhouse gas emissions.
After the adoption of the Bali Action Plan in 2007 the policy on climate change shifted
considerably on global scale following the dynamics of international negotiations to reach a
new global climate agreement that will cover all major (including the so called "emerging")
economies, and an agreement on climate policy management after the first commitment
period under the Kyoto Protocol (after 2012). Bulgaria participates as a full member of EU
within the framework of international negotiations since 2007, i.e. according to the
common, coordinated position of the Union in these negotiations.
4.2. Policy - making process
The Ministry of Environment and Water is responsible for the overall national
environmental policy in Bulgaria including the climate change problems.
It is responsible for applying the adopted legislation on national scale and conceiving new
legislation in the future. The problem for environmental protection is a global one and for
this reason MOEW works together with almost all other ministries. The MOEW has the
following subsidiary bodies: The Executive Environmental Agency, fifteen Regional
Inspectorates for Environment and Water, three National Parks and four Basin Directorates.
The following organizations support the activities of MOEW: The Ministry of Economy,
Ministry of Energy , Ministry of Transport, Information Technology and Communications
(MTITC), The Energy Efficiency Agency (EEA), The Ministry of Agriculture Food and
Forestry (MAFF), The Ministry of Finance (MF), The Ministry of Regional Development
(MRD), The Ministry of Education, Youth and Science (MES), The Ministry of Foreign
Affairs, as well as The National Statistical Institute, The Bulgarian Academy of Sciences
102
etc, which participate in the process of application, development and perfection of GHG
mitigation measures, procedures and mechanisms.
Responsibility of the Ministry of Environment and Water
The Ministry of Environment and Water (MOEW) is the governmental institution
authorized to develop and carry out the state policy related to protection of the environment.
MOEW is responsible for the preparation and reporting of the annual inventories of GHG
emissions, as well as for the formulation and implementation of the policies and measures
to mitigate climate change.
The Ministry of Environment and Water conducts the overall state policy on climate change
mitigation, assisted by the National Expert Committee on Climate Change and Coordinating
Committee on Climate change as an advisory bodies. For the purpose of application and
implementation of the country’s commitments under international, European and national
legislation on climate change, Directiorate Policy on Climate Change is structured within
the Ministry.
National expert Committee on Climate Change
The implementation of the state policy on climate change and the coordination of the
institutions involved in its implementation is also carried out by the National Expert
Council on Climate Change with the Minister of Environment and Water, established by
Order RD-790 of 14.10.2014. The detailed rules for the coordination and interaction with
the institutions, the functions and the organization of work are detailed in the approved
Council's Rules of Procedure.
Coordinating Committee on Climate change
By Order № RD-230 of 04.26.2016 was formed Coordinating Council on Climate Change
in order to assist the Minister of Environment and Water in developing a National strategy
for adaptation to climate change and other issues related to the implementation of the
national climate policy, incl. and coordinating interactions with institutions involved in
policy development and implementation.
Role of implementing agencies and other institutions
ExEA is an administration under the Minister of Environment and Water jurisdiction and is
appointed to carry out management, coordination and information functions as regards the
control and environmental protection in Bulgaria. It designs and manages the National
Environmental Monitoring System for Environmental Monitoring and information on the
state of environmental components and factors at national level. The Agency coordinates
and performs the overall activities on the preparation of the GHG inventories and the
National Inventory Report and National Report on the State and Protection of the
Environment. The ExEA administrates the National GHG Registry.
Sustainable Energy Development Agency within Ministry of energy
organizes the implementation of projects and measures in accordance with the national
long- and short-term energy efficiency programs; approves projects for energy efficiency
and controls their implementation; participates in the preparation of legal regulations in the
field of energy efficiency: proposes development and improvement of energy efficiency
standards in order to achieve approximation to the EU norms and to encourage energy
efficiency at the demand side; cooperates with central and regional governmental
institutions, employers’ associations, branch organizations, consumer associations and
NGOs on implementation of energy efficiency policies and measures; maintains the
national information system on energy efficiency, develops guidelines for establishments
103
and maintenance of EE information systems for central and regional governmental
institutions; develops programs for implementation and control of EE measures and
programs for EE awareness rising; develops programs for implementation of EE on local
(municipal) level; cooperates in implementing EE training.
Municipalities
The major responsibility of municipal energy management is imposed upon local
authorities. The rational use of energy as well as its production and supply at local level,
became responsibility of municipal authorities. The basic instrument for energy
management in municipalities is the local (municipal) energy planning.
Municipal energy efficiency planning is obligatory according to the Energy Efficiency Law.
Therefore, the municipal administration has to adopt the following programmes:
Refurbishment of the housings, administrative and utility buildings throughout the
municipal territory aiming to carry out measures for energy efficiency;
Introduction of energy-saving appliances for street lighting in settlements and in
public buildings;
Other measures for improvement of energy efficiency.
4.3. Domestic and regional programmes, legislative arrangements.
4.3.1.Domestic and regional programmes
In Bulgaria the Regions do not have a direct competence in the area of protection of global
climate system. Nevertheless, the Regional bodies remain responsible for overall
development of its territory and for addressing the needs of its population in general terms.
This is the foundation of the regional role of responsible bodies in creation of Regional
development concepts and plans including water management plans for river basins and
flood prevention measures, principles of territorial development. Regional bodies are also
involved in implementation of the below specified energy savings programmes and use of
RES, restoration of housing fund (central heating supply systems, revitalization of housing
estates) and improvement of transportation infrastructure. Regions also play a large role in
preparation of waste management plans and in actual waste management (operation of
landfills, composting facilities, facilities involved in energy and material recovery of waste
etc.).
4.3.2. National programmes
An integrated and complex system of strategic and operational planning has gradually been
created, which is further modified in line with international commitment of Bulgaria
whether assumed pursuant to post-Kyoto processes or EU policies and legislation.
Legislative measures also lay down rules for institutional responsibilities for coordination
and implementation of various programmes.
National Development Programme: “Bulgaria 2020”;
Energy Strategy of the Republic of Bulgaria until 2020;
National Energy Efficiency Programme until 2015;
National Action Plan for Renewable Energy;
Third National Climate Change Action Plan (2013 – 2020).
104
National Programme for Promotion of the Biofuels Use in the Transport Sector
2008-2020;
Integrated Transport Strategy for the period until 2030
Strategic Plan for Development of the Forestry Sector in the Republic of Bulgaria
2014-2023
National Strategy for the Development of the Forestry Sector in the Republic of
Bulgaria for the period 2013-2020
Energy strategy of the Republic of Bulgaria until 2020
National waste prevention programme (NWPP) 2014 - 2020
National Waste Management Plan (NWMP) 2014 – 2020
National Regional Development Strategy
The most important strategic documents and programme with direct or demonstrable
indirect effect on greenhouse gas emissions:
Green Investment Scheme
In June 2010 an Amendment to the Environmental Protection Act (EPA) was approved by
the Council of Ministers and the National Assembly. The new legislation creates the main
legal framework of the Bulgarian National Green Investment Scheme (NGIS) and allows
Bulgarian government to participate in the International Emission Trading mechanism
according to the Article 17 of the Kyoto Protocol. EPA defines the entire process from
selling of AAUs to “greening” of the revenues. EPA empowers the National Trust Eco Fund
(NTEF) to administer and implement the NGIS. NTEF elaborates rules for selection,
assessment and approval of projects that would reduce emissions and would be reimbursed
by the NGIS.
In order to exploit the possibilities for financing projects to reduce greenhouse gas
emissions through the National Green Investment Scheme is a decision of the Council of
Ministers № 546/12 September 2013 for addition to the agreement with Austria for the
purchase of AAUs in Scheme green investments. It is accepted and a decision of the
Council of Ministers № 547/12 September 2013 in connection with the implementation of
projects under the Green Investment Scheme.
The funds from the sale of AAUs of the Republic of Austria have implemented projects for
energy efficiency of the 77 public facilities state and municipal property in Bulgaria. Public
projects to improve energy efficiency in municipal buildings, kindergartens and primary
schools. Realized are energy efficiency projects at 13 public sites throughout the country.
In 2015 was started the Investment Climate Programme, which is a kind of continuation of
the National Green Investment Scheme. The new programme is implemented by Trust Eco-
Fund and it is financed by the revenues from so called “early auctions” of greenhouse gas
emissions allowances from installations paid into the budget of the Ministry of Environment
and Water by 31st December 2012. The funds are designated to be used for financing of the
projects aiming at improving of energy efficiency of state and municipal public buildings,
as well as for promoting the use of electric and hybrid vehicles by public institutions (since
2016).
Third National Climate Change Action Plan (2013 – 2020)
105
The economic and political development in Bulgaria after the year 2007 along with changes
in the international and domestic policy and regulatory framework required an update of the
Second Action Plan.
In June 2012 the Third National Action Plan (2013 – 2020) was approved by the Council of
Ministers. The Third National Action Plan on Climate Change outlines the framework for
action on climate change for the period 2013-2020 in order to fulfill the obligations under
The United Nations Framework Convention on Climate Change, The Kyoto protocol and
the “Climate - Energy” package of the European Union.
The main objective of the Third National Action Plan on Climate Change (NAPCC) is to
outline the framework for action to combat climate change for the period 2013-2020 and to
focus the country’s efforts on actions leading to reduction of the negative impacts of climate
change and implementation of the undertaken commitments.
The Third National Action Plan on Climate Change provides specific measures for
reduction of greenhouse gas emissions across all sectors and these measures are consistent
with both the national policy on climate change and the potential of the national economy to
reduce emissions. The overall effect of the measures will ensure the implementation of the
commitments taken and the achievement of the legally binding European objectives,
namely:
20% increase in energy efficiency;
20% reduction of greenhouse gas emissions compared to their 1990 levels;
20% share of renewable energy in the total EU energy consumption by 2020
including a 10% share of biofuels in transport.
The “three 20” are tightly interrelated. Achieving 20% reduction in greenhouse gas
emissions would be impossible without progress in the other two relating to the promotion
of renewable energy and energy efficiency.
Special attention is drew to the legislative package “Climate and Energy”. The package of
legislative measures relates to: the revision of the existing emission trading scheme of the
Community; the establishment of differentiated ceilings for greenhouse gases for sectors
outside the scheme (transport, building, agriculture, waste); the formulation of binding
national targets for increasing the share of renewable energy in the energy balance and
introduction of rules to promote new technologies for carbon capture and storage. A
number of flexibility mechanisms are provided for in order to achieve the objectives in a
cost-effective way. 2005 was chosen as a reference year for setting the 2020 targets,
because the first verified data on greenhouse gas emissions are since that year.
Reduction of greenhouse gas emissions from the sources within the scope of the scheme by
21% compared to their 2005 levels is set for all EU Member States through a linear factor
for reducing the permitted emission ceiling for the sectors under the European Trading
Scheme (ETS). The main flexibility mechanism in the revised scheme is the redistribution
of rights for emission allowances trading (auctioning rights), which is expected to generate
substantial financial resources for investment in the improvement of energy efficiency,
promotion of renewable energy and reduction of greenhouse gas emissions. For the sectors
outside the scheme the differentiated emission ceilings range from -20% to +20%. Bulgaria
has an individual commitment allowing it to increase the emissions by 20% compared to
their 2005 level. The national objectives of the Member States in terms of share of
renewables in the final energy consumption by 2020 range from 10% to 49%. Bulgaria’s
goal is set at 16%, including 10% share of biofuels in the final consumption of transport
fuels.
106
The “Climate and Energy” package does not contain direct binding measures to improve
energy efficiency although it has an indirect effect in this direction. The individual
commitments of Member States in the field of energy efficiency are still taken on a
voluntary basis and are rather political than legally binding. At this stage they are defined in
the context of the strategy “Europe 2020” where resource (including energy) efficiency is a
flagship initiative. According to the commitment undertaken within the framework of
“Europe 2020” Bulgaria aims to reduce the energy intensity of GDP by 50% by 2020. The
implementation of the energy efficiency measures and policies set in the National Energy
Strategy until 2020 aims to lead to an improvement of the energy efficiency by
approximately 25% or to saving more than 5 mln. toe. primary energy compared to the
baseline development scenario by 2020.
NAPCC presents an assessment of the status and trends of greenhouse gas emissions in
Bulgaria until 2009 in various sectors and the scenarios and projections of the emissions in
these sectors by 2030 before and after the implementation of the measures.
The policies and measures planned to achieve the objectives of the country with regard to
climate change are presented by sectors and represent the most significant and voluminous
part of the Third Action Plan on Climate Change. The process of selection of specific
measures in each sector includes consultations with the relevant government institutions,
numerous consultations with stakeholders, businesses, NGOs and academic circles. The
received comments and opinions on the proposed policies and measures have been taken
into account. Thus transparency and coordination in preparing the Plan is ensured.
After specifying the policies and measures by sector, their feasibility was analyzed from
economic point of view. The effective reduction of greenhouse gas emissions was assessed
without need to reduce the production and the consumption on the basis of the baseline
scenario for the economic development of the country by 2030.
NAPCC pays special attention to the administrative capacity necessary to implement the
planned measures, as well as to the responsibilities for monitoring and reporting the
implementation of the Plan. Besides the leading role of the competent institutions it
underlines the specific role and functions of municipalities. A special feature of the
activities on climate change is that they cover a large number of institutions and bodies both
from the central and the local authorities because of their horizontal and cross-cutting
nature.
Programme for Promotion of Biofuels Use in the Transport Sector 2008-2020
The main goals are promoting diversification of energy supplies, encouragement of the
production and use of biofuels in transport, environmental protection and establishing the
conditions to achieve sustainable development at the local and regional level.
The national indicative targets on biofuel consumption are set. This programme is one of
the instruments for meeting the fixed indicative targets. The possibilities of growing energy
crops and producing biofuels in Bulgaria are considered.
The national competent authority for the implementation of the National Programme is the
Ministry of Economy and Energy.
Integrated Transport Strategy for the period until 2030
The Integrated Transport Strategy for the period until 2030 was adopted by the Council of
Ministers of the Republic of Bulgaria with Decision No 336/23 June 2017. The strategic
document is in compliance with the requirements of the Ex-Ante Conditionality’s 7.1, 7.2
and 7.3 (Transport) of the European Structural and Investment Funds.
107
The Strategy is in accordance with the Partnership Agreement of the Republic of Bulgaria.
The Integrated Transport Strategy for the period until 2030 was adopted by the Council of
Ministers of the Republic of Bulgaria on 21 June 2017.
The strategic objectives of the transport policy for the period until 2030 are:
Increasing the effectiveness and competitiveness of the transport sector
Improvement of the transport connectivity and access (internal and external)
Limiting the negative effects of the transport sector development.
The strategic priorities of the transport sector are as follows:
Effective maintenance, modernization and development of transport infrastructure
Improvement of the management of the transport system
Development of intermodal transport
Improvement of the conditions for implementation of the principles for liberalization
of the transport market
Reduction of the consumption of fuel and increasing the energy efficiency of
transport
Improvement of the connectivity of the Bulgarian transport system with the Single
European transport space
Ensuring quality and easily accessible transport in all regions of the country
Limiting the negative effects of transport on environment and people’s health
Increasing security and safety of the transport system.
As a part of the Strategy a National Transport Model is prepared. The model covers freight
and passenger traffic as well as all modes of transport. On the basis of the model different
scenarios for the transport sector development are elaborated.
For the purposes of the investment programming some projects are identified and their
realization will contribute to the sustainable development of the transport sector in medium
and long-term period.
National Strategy for the Development of the Forestry Sector in the Republic of
Bulgaria for the period 2013-2020
The Strategy is main document that defines the strategic framework of the state policy for
achieving long-term and sustainable management of vital and productive multifunctional
forests and growing competitiveness of the forestry sector as a basis for a better standard of
living, especially in mountain and rural areas. A prerequisite for the sustainable
development of the forest territories is the three levels of forest planning - national, regional
and local, as defined in the Forestry Act, reflected respectively in the National Strategy for
the Development of the Forestry Sector, the Strategic Plan for the Development of the
Forestry Sector, territories and forestry plans and programs.
Strategic Plan for Development of the Forestry Sector in the Republic of
Bulgaria 2014-2023
108
This plan is developed with the financial support of the European Social Fund under
Operational Program Administrative Capacity’s project "Strategic Planning in the Bulgarian
Forests – a Guarantor for Effective Management and Sustainable Development". These
strategic documents can be found on the website of the Executive Forest Agency (EFA):
http://iag.bg/docs/lang/1/cat/5/index.
The implementation of the Operational objectives with the corresponding budget, timeline,
expected results, performance indicators, responsible institutions and stakeholders is
regulated in specific sub-activities in SDPFS as follows:
Operational objective 1 from SDPFS "Increasing of the forest area, tree growing stock and
the stock of carbon in forest areas"
Operational objective 2 from SDPFS "Improving the management and use of forests"
Operational objective 3 from SDPFS "Increasing the effectiveness of preventing and
combating forest fires and illegal activities in the forests"
Operational objective 4 from SDPFS "Increasing the resilience and adaptability of forest
ecosystems to climate change"
The above mentioned operational objectives and activities are expected to have a direct and
sometimes indirect positive effect on both the adaptation of forest ecosystems to climate
change, as well as on the reduction of the negative impact of climate change, including by
increasing the absorption of greenhouse gases from the atmosphere.
The aforementioned “Programme of Measures for the Adaptation of Forests in the Republic
of Bulgaria and Mitigation of the Negative Impact of Climate Change on them” is approved
in 2011 by the Minister of Agriculture and Food under the proposal of the Executive
Director of EFA. In the Program are identified and designated concrete measures (the
Program is published on the EFA website at http://www.iag.bg/docs/lang/1/cat/5/index).
As regards the management of pastures, grasslands and meadows from the State and
Municipal Land Funds (SLF and MLF), given that these are lands with special status,
whose main purpose is their use for livestock grazing and mowing, to this moment is
prepared an Amending Act of the Ownership and Use of Agricultural Land Act, introducing
a simplified regime for the use of these lands as intended. The draft legislative act provides
for rental and lease of pastures, grasslands and meadows of SLF and MLF to be done
without a tender procedure, as they will be allocated only to the owners or users of holdings
with grazing livestock registered in the System for animal identification and registration of
holdings under Bulgarian Food Safety Agency, according to the number and type of
registered animals at market price determined by an independent appraiser in accordance
with the conditions for maintaining the land in good agricultural and environmental
condition. Pastures, grasslands and meadows of SLF and MLF remaining free after
allocation of their registered owners of grazing animals will be auctioned, and to persons
who undertake responsibility to maintain them in good agricultural and environmental
condition. Rental contracts and leases concluded in this way can be terminated before the
expiry of their term, if there is non-compliance with the conditions for maintaining the land
in good agricultural and environmental condition defined pursuant to Art.42 of the Farmers
Support Act. It should be noted that the purpose of sustainable and strict management of the
landed estates of the SLF, which fall within the ecological network of special areas of
conservation, called "Natura 2000", representing a way of permanent usage - "pastures",
"pastures, grasslands", "pastures with shrubs", "meadows" or "fields" - private state
property, for which Ministry of Environment and Water has issued orders to comply with
specific restrictions and the exact borders. They are brought to the attention of MAF for
109
their reflection in the sketches of the landed estates. They are available for use in strict
compliance with the restrictions, which are monitored in the checks.
On pastures of municipal land, the existing provisions of the Ownership and Use of
Agricultural Land Act is stipulated that the decision of the municipal council, annually lays
down rules for the use of grasslands and pastures that contain:
- Operational perspective plan for grazing;
- Parts of grasslands and pastures, mainly for mowing;
- Measures for the protection, maintenance and improvement of grasslands and
pastures, such as cleaning of bushes and other unwanted vegetation, anti-erosion activities,
fertilization, temporary fencing;
- Parts of grasslands and pastures for artificial pasture for planting with appropriate
grass mixtures;
- Mode of use, prohibitions and restrictions depending on the specific features of the
landscape, soil, climate and other natural conditions.
According to the provision of Art.25 of the Ownership and Use of Agricultural Land Act is
determined that the ownership of the municipalities on pastures and grasslands is public and
only exceptionally allowed to be declared as private municipal property, in case of the
change of use of grasslands and pastures under the Municipal Property Act, in cases defined
in Paragraph 3 (points from 1 to 5) of the above-mentioned article, as follows:
- for construction of technical infrastructure under the Spatial Planning Act;
- for investment projects received a certificate for investment class A or class B or
priority investment project under the Investment Promotion Act when it stated in the
certification of the project;
- for creating of new or expand existing construction boundaries of urbanized areas
(settlements and settlement formations), as well as creating or expanding the boundaries of
individual regulated landed estates outside them;
- for investment projects related to socio-economic development of the municipality;
- other cases determined by law.
In the above-listed cases, the municipal council adopts a decision expressing prior consent
to change the use of pastures and grasslands, subject to the terms and conditions regulated
by special laws (Protection of Agricultural Land Act) and regulations to maintain a reserve
of permanent grasslands, and provided that there is no shortage of land for the needs of
livestock.
As regards to the arable lands, pursuant to Art. 7 of the Ownership and Use of
Agricultural Land Act, is regulated that the eroded, polluted, salty, acid and waterlogged
agricultural lands are recovered and improved on the basis of a set of activities or
technologies that operate on the basis of pre-designed, coordinated and approved
technologies and projects approved by the Expert Council.
Mines, quarries and other areas with disturbed soil profile, ash ponds, tailings, landfills and
other waste depots, old riverbeds, routes of abandoned canals, roads, railways and
construction sites after dismantling of engineering equipment, finishes and superstructure
110
are subject to reclamation, which is based on pre-established, coherent and approved the
project, which is an integral part of the project for construction of the site. The procedure
for using humus after its withdrawal, reclamation, land improvement and the adoption of
reclaimed areas is defined in Regulation № 26 for land reclamation, improvement of low-
productive lands, withdrawing and utilization of the humus layer.
One of the main strategic documents containing measures for the Land Use, Land-Use
Change and Forestry sector, is the Third National Action Plan on Climate Change
(NAPCC) (http://www.moew.government.bg/?show=top&cid=570)
- National Waste Management Plan (NWMP) 2014 – 2020
The National Waste Management Plan (NWMP) plays a key role in achieving a resource
efficient and sustainable waste management, as the analysis of the current situation shows
that in Bulgaria there is significant potential to improve waste prevention and its
management, better use of resources, development of new markets and new jobs, as at the
same time reduce the harmful effects of waste on the environment
NWMP is based on the following principles:
Prevention "- waste should be reduced and avoided where it is possible.
"Extended producer responsibility" and "polluter pays" - those who produce or
contribute to waste generation or pollute the environment or current waste holders
must cover the full costs for waste treatment and should manage them in a way that
ensures high level of protection of the environment and human healthcare.
“Precaution” - potential waste problems should be foreseen and avoided at the
earliest possible stage.
“Self-sufficiency and proximity” – waste should be disposed as near as possible to
the place of their generation as waste generated in the EU should be treated within
the union.
„Public participation“ – relevant stakeholders and authorities as the general public
have the opportunity to participate in the development of waste management plans
and waste prevention programs and have access to them after their development.
National waste prevention programme (NWPP) 2014 - 2020
Bulgaria has developed a National waste prevention programme (NWPP) in accordance
with the requirements of the WFD and Article 50 of the Waste Management Act for the first
time. NWPP is an integral part of NWMP and identifies measures for implementation of the
highest level in the waste management hierarchy. The fourth NWMP is the transition from
waste management to the efficient use of waste as resources and sustainable development
by prevention of their generation, as far as possible. Successful implementation of the plan
will lead to the prevention and reduction of the harmful effects of waste on the environment
and human health and reduce the use of primary natural resources. The plan supports the
central and local authorities to concentrate limited financial resources from national and EU
sources on priority projects in the field of waste management.
Waste Management Programmes (WMP)
Waste Management Programmes (WMPs) are developed and implemented by the mayors
on the territory of the respective municipality.
111
Energy strategy of the Republic of Bulgaria until 2020
The strategy covers four main areas: tackling adverse climate changes; reducing the energy
intensity of economy and increasing energy efficiency; reducing the external dependency of
the European Union on imported energy resources; promoting economic growth and
employment; and provision of secure and affordable energy to users. The availability of a
well-developed internal energy market is indicated as both an objective and a means of
achieving the goals.
A number of steps are planned in the Medium-term Programme till 2013 of the Energy
Strategy including adoption of strategies, plans and programmes in various sectors of
energy management:
1. Energy security for the Bulgarian industry and population
Diversification of the sources and routes for supply of natural gas.
Provision of Regulatory incentives for investments in the network infrastructure and
for development of the grids adequate to the needs of their users, including
application of the „smart grids“concept.
Development by the end of 2011 and adoption of a District Heating Sector
Stabilization and Development Program.
Institutional support and monitoring of projects of strategic significance to energy
security, including those of investors in new power plants (required for balancing
the generation by wind and solar power plants), as well as in a new nuclear capacity
as a project with prevailing participation of foreign investors.
Institutional support and monitoring of projects for construction of new and/or
replacing capacities using indigenous coal and mandatorily using up-to-date highly
efficient and low-emission carbon capture and storage technologies, including
technologies for development and improvement of the power system.
Construction of a national storage for radioactive waste and a dry storage for spent
nuclear fuel in conformity with the best international standards.
Updated Strategy for management of spent nuclear fuel and radioactive waste.
Development of a system of adequate mechanisms for energy social protection.
2. Reduction of greenhouse gas emissions
Timely creation of working mechanisms for conducting of bids for greenhouse gas
emission allowance after 2013 and participation in a Common-European trading
platform.
Regulation of the spending of revenues from the bids for greenhouse gas emission
allowance in projects for sustainable energy development, construction of „smart
grids“ and creation of administrative capacity and procedures for project selection
and evaluation.
Active participation of the state in the European procedures for financing of clean
technologies – demonstration projects for capture and storage of carbon dioxide and
innovative projects for renewable energy.
3. Increase of the share of renewable energy sources in the total final energy demand
112
Increase the share of electric power generated by renewable energy sources (RES),
using mechanisms for achievement of the quantitative targets at the least cost to
users.
Adoption of a National Action Plan for energy from renewable sources till 2020.
Imposition of the requirements of Directive 2009/28/ЕU – adopting of a new law
and secondary legislation on renewable energy with a view to removing the barriers
hindering the integration of RES into the electricity and gas networks and
implementation of a package of measures for promotion of investments in RES
technologies, generation and consumption of energy from renewable sources and
scientific research.
Improvement of the existing support mechanisms for the generation and
consumption of energy from renewable sources and financial incentives of projects
through specialized credit lines, financing from European funds and programs and
from other sources.
Creation of favourable conditions for development of a market for electric road
vehicles, including ones supplied by RES, as well as of systems for storage of
energy.
Acceleration of the work for implementation of joint projects for utilization of the
existing hydro-power potential in the country.
4. Energy Efficiency Enhancement
Development and adoption of a National Energy Efficiency Strategy of the Republic
of Bulgaria till 2020 with emphasis on the promotion of measures for energy
efficiency in the residential sector, in the public buildings, transport and industry.
Changes in the Energy Efficiency Act (EEA) related to transposition of the
requirements of Directive 2010/31/ЕU on the energy characteristics of buildings,
stimulation of the energy services market and accelerated adoption of market
mechanisms for promotion of energy efficiency.
Development of a second National Energy Efficiency Action Plan the purpose of
which is to detail the requirements towards programs in specific sectors and to
formulate the high-priority measures for energy efficiency for the period 2011 –
2014.
Development, by the end of 2011, and adoption of a Program for Accelerated
Gasification of the Republic of Bulgaria, the performance of which is expected to
save considerable amounts of primary energy.
Financial incentives for energy efficiency measures through schemes of the Energy
Efficiency Fund, specialized credit lines, financing under European funds and
programs and creation of additional schemes and instruments, including those for
performance of the national program for refurbishment of residential buildings in the
Republic of Bulgaria.
5. Building of a competitive energy market as a way to achievement of high priority
objectives - competitiveness, energy security & sustainable development
Amendments and supplements to the Law on Energy and the secondary legislation
transposing the requirements of the Third Liberalisation Package for the purpose of
creating an efficient energy market, transparency of the public energy companies in
combination with better protection of the rights of consumers.
113
Development, by the end of 2011, and adoption of a Programme for Accelerated
Market Development of the Electric Power Industry.
Creation of a power exchange.
Enhancement of the professional capability and independence of the Regulatory
body in the energy sector.
Protection of the rights of consumers.
6. Better utilization of the indigenous energy resources
Development, by the end of 2011, and adoption of a Programme for efficient use of
the indigenous energy resources, taking also into account the opportunities for
sustainable and ecologically sound use and management of soils with preservation
of their environmental functions and prevention of their damage, as well as
reclamation of already damaged soils and limiting and/or mitigation of damages to
levels free of risk to the environment and human health.
Updating of the legislative basis with a view to guaranteeing unified management of
mineral resources.
Standardization of the procedures and documents related to granting of rights for
prospecting, exploration and production of mineral resources, inclusive of
promotion of the development of new gas fields in the country.
7. Alternatives to the supply of natural gas
The security risks can be managed through diversification of the energy resource types,
sources, suppliers and routes taking into account the regional and global trends in the
energy markets. Viewed from that angle, the diversification of energy supply will assist the
creation of competition between the main energy suppliers and will stabilize the prices of
primary energy resources.
Construction of terminals for import of liquefied and compressed natural gas, through
which alternative gas supply for the country will take place, as well as of the lacking
infrastructure – interconnections with neighbour countries, will be an indispensable element
of the set of measures for guaranteeing, in the long-term, the security of supply to the
country, and also as a mechanism that will contribute to more flexible crisis response.
The access to alternative sources and routes for import will enable the achievement of more
competitive conditions in the import of natural gas from gas-producing countries, such as
the countries of the Caspian region and Asia Minor, as well as from Algeria, Egypt, Libya,
Qatar, Oman, United Arab Emirates, Nigeria, etc.
Through the projects for interconnections the security of gas supply to Bulgaria will be
improved and the negative effects from potential crises due to full or partial loss of supply
from the single for the time being source on the national economy will be avoided.
In this connection the state will direct its efforts to implementation of the following
alternatives:
Possible construction of a regasification terminal for liquefied natural gas (LNG),
through which natural gas will be supplied not only to Bulgaria, but to third
countries as well, through the well-developed Bulgarian gas transmission network;
Implementation of a project for supply of compressed natural gas (CNG) from
Azerbaijan across the Black Sea;
114
Construction of gas interconnections with Turkey, Romania, Greece and Serbia
8. Expected results
20% lower energy intensiveness of GDP by 2013.
Increase of the RES share to 12% of the total final energy consumption by 2013.
Increased share of freely negotiated quantities of electricity in the internal market.
Established power exchange.
Higher-quality energy supply at affordable and predictable prices.
National Regional Development Strategy
National Regional Development Strategy (NRDS) for the period 2012 – 2022 is developed
in accordance with the legislative regulations of the Regional Development Act. NRDS is
the main document that defines the strategic framework of the government policy for
achieving balanced and sustainable development of the regions in the country and for
overcoming the intra-regional and inter-regional differences/ disparities in the context of
pan-European cohesion policy, and achieving smart, sustainable and inclusive growth.
NRDS plays an important role for achieving compliance and mutual complement between
the objectives and the priorities of the regional development policy and the sectoral policies
and strategies that promote balanced development of the regions.
The designated in the NRDS period, from 2012 to 2022, is a period, in which major changes
are supposed to take place in global and in European scale, it is a period of the emergence
of new tests and challenges to the European Community and the European countries in
coherence with the overcoming the effects of the debt financial crisis and the on-going
successful implementation of the cohesion policy and preservation of national and regional
identity in the development process. The biggest challenges, facing Europe and the
European countries, are: the globalization, the negative demographic trends, the climate
changes and the energy dependence. The European policy in this period will be adjusted so
as to help the regions to be prepared to face these challenges and trials and each of the
regions to find individual solutions to cope with the difficulties it is faced. In response to the
requirements of the strategy "Europe 2020", "National Development Programme:
BULGARIA 2020" is developed as a long-term framework document, defining the vision
and the overall objectives of the development policies for a period of 10 years for all sectors
of the government, including their territorial manifestations.
4.3.13. Legislative arrangements
The Bulgarian climate change policy follows the multilateral and bilateral international
agreements, the EU legislation in the field of climate change as well as the national
legislation. The most important legislative acts dealing with climate change issues are:
Climate change mitigation act (SG 22/2014, last amended SG 85/2017)
In pursuance of its international commitments and in order to synchronise Bulgarian
legislation with the European law, the Climate Change Mitigation Act outlines the overall
policy to be followed in order to mitigate climate change and its impacts and fulfil
international obligations within the UNFCCC and Kyoto Protocol, as well as the EU legal
framework.
The Act integrates the already existing climate change mitigation related articles of the
Environmental Protection Act, namely provisions on:
115
the National Environmental Monitoring System (including the National GHG
Inventory System), directed by the Minister of Environment and Water through the
Executive Environment Agency, originally established by the EPA and related
regulation
the Greenhouse Gas Emissions Allowances Trading Scheme, for which the Minister
of Environment and Water (acting jointly with other ministers) elaborates a National
Allocation Plan every five years
the National Trust Eco Fund, established in 1995 after signing a swap deal ‘Debt for
Nature’ with Switzerland and assigned in 2010 with responsibility for managing the
funds received by Bulgaria within the Green Investment Scheme and other
programmes
The Act further regulates instruments available under the Kyoto Protocol (Joint
Implementation, CDM), administration of the national GHG trading register, and
reduction of GHG emissions from fuels used for transport and energy and the
voluntary emissions reduction scheme.
The Act also reaffirms the National Action Plan on Climate Change as the
“instrument which determines the framework of state policy in the field of climate
change for each separate period of action under the policies of the European Union
and international treaties to which Bulgaria is a party”. The most recent (Third)
National Action Plan (replacing the second one published in 2004) was adopted in
2012. It provides for transition to a low carbon and resource efficient economy and
includes measures to achieve the target of over 18.5% GHG emissions reduction by
2020 compared to the 2005 levels and 20% share of renewables in energy
production by 2020.
The Act further establishes the National Expert Council on Climate Change as an
advisory body to the Minister of Environment and Water. The Council includes
representatives of the relevant Ministries, the State Agency for National Security,
the Executive Environment Agency, Bulgarian Academy of Sciences, the National
Association of Municipalities and non-profit organisations, whose activity is directly
related to climate change mitigation”.
The Act also mandates the Minister of Environment and Water and other competent
ministers to draft, after consultation with the National Council of Experts on Climate
Change, a national strategy on climate change adaptation. The adaptation strategy is
to be prepared for not less than 20 years, with the exception of the first strategy to be
drawn up for the period up to 2030 inclusive, and should be adopted by the Council
of Ministers.
The Act sets the target of minimum 6% reduction of the lifecycle GHG emissions of liquid
fuels and energy for transport per unit of energy by 31 December 2020 compared to the
2010 fuel standards. It provides for every supplier of liquid fuels and energy to the transport
sector to submit to the MOEW by 31 March each year a verified report on the GHG
intensity of products delivered the previous year.
Environmental Protection Act (EPA) (SG 91/2002, last amended SG 96/2017)
EPA is a framework law that regulates the basic conditions and principles of the
management of the public relations related to environmental protection. It defines the
competent authorities within the meaning of the act: the Minister of Environment and Water
116
and the Director of the Executive Environment Agency are among the bodies holding
powers with regard to EPA and the measures related to climate change, however all
competent authorities under EPA may be involved with actions of other competent
authorities under other laws - for example in the sectors “Energy”, “Land use, land use
change and forestry” (LULUCF).
EPA establishes a scheme for trading greenhouse gas emissions. It regulates the existence
of a National Plan for allocation of greenhouse gas allowances. EPA introduces a
requirement for issue of greenhouse gas emission permits as a condition for execution of
certain activities. The conditions and the procedures for issuing and revising a greenhouse
gas emission permit and the consequences of this issuing are described in detail. A national
register for reporting the issuance, holding, transfer and cancellation of greenhouse gas
emission allowances is created. The Council of Ministers is delegated powers to issue
bylaws detailing the management of activities related to greenhouse gas emissions. The
obligations of aircraft operators and suppliers of transport liquid fuels are regulated. EPA
designates the competent authorities in the field of environment responsible for Bulgaria’s
relations with international and European institutions in this area as well as for the
established administrative relationships. It specifies the boundaries of the competence of
national authorities and EU bodies in the field of environment.
EPA regulates three of the most important horizontal mechanisms for management of
activities related to environmental impacts and the effects of greenhouse gases –
Environmental Impact Assessment (EIA) of specific investment proposals, environmental
assessment (EA) of plans and programmes and access to information (AI) on the
environment. The preparation of an environmental assessment is part of the procedure for
preparation of all major plans, programmes and strategies in the fields related to activities
that are sources of greenhouse gases – energy, agriculture, transport, waste management,
etc. The purpose of EA and EIA is to integrate the considerations related to the environment
in the process of development as a whole and the introduction of the sustainable
development principle.
Relevant bylaws:
Ordinance on the conditions and procedure for carrying out environmental impact
assessment – SG 25/2003, last amended SG 55/2017;
Ordinance on the conditions and the procedure for carrying out environmental
assessment of plans and programmes – SG57/2004, last amended by SG 12/2016.
Energy Act (EA) SG 107/2003, last amended SG 58/2017)
The Energy Act settles the public relations associated with the activities of production,
import and export, transmission, transit, distribution of electricity, heat and natural gas,
transmission of oil and oil products by pipelines, trade in electricity, heat and natural gas,
and the powers of state bodies to define energy policy, to regulate and to exercise control. It
designates the bodies carrying out the energy policy as well as the instruments underlying
the energy policy.
The Council of Ministers proposes and the National Assembly adopts the Energy Strategy
of Bulgaria on the basis of the EA.
The Energy Act lays down rules and principles for energy pricing - it regulates the prices of
the produced electricity. The costs of energy companies arising from public obligations for
environmental protection and energy efficiency are compensated by administrative
117
measures determined by the Energy and Water Regulatory Commission (EWRC) – a
specialized state authority regulating the activities in the field of energy. The obligation to
purchase electricity produced from renewable sources is also considered as such a cost.
The activities related to electricity production and connection to the energy transmission
network may be effected only after issuance of the relevant license/permit.
The Energy Act regulates the production of electricity from thermal power plants using a
combined mode of production. The entire quantity of electricity from highly efficient
cogeneration of heat and electricity, registered with a certificate of origin, is subject to
purchase at preferential prices.
A bylaw issued on the basis of EA:
Ordinance on the issue of certificates of origin for electricity produced by
cogeneration – SG 41/2007, last amended SG 85/2010.
The EA is the law where the proposals for legislative amendments in the energy sector as
well as the proposals for establishment of regulatory mechanisms promoting the renovation
and expansion of district heating networks formulated in the NAPCC should be included.
Energy from Renewable Sources Act (ERSA) (SG 35/2011, last amended SG
58/2017)
The Energy from renewable sources act regulates the public relations associated with the
production and consumption of electricity, thermal energy and cooling energy from
renewable sources, gas from renewable sources, biofuels and energy from renewable
sources in transport. The main purpose of this Act is to promote and support the production
and consumption of energy and fuels from renewable sources. This is to be effected through
the introduction of support schemes, by raising the awareness and by encouraging research.
It regulates the adoption of a National Action Plan for Energy from renewable sources
(NAPERS); and national support schemes to promote the use of energy from renewable
sources. The main focus is on joint projects and schemes for production of energy from
renewable sources with other EU Member States. The municipal councils approve long
term and short term programs to promote the use of energy from renewable sources and
biofuels.
The Energy from renewable sources act takes into account the need for interaction between
several different bodies of central executive authorities and local government in order to
achieve the objectives of the law. The implementing powers are divided between the
Minister of Economy, Energy and Tourism, the Minister of Environment and Water,
SEWRC, the Sustainable Energy Development Agency (SEDA), the district governor, the
city council and the mayor of the municipality.
ERSA contains also specific measures to support the production of energy from renewable
sources and biofuels.
Bylaws issued on the basis of ERSA are:
Ordinance on the calculation of the total share of energy from renewable sources in
the gross final energy consumption and the use of biofuels and renewable energy in
transport (№ RD-16-869) SG 42/2015;
Ordinance on the conditions and procedure for issuance, transfer, cancellation and
recognition of guarantees of origin of the energy from renewable sources (№RD -
16-1117) SG 42/2015.
118
Energy Efficiency Act (EEA) (SG 35/2015, last amended SG 105/2016)
EEA regulates the public relations relevant to the state policy for improving energy
efficiency of final energy consumption and the provision of energy services.
The National Assembly adopts a National Energy Efficiency Strategy of the Republic of
Bulgaria that determines the national indicative target of energy savings, as well as the
stages, the tools and the measures for its achievement. The National Strategy is updated
every five years. The Council of Ministers adopts national action plans on energy efficiency
and annual reports on the implementation of these plans. The Minister of Economy, Energy
and Tourism prepares draft programmes on improvement of energy efficiency in final
energy consumption and on the provision of energy services and submits them for approval
by the Council of Ministers. The Executive Director of SEDA is responsible for the
activities related to the implementation of the state policy for improvement of energy
efficiency in final energy consumption and the provision of energy services. The local
governments adopt energy efficiency programmes.
EEA contains detailed requirements to the content of the national action plans on energy
efficiency. It establishes the legislative basis to link the different actions and steps for
achievement of energy efficiency in the final energy consumption – setting individual and
intermediate indicative energy saving targets, formulating specific actions to achieve energy
efficiency, defining time frames for implementation, financing, division of obligations. The
plans are reported on annual basis.
The national indicative targets determined in the action plans on energy efficiency are
allocated as individual targets for energy savings to energy traders, owners of buildings
with a total floor area over 1000 m2 (as of 12 March 2013 the threshold is reduced to 500
m2) and owners of industrial systems with annual energy consumption over 3000 MWh.
The operated buildings with a total floor area over 500 m2 are subject to mandatory
certification.
Air conditioning installations in buildings and hot water boilers with specific power
according to the used fuel type are subject to energy efficiency checks. SEDA maintains a
database of the inspected systems.
The industrial systems with annual energy consumption over 3000 MWh are subject to
mandatory energy efficiency audits, conducted at least once every three years.
EEA provides for the implementation of energy efficiency management which is
responsibility of the owners of the audited industrial systems and the installations inspected
for energy efficiency. The management activities are specifically defined in the act. The
administrative authority may impose fines or property sanctions in case of violations of the
activities related to the energy efficiency management.
SEDA establishes and maintains a national information system on the state of energy
efficiency in Bulgaria.
EEA defines the term “energy services” and the scope of entities that may provide energy
services. The energy services include implementation of one or more activities and
measures to improve energy efficiency.
The financial mechanisms for improving energy efficiency are: voluntary agreements,
performance contracting and financing from the Energy Efficiency and Renewable Sources
Fund. The Fund supports the implementation of actions and measures for increasing energy
efficiency and promoting the production and consumption of energy from renewable
sources, except for those activities that are funded by the state budget. The Fund operates
119
under the Energy Efficiency Act and the donor agreements and it is not part of the
consolidated state budget.
Bylaws related to energy efficiency:
Ordinance on labelling requirements and the provision of standard information on
products related to energy consumption with respect to energy and other resources
consumption - SG 41/2011, last amended SG19/2016;
Ordinance № RD-16-267 of 2008 on estimation of the amount of electricity
produced by cogeneration of thermal and electric energy – SG 37/2008, last
amended SG 42/2015;
Ordinance № 7 of 2004 on energy efficiency, heat and energy savings in buildings –
SG 5/2005, last amended SG 31/2015;
Ordinance on methodologies for setting national targets, the procedure for allocation
of these targets as individual energy saving targets between the persons under art.
10, para. 1 of the Energy Efficiency Act, eligible energy efficiency measures,
assessment methodologies and methods of verification of energy savings and for
approval of the tariff for fees collected by the Energy Efficiency Agency for issuing
energy savings certificates under art. 51 para. 1 of the Energy Efficiency Act – SG
27/2009, last amended SG 88/2011;
Tariff of the fees collected by the Sustainable Energy Development Agency under
the Energy Efficiency Act and the Renewable Energy Act - SG 35/2013;
Ordinance on the conditions and the procedures for determining the amount and the
payment of funds under performance contracts leading to energy savings in public
and/or municipal buildings (№ RD-16-347) - SG 28/2009;
Ordinance on energy consumption indicators, energy performance of industrial
systems, on the conditions and the procedures for performing energy efficiency
audits of industrial systems (№ RD-16-346) - SG 28/2009 - has been repealed.;
Ordinance on the circumstances subject to entry in the register of persons carrying
out certification of buildings and energy efficiency audits, on the procedure for
receiving information from the register, the terms and conditions for acquiring
qualification and the required technical facilities for performing audits and
certification (№ RD-16-348) – SG 28/2009 - has been repealed;
Ordinance on the circumstances subject to entry in the register of persons carrying
out certification of buildings and energy efficiency audits, on the procedure for
receiving information from the register, the terms and conditions for acquiring
qualification and the required technical facilities for performing audits and
certification (№ RD-16-301) – SG 27/2014
Ordinance on the conditions and the procedure for auditing the energy efficiency of
hot water boilers and air conditioning systems pursuant to art. 27, para. 1 and art. 28,
para. 1 of the Energy Efficiency Act and on the creation, maintenance and use of a
database for these systems (№ RD-16-932) – SG 89/2009;
Ordinance on the conditions and the procedure for energy efficiency auditing and
certification of buildings, on issuing energy performance certificates and the
categories of certificates (№ RD-16-1057) – SG 101/2013;
Ordinance on indicators for energy consumption and energy performance of
buildings (№ RD-16-1058) – SG 10/2016;
120
Statutes of the Sustainable Energy Development Agency - SG 88/2011.The EEA
transposes the requirements of Directive 2006/32/EC of the European Parliament
and of the Council of 5 April 2006 on energy end-use efficiency and energy services
and repealing Council Directive 93/86/EEC and Directive 2010/31/EU of the
European Parliament and the Council of 19 May 2010 on the energy performance of
buildings (OJ, L 153/13 of 18 June 2010).
Clean Ambient Air Act (CAAA) (SG 45/1996, last amended SG 85/2017)
Clean Ambient Air Act regulates the limitation of emissions into the air from stationary
sources and the quality requirements for liquid fuels – activities directly related to
greenhouse gas emissions.
The marketing of liquid fuels that do not meet the quality requirements has been forbidden.
The Minister of Environment and Water jointly with the relevant ministers issues
regulations that set emission limit values of harmful substances (pollutants) emitted into the
atmosphere by facilities and activities with stationary emission sources. These standards are
mandatory for all sites in Bulgaria. Exceptions are allowed for sites related to the national
fuel and energy balance.
In addition, programmes to gradually reduce the total annual emissions of certain pollutants:
sulphur dioxide, nitrogen oxides and other pollutants released into the air by certain
operating facilities and activities such as large combustion plants and others, are also
adopted.
Another approach in the Clean Ambient Air Act used to reduce air pollution is setting
norms for harmful substances in exhaust gases from internal combustion engines. These
norms are approved by the Minister of Transport, Information Technologies and
Communications, jointly with the Minister of Environment and Water and the Minister of
Health.
In June 2014 a new EU Regulation (№ 517/2014) on fluorinated greenhouse gases,
repealing Regulation № 842/2006, came into force and applies from 1 January 2015. New
F-gas Regulation 517/2014/EU, which repeals 2006/842/EC, is currently included in
amendment of Clean Ambient Air Act (2015).
The Minister of Environment and Water, the directors of the regional inspectorates for
environment and water or their authorized officials monitor the application of the measures
specified for stationary refrigerating and air conditioning systems, thermal pumps, high
voltage switchgear, air conditioning systems in motor vehicles and other equipment
containing fluorinated greenhouse gases.
The Clean Ambient Air Act defines the powers of the supervisory authorities to enforce the
set standards, as well as the obligations of other government bodies such as the Customs
Agency and the Directorate General of Fire Safety and Population Protection under the
Ministry of Interior, to provide information to the Ministry of Environment and Water.
Bylaws issued on the basis of the CAAA:
Regulation on the requirements to the quality of liquid fuels, the procedure and
method for their control - SG 66/2003, last amended SG 88/2014;
121
Ordinance № 10 of 2003 on emission limit values (concentrations in waste gases) of
sulphur dioxide, nitrogen oxides and dust emitted in the air from large combustion
plants – SG 93/2003, last amended SG 19/2011;
Ordinance № 6 of 1999 on the procedure and method for measuring emissions of
harmful substances emitted into the ambient air by stationary sources – SG 31/1999,
last amended SG 61/2017;
Ordinance establishing measures for implementing Regulation (EC) № 842/2006 on
certain fluorinated greenhouse gases - SG 3/2009, last amended SG 7/2011 - has
been repealed.
Forestry Act (FA) (SG 19/2011, last amended SG 58/2017)
The Forestry Act and the related regulations, which are the main normative basis governing
the public relations related to the conservation, management and use of the forest territories
in the Republic of Bulgaria. The objectives of the Act are geared towards ensuring
multifunctional and sustainable management of forest ecosystems and include:
• Conservation and increase of forest area;
• maintenance and improvement of forests;
• ensuring and maintaining the ecosystem, social and economic functions of forest areas;
• ensuring and increasing the production of timber and non-timber forest products through
environmentally friendly forest management;
• maintaining the biological and landscape diversity and improving the status of the
populations of the wild flora, fauna and fauna species;
• providing recreational opportunities for the population and improving the conditions for
recreation;
• striking a balance between the interests of the community and forest owners;
• Assisting and encouraging landowners in forest areas;
• Implementation of international and European commitments for the conservation of forest
habitats.
Local Government and Local Administration Act (LGLAA) (SG 77/1991, last
amended SG 9/2017)
Local governments take decisions on the establishment and approval of spatial development
plans and their amendments for the territory of the municipalities under the Spatial
Planning Act as well as strategies, forecasts, plans and programs for development of the
municipalities that take into account also the European local community development
policies.
Local governments set requirements to the activity of natural and legal persons on the
territory of the municipalities arising from the environmental, social and other
characteristics of the settlements.
The activities to combat climate change have a local dimension in almost all sectors –
either because they are related to plans and programs adopted at municipal level, or
because they are implemented through local projects. Therefore a reasonable and
transparent regulation of these activities and projects at local level can benefit greatly
those municipalities that take advantage of the powers delegated to them.
122
Spatial Planning Act (SPA) (SG 1/2001, last amended SG 96/2017)
SPA regulates the procedures for preparation, approval and amendment of general and
detailed spatial development plans of settlements. The bylaws issued on the basis of the
SPA lay down the standards of urban planning and development of land.
The standards for planning and construction regulated at governmental level, as well
as the specific management decisions taken at local level are directly related to the
activities for sector Land Use, Land Use Change and Forestry proposed in the
NAPCC.
Agricultural Land Protection Act (ALPA) (SG 35/1996, last amended SG
96/2017)
ALPA allows land use change of agricultural land only in certain specific cases.
Burning of stubbles and other plant residues in agricultural lands is prohibited. The users of
agricultural land are held responsible for the burning of stubble and other plant waste on the
agricultural land and must participate in their extinguishing.
The owners and the users of agricultural land are entitled to tax and credit preferences when
implementing the mandatory limitation on agricultural land use as well as when
implementing projects to restore and improve the fertility of agricultural land.
ALPA contains a legal framework covering some of the activities envisaged for the
Agriculture sector in the NAPCC, such as counteracting the burning of stubble and plant
waste and promoting agricultural practices aimed at reducing greenhouse gas emissions.
Agricultural Producers Support Act (APSA) (SG 58/1998 , last amended SG
58/2017)
APSA regulates state support to farmers with regard to the implementation of the measures
included in the National Plan for Agricultural and Rural Development. Support is provided
to farmers that operate and are registered in disadvantaged areas or in areas covered by
Natura 2000 network.
APSA envisages development and approval of a National Strategic Plan for Rural
Development and a Rural Development Programme.
A bylaw issued on the basis of APSA is:
Ordinance on the terms and conditions for providing support to producers of energy
crops – SG 37/2007, last amended SG 4/2008.
APSA regulates some of the activities through which the measures envisaged for the
Agriculture sector of the NAPCC can be implemented, as well as the activities related to
biofuel production. APSA is the law regulating the key financial mechanism for
management of agricultural activities. Most of the proposals – whether introduction of best
practices for rice production or for encouragement of crop rotation, especially with
nitrogen-fixing crops, for restoration of degraded agricultural lands, or the introduction of
water saving irrigation technologies – can be applied using the financial mechanisms
regulated by APSA.
123
Waste Management Act (WMA) (SG 86/2003, last amended SG 105/2016)
WMA lays down the requirements for the establishment of regional waste management
systems. They are set up by municipalities, on a regional basis, and consists of a regional
landfill and/or other waste treatment facilities.
Bylaws issued under the WMA:
Ordinance № 6 of 28 July 2004 on the conditions and requirements for construction
and operation of waste incineration and co-incineration plants – SG 78/2004, last
amended SG 98/2004 - has been repealed.;
Ordinance № 4 of 16 April 2013 on the conditions and requirements for
construction and operation of waste incineration and co-incineration plants – SG
36/2013
Ordinance № 8 of 24 August 2004 on the conditions and requirements for
construction and operation of landfills and other facilities and installations for waste
recovery and disposal – SG 83/2004, last amended SG 27/2011 - has been repealed.
Ordinance № 6 on the conditions and requirements for construction and operation of
landfills and other facilities and installations for waste recovery and disposal – SG
80/2013, last amended SG 13/2017;
Ordinance on packaging and packaging waste – SG 19/2004, last amended SG
29/2011 - has been repealed.;
Ordinance on packaging and packaging waste – SG 85/2012, last amended SG
30/2016
Ordinance establishing the terms and conditions for payment of product fees for
products after the use of which wide spread waste is generated – SG 53/2008, last
amended SG 29/2011;
Ordinance on the way of utilization of sludge deriving from wastewater treatment
through its use in agriculture – SG 112/2004, last amended SG 100/2013.
Statistics Act (SA) (SG 57/1999, last amended SG 15/2013)
The National Statistical Institute collects and processes information that is used for decision
making related to climate change.
Geological Storage of Carbon Dioxide Act (GSCDA) (SG 14/2012, last amended
SG 14/2015)
This act regulates public relations relevant to the storage of carbon dioxide in suitable
underground geological formations.
It formulates the assessment criteria and the conditions to be met by the geological
formations for storage of carbon dioxide. The right to explore the earth for geological
formations that are suitable to store carbon dioxide is provided through an exploration
permit. A permit is required also for underground storage of carbon dioxide. The
permits are issued by the Minister of Economy, Energy and Tourism. The permitting
procedure is defined in the GSCDA.
124
The Council of Ministers determines the state policy on storage of carbon dioxide in
geological formations by approving a programme for exploration of sites for storage of
carbon dioxide.
GSCDA lays down obligations related to the periods of operation, closure and post-closure
of carbon dioxide storage sites.
This law transposes Directive 2009/31/EC of the European Parliament and of the
Council of 23 April 2009 on the geological storage of carbon dioxide and amending
Council Directive 85/337/EEC, European Parliament and Council Directives
2000/60/EC, 2001/80/EC, 2004/35/EC, 2006/12/EC, 2008/1/EC and Regulation (EC) No
1013/2006 into the Bulgarian legislation.
Fiscal policy
In many EU countries fiscal policies are important instruments to stimulate measures that
reduce emissions of greenhouse gases and/or save energy. The advantage of the fiscal
incentives is that they are equally available to all investors and make better use of the
market mechanisms. When introducing such policies in Bulgaria it is necessary to
remember that they have to be in harmony with EU legislation (especially in relation to
competitiveness) and to be implemented in such a way that minimizes or eliminates the
“free riders”.
A number of stimulating measures for the subjects of taxation were introduced in the Law
on amendment and supplement of the Law on the Corporate Income Tax Act and also
in the Law on amendment and supplement of the Personal Income Tax Law, regarding
the activities of the newly established fund “Energy efficiency”.
4.4. Policies and measures and their effects
The information and the analysis of the provided national measures for the period until
2016 are provided on the basis of two groups of measures and reported based on the status
of implementation of measures: “with measures” (WM) and “with additional measures”
(WAM).
According to the official definition of the UNFCCC documents Implemented policies and
measures are those for which one or more of the following applies: (a) national legislation is
in force; (b) one or more voluntary agreements have been established; (c) financial
resources have been allocated; (d) human resources have been mobilized. Here we do not
consider measures that are supported by the national legislation as implemented. These
measures are listed under additional measures. Those policies and measures for which an
official government decision has been made are not considered under the “with measures”
as well, because it is common practice in the country to cancel or postpone the
implementation of legal or governmental decisions so there is no a clear commitment to
proceed with implementation.
Planned policies and measures are options already adopted, but not implemented yet, or are
under discussion and having a realistic chance of being implemented in future.
The policies and measures presented by sectors contribute to the reduction of greenhouse
gas emissions in Bulgaria. The overall effect of their implementation will ensure the
achievement of the legally binding targets for our country under the Climate and Energy
package as well as the energy efficiency goals. The measures are summarized for each
125
sector and the total effect of their implementation is reflected in Section 5. Projections and
total effect of policies and measures.
These measures are selected from a larger number of proposed actions after coordination
with governmental and non-governmental stakeholders. They are formulated so as to meet
the main goal for reduction of greenhouse gas emissions in Bulgaria and implementation of
the existing EU legislation on climate change. Various tools were proposed to support their
implementation. The measures are grouped in two directions - those with a measurable
effect on the reduction of greenhouse gases and those with indirect effect. A performance
indicator was set that is directly or indirectly related to the calculation of the expected
effect, as well as target values by year.
4.4.14. Real and expected interaction with other relevant policies and
measures and with the relevant policies and legislation of the
European Community
Regulation in 2014 have been approved to further clarify the EU ETS
process:Regulation on the order and methods of administration of the National
registry for trading with greenhouse gas emissions was approved by DCM
266/29.08.2014
Regulation on the order and way of issuing and reconsideration of allowances for
GHG emissions from installations and for performance of the monitoring by the
installation operators and aircraft operators – participants in the emission allowances
trading scheme was approved by DCM 265/29.08.2014
Regulation on the conditions, order and way of preparation of reports and for
verification of the reports of the installation and aircraft operators;
Regulation on the order and methods of working of the National registry for accounting of
issuing, possession, delivery, transferring and cancelling of GHG emission allowances was
approved by DCM №7/19.01.2007. – has been replaced.
DCM 297/13.12.2010 for Regulation on the order and way of issuing and reconsideration of
allowances for GHG emissions from installations and for performance of the monitoring by
the installation operators and aircraft operators – participants in the emission allowances
trading scheme – has been replaced.
DCM 298/13.12.2010 for Regulation on the conditions, order and way of
preparation of reports and for verification of the reports of the installation and
aircraft operators; - has been replaced.
DCM № 313/12.2010 for Regulation on the order and way of functioning of the
National Registry for accounting, issuing, possession, delivery, transferring and
cancelling of GHG emission allowances – has been replaced.
Directive 2009/30/EC amending the Fuel Quality Directive introduce a requirement for fuel
producers and suppliers to reduce by 2020 the greenhouse gas emissions throughout the fuel
production chain by 6% and to realize additional reductions of 4% by applying new
technologies (for instance CCS) and by using credits from projects under the “Clean
Development” mechanism (CDM) in developing countries. Thus the target of 10%
reduction of greenhouse gas emissions from transport fuels is distributed as follows:
6% reduction in greenhouse gas intensity of fuels (with interim indicative targets of
2% in 2014 and 4% in 2017); and additional
126
2% reduction of greenhouse gas intensity by applying new technologies (such as
CCS) – depending on their level of development;
2% reduction by obtaining CDM credits.
Reaching this target depends directly on achieving 10% share of biofuels in transport
fuel consumption as laid down in the RES Directive.
The achievement of the target is directly dependent on achieving a 10% share of biofuels
in transport fuel consumption laid down in the Renewable Energy Directive.
The Fuel Quality Directive introduces the same requirements for biofuels as for renewable
energy – in order to be taken into account their greenhouse gas emission indicators should
be at least 35% lower than those of conventional fossil fuels (respectively - 50% from 2017
and 60% from 2018). They must also meet the sustainability criteria which are identical
with those set out in the Renewable Energy Directive (for instance in order to recognize the
targets, the raw material must not have been produced on a land with high biodiversity
value or within Natura 2000 network).
National long-term program for reassurance of the bio fuels consumption in the transport
sector 2008-2020 was developed. It was adopted by the Council of Ministers on 15.11.2007.
In connection with efficient realization of the politics and measures on climate changes and
on purpose increase of the institutional capacity of the national level, the work on
coordination of different aspects from these activities through interdepartmental working
groups was approved as a good practice. With Orders from the Minister of Environment and
Water were established: Interdepartmental committee on climate change, Interdepartmental
working group for development of National Allocation Plan 2008-2012 and Steering
Committee for evaluation of JI projects under the Kyoto Protocol.
4.4.15. Energy sector
The Energy Sector covers the following activities:
production and transmission of electricity, including cogeneration;
production and transmission of heat for public needs;
transmission of natural gas (maintenance of the pressure of compressor stations).
About 92-93% of the total aggregated greenhouse gas emissions in the sector are emitted in
the production of electric energy due to the burning of fuels, 6-7% come from the
production of thermal energy and about 1% is emitted by the transmission of natural gas.
Emissions from the energy sector are the main source of GHGs in Bulgaria: in 2015 the
sector is responsible for 74.2% of national total GHG emissions (45 646 Gg CO2e from
sector 1A of the total 61 483 Gg CO2e excl. LULUCF).
4.4.15.1. Greenhouse gas emissions – state and trends
The greenhouse gases for which the Energy sector is responsible hold the largest and
growing share in the total emissions, which determines their key importance for the
implementation of the national emission reduction targets. This is due to the stable
production of electricity in recent years, a growing proportion of which is intended for
export, on the one hand, and to the larger share of electricity produced from coal after the
decommissioning of nuclear power units and the commissioning of new coal power, on the
other hand.
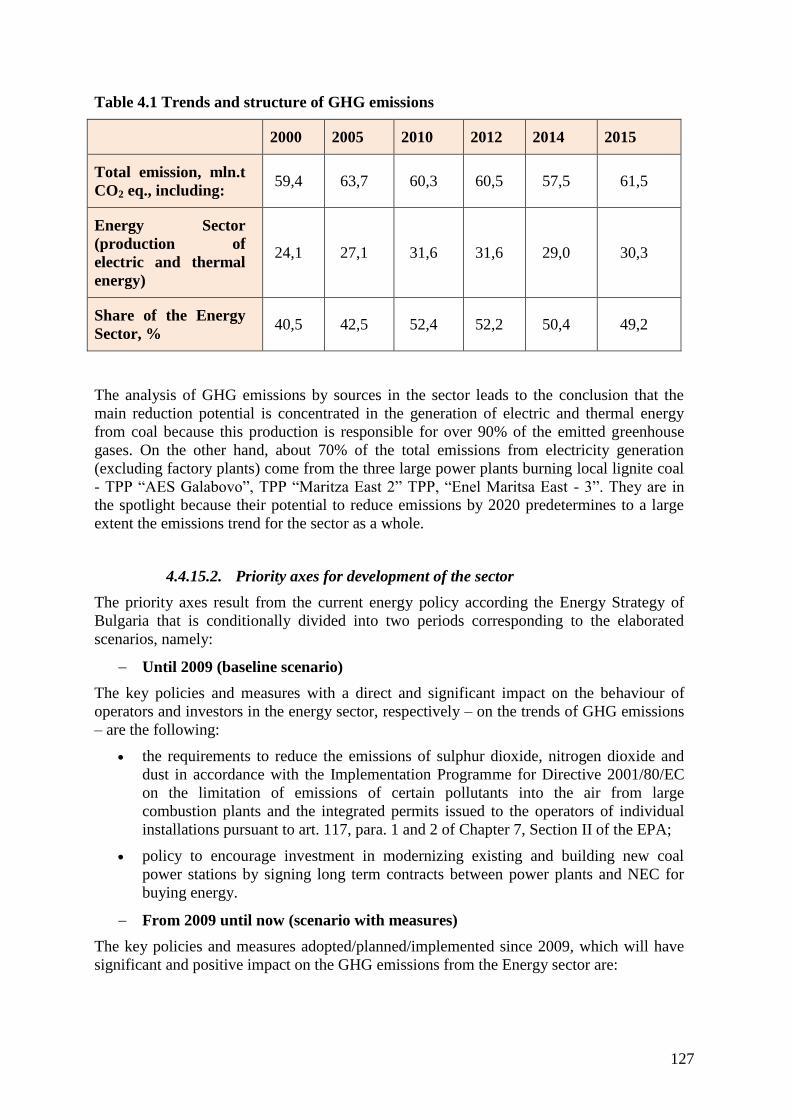
127
Table 4.1 Trends and structure of GHG emissions
2000 2005 2010 2012 2014 2015
Total emission, mln.t
CO2 eq., including: 59,4 63,7 60,3 60,5 57,5 61,5
Energy Sector
(production of
electric and thermal
energy)
24,1 27,1 31,6 31,6 29,0 30,3
Share of the Energy
Sector, % 40,5 42,5 52,4 52,2 50,4 49,2
The analysis of GHG emissions by sources in the sector leads to the conclusion that the
main reduction potential is concentrated in the generation of electric and thermal energy
from coal because this production is responsible for over 90% of the emitted greenhouse
gases. On the other hand, about 70% of the total emissions from electricity generation
(excluding factory plants) come from the three large power plants burning local lignite coal
- TPP “AES Galabovo”, TPP “Maritza East 2” TPP, “Enel Maritsa East - 3”. They are in
the spotlight because their potential to reduce emissions by 2020 predetermines to a large
extent the emissions trend for the sector as a whole.
4.4.15.2. Priority axes for development of the sector
The priority axes result from the current energy policy according the Energy Strategy of
Bulgaria that is conditionally divided into two periods corresponding to the elaborated
scenarios, namely:
Until 2009 (baseline scenario)
The key policies and measures with a direct and significant impact on the behaviour of
operators and investors in the energy sector, respectively – on the trends of GHG emissions
– are the following:
the requirements to reduce the emissions of sulphur dioxide, nitrogen dioxide and
dust in accordance with the Implementation Programme for Directive 2001/80/EC
on the limitation of emissions of certain pollutants into the air from large
combustion plants and the integrated permits issued to the operators of individual
installations pursuant to art. 117, para. 1 and 2 of Chapter 7, Section II of the EPA;
policy to encourage investment in modernizing existing and building new coal
power stations by signing long term contracts between power plants and NEC for
buying energy.
From 2009 until now (scenario with measures)
The key policies and measures adopted/planned/implemented since 2009, which will have
significant and positive impact on the GHG emissions from the Energy sector are:
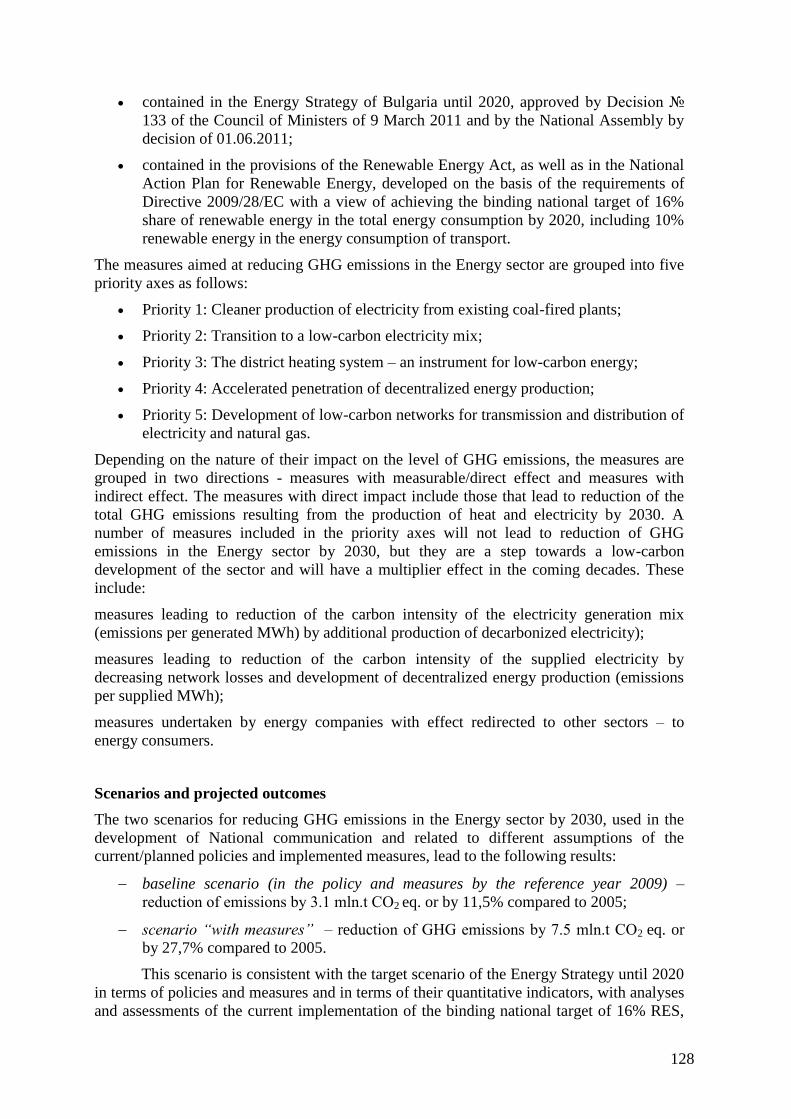
128
contained in the Energy Strategy of Bulgaria until 2020, approved by Decision №
133 of the Council of Ministers of 9 March 2011 and by the National Assembly by
decision of 01.06.2011;
contained in the provisions of the Renewable Energy Act, as well as in the National
Action Plan for Renewable Energy, developed on the basis of the requirements of
Directive 2009/28/EC with a view of achieving the binding national target of 16%
share of renewable energy in the total energy consumption by 2020, including 10%
renewable energy in the energy consumption of transport.
The measures aimed at reducing GHG emissions in the Energy sector are grouped into five
priority axes as follows:
Priority 1: Cleaner production of electricity from existing coal-fired plants;
Priority 2: Transition to a low-carbon electricity mix;
Priority 3: The district heating system – an instrument for low-carbon energy;
Priority 4: Accelerated penetration of decentralized energy production;
Priority 5: Development of low-carbon networks for transmission and distribution of
electricity and natural gas.
Depending on the nature of their impact on the level of GHG emissions, the measures are
grouped in two directions - measures with measurable/direct effect and measures with
indirect effect. The measures with direct impact include those that lead to reduction of the
total GHG emissions resulting from the production of heat and electricity by 2030. A
number of measures included in the priority axes will not lead to reduction of GHG
emissions in the Energy sector by 2030, but they are a step towards a low-carbon
development of the sector and will have a multiplier effect in the coming decades. These
include:
measures leading to reduction of the carbon intensity of the electricity generation mix
(emissions per generated MWh) by additional production of decarbonized electricity);
measures leading to reduction of the carbon intensity of the supplied electricity by
decreasing network losses and development of decentralized energy production (emissions
per supplied MWh);
measures undertaken by energy companies with effect redirected to other sectors – to
energy consumers.
Scenarios and projected outcomes
The two scenarios for reducing GHG emissions in the Energy sector by 2030, used in the
development of National communication and related to different assumptions of the
current/planned policies and implemented measures, lead to the following results:
baseline scenario (in the policy and measures by the reference year 2009) –
reduction of emissions by 3.1 mln.t СО2 eq. or by 11,5% compared to 2005;
scenario “with measures” – reduction of GHG emissions by 7.5 mln.t СО2 eq. or
by 27,7% compared to 2005.
This scenario is consistent with the target scenario of the Energy Strategy until 2020
in terms of policies and measures and in terms of their quantitative indicators, with analyses
and assessments of the current implementation of the binding national target of 16% RES,
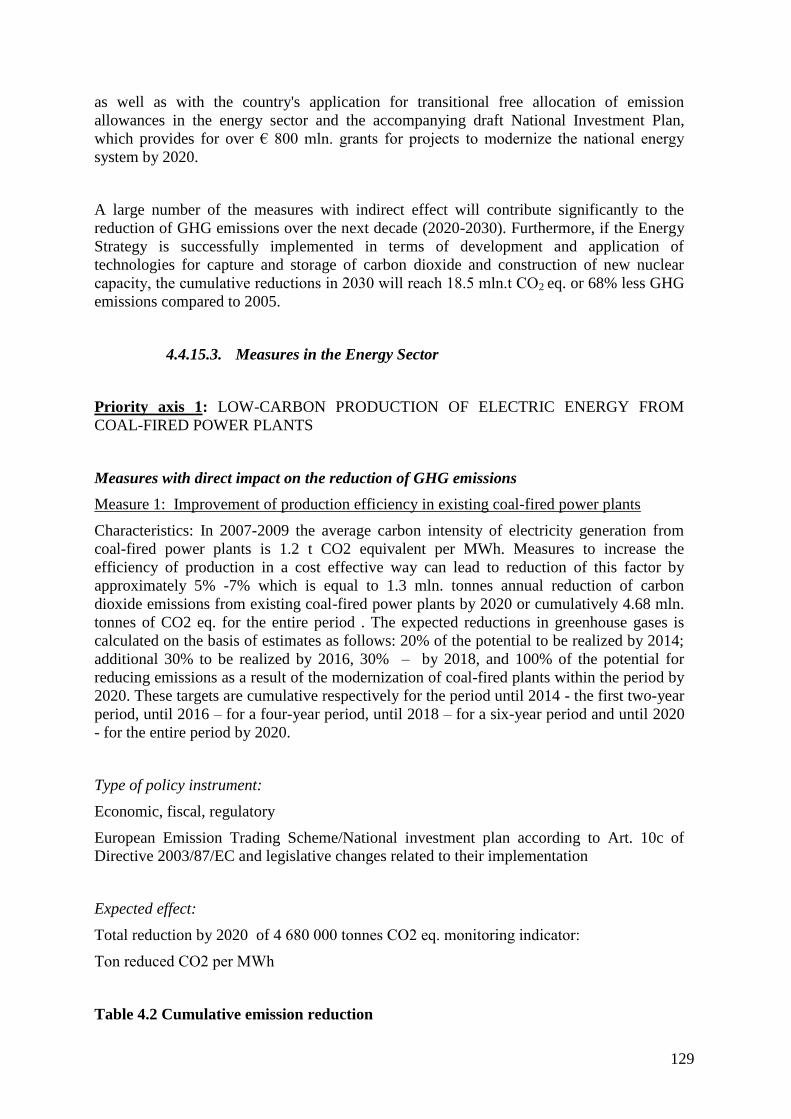
129
as well as with the country's application for transitional free allocation of emission
allowances in the energy sector and the accompanying draft National Investment Plan,
which provides for over € 800 mln. grants for projects to modernize the national energy
system by 2020.
A large number of the measures with indirect effect will contribute significantly to the
reduction of GHG emissions over the next decade (2020-2030). Furthermore, if the Energy
Strategy is successfully implemented in terms of development and application of
technologies for capture and storage of carbon dioxide and construction of new nuclear
capacity, the cumulative reductions in 2030 will reach 18.5 mln.t СО2 eq. or 68% less GHG
emissions compared to 2005.
4.4.15.3. Measures in the Energy Sector
Priority axis 1: LOW-CARBON PRODUCTION OF ELECTRIC ENERGY FROM
COAL-FIRED POWER PLANTS
Measures with direct impact on the reduction of GHG emissions
Measure 1: Improvement of production efficiency in existing coal-fired power plants
Characteristics: In 2007-2009 the average carbon intensity of electricity generation from
coal-fired power plants is 1.2 t CO2 equivalent per MWh. Measures to increase the
efficiency of production in a cost effective way can lead to reduction of this factor by
approximately 5% -7% which is equal to 1.3 mln. tonnes annual reduction of carbon
dioxide emissions from existing coal-fired power plants by 2020 or cumulatively 4.68 mln.
tonnes of CO2 eq. for the entire period . The expected reductions in greenhouse gases is
calculated on the basis of estimates as follows: 20% of the potential to be realized by 2014;
additional 30% to be realized by 2016, 30% – by 2018, and 100% of the potential for
reducing emissions as a result of the modernization of coal-fired plants within the period by
2020. These targets are cumulative respectively for the period until 2014 - the first two-year
period, until 2016 – for a four-year period, until 2018 – for a six-year period and until 2020
- for the entire period by 2020.
Type of policy instrument:
Economic, fiscal, regulatory
European Emission Trading Scheme/National investment plan according to Art. 10c of
Directive 2003/87/EC and legislative changes related to their implementation
Expected effect:
Total reduction by 2020 of 4 680 000 tonnes СО2 eq. monitoring indicator:
Ton reduced СО2 per MWh
Table 4.2 Cumulative emission reduction
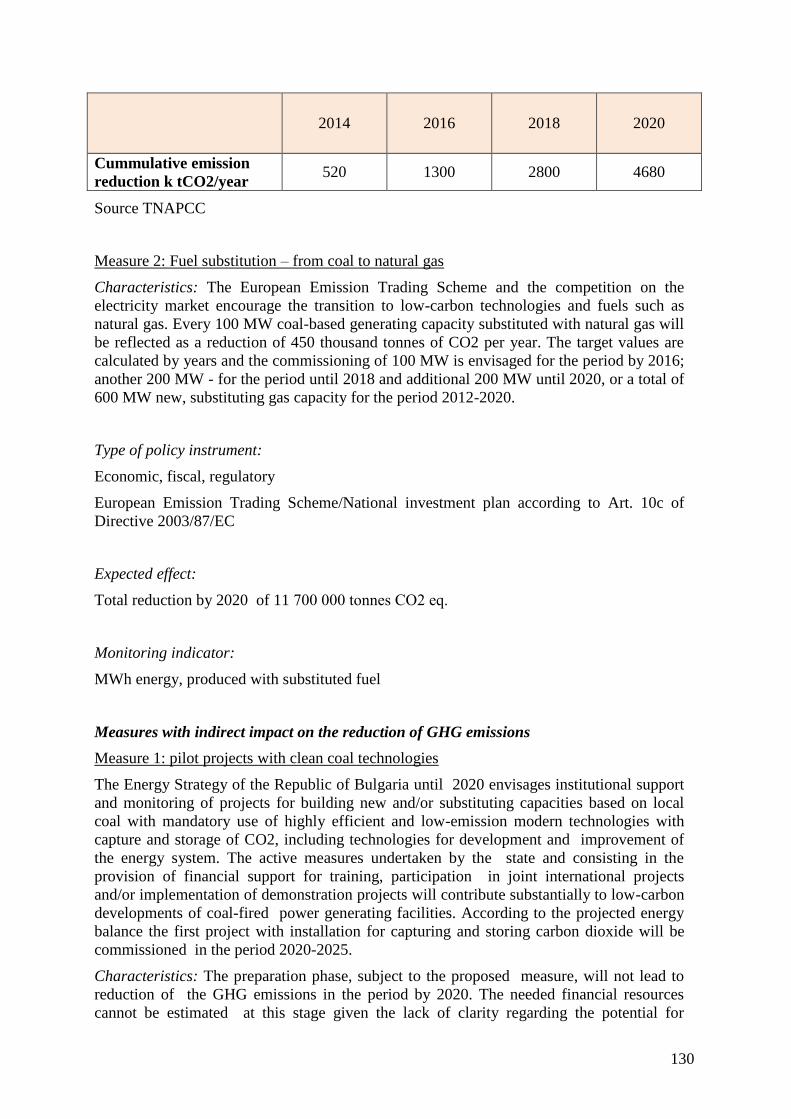
130
2014 2016 2018 2020
Cummulative emission
reduction k tCO2/year 520 1300 2800 4680
Source TNAPCC
Measure 2: Fuel substitution – from coal to natural gas
Characteristics: The European Emission Trading Scheme and the competition on the
electricity market encourage the transition to low-carbon technologies and fuels such as
natural gas. Every 100 MW coal-based generating capacity substituted with natural gas will
be reflected as a reduction of 450 thousand tonnes of CO2 per year. The target values are
calculated by years and the commissioning of 100 MW is envisaged for the period by 2016;
another 200 MW - for the period until 2018 and additional 200 MW until 2020, or a total of
600 MW new, substituting gas capacity for the period 2012-2020.
Type of policy instrument:
Economic, fiscal, regulatory
European Emission Trading Scheme/National investment plan according to Art. 10c of
Directive 2003/87/EC
Expected effect:
Total reduction by 2020 of 11 700 000 tonnes СО2 eq.
Monitoring indicator:
MWh energy, produced with substituted fuel
Measures with indirect impact on the reduction of GHG emissions
Measure 1: pilot projects with clean coal technologies
The Energy Strategy of the Republic of Bulgaria until 2020 envisages institutional support
and monitoring of projects for building new and/or substituting capacities based on local
coal with mandatory use of highly efficient and low-emission modern technologies with
capture and storage of CO2, including technologies for development and improvement of
the energy system. The active measures undertaken by the state and consisting in the
provision of financial support for training, participation in joint international projects
and/or implementation of demonstration projects will contribute substantially to low-carbon
developments of coal-fired power generating facilities. According to the projected energy
balance the first project with installation for capturing and storing carbon dioxide will be
commissioned in the period 2020-2025.
Characteristics: The preparation phase, subject to the proposed measure, will not lead to
reduction of the GHG emissions in the period by 2020. The needed financial resources
cannot be estimated at this stage given the lack of clarity regarding the potential for
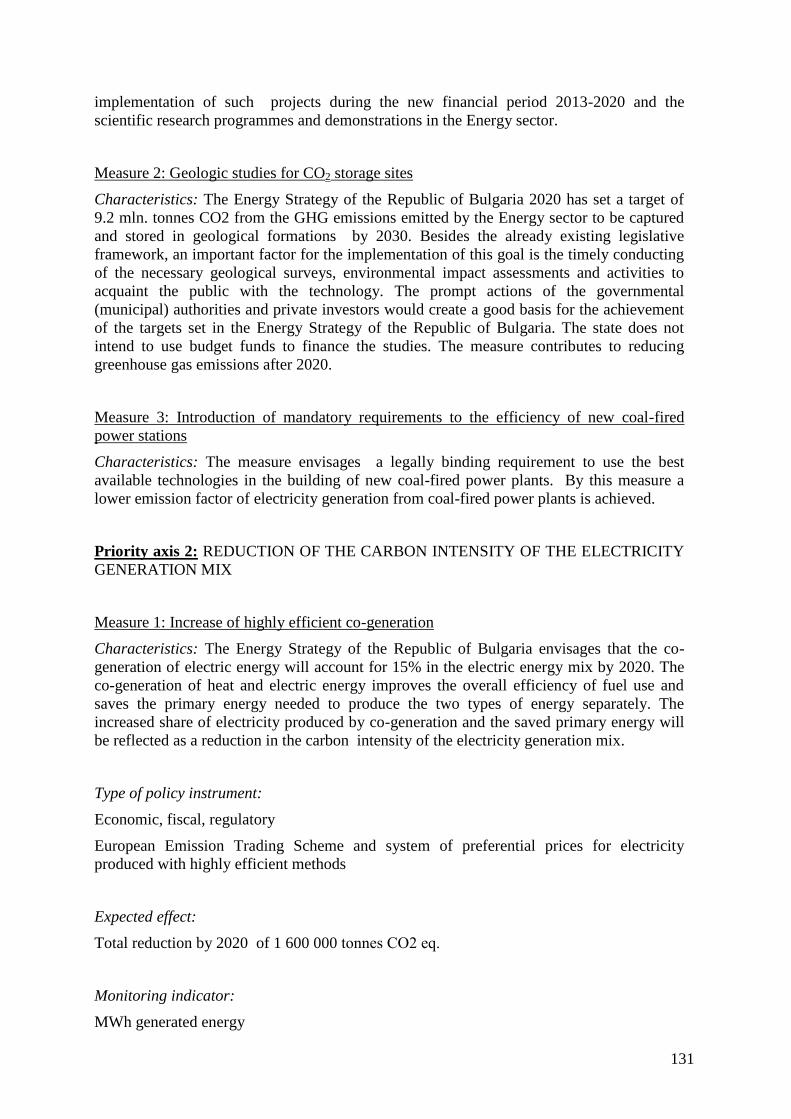
131
implementation of such projects during the new financial period 2013-2020 and the
scientific research programmes and demonstrations in the Energy sector.
Measure 2: Geologic studies for CO2 storage sites
Characteristics: The Energy Strategy of the Republic of Bulgaria 2020 has set a target of
9.2 mln. tonnes CO2 from the GHG emissions emitted by the Energy sector to be captured
and stored in geological formations by 2030. Besides the already existing legislative
framework, an important factor for the implementation of this goal is the timely conducting
of the necessary geological surveys, environmental impact assessments and activities to
acquaint the public with the technology. The prompt actions of the governmental
(municipal) authorities and private investors would create a good basis for the achievement
of the targets set in the Energy Strategy of the Republic of Bulgaria. The state does not
intend to use budget funds to finance the studies. The measure contributes to reducing
greenhouse gas emissions after 2020.
Measure 3: Introduction of mandatory requirements to the efficiency of new coal-fired
power stations
Characteristics: The measure envisages a legally binding requirement to use the best
available technologies in the building of new coal-fired power plants. By this measure a
lower emission factor of electricity generation from coal-fired power plants is achieved.
Priority axis 2: REDUCTION OF THE CARBON INTENSITY OF THE ELECTRICITY
GENERATION MIX
Measure 1: Increase of highly efficient co-generation
Characteristics: The Energy Strategy of the Republic of Bulgaria envisages that the co-
generation of electric energy will account for 15% in the electric energy mix by 2020. The
co-generation of heat and electric energy improves the overall efficiency of fuel use and
saves the primary energy needed to produce the two types of energy separately. The
increased share of electricity produced by co-generation and the saved primary energy will
be reflected as a reduction in the carbon intensity of the electricity generation mix.
Type of policy instrument:
Economic, fiscal, regulatory
European Emission Trading Scheme and system of preferential prices for electricity
produced with highly efficient methods
Expected effect:
Total reduction by 2020 of 1 600 000 tonnes СО2 eq.
Monitoring indicator:
MWh generated energy
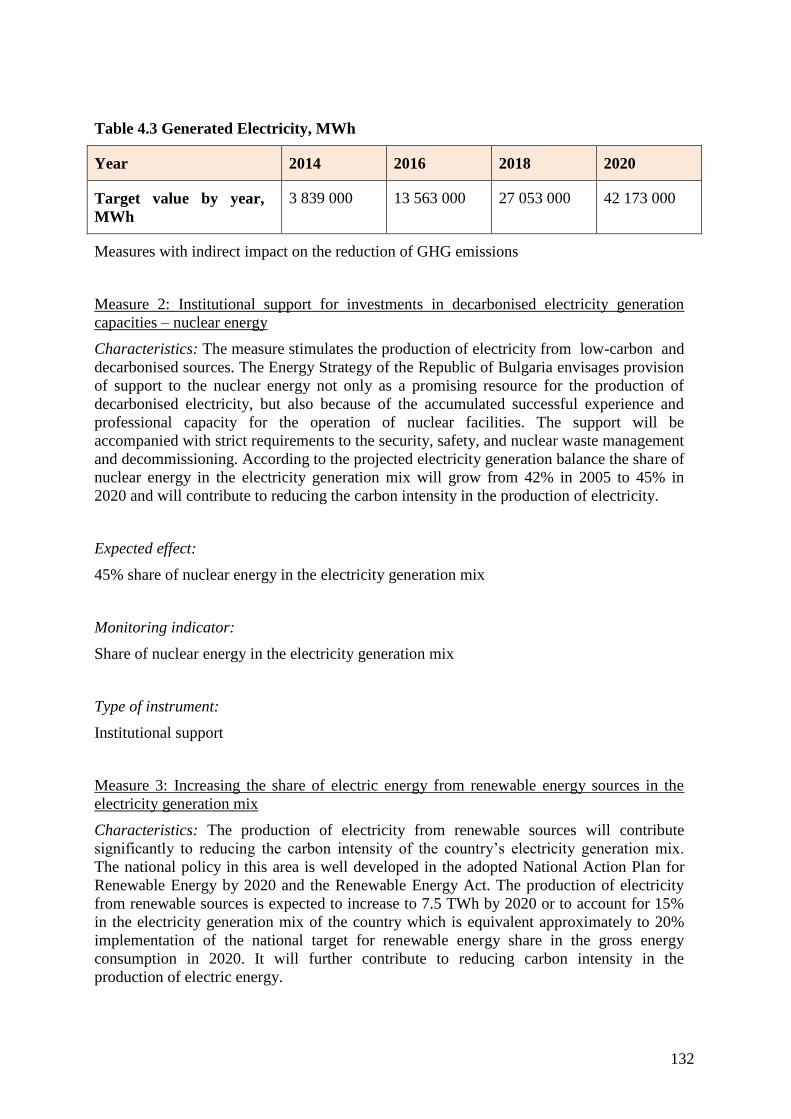
132
Table 4.3 Generated Electricity, MWh
Year 2014 2016 2018 2020
Target value by year,
MWh
3 839 000 13 563 000 27 053 000 42 173 000
Measures with indirect impact on the reduction of GHG emissions
Measure 2: Institutional support for investments in decarbonised electricity generation
capacities – nuclear energy
Characteristics: The measure stimulates the production of electricity from low-carbon and
decarbonised sources. The Energy Strategy of the Republic of Bulgaria envisages provision
of support to the nuclear energy not only as a promising resource for the production of
decarbonised electricity, but also because of the accumulated successful experience and
professional capacity for the operation of nuclear facilities. The support will be
accompanied with strict requirements to the security, safety, and nuclear waste management
and decommissioning. According to the projected electricity generation balance the share of
nuclear energy in the electricity generation mix will grow from 42% in 2005 to 45% in
2020 and will contribute to reducing the carbon intensity in the production of electricity.
Expected effect:
45% share of nuclear energy in the electricity generation mix
Monitoring indicator:
Share of nuclear energy in the electricity generation mix
Type of instrument:
Institutional support
Measure 3: Increasing the share of electric energy from renewable energy sources in the
electricity generation mix
Characteristics: The production of electricity from renewable sources will contribute
significantly to reducing the carbon intensity of the country’s electricity generation mix.
The national policy in this area is well developed in the adopted National Action Plan for
Renewable Energy by 2020 and the Renewable Energy Act. The production of electricity
from renewable sources is expected to increase to 7.5 TWh by 2020 or to account for 15%
in the electricity generation mix of the country which is equivalent approximately to 20%
implementation of the national target for renewable energy share in the gross energy
consumption in 2020. It will further contribute to reducing carbon intensity in the
production of electric energy.
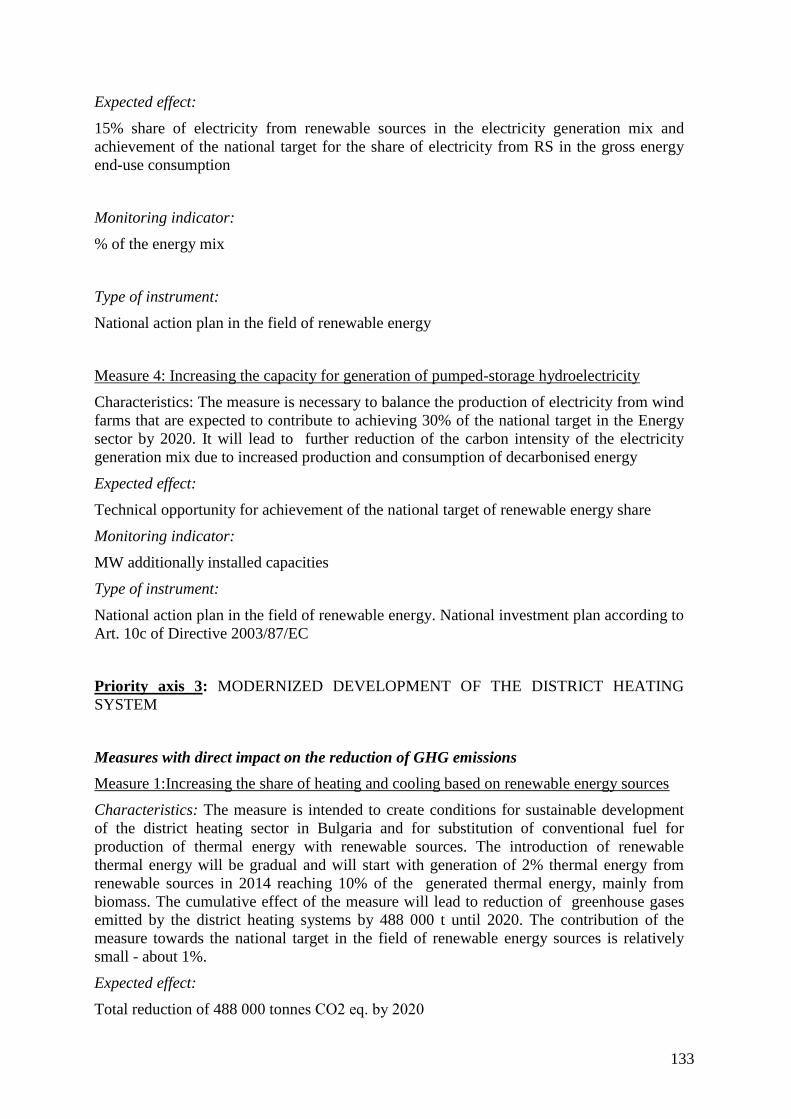
133
Expected effect:
15% share of electricity from renewable sources in the electricity generation mix and
achievement of the national target for the share of electricity from RS in the gross energy
end-use consumption
Monitoring indicator:
% of the energy mix
Type of instrument:
National action plan in the field of renewable energy
Measure 4: Increasing the capacity for generation of pumped-storage hydroelectricity
Characteristics: The measure is necessary to balance the production of electricity from wind
farms that are expected to contribute to achieving 30% of the national target in the Energy
sector by 2020. It will lead to further reduction of the carbon intensity of the electricity
generation mix due to increased production and consumption of decarbonised energy
Expected effect:
Technical opportunity for achievement of the national target of renewable energy share
Monitoring indicator:
MW additionally installed capacities
Type of instrument:
National action plan in the field of renewable energy. National investment plan according to
Art. 10c of Directive 2003/87/EC
Priority axis 3: MODERNIZED DEVELOPMENT OF THE DISTRICT HEATING
SYSTEM
Measures with direct impact on the reduction of GHG emissions
Measure 1:Increasing the share of heating and cooling based on renewable energy sources
Characteristics: The measure is intended to create conditions for sustainable development
of the district heating sector in Bulgaria and for substitution of conventional fuel for
production of thermal energy with renewable sources. The introduction of renewable
thermal energy will be gradual and will start with generation of 2% thermal energy from
renewable sources in 2014 reaching 10% of the generated thermal energy, mainly from
biomass. The cumulative effect of the measure will lead to reduction of greenhouse gases
emitted by the district heating systems by 488 000 t until 2020. The contribution of the
measure towards the national target in the field of renewable energy sources is relatively
small - about 1%.
Expected effect:
Total reduction of 488 000 tonnes СО2 eq. by 2020
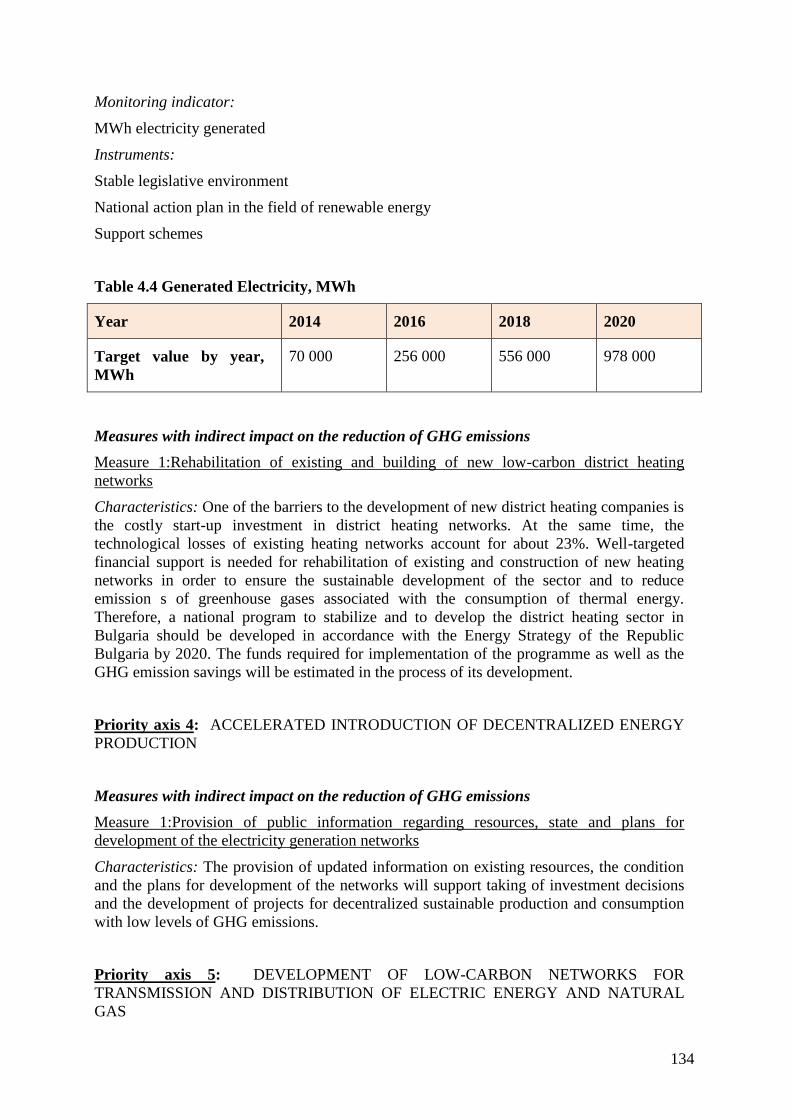
134
Monitoring indicator:
MWh electricity generated
Instruments:
Stable legislative environment
National action plan in the field of renewable energy
Support schemes
Table 4.4 Generated Electricity, MWh
Year 2014 2016 2018 2020
Target value by year,
MWh
70 000 256 000 556 000 978 000
Measures with indirect impact on the reduction of GHG emissions
Measure 1:Rehabilitation of existing and building of new low-carbon district heating
networks
Characteristics: One of the barriers to the development of new district heating companies is
the costly start-up investment in district heating networks. At the same time, the
technological losses of existing heating networks account for about 23%. Well-targeted
financial support is needed for rehabilitation of existing and construction of new heating
networks in order to ensure the sustainable development of the sector and to reduce
emission s of greenhouse gases associated with the consumption of thermal energy.
Therefore, a national program to stabilize and to develop the district heating sector in
Bulgaria should be developed in accordance with the Energy Strategy of the Republic
Bulgaria by 2020. The funds required for implementation of the programme as well as the
GHG emission savings will be estimated in the process of its development.
Priority axis 4: ACCELERATED INTRODUCTION OF DECENTRALIZED ENERGY
PRODUCTION
Measures with indirect impact on the reduction of GHG emissions
Measure 1:Provision of public information regarding resources, state and plans for
development of the electricity generation networks
Characteristics: The provision of updated information on existing resources, the condition
and the plans for development of the networks will support taking of investment decisions
and the development of projects for decentralized sustainable production and consumption
with low levels of GHG emissions.
Priority axis 5: DEVELOPMENT OF LOW-CARBON NETWORKS FOR
TRANSMISSION AND DISTRIBUTION OF ELECTRIC ENERGY AND NATURAL
GAS
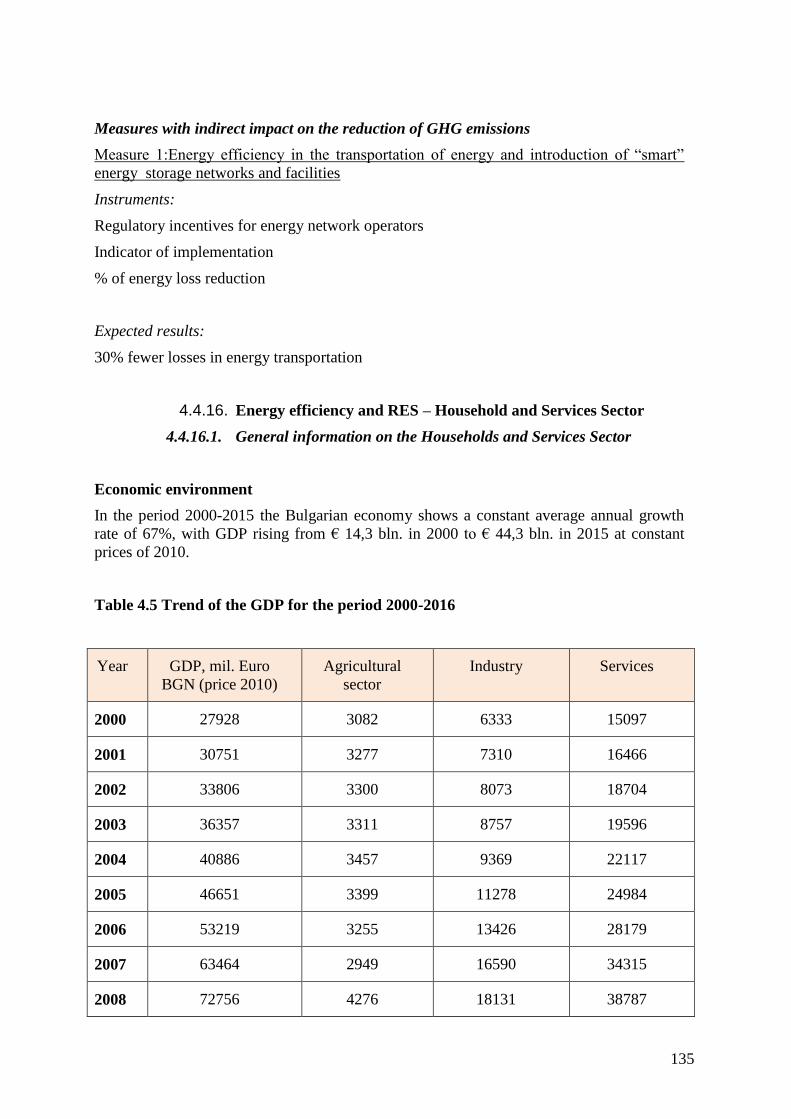
135
Measures with indirect impact on the reduction of GHG emissions
Measure 1:Energy efficiency in the transportation of energy and introduction of “smart”
energy storage networks and facilities
Instruments:
Regulatory incentives for energy network operators
Indicator of implementation
% of energy loss reduction
Expected results:
30% fewer losses in energy transportation
4.4.16. Energy efficiency and RES – Household and Services Sector
4.4.16.1. General information on the Households and Services Sector
Economic environment
In the period 2000-2015 the Bulgarian economy shows a constant average annual growth
rate of 67%, with GDP rising from € 14,3 bln. in 2000 to € 44,3 bln. in 2015 at constant
prices of 2010.
Table 4.5 Trend of the GDP for the period 2000-2016
Year GDP, mil. Euro
BGN (price 2010)
Agricultural
sector
Industry Services
2000 27928 3082 6333 15097
2001 30751 3277 7310 16466
2002 33806 3300 8073 18704
2003 36357 3311 8757 19596
2004 40886 3457 9369 22117
2005 46651 3399 11278 24984
2006 53219 3255 13426 28179
2007 63464 2949 16590 34315
2008 72756 4276 18131 38787

136
2009 72986 3093 19257 41009
2010 74771 3110 17802 44110
2011 80759 3711 20686 46228
2012 82040 3741 20510 46738
2013 82166 3776 19519 47476
2014 83634 3819 19705 49086
2015 88571 3664 21335 51547
2016 94130 3817 22993 54408
Figure 4.1 Basic indicators of economic development (mln. BGN)
Source: NSI
The next table present the structure in % of GVA by economic sectors.
Table 4.6 Structure of Gross Value Added by Economic Sector,%
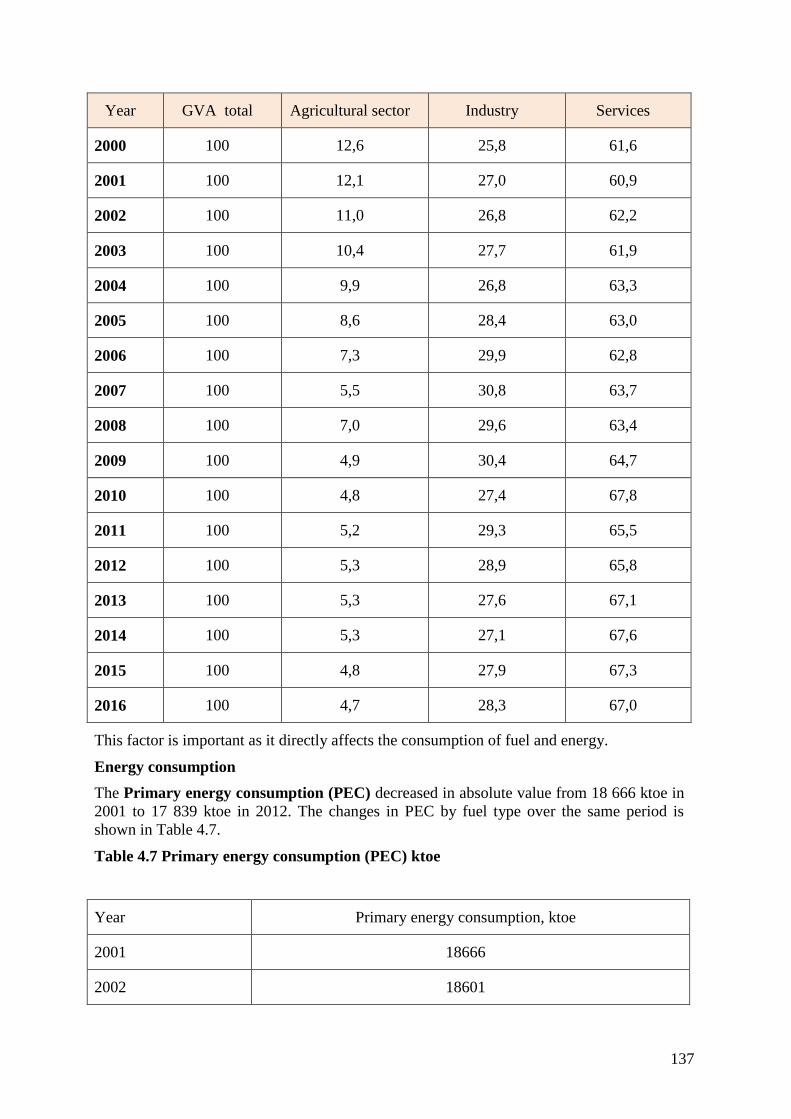
137
Year GVA total Agricultural sector Industry Services
2000 100 12,6 25,8 61,6
2001 100 12,1 27,0 60,9
2002 100 11,0 26,8 62,2
2003 100 10,4 27,7 61,9
2004 100 9,9 26,8 63,3
2005 100 8,6 28,4 63,0
2006 100 7,3 29,9 62,8
2007 100 5,5 30,8 63,7
2008 100 7,0 29,6 63,4
2009 100 4,9 30,4 64,7
2010 100 4,8 27,4 67,8
2011 100 5,2 29,3 65,5
2012 100 5,3 28,9 65,8
2013 100 5,3 27,6 67,1
2014 100 5,3 27,1 67,6
2015 100 4,8 27,9 67,3
2016 100 4,7 28,3 67,0
This factor is important as it directly affects the consumption of fuel and energy.
Energy consumption
The Primary energy consumption (PEC) decreased in absolute value from 18 666 ktoe in
2001 to 17 839 ktoe in 2012. The changes in PEC by fuel type over the same period is
shown in Table 4.7.
Table 4.7 Primary energy consumption (PEC) ktoe
Year Primary energy consumption, ktoe
2001 18666
2002 18601
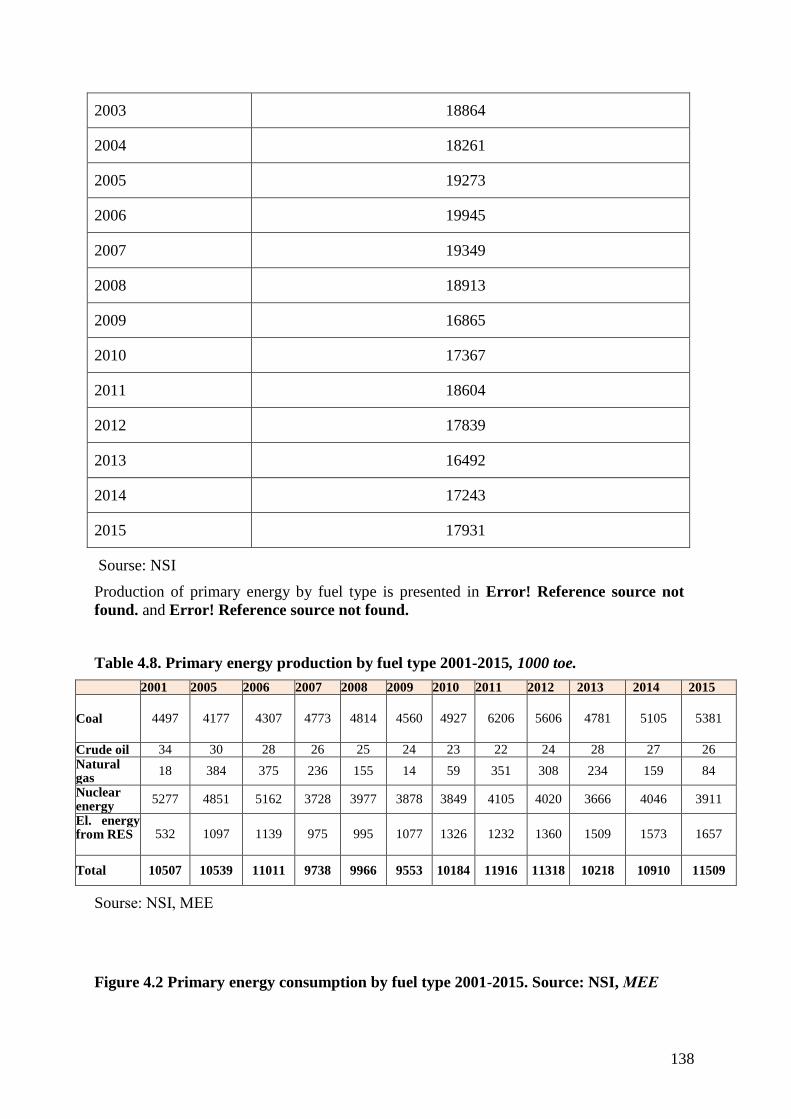
138
2003 18864
2004 18261
2005 19273
2006 19945
2007 19349
2008 18913
2009 16865
2010 17367
2011 18604
2012 17839
2013 16492
2014 17243
2015 17931
Sourse: NSI
Production of primary energy by fuel type is presented in Error! Reference source not
found. and Error! Reference source not found.
Table 4.8. Primary energy production by fuel type 2001-2015, 1000 toe.
2001 2005 2006 2007 2008 2009 2010 2011 2012 2013 2014 2015
Coal 4497 4177 4307 4773 4814 4560 4927 6206 5606 4781 5105 5381
Crude oil 34 30 28 26 25 24 23 22 24 28 27 26 Natural gas
18 384 375 236 155 14 59 351 308 234 159 84
Nuclear energy
5277 4851 5162 3728 3977 3878 3849 4105 4020 3666 4046 3911
El. energy from RES
532 1097 1139 975 995 1077 1326 1232 1360 1509 1573 1657
Total 10507 10539 11011 9738 9966 9553 10184 11916 11318 10218 10910 11509
Sourse: NSI, MEЕ
Figure 4.2 Primary energy consumption by fuel type 2001-2015. Source: NSI, MEЕ
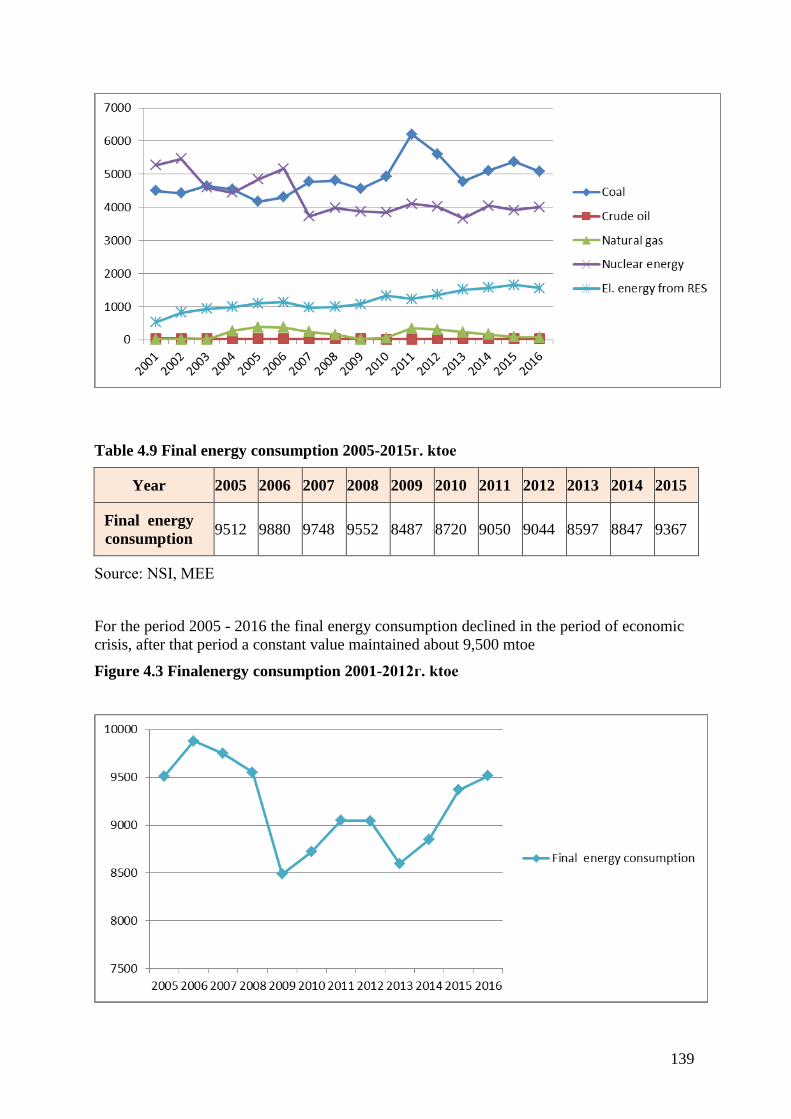
139
Table 4.9 Final energy consumption 2005-2015г. ktoe
Year 2005 2006 2007 2008 2009 2010 2011 2012 2013 2014 2015
Final energy
consumption 9512 9880 9748 9552 8487 8720 9050 9044 8597 8847 9367
Source: NSI, MEЕ
For the period 2005 - 2016 the final energy consumption declined in the period of economic
crisis, after that period a constant value maintained about 9,500 mtoe
Figure 4.3 Finalenergy consumption 2001-2012г. ktoe
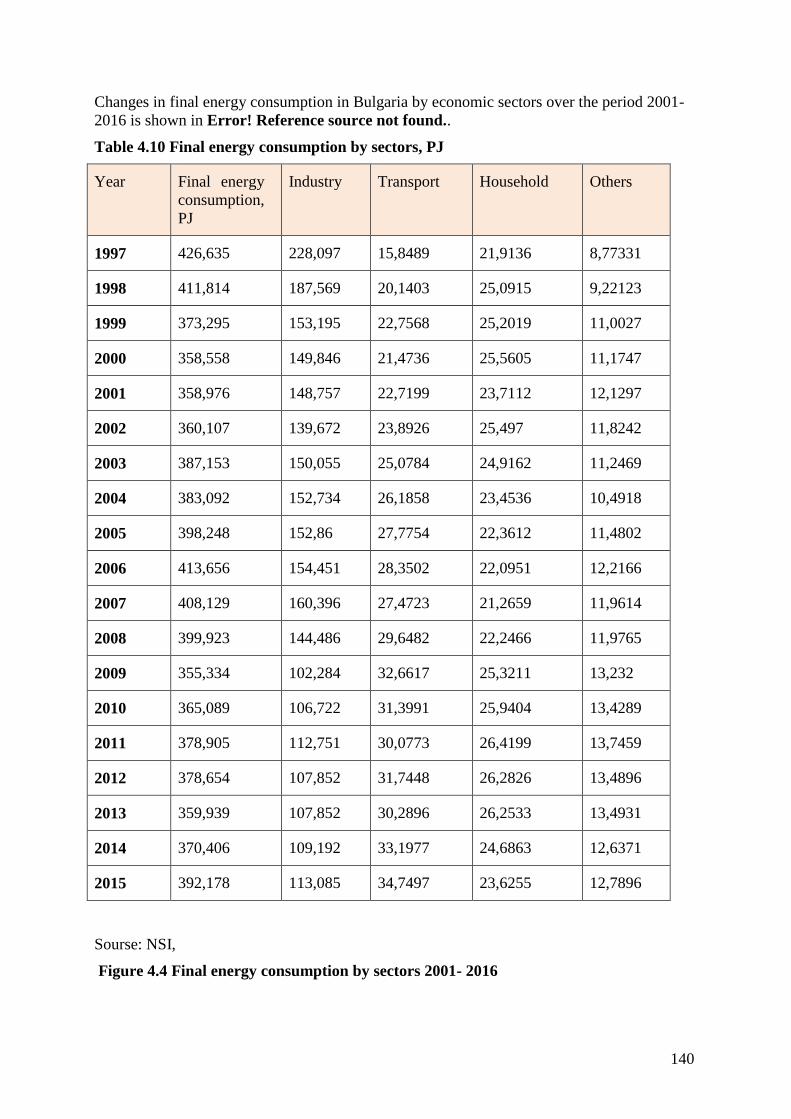
140
Changes in final energy consumption in Bulgaria by economic sectors over the period 2001-
2016 is shown in Error! Reference source not found..
Table 4.10 Final energy consumption by sectors, PJ
Year Final energy
consumption,
PJ
Industry Transport Household Others
1997 426,635 228,097 15,8489 21,9136 8,77331
1998 411,814 187,569 20,1403 25,0915 9,22123
1999 373,295 153,195 22,7568 25,2019 11,0027
2000 358,558 149,846 21,4736 25,5605 11,1747
2001 358,976 148,757 22,7199 23,7112 12,1297
2002 360,107 139,672 23,8926 25,497 11,8242
2003 387,153 150,055 25,0784 24,9162 11,2469
2004 383,092 152,734 26,1858 23,4536 10,4918
2005 398,248 152,86 27,7754 22,3612 11,4802
2006 413,656 154,451 28,3502 22,0951 12,2166
2007 408,129 160,396 27,4723 21,2659 11,9614
2008 399,923 144,486 29,6482 22,2466 11,9765
2009 355,334 102,284 32,6617 25,3211 13,232
2010 365,089 106,722 31,3991 25,9404 13,4289
2011 378,905 112,751 30,0773 26,4199 13,7459
2012 378,654 107,852 31,7448 26,2826 13,4896
2013 359,939 107,852 30,2896 26,2533 13,4931
2014 370,406 109,192 33,1977 24,6863 12,6371
2015 392,178 113,085 34,7497 23,6255 12,7896
Sourse: NSI,
Figure 4.4 Final energy consumption by sectors 2001- 2016
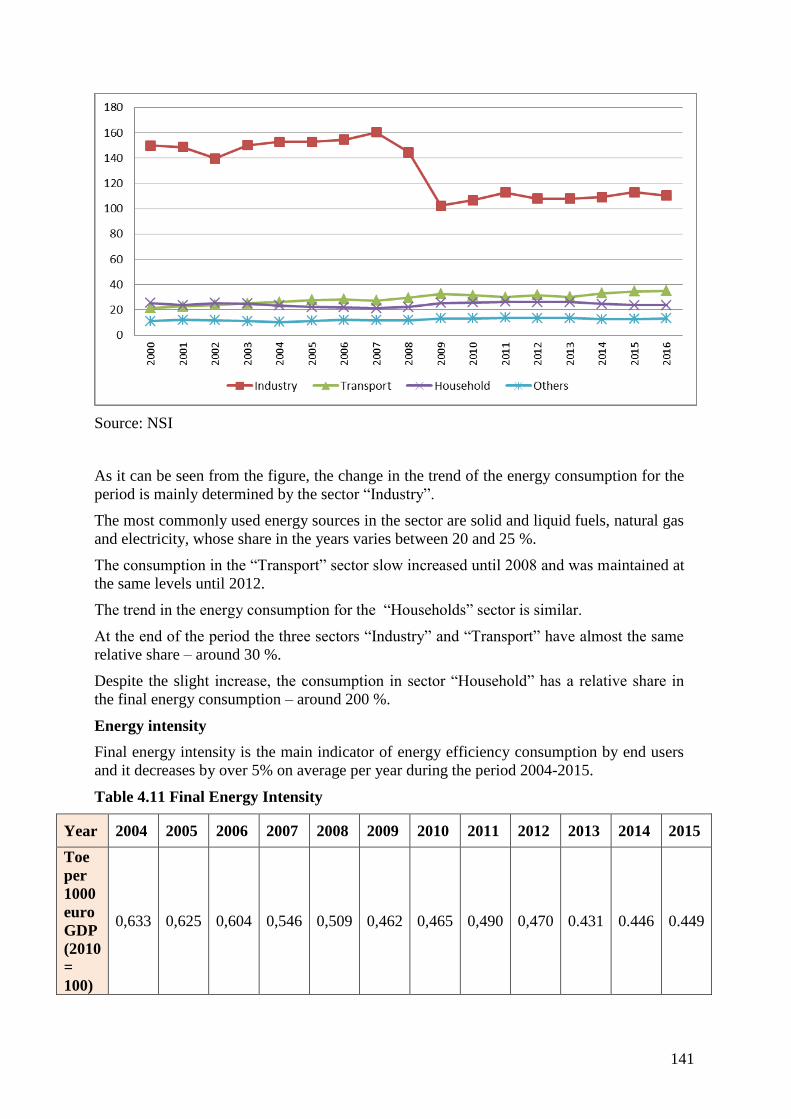
141
Source: NSI
As it can be seen from the figure, the change in the trend of the energy consumption for the
period is mainly determined by the sector “Industry”.
The most commonly used energy sources in the sector are solid and liquid fuels, natural gas
and electricity, whose share in the years varies between 20 and 25 %.
The consumption in the “Transport” sector slow increased until 2008 and was maintained at
the same levels until 2012.
The trend in the energy consumption for the “Households” sector is similar.
At the end of the period the three sectors “Industry” and “Transport” have almost the same
relative share – around 30 %.
Despite the slight increase, the consumption in sector “Household” has a relative share in
the final energy consumption – around 200 %.
Energy intensity
Final energy intensity is the main indicator of energy efficiency consumption by end users
and it decreases by over 5% on average per year during the period 2004-2015.
Table 4.11 Final Energy Intensity
Year 2004 2005 2006 2007 2008 2009 2010 2011 2012 2013 2014 2015
Toe
per
1000
euro
GDP
(2010
=
100)
0,633 0,625 0,604 0,546 0,509 0,462 0,465 0,490 0,470 0.431 0.446 0.449
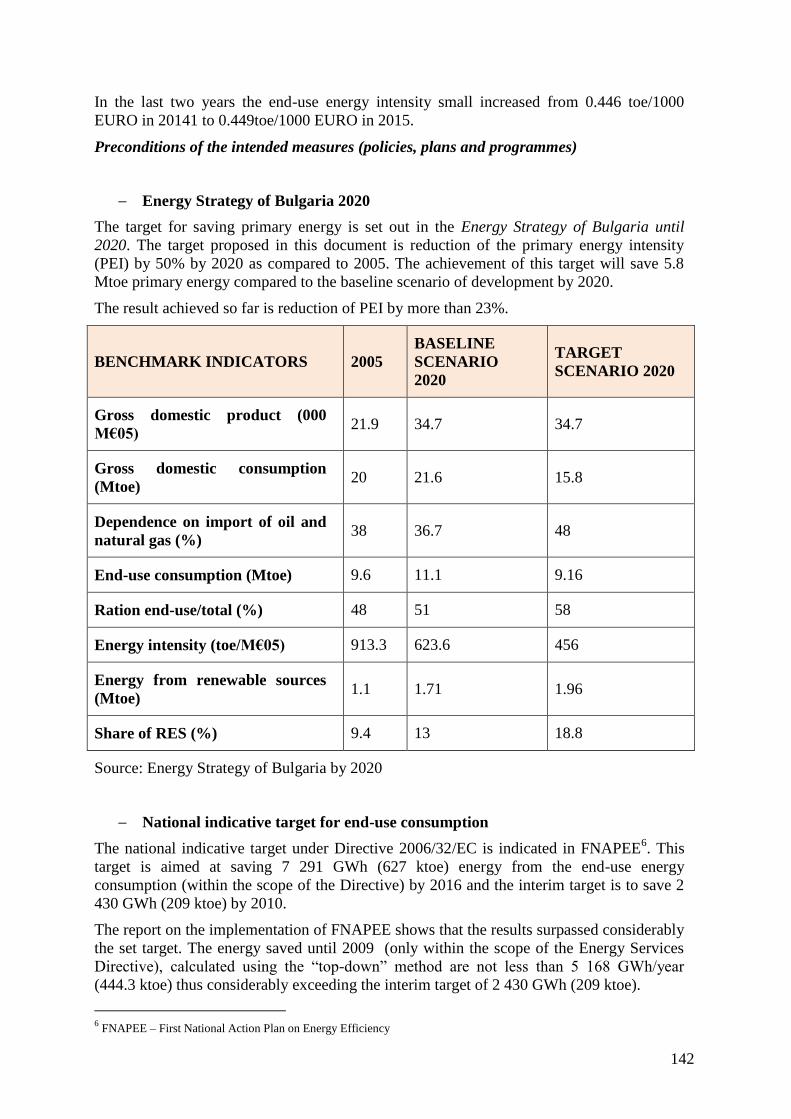
142
In the last two years the end-use energy intensity small increased from 0.446 toe/1000
EURO in 20141 to 0.449toe/1000 EURO in 2015.
Preconditions of the intended measures (policies, plans and programmes)
Energy Strategy of Bulgaria 2020
The target for saving primary energy is set out in the Energy Strategy of Bulgaria until
2020. The target proposed in this document is reduction of the primary energy intensity
(PEI) by 50% by 2020 as compared to 2005. The achievement of this target will save 5.8
Mtoe primary energy compared to the baseline scenario of development by 2020.
The result achieved so far is reduction of PEI by more than 23%.
BENCHMARK INDICATORS 2005
BASELINE
SCENARIO
2020
TARGET
SCENARIO 2020
Gross domestic product (000
М€05) 21.9 34.7 34.7
Gross domestic consumption
(Mtoe) 20 21.6 15.8
Dependence on import of oil and
natural gas (%) 38 36.7 48
End-use consumption (Mtoe) 9.6 11.1 9.16
Ration end-use/total (%) 48 51 58
Energy intensity (toe/М€05) 913.3 623.6 456
Energy from renewable sources
(Mtoe) 1.1 1.71 1.96
Share of RES (%) 9.4 13 18.8
Source: Energy Strategy of Bulgaria by 2020
National indicative target for end-use consumption
The national indicative target under Directive 2006/32/EC is indicated in FNAPEE6. This
target is aimed at saving 7 291 GWh (627 ktoe) energy from the end-use energy
consumption (within the scope of the Directive) by 2016 and the interim target is to save 2
430 GWh (209 ktoe) by 2010.
The report on the implementation of FNAPEE shows that the results surpassed considerably
the set target. The energy saved until 2009 (only within the scope of the Energy Services
Directive), calculated using the “top-down” method are not less than 5 168 GWh/year
(444.3 ktoe) thus considerably exceeding the interim target of 2 430 GWh (209 ktoe).
6 FNAPEE – First National Action Plan on Energy Efficiency
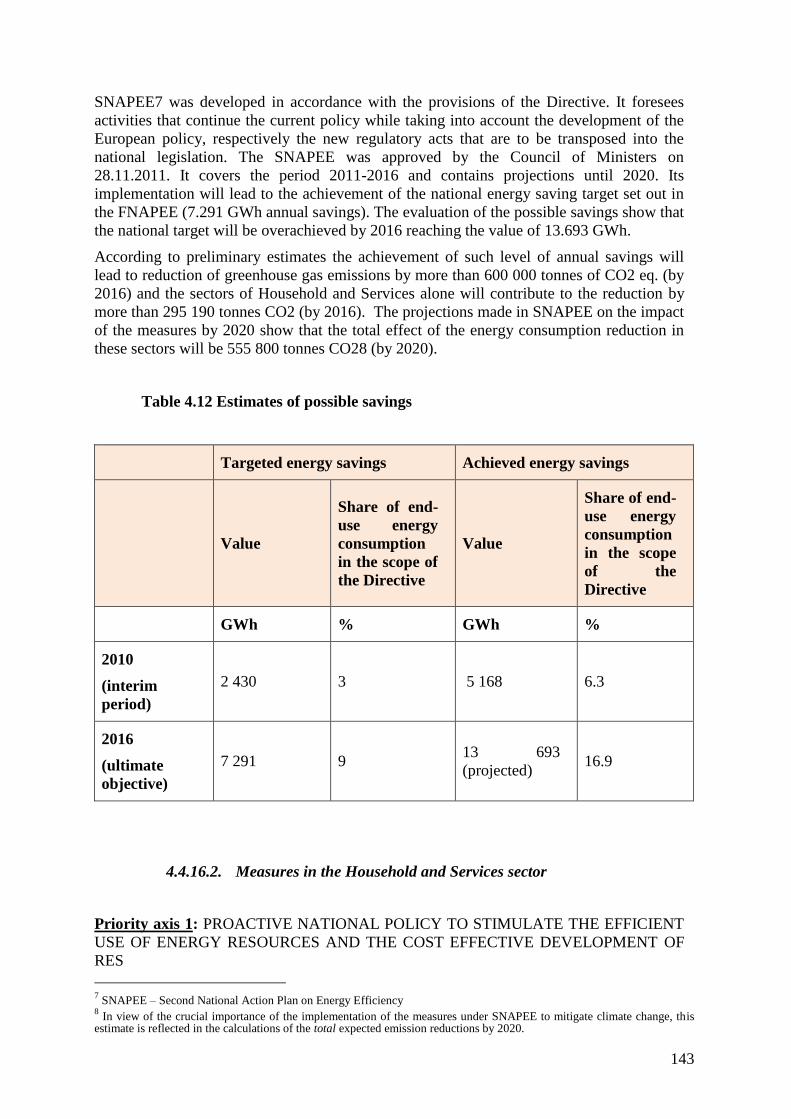
143
SNAPEE7 was developed in accordance with the provisions of the Directive. It foresees
activities that continue the current policy while taking into account the development of the
European policy, respectively the new regulatory acts that are to be transposed into the
national legislation. The SNAPEE was approved by the Council of Ministers on
28.11.2011. It covers the period 2011-2016 and contains projections until 2020. Its
implementation will lead to the achievement of the national energy saving target set out in
the FNAPEE (7.291 GWh annual savings). The evaluation of the possible savings show that
the national target will be overachieved by 2016 reaching the value of 13.693 GWh.
According to preliminary estimates the achievement of such level of annual savings will
lead to reduction of greenhouse gas emissions by more than 600 000 tonnes of CO2 eq. (by
2016) and the sectors of Household and Services alone will contribute to the reduction by
more than 295 190 tonnes CO2 (by 2016). The projections made in SNAPEE on the impact
of the measures by 2020 show that the total effect of the energy consumption reduction in
these sectors will be 555 800 tonnes CO28 (by 2020).
Table 4.12 Estimates of possible savings
Targeted energy savings Achieved energy savings
Value
Share of end-
use energy
consumption
in the scope of
the Directive
Value
Share of end-
use energy
consumption
in the scope
of the
Directive
GWh % GWh %
2010
(interim
period)
2 430 3 5 168 6.3
2016
(ultimate
objective)
7 291 9 13 693
(projected) 16.9
4.4.16.2. Measures in the Household and Services sector
Priority axis 1: PROACTIVE NATIONAL POLICY TO STIMULATE THE EFFICIENT
USE OF ENERGY RESOURCES AND THE COST EFFECTIVE DEVELOPMENT OF
RES
7 SNAPEE – Second National Action Plan on Energy Efficiency
8 In view of the crucial importance of the implementation of the measures under SNAPEE to mitigate climate change, this
estimate is reflected in the calculations of the total expected emission reductions by 2020.
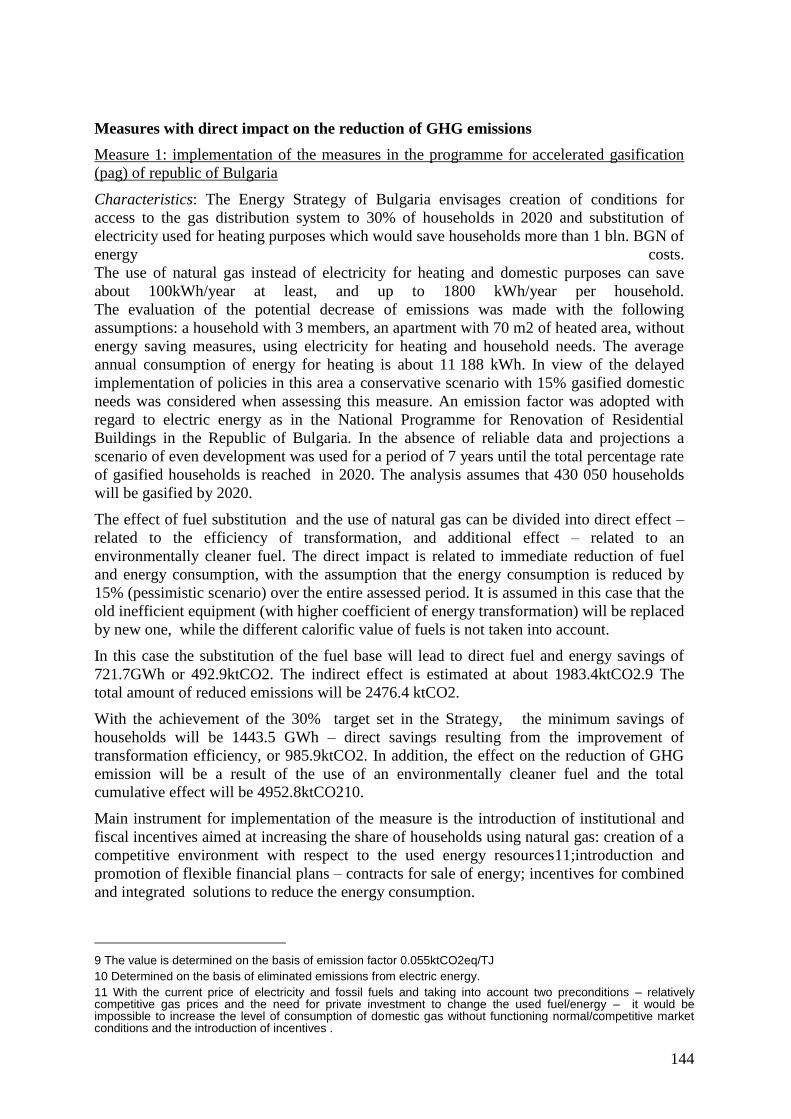
144
Measures with direct impact on the reduction of GHG emissions
Measure 1: implementation of the measures in the programme for accelerated gasification
(pag) of republic of Bulgaria
Characteristics: The Energy Strategy of Bulgaria envisages creation of conditions for
access to the gas distribution system to 30% of households in 2020 and substitution of
electricity used for heating purposes which would save households more than 1 bln. BGN of
energy costs.
The use of natural gas instead of electricity for heating and domestic purposes can save
about 100kWh/year at least, and up to 1800 kWh/year per household.
The evaluation of the potential decrease of emissions was made with the following
assumptions: a household with 3 members, an apartment with 70 m2 of heated area, without
energy saving measures, using electricity for heating and household needs. The average
annual consumption of energy for heating is about 11 188 kWh. In view of the delayed
implementation of policies in this area a conservative scenario with 15% gasified domestic
needs was considered when assessing this measure. An emission factor was adopted with
regard to electric energy as in the National Programme for Renovation of Residential
Buildings in the Republic of Bulgaria. In the absence of reliable data and projections a
scenario of even development was used for a period of 7 years until the total percentage rate
of gasified households is reached in 2020. The analysis assumes that 430 050 households
will be gasified by 2020.
The effect of fuel substitution and the use of natural gas can be divided into direct effect –
related to the efficiency of transformation, and additional effect – related to an
environmentally cleaner fuel. The direct impact is related to immediate reduction of fuel
and energy consumption, with the assumption that the energy consumption is reduced by
15% (pessimistic scenario) over the entire assessed period. It is assumed in this case that the
old inefficient equipment (with higher coefficient of energy transformation) will be replaced
by new one, while the different calorific value of fuels is not taken into account.
In this case the substitution of the fuel base will lead to direct fuel and energy savings of
721.7GWh or 492.9ktCO2. The indirect effect is estimated at about 1983.4ktCO2.9 The
total amount of reduced emissions will be 2476.4 ktCO2.
With the achievement of the 30% target set in the Strategy, the minimum savings of
households will be 1443.5 GWh – direct savings resulting from the improvement of
transformation efficiency, or 985.9ktCO2. In addition, the effect on the reduction of GHG
emission will be a result of the use of an environmentally cleaner fuel and the total
cumulative effect will be 4952.8ktCO210.
Main instrument for implementation of the measure is the introduction of institutional and
fiscal incentives aimed at increasing the share of households using natural gas: creation of a
competitive environment with respect to the used energy resources11;introduction and
promotion of flexible financial plans – contracts for sale of energy; incentives for combined
and integrated solutions to reduce the energy consumption.
9 The value is determined on the basis of emission factor 0.055ktCO2eq/TJ
10 Determined on the basis of eliminated emissions from electric energy.
11 With the current price of electricity and fossil fuels and taking into account two preconditions – relatively competitive gas prices and the need for private investment to change the used fuel/energy – it would be impossible to increase the level of consumption of domestic gas without functioning normal/competitive market conditions and the introduction of incentives .
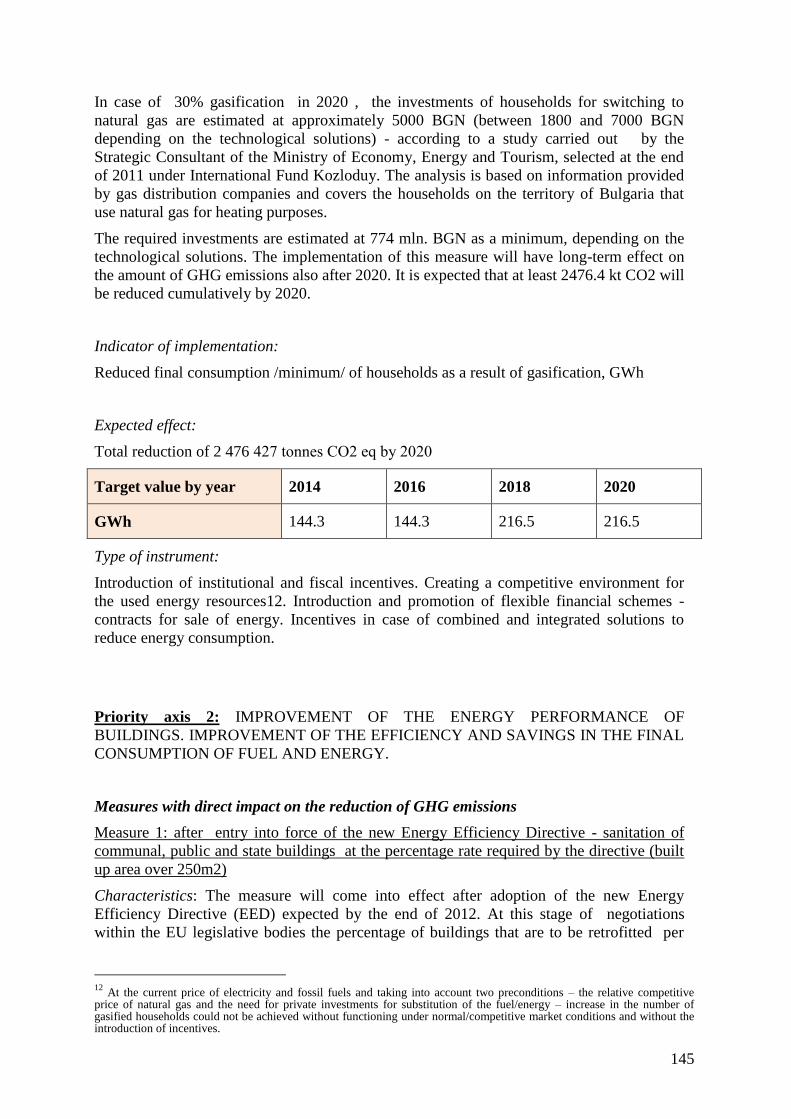
145
In case of 30% gasification in 2020 , the investments of households for switching to
natural gas are estimated at approximately 5000 BGN (between 1800 and 7000 BGN
depending on the technological solutions) - according to a study carried out by the
Strategic Consultant of the Ministry of Economy, Energy and Tourism, selected at the end
of 2011 under International Fund Kozloduy. The analysis is based on information provided
by gas distribution companies and covers the households on the territory of Bulgaria that
use natural gas for heating purposes.
The required investments are estimated at 774 mln. BGN as a minimum, depending on the
technological solutions. The implementation of this measure will have long-term effect on
the amount of GHG emissions also after 2020. It is expected that at least 2476.4 kt CO2 will
be reduced cumulatively by 2020.
Indicator of implementation:
Reduced final consumption /minimum/ of households as a result of gasification, GWh
Expected effect:
Total reduction of 2 476 427 tonnes СО2 eq by 2020
Target value by year 2014 2016 2018 2020
GWh 144.3 144.3 216.5 216.5
Type of instrument:
Introduction of institutional and fiscal incentives. Creating a competitive environment for
the used energy resources12. Introduction and promotion of flexible financial schemes -
contracts for sale of energy. Incentives in case of combined and integrated solutions to
reduce energy consumption.
Priority axis 2: IMPROVEMENT OF THE ENERGY PERFORMANCE OF
BUILDINGS. IMPROVEMENT OF THE EFFICIENCY AND SAVINGS IN THE FINAL
CONSUMPTION OF FUEL AND ENERGY.
Measures with direct impact on the reduction of GHG emissions
Measure 1: after entry into force of the new Energy Efficiency Directive - sanitation of
communal, public and state buildings at the percentage rate required by the directive (built
up area over 250m2)
Characteristics: The measure will come into effect after adoption of the new Energy
Efficiency Directive (EED) expected by the end of 2012. At this stage of negotiations
within the EU legislative bodies the percentage of buildings that are to be retrofitted per
12
At the current price of electricity and fossil fuels and taking into account two preconditions – the relative competitive price of natural gas and the need for private investments for substitution of the fuel/energy – increase in the number of gasified households could not be achieved without functioning under normal/competitive market conditions and without the introduction of incentives.
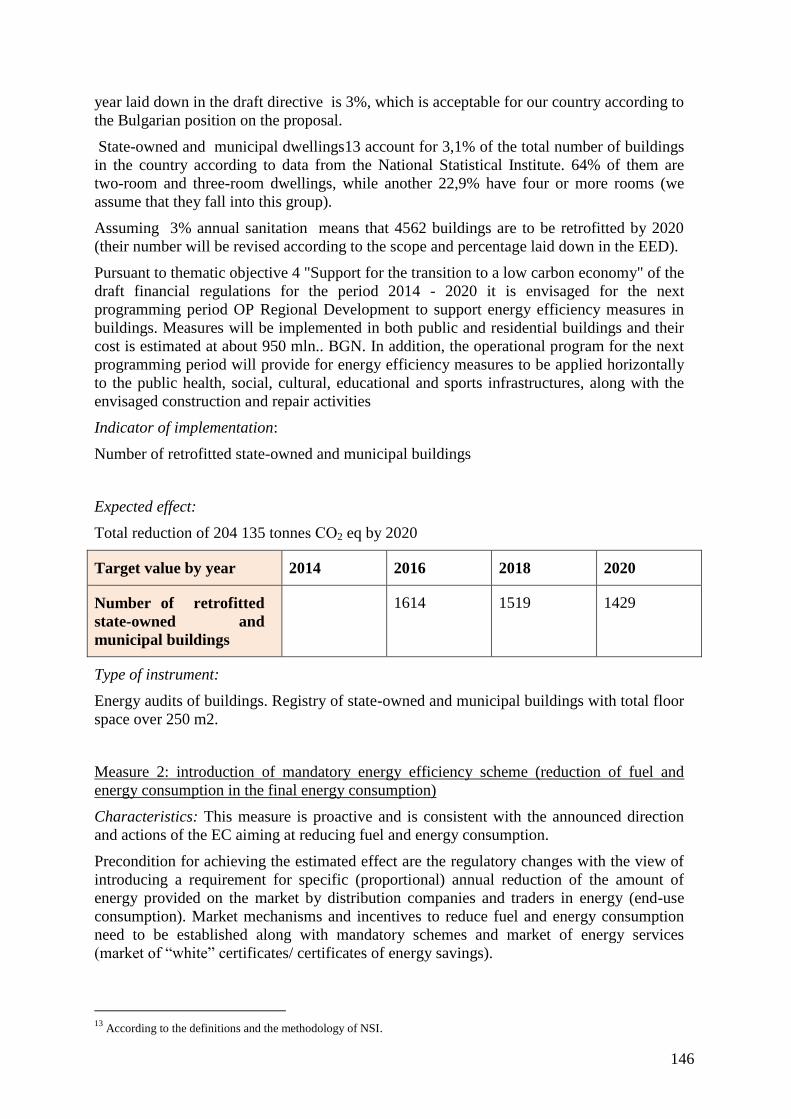
146
year laid down in the draft directive is 3%, which is acceptable for our country according to
the Bulgarian position on the proposal.
State-owned and municipal dwellings13 account for 3,1% of the total number of buildings
in the country according to data from the National Statistical Institute. 64% of them are
two-room and three-room dwellings, while another 22,9% have four or more rooms (we
assume that they fall into this group).
Assuming 3% annual sanitation means that 4562 buildings are to be retrofitted by 2020
(their number will be revised according to the scope and percentage laid down in the EED).
Pursuant to thematic objective 4 "Support for the transition to a low carbon economy" of the
draft financial regulations for the period 2014 - 2020 it is envisaged for the next
programming period OP Regional Development to support energy efficiency measures in
buildings. Measures will be implemented in both public and residential buildings and their
cost is estimated at about 950 mln.. BGN. In addition, the operational program for the next
programming period will provide for energy efficiency measures to be applied horizontally
to the public health, social, cultural, educational and sports infrastructures, along with the
envisaged construction and repair activities
Indicator of implementation:
Number of retrofitted state-owned and municipal buildings
Expected effect:
Total reduction of 204 135 tonnes СО2 eq by 2020
Target value by year 2014 2016 2018 2020
Number of retrofitted
state-owned and
municipal buildings
1614 1519 1429
Type of instrument:
Energy audits of buildings. Registry of state-owned and municipal buildings with total floor
space over 250 m2.
Measure 2: introduction of mandatory energy efficiency scheme (reduction of fuel and
energy consumption in the final energy consumption)
Characteristics: This measure is proactive and is consistent with the announced direction
and actions of the EC aiming at reducing fuel and energy consumption.
Precondition for achieving the estimated effect are the regulatory changes with the view of
introducing a requirement for specific (proportional) annual reduction of the amount of
energy provided on the market by distribution companies and traders in energy (end-use
consumption). Market mechanisms and incentives to reduce fuel and energy consumption
need to be established along with mandatory schemes and market of energy services
(market of “white” certificates/ certificates of energy savings).
13
According to the definitions and the methodology of NSI.
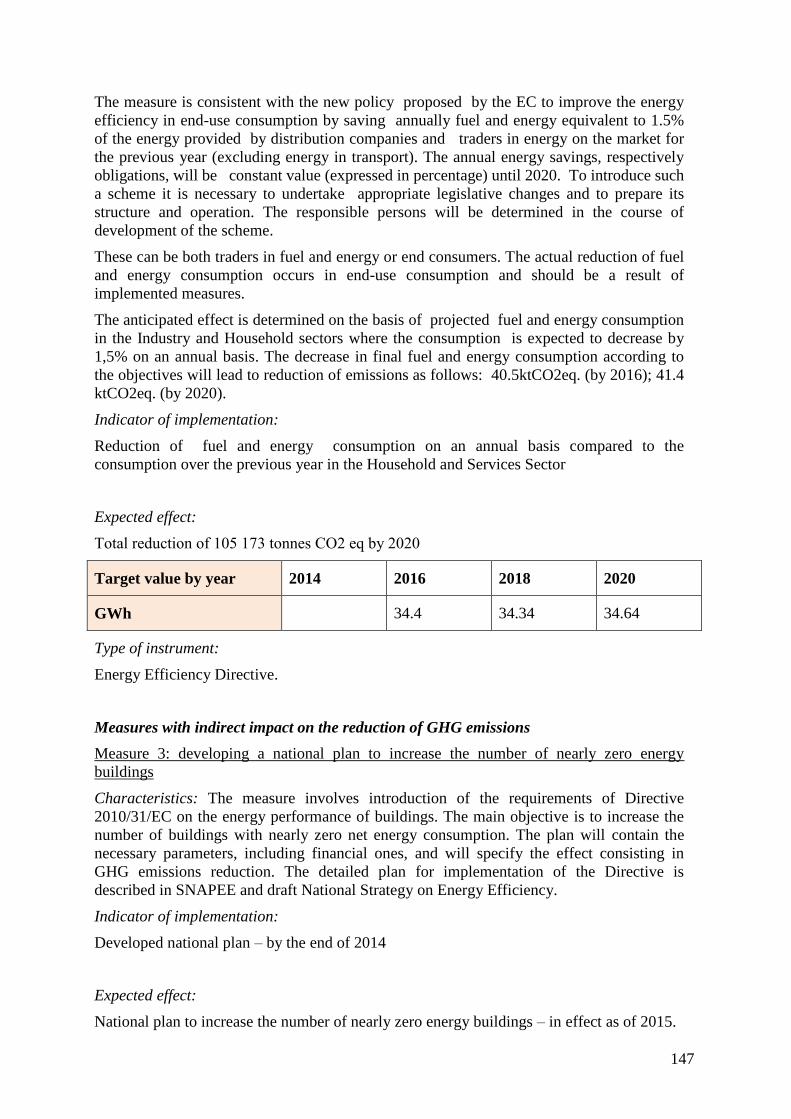
147
The measure is consistent with the new policy proposed by the EC to improve the energy
efficiency in end-use consumption by saving annually fuel and energy equivalent to 1.5%
of the energy provided by distribution companies and traders in energy on the market for
the previous year (excluding energy in transport). The annual energy savings, respectively
obligations, will be constant value (expressed in percentage) until 2020. To introduce such
a scheme it is necessary to undertake appropriate legislative changes and to prepare its
structure and operation. The responsible persons will be determined in the course of
development of the scheme.
These can be both traders in fuel and energy or end consumers. The actual reduction of fuel
and energy consumption occurs in end-use consumption and should be a result of
implemented measures.
The anticipated effect is determined on the basis of projected fuel and energy consumption
in the Industry and Household sectors where the consumption is expected to decrease by
1,5% on an annual basis. The decrease in final fuel and energy consumption according to
the objectives will lead to reduction of emissions as follows: 40.5ktCO2eq. (by 2016); 41.4
ktCO2eq. (by 2020).
Indicator of implementation:
Reduction of fuel and energy consumption on an annual basis compared to the
consumption over the previous year in the Household and Services Sector
Expected effect:
Total reduction of 105 173 tonnes СО2 eq by 2020
Target value by year 2014 2016 2018 2020
GWh 34.4 34.34 34.64
Type of instrument:
Energy Efficiency Directive.
Measures with indirect impact on the reduction of GHG emissions
Measure 3: developing a national plan to increase the number of nearly zero energy
buildings
Characteristics: The measure involves introduction of the requirements of Directive
2010/31/EC on the energy performance of buildings. The main objective is to increase the
number of buildings with nearly zero net energy consumption. The plan will contain the
necessary parameters, including financial ones, and will specify the effect consisting in
GHG emissions reduction. The detailed plan for implementation of the Directive is
described in SNAPEE and draft National Strategy on Energy Efficiency.
Indicator of implementation:
Developed national plan – by the end of 2014
Expected effect:
National plan to increase the number of nearly zero energy buildings – in effect as of 2015.
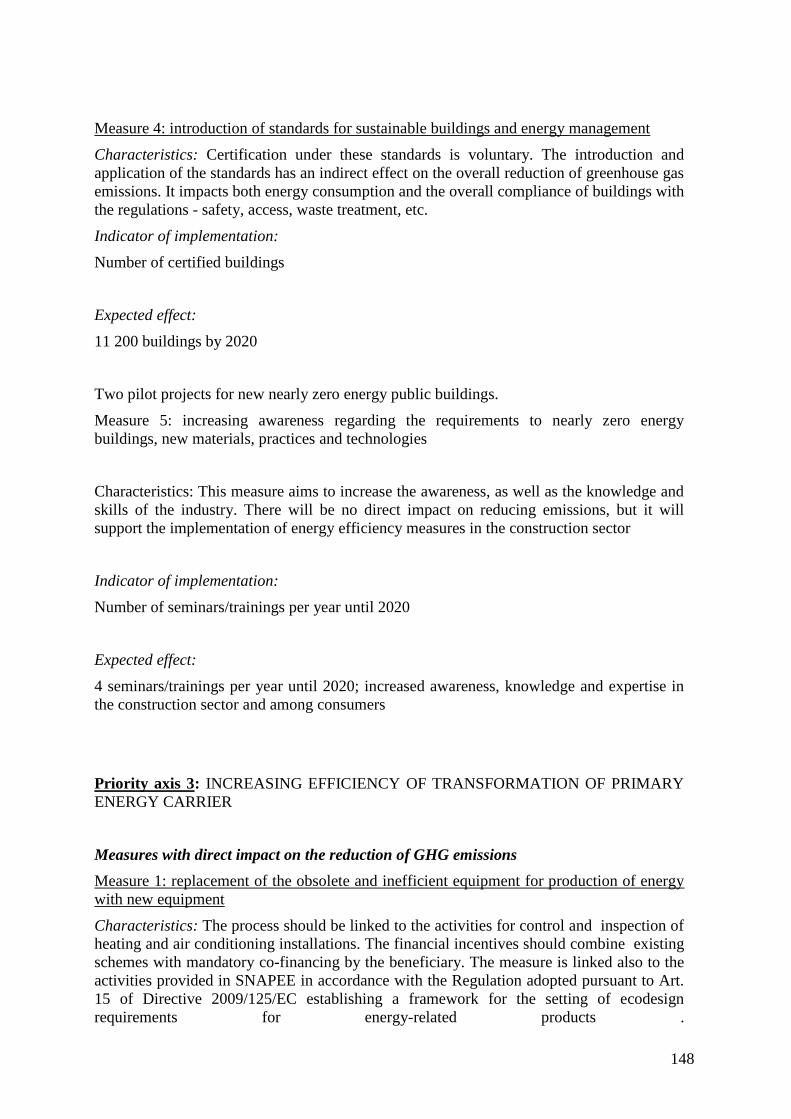
148
Measure 4: introduction of standards for sustainable buildings and energy management
Characteristics: Certification under these standards is voluntary. The introduction and
application of the standards has an indirect effect on the overall reduction of greenhouse gas
emissions. It impacts both energy consumption and the overall compliance of buildings with
the regulations - safety, access, waste treatment, etc.
Indicator of implementation:
Number of certified buildings
Expected effect:
11 200 buildings by 2020
Two pilot projects for new nearly zero energy public buildings.
Measure 5: increasing awareness regarding the requirements to nearly zero energy
buildings, new materials, practices and technologies
Characteristics: This measure aims to increase the awareness, as well as the knowledge and
skills of the industry. There will be no direct impact on reducing emissions, but it will
support the implementation of energy efficiency measures in the construction sector
Indicator of implementation:
Number of seminars/trainings per year until 2020
Expected effect:
4 seminars/trainings per year until 2020; increased awareness, knowledge and expertise in
the construction sector and among consumers
Priority axis 3: INCREASING EFFICIENCY OF TRANSFORMATION OF PRIMARY
ENERGY CARRIER
Measures with direct impact on the reduction of GHG emissions
Measure 1: replacement of the obsolete and inefficient equipment for production of energy
with new equipment
Characteristics: The process should be linked to the activities for control and inspection of
heating and air conditioning installations. The financial incentives should combine existing
schemes with mandatory co-financing by the beneficiary. The measure is linked also to the
activities provided in SNAPEE in accordance with the Regulation adopted pursuant to Art.
15 of Directive 2009/125/EC establishing a framework for the setting of ecodesign
requirements for energy-related products .
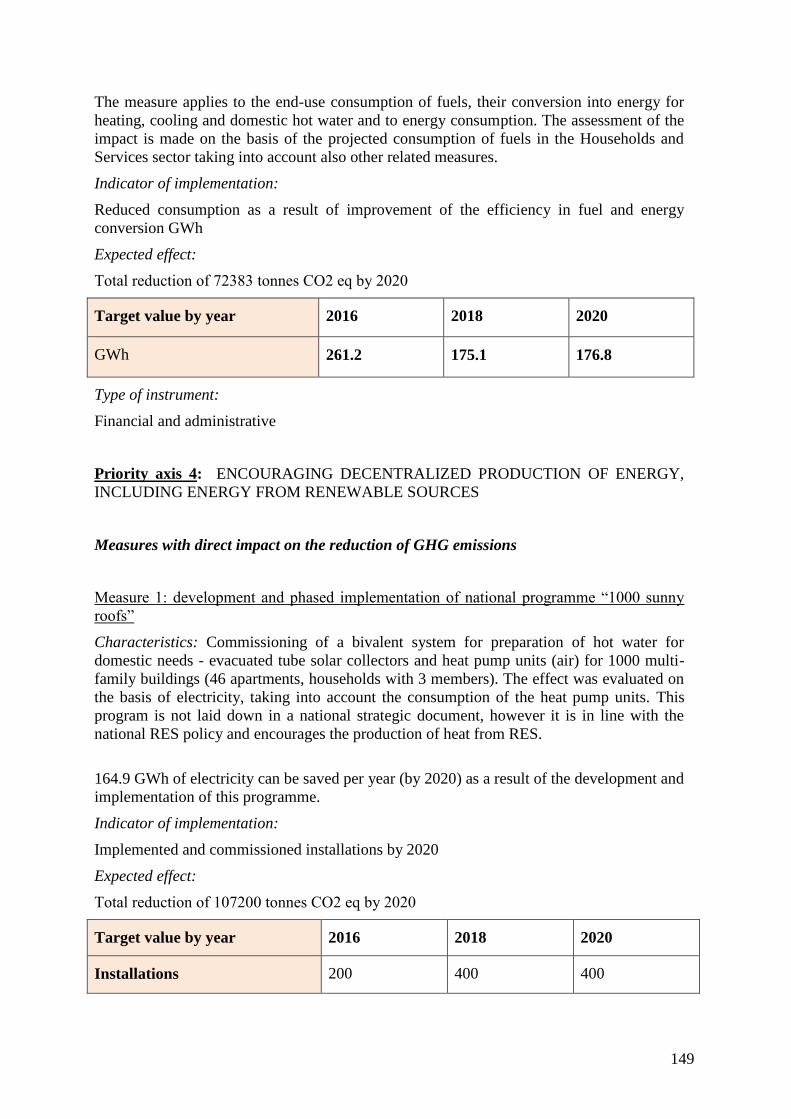
149
The measure applies to the end-use consumption of fuels, their conversion into energy for
heating, cooling and domestic hot water and to energy consumption. The assessment of the
impact is made on the basis of the projected consumption of fuels in the Households and
Services sector taking into account also other related measures.
Indicator of implementation:
Reduced consumption as a result of improvement of the efficiency in fuel and energy
conversion GWh
Expected effect:
Total reduction of 72383 tonnes СО2 eq by 2020
Target value by year 2016 2018 2020
GWh 261.2 175.1 176.8
Type of instrument:
Financial and administrative
Priority axis 4: ENCOURAGING DECENTRALIZED PRODUCTION OF ENERGY,
INCLUDING ENERGY FROM RENEWABLE SOURCES
Measures with direct impact on the reduction of GHG emissions
Measure 1: development and phased implementation of national programme “1000 sunny
roofs”
Characteristics: Commissioning of a bivalent system for preparation of hot water for
domestic needs - evacuated tube solar collectors and heat pump units (air) for 1000 multi-
family buildings (46 apartments, households with 3 members). The effect was evaluated on
the basis of electricity, taking into account the consumption of the heat pump units. This
program is not laid down in a national strategic document, however it is in line with the
national RES policy and encourages the production of heat from RES.
164.9 GWh of electricity can be saved per year (by 2020) as a result of the development and
implementation of this programme.
Indicator of implementation:
Implemented and commissioned installations by 2020
Expected effect:
Total reduction of 107200 tonnes СО2 eq by 2020
Target value by year 2016 2018 2020
Installations 200 400 400
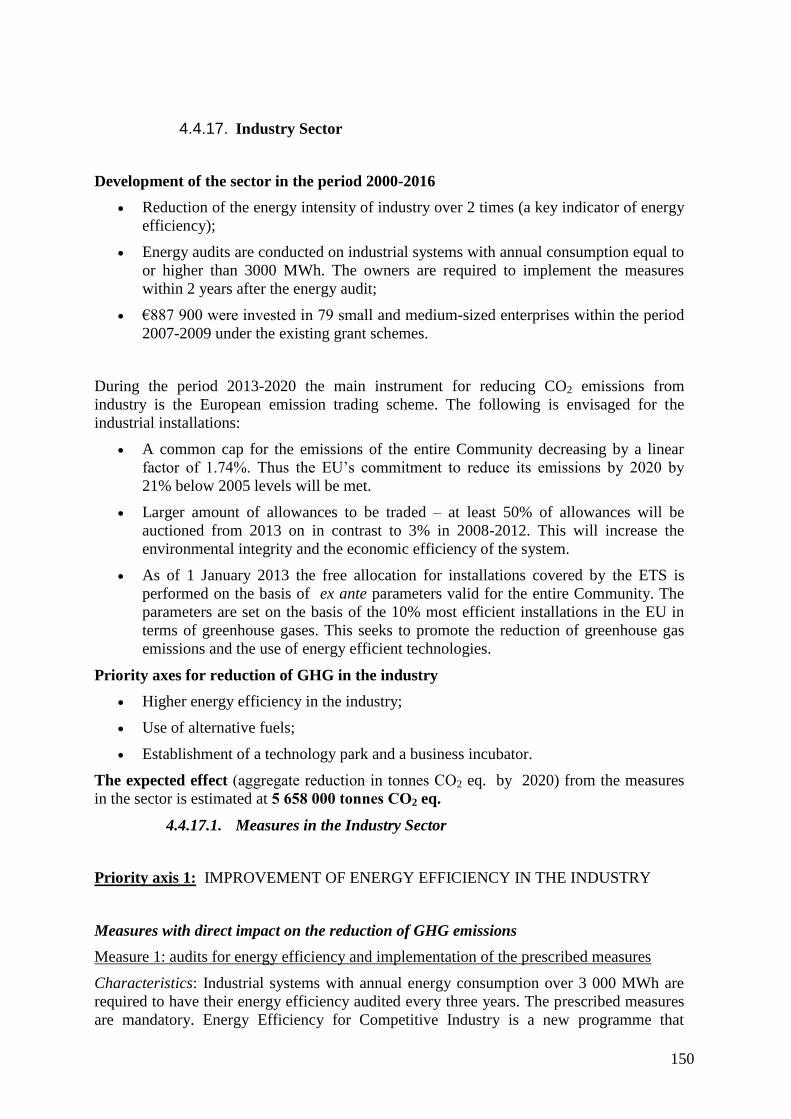
150
4.4.17. Industry Sector
Development of the sector in the period 2000-2016
Reduction of the energy intensity of industry over 2 times (a key indicator of energy
efficiency);
Energy audits are conducted on industrial systems with annual consumption equal to
or higher than 3000 MWh. The owners are required to implement the measures
within 2 years after the energy audit;
€887 900 were invested in 79 small and medium-sized enterprises within the period
2007-2009 under the existing grant schemes.
During the period 2013-2020 the main instrument for reducing CO2 emissions from
industry is the European emission trading scheme. The following is envisaged for the
industrial installations:
A common cap for the emissions of the entire Community decreasing by a linear
factor of 1.74%. Thus the EU’s commitment to reduce its emissions by 2020 by
21% below 2005 levels will be met.
Larger amount of allowances to be traded – at least 50% of allowances will be
auctioned from 2013 on in contrast to 3% in 2008-2012. This will increase the
environmental integrity and the economic efficiency of the system.
As of 1 January 2013 the free allocation for installations covered by the ETS is
performed on the basis of ex ante parameters valid for the entire Community. The
parameters are set on the basis of the 10% most efficient installations in the EU in
terms of greenhouse gases. This seeks to promote the reduction of greenhouse gas
emissions and the use of energy efficient technologies.
Priority axes for reduction of GHG in the industry
Higher energy efficiency in the industry;
Use of alternative fuels;
Establishment of a technology park and a business incubator.
The expected effect (aggregate reduction in tonnes СО2 eq. by 2020) from the measures
in the sector is estimated at 5 658 000 tonnes СО2 eq.
4.4.17.1. Measures in the Industry Sector
Priority axis 1: IMPROVEMENT OF ENERGY EFFICIENCY IN THE INDUSTRY
Measures with direct impact on the reduction of GHG emissions
Measure 1: audits for energy efficiency and implementation of the prescribed measures
Characteristics: Industrial systems with annual energy consumption over 3 000 MWh are
required to have their energy efficiency audited every three years. The prescribed measures
are mandatory. Energy Efficiency for Competitive Industry is a new programme that
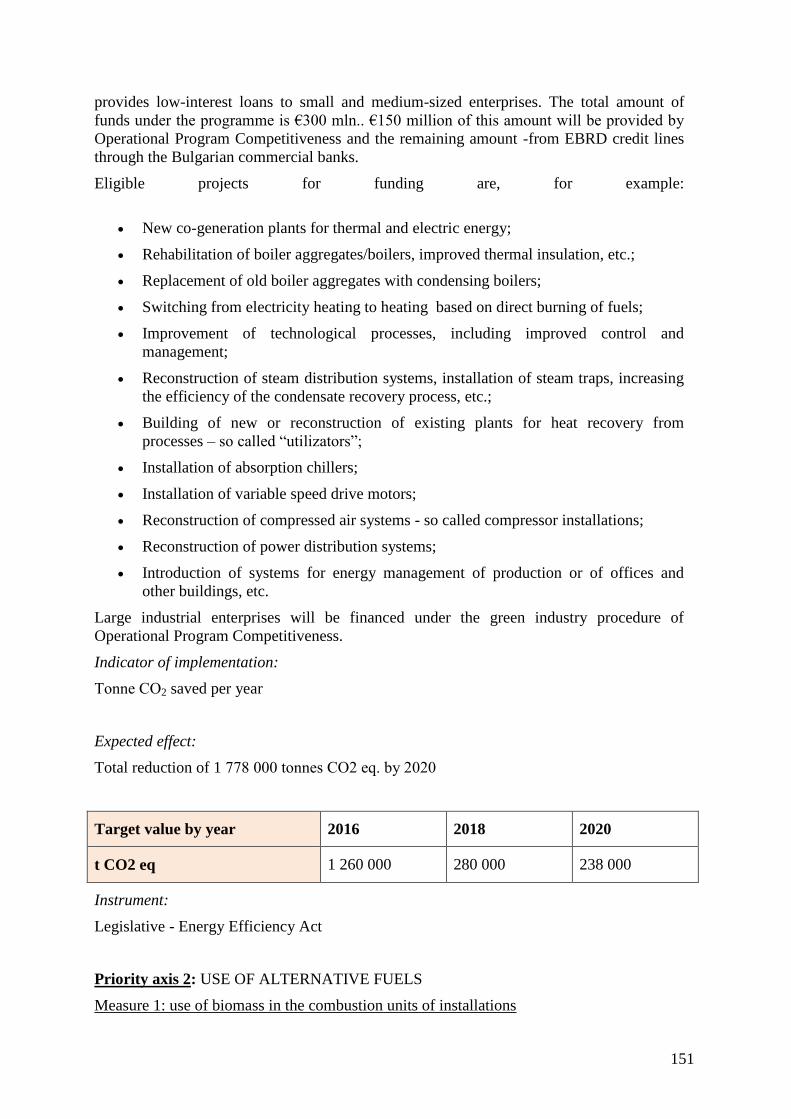
151
provides low-interest loans to small and medium-sized enterprises. The total amount of
funds under the programme is €300 mln.. €150 million of this amount will be provided by
Operational Program Competitiveness and the remaining amount -from EBRD credit lines
through the Bulgarian commercial banks.
Eligible projects for funding are, for example:
New co-generation plants for thermal and electric energy;
Rehabilitation of boiler aggregates/boilers, improved thermal insulation, etc.;
Replacement of old boiler aggregates with condensing boilers;
Switching from electricity heating to heating based on direct burning of fuels;
Improvement of technological processes, including improved control and
management;
Reconstruction of steam distribution systems, installation of steam traps, increasing
the efficiency of the condensate recovery process, etc.;
Building of new or reconstruction of existing plants for heat recovery from
processes – so called “utilizators”;
Installation of absorption chillers;
Installation of variable speed drive motors;
Reconstruction of compressed air systems - so called compressor installations;
Reconstruction of power distribution systems;
Introduction of systems for energy management of production or of offices and
other buildings, etc.
Large industrial enterprises will be financed under the green industry procedure of
Operational Program Competitiveness.
Indicator of implementation:
Tonne СО2 saved per year
Expected effect:
Total reduction of 1 778 000 tonnes СО2 eq. by 2020
Target value by year 2016 2018 2020
t CO2 eq 1 260 000 280 000 238 000
Instrument:
Legislative - Energy Efficiency Act
Priority axis 2: USE OF ALTERNATIVE FUELS
Measure 1: use of biomass in the combustion units of installations
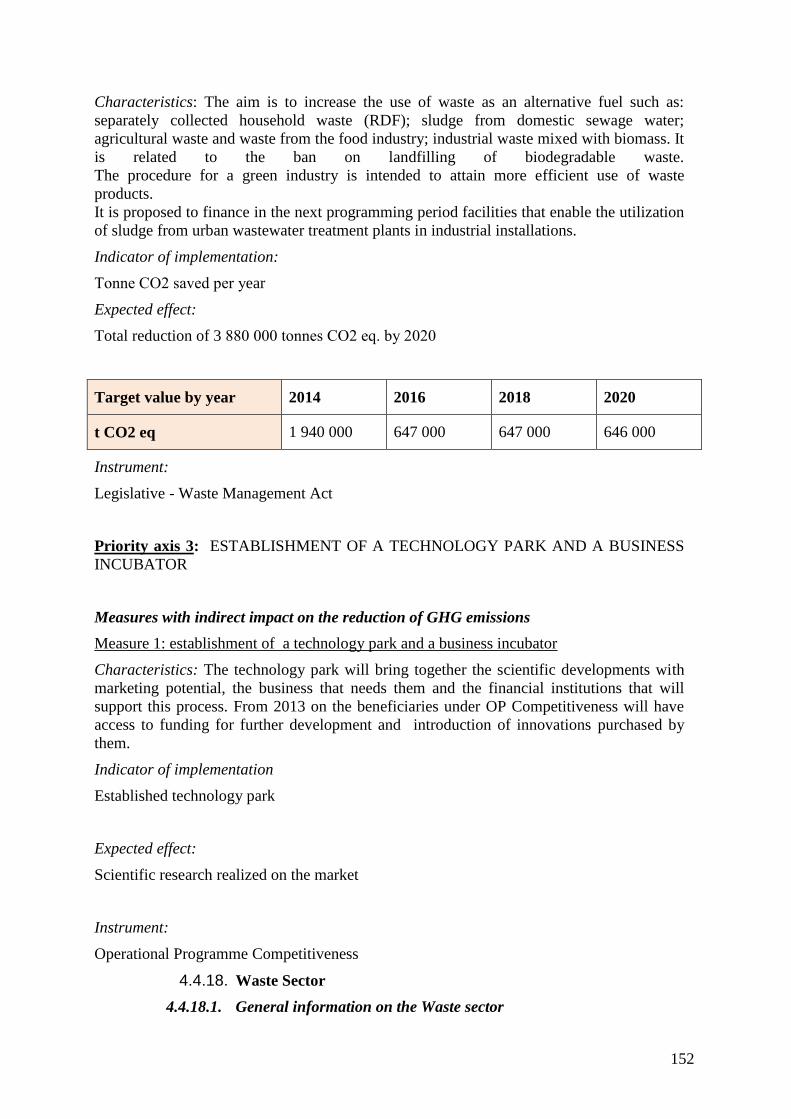
152
Characteristics: The aim is to increase the use of waste as an alternative fuel such as:
separately collected household waste (RDF); sludge from domestic sewage water;
agricultural waste and waste from the food industry; industrial waste mixed with biomass. It
is related to the ban on landfilling of biodegradable waste.
The procedure for a green industry is intended to attain more efficient use of waste
products.
It is proposed to finance in the next programming period facilities that enable the utilization
of sludge from urban wastewater treatment plants in industrial installations.
Indicator of implementation:
Tonne СО2 saved per year
Expected effect:
Total reduction of 3 880 000 tonnes СО2 eq. by 2020
Target value by year 2014 2016 2018 2020
t CO2 eq 1 940 000 647 000 647 000 646 000
Instrument:
Legislative - Waste Management Act
Priority axis 3: ESTABLISHMENT OF A TECHNOLOGY PARK AND A BUSINESS
INCUBATOR
Measures with indirect impact on the reduction of GHG emissions
Measure 1: establishment of a technology park and a business incubator
Characteristics: The technology park will bring together the scientific developments with
marketing potential, the business that needs them and the financial institutions that will
support this process. From 2013 on the beneficiaries under OP Competitiveness will have
access to funding for further development and introduction of innovations purchased by
them.
Indicator of implementation
Established technology park
Expected effect:
Scientific research realized on the market
Instrument:
Operational Programme Competitiveness
4.4.18. Waste Sector
4.4.18.1. General information on the Waste sector
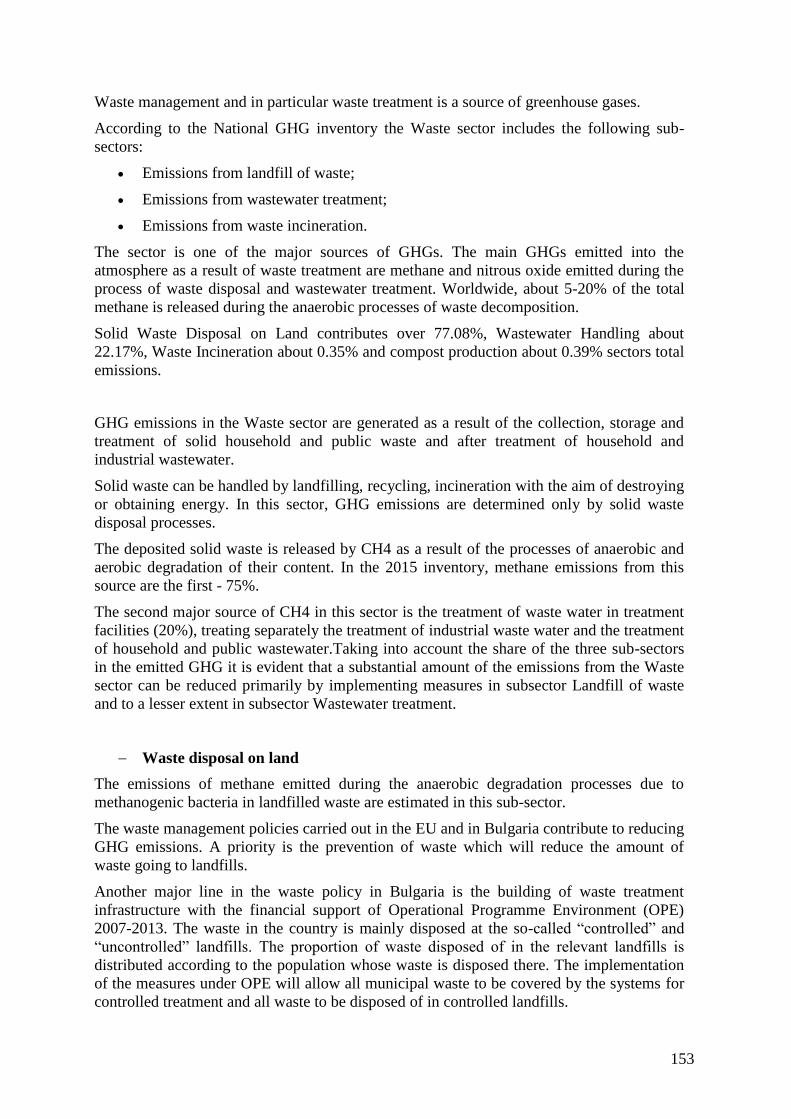
153
Waste management and in particular waste treatment is a source of greenhouse gases.
According to the National GHG inventory the Waste sector includes the following sub-
sectors:
Emissions from landfill of waste;
Emissions from wastewater treatment;
Emissions from waste incineration.
The sector is one of the major sources of GHGs. The main GHGs emitted into the
atmosphere as a result of waste treatment are methane and nitrous oxide emitted during the
process of waste disposal and wastewater treatment. Worldwide, about 5-20% of the total
methane is released during the anaerobic processes of waste decomposition.
Solid Waste Disposal on Land contributes over 77.08%, Wastewater Handling about
22.17%, Waste Incineration about 0.35% and compost production about 0.39% sectors total
emissions.
GHG emissions in the Waste sector are generated as a result of the collection, storage and
treatment of solid household and public waste and after treatment of household and
industrial wastewater.
Solid waste can be handled by landfilling, recycling, incineration with the aim of destroying
or obtaining energy. In this sector, GHG emissions are determined only by solid waste
disposal processes.
The deposited solid waste is released by CH4 as a result of the processes of anaerobic and
aerobic degradation of their content. In the 2015 inventory, methane emissions from this
source are the first - 75%.
The second major source of CH4 in this sector is the treatment of waste water in treatment
facilities (20%), treating separately the treatment of industrial waste water and the treatment
of household and public wastewater.Taking into account the share of the three sub-sectors
in the emitted GHG it is evident that a substantial amount of the emissions from the Waste
sector can be reduced primarily by implementing measures in subsector Landfill of waste
and to a lesser extent in subsector Wastewater treatment.
Waste disposal on land
The emissions of methane emitted during the anaerobic degradation processes due to
methanogenic bacteria in landfilled waste are estimated in this sub-sector.
The waste management policies carried out in the EU and in Bulgaria contribute to reducing
GHG emissions. A priority is the prevention of waste which will reduce the amount of
waste going to landfills.
Another major line in the waste policy in Bulgaria is the building of waste treatment
infrastructure with the financial support of Operational Programme Environment (OPE)
2007-2013. The waste in the country is mainly disposed at the so-called “controlled” and
“uncontrolled” landfills. The proportion of waste disposed of in the relevant landfills is
distributed according to the population whose waste is disposed there. The implementation
of the measures under OPE will allow all municipal waste to be covered by the systems for
controlled treatment and all waste to be disposed of in controlled landfills.
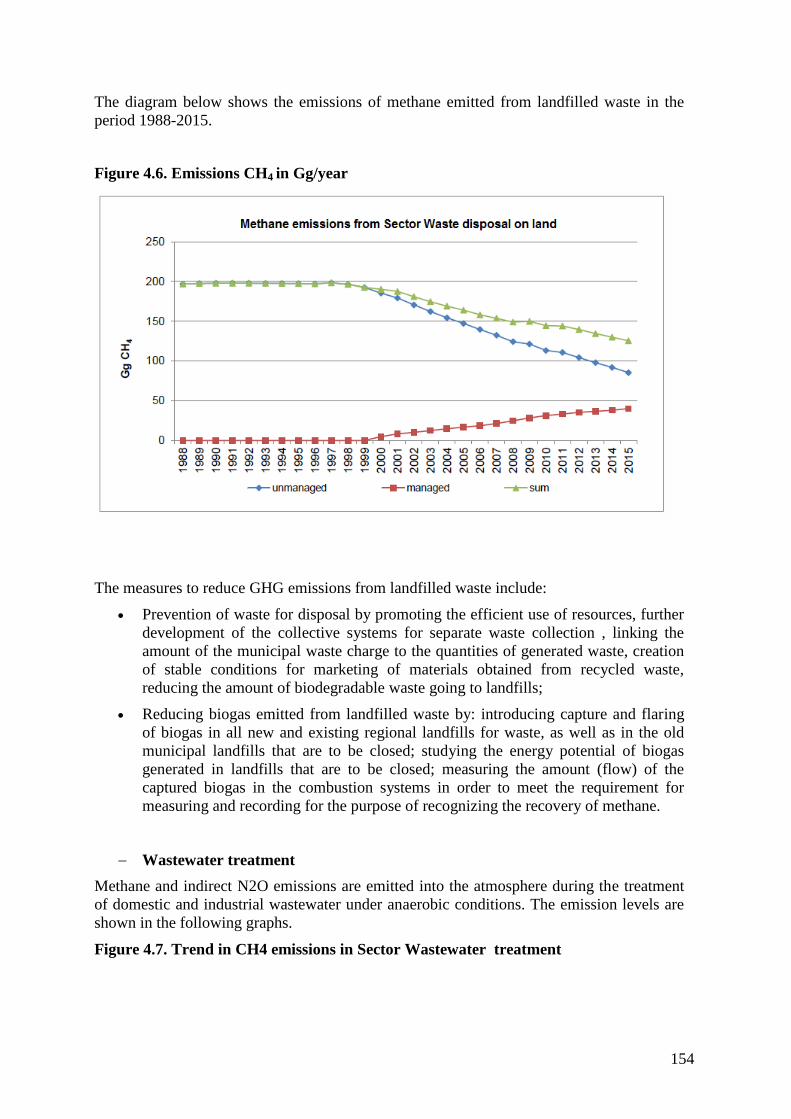
154
The diagram below shows the emissions of methane emitted from landfilled waste in the
period 1988-2015.
Figure 4.6. Emissions CH4 in Gg/year
The measures to reduce GHG emissions from landfilled waste include:
Prevention of waste for disposal by promoting the efficient use of resources, further
development of the collective systems for separate waste collection , linking the
amount of the municipal waste charge to the quantities of generated waste, creation
of stable conditions for marketing of materials obtained from recycled waste,
reducing the amount of biodegradable waste going to landfills;
Reducing biogas emitted from landfilled waste by: introducing capture and flaring
of biogas in all new and existing regional landfills for waste, as well as in the old
municipal landfills that are to be closed; studying the energy potential of biogas
generated in landfills that are to be closed; measuring the amount (flow) of the
captured biogas in the combustion systems in order to meet the requirement for
measuring and recording for the purpose of recognizing the recovery of methane.
Wastewater treatment
Methane and indirect N2O emissions are emitted into the atmosphere during the treatment
of domestic and industrial wastewater under anaerobic conditions. The emission levels are
shown in the following graphs.
Figure 4.7. Trend in CH4 emissions in Sector Wastewater treatment
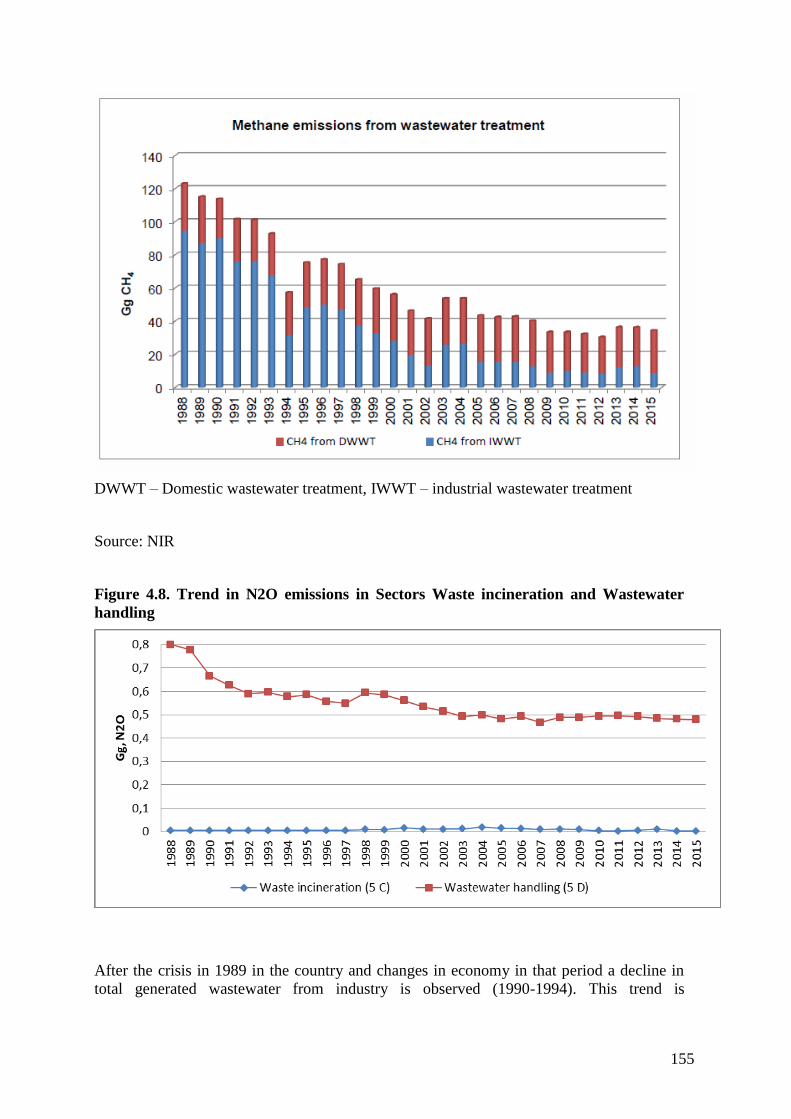
155
DWWT – Domestic wastewater treatment, IWWT – industrial wastewater treatment
Source: NIR
Figure 4.8. Trend in N2O emissions in Sectors Waste incineration and Wastewater
handling
After the crisis in 1989 in the country and changes in economy in that period a decline in
total generated wastewater from industry is observed (1990-1994). This trend is
156
characteristic for paper and pulp production, production of food and beverage, organic
chemicals, textile and textile products and affect the emissions in that period.
In 2002 again a decline in total generated wastewater could be observed from industry: food
and beverage, paper and pulp production, organic chemicals and textile. This is connected
with the next stage of the economy restructuring in the country – privatization of enterprises
(part of them are sold, closed or changed their functions).
During 2003-2004 a significant growth of generated industrial wastewater is observed,
formed by discharged wastewater from preceiding years (discharge of several big tailing
ponds of mining companies in the country) with permission of the Ministry of Environment
and waters which gives rise of the emissions from industrial wastewater treatment.
In 2015 the quantity of generated industrial wastewater is less in comparison with 2014 –
146 283 thou.m3 versus 111 355 thou.m3 for 2015. The sharp decline is characteristic for
paper and pulp industry – from 29 360 thou.m3 in 2014 to 15 675 thou.m3 in 2015. Slight
decrease is also observed in generated wastewater from production of fertilizers, textile and
other industries. This tendency leads to significant decrease in CH4 emissions from
industrial wastewater treatment in comparison with previous (2014) year. According to NSI
data, domestic wastewater has been treated in centralized aerobic treatment plants, septic
systems, latrines and discharged into water bodies (sea, river, lakes). In 2015 about 62.3 %
of the population is connected to centralized aerobic treatment plants, 13.2 % is connected
to the public sewerage, but without treatment (sea, river, lake) and 24.5 % of the country
population use septic systems and latrines (detail information at: www.nsi.bg ).
In Bulgaria, 73% of the population is classified as urban income group and 27 % - as rural
income group (NSI data).
Methane emissions from the treatment of domestic sewage water in the last 20 years show a
steady trend of decline.
The emissions of nitrous oxide also mark a steady decrease following the decrease of the
population.
In 2008 emissions of methane from domestic wastewater represented about 60% of the
GHG emissions from wastewater in Bulgaria.
The treatment of sludge that is the main generator of methane emissions is taken into
consideration in the National Programme for Priority Construction of Urban Wastewater
Treatment Plants (NPPCUWWTP) and the National Waste Management Programme .
Practice has shown that it is technologically feasible and economically viable to produce
electricity from the biogas generated in the methane tanks of large wastewater treatment
plants (more than 50 000 PE) in order to cover the main share of the energy needs of the
plants. The energy balance of small and medium-sized wastewater treatment plants (less
than 20 000 PE) is negative (from -27 to -32 W/PE) thus making the capture and utilization
of biogas economically inexpedient.
In 2008 the WWTPs treated approximately 58 000 tonnes of sludge. According to the
NPPCUWWTP around 94 500 tonnes of sludge will be generated in the country by the end
of the programme period (2014), 72% of which will be treated in WWTP for over 20 000
PE. This means that the methane from about 60% of the wastewater may be captured and
treated. The measures for reduction of GHG emissions envisage introduction of capture and
treatment of biogas from urban wastewater treatment plants for over 20 000 PE by
introducing anaerobic stabilization of sludge with capture and combustion of biogas in new
and renovated plants, repair, reconstruction and commissioning of methane tanks in existing
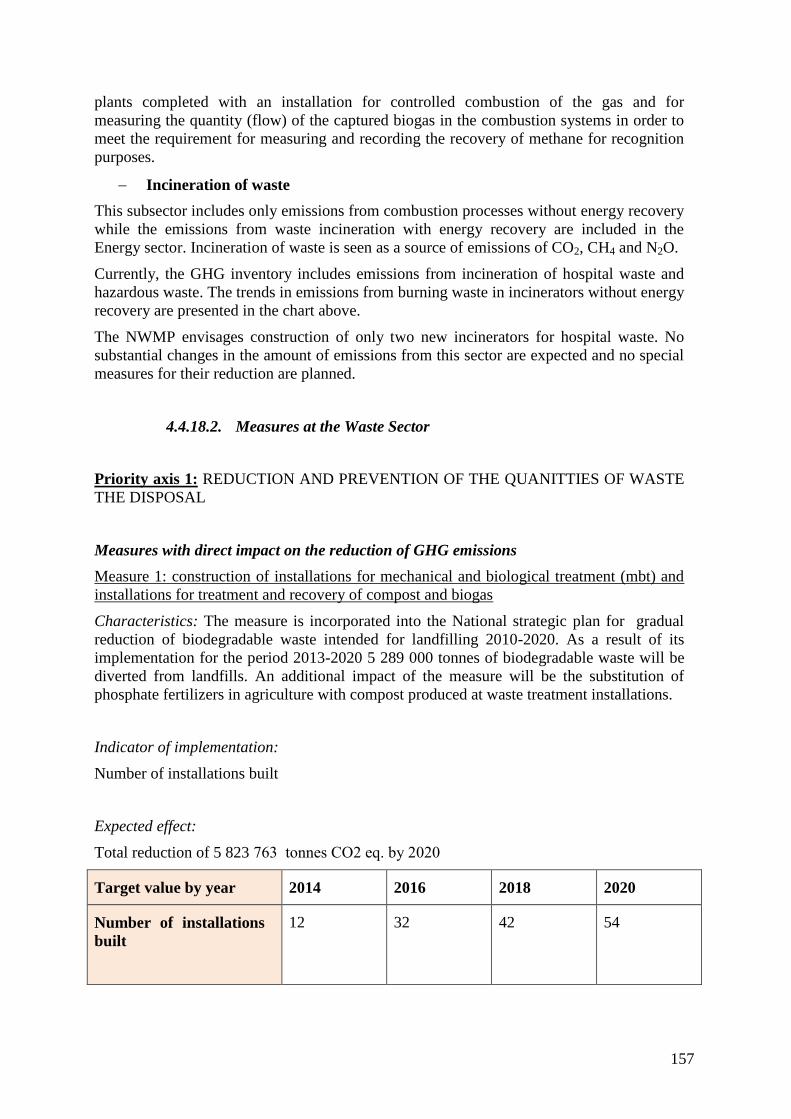
157
plants completed with an installation for controlled combustion of the gas and for
measuring the quantity (flow) of the captured biogas in the combustion systems in order to
meet the requirement for measuring and recording the recovery of methane for recognition
purposes.
Incineration of waste
This subsector includes only emissions from combustion processes without energy recovery
while the emissions from waste incineration with energy recovery are included in the
Energy sector. Incineration of waste is seen as a source of emissions of CO2, CH4 and N2O.
Currently, the GHG inventory includes emissions from incineration of hospital waste and
hazardous waste. The trends in emissions from burning waste in incinerators without energy
recovery are presented in the chart above.
The NWMP envisages construction of only two new incinerators for hospital waste. No
substantial changes in the amount of emissions from this sector are expected and no special
measures for their reduction are planned.
4.4.18.2. Measures at the Waste Sector
Priority axis 1: REDUCTION AND PREVENTION OF THE QUANITTIES OF WASTE
THE DISPOSAL
Measures with direct impact on the reduction of GHG emissions
Measure 1: construction of installations for mechanical and biological treatment (mbt) and
installations for treatment and recovery of compost and biogas
Characteristics: The measure is incorporated into the National strategic plan for gradual
reduction of biodegradable waste intended for landfilling 2010-2020. As a result of its
implementation for the period 2013-2020 5 289 000 tonnes of biodegradable waste will be
diverted from landfills. An additional impact of the measure will be the substitution of
phosphate fertilizers in agriculture with compost produced at waste treatment installations.
Indicator of implementation:
Number of installations built
Expected effect:
Total reduction of 5 823 763 tonnes СО2 eq. by 2020
Target value by year 2014 2016 2018 2020
Number of installations
built
12 32 42 54
158
Instrument:
National Programme for Waste Management Activities 2009-2013
National strategic plan for the phased reduction of the amount of biodegradable waste
intended for disposal at landfills 2010-2020.
Measures with indirect impact on the reduction of GHG emissions
Measure 1: further development of collective systems for separate collection of waste from
the population
Characteristics: The measure is included also in the National Waste Management
Programme 2009-2013. It aims to increase the efficiency and the scope of separate
collection systems among the population, the enterprises and the governmental institutions
at all levels. 130 000 tonnes/year are expected to be diverted from disposal at landfills as a
result of separate collection and recycling of waste paper and cardboard
Measure 2: introduction of differentiated charges for the generated waste
Characteristics: The measure is laid down in the National Waste Management Programme
2009-2013. Methodological guidelines will be developed to determine the amount of
household waste charge and to introduce differentiated charge for landfilling of waste
where the recyclable waste delivered for landfilling will be charged at the highest rate.
Linking the amount of discharged waste to the amount of the charges and fees for
household waste will motivate citizens and companies to reduce the quantities of waste and
to re-orient towards various schemes for separate collection and recycling of waste.
Measure 3: introduction of separate collection of “green” waste in municipalities
Characteristics: The measure is included in the National strategic plan for gradual
reduction of biodegradable waste intended for landfilling 2010-2020. The municipal
ordinances are to regulate the method of separate collection of “green” waste, while the
programmes should include more specific measures regarding: prevention of biodegradable
waste; recycling of waste paper and cardboard; composting of “green” waste; introduction
of home composting. At a subsequent stage, after adoption of a national plan for waste
prevention, the programmes will be expanded to cover biodegradable waste from food
(catering establishments, markets, shops, etc.)
Expected results:
264 municipalities with separate collection by the end of 2020
Priority axis 2: CAPTURE AND FLARING OF BIOGAS FROM LANDFILLED
WASTE
Measures with direct impact on the reduction of GHG emissions
Measure 1: capture and flaring of biogas in all new and existing reginoal landfills
Characteristics: The requirement for design and operation of landfills is provided for in
Ordinance №8/2004. It is necessary to improve the control over its implementation. 360
mln. Nm3 methane will be burned by 2020 with the introduction of systems for capture and
flaring of biogas in all regional landfills.
Indicator of implementation:
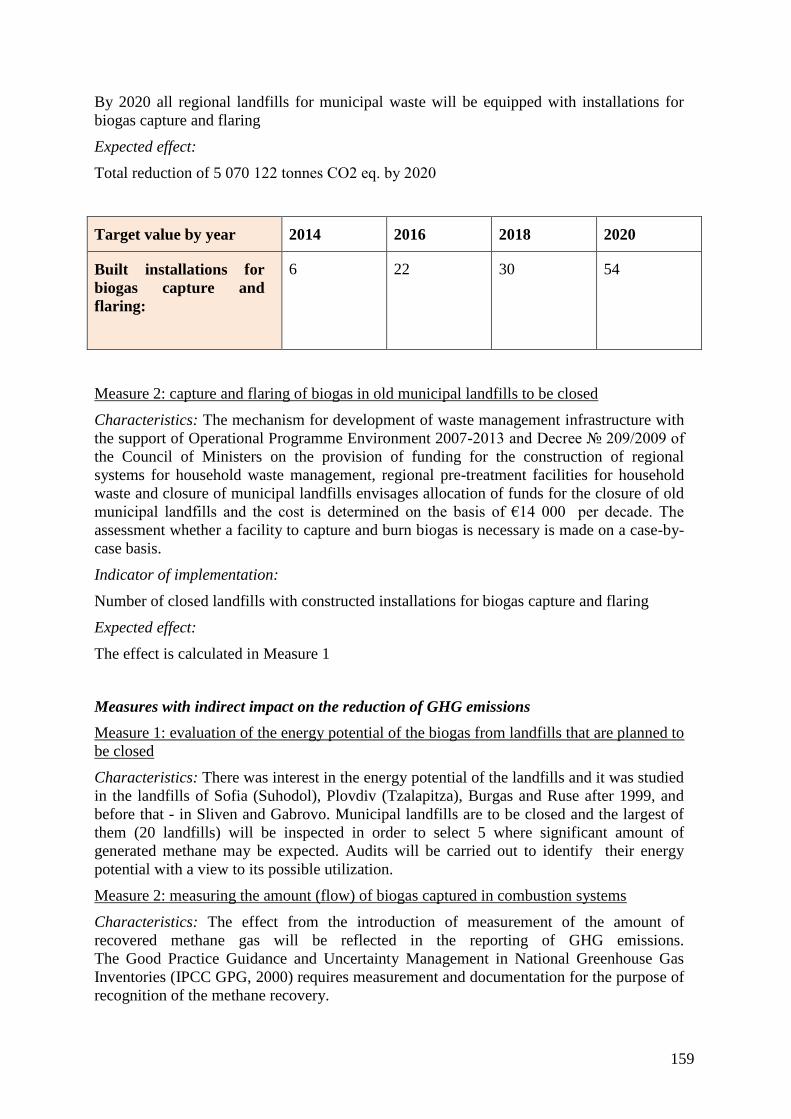
159
By 2020 all regional landfills for municipal waste will be equipped with installations for
biogas capture and flaring
Expected effect:
Total reduction of 5 070 122 tonnes СО2 eq. by 2020
Target value by year 2014 2016 2018 2020
Built installations for
biogas capture and
flaring:
6 22 30 54
Measure 2: capture and flaring of biogas in old municipal landfills to be closed
Characteristics: The mechanism for development of waste management infrastructure with
the support of Operational Programme Environment 2007-2013 and Decree № 209/2009 of
the Council of Ministers on the provision of funding for the construction of regional
systems for household waste management, regional pre-treatment facilities for household
waste and closure of municipal landfills envisages allocation of funds for the closure of old
municipal landfills and the cost is determined on the basis of €14 000 per decade. The
assessment whether a facility to capture and burn biogas is necessary is made on a case-by-
case basis.
Indicator of implementation:
Number of closed landfills with constructed installations for biogas capture and flaring
Expected effect:
The effect is calculated in Measure 1
Measures with indirect impact on the reduction of GHG emissions
Measure 1: evaluation of the energy potential of the biogas from landfills that are planned to
be closed
Characteristics: There was interest in the energy potential of the landfills and it was studied
in the landfills of Sofia (Suhodol), Plovdiv (Tzalapitza), Burgas and Ruse after 1999, and
before that - in Sliven and Gabrovo. Municipal landfills are to be closed and the largest of
them (20 landfills) will be inspected in order to select 5 where significant amount of
generated methane may be expected. Audits will be carried out to identify their energy
potential with a view to its possible utilization.
Measure 2: measuring the amount (flow) of biogas captured in combustion systems
Characteristics: The effect from the introduction of measurement of the amount of
recovered methane gas will be reflected in the reporting of GHG emissions.
The Good Practice Guidance and Uncertainty Management in National Greenhouse Gas
Inventories (IPCC GPG, 2000) requires measurement and documentation for the purpose of
recognition of the methane recovery.
160
Priority axis 3: CAPTURE OF BIOGAS FROM URBAN WASTEWATER
TREATMENT PLANTS (UWWTP) AND ITS BURNING
Measures with direct impact on the reduction of GHG emissions
Measure 1: introduction of anaerobic stabilization of sludge with capture and burning of
biogas in new plants and plants under reconstruction in settlements with over 20 000
population equivalent
Characteristics: A cost-benefit analysis for each project should justify or discourage the
recovery of methane. Practice has shown that it is technologically feasible and economically
viable to produce electricity from the biogas emitted from the methane tanks of large
wastewater treatment plants (more than 50 000 PE) in order to cover the main share of the
energy needs of the plants. An additional effect of the stabilization of sludge at UWWTP
will be achieved as a result of the possibility to use the stabilized sludge in agriculture so as
to recycle the nutritional substances, to preserve the fertile soils and to limit the use of
agricultural chemicals and synthetic fertilizers
Indicator of implementation:
Number of plants with anaerobic stabilization of sludge
Expected effect:
Total reduction of 1 025 589 tonnes СО2 eq. by 2020
Target value by year 2014 2016 2018 2020
Number of plants with
anaerobic stabilization
of sludge
8 20
4.4.19. Agriculture Sector
4.4.19.1. General information of the Agriculture sector
In the year 2015 the sector agriculture contributed 10% to the total of Bulgaria's greenhouse
gas emissions (without LULUCF). The trend of GHG emissions from 1988 to 2015 shows a
decrease of 56% for this sector due to decrease in activity data.
CH4 emissions are 30% from of the total emissions in the sector in CO2-eq in 2015. A
steady trend of emissions decrease is observed after 2004 due to reduction in animal
numbers.
N2O emissions from the sector are also significant. The biggest share belongs to the
agricultural soils emissions. The share of N2O emissions is 69% for the year 2015. The
biggest share in these emissions has the Agricultural soils category with 88%. N2O
emissions from manure management and field burning of agricultural residues are of an
order of magnitude smaller.
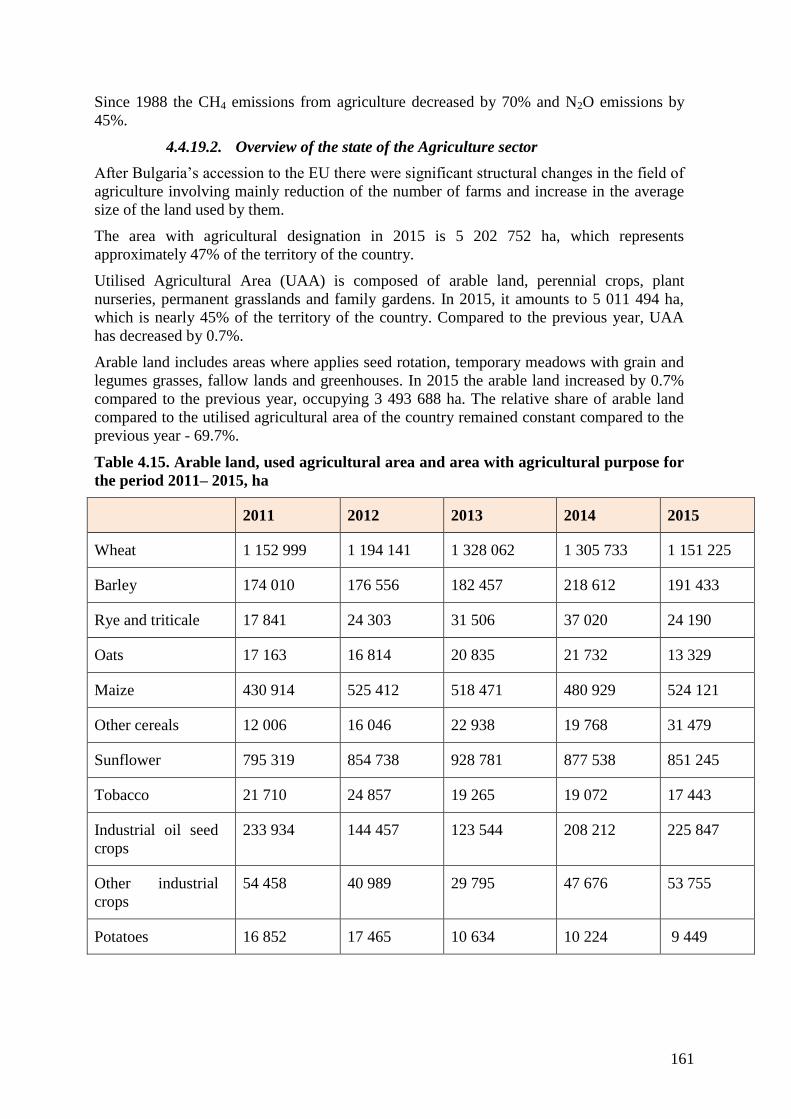
161
Since 1988 the CH4 emissions from agriculture decreased by 70% and N2O emissions by
45%.
4.4.19.2. Overview of the state of the Agriculture sector
After Bulgaria’s accession to the EU there were significant structural changes in the field of
agriculture involving mainly reduction of the number of farms and increase in the average
size of the land used by them.
The area with agricultural designation in 2015 is 5 202 752 ha, which represents
approximately 47% of the territory of the country.
Utilised Agricultural Area (UAA) is composed of arable land, perennial crops, plant
nurseries, permanent grasslands and family gardens. In 2015, it amounts to 5 011 494 ha,
which is nearly 45% of the territory of the country. Compared to the previous year, UAA
has decreased by 0.7%.
Arable land includes areas where applies seed rotation, temporary meadows with grain and
legumes grasses, fallow lands and greenhouses. In 2015 the arable land increased by 0.7%
compared to the previous year, occupying 3 493 688 ha. The relative share of arable land
compared to the utilised agricultural area of the country remained constant compared to the
previous year - 69.7%.
Table 4.15. Arable land, used agricultural area and area with agricultural purpose for
the period 2011– 2015, ha
2011 2012 2013 2014 2015
Wheat 1 152 999 1 194 141 1 328 062 1 305 733 1 151 225
Barley 174 010 176 556 182 457 218 612 191 433
Rye and triticale 17 841 24 303 31 506 37 020 24 190
Oats 17 163 16 814 20 835 21 732 13 329
Maize 430 914 525 412 518 471 480 929 524 121
Other cereals 12 006 16 046 22 938 19 768 31 479
Sunflower 795 319 854 738 928 781 877 538 851 245
Tobacco 21 710 24 857 19 265 19 072 17 443
Industrial oil seed
crops
233 934 144 457 123 544 208 212 225 847
Other industrial
crops
54 458 40 989 29 795 47 676 53 755
Potatoes 16 852 17 465 10 634 10 224 9 449
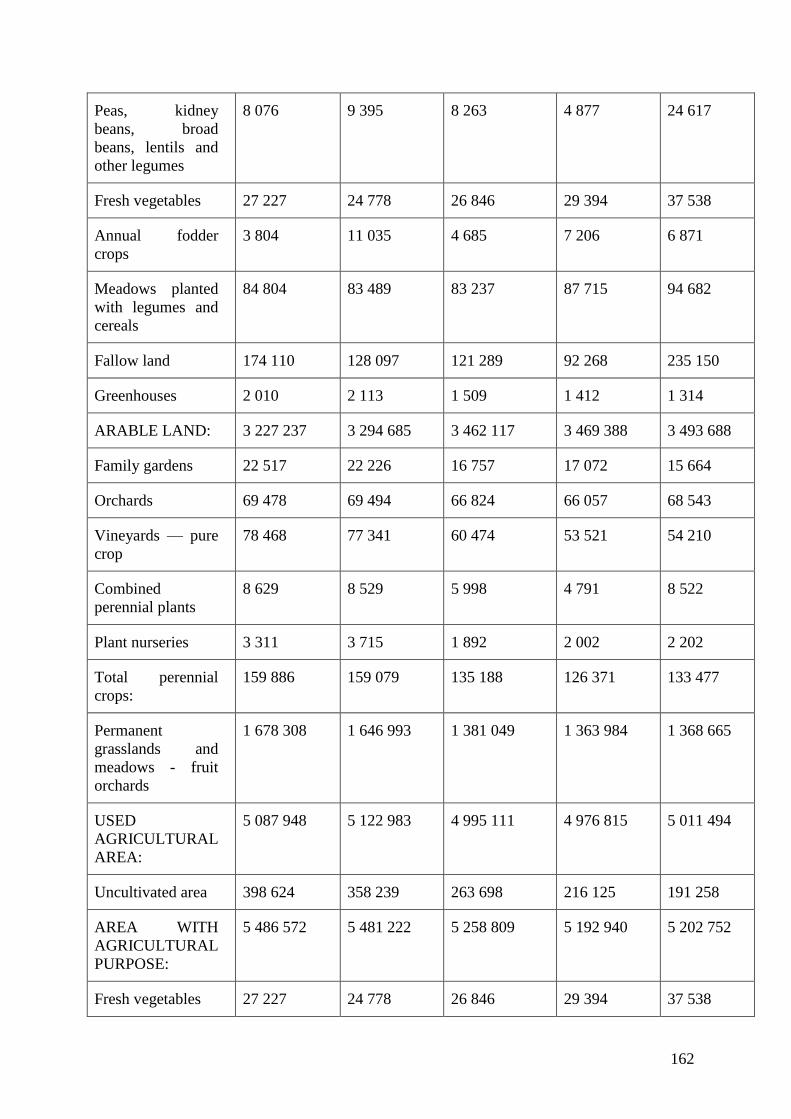
162
Peas, kidney
beans, broad
beans, lentils and
other legumes
8 076 9 395 8 263 4 877 24 617
Fresh vegetables 27 227 24 778 26 846 29 394 37 538
Annual fodder
crops
3 804 11 035 4 685 7 206 6 871
Meadows planted
with legumes and
cereals
84 804 83 489 83 237 87 715 94 682
Fallow land 174 110 128 097 121 289 92 268 235 150
Greenhouses 2 010 2 113 1 509 1 412 1 314
ARABLE LAND: 3 227 237 3 294 685 3 462 117 3 469 388 3 493 688
Family gardens 22 517 22 226 16 757 17 072 15 664
Orchards 69 478 69 494 66 824 66 057 68 543
Vineyards — pure
crop
78 468 77 341 60 474 53 521 54 210
Combined
perennial plants
8 629 8 529 5 998 4 791 8 522
Plant nurseries 3 311 3 715 1 892 2 002 2 202
Total perennial
crops:
159 886 159 079 135 188 126 371 133 477
Permanent
grasslands and
meadows - fruit
orchards
1 678 308 1 646 993 1 381 049 1 363 984 1 368 665
USED
AGRICULTURAL
AREA:
5 087 948 5 122 983 4 995 111 4 976 815 5 011 494
Uncultivated area 398 624 358 239 263 698 216 125 191 258
AREA WITH
AGRICULTURAL
PURPOSE:
5 486 572 5 481 222 5 258 809 5 192 940 5 202 752
Fresh vegetables 27 227 24 778 26 846 29 394 37 538
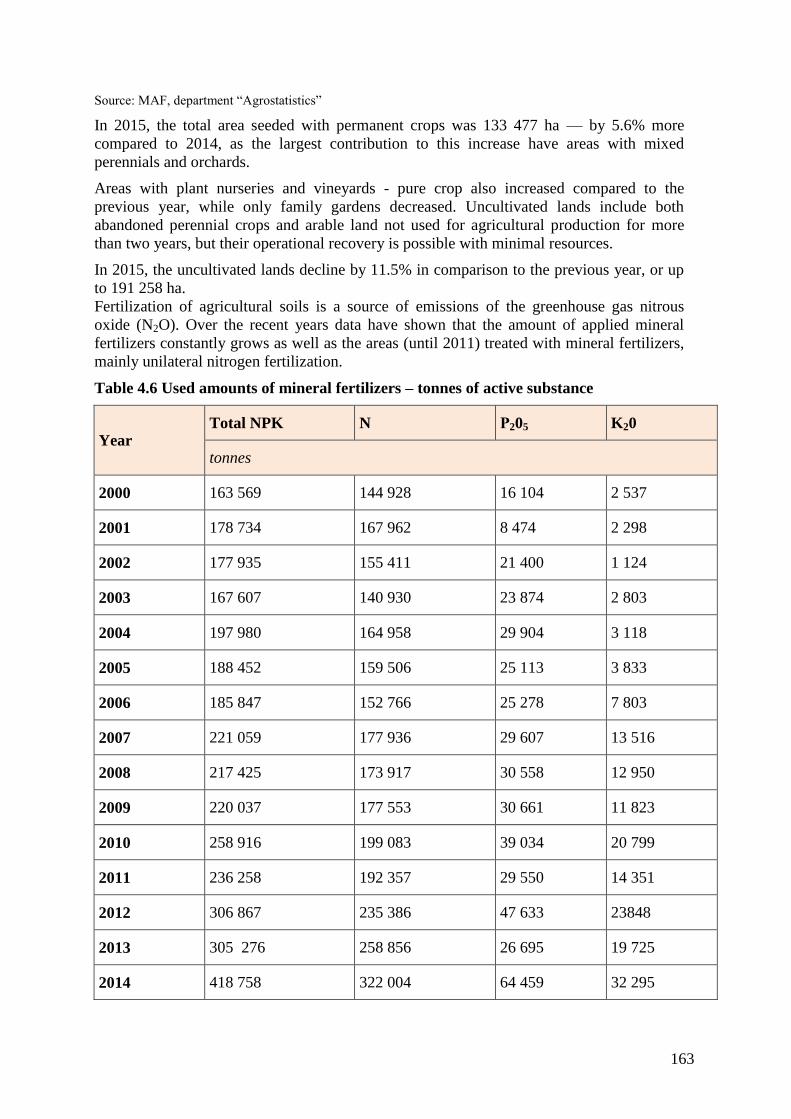
163
Source: MAF, department “Agrostatistics”
In 2015, the total area seeded with permanent crops was 133 477 ha — by 5.6% more
compared to 2014, as the largest contribution to this increase have areas with mixed
perennials and orchards.
Areas with plant nurseries and vineyards - pure crop also increased compared to the
previous year, while only family gardens decreased. Uncultivated lands include both
abandoned perennial crops and arable land not used for agricultural production for more
than two years, but their operational recovery is possible with minimal resources.
In 2015, the uncultivated lands decline by 11.5% in comparison to the previous year, or up
to 191 258 ha.
Fertilization of agricultural soils is a source of emissions of the greenhouse gas nitrous
oxide (N2O). Over the recent years data have shown that the amount of applied mineral
fertilizers constantly grows as well as the areas (until 2011) treated with mineral fertilizers,
mainly unilateral nitrogen fertilization.
Table 4.6 Used amounts of mineral fertilizers – tonnes of active substance
Year Total NPK N Р205 K20
tonnes
2000 163 569 144 928 16 104 2 537
2001 178 734 167 962 8 474 2 298
2002 177 935 155 411 21 400 1 124
2003 167 607 140 930 23 874 2 803
2004 197 980 164 958 29 904 3 118
2005 188 452 159 506 25 113 3 833
2006 185 847 152 766 25 278 7 803
2007 221 059 177 936 29 607 13 516
2008 217 425 173 917 30 558 12 950
2009 220 037 177 553 30 661 11 823
2010 258 916 199 083 39 034 20 799
2011 236 258 192 357 29 550 14 351
2012 306 867 235 386 47 633 23848
2013 305 276 258 856 26 695 19 725
2014 418 758 322 004 64 459 32 295
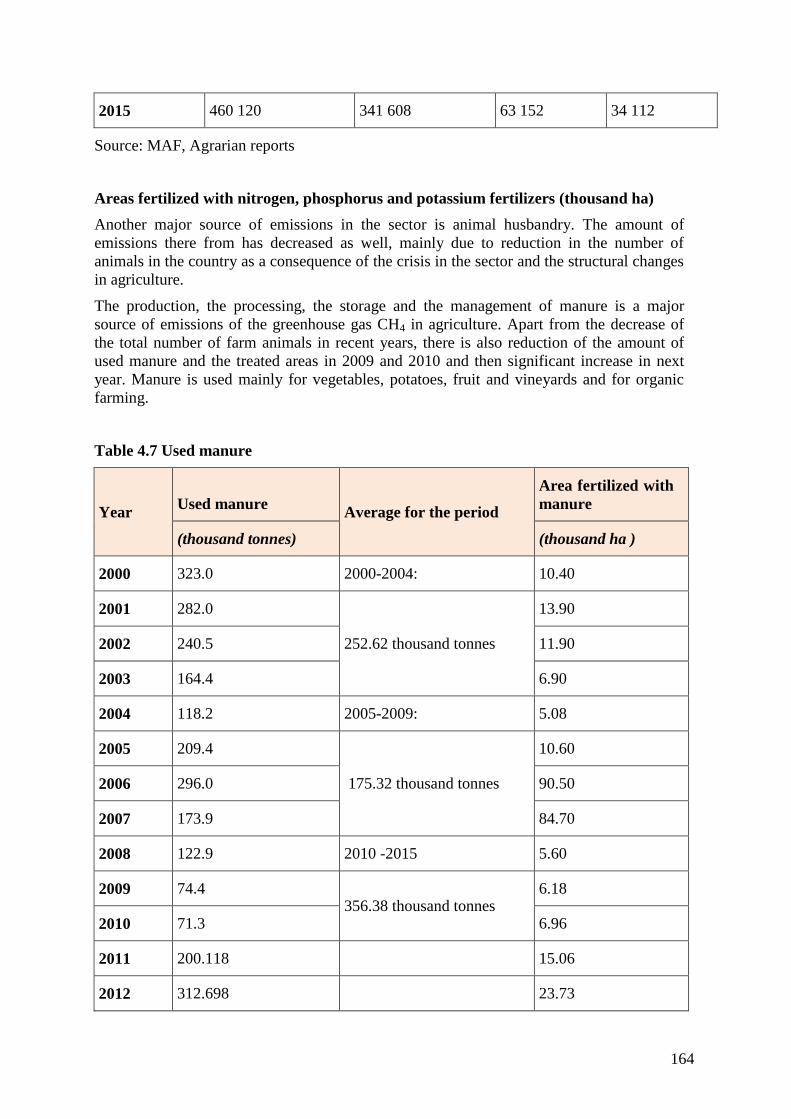
164
2015 460 120 341 608 63 152 34 112
Source: MAF, Agrarian reports
Areas fertilized with nitrogen, phosphorus and potassium fertilizers (thousand ha)
Another major source of emissions in the sector is animal husbandry. The amount of
emissions there from has decreased as well, mainly due to reduction in the number of
animals in the country as a consequence of the crisis in the sector and the structural changes
in agriculture.
The production, the processing, the storage and the management of manure is a major
source of emissions of the greenhouse gas CH4 in agriculture. Apart from the decrease of
the total number of farm animals in recent years, there is also reduction of the amount of
used manure and the treated areas in 2009 and 2010 and then significant increase in next
year. Manure is used mainly for vegetables, potatoes, fruit and vineyards and for organic
farming.
Table 4.7 Used manure
Year Used manure
Average for the period
Area fertilized with
manure
(thousand tonnes) (thousand ha )
2000 323.0 2000-2004: 10.40
2001 282.0
252.62 thousand tonnes
13.90
2002 240.5 11.90
2003 164.4 6.90
2004 118.2 2005-2009: 5.08
2005 209.4
175.32 thousand tonnes
10.60
2006 296.0 90.50
2007 173.9 84.70
2008 122.9 2010 -2015 5.60
2009 74.4 356.38 thousand tonnes
6.18
2010 71.3 6.96
2011 200.118 15.06
2012 312.698 23.73
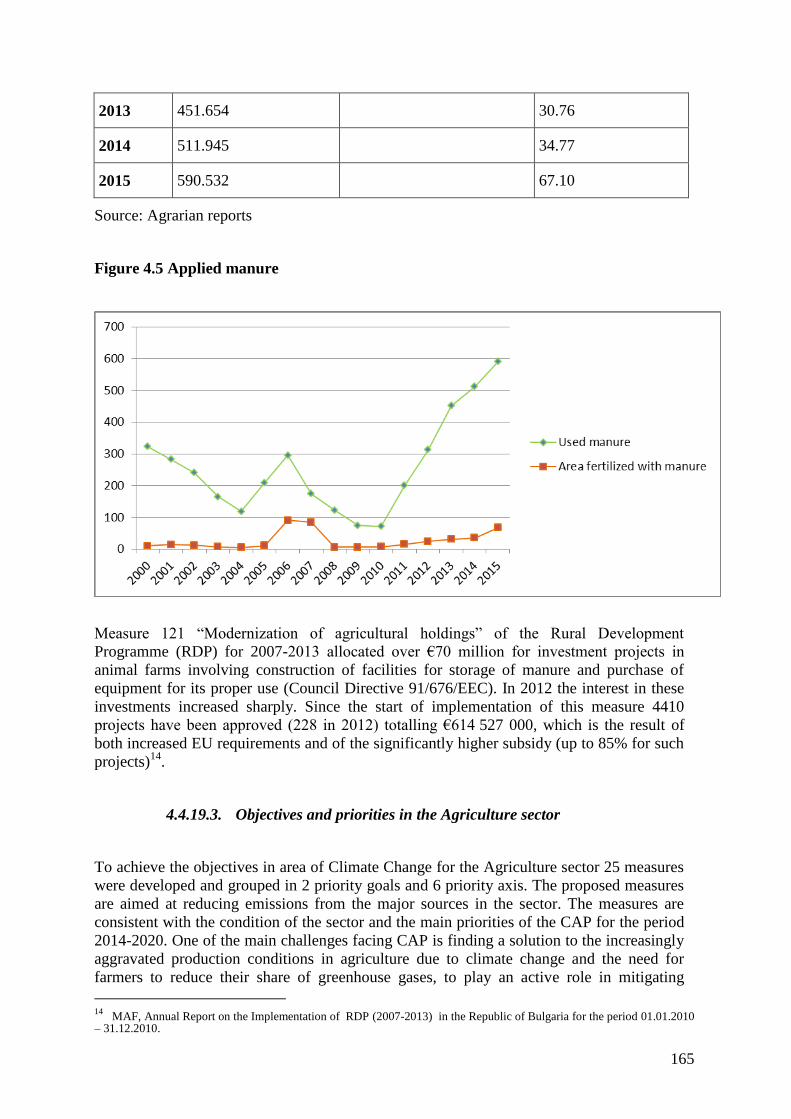
165
2013 451.654 30.76
2014 511.945 34.77
2015 590.532 67.10
Source: Agrarian reports
Figure 4.5 Applied manure
Measure 121 “Modernization of agricultural holdings” of the Rural Development
Programme (RDP) for 2007-2013 allocated over €70 million for investment projects in
animal farms involving construction of facilities for storage of manure and purchase of
equipment for its proper use (Council Directive 91/676/EEC). In 2012 the interest in these
investments increased sharply. Since the start of implementation of this measure 4410
projects have been approved (228 in 2012) totalling €614 527 000, which is the result of
both increased EU requirements and of the significantly higher subsidy (up to 85% for such
projects)14
.
4.4.19.3. Objectives and priorities in the Agriculture sector
To achieve the objectives in area of Climate Change for the Agriculture sector 25 measures
were developed and grouped in 2 priority goals and 6 priority axis. The proposed measures
are aimed at reducing emissions from the major sources in the sector. The measures are
consistent with the condition of the sector and the main priorities of the CAP for the period
2014-2020. One of the main challenges facing CAP is finding a solution to the increasingly
aggravated production conditions in agriculture due to climate change and the need for
farmers to reduce their share of greenhouse gases, to play an active role in mitigating
14
MAF, Annual Report on the Implementation of RDP (2007-2013) in the Republic of Bulgaria for the period 01.01.2010 – 31.12.2010.
166
climate change and to provide energy from renewable sources. In this regard there is an
opportunity to promote the implementation of a number of measures in the field of direct
payments, market support and rural development in order to mitigate climate change.
Based on the analysis of the major sources of emissions the following two main objectives
are defined in the Agriculture sector:
Reduction and/or optimization of emissions from the agricultural sector;
Increasing the awareness and the knowledge of both farmers and the administration
in terms of actions and their effect on climate change.
The following priorities refer to these main objectives:
Reduction of emissions from agricultural land;
Reduction of methane emissions from the biological fermentation in animal
husbandry;
Improving the management of manure;
Optimization of the use of plant residues in agriculture;
Improving the management of rice fields and technology for rice production;
Improving the knowledge of farmers and the administration regarding reduction of
emissions from the Agriculture sector.
4.4.19.4. Measures in the Agriculture Sector
Priority axis 1: REDUCTION OF EMISSIONS FROM AGRICULTURAL LAND
Measures with direct impact on the reduction of GHG emissions
Measure 1: encouraging the use of suitable crop rotation, especially with nitrogen fixing
crops
Characteristics: Rotation means science-based successive rotation of crops in time and
place on a farmland. The period required for all crops to pass through all fields following
the order of the crop rotation scheme is called rotation period or rotation. The introduction
of sustainable crop rotations that include plant cover in winter and legumes (beans,
soybeans, alfalfa, clover) will prevent soil erosion and will retain organic carbon (carbon
sequestration), which is a potential tool for reducing greenhouse gases.
The proposed budget for the measure is based on:
350 BGN/ha is the current payment for biological field crops under Measure 214 of RDP
2007-2013;
150 BGN/ha is the current payment for the introduction of rotation under Measure 214 of
RDP 2007-2013.
This measure covers: 20 000 ha, of which 60% in organic production.
Organic production: 12 000 ha Х 350 BGN/ha = 4 200 000 BGN
167
Crop rotation: 8000 ha х 150 BGN/ha = 1 200 000 BGN
Indicator of implementation:
8000 ha with improved crop rotation;
12 000 ha treated biologically;
Expected effect:
Total reduction of 6356 Gg CO2 eq
Measure 2: management of degraded agricultural land through:
1. biological reclamation with typical for the region grass species
2. implementation of erosion control measures and soil treatment methods
Characteristics: Soil erosion is a process of mechanical destruction and weathering of soil
by the action of water and wind. It gradually reduces the amount of nutrients and the humus
in soil. Erosion aggravates the structure, as well as the water and air regime of soil. The
combination of the specific natural and economic conditions in Bulgaria is a reason for the
high risk of degradation processes in agricultural soils. The most common processes of soil
degradation include water and wind erosion, pollution, reduction of organic matter stocks
(humus), compaction, acidification, salinization, loss of biodiversity. More than 60% of the
country is affected by varying degrees of erosion. 11.8 % of the country’s territory is
severely eroded. 65% of agricultural land is threatened by water erosion and 24% is
threatened by wind erosion. The average annual intensity of soil erosion varies according to
land use, but soil loss in agricultural lands is estimated at 12.256 tonnes/ha a year on
average. The water erosion of soil controls the stocks of organic carbon and their
distribution on the landscape which affects the circulation of carbon, the content of carbon
dioxide in the atmosphere and the global warming.
The proposed budget for the measure is based on reclamation of 2500 ha:
2500 ha х 380 BGN/ha = 950 000 BGN
Erosion control practices for 2500 ha
2500 ha х 145 BGN/ha = 362 500 BGN
The amounts used are under the current Measure 214 Agri-environmental payments under
RDP 2007-2013
Indicator of implementation:
ha with control erosion practices and recultivated agricultural land
Expected effect:
Total reduction of 20 000 tonnes СО2 eq. by 2020
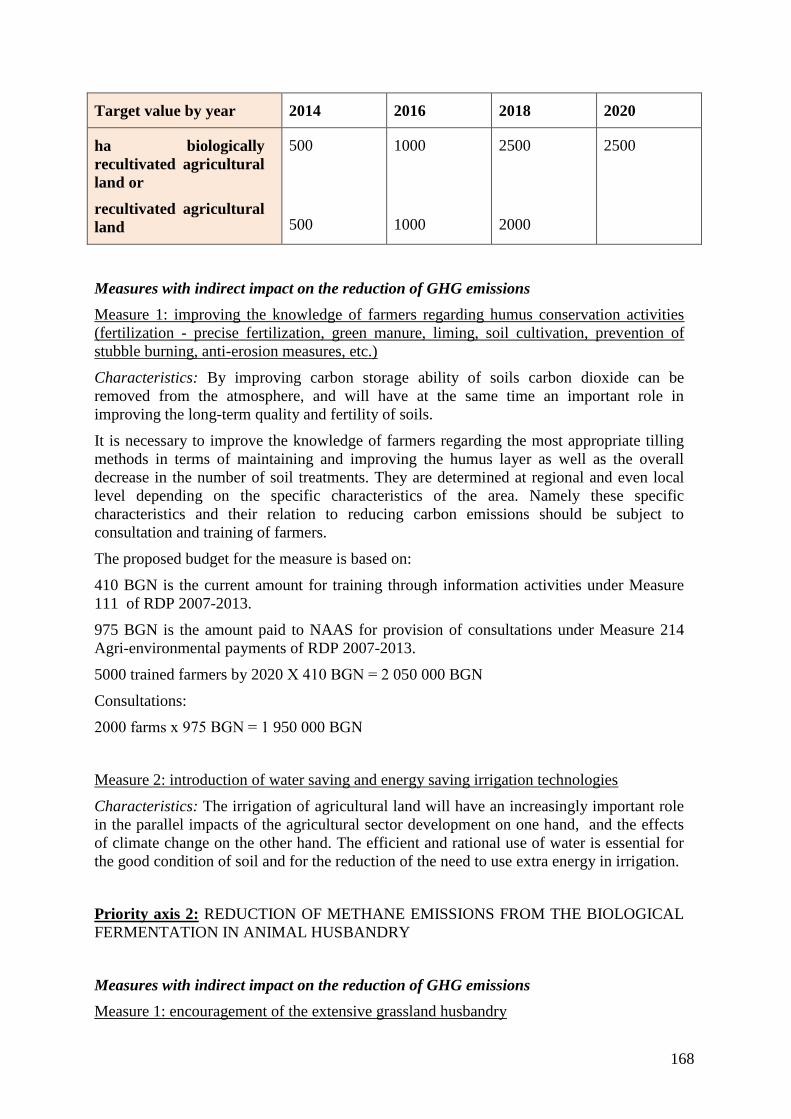
168
Target value by year 2014 2016 2018 2020
ha biologically
recultivated agricultural
land or
recultivated agricultural
land
500
500
1000
1000
2500
2000
2500
Measures with indirect impact on the reduction of GHG emissions
Measure 1: improving the knowledge of farmers regarding humus conservation activities
(fertilization - precise fertilization, green manure, liming, soil cultivation, prevention of
stubble burning, anti-erosion measures, etc.)
Characteristics: By improving carbon storage ability of soils carbon dioxide can be
removed from the atmosphere, and will have at the same time an important role in
improving the long-term quality and fertility of soils.
It is necessary to improve the knowledge of farmers regarding the most appropriate tilling
methods in terms of maintaining and improving the humus layer as well as the overall
decrease in the number of soil treatments. They are determined at regional and even local
level depending on the specific characteristics of the area. Namely these specific
characteristics and their relation to reducing carbon emissions should be subject to
consultation and training of farmers.
The proposed budget for the measure is based on:
410 BGN is the current amount for training through information activities under Measure
111 of RDP 2007-2013.
975 BGN is the amount paid to NAAS for provision of consultations under Measure 214
Agri-environmental payments of RDP 2007-2013.
5000 trained farmers by 2020 Х 410 BGN = 2 050 000 BGN
Consultations:
2000 farms х 975 BGN = 1 950 000 BGN
Measure 2: introduction of water saving and energy saving irrigation technologies
Characteristics: The irrigation of agricultural land will have an increasingly important role
in the parallel impacts of the agricultural sector development on one hand, and the effects
of climate change on the other hand. The efficient and rational use of water is essential for
the good condition of soil and for the reduction of the need to use extra energy in irrigation.
Priority axis 2: REDUCTION OF METHANE EMISSIONS FROM THE BIOLOGICAL
FERMENTATION IN ANIMAL HUSBANDRY
Measures with indirect impact on the reduction of GHG emissions
Measure 1: encouragement of the extensive grassland husbandry
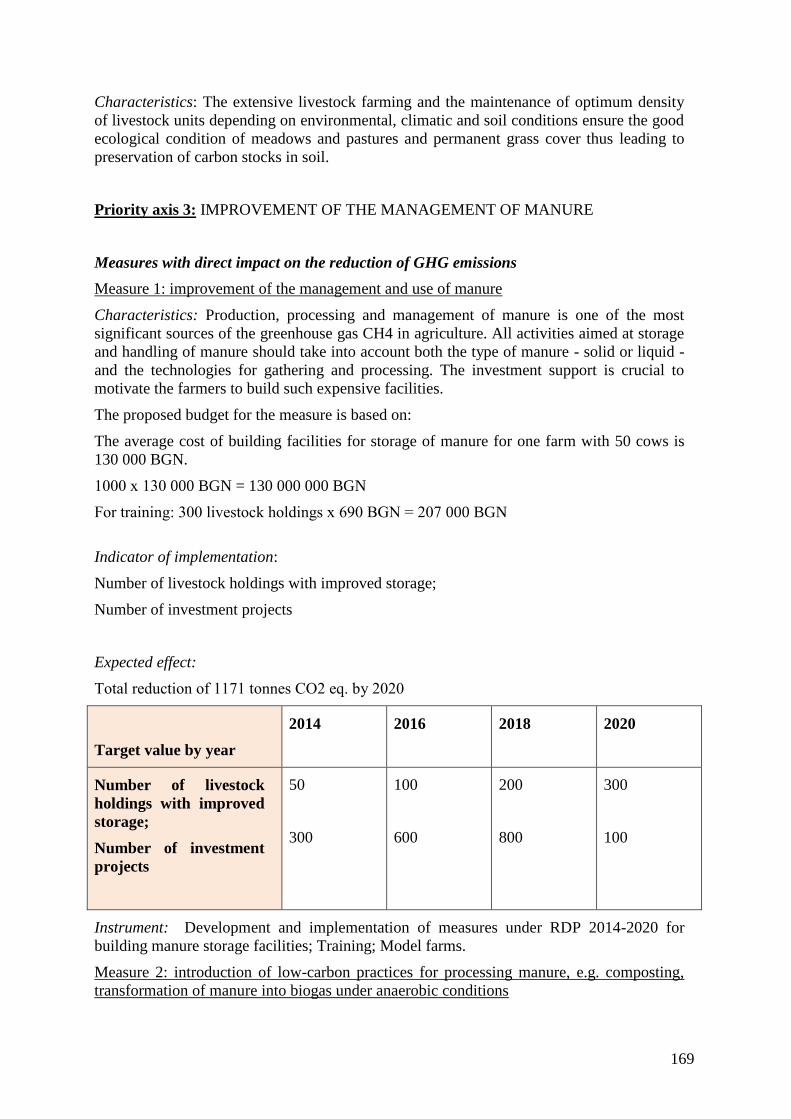
169
Characteristics: The extensive livestock farming and the maintenance of optimum density
of livestock units depending on environmental, climatic and soil conditions ensure the good
ecological condition of meadows and pastures and permanent grass cover thus leading to
preservation of carbon stocks in soil.
Priority axis 3: IMPROVEMENT OF THE MANAGEMENT OF MANURE
Measures with direct impact on the reduction of GHG emissions
Measure 1: improvement of the management and use of manure
Characteristics: Production, processing and management of manure is one of the most
significant sources of the greenhouse gas CH4 in agriculture. All activities aimed at storage
and handling of manure should take into account both the type of manure - solid or liquid -
and the technologies for gathering and processing. The investment support is crucial to
motivate the farmers to build such expensive facilities.
The proposed budget for the measure is based on:
The average cost of building facilities for storage of manure for one farm with 50 cows is
130 000 BGN.
1000 х 130 000 BGN = 130 000 000 BGN
For training: 300 livestock holdings х 690 BGN = 207 000 BGN
Indicator of implementation:
Number of livestock holdings with improved storage;
Number of investment projects
Expected effect:
Total reduction of 1171 tonnes СО2 eq. by 2020
Target value by year
2014 2016 2018 2020
Number of livestock
holdings with improved
storage;
Number of investment
projects
50
300
100
600
200
800
300
100
Instrument: Development and implementation of measures under RDP 2014-2020 for
building manure storage facilities; Training; Model farms.
Measure 2: introduction of low-carbon practices for processing manure, e.g. composting,
transformation of manure into biogas under anaerobic conditions
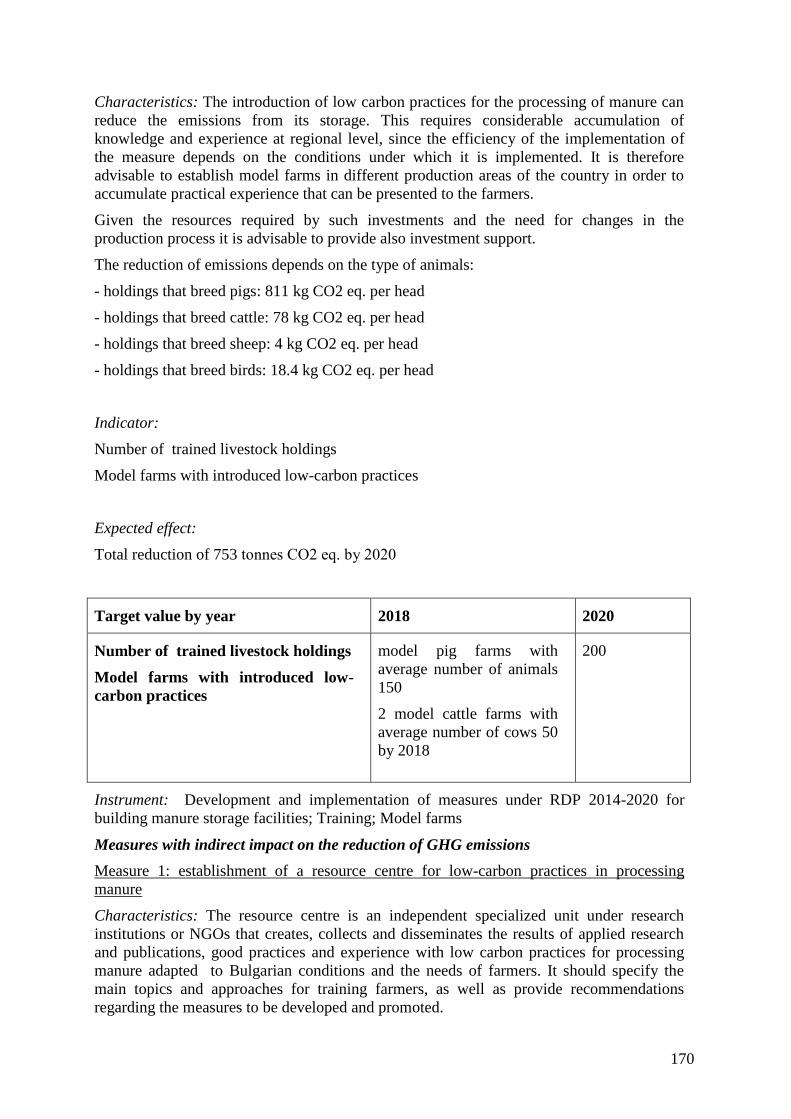
170
Characteristics: The introduction of low carbon practices for the processing of manure can
reduce the emissions from its storage. This requires considerable accumulation of
knowledge and experience at regional level, since the efficiency of the implementation of
the measure depends on the conditions under which it is implemented. It is therefore
advisable to establish model farms in different production areas of the country in order to
accumulate practical experience that can be presented to the farmers.
Given the resources required by such investments and the need for changes in the
production process it is advisable to provide also investment support.
The reduction of emissions depends on the type of animals:
- holdings that breed pigs: 811 kg CO2 eq. per head
- holdings that breed cattle: 78 kg CO2 eq. per head
- holdings that breed sheep: 4 kg CO2 eq. per head
- holdings that breed birds: 18.4 kg CO2 eq. per head
Indicator:
Number of trained livestock holdings
Model farms with introduced low-carbon practices
Expected effect:
Total reduction of 753 tonnes СО2 eq. by 2020
Target value by year 2018 2020
Number of trained livestock holdings
Model farms with introduced low-
carbon practices
model pig farms with
average number of animals
150
2 model cattle farms with
average number of cows 50
by 2018
200
Instrument: Development and implementation of measures under RDP 2014-2020 for
building manure storage facilities; Training; Model farms
Measures with indirect impact on the reduction of GHG emissions
Measure 1: establishment of a resource centre for low-carbon practices in processing
manure
Characteristics: The resource centre is an independent specialized unit under research
institutions or NGOs that creates, collects and disseminates the results of applied research
and publications, good practices and experience with low carbon practices for processing
manure adapted to Bulgarian conditions and the needs of farmers. It should specify the
main topics and approaches for training farmers, as well as provide recommendations
regarding the measures to be developed and promoted.
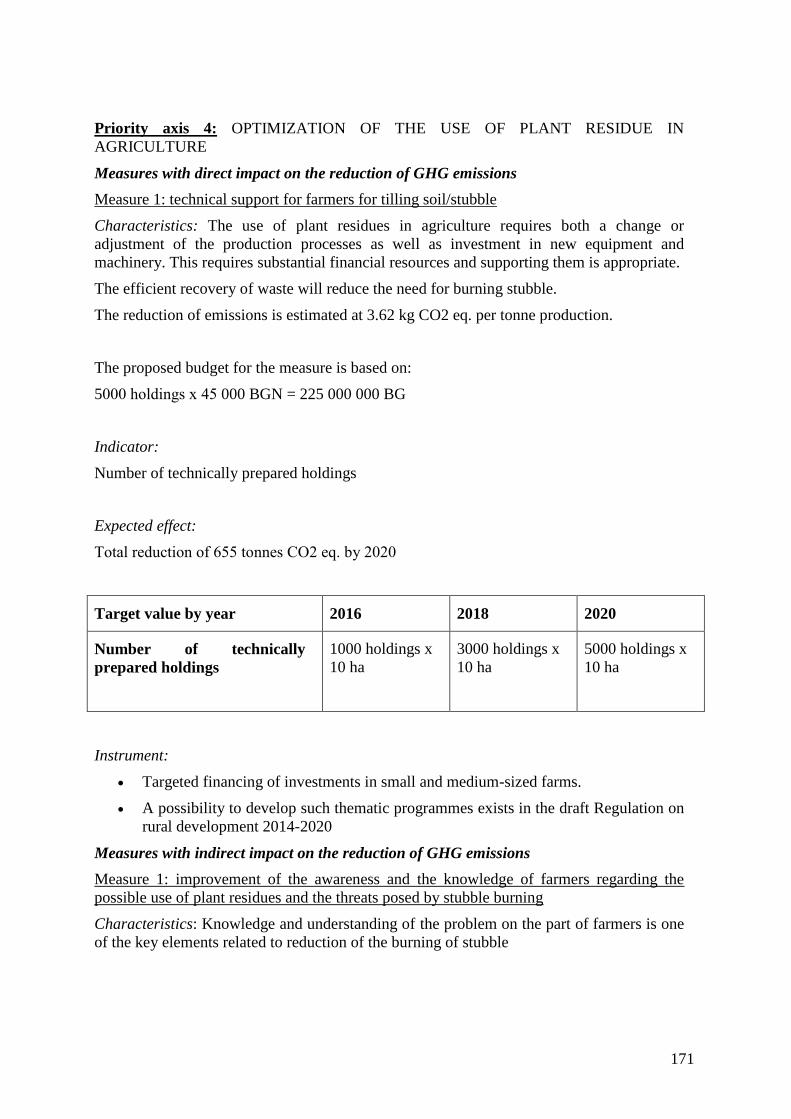
171
Priority axis 4: OPTIMIZATION OF THE USE OF PLANT RESIDUE IN
AGRICULTURE
Measures with direct impact on the reduction of GHG emissions
Measure 1: technical support for farmers for tilling soil/stubble
Characteristics: The use of plant residues in agriculture requires both a change or
adjustment of the production processes as well as investment in new equipment and
machinery. This requires substantial financial resources and supporting them is appropriate.
The efficient recovery of waste will reduce the need for burning stubble.
The reduction of emissions is estimated at 3.62 kg CO2 eq. per tonne production.
The proposed budget for the measure is based on:
5000 holdings х 45 000 BGN = 225 000 000 BG
Indicator:
Number of technically prepared holdings
Expected effect:
Total reduction of 655 tonnes СО2 eq. by 2020
Target value by year 2016 2018 2020
Number of technically
prepared holdings
1000 holdings x
10 ha
3000 holdings x
10 ha
5000 holdings x
10 ha
Instrument:
Targeted financing of investments in small and medium-sized farms.
A possibility to develop such thematic programmes exists in the draft Regulation on
rural development 2014-2020
Measures with indirect impact on the reduction of GHG emissions
Measure 1: improvement of the awareness and the knowledge of farmers regarding the
possible use of plant residues and the threats posed by stubble burning
Characteristics: Knowledge and understanding of the problem on the part of farmers is one
of the key elements related to reduction of the burning of stubble
172
Priority axis 5: IMPROVEMENT OF THE MANAGEMENT OF PADDY FIELDS AND
TECHNOLOGIES FOR PRODUCTION OF RICE
Measures with direct impact on the reduction of GHG emissions
Measure 1: financial support for improving the equipment and the technology of production
Characteristics: In recent years, rice production in the country has been gradually
recovering its potential. The introduction of low carbon technologies and methods is
necessary, feasible and appropriate in this specific period
Indicator of implementation: Number of supported rice producers
Expected effect: Total reduction of 10 tonnes СО2 eq. by 2020
Target value by year 2016 2018 2020
Number of t supported rice
producers
10 x 10 ha 20x 10 ha 50x10 ha
Priority axis 6: RAISING THE AWARENESS AND IMPROVING THE KNOWLEDGE
OF FARMERS AND ADMINISTRATION REGARDING THE ACTIONS AND THEIR
EFFECT ON CLIMATE CHANGE
Measures in this priority axis are with indirect impact on the reduction of GHG emissions.
4.4.20. Land Use, Land Use Change and Forestry Sector
4.4.20.1. General information on the sector
The sector of Land Use, Land Use Change and Forestry (LULUCF) is not addressed and no
measures are proposed to reduce emissions or to increase the absorption of greenhouse
gases in the previous two Action Plans on Climate Change (2000, 2005). Accounting for the
activities in the sector is necessary in order to make a comprehensive analysis of the carbon
balance in the country.
Land Use, Land-Use Change and Forestry (LULUCF) sector includes emissions and
greenhouse gas removals from different land-use types, changes in the land-use and
forestry. The greenhouse gas inventory of LULUCF sector comprises emissions and
removals of СО2 due to overall carbon gains or losses in the relevant carbon pools of the
predefined six land-use categories. These pools are above-ground biomass, below-ground
biomass, dead organic matter (litter and dead wood) and soils. Sources of the non-CO2
emissions in the LULUCF sector are the biomass burning, lime and urea application, as
well as fertilisation.
Since reporting year 2015 the methodology used to calculate emissions and removals in
LULUCF follows that of the 2006 IPCC Guidelines. The predefined land-use categories are
Forest land (FL), Cropland (CL), Grassland (GL), Wetland (WL), Settlements (S), Other
land (OL). In accordance with the 2006 IPCC Guidelines emissions and removals should be
reported into two sub-categories – land remaining in the same category and land converted
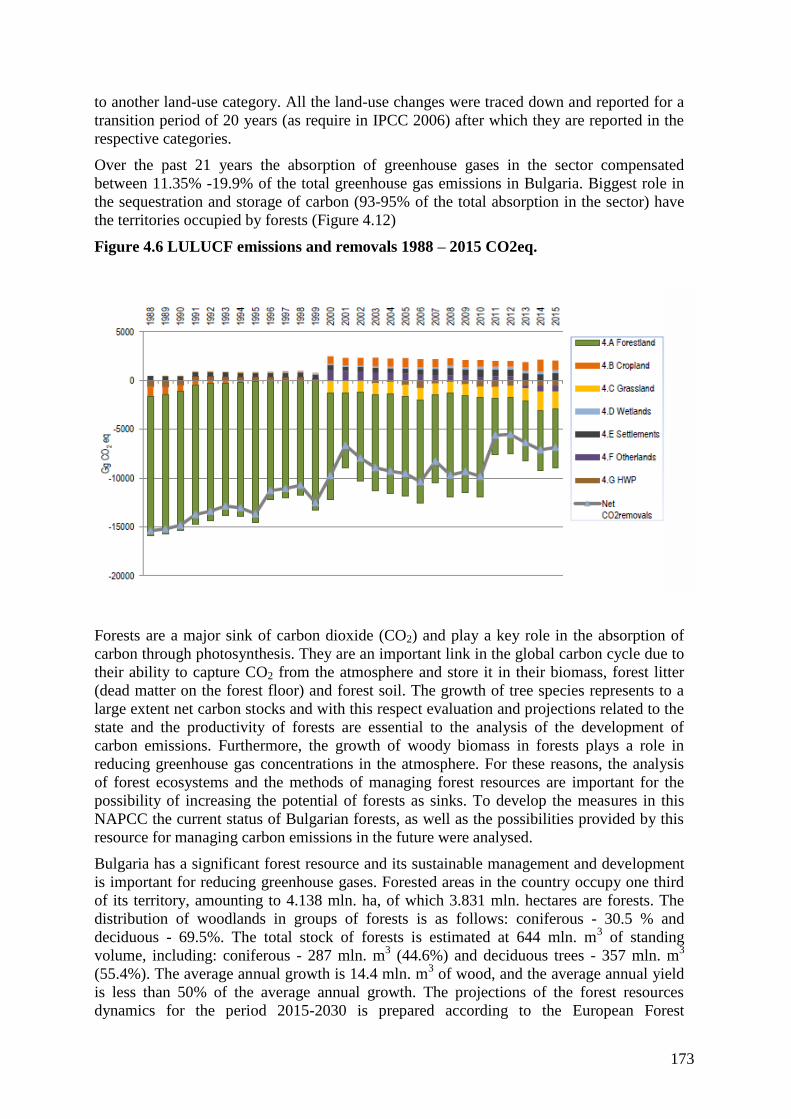
173
to another land-use category. All the land-use changes were traced down and reported for a
transition period of 20 years (as require in IPCC 2006) after which they are reported in the
respective categories.
Over the past 21 years the absorption of greenhouse gases in the sector compensated
between 11.35% -19.9% of the total greenhouse gas emissions in Bulgaria. Biggest role in
the sequestration and storage of carbon (93-95% of the total absorption in the sector) have
the territories occupied by forests (Figure 4.12)
Figure 4.6 LULUCF emissions and removals 1988 – 2015 CO2eq.
Forests are a major sink of carbon dioxide (CO2) and play a key role in the absorption of
carbon through photosynthesis. They are an important link in the global carbon cycle due to
their ability to capture CO2 from the atmosphere and store it in their biomass, forest litter
(dead matter on the forest floor) and forest soil. The growth of tree species represents to a
large extent net carbon stocks and with this respect evaluation and projections related to the
state and the productivity of forests are essential to the analysis of the development of
carbon emissions. Furthermore, the growth of woody biomass in forests plays a role in
reducing greenhouse gas concentrations in the atmosphere. For these reasons, the analysis
of forest ecosystems and the methods of managing forest resources are important for the
possibility of increasing the potential of forests as sinks. To develop the measures in this
NAPCC the current status of Bulgarian forests, as well as the possibilities provided by this
resource for managing carbon emissions in the future were analysed.
Bulgaria has a significant forest resource and its sustainable management and development
is important for reducing greenhouse gases. Forested areas in the country occupy one third
of its territory, amounting to 4.138 mln. ha, of which 3.831 mln. hectares are forests. The
distribution of woodlands in groups of forests is as follows: coniferous - 30.5 % and
deciduous - 69.5%. The total stock of forests is estimated at 644 mln. m3 of standing
volume, including: coniferous - 287 mln. m3 (44.6%) and deciduous trees - 357 mln. m
3
(55.4%). The average annual growth is 14.4 mln. m3 of wood, and the average annual yield
is less than 50% of the average annual growth. The projections of the forest resources
dynamics for the period 2015-2030 is prepared according to the European Forest
174
Information Scenario Model (EFISCEN) which is a matrix model based on the area
occupied by tree species or by forest types and is suitable for policy analysis for large
territories (D. Kostov, 2009). The following results for the stock of standing timber in
Bulgarian forests and the average annual growth were estimated using the simulations with
this model in the baseline scenario: 2015 – 705.3 mln. m3 of stock and growth of 16.763
mln. m3; 2020 – 743.5 mln. m
3 of stock and growth of 16.734 mln. m
3; 2025 – 780.3 mln.
m3 of stock and growth of 16.669 mln. m
3; 2030 - 812 mln. m
3 of stock and growth of
16.195 mln. m3. This analysis shows that Bulgarian forests are now a reservoir of 229 mln.
tonnes of carbon that will reach 264 mln. tonnes of C in 2020, and in 2030 - 288 mln.
tonnes of C. EU forests, including Bulgarian forests, absorb a total of 0.5 bln. tons of CO2
eq. per year, while greenhouse gas emissions from the industry in the EU-27 amount to 5
bln. tons of CO2 eq. per year.15
.
In the long term it is necessary to continue the development of the concept for sustainable
and multifunctional forest management aimed at maintaining or increasing the supplies of
timber and respectively of carbon in forests, while ensuring, at the same time, a sustainable
annual yield of timber and timber products. The current National Strategy “Sustainable
Development of Forestry in Bulgaria 2006-2015” points out the need of overall
improvement of the role and contribution of forests to climate change mitigation by
increasing the carbon stocks in existing and in new forests. The increase in the use of wood
as a resource that can substitute other energy-intensive materials and as a renewable energy
source will have a positive impact on the carbon balance and will contribute to reducing the
use of fossil fuels. The expansion of forest areas through afforestation of abandoned
agricultural land, barren and deforested areas, eroded and threatened by erosion land, and
the acceleration of measures for cultivation of forests and improvement of forest health will
allow forests to better perform their productive, environmental and preservation functions
that also will have, on the other hand, a positive effect on the growing accumulation of
carbon in forest areas. The significant adverse effect of forest fires on the gas composition
of the atmosphere can be minimized by anticipating and taking appropriate measures,
activities and campaigns aimed both at the forestry sector and the related persons and
organizations as well as at the general public.
Sixteen measures were developed to achieve the objectives on Climate Change for the Land
Use, Land Use Change and Forestry sector and were grouped into four priority axes,
comprising several popular approaches to managing the carbon balance.
The first priority axis combines measures to increase the sequestration of greenhouse gases
and the necessary measures are associated with increase of the areas of land use categories -
sinks of greenhouse gases - forests, pastures and meadows, and measures for their
sustainable maintenance in order to increase the amount of biomass. The increase of green
areas in urban territories is also a measure with positive impact on carbon balance. This axis
reflects the need for additional legislative and administrative measures to regulate the
changes in the designation of areas of land use categories that are sinks of greenhouse
gases.
Another group of measures is aimed at conservation of carbon stocks in forests. This
priority axis comprises activities aimed primarily at maintaining and improving the
condition of forests as a carbon pool.
The third priority axis contains measures related to increasing the potential of forests for
carbon sequestration. There are administrative, regulatory and financial measures aimed at
15
Green Paper on Forest Protection and Information in the EU.
175
increasing the country's forest resources and improving their condition and potential as a
major carbon sink.
The last priority axis includes measures aimed at the long-term retention of carbon in wood
products through the expansion of their use at the expense of other non-renewable materials
with high carbon content which can be achieved by raising the awareness and the interest of
society.
4.4.20.2. Measures in the Land Use, Land Use Change and Forestry Sector
Priority axis 1: INCREASING GREENHOUSE GAS SEQUESTRATION
Measures with direct impact on the reduction of GHG emissions
Measures with direct impact on the reduction of GHG emissions
Measure 1: utilization of „non-wooded areas intended for afforestation “ in forest areas
Characteristics: The measure is consistent with the requirements set out in the Forestry Act
(2011). The needed financial resources are estimated on the basis of the accepted mean
values of investments. The implementation of the measure is important for achieving the
goals of NAPCC because forests are a major carbon sink and a reservoir of 90-95% of the
total amount of sequestered carbon in the LULUCF sector. Increasing forest area has an
important role in offsetting the greenhouse gas emissions from other sectors. The
afforestation of non-wooded areas in the long term will increase the capacity of the forests
as sinks of greenhouse gases.
Indicator of implementation:
490 ha utilized areas
Expected effect:
Total reduction of 13 378 tonnes СО2 eq by 2020
Target value by year 2014 2016 2018 2020
ha utilized areas 120 ha
utilized
areas
130 ha
utilized
areas
120 ha
utilized
areas
120 ha
utilized
areas
Type of instrument:
Development of a programme for afforestation of non-wooded areas intended for
afforestation in forest areas; Organization of afforestation campaigns; Publishing and
distribution of explanatory leaflets.
Measure 2: afforestation of abandoned agricultural land, barren and deforested areas, eroded
and threatened by erosion land outside forest areas
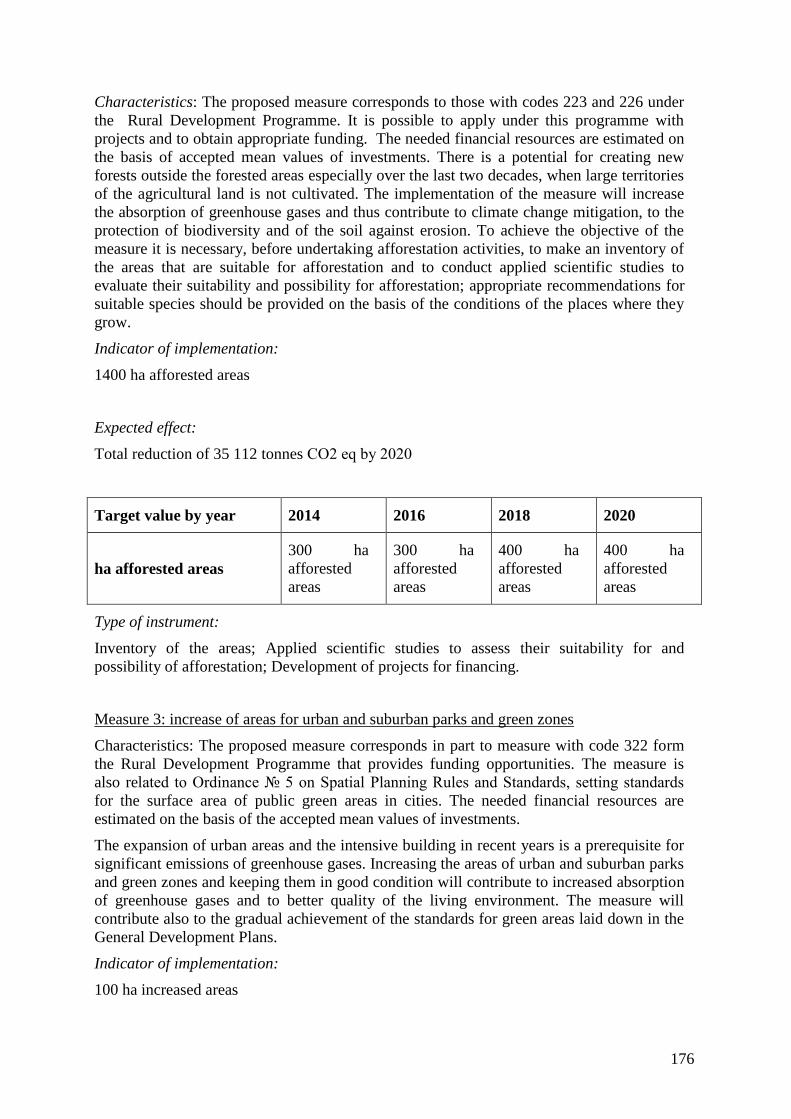
176
Characteristics: The proposed measure corresponds to those with codes 223 and 226 under
the Rural Development Programme. It is possible to apply under this programme with
projects and to obtain appropriate funding. The needed financial resources are estimated on
the basis of accepted mean values of investments. There is a potential for creating new
forests outside the forested areas especially over the last two decades, when large territories
of the agricultural land is not cultivated. The implementation of the measure will increase
the absorption of greenhouse gases and thus contribute to climate change mitigation, to the
protection of biodiversity and of the soil against erosion. To achieve the objective of the
measure it is necessary, before undertaking afforestation activities, to make an inventory of
the areas that are suitable for afforestation and to conduct applied scientific studies to
evaluate their suitability and possibility for afforestation; appropriate recommendations for
suitable species should be provided on the basis of the conditions of the places where they
grow.
Indicator of implementation:
1400 ha afforested areas
Expected effect:
Total reduction of 35 112 tonnes СО2 eq by 2020
Target value by year 2014 2016 2018 2020
ha afforested areas
300 ha
afforested
areas
300 ha
afforested
areas
400 ha
afforested
areas
400 ha
afforested
areas
Type of instrument:
Inventory of the areas; Applied scientific studies to assess their suitability for and
possibility of afforestation; Development of projects for financing.
Measure 3: increase of areas for urban and suburban parks and green zones
Characteristics: The proposed measure corresponds in part to measure with code 322 form
the Rural Development Programme that provides funding opportunities. The measure is
also related to Ordinance № 5 on Spatial Planning Rules and Standards, setting standards
for the surface area of public green areas in cities. The needed financial resources are
estimated on the basis of the accepted mean values of investments.
The expansion of urban areas and the intensive building in recent years is a prerequisite for
significant emissions of greenhouse gases. Increasing the areas of urban and suburban parks
and green zones and keeping them in good condition will contribute to increased absorption
of greenhouse gases and to better quality of the living environment. The measure will
contribute also to the gradual achievement of the standards for green areas laid down in the
General Development Plans.
Indicator of implementation:
100 ha increased areas
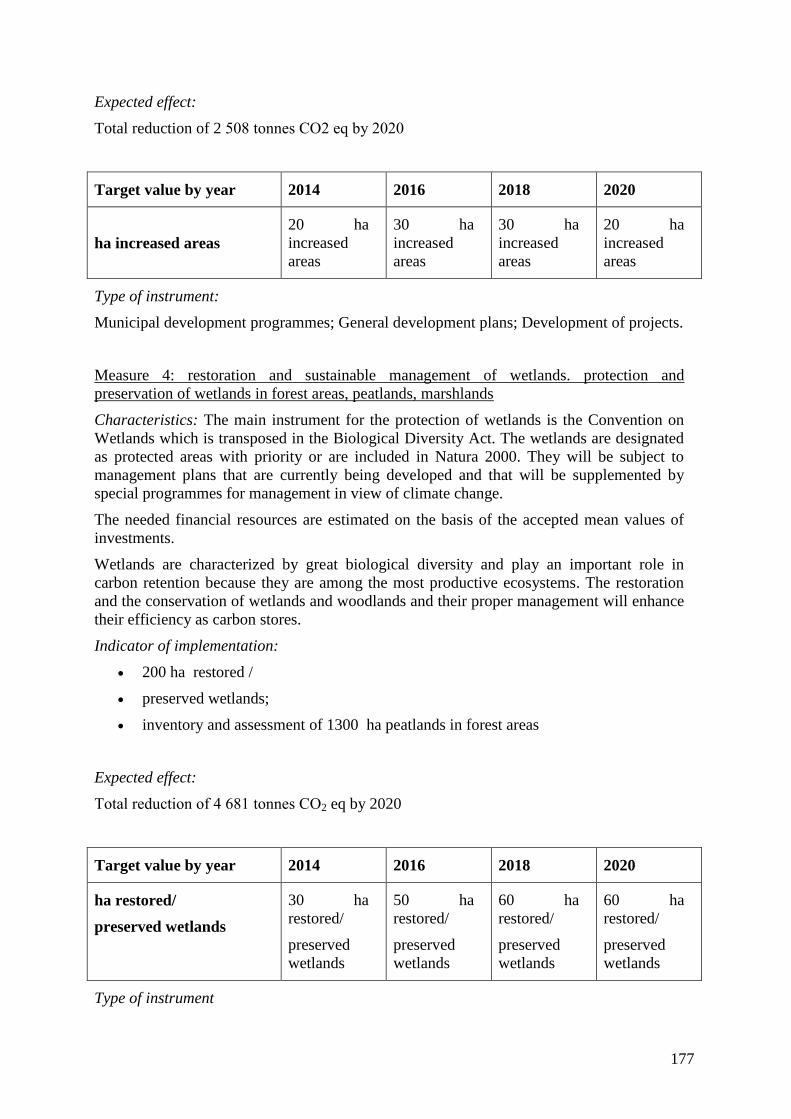
177
Expected effect:
Total reduction of 2 508 tonnes СО2 eq by 2020
Target value by year 2014 2016 2018 2020
ha increased areas
20 ha
increased
areas
30 ha
increased
areas
30 ha
increased
areas
20 ha
increased
areas
Type of instrument:
Municipal development programmes; General development plans; Development of projects.
Measure 4: restoration and sustainable management of wetlands. protection and
preservation of wetlands in forest areas, peatlands, marshlands
Characteristics: The main instrument for the protection of wetlands is the Convention on
Wetlands which is transposed in the Biological Diversity Act. The wetlands are designated
as protected areas with priority or are included in Natura 2000. They will be subject to
management plans that are currently being developed and that will be supplemented by
special programmes for management in view of climate change.
The needed financial resources are estimated on the basis of the accepted mean values of
investments.
Wetlands are characterized by great biological diversity and play an important role in
carbon retention because they are among the most productive ecosystems. The restoration
and the conservation of wetlands and woodlands and their proper management will enhance
their efficiency as carbon stores.
Indicator of implementation:
200 ha restored /
preserved wetlands;
inventory and assessment of 1300 ha peatlands in forest areas
Expected effect:
Total reduction of 4 681 tonnes СО2 eq by 2020
Target value by year 2014 2016 2018 2020
ha restored/
preserved wetlands
30 ha
restored/
preserved
wetlands
50 ha
restored/
preserved
wetlands
60 ha
restored/
preserved
wetlands
60 ha
restored/
preserved
wetlands
Type of instrument
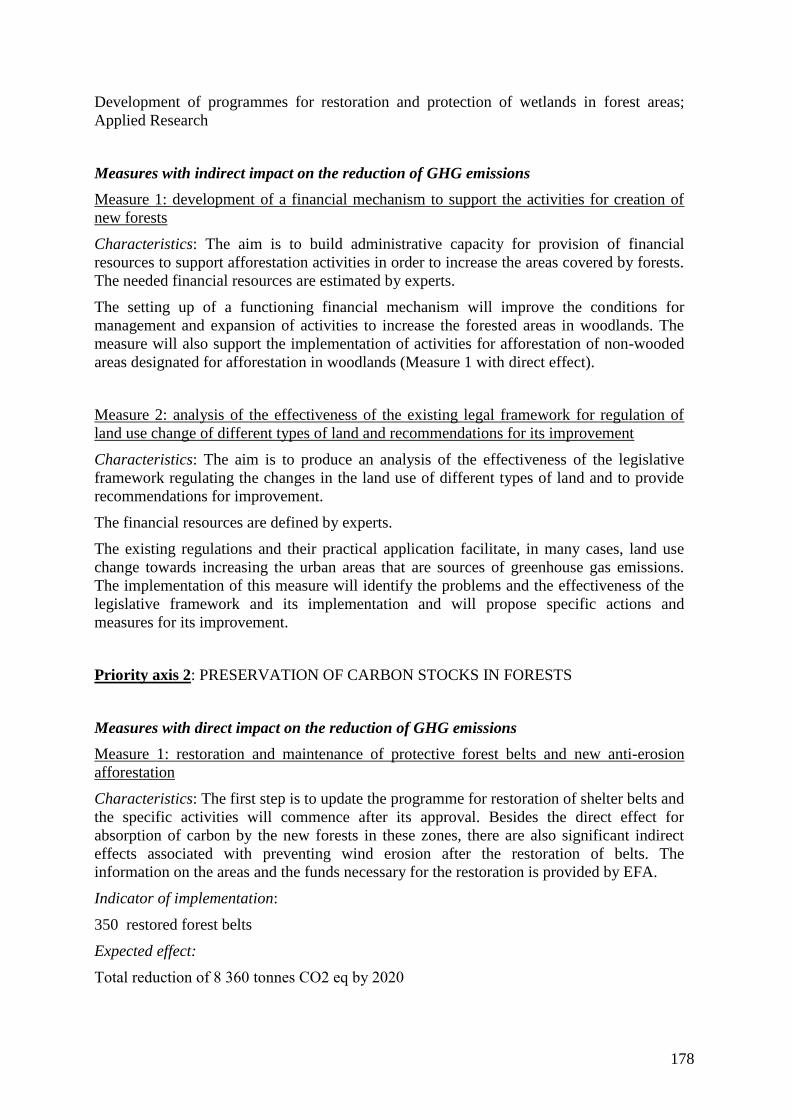
178
Development of programmes for restoration and protection of wetlands in forest areas;
Applied Research
Measures with indirect impact on the reduction of GHG emissions
Measure 1: development of a financial mechanism to support the activities for creation of
new forests
Characteristics: The aim is to build administrative capacity for provision of financial
resources to support afforestation activities in order to increase the areas covered by forests.
The needed financial resources are estimated by experts.
The setting up of a functioning financial mechanism will improve the conditions for
management and expansion of activities to increase the forested areas in woodlands. The
measure will also support the implementation of activities for afforestation of non-wooded
areas designated for afforestation in woodlands (Measure 1 with direct effect).
Measure 2: analysis of the effectiveness of the existing legal framework for regulation of
land use change of different types of land and recommendations for its improvement
Characteristics: The aim is to produce an analysis of the effectiveness of the legislative
framework regulating the changes in the land use of different types of land and to provide
recommendations for improvement.
The financial resources are defined by experts.
The existing regulations and their practical application facilitate, in many cases, land use
change towards increasing the urban areas that are sources of greenhouse gas emissions.
The implementation of this measure will identify the problems and the effectiveness of the
legislative framework and its implementation and will propose specific actions and
measures for its improvement.
Priority axis 2: PRESERVATION OF CARBON STOCKS IN FORESTS
Measures with direct impact on the reduction of GHG emissions
Measure 1: restoration and maintenance of protective forest belts and new anti-erosion
afforestation
Characteristics: The first step is to update the programme for restoration of shelter belts and
the specific activities will commence after its approval. Besides the direct effect for
absorption of carbon by the new forests in these zones, there are also significant indirect
effects associated with preventing wind erosion after the restoration of belts. The
information on the areas and the funds necessary for the restoration is provided by EFA.
Indicator of implementation:
350 restored forest belts
Expected effect:
Total reduction of 8 360 tonnes СО2 eq by 2020
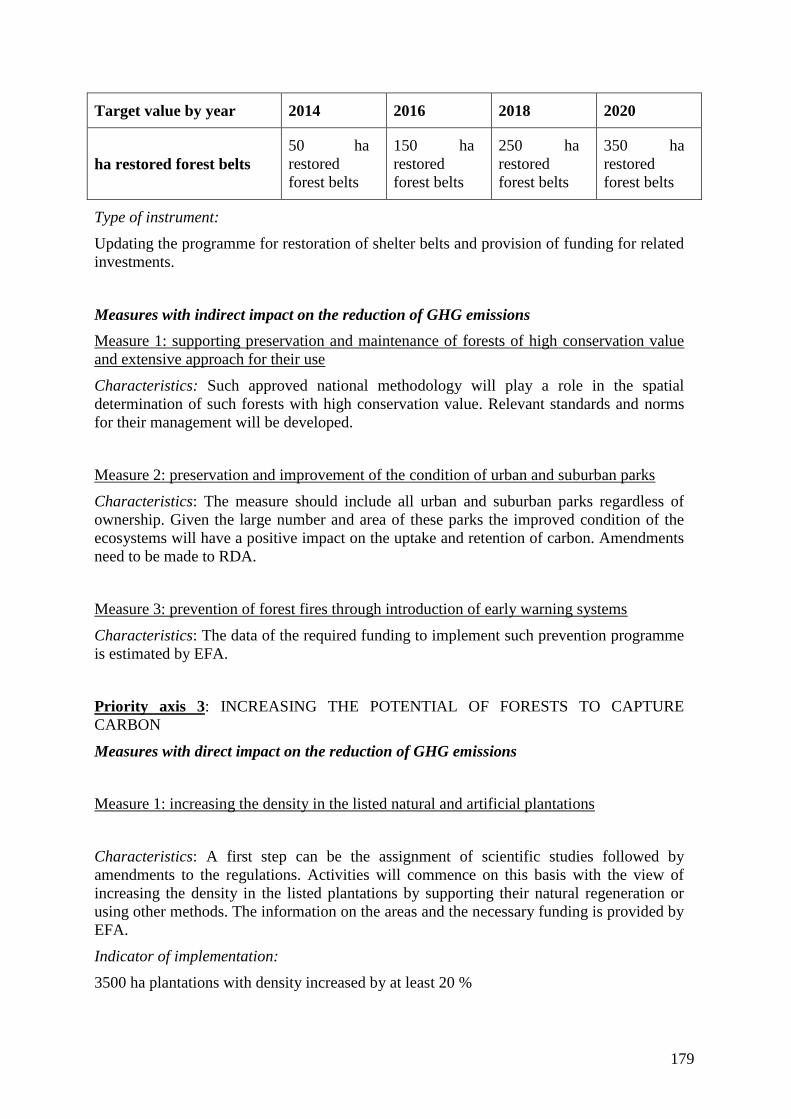
179
Target value by year 2014 2016 2018 2020
ha restored forest belts
50 ha
restored
forest belts
150 ha
restored
forest belts
250 ha
restored
forest belts
350 ha
restored
forest belts
Type of instrument:
Updating the programme for restoration of shelter belts and provision of funding for related
investments.
Measures with indirect impact on the reduction of GHG emissions
Measure 1: supporting preservation and maintenance of forests of high conservation value
and extensive approach for their use
Characteristics: Such approved national methodology will play a role in the spatial
determination of such forests with high conservation value. Relevant standards and norms
for their management will be developed.
Measure 2: preservation and improvement of the condition of urban and suburban parks
Characteristics: The measure should include all urban and suburban parks regardless of
ownership. Given the large number and area of these parks the improved condition of the
ecosystems will have a positive impact on the uptake and retention of carbon. Amendments
need to be made to RDA.
Measure 3: prevention of forest fires through introduction of early warning systems
Characteristics: The data of the required funding to implement such prevention programme
is estimated by EFA.
Priority axis 3: INCREASING THE POTENTIAL OF FORESTS TO CAPTURE
CARBON
Measures with direct impact on the reduction of GHG emissions
Measure 1: increasing the density in the listed natural and artificial plantations
Characteristics: A first step can be the assignment of scientific studies followed by
amendments to the regulations. Activities will commence on this basis with the view of
increasing the density in the listed plantations by supporting their natural regeneration or
using other methods. The information on the areas and the necessary funding is provided by
EFA.
Indicator of implementation:
3500 ha plantations with density increased by at least 20 %
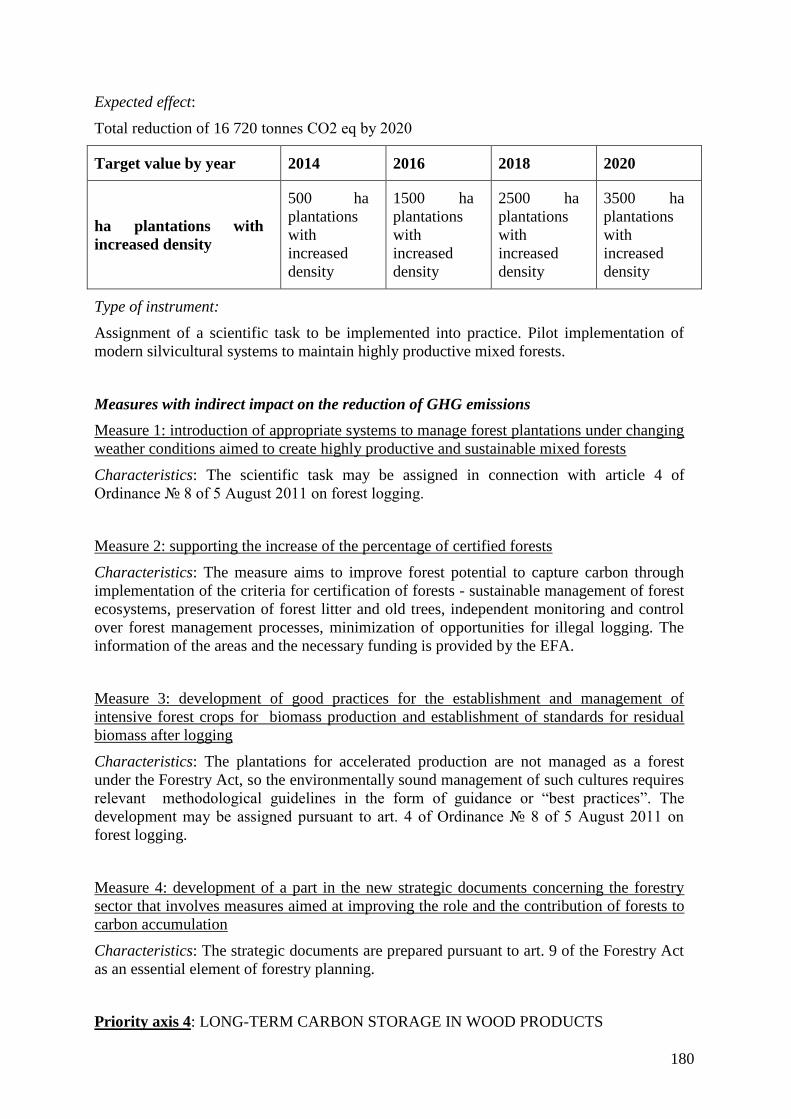
180
Expected effect:
Total reduction of 16 720 tonnes СО2 eq by 2020
Target value by year 2014 2016 2018 2020
ha plantations with
increased density
500 ha
plantations
with
increased
density
1500 ha
plantations
with
increased
density
2500 ha
plantations
with
increased
density
3500 ha
plantations
with
increased
density
Type of instrument:
Assignment of a scientific task to be implemented into practice. Pilot implementation of
modern silvicultural systems to maintain highly productive mixed forests.
Measures with indirect impact on the reduction of GHG emissions
Measure 1: introduction of appropriate systems to manage forest plantations under changing
weather conditions aimed to create highly productive and sustainable mixed forests
Characteristics: The scientific task may be assigned in connection with article 4 of
Ordinance № 8 of 5 August 2011 on forest logging.
Measure 2: supporting the increase of the percentage of certified forests
Characteristics: The measure aims to improve forest potential to capture carbon through
implementation of the criteria for certification of forests - sustainable management of forest
ecosystems, preservation of forest litter and old trees, independent monitoring and control
over forest management processes, minimization of opportunities for illegal logging. The
information of the areas and the necessary funding is provided by the EFA.
Measure 3: development of good practices for the establishment and management of
intensive forest crops for biomass production and establishment of standards for residual
biomass after logging
Characteristics: The plantations for accelerated production are not managed as a forest
under the Forestry Act, so the environmentally sound management of such cultures requires
relevant methodological guidelines in the form of guidance or “best practices”. The
development may be assigned pursuant to art. 4 of Ordinance № 8 of 5 August 2011 on
forest logging.
Measure 4: development of a part in the new strategic documents concerning the forestry
sector that involves measures aimed at improving the role and the contribution of forests to
carbon accumulation
Characteristics: The strategic documents are prepared pursuant to art. 9 of the Forestry Act
as an essential element of forestry planning.
Priority axis 4: LONG-TERM CARBON STORAGE IN WOOD PRODUCTS
181
Measures with indirect impact on the reduction of GHG emissions
Measure 1: extend the use of wood products as substitutes for products from non-
renewable, polluting and energy-intensive materials
Characteristics: Initiatives by stakeholders in the forestry sector – state and scientific
institutions, representatives of the forestry business, branch organisations and NGOs –
concerning the advantages of wood products. The measure is related to training and
awareness raising of citizens, including with respect to the effective use of wood products.
4.4.21. Transport Sector
4.4.21.1. General information on the Transport sector
The analysis of the development of the Bulgarian transport sector over the recent years
shows significant structural changes and a tendency for growing share of road transport in
the overall transport activity.
Following a steep decline in 1989 as a result of the political and economic crisis, a distinct
uptrend of GHG emissions could be noticed since 2000 to present. The change was a result
of the economic recovery, preceded by the introduction of a currency board regime in 1997
and rigorous economic and political reforms. The main contributing gas is CO2, followed
by CH4 and N2O.The CO2 emission trend is directly related to the fuel consumption and
therefore shows a decrease in the period 1990-2000. However, with the reviving economy
CO2 emissions grew constantly to 2006. Afterwards, a period of stabilization began and
continued to 2009 when there was a slight drop in the emissions mainly related to the
economic crisis and the consequent decline in transportation. For 2013 there was again a
drop in the fuel consumption (mostly for diesel fuel and gasoline), which resulted in
decrease of the emissions, but the drop was compensated in 2014 and 2015, reaching the
highest ever consumption.
Overall, the GHG emissions from road transport increased by 28.7% compared to base year
level of 6 923.6 Gg CO2e and reached 8 913.9 Gg CO2e in 2015.
The most significant contributor to GHG emissions are passenger cars, followed by heavy-
duty vehicles, light-duty vehicles and motorcycles and mopeds. As it can be noticed from
the following figure, in 2015, passenger cars account for 65.1%, light-duty vehicles are
responsible for 13.7%, and heavy duty vehicles (incl. buses) account for 20.9% of total
GHG CO2e emissions, with the share of passenger cars increasing over the time series. The
remaining 0.3% were shared among and mopeds and motorcycles.The White Paper
“Roadmap to a Single European Transport Area - Towards a competitive and resource
efficient transport system” (COM (2011) 144 final) refers to the Commission’s analysis16
which shows that while other sectors can achieve greater reductions, the transport sector is
expected to reduce its greenhouse gases (GHG) by at least 60% by 2050 compared to 1990
levels, however it remains a significant and growing source of GHG. The aim of the
transport sector is to reduce GHG emissions by about 20% below their level in 2008 by
16 Communication from the Commission “A Roadmap for moving to a competitive low carbon economy in 2050”, (COM (2011)112).
182
2030. Given the significant increase of transport emissions over the past two decades, this
reduction would nevertheless lead them to a level higher by 8 % than the level in 1990.
According to Decision 406/2009/EC (Efforts Sharing Decision) Bulgaria is assigned an
individual target allowing it to increase the emissions from sectors outside the ETS, such as
the transport sector, with 20% by 2020 compared to their level in 2005. Although this
individual commitment facilitates the national objectives in the course of time the Transport
sector undoubtedly requires drastic changes in order to achieve stability. One of the biggest
challenges is to reduce dependence of the transport system and the Bulgarian economy on
oil.
In this regard, the main measures in the sector should be directed at achieving an optimal
balance in the use of the potential of different types of transport.
4.4.21.2. Measures in the Transport sector
The main measures in the sector are divided into four priority axes as follows:
Priority axis 1: REDUCTION OF TRANSPORT EMISSIONS
Measures with direct impact on the reduction of GHG emissions
Measure 1: rehabilitation and modernization of the existing road infrastructure to ensure
optimum speed and optimum driving modes of automobile engines
Characteristics: Assessment of the emission saving potential of projects for rehabilitation
and modernization – within the EIA. Existing methodology of the European Investment
Bank.
(http://www.eib.org/attachments/strategies/footprint_summary_of_the_methodologies_en.p
df)
Indicator of implementation:
Emission savings from km. rehabilitated infrastructure
Expected effect:
Total reduction of 542 496 tonnes СО2 eq by 2020
Type of instrument:
1.Updating the regulatory basis on design
2.Development and implementation of specific projects
Measure 2: introduction of intelligent transport systems along the national and the urban
road network
Characteristics: Intelligent Transport Systems (ITS) encompass a wide range of technical
solutions designed to improve transport by improving mobility and increasing the safety of
road traffic. Telematics (a combination of telecommunications and informatics) uses
advanced technologies to meet transport needs. Intelligent transport systems and telematic
solutions help improve road safety, promote the efficiency of the used existing
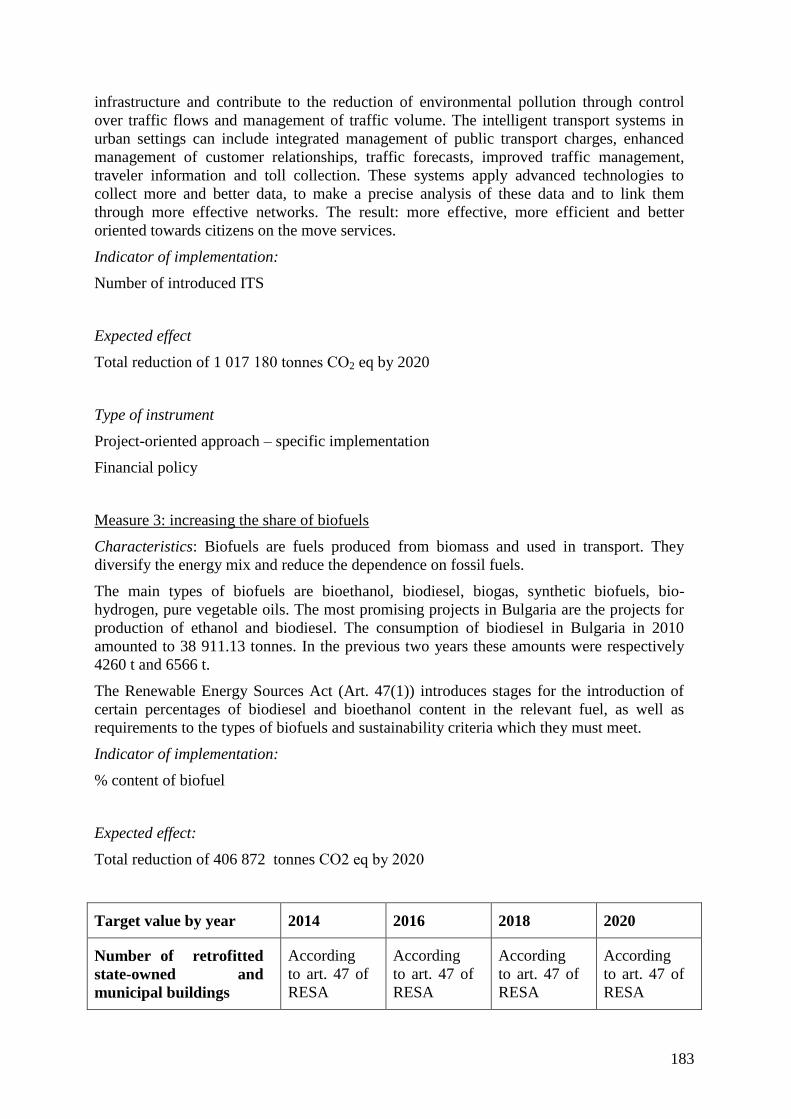
183
infrastructure and contribute to the reduction of environmental pollution through control
over traffic flows and management of traffic volume. The intelligent transport systems in
urban settings can include integrated management of public transport charges, enhanced
management of customer relationships, traffic forecasts, improved traffic management,
traveler information and toll collection. These systems apply advanced technologies to
collect more and better data, to make a precise analysis of these data and to link them
through more effective networks. The result: more effective, more efficient and better
oriented towards citizens on the move services.
Indicator of implementation:
Number of introduced ITS
Expected effect
Total reduction of 1 017 180 tonnes СО2 eq by 2020
Type of instrument
Project-oriented approach – specific implementation
Financial policy
Measure 3: increasing the share of biofuels
Characteristics: Biofuels are fuels produced from biomass and used in transport. They
diversify the energy mix and reduce the dependence on fossil fuels.
The main types of biofuels are bioethanol, biodiesel, biogas, synthetic biofuels, bio-
hydrogen, pure vegetable oils. The most promising projects in Bulgaria are the projects for
production of ethanol and biodiesel. The consumption of biodiesel in Bulgaria in 2010
amounted to 38 911.13 tonnes. In the previous two years these amounts were respectively
4260 t and 6566 t.
The Renewable Energy Sources Act (Art. 47(1)) introduces stages for the introduction of
certain percentages of biodiesel and bioethanol content in the relevant fuel, as well as
requirements to the types of biofuels and sustainability criteria which they must meet.
Indicator of implementation:
% content of biofuel
Expected effect:
Total reduction of 406 872 tonnes СО2 eq by 2020
Target value by year 2014 2016 2018 2020
Number of retrofitted
state-owned and
municipal buildings
According
to art. 47 of
RESA
According
to art. 47 of
RESA
According
to art. 47 of
RESA
According
to art. 47 of
RESA
184
Type of instrument:
Renewable Energy Sources Act
Measures with indirect impact on the reduction of GHG emissions
Measure 1: developing and promoting the use of “hybrid” and electric vehicles
Characteristics: The indirect effect from the introduction of the measures is estimated at
135 624 tCO2 eq.
On 14.12.2010 a Memorandum of Understanding – “Electric Mobility” – for development
and use of electric vehicles was signed by Sofia Municipality and CEZ Bulgaria. The
purpose of the Memorandum is the development of a common strategy and an action plan
for electric vehicles. CEZ and Sofia Municipality agreed to promote the introduction of
electric vehicles on the streets of Sofia. The Municipality is committed to establishing
alleviated procedures for granting permits for installation of charging stations for electric
cars. The electricity distribution company, on its part, will apply alleviated procedures for
the provision of transit capacity, connection points and power. The first 7 electric stations
were installed at the end of 2011 in Sofia. The initiative is part of the pilot project that the
company Full Charger - Bulgaria, developed together with CEZ Bulgaria and Sofia
Municipality. The charging stations are located in the “Blue Zone” in central city areas.
Cars will be charged through prepaid vouchers. Activation through contactless debit and
credit cards will be introduced later. Full Charger - Bulgaria plans to build a network of
150-200 charging stations by the end of 2012 in Sofia and in other big cities. After that
stations will be built along motorways and inter-city roads.
The factory of "Litex Motors" in Lovech will be ready to produce electric cars in the spring
of 2012.
Priority axis 2: REDUCTION OF FUEL CONSUMPTION
Measures with direct impact on the reduction of GHG emissions
Measure 1: reduction of the relative share of trips with private motor vehicles through
improvement and development of urban public transport and development of non-motorized
transport
Indicator of implementation:
Change in the share of private and public transport
Expected effect:
Total reduction of 678 120 tonnes СО2 eq by 2020
Type of instrument:
Project-oriented approach – specific implementation
Measure 2: developing and promoting the use of bicycles for transport
185
Indicator of implementation:
Km of bicycle alleys
Expected effect:
Total reduction of 1 017 180 tonnes СО2 eq by 2020
Type of instrument:
Project-oriented approach – specific implementation
1. Design and construction of new cycling infrastructure
2. Developing systems for use of municipal bicycles
Trainings and campaigns
Measures with indirect impact on the reduction of GHG emissions
Measure 1: fiscal policy to stimulate economies and to limit consumption of conventional
fuels
Characteristics: The indirect effect from the introduction of this measure is estimated at 406
872 tCO2 eq.
The measures is proposed in the White Paper “Roadmap to a Single European Transport
Area - Towards a competitive and resource efficient transport system” (COM (2011) 144
final).
Measure 2: reduction of the number of motor vehicles using conventional fuels in public
transport by 2020
Characteristics: The measures is proposed in the White Paper “Roadmap to a Single
European Transport Area - Towards a competitive and resource efficient transport system”
(COM (2011) 144 final).
National action plan to encourage green public procurement for the period 2012-2014 – one
of the Plan’s objectives is to reduce GHG emissions and one of the major product groups
are the clean and energy efficient transport vehicles.
Priority axis 3: DIVERSIFICATION OF TRANSPORT
Measures with direct impact on the reduction of GHG emissions
Measure 1: increasing the share of public electric transport – railway, metro, trolley, tram
and metro
Characteristics: OP “Transport” 2007-2013, Priority axis 1 “Development of railway
infrastructure along the major national and Pan-European transport axes” provides for:
modernization of the railway line Sofia – Plovdiv; reconstruction and electrification of
railway line Svilengrad - Turkish border; renewal of sections of railway infrastructure on
186
the railway line Plovdiv - Burgas (along Trans-European Transport Network);
modernization of railway line Sofia - Dragoman (along TEN-T); design of the construction
of railway line Vidin - Sofia.
Given the crucial importance of the central section of Line 2, it is currently a separate Sofia
Metro Expansion Project which is included in Operational Programme Transport, with
financing by the European Regional Development Fund, with national and local co-
financing. This stretch covers the section: “Road junction Nadezhda - Central Railway
Station – Sv. Nedelya Square - Cherny Vrah Blvd.” International tender procedures were
conducted in 2007-2008 for selection of contractors of this project and the contracts entered
into force in December 2008 with a time limit for completion - autumn 2012.
The expected effect of the implementation of such measures is reduction of hazardous and
greenhouse gases – 90 500 tonnes СО2 per year.
Indicator of implementation:
Share of public electric transport
Expected effect:
Total reduction of 1 017 180 tonnes СО2 eq by 2020
Type of instrument:
Project-oriented approach – specific implementation
Increasing the share of electric railway transport - infrastructure improvements;
Increasing the share of electric railway transport - renovation of vehicles;
Increasing the share of electric mass public transport - infrastructure improvements;
increasing the share of electric mass public transport - renovation of vehicles.
Measure 2: development and construction of intermodal terminals for combined transport
Characteristics: The measure aims to achieve a two-sided effect, consisting, on one side, in
increase of the degree of utilization of more environmentally friendly modes of transport
and, on the other side, in the creation of favorable conditions for increasing the added value
of transport activity with overall reduction of transport costs per unit of GDP.
The expected results of its implementation are:
more efficient use of rail and water transport;
development of transport schemes and technologies meeting contemporary
requirements with regard to environment and climate;
increased coordination and integration of different transport modes;
lower cost for passenger and cargo transport;
integration of the Bulgarian transport system with that of the EU and increasing its
competitiveness.
Indicator of implementation:
Construction of 5 intermodal terminals by 2020
187
Expected effect:
Total reduction of 406 872 tonnes СО2 eq by 2020
Target value by year 2016 2018 2020
Number of terminals 1 term. 2 term. 2 term.
Type of instrument:
Project-oriented approach – specific implementation
Measures with indirect impact on the reduction of GHG emissions
Measure 1: reduction of cargo intended for transportation by motor vehicles at a distance of
more than 300 km by redirecting it to more environmentally sound modes of transport, e.g.
railway
Characteristics: The measures is proposed in this format in the White Paper - Roadmap to a
Single European Transport Area - Towards a competitive and resource efficient transport
system (COM (2011) 144 final).
Measure 2: connecting the central network airports – Sofia, Varna, Burgas, Plovdiv and G.
Oryahovitza with railway lines
Characteristics: The measures is proposed in this format in the White Paper - Roadmap to a
Single European Transport Area - Towards a competitive and resource efficient transport
system (COM (2011) 144 final).
Priority axis 4: INFORMING AND TRAINING CONSUMERS
Measures with indirect impact on the reduction of GHG emissions
Measure 1: sustainable transport statistics
Measure 2: informed selection of a transport vehicle
Measure 3: instruction in economic driving
4.4.22. Education and science
4.4.22.1. Measures in the field of education and science
Objective and direction of the measures in the field of science and education
The measures in the field of science and education are consistent, on the one hand, with the
needs of the relevant sectors and, on the other hand, with the National Strategy of Scientific
188
Research by 2020 and with the Programme for Development of Education, Science and
Youth Policies in Bulgaria. Those two documents contain several leading national research
priorities that are focused on areas closely related to the possibilities to reduce greenhouse
gas emissions - energy sources and energy saving technologies; addressing and control of
harmful and hazardous municipal and industrial waste; new raw materials and other
materials.
The main objective of the measures is to focus the research and development activities and
the educational activity on the issue of reducing greenhouse gas emissions, the
identification and the study of the natural and the anthropogenic factors in order to ensure
their sustainable management on the basis of practical experience and within a more
competent administrative and organizational, technological, information and financial
environment.
The contribution of science and education to the achievement of the national targets for
reducing greenhouse gas emissions is in two directions:
Establishing the condition:
contribution to the definition of the mechanisms and the specifics of the origin and
the generation of greenhouse gases in the relevant sectors;
contribution to the monitoring of the implementation of the plan;
involvement in fundamental research that contributes to the identification of
problems at global level.
Building the capacity of human resources and institutions to contribute to the
reduction of the anthropogenic impact on climate change:
Establishment of general knowledge and understanding of the anthropogenic impact
on climate change at all levels of the educational system and setting up strategies to
reduce this impact (through the system of general secondary education)
Preparation of specialists for the different sectors.
In the first two National Action Plans on Climate Change (NAPCC) education and science
are included in the package of measures at national level (respectively in the first NAPCC)
as well as an important tool in the policy of the Government of Bulgaria on Climate Change
(in the second NAPCC). No specific measures on science and education are identified in the
second action plan.
The national policy in the field of research and education is conducted by the Ministry of
Education and Science (Ministry of Education), and in the field of innovation - the Ministry
of Economy. The ministries are supported by the National Council for Scientific Research
(NCSR) and the National Council for Innovation. The other ministries are also actively
involved in the implementation of the state policy to encourage research and innovation by
supporting, performing or financing/co-financing specific tasks in that sphere.
Some specific features of the sector should be taken into account in order to identify
measures in the field of science and education that will contribute to meeting the national
targets for reducing greenhouse gases as follows:
Although specific research institutes, departments or educational institutions are
directly involved with measures to reduce greenhouse gases the manner of
functioning of the whole educational system determines the possible contribution of
these departments;
189
The priorities in the "Education and Science" Sector are essential for the analysis of
the trends and the direction of the proposed measures related to reducing GHG
emissions.
The current environment for conducting research and educational activities in this field is
characterized by the following capacity.
Institutional and expert capacity
School education in the country has 2700 schools and 64000 teachers. (Programme for
Development of Education, Science and Youth Policies in the Republic of Bulgaria (2009-
2013). The decreasing number of school-age children in recent years was a precondition for
significant optimization of the number of the staff employed in school education. On the
other hand, there was also observed a negative trend of decreasing number of young people
that are interested and motivated to become teachers. They account for 11% of the total
number of school teachers. (Public Expenditure Review: Education - condition, problems
and opportunities. Ministry of Finance. www.minfin.bg/document/2892:1). These people
usually bring new thinking and initiatives of innovations, new technologies and topics to
school.
Higher education includes 53 higher schools (37 state and 16 private), including 43
universities and specialized higher schools and 10 independent colleges. The teaching staff
includes over 22 000 people.
According to the Programme for Development of Education, Science and Youth Policies in
the Republic of Bulgaria (2009-2013) the academic staff in Bulgaria is marked by poor
motivation and inadequate social status, lack of interest in academic career and shortage of
adequately trained human resources in priority areas, little research work in the preparation
of students, lack of innovation and inadequate links between higher educational institutions
and science. Another serious problem is the age of the faculty. It features a large structural
imbalance - 69% of professors are aged over 60 years and only 4% are aged up to 49 years.
47.06% of the total number of teachers are aged over 50 years (Public Expenditure Review:
Education - condition, problems and opportunities. Ministry of Finances.
www.minfin.bg/document/2892:1).
The R&D system includes human resources and institutions. According to statistical data
about 17 000 scientists are involved in research work most of whom are concentrated in
public R&D organizations. Very few researchers (about 13% of their total number) are
concentrated in business structures. For comparison, in some of the new EU countries this
figure is over 30% and in others - over 60%. (Programme for Development of Education,
Science and Youth Policies in the Republic of Bulgaria (2009-2013). In European countries
the predominant share of people employed in research and development (R & D) works in
the private sector and in the system of higher education. In Bulgaria almost 60% of the
people engaged in R&D are in the public sector and paid from the budget, compared an
average level of 13% in the EU (National Strategy for R&D Development 2020).
The aim of patenting and licensing activities is to provide links to practice and to
encourage the search and implementation of new and/or updated products, technologies and
services. The number of applications from European and world patent organizations is low,
while the number of applications and patents granted to foreign organizations is higher than
the number of national applicants. In our Bulgaria there is no coordinated policy of
activities concerning the relationship between science and innovation (Programme for
Development of Education, Science and Youth Policies in the Republic of Bulgaria (2009-
190
2013). The existing offices are inefficient and there is an insufficient number of transfer
offices to provide a link with industry and to encourage the demand and implementation of
new and/or updated products, technologies and services (Programme for Development of
Education, Science and Youth Policies in the Republic of Bulgaria (2009-2013). Less than
10% of the active innovation companies have links with R&D organizations (National
Strategy for R&D Development 2020). The different elements of the Bulgarian innovation
system are not connected – the fundamental and sectoral studies develop separately.
According to Eurostat data for 2008 the share of high technology products in total export is
3.57%, while the figures of other new Member States are between 4 and 6.5%, and an
average rate of 15% for EU 27. According to the European map of innovations, Bulgaria
together with Romania, Latvia and Lithuania, are defined as “humble innovators”
(European Innovation Scoreboard 2010, http://www.proinno-europe.eu/inno-
metrics/page/innovation-union-scoreboard-2010), yet the country is one of the rapidly
advancing Member States in the field of innovation. The Bulgarian summary innovation
index (SII) for 2010 is 0.226, with an average index for EU27 - 0.516.
Infrastructural capacity
According to data provided by MES regarding the financing of the purchased scientific
equipment for the period 2005-2008 there is no funding for the infrastructure in the field of
energy sources. The share of scientific equipment in the field of environmental and marine
sciences and in engineering sciences. A single purchase of expensive equipment without
ensuring the necessary conditions for conducting research and an available long-term
scientific program leads to its inefficient use and therefore to increase in the cost of the
services for the business. This leads to a paradox in some cases where Bulgaria disposes of
unique scientific equipment, but research organizations and companies send samples for
research in other EU Member States due to lower prices.
A National Roadmap for R&D Infrastructure, developed by MES was approved in
September 2010 by decision of the Council of Ministers. The map covers major scientific
centres serving specific economic and social needs of the country, the region of South-
eastern Europe and Pan-European infrastructures in which Bulgaria will participate. The
main priority of the scientific infrastructure is in the field of energy, marine research, new
materials for various applications, information and communication technologies, social
studies. (National Strategy for R&D Development 2020).
Financial capacity
Since 2006 the total expenditure on R&D in Bulgaria is about 0.45% of the GDP without a
significant upward trend. The structure of R&D financing is inversely proportional to that in
EU countries. The largest percentage is paid from the state budget – more than 2/3, and 1/3
– by the business. This ratio has remained steady over the past 10 years.
The Research and Development Fund is a national instrument supporting research projects
on competitive basis. Another instrument is the National Innovation Fund that finances
applied scientific research projects and technical and economic projects that introduce new
products, processes and services or improve existing ones. These two national funds are
potential sources of financing also for the measures proposed under this action plan.
With regard to international scientific programs, Bulgaria is presented in the Seventh
Framework Programme and the Programme COST. The country is represented also in the
191
programme Intelligent Energy for Europe which includes the extension of the programmes
SAVE - energy efficiency and ALTENER - renewable energy. The revenues from
international scientific programs are currently allocated as follows: 40% for the business,
35% for universities and about 25% for BAS and the Agricultural Academy.
Main fields of scientific research
For the purposes of the National Action Plan a study and research was conducted on the
main topics covered by the Bulgarian educational and scientific institutions, the NGOs and
the other organizations.
The main fields of research and educational activities are:
Meteorology, climatology and hydrology
These activities study the basic climate elements (air temperature, precipitation,
atmospheric circulation) in Bulgaria and more specifically in its mountainous areas which
are particularly sensitive to climate change.
The studies focus also on the climatic changes in the geological history of Earth in order to
assess the effects of astronomical factors, earth’s internal forces and environmental factors
on climate formation. The analysis of time series and extreme events is improved and
models are created of nonlinear systems, including climatic systems. The wind-solar
renewable energy sources are studied with a view to establishing the wind and the solar
energy potential on the territory of the country in meso- and macro-climatic aspects. The
methods of monitoring climatic elements are automated.
Air pollution
A single methodology for inventory of emissions of harmful substances was developed.
Different scale models of atmospheric components were made in order to assess the quality
of air environment and the origin/transportation of pollution on a large and on a small scale.
A methodology was developed for calculating emissions and sinks of greenhouse gases
from the plant cover. Research is conducted on the optimization of waste management in
order to reduce greenhouse gases. Ground, oceanographic and space systems for monitoring
of various objects in the environment, including in the air environment, are being improved.
Technologies
Mathematical and computer models are created of the transportation of air pollutants and
tested with model and real meteorological and emission data on the first Bulgarian
supercomputer IBM Blue Gene/P. The possibilities and the costs of implementing Directive
97/68/EC on emissions of gaseous and particulate pollutants from non-road mobile
machinery are studied. Materials, technologies and devices for efficient transformation of
solar energy in two main areas - photovoltaic and photothermal – are developed and tested.
Technologies involving the use of biomass and hydrogen raw materials as renewable energy
sources are investigated. Unmanned flying systems for monitoring and GIS-interpretation of
meteorological are introduced that determine the pollution of air. Energy saving and water
saving technologies for production of good agricultural produce are being developed.
Forests, Forestry and Agriculture; Land Use
Good agricultural practices leading to minimization of greenhouse gas emissions are being
developed. The role of underground plant biomass in the annual fixation of CO2 by forest
ecosystems is studied. The bio- and the energy potential of non-traditional plant species is
examined. The applicability of the principles of forest management as a means of entering
192
the carbon market is investigated; the amount of carbon dioxide presently stored in forest
ecosystems in some areas is being estimated.
Territorial structure
The Climate Friendly Cities Project aims to assist the development of a spatial structure of
cities that is favourable for the climate through planning and zoning.
An index of regional “climate security” was established under the Regions for Sustainable
Change Project based on data of greenhouse gas emissions, energy data, policy framework,
institutional capacity, socio-political situation, financial instruments The index is adjusted
to Bulgaria and applied to the monitoring system of regional development plans.
Transport
The Green Corridor Development Programme ensures the development of pedestrian and
bicycle routes both for tourism and transport. An online tool is currently being developed
for planning a bicycle journey in Sofia as a measure to reduce the emissions in the city. The
project “One Planet Mobility” aims to reduce CO2 emissions from transport under which
several computer models were developed to project the reduction of emissions from
transport in Sofia.
4.5. Status of implementation and quantitative evaluation of the
sectoral policies
In the period 1988 – 2015 Bulgaria has reached significant reduction of the GHG emissions
equal to 61.483 Mt, which is about 47 % of the emissions in the basic 1988. Main reasons
for the GHG emissions level are:
intensive application of the legislation in the field of activities, connected with the
climate changes;
successful application of government policies and measures for transition to market
economy, industry structure change, privatisation and liberalisation;
applied policies and measures, particularly directed to GHG emissions limitation;
energy policy to liberalisation of the energy markets and subsidies removal;
replacement of the fossil solid and heavy liquid fuels with natural gas and other
gaseous fuels;
energy efficiency increase and increase of the share of produced energy from RES
increased institutional capacity, engaged with coordination of climate change
activities;
population decrease.
Due to the early termination of the operation of four nuclear units in the end of 2002 and in
the end of 2006, and due to the economic and demographic development, increase of the
emissions took place in 2003 and 2007,. The rate of increase of the emissions in the years to
come will depend on policies and measures, which will be undertaken by the Government.
Although the country has much lower emissions from the admissible, according the Kyoto
Protocol, it has potential for additional decrease of GHG emissions. This potential might be
realized, in case of extension of implementation of purposive politic for emissions
reduction, expressed as implementation of additional measures. The implementation of
193
political decisions and measures set in the Second National Action Plan on Climate Change
and the development and implementation of the Third National Action Alan on Climate
Change would allow avoiding of part of the projected growth of GHG emissions.
The policies and measures presented by sectors contribute to the reduction of greenhouse
gas emissions in Bulgaria. The overall effect of their implementation will ensure the
achievement of the legally binding targets for our country under the Climate and Energy
package as well as the energy efficiency goals. The measures are summarized for each
sector and the total effect of their implementation is reflected in Table 1.18 Summary of
policies and measures with direct effect on the reduction of greenhouse gas emissions.
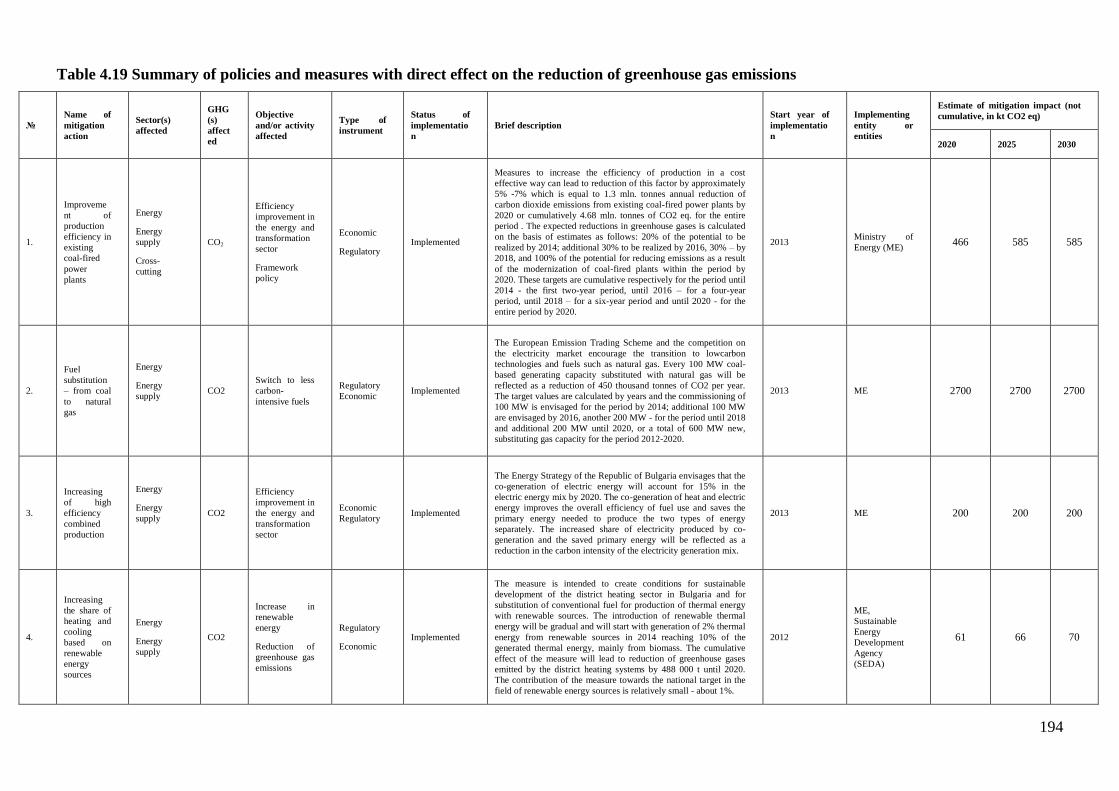
194
Table 4.19 Summary of policies and measures with direct effect on the reduction of greenhouse gas emissions
№
Name of
mitigation
action
Sector(s)
affected
GHG
(s)
affect
ed
Objective
and/or activity
affected
Type of
instrument
Status of
implementatio
n
Brief description
Start year of
implementatio
n
Implementing
entity or
entities
Estimate of mitigation impact (not
cumulative, in kt CO2 eq)
2020 2025 2030
1.
Improveme
nt of
production
efficiency in
existing
coal-fired
power
plants
Energy
Energy
supply
Cross-
cutting
CO2
Efficiency
improvement in
the energy and
transformation
sector
Framework
policy
Economic
Regulatory Implemented
Measures to increase the efficiency of production in a cost
effective way can lead to reduction of this factor by approximately
5% -7% which is equal to 1.3 mln. tonnes annual reduction of
carbon dioxide emissions from existing coal-fired power plants by
2020 or cumulatively 4.68 mln. tonnes of CO2 eq. for the entire
period . The expected reductions in greenhouse gases is calculated
on the basis of estimates as follows: 20% of the potential to be
realized by 2014; additional 30% to be realized by 2016, 30% – by
2018, and 100% of the potential for reducing emissions as a result
of the modernization of coal-fired plants within the period by
2020. These targets are cumulative respectively for the period until
2014 - the first two-year period, until 2016 – for a four-year
period, until 2018 – for a six-year period and until 2020 - for the
entire period by 2020.
2013 Ministry of
Energy (ME) 466 585 585
2.
Fuel
substitution
– from coal
to natural
gas
Energy
Energy
supply
CO2
Switch to less
carbon-
intensive fuels
Regulatory
Economic Implemented
The European Emission Trading Scheme and the competition on
the electricity market encourage the transition to lowcarbon
technologies and fuels such as natural gas. Every 100 MW coal-
based generating capacity substituted with natural gas will be
reflected as a reduction of 450 thousand tonnes of CO2 per year.
The target values are calculated by years and the commissioning of
100 MW is envisaged for the period by 2014; additional 100 MW
are envisaged by 2016, another 200 MW - for the period until 2018
and additional 200 MW until 2020, or a total of 600 MW new,
substituting gas capacity for the period 2012-2020.
2013 ME 2700 2700 2700
3.
Increasing
of high
efficiency
combined
production
Energy
Energy
supply
CO2
Efficiency
improvement in
the energy and
transformation
sector
Economic
Regulatory Implemented
The Energy Strategy of the Republic of Bulgaria envisages that the
co-generation of electric energy will account for 15% in the
electric energy mix by 2020. The co-generation of heat and electric
energy improves the overall efficiency of fuel use and saves the
primary energy needed to produce the two types of energy
separately. The increased share of electricity produced by co-
generation and the saved primary energy will be reflected as a
reduction in the carbon intensity of the electricity generation mix.
2013 ME 200 200 200
4.
Increasing
the share of
heating and
cooling
based on
renewable
energy
sources
Energy
Energy
supply
CO2
Increase in
renewable
energy
Reduction of
greenhouse gas
emissions
Regulatory
Economic Implemented
The measure is intended to create conditions for sustainable
development of the district heating sector in Bulgaria and for
substitution of conventional fuel for production of thermal energy
with renewable sources. The introduction of renewable thermal
energy will be gradual and will start with generation of 2% thermal
energy from renewable sources in 2014 reaching 10% of the
generated thermal energy, mainly from biomass. The cumulative
effect of the measure will lead to reduction of greenhouse gases
emitted by the district heating systems by 488 000 t until 2020.
The contribution of the measure towards the national target in the
field of renewable energy sources is relatively small - about 1%.
2012
ME,
Sustainable
Energy
Development
Agency
(SEDA)
61 66 70
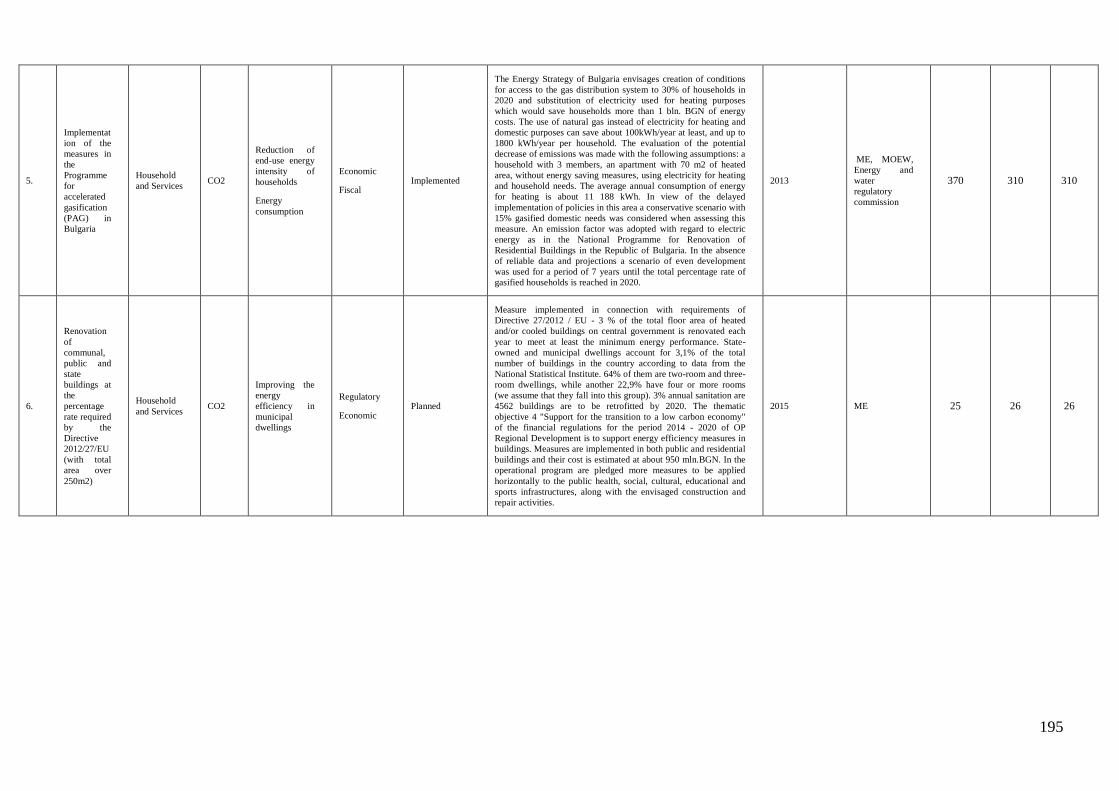
195
5.
Implementat
ion of the
measures in
the
Programme
for
accelerated
gasification
(PAG) in
Bulgaria
Household
and Services CO2
Reduction of
end-use energy
intensity of
households
Energy
consumption
Economic
Fiscal Implemented
The Energy Strategy of Bulgaria envisages creation of conditions
for access to the gas distribution system to 30% of households in
2020 and substitution of electricity used for heating purposes
which would save households more than 1 bln. BGN of energy
costs. The use of natural gas instead of electricity for heating and
domestic purposes can save about 100kWh/year at least, and up to
1800 kWh/year per household. The evaluation of the potential
decrease of emissions was made with the following assumptions: a
household with 3 members, an apartment with 70 m2 of heated
area, without energy saving measures, using electricity for heating
and household needs. The average annual consumption of energy
for heating is about 11 188 kWh. In view of the delayed
implementation of policies in this area a conservative scenario with
15% gasified domestic needs was considered when assessing this
measure. An emission factor was adopted with regard to electric
energy as in the National Programme for Renovation of
Residential Buildings in the Republic of Bulgaria. In the absence
of reliable data and projections a scenario of even development
was used for a period of 7 years until the total percentage rate of
gasified households is reached in 2020.
2013
ME, MOEW,
Energy and
water
regulatory
commission
370 310 310
6.
Renovation
of
communal,
public and
state
buildings at
the
percentage
rate required
by the
Directive
2012/27/EU
(with total
area over
250m2)
Household
and Services CO2
Improving the
energy
efficiency in
municipal
dwellings
Regulatory
Economic Planned
Measure implemented in connection with requirements of
Directive 27/2012 / EU - 3 % of the total floor area of heated
and/or cooled buildings on central government is renovated each
year to meet at least the minimum energy performance. State-
owned and municipal dwellings account for 3,1% of the total
number of buildings in the country according to data from the
National Statistical Institute. 64% of them are two-room and three-
room dwellings, while another 22,9% have four or more rooms
(we assume that they fall into this group). 3% annual sanitation are
4562 buildings are to be retrofitted by 2020. The thematic
objective 4 "Support for the transition to a low carbon economy"
of the financial regulations for the period 2014 - 2020 of OP
Regional Development is to support energy efficiency measures in
buildings. Measures are implemented in both public and residential
buildings and their cost is estimated at about 950 mln.BGN. In the
operational program are pledged more measures to be applied
horizontally to the public health, social, cultural, educational and
sports infrastructures, along with the envisaged construction and
repair activities.
2015 ME 25 26 26
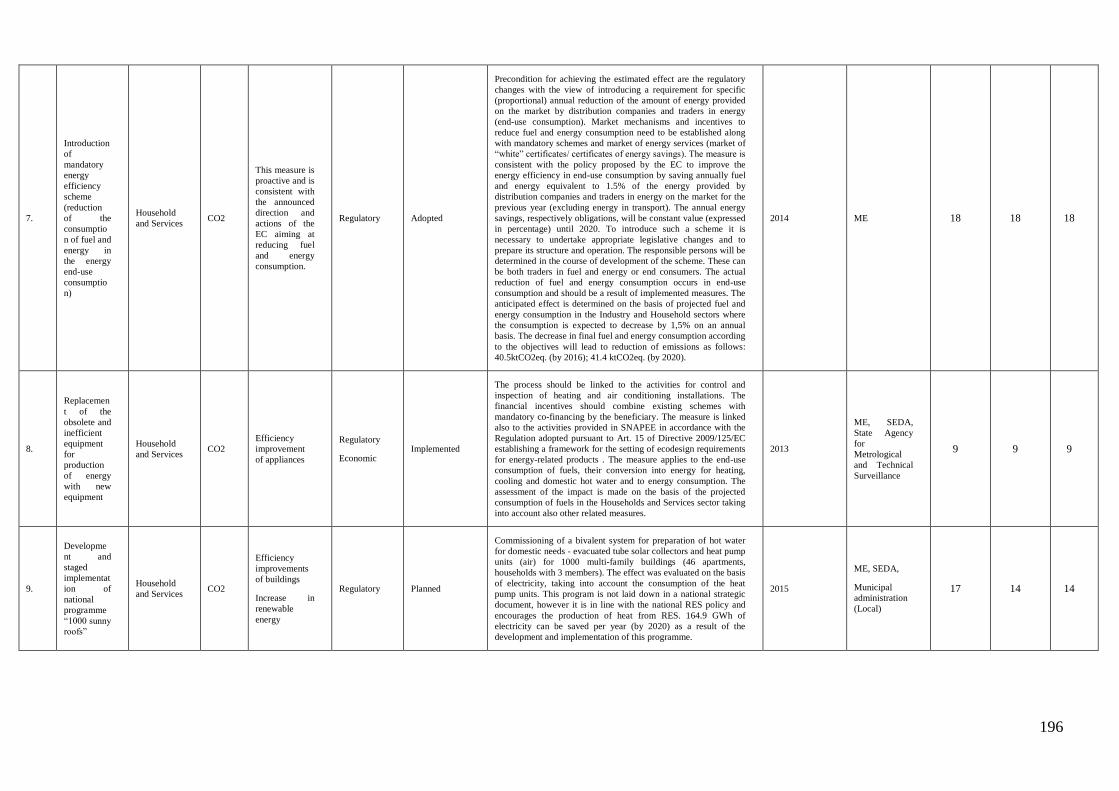
196
7.
Introduction
of
mandatory
energy
efficiency
scheme
(reduction
of the
consumptio
n of fuel and
energy in
the energy
end-use
consumptio
n)
Household
and Services CO2
This measure is
proactive and is
consistent with
the announced
direction and
actions of the
EC aiming at
reducing fuel
and energy
consumption.
Regulatory Adopted
Precondition for achieving the estimated effect are the regulatory
changes with the view of introducing a requirement for specific
(proportional) annual reduction of the amount of energy provided
on the market by distribution companies and traders in energy
(end-use consumption). Market mechanisms and incentives to
reduce fuel and energy consumption need to be established along
with mandatory schemes and market of energy services (market of
“white” certificates/ certificates of energy savings). The measure is
consistent with the policy proposed by the EC to improve the
energy efficiency in end-use consumption by saving annually fuel
and energy equivalent to 1.5% of the energy provided by
distribution companies and traders in energy on the market for the
previous year (excluding energy in transport). The annual energy
savings, respectively obligations, will be constant value (expressed
in percentage) until 2020. To introduce such a scheme it is
necessary to undertake appropriate legislative changes and to
prepare its structure and operation. The responsible persons will be
determined in the course of development of the scheme. These can
be both traders in fuel and energy or end consumers. The actual
reduction of fuel and energy consumption occurs in end-use
consumption and should be a result of implemented measures. The
anticipated effect is determined on the basis of projected fuel and
energy consumption in the Industry and Household sectors where
the consumption is expected to decrease by 1,5% on an annual
basis. The decrease in final fuel and energy consumption according
to the objectives will lead to reduction of emissions as follows:
40.5ktCO2eq. (by 2016); 41.4 ktCO2eq. (by 2020).
2014 ME 18 18 18
8.
Replacemen
t of the
obsolete and
inefficient
equipment
for
production
of energy
with new
equipment
Household
and Services CO2
Efficiency
improvement
of appliances
Regulatory
Economic Implemented
The process should be linked to the activities for control and
inspection of heating and air conditioning installations. The
financial incentives should combine existing schemes with
mandatory co-financing by the beneficiary. The measure is linked
also to the activities provided in SNAPEE in accordance with the
Regulation adopted pursuant to Art. 15 of Directive 2009/125/EC
establishing a framework for the setting of ecodesign requirements
for energy-related products . The measure applies to the end-use
consumption of fuels, their conversion into energy for heating,
cooling and domestic hot water and to energy consumption. The
assessment of the impact is made on the basis of the projected
consumption of fuels in the Households and Services sector taking
into account also other related measures.
2013
ME, SEDA,
State Agency
for
Metrological
and Technical
Surveillance
9 9 9
9.
Developme
nt and
staged
implementat
ion of
national
programme
“1000 sunny
roofs”
Household
and Services CO2
Efficiency
improvements
of buildings
Increase in
renewable
energy
Regulatory Planned
Commissioning of a bivalent system for preparation of hot water
for domestic needs - evacuated tube solar collectors and heat pump
units (air) for 1000 multi-family buildings (46 apartments,
households with 3 members). The effect was evaluated on the basis
of electricity, taking into account the consumption of the heat
pump units. This program is not laid down in a national strategic
document, however it is in line with the national RES policy and
encourages the production of heat from RES. 164.9 GWh of
electricity can be saved per year (by 2020) as a result of the
development and implementation of this programme.
2015
ME, SEDA,
Municipal
administration
(Local)
17 14 14
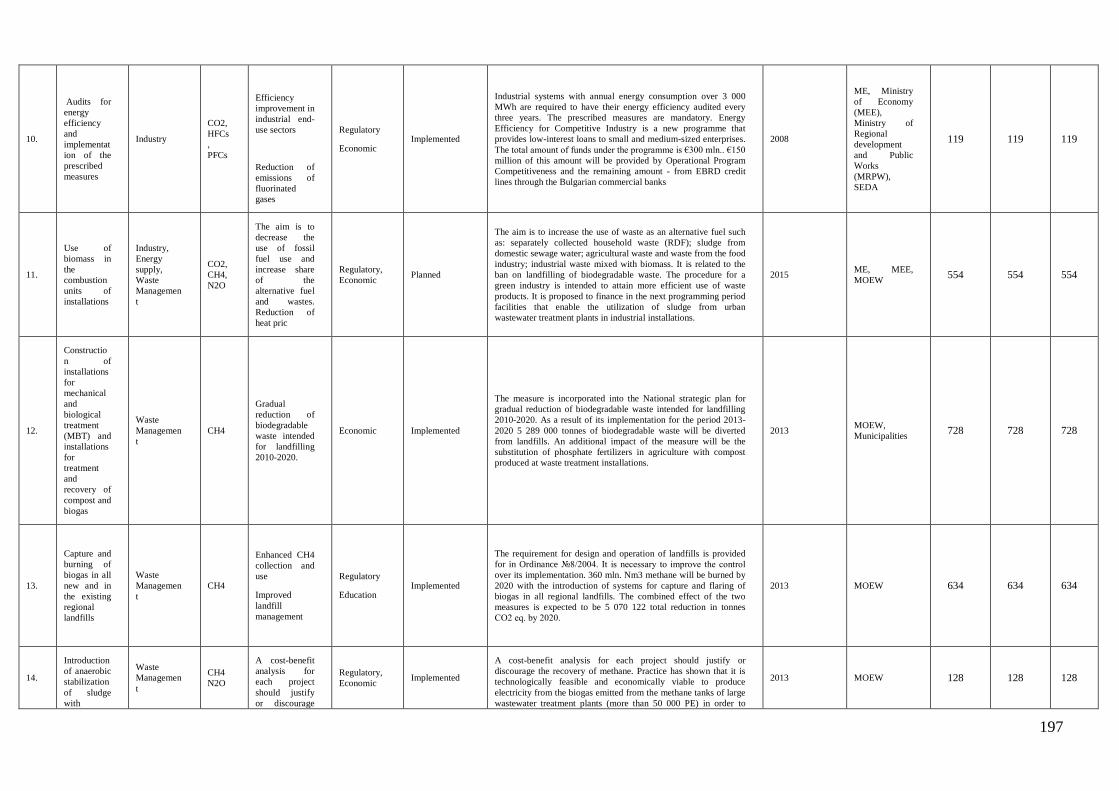
197
10.
Audits for
energy
efficiency
and
implementat
ion of the
prescribed
measures
Industry
CO2,
HFCs
,
PFCs
Efficiency
improvement in
industrial end-
use sectors
Reduction of
emissions of
fluorinated
gases
Regulatory
Economic Implemented
Industrial systems with annual energy consumption over 3 000
MWh are required to have their energy efficiency audited every
three years. The prescribed measures are mandatory. Energy
Efficiency for Competitive Industry is a new programme that
provides low-interest loans to small and medium-sized enterprises.
The total amount of funds under the programme is €300 mln.. €150
million of this amount will be provided by Operational Program
Competitiveness and the remaining amount - from EBRD credit
lines through the Bulgarian commercial banks
2008
ME, Ministry
of Economy
(MEE),
Ministry of
Regional
development
and Public
Works
(MRPW),
SEDA
119 119 119
11.
Use of
biomass in
the
combustion
units of
installations
Industry,
Energy
supply,
Waste
Managemen
t
CO2,
CH4,
N2O
The aim is to
decrease the
use of fossil
fuel use and
increase share
of the
alternative fuel
and wastes.
Reduction of
heat pric
Regulatory,
Economic Planned
The aim is to increase the use of waste as an alternative fuel such
as: separately collected household waste (RDF); sludge from
domestic sewage water; agricultural waste and waste from the food
industry; industrial waste mixed with biomass. It is related to the
ban on landfilling of biodegradable waste. The procedure for a
green industry is intended to attain more efficient use of waste
products. It is proposed to finance in the next programming period
facilities that enable the utilization of sludge from urban
wastewater treatment plants in industrial installations.
2015 ME, MEE,
MOEW 554 554 554
12.
Constructio
n of
installations
for
mechanical
and
biological
treatment
(MBT) and
installations
for
treatment
and
recovery of
compost and
biogas
Waste
Managemen
t
CH4
Gradual
reduction of
biodegradable
waste intended
for landfilling
2010-2020.
Economic Implemented
The measure is incorporated into the National strategic plan for
gradual reduction of biodegradable waste intended for landfilling
2010-2020. As a result of its implementation for the period 2013-
2020 5 289 000 tonnes of biodegradable waste will be diverted
from landfills. An additional impact of the measure will be the
substitution of phosphate fertilizers in agriculture with compost
produced at waste treatment installations.
2013 MOEW,
Municipalities 728 728 728
13.
Capture and
burning of
biogas in all
new and in
the existing
regional
landfills
Waste
Managemen
t
CH4
Enhanced CH4
collection and
use
Improved
landfill
management
Regulatory
Education Implemented
The requirement for design and operation of landfills is provided
for in Ordinance №8/2004. It is necessary to improve the control
over its implementation. 360 mln. Nm3 methane will be burned by
2020 with the introduction of systems for capture and flaring of
biogas in all regional landfills. The combined effect of the two
measures is expected to be 5 070 122 total reduction in tonnes
СО2 eq. by 2020.
2013 MOEW 634 634 634
14.
Introduction
of anaerobic
stabilization
of sludge
with
Waste
Managemen
t
CH4
N2O
A cost-benefit
analysis for
each project
should justify
or discourage
Regulatory,
Economic Implemented
A cost-benefit analysis for each project should justify or
discourage the recovery of methane. Practice has shown that it is
technologically feasible and economically viable to produce
electricity from the biogas emitted from the methane tanks of large
wastewater treatment plants (more than 50 000 PE) in order to
2013 MOEW 128 128 128
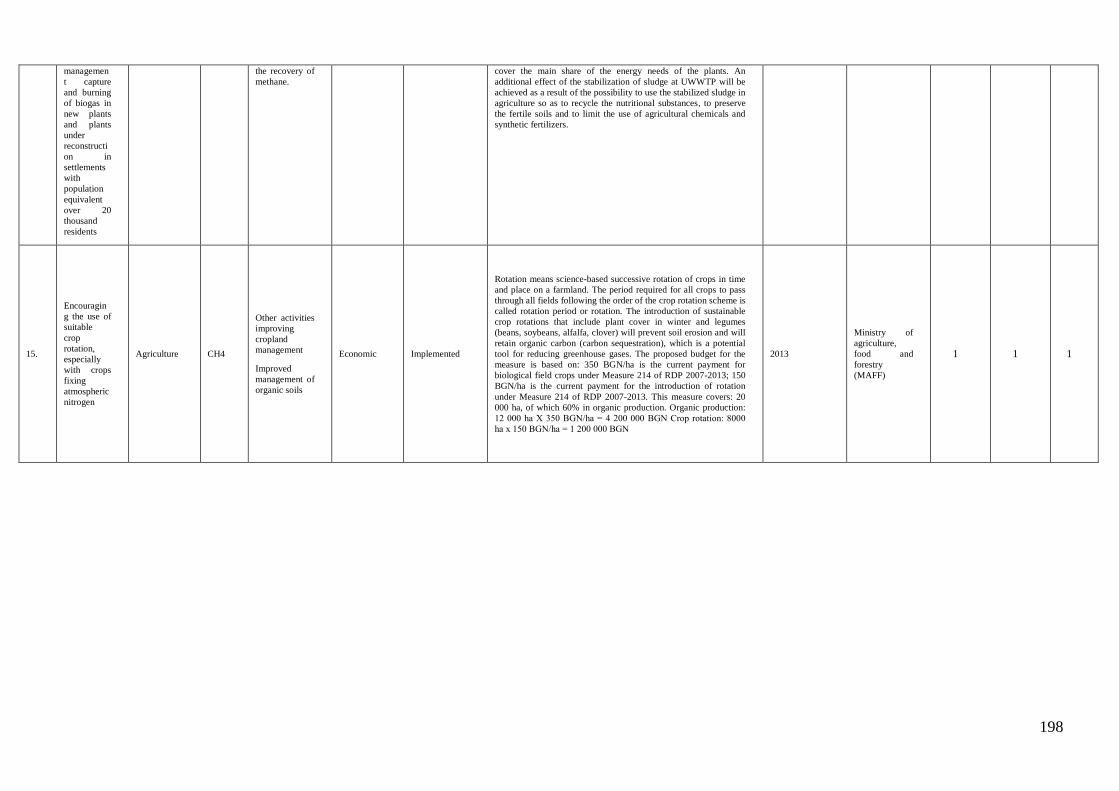
198
managemen
t capture
and burning
of biogas in
new plants
and plants
under
reconstructi
on in
settlements
with
population
equivalent
over 20
thousand
residents
the recovery of
methane.
cover the main share of the energy needs of the plants. An
additional effect of the stabilization of sludge at UWWTP will be
achieved as a result of the possibility to use the stabilized sludge in
agriculture so as to recycle the nutritional substances, to preserve
the fertile soils and to limit the use of agricultural chemicals and
synthetic fertilizers.
15.
Encouragin
g the use of
suitable
crop
rotation,
especially
with crops
fixing
atmospheric
nitrogen
Agriculture CH4
Other activities
improving
cropland
management
Improved
management of
organic soils
Economic Implemented
Rotation means science-based successive rotation of crops in time
and place on a farmland. The period required for all crops to pass
through all fields following the order of the crop rotation scheme is
called rotation period or rotation. The introduction of sustainable
crop rotations that include plant cover in winter and legumes
(beans, soybeans, alfalfa, clover) will prevent soil erosion and will
retain organic carbon (carbon sequestration), which is a potential
tool for reducing greenhouse gases. The proposed budget for the
measure is based on: 350 BGN/ha is the current payment for
biological field crops under Measure 214 of RDP 2007-2013; 150
BGN/ha is the current payment for the introduction of rotation
under Measure 214 of RDP 2007-2013. This measure covers: 20
000 ha, of which 60% in organic production. Organic production:
12 000 ha Х 350 BGN/ha = 4 200 000 BGN Crop rotation: 8000
ha х 150 BGN/ha = 1 200 000 BGN
2013
Ministry of
agriculture,
food and
forestry
(MAFF)
1 1 1
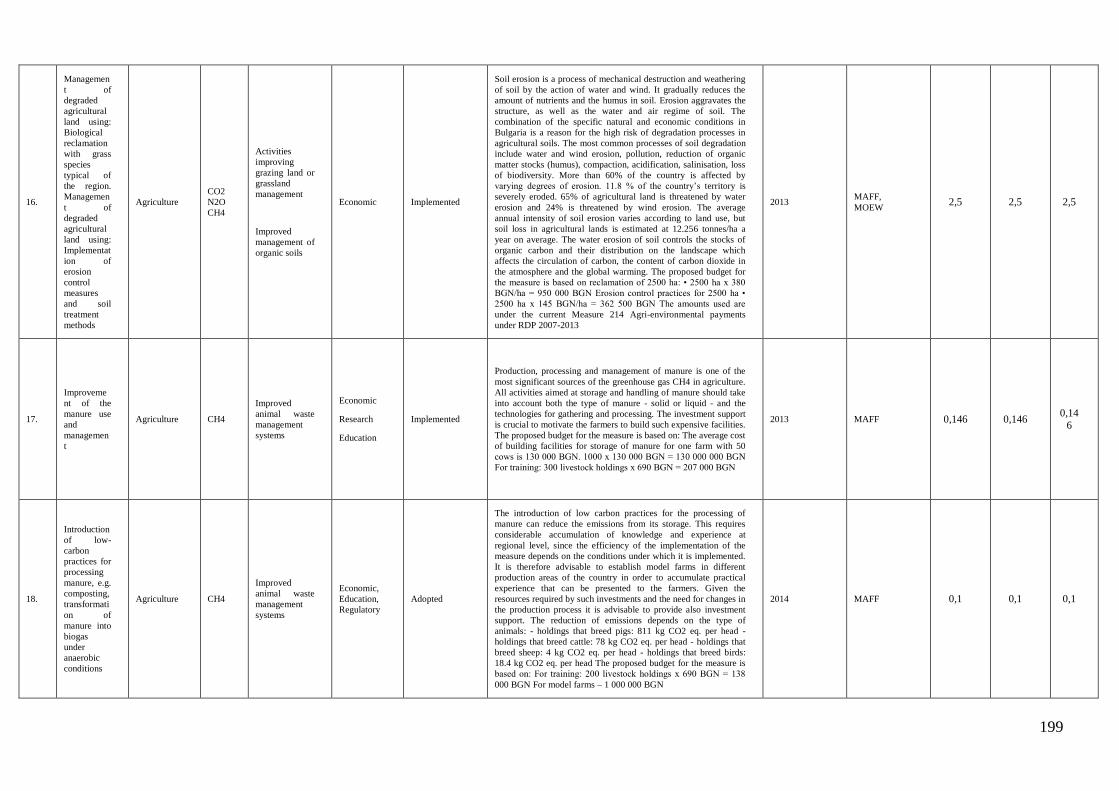
199
16.
Managemen
t of
degraded
agricultural
land using:
Biological
reclamation
with grass
species
typical of
the region.
Managemen
t of
degraded
agricultural
land using:
Implementat
ion of
erosion
control
measures
and soil
treatment
methods
Agriculture
CO2
N2O
CH4
Activities
improving
grazing land or
grassland
management
Improved
management of
organic soils
Economic Implemented
Soil erosion is a process of mechanical destruction and weathering
of soil by the action of water and wind. It gradually reduces the
amount of nutrients and the humus in soil. Erosion aggravates the
structure, as well as the water and air regime of soil. The
combination of the specific natural and economic conditions in
Bulgaria is a reason for the high risk of degradation processes in
agricultural soils. The most common processes of soil degradation
include water and wind erosion, pollution, reduction of organic
matter stocks (humus), compaction, acidification, salinisation, loss
of biodiversity. More than 60% of the country is affected by
varying degrees of erosion. 11.8 % of the country’s territory is
severely eroded. 65% of agricultural land is threatened by water
erosion and 24% is threatened by wind erosion. The average
annual intensity of soil erosion varies according to land use, but
soil loss in agricultural lands is estimated at 12.256 tonnes/ha a
year on average. The water erosion of soil controls the stocks of
organic carbon and their distribution on the landscape which
affects the circulation of carbon, the content of carbon dioxide in
the atmosphere and the global warming. The proposed budget for
the measure is based on reclamation of 2500 ha: • 2500 ha х 380
BGN/ha = 950 000 BGN Erosion control practices for 2500 ha •
2500 ha х 145 BGN/ha = 362 500 BGN The amounts used are
under the current Measure 214 Agri-environmental payments
under RDP 2007-2013
2013 MAFF,
MOEW 2,5 2,5 2,5
17.
Improveme
nt of the
manure use
and
managemen
t
Agriculture CH4
Improved
animal waste
management
systems
Economic
Research
Education
Implemented
Production, processing and management of manure is one of the
most significant sources of the greenhouse gas CH4 in agriculture.
All activities aimed at storage and handling of manure should take
into account both the type of manure - solid or liquid - and the
technologies for gathering and processing. The investment support
is crucial to motivate the farmers to build such expensive facilities.
The proposed budget for the measure is based on: The average cost
of building facilities for storage of manure for one farm with 50
cows is 130 000 BGN. 1000 х 130 000 BGN = 130 000 000 BGN
For training: 300 livestock holdings х 690 BGN = 207 000 BGN
2013 MAFF 0,146 0,146 0,14
6
18.
Introduction
of low-
carbon
practices for
processing
manure, e.g.
composting,
transformati
on of
manure into
biogas
under
anaerobic
conditions
Agriculture CH4
Improved
animal waste
management
systems
Economic,
Education,
Regulatory
Adopted
The introduction of low carbon practices for the processing of
manure can reduce the emissions from its storage. This requires
considerable accumulation of knowledge and experience at
regional level, since the efficiency of the implementation of the
measure depends on the conditions under which it is implemented.
It is therefore advisable to establish model farms in different
production areas of the country in order to accumulate practical
experience that can be presented to the farmers. Given the
resources required by such investments and the need for changes in
the production process it is advisable to provide also investment
support. The reduction of emissions depends on the type of
animals: - holdings that breed pigs: 811 kg CO2 eq. per head -
holdings that breed cattle: 78 kg CO2 eq. per head - holdings that
breed sheep: 4 kg CO2 eq. per head - holdings that breed birds:
18.4 kg CO2 eq. per head The proposed budget for the measure is
based on: For training: 200 livestock holdings х 690 BGN = 138
000 BGN For model farms – 1 000 000 BGN
2014 MAFF 0,1 0,1 0,1
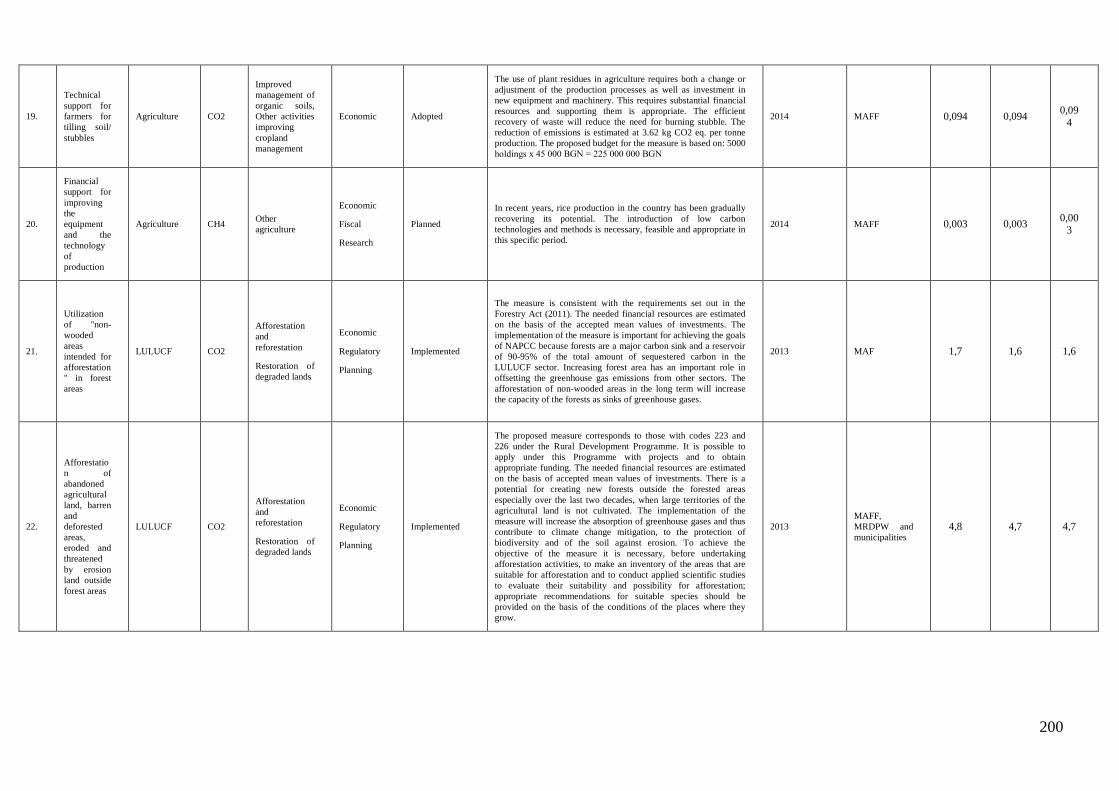
200
19.
Technical
support for
farmers for
tilling soil/
stubbles
Agriculture CO2
Improved
management of
organic soils,
Other activities
improving
cropland
management
Economic Adopted
The use of plant residues in agriculture requires both a change or
adjustment of the production processes as well as investment in
new equipment and machinery. This requires substantial financial
resources and supporting them is appropriate. The efficient
recovery of waste will reduce the need for burning stubble. The
reduction of emissions is estimated at 3.62 kg CO2 eq. per tonne
production. The proposed budget for the measure is based on: 5000
holdings х 45 000 BGN = 225 000 000 BGN
2014 MAFF 0,094 0,094 0,09
4
20.
Financial
support for
improving
the
equipment
and the
technology
of
production
Agriculture CH4 Other
agriculture
Economic
Fiscal
Research
Planned
In recent years, rice production in the country has been gradually
recovering its potential. The introduction of low carbon
technologies and methods is necessary, feasible and appropriate in
this specific period.
2014 MAFF 0,003 0,003 0,00
3
21.
Utilization
of "non-
wooded
areas
intended for
afforestation
" in forest
areas
LULUCF CO2
Afforestation
and
reforestation
Restoration of
degraded lands
Economic
Regulatory
Planning
Implemented
The measure is consistent with the requirements set out in the
Forestry Act (2011). The needed financial resources are estimated
on the basis of the accepted mean values of investments. The
implementation of the measure is important for achieving the goals
of NAPCC because forests are a major carbon sink and a reservoir
of 90-95% of the total amount of sequestered carbon in the
LULUCF sector. Increasing forest area has an important role in
offsetting the greenhouse gas emissions from other sectors. The
afforestation of non-wooded areas in the long term will increase
the capacity of the forests as sinks of greenhouse gases.
2013 MAF 1,7 1,6 1,6
22.
Afforestatio
n of
abandoned
agricultural
land, barren
and
deforested
areas,
eroded and
threatened
by erosion
land outside
forest areas
LULUCF CO2
Afforestation
and
reforestation
Restoration of
degraded lands
Economic
Regulatory
Planning
Implemented
The proposed measure corresponds to those with codes 223 and
226 under the Rural Development Programme. It is possible to
apply under this Programme with projects and to obtain
appropriate funding. The needed financial resources are estimated
on the basis of accepted mean values of investments. There is a
potential for creating new forests outside the forested areas
especially over the last two decades, when large territories of the
agricultural land is not cultivated. The implementation of the
measure will increase the absorption of greenhouse gases and thus
contribute to climate change mitigation, to the protection of
biodiversity and of the soil against erosion. To achieve the
objective of the measure it is necessary, before undertaking
afforestation activities, to make an inventory of the areas that are
suitable for afforestation and to conduct applied scientific studies
to evaluate their suitability and possibility for afforestation;
appropriate recommendations for suitable species should be
provided on the basis of the conditions of the places where they
grow.
2013
MAFF,
MRDPW and
municipalities 4,8 4,7 4,7
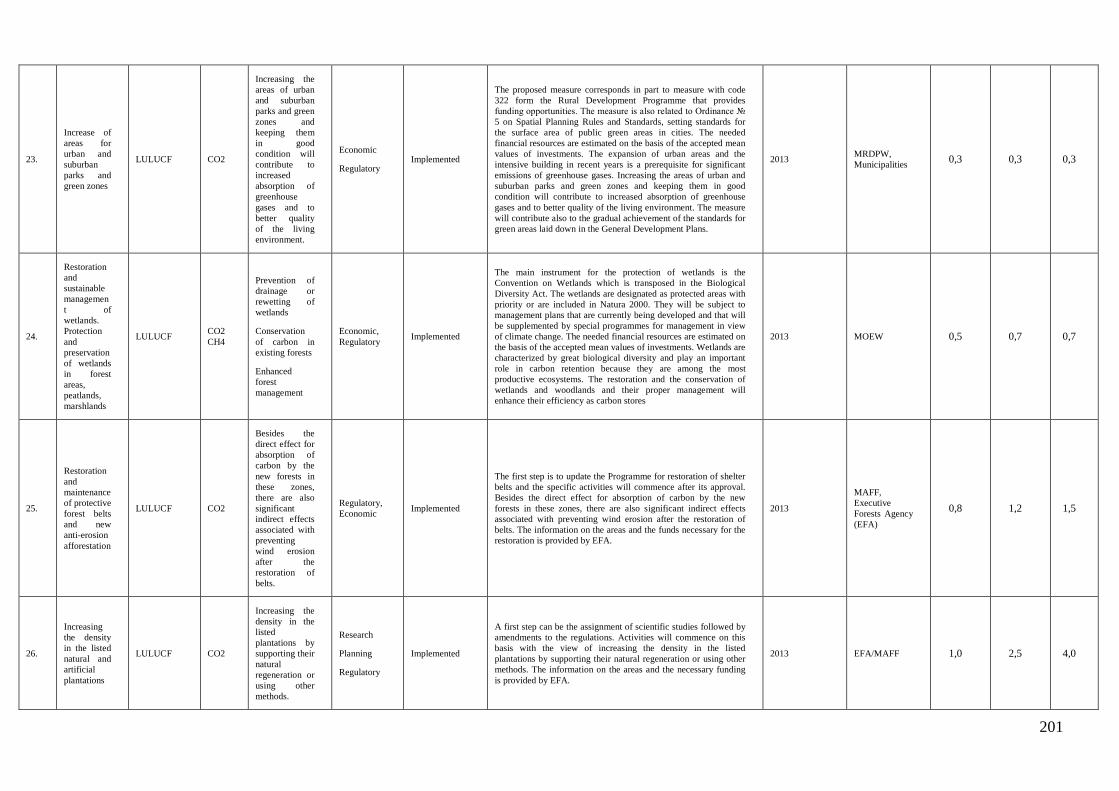
201
23.
Increase of
areas for
urban and
suburban
parks and
green zones
LULUCF CO2
Increasing the
areas of urban
and suburban
parks and green
zones and
keeping them
in good
condition will
contribute to
increased
absorption of
greenhouse
gases and to
better quality
of the living
environment.
Economic
Regulatory Implemented
The proposed measure corresponds in part to measure with code
322 form the Rural Development Programme that provides
funding opportunities. The measure is also related to Ordinance №
5 on Spatial Planning Rules and Standards, setting standards for
the surface area of public green areas in cities. The needed
financial resources are estimated on the basis of the accepted mean
values of investments. The expansion of urban areas and the
intensive building in recent years is a prerequisite for significant
emissions of greenhouse gases. Increasing the areas of urban and
suburban parks and green zones and keeping them in good
condition will contribute to increased absorption of greenhouse
gases and to better quality of the living environment. The measure
will contribute also to the gradual achievement of the standards for
green areas laid down in the General Development Plans.
2013 MRDPW,
Municipalities 0,3 0,3 0,3
24.
Restoration
and
sustainable
managemen
t of
wetlands.
Protection
and
preservation
of wetlands
in forest
areas,
peatlands,
marshlands
LULUCF CO2
CH4
Prevention of
drainage or
rewetting of
wetlands
Conservation
of carbon in
existing forests
Enhanced
forest
management
Economic,
Regulatory Implemented
The main instrument for the protection of wetlands is the
Convention on Wetlands which is transposed in the Biological
Diversity Act. The wetlands are designated as protected areas with
priority or are included in Natura 2000. They will be subject to
management plans that are currently being developed and that will
be supplemented by special programmes for management in view
of climate change. The needed financial resources are estimated on
the basis of the accepted mean values of investments. Wetlands are
characterized by great biological diversity and play an important
role in carbon retention because they are among the most
productive ecosystems. The restoration and the conservation of
wetlands and woodlands and their proper management will
enhance their efficiency as carbon stores
2013 MOEW 0,5 0,7 0,7
25.
Restoration
and
maintenance
of protective
forest belts
and new
anti-erosion
afforestation
LULUCF CO2
Besides the
direct effect for
absorption of
carbon by the
new forests in
these zones,
there are also
significant
indirect effects
associated with
preventing
wind erosion
after the
restoration of
belts.
Regulatory,
Economic Implemented
The first step is to update the Programme for restoration of shelter
belts and the specific activities will commence after its approval.
Besides the direct effect for absorption of carbon by the new
forests in these zones, there are also significant indirect effects
associated with preventing wind erosion after the restoration of
belts. The information on the areas and the funds necessary for the
restoration is provided by EFA.
2013
MAFF,
Executive
Forests Agency
(EFA)
0,8 1,2 1,5
26.
Increasing
the density
in the listed
natural and
artificial
plantations
LULUCF CO2
Increasing the
density in the
listed
plantations by
supporting their
natural
regeneration or
using other
methods.
Research
Planning
Regulatory
Implemented
A first step can be the assignment of scientific studies followed by
amendments to the regulations. Activities will commence on this
basis with the view of increasing the density in the listed
plantations by supporting their natural regeneration or using other
methods. The information on the areas and the necessary funding
is provided by EFA.
2013 EFA/MAFF 1,0 2,5 4,0
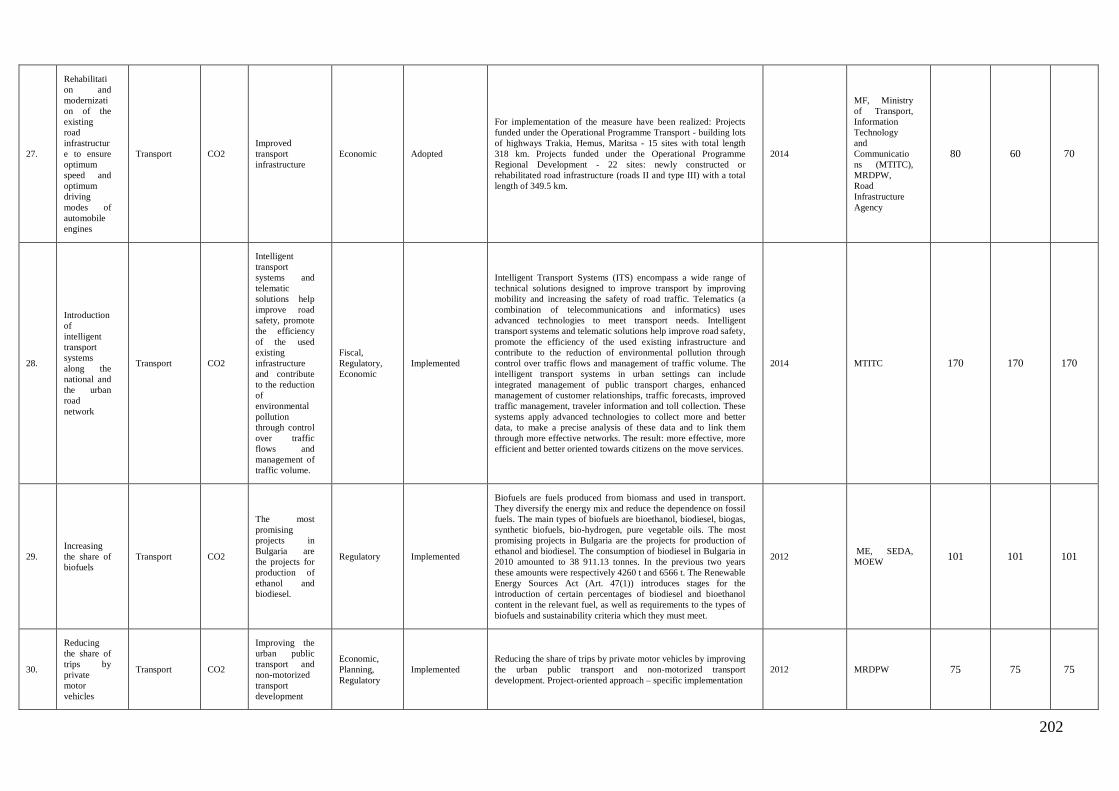
202
27.
Rehabilitati
on and
modernizati
on of the
existing
road
infrastructur
e to ensure
optimum
speed and
optimum
driving
modes of
automobile
engines
Transport CO2
Improved
transport
infrastructure
Economic Adopted
For implementation of the measure have been realized: Projects
funded under the Operational Programme Transport - building lots
of highways Trakia, Hemus, Maritsa - 15 sites with total length
318 km. Projects funded under the Operational Programme
Regional Development - 22 sites: newly constructed or
rehabilitated road infrastructure (roads II and type III) with a total
length of 349.5 km.
2014
MF, Ministry
of Transport,
Information
Technology
and
Communicatio
ns (MTITC),
MRDPW,
Road
Infrastructure
Agency
80 60 70
28.
Introduction
of
intelligent
transport
systems
along the
national and
the urban
road
network
Transport CO2
Intelligent
transport
systems and
telematic
solutions help
improve road
safety, promote
the efficiency
of the used
existing
infrastructure
and contribute
to the reduction
of
environmental
pollution
through control
over traffic
flows and
management of
traffic volume.
Fiscal,
Regulatory,
Economic
Implemented
Intelligent Transport Systems (ITS) encompass a wide range of
technical solutions designed to improve transport by improving
mobility and increasing the safety of road traffic. Telematics (a
combination of telecommunications and informatics) uses
advanced technologies to meet transport needs. Intelligent
transport systems and telematic solutions help improve road safety,
promote the efficiency of the used existing infrastructure and
contribute to the reduction of environmental pollution through
control over traffic flows and management of traffic volume. The
intelligent transport systems in urban settings can include
integrated management of public transport charges, enhanced
management of customer relationships, traffic forecasts, improved
traffic management, traveler information and toll collection. These
systems apply advanced technologies to collect more and better
data, to make a precise analysis of these data and to link them
through more effective networks. The result: more effective, more
efficient and better oriented towards citizens on the move services.
2014 MTITC 170 170 170
29.
Increasing
the share of
biofuels
Transport CO2
The most
promising
projects in
Bulgaria are
the projects for
production of
ethanol and
biodiesel.
Regulatory Implemented
Biofuels are fuels produced from biomass and used in transport.
They diversify the energy mix and reduce the dependence on fossil
fuels. The main types of biofuels are bioethanol, biodiesel, biogas,
synthetic biofuels, bio-hydrogen, pure vegetable oils. The most
promising projects in Bulgaria are the projects for production of
ethanol and biodiesel. The consumption of biodiesel in Bulgaria in
2010 amounted to 38 911.13 tonnes. In the previous two years
these amounts were respectively 4260 t and 6566 t. The Renewable
Energy Sources Act (Art. 47(1)) introduces stages for the
introduction of certain percentages of biodiesel and bioethanol
content in the relevant fuel, as well as requirements to the types of
biofuels and sustainability criteria which they must meet.
2012 ME, SEDA,
MOEW 101 101 101
30.
Reducing
the share of
trips by
private
motor
vehicles
Transport CO2
Improving the
urban public
transport and
non-motorized
transport
development
Economic,
Planning,
Regulatory
Implemented
Reducing the share of trips by private motor vehicles by improving
the urban public transport and non-motorized transport
development. Project-oriented approach – specific implementation
2012 MRDPW 75 75 75
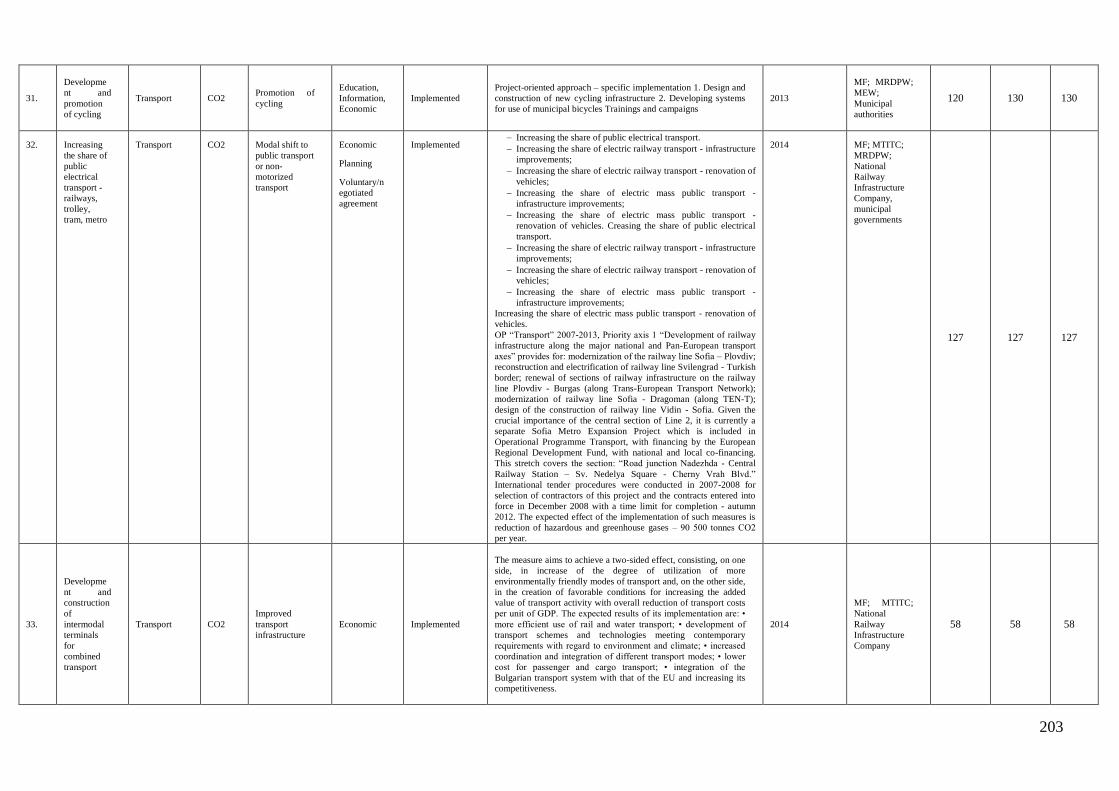
203
31.
Developme
nt and
promotion
of cycling
Transport CO2 Promotion of
cycling
Education,
Information,
Economic
Implemented
Project-oriented approach – specific implementation 1. Design and
construction of new cycling infrastructure 2. Developing systems
for use of municipal bicycles Trainings and campaigns
2013
MF; MRDPW;
MEW;
Municipal
authorities
120 130 130
32. Increasing
the share of
public
electrical
transport -
railways,
trolley,
tram, metro
Transport CO2 Modal shift to
public transport
or non-
motorized
transport
Economic
Planning
Voluntary/n
egotiated
agreement
Implemented Increasing the share of public electrical transport.
Increasing the share of electric railway transport - infrastructure
improvements;
Increasing the share of electric railway transport - renovation of
vehicles;
Increasing the share of electric mass public transport -
infrastructure improvements;
Increasing the share of electric mass public transport -
renovation of vehicles. Creasing the share of public electrical
transport.
Increasing the share of electric railway transport - infrastructure
improvements;
Increasing the share of electric railway transport - renovation of
vehicles;
Increasing the share of electric mass public transport -
infrastructure improvements;
Increasing the share of electric mass public transport - renovation of
vehicles.
OP “Transport” 2007-2013, Priority axis 1 “Development of railway
infrastructure along the major national and Pan-European transport
axes” provides for: modernization of the railway line Sofia – Plovdiv;
reconstruction and electrification of railway line Svilengrad - Turkish
border; renewal of sections of railway infrastructure on the railway
line Plovdiv - Burgas (along Trans-European Transport Network);
modernization of railway line Sofia - Dragoman (along TEN-T);
design of the construction of railway line Vidin - Sofia. Given the
crucial importance of the central section of Line 2, it is currently a
separate Sofia Metro Expansion Project which is included in
Operational Programme Transport, with financing by the European
Regional Development Fund, with national and local co-financing.
This stretch covers the section: “Road junction Nadezhda - Central
Railway Station – Sv. Nedelya Square - Cherny Vrah Blvd.”
International tender procedures were conducted in 2007-2008 for
selection of contractors of this project and the contracts entered into
force in December 2008 with a time limit for completion - autumn
2012. The expected effect of the implementation of such measures is
reduction of hazardous and greenhouse gases – 90 500 tonnes СО2
per year.
2014 MF; MTITC;
MRDPW;
National
Railway
Infrastructure
Company,
municipal
governments
127 127 127
33.
Developme
nt and
construction
of
intermodal
terminals
for
combined
transport
Transport CO2
Improved
transport
infrastructure
Economic Implemented
The measure aims to achieve a two-sided effect, consisting, on one
side, in increase of the degree of utilization of more
environmentally friendly modes of transport and, on the other side,
in the creation of favorable conditions for increasing the added
value of transport activity with overall reduction of transport costs
per unit of GDP. The expected results of its implementation are: •
more efficient use of rail and water transport; • development of
transport schemes and technologies meeting contemporary
requirements with regard to environment and climate; • increased
coordination and integration of different transport modes; • lower
cost for passenger and cargo transport; • integration of the
Bulgarian transport system with that of the EU and increasing its
competitiveness.
2014
MF; MTITC;
National
Railway
Infrastructure
Company
58 58 58
204
4.6. Policies and measures pursuant to Article 2 of the Kyoto Protocol
Activities aimed at promoting decisions by the ICAO and IMO in favour of emissions
reduction
The Parties to the Kyoto Protocol have committed themselves to continuing their efforts to
limit or reduce emissions from air and sea transports in the framework of the International Civil
Aviation Organisation (ICAO) and the International Maritime Organisation (IMO) (to date,
quantitative reduction obligations only for Annex 1). To date, neither of the two bodies has
approved regulations / procedures for limiting greenhouse-gas emissions.
IMO
The IMO deals with GHG-emissions issues via its Maritime Environmental Protection
Committee (MEPC).
The EU Commission has announced that it will propose relevant measures of its own if the
IMO fails, by the end of 2011, to make a concrete proposal for ways of including maritime
transports in reduction measures. Currently, the EU is having various relevant possibilities
studied, including emissions-differentiated port fees, emissions standards, levies and emission
trading.
In April 2015, an EU regulation was adopted on the monitoring, reporting and verification of
carbon dioxide emissions from maritime transport. The regulation take effect 1 January 2018
and will apply to all ships above 5,000 gross tonnes in respect to their CO2 emissions during
their voyages to and from ports in the EU. Bulgaria is in the process of implementing this
regulation. In the IMO, a similar mandatory data collection system for fuel consumption, as
well as other additional specified data, was adopted in October 2016. This regulation is
expected to enter into force on 1 March 2018 and applies to all ships in the world above 5,000
gross tonnes. These ships account for approximately 85 % of CO2 emissions from international
shipping.
The mandatory data collection system is intended to be the IMO’s first step in a three-step
approach to decrease greenhouse gas emissions from shipping. The second step will be to
analyse the data collected, which will provide the basis for the third step: further measures to
enhance energy efficiency and address greenhouse gas emissions from international shipping.
ICAO
The International Civil Aviation Organisation (ICAO) considers environmental aspects within
the framework of its Committee on Aviation Environmental Protection (CAEP), which
comprises a range of different working groups. To deal with greenhouse-gas issues, the ICAO
has also established a Group on International Aviation and Climate Change (GIACC),
alongside the CAEP. That group has been in existence since early 2008. A politically high-
ranking group, the GIACC turns to the CAEP for advice on technical matters whenever the
GIACC's members deem such reliance to be necessary. The group is working toward the aim of
developing a strategy, by mid-2016, for limiting aviation-related CO2 emissions.
While the ICAO is working on a CO2-based certification standard, such a standard would not
address air-transport growth and would require decades to make an impact, via the composition
of aircraft fleets. Along with such technical measures, the CAEP is also considering market-
economic instruments. A central focus of such efforts is on linking existing emission trading
schemes with mechanisms for offsetting emissions.
205
Since the beginning of 2012, emissions from international aviation are included in the EU
Emissions Trading System (EU ETS). Like industrial installations covered by the EU ETS,
airlines receive tradable allowances covering a certain level of CO2 emissions from their flights
per year. The legislation, adopted in 2008, applies to EU and non-EU airlines alike. Emissions
from flights to and from Iceland, Liechtenstein and Norway are also covered.
In April 2013 the EU temporarily suspended enforcement of the EU ETS requirements for
flights operated from or to non-European countries, while continuing to apply the legislation to
flights within and between countries in Europe. The EU took this initiative to allow time for the
International Civil Aviation Organization (ICAO) Assembly in autumn 2013 to reach a global
agreement to tackle aviation emissions – something Europe has been seeking for more than 15
years.
In October 2013 the EU's hard work paid off when the ICAO Assembly agreed to develop by
2016 global market-based mechanism (MBM) addressing international aviation emissions and
apply it by 2020. Until then countries or groups of countries, such as the EU, can implement
interim measures.
In response to the ICAO outcome and to give further momentum to the global
discussions, the European Commission proposed amending the EU ETS so that only the part of
a flight that takes place in European regional airspace is covered by the EU ETS.
In March 2014 the Council of the EU and European Parliament reached agreement to limit the
aviation coverage of the EU ETS to emissions from flights within the European Economic Area
(EEA) for the period from 2013 to 2016. This applies to all (also third country) aircraft
operators. The European Parliament voted in favour of this agreement on 3 April 2014.
In September 2016 ICAO decided to implement a global measure, the Carbon Offsetting and
Reduction Scheme for International Aviation (CORSIA). Sweden is among the nations that
have voluntarily participated in the scheme from its outset.
The EU ETS regulation was amended with an exemption in 2014 so that up until 31 December
2016 the scheme only covered intra-EU/EEA flights. Following the ICAO Assembly in 2016,
the EU Commission is revisiting the EU ETS regulation due to the decision on the global
market-based measure.
4.7. Information on minimization of adverse effects (including adverse
effects of climate change) on developing countries in the
implementation of policies and measures
The implemented and planned for implementation policies and measures have no adverse
impact on developing countries.
Republic of Bulgaria’s Roadmap for participation in the international development assistance
delineates the country’s geographic priorities for projects sponsorship. States that are
geographically closely situated are identified as the most appropriate beneficiaries - Armenia,
Former Yugoslav Republic of Macedonia, Moldova, Kosovo, Serbia and Georgia.
Moreover, since the Bulgarian contribution is not large enough to allow the execution of an
independent project, the Ministry of Environment and Water has decided to sponsor an “off-
the-shelf” project which allows a certain degree of customization.
Taking into consideration Bulgarian foreign policy priorities and a proposal by the Ministry of
Finance, the Ministry of Environment and Water contacted United Nations Development
206
program with the goal of identifying a project which fulfils the aims of EU Fast Start Financing
initiative.
After a period of prolonged negotiations the project “Bulgarian Fast Start Finance Contribution
2011-2012: Utilizing Bulgarian Experience in the Development of Administrative Capacity for
the Conduct of Monitoring, Reporting and Verification of Greenhouse Gas Emissions” was
acknowledged as the best available mean of delivering Bulgaria’s FSF contribution.
The main aim of the project is to support the implementation process of the EU Directives
2003/87/EC and 2009/29/EC in Former Yugoslav Republic of Macedonia by utilizing
Bulgarian expertise and capitalizing on best practices and lessons learned of Republic of
Bulgaria in the field of monitoring, reporting and verification of greenhouse gas emissions as
well as emission trading. This is achieved through direct interaction between the Ministries of
Environment in the two countries and information exchange between the national and
Bulgarian institutions and experts.
It is expected that the project will contribute to achieving national consensus on the actions and
measures that need to be undertaken to address the climate change related issues relevant for
the country in regards to the EU ETS on a short and long term. This should also open dialogues
on the need for allocation of adequate financial means for realization of the agreed actions and
measures.
4.8. Policies and measures no longer in place
The following measures have not been implemented and have not been considered for the
calculation of the GHG projections in the current report:
1) Financial support for improving the equipment and the technology of production in rice
fields.
2) Introduction of low-carbon practices for processing manure, eg. composting,
transformation of manure into biogas under anaerobic conditions
3) Transports dispatching system – The measure was implemented
4) Introduction of railway transport power dispatching system
5) Reconstruction and modernization of the existing railway infrastructure to ensure
optimum speed and optimum driving mode
6) Transports cargo dispatching system - The measure is implemented
7) Modernization of Railway transport - The measure is implemented
8) Improvement of Manure use and management - Some projects was implemented.
Campaigns, workshops and training sessions for good practices have taken place.
9) Improvement of the operation of NPP-Kozloduy – The measure is implemented
10) Construction of hydro cascade Gorna Arda and Sredna Vucha - The projects are
implemented under Memorandum of understanding regarding bilateral cooperation for
the realization of Joint Implementation.
11) Construction of small and micro HPP in different country regions - A number of
applications for the construction of small and micro HPP has built
207
12) Upgrading of cogeneration plants and district heating boilers by natural gas turbines -
During the reporting period the operation of following small cogeneration plants were
established: gas fired turbine in “Biovet”- Peshtera; Toplofikacia- Pleven and
Toplofikacia Veliko Tarnovo
13) 13) Gas supply to households Households and public buildings - Several gas
supply networks are constructed. A number of schools are under gasification. Due to the
high price of gas the residential sector is with low rates.
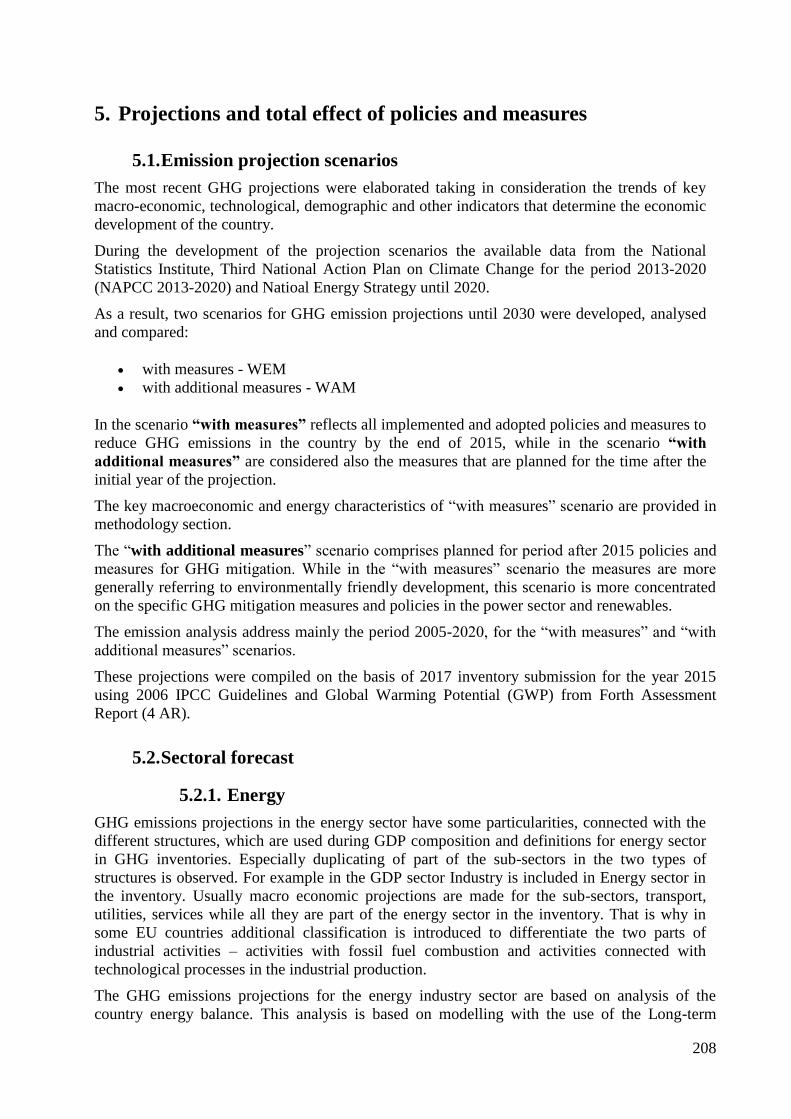
208
5. Projections and total effect of policies and measures
5.1. Emission projection scenarios
The most recent GHG projections were elaborated taking in consideration the trends of key
macro-economic, technological, demographic and other indicators that determine the economic
development of the country.
During the development of the projection scenarios the available data from the National
Statistics Institute, Third National Action Plan on Climate Change for the period 2013-2020
(NAPCC 2013-2020) and Natioal Energy Strategy until 2020.
As a result, two scenarios for GHG emission projections until 2030 were developed, analysed
and compared:
with measures - WEM
with additional measures - WAM
In the scenario “with measures” reflects all implemented and adopted policies and measures to
reduce GHG emissions in the country by the end of 2015, while in the scenario “with
additional measures” are considered also the measures that are planned for the time after the
initial year of the projection.
The key macroeconomic and energy characteristics of “with measures” scenario are provided in
methodology section.
The “with additional measures” scenario comprises planned for period after 2015 policies and
measures for GHG mitigation. While in the “with measures” scenario the measures are more
generally referring to environmentally friendly development, this scenario is more concentrated
on the specific GHG mitigation measures and policies in the power sector and renewables.
The emission analysis address mainly the period 2005-2020, for the “with measures” and “with
additional measures” scenarios.
These projections were compiled on the basis of 2017 inventory submission for the year 2015
using 2006 IPCC Guidelines and Global Warming Potential (GWP) from Forth Assessment
Report (4 AR).
5.2. Sectoral forecast
5.2.1. Energy
GHG emissions projections in the energy sector have some particularities, connected with the
different structures, which are used during GDP composition and definitions for energy sector
in GHG inventories. Especially duplicating of part of the sub-sectors in the two types of
structures is observed. For example in the GDP sector Industry is included in Energy sector in
the inventory. Usually macro economic projections are made for the sub-sectors, transport,
utilities, services while all they are part of the energy sector in the inventory. That is why in
some EU countries additional classification is introduced to differentiate the two parts of
industrial activities – activities with fossil fuel combustion and activities connected with
technological processes in the industrial production.
The GHG emissions projections for the energy industry sector are based on analysis of the
country energy balance. This analysis is based on modelling with the use of the Long-term
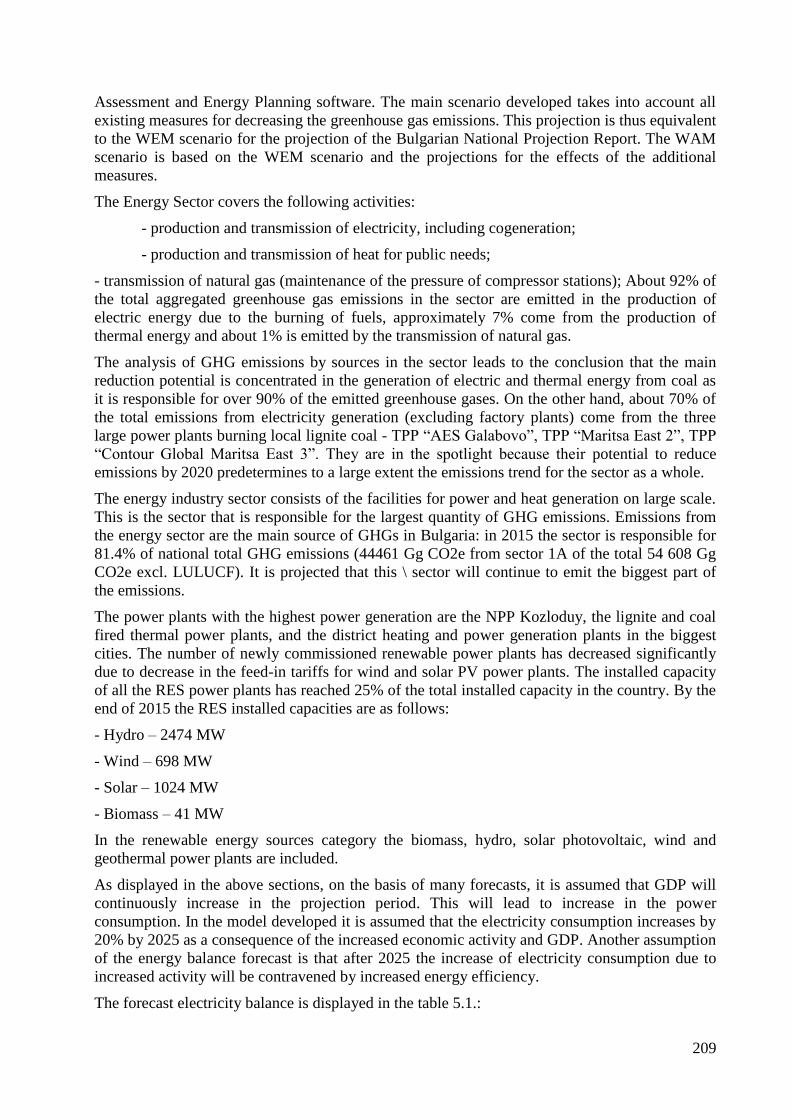
209
Assessment and Energy Planning software. The main scenario developed takes into account all
existing measures for decreasing the greenhouse gas emissions. This projection is thus equivalent
to the WEM scenario for the projection of the Bulgarian National Projection Report. The WAM
scenario is based on the WEM scenario and the projections for the effects of the additional
measures.
The Energy Sector covers the following activities:
- production and transmission of electricity, including cogeneration;
- production and transmission of heat for public needs;
- transmission of natural gas (maintenance of the pressure of compressor stations); About 92% of
the total aggregated greenhouse gas emissions in the sector are emitted in the production of
electric energy due to the burning of fuels, approximately 7% come from the production of
thermal energy and about 1% is emitted by the transmission of natural gas.
The analysis of GHG emissions by sources in the sector leads to the conclusion that the main
reduction potential is concentrated in the generation of electric and thermal energy from coal as
it is responsible for over 90% of the emitted greenhouse gases. On the other hand, about 70% of
the total emissions from electricity generation (excluding factory plants) come from the three
large power plants burning local lignite coal - TPP “AES Galabovo”, TPP “Maritsa East 2”, TPP
“Contour Global Maritsa East 3”. They are in the spotlight because their potential to reduce
emissions by 2020 predetermines to a large extent the emissions trend for the sector as a whole.
The energy industry sector consists of the facilities for power and heat generation on large scale.
This is the sector that is responsible for the largest quantity of GHG emissions. Emissions from
the energy sector are the main source of GHGs in Bulgaria: in 2015 the sector is responsible for
81.4% of national total GHG emissions (44461 Gg CO2e from sector 1A of the total 54 608 Gg
CO2e excl. LULUCF). It is projected that this \ sector will continue to emit the biggest part of
the emissions.
The power plants with the highest power generation are the NPP Kozloduy, the lignite and coal
fired thermal power plants, and the district heating and power generation plants in the biggest
cities. The number of newly commissioned renewable power plants has decreased significantly
due to decrease in the feed-in tariffs for wind and solar PV power plants. The installed capacity
of all the RES power plants has reached 25% of the total installed capacity in the country. By the
end of 2015 the RES installed capacities are as follows:
- Hydro – 2474 MW
- Wind – 698 MW
- Solar – 1024 MW
- Biomass – 41 MW
In the renewable energy sources category the biomass, hydro, solar photovoltaic, wind and
geothermal power plants are included.
As displayed in the above sections, on the basis of many forecasts, it is assumed that GDP will
continuously increase in the projection period. This will lead to increase in the power
consumption. In the model developed it is assumed that the electricity consumption increases by
20% by 2025 as a consequence of the increased economic activity and GDP. Another assumption
of the energy balance forecast is that after 2025 the increase of electricity consumption due to
increased activity will be contravened by increased energy efficiency.
The forecast electricity balance is displayed in the table 5.1.:
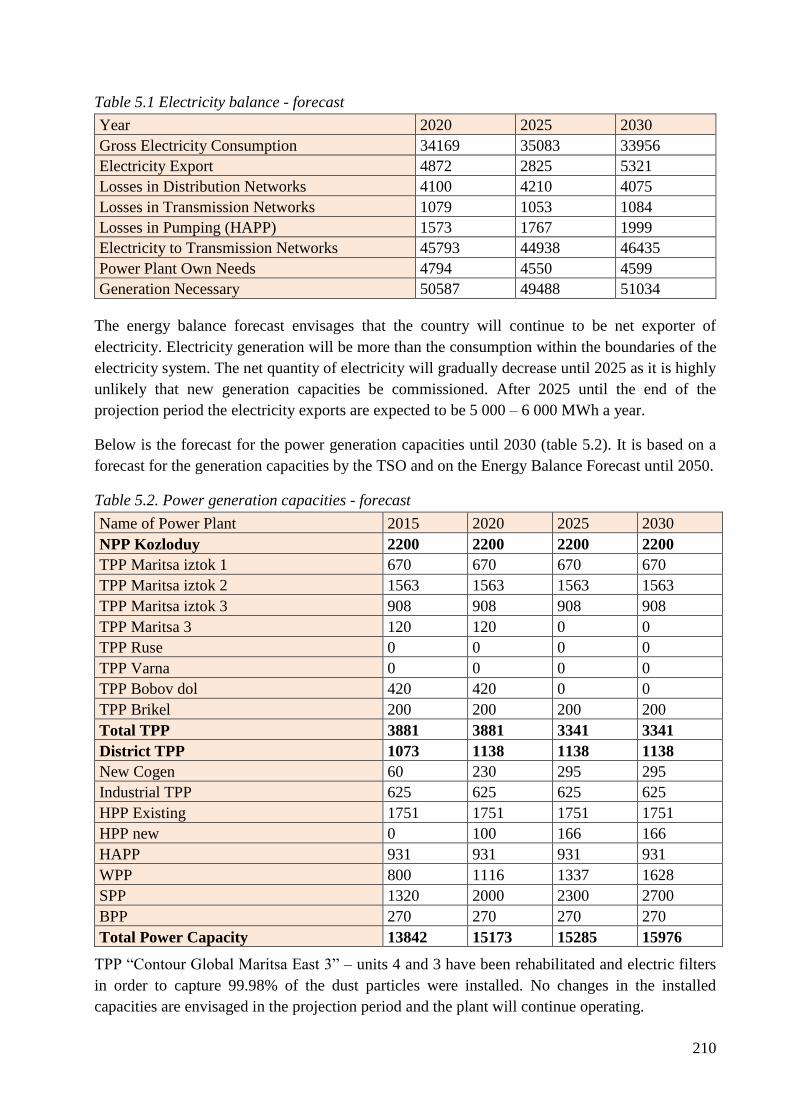
210
Table 5.1 Electricity balance - forecast
Year 2020 2025 2030
Gross Electricity Consumption 34169 35083 33956
Electricity Export 4872 2825 5321
Losses in Distribution Networks 4100 4210 4075
Losses in Transmission Networks 1079 1053 1084
Losses in Pumping (HAPP) 1573 1767 1999
Electricity to Transmission Networks 45793 44938 46435
Power Plant Own Needs 4794 4550 4599
Generation Necessary 50587 49488 51034
The energy balance forecast envisages that the country will continue to be net exporter of
electricity. Electricity generation will be more than the consumption within the boundaries of the
electricity system. The net quantity of electricity will gradually decrease until 2025 as it is highly
unlikely that new generation capacities be commissioned. After 2025 until the end of the
projection period the electricity exports are expected to be 5 000 – 6 000 MWh a year.
Below is the forecast for the power generation capacities until 2030 (table 5.2). It is based on a
forecast for the generation capacities by the TSO and on the Energy Balance Forecast until 2050.
Table 5.2. Power generation capacities - forecast
Name of Power Plant 2015 2020 2025 2030
NPP Kozloduy 2200 2200 2200 2200
TPP Maritsa iztok 1 670 670 670 670
TPP Maritsa iztok 2 1563 1563 1563 1563
TPP Maritsa iztok 3 908 908 908 908
TPP Maritsa 3 120 120 0 0
TPP Ruse 0 0 0 0
TPP Varna 0 0 0 0
TPP Bobov dol 420 420 0 0
TPP Brikel 200 200 200 200
Total TPP 3881 3881 3341 3341
District TPP 1073 1138 1138 1138
New Cogen 60 230 295 295
Industrial TPP 625 625 625 625
HPP Existing 1751 1751 1751 1751
HPP new 0 100 166 166
HAPP 931 931 931 931
WPP 800 1116 1337 1628
SPP 1320 2000 2300 2700
BPP 270 270 270 270
Total Power Capacity 13842 15173 15285 15976
TPP “Contour Global Maritsa East 3” – units 4 and 3 have been rehabilitated and electric filters
in order to capture 99.98% of the dust particles were installed. No changes in the installed
capacities are envisaged in the projection period and the plant will continue operating.
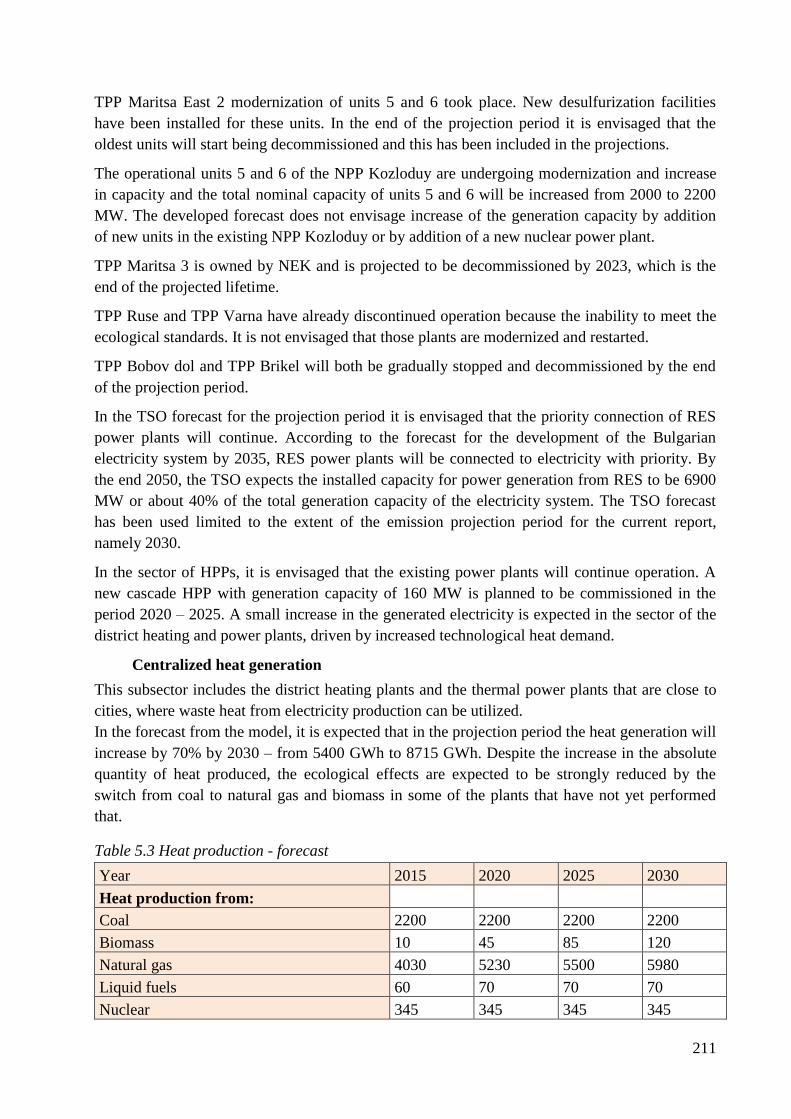
211
TPP Maritsa East 2 modernization of units 5 and 6 took place. New desulfurization facilities
have been installed for these units. In the end of the projection period it is envisaged that the
oldest units will start being decommissioned and this has been included in the projections.
The operational units 5 and 6 of the NPP Kozloduy are undergoing modernization and increase
in capacity and the total nominal capacity of units 5 and 6 will be increased from 2000 to 2200
MW. The developed forecast does not envisage increase of the generation capacity by addition
of new units in the existing NPP Kozloduy or by addition of a new nuclear power plant.
TPP Maritsa 3 is owned by NEK and is projected to be decommissioned by 2023, which is the
end of the projected lifetime.
TPP Ruse and TPP Varna have already discontinued operation because the inability to meet the
ecological standards. It is not envisaged that those plants are modernized and restarted.
TPP Bobov dol and TPP Brikel will both be gradually stopped and decommissioned by the end
of the projection period.
In the TSO forecast for the projection period it is envisaged that the priority connection of RES
power plants will continue. According to the forecast for the development of the Bulgarian
electricity system by 2035, RES power plants will be connected to electricity with priority. By
the end 2050, the TSO expects the installed capacity for power generation from RES to be 6900
MW or about 40% of the total generation capacity of the electricity system. The TSO forecast
has been used limited to the extent of the emission projection period for the current report,
namely 2030.
In the sector of HPPs, it is envisaged that the existing power plants will continue operation. A
new cascade HPP with generation capacity of 160 MW is planned to be commissioned in the
period 2020 – 2025. A small increase in the generated electricity is expected in the sector of the
district heating and power plants, driven by increased technological heat demand.
Centralized heat generation
This subsector includes the district heating plants and the thermal power plants that are close to
cities, where waste heat from electricity production can be utilized.
In the forecast from the model, it is expected that in the projection period the heat generation will
increase by 70% by 2030 – from 5400 GWh to 8715 GWh. Despite the increase in the absolute
quantity of heat produced, the ecological effects are expected to be strongly reduced by the
switch from coal to natural gas and biomass in some of the plants that have not yet performed
that.
Table 5.3 Heat production - forecast
Year 2015 2020 2025 2030
Heat production from:
Coal 2200 2200 2200 2200
Biomass 10 45 85 120
Natural gas 4030 5230 5500 5980
Liquid fuels 60 70 70 70
Nuclear 345 345 345 345
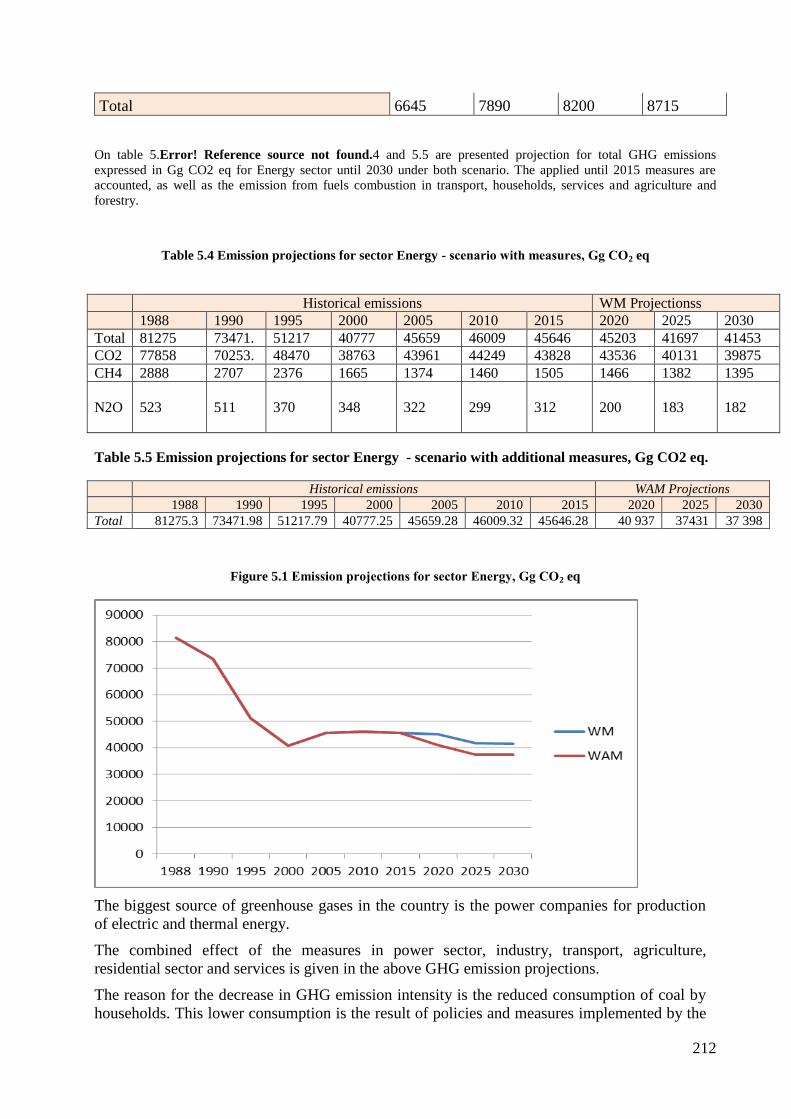
212
Total 6645 7890 8200 8715
On table 5.Error! Reference source not found.4 and 5.5 are presented projection for total GHG emissions
expressed in Gg CO2 eq for Energy sector until 2030 under both scenario. The applied until 2015 measures are
accounted, as well as the emission from fuels combustion in transport, households, services and agriculture and
forestry.
Table 5.4 Emission projections for sector Energy - scenario with measures, Gg СО2 eq
Historical emissions WM Projectionss
1988 1990 1995 2000 2005 2010 2015 2020 2025 2030
Total 81275 73471. 51217 40777 45659 46009 45646 45203 41697 41453
CO2 77858 70253. 48470 38763 43961 44249 43828 43536 40131 39875
CH4 2888 2707 2376 1665 1374 1460 1505 1466 1382 1395
N2O 523
511
370
348
322 299 312 200 183 182
Table 5.5 Emission projections for sector Energy - scenario with additional measures, Gg CO2 eq.
Historical emissions WAM Projections
1988 1990 1995 2000 2005 2010 2015 2020 2025 2030
Total 81275.3 73471.98 51217.79 40777.25 45659.28 46009.32 45646.28 40 937 37431 37 398
Figure 5.1 Emission projections for sector Energy, Gg СО2 eq
The biggest source of greenhouse gases in the country is the power companies for production
of electric and thermal energy.
The combined effect of the measures in power sector, industry, transport, agriculture,
residential sector and services is given in the above GHG emission projections.
The reason for the decrease in GHG emission intensity is the reduced consumption of coal by
households. This lower consumption is the result of policies and measures implemented by the
213
Ministry of Economy that partially compensated the significant increase in emissions caused by
the early decommissioning of nuclear facilities.
An essential part of the emission reduction was due to improved operation of Units 5 and 6 at
Kozloduy NPP and improved operation of district heating companies through the following
measures:
conducted rehabilitation, reduction of losses from transmission of thermal energy and
replacement of the subscriber stations;
introduction of the thermal energy accounting system that allows for regulation and
reporting of the actually consumed thermal energy.
The Energy Strategy of Bulgaria outlines the framework of the national energy policy and the
planned major reforms in this sector. The Bulgarian energy sector will continue to be based on
two main foundations: nuclear energy and local lignite coal that will be given priority in the
development of a competitive energy market in the future. All other priorities are directly
related to the following:
Security of supply;
Competition at the energy market;
Environmental protection.
In the course of its development the energy sector in Bulgaria has implemented various
measures that lead to stabilization and reduction of GHG emissions. Following the earlier
decommissioning of Units 3 and 4 of NPP Kozloduy (2006), the emissions from the energy
sector have been growing. This is due to the development plans introduced by the energy plants
using local and imported coal with high GHG emission potential. Energy industries
This sector includes emissions from burning fuel for generation of electricity and heat, from
production and processing of fuels and from other energy industries in Bulgaria.
The facilities for generation of electricity and thermal energy in this sector represent the
foundations of the energy sector in the country. They form an energy mix that includes the
large lignite-fired thermal power plants in the Maritsa East basin, NPP Kozloduy, the power
plants with co-generation of electricity and thermal energy for public needs and power plants
operating on the same principle for the factory needs. The prevalent fuel used in the process of
co-generation in Bulgaria is natural gas.
As a whole this sector accounts for 90% of domestically produced energy. Therefore it is
representative for the Energy Sector and its essential characteristics.
Scenario with measures – WM
Table 5.1 Energy industries– scenario with measures, Gg CO2 eq.
Historical emissions WM Projections
1988 1990 1995 2000 2005 2010 2015 2020 2025 2030
Total 42 179,4 38676,85 27259,83 24076,86 27148,08 31638,28 30316,87 31460,09 27787,11 26937,76
CO2 42024,36
38530,05
27151,09
23978,43
27034,13
31505,88
30190,07
31324,01 27664,14 26814,50
CH4 18,84
13,54
8,38
6,77
7,524
9,00
8,87
8,98 9,01 8,91
N2O 136,19
133,26
100,35
91,65
106,42
123,39
117,92
127,103 113,96 114,34
214
It is difficult to forecast the energy mix because such forecast would require combination of
opposite trends in the development of its elements. This is determined by the differences in
technologies and their historical development which depends on:
the development of fuel prices;
the safety in operation and the impact of large accidents on the decisions taken by the
competent authorities;
economic indicators and energy efficiency;
reduction of GHG emissions.
Leading criterion is the reduction of GHG emissions. Therefore, this scenario with existing
measures provides for development of the subsector that ensures a smooth transition from the
development until 2015. From a methodological point of view this scenario contain the
measures outlined in the country’s Energy Strategy and in the the Third National Action Plan
on Climate Change It assumes that the subsector develops by implementing already existing
measures, as well as guidelines and policies adopted by the EU. Table above provides the
projections of the aggregate GHG emissions under the scenario with existing measures as well
as the changes over two main periods – 2005-2020 and 2005-2030.The analysis shows:
in both periods GHG emissions decrease, especially so after 2020;
obviously this scenario combines circumstances related to the overall development of the
country where the level of GHG emissions in 2020 is equal to that in 2000.
This fact is assessed by the authors of the Energy Strategy as a negative one and motivated the
development of the scenario with additional measures.
Scenario with additional measures – WAM
The scenario with additional measures reflects all adopted or planned policies and measures for
reduction of GHG emissions in the country after 2015 with respect to this sector and includes
the impact of policies and measures presented in this report that have a quantitative assessment
at this stage.
Table 5.2 Aggregate GHG emissions from the Energy Industries Sector, Gg CO2 eq. – scenario with
additional measures
Historical emissions WAM Projections
1988 1990 1995 2000 2005 2010 2015 2020 2025 2030
Total 42 179,4 38676,85 27259,83 24076,86 27148,08 31638,28 30316,87 28157 24477 23627
Figure 5.2. Emission projections for sector Energy Industries – WEM and WAM scenarios,
Gg СО2 eq
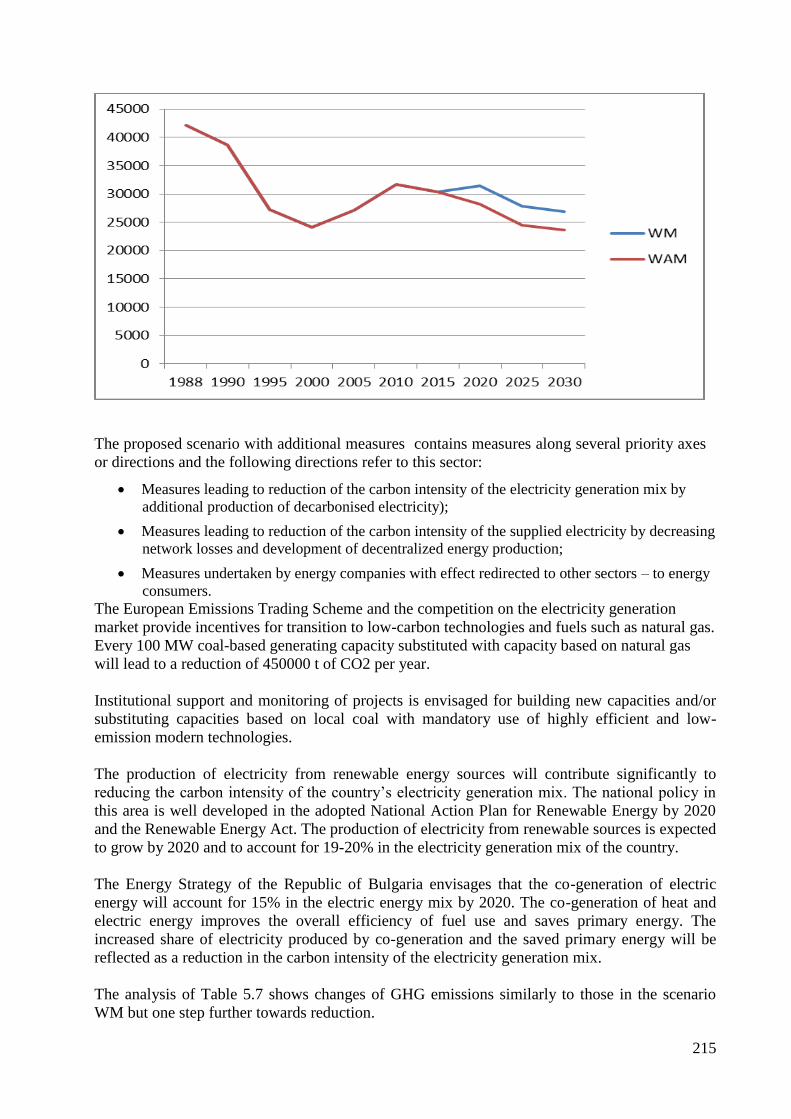
215
The proposed scenario with additional measures contains measures along several priority axes
or directions and the following directions refer to this sector:
Measures leading to reduction of the carbon intensity of the electricity generation mix by
additional production of decarbonised electricity);
Measures leading to reduction of the carbon intensity of the supplied electricity by decreasing
network losses and development of decentralized energy production;
Measures undertaken by energy companies with effect redirected to other sectors – to energy
consumers.
The European Emissions Trading Scheme and the competition on the electricity generation
market provide incentives for transition to low-carbon technologies and fuels such as natural gas.
Every 100 MW coal-based generating capacity substituted with capacity based on natural gas
will lead to a reduction of 450000 t of CO2 per year.
Institutional support and monitoring of projects is envisaged for building new capacities and/or
substituting capacities based on local coal with mandatory use of highly efficient and low-
emission modern technologies.
The production of electricity from renewable energy sources will contribute significantly to
reducing the carbon intensity of the country’s electricity generation mix. The national policy in
this area is well developed in the adopted National Action Plan for Renewable Energy by 2020
and the Renewable Energy Act. The production of electricity from renewable sources is expected
to grow by 2020 and to account for 19-20% in the electricity generation mix of the country.
The Energy Strategy of the Republic of Bulgaria envisages that the co-generation of electric
energy will account for 15% in the electric energy mix by 2020. The co-generation of heat and
electric energy improves the overall efficiency of fuel use and saves primary energy. The
increased share of electricity produced by co-generation and the saved primary energy will be
reflected as a reduction in the carbon intensity of the electricity generation mix.
The analysis of Table 5.7 shows changes of GHG emissions similarly to those in the scenario
WM but one step further towards reduction.
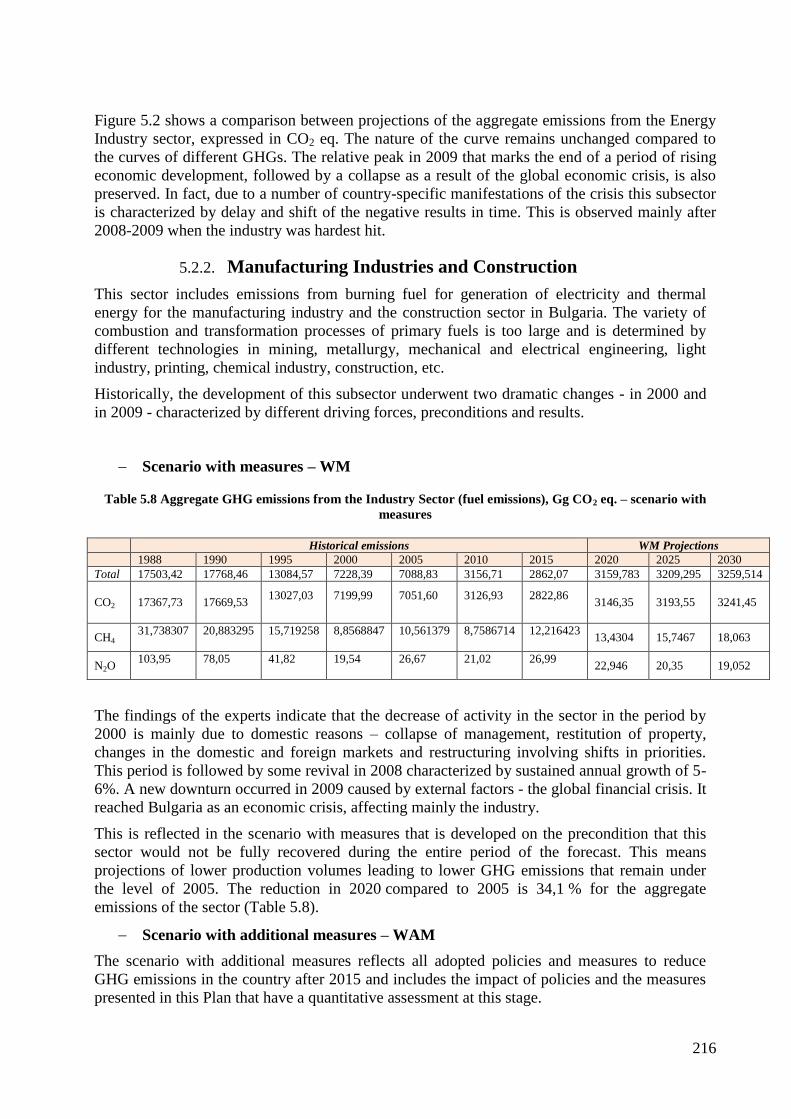
216
Figure 5.2 shows a comparison between projections of the aggregate emissions from the Energy
Industry sector, expressed in CO2 eq. The nature of the curve remains unchanged compared to
the curves of different GHGs. The relative peak in 2009 that marks the end of a period of rising
economic development, followed by a collapse as a result of the global economic crisis, is also
preserved. In fact, due to a number of country-specific manifestations of the crisis this subsector
is characterized by delay and shift of the negative results in time. This is observed mainly after
2008-2009 when the industry was hardest hit.
5.2.2. Manufacturing Industries and Construction
This sector includes emissions from burning fuel for generation of electricity and thermal
energy for the manufacturing industry and the construction sector in Bulgaria. The variety of
combustion and transformation processes of primary fuels is too large and is determined by
different technologies in mining, metallurgy, mechanical and electrical engineering, light
industry, printing, chemical industry, construction, etc.
Historically, the development of this subsector underwent two dramatic changes - in 2000 and
in 2009 - characterized by different driving forces, preconditions and results.
Scenario with measures – WM
Table 5.8 Aggregate GHG emissions from the Industry Sector (fuel emissions), Gg CO2 eq. – scenario with
measures
Historical emissions WM Projections
1988 1990 1995 2000 2005 2010 2015 2020 2025 2030
Total 17503,42 17768,46 13084,57 7228,39 7088,83 3156,71 2862,07 3159,783 3209,295 3259,514
CO2
17367,73
17669,53
13027,03
7199,99
7051,60
3126,93
2822,86
3146,35 3193,55 3241,45
CH4 31,738307
20,883295
15,719258
8,8568847
10,561379
8,7586714
12,216423
13,4304 15,7467 18,063
N2O 103,95
78,05
41,82
19,54
26,67
21,02
26,99
22,946 20,35 19,052
The findings of the experts indicate that the decrease of activity in the sector in the period by
2000 is mainly due to domestic reasons – collapse of management, restitution of property,
changes in the domestic and foreign markets and restructuring involving shifts in priorities.
This period is followed by some revival in 2008 characterized by sustained annual growth of 5-
6%. A new downturn occurred in 2009 caused by external factors - the global financial crisis. It
reached Bulgaria as an economic crisis, affecting mainly the industry.
This is reflected in the scenario with measures that is developed on the precondition that this
sector would not be fully recovered during the entire period of the forecast. This means
projections of lower production volumes leading to lower GHG emissions that remain under
the level of 2005. The reduction in 2020 compared to 2005 is 34,1 % for the aggregate
emissions of the sector (Table 5.8).
Scenario with additional measures – WAM
The scenario with additional measures reflects all adopted policies and measures to reduce
GHG emissions in the country after 2015 and includes the impact of policies and the measures
presented in this Plan that have a quantitative assessment at this stage.
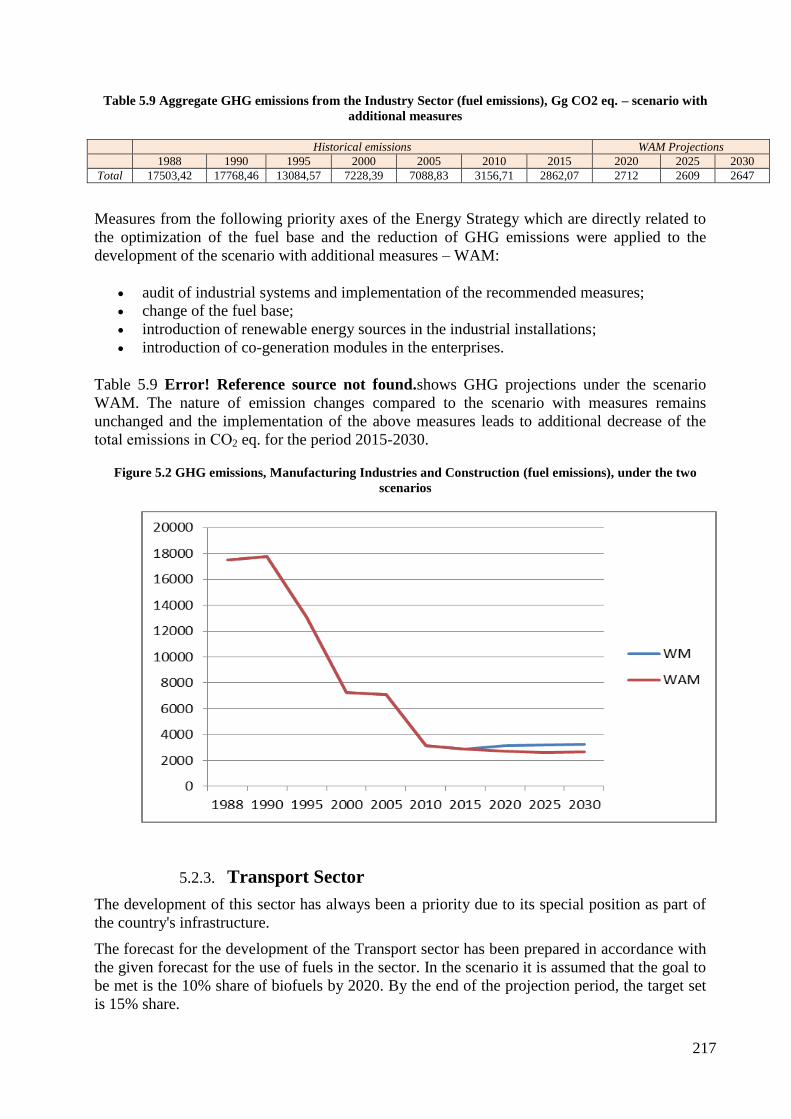
217
Table 5.9 Aggregate GHG emissions from the Industry Sector (fuel emissions), Gg CO2 eq. – scenario with
additional measures
Historical emissions WAM Projections
1988 1990 1995 2000 2005 2010 2015 2020 2025 2030
Total 17503,42 17768,46 13084,57 7228,39 7088,83 3156,71 2862,07 2712 2609 2647
Measures from the following priority axes of the Energy Strategy which are directly related to
the optimization of the fuel base and the reduction of GHG emissions were applied to the
development of the scenario with additional measures – WAM:
audit of industrial systems and implementation of the recommended measures;
change of the fuel base;
introduction of renewable energy sources in the industrial installations;
introduction of co-generation modules in the enterprises.
Table 5.9 Error! Reference source not found.shows GHG projections under the scenario
WAM. The nature of emission changes compared to the scenario with measures remains
unchanged and the implementation of the above measures leads to additional decrease of the
total emissions in СО2 eq. for the period 2015-2030.
Figure 5.2 GHG emissions, Manufacturing Industries and Construction (fuel emissions), under the two
scenarios
5.2.3. Transport Sector
The development of this sector has always been a priority due to its special position as part of
the country's infrastructure.
The forecast for the development of the Transport sector has been prepared in accordance with
the given forecast for the use of fuels in the sector. In the scenario it is assumed that the goal to
be met is the 10% share of biofuels by 2020. By the end of the projection period, the target set
is 15% share.
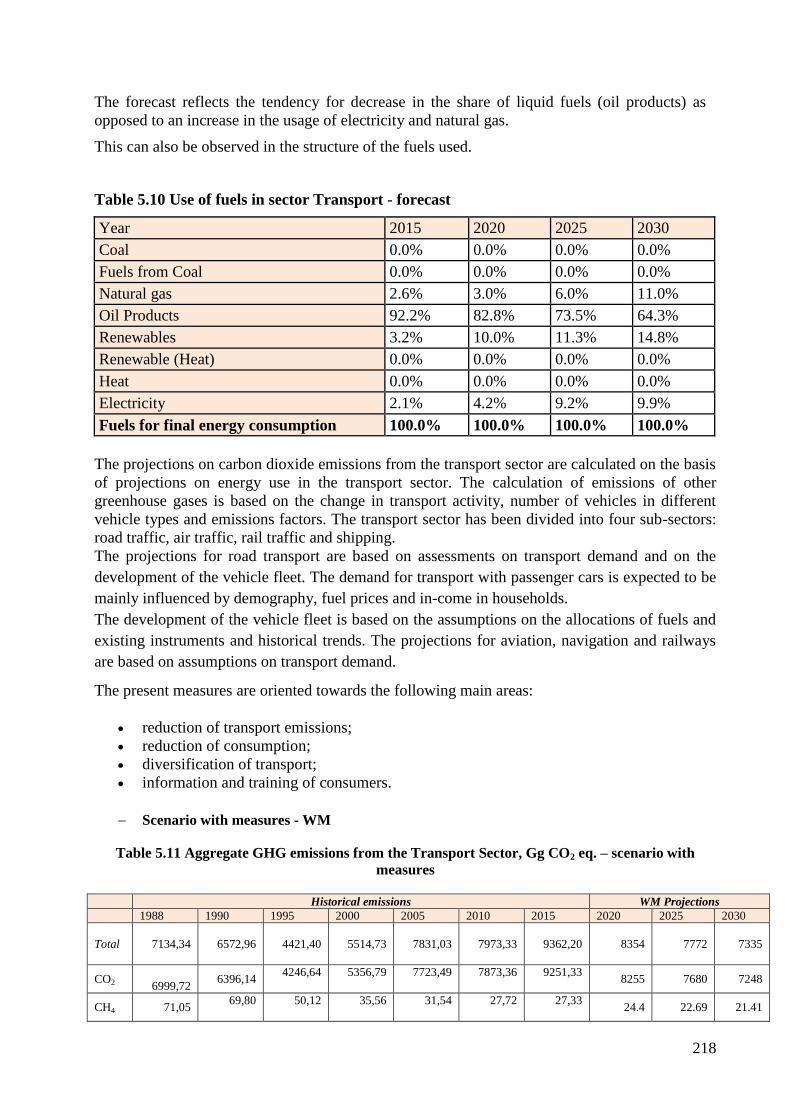
218
The forecast reflects the tendency for decrease in the share of liquid fuels (oil products) as
opposed to an increase in the usage of electricity and natural gas.
This can also be observed in the structure of the fuels used.
Table 5.10 Use of fuels in sector Transport - forecast
Year 2015 2020 2025 2030
Coal 0.0% 0.0% 0.0% 0.0%
Fuels from Coal 0.0% 0.0% 0.0% 0.0%
Natural gas 2.6% 3.0% 6.0% 11.0%
Oil Products 92.2% 82.8% 73.5% 64.3%
Renewables 3.2% 10.0% 11.3% 14.8%
Renewable (Heat) 0.0% 0.0% 0.0% 0.0%
Heat 0.0% 0.0% 0.0% 0.0%
Electricity 2.1% 4.2% 9.2% 9.9%
Fuels for final energy consumption 100.0% 100.0% 100.0% 100.0%
The projections on carbon dioxide emissions from the transport sector are calculated on the basis
of projections on energy use in the transport sector. The calculation of emissions of other
greenhouse gases is based on the change in transport activity, number of vehicles in different
vehicle types and emissions factors. The transport sector has been divided into four sub-sectors:
road traffic, air traffic, rail traffic and shipping.
The projections for road transport are based on assessments on transport demand and on the
development of the vehicle fleet. The demand for transport with passenger cars is expected to be
mainly influenced by demography, fuel prices and in-come in households.
The development of the vehicle fleet is based on the assumptions on the allocations of fuels and
existing instruments and historical trends. The projections for aviation, navigation and railways
are based on assumptions on transport demand.
The present measures are oriented towards the following main areas:
reduction of transport emissions;
reduction of consumption;
diversification of transport;
information and training of consumers.
Scenario with measures - WM
Table 5.11 Aggregate GHG emissions from the Transport Sector, Gg CO2 eq. – scenario with
measures
Historical emissions WM Projections
1988 1990 1995 2000 2005 2010 2015 2020 2025 2030
Total 7134,34 6572,96
4421,40
5514,73 7831,03 7973,33 9362,20 8354 7772 7335
CO2
6999,72 6396,14
4246,64
5356,79
7723,49
7873,36
9251,33
8255 7680 7248
CH4 71,05 69,80
50,12
35,56
31,54
27,72
27,33
24.4 22.69 21.41
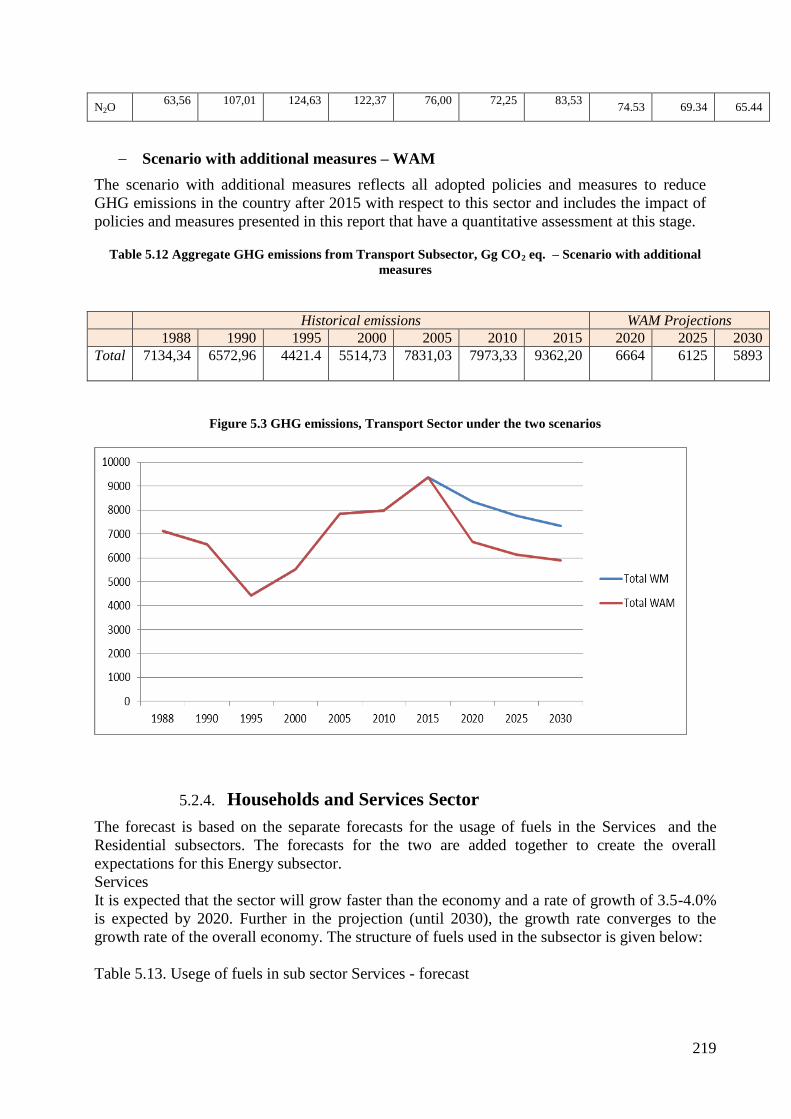
219
N2O 63,56
107,01
124,63
122,37
76,00
72,25
83,53
74.53 69.34 65.44
Scenario with additional measures – WAM
The scenario with additional measures reflects all adopted policies and measures to reduce
GHG emissions in the country after 2015 with respect to this sector and includes the impact of
policies and measures presented in this report that have a quantitative assessment at this stage.
Table 5.12 Aggregate GHG emissions from Transport Subsector, Gg CO2 eq. – Scenario with additional
measures
Historical emissions WAM Projections
1988 1990 1995 2000 2005 2010 2015 2020 2025 2030
Total 7134,34
6572,96
4421.4
5514,73
7831,03
7973,33
9362,20
6664 6125 5893
Figure 5.3 GHG emissions, Transport Sector under the two scenarios
5.2.4. Households and Services Sector
The forecast is based on the separate forecasts for the usage of fuels in the Services and the
Residential subsectors. The forecasts for the two are added together to create the overall
expectations for this Energy subsector.
Services
It is expected that the sector will grow faster than the economy and a rate of growth of 3.5-4.0%
is expected by 2020. Further in the projection (until 2030), the growth rate converges to the
growth rate of the overall economy. The structure of fuels used in the subsector is given below:
Table 5.13. Usege of fuels in sub sector Services - forecast
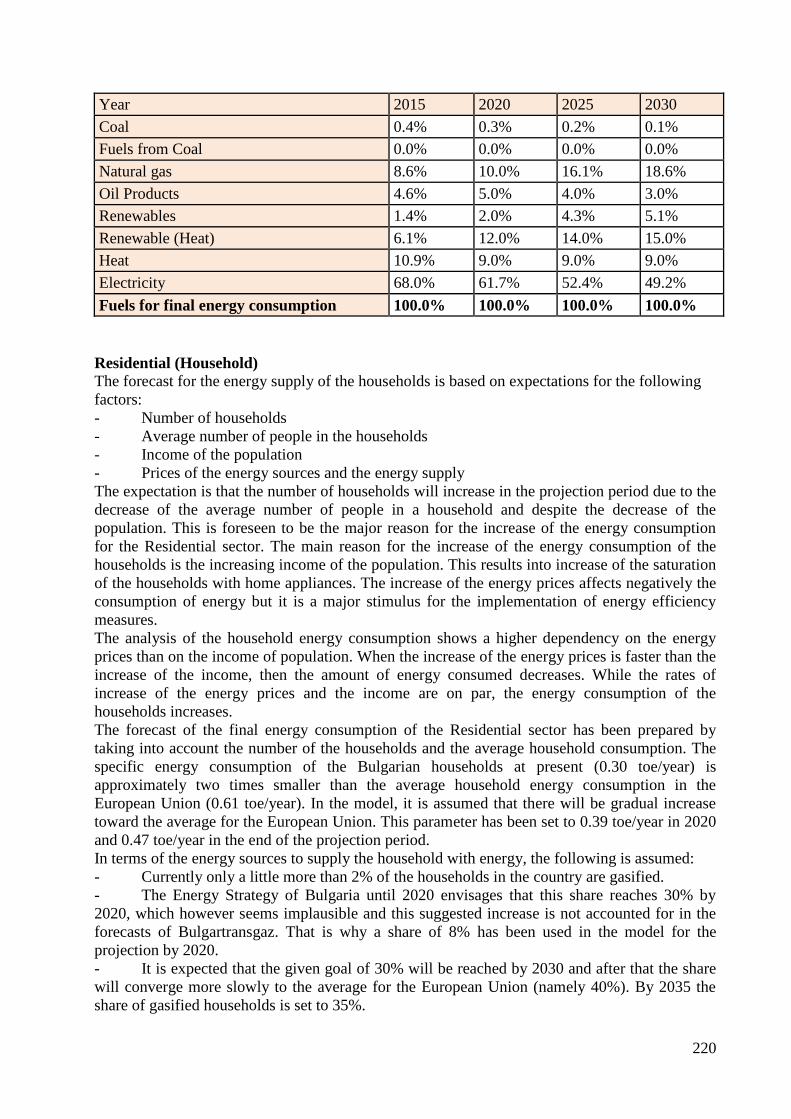
220
Year 2015 2020 2025 2030
Coal 0.4% 0.3% 0.2% 0.1%
Fuels from Coal 0.0% 0.0% 0.0% 0.0%
Natural gas 8.6% 10.0% 16.1% 18.6%
Oil Products 4.6% 5.0% 4.0% 3.0%
Renewables 1.4% 2.0% 4.3% 5.1%
Renewable (Heat) 6.1% 12.0% 14.0% 15.0%
Heat 10.9% 9.0% 9.0% 9.0%
Electricity 68.0% 61.7% 52.4% 49.2%
Fuels for final energy consumption 100.0% 100.0% 100.0% 100.0%
Residential (Household)
The forecast for the energy supply of the households is based on expectations for the following
factors:
- Number of households
- Average number of people in the households
- Income of the population
- Prices of the energy sources and the energy supply
The expectation is that the number of households will increase in the projection period due to the
decrease of the average number of people in a household and despite the decrease of the
population. This is foreseen to be the major reason for the increase of the energy consumption
for the Residential sector. The main reason for the increase of the energy consumption of the
households is the increasing income of the population. This results into increase of the saturation
of the households with home appliances. The increase of the energy prices affects negatively the
consumption of energy but it is a major stimulus for the implementation of energy efficiency
measures.
The analysis of the household energy consumption shows a higher dependency on the energy
prices than on the income of population. When the increase of the energy prices is faster than the
increase of the income, then the amount of energy consumed decreases. While the rates of
increase of the energy prices and the income are on par, the energy consumption of the
households increases.
The forecast of the final energy consumption of the Residential sector has been prepared by
taking into account the number of the households and the average household consumption. The
specific energy consumption of the Bulgarian households at present (0.30 toe/year) is
approximately two times smaller than the average household energy consumption in the
European Union (0.61 toe/year). In the model, it is assumed that there will be gradual increase
toward the average for the European Union. This parameter has been set to 0.39 toe/year in 2020
and 0.47 toe/year in the end of the projection period.
In terms of the energy sources to supply the household with energy, the following is assumed:
- Currently only a little more than 2% of the households in the country are gasified.
- The Energy Strategy of Bulgaria until 2020 envisages that this share reaches 30% by
2020, which however seems implausible and this suggested increase is not accounted for in the
forecasts of Bulgartransgaz. That is why a share of 8% has been used in the model for the
projection by 2020.
- It is expected that the given goal of 30% will be reached by 2030 and after that the share
will converge more slowly to the average for the European Union (namely 40%). By 2035 the
share of gasified households is set to 35%.
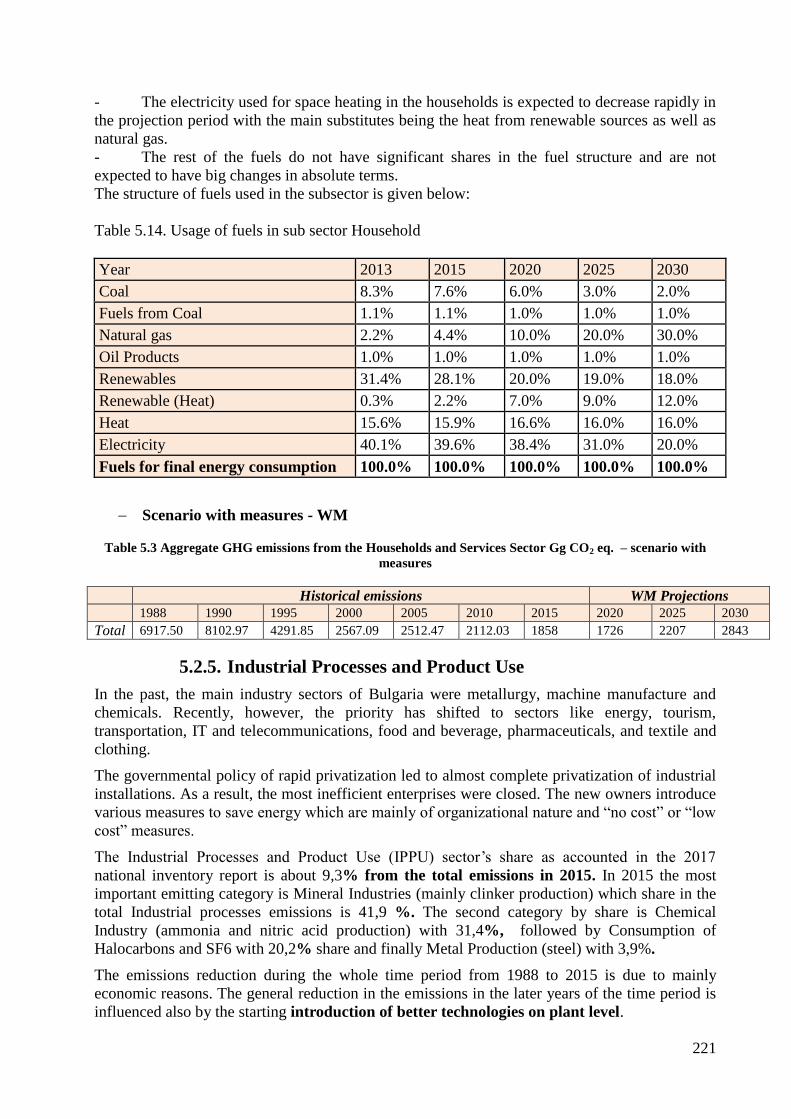
221
- The electricity used for space heating in the households is expected to decrease rapidly in
the projection period with the main substitutes being the heat from renewable sources as well as
natural gas.
- The rest of the fuels do not have significant shares in the fuel structure and are not
expected to have big changes in absolute terms.
The structure of fuels used in the subsector is given below:
Table 5.14. Usage of fuels in sub sector Household
Year 2013 2015 2020 2025 2030
Coal 8.3% 7.6% 6.0% 3.0% 2.0%
Fuels from Coal 1.1% 1.1% 1.0% 1.0% 1.0%
Natural gas 2.2% 4.4% 10.0% 20.0% 30.0%
Oil Products 1.0% 1.0% 1.0% 1.0% 1.0%
Renewables 31.4% 28.1% 20.0% 19.0% 18.0%
Renewable (Heat) 0.3% 2.2% 7.0% 9.0% 12.0%
Heat 15.6% 15.9% 16.6% 16.0% 16.0%
Electricity 40.1% 39.6% 38.4% 31.0% 20.0%
Fuels for final energy consumption 100.0% 100.0% 100.0% 100.0% 100.0%
Scenario with measures - WM
Table 5.3 Aggregate GHG emissions from the Households and Services Sector Gg CO2 eq. – scenario with
measures
Historical emissions WM Projections
1988 1990 1995 2000 2005 2010 2015 2020 2025 2030
Total 6917.50 8102.97 4291.85 2567.09 2512.47 2112.03 1858 1726 2207 2843
5.2.5. Industrial Processes and Product Use
In the past, the main industry sectors of Bulgaria were metallurgy, machine manufacture and
chemicals. Recently, however, the priority has shifted to sectors like energy, tourism,
transportation, IT and telecommunications, food and beverage, pharmaceuticals, and textile and
clothing.
The governmental policy of rapid privatization led to almost complete privatization of industrial
installations. As a result, the most inefficient enterprises were closed. The new owners introduce
various measures to save energy which are mainly of organizational nature and “no cost” or “low
cost” measures.
The Industrial Processes and Product Use (IPPU) sector’s share as accounted in the 2017
national inventory report is about 9,3% from the total emissions in 2015. In 2015 the most
important emitting category is Mineral Industries (mainly clinker production) which share in the
total Industrial processes emissions is 41,9 %. The second category by share is Chemical
Industry (ammonia and nitric acid production) with 31,4%, followed by Consumption of
Halocarbons and SF6 with 20,2% share and finally Metal Production (steel) with 3,9%.
The emissions reduction during the whole time period from 1988 to 2015 is due to mainly
economic reasons. The general reduction in the emissions in the later years of the time period is
influenced also by the starting introduction of better technologies on plant level.
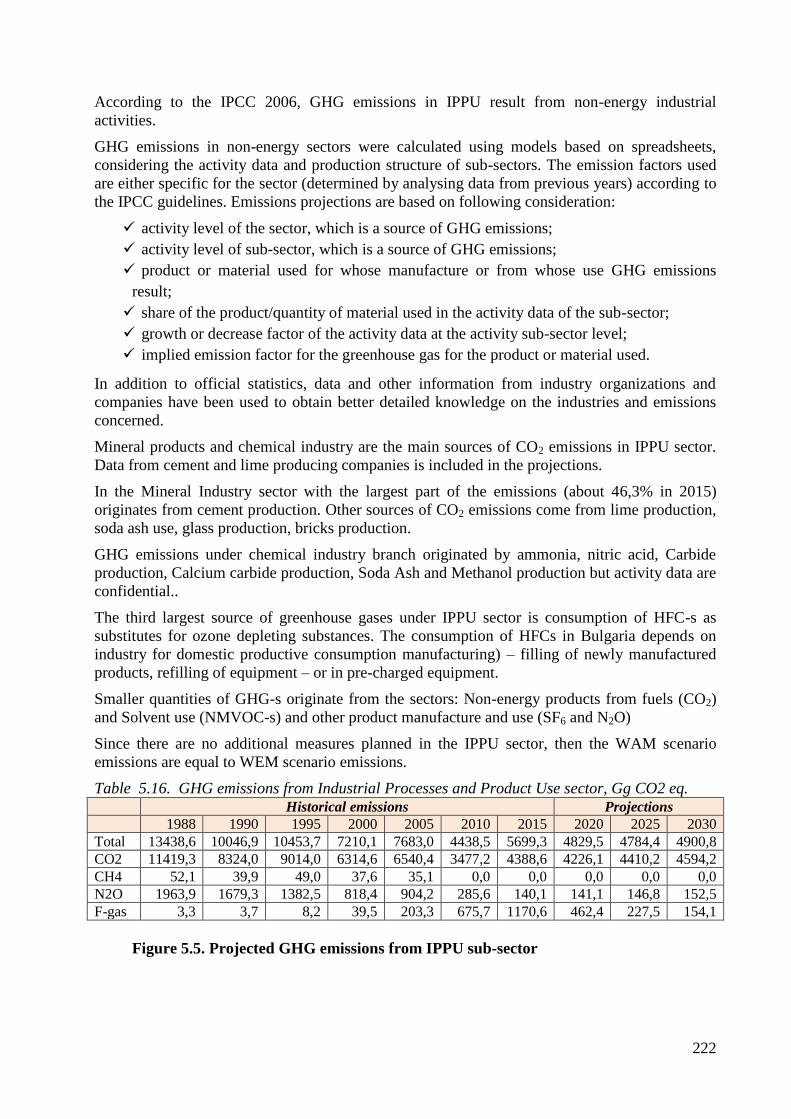
222
According to the IPCC 2006, GHG emissions in IPPU result from non-energy industrial
activities.
GHG emissions in non-energy sectors were calculated using models based on spreadsheets,
considering the activity data and production structure of sub-sectors. The emission factors used
are either specific for the sector (determined by analysing data from previous years) according to
the IPCC guidelines. Emissions projections are based on following consideration:
activity level of the sector, which is a source of GHG emissions;
activity level of sub-sector, which is a source of GHG emissions;
product or material used for whose manufacture or from whose use GHG emissions
result;
share of the product/quantity of material used in the activity data of the sub-sector;
growth or decrease factor of the activity data at the activity sub-sector level;
implied emission factor for the greenhouse gas for the product or material used.
In addition to official statistics, data and other information from industry organizations and
companies have been used to obtain better detailed knowledge on the industries and emissions
concerned.
Mineral products and chemical industry are the main sources of CO2 emissions in IPPU sector.
Data from cement and lime producing companies is included in the projections.
In the Mineral Industry sector with the largest part of the emissions (about 46,3% in 2015)
originates from cement production. Other sources of CO2 emissions come from lime production,
soda ash use, glass production, bricks production.
GHG emissions under chemical industry branch originated by ammonia, nitric acid, Carbide
production, Calcium carbide production, Soda Ash and Methanol production but activity data are
confidential..
The third largest source of greenhouse gases under IPPU sector is consumption of HFC-s as
substitutes for ozone depleting substances. The consumption of HFCs in Bulgaria depends on
industry for domestic productive consumption manufacturing) – filling of newly manufactured
products, refilling of equipment – or in pre-charged equipment.
Smaller quantities of GHG-s originate from the sectors: Non-energy products from fuels (CO2)
and Solvent use (NMVOC-s) and other product manufacture and use (SF6 and N2O)
Since there are no additional measures planned in the IPPU sector, then the WAM scenario
emissions are equal to WEM scenario emissions.
Table 5.16. GHG emissions from Industrial Processes and Product Use sector, Gg CO2 eq. Historical emissions Projections
1988 1990 1995 2000 2005 2010 2015 2020 2025 2030
Total 13438,6 10046,9 10453,7 7210,1 7683,0 4438,5 5699,3 4829,5 4784,4 4900,8
CO2 11419,3 8324,0 9014,0 6314,6 6540,4 3477,2 4388,6 4226,1 4410,2 4594,2
CH4 52,1 39,9 49,0 37,6 35,1 0,0 0,0 0,0 0,0 0,0
N2O 1963,9 1679,3 1382,5 818,4 904,2 285,6 140,1 141,1 146,8 152,5
F-gas 3,3 3,7 8,2 39,5 203,3 675,7 1170,6 462,4 227,5 154,1
Figure 5.5. Projected GHG emissions from IPPU sub-sector
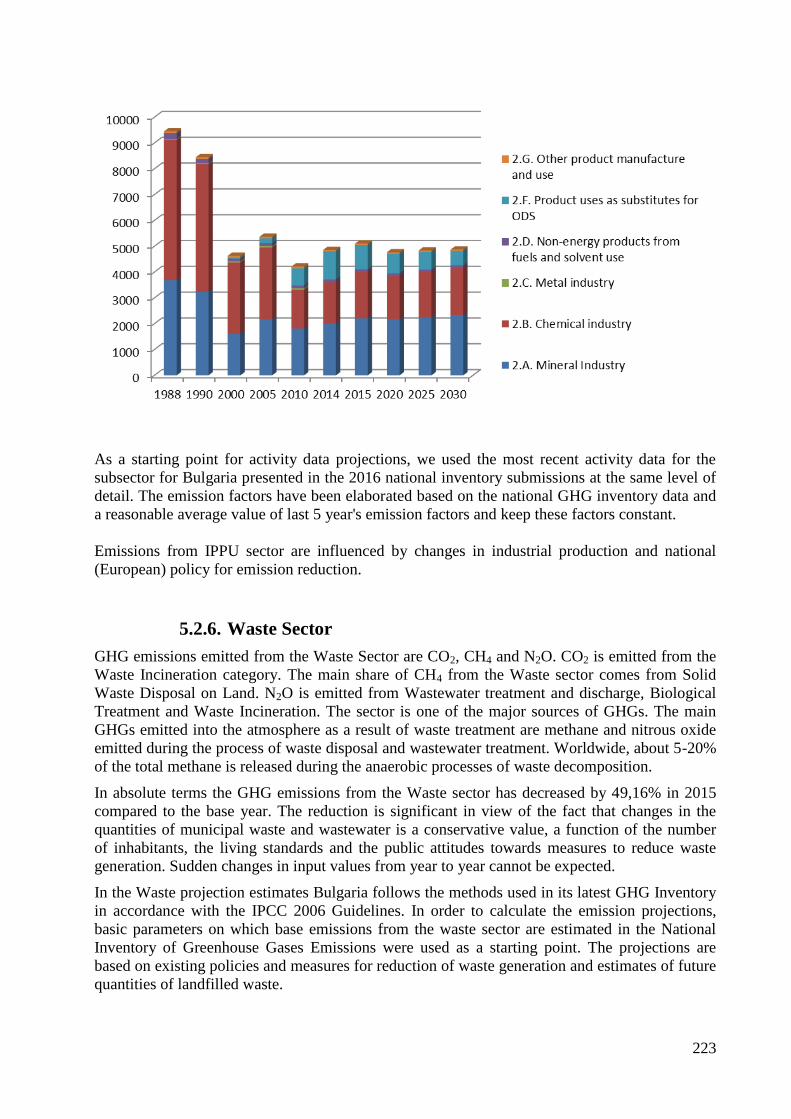
223
As a starting point for activity data projections, we used the most recent activity data for the
subsector for Bulgaria presented in the 2016 national inventory submissions at the same level of
detail. The emission factors have been elaborated based on the national GHG inventory data and
a reasonable average value of last 5 year's emission factors and keep these factors constant.
Emissions from IPPU sector are influenced by changes in industrial production and national
(European) policy for emission reduction.
5.2.6. Waste Sector
GHG emissions emitted from the Waste Sector are CO2, CH4 and N2O. CO2 is emitted from the
Waste Incineration category. The main share of CH4 from the Waste sector comes from Solid
Waste Disposal on Land. N2O is emitted from Wastewater treatment and discharge, Biological
Treatment and Waste Incineration. The sector is one of the major sources of GHGs. The main
GHGs emitted into the atmosphere as a result of waste treatment are methane and nitrous oxide
emitted during the process of waste disposal and wastewater treatment. Worldwide, about 5-20%
of the total methane is released during the anaerobic processes of waste decomposition.
In absolute terms the GHG emissions from the Waste sector has decreased by 49,16% in 2015
compared to the base year. The reduction is significant in view of the fact that changes in the
quantities of municipal waste and wastewater is a conservative value, a function of the number
of inhabitants, the living standards and the public attitudes towards measures to reduce waste
generation. Sudden changes in input values from year to year cannot be expected.
In the Waste projection estimates Bulgaria follows the methods used in its latest GHG Inventory
in accordance with the IPCC 2006 Guidelines. In order to calculate the emission projections,
basic parameters on which base emissions from the waste sector are estimated in the National
Inventory of Greenhouse Gases Emissions were used as a starting point. The projections are
based on existing policies and measures for reduction of waste generation and estimates of future
quantities of landfilled waste.
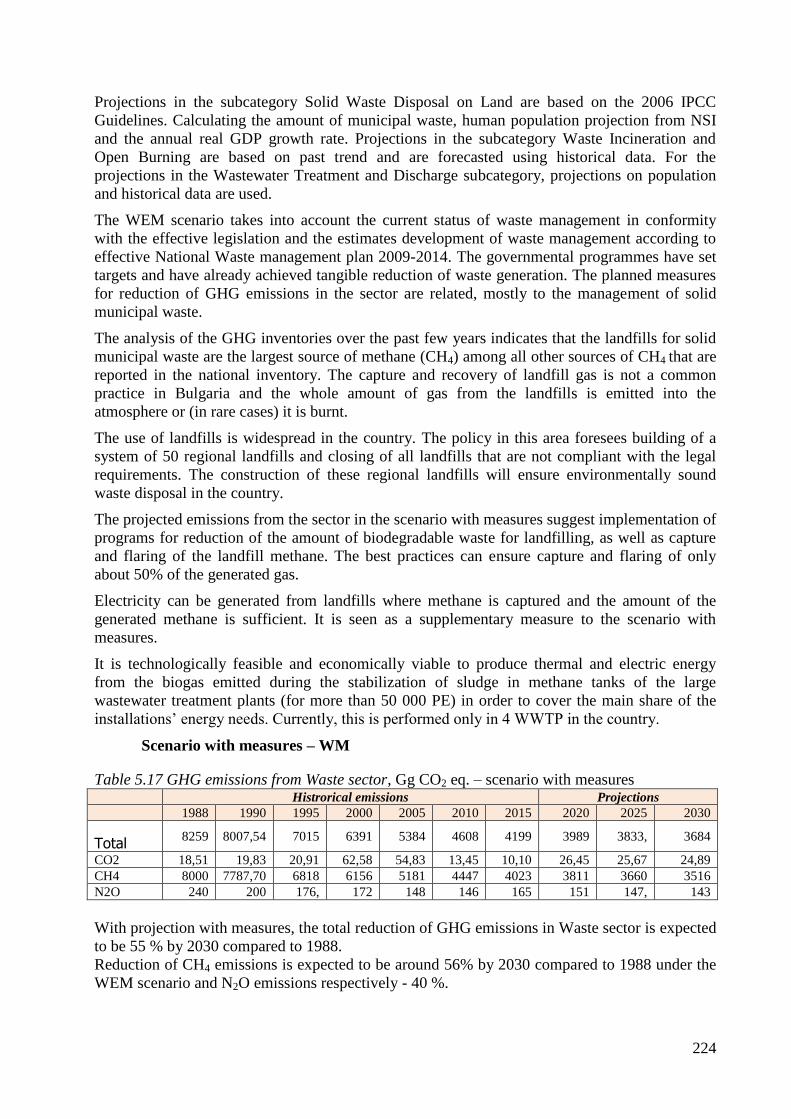
224
Projections in the subcategory Solid Waste Disposal on Land are based on the 2006 IPCC
Guidelines. Calculating the amount of municipal waste, human population projection from NSI
and the annual real GDP growth rate. Projections in the subcategory Waste Incineration and
Open Burning are based on past trend and are forecasted using historical data. For the
projections in the Wastewater Treatment and Discharge subcategory, projections on population
and historical data are used.
The WEM scenario takes into account the current status of waste management in conformity
with the effective legislation and the estimates development of waste management according to
effective National Waste management plan 2009-2014. The governmental programmes have set
targets and have already achieved tangible reduction of waste generation. The planned measures
for reduction of GHG emissions in the sector are related, mostly to the management of solid
municipal waste.
The analysis of the GHG inventories over the past few years indicates that the landfills for solid
municipal waste are the largest source of methane (CH4) among all other sources of CH4 that are
reported in the national inventory. The capture and recovery of landfill gas is not a common
practice in Bulgaria and the whole amount of gas from the landfills is emitted into the
atmosphere or (in rare cases) it is burnt.
The use of landfills is widespread in the country. The policy in this area foresees building of a
system of 50 regional landfills and closing of all landfills that are not compliant with the legal
requirements. The construction of these regional landfills will ensure environmentally sound
waste disposal in the country.
The projected emissions from the sector in the scenario with measures suggest implementation of
programs for reduction of the amount of biodegradable waste for landfilling, as well as capture
and flaring of the landfill methane. The best practices can ensure capture and flaring of only
about 50% of the generated gas.
Electricity can be generated from landfills where methane is captured and the amount of the
generated methane is sufficient. It is seen as a supplementary measure to the scenario with
measures.
It is technologically feasible and economically viable to produce thermal and electric energy
from the biogas emitted during the stabilization of sludge in methane tanks of the large
wastewater treatment plants (for more than 50 000 PE) in order to cover the main share of the
installations’ energy needs. Currently, this is performed only in 4 WWTP in the country.
Scenario with measures – WM
Table 5.17 GHG emissions from Waste sector, Gg CO2 eq. – scenario with measures Histrorical emissions Projections
1988 1990 1995 2000 2005 2010 2015 2020 2025 2030
Total 8259 8007,54 7015 6391 5384 4608 4199 3989 3833, 3684
CO2 18,51 19,83 20,91 62,58 54,83 13,45 10,10 26,45 25,67 24,89
CH4 8000 7787,70 6818 6156 5181 4447 4023 3811 3660 3516
N2O 240 200 176, 172 148 146 165 151 147, 143
With projection with measures, the total reduction of GHG emissions in Waste sector is expected
to be 55 % by 2030 compared to 1988.
Reduction of CH4 emissions is expected to be around 56% by 2030 compared to 1988 under the
WEM scenario and N2O emissions respectively - 40 %.
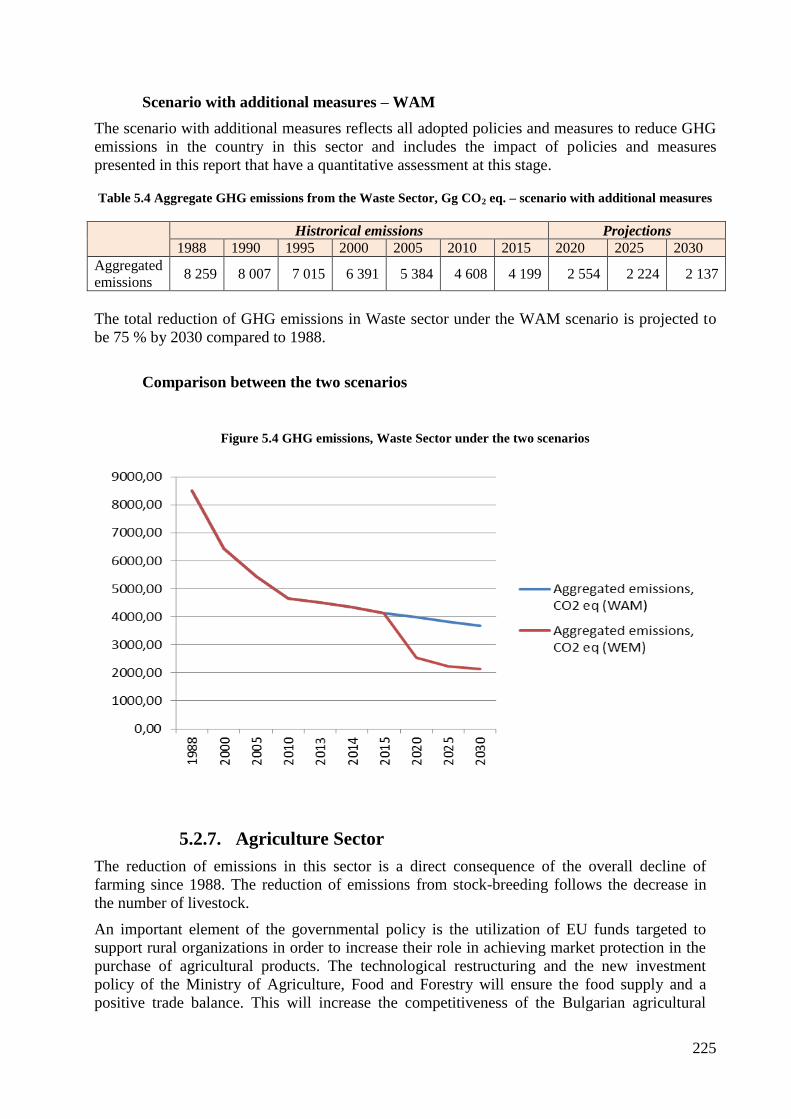
225
Scenario with additional measures – WAM
The scenario with additional measures reflects all adopted policies and measures to reduce GHG
emissions in the country in this sector and includes the impact of policies and measures
presented in this report that have a quantitative assessment at this stage.
Table 5.4 Aggregate GHG emissions from the Waste Sector, Gg CO2 eq. – scenario with additional measures
Histrorical emissions Projections
1988 1990 1995 2000 2005 2010 2015 2020 2025 2030
Aggregated
emissions 8 259 8 007 7 015 6 391 5 384 4 608 4 199 2 554 2 224 2 137
The total reduction of GHG emissions in Waste sector under the WAM scenario is projected to
be 75 % by 2030 compared to 1988.
Comparison between the two scenarios
Figure 5.4 GHG emissions, Waste Sector under the two scenarios
5.2.7. Agriculture Sector
The reduction of emissions in this sector is a direct consequence of the overall decline of
farming since 1988. The reduction of emissions from stock-breeding follows the decrease in
the number of livestock.
An important element of the governmental policy is the utilization of EU funds targeted to
support rural organizations in order to increase their role in achieving market protection in the
purchase of agricultural products. The technological restructuring and the new investment
policy of the Ministry of Agriculture, Food and Forestry will ensure the food supply and a
positive trade balance. This will increase the competitiveness of the Bulgarian agricultural
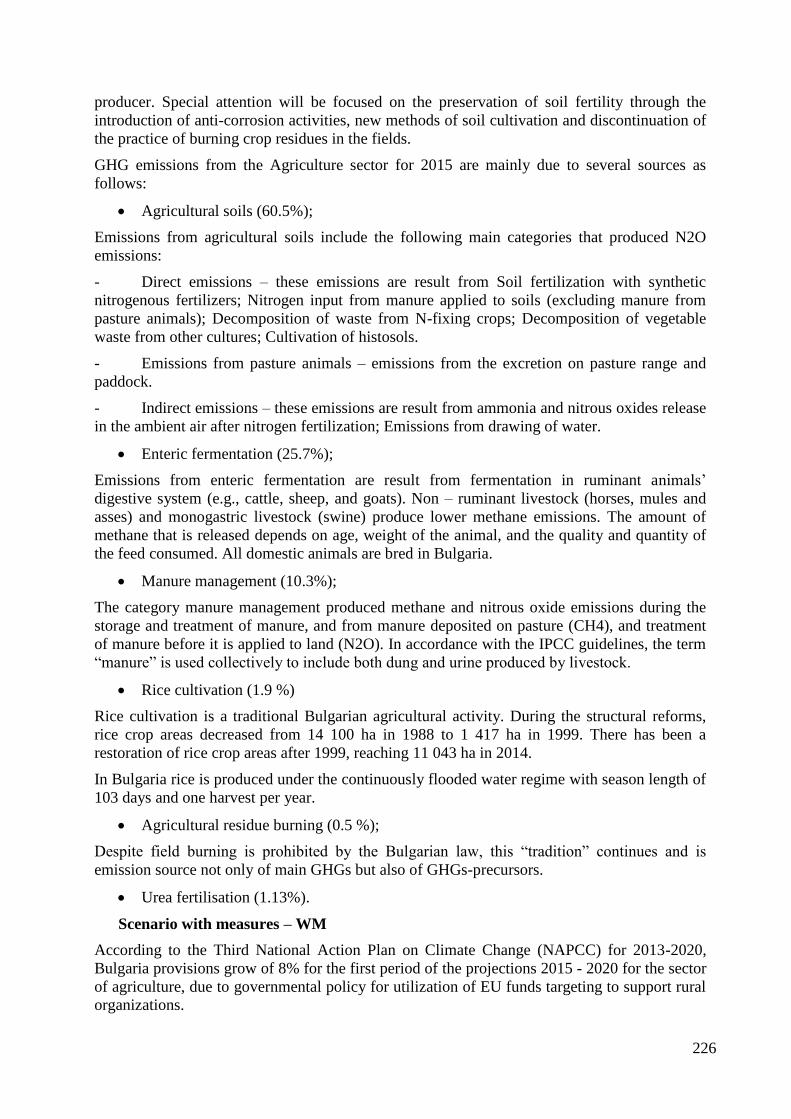
226
producer. Special attention will be focused on the preservation of soil fertility through the
introduction of anti-corrosion activities, new methods of soil cultivation and discontinuation of
the practice of burning crop residues in the fields.
GHG emissions from the Agriculture sector for 2015 are mainly due to several sources as
follows:
Agricultural soils (60.5%);
Emissions from agricultural soils include the following main categories that produced N2O
emissions:
- Direct emissions – these emissions are result from Soil fertilization with synthetic
nitrogenous fertilizers; Nitrogen input from manure applied to soils (excluding manure from
pasture animals); Decomposition of waste from N-fixing crops; Decomposition of vegetable
waste from other cultures; Cultivation of histosols.
- Emissions from pasture animals – emissions from the excretion on pasture range and
paddock.
- Indirect emissions – these emissions are result from ammonia and nitrous oxides release
in the ambient air after nitrogen fertilization; Emissions from drawing of water.
Enteric fermentation (25.7%);
Emissions from enteric fermentation are result from fermentation in ruminant animals’
digestive system (e.g., cattle, sheep, and goats). Non – ruminant livestock (horses, mules and
asses) and monogastric livestock (swine) produce lower methane emissions. The amount of
methane that is released depends on age, weight of the animal, and the quality and quantity of
the feed consumed. All domestic animals are bred in Bulgaria.
Manure management (10.3%);
The category manure management produced methane and nitrous oxide emissions during the
storage and treatment of manure, and from manure deposited on pasture (CH4), and treatment
of manure before it is applied to land (N2O). In accordance with the IPCC guidelines, the term
“manure” is used collectively to include both dung and urine produced by livestock.
Rice cultivation (1.9 %)
Rice cultivation is a traditional Bulgarian agricultural activity. During the structural reforms,
rice crop areas decreased from 14 100 ha in 1988 to 1 417 ha in 1999. There has been a
restoration of rice crop areas after 1999, reaching 11 043 ha in 2014.
In Bulgaria rice is produced under the continuously flooded water regime with season length of
103 days and one harvest per year.
Agricultural residue burning (0.5 %);
Despite field burning is prohibited by the Bulgarian law, this “tradition” continues and is
emission source not only of main GHGs but also of GHGs-precursors.
Urea fertilisation (1.13%).
Scenario with measures – WM
According to the Third National Action Plan on Climate Change (NAPCC) for 2013-2020,
Bulgaria provisions grow of 8% for the first period of the projections 2015 - 2020 for the sector
of agriculture, due to governmental policy for utilization of EU funds targeting to support rural
organizations.
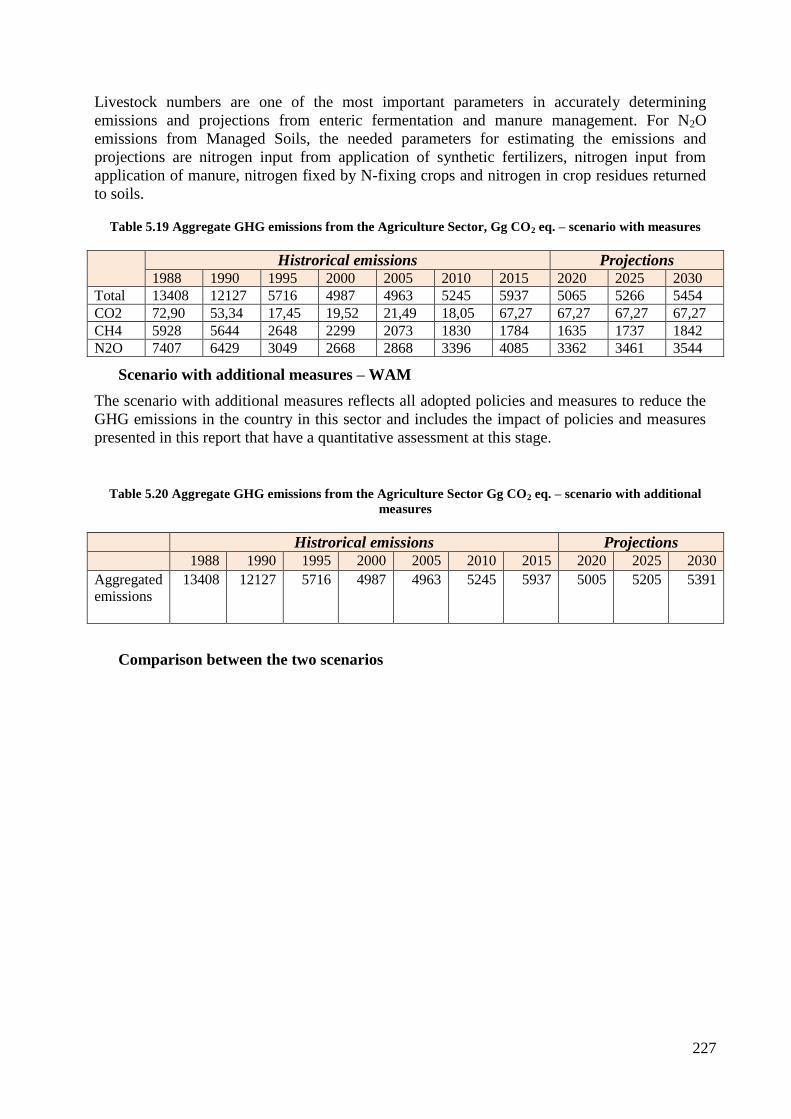
227
Livestock numbers are one of the most important parameters in accurately determining
emissions and projections from enteric fermentation and manure management. For N2O
emissions from Managed Soils, the needed parameters for estimating the emissions and
projections are nitrogen input from application of synthetic fertilizers, nitrogen input from
application of manure, nitrogen fixed by N-fixing crops and nitrogen in crop residues returned
to soils.
Table 5.19 Aggregate GHG emissions from the Agriculture Sector, Gg CO2 eq. – scenario with measures
Histrorical emissions Projections
1988 1990 1995 2000 2005 2010 2015 2020 2025 2030
Total 13408 12127 5716 4987 4963 5245 5937 5065 5266 5454 CO2 72,90 53,34 17,45 19,52 21,49 18,05 67,27 67,27 67,27 67,27 CH4 5928 5644 2648 2299 2073 1830 1784 1635 1737 1842 N2O 7407 6429 3049 2668 2868 3396 4085 3362 3461 3544
Scenario with additional measures – WAM
The scenario with additional measures reflects all adopted policies and measures to reduce the
GHG emissions in the country in this sector and includes the impact of policies and measures
presented in this report that have a quantitative assessment at this stage.
Table 5.20 Aggregate GHG emissions from the Agriculture Sector Gg CO2 eq. – scenario with additional
measures
Histrorical emissions Projections
1988 1990 1995 2000 2005 2010 2015 2020 2025 2030
Aggregated
emissions
13408 12127 5716 4987 4963 5245 5937 5005 5205 5391
Comparison between the two scenarios
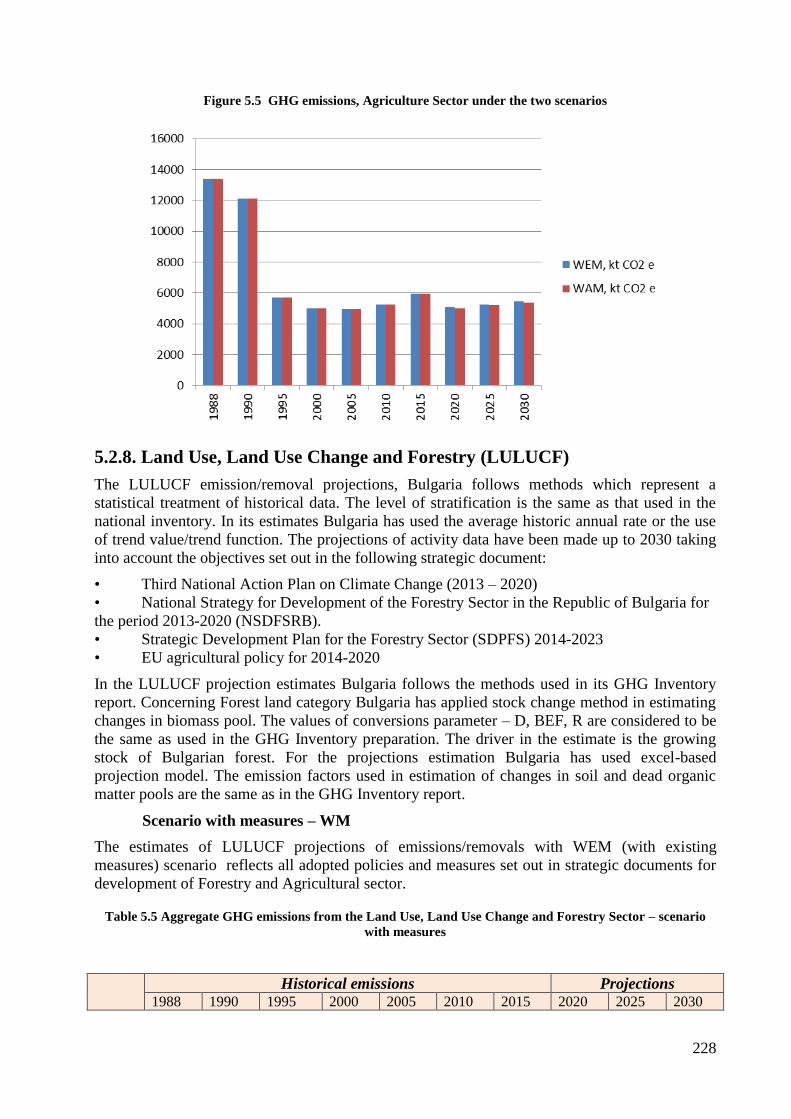
228
Figure 5.5 GHG emissions, Agriculture Sector under the two scenarios
5.2.8. Land Use, Land Use Change and Forestry (LULUCF)
The LULUCF emission/removal projections, Bulgaria follows methods which represent a
statistical treatment of historical data. The level of stratification is the same as that used in the
national inventory. In its estimates Bulgaria has used the average historic annual rate or the use
of trend value/trend function. The projections of activity data have been made up to 2030 taking
into account the objectives set out in the following strategic document:
• Third National Action Plan on Climate Change (2013 – 2020)
• National Strategy for Development of the Forestry Sector in the Republic of Bulgaria for
the period 2013-2020 (NSDFSRB).
• Strategic Development Plan for the Forestry Sector (SDPFS) 2014-2023
• EU agricultural policy for 2014-2020
In the LULUCF projection estimates Bulgaria follows the methods used in its GHG Inventory
report. Concerning Forest land category Bulgaria has applied stock change method in estimating
changes in biomass pool. The values of conversions parameter – D, BEF, R are considered to be
the same as used in the GHG Inventory preparation. The driver in the estimate is the growing
stock of Bulgarian forest. For the projections estimation Bulgaria has used excel-based
projection model. The emission factors used in estimation of changes in soil and dead organic
matter pools are the same as in the GHG Inventory report.
Scenario with measures – WM
The estimates of LULUCF projections of emissions/removals with WEM (with existing
measures) scenario reflects all adopted policies and measures set out in strategic documents for
development of Forestry and Agricultural sector.
Table 5.5 Aggregate GHG emissions from the Land Use, Land Use Change and Forestry Sector – scenario
with measures
Historical emissions Projections 1988 1990 1995 2000 2005 2010 2015 2020 2025 2030
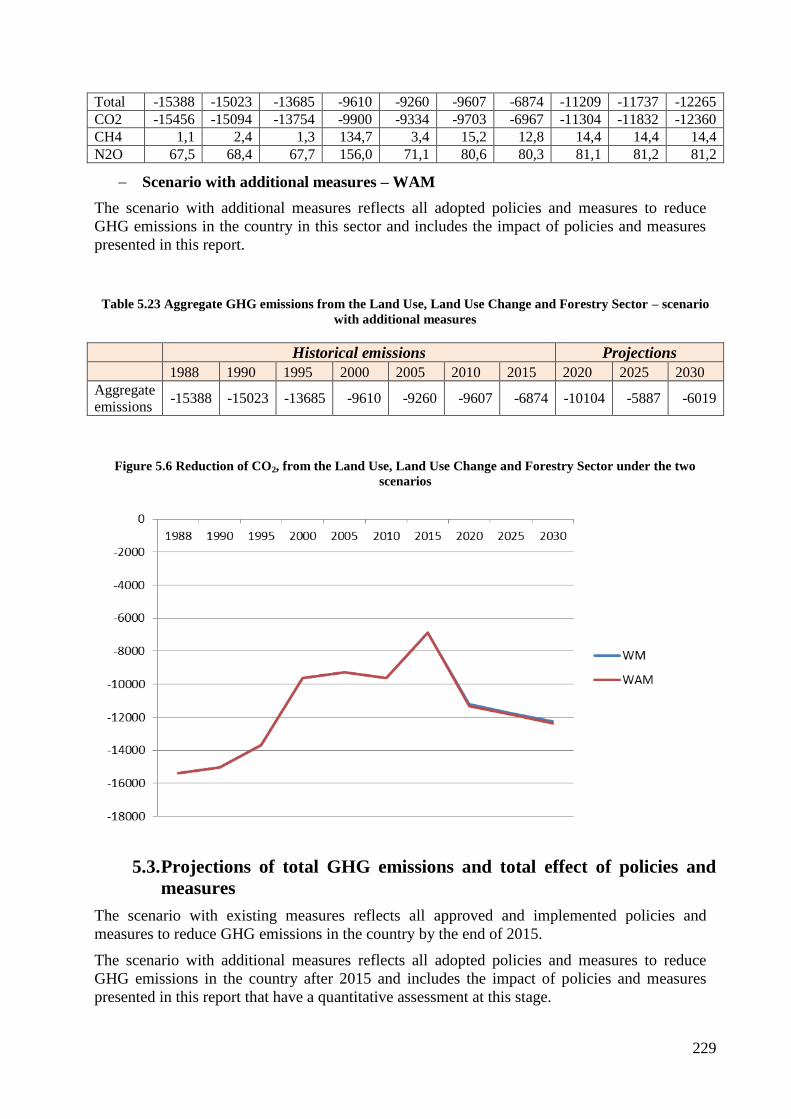
229
Total -15388 -15023 -13685 -9610 -9260 -9607 -6874 -11209 -11737 -12265 CO2 -15456 -15094 -13754 -9900 -9334 -9703 -6967 -11304 -11832 -12360 CH4 1,1 2,4 1,3 134,7 3,4 15,2 12,8 14,4 14,4 14,4 N2O 67,5 68,4 67,7 156,0 71,1 80,6 80,3 81,1 81,2 81,2
Scenario with additional measures – WAM
The scenario with additional measures reflects all adopted policies and measures to reduce
GHG emissions in the country in this sector and includes the impact of policies and measures
presented in this report.
Table 5.23 Aggregate GHG emissions from the Land Use, Land Use Change and Forestry Sector – scenario
with additional measures
Historical emissions Projections
1988 1990 1995 2000 2005 2010 2015 2020 2025 2030 Aggregate
emissions -15388 -15023 -13685 -9610 -9260 -9607 -6874 -10104 -5887 -6019
Figure 5.6 Reduction of CO2, from the Land Use, Land Use Change and Forestry Sector under the two
scenarios
5.3. Projections of total GHG emissions and total effect of policies and
measures
The scenario with existing measures reflects all approved and implemented policies and
measures to reduce GHG emissions in the country by the end of 2015.
The scenario with additional measures reflects all adopted policies and measures to reduce
GHG emissions in the country after 2015 and includes the impact of policies and measures
presented in this report that have a quantitative assessment at this stage.
230
Table 5.24 Aggregate GHG emissions of Bulgaria (excl. LULUCF)– Gg CO2 eq. - scenario with measures
2015 2020 2025 2030
Total emissions,
WM 61 482,75 59 086,83 55 580,88 55 492,74
The scenario with additional measures reflects all adopted policies and measures to reduce GHG
emissions in the country after 2015 and includes the impact of policies and measures presented
in this Plan that have a quantitative assessment at this stage.
Table 5.25 Aggregate GHG emissions of Bulgaria - Gg CO2 eq. - scenario with additional measures
2015 2020 2025 2030
Total emissions,
WAM 61 482,75 53 325,5 49 650,4 49 826,8
Comparison between the two scenarios is presented in the following Table 5.26
Table 5.26 Comparison between GHG emissions, aggregated for Bulgaria under the two scenarios
2015 2020 2025 2030
Aggregate emissions in Gg CO2 eq. ΔWAM-WEM 0 2889,9 2717,4 2571,1
∆ WAM - WEM, % 0 5,0 5.0 4.8
5.4. Supplementary relating to mechanisms under Article 6, 12 and 17, of
the Kyoto Protocol
Bulgaria has essential potential for further reduction of the carbon intensity of the economy.
This potential might be realized with the implementation of targeted policies and measures.
These policies and measures apply one or more political instruments, for example:
Legislative instruments: implementation of the EU and national legislative acts and
others;
Market orientated: participation in the international emission trading, EU Emissions
trading scheme;
Financial instruments: funds and different investment sources, as the green investment
scheme, energy efficiency funds, and state guarantee of loans;
Scientific and research activities;
Voluntary agreements and others.
Bulgaria as an Annex I Party of the Kyoto Protocol is participating in two of the flexible
mechanisms to the Kyoto Protocol: Joint Implementation under Article 6 and International
Emission Trading under Article 17.
The European greenhouse gas trading scheme (EU ETS) is a Community market mechanism
established in 2005 in order to encourage investments in low carbon production. The scheme is
based on the „cap and trade” principle and the first two trading periods (2005-2007 and 2008-
2012) were regulated by Directive 2003/87/EC. It functioned at Member State level on the
basis of National Allocation Plans (NAPs) developed by each country and approved by
decisions of the European Commission.
231
Pursuant to Directive 2008/101/EC, the scope of the ETS is enlarged to cover also aviation
activities as of 1 January 2012.
Bulgaria was included de jure in the EU ETS after it joined the EU in 2007, but de facto its
actual participation started after the NAP was approved for the second trading period (2008-
2012) by a decision of the Commission from April 2010. At the time of the approval of the
NAP, the Emission Trading Scheme in Bulgaria covered 132 installations. The total amount of
allowances for allocation was determined at just under 206 million (205,892,286) and included
the allowances for installations covered by the scheme, as well as those reserved for new
entrants and projects under the Joint Implementation mechanisms of the Kyoto Protocol.
Directive 2009/29/EC on ETS provides for the reduction of greenhouse gas emissions from
sources covered by the scheme by 21 % compared to their 2005 levels. The new elements can
be summarized as follows:
• inclusion of new sectors and gases;
• harmonized approach – a common cap on emissions, instead of 27 national limits;
• reserve for new entrants set at EU level (5% of the total allocation);
• a single registry;
• gradual increase of traded allowances at the expense of free allocation;
• harmonized rules for free allocation based on ambitious indicators;
• 100% auctioning of allowances for electricity generation.
In Phase III of the scheme, the default means of allocating allowances is auctioning. During the
current trading period (2013-2020), approximately the half of emission allowances are
allocated for free and half are auctioned. The power sector is included in the EU ETS, and
according to the rules in Phase III of the scheme, which commenced in 2013, no free
allowances should be given to the power sector. Under the derogation (Article 10(c) of the
revised EU-ETS Directive) free of charge allocation is allowed to existing power plants for a
transitional period (a decreasing number free of charge allowances, which by 2020 is 0). This is
conditional upon the country and Bulgaria must ensure that at least the equivalent value of the
free allowances is invested in modernising their electricity generation through investments set
out in a national plan included in their applications. All other installations receive free
allocations according to fixed EU benchmarks and risk for carbon dioxide leakage.
Regarding emissions from the aviation sector, since the beginning of 2012, emissions from all
flights from, to and within the European Economic Area (EEA) (i.e. the 28 EU Member States,
plus Iceland, Liechtenstein and Norway) are included in the EU ETS. The legislation, adopted
in 2008, applies to EU and non-EU aircraft operators. As the industrial installations covered by
the EU ETS, aircraft operators receive tradable allowances covering a certain level of CO2
emissions from their flights per year.
In April 2013 the EU decided to temporarily suspend enforcement of the EU ETS requirements
for flights in 2012 to and from non-European countries. For the period 2013-2016 the
legislation has also been amended so that only emissions from flights within the EEA fall under
the EU ETS.
Exemptions for aircraft operators with low emissions have also been introduced. The EU took
this initiative to allow time for the International Civil Aviation Organization (ICAO) Assembly
to reach a global agreement to tackle aviation emissions.
In October the ICAO Assembly agreed to develop by 2016 a global market-based mechanism
(MBM) addressing international aviation emissions and apply it by 2020. Until then countries
or groups of countries, such as the EU, can implement interim measures.
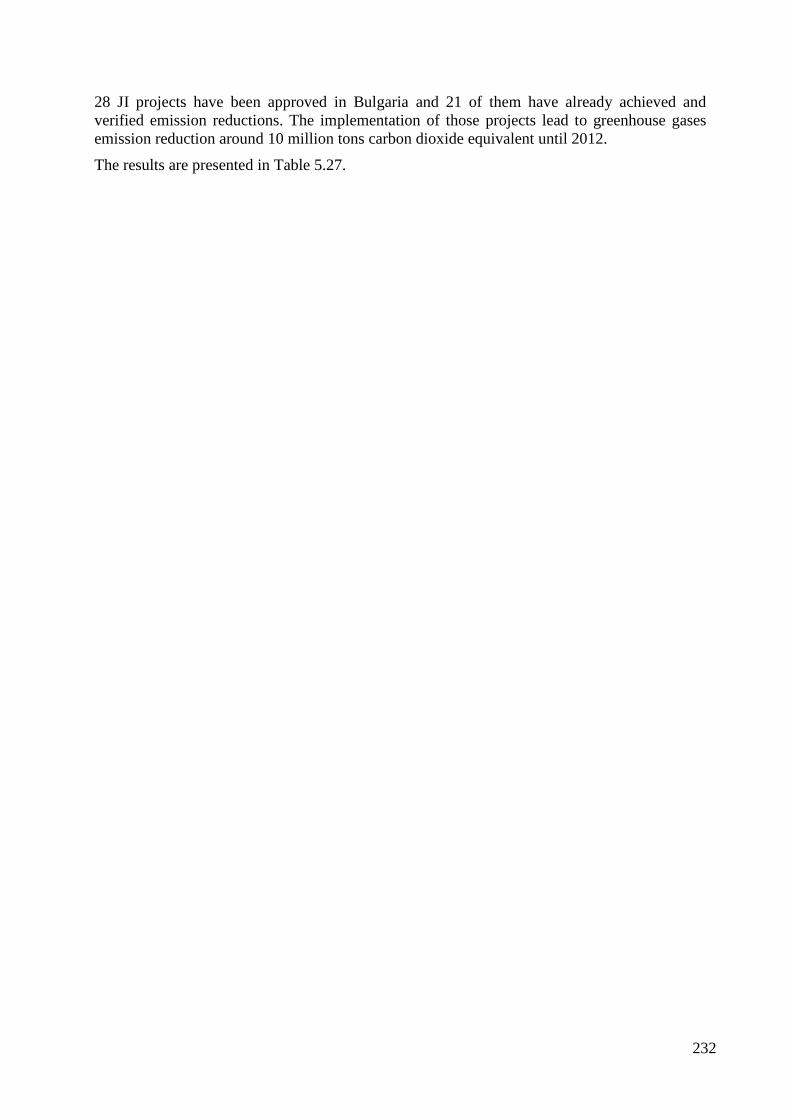
232
28 JI projects have been approved in Bulgaria and 21 of them have already achieved and
verified emission reductions. The implementation of those projects lead to greenhouse gases
emission reduction around 10 million tons carbon dioxide equivalent until 2012.
The results are presented in Table 5.27.
233
Table 5.27 Emissions reduction by implemented JI project
№ Project Name Issued AAU Issued ERU TOTAL
1 Portfolio of new cogeneration power stations for combined production of heat and electricity in District
Heating Company Pleven and District Heating Company Veliko Tarnovo, Bulgaria
50 067 770 772 820 839
2 Energy efficiency investment programme at Svilocell Pulp Mill 6 004 672 065 678 069
3 New cogeneration power station for combined production of heat and electricity in District Heating Bourgas,
Bulgaria
104 498 348 920 453 418
4 Cogeneration gas power stations AKB Fores 0 42 416 42 416
5 Reduction of Greenhouse Gases by Gasification in the Varna municipality 29 208 86 522 115 730
6 Sofia District Heating Project 925 462 158 538 1 084 000
7 Pernik District Heating project 157 000 626 834 783 834
8 Co-generation Gas Power Station Biovet 97 823 333 648 431 471
9 Reduction of Greenhouse gases by gasification of Sofia municipality 90 960 431 612 522 572
10 Reduction of Greenhouse gas by gasification of the towns of Veliko Turnovo, Gorna Oryahovitsa and
Lyaskovets
65 032 198 354 263 386
11 Svilosa Biomass Project 145 882 293 037 438 919
12 Methane gas Capture and Electricity Production at Kubratovo Wastewater Treatment, Sofia Bulgaria 36 212 536 185 572 397
13 Nitrous Oxide Reduction at Agropolychim Fertilizer Plant 808 184 1 565 070 2 373 254
14 Reduction of greenhouse gases by gasification of Burgas Municipality 0 60 323 60 323
15 Kaliakra Wind power project 0 299 281 299 281
16 Sunflower and rape seed – bio diesel fuel production and use for transportation in Bulgaria 0 258 435 258 435
17 Bulgarian Small Hydro Power Plant (SHPP) Portfolio 0 41 067 41 067
18 Bulgarian Energy Efficiency and renewable Energy portfolio project 91 511 136 694 228 205
19 Emission Reduction of Nitrous Oxide in Nitric Acid Production at Neochim PLC 0 105 593 105 593
20 Biomass Steam Boiler at Vinprom Peshtera 0 0 0
21 Sreden Iskar Cascade HPP Portfolio Project 0 98 180 98 180
TOTAL 2 607 843 7 063 546 9 671 389
234
Legislative instruments:
The main documents of the environmental policy are the Environmental Protection Act, the
secondary legislation, the National strategy for the environment. They offer a base for the
activities in the area of environmental policies including climate change. The second Action
Plan on climate change played the role to formulate the goals in this strategy through
determination of specific policies and measures, including actions on their introduction. This
approach is being developed in The Third Action Plan on Climate Change, which is approved
by the Council of Ministers on 01.06.2012. In addition, a set of political instruments for
application of the corresponding EU legislation measures and actions to meet the Kyoto
protocol requirements is available.
Multilateral international agreements:
United Nations Framework Convention on Climate Change (UNFCCC), enforced in
1995.
Kyoto Protocol to the UNFCCC, enforced in 2005
Paris Agreement to the UNFCCC, enforced in 2016
European legislation:
1. Directive 2003/87/EC of the European Parliament and of the Council of 13 October
2003 establishing a scheme for greenhouse gas emission allowance trading within the
Community and amending Council Directive 96/61/EC
2. Directive 2004/101/EC of the European Parliament and of the Council of 27 October
2004 amending Directive 2003/87/EC establishing a scheme for greenhouse gas
emission allowance trading within the Community, in respect of the Kyoto Protocol's
project mechanisms.
3. Commission Decision of 29 January 2004 establishing guidelines for the monitoring
and reporting of greenhouse gas emissions pursuant to Directive 2003/87/EC of the
European Parliament and of the Council
4. Regulation (EU) No 525/2013 of the European Parliament and of the Council of 21
May 2013 on a mechanism for monitoring and reporting greenhouse gas emissions and
for reporting other information at national and Union level relevant to climate change
and repealing Decision No 280/2004/EC
5. Commission Regulation (EC) No 2216/2004 of 21 December 2004 for a standardised
and secured system of registries pursuant to Directive 2003/87/EC of the European
Parliament and of the Council and Decision No 280/2004/EC of the European
Parliament and of the Council
6. Directive 2008/101/EC of the European Parliament and the Council of 19 November
2008 amending Directive 2003/87/EC so as to include aviation activities in the scheme
for greenhouse gas emission allowance trading within the Community
7. Directive 2009/28/EC of the European Parliament and of the Council on the promotion
of the use of energy from renewable sources and amending and subsequently repealing
Directives 2001/77/EC and 2003/30/EC
8. Directive 2009/29/EC of the European Parliament and the Council of 23 April 2009
amending Directive 2003/87/EC so as to improve and extend the greenhouse gas
emission allowance trading scheme of the Community
235
9. Directive 2009/31/EC of the European Parliament and the Council of April 23 2009 on
the geological storage of carbon dioxide and amending Council Directive 85/337/EEC,
European Parliament and Council Directives 2000/60/EC, 2001/80/EC, 2004/35/EC,
2006/12/EC, 2008/1/EC and Regulation (EC) No 1013/2006
10. Decision no 406/2009/EC of the European Parliament and of the Council of 23 April
2009 on the effort of Member States to reduce their greenhouse gas emissions to meet
the Community’s greenhouse gas emission reduction commitments up to 2020
11. Commission Decision №278/2011 of 27 April for determining transitional Union-wide
rules for harmonised free allocation of emission allowances pursuant to Article 10a of
Directive 2003/87/EC of the European Parliament and of the Council
12. Commission Regulation (EU) № 600/2012 of June 2012 on the verification of
greenhouse emission reports and tonne-kilometre and the accreditation of verifiers
pursuant to Directive 2003/87/EC of the European Parliament and the Council.
13. Commission Regulation (EU) № 601/2012 of 21 June 2012 on the monitoring and
reporting of greenhouse gas emissions pursuant to Directive 2003/87/EC of the
European Parliament and of the Council Text with EEA relevance
National legislation:
1. Ratification act of the United Nations Framework Convention on Climate Change
(UNFCCC)(published in State Gazette, No 28/28.03.1995)
2. Ratification act of the Kyoto Protocol (published in State Gazette, No 72/25.07.2002)
3. Climate Change Mitigation Act
4. Environmental Protection Act as amended
5. Amendment of the Environmental Protection Act in order to introduce The National
Green investment scheme (published in State Gazette, No 46/18.06.2010)
6. Decision of the Council of Ministers No1012/21.12.2004 approving the Second
National Action Plan on climate change
7. Decision of the Council of Ministers No439/01.06.2012 approving the Third National
Action Plan on climate change
8. Five Acts for ratification of the Bilateral Cooperation Agreements in the field of the
Joint implementation mechanism under the Kyoto Protocol, respectively with the
Netherlands, Austria, Switzerland, Denmark and the Prototype Carbon Fund of the
World Bank, Sweden
9. Ratification act of the Paris Agreement (published in State Gazette, No 86/01.11.2016)
In June 2010 an Amendment to the Environmental Protection Act (EPA) was approved by the
Council of Ministers and the National Assembly. The legislation creates the main legal
framework of the Bulgarian National Green Investment Scheme (NGIS) and allows
Bulgarian government to participate in the International Emission Trading mechanism
according to the Article 17 of the Kyoto Protocol. EPA defines the entire process from selling
of AAUs to “greening” of the revenues. EPA empowers the National Trust Eco Fund (NTEF)
to administer and implement the NGIS. NTEF elaborates rules for selection, assessment and
approval of projects that would reduce emissions and would be reimbursed by the NGIS.
The Regulation on Organization and Activities of the National Trust Ecofund is presented on
the next figure.
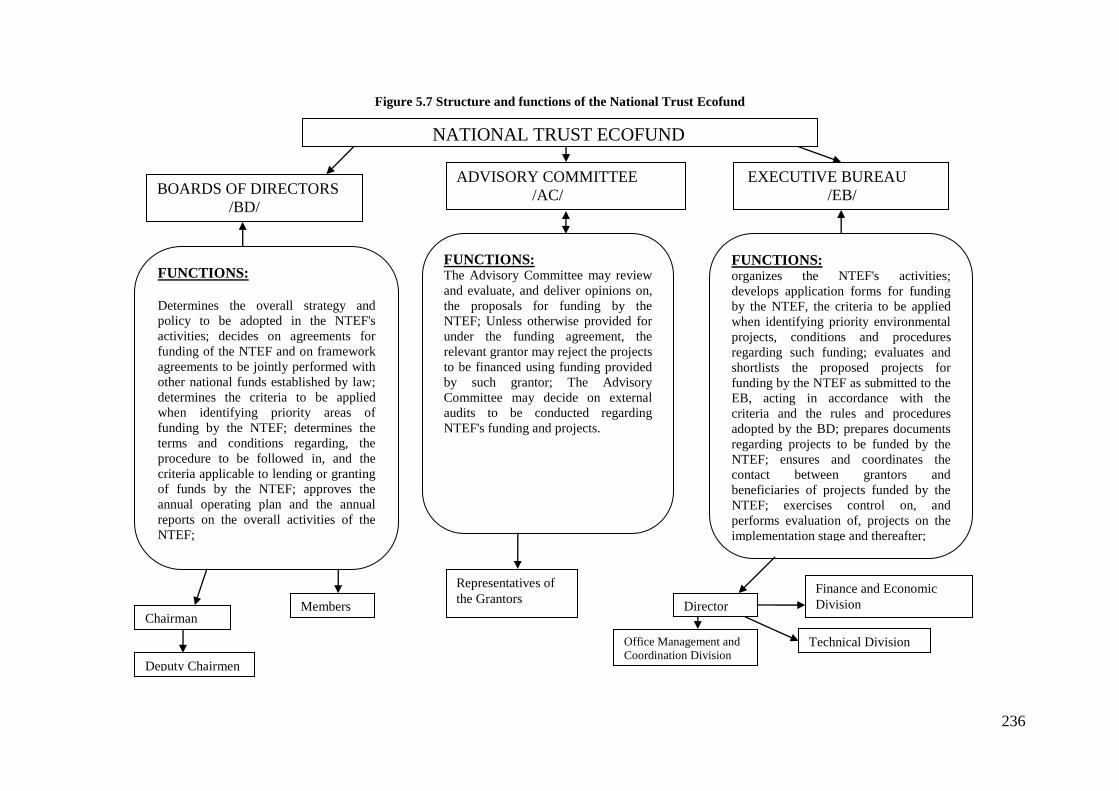
236
Figure 5.7 Structure and functions of the National Trust Ecofund
NATIONAL TRUST ECOFUND
STRUCTURE
BOARDS OF DIRECTORS
/BD/
ADVISORY COMMITTEE
/AC/
EXECUTIVE BUREAU
/EB/
FUNCTIONS:
Determines the overall strategy and
policy to be adopted in the NTEF's
activities; decides on agreements for
funding of the NTEF and on framework
agreements to be jointly performed with
other national funds established by law;
determines the criteria to be applied
when identifying priority areas of
funding by the NTEF; determines the
terms and conditions regarding, the
procedure to be followed in, and the
criteria applicable to lending or granting
of funds by the NTEF; approves the
annual operating plan and the annual
reports on the overall activities of the
NTEF;
FUNCTIONS: The Advisory Committee may review
and evaluate, and deliver opinions on,
the proposals for funding by the
NTEF; Unless otherwise provided for
under the funding agreement, the
relevant grantor may reject the projects
to be financed using funding provided
by such grantor; The Advisory
Committee may decide on external
audits to be conducted regarding
NTEF's funding and projects.
FUNCTIONS: organizes the NTEF's activities;
develops application forms for funding
by the NTEF, the criteria to be applied
when identifying priority environmental
projects, conditions and procedures
regarding such funding; evaluates and
shortlists the proposed projects for
funding by the NTEF as submitted to the
EB, acting in accordance with the
criteria and the rules and procedures
adopted by the BD; prepares documents
regarding projects to be funded by the
NTEF; ensures and coordinates the
contact between grantors and
beneficiaries of projects funded by the
NTEF; exercises control on, and
performs evaluation of, projects on the
implementation stage and thereafter;
Chairman
Deputy Chairmen
Members
Representatives of
the Grantors
Office Management and
Coordination Division
Director
Finance and Economic
Division
Technical Division
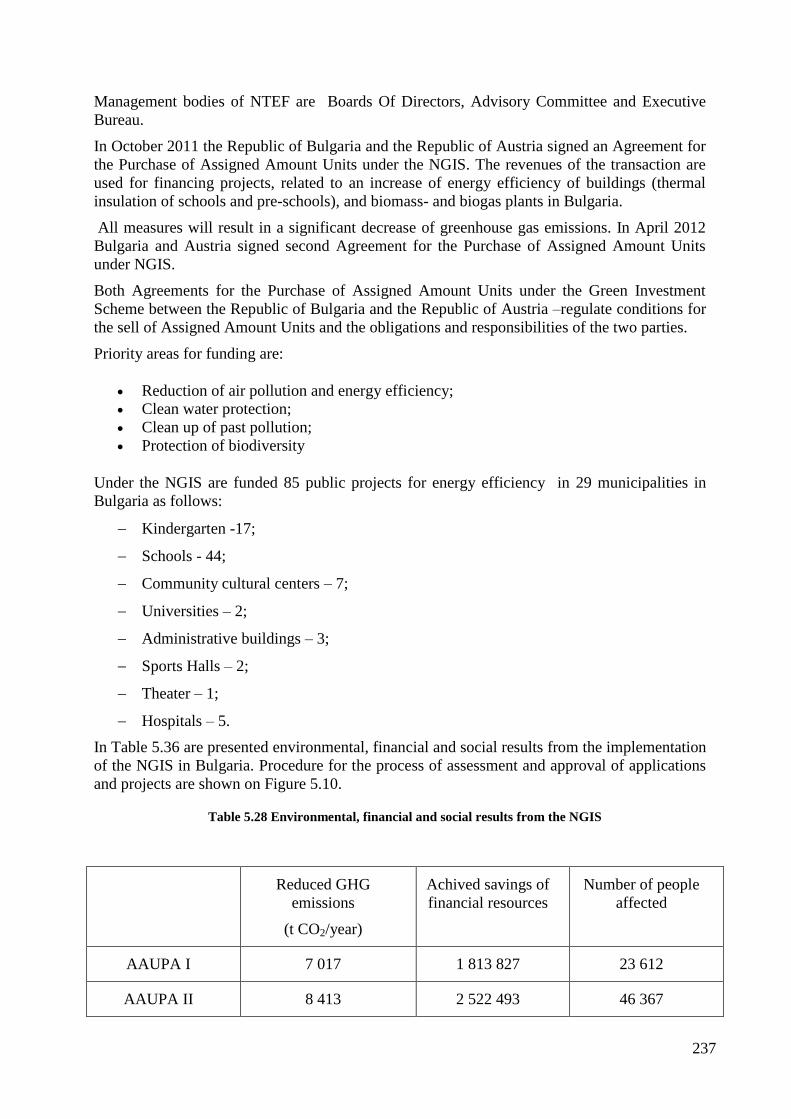
237
Management bodies of NTEF are Boards Of Directors, Advisory Committee and Executive
Bureau.
In October 2011 the Republic of Bulgaria and the Republic of Austria signed an Agreement for
the Purchase of Assigned Amount Units under the NGIS. The revenues of the transaction are
used for financing projects, related to an increase of energy efficiency of buildings (thermal
insulation of schools and pre-schools), and biomass- and biogas plants in Bulgaria.
All measures will result in a significant decrease of greenhouse gas emissions. In April 2012
Bulgaria and Austria signed second Agreement for the Purchase of Assigned Amount Units
under NGIS.
Both Agreements for the Purchase of Assigned Amount Units under the Green Investment
Scheme between the Republic of Bulgaria and the Republic of Austria –regulate conditions for
the sell of Assigned Amount Units and the obligations and responsibilities of the two parties.
Priority areas for funding are:
Reduction of air pollution and energy efficiency;
Clean water protection;
Clean up of past pollution;
Protection of biodiversity
Under the NGIS are funded 85 public projects for energy efficiency in 29 municipalities in
Bulgaria as follows:
Kindergarten -17;
Schools - 44;
Community cultural centers – 7;
Universities – 2;
Administrative buildings – 3;
Sports Halls – 2;
Theater – 1;
Hospitals – 5.
In Table 5.36 are presented environmental, financial and social results from the implementation
of the NGIS in Bulgaria. Procedure for the process of assessment and approval of applications
and projects are shown on Figure 5.10.
Table 5.28 Environmental, financial and social results from the NGIS
Reduced GHG
emissions
(t CO2/year)
Achived savings of
financial resources
Number of people
affected
AAUPA I 7 017 1 813 827 23 612
AAUPA II 8 413 2 522 493 46 367
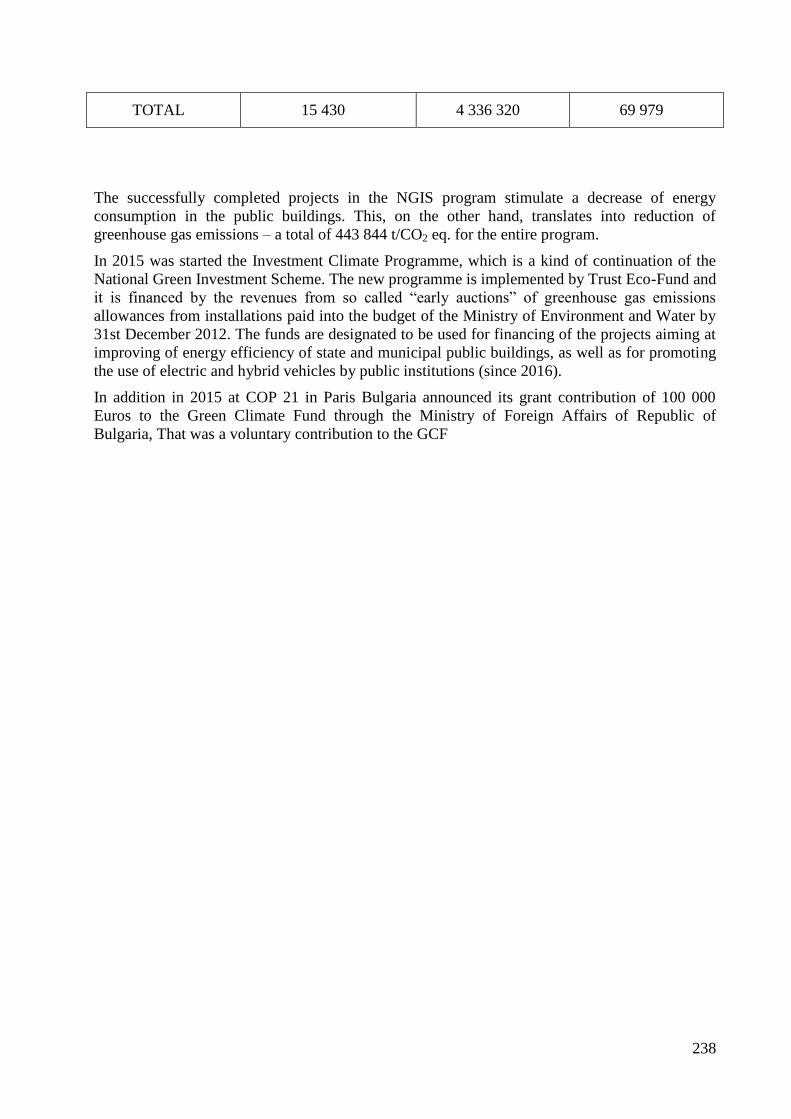
238
TOTAL 15 430 4 336 320 69 979
The successfully completed projects in the NGIS program stimulate a decrease of energy
consumption in the public buildings. This, on the other hand, translates into reduction of
greenhouse gas emissions – a total of 443 844 t/CO2 eq. for the entire program.
In 2015 was started the Investment Climate Programme, which is a kind of continuation of the
National Green Investment Scheme. The new programme is implemented by Trust Eco-Fund and
it is financed by the revenues from so called “early auctions” of greenhouse gas emissions
allowances from installations paid into the budget of the Ministry of Environment and Water by
31st December 2012. The funds are designated to be used for financing of the projects aiming at
improving of energy efficiency of state and municipal public buildings, as well as for promoting
the use of electric and hybrid vehicles by public institutions (since 2016).
In addition in 2015 at COP 21 in Paris Bulgaria announced its grant contribution of 100 000
Euros to the Green Climate Fund through the Ministry of Foreign Affairs of Republic of
Bulgaria, That was a voluntary contribution to the GCF
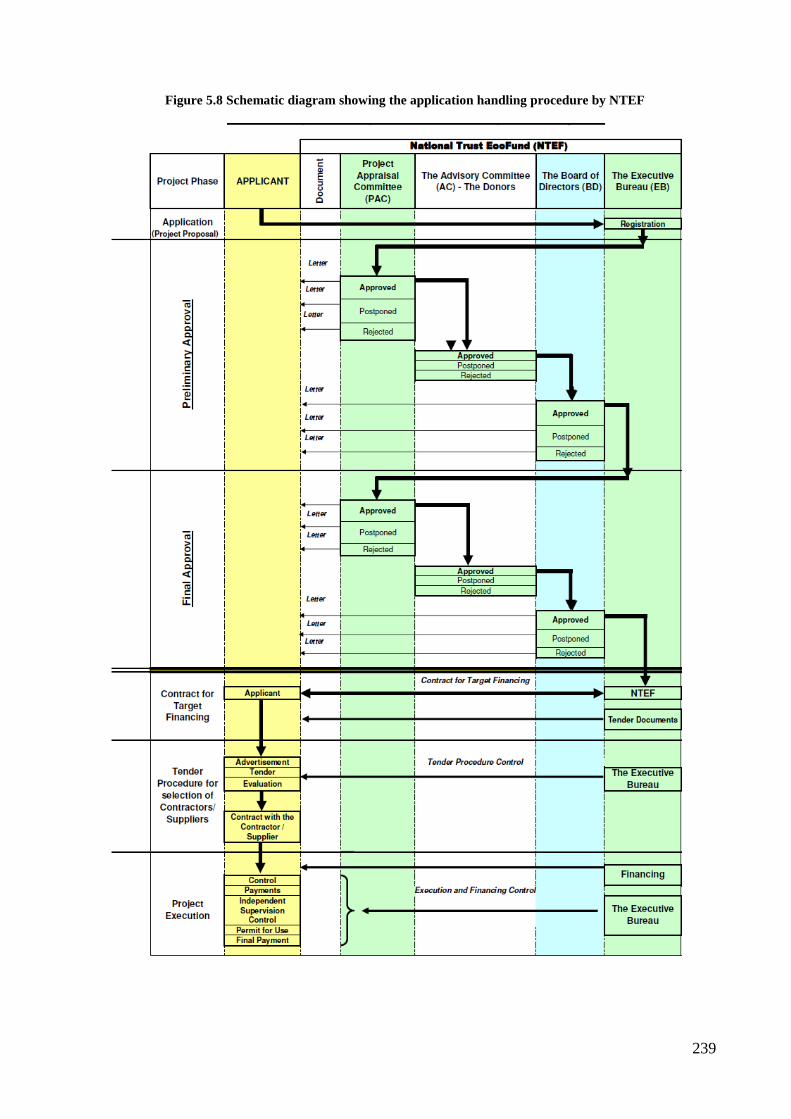
239
Figure 5.8 Schematic diagram showing the application handling procedure by NTEF
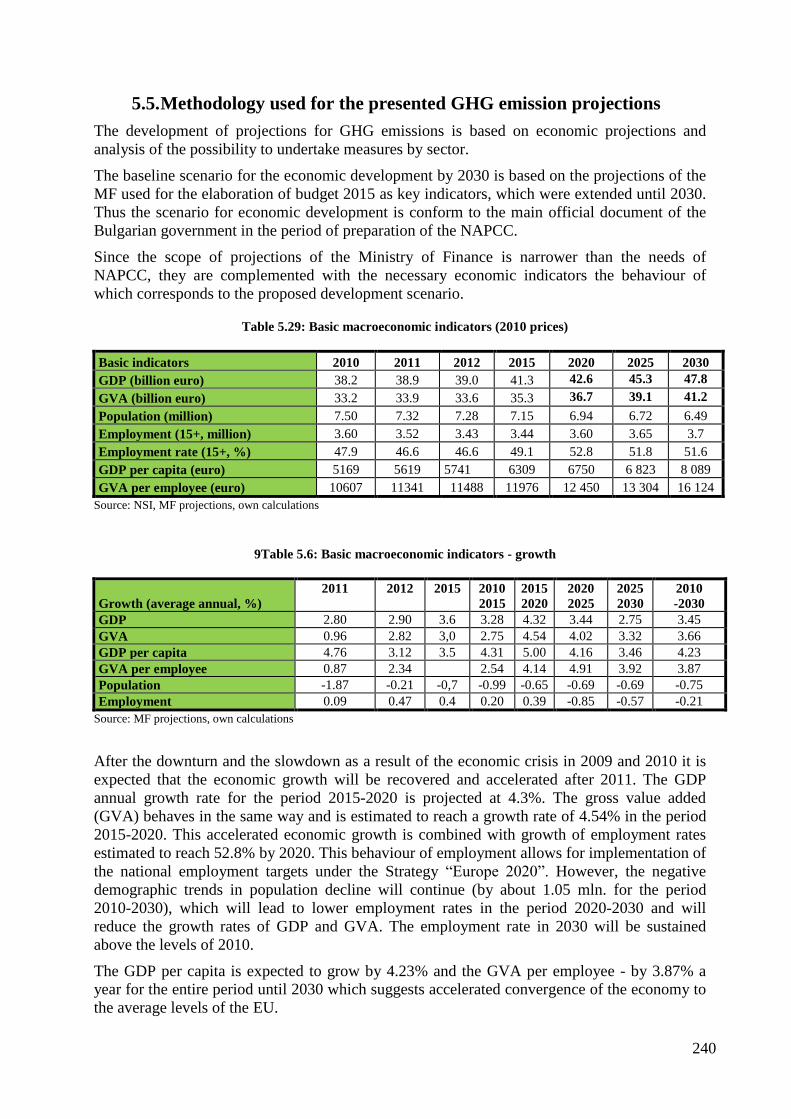
240
5.5. Methodology used for the presented GHG emission projections
The development of projections for GHG emissions is based on economic projections and
analysis of the possibility to undertake measures by sector.
The baseline scenario for the economic development by 2030 is based on the projections of the
MF used for the elaboration of budget 2015 as key indicators, which were extended until 2030.
Thus the scenario for economic development is conform to the main official document of the
Bulgarian government in the period of preparation of the NAPCC.
Since the scope of projections of the Ministry of Finance is narrower than the needs of
NAPCC, they are complemented with the necessary economic indicators the behaviour of
which corresponds to the proposed development scenario.
Table 5.29: Basic macroeconomic indicators (2010 prices)
Basic indicators 2010 2011 2012 2015 2020 2025 2030
GDP (billion euro) 38.2 38.9 39.0 41.3 42.6 45.3 47.8
GVA (billion euro) 33.2 33.9 33.6 35.3 36.7 39.1 41.2
Population (million) 7.50 7.32 7.28 7.15 6.94 6.72 6.49
Employment (15+, million) 3.60 3.52 3.43 3.44 3.60 3.65 3.7
Employment rate (15+, %) 47.9 46.6 46.6 49.1 52.8 51.8 51.6
GDP per capita (euro) 5169 5619 5741 6309 6750 6 823 8 089
GVA per employee (euro) 10607 11341 11488 11976 12 450 13 304 16 124
Source: NSI, MF projections, own calculations
9Table 5.6: Basic macroeconomic indicators - growth
Growth (average annual, %)
2011 2012 2015 2010
2015
2015
2020
2020
2025
2025
2030
2010
-2030
GDP 2.80 2.90 3.6 3.28 4.32 3.44 2.75 3.45
GVA 0.96 2.82 3,0 2.75 4.54 4.02 3.32 3.66
GDP per capita 4.76 3.12 3.5 4.31 5.00 4.16 3.46 4.23
GVA per employee 0.87 2.34 2.54 4.14 4.91 3.92 3.87
Population -1.87 -0.21 -0,7 -0.99 -0.65 -0.69 -0.69 -0.75
Employment 0.09 0.47 0.4 0.20 0.39 -0.85 -0.57 -0.21
Source: MF projections, own calculations
After the downturn and the slowdown as a result of the economic crisis in 2009 and 2010 it is
expected that the economic growth will be recovered and accelerated after 2011. The GDP
annual growth rate for the period 2015-2020 is projected at 4.3%. The gross value added
(GVA) behaves in the same way and is estimated to reach a growth rate of 4.54% in the period
2015-2020. This accelerated economic growth is combined with growth of employment rates
estimated to reach 52.8% by 2020. This behaviour of employment allows for implementation of
the national employment targets under the Strategy “Europe 2020”. However, the negative
demographic trends in population decline will continue (by about 1.05 mln. for the period
2010-2030), which will lead to lower employment rates in the period 2020-2030 and will
reduce the growth rates of GDP and GVA. The employment rate in 2030 will be sustained
above the levels of 2010.
The GDP per capita is expected to grow by 4.23% and the GVA per employee - by 3.87% a
year for the entire period until 2030 which suggests accelerated convergence of the economy to
the average levels of the EU.
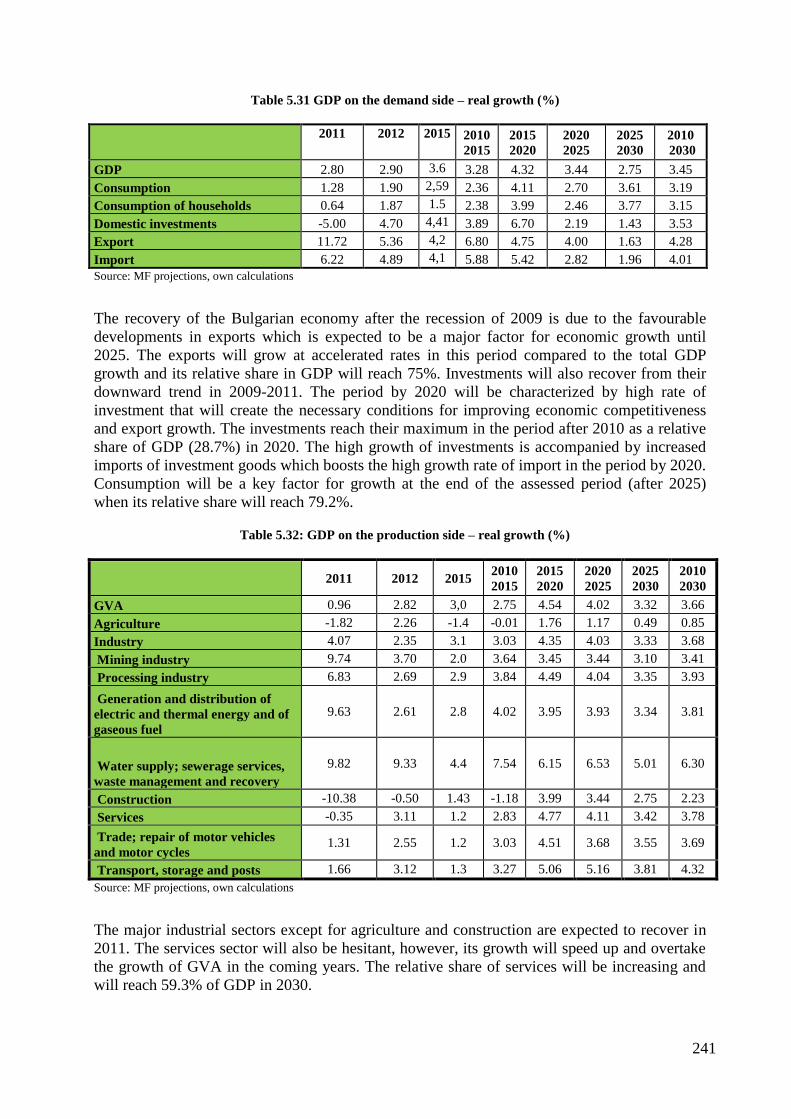
241
Table 5.31 GDP on the demand side – real growth (%)
2011 2012 2015 2010
2015
2015
2020
2020
2025
2025
2030
2010
2030
GDP 2.80 2.90 3.6 3.28 4.32 3.44 2.75 3.45
Consumption 1.28 1.90 2,59 2.36 4.11 2.70 3.61 3.19
Consumption of households 0.64 1.87 1.5 2.38 3.99 2.46 3.77 3.15
Domestic investments -5.00 4.70 4,41 3.89 6.70 2.19 1.43 3.53
Export 11.72 5.36 4,2 6.80 4.75 4.00 1.63 4.28
Import 6.22 4.89 4,1 5.88 5.42 2.82 1.96 4.01
Source: MF projections, own calculations
The recovery of the Bulgarian economy after the recession of 2009 is due to the favourable
developments in exports which is expected to be a major factor for economic growth until
2025. The exports will grow at accelerated rates in this period compared to the total GDP
growth and its relative share in GDP will reach 75%. Investments will also recover from their
downward trend in 2009-2011. The period by 2020 will be characterized by high rate of
investment that will create the necessary conditions for improving economic competitiveness
and export growth. The investments reach their maximum in the period after 2010 as a relative
share of GDP (28.7%) in 2020. The high growth of investments is accompanied by increased
imports of investment goods which boosts the high growth rate of import in the period by 2020.
Consumption will be a key factor for growth at the end of the assessed period (after 2025)
when its relative share will reach 79.2%.
Table 5.32: GDP on the production side – real growth (%)
2011 2012 2015
2010
2015
2015
2020
2020
2025
2025
2030
2010
2030
GVA 0.96 2.82 3,0 2.75 4.54 4.02 3.32 3.66
Agriculture -1.82 2.26 -1.4 -0.01 1.76 1.17 0.49 0.85
Industry 4.07 2.35 3.1 3.03 4.35 4.03 3.33 3.68
Mining industry 9.74 3.70 2.0 3.64 3.45 3.44 3.10 3.41
Processing industry 6.83 2.69 2.9 3.84 4.49 4.04 3.35 3.93
Generation and distribution of
electric and thermal energy and of
gaseous fuel
9.63 2.61 2.8 4.02 3.95 3.93 3.34 3.81
Water supply; sewerage services,
waste management and recovery
9.82 9.33 4.4 7.54 6.15 6.53 5.01 6.30
Construction -10.38 -0.50 1.43 -1.18 3.99 3.44 2.75 2.23
Services -0.35 3.11 1.2 2.83 4.77 4.11 3.42 3.78
Trade; repair of motor vehicles
and motor cycles 1.31 2.55 1.2 3.03 4.51 3.68 3.55 3.69
Transport, storage and posts 1.66 3.12 1.3 3.27 5.06 5.16 3.81 4.32
Source: MF projections, own calculations
The major industrial sectors except for agriculture and construction are expected to recover in
2011. The services sector will also be hesitant, however, its growth will speed up and overtake
the growth of GVA in the coming years. The relative share of services will be increasing and
will reach 59.3% of GDP in 2030.
242
The fluctuating performance of agriculture will continue throughout the period while the
average annual economic growth will remain below the overall growth rate of GVA. This
determines the reduction of its relative share which will reach 3.4% of GDP by 2030.
The high growth rates in the construction sector in the period before the crisis are not expected
to be repeated. The period by 2015 will be characterized by a small average annual decline in
construction. After 2015 the industry will have positive growth rates and after 2020 its relative
share will stabilize at levels of 4.6% of GDP.
The industrial sector will be characterized by growth rates (3.68%) very close to those of GVA
(3.66%) throughout the period, and its relative share will reach 26.6% in 2030. In 2011 the
industry will begin to recover from the crisis at expected relatively high rates of growth.
Among the industrial sectors with highest expected rate of growth is the sector of “Water
supply; sewerage, waste management and recovery”. This sector will mark the highest growth
rates during the period. Waste management is a sector with the greatest potential for
development and the relative share of the treated waste is expected to increase significantly at
the expense of the untreated waste.
The mining industry will realize relatively lower growth rates than the overall growth of GVA,
and its relative share in GDP at the end of the period will be 11.9%, which does not represent a
significant change compared to 2010 when it was 12%.
The processing industry will grow at a faster pace than the overall growth of GVA and at the
end of the period it will reach a relative share of 15.6% of GDP.
5.6. Economic analysis of the possibility to undertake measures by sectors
The analysis is based on the scenario for economic development by 2030. The goal is to assess
the feasibility of measures by sectors in terms of economic development. In principle, the
reduction of greenhouse gas emissions is assessed under stable and unchanged macroeconomic
indicators. Thus the effective reduction of emissions is estimated without reducing the actual
production and consumption.
The effects of the measures proposed to reduce the emissions may be assessed on the side of
production (supply) by sectors – improvement of the quality of human capital, technologies and
efficiency and on the demand side – through the investment required to implement the
measures.
The assessment of investment possibilities should take into account that the total amount of
investments for the entire economy for the period 2012-2020 is 214 bln. BGN at current prices
of 2011 (because the investments proposed in individual sectors are also at current prices). The
total cost of the planned measures is 10.575 bln. BGN or 4.9% of the total investments in the
economy for that period. The expected reduction in emissions as a result of the intended
measures is estimated at 44.832 mln. tonnes of CO2 eq., which means that the cost of each
saved tonne of emissions is estimated at 236 BGN. It should be taken into account that
measures include implementation of both existing (in 2012) and planned (by 2020) strategies
and sectoral policies.
The conservation, the rational and responsible use of resources is essential not only for
improving and protecting the environment, but for achieving sustainable economic growth and
increasing the competitiveness of the Bulgarian economy. The introduction of low carbon,
energy efficient and low waste technologies, as well as the recovery and recycling of greater
amounts of waste contribute to improving productivity and resource efficiency. This creates
243
opportunities for finding new sources of growth and jobs through cost savings, marketing of
innovation and better management of resources throughout their life cycle.
5.6.1. Energy
The measures in the Energy Sector are consistent with the Energy Strategy of Bulgaria by
2020. This suggests security of resources as a prerequisite for the approval of the document.
The main sources of financing are to be the Structural Funds, the green investment scheme,
Kozloduy Fund, the state budget and private investments that would ensure high cost efficiency
of projects. The planned investments in direct and indirect measures are more than 6189 mln.
BGN, which is a considerable resource and accounts for nearly 2.9% of the total investment in
the economy over the entire period. The investments planned for direct measures are 1753 mln.
BGN and will lead to saving 18 mln. tonnes of emissions at an average cost of 97.4 BGN per
tonne of saved emissions.
According to the macroeconomic scenario the sector “Production and distribution of electric
and thermal energy and gaseous fuels” will grow on average by 3.8% in the period by 2030 and
its relative share in GDP will slightly rise from 3.3% to 3.6 %.
The specific measures are aimed at improving the efficiency of energy production and
transition from coal to natural gas in some plants, improving the technologies used to produce
energy from coal, including the use of “clean” coal technologies. Changes are to be effected
also in the energy mix, aimed at increasing the target values of the shares of electricity from
nuclear sources and from renewable sources – 15% of the electricity mix, as well as at
increasing the use of high efficiency cogeneration.
In order to reduce the amount of greenhouse gas emissions, to use less resources and to achieve
respectively lower cost of energy, concrete measures for more efficient production in existing
plants amounting at 240 mln. BGN are envisaged for the period 2013-2020. In addition,
replacement of technologies will be undertaken to allow transition from coal to natural gas,
where the required investments worth 720 mln. BGN. The expected effect from these measures
in terms of reduced emissions is respectively 4.68 mln. and 11.7 mln. tonnes of CO2 eq. which
means that the average cost of saved emissions is respectively 51 BGN/tonne and 62
BGN/tonne. This means that these measures have the lowest cost per tonne of saved emissions
in the energy sector . In addition, the main sources of funding will be private investments,
European programmes and revenues under art. 10c of Directive 2003/87/EC, which will
significantly limit the use of public funds.
Another important tool for reducing emissions is the use of high efficiency cogeneration, where
the investment is estimated at approximately 790 mln. BGN for the period 2013-2020 and will
lead to emissions reduction of 1.6 mln. tonnes CO2eq. The estimated average price of a tonne
saved emissions is 494 BGN, which significantly exceeds the results of the previous two
measures.
Immediate effect from an increased share of electricity from renewable sources is the reduction
of greenhouse gas emissions as this production does not generate any emissions. Bulgaria has a
significant potential of renewable energy sources and the encouragement of investments therein
directly contributes to diversification of the energy mix and to slowing down the process of
exhaustion of local energy resources. An important aspect here is the decentralized production
of energy and the consumption of energy from renewable sources by households. The specific
measure to be implemented is to increase the share of energy for heating and cooling from
renewable sources which will contribute to reducing greenhouse gas emissions by 488000
tonnes by 2020.
244
The most prominent of the indirect measures is the one aimed at increasing the share of
electricity from renewable sources in the electricity mix and that is related and contributes to
the implementation of the national target with regard to the share of renewable energy in the
gross final energy consumption by 2020. The investments required for this measure are
estimated at 4183 mln. BGN.
5.6.2. Energy efficiency
The improvement of the efficiency of energy production and consumption will increase the
competitiveness of enterprises and the possibilities to generate higher added value. The total
amount of foreseen investment is about 950 mln. BGN that will lead to reduction of emissions
by 3.5 mln. tonnes. The average cost per ton of saved emissions in the sector is 270 BGN , and
the main sources to finance these investments are the European funds, different financial
schemes in this field, credit lines, the state budget and private investments.
The growing use of natural gas in households has a positive energy saving and environmental
effect, but increases the dependency on imported energy resources. The supply of natural gas to
30% of households by 2020 will increase the import of natural gas and the dependence on
imported oil and natural gas will rise from 36.7% in the baseline scenario to 48% in case of
gasification. The risk of supply disruption will be managed through diversification of the
sources of natural gas supply by building gas system interconnections with Greece, Romania,
Turkey and Serbia, by participation in major international projects and expansion of the
country’s existing gas storage facilities.
Reducing the consumption of electricity by substituting it with natural gas will lead to more
efficient use of resources, lower costs and better and healthier environment. The use of natural
gas in households and in the provision of services is substantiated by the measure for
accelerated gasification which is part of the Second National Action Plan for Energy Efficiency
covering the period 2011-2016 and will probably be extended to the next action plan.
According to this measure 430000 households will have access to natural gas, the investment
needs are estimated at 774 mln. BGN and the expected reduction is respectively 2.4 mln.
tonnes CO2eq. The cost of this measure per saved tonne of greenhouse gas emissions is 322.5
BGN however without its application it would be impossible to secure access to natural gas for
households by 2020, neither to achieve the results of the accompanying measures that are
important in terms of efficiency of energy consumption and in terms of reducing emissions.
Improvement of the efficiency and savings in the final fuel and energy consumption will be
carried out largely through sanitation of at least 3% of the public and state-owned buildings
with total floor space of over 250m2 per year in order to ensure the fulfilment of the minimum
requirements to the energy performance of these buildings. The investments are estimated at
34.2 mln. BGN, and the reduced emissions are equivalent to 204000 tonnes of CO2. Sources of
financing the measure are the structural funds, the green investment scheme, the state budget.
The cost of one tonne saved emissions is 168 BGN which makes the measure significantly
more effective than the average level for the Energy efficiency sector as a whole.
Decentralization of production is to be realized through the national programme “1000 sunny
roofs” that will be implemented during the period 2015-2020. The investment is estimated at
140.5 mln. BGN to be provided by the European funds, the Energy Efficiency Fund, private
investments and other sources and will contribute to reducing emissions by 107 200 tonnes of
CO2 eq. The relative cost per tonne of saved emissions is 1308 BGN and is the highest one for
all proposed measures in the sector.
245
5.6.3. Industry
The measures in the Industry Sector are aimed at improving the energy efficiency and at
optimal utilization of resources. The main source of funding is the programme
“Competitiveness” and its eventual extension in the next programming period. The planned
investments amount to 361.6 mln. BGN, of which 261.6 mln. BGN have a direct effect and the
remaining 100 mln. BGN have an indirect effect. The investments are relatively small in
volume with respect to the total investments in the economy. The estimated savings in CO2
emissions from the measures with direct impact amount to 5.6 mln. tonnes, i.e. the investment
per reduced tonne of emissions is slightly more than 46 BGN which makes the measures
relatively efficient.
The direct measures involve, on one hand, the technology used in the industry thus creating
preconditions for increase in production competitiveness by reducing the energy intensity in the
sector and the final energy consumption.
Other measures are aimed at the utilization of alternative fuels such as biodegradable waste,
thus increasing resource efficiency, decreasing the dependence on imported fuels and meeting
the requirements related to the prohibition of landfilling of biodegradable waste. The measure
is consistent also with the estimates in the macroeconomic scenario according to which the
value added in the industrial sector “Water supply, sewerage, waste management and
remediation activities” grows by 94% in 2020 compared to 2009 due to waste management.
Moreover, the added value in this sector is expected to increase by additional 75% by 2030
compared to 2020 as a result of the measures and the expectations for economic development.
The establishment of a technology park and a business incubator is a measure with indirect
impact on the reduction of greenhouse gases. Its effects can be sought mainly in the following
areas: introduction of incentives to encourage private sector investments in R&D and
innovations of widely used production methods aiming at optimal efficiency of resources;
development of market instruments to encourage environmentally friendly products through
efficient use of resources; encouraging the exchange of good practice between enterprises with
respect to the efficient use of raw materials in production.
5.6.4. Transport
Structure of the sector has been changing over the recent years towards increasing the share of
road transport which accounted for 98% of the energy consumption in the sector in 2009. The
share of diesel in fuel consumption significantly increased in the sector and reached 46.3%.
Private cars in 2009 were a source of 60% of the total emissions in the sector. The analysis
shows that the main objective of the measures in the sector is to achieve optimal balance in the
use of different modes of transport. Measures will be taken to reduce transport emissions, fuel
consumption, to diversify transportation services, to inform and to train the consumers.
According to the macroeconomic scenario there will be an increase in the relative share of
transport services, where the share of the sector “Transport, storage and posts” will reach 5.6%
of the GDP by 2030 and an average growth rate of 4.3% which indicates potential for growth
and reinforces the need for optimization of the various transport modes.
The main sources of financing for the proposed measures are the European funds with state and
municipal co-financing, the state budget and the municipal budgets. The planned investments
amount to 2071.8 mln. BGN and seem feasible and justified in terms of implementation of the
European and national priorities. 5.6 mln. tonnes of emissions will be saved at an average cost
of 370 BGN per tonne.
246
With regard to the priority axis for reductions of transport emissions there are two direct
measures which require substantial funding. The first measure involves rehabilitation and
modernization of road infrastructure to reduce emissions with foreseen investments of 440 mln.
BGN. The measure aims to ensure optimal speeds and optimal operation of motor vehicle
engines. The second measure is aimed at the development and the construction of intelligent
transport systems which requires financial resources of 410 mln. BGN. These systems will
contribute to the enhancement of mobility and safety and the reduction of pollution. Another
direct measure is the increase of the share of biofuels.
The rehabilitation and modernization of the road infrastructure is a key priority of the
Government and is directly related to an increased growth potential through the development of
transport connectivity and the improvement of access to markets. The intelligent transport
systems increase efficiency in the use of existing infrastructure and help reduce environmental
pollution through the prediction and management of traffic flows and volume. The increased
share of biofuels will contribute to increasing resource efficiency.
The reduction of fuel consumption implies less travel by private cars and will be achieved
mainly through two measures that require substantial financial resources. The first one provides
for the development of non-motorized transport and improvement of the urban public transport
which requires investments of 200 mln. BGN. The second measure envisages development of
cycling through the construction of bicycle tracks and lanes and a system for using public
bicycles, at estimated cost of 150 mln. BGN. The measures will lead to less travel by private
cars, better traffic management, less traffic congestion, less noise and fewer emissions. This
will improve transport connectivity and will increase the economic efficiency.
Diversification of transport will be achieved by increasing the share of public electrical
transport (840 mln. BGN) and by establishing intermodal terminals for combined transport (30
mln. BGN). The increase of the share of public electrical transport includes both renovation
and construction of the relevant infrastructure (railway and mass public infrastructure, mainly
metropolitan), as well as renewal of vehicles. The implementation of this measure will help
Bulgaria implement its commitments related to the national and trans-European transport
networks and to optimize its public transport. It will also improve traffic management, transport
connectivity, access to markets, and thus increase the opportunities for international trade and
will save time and costs of households and businesses.
It is envisaged that 30% of truck cargoes transported at a distance of over 300 km are to be
redirected to more environmentally sound modes of transport such as railway. In order to make
the combined modes of transport more efficient the central network airports in Sofia, Varna,
Burgas, Plovdiv and Gorna Oryahovitsa will be connected to railway lines.
Measures for training and informing consumers with indirect effect on the reduction of
emissions are planned under priority axis 4.
5.6.5. Agriculture
Emissions in the Agriculture sector are mainly due to several sources – agricultural soils (58%),
biological fermentation in animal husbandry (21.8%), management of manure (19.3%), burning
of stubble (1.7%) and rice production (1.1 %). After Bulgaria joined the EU the major
structural changes in this sector consisted in reducing the number of farms and increasing their
average area.
According to the macroeconomic scenario for development, the sector of agriculture, forestry
and fisheries will grow at an annual rate of 0.85% by 2030 which will lead to reduction of its
relative share in the GDP down to 3.4% at the end of the period.
247
The main sources of investment financing are the RDP and the state budget. The total planned
investment is 411.8 mln. BGN, which corresponds to the scenario of economic development.
The direct measures are worth 372.3 mln. BGN, the expected emission savings are 30 tonnes at
an average cost above 12000 BGN per tonne thus making the measures relatively expensive.
This is mainly due to the need for significant capital investment for restructuring and
mechanization of farms, for building new installations and facilities and for purchase of
equipment.
The direct measures under the priority axis for reducing emissions from agricultural soils
include organic farming (12000 ha by 2020) and scientifically justified crop rotation (on 8000
ha by 2020); biological recultivation (2500 ha ) and anti-erosion measures (2500 ha), with total
investment of 6.7 mln. BGN. These measures will cover less than 1% of the arable land in the
country. The expected effects are associated with the preservation of organic carbon in the soil,
improvement of the quality of arable land and production and modernization of technologies
and competitiveness. The expected amount of saved emissions is 26000 tonnes at an average
cost of 258 BGN/tonne.
The indirect measures related to soils include enhancement of the competencies and skills of
farmers to improve soil quality and to use energy and water saving irrigation technologies,
which will increase the quality of human capital, the productivity and the efficiency of the used
resources. The required investment amounts to 4.1 mln. BGN.
One indirect measure is planned under the priority axis for reduction of methane emissions in
stock-breeding – encouragement of extensive grassland husbandry. Training of farmers is
envisaged with the view of increasing the quality of human resources and permanent pastures
are to be maintained with payment per hectare. The financial resources required for the
measure are estimated at 34 190 000 BGN.
The direct measures related to management of manure include construction of the necessary
storage installations. The investments required for that purpose are the most significant
amounting to 130 mln. BGN. These installations will cover 16% of the number of cows (over 2
years old) by 2009. Trainings will be conducted and model farms will be built to process
manure that will cost 1.4 mln. BGN. The direct measures are expected to save 1924 tonnes
which in terms of cost means 68400 BGN per tonne. The indirect measures involve building a
resource center for scientific research, and development of training methods and practices. This
would boost R&D expenses, improve the quality of human capital and technologies.
Substantial financial resources amounting to 230 mln. BGN are planned for the optimization of
the use of crop residues/waste in agriculture. The direct measures are worth 225 mln. BGN and
will save 655 tonnes of emissions at an average cost of 343 000 BGN per tonne which makes
the measure the most expensive one in relative terms. Its implementation will address the
problems with stubble burning. Investments are foreseen for equipment and machinery as well
as for changes and adaptation of the production process. 5000 farms will be covered which is
about 1.4% of their total number. The indirect measures are aimed at improving the awareness
and knowledge of farmers and at strengthening the prevention of stubble burning. The resource
efficiency will be enhanced, the technologies, as well as the human capital will improve as a
result of the measures.
Other training measures besides those specified above are also envisaged for the farms and
their staff in order to improve the quality of human capital, resource efficiency and
productivity.
248
5.6.6. Land use, land use change and forestry
The balance between emission and absorption of greenhouse gases in the LULUCF sector is in
favour of the absorption. Sinks are territories occupied by forests, grasslands and meadows.
The main source of emissions in the sector is the change in land use and the conversion of
forests, grassland and pastures into cropland and urban areas.
Over the past 21 years the absorption of greenhouse gases in the sector has been offsetting
between 11.35% and 19.9% of the total greenhouse gas emissions in Bulgaria. The most
important role in the uptake and storage of carbon (94-95% of the total absorption in the sector)
have the areas occupied by forests, which explains the focus of many of the measures.
The main sources of investment financing are RDP, OP Environment, EMEPA, state and
municipal budgets, interested private individuals and entities. The total proposed investment is
54.8 mln. BGN, justified by the importance and the impact of the measures. The direct
measures worth 27.9 mln. BGN and will save 80800 tonnes of CO2 emissions at an average
cost of 345.3 BGN per tonne.
The first priority axis consists in increasing the absorption of greenhouse gases and with this
respect part of the measures are aimed at afforestation in both existing forests and parks as well
as in newly abandoned agricultural or eroded lands. The total value of these measures is
estimated at 10.45mln. BGN. The effect is reduction of emissions by 51 000 tonnes at a cost of
205 BGN per tonne. The most expensive measure is related to wetland management in forest
areas, peatland and marshland – 15 mln. BGN with expected effect of emission reductions
amounting to 4.7 tonnes, i.e. at a cost of 3200 BGN per tonne. This makes the measure
relatively expensive, but it is important for preserving biodiversity and natural development of
forest ecosystems. The envisaged indirect measures are related to the financial mechanism
aimed at supporting the activities and the analysis of existing legislation. The implementation
of these measures will contribute to the sustainable growth and development of the wooded
forest areas, the maintenance of the ecosystems therein, the possibilities to develop tourism, to
increase the share of wood pulp as energy source, and to increase the value of the forestry
sector.
The second priority axis affects the storage of carbon stocks in forests and envisages restoration
and maintenance of forest shelter belts and new anti-erosion afforestation. The needed financial
resources are estimated at 1.75 mln. BGN with expected effect of 8360 tonnes CO2 reduction,
i.e. at a cost of 209 BGN per tonne, which is comparable to the cost of the afforestation
measures in the first axis. Most important among the indirect measures is the prevention of
forest fires through the establishment of an early warning system worth 25 million BGN, which
includes the purchase of new equipment. The implementation of these measures will contribute
to the protection, conservation, development and expansion of forest areas, to the improvement
of the methods and technologies used, which will increase the efficiency and promote the
growth and the added value of the forestry sector.
The third priority axis is focused on the potential of forests to capture carbon and plans increase
of tree density worth 0.7 mln. BGN. The expected effect is reducing emissions by 16 720
tonnes, at cost of 42 BGN per tonne, which makes the measure highly effective. The indirect
measures include the development of new systems, good practices, forest certification and
updating strategic documents. The implementation of these measures will contribute to
sustainable growth and development of forest areas as well as to increased value added in the
sector.
The fourth priority axis is aimed at the long-term retention of carbon in wood products through
campaigns and initiatives for expanding the use of wood products as substitutes for products
249
from non-renewable, polluting and energy-intensive materials. This will increase resource
efficiency and the value added in the sector.
5.6.7. Waste
The GHG emissions from landfilled waste is about 77% of the total amount in the sector, the
emissions from waste water treatment are about 22% and from waste incineration – less than
1%. Therefore, the measures in the waste sector are targeted as a priority at the subsector of
waste disposal and to a lesser extent at the subsector of wastewater treatment.
The main sources of funding are OP Environment, private investments, own funds of recovery
organizations, EMEPA.
The planned investments in the sector amount to 536.3 mln. BGN, which is achievable from a
financial standpoint. The investments and the measures undertaken in the sector correspond to
the projections in the macroeconomic scenario according to which the value added in the
industrial sector of “Water supply, sewerage, waste management and remediation activities”
increases throughout the period 2010-2030 by 6.3% on average with total value added growth
of 3.66%, while its relative share in the value added grows from 0.86% in 2009 to 1.55% at the
end of period. The direct measures will require investments of 455 mln. BGN and will save 12
mln. tonnes of emissions at an average cost of 38 BGN per tonne which makes the measures in
this sector highly efficient.
With regard to the landfilling of waste the main efforts are directed towards the prevention of
waste which will help reduce the amount of waste for disposal, as well as to build infrastructure
for waste treatment. The measure “Development of systems for mechanical and biological
treatment (MBT) plants for treatment and utilization of compost and biogas” has a relatively
high effect and requires 221 mln. BGN (41.2% of the planned investments in the sector)
however 5.8 mln. tonnes of emissions will be saved by 2020 at an average cost of 38 BGN
which makes the measure highly efficiency. As an indirect measure is referred the further
development of the collective schemes for separate waste collection worth 80 mln. BGN, which
will increase the efficiency and the scope of the systems and will contribute to the diversion of
130000 tonnes of waste from landfills every year. Prevention of waste disposal will be effected
also through market based incentives for households. The amount of the waste charges is to be
bound to the quantities of generated waste thus encouraging households to reduce the amount
of disposed waste, to use various waste collection schemes and waste recovery at home.
Standards are to be introduced for the recycled materials and compost, which will allow the
marketing of these materials, reduce transaction costs and increase the cost efficiency. Separate
collection of “green waste” is to be introduced in all municipalities through the updating of
their regulations and waste management programmes.
The already landfilled waste also has a high potential to be used as energy and resource.
Measures will be implemented to capture and use the biogas in both new and existing landfills
and in landfills pending closure, which will improve resource efficiency, reduce dependence on
imported energy resources and create added value that is currently being lost without the
construction of these installations. The total cost of direct measures under this priority axis is
60 mln. BGN, the expected amount of saved emissions is 10.9 mln. tonnes at an average cost of
5.5 BGN per tonne which makes the measure very highly efficient. The indirect measures
include measuring and estimation of the amount of biogas in landfilled waste.
Measures will be taken to capture and flare the biogas in urban waste water treatment plants,
which will enable these plants to meet their own energy needs and to improve their profitability
and efficiency. The cost of these measures is estimated at 174 mln. BGN and the expected
250
amount of saved emissions is 1.025 mln. tonnes which makes an average cost of 170
BGN/tonne.
The measures in this sector will lead to increased resource efficiency and better management of
resources throughout their life cycle, will increase the added value, reduce the dependence on
imported energy resources thus reducing the costs of households and businesses and increasing
the competitiveness of the economy.
5.7. Projections, sensitivity analysis, focused on the key input variables.
There are three sets of key inputs to produce the energy demand forecasts: the level and
structure of GDP; total population; and the level and structure of final energy consumption.
A methodology that allows scrutinizing the interrelationships between macroeconomic
development, sectoral development (including the energy sector), and GHG emissions is used.
The macroeconomic forecasts, including GDP and population growth, were provided by the
Bulgarian Agency for Economic Analysis and Forecasts within the Ministry of Finance.
The general assumptions used are that the energy network is presented as a combination of
sectoral and level presentation of data. The network is simplified as to represent only some of
the sectors and some of the levels in a detailed way. Other information is generalized in a way
to keep the total energy flows in the energy system and related emissions.
5.8. Specific assumptions related to the with measures scenario for GHG
emissions
Generally macroeconomic indicators determine the share of energy demand, which serves as
driving force of economy development. For the current study a moderate projections are
applied. The major economic factors influencing the development of the energy sector are:
Restructuring of economy and increased share of private sector
Access to the markets of EU and Balkan countries
Decreasing share of heavy industry in the national economy
Increased share of production and services with low energy intensity
Technological progress and high technological development
Improved management of energy prices
Energy efficiency policy at supply and demand side.
GHG emissions projections depend on a number of economic and energy assumptions and are
subject to significant uncertainty, especially in the longer term. In general, GDP growth has a
direct and significant impact on GHG emissions. The energy intensity is correlated with
population and GDP rates.
Table 5.33. GHG emissions at a different scenario
Scenario base
year
2015 2020 2025 2030
GHG emissions (Mt CO2-eq)
Reference 57 59 59 56 56
Reference with
higher GDP
57 70 79 85 100
Reference with 57 50 41 31 26
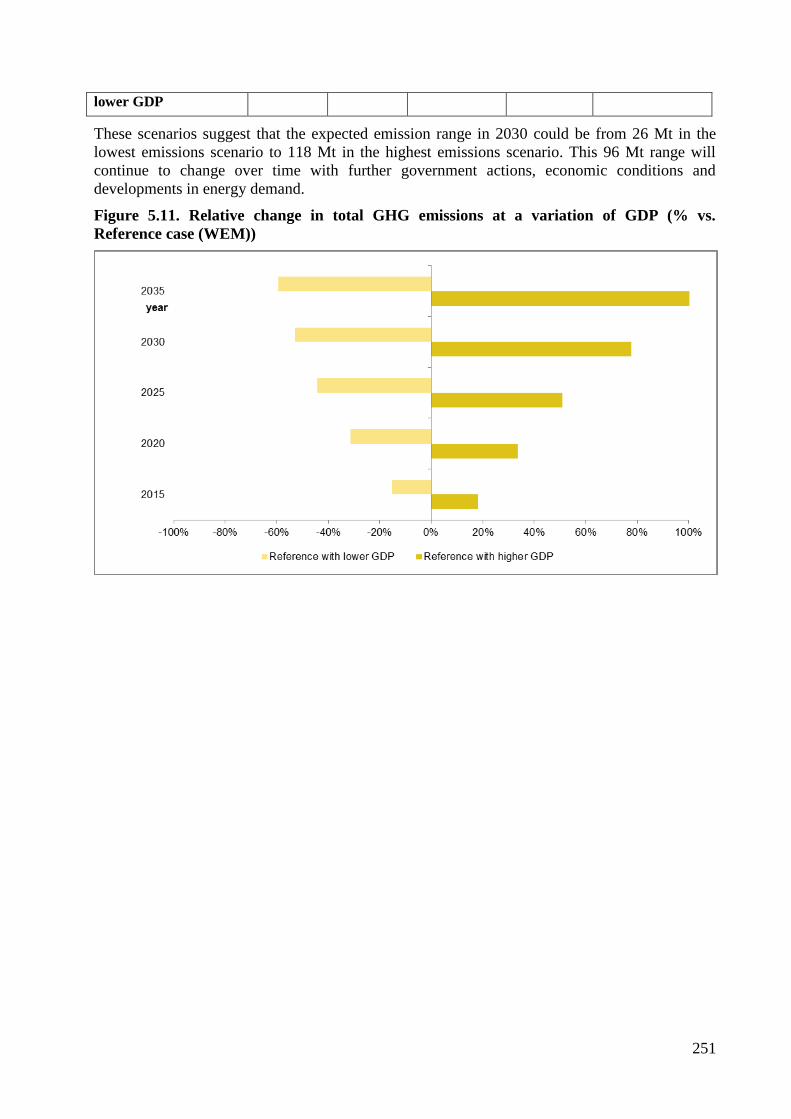
251
lower GDP
These scenarios suggest that the expected emission range in 2030 could be from 26 Mt in the
lowest emissions scenario to 118 Mt in the highest emissions scenario. This 96 Mt range will
continue to change over time with further government actions, economic conditions and
developments in energy demand.
Figure 5.11. Relative change in total GHG emissions at a variation of GDP (% vs.
Reference case (WEM))
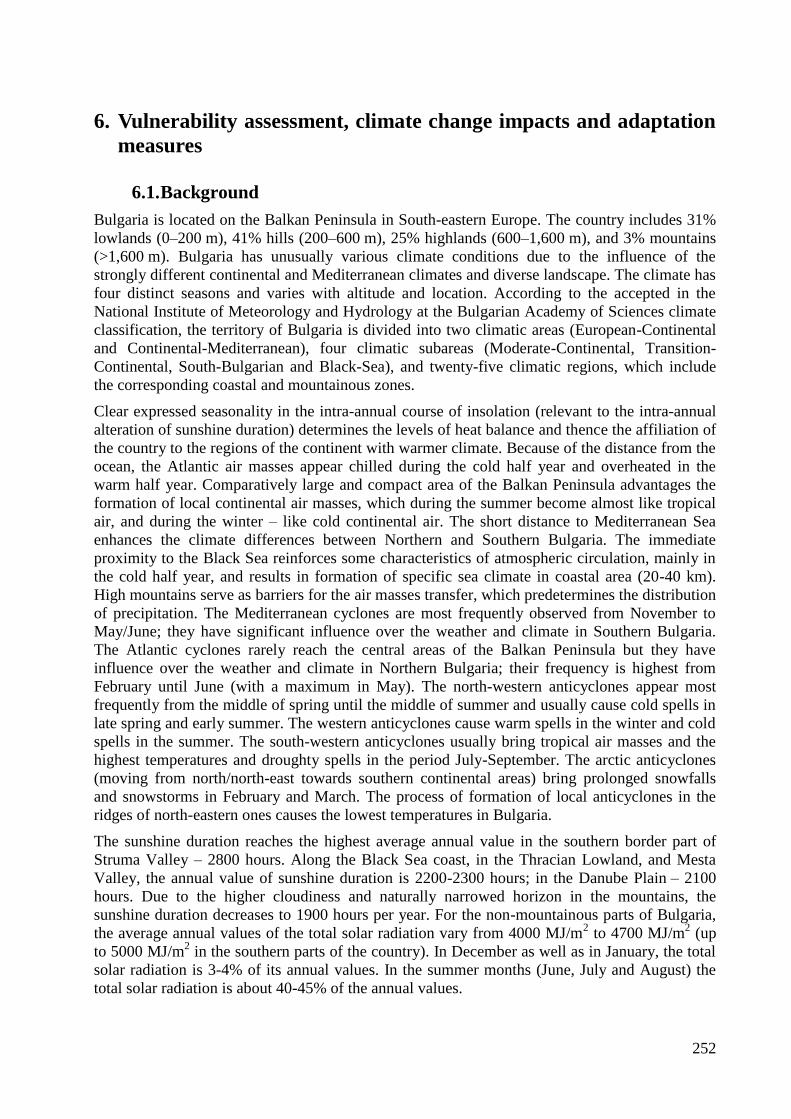
252
6. Vulnerability assessment, climate change impacts and adaptation
measures
6.1. Background
Bulgaria is located on the Balkan Peninsula in South-eastern Europe. The country includes 31%
lowlands (0–200 m), 41% hills (200–600 m), 25% highlands (600–1,600 m), and 3% mountains
(>1,600 m). Bulgaria has unusually various climate conditions due to the influence of the
strongly different continental and Mediterranean climates and diverse landscape. The climate has
four distinct seasons and varies with altitude and location. According to the accepted in the
National Institute of Meteorology and Hydrology at the Bulgarian Academy of Sciences climate
classification, the territory of Bulgaria is divided into two climatic areas (European-Continental
and Continental-Mediterranean), four climatic subareas (Moderate-Continental, Transition-
Continental, South-Bulgarian and Black-Sea), and twenty-five climatic regions, which include
the corresponding coastal and mountainous zones.
Clear expressed seasonality in the intra-annual course of insolation (relevant to the intra-annual
alteration of sunshine duration) determines the levels of heat balance and thence the affiliation of
the country to the regions of the continent with warmer climate. Because of the distance from the
ocean, the Atlantic air masses appear chilled during the cold half year and overheated in the
warm half year. Comparatively large and compact area of the Balkan Peninsula advantages the
formation of local continental air masses, which during the summer become almost like tropical
air, and during the winter – like cold continental air. The short distance to Mediterranean Sea
enhances the climate differences between Northern and Southern Bulgaria. The immediate
proximity to the Black Sea reinforces some characteristics of atmospheric circulation, mainly in
the cold half year, and results in formation of specific sea climate in coastal area (20-40 km).
High mountains serve as barriers for the air masses transfer, which predetermines the distribution
of precipitation. The Mediterranean cyclones are most frequently observed from November to
May/June; they have significant influence over the weather and climate in Southern Bulgaria.
The Atlantic cyclones rarely reach the central areas of the Balkan Peninsula but they have
influence over the weather and climate in Northern Bulgaria; their frequency is highest from
February until June (with a maximum in May). The north-western anticyclones appear most
frequently from the middle of spring until the middle of summer and usually cause cold spells in
late spring and early summer. The western anticyclones cause warm spells in the winter and cold
spells in the summer. The south-western anticyclones usually bring tropical air masses and the
highest temperatures and droughty spells in the period July-September. The arctic anticyclones
(moving from north/north-east towards southern continental areas) bring prolonged snowfalls
and snowstorms in February and March. The process of formation of local anticyclones in the
ridges of north-eastern ones causes the lowest temperatures in Bulgaria.
The sunshine duration reaches the highest average annual value in the southern border part of
Struma Valley – 2800 hours. Along the Black Sea coast, in the Thracian Lowland, and Mesta
Valley, the annual value of sunshine duration is 2200-2300 hours; in the Danube Plain – 2100
hours. Due to the higher cloudiness and naturally narrowed horizon in the mountains, the
sunshine duration decreases to 1900 hours per year. For the non-mountainous parts of Bulgaria,
the average annual values of the total solar radiation vary from 4000 MJ/m2 to 4700 MJ/m
2 (up
to 5000 MJ/m2 in the southern parts of the country). In December as well as in January, the total
solar radiation is 3-4% of its annual values. In the summer months (June, July and August) the
total solar radiation is about 40-45% of the annual values.
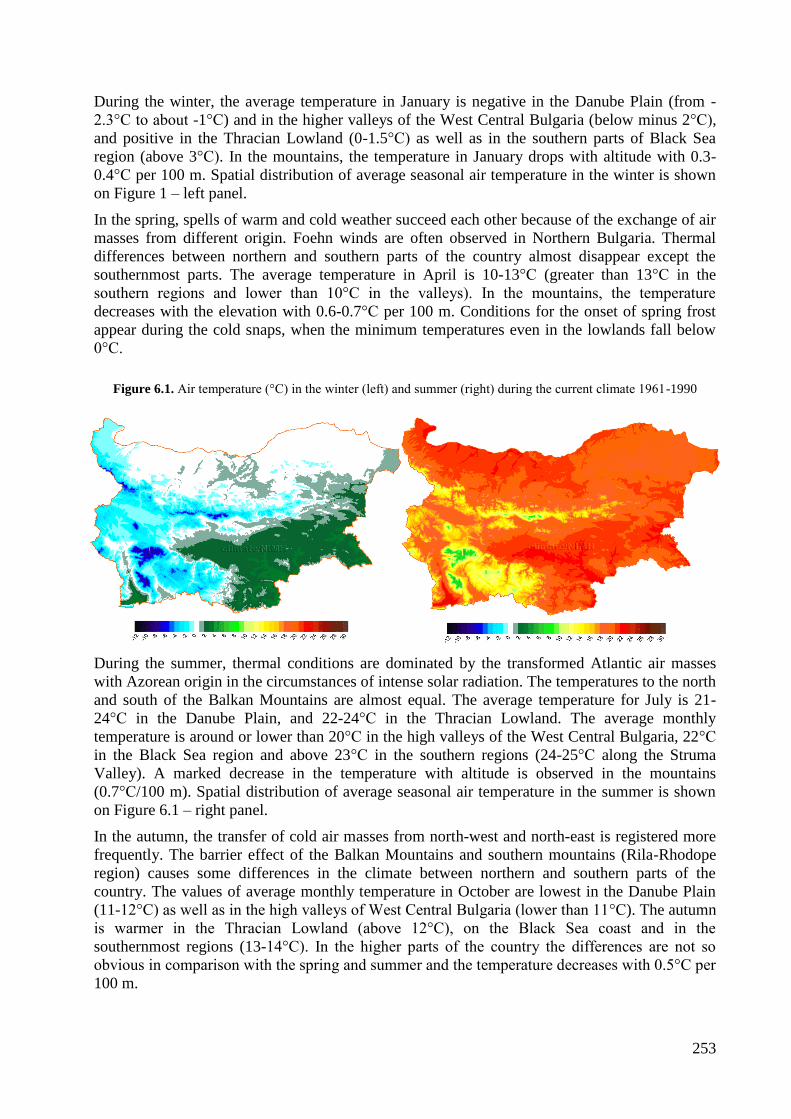
253
During the winter, the average temperature in January is negative in the Danube Plain (from -
2.3°C to about -1°C) and in the higher valleys of the West Central Bulgaria (below minus 2°C),
and positive in the Thracian Lowland (0-1.5°C) as well as in the southern parts of Black Sea
region (above 3°C). In the mountains, the temperature in January drops with altitude with 0.3-
0.4°C per 100 m. Spatial distribution of average seasonal air temperature in the winter is shown
on Figure 1 – left panel.
In the spring, spells of warm and cold weather succeed each other because of the exchange of air
masses from different origin. Foehn winds are often observed in Northern Bulgaria. Thermal
differences between northern and southern parts of the country almost disappear except the
southernmost parts. The average temperature in April is 10-13°C (greater than 13°C in the
southern regions and lower than 10°C in the valleys). In the mountains, the temperature
decreases with the elevation with 0.6-0.7°C per 100 m. Conditions for the onset of spring frost
appear during the cold snaps, when the minimum temperatures even in the lowlands fall below
0°C.
Figure 6.1. Air temperature (°C) in the winter (left) and summer (right) during the current climate 1961-1990
During the summer, thermal conditions are dominated by the transformed Atlantic air masses
with Azorean origin in the circumstances of intense solar radiation. The temperatures to the north
and south of the Balkan Mountains are almost equal. The average temperature for July is 21-
24°C in the Danube Plain, and 22-24°C in the Thracian Lowland. The average monthly
temperature is around or lower than 20°C in the high valleys of the West Central Bulgaria, 22°C
in the Black Sea region and above 23°C in the southern regions (24-25°C along the Struma
Valley). A marked decrease in the temperature with altitude is observed in the mountains
(0.7°C/100 m). Spatial distribution of average seasonal air temperature in the summer is shown
on Figure 6.1 – right panel.
In the autumn, the transfer of cold air masses from north-west and north-east is registered more
frequently. The barrier effect of the Balkan Mountains and southern mountains (Rila-Rhodope
region) causes some differences in the climate between northern and southern parts of the
country. The values of average monthly temperature in October are lowest in the Danube Plain
(11-12°C) as well as in the high valleys of West Central Bulgaria (lower than 11°C). The autumn
is warmer in the Thracian Lowland (above 12°C), on the Black Sea coast and in the
southernmost regions (13-14°C). In the higher parts of the country the differences are not so
obvious in comparison with the spring and summer and the temperature decreases with 0.5°C per
100 m.
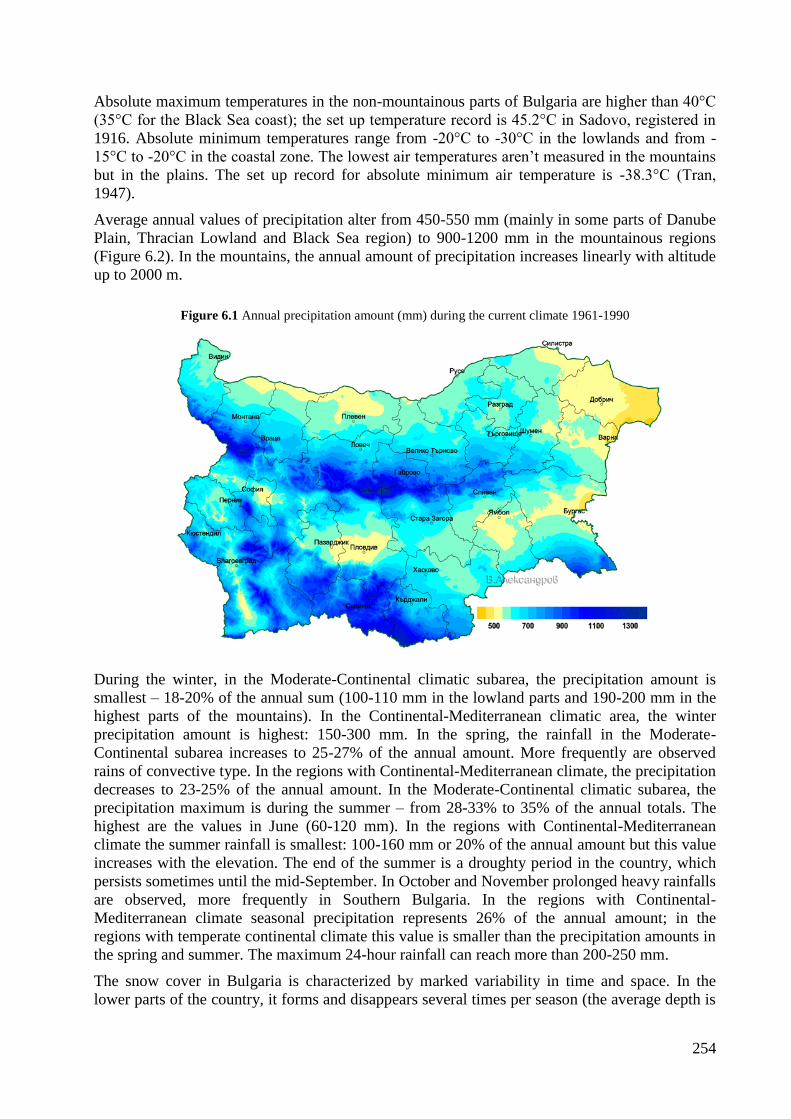
254
Absolute maximum temperatures in the non-mountainous parts of Bulgaria are higher than 40°C
(35°C for the Black Sea coast); the set up temperature record is 45.2°C in Sadovo, registered in
1916. Absolute minimum temperatures range from -20°C to -30°C in the lowlands and from -
15°C to -20°C in the coastal zone. The lowest air temperatures aren’t measured in the mountains
but in the plains. The set up record for absolute minimum air temperature is -38.3°C (Tran,
1947).
Average annual values of precipitation alter from 450-550 mm (mainly in some parts of Danube
Plain, Thracian Lowland and Black Sea region) to 900-1200 mm in the mountainous regions
(Figure 6.2). In the mountains, the annual amount of precipitation increases linearly with altitude
up to 2000 m.
Figure 6.1 Annual precipitation amount (mm) during the current climate 1961-1990
During the winter, in the Moderate-Continental climatic subarea, the precipitation amount is
smallest – 18-20% of the annual sum (100-110 mm in the lowland parts and 190-200 mm in the
highest parts of the mountains). In the Continental-Mediterranean climatic area, the winter
precipitation amount is highest: 150-300 mm. In the spring, the rainfall in the Moderate-
Continental subarea increases to 25-27% of the annual amount. More frequently are observed
rains of convective type. In the regions with Continental-Mediterranean climate, the precipitation
decreases to 23-25% of the annual amount. In the Moderate-Continental climatic subarea, the
precipitation maximum is during the summer – from 28-33% to 35% of the annual totals. The
highest are the values in June (60-120 mm). In the regions with Continental-Mediterranean
climate the summer rainfall is smallest: 100-160 mm or 20% of the annual amount but this value
increases with the elevation. The end of the summer is a droughty period in the country, which
persists sometimes until the mid-September. In October and November prolonged heavy rainfalls
are observed, more frequently in Southern Bulgaria. In the regions with Continental-
Mediterranean climate seasonal precipitation represents 26% of the annual amount; in the
regions with temperate continental climate this value is smaller than the precipitation amounts in
the spring and summer. The maximum 24-hour rainfall can reach more than 200-250 mm.
The snow cover in Bulgaria is characterized by marked variability in time and space. In the
lower parts of the country, it forms and disappears several times per season (the average depth is
255
about 10-15 cm per season). Rarely, the snow cover depth could reach 30-40 cm in the coastal
region, above 60-70 cm in Dobrudzha and above 100-110 cm in the Danube Plain. In the
mountainous areas the maximum of snow accumulation shifts with altitude from the end of
January until the beginning of March. In the hilly parts (500-800 m) the accumulation of snow
begins in December; for the high parts (1000-1500 m) – even in November. The average snow
cover depth in the lower parts of the mountains is 25-30 cm in January and February. The
maximum values can reach to 200 cm and more in the highest parts in March and April, when
the maximum accumulation is observed.
The prevailing winds are north-west/west and north-east (in some southern parts of the country).
Several regions could be outlined with relation to the average annual wind speed. The first one
includes lowland parts, where the average wind speed does not exceed 2 m/s (with maximum in
February/March and minimum in September/October). The second region comprises the north-
eastern parts of the country and the unsheltered low mountainous regions (up to 1000 m), where
the average annual wind speed is 2-4 m/s (with maximum in February-March and minimum in
August-September). The third region consists of unsheltered and deforested mountainous regions
over 1000 m, where the wind speed exceeds vastly 4 m/s, with an annual maximum in February
and minimum in August. Among the local winds, the most characteristic are the breeze (3-
5 m/s), mountain-valley winds (3-6 m/s), katabatic winds (Sliven’s wind with velocity more than
15 m/s) and foehn winds (10-20 m/s).
Since the middle of 1980s, the tendency of the average annual air temperature in Bulgaria is
towards warmer climate (Figure 6.3). In fact, the annual temperature anomalies are positive from
1997 to now. Moreover, they are equal or exceed 1°C for the all years after 2007 (except 2011).
Since the beginning of 21st century, 2015 appears as the warmest year (1.6°C above the climactic
normal in the areas up to 800 m altitude); in Northern Bulgaria – 1.8°C above the normal (Figure
4). Warmest months are November, July and January, with deviations from the monthly normal
+3.2°C, +2.7°C and +2.6°C, correspondingly.
Figure 6.2 Anomalies of annual temperature in areas up to 800 m altitude for the period 1988-2016 relative to the
period 1961-1990
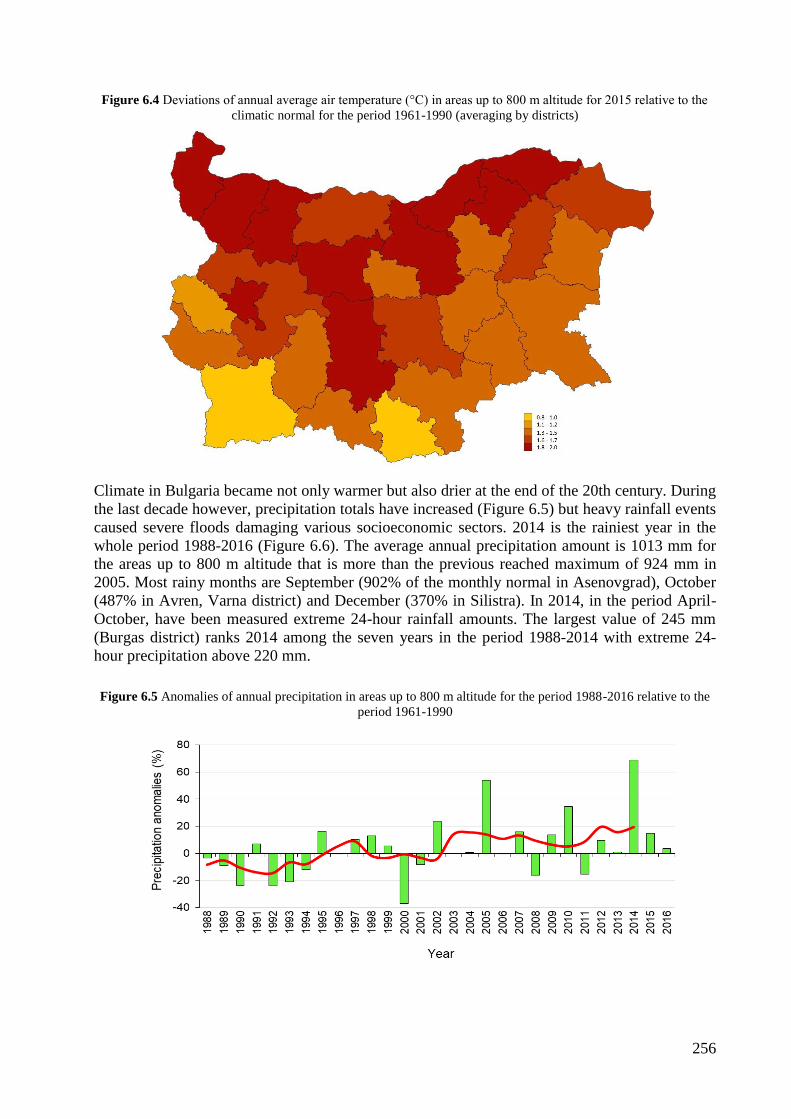
256
Figure 6.4 Deviations of annual average air temperature (°C) in areas up to 800 m altitude for 2015 relative to the
climatic normal for the period 1961-1990 (averaging by districts)
Climate in Bulgaria became not only warmer but also drier at the end of the 20th century. During
the last decade however, precipitation totals have increased (Figure 6.5) but heavy rainfall events
caused severe floods damaging various socioeconomic sectors. 2014 is the rainiest year in the
whole period 1988-2016 (Figure 6.6). The average annual precipitation amount is 1013 mm for
the areas up to 800 m altitude that is more than the previous reached maximum of 924 mm in
2005. Most rainy months are September (902% of the monthly normal in Asenovgrad), October
(487% in Avren, Varna district) and December (370% in Silistra). In 2014, in the period April-
October, have been measured extreme 24-hour rainfall amounts. The largest value of 245 mm
(Burgas district) ranks 2014 among the seven years in the period 1988-2014 with extreme 24-
hour precipitation above 220 mm.
Figure 6.5 Anomalies of annual precipitation in areas up to 800 m altitude for the period 1988-2016 relative to the
period 1961-1990
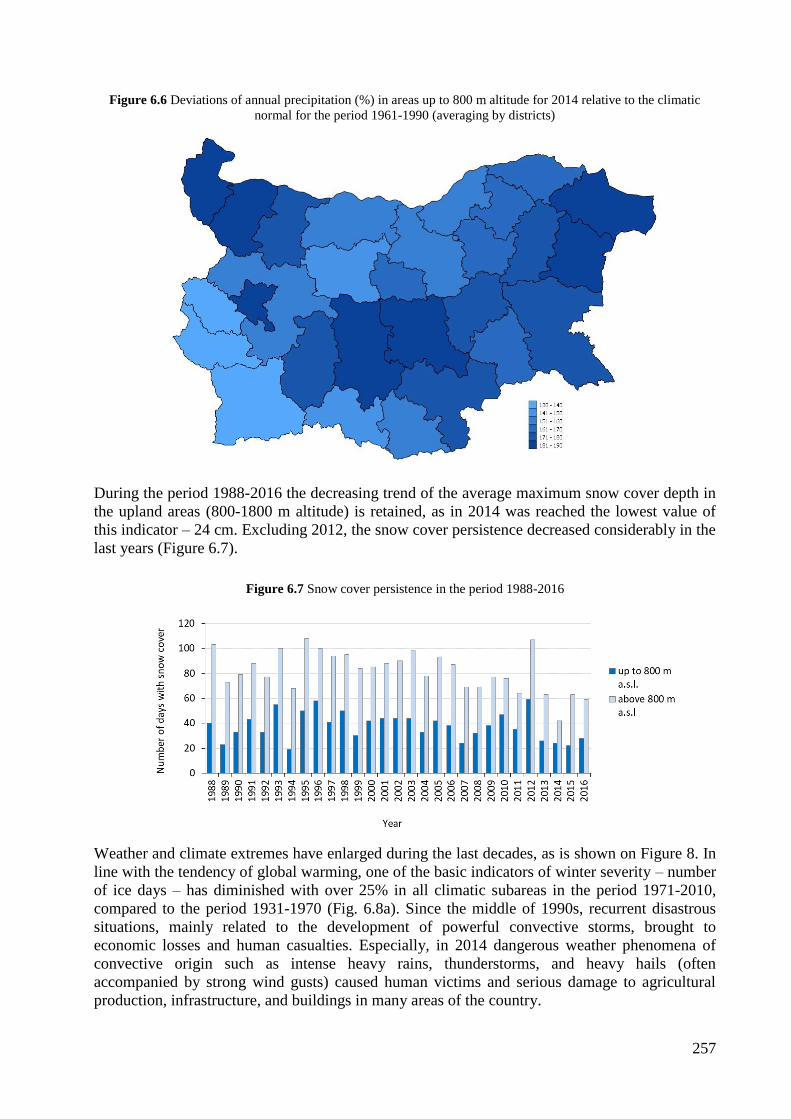
257
Figure 6.6 Deviations of annual precipitation (%) in areas up to 800 m altitude for 2014 relative to the climatic
normal for the period 1961-1990 (averaging by districts)
During the period 1988-2016 the decreasing trend of the average maximum snow cover depth in
the upland areas (800-1800 m altitude) is retained, as in 2014 was reached the lowest value of
this indicator – 24 cm. Excluding 2012, the snow cover persistence decreased considerably in the
last years (Figure 6.7).
Figure 6.7 Snow cover persistence in the period 1988-2016
Weather and climate extremes have enlarged during the last decades, as is shown on Figure 8. In
line with the tendency of global warming, one of the basic indicators of winter severity – number
of ice days – has diminished with over 25% in all climatic subareas in the period 1971-2010,
compared to the period 1931-1970 (Fig. 6.8a). Since the middle of 1990s, recurrent disastrous
situations, mainly related to the development of powerful convective storms, brought to
economic losses and human casualties. Especially, in 2014 dangerous weather phenomena of
convective origin such as intense heavy rains, thunderstorms, and heavy hails (often
accompanied by strong wind gusts) caused human victims and serious damage to agricultural
production, infrastructure, and buildings in many areas of the country.
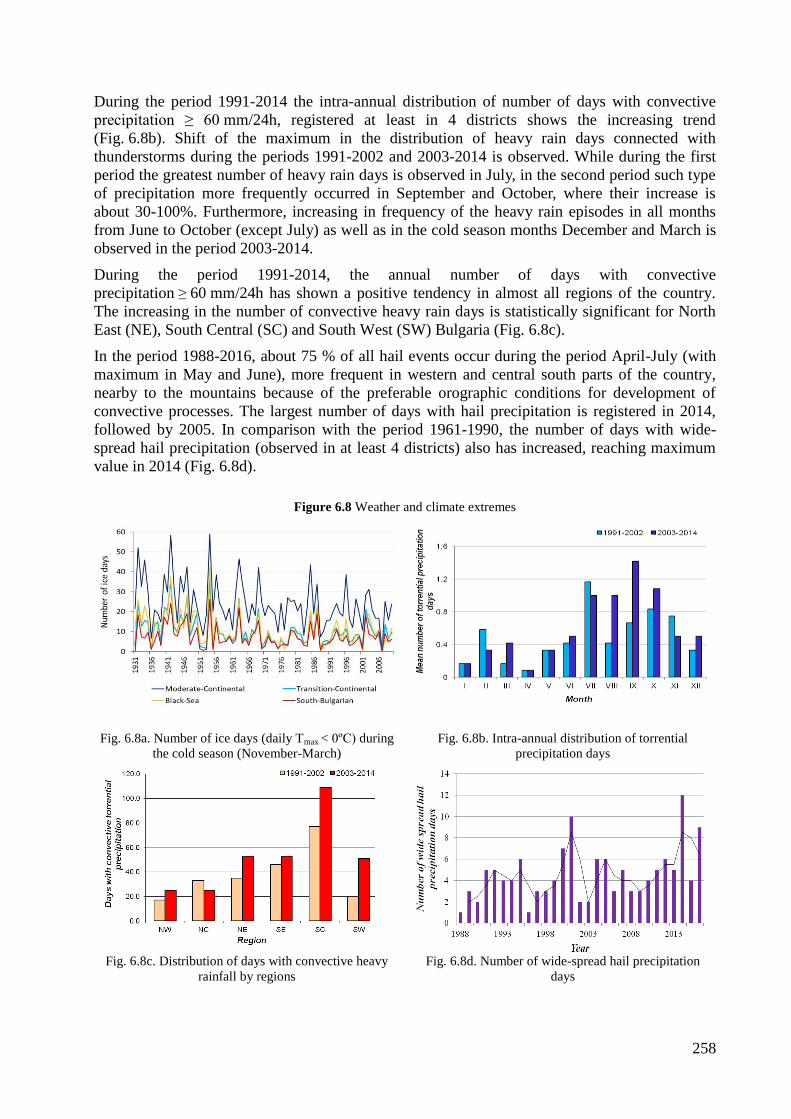
258
During the period 1991-2014 the intra-annual distribution of number of days with convective
precipitation ≥ 60 mm/24h, registered at least in 4 districts shows the increasing trend
(Fig. 6.8b). Shift of the maximum in the distribution of heavy rain days connected with
thunderstorms during the periods 1991-2002 and 2003-2014 is observed. While during the first
period the greatest number of heavy rain days is observed in July, in the second period such type
of precipitation more frequently occurred in September and October, where their increase is
about 30-100%. Furthermore, increasing in frequency of the heavy rain episodes in all months
from June to October (except July) as well as in the cold season months December and March is
observed in the period 2003-2014.
During the period 1991-2014, the annual number of days with convective
precipitation ≥ 60 mm/24h has shown a positive tendency in almost all regions of the country.
The increasing in the number of convective heavy rain days is statistically significant for North
East (NE), South Central (SC) and South West (SW) Bulgaria (Fig. 6.8c).
In the period 1988-2016, about 75 % of all hail events occur during the period April-July (with
maximum in May and June), more frequent in western and central south parts of the country,
nearby to the mountains because of the preferable orographic conditions for development of
convective processes. The largest number of days with hail precipitation is registered in 2014,
followed by 2005. In comparison with the period 1961-1990, the number of days with wide-
spread hail precipitation (observed in at least 4 districts) also has increased, reaching maximum
value in 2014 (Fig. 6.8d).
Figure 6.8 Weather and climate extremes
Fig. 6.8a. Number of ice days (daily Tmax < 0ºC) during
the cold season (November-March)
Fig. 6.8b. Intra-annual distribution of torrential
precipitation days
Fig. 6.8c. Distribution of days with convective heavy
rainfall by regions
Fig. 6.8d. Number of wide-spread hail precipitation
days
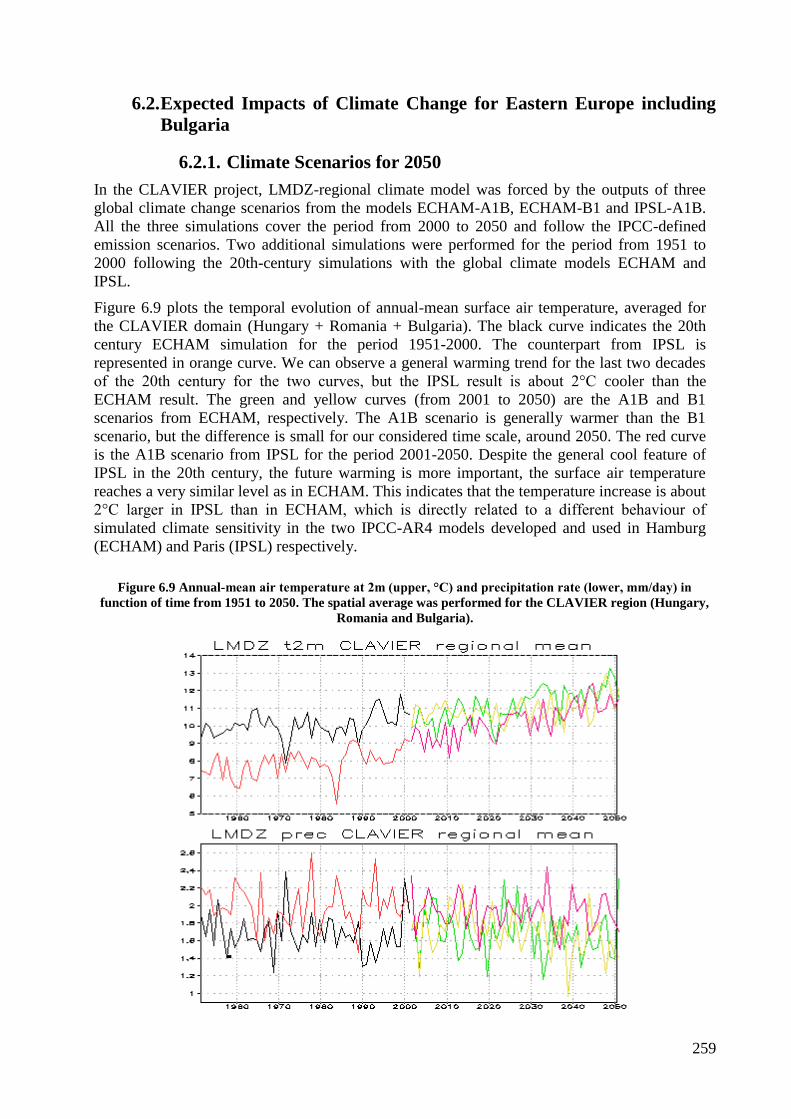
259
6.2. Expected Impacts of Climate Change for Eastern Europe including
Bulgaria
6.2.1. Climate Scenarios for 2050
In the CLAVIER project, LMDZ-regional climate model was forced by the outputs of three
global climate change scenarios from the models ECHAM-A1B, ECHAM-B1 and IPSL-A1B.
All the three simulations cover the period from 2000 to 2050 and follow the IPCC-defined
emission scenarios. Two additional simulations were performed for the period from 1951 to
2000 following the 20th-century simulations with the global climate models ECHAM and
IPSL.
Figure 6.9 plots the temporal evolution of annual-mean surface air temperature, averaged for
the CLAVIER domain (Hungary + Romania + Bulgaria). The black curve indicates the 20th
century ECHAM simulation for the period 1951-2000. The counterpart from IPSL is
represented in orange curve. We can observe a general warming trend for the last two decades
of the 20th century for the two curves, but the IPSL result is about 2°C cooler than the
ECHAM result. The green and yellow curves (from 2001 to 2050) are the A1B and B1
scenarios from ECHAM, respectively. The A1B scenario is generally warmer than the B1
scenario, but the difference is small for our considered time scale, around 2050. The red curve
is the A1B scenario from IPSL for the period 2001-2050. Despite the general cool feature of
IPSL in the 20th century, the future warming is more important, the surface air temperature
reaches a very similar level as in ECHAM. This indicates that the temperature increase is about
2°C larger in IPSL than in ECHAM, which is directly related to a different behaviour of
simulated climate sensitivity in the two IPCC-AR4 models developed and used in Hamburg
(ECHAM) and Paris (IPSL) respectively.
Figure 6.9 Annual-mean air temperature at 2m (upper, °C) and precipitation rate (lower, mm/day) in
function of time from 1951 to 2050. The spatial average was performed for the CLAVIER region (Hungary,
Romania and Bulgaria).
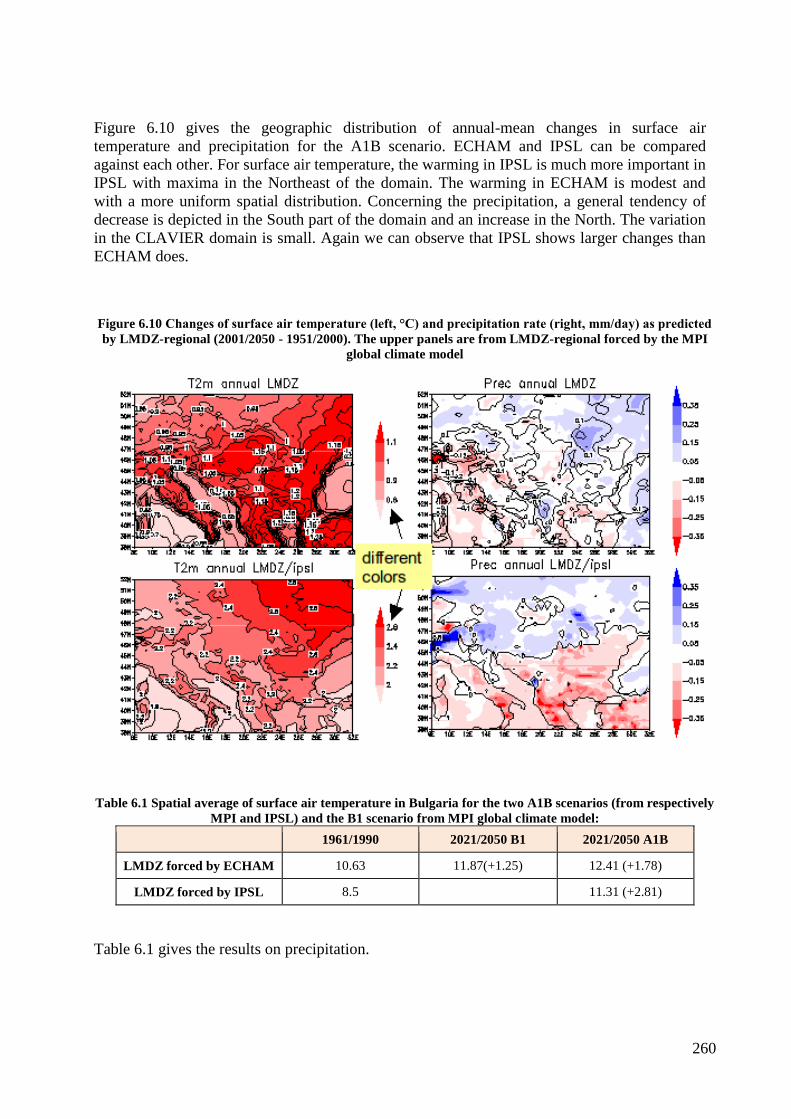
260
Figure 6.10 gives the geographic distribution of annual-mean changes in surface air
temperature and precipitation for the A1B scenario. ECHAM and IPSL can be compared
against each other. For surface air temperature, the warming in IPSL is much more important in
IPSL with maxima in the Northeast of the domain. The warming in ECHAM is modest and
with a more uniform spatial distribution. Concerning the precipitation, a general tendency of
decrease is depicted in the South part of the domain and an increase in the North. The variation
in the CLAVIER domain is small. Again we can observe that IPSL shows larger changes than
ECHAM does.
Figure 6.10 Changes of surface air temperature (left, °C) and precipitation rate (right, mm/day) as predicted
by LMDZ-regional (2001/2050 - 1951/2000). The upper panels are from LMDZ-regional forced by the MPI
global climate model
Table 6.1 Spatial average of surface air temperature in Bulgaria for the two A1B scenarios (from respectively
MPI and IPSL) and the B1 scenario from MPI global climate model:
1961/1990 2021/2050 B1 2021/2050 A1B
LMDZ forced by ECHAM 10.63 11.87(+1.25) 12.41 (+1.78)
LMDZ forced by IPSL 8.5 11.31 (+2.81)
Table 6.1 gives the results on precipitation.
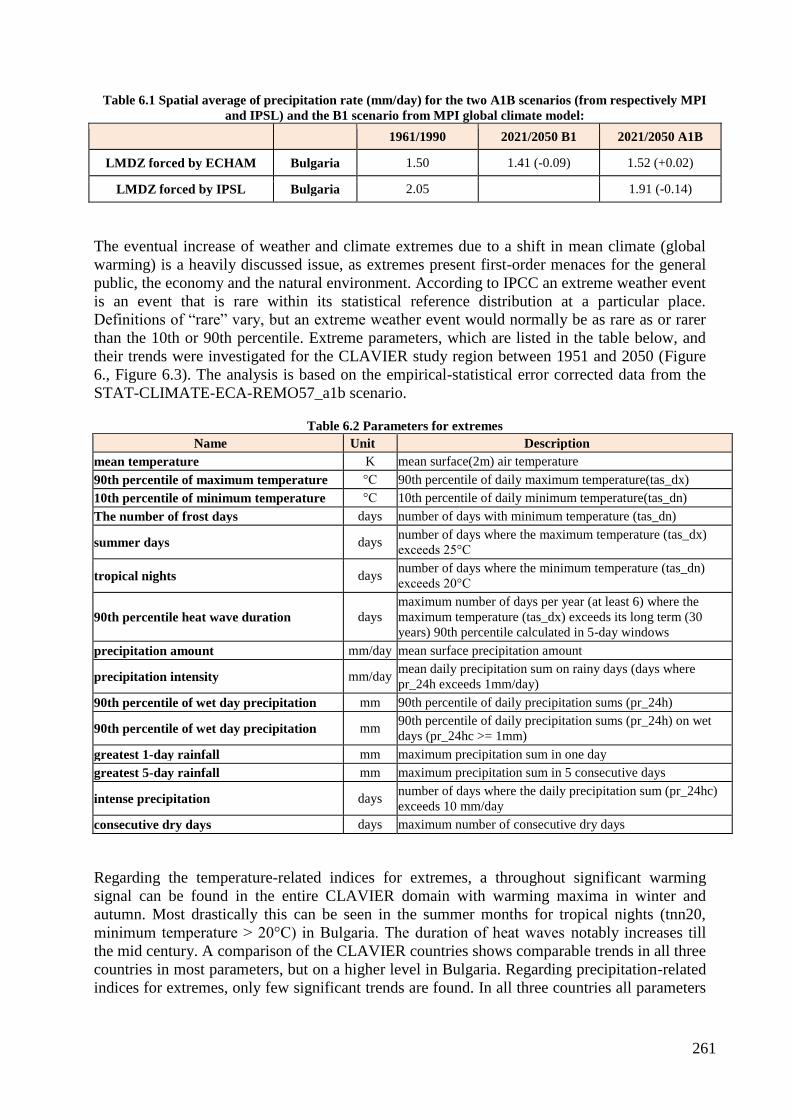
261
Table 6.1 Spatial average of precipitation rate (mm/day) for the two A1B scenarios (from respectively MPI
and IPSL) and the B1 scenario from MPI global climate model:
1961/1990 2021/2050 B1 2021/2050 A1B
LMDZ forced by ECHAM Bulgaria 1.50 1.41 (-0.09) 1.52 (+0.02)
LMDZ forced by IPSL Bulgaria 2.05 1.91 (-0.14)
The eventual increase of weather and climate extremes due to a shift in mean climate (global
warming) is a heavily discussed issue, as extremes present first-order menaces for the general
public, the economy and the natural environment. According to IPCC an extreme weather event
is an event that is rare within its statistical reference distribution at a particular place.
Definitions of “rare” vary, but an extreme weather event would normally be as rare as or rarer
than the 10th or 90th percentile. Extreme parameters, which are listed in the table below, and
their trends were investigated for the CLAVIER study region between 1951 and 2050 (Figure
6., Figure 6.3). The analysis is based on the empirical-statistical error corrected data from the
STAT-CLIMATE-ECA-REMO57_a1b scenario.
Table 6.2 Parameters for extremes
Name Unit Description
mean temperature K mean surface(2m) air temperature
90th percentile of maximum temperature °C 90th percentile of daily maximum temperature(tas_dx)
10th percentile of minimum temperature °C 10th percentile of daily minimum temperature(tas_dn)
The number of frost days days number of days with minimum temperature (tas_dn)
summer days days number of days where the maximum temperature (tas_dx)
exceeds 25°C
tropical nights days number of days where the minimum temperature (tas_dn)
exceeds 20°C
90th percentile heat wave duration days
maximum number of days per year (at least 6) where the
maximum temperature (tas_dx) exceeds its long term (30
years) 90th percentile calculated in 5-day windows
precipitation amount mm/day mean surface precipitation amount
precipitation intensity mm/day mean daily precipitation sum on rainy days (days where
pr_24h exceeds 1mm/day)
90th percentile of wet day precipitation mm 90th percentile of daily precipitation sums (pr_24h)
90th percentile of wet day precipitation mm 90th percentile of daily precipitation sums (pr_24h) on wet
days (pr_24hc >= 1mm)
greatest 1-day rainfall mm maximum precipitation sum in one day
greatest 5-day rainfall mm maximum precipitation sum in 5 consecutive days
intense precipitation days number of days where the daily precipitation sum (pr_24hc)
exceeds 10 mm/day
consecutive dry days days maximum number of consecutive dry days
Regarding the temperature-related indices for extremes, a throughout significant warming
signal can be found in the entire CLAVIER domain with warming maxima in winter and
autumn. Most drastically this can be seen in the summer months for tropical nights (tnn20,
minimum temperature > 20°C) in Bulgaria. The duration of heat waves notably increases till
the mid century. A comparison of the CLAVIER countries shows comparable trends in all three
countries in most parameters, but on a higher level in Bulgaria. Regarding precipitation-related
indices for extremes, only few significant trends are found. In all three countries all parameters
262
(mean precipitation and parameters for extremes) have the tendency to decline in summer and
to increase in winter. Bulgaria again stands out with a strong increase in consecutive dry days.
6.2.2. Climate Scenarios for the 2080s and end of 21 Century
Significant summer warming in the western Balkan countries, were projected by the HadCM3
model for 2080. Air temperatures during this time of the year are expected to increase between
5° and 8°C over most of the countries in the peninsula. Summer precipitation is projected to
decrease in the region of interest. HadCM3 climate change scenarios were also created for
every used weather stations from selected areas in Bulgaria. Figure 6.4 shows the monthly
climate values of air temperature and precipitation in Novachene (north Bulgaria) under the
HaDCM3 climate change scenarios for the years 2020, 2050 and 2080. It could be seen that the
newer HadCM3 model simulates higher increases for monthly air temperature in comparison to
the previous HadCM2 ones. Even air temperatures in July and August are projected to be in
2080 near 8°C higher than air temperatures, relative to the period 1961-1990 (Figure 6.3).
Simulated HadCM3 precipitation has a similar direction for the 21st century as for the
HadCM2 and ECHAM4 models – a decreasing one. Monthly precipitation in Novachene from
May to September is projected to be about 50 % reduced in 2080. Only precipitation in
February and March as well as December is expected to increase during the 21st century.
Additional findings from the CECILIA project are listed below:
Obviously winters will be milder in the next decades reaching up to 10°C and even more
in some areas
Recent summers will gradually disappear as it will be hotter with average maximum air
temperatures often above 30°C in most lowland areas in the country.
Ice days will decrease, higher min temperature will affect the period of vernalisation in
winter and crop growth in summer
It is clear that by increasing maximum and minimum air temperatures will caused
respective increase of mean air temperature both in winter and summer
The number of summer days increases up to 90 days in the period 2021-2050. Percentage
of summer days is projected to rise from 18-20 % nowadays to more than 40 % in most
flat locations in south Bulgaria
The hot days would increase as well, up to 30 % till the end of the 21st century.
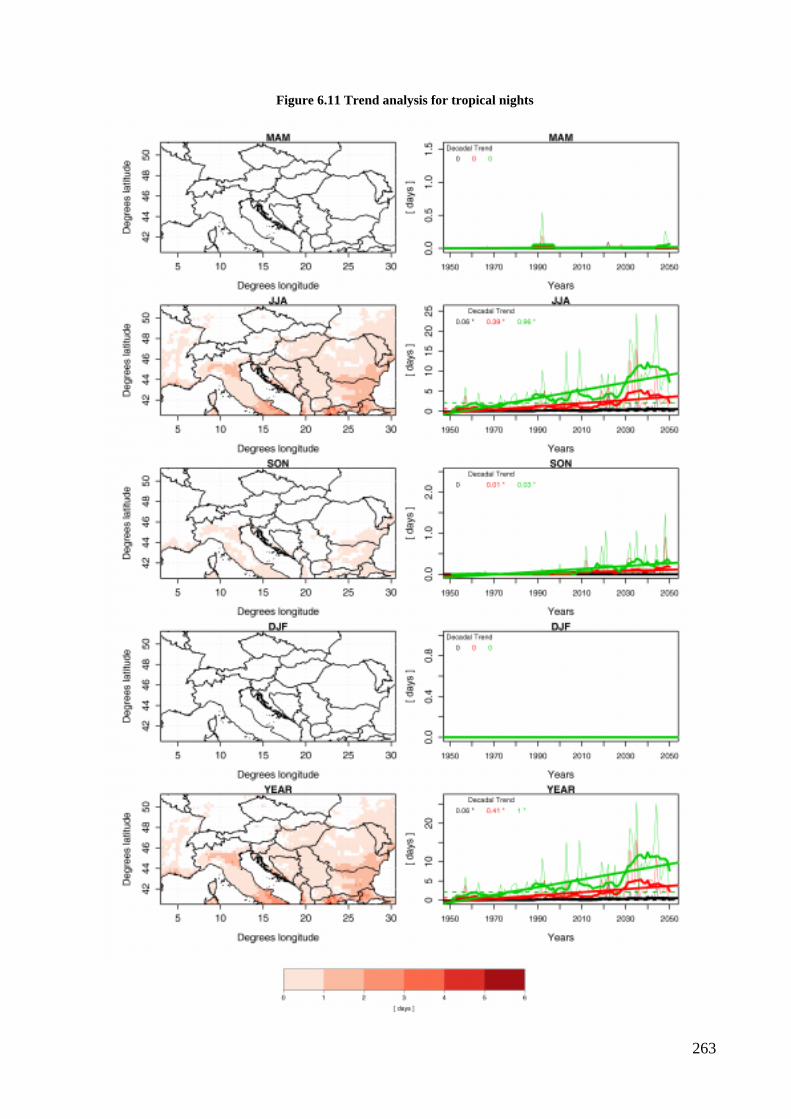
263
Figure 6.11 Trend analysis for tropical nights
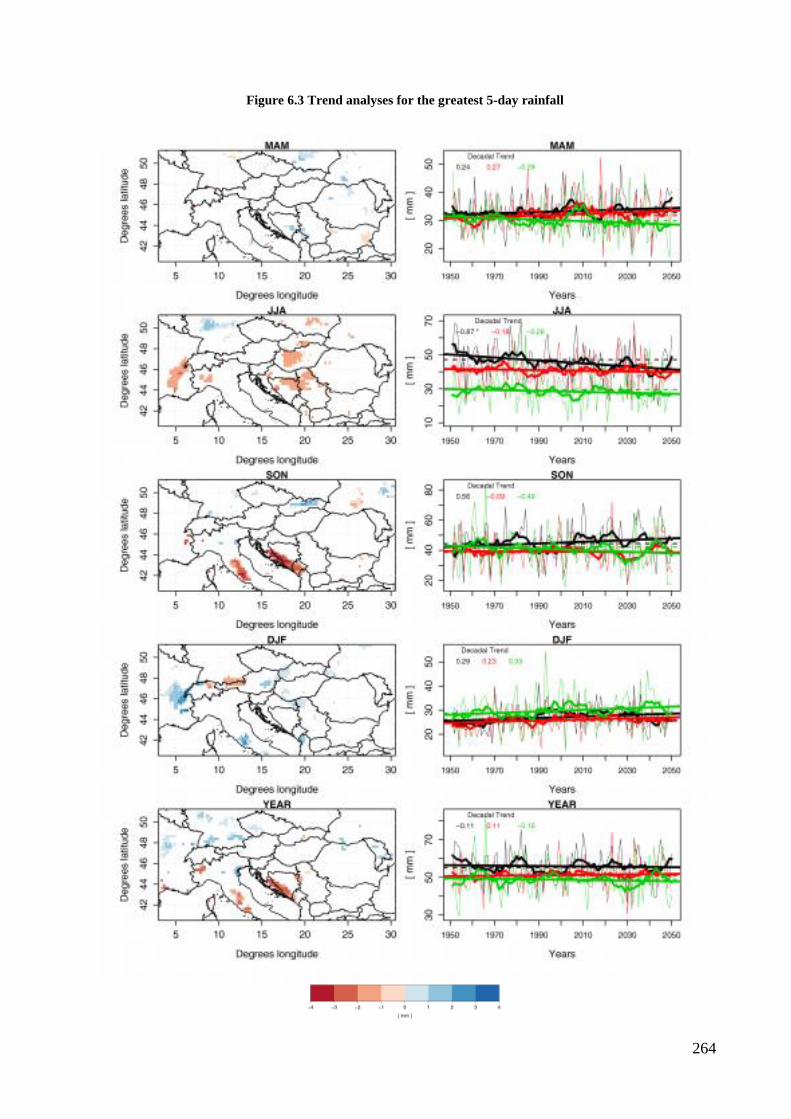
264
Figure 6.3 Trend analyses for the greatest 5-day rainfall
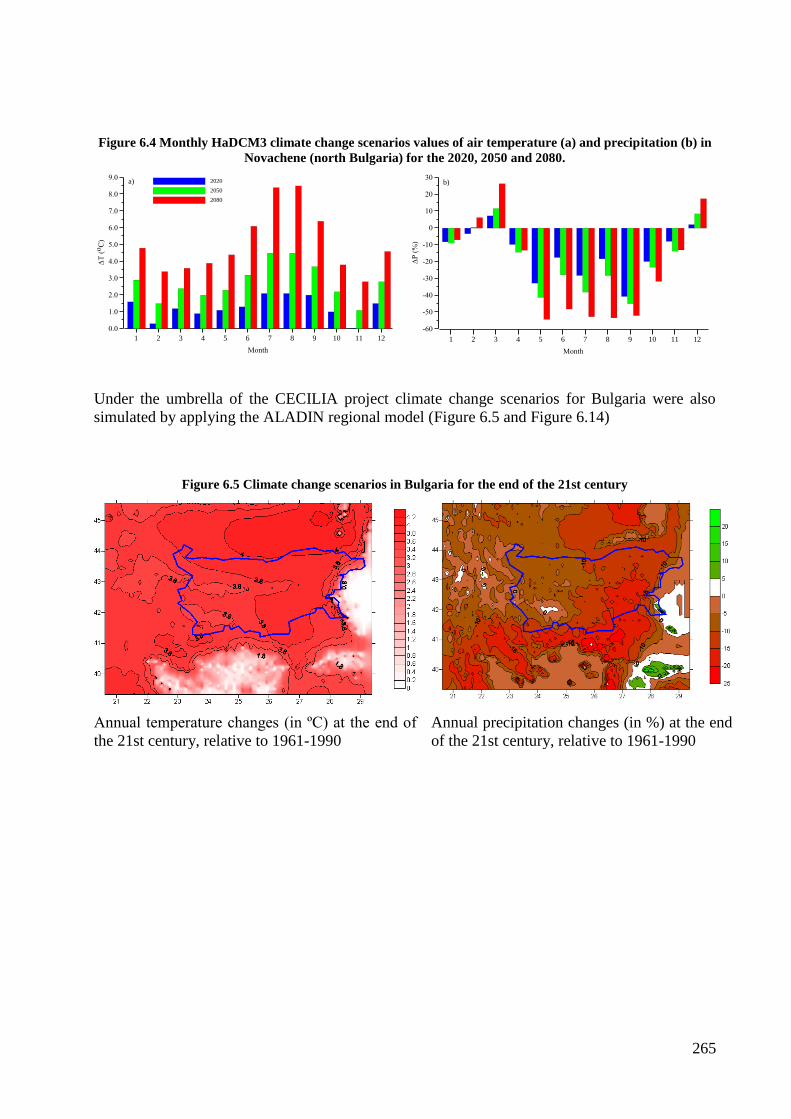
265
Figure 6.4 Monthly HaDCM3 climate change scenarios values of air temperature (a) and precipitation (b) in
Novachene (north Bulgaria) for the 2020, 2050 and 2080.
1 2 3 4 5 6 7 8 9 10 11 12
Month
0.0
1.0
2.0
3.0
4.0
5.0
6.0
7.0
8.0
9.0
T
(o
C)
a) 2020
2050
2080
1 2 3 4 5 6 7 8 9 10 11 12
Month
-60
-50
-40
-30
-20
-10
0
10
20
30
P
(%
)
b)
Under the umbrella of the CECILIA project climate change scenarios for Bulgaria were also
simulated by applying the ALADIN regional model (Figure 6.5 and Figure 6.14)
Figure 6.5 Climate change scenarios in Bulgaria for the end of the 21st century
Annual temperature changes (in ºC) at the end of
the 21st century, relative to 1961-1990
Annual precipitation changes (in %) at the end
of the 21st century, relative to 1961-1990
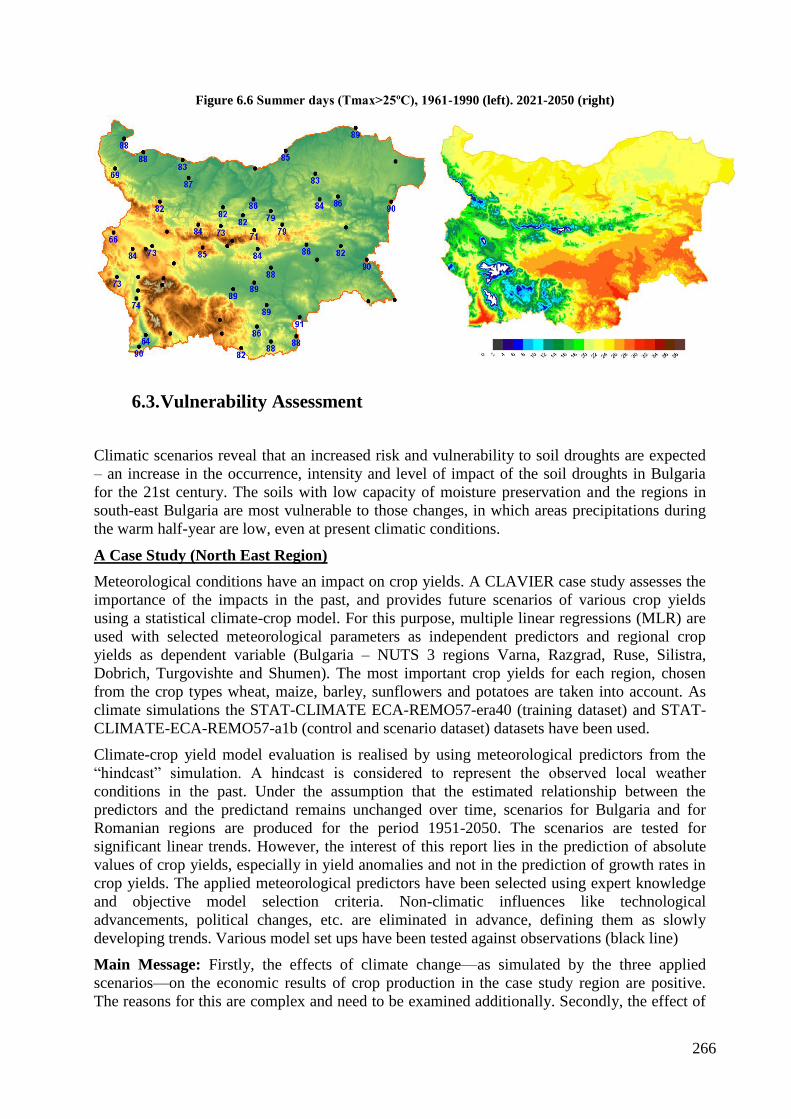
266
Figure 6.6 Summer days (Tmax>25ºC), 1961-1990 (left). 2021-2050 (right)
6.3. Vulnerability Assessment
Climatic scenarios reveal that an increased risk and vulnerability to soil droughts are expected
– an increase in the occurrence, intensity and level of impact of the soil droughts in Bulgaria
for the 21st century. The soils with low capacity of moisture preservation and the regions in
south-east Bulgaria are most vulnerable to those changes, in which areas precipitations during
the warm half-year are low, even at present climatic conditions.
A Case Study (North East Region)
Meteorological conditions have an impact on crop yields. A CLAVIER case study assesses the
importance of the impacts in the past, and provides future scenarios of various crop yields
using a statistical climate-crop model. For this purpose, multiple linear regressions (MLR) are
used with selected meteorological parameters as independent predictors and regional crop
yields as dependent variable (Bulgaria – NUTS 3 regions Varna, Razgrad, Ruse, Silistra,
Dobrich, Turgovishte and Shumen). The most important crop yields for each region, chosen
from the crop types wheat, maize, barley, sunflowers and potatoes are taken into account. As
climate simulations the STAT-CLIMATE ECA-REMO57-era40 (training dataset) and STAT-
CLIMATE-ECA-REMO57-a1b (control and scenario dataset) datasets have been used.
Climate-crop yield model evaluation is realised by using meteorological predictors from the
“hindcast” simulation. A hindcast is considered to represent the observed local weather
conditions in the past. Under the assumption that the estimated relationship between the
predictors and the predictand remains unchanged over time, scenarios for Bulgaria and for
Romanian regions are produced for the period 1951-2050. The scenarios are tested for
significant linear trends. However, the interest of this report lies in the prediction of absolute
values of crop yields, especially in yield anomalies and not in the prediction of growth rates in
crop yields. The applied meteorological predictors have been selected using expert knowledge
and objective model selection criteria. Non-climatic influences like technological
advancements, political changes, etc. are eliminated in advance, defining them as slowly
developing trends. Various model set ups have been tested against observations (black line)
Main Message: Firstly, the effects of climate change—as simulated by the three applied
scenarios—on the economic results of crop production in the case study region are positive.
The reasons for this are complex and need to be examined additionally. Secondly, the effect of
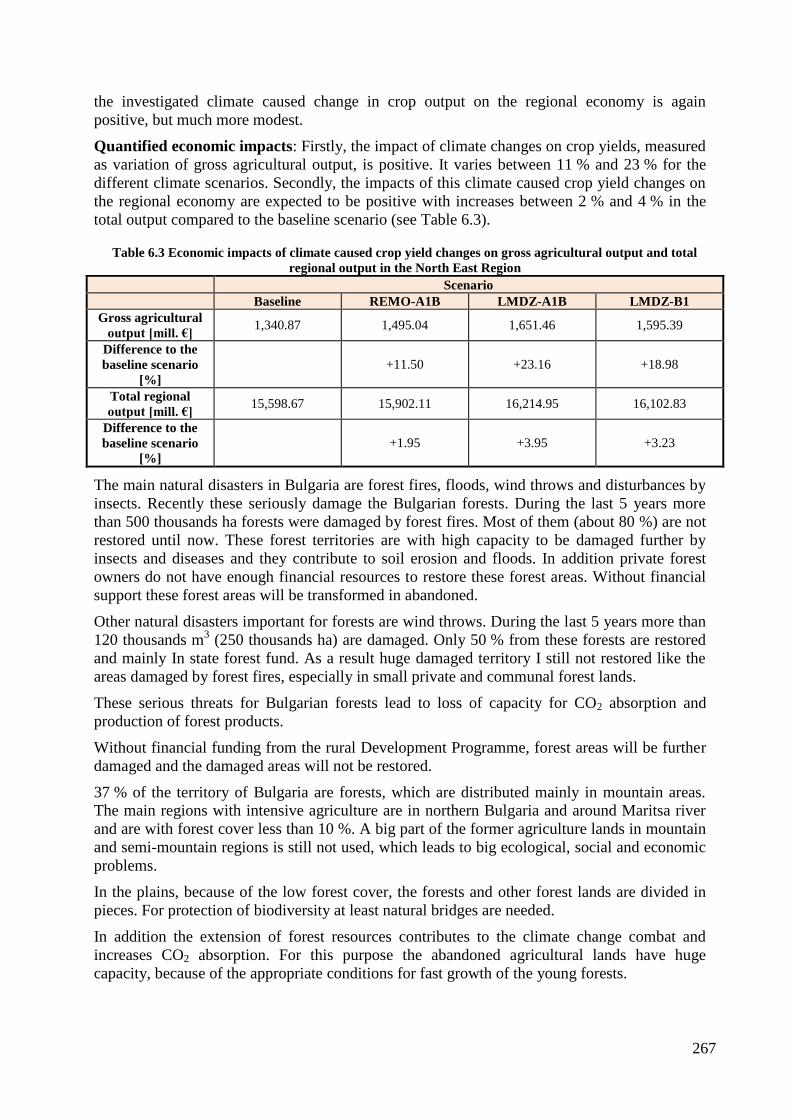
267
the investigated climate caused change in crop output on the regional economy is again
positive, but much more modest.
Quantified economic impacts: Firstly, the impact of climate changes on crop yields, measured
as variation of gross agricultural output, is positive. It varies between 11 % and 23 % for the
different climate scenarios. Secondly, the impacts of this climate caused crop yield changes on
the regional economy are expected to be positive with increases between 2 % and 4 % in the
total output compared to the baseline scenario (see Table 6.3).
Table 6.3 Economic impacts of climate caused crop yield changes on gross agricultural output and total
regional output in the North East Region
Scenario
Baseline REMO-A1B LMDZ-A1B LMDZ-B1
Gross agricultural
output [mill. €] 1,340.87 1,495.04 1,651.46 1,595.39
Difference to the
baseline scenario
[%]
+11.50 +23.16 +18.98
Total regional
output [mill. €] 15,598.67 15,902.11 16,214.95 16,102.83
Difference to the
baseline scenario
[%]
+1.95 +3.95 +3.23
The main natural disasters in Bulgaria are forest fires, floods, wind throws and disturbances by
insects. Recently these seriously damage the Bulgarian forests. During the last 5 years more
than 500 thousands ha forests were damaged by forest fires. Most of them (about 80 %) are not
restored until now. These forest territories are with high capacity to be damaged further by
insects and diseases and they contribute to soil erosion and floods. In addition private forest
owners do not have enough financial resources to restore these forest areas. Without financial
support these forest areas will be transformed in abandoned.
Other natural disasters important for forests are wind throws. During the last 5 years more than
120 thousands m3 (250 thousands ha) are damaged. Only 50 % from these forests are restored
and mainly In state forest fund. As a result huge damaged territory I still not restored like the
areas damaged by forest fires, especially in small private and communal forest lands.
These serious threats for Bulgarian forests lead to loss of capacity for CO2 absorption and
production of forest products.
Without financial funding from the rural Development Programme, forest areas will be further
damaged and the damaged areas will not be restored.
37 % of the territory of Bulgaria are forests, which are distributed mainly in mountain areas.
The main regions with intensive agriculture are in northern Bulgaria and around Maritsa river
and are with forest cover less than 10 %. A big part of the former agriculture lands in mountain
and semi-mountain regions is still not used, which leads to big ecological, social and economic
problems.
In the plains, because of the low forest cover, the forests and other forest lands are divided in
pieces. For protection of biodiversity at least natural bridges are needed.
In addition the extension of forest resources contributes to the climate change combat and
increases CO2 absorption. For this purpose the abandoned agricultural lands have huge
capacity, because of the appropriate conditions for fast growth of the young forests.
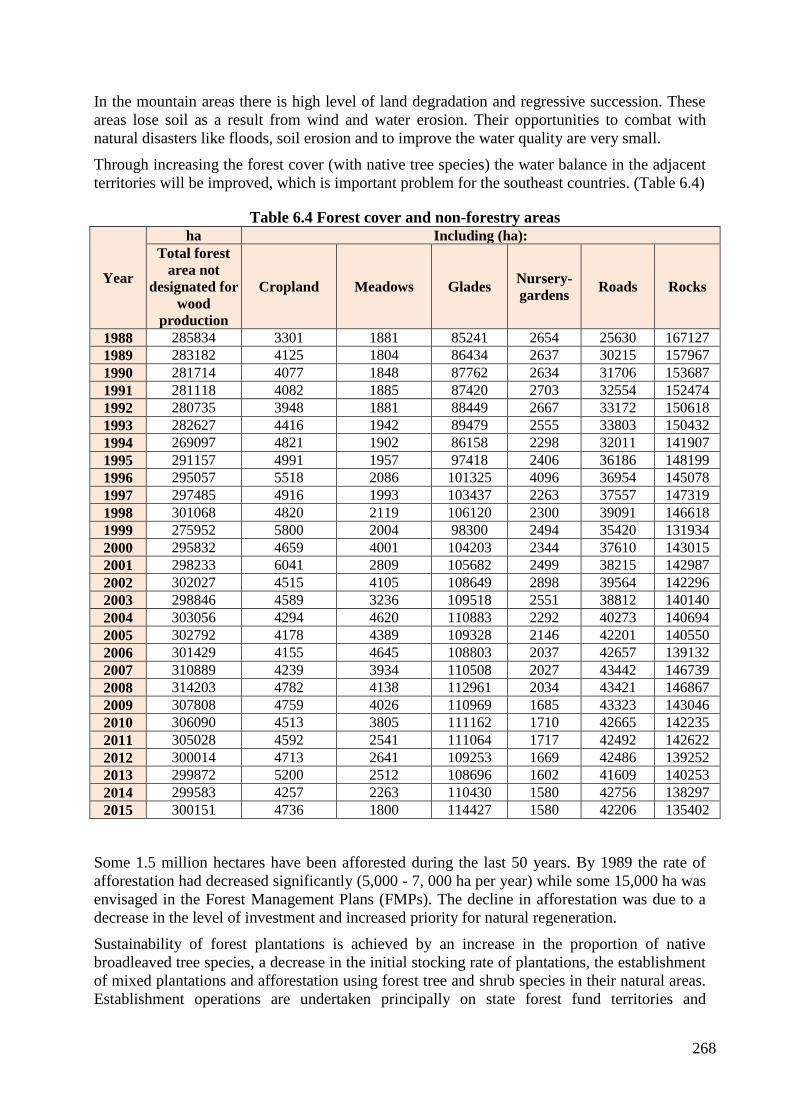
268
In the mountain areas there is high level of land degradation and regressive succession. These
areas lose soil as a result from wind and water erosion. Their opportunities to combat with
natural disasters like floods, soil erosion and to improve the water quality are very small.
Through increasing the forest cover (with native tree species) the water balance in the adjacent
territories will be improved, which is important problem for the southeast countries. (Table 6.4)
Table 6.4 Forest cover and non-forestry areas
Year
ha Including (ha):
Total forest
area not
designated for
wood
production
Cropland Meadows Glades Nursery-
gardens Roads Rocks
1988 285834 3301 1881 85241 2654 25630 167127
1989 283182 4125 1804 86434 2637 30215 157967
1990 281714 4077 1848 87762 2634 31706 153687
1991 281118 4082 1885 87420 2703 32554 152474
1992 280735 3948 1881 88449 2667 33172 150618
1993 282627 4416 1942 89479 2555 33803 150432
1994 269097 4821 1902 86158 2298 32011 141907
1995 291157 4991 1957 97418 2406 36186 148199
1996 295057 5518 2086 101325 4096 36954 145078
1997 297485 4916 1993 103437 2263 37557 147319
1998 301068 4820 2119 106120 2300 39091 146618
1999 275952 5800 2004 98300 2494 35420 131934
2000 295832 4659 4001 104203 2344 37610 143015
2001 298233 6041 2809 105682 2499 38215 142987
2002 302027 4515 4105 108649 2898 39564 142296
2003 298846 4589 3236 109518 2551 38812 140140
2004 303056 4294 4620 110883 2292 40273 140694
2005 302792 4178 4389 109328 2146 42201 140550
2006 301429 4155 4645 108803 2037 42657 139132
2007 310889 4239 3934 110508 2027 43442 146739
2008 314203 4782 4138 112961 2034 43421 146867
2009 307808 4759 4026 110969 1685 43323 143046
2010 306090 4513 3805 111162 1710 42665 142235
2011 305028 4592 2541 111064 1717 42492 142622
2012 300014 4713 2641 109253 1669 42486 139252
2013 299872 5200 2512 108696 1602 41609 140253
2014 299583 4257 2263 110430 1580 42756 138297
2015 300151 4736 1800 114427 1580 42206 135402
Some 1.5 million hectares have been afforested during the last 50 years. By 1989 the rate of
afforestation had decreased significantly (5,000 - 7, 000 ha per year) while some 15,000 ha was
envisaged in the Forest Management Plans (FMPs). The decline in afforestation was due to a
decrease in the level of investment and increased priority for natural regeneration.
Sustainability of forest plantations is achieved by an increase in the proportion of native
broadleaved tree species, a decrease in the initial stocking rate of plantations, the establishment
of mixed plantations and afforestation using forest tree and shrub species in their natural areas.
Establishment operations are undertaken principally on state forest fund territories and
269
particularly on areas destroyed by fire, stands and plantations damaged by drought, clearings
and bare areas.
The reserve for the future expansion of the forests is estimated as nearly 300 000 ha. According
to expert evaluation there are about 100 000 ha of bare lands, suitable for afforestation.
There are some regulatory preconditions - internal (amendments to the Law on Forest) and
external (mechanisms for mutual implementation of the Kyoto Protocol) - for ensuring
sustainable contribution of our country towards decreasing CO2 emissions and increasing
renewable energy sources through the establishment of new forests, including plantations for
biomass.
An especially important task for the management of forest resources, particularly in that part of
the country – with an altitude of up to 800 m, is the implementation of the activities concerning
the adapting of forest vegetation to the climate changes.
The average growing stock per hectare in 2008 was 159 m3. During the last 35 years the total
growing stock more than doubled from 252.2 million m3 to 591 million m
3. Total annual
increment of the forests is estimated as 14 million m3.
The large-scale afforestation activities from the middle of the last century resulted in a sudden
increase in the area covered by coniferous forest. After 1990 the area of conifer forests started
to decline and now represent only 30.2 % of the forest area. This trend is expected to continue
into the future.
The forest area managed mainly for the purpose of harvesting and environmental functions
during 2008 was 68.1 %; protective forests and forests for recreation represented 19.8 % and
the forests and lands in protected areas covered 8.2 % of the forest fund of the country. Some
13.4 % of Bulgarian forests have as a primary function the protection of the soil against erosion
and water balance maintenance.
In the context of the regulated carbon markets, forestry and land-use projects have played a
very small role in producing emission reductions so far, even though it is estimated that around
20 percent of greenhouse gases emissions globally are linked to the forestry and land-use
sector. On the voluntary market the picture is quite different, with forestry projects representing
as much as 15 percent of all.
Developing carbon forestry projects for the voluntary market is another possibility that should
be explored. Again some of the limitations associated with JI projects could be mitigated. Since
buyers on the voluntary market are not necessarily time bound by a dated emissions reduction
target, the project implementation period can be longer.
Another opportunity that needs to be considered in the forestry sector is the use of biomass in
energy production. The use of local fuel-wood and wood waste (bark, shavings, etc.), industrial
waste wood, or agricultural residues for heating, energy production, or combined heat and
power plants could have a large potential in rural areas in Bulgaria. Improved forest
management and thinning operations could increase the access to fuel-wood and wood waste.
The benefits would potentially include lower fuel costs, reduced local air pollution, and access
to locally-produced energy sources. The greenhouse gases emission reductions depend on the
fuel that is replaced. In addition methane emissions from the decay of wood waste would be
reduced, which could also have large emission reduction and carbon revenue potential. Carbon
revenues could be generated from the emission reductions associated with switching fuels
(from a carbon intensive fuel like mazut to a relatively less carbon intensive fuel source like
wood).
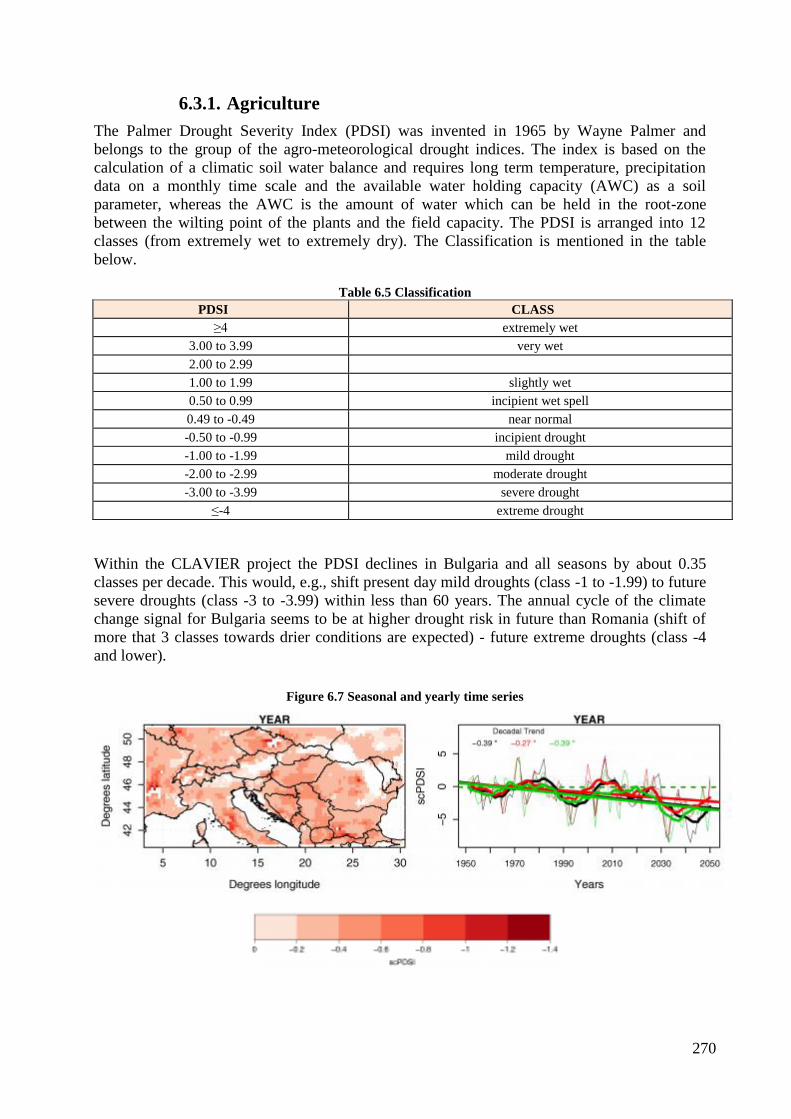
270
6.3.1. Agriculture
The Palmer Drought Severity Index (PDSI) was invented in 1965 by Wayne Palmer and
belongs to the group of the agro-meteorological drought indices. The index is based on the
calculation of a climatic soil water balance and requires long term temperature, precipitation
data on a monthly time scale and the available water holding capacity (AWC) as a soil
parameter, whereas the AWC is the amount of water which can be held in the root-zone
between the wilting point of the plants and the field capacity. The PDSI is arranged into 12
classes (from extremely wet to extremely dry). The Classification is mentioned in the table
below.
Table 6.5 Classification
PDSI CLASS
≥4 extremely wet
3.00 to 3.99 very wet
2.00 to 2.99
1.00 to 1.99 slightly wet
0.50 to 0.99 incipient wet spell
0.49 to -0.49 near normal
-0.50 to -0.99 incipient drought
-1.00 to -1.99 mild drought
-2.00 to -2.99 moderate drought
-3.00 to -3.99 severe drought
≤-4 extreme drought
Within the CLAVIER project the PDSI declines in Bulgaria and all seasons by about 0.35
classes per decade. This would, e.g., shift present day mild droughts (class -1 to -1.99) to future
severe droughts (class -3 to -3.99) within less than 60 years. The annual cycle of the climate
change signal for Bulgaria seems to be at higher drought risk in future than Romania (shift of
more that 3 classes towards drier conditions are expected) - future extreme droughts (class -4
and lower).
Figure 6.7 Seasonal and yearly time series
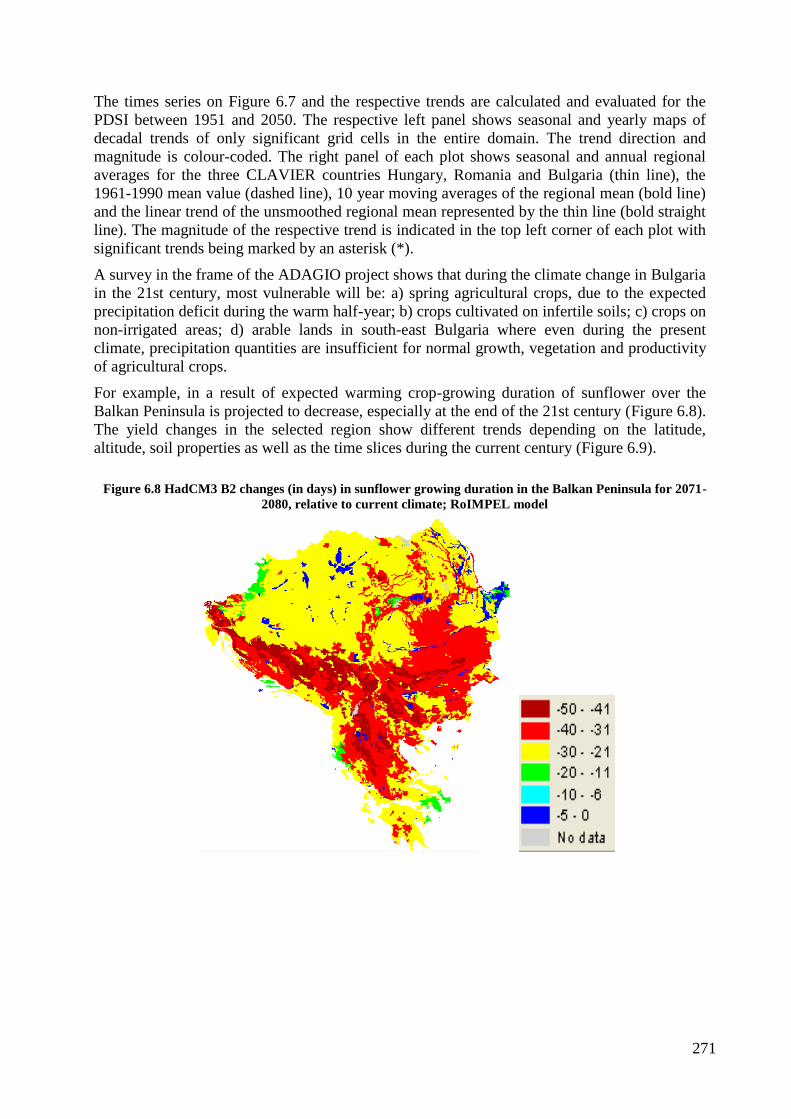
271
The times series on Figure 6.7 and the respective trends are calculated and evaluated for the
PDSI between 1951 and 2050. The respective left panel shows seasonal and yearly maps of
decadal trends of only significant grid cells in the entire domain. The trend direction and
magnitude is colour-coded. The right panel of each plot shows seasonal and annual regional
averages for the three CLAVIER countries Hungary, Romania and Bulgaria (thin line), the
1961-1990 mean value (dashed line), 10 year moving averages of the regional mean (bold line)
and the linear trend of the unsmoothed regional mean represented by the thin line (bold straight
line). The magnitude of the respective trend is indicated in the top left corner of each plot with
significant trends being marked by an asterisk (*).
A survey in the frame of the ADAGIO project shows that during the climate change in Bulgaria
in the 21st century, most vulnerable will be: a) spring agricultural crops, due to the expected
precipitation deficit during the warm half-year; b) crops cultivated on infertile soils; c) crops on
non-irrigated areas; d) arable lands in south-east Bulgaria where even during the present
climate, precipitation quantities are insufficient for normal growth, vegetation and productivity
of agricultural crops.
For example, in a result of expected warming crop-growing duration of sunflower over the
Balkan Peninsula is projected to decrease, especially at the end of the 21st century (Figure 6.8).
The yield changes in the selected region show different trends depending on the latitude,
altitude, soil properties as well as the time slices during the current century (Figure 6.9).
Figure 6.8 HadCM3 B2 changes (in days) in sunflower growing duration in the Balkan Peninsula for 2071-
2080, relative to current climate; RoIMPEL model
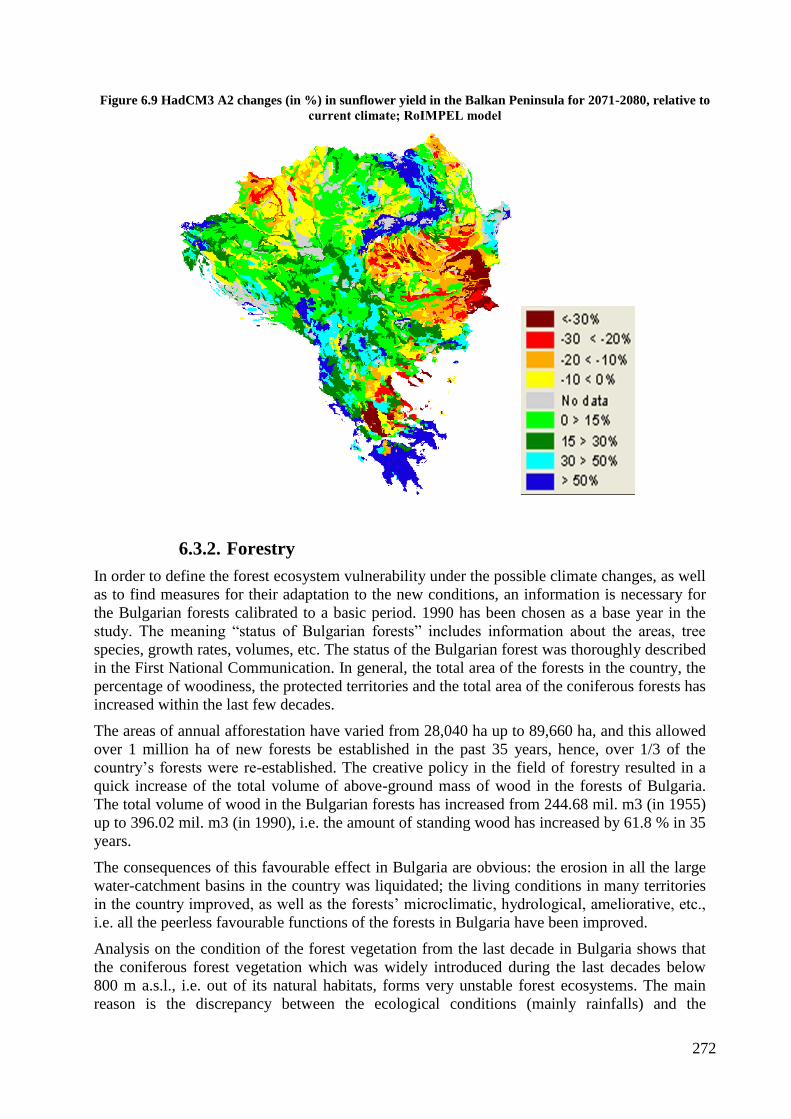
272
Figure 6.9 HadCM3 A2 changes (in %) in sunflower yield in the Balkan Peninsula for 2071-2080, relative to
current climate; RоIMPEL model
6.3.2. Forestry
In order to define the forest ecosystem vulnerability under the possible climate changes, as well
as to find measures for their adaptation to the new conditions, an information is necessary for
the Bulgarian forests calibrated to a basic period. 1990 has been chosen as a base year in the
study. The meaning “status of Bulgarian forests” includes information about the areas, tree
species, growth rates, volumes, etc. The status of the Bulgarian forest was thoroughly described
in the First National Communication. In general, the total area of the forests in the country, the
percentage of woodiness, the protected territories and the total area of the coniferous forests has
increased within the last few decades.
The areas of annual afforestation have varied from 28,040 ha up to 89,660 ha, and this allowed
over 1 million ha of new forests be established in the past 35 years, hence, over 1/3 of the
country’s forests were re-established. The creative policy in the field of forestry resulted in a
quick increase of the total volume of above-ground mass of wood in the forests of Bulgaria.
The total volume of wood in the Bulgarian forests has increased from 244.68 mil. m3 (in 1955)
up to 396.02 mil. m3 (in 1990), i.e. the amount of standing wood has increased by 61.8 % in 35
years.
The consequences of this favourable effect in Bulgaria are obvious: the erosion in all the large
water-catchment basins in the country was liquidated; the living conditions in many territories
in the country improved, as well as the forests’ microclimatic, hydrological, ameliorative, etc.,
i.e. all the peerless favourable functions of the forests in Bulgaria have been improved.
Analysis on the condition of the forest vegetation from the last decade in Bulgaria shows that
the coniferous forest vegetation which was widely introduced during the last decades below
800 m a.s.l., i.e. out of its natural habitats, forms very unstable forest ecosystems. The main
reason is the discrepancy between the ecological conditions (mainly rainfalls) and the
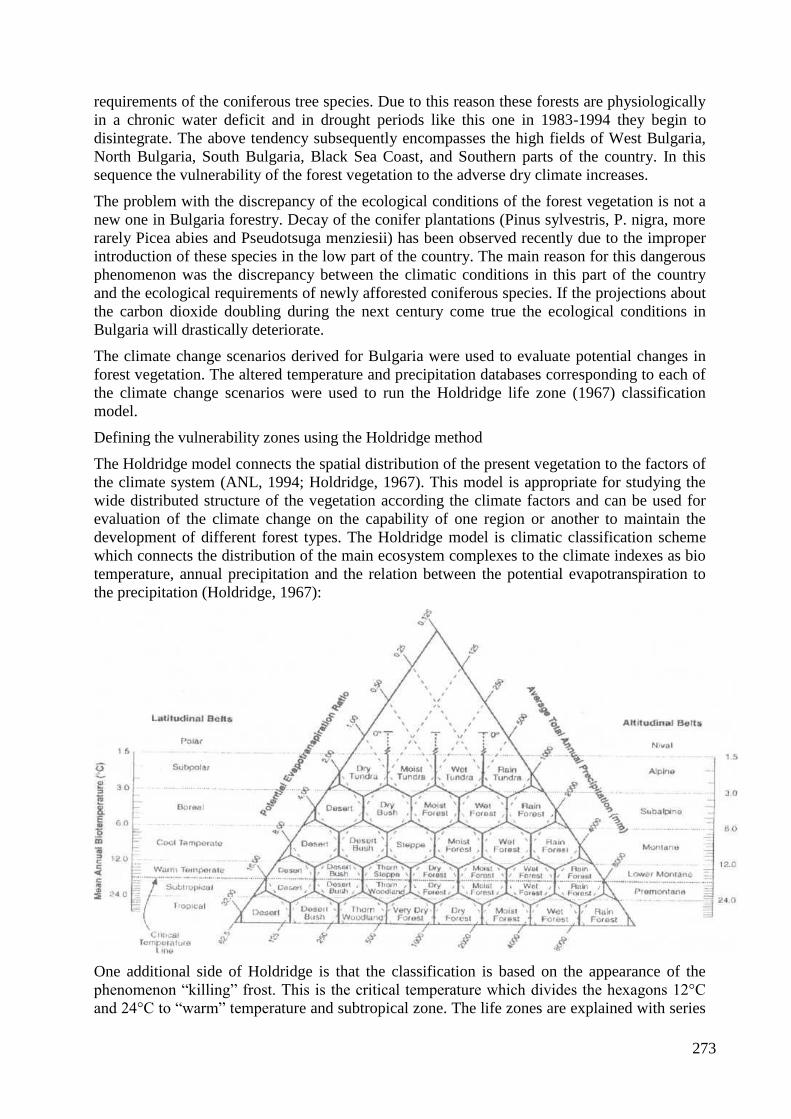
273
requirements of the coniferous tree species. Due to this reason these forests are physiologically
in a chronic water deficit and in drought periods like this one in 1983-1994 they begin to
disintegrate. The above tendency subsequently encompasses the high fields of West Bulgaria,
North Bulgaria, South Bulgaria, Black Sea Coast, and Southern parts of the country. In this
sequence the vulnerability of the forest vegetation to the adverse dry climate increases.
The problem with the discrepancy of the ecological conditions of the forest vegetation is not a
new one in Bulgaria forestry. Decay of the conifer plantations (Pinus sylvestris, P. nigra, more
rarely Picea abies and Pseudotsuga menziesii) has been observed recently due to the improper
introduction of these species in the low part of the country. The main reason for this dangerous
phenomenon was the discrepancy between the climatic conditions in this part of the country
and the ecological requirements of newly afforested coniferous species. If the projections about
the carbon dioxide doubling during the next century come true the ecological conditions in
Bulgaria will drastically deteriorate.
The climate change scenarios derived for Bulgaria were used to evaluate potential changes in
forest vegetation. The altered temperature and precipitation databases corresponding to each of
the climate change scenarios were used to run the Holdridge life zone (1967) classification
model.
Defining the vulnerability zones using the Holdridge method
The Holdridge model connects the spatial distribution of the present vegetation to the factors of
the climate system (ANL, 1994; Holdridge, 1967). This model is appropriate for studying the
wide distributed structure of the vegetation according the climate factors and can be used for
evaluation of the climate change on the capability of one region or another to maintain the
development of different forest types. The Holdridge model is climatic classification scheme
which connects the distribution of the main ecosystem complexes to the climate indexes as bio
temperature, annual precipitation and the relation between the potential evapotranspiration to
the precipitation (Holdridge, 1967):
One additional side of Holdridge is that the classification is based on the appearance of the
phenomenon “killing” frost. This is the critical temperature which divides the hexagons 12°C
and 24°C to “warm” temperature and subtropical zone. The life zones are explained with series
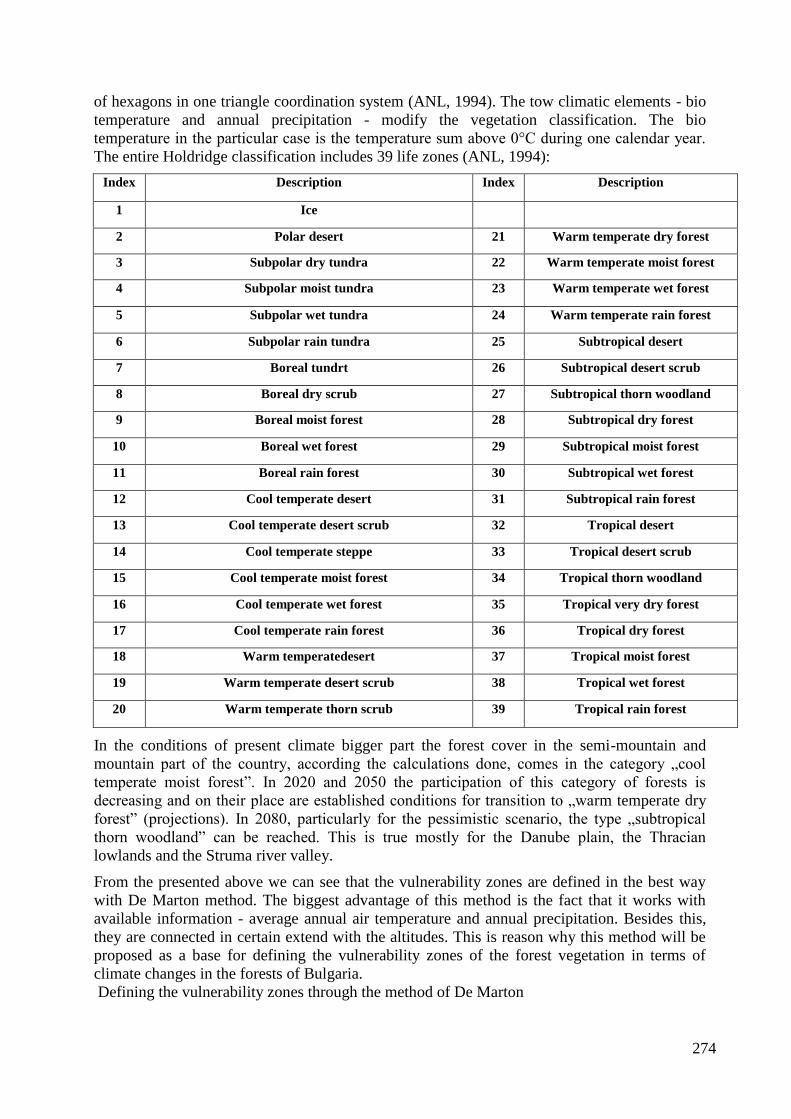
274
of hexagons in one triangle coordination system (ANL, 1994). The tow climatic elements - bio
temperature and annual precipitation - modify the vegetation classification. The bio
temperature in the particular case is the temperature sum above 0°C during one calendar year.
The entire Holdridge classification includes 39 life zones (ANL, 1994):
Index Description Index Description
1 Ice
2 Polar desert 21 Warm temperate dry forest
3 Subpolar dry tundra 22 Warm temperate moist forest
4 Subpolar moist tundra 23 Warm temperate wet forest
5 Subpolar wet tundra 24 Warm temperate rain forest
6 Subpolar rain tundra 25 Subtropical desert
7 Boreal tundrt 26 Subtropical desert scrub
8 Boreal dry scrub 27 Subtropical thorn woodland
9 Boreal moist forest 28 Subtropical dry forest
10 Boreal wet forest 29 Subtropical moist forest
11 Boreal rain forest 30 Subtropical wet forest
12 Cool temperate desert 31 Subtropical rain forest
13 Cool temperate desert scrub 32 Tropical desert
14 Cool temperate steppe 33 Tropical desert scrub
15 Cool temperate moist forest 34 Tropical thorn woodland
16 Cool temperate wet forest 35 Tropical very dry forest
17 Cool temperate rain forest 36 Tropical dry forest
18 Warm temperatedesert 37 Tropical moist forest
19 Warm temperate desert scrub 38 Tropical wet forest
20 Warm temperate thorn scrub 39 Tropical rain forest
In the conditions of present climate bigger part the forest cover in the semi-mountain and
mountain part of the country, according the calculations done, comes in the category „cool
temperate moist forest”. In 2020 and 2050 the participation of this category of forests is
decreasing and on their place are established conditions for transition to „warm temperate dry
forest” (projections). In 2080, particularly for the pessimistic scenario, the type „subtropical
thorn woodland” can be reached. This is true mostly for the Danube plain, the Thracian
lowlands and the Struma river valley.
From the presented above we can see that the vulnerability zones are defined in the best way
with De Marton method. The biggest advantage of this method is the fact that it works with
available information - average annual air temperature and annual precipitation. Besides this,
they are connected in certain extend with the altitudes. This is reason why this method will be
proposed as a base for defining the vulnerability zones of the forest vegetation in terms of
climate changes in the forests of Bulgaria.
Defining the vulnerability zones through the method of De Marton
275
The values of De Marton index and their ecological meaning have the following parameters:
- Zone A - index with value under 20 (in red color on the map): lasting deficit in
moistening, which leads to destruction of the forest ecosystems;
- Zone B - index from 21 to 30 (in yellow color on the map): lasting disturbances in the
moistening;
- Zone C - index from 31 to 40 (in green color on the map): disturbances in the
moistening in some years;
- Zone D - index from 41 to 70 (in blue color on the map): optimal conditions in the
moistening;
- Zone E - index above 70 (in purple color on the map): over moistening.
According the calculations and the elaborated maps, in conditions of present climate there is no
zone with value of De Marton index under 20, in which case the forest vegetation degrades.
In 2020 realistic scenario we can expect the appearance of values under on significant parts of
North-East Bulgaria. This process increases in 2050 with a strip along Danube River near the
town of Svishtov, and in 2080 this zone expands from Black Sea to the town of Tutrakan, from
Svishtov to the town of Vidin, as well as in parts of Thracian Lowland - In pessimistic scenario
for 2080 the picture is too unfavorable: lasting deficit in moistening appears on almost entire
South Dobrudja, bigger part of the Danube plain and Thracian lowland, as appears also in the
region of Petrich and Sandanski (South-West towns).
Zone A can be qualified as the most dangerous vulnerability zone in future climate changes as
there is lasting deficit of moistening.
At present time Zone B covers significant territories with altitude a.s.l. from 0 to-200 m. It
includes the Northern part of Danube plain, South Dobrudja, parts of the Thracian lowland and
the Black Sea coastal area without Strandja mountain. In 2020 zone B covers almost entire
Danube plain, the West part of Dobrudja, almost entire Thracian Lowland, the fields around
Petrich and Sandanski, the south coastal area of Black Sea and other lands under 300 m a.s.l. In
2050 zone B reaches 600 m a.s.l. and covers Danube plain, Dobrudja, the foothills of Balkan
mountain, the entire Thracian Lowland, the East Rhodope mountain, big parts of Sredna Gora
mountain and Strandja mountain, Sofia field, the valleys of Struma and Mesta rivers. In 2080
zone B covers bigger part of the territories from 200 to 900 m a.s.l.. In pessimistic scenario for
2080 zone B covers all territories from 200 to 1000 m a.s.l..
Zone C at present time covers large territories in the range 200-800 m a.s.l. in the South half of
the Danube plain, the foothills of Balkan, Sredna Gora, the high fields of West Bulgaria, the
valleys of Struma and Mesta rivers, East Rhodope and Strandja. In 2020 it covers territories
from 300 to 900 m a.s.l. ; in 2050 from 600 to 1000 m a.s.l. , to reach in 2080 from 900 to 1500
m a.s.l.. In pessimistic scenario in 2080 zone C is getting smaller in the range of 1000 to 1500
m a.s.l. - only in the high Bulgarian mountains.
Zone D is the optimal zone for growing of forest tree vegetation. Now this zone covers
significant parts of the mountains from 800 to 2000 m a.s.l. - Balkan, Sredna Gora, Rilo-
Rhodope massive, the Western mountains. In 2020 is expected to start from 900 m a.s.l. - up to
the highest parts of the mountains. In 2050 the border of the zone moves to 1000 m a.s.l., and
in 2080 probably will start from 1500 m a.s.l. - it will remain only in the highest Bulgarian
mountains.
Zone E is the zone with over moistening, which is also not favorable for the forest ecosystems.
This zone exists only in the conditions of the present climate. It covers the highest parts of Rila
276
and Pirin on altitude above 2000 m a.s.l. In conditions of warming and drying climate this zone
dose not exists — it is not present in 2020, 2050 and 2080.
The distribution of the forest area (ha) is given according vulnerability zones for the different
climate scenarios (present climate, 2020, 2050 and 2080). The data is obtained by overlapping
of the map of the forests in Bulgaria from the project CORINE LAND COVER 2006 on the
maps of the vulnerability zones defined with De Marton for present climate, 2020, 2050 and
2080. The territories of the forest cover show that the most vulnerable zone A, in which the
forest vegetation starts to fell apart increases 1,43 times in 2050 compared to 2020 and with
4,05 times for realistic scenario in 2080 compared with 2020. For the pessimistic scenario in
2080 this increasing is over 11 times.
For the forests in vulnerability zone B with lasting water deficit, the increasing of the territories
in 2020 compared to present condition is with 1,89 times; in 2050 - 3,66 times, and in 2080 for
realistic scenario - 4,1 times.
In contrast to the above tendencies, the areas in zone C, in which the moistening is not
sufficient only in particular years, show the opposite regularity: in 2050 compared with the
present climate they decrease with 18,6 %, and in 2080 for realistic scenario with 21,1 %.
The forests in vulnerability zone D - with optimal moistening, where are the most productive
Bulgarian forests, in 2020 it decreases with 25,7 %, in 2050 - 58,2 %, and in 2080 for realistic
scenario with 70,4 %.
The forests in vulnerability zone E with over moistening in 2020 are decreased by half
compared with the present situation and from 2050 practically does not exists.
Therefore, the climate changes in 21st century will lead to clearly notices worsening of the
moistening of the Bulgarian forests, especially on lower altitude above sea level. This will have
influence on the productivity and sustainability of the forest ecosystems and watersheds.
The changes are from “cool temperate moist forest” to “warm temperate dry forest” for North
Bulgaria, and for South Bulgaria the “warm temperate dry forest” will remain typical. In the
warmest country regions (station Sandanski) “subtropical dry forest” could be expected, which
means drastic warming and droughts. Since 60.6 % of forests are in the zone below 800 m, it is
clear, that most of the Bulgarian forests would be vulnerable to the drastic climate change
under the eventual doubling of carbon dioxide in the near future. The changes in the mountain
regions of the country (station Smoljan, 1180 m a.s.l.) would pass from “cool temperate wet
forest” to “warm temperate moist forest”. At an eventual climate warming a moving of the
species composition from South to North could be expected, which means shifting of tree and
shrub vegetation from the South-Bulgarian into the North-Bulgarian and from the South-
Bulgarian border region into the South-Bulgarian forest vegetation area, respectively. That
means that it could be expected that the South-Bulgarian border region area will be settled by
typical Mediterranean vegetation, a part of which is to be seen there even at present.
In addition to the First National Communication, hereafter the forest vulnerability was
evaluated following the GAP models. The prediction of the forest ecosystem responses to long-
term climate changes requires hierarchical constructed dynamic models, capable to cover and
describe in a mechanistic manner the combination of the basic ecosystem processes and their
interrelationships in space and time. The forest gap models are individually based programs
which simulate the vegetation response functions to the environmental conditions. The model
could evaluate the possible changes in the species composition, forest structure and
productivity of specific forest sites. The model requires detailed information on specific forest
species and environmental factors. The model could evaluate the dynamics of particular forest
site in response to the climate change.
277
The GAP model results show that in case of climate warming over the next 90 years, the
following consequences could be expected:
A. In the lowlands – Tree species diversity reduction. In spite of that, the biodiversity would be
greater compared with the biodiversity in the mountain regions. The selected tree species
guarantee increased bio-productivity. It could be considered that if proper selection is made,
optimal bio-production could be released under changed climate conditions.
B. In mountains – Increased tree biodiversity could be expected. It could be realized by means
of the natural shifting of tree vegetation from lower to higher sites in the mountains. This
process would be combined with biomass production increase.
C. Both in lowlands and mountains – Increased biomass productivity would be accompanied by
increased CO2 absorption.
Conclusions
Either using Holdridge Life Zones Classification Model or JABOWA-II Gap Model, two
climate zones of climate change influence have been established: from 0 to 600-800 m a.s.l.
and over 800 (1,000) m a.s.l. Working with Holdridge model, critical situation for the future of
the forests in the lowlands and low-hill regions on the whole was outlined, while developing
gap models it could be seen that the status of the forests (in all altitudes) wouldn’t be critical at
all. As Holdridge model provides a regional mapping system for interpreting spatial changes
throughout the country or regions, while the forest gap model evaluates the temporal dynamics
of a given site in response to climate change, it could be considered that the GAP model results
are more objective. It is found that for the purposes of the forestry production the most
appropriate is the dryness index of De Marton for defining the vulnerability zones.
The changing of the climate to warmer and dryer leads to worsening of the forest soils
characteristics. On the other hand, the change in the moisture and temperature regime of the
soils leads to appearance of conditions for stress in the forest ecosystems. It is pointed that
bigger part of the regions with observed stress regarding the soil moisture are located in the
South Border forest vegetation zone and others are located in the North East and East Bulgaria
in the low forest vegetation zone. In these regions the conditions are unfavorable and cause
anomalies in the growth and development of the forest stands.
It is found out that on the territory of Bulgaria predominant are the warm (meso) temperature
regimes. The warm and dry (thermo-xeric) regime of the soils is typical for the South Black
Sea coast and far South regions, as well as for lands in the lower stream of Maritsa river. These
regions in bigger extend overlap some sub zones of the South Border forest vegetation zone for
example Low Maritsa and Strandja Black Sea coast. The cool and wet regime is typical for the
soils in the mountain regions, there is growing forest vegetation and high mountain pastures.
The presence of sandy soils, more vulnerable to dryness is outlined in the territories along
Danube in North Bulgaria and in some parts of North East Bulgaria, as well as rocky or
“young” soils, which can be vulnerable to soil drying, but are met in mountain regions, where
the precipitation as a principle are higher. The heavy clayey soils are met mostly in Thracian
lowland and reach the Black Sea coast. They are also met singly and scattered in West
Bulgaria. There soils can also be vulnerable to drying despite the clay containing.
Regions in Bulgaria, vulnerable in terms of climate drying and resulting effects
The climate change, despite the direction, leads to change in the composition of the vegetation
and animal habitats. Some species migrate to territories with more favorable climate regime,
corresponding to their ecological and biological requirements, and in more drastic and rapid
278
changes and lack of possibility to migrate they can die. In the particular case the main
importance is not in the direction of climate change but in the quantitative changes of the
climate characteristics. The different biological species are distinguished with their plasticity,
and because of this, their reactions to the climate changes are expected to be different.
According to Raev et al. (1996) the forest territories in Bulgaria are relatively divided into two
vulnerability zones in terms of climate drying:
- Low forest vegetation zone (from 0 to 800 m a.s.l.);
- Forests in the higher parts of the country (above 800 m a.s.l.).
If we take into account the forest vegetation zoning in Bulgaria from Zahariev et al. (1979), the
first zone can be divided in several smaller groups. In the lower forest vegetation zone can be
differentiated three conditional groups of territories. The first group includes the forest areas
close to Black Sea, mostly the far East slopes of Balkan, the East part of Strandja and some
particular places on the North Black Sea coast. These territories, because of their close location
to Black Sea, receive enough mostly air humidity and is expected to be affected by the
processes of temperature increasing and drying on a very small scale. The second group
territories includes the forest ecosystems, dominated by deciduous tree species, mostly
representatives of Quercus sp., which cover the plain and hilly parts and slopes of the
mountains up to 800 m a.s.l. The third group of territories is this, located by Zahariev et al.
(1979) in the South Border forest vegetation zone, and in some areas of Thracian forest
vegetation zone. Here the Sandanski-Petrich valley, big percentage of the low parts of East
Rhodope and parts of West Rhodope are situated.
According to the realistic scenario for 2020 it is expected the De Martons’ index to be with
values bellow 20 in North East Bulgaria and mostly in Dobrudja. This could lead to changes in
the species composition, and areas with English oak (Q. robur) is expected to be substituted
with the Pubescent Oak. The tree species, which is expected to decrease their relevant
participation in the stands are: Quercus robur - English oak, Fraxinus oxycarpa - Caucasian
Ash, Staphyllea
pinnata - Bladdernut, Fagus sylvatica ssp. moesiaca - beech, low mountain sub species,
Crataegus monogyna - Common Hawthorn, Smilax excelsa, Alnus glutinosa - Black Alder,
Carpinus betulus
- common hornbeam.
Tree species, for which is expected to increase their participation, are the following: Quercus
pubescens
- Pubescent Oak, Crataegus pentagyna - small-flowered black hawthorn, Comus mas -
European Cornel, Carpinus orientalis - Oriental Hornbeam, Quercus frainetto - Flungarian Oak.
From the rest of the vegetation diversity the most affected will the representatives of the
mesophyll forests, because due to the disturbance of their structure is changed the light regime
and this can lead to decreasing of the quantity of a number of species or to their entire
extinction. Such are mostly the following species: Nectaroscordium siculum - Honey garlic,
Primula vulgaris - Primrose, Cirsium creticum, Carex acuta - Acute Sedge, Leucojum aestivum
- Summer snowflake, Humulus lupulus - Common hop and others.
The fauna is expected to be less affected.
The expected changes in this region can affect the coniferous monocultures as well. As in the
composition of some of them exist mesophyll species as the Douglas fir, silver fir and others,
they are expected to be the most affected and gradually to be excluded from the composition of
279
the cultures. According the Budiko index for 2020 other region, which can be related to the
zones with high vulnerability (zone A), are the flooded forests along Danube, which water
regime most likely will be changed. This can lead to decreasing the number of some
hydrophilic, the appearance of top dryness and particularly increasing of the areas, covered
with amorpha (Amorpha fruticosa), which is invasive species, despite it prefers more humid
areas it has significant ecological flexibility and is better than our species, typical for this
region, reading this characteristic.
To the regions with moderate vulnerability degree (zone B) can be added mostly the North part
of Strandja, parts of East Balkan, the region of Ludogorie, some parts of East Rhodope and
Sandanski- Petrich valley.
The change in Strandja and East Balkan is expected to be not till degradation of the stands, but
mostly in direction of their xerophytization. It is foreseen small increasing of the participation
of xerothermic and mesoxerophyte flora elements as Hungarian Oak (Quercus frainetto),
Pubescent Oak (Quercus pubescens), South European Flowering Ash (Fraxinus ornus), Pyrus
elaeagrifolia, Cistus incanus and others. At the same time is possible to observe decrease of the
participation of mesophyte elements as Holly (Ilex colchica), Cherry laurel (Prunus
laurocerasus), Daphne pontica, Smilax excelsa, Pontic Rhododendron (Rhododendron
ponticum), Euonymus latifolius, and from the grass species - Epimedium pubigerum, Primula
vulgaris, Trachystemon orientalis and others. Changes in the shrub habitats, growing mostly on
limestone and rocky grounds, are not expected. It is also possible the increasing of some
species, rare at the moment and Sideritis taurica, Teucrium lamiifolium, Phyllirea latifolia.
Another possibility is the appearance of new individuals of the newly discovered tree species in
Strandja -Kumarka (Arbutus unedo).
The relevantly lower dryness can cause drying in the black pine cultures, which are
predominant in Strandja and to increase the fire danger rating. The dryness is expected to cause
the beginning of entering of invasive species in the stands, mostly in the coniferous cultures.
Similar changes are expected in the region of East Balkan, where the highly productive stands
from Sessile Oak can be transformed gradually in mixed stands with the participation of
Turkey oak and Hungarian oak.
Within the same group of territories are the plain forests in Thracian lowlands - the so called
“korii”, which are the only places in the plain, preserving the natural biodiversity. Such are
Aytos, Konevska, Yulevska, Tulovska, Chirpanska korii, the forest near the town of Parvomay
and others. In some of them at the present moment is observed invasion of the Quercus
pubescent and this process is expected to become stronger. A process of decreasing of canopy
cover is expected, which will increase the lighting of the ground storey and will increase the
process of development of the ruderal grass vegetation. Besides this, in the composition of
these forests will increase their participation xeromorphic elements as Prunus spinosa, Paliurus
spina-christi, more intensive invasion of acacia (Robinia pseudoacacia) is also possible, a
species does not “allowed” by the oaks in the stands.
In East Rhodope and in the South part of Struma valley the changes are expected to be the most
insignificant. This prognosis is based on the fact that in these areas at the present moment the
climate is traditionally dry and the relevantly small changes till 2020 cannot cause serious
changes in the vegetation, which is adapted to these conditions. Similar to Strandja, here is also
possible the increasing of number of Mediterranean elements as Arbutus andrachne, Arbutus
unedo and others.
The gene-selective measures, that can be considered as appropriate for the described conditions
and prognosis, should be pointed in several directions. The first direction is the development of
280
long term selective Programme for the choice and creation of more dry resistant poplar
cultivars (cultivated varieties), which can grow successfully even in conditions of not sufficient
soil moisture. Here are existing reserves for more adequate usage of autochthonous gene fund
of the black and white poplar.
Other direction of the gene-selective activities, which is expected to be appropriate for these
conditions, is the selection of appropriate oak origins and particularly of appropriate
individuals. This includes the establishment of a network from ecological experimental cultures
and mostly - posterity experiments, in which to be studied the inheritance of valuable indicators
from economic point of view, with particular attention on the drought resistance. This can
allow the preservation of natural species composition in the forests, even with the price of
occasional usage of sampling material from other populations. From one side, the positive
effect is the preservation of the natural species compositions and from other side - the change
of the natural gene fund of the populations. It is obvious that we will have to look for
compromise between the positive and negative sides of the gene-selective methods application.
Further information regarding the vulnerability zones of the forest ecosystems towards climate
changes for present climate (1961-1990), for the years 2050 and 2080, the different scenarios
and methodologies used for Bulgaria, as well as using calculations of some of the complex
climate indexes: De Marton, Budiko, Selyaninov and the Holdridge (1967) can be found in
the Programme of measures for adaptation of the forests in the Republic of Bulgaria and
mitigation the negative effect of climate change on them, part of the national efforts of Bulgaria
in implementation of FUTUREforest Project under INTERREG IV C Programme of the EU.
6.4. Adaptation Policy and Measures
The Ministry of Environment and Water of Bulgaria is the central body coordinating the
adaptation policy-making process.
In order to decrease country’s the vulnerability to the effects of climate change and to improve
the capacity of the natural, social and economic systems to adapt to the inevitable impacts of
climate change, the Ministry of Environment and Water of Bulgaria has started preparation of
National Climate Change Adaptation Strategy.
Taking into account that developing such a strategic document is subject to a substantial
expertise and significant data collection, it was adopted a stepwise approach.
Phase I. As a first step was prepared a Framework document "National climate change risk and
vulnerability assessment for the sectors of the Bulgarian economy". The document was finalized
in early June 2014.
The main objective of this document is to assess the risk of climate change related natural
disasters in Bulgaria on the basis of various climate models and scenarios. The economic sectors
included in the document are: agriculture, water, urban environment, energy, transport,
construction and infrastructure, forestry, ecosystems and biodiversity, human health and tourism.
A cross-border cooperation on issues related to the impact of climate change is taken into
consideration in the draft document.
The Framework document is serving as a basis for further development of a National Adaptation
Strategy. Therefore all the collected and evaluated information gives grounds for development of
specific measures which should present the overall appearance of the strategic actions that
reduce country’s vulnerability to the effects of climate change.
Phase II. Preparation and adoption of a National Adaptation Strategy and Action Plan
281
The Ministry of Environment and Water of Bulgaria signed with the International Bank for
Reconstruction and Development an Agreement for Reimbursable Advisory Services on the
development of a National Climate Change Adaptation Strategy and Action Plan. The objectives
of the Agreement are to support the Ministry of Environment and Water in: accessing options to
address climate risks across the economy; formulating a Climate Change National Adaptation
Strategy and Action Plan for the Republic of Bulgaria, which shall cover the period up to 2030;
and strengthening capacity for implementation and cross-sector coordination on climate change
adaptation.
The development of the Strategy is funded by the Operational Programme “Good Governance”
(OPGG), Priority Axis 2 “Effective and professional governance in partnership with the civil
society and the business”. On 10 April 2017 was signed a Grant Contract between the Ministry
of Environment and Water of Bulgaria and the Managing Authority of the OPGG for
implementation of a project “National Climate Change Adaptation Strategy and Action Plan”
The project consists of developing a comprehensive National Climate Change Adaptation
Strategy and Action Plan, which cover the period to 2030. The strategy serves as a reference
document, setting a framework for adaptation action and priority directions, identifying and
confirming the need for climate action both at economy-wide and sectoral level. The National
Adaptation Strategy:
provides analysis of the current situation in the sectors: agriculture, forestry, ecosystems
and biodiversity, water, transport, energy, construction and infrastructure, human health,
urban environment, and tourism;
set goals and priorities for improving adaptation capacity, presented by sectors;
defines specific measures to achieve the goals laid down in the Strategy.
The Action Plan will summarize the adaptation measures for all sectors identified in the Strategy
in order to attain the strategic goals by focusing on implementation of priority adaptation
measures, including consideration of implementation, responsible institutions, resources, terms
,time bound targets and monitoring indicators.
The National Climate Change Adaptation Strategy will be finalized and adopted during the
second half of 2018.
The forestry sector is the only one in which a specific programme of measures for adapting
Bulgarian forests to climate change was developed and approved. The Programme of measures
for adaptation and mitigation of the negative climate change related effects on forests was
officially adopted by the Ministry of Agriculture and Foods on 03.05.2011.
For the purposes of drafting the document a vulnerability assessment of forestry by vulnerability
zones of the forest eco-systems was carried out.
The Programme goes through four stages:
Stage 1: Preparation of "Analysis on the state of the main components in the forest ecosystems"
in the context of climate change;
Stage 2: Elaboration of climate scenarios based on contemporary data and state-of-art models on
the evolution of climate in Bulgaria during XX and XXI centuries;
Stage 3: Ddefinition of the "zones of vulnerability" in the forest ecosystems of Bulgaria;
Stage 4: Elaboration of a comprehensive programme with concrete measures for adaptation of
forests to climate change, according to zones of vulnerability, for some of the main components
of the forest ecosystems in Bulgaria.
282
Another very important part to be integrated in the National Adaptation Strategy is insurance.
The Ministry of Environment and Water already has developed an analytical
document "Financial disaster risk management and insurance options for climate change
adaptation in Bulgaria". The document was prepared with the financial and technical support of
the World Bank and its purpose is to analyze the role and importance of the insurance business
for the prevention of risks that occur as a result of climate change and for the development of
adaptation measures.
6.4.1. Agriculture
Two main types of adaptation are autonomous and planned adaptation. Autonomous adaptation
is the reaction of, for example, a farmer to changing precipitation patterns, in that she changes
crops or uses different harvest and planting/sowing dates.
Planned adaptation measures are conscious policy options or response strategies, often
multisectoral in nature, aimed at altering the adaptive capacity of the agricultural system or
facilitating specific adaptations. For example, deliberate crops selection and distribution
strategies across different agriclimatic zones, substitution of new crops for old ones and
resource substitution induced by scarcity.
Farm level analyses have shown that large reductions in adverse impacts from climate change
are possible when adaptation is fully implemented. Short-term adjustments are seen as
autonomous in the sense that no other sectors (e.g. policy, research etc.) are needed in their
development and implementation.
Long-term adaptations are major structural changes to overcome adversity such as changes in
land-use to maximize yield under new conditions; application of new technologies; new land
management techniques; and water-use efficiency related techniques. FAO defines the
following “major classes of adaptation”:
seasonal changes and sowing dates;
different variety or species;
water supply and irrigation system;
other inputs (fertilizer, tillage methods, grain drying, other field operations);
new crop varieties;
forest fire management, promotion of agroforestry, adaptive management with suitable
species and silvicultural practices (FAO, 2005).
Accordingly, types of responses include:
reduction of food security risk;
identifying present vulnerabilities;
adjusting agricultural research priorities;
protecting genetic resources and intellectual property rights;
strengthening agricultural extension and communication systems;
adjustment in commodity and trade policy;
increased training and education;
identification and promotion of (micro-) climatic benefits and environmental services of
trees and forests (FAO, 2005).
The sowing dates of spring crops in Bulgaria could shift under the GCM climate change
scenarios in order to reduce the yield loss caused by temperature increase. The selection of an
283
earlier sowing date for maize will probably be the appropriate response to offset the negative
effect of a potential increase in temperature. This change in planting date will allow for the
crop to develop during a period of the year with lower temperatures, thereby decreasing
developmental rates and increasing the growth duration, especially the grain filling period. The
results show that the sowing date of maize for the experimental station Carev Brod (northeast
Bulgaria) should occur at least 2 weeks earlier in the 2080s under the ECHAM4 scenario,
relative to the current climate conditions. It should be noted, however, that although changes in
sowing date are a no-cost decision that can be taken at the farm-level, a large shift in sowing
dates probably would interfere with the agro-technological management of other crops, grown
during the remainder of the year.
Another option for adaptation is to use different hybrids and cultivars. There is an opportunity
for cultivation of more productive, later or earlier-maturing, disease and pest tolerant hybrids
and cultivars. Switching from maize hybrids with a long to a short or very short growing season
projected an additional decrease of final yield under a potential warming in Bulgaria. However,
using hybrids with a medium growing season would be beneficial for maize productivity.
Technological innovations, including the development of new crop hybrids and cultivars that
may be bred to better match the changing climate, are considered as a promising adaptation
strategy. However, the cost of these innovations is still unclear.
Results from the adaptation assessments suggest that possible changes in sowing date and
hybrid selection can reduce the negative impact of potential warming on maize yield during the
next century. Changes in cropping mixtures, irrigation, and agricultural land use can be
additional alternative options for adaptation in agriculture.
The adaptation measures presented bellow in relation to irrigation in the conditions of the
present and future climate in Bulgaria are based on various expert assessment (for example,
Vurlev, etc. 2004, Alexandrow and Slavov, 2003), documents, Action Plans (for example,
Slavov and Ivanova 1998A, 1998b, 1999) and programs (for example, Republic of Bulgaria,
2001).
Measures for increasing irrigation and irrigated agriculture adaptation of the country
towards climate changes
The urgent necessity to undertake appropriate measures for increasing adaptation towards
climate changes with warming and drought tendency is evident – not only in regard to
agricultural production but also in to irrigation, which is the main factor in the fight with those
tendencies, and also an element of the agricultural sector as a whole.
The objectives of the adaptation measures should be to decrease or avoid the damages from
drought and from climatic changes in general, and be directed to support and maintain
agricultural production at relatively high and sustainable productivity level, and also for
effective and sparingly use of water resources, having full use of the built irrigation facilities. It
is necessary to include activities on information dissemination about the nature of droughts, as
knowing the phenomenon will diminish the sensitiveness and vulnerability o the population
from their impact.
The main adaptation measures cover organizational and managerial, financial and economic,
and legislative aspects of irrigation and irrigated agriculture and should aim at:
improvement of management, use and protection of water resources in irrigated
agriculture;
improving the efficiency of the management and use of the existing irrigation facilities
and elaboration of the technological and technical facilities for irrigation;
284
use of rational and economically sound irrigation regimes for the irrigated crops and
elaboration of the technologies for cultivation of crops in the conditions of droughts and
water deficit.
Adaptation measures to improve management, use and protection of water resources in
irrigated agriculture during climate change:
establishing the impact of climate changes and drought on the quantity and quality of
water resources used in irrigated agriculture;
assessing the needs of water for irrigation of agricultural crops under climate changes and
preparing long term projections for the required water resources to be used in agriculture.
Work is going on in various institutions like the Institute of melioration and mechanization,
Institute of Water Problems, University of Architecture, Civil Engineering and Geodesy
(UACEG), Institute of Soil Science and Agroecology "N. Pushkarov", Higher Institute of
Agriculture, National Institute of Meteorology and Hydrology (NIMH), etc. Numerical
experiments to determine the optimal dates and water quantity for irrigation of the maize for
various climate scenarios are carried out in NIMH, using computer system for
agrotechnological decision taking DSSAT (Alexandrov, 1998, 1999). The calculations are
taken in regard to biophysical and economic analysis of the final yield and the received profit
from the maize.
The ROIMPEL model of crop was also used for evaluation of vulnerability. It is a module
simulation model for crops, limited by available soil – water and nitrogen, using limited data
that is easy to book in. Various practices for the nitrogen and water management can be
considered easily, as outside files parameters that are easy for explanation are asked.
ROIMPEL gives the work day statistical data (optimally, very humid soil or very dry), that can
be used for optimizing of the use of technique and the labour in the farm. The nitrogen
concentrations that are possibly dangerous for underground waters pollution are possible to be
received. The minimal requirements of data for soil are the constitution of the soil and class of
organic substances. The minimum data for the weather, necessary for the model are the
monthly values of the average daily air temperatures and the total quantity of monthly rainfall.
Therefore, ROIMPEL is a very suitable model for research of climate change projects, where
the disturbances, concerning the climate parameters are decreased proportionally from the
GCMs on monthly base.
A Case Study on Irrigation Measures
Agroecosystems in southern Europe would be threatened mainly by reduced precipitation and
subsequent increases in water scarcity. Although measures are being taken to reduce
greenhouse gas emissions, and these measures will probably reduce the rate and magnitude of
climate change, it is unlikely that greenhouse gas emissions can be reduced enough to stabilize
climate; therefore, adaptation will be necessary. The goals of agricultural adaptation measures
are the promotion to sustainable development and to minimize the impact of climate change by
reducing vulnerability to its effects.
The altered temperature and precipitation databases corresponding to each of the respective
climate change scenarios were used to run the CERES GENERIC 3.0 simulation model of
maize. Crop management, technology, and distribution of cultivated land were assumed to be
constant. Agricultural production is very sensitive to change and variation in weather
conditions during the regular growing season. All the developmental processes, starting as
early as the germination process immediately after planting, and as late as the ripening process
during physiological maturity, are affected and controlled by temperature. All scenarios
285
projected a shorter vegetative (sowing-silking) and reproductive (silking-full maturity) growing
season of maize. These changes were driven by the temperature increases of the scenarios.
Simulated grain maize yield decreases in Bulgaria were caused primarily by warming and
precipitation deficit during the growing season of this crop.
The DSSAT Seasonal Analysis program was run in order to determine the most appropriate
timing and water amount of irrigation applications under the expected climate change during
the growing season of maize. Both biophysical and economic analyses were done. The strategic
analysis, was done in respect to the simulated value of harvest maize yield and net return. The
tested treatments of the irrigated numerical experiment assumed maize growth and
development under rainfed conditions, different date(s) and water amount of irrigation. The
economic analysis of the Seasonal Analysis computer program calculates means, standard
deviations, maxima and minima of the economic returns, and plots these as box plots,
cumulative function plots, or mean-variance diagrams. Formal strategy evaluation of all
treatments is carried out using mean-Gini stochastic dominance. In contrast to the biophysical
analysis returns per hectare of the 6th treatment are lower than returns of the 4th and 5th
treatments due to more water being applied.
During limited precipitation in summer, irrigation facilities must be used, oriented towards
design and operation of irrigation facilities, which use water resources in an economical way
and have very low water transportation losses during irrigation.
Gravitee feed irrigation and flooding of beds and rice fields should be used as a last resort, only
when proven to be effective.
Main and distribution canals of old irrigation systems must be coated to bring to minimum
losses from filtration. Permanent canals in irrigation systems must be afforested on sufferance
strips to utilize filtered water and to cover them aiming at the reduction of the physical
evaporation from water surface in the canals.
Adaptation measures to improve management efficiency and use of existing irrigation
systems and elaboration of technological and technical means for irrigation under climate
changes:
To prepare up-to-date strategy and new program for the rehabilitation and restructuring of
irrigation management and improving the efficiency of use of the existing irrigation
infrastructure;
To change legislation and regulation in the irrigation sector taking into consideration the
altered agricultural conditions, the experience from the reforms carried out so far and to
ask for free use of the technologically established hydromeliorative infrastructure and
service facilities on the territory of the associations;
Preparation of information materials for water users on the benefits and good practices of
agricultural crop irrigation.
Adaptation measures for use of rational and economically viable irrigation regimes for
irrigated crops and elaboration of the technologies for cultivation under climate change:
Determining the vulnerability of agricultural crops under climate changes, long term
droughts and water deficit in the major agroclimatic regions in the country, respectively
their impact on the quantity and quality of the yield from them;
Reassessment of the water and irrigation norms and legislative provisions of irrigation,
new zoning for the irrigated crops in the country;
286
Development and application of optimized irrigation regimes for the major agricultural
crops for various agroclimatic regions in the country;
Research on the effect from irrigation and sustainability of yields under various water
saving methods and irrigation technologies;
Creation and application of mineral fertilization systems and integrated weed fight during
cultivation of agricultural crops under irrigation conditions;
Application of proper moisture preserving technologies and techniques for soil treatment
in irrigated lands;
Adaptation and introduction in practice of information and advisory system for irrigation
necessity forecast and defining the parameters of the irrigation regime for the irrigated
crops;
Technology changes for irrigated crop cultivation in various agroclimatic regions under
water shortage conditions;
Use of new cultivars and hybrids that adapt better to water deficit.
The presented above allows the following conclusions to be drawn:
Irrigation will be the main factor for the sustainable development of Bulgarian
agriculture, giving guarantee for stable and quality plant production in years, varying in
terms of the climate and accepting the challenges due to the expected periods of drought
and water deficit in the years to come;
Fast restoration and development of the irrigation sector and irrigation agriculture should
become a main priority of the state policy in the agricultural sector supported by real,
active and sound investment program, based on the use of national and international
financial resources;
Completion of the economic efficiency assessment of the existing irrigation facilities and
taking a decision for the restoration and reconstruction of economically effective, suitable
and unsuitable facilities at the present moment;
Development and application of proper irrigation investment program for the next few
years, with state subsidies aimed at the most efficient regions and such with active or to
be established soon irrigation associations;
Reconstruction and reorganization of the existing irrigation systems, aimed at their use in
the condition of water deficit, implementing proper models in representative regions in
the country;
Elaboration of the present irrigation technologies and equipment, aimed at compliance
with the new needs of the irrigated cultivars and increasing their efficiency, development
and use of new water saving and energy saving technologies and equipment;
Assessment of the energy demand of the irrigation systems and developing measures to
increase their energy efficiency;
Development and application of technologies and systems for regulation and control of
technological processes for distribution and use of water for irrigation.
Some economic adaptation measures, such as substitution possibilities for other crops,
availability, and costs of alternative production techniques, are recommended for evaluation in
the future. As in the Second National Communication the other major adaptation measures
under consideration in Bulgaria are:
New zoning of the agroclimatic resources and agricultural crops
Expanding areas of the most important agricultural crops over new regions characterized
by improved thermal and moisture conditions;
287
Utilization of a variety of cultivars and hybrids, especially long-maturing, high-
productive cultivars and hybrids with better industrial qualities;
Cultivation of new agricultural crops grown with Mediterranean origin.
New cultivars and hybrids to be adapted to climate change
The new cultivars of winter agricultural crops to pass through the winter season
organogenesis under higher temperatures without deviations from the normal crop
growth and development;
The new cultivars and hybrids to be with higher dry-resistance, especially at the end of
the vegetative period and at the beginning of the reproductive period;
Higher maximal air temperatures not to provoke thermal stress effects, especially during
crop flowering and formation of the reproductive organs;
The new cultivars and hybrids to grow and photosynthesis under an increased
concentration of carbon dioxide.
Optimization of soil treatment
Optimal dates and terms of sowing of main crops
Soil monitoring
Measures for improvement of the water content in soils
Measures to improve the soil structure and performance
Actions against erosion and for better nutrition mode
Up-to-date technologies in soil treatment that keep soil water and structure
Effective use of mineral fertilizers relevant to the soils diversity
Overcoming of the misbalance of the main nutrients and normalization of the
mineral/organic fertilizers ratio
Adaptation phytosanitary measures
Development of special sub-models incorporated into models of agro-ecosystems which
simulate plant-protection situations, related to climate change
Assessment of already used pesticides and the way of their utilization and potential
effectiveness of the chemical method against crop diseases and pests
Improving technologies for plant protection and priority development of non-chemical
methods against crop diseases and pests
Improving the monitoring for the phytosanitary situation in the country
6.4.2. Forestry
6.4.2.1.Summary
For the forests in the low parts of the country (under 800 m a.s.l.), where the most significant
impact from climate change is expected, the strategic objective of the management must be
adaptation towards drought and improving forest sustainability.
For the forests in the higher parts of the country, i.e. those above 800 m a.s.l., where expected
changes are not likely to be drastic, the objectives are preservation of biodiversity, eco system
sustainability, multifunctional management, system of protected nature territories.
The natural and introduced forest wood and shrub species in Bulgaria have great potential for a
good adaptation towards possible climate change in the present century.
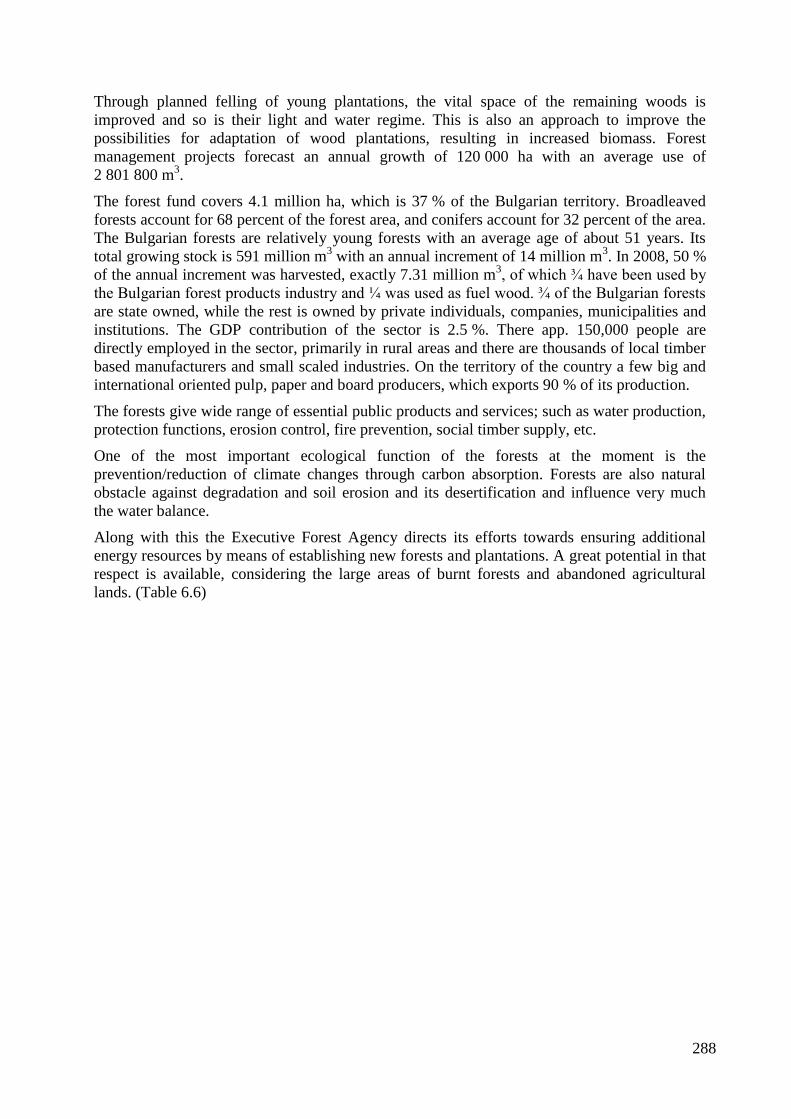
288
Through planned felling of young plantations, the vital space of the remaining woods is
improved and so is their light and water regime. This is also an approach to improve the
possibilities for adaptation of wood plantations, resulting in increased biomass. Forest
management projects forecast an annual growth of 120 000 ha with an average use of
2 801 800 m3.
The forest fund covers 4.1 million ha, which is 37 % of the Bulgarian territory. Broadleaved
forests account for 68 percent of the forest area, and conifers account for 32 percent of the area.
The Bulgarian forests are relatively young forests with an average age of about 51 years. Its
total growing stock is 591 million m3 with an annual increment of 14 million m
3. In 2008, 50 %
of the annual increment was harvested, exactly 7.31 million m3, of which ¾ have been used by
the Bulgarian forest products industry and ¼ was used as fuel wood. ¾ of the Bulgarian forests
are state owned, while the rest is owned by private individuals, companies, municipalities and
institutions. The GDP contribution of the sector is 2.5 %. There app. 150,000 people are
directly employed in the sector, primarily in rural areas and there are thousands of local timber
based manufacturers and small scaled industries. On the territory of the country a few big and
international oriented pulp, paper and board producers, which exports 90 % of its production.
The forests give wide range of essential public products and services; such as water production,
protection functions, erosion control, fire prevention, social timber supply, etc.
One of the most important ecological function of the forests at the moment is the
prevention/reduction of climate changes through carbon absorption. Forests are also natural
obstacle against degradation and soil erosion and its desertification and influence very much
the water balance.
Along with this the Executive Forest Agency directs its efforts towards ensuring additional
energy resources by means of establishing new forests and plantations. A great potential in that
respect is available, considering the large areas of burnt forests and abandoned agricultural
lands. (Table 6.6)
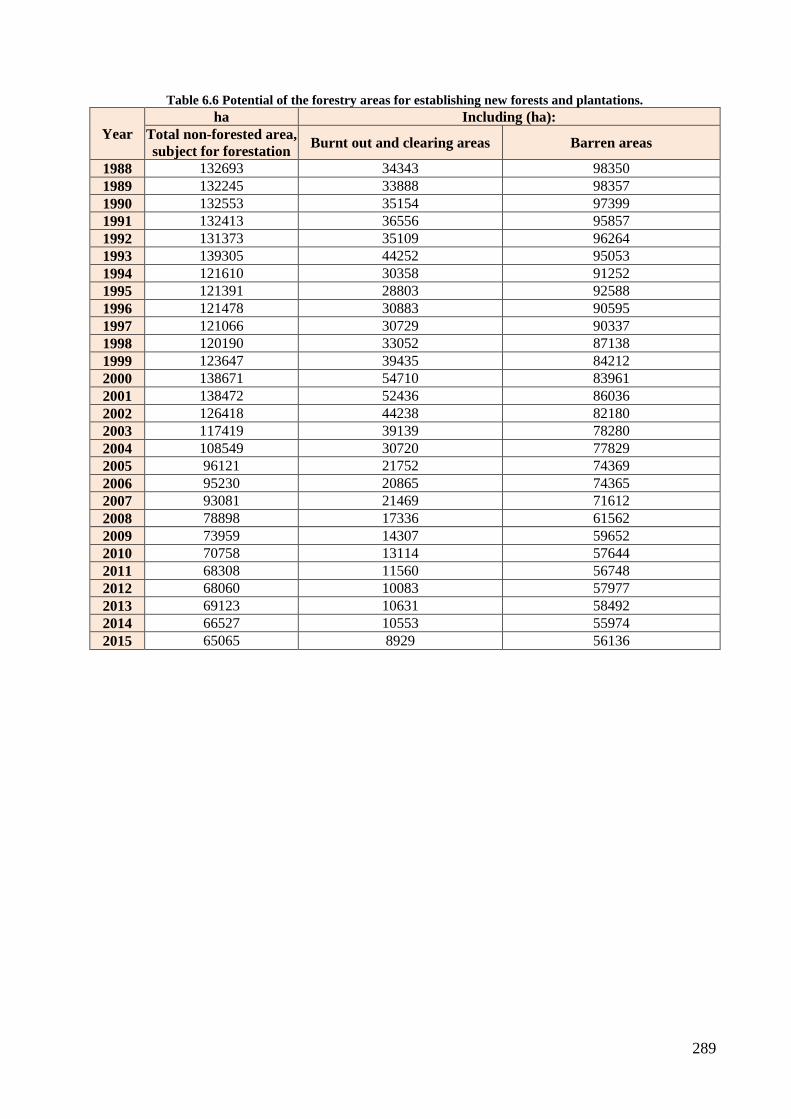
289
Table 6.6 Potential of the forestry areas for establishing new forests and plantations.
Year
ha Including (ha):
Total non-forested area,
subject for forestation Burnt out and clearing areas Barren areas
1988 132693 34343 98350
1989 132245 33888 98357
1990 132553 35154 97399
1991 132413 36556 95857
1992 131373 35109 96264
1993 139305 44252 95053
1994 121610 30358 91252
1995 121391 28803 92588
1996 121478 30883 90595
1997 121066 30729 90337
1998 120190 33052 87138
1999 123647 39435 84212
2000 138671 54710 83961
2001 138472 52436 86036
2002 126418 44238 82180
2003 117419 39139 78280
2004 108549 30720 77829
2005 96121 21752 74369
2006 95230 20865 74365
2007 93081 21469 71612
2008 78898 17336 61562
2009 73959 14307 59652
2010 70758 13114 57644
2011 68308 11560 56748
2012 68060 10083 57977
2013 69123 10631 58492
2014 66527 10553 55974
2015 65065 8929 56136
Vulnerability assessment, climate change impacts and adaptation measures 290
Table 6.7 shows the data of the distribution of the forest area (by forest types) for the period
1988-2008.
During the last 50 years about 1.5 million ha forests are forested. The main aims of these
forestations were increase of forest area, their productivity and soil erosion control. Bulgarian
forests provide about 85 % of the water flow in the country or nearly 3.6 billion m3 of clear
drinkable water. They play a significant role for decreasing the emissions of greenhouse gases
in the atmosphere accumulating carbon in the biomass through CO2 absorption.
As a country signatory to the Pan-European process for the protection of forests, to the UN
Convention on Climate change (the Kyoto Protocol respectively), Bulgaria defined its support
for the effective production and usage of bio-energy from renewable forest resources, managed
in a sustainable way, as a main priority in its national forest policy.
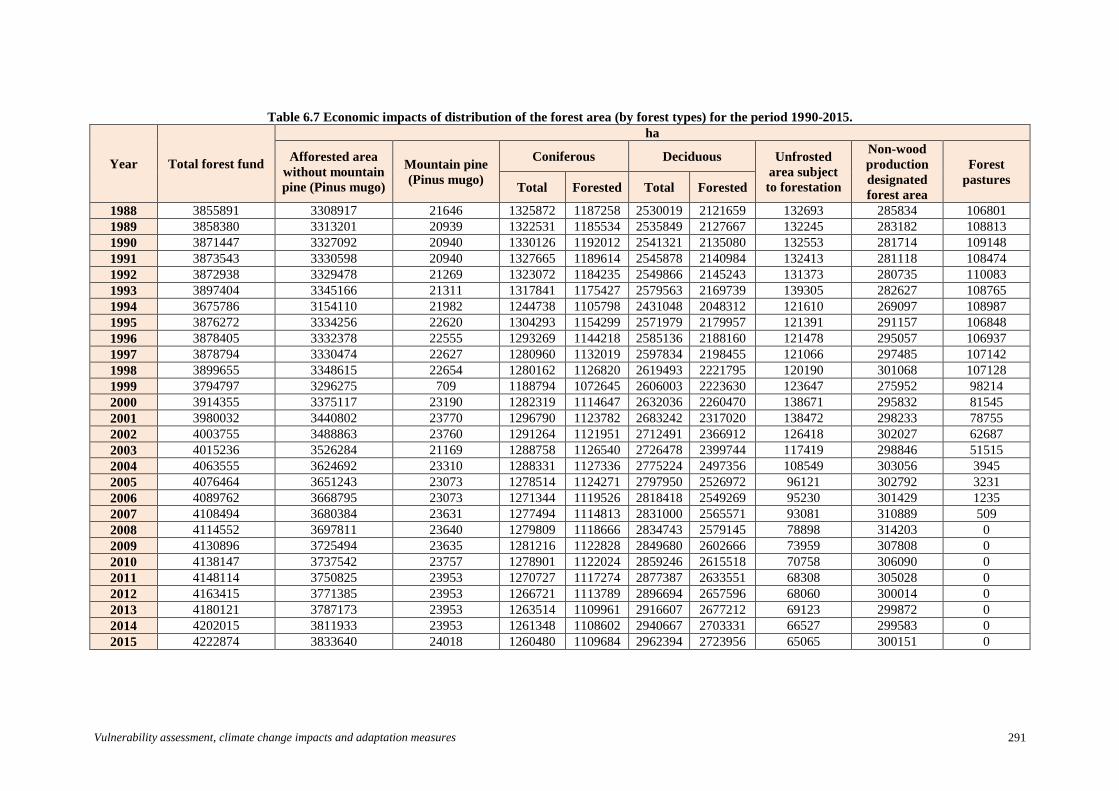
Vulnerability assessment, climate change impacts and adaptation measures 291
Table 6.7 Economic impacts of distribution of the forest area (by forest types) for the period 1990-2015.
Year Total forest fund
ha
Afforested area
without mountain
pine (Pinus mugo)
Mountain pine
(Pinus mugo)
Coniferous Deciduous Unfrosted
area subject
to forestation
Non-wood
production
designated
forest area
Forest
pastures Total Forested Total Forested
1988 3855891 3308917 21646 1325872 1187258 2530019 2121659 132693 285834 106801
1989 3858380 3313201 20939 1322531 1185534 2535849 2127667 132245 283182 108813
1990 3871447 3327092 20940 1330126 1192012 2541321 2135080 132553 281714 109148
1991 3873543 3330598 20940 1327665 1189614 2545878 2140984 132413 281118 108474
1992 3872938 3329478 21269 1323072 1184235 2549866 2145243 131373 280735 110083
1993 3897404 3345166 21311 1317841 1175427 2579563 2169739 139305 282627 108765
1994 3675786 3154110 21982 1244738 1105798 2431048 2048312 121610 269097 108987
1995 3876272 3334256 22620 1304293 1154299 2571979 2179957 121391 291157 106848
1996 3878405 3332378 22555 1293269 1144218 2585136 2188160 121478 295057 106937
1997 3878794 3330474 22627 1280960 1132019 2597834 2198455 121066 297485 107142
1998 3899655 3348615 22654 1280162 1126820 2619493 2221795 120190 301068 107128
1999 3794797 3296275 709 1188794 1072645 2606003 2223630 123647 275952 98214
2000 3914355 3375117 23190 1282319 1114647 2632036 2260470 138671 295832 81545
2001 3980032 3440802 23770 1296790 1123782 2683242 2317020 138472 298233 78755
2002 4003755 3488863 23760 1291264 1121951 2712491 2366912 126418 302027 62687
2003 4015236 3526284 21169 1288758 1126540 2726478 2399744 117419 298846 51515
2004 4063555 3624692 23310 1288331 1127336 2775224 2497356 108549 303056 3945
2005 4076464 3651243 23073 1278514 1124271 2797950 2526972 96121 302792 3231
2006 4089762 3668795 23073 1271344 1119526 2818418 2549269 95230 301429 1235
2007 4108494 3680384 23631 1277494 1114813 2831000 2565571 93081 310889 509
2008 4114552 3697811 23640 1279809 1118666 2834743 2579145 78898 314203 0
2009 4130896 3725494 23635 1281216 1122828 2849680 2602666 73959 307808 0
2010 4138147 3737542 23757 1278901 1122024 2859246 2615518 70758 306090 0
2011 4148114 3750825 23953 1270727 1117274 2877387 2633551 68308 305028 0
2012 4163415 3771385 23953 1266721 1113789 2896694 2657596 68060 300014 0
2013 4180121 3787173 23953 1263514 1109961 2916607 2677212 69123 299872 0
2014 4202015 3811933 23953 1261348 1108602 2940667 2703331 66527 299583 0
2015 4222874 3833640 24018 1260480 1109684 2962394 2723956 65065 300151 0
Vulnerability assessment, climate change impacts and adaptation measures 292
6.4.2.2.Policies and measures and their effect
Very important for forest restoration, resp. for CO2 absorption has Art. 42 (2) of Forestry act:
“Art. 42. (amend. SG 16/03) (1) (amend. – SG 64/07; amend. – SG 80/09) The afforestation in
the forest fund shall be carried out according to the forest development projects, technical
projects for fighting with the erosion and landslides, plans and programmes under the
conditions and by the order, determined with ordinance by the Minister of Agriculture and
Food.
(2) (amend. – SG 43/08) Not renewed felling grounds and fire plots from the forest fund shall
be afforested by their owner up to two years after felling or fire. If there are objective reasons
the term can be extended by the director of the regional directorate of forestry with one year.”
The Bulgarian Government Programme 2009-2013 has identified the following main priorities
in the area of forestry:
“Improvement of the protection and support of adaptation of Bulgarian forests to climate
changes”
Measures
Improvement of the forest database through implementation of remote sensing
technology. Adoption of National forest inventory as Pan-European method for control of
forest management plans
Statutory prohibition for forest land exchange and the change of the purpose of forest
land for the period of 20 years, except for important public services
Formation of inter-institutional scientific board, participation in realization and
implementation of European and world projects and initiatives, regarding prevention and
adaptation of forest to climate change
Adoption of measures for forest protection and forest safeguarding together with police
services, NGO’s, municipalities, etc.
Updating the National plan for forest fire prevention and protection and improvement of
the control of the activities against forest fires
Development and adoption of updated close to nature regimes for forest management in
the protected areas and NATURA 2000 sites
Public awareness campaigns for forest benefits and the ways of their protection
Implementation of the common European methods for evaluation of non-wood forest
functions and services and their future financial and functional support Coordination of
the implementation of the principle “The user pays” for forest resources, together with all
stakeholders
Stimulating the biological production of products and extension of ecological services in
the forests.“
In addition to the above stated the contribution of the Rural Development Programme to climate
change combat is realized through acceleration of the CO2 absorption in the atmosphere –
strengthening the CO2 absorption through forestation of different territories. The total measured
quantity, equivalent to CO2, fixed through afforested or reforested areas within the Rural
development Programme is about 1.4 million tonnes. This is an expert estimation, based on the
study of the annual forest growth during their whole life cycle and prognosis for the CO2
absorption rate.
Vulnerability assessment, climate change impacts and adaptation measures 293
This will be realized through two so called “Forest measures” closely related to forestation and
climate change impact:
Afforestation of non-agricultural lands - Measure 223
Main aims of the measure:
Increasing the forest cover with the aim contribution to the climate change mitigation and
increasing the biodiversity
Reducing soil erosion and protection of the lands from marginalization
Improvement of the water balance in the strengthen territories
Restoration of forest capacity and implementation of preventive activities - Measure 226
Main aims of the measure:
Restoration of the forests, damaged by forest fires or other natural disasters –
Reforestation of the affected forests, using native tree species; Increasing the tree species
diversity through transformation of the coniferous ecosystems in mixed forest or
broadleaved ecosystems
Improving the prevention activities for combat against forest fires.
6.4.3. Vulnerability assessment, climate change influence and
adaptation measures
6.5. Soils
Soil diversity in Bulgaria is enormous. Soils have different characteristics, fertility and
vulnerability to climate change. The temperature rise will increase the water deficit in soils
with low precipitation rates that are prone to droughts. The most serious impacts will be
observed for soils with light mechanical content and bad water characteristics and partly for
heavy clay soils. About 30 % of the soils in Bulgaria are prone to wind erosion.
Optimization of soil treatment includes:
Choice of optimal dates and terms for the collection of major crops;
Soil monitoring;
Measures for improvement water content in soils;
Measures to improve soil structure and characteristics;
Actions against erosion and for better nutrition mode;
Up-to-date technologies for soil treatment, preserving the moisture and soil texture;
Melioration of poor soils;
Effective use of mineral fertilizers, relevant to various soils.
Financial resources and transfer of technology 294
7. Financial resources and transfer of technology
7.1. Provision of new and additional financial resources
This is not applicable for Bulgaria.
7.2. Assistance to developing country Parties that are particularly
vulnerable to climate change
This is not applicable for Bulgaria.
7.3. Provision of financial resources, including financial resources under
Article 11 of the Kyoto Protocol
This is not applicable for Bulgaria.
7.4. Activities related to transfer of technology
Despite the fact that Bulgaria is an Annex I Party of the UNFCCC, as a country with economy
in transition status under the Convention, it has no commitments to provide financial resources
and technology transfer to developing countries.
The Republic of Bulgaria being a country in Currency Board and its restrictions imposed does
not have significant own financial resources for the management of its environmental policy
and relies mainly of different forms of international cooperation.
As a new EU member, Bulgaria is a recipient of technology transfer support and uses various
EU funds that facilitate the country’s ability to reach compliance with certain environmental
standards, as well as to carry on an improved environmental policy. For the continuation of this
tendency contributes the growth of foreign investments and international cooperation. The
foreign developmental cooperation of the Republic of Bulgaria has exhibited a constant
increase in recent years that is as result of the country membership in the EU.
In terms of technology transfer, as a country in transition, Bulgaria has no obligations to
support technology transfer, under Article 11 of the Kyoto Protocol, for countries out of Annex
I of the Convention.
National and international sources for financing of environmental policy, including
climate change mitigation measures in Bulgaria
The main national and international sources for financing of environmental policy,
including climate change mitigation measures to be put into practice are:
National: State budget; National Trust Eco Fund
EU Environmental Funds: “Operational Programme Environment 2014-2020”,
Other EU Funds, Programs and Initiatives
International: Within the framework of the Joint Implementation (JI) mechanism under
the Kyoto Protocol, Green investment scheme, Investment Climate Programme, Bilateral
cooperation agreements, International organizations and Financial institutions
Financial resources and transfer of technology 295
State budget: Each year, in addition to the Annex to the Law on the State Budget of the
Republic of Bulgaria, the financing of environmental installations and sites at the
municipalities is approved such as: municipal waste water treatment plants, collectors to them,
sewage pumping stations, municipal solid waste landfills for household waste, etc.
Also, in the draft of the Law on the State Budget, in addition to the List of environmental
installations and sites, envisaged for construction are included not completed projects from the
previous year, which are transitional; some of them are co-financing from foreign donor
programs; listed in the National waste management program and the National program for
priority construction of urban waste water treatment plants and collectors for settlements of
over 10 000 population equivalent, adopted by the Council of Ministers.
National Trust Eco Fund: The fund has been established as independent legal entity by the
Law for Environmental protection to manage the funds, given to Bulgaria as a grant by the
government of the Swiss Confederation during the swap deal “Debt for Environment” between
Bulgaria, Switzerland and other donors. Priority areas of the fund are: elimination of past
damages to the environment, reduction of air pollution, protection of water purity and
protection of biodiversity.
Funds are also generated via the Assigned Amount Units (AAUs) international trade deal(s),
the sale of greenhouse gas emissions quotas for aviation activities, as well as funds, provided
by other environmental protection agreements between the Republic of Bulgaria and
international or local financing sources.
“Operational Programme Environment 2007-2013” and „Operational Programme Environment
2014-2020’ (OPE) sets the country strategic objectives and priorities in environment sector. It
is directed to implementation of the commitments taken in the negotiation process in the sector
and achievement of compliance with EU requirements in the field of environment.
OPE sets the objectives, priorities and types of activities to be financed, following the national
policy in environmental protection as well as EU policy and legislation.
The two funds providing financing in the field of environment:
European Regional Development Fund (ЕRDF) - aimed at strengthening the economic
and social cohesion in the EU, recovering the disturbed balance between the regions.
ERDF finances direct aid to research and innovation, telecommunications, environment,
energy and transport, financial instruments (capital risk funds, local development funds,
etc.) to support regional and local development.
Cohesion Fund (CF) - aimed at helping less developed member states to overcome the
economic and social situation and stabilize their economy.
As a member of European Union the Republic of Bulgaria for some measures in its
environmental policy has opportunity to use finance means by follow funds and programs:
European Regional Development Fund 2007 – 2013:
The Urban Development Network (Programme URBACT II - An Exchange and
learning programme for cities contributing to the European Commission Initiative
“Regions For Economic Change”);
Interregional Cooperation Programme “INTERREG IVC” (Contributing to the
European Commission Initiative “Regions for Economic Change”;
South East Europe (SEE) - Transnational Co-operation Programme for a moving European
area in transition on the way to integration;
Financial resources and transfer of technology 296
ESPON 2013 Programme - European observation network on territorial development and
cohesion, adopted by European Commission Decision C(2007) 5313 of 7 November 2007;
ESPON 2020 Cooperation Programme - The revised version of the ESPON 2020 Cooperation
Programme was adopted on the 26 May 2016 by the European Commission
The ESPON 2020 Programme aims at promoting and fostering a European territorial
dimension in development and cooperation by providing evidence, knowledge transfer and
policy learning to public authorities and other policy actors at all levels.
ESPON 2020 shall continue the consolidation of a European Territorial Observatory Network
and grow the provision and policy use of pan-European, comparable, systematic and reliable
territorial evidence.
Good Governance of Territorial Cooperation Programmes INTERACT 2007-2013 under
the “European Territorial Cooperation” Objective based on Article 6 pt. 3 lit. b of Regulation
1080/06. In addition there is a new programme period INTERACT III 2014-2020 Interregional
Cooperation Programme.
IPA Cross-Border Programs:
BULGARIA – SERBIA 2007 – 2013 (CCI Number: 2007CB16IPO006) and there is a new
programme period BULGARIA – SERBIA 2014 – 2020 (CCI Number: 2014TC16I5CB007);
BULGARIA - THE FORMER YUGOSLAV RЕPUBLIC OF MACEDONIA (CCI Number:
2007CB16IPO007) and there is a new programme period BULGARIA - THE FORMER
YUGOSLAV RЕPUBLIC OF MACEDONIA 2014 – 2020 (CCI Number:
2014TC16I5CB006);
BULGARIA – TURKEY (CCI Number: 2007CB16IPO008 and there is a new programme
period BULGARIA – TURKEY 2014-2020 (CCI Number: 2014TC16I5CB005);
Cross-Border Cooperation Programme ROMANIA – BULGARIA 2007-2013 and there is a
new programme period 2014-2020;
European Territorial Cooperation Programme GREECE-BULGARIA 2007-2013 and there
is a new programme period 2014-2020;
Joint Operational Programme Black Sea Basin 2007-2013 and there is a new programme
period 2014-2020.
The Joint Implementation Mechanism in Bulgaria
The position of the Republic of Bulgaria on Joint Implementation Mechanism (JI) according to
Article 6 of the Kyoto Protocol under the UNFCCC is as follows: JI is economically effective
and it allows GHG emission reductions under minimal expenses. The JI mechanism contributes
to more easy and rapid introduction of the new and “state of art” technologies in the country.
Bulgaria is amongst the first Annex I countries in the world which hosted JI projects. As a
result, the country has already gained experience in various aspects of the JI mechanism,
amongst which: A number of memorandums of understanding/Cooperation agreements were
concluded with other Annex I countries, consultancy on the possibilities for realization of JI
projects was implemented, procedures for support and approval of JI projects on both Track 1
and Track 2 were adopted, 28 JI projects were approved (26 on Track 1 and 2 on Track 2),
transactions of verified emission reductions were made to 20 of the projects.
Financial resources and transfer of technology 297
The Climate Change Policy Directorate within MOEW is responsible for the application of the
flexible mechanisms of the Kyoto Protocol and for the execution of the procedures for
assessment, approval and administration of JI projects in Bulgaria. The Directorate is also
responsible for the application of the EU Climate Change Policy in Bulgaria.
The legislation on JI projects in Bulgaria includes the Laws on ratification of the UNFCCC and
the Kyoto Protocol, the Environmental Protection Act and the national guidelines for approval
of JI projects under Track 1 and Track 2.
A procedure for approval of JI projects has been set and is in place, and it requires the
assessment of each project by a Steering Committee for JI projects (SC JI). The committee is
formed by Order of the Minister of Environment and Water and consists of members – experts
from different institutions concerned – the Ministry of Environment and Water, the Ministry of
Economy, Energy and Tourism, the Ministry of Finance, the Ministry of Regional
Development and Public Works, the Ministry of Agriculture and Food, the Ministry of
Transport, Information Technology and Communications, the Ministry of Foreign Affairs, the
Executive Environment Agency, the Energy Efficiency Agency and the Executive Forestry
Agency. The Committee is chaired by Deputy Minister of MOEW. The SC evaluates proposed
projects according to the existing internal environmental criteria and the JI national guidelines
on Track 1 and Track 2. The SC advises the Minister of Environment and Water in issuing/not
issuing a Letter of Approval for each particular project proposal.
Several Memorandums of Understanding/Cooperation Agreements have been signed aimed at
JI cooperation with: The Kingdom of Netherlands, The Swiss Confederation, The Kingdom of
Denmark, Republic of Austria, the Kingdom of Belgium, Prototype carbon Fund at World
Bank, Japan and the Kingdom of Sweden. Since the adoption of the national guideline for
approval of JI projects under Track 1 in April 2010, Memorandums of understanding/
Cooperation Agreements are no longer a necessary condition for approval of new projects. The
Track 1 national guideline allows every Annex I country to be a buyer of projects’ emission
reductions.
As it is mentioned above, Bulgaria considers that the Joint Implementation mechanism is
important initiative for attraction of investments in energy efficiency, renewable energy
sources, cogeneration and new low carbon or carbon-less technologies.
The JI projects for which Letter of Support and JI projects for which Letter of Approval have
been issued by MOEW are listed bellow:
Letter of Approval
Biomass Steam Boiler in Vinprom Peshtera
Portfolio of new co-generation power stations for combined production of heat and
electricity in District heating system Pleven and District heating system Veliko Turnovo,
Bulgaria;
New co-generation power station for combined production of heat and electricity in
District heating Bourgas, Bulgaria;
Cogeneration gas power station AKB Fores PLC Financial Industrial Group;
Cogeneration power station Biovet;
TPP Plovdiv South co-generation project;
Industrial Energy Efficiency and cogeneration, Nikopol;
Energy efficiency investment program at Svilocell Pulp Mill, Bulgaria;
Bulgarian Energy Efficiency and Renewable Energy Portfolio Project;
Biomass and Energy Efficiency Project, Paper Factory Stambolijski;
Biomass Utilization in Svilosa Inc;
Financial resources and transfer of technology 298
Rehabilitation of District heating system in Sofia;
Rehabilitation of District heating system in Pernik;
Reduction of greenhouse gas by gasification in Varna Municipality;
Reduction of GHG by gasification of Sofia municipality;
Reduction of Greenhouse gases by gasification in the Zapad region of Bulgaria
Reduction of GHG by gasification of the towns of Veliko Turnovo, Gorna Oryahovitsa
and Lyaskovets;
Reduction of greenhouse gases by gasification of Burgas Municipality;
Vacha Cascade JI Project;
Rehabilitation of Dolna Arda hydropower cascade;
Sreden Iskar cascade HPP portfolio project in Bulgaria;
Small Hydropower Station SHPS Potochnitsa;
Bulgarian Small Hydro Power Plants (SHPP) portfolio;
Kaliakra Wind Power Plant;
Methane capture and electricity production at Kubratovo WwTW, Sofia, Bulgaria;
Reduction of N2O at Agropolychim Devnya;
Sunflower and rape seed - bio diesel fuel production and use for transportation in
Bulgaria;
Emission Reduction of Nitrous Oxide in Nitric Acid Production at Neochim PLC.
At present, the approval of new projects, leading to direct or indirect reduction of emissions of
installations under EU ETS, is impossible in practice because of the necessity EU allowances to
be cancelled when ERUs are transferred to the buyer. These are allowances from the set aside
of allowances for avoiding the so called double counting of greenhouse gas emission reductions
for JI projects, on the account of allowances for the installations covered by the EU ETS. For
that reason the Bulgarian government refrains from approval of new projects of installations
under the EU ETS sector to the end of 2012. Eligible for approval are projects that do not lead
to direct or indirect double counting.
Information under Article 10 of the Kyoto Protocol
The country has not formulated programs to improve the quality of local emission factors,
activity data and models which reflect national conditions. The country is more active in the
field of development and implementation of national programs containing measures to mitigate
climate change. The First National Climate Change Action Plan was developed in 1999 and
approved by the Government in 2000. The Second National Action Plan on Climate Change
(SNAPCC) was developed in the period 2003-2004 and approved by the Government in 2004.
The Plan envisions a set of coordinated actions in line with Bulgaria’s international obligations
in the context of UNFCCC as well as the Climate Change Program of the European Union
(EU). The Plan covers the period 2005-2008. The cumulative effects from the applied measures
in respect of GHG emission reductions are annually evaluated.
The Second SNAPCC defines mainly the legislative framework and the institutional structure,
requirable for implementing the climate change-related policies executing Bulgaria’s
obligations to the UNFCCC and the Kyoto Protocol.
The evaluation of the plan fulfilment was performed in 2009. Essentially the plan assessment
was a procedure of evaluation of the policies and measures in it. The implemented extensive
analysis gives possibility for synonymous answers to questions like:
Is the purpose of the plan set correctly?
Is it correctly estimated what measures are necessary and are they precisely formulated
and addressed to the relevant institutions?
Financial resources and transfer of technology 299
The analysis shows that the purpose is set correctly and the measures are addressed precisely.
The measures, provided in the plan were conformed with actions for their implementation on
national and European level. The post analysis showed that despite the declarations of some
branches, the conditions for measure implementation are changed and for some of them the
provided potential is not realized. Some of the provided actions dropped out and the measures
were not realized in optimum degree.
The negative moments are reported in the assessment. The key question for every plan is – are
the emissions reduced in absolute rate and as a trend and what is the proportion between the
economy growth and the growth/reduction of the emissions.
As far as the correct introduction of specific European Directives and Decisions is necessary
condition for the successful implementation of some measures, the necessary legislation acts
and documents are described in detail in the development. It is shown how their non-
introduction discredits the implementation of specific measures.
The implementation of the provided in the Second Plan policies and measures is analysed in
detail It was concluded that they are mostly realized and they led to GHG emissions for unit
GDP reduction of the order of 15 % from the annual emissions of the country for the accounted
period.
In June 2012 Bulgaria has adopted a Third National Action Plan on Climate Change. The
main strategic objective of this document is to outline the framework for action to combat
climate change for the period 2013-2020 and to focus the country’s efforts on actions leading to
reduction of the negative impacts of climate change and implementation of the undertaken
commitments. The plan provides specific measures for reduction of greenhouse gas emissions
across all sectors of the Bulgarian economy and these measures are consistent with both the
national policy on climate change and the potential of the national economy to reduce
emissions. Successful implementation of the envisaged measures will lead to a reduction of the
greenhouse gas emissions by 2020 by over 18,5% compared to their 2005 levels.
The Third NAPCC provides specific measures for reduction of greenhouse gas emissions in the
following sectors - Energy Sector, Household and Services Sector, Industry Sector, Waste
Sector, Agricultural Sector, Land Use, Land Use Change and Forestry, Transport Sector,
Education and Science.
According to the mechanism of monitoring and reporting within the Third NAPCC, the review
of measures’ implementation status is envisaged to be done every two years. In that relation,
during 2015, the first report containing information on the current status of implementation of
the measures in all sectors covered by Third NAPCC (2013-2020) was prepared by the
Interministerial Working Group established by Order No. RD-491 from 8th July 2015 of the
minister of environment and water. The full report is published on the website of the Ministry of
Environment and Water of Bulgaria.
The first official report on the implementation of the Third NAPCC is elaborated within the
above-mentioned Interministerial Working Group and approved by the Council of the Ministers
until the end of 2017.
Research projects and systematic observation 300
8. Research projects and systematic observation
8.1. General policy on research and systematic observation
Green Paper on European Research Area except the emphasis on regional cooperation
recommends "the creation of joint programs for research driven society”. Therefore, the overall
objective of a general policy on research and systematic observations is: strengthening and
development of the national scientific potential, and providing public information on:
monitoring, evaluation and forecasting of the situation and global changes in the system:
atmosphere-biosphere-hydrosphere and analysis of the impact on socio-economic sectors of
society and natural ecosystems in the region of Balkans and Black Sea basin. Specific
objectives include: 1.) Conduct interdisciplinary research aimed at scientific and application
service of socio-economic sectors of society in the country and region 2.) Maintenance and
upgrading of existing and new components of the monitoring networks, assessment and
analysis of state and changes in the atmosphere, biosphere, hydrosphere 3.) Development and
improvement of methods, models and systems for forecasting the short, medium and long-term
changes in atmosphere and related hazardous weather phenomena and changes in the biosphere
and hydrosphere, 4) Development and improvement of methods and models for quantitative
assessment and analysis of the impact of state and changes in the atmosphere, biosphere,
hydrosphere on socioeconomic sectors of society and natural ecosystems; 5.) Developing
proposals for making management decisions to adapt to the adverse global changes; 7.)
Interaction with the institutions in the preparation of strategies related to these tasks.
The section on systematic observations activities in the country follows the detailed guidance
for required information as provided in the UNFCCC reporting guidelines on global climate
observing systems. It includes summary information on the current status of national plans,
programs and support for ground and space-based climate observing systems. It should be
pointed out that up to now activities in this field have been undertaken separately from the
climate change policies and measures. They were more closely linked to the general
commitments of the country in the field of meteorology.
8.2. Research
Over the past 10 years there has been a trend of increased scientific interest in climate change:
global, regional and national scale. The topic of climate change includes a number of scientific
aspects. The Bulgarian Academy of Sciences BAS works in different directions: fluctuations
and climate change, vulnerability assessment and adaptation of individual sectors (e.g. water
resources, agriculture, forests, etc.) under climate change, solar-terrestrial influences and more.
On the topic of climate change in more than 10 units of the Bulgarian Academy of Sciences,
work but the major one is the National Institute of Meteorology and Hydrology.
The Bulgarian Academy of Sciences (BAS) carries out research and other activities on climate
change. The information for this research is so big that can not be summarized and analysed
within this document. Work is going on not only on planned tasks with national financing but
also in cooperation with research organizations from EU member countries within the Sixth
and Seventh Framework Programme.
Comprehending the significance of this problem, BAS established a National Coordination
Centre for Global Change. The Scientific Coordination Centre for Global Change of the
Bulgarian Academy of Sciences (SCCGC-BAS) is a voluntary association of representatives of
academic research and development institutes and units, universities and higher educational

Research projects and systematic observation 301
establishments, institutions, agencies, organizations, companies and other entities in Bulgaria
which organizes and conducts activities related to global change in environment, as well as to
the economic, political, social and spiritual aspects of global change on society.
The SCCGC-BAS is a consultative/advisory body of the Steering Committee of the Bulgarian
Academy of Sciences on global change in Bulgaria. The SCCGC-BAS is a center for
coordination of research and scientific-methodological activities under the implementation of
national and international projects and contracts in the field of global change.
The SCCGC-BAS Tasks:
To coordinate and support research on aspects of global change in Bulgaria;
To coordinate and support the scientific, methodological and informational needs related
to implementation of the national programs on global change;
To coordinate and support scientific, methodological and informational needs related to
implementation of the country's commitments under international conventions, contracts
and agreements on the subject of global change;
To assist contacts among scientists and their participation in national, regional and
international global change programs;
To coordinate and assist the information exchange among scientists and stakeholders in
the country and abroad through establishment and maintenance of a scientific network on
global change in Bulgaria;
To organize and perform assessments and evaluations, to provide expertise, and to
develop reviews and position papers as required by governmental institutions,
international organizations, business entities, NGOs and other organizations or
individuals on aspects of global change;
To organize and support scientific conferences, courses for training and skill
enhancement for specialists, as well as the publication of research, information, applied
science and materials for the public in the field of global change;
To play the role of a focal point, information centre and representative of the Bulgarian
Academy of Sciences before national and international bodies, organizations, programs
and projects within the scope of the major objectives and goats of the Centre.
On national level the centre puts efforts to strengthen the cooperation amongst Bulgarian
institutions and organizations. In regard to this, it organizes discussions about the Second
National Action Plan on Climate Change and the policy of MOEW on climate change; on
climate change and global change project implementation, etc.
On international level, the centre supports participation in projects, publications and reports on
climate change and global change. The SCCGC-BAS organized an international conference,
held in Sofia, 19-21 May 2008: "Global environmental change: challenges to science and
society in south-eastern Europe".
Major international and with a national scope projects:
Standardized automated large-scale monitoring of atypical pheno- logy of the European
horseradish pine-tree species, as a result of climate change in two remote areas (France
and Bulgaria), 2017 - 2019
Climate-Smart Forestry in Mountain Regions (CLIMO) [Memorandum of understanding
(MoU)], 2016-2020
Research projects and systematic observation 302
Construction of a structure in the meteorological database of NIMH-BAS for introducing
information about dangerous meteorological phenomena, 2016-2018
Climate assessment of heavy rainfall, strong wind, hailstorms and thunderstorms, ice
conditions for 28 administrative districts on the territory of Bulgaria, 2016
Freshwater ecosystem services mapping and assessment in Bulgaria, 2015 - 2017
Mapping and Assessment of Ecosystem Services in the Wetlands of Bulgaria, 2015-2017
Implementation of modern methods and technologies for assessment of groundwater
nutrition in connection with future climate change in Bulgaria, with emphasis on the
unsaturated zone, 2015 – 2016
CMEMS-INSTAC – Copernicus Marine Environment Monitoring Service In Situ
Thematic Assembly Centre, 2015 -
East and South European Network for Invasive Alien Species – A tool to support the
management of alien species in Bulgaria, 2015 - 2017
Biogenic volatile organic compounds, global climate change, and plant adaptation
potential to changing environment, 2014 - 2017
Joint study of anthropogenic air pollution in the Burgas - Kirklareli cross-border area as a
step towards future assessments on its impact on the population and the environment,
2014 - 2015
Land-use and management impacts on carbon sequestration in mountain ecosystems”,
2013 – 2016
Characteristics of intense rains in Bulgaria - applied research, 2013 - 2016
Specialized indices for climatic extremes on the territory of Bulgaria, 2013 - 2016
Climate assessments for Bulgaria using the regional climatic model RegCM, 2013 - 2015
Potential threats to environmental and economic sustainability in the Danube and Black
Sea region: Danube River as invasive alien species corridor, 2012 - 2020
Green Infrastructure approach: linking environment with social aspects in studying and
managing urban forests [Memorandum of understanding (MoU): 2012-1-11901], 2012 -
2017
COCONET (Towards COast to COast NETworks of marine protected areas ( from the
shore to the high and deep sea), coupled with sea-based wind energy potential, 2012 -
2016
Policy-oriented marine Environmental Research in the Southern EUropean Seas, 2012 -
2015
COST Action ES1102 - VALUE - Validating and Integrating Downscaling Methods for
Climate Change Research, 2012 - 2015
MSFD Guiding Improvements in the Black Sea Integrated Monitoring System, 2012 -
2014
Improvement of integrated water management and flood risk prevention. Climate
changes studies for the SEE regions (ref.: CC-WaterS etc.) – 2012 – 2014
Effects of Climate Change on Air Pollution Impacts and Response Strategies for
European Ecosystems (ECLAIRE contract 282910), 2011 – 2015
CREAM- Coordinating research in support to application of EAF (Ecosystem Approach
to Fisheries) and management advice in the Mediterranean and Black Seas”, 2011 - 2014
Strenghtening the regional capacity to support the sustainable management of the Black
Sea Fisheries (SRCSSMBSF), 2011 - 2013
Improved mountainous forest management for sustainable provisioning of ecosystem
services under climate change (MFORES)”. The project was co-financed by the program
BG03 “Biodiversity and ecosystem services” of the Financial Mechanism of the
European Economic Area, 2009 – 2014.
Research projects and systematic observation 303
EnviroGRID Building Capacity for a Black Sea Catchment Observation and Assessment
System supporting Sustainable Development, 2009 – 2013
Knowledge-based Sustainable Management for Europe's Seas, 2009 - 2013
FUTUREforest - Woodlands for Climate Change, 2008-2011
Climate change and variability: Impact on Central and Eastern Europe, 2007-2009
Adaptation of agriculture in European regions at environmental risk under climate
change, 2007-2009
Central and Eastern Europe climate change impact and vulnerability assessment, 2006-
2009
Impacts of climate change and variability on European agriculture, 2006-2010
Establishing a European phenological data platform for climatological applications,
2005-2009
Application of European experience on utilization of climate change results, 2005-2007
Introducing models under climate change conditions by establishment of contacts
between users and model developers, 2005-2007
Snow variability and change in Bulgaria, 2005-2007
Long-term variations of soil moisture and climate change in Bulgaria, 2005-2007
Monitoring social, economic and environmental differences of municipalities in Bulgaria
in 2003-2005
Climate change impact on water balance in Balkan Peninsula, 2002-2005
National institute of meteorology and hydrology at Bulgarian academy of science, NIMH
at BAS is the major Bulgaria research institute in meteorology, agrometeorology, and
hydrology, performing research-related practical application.
NIMH carries out an efficient exchange of knowledge both with the industry and with the
general public by means of all kinds of national media.
The programs of the World Meteorological Organization (WMO) and the best achievements of
related hydrometeorological services lead us in our daily work, which is being performed in
compliance with the Articles of Association of BAS, the Rules and Regulations of NIMH, the
requirements of the Ministry of Education and Science, and the updated documents of the
Commission of the European Communities.
NIMH is the official representative of Bulgaria in WMO, EUMETSAT, EUMETNET
(OPERA), UNESCO’s International Hydrological Program, and the International Association
for Danube Research, etc.
Among the Scopes of Activity of NIMH is: Provision of expert opinions, information,
analyses, various forecasts of the hydrometeorological processes, climate change and water
resources on the territory of Bulgaria, including the western part of the Black Sea.
Through its activities NIMH implements at a national level our international commitments such
as the United Nations Framework Convention on Climate Change and the Kyoto Protocol, the
Convention to Combat Desertification, the EU Water Initiative, the Contribution of the
Intergovernmental Panel on Climate Change, and the Earth Monitoring Initiative.
The Institute takes an active part in EC Framework Programs V, VI, and VII and is open for
research workers from Europe and other countries through joint projects and a modern Training
Centre. The main NIMH research is consistent also with the EU research policies, defined in
the priority areas of the 7th Framework Program., for example: “Environment, including
Climate Change”.
Major publications:
Research projects and systematic observation 304
Aksoy, H, N.E. Unal, V. Alexandrov, S. Dakova and J.Y. Yoon, 2008.
Hydrometeorological analysis of north-western Turkey with links to climate change.
International Journal of Climatology 28(8): 1047 – 1060
Alexandrov, V. and J. Eitzinger, 2005. The Potential Effect of Climate Change and
Elevated Air Carbon Dioxide on Agricultural Crop Production in Central and South-
eastern Europe. Journal of Crop Improvement 13(1-2): 291-331.
Alexandrov, V., 2006. The climate change impact on ecosystems in the Balkan Peninsula
and Central Europe. Meteorology and Hydrology 9: 88-98 (in Russian)
Alexandrov, V., M.Genev and H.Aksoy, 2005. Climate variability and change effects on
water resources in the western Black Sea coastal zone. Proceedings of the European
Water Resources Association (EWRA’2005) Conference: “Sharing a common vision for
our water resources”, 7-10 September 2005, Menton, France, (CD) 12 pp.
Alexandrov, V., M.Genev and H.Aksoy, 2005. The impact of climate variability and
change on water resources in the western coastal zone of Black Sea. Regional
Hydrological Impacts of Climatic Change - Impact Assessment and Decision Making
(Proceedings of symposium S6 held during the Seventh IAHS Scientific Assembly at Foz
do Iguaçu, Brazil, April 2005). IAHS Publ. 295, pp.62-71.
Bocheva L., Ch. Georgiev and P. Simeonov. A climatic study of severe storms over
Bulgaria produced by Mediterranean cyclones in 1990-2001 period. Atmos. Research,
83, Nos.2-4, 2007, 284-293.
Brown R. and N. Petkova, 2006, Snow Cover Variability in Bulgarian Mountainous
Regions, 1931-2000, International Journal of Climatology
Eitzinger, J., Thaler, S., Kubu, G., Trnka, M., Alexandrov, V. 2009 Der Klimawandel,
seine absehbaren Folgen für die Landwirtschaft in Oberösterreich und
Anpassungsstrategien. Amt der OÖ Landesregierung, 60
Eitzinger, J., V. Alexandrov and M. Trnka, 2006. Climate Change Impacts on Yield and
Crop Water Use in Austria using Crop Models. Proceedings of the International
conference on Soil Physics and Rural Water Management, 28–29 September 2006,
Vienna, Austria, pp. 199-202.
Eitzinger, J.,H. Formayer, S. Thaler, M. Trnka, Z. Zdenek, V. Alexandrov, 2008. Results
and uncertainties of climate change impact research in agricultural crop production in
Central Europe. Journal for Land Management, Food and Environment 59: 1-4.
Gocheva, A., L. Trifonova, T. Matrinova, L. Bocheva (2006) Complex approach for
assessment of dry wind and droughty spells in Bulgaria, International Conference
BALWOIS, 23 – 26 May 2006, Ohrid, Republic of Macedonia, 12 pages
(www.balwois.org)
Gocheva, A., L. Trifonova, T. Matrinova, L. Bocheva (2006) Extreme hot spells and heat
waves on the territory of Bulgaria, International Conference BALWOIS, 23 – 26 May
2006, Ohrid, Republic of Macedonia, 11 pages (www.balwois.org)
Eitzinger, J, G. Kubu, V. Alexandrov, A. Utset, D. T. Mihailovic, B. Lalic, M. Trnka, Z.
Zalud D. Semeradova, D. Ventrella, D. P. Anastasiou, M. Medany, S. Altaher, J. Olejnik,
J. Lesny, N. Nemeshko, M. Nikolaev, C. Simota and G. Cojocaru, 2009. Adaptation of
vulnerable regional agricultural systems in Europe to climate change – results from the
ADAGIO project. Adv. Sci. Res., 3, 133–135
Research projects and systematic observation 305
Kazandjiev V., N. Shopova 2006. Agrometeorological observations and data Base
Management for Farmers Support in Bulgaria, 8-th Conference on Meteorology –
Climatology and Atmospheric Physics COMECAP 24-26 May 2006, Athens
Kazandjiev V., N. Slavov 2006. Phenological development as indicator of meteorological
conditions, BALWOIS Conference, Ohrid, Macedonia.
Koleva Ek., V.Alexandrov, 2008. Drought in the Bulgarian low regions during the 20th
century. Theoretical and Applied Climatology 92(1-2): 113-120.
Marinova, T., L. Bocheva, V. Sharov, 2005. On some climatic changes in the circulation
over the Mediterranean area. IDŐJÁRÁS, Vol.109, No 1, 55–67.
Neytchev, P., Zucchini,W., Hristov, H. and Neykov, N.M. (2006) Development of a
multisite daily precipitation model for Bulgaria using hidden Markov models. In: Proc. of
the XXIIIrd conference of Danubian countries on the hydrological forecasting and
hydrological bases of water management. Belgrade, Serbia, 28- 31 August.
Orlandini S, Nejedlik P, Eitzinger J, Alexandrov V, Toulios L, Calanca P, Trnka M,
Olesen JE. 2008 Impacts of climate change and variability on European agriculture:
results of inventory analysis in COST 734 countries.Ann N Y Acad Sci. 1146: 338-353.
Petkova N., 2007, Snow cover variability in Bulgarian Mountainous Regions,
International conference on „Climate change and problems”, 20-22 April, Sofia, Bulgaria
Petkova N., R. Brown, E. Koleva and V. Alexandrov, 2005. Snow Cover Changes in
Bulgarian Mountainous Regions, 1931-2000, Croatian Meteorological Journal 40: 662-
665.
Simeonov P., R. Petrov, L. Bocheva and T. Marinova Pre-project Study on
Meteorological Conditions for Hail Suppression and Rain Enhancement aim in South-
East Bulgaria, Paper submitted at 9th WMO World Weather Modification Conference,
22-25 Oct. 2007, Antalya, Turkey, (Ext. abstract, pp. 4).
The topic of climate change is reflected in other research units of the Academy and
Universities:
Geophysical Institute
Central Laboratory of Solar-Terrestrial Influences
Geographical Institute
Institute of Oceanology
Institute of Botany
Institute of Water Problems
Forest Research Institute
Space Research Institute
Institute of Nuclear Research and Nuclear Energy
Institute of Astronomy
Sofia University
Research projects and systematic observation 306
New Bulgarian University
South-western University, Blagoevgrad
University of Veliko Turnovo
University of Plovdiv
Agricultural University, Plovdiv
Forestry University
Financial Sources for Environmental Projects in Bulgaria
The main sources for financing of environmental projects in Bulgaria are:
- State budget;
- An enterprise for managing activities on environmental protection;
- National trust ecofund;
- National Research fund;
The Principality of Monaco.
- International organizations and financial institutions:
EC/EU programmes
United Nations Development Program;
Nordic-funds;
CIM-projects;
Central European Initiative;
United States Agency for International Development;
European Bank for Reconstruction and Development;
The World Bank.
8.3. Systematic Observation
There are no GSN (Global Surface Network) and GUAN (Global Upper Air Network) stations
located in Bulgaria. There is only one GAW (Global Atmosphere Watch) station in the country
(Rojen).
The National Institute of Meteorology and Hydrology in Sofia, Bulgaria has several
weather stations included within the Regional Basic Synoptic Network (RBSN) and Regional
Basic Climatological Network (RBCN) in RA VI (Europe):
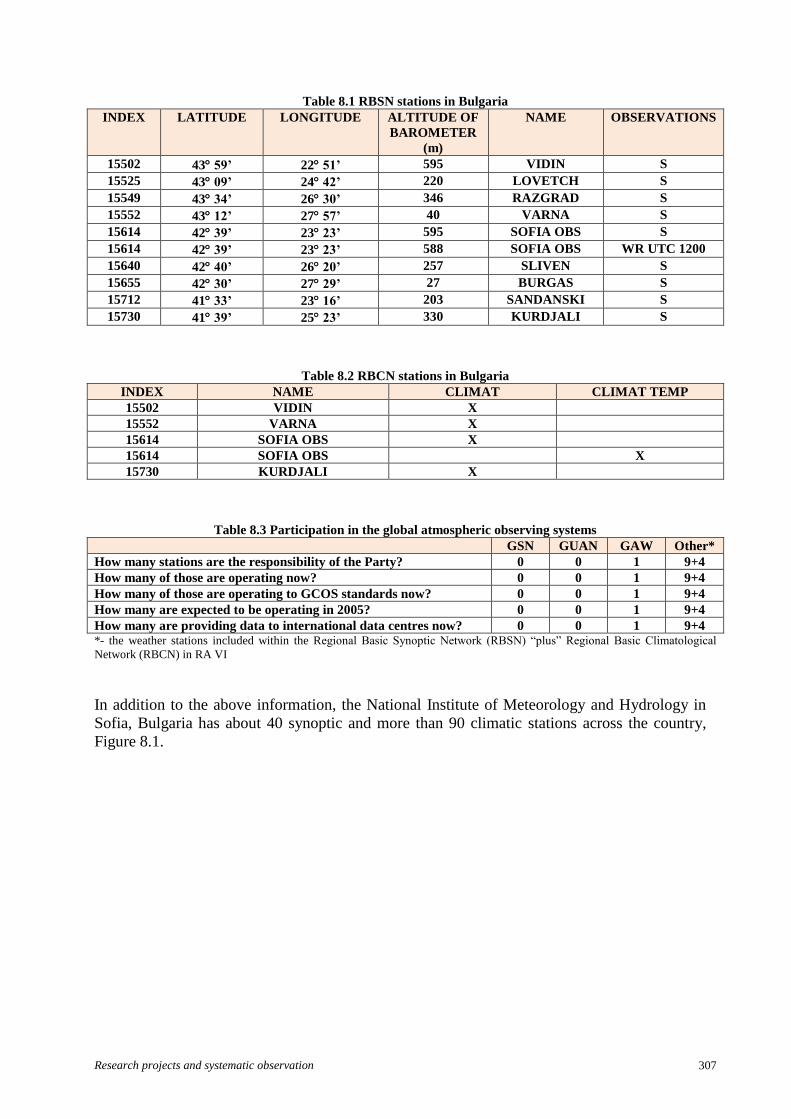
Research projects and systematic observation 307
Table 8.1 RBSN stations in Bulgaria
INDEX LATITUDE LONGITUDE ALTITUDE OF
BAROMETER
(m)
NAME OBSERVATIONS
15502 43 59’ 22 51’ 595 VIDIN S
15525 43 09’ 24 42’ 220 LOVETCH S
15549 43 34’ 26 30’ 346 RAZGRAD S
15552 43 12’ 27 57’ 40 VARNA S
15614 42 39’ 23 23’ 595 SOFIA OBS S
15614 42 39’ 23 23’ 588 SOFIA OBS WR UTC 1200
15640 42 40’ 26 20’ 257 SLIVEN S
15655 42 30’ 27 29’ 27 BURGAS S
15712 41 33’ 23 16’ 203 SANDANSKI S
15730 41 39’ 25 23’ 330 KURDJALI S
Table 8.2 RBCN stations in Bulgaria
INDEX NAME CLIMAT CLIMAT TEMP
15502 VIDIN X
15552 VARNA X
15614 SOFIA OBS X
15614 SOFIA OBS X
15730 KURDJALI X
Table 8.3 Participation in the global atmospheric observing systems
GSN GUAN GAW Other*
How many stations are the responsibility of the Party? 0 0 1 9+4
How many of those are operating now? 0 0 1 9+4
How many of those are operating to GCOS standards now? 0 0 1 9+4
How many are expected to be operating in 2005? 0 0 1 9+4
How many are providing data to international data centres now? 0 0 1 9+4 *- the weather stations included within the Regional Basic Synoptic Network (RBSN) “plus” Regional Basic Climatological
Network (RBCN) in RA VI
In addition to the above information, the National Institute of Meteorology and Hydrology in
Sofia, Bulgaria has about 40 synoptic and more than 90 climatic stations across the country,
Figure 8.1.
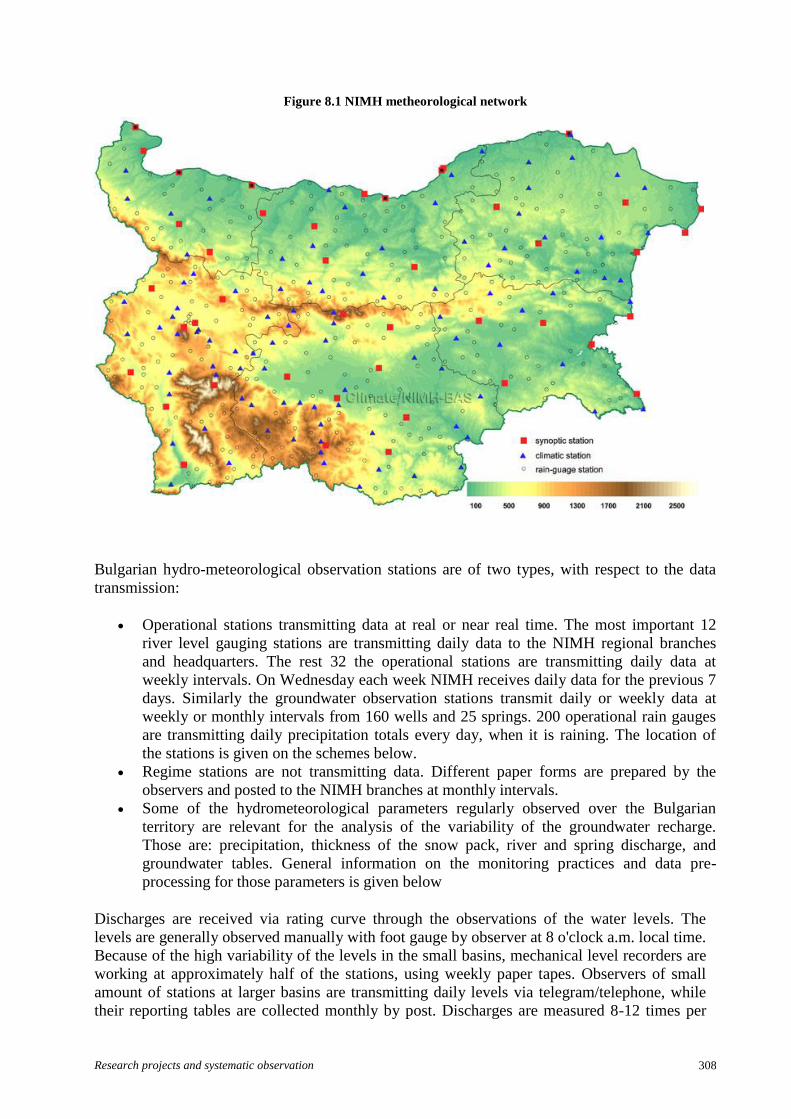
Research projects and systematic observation 308
Figure 8.1 NIMH metheorological network
Bulgarian hydro-meteorological observation stations are of two types, with respect to the data
transmission:
Operational stations transmitting data at real or near real time. The most important 12
river level gauging stations are transmitting daily data to the NIMH regional branches
and headquarters. The rest 32 the operational stations are transmitting daily data at
weekly intervals. On Wednesday each week NIMH receives daily data for the previous 7
days. Similarly the groundwater observation stations transmit daily or weekly data at
weekly or monthly intervals from 160 wells and 25 springs. 200 operational rain gauges
are transmitting daily precipitation totals every day, when it is raining. The location of
the stations is given on the schemes below.
Regime stations are not transmitting data. Different paper forms are prepared by the
observers and posted to the NIMH branches at monthly intervals.
Some of the hydrometeorological parameters regularly observed over the Bulgarian
territory are relevant for the analysis of the variability of the groundwater recharge.
Those are: precipitation, thickness of the snow pack, river and spring discharge, and
groundwater tables. General information on the monitoring practices and data pre-
processing for those parameters is given below
Discharges are received via rating curve through the observations of the water levels. The
levels are generally observed manually with foot gauge by observer at 8 o'clock a.m. local time.
Because of the high variability of the levels in the small basins, mechanical level recorders are
working at approximately half of the stations, using weekly paper tapes. Observers of small
amount of stations at larger basins are transmitting daily levels via telegram/telephone, while
their reporting tables are collected monthly by post. Discharges are measured 8-12 times per
Research projects and systematic observation 309
year by current meters, or floats in case of dangerous floods. Small springs are measured via
volume method. Most of the stations are equipped with measurement bridges. Cross-section
profiles are measured one or twice per year, which generally do not include the floodplains.
The frequency of those observations depends on the stability of river bed at the measuring
section. Provisional rating curves are maintained for the cross-sections with daily data
transmission, while for all stations rating curves and daily mean discharges are validated
annually. Certain amount of small river basins having an area of 50-100 km2 are observed
above the hydrotechnical structures (dams, derivation channels), while the others with
measuring sections located at the lowlands have an area of 200-400 to 1000-5000 km2.
Reservoir cascades regulate more than 50 % of the surface waters.
National Institute of Meteorology and Hydrology: it has Black Sea coastal stations – 10 stations
measure sea temperature; 10 stations measure sea level; 3 stations measure sea water salinity.
In 1995 Bulgaria was involved in the European space-based observing programmes on
meteorology after signing an Agreement on Use of Images from the EUMETSAT Meteosat
Satellites between the National Institute of Meteorology and Hydrology (NIMH) and
EUMETSAT, the European Organisation for the Exploitation of Meteorological Satellites.
High Resolution Image (HRI) data from Meteosat-7 in three channels (0,5-0,9 µm, 5,7-7,1 µm
and 10,5-12,5 µm) are processed and utilized for operational and research purposes. Daily
imagery analysis is made subjectively for the purposes of short-range weather forecasting. The
observations from the three channels of Meteosat-7 are received every 30 minutes at NIMH by
operating a Primary Data User Station (PDUS).
The Geophysical Institute “Acad. L. Krastanov” is a leading scientific institution in the
country, which carries out fundamental and applied research in the fields of:
Physics of the solid Earth
o Department “Seismology”;
o Department “Geomagnetism and Gravimetry”;
o Palaeomagnetic laboratory
o Physics of the Earth’s environment
o Department “Physics of the Atmosphere”;
o Department “Physics of the Ionosphere”.
The main research activity of the Institute is entirely subordinated to the national priorities:
Protection of the population and risk mitigation of unfavourable natural phenomena and
disasters;
Facilitating sustainable development and use of the natural and raw-material resources in
Bulgaria;
Providing national authorities with expert geophysical information
An important and irrevocable part of the Institute’s activities is the unique for our country
scientific and operative activity, concerning registration, processing, analysis and interpretation
of the seismicity, geomagnetic field, the status of the ionosphere and UV radiation level above
the country and surrounding lands.
The unique for the country international geomagnetic standard with absolute and comparative
geomagnetic measurements is maintained in Geomagnetic Observatory
State budget;
Research projects and systematic observation 310
An enterprise for managing activities on environmental protection;
National trust ecofund;
National Research fund;
European Union pre-accession funds for candidate member countries – ISPA, PHARE,
SAPHARD;
“Joint Implementation” mechanism within the framework of the Kyoto Protocol to the
United Nations Framework Convention on Climate Change;
Agreements for bilateral cooperation with:
o The Kingdom of the Netherlands;
o The Federal Republic of Germany;
o Denmark;
o Austria;
o The Kingdom of Belgium;
o The United Kingdom;
o The Principality of Monaco.
International organizations and financial institutions:
o EC/EU programmes
o United Nations Development Program;
o Nordic-funds;
o CIM-projects;
o Central European Initiative;
o United States Agency for International Development;
o European Bank for Reconstruction and Development;
o The World Bank.
The unique for the country international geomagnetic standard with absolute and comparative
geomagnetic measurements is maintained in Geomagnetic Observatory “Panagyurishte”. The
parameters of the Earth’s Magnetic Field are registered daily and maps of variations of the
elements are drawn. Main users of the collected information are Military Geographic service of
the MA, Cadaster Agency at the Ministry of Regional Development of Bulgaria and all
organizations working in the area of underground resources research with geomagnetic
methods. Geomagnetic field data are used for navigation and radio-connections services as
well.
The Ionospheric station “Plana” performs daily registration, processing and analysis of the
condition of the ionosphere above the country and surrounding areas. On the basis of these
observations, forecasts for ionospheric radio wave propagation, and short-wave radio-circuits
on the territory of Bulgaria is provided. Based on the contract with the Defence Ministry, these
forecasts are forwarded for exploitation to all interested authorities.
The Network for the ground measurements of the bioactive UV radiation and the ozone
thickness consists of three stationary stations, which will be installed in Sofia (GPhI), v.
Shkorpilovci in the base of the Oceanology Institute and in Geophysical observatory “Vitosha”.
From these three permanent stations information for the bioactive UV radiation level in the
capital, on the coast and in the Bulgarian mountain resorts will be collected. Two portable
stations for measurement of erythemal UV exposure will be used in a planed field works and
for relative calibration as well.
The Departments of the Institute of oceanography related to observations are;
Marine Physics:
Research projects and systematic observation 311
Measurements and analysis of the main hydrophysical parameters of sea water and
meteorological components of the adjacent atmosphere;
Marine Chemistry:
Monitoring on the main chemical parameters as main ions, dissolved gases, biogenic
elements in the western part of the Black Sea and coastal lakes;
Marine Biology and Ecology:
Study the taxonomic and functional biodiversity of the Black Sea and the food chain
interactions
Investigate the response of biota to external forcing - anthropogenic pressure and global
climatic impact
Coastal Zone Dynamics:
Studies wind-wave climate and wave transformation in shallow water; wind-wave structure and
non-linear relations; sea level fluctuations; coastal morpho- and lythodynamic processes;
sediment balance; geodynamic coastal processes.
Marine Geology and Archaeology:
Studies on structure and composition of the Black Sea sediment complex and stages in its
development; recent geological processes; geocatastrophic phenomena;
Investigations on alternative energy resources; geophysical fields;
Ocean Technologies
Collects, processes, quality controls, archives and keeps various oceanographic data.
Institute of Oceanology: Every year it carries out complex seasonal expeditions studying
physical, chemical and biological parameters of sea water and bed at the western part of Black
Sea. The research ship “Academic” executes up to 4 seasonal expeditions applying a constant
scheme for monitoring (at about 50 points at the western part of Black Sea). The profiles of sea
temperature and salinity, oxygen, phosphates, nitrates, nitrites, zooplanktons and fauna are
measured. Weather observations are done at every location of interest: air temperature, sea
level pressure, wind speed and direction. The institute is currently trying to recover and
improve some oceanographic systems for observations such as VOS (Volunteer Observing
Ship) and TIDE GAUGES as well as to include them within international programmers.
In 2004 National Centre for Oceanographic Data was established in the Institute. It is included
in the international system for data exchange IODE of IOC.
Bulgarian National Oceanographic Data Centre (BGODC) serves as a local portal for the
national and international exchange of oceanographic data.
The main objectives of BGODC are:
To acquire the marine data sampled by Bulgarian institutes and agencies, archive it and
maximise its utilization by promoting data exchange on national and international level
Research projects and systematic observation 312
To meet Bulgarian's international data exchange obligations to intergovernmental
Oceanographic Commission (IOC), SEADATANET, ASCABOS and ARENA projects
regarding monitoring of the Black Sea.
Institute of Oceanology: the 4 stations measuring the Black Sea level are equipped with
seagraphes and data are stored on paper. It does not allow operative data exchange.
Institute for Space Research: Bulgaria is participating in space-based observing programmes
by development and execution of national and international space programmes as well as
development of complex research tools for:
international crews of orbital space stations including those with the first and second
Bulgarian astronauts
space satellites
geophysical rockets
sub-space experiments
An important way related to participation in space-based observing programmes is
development, analyses and interpretation of space satellite images.
The Institute has participated in the creation of the scientific base and the development of the
instrumentation of the following satellites and rockets: satellites "intercosmos"- 8, 12, 14, 19;
"intercosmos-bulgaria-1300" and "meteor-priroda"; satellites (with 24 original scientific
instruments) "vertical" - 3,4, 6, 7, 9 and 10 rockets as well as in scientific programs of the first
and second Bulgarian cosmonauts on board of "salyut-6" and "mir", space stations "vega",
"activen", "granat", "interball" and other projects, "apex" satellite, and "phobos" missions.
By a model, developed by Bulgarian scientists, important results related to the impact of
inhomogeneous Earth surface on the cloud distribution were obtained. The theory and results
were published in a book written by Bulgarian, Hungarian, German, Romanian and Russian
researchers.
Studies on the statistical structure of meteorological fields in the stratosphere and mesosphere
were carried out by applying rocket data. The obtained results were involved within the
methods for analyses of meteorological fields, hydrodynamic and statistical forecasts.
In Bulgaria a method was developed for measurement of the wind velocity vector in the upper
layers of the atmosphere by applying dipole reflectors cluttered from a container located in
meteorological rockets. The obtained data for the wind profile at a level of 75-100 km together
with the data of temperature, pressure and density allow investigating the global atmosphere
circulation in the stratosphere and mesosphere.
Bulgaria utilizes observations from satellites: satellite images with very high (IKONOS,
QuickBird, EROS) high (IRS, SPOT) and moderate (Landsat, ASTER) space resolution are
used. The satellite images are used for research and scientific experiments as well as a basic
source of information under development of geoinformation systems.
Bulgaria is an active participant at the investigation of the Earth surface by aero-space tools.
The country has its own contribution (project teams from the Institute for Space Research and
some other space laboratories in the country) to utilization of spectral-reflector characteristics
of various natural forms. Bulgarian specialists created a catalogue of the major soil types in the
country. Since 1989 Bulgarian scientists have participated during two stages of an international
project “Earth cover” by using satellite data. The satellite images are received by: participation
Research projects and systematic observation 313
of various national and international projects and programmes (e.g. CD, DVD); Internet (e.g.
FTP servers); purchase (e.g. CD, DVD).
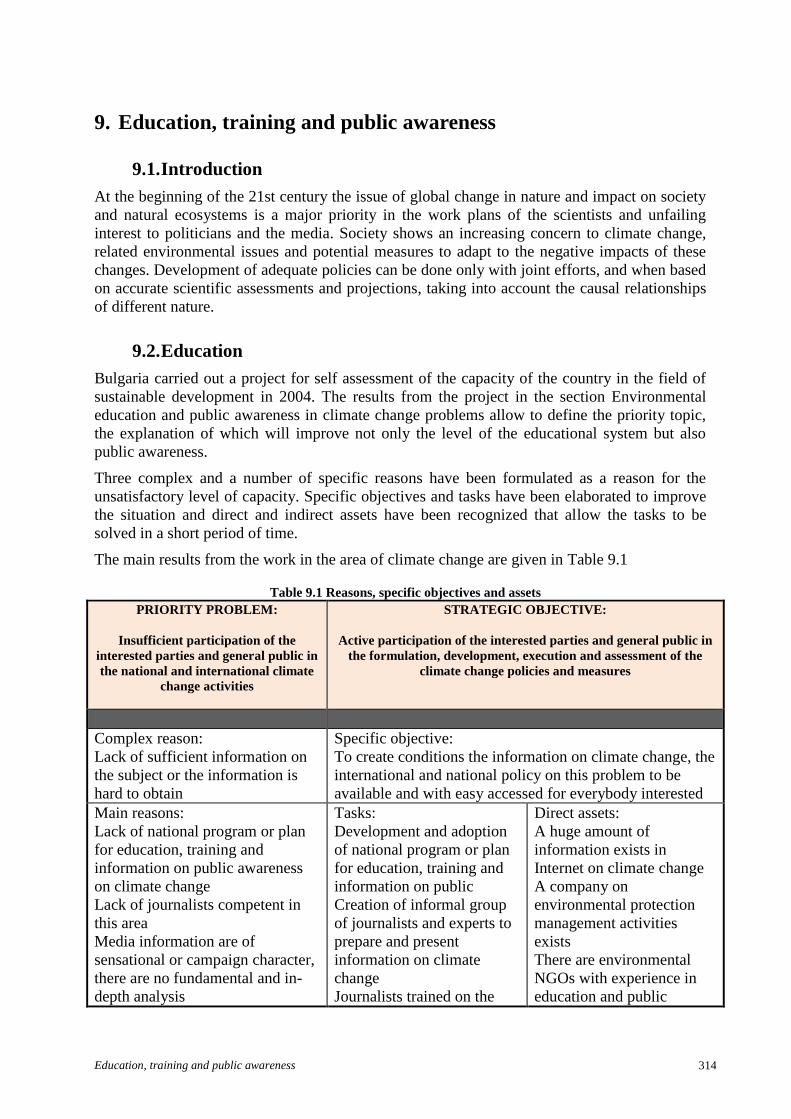
Education, training and public awareness 314
9. Education, training and public awareness
9.1. Introduction
At the beginning of the 21st century the issue of global change in nature and impact on society
and natural ecosystems is a major priority in the work plans of the scientists and unfailing
interest to politicians and the media. Society shows an increasing concern to climate change,
related environmental issues and potential measures to adapt to the negative impacts of these
changes. Development of adequate policies can be done only with joint efforts, and when based
on accurate scientific assessments and projections, taking into account the causal relationships
of different nature.
9.2. Education
Bulgaria carried out a project for self assessment of the capacity of the country in the field of
sustainable development in 2004. The results from the project in the section Environmental
education and public awareness in climate change problems allow to define the priority topic,
the explanation of which will improve not only the level of the educational system but also
public awareness.
Three complex and a number of specific reasons have been formulated as a reason for the
unsatisfactory level of capacity. Specific objectives and tasks have been elaborated to improve
the situation and direct and indirect assets have been recognized that allow the tasks to be
solved in a short period of time.
The main results from the work in the area of climate change are given in Table 9.1
Table 9.1 Reasons, specific objectives and assets
PRIORITY PROBLEM:
Insufficient participation of the
interested parties and general public in
the national and international climate
change activities
STRATEGIC OBJECTIVE:
Active participation of the interested parties and general public in
the formulation, development, execution and assessment of the
climate change policies and measures
Complex reason:
Lack of sufficient information on
the subject or the information is
hard to obtain
Specific objective:
To create conditions the information on climate change, the
international and national policy on this problem to be
available and with easy accessed for everybody interested
Main reasons:
Lack of national program or plan
for education, training and
information on public awareness
on climate change
Lack of journalists competent in
this area
Media information are of
sensational or campaign character,
there are no fundamental and in-
depth analysis
Tasks:
Development and adoption
of national program or plan
for education, training and
information on public
Creation of informal group
of journalists and experts to
prepare and present
information on climate
change
Journalists trained on the
Direct assets:
A huge amount of
information exists in
Internet on climate change
A company on
environmental protection
management activities
exists
There are environmental
NGOs with experience in
education and public
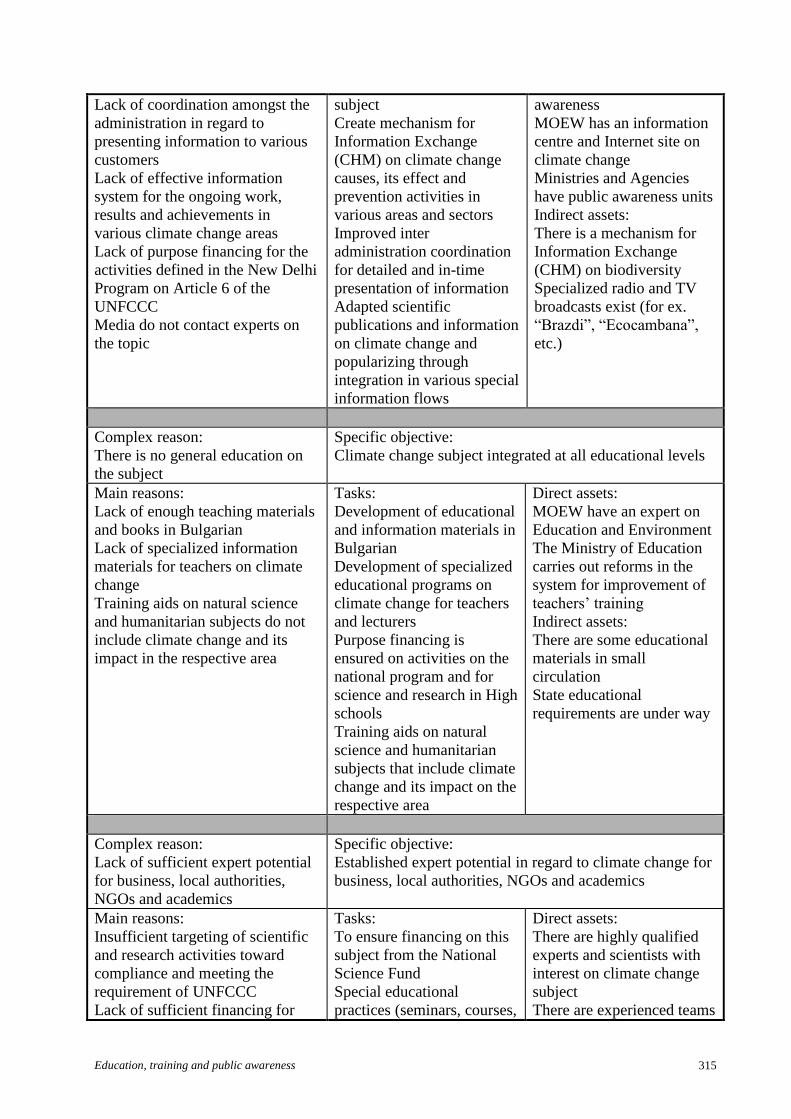
Education, training and public awareness 315
Lack of coordination amongst the
administration in regard to
presenting information to various
customers
Lack of effective information
system for the ongoing work,
results and achievements in
various climate change areas
Lack of purpose financing for the
activities defined in the New Delhi
Program on Article 6 of the
UNFCCC
Media do not contact experts on
the topic
subject
Create mechanism for
Information Exchange
(CHM) on climate change
causes, its effect and
prevention activities in
various areas and sectors
Improved inter
administration coordination
for detailed and in-time
presentation of information
Adapted scientific
publications and information
on climate change and
popularizing through
integration in various special
information flows
awareness
MOEW has an information
centre and Internet site on
climate change
Ministries and Agencies
have public awareness units
Indirect assets:
There is a mechanism for
Information Exchange
(CHM) on biodiversity
Specialized radio and TV
broadcasts exist (for ex.
“Brazdi”, “Ecocambana”,
etc.)
Complex reason:
There is no general education on
the subject
Specific objective:
Climate change subject integrated at all educational levels
Main reasons:
Lack of enough teaching materials
and books in Bulgarian
Lack of specialized information
materials for teachers on climate
change
Training aids on natural science
and humanitarian subjects do not
include climate change and its
impact in the respective area
Tasks:
Development of educational
and information materials in
Bulgarian
Development of specialized
educational programs on
climate change for teachers
and lecturers
Purpose financing is
ensured on activities on the
national program and for
science and research in High
schools
Training aids on natural
science and humanitarian
subjects that include climate
change and its impact on the
respective area
Direct assets:
MOEW have an expert on
Education and Environment
The Ministry of Education
carries out reforms in the
system for improvement of
teachers’ training
Indirect assets:
There are some educational
materials in small
circulation
State educational
requirements are under way
Complex reason:
Lack of sufficient expert potential
for business, local authorities,
NGOs and academics
Specific objective:
Established expert potential in regard to climate change for
business, local authorities, NGOs and academics
Main reasons:
Insufficient targeting of scientific
and research activities toward
compliance and meeting the
requirement of UNFCCC
Lack of sufficient financing for
Tasks:
To ensure financing on this
subject from the National
Science Fund
Special educational
practices (seminars, courses,
Direct assets:
There are highly qualified
experts and scientists with
interest on climate change
subject
There are experienced teams

Education, training and public awareness 316
research on this subject
Ignoring the gravity of the
problem by the parties concerned
Lack of good opportunities for
employment and professional
growth
information campaigns)
Improved interconnection of
business and science for
popularizing and financing
the research on the subject
in climate change projects
There is a limited number of
experts with good
knowledge on climate
change
Indirect assets:
There are chamber
organizations that support
information dissemination
and protection of member
interests
EPA requires the
development and
application of national and
municipal environmental
protection programs
There is experience in the
development of municipal
programs on EE
There are regional centres
and local units on energy
efficiency
There is already planning of the tasks from Table 9.1 and some positive results are in place.
9.3. Environmental Education in Schools
The effective use of human potential, especially in hard time as the present transitional period,
is one of the greatest challenges, undertaken by people in the last decade. Environmental
protection – soil, air, water, plants and animals, natural heritage must develop into personal
conviction. One of the fundaments of the present education is to familiarize the pupils with the
natural environment and form a positive attitude towards everything, surrounding them.
The topics of environmental protection and climate change are included in school syllabuses in
the educational and cultural field “Natural science and environment”. They are studied in most
details in the “Geography” subject but also, even in lesser scale in “Environmental chemistry”
and “Biology”.
The children have contacts with nature even in primary school, they get used to watch it, get
acquainted with various natural sites and objects, and follow different natural phenomenon. To
enhance their knowledge on the environment it is of great benefit to have various games –
didactic, of cognitive nature. When introducing Bulgarian mountains to them, a special
attention should be drawn to the variety of mountains in the country.
For an efficient environmental education and training, trips and games at the open are very
beneficial. The game “How old is the tree” will help the children understand how long does it
take for a tree to grow.
Through a series of research, experiments are made on the state of the river, running through
settlements. The water in the mountain is investigated and so is the water in the city. Even only
Education, training and public awareness 317
primitive tools are used – magnifying glass, what is seen is enough for drawing some valuable
conclusions. Visits of the Black Sea, numerous water dams, parks and reserves can also
positively contribute on children’s knowledge on environmental problems.
Pupils can see for themselves how much cleaner the water in the mountains is, where human
presence is limited.
In this context, one should add the necessity of introduction of compulsory environmental
lessons in primary schools and outdoor activities.
9.4. Development of Specific Syllabuses for Training of Teachers and
Lecturers
A “Specialized course on vocational training of chemistry teachers on environmental
protection” was carried out in 2005. It was on 3 stages during the school year. All 50
participants – chemistry teachers have obtained a certificate. The participants in the course
have been selected from all over the country. The successful completion of the education can
be used as a model for future training and elaboration of similar courses for training of
teachers.
9.5. Ecotourism
The consolidation of the movement for environmental protection and development of
ecotourism is typical for the period of transition to market economy. Both tendencies are
expression of the concern for environmental protection and protection of the natural and
cultural heritage. The protection of the environment, heritage and ecotourism are closely linked
amongst them and need each other to achieve successfully their goals.
During the first national forum “Ecotourism, mountains and protected territories – partners for
prosperity”, the Ministry of Economy, Ministry of Environment and Waters and Ministry of
Agriculture and Forestry signed a Protocol for cooperation in the ecotourism.
The strong orientation of ecotourism to the principles, guiding directions and certification,
based on the standards of sustainability, assigns it a special part in the sector Tourism. During
the years, since the term was defined for the first time, Bulgaria reached consensus on the main
elements of ecotourism, which characterize it as follows:
contributes for the biodiversity protection;
supports the prosperity of the local population;
includes a responsible behaviour from tourists and the tourist sector;
requires the lowest possible use of non-renewable resource;
services for small tourist groups are provided mainly by small business
the emphasis is on local participation, private property and business opportunities,
especially for people from rural areas;
includes imperative/cognitive element.
318
ANNEX I –Biennial report
THIRD BIENNIAL REPORT
OF THE REPUBLIC OF BULGARIA
Accompanying the document:Seventh National Communication the Republic of Bulgaria
under the United Nations Framework Convention on Climate Change

319
CONTENTS
1. Introduction ............................................................................................................ Error! Bookmark not defined.
2. Information on greenhouse gas emissions and trends ......................................... Error! Bookmark not defined.
3. Quantified economy-wide emission reduction target .......................................... Error! Bookmark not defined.
4. Progress in achievement of quantified economy-wide emission reduction targets and relevant
information ...................................................................................................................... Error! Bookmark not defined.
5. Projections .............................................................................................................. Error! Bookmark not defined.
6. Provision of financial, technological and capacity-building support to developing country PartiesError! Bookmark not defined.
7. Other reporting matters ........................................................................................ Error! Bookmark not defined.
8. Annex – Common tabular format workbook for the 3th biennial report ......... Error! Bookmark not defined.
320
1. Introduction
The third Biennial Report of Bulgaria (BR3) was prepared under Decision 2/CP.17 of the
Conference of the Parties to the UNFCCC and was submitted as an Annex to Bulgaria’s
Seventh National Communication under the UNFCCC (NC7).
This document is structured according to an outline defined in Annex 1 of the Decision
2/CP.17. Provisions of many chapters are reflecting information already provided in the
Bulgaria’s Seventh National Communication in its corresponding chapters.
As defined in the UNFCCC biennial reporting guidelines for developed-country Parties and
referring Annex I to UNFCCC decision 2/CP.17, the information is structured as follows:
• Information on GHG emissions and trends, and the GHG inventory including
information on national inventory system (section 2);
• Quantified economy-wide emission reduction target (section 3);
• Policies and measures (section 4);
• Projections (section 5);
• Provisions of financial, technological and capacity-building support to developing
country Parties (section 6).
Tabular information as defined in the common tabular format (CTF) for the UNFCCC biennial
reporting guidelines for developed country Parties (UNFCCC decision 19/CP.18) were
submitted separately in the CTF Tables attached to this submission. For the CTF submission to
the UNFCCC, the electronic reporting facility (CTF application) provided by the UNFCCC
Secretariat has been used as required by UNFCCC decision 19/CP.18.
2. Information on greenhouse gas emissions and trends
The legal basis for the compilation of the GHG inventory and the GHG inventory methodology
as well as data availability is described in the National Inventory Report of Bulgaria 2017,
chapter 1, submitted to the UNFCCC on 12 April 2017. The greenhouse gas data presented in
this chapter are consistent with the 2017 GHG inventory submission of Bulgaria to the United
Nations Framework Convention on Climate Change (UNFCCC) Secretariat submitted on 11
April 2017 in the CRF Tables.
Summary tables of GHG emissions of Bulgaria for emission trends by gas and by sector in the
common tabular format are presented in the CRF Tables 1(a) and 1(b) in the CTF Tables
attached to this submission. These data and the complete submissions of Bulgaria under the
Regulation (EU) No. 525/2013 of the European Parliament and of the Council.
2.1. Summary information on GHG emissions and trends
In 2015 Bulgaria's greenhouse gas emissions totalled 61 483 Gg CO2 without reporting of
sequestration from LULUCF sector. The emissions decreased by 47.17 % compared with the
base year. Emissions in 2015 were 6.9 % increase in comparison with the emissions of the
previous year.
The net emissions including reporting of sequestration from LULUCF sector were 54 608 Gg
CO2 eq. The emissions decreased by 45.93 % compared with the base year.
321
The main reasons for the declining GHG emission trend in Bulgaria are the structural economic
changes due to the radical transition process from a centrally-planned economy to a market-
based economy. This led to a decrease of power production from thermal power stations (and
an increase of the shares of hydropower and nuclear power), structural changes in industry
(including a decline in production by energy-intensive enterprises and energy - efficiency
improvements), introduction of energy efficiency measures in the residential sector and a shift
form solid and liquid fuels to natural gas in energy consumption. This also led to a decrease in
GHG emissions from the agricultural sector stemming from the decline in the cattle and sheep
populations and the use of fertilizers.
Bulgaria experienced a steady declining population trend during the period 1988-2015, which
resulted in the reduction of population by 20%.
The most important greenhouse gas in Bulgaria is carbon dioxide. The share of CO2 emissions
from the total greenhouse gas emissions varies around 78.5% excluding LULUCF and 75.7%
including LULUCF. In absolute terms CO2 emissions have decreased 46% since 1988. Around
74.2% of total CO2 eq emissions originate from the Energy sector. The amount of energy-
related CO2 emissions has fluctuated much according to the economic trend, the energy supply
structure (including electricity exports) and climate conditions.
Methane emissions (CH4) have decreased by 56.6% from the 1988 level. This is mainly due to
the improvements in waste collection and treatment and a reduction in animal husbandry in the
Agriculture sector. Correspondingly, emissions of nitrous oxide (N2O) have also decreased by
53.6% which has been occasioned mostly by the reduced nitrogen fertilisation of agricultural
fields, the biggest decline was in the beginning of time series.
The emissions of F-gases have increased over tenfold during 1995-2015. A key driver behind
the trend has been the substitution of ozone depleting substances (ODS) by F-gases in many
applications.
More detailed information about the trends of the greenhouse gas emissions are described in
the chapter 3.1 of the Bulgaria’s Seventh National Communication. Summary tables of
greenhouse gas emissions of Bulgaria for emission trends by gas and by sector in the common
tabular format are presented in the CTF Table 1.
More detailed information on inventory data and inventory arrangements can be found in the
Bulgarian National Inventory Report 2017.
2.2. National Inventory Arrangements
Bulgaria’s reporting obligations to the UNFCCC, UNECE and EC are being administered by
the MoEW. All activities on preparation of GHG inventory in Bulgaria are coordinated and
managed on the state level by MoEW.
Since 2008 the Executive Environment Agency (ExEA) has been identified as the responsible
organization for preparation of Bulgaria’s National GHG Inventory under the UNFCCC and
the Kyoto Protocol and designated as single national entity.
Further information on the institutional arrangement of the Bulgarian National Inventory
System is provided in chapter 3.3.2 of the Seventh National Communication.
There were no significant changes of the inventory system since the Second Biennial Report of
Bulgaria (BR2), except the Order № 296/04.12.2015 by the Executive Director of ExEA
(Sector experts/QC experts) which reflect relevant staffing changes of the inventory team.
More detailed information on inventory data and inventory arrangements can be found in the
Bulgarian National Inventory Reports.
322
3. Quantified economy-wide emission reduction target
Under the UNFCCC, the EU and its Member States have taken a joint emission reduction
target to reduce its GHG emissions by at least 20% compared to 1990 by 2020, with a
conditional offer to move to a 30% reduction, provided that other developed countries commit
themselves to comparable emission reductions and developing countries contribute adequately
according to their responsibilities and respective capabilities. This is documented in the
UNFCCC revised notes on the “Compilation of economy-wide emission reduction targets to be
implemented by Parties included in Annex I to the Convention”17
.
No individual quantified economy-wide reduction target is set for Bulgaria as this 20 %
reduction target will be fulfilled jointly by the EU and its Member States.
The EU quantified economy-wide emission reduction target is implemented through the EU
Climate and Energy Package. The package underpins the EU implementation of the target
under the Convention. The package introduced a clear approach to achieving the 20 %
reduction of total GHG emissions from 1990 levels, which is equivalent to a 14 % reduction
compared to 2005 levels. This 14 % reduction objective is divided between the European
Union Emission Trading Scheme (EU ETS) and the Effort Sharing Decision (ESD) sectors.
These two sub-targets are:
a 21 % reduction target compared to 2005 for emissions covered by the ETS (including
domestic and international aviation);
a 10 % reduction target compared to 2005 for ESD sectors, shared between the 28
Member States (MS) through individual national GHG targets.
Emission reduction targets under the Effort Sharing Decision
The Effort Sharing Decision No 406/2009/EC, on the effort of Member States to reduce their
GHG emissions to meet the Community’s GHG emission reduction commitments up to 2020
was adopted on 23 April 2009. The ESD sets binding annual greenhouse gas emission targets
for each Member State for the period 2013-2020. By 2020, the national targets will collectively
deliver a reduction of around 10 % in total EU emissions from the sectors not included in the
EU ETS compared with 2005 levels.
The targets are distributed according to the principle of ‘solidarity’ in a ‘fair and equitable’ way
allowing for further, accelerated growth in less wealthy countries where economic development
still needs to catch up with other Member States. That means that Member States with a low
Gross Domestic Product (GDP) per capita will be allowed to emit more than they did in 2005
although these ‘positive’ limits should still require a reduction effort. Thus, under the ESD,
Bulgaria has a reduction target of not exceeding 20 % by 2020 compared with 2005 for
emissions from sectors not covered by the EU ETS. Bulgaria’s Annual Emission Allocation
(AEA) for the year 2015 calculated applying global warming potential values from the fourth
IPCC assessment report is 29 132 652 AEA. More detailed information on Bulgaria’ Annual
Emissions Allocations for the period from 2013 to 2020 is provided in Commission Decision
of 26 March 2013 on determining Member States’ annual emission allocations for the period
from 2013 to 2020 pursuant to Decision No 406/2009/EC of the European Parliament and of
the Council.
In 2017, the annual emissions allocation of the EU Member States were further adjusted (by the
Commission Decision (EU) 2017/1471 of 10 August 2017 amending Decision 2013/162/EU to
revise Member States' annual emission allocations for the period from 2017 to 2020) to take
17
FCCC/SB/2011/INF.1/Rev.1 of 7 June 2011. and FCCC/SBSTA/2014/INF.6
323
into account changes introduced by the implementation of the 2006 IPCC guidelines for
national greenhouse gas inventories on the emissions levels in the inventory as these guidelines
were applied in inventory reporting after the annual emission allocations under the ESD were
agreed upon.
The Member States’ targets under the ESD are translated into an annual emission budget for
each Member State. The budget, the so-called Annual Emission Allocation (AEA), corresponds
to the absolute amount of emissions allowed to that Member State. The Annual Emission
Allocation units, corresponds to one ton of CO2 each, can be traded between Member States.
Emission reduction targets under the European Union Emission Trading Scheme
The EU ETS is a market based mechanism setting a cap on the total amount of greenhouse
gases that can be emitted by operators (factories and other installation in the system) in the EU.
As a result, total emissions cannot exceed this cap. In addition, the cap decreases gradually
every year.
A joint quantified economy-wide emission reduction target of 20 % for the years 2013-2020 is
calculated providing that in 2020 emissions from sectors covered by the EU ETS will be 21 %
lower than in 2005.
The EU-wide cap imposed on the EU ETS is determined for all EU Member States and the
three non-EU countries (Iceland, Norway and Liechtenstein) without reflecting a specific share
for each Member State. Allowances allocated in the EU ETS from 2013 to 2020 decrease by
1.74 % annually, starting from the average level of allowances issued by Member States for the
second trading period (2008–2012).
This system imposes a lot of additional burden on companies and forces them to monitor,
manage and cut the emission. This is a market-based system, so the idea is that the European
GHG emission is managed by market-based mechanisms, not by administrative actions.
The allocation of allowances takes place through auctions and free allocation. The share of
allowances auctioned on behalf of each Member State in each year is public and can be
obtained from the relevant auction platforms.
Nonetheless, free allocation is provided on the basis of EU-wide rules to installation operators
within a certain limit. For each of the nearly 12 000 installations in the EU ETS, the allocation
has been calculated based on the common rules. A breakdown of the amounts per Member
State is not available.
For more detailed explanation how the EU climate and energy package, EU target under the
UNFCCC and KP are set up and related, please also refer to the EU-BR3.
4. Progress in achievement of quantified economy-wide emission
reduction targets and relevant information
Bulgaria’s emission reduction target for the years 2013-2020 is part of the joint target of the
European Union. The historical trend in the national total emissions without the LULUCF
sector is the key indicator for progress in the achievement of the target. The EU joint target
under the Convention refers to greenhouse gas emissions of the EU-28 and the emissions are
calculated as the sum of the emission of the Member States.
Total GHG emissions excluding emissions and removals from LULUCF decreased by 40.9 %
between 1990 amd 2015, whereas total GHG emissions including net emissions and removals
324
from LULUCF decrease by 38.4 % over the same period. The emission trends 1990 – 2015 are
reported in CTF Table 1.
In the following sections, progress in achievement of quantified economy-wide emission
reduction targets is described through mitigation actions (policies and measures) planned,
adopted and implemented for achieving the targets and commitments under Convention and
EU’s Climate and Energy Package 2020. For further information on relevant mitigation
policies and measures please see chapter 4 of the Bulgaria’s Seventh National Communication.
Information on the effects of the mitigation actions and progress in achievement of the target
under the Convention, where available and relevant, has been included also in CTF Tables 3
and 4.
Emissions/removals in the LULUCF sector are not included in the EU target under the
Convention.
In the BR3 brief overview of the most significant climate related policies and measures is
reported. The development of GHG emissions is reported in CTF Table 4.
4.1. Cross-sectoral
EU level
EU Emissions Trading System (EU ETS)
The EU ETS is a Community market mechanism established in 2005 in order to encourage
investments in low carbon production. It is based on the 'cap and trade' principle. It limits
emissions from nearly 11,000 heavy energy-using installations (power stations & industrial
plants) and slightly over 500 aircraft operators operating between EEA countries, and covers
around 45 % of the EU's greenhouse gas emissions.
There are three trading periods (2005-2007, 2008-2012 and 2013-2020) were regulated by
Directive 2003/87/EC. In the first and second trading period, allowances were allocated free-
of-charge. In the third trading period 2013-2020, allowances are being allocated on the basis of
harmonized rules and a growing share of allowances is sold at auctions.
On 15 July 2015, the Commission presented a legislative proposal on the revision of the EU
ETS for Phase 4 in line with the 2030 Climate and Energy policy Framework.
More information on EU ETS is descripted in the Bulgaria’s Seventh National Communication
in chapter 4.
Effort Sharing Decision (ESD)
The EU Effort Sharing Decision (2013-2020) covers emissions from the non-ETS sectors such
as buildings, transport and agriculture. It sets national emission targets for 2020, expressed as
percentage changes from 2005 levels. By 2020, these national targets will collectively deliver a
reduction of around 10 % in total EU emissions from the sectors covered compared with 2005
levels.
Under the ESD, Bulgaria has a reduction target of not exceeding 20 % by 2020 compared with
2005 for emissions from sectors not covered by the EU ETS.
In accordance with Article 14 of the Decision, the European Commission prepared an
evaluation of the implementation of the Effort Sharing Decision up to 2015. The evaluation
concluded that the commitments under the Decision have contributed to stimulating new
national policies and measures promoting effective reductions of greenhouse gas emissions. It
also found that the Decision has resulted in Member States becoming more active in
325
considering new measures to reduce emissions in those sectors within the Decision’s scope, as
well as in improved coordination between national, regional and local governments.
The results of the evaluation were used by the Commission when preparing two legislative
proposals setting out how EU Member States should implement their commitment to reduce its
non-ETS emissions by 30 % by 2030 compared to 2005. The proposals were tabled on 20 July
2016.
First, for sectors outside the ETS and Land Use, Land Use Change and Forestry (LULUCF),
each Member State would be subject to a binding annual greenhouse gas emission limits for the
period 2021–2030. Member States agreed to share the relevant efforts on the basis of fairness,
solidarity, cost-effectiveness and environmental integrity. The proposal thus recognises
Member States' varying capacities to take action by differentiating 2030 targets primarily based
on 2013 GDP per capita. The proposed 2030 targets range from 0 % to -40 % compared to
2005 levels.
Secondly, Member States would be required to balance greenhouse gas emissions and removals
from land use, land use change and forestry under the ‘no debit rule’. It is proposed that
greenhouse gas emissions from land use would have to be entirely compensated by an
equivalent removal of CO2 from the atmosphere through action in this sector or alternatively in
the effort sharing sectors.
National level
CLIMATE CHANGE MITIGATION ACT (CCMA)
The administrative framework of the EU ETS is defined by the Climate Change Mitigation Act
(CCMA) (S.G. 22/2014, last amended S.G. 58/18.07.2017). It governs the public relations
relevant to the implementation of the European greenhouse gas emission trading scheme and
regulates the activities related to the allocation of greenhouse gas emission allowances and the
issuance and modification of greenhouse gas emission permits. The act also regulates: the
relations involving plans for monitoring and reporting of greenhouse gas emissions; the
operation of the national registry for greenhouse gas emission allowances and the activities of
the national registry administrator; the issuance, surrendering and cancellation of allowances;
the terms and conditions for closure of stationary installations; and the emission allowances for
the aviation sector.
Subject to regulation by CCMA is the implementation of joint implementation projects and
voluntary schemes, the reduction of greenhouse gas emissions from liquid fuels supplied to the
transport sector, as well as the implementation of the obligations under Decision 406/2009/EC
on the effort of Member States to reduce their greenhouse gas emissions in order to meet the
Community’s greenhouse gas emission reduction commitments up to 2020.
CCMA consolidates the numerous provisions relating to its subject that are currently found in
various regulatory acts. It settles the connections between national legislation and EU standards
in the field of the regulated matter. It also provides the mechanisms needed to fulfil the
obligations of Bulgaria under the Kyoto Protocol.
THIRD NATIONAL CLIMATE CHANGE ACTION PLAN (2013 – 2020)
In June 2012 the Third National Action Plan (2013 – 2020) was approved by the Council of
Ministers. The Third National Action Plan on Climate Change outlines the framework for
action on climate change for the period 2013-2020 in order to fulfil the obligations under The
United Nations Framework Convention on Climate Change, The Kyoto protocol and the
“Climate - Energy” package of the European Union.
326
The main objective of the Third National Action Plan on Climate Change (NAPCC) is to
outline the framework for action against climate change for the period 2013-2020 and to focus
the country’s efforts on actions leading to reduction of the negative impacts of climate change
and implementation of the undertaken commitments.
The Third National Action Plan on Climate Change provides specific measures for reduction of
greenhouse gas emissions across all sectors and these measures are consistent with both the
national policy on climate change and the potential of the national economy to reduce
emissions. The overall effect of the measures will ensure the implementation of the
commitments taken and the achievement of the legally binding European objectives, namely:
• 20% increase in energy efficiency;
• 20% reduction of greenhouse gas emissions compared to their 1990 levels;
• 20% share of renewable energy in the total EU energy consumption by 2020 including a
10% share of biofuels in the transport.
The reduction of greenhouse gas emissions from the sources within the scope of the scheme by
21% compared to their 2005 levels is set for all EU Member States through a linear factor for
reducing the permitted emission caps for the sectors under the ETS. For the non-ETS sectors
Bulgaria has an individual commitment allowing an increase in emissions by 20% compared to
their 2005 level. The national objectives of the Member States, in terms of share of renewables
in the final energy consumption by 2020 range from 10% to 49%. Bulgaria’s goal is set at 16%,
including 10% share of biofuels in the final consumption of transport fuels.
The “Climate and Energy” package does not contain direct binding measures for energy
efficiency improvement although it has an indirect effect in this direction. The individual
commitments of Member States in the field of energy efficiency are still taken on a voluntary
basis and are rather political than legally binding. At this stage they are defined in the context
of the strategy “Europe 2020” where resource (including energy) efficiency is a flagship
initiative. According to the commitment undertaken within the framework of “Europe 2020”,
Bulgaria aims to reduce the energy intensity of GDP by 50% by 2020. The implementation of
the energy efficiency measures and policies set in the National Energy Strategy until 2020 aim
to lead to an improvement of the energy efficiency by approximately 25% or saving more than
5 million toe primary energy compared to the baseline development scenario by 2020.
NAPCC presents an assessment of the status and trends of greenhouse gas emissions in
Bulgaria until 2009 in various sectors and the scenarios and projections of the emissions in
these sectors by 2030 before and after the implementation of the measures.
The policies and measures for achieving the objectives of the country with regard to climate
change are presented by sectors and represent the most significant and voluminous part of the
Third Action Plan on Climate Change. The process of selection of specific measures in each
sector includes consultations with the relevant government institutions, numerous consultations
with stakeholders, businesses, NGOs and academic circles. The received comments and
opinions on the proposed policies and measures have been taken into account. Thus
transparency and coordination in preparing the Plan is ensured.
After specifying the policies and measures by sector, their feasibility was analyzed from
economic point of view. The effective reduction of greenhouse gas emissions was assessed
without need to reduce the production and the consumption on the basis of the baseline
scenario for the economic development of the country by 2030.
NAPCC pays special attention to the administrative capacity necessary to implement the
planned measures, as well as to the responsibilities for monitoring and reporting the
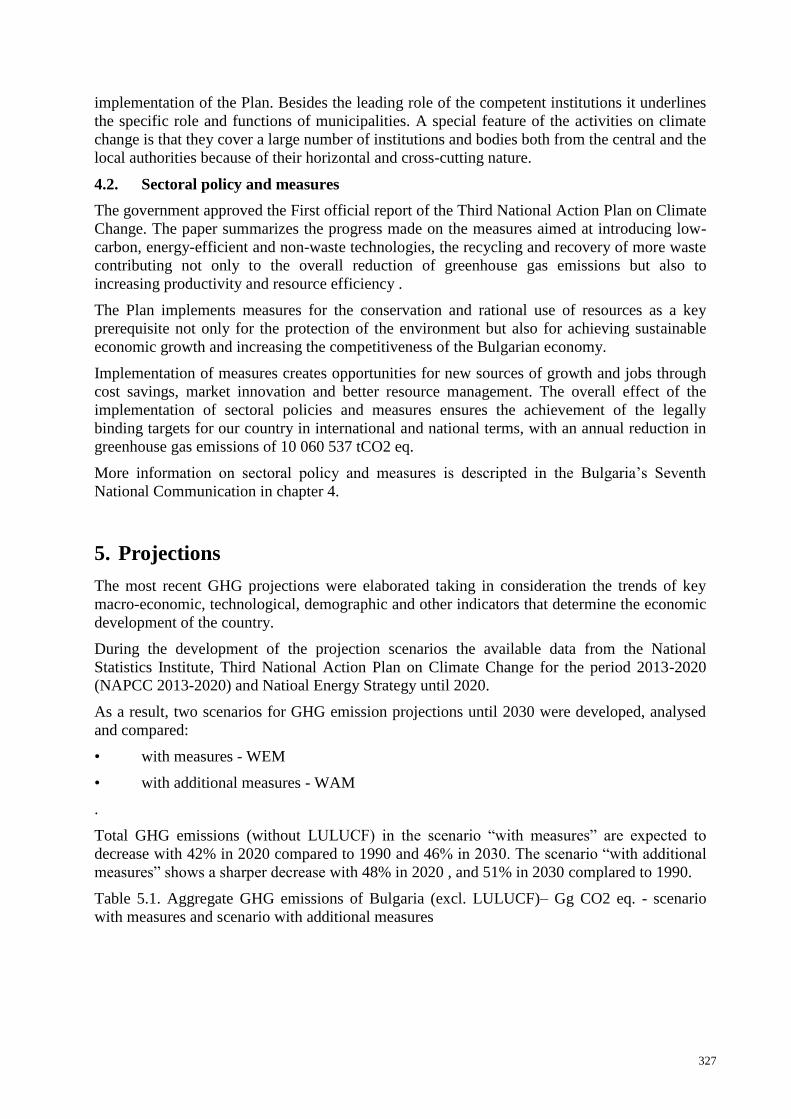
327
implementation of the Plan. Besides the leading role of the competent institutions it underlines
the specific role and functions of municipalities. A special feature of the activities on climate
change is that they cover a large number of institutions and bodies both from the central and the
local authorities because of their horizontal and cross-cutting nature.
4.2. Sectoral policy and measures
The government approved the First official report of the Third National Action Plan on Climate
Change. The paper summarizes the progress made on the measures aimed at introducing low-
carbon, energy-efficient and non-waste technologies, the recycling and recovery of more waste
contributing not only to the overall reduction of greenhouse gas emissions but also to
increasing productivity and resource efficiency .
The Plan implements measures for the conservation and rational use of resources as a key
prerequisite not only for the protection of the environment but also for achieving sustainable
economic growth and increasing the competitiveness of the Bulgarian economy.
Implementation of measures creates opportunities for new sources of growth and jobs through
cost savings, market innovation and better resource management. The overall effect of the
implementation of sectoral policies and measures ensures the achievement of the legally
binding targets for our country in international and national terms, with an annual reduction in
greenhouse gas emissions of 10 060 537 tCO2 eq.
More information on sectoral policy and measures is descripted in the Bulgaria’s Seventh
National Communication in chapter 4.
5. Projections
The most recent GHG projections were elaborated taking in consideration the trends of key
macro-economic, technological, demographic and other indicators that determine the economic
development of the country.
During the development of the projection scenarios the available data from the National
Statistics Institute, Third National Action Plan on Climate Change for the period 2013-2020
(NAPCC 2013-2020) and Natioal Energy Strategy until 2020.
As a result, two scenarios for GHG emission projections until 2030 were developed, analysed
and compared:
• with measures - WEM
• with additional measures - WAM
.
Total GHG emissions (without LULUCF) in the scenario “with measures” are expected to
decrease with 42% in 2020 compared to 1990 and 46% in 2030. The scenario “with additional
measures” shows a sharper decrease with 48% in 2020 , and 51% in 2030 complared to 1990.
Table 5.1. Aggregate GHG emissions of Bulgaria (excl. LULUCF)– Gg CO2 eq. - scenario
with measures and scenario with additional measures
328
1990 2015 2020 2030 ∆ (2020 -
1990), %
∆ (2030 -
1990), %
WEM scenario Aggregate
emissions in Gg CO2 eq. 102 072 60 189 59 086 55 492 -42 -46
WAM scenario Aggregate
emissions in Gg CO2 eq. 102 072 61 430 53 325 49 650 -48 -51
Projected emissions according to sector and gas are listed in CTF Tables 6 (a) and 6 (c) in the
Annex. Key variables used in the projections are listed in CTF Table 5.
More details on results, assumptions, methods and changes compared to previously reported
projections can be found in Chapter 5 of Bulgaria’s Seventh National Communication.
6. Provision of financial, technological and capacity-building
support to developing country Parties
Despite the fact that Bulgaria is an Annex I Party to the Convention, as a country with economy
in transition status under the Convention, it has no commitments to provide financial resources
and technology transfer to developing country Parties. Nevertheless, in its first biennial report,
Bulgaria did report information on provision of financial support to developing country Parties,
in particular in the Former Yugoslav Republic of Macedonia (FYROM).
Republic of Bulgaria’s Roadmap for participation in the international development assistance
delineates the country’s closely situated States that are identifying as the most appropriate
beneficiaries for financial, technological and capacity-building support with regards to Bulgarian
geographic priorities for projects sponsorship – Former Yugoslav Republic of Macedonia,
Armenia, Moldova, Kosovo, Serbia and Georgia.
Taking into consideration Bulgarian foreign policy priorities and a proposal by the Ministry of
Finance, the Ministry of Environment and Water contacted United Nations Development
program (UNDP) with the goal of identifying a project which fulfills the aims of EU Fast Start
Finance initiative.
As a part of the EU Fast Start Finance initiative, the country provided support in 2011 and 2012
to a project on capacity-building in the FYROM on monitoring, reporting and verification
systems for GHG inventories and emissions trading. In 2012 Bulgaria provided financial support
in the amount of 20 000 euros in the FYORM regarding to Bulgarian contribution to the short-
term financing 2011-2012: sharing Bulgarian experience of monitoring, reporting and
verification of greenhouse gas in the former Yugoslav Republic of Macedonia for participation
in the European Union Emission Trading Scheme of greenhouse gases.
This is achieved through direct interaction between the Ministers of Environment in the two
countries as the main aim of the project is to support the implementation process of the EU
Directives 2003/87/EC and 2009/29/EC in FYROM by utilizing Bulgarian expertise and
capitalizing on best practices and lessons learned of Republic of Bulgaria in the field of
monitoring, reporting and verification of greenhouse gas emissions and emissions trading.
329
As Bulgaria significantly overachieved the emissions reduction target, Bulgaria concluded two
Assigned Amount Units (AAUs) Purchase Agreements (in October 2011 and April 2012). The
proceeds from the sale of AAUs are being spent through the National Green Investment Scheme,
supporting projects on energy efficiency. Around 100 projects for financing the improvement of
public buildings, including educational institutions, kindergartens, cultural institutions, medical
centers and administrative buildings have been implemented. All measures result in a significant
decrease of emissions.
In 2015 was started the Investment Climate Programme, which is a kind of continuation of the
National Green Investment Scheme. The new programme is implemented by Trust Eco-Fund and
it is financed by the revenues from so called “early auctions” of greenhouse gas emissions
allowances from installations paid into the budget of the Ministry of Environment and Water by
31st December 2012. The funds are designated to be used for financing of the projects aiming at
improving of energy efficiency of state and municipal public buildings, as well as for promoting
the use of electric and hybrid vehicles by public institutions (since 2016).
In addition in 2015 at COP 21 in Paris Bulgaria announced its grant contribution of 100 000
Euros to the Green Climate Fund through the Ministry of Foreign Affairs of Republic of
Bulgaria, That was a voluntary contribution to the GCF..
7. Other reporting matters
No other reporting matters supplied in this submission
330
FOR FURTHER INFORMATION PLEASE CONTACT:
Ministry of Environment and Water
22 Maria Louisa Blvd.
1000 Sofia
Bulgaria
http://www.moew.government.bg/
REPUBLIC OF BULGARIA
SEVENTH NATIONAL COMMUNICATION ON CLIMATE CHANGE