Settlement Scaling and Increasing Returns in an Ancient Society
31
ECONOMIC ANTHROPOLOGY Settlement scaling and increasing returns in an ancient society Scott G. Ortman, 1,2 * Andrew H. F. Cabaniss, 2,3 Jennie O. Sturm, 4 Luís M. A. Bettencourt 2 A key property of modern cities is increasing returns to scale—the finding that many socioeconomic outputs in- crease more rapidly than their population size. Recent theoretical work proposes that this phenomenon is the result of general network effects typical of human social networks embedded in space and, thus, is not necessarily limited to modern settlements. We examine the extent to which increasing returns are apparent in archaeological settle- ment data from the pre-Hispanic Basin of Mexico. We review previous work on the quantitative relationship be- tween population size and average settled area in this society and then present a general analysis of their patterns of monument construction and house sizes. Estimated scaling parameter values and residual statistics support the hypothesis that increasing returns to scale characterized various forms of socioeconomic production available in the archaeological record and are found to be consistent with key expectations from settlement scaling theory. As a consequence, these results provide evidence that the essential processes that lead to increasing returns in contem- porary cities may have characterized human settlements throughout history, and demonstrate that increasing re- turns do not require modern forms of political or economic organization. INTRODUCTION Many studies over the last few decades have demonstrated that aver- age properties of contemporary urban settlements—from socioeconomic outputs to land area to the extent of infrastructure—vary systematical- ly and predictably with population size (1–6). For example, measures of the physical extent of urban infrastructure increase more slowly than city population size, thus exhibiting economies of scale. On the other hand, various socioeconomic outputs increase faster than pop- ulation size and thus exhibit increasing returns to scale. Recent theory, building from comparative analyses of large data sets for many urban systems around the world, has proposed that these properties of mod- ern cities take a simple mathematical form and emerge from a few general principles of human social organization (2). This view posits the primary role of cities in human societies as social reactors: Larger cities are environments where a larger number of social interactions per unit time can be supported and sustained. This generic dynamics, in turn, is the basis for expanding economic and political organization, such as the division and coordination of labor, the specialization of knowledge, and the development of (hierarchical) political and civic institutions. Thus, whereas the expression of these activities is local and reflects history and culture, the larger cities in any urban system, on average, share common characteristics as they magnify social inter- action opportunities (2, 3, 7) and provide better matching comple- mentarities (8), thereby increasing the productivity and scope of material resources and human labor (2, 7, 8). An important aspect of these ideas is that the theoretical derivation of scaling relations does not invoke specific characteristics of modern economies, industrialization, or global trade, but instead relies only on basic self-consistent characteristics of human social networks em- bedded in space. Consequently, these models are potentially applicable to ancient (and even non-urban) settlement systems and make a set of integrated and novel predictions for the structure and function of these systems that can be tested using archaeological evidence. We have previously introduced settlement scaling theory and examined the extent to which spatial economies of scale characterized the pre- Hispanic Basin of Mexico (BOM) (7). Here, we review this previous work and discuss the relationship of settlement scaling theory to existing models of spatial economics. Then, we investigate two ways in which increasing returns to scale are expressed by archaeological data from the pre-Hispanic BOM (Fig. 1) by analyzing the scaling proper- ties and statistics of monument construction and house sizes versus settlement population. We find not only that increasing returns were present in the pre-Hispanic BOM but also that the measure of such returns (elasticity) has the same numerical value predicted by settle- ment scaling theory and observed in modern urban systems. On the basis of these combined results, we propose that scaling phenomena in all human societies emerge from the same essential processes, and that settlement scaling theory provides a unifying view of these patterns and a novel theoretical framework for the interpretation of archaeo- logical data. Previous research We begin by briefly reviewing settlement scaling theory and its rela- tion to standard models of land use in cities and to extensive empirical observations of modern urban areas. This allows us to derive in simple terms the main expectations of scaling theory for settlements in the archaeological record as a function of their population size. We then introduce the main characteristics of the BOM settlement surveys em- phasizing how they enable the creation of independent measures of population and occupied land area, leading to a test of expected spatial economies of scale following from scaling theory. These arguments set up the necessary formal expectations for data expressing potential increasing returns to scale, characterizing social and economic pro- duction in ancient societies. Settlement scaling theory Simple spatial models of settlements have a long history in geography and economics, starting with the von Thünen model (for the isolated 1 Department of Anthropology, University of Colorado Boulder, Boulder, CO 80309–0233, USA. 2 Santa Fe Institute, 1399 Hyde Park Road, Santa Fe, NM 87501, USA. 3 Department of Classics, University of North Carolina at Chapel Hill, Chapel Hill, NC 27599, USA. 4 Depart- ment of Anthropology, University of New Mexico, Albuquerque, NM 87131, USA. *Corresponding author. E-mail: [email protected] 2015 © The Authors, some rights reserved; exclusive licensee American Association for the Advancement of Science. Distributed under a Creative Commons Attribution Non-Commercial License 4.0 (CC BY-NC). 10.1126/sciadv.1400066 RESEARCH ARTICLE Ortman et al. Sci. Adv. 2015;1:e1400066 20 February 2015 1 of 8
Transcript of Settlement Scaling and Increasing Returns in an Ancient Society
2015 © The Authors, some rights reserved;
R E S EARCH ART I C L E
ECONOMIC ANTHROPOLOGY
nsee American Association forment of Science. Distributed
tive Commons Attribution
rcial License 4.0 (CC BY-NC).
dv.1400066
Settlement scaling and increasing returns inan ancient societyScott G. Ortman,1,2* Andrew H. F. Cabaniss,2,3 Jennie O. Sturm,4 Luís M. A. Bettencourt2
exclusive lice
the Advance
under a Crea
Non-Comme
10.1126/scia
A key property of modern cities is increasing returns to scale—the finding that many socioeconomic outputs in-crease more rapidly than their population size. Recent theoretical work proposes that this phenomenon is the resultof general network effects typical of human social networks embedded in space and, thus, is not necessarily limitedto modern settlements. We examine the extent to which increasing returns are apparent in archaeological settle-ment data from the pre-Hispanic Basin of Mexico. We review previous work on the quantitative relationship be-tween population size and average settled area in this society and then present a general analysis of their patternsof monument construction and house sizes. Estimated scaling parameter values and residual statistics support thehypothesis that increasing returns to scale characterized various forms of socioeconomic production available in thearchaeological record and are found to be consistent with key expectations from settlement scaling theory. As aconsequence, these results provide evidence that the essential processes that lead to increasing returns in contem-porary cities may have characterized human settlements throughout history, and demonstrate that increasing re-turns do not require modern forms of political or economic organization.
INTRODUCTION
Many studies over the last few decades have demonstrated that aver-age properties of contemporary urban settlements—from socioeconomicoutputs to land area to the extent of infrastructure—vary systematical-ly and predictably with population size (1–6). For example, measuresof the physical extent of urban infrastructure increase more slowlythan city population size, thus exhibiting economies of scale. On theother hand, various socioeconomic outputs increase faster than pop-ulation size and thus exhibit increasing returns to scale. Recent theory,building from comparative analyses of large data sets for many urbansystems around the world, has proposed that these properties of mod-ern cities take a simple mathematical form and emerge from a fewgeneral principles of human social organization (2). This view positsthe primary role of cities in human societies as social reactors: Largercities are environments where a larger number of social interactionsper unit time can be supported and sustained. This generic dynamics,in turn, is the basis for expanding economic and political organization,such as the division and coordination of labor, the specialization ofknowledge, and the development of (hierarchical) political and civicinstitutions. Thus, whereas the expression of these activities is localand reflects history and culture, the larger cities in any urban system,on average, share common characteristics as they magnify social inter-action opportunities (2, 3, 7) and provide better matching comple-mentarities (8), thereby increasing the productivity and scope ofmaterial resources and human labor (2, 7, 8).
An important aspect of these ideas is that the theoretical derivationof scaling relations does not invoke specific characteristics of moderneconomies, industrialization, or global trade, but instead relies only onbasic self-consistent characteristics of human social networks em-bedded in space. Consequently, these models are potentially applicableto ancient (and even non-urban) settlement systems and make a set of
1Department of Anthropology, University of Colorado Boulder, Boulder, CO 80309–0233,USA. 2Santa Fe Institute, 1399 Hyde Park Road, Santa Fe, NM 87501, USA. 3Department ofClassics, University of North Carolina at Chapel Hill, Chapel Hill, NC 27599, USA. 4Depart-ment of Anthropology, University of New Mexico, Albuquerque, NM 87131, USA.*Corresponding author. E-mail: [email protected]
Ortman et al. Sci. Adv. 2015;1:e1400066 20 February 2015
integrated and novel predictions for the structure and function ofthese systems that can be tested using archaeological evidence. Wehave previously introduced settlement scaling theory and examinedthe extent to which spatial economies of scale characterized the pre-Hispanic Basin of Mexico (BOM) (7). Here, we review this previouswork and discuss the relationship of settlement scaling theory toexisting models of spatial economics. Then, we investigate two waysin which increasing returns to scale are expressed by archaeological datafrom the pre-Hispanic BOM (Fig. 1) by analyzing the scaling proper-ties and statistics of monument construction and house sizes versussettlement population. We find not only that increasing returns werepresent in the pre-Hispanic BOM but also that the measure of suchreturns (elasticity) has the same numerical value predicted by settle-ment scaling theory and observed in modern urban systems. On thebasis of these combined results, we propose that scaling phenomena inall human societies emerge from the same essential processes, and thatsettlement scaling theory provides a unifying view of these patternsand a novel theoretical framework for the interpretation of archaeo-logical data.
Previous researchWe begin by briefly reviewing settlement scaling theory and its rela-tion to standard models of land use in cities and to extensive empiricalobservations of modern urban areas. This allows us to derive in simpleterms the main expectations of scaling theory for settlements in thearchaeological record as a function of their population size. We thenintroduce the main characteristics of the BOM settlement surveys em-phasizing how they enable the creation of independent measures ofpopulation and occupied land area, leading to a test of expected spatialeconomies of scale following from scaling theory. These arguments setup the necessary formal expectations for data expressing potentialincreasing returns to scale, characterizing social and economic pro-duction in ancient societies.
Settlement scaling theorySimple spatial models of settlements have a long history in geographyand economics, starting with the von Thünen model (for the isolated
1 of 8
R E S EARCH ART I C L E
state). More recent models apply similar ideas to the structure of cities,due to Alonso and others (9). These models are most frequently in-voked to derive patterns of land use as the result of the interplay be-tween land rents and transportation costs in monocentric settlementgeometries (9).
Settlement scaling theory retains some of the characteristics of thesemodels but generalizes them in a few ways that apply to more realisticsituations. First, settlement scaling theory considers situations wherecircular symmetry is not necessary (there is no single central market)by requiring only that a number of social encounters are realized overa specific geometry per unit time. Crucially for archaeology, settlementscaling theory also does not specify the type or value of goods to betransported: The problem of what can be produced and spent is in-stead determined more abstractly as the result of socioeconomic ratesof interaction. What is specified in our approach is the universal de-pendence of the rates at which goods are produced (and consumed)on population size (elasticities) (2, 7). As such, the ideas that underliesettlement scaling theory are more general than traditional models ofland use economics and can be developed and tested in the context ofancient societies and archaeological data.
In (2, 7), we propose that human settlements are, first and fore-most, social networks embedded in space. In this view, settlementsare containers within which a population interacts frequently, with in-ternal social interactions far outnumbering external ones. From thisvery simple general picture, one can derive an expected scaling rela-tion between total settlement land area and population. To see this,consider a settlement with relatively low density of occupation thatis not especially organized or planned spatially. We call such settle-ments amorphous and posit that their spatial extent is set by a simple
Ortman et al. Sci. Adv. 2015;1:e1400066 20 February 2015
form of spatial equilibrium where, on av-erage, the benefits of social interactionbalance movement costs for a given pop-ulation size N. In this case, the cost ofmovement c is set by the energetic costof walking e (measured in cal/length)times the diameter of the circumscribingarea L, which is proportional to the onlycharacteristic length scale in the problem:the square root of the area, c = c0eA
1/2.This is true in many different geometriesand does not require that the settlementbe circular or the transportation radial(9, 10). The dimensionless constant c0 isa number of order unity, as demonstratedby studies exploring movement in differ-ent urban forms (10). The average socialbenefits of interaction with others y arethen estimated through the average pro-ductivity of each interaction g times the ra-tio of urban volume covered by a personin the settlement over its area, times thenumber of people in the settlement. If weparameterize these quantities by the dis-tance at which interaction occurs a0 (across-section in the language of physics)and the distance travelled over the givenperiod l, we obtain y = (ga0l/A)N. Equi-librium between social net benefits and
movement costs, c(N) = y(N), then leads to A(N) = aNa, where a =(ga0l)/(c0e)
a and a = 2/3.This simple picture needs to be elaborated as settlement densities
increase and urban space becomes more structured and differentiated(2). The main feature of such changes is the explicit appearance ofspaces dedicated to flows, such as streets and waterways. As thishappens, dwellings align along these transportation networks, as canbe seen in maps of many ancient and modern cities. This changetoward a networked organization with size and density has been notedin archaeology by Flannery (11), who suggested that it may be a gen-eral feature of human settlement growth.
Such spatial organization has a different geometry from theamorphous settlement and leads to different scaling exponents. Toextend the amorphous settlement model to larger and denser “net-worked” settlements, we assume that infrastructural space d is setaside on a per capita basis, proportional to the overall density ofsettlement, such that d = r−1/2, where r = A/N [more complex andthorough models can also be developed that justify these simple de-rivations (2)]. Thus, the total area of the infrastructural networkAn isproportional to the population times the square root of area over pop-ulation, An ∼ A1/2N1/2. Substituting aN2/3 for A leads to An ~ a1/2 N5/6,the relation observed for infrastructural quantities in contemporarymetropolitan areas (2, 6).
Finally, we assume that total socioeconomic outputs, whether pos-itive in the form of economic production or innovation, or negative inthe form of contagious diseases or interpersonal violence [see (5)], areproportional to the total number of interactions that take place in asettlement, with technology and culture influencing only the produc-tivity (and cost) of each interaction. Given this, we can derive the
Mexico
A B
0 10 20 305km
0 - 100101 - 10001001 - 1000010,001 - 100,000100,001 - 1,000,000
5000 m
1750 m
ASTER terrainPopulation
Mexico City Survey regions
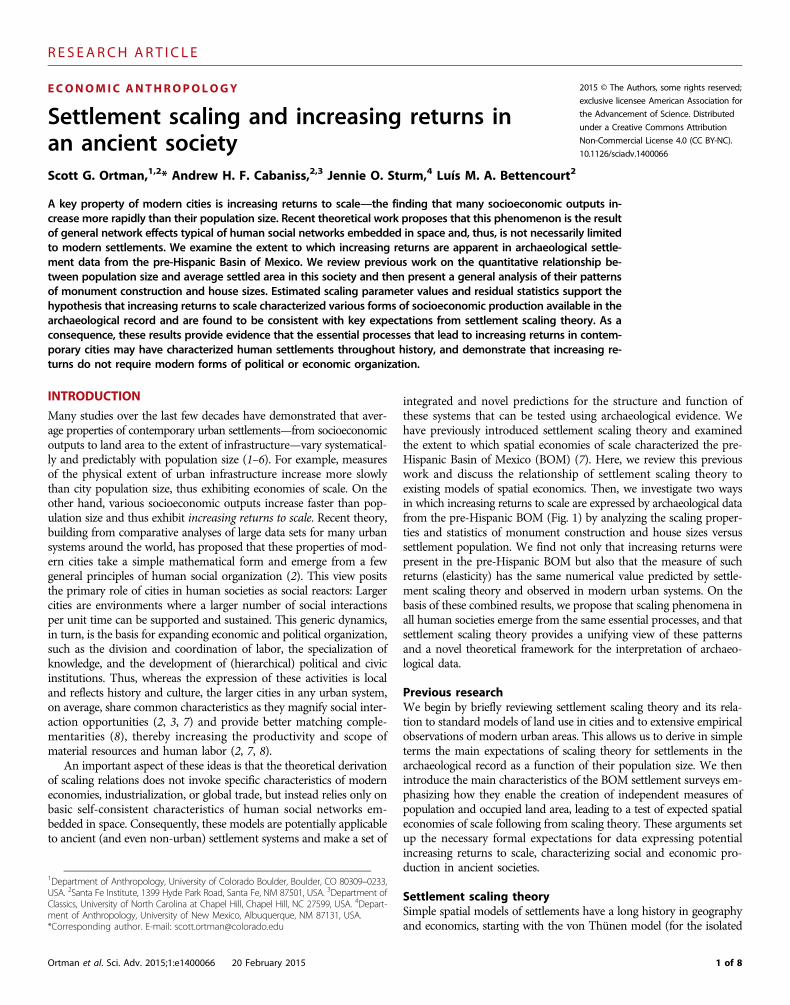
Fig. 1. The BOM. (A) Location within Mexico. (B) Settlements dating to the Formative period (outlineshows surveyed area; circle size is proportional to population; colors denote elevation; gray area shows
the extent of Mexico City in 1964). Today, settlement covers the entire basin, and the lake has beendrained. See the Supplementary Materials for image sources.2 of 8
R E S EARCH ART I C L E
expected socioeconomic output of a settlement Y, relative to others, bymultiplying the per capita benefit of interaction by the population, Y =yN = ga0lN
2/A, and then substituting the relation for the infrastruc-tural area An for A. This simplifies to Y = GN2/An ∼ N2/N5/6 ∼ N7/6,where G = ga0l. This expectation is consistent with observations acrossmany contemporary urban systems (2), and its test in the context ofarchaeology is the focus of the new work presented in this paper.
An important feature of these models is that their assumptions andinput parameters are very general and are not specific to modern po-litical or economic organization. Exponents are “universal” because theyare set by the congruence of the geometries of spatial and social net-works, under the assumption of an equilibrium between centripetalsocial interactions and centrifugal costs (2, 9), as well as the require-ment that such arrangements stay open-ended relative to settlementsize (2). Simple elaborations of these arguments further derive ex-pected patterns of professional diversity (division of labor) (12), laborproductivity (13), and urban area production (14) that are all con-sistent with empirical evidence from modern cities.
Population and settled areaThe population-area scaling relations discussed above apply to settle-ments for which it is reasonable to model the settled area as the con-tainer within which the resident population interacts on a regularbasis. It proposes that such settlements tend to grow in ways that bal-ance the costs of moving within the settlement with the benefits of theresulting social interactions. Thus, settlements whose spatial arrange-ments balance these costs and benefits should exhibit a specific andconsistent overall average relationship between the resident populationand settled area. Specifically, settlement scaling theory predicts that theexponent relating population to settled area for “interaction container”settlements should fall in the range between 2/3 and 5/6, with thisexponent being closer to 2/3 among small, amorphous settlementsand closer to 5/6 among larger, networked settlements. It also suggeststhe area taken up by an individual in the smallest such settlementsderives primarily from travel costs (walking, in this context) and theaverage (energetic) benefit of social interactions. Technologies that re-duce transportation costs or increase the effectiveness of interactionshould increase this baseline area, but factors that influence the rateof energy capture by primary producers should not. This is becausethe movement and exchange of agricultural produce provide a strongerconstraint on energy flows in social networks than agricultural pro-duction itself. Thus, our models predict that the prefactor of thescaling relation between population and settled area should be respon-
Ortman et al. Sci. Adv. 2015;1:e1400066 20 February 2015
sive to changes in within-settlement transport technology, but not tochanges in agricultural productivity.
In (7), we tested these expectations by comparing the populationsand settled areas of BOM settlements dating from four pre-Hispaniccultural periods. We now briefly describe these periods and some ofthe key characteristics of the surveys. The Formative period (1150 BCEto 150 CE) saw the beginnings of detectable settlements and the rise oflocal polities; the Classic period (150 to 650 CE), the political and ec-onomic dominance of Teotihuacan (N ≈ 100,000); the Toltec period(650 to 1200 CE), the formation of a number of small competitivepolities; and the Aztec period (1200 to 1520 CE), the unification ofthese into an empire centered on Tenochtitlán (N ≈ 200,000) thatwas in place at the time of the Spanish conquest. We also comparedtwo size classes corresponding to “amorphous” (N < 5000) and net-worked (N ≥ 5000) settlements and 1960 census data from the samearea. For details of our data selection and grouping criteria, see (7).The key characteristic of the BOM archaeological surveys that allowedus to assess the population-area relationship was that it estimated pop-ulation densities through potsherd densities according to a gradedscale. In (7), we performed several statistical tests of the independenceof this measure from total area, and of the correlation of the resultingpopulation estimates with more direct dwelling counts, where availa-ble (see also Materials and Methods).
Portions of our previous results, updated to take a few minor dataedits into account, are presented in Table 1. These results show thatthe exponent of the average scaling relation lies within the interval2/3 ≤ a ≤ 5/6 for each of the four major cultural periods. They alsoillustrate the transition from 2/3 to 5/6 for amorphous versus net-worked settlements predicted by our theory. Finally, they show thatthere is no clear evidence for change in the prefactor of the averagescaling relation across pre-Hispanic periods, despite significant changesin maximum agricultural yields. However, we also find that the pre-factor for the 1960 data is significantly larger than those observedacross pre-Hispanic periods, consistent with the major innovationsin transportation technology, and other contextual changes, of morerecent times.
RESULTS
We now show that, in addition to spatial economies of scale, increas-ing returns to scale are also apparent in the BOM survey data. First,we compare the populations and time periods of political units with
Table 1. Population-area scaling analysis results. The yields (kg/maize per hectare) of the most productive agricultural strategies for the pre-Hispanic periods are as follows: Formative, 700; Classic and Toltec, 1400; and Aztec, 3000 (28). CI, confidence interval.
Group
Sites a (ha) 95% CI a 95% CI r2Formative (1150 BCE to 150 CE)
230 0.195 0.160–0.238 0.711 0.673–0.749 0.855Classic (150–650 CE)
272 0.221 0.174–0.279 0.632 0.583–0.681 0.707Toltec (650–1200 CE)
484 0.210 0.180–0.244 0.718 0.684–0.753 0.777Aztec (1200–1520 CE)
546 0.177 0.156–0.201 0.764 0.734–0.793 0.8301960 Census
181 0.445 0.250–0.945 0.641 0.552–0.729 0.532Amorphous (N < 5000)
1510 0.237 0.217–0.259 0.671 0.651–0.691 0.741Networked (N ≥ 5000)
22 0.109 0.009–1.303 0.853 0.598–1.109 0.7093 of 8
R E S EARCH ART I C L E
public monument volumes to illustrate that larger political unitsproduced such structures at faster rates per capita. Second, we com-pare settlement populations with domestic mound areas and find thathouses in more populous settlements were larger on average. In bothcases, we observe scaling exponent values that are statistically in-distinguishable from those observed in modern urban systems andthat are consistent with quantitative predictions of settlement scalingtheory (2, 7).
Polity population and monument constructionPre-Hispanic Mesoamerican societies are well known for their mon-umental architecture, especially pyramids, administrative palaces, andplaza-focused buildings. Several factors allow us to treat the total vol-ume of public monuments in administrative and ceremonial centersas a measure of the total production of corvée labor pools drawn fromthe subject population over a period of time (see the SupplementaryMaterials for details). Given these linking arguments, settlementscaling theory predicts that average public monument constructionrates should be proportional to the population of subject settlementsto the 7/6 power, or more formally Y = G N2/An ∼ N2/N5/6 ∼ N7/6.
In the Supplementary Materials, we provide a detailed account ofour procedures for estimating the volumes of civic-ceremonial struc-tures and the size of the subject populations that contributed labor tothese monuments during different cultural periods. Essentially, wecombine archaeological studies of political organization and correla-tions between BOM survey data and ethnohistoric sources to creategroups of settlements, populations, and monuments for specific polit-ical units and archaeological periods (15–21). The resulting data set ispresented in table S2. These data are insufficient for a detailed time-series analysis, but the average scaling relation between political unitpopulation and public monument construction rates (total volume/years in period) across all periods (Table 2 and Fig. 2A) indicates thatthe exponent of this relation 1 + d ~ 7/6, as predicted by theory. Theseresults suggest that larger corvée labor groups generally produced moreper person and per unit time than smaller groups, with the relative de-gree of benefit numerically identical to that observed for socioeconomicrates in modern urban systems (2, 3).
It is also apparent in Fig. 2A that political units from differentperiods follow essentially the same scaling relation, characterized bya single prefactor representing the baseline productivity of an individ-ual [that is, Y(N→1)]. In the Supplementary Materials, we show thatthere is no evidence for change in scaling parameters through time.Specifically, we show in table S5A that the null hypothesis of nochange in scaling parameters through time is far more likely thanthe alternative. This in turn suggests that there was little change inthe technology and energetics of public monument construction overtime. As a result, the remarkable concentrations of public monuments
Ortman et al. Sci. Adv. 2015;1:e1400066 20 February 2015
in political capitals can be attributed to the populations these autho-rities regulated and the returns to scale associated with the resultingcorvée labor forces.
In analyzing the data this way, we do not mean to suggest thatthere was no variation in the annual labor tax, the proportion of
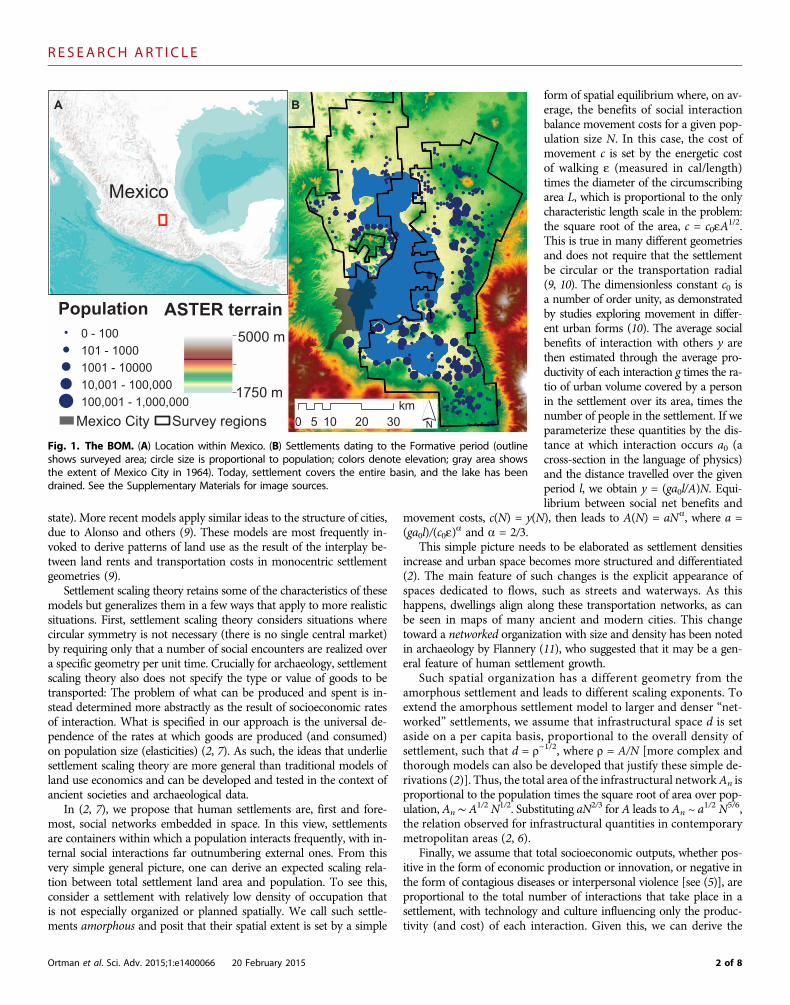
Table 2. Estimated scaling parameters for socioeconomic outputs with population. For the first analysis, the independent variable is the pop-ulation of the political unit; for all others, the independent variable is the settlement population.
Dependent variable
Sample Prefactor 95% CI Exponent 95% CI r2Civic mound volume/year
48 Y0 = 0.0021 0.0006–0.0070 1 + d = 1.177 1.028–1.327 0.852Domestic-mound area (m2)
80 y0 = 168.6 93.3–304.8 d = 0.190 0.083–0.298 0.863Y = m * N
80 Y0 = 168.6 93.3–304.8 1 + d = 1.190 1.083–1.298 0.863G = m * A/N
80 G0 = 28.71 12.88–63.97 g = 0.037 −0.108 to 0.182 0.003A
B
Fig. 2. Super-linear scaling of socioeconomic rates with population.(A) Political unit population versus public monument construction rates.
(B) Settlement population versus total domestic mound area. Symbols de-note time periods, solid lines show power law fits from ordinary least-squares(OLS) regression of the log-transformed data, and dashed lines representproportionate (linear) scaling. Inset shows the independence of averageG on N, where G = A/N * (mean domestic mound area) (see also Table 2).4 of 8
R E S EARCH ART I C L E
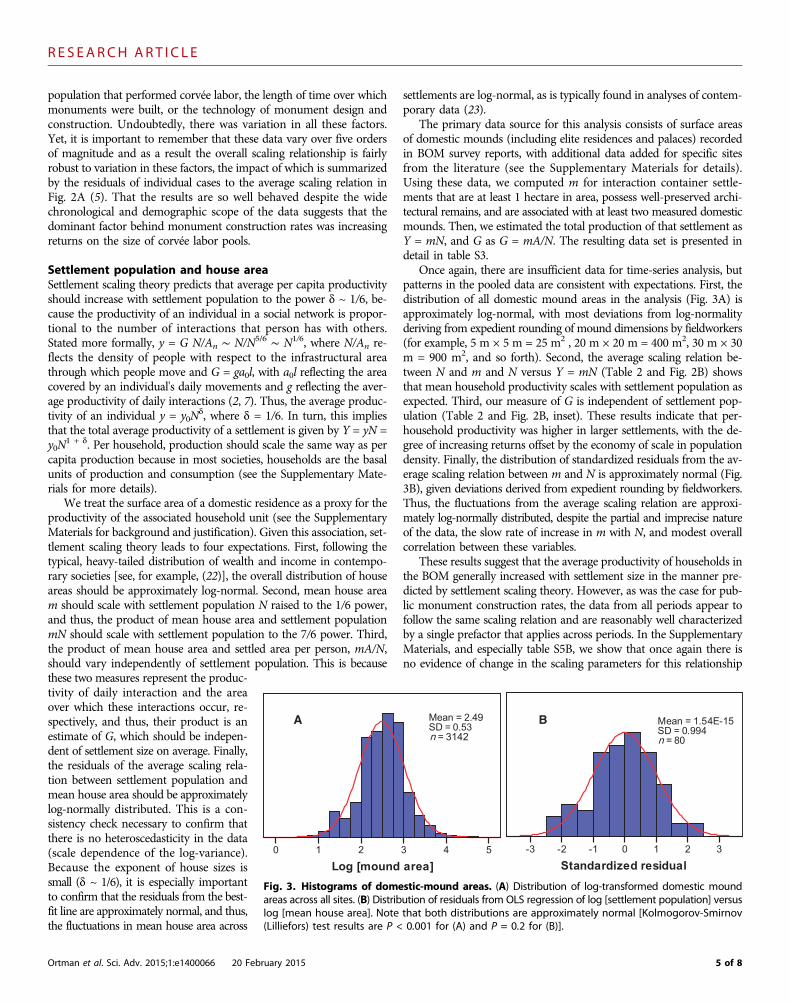
population that performed corvée labor, the length of time over whichmonuments were built, or the technology of monument design andconstruction. Undoubtedly, there was variation in all these factors.Yet, it is important to remember that these data vary over five ordersof magnitude and as a result the overall scaling relationship is fairlyrobust to variation in these factors, the impact of which is summarizedby the residuals of individual cases to the average scaling relation inFig. 2A (5). That the results are so well behaved despite the widechronological and demographic scope of the data suggests that thedominant factor behind monument construction rates was increasingreturns on the size of corvée labor pools.
Settlement population and house areaSettlement scaling theory predicts that average per capita productivityshould increase with settlement population to the power d ~ 1/6, be-cause the productivity of an individual in a social network is propor-tional to the number of interactions that person has with others.Stated more formally, y = G N/An ∼ N/N5/6 ∼ N1/6, where N/An re-flects the density of people with respect to the infrastructural areathrough which people move and G = ga0l, with a0l reflecting the areacovered by an individual's daily movements and g reflecting the aver-age productivity of daily interactions (2, 7). Thus, the average produc-tivity of an individual y = y0N
d, where d = 1/6. In turn, this impliesthat the total average productivity of a settlement is given by Y = yN =y0N
1 + d. Per household, production should scale the same way as percapita production because in most societies, households are the basalunits of production and consumption (see the Supplementary Mate-rials for more details).
We treat the surface area of a domestic residence as a proxy for theproductivity of the associated household unit (see the SupplementaryMaterials for background and justification). Given this association, set-tlement scaling theory leads to four expectations. First, following thetypical, heavy-tailed distribution of wealth and income in contempo-rary societies [see, for example, (22)], the overall distribution of houseareas should be approximately log-normal. Second, mean house aream should scale with settlement population N raised to the 1/6 power,and thus, the product of mean house area and settlement populationmN should scale with settlement population to the 7/6 power. Third,the product of mean house area and settled area per person, mA/N,should vary independently of settlement population. This is because
these two measures represent the produc-tivity of daily interaction and the areaover which these interactions occur, re-spectively, and thus, their product is anestimate of G, which should be indepen-dent of settlement size on average. Finally,the residuals of the average scaling rela-tion between settlement population andmean house area should be approximatelylog-normally distributed. This is a con-sistency check necessary to confirm thatthere is no heteroscedasticity in the data(scale dependence of the log-variance).Because the exponent of house sizes issmall (d ~ 1/6), it is especially importantto confirm that the residuals from the best-fit line are approximately normal, and thus,the fluctuations in mean house area acrossOrtman et al. Sci. Adv. 2015;1:e1400066 20 February 2015
settlements are log-normal, as is typically found in analyses of contem-porary data (23).
The primary data source for this analysis consists of surface areasof domestic mounds (including elite residences and palaces) recordedin BOM survey reports, with additional data added for specific sitesfrom the literature (see the Supplementary Materials for details).Using these data, we computed m for interaction container settle-ments that are at least 1 hectare in area, possess well-preserved archi-tectural remains, and are associated with at least two measured domesticmounds. Then, we estimated the total production of that settlement asY = mN, and G as G = mA/N. The resulting data set is presented indetail in table S3.
Once again, there are insufficient data for time-series analysis, butpatterns in the pooled data are consistent with expectations. First, thedistribution of all domestic mound areas in the analysis (Fig. 3A) isapproximately log-normal, with most deviations from log-normalityderiving from expedient rounding of mound dimensions by fieldworkers(for example, 5 m × 5 m = 25 m2 , 20 m × 20 m = 400 m2, 30 m × 30m = 900 m2, and so forth). Second, the average scaling relation be-tween N and m and N versus Y = mN (Table 2 and Fig. 2B) showsthat mean household productivity scales with settlement population asexpected. Third, our measure of G is independent of settlement pop-ulation (Table 2 and Fig. 2B, inset). These results indicate that per-household productivity was higher in larger settlements, with the de-gree of increasing returns offset by the economy of scale in populationdensity. Finally, the distribution of standardized residuals from the av-erage scaling relation between m and N is approximately normal (Fig.3B), given deviations derived from expedient rounding by fieldworkers.Thus, the fluctuations from the average scaling relation are approxi-mately log-normally distributed, despite the partial and imprecise natureof the data, the slow rate of increase in m with N, and modest overallcorrelation between these variables.
These results suggest that the average productivity of households inthe BOM generally increased with settlement size in the manner pre-dicted by settlement scaling theory. However, as was the case for pub-lic monument construction rates, the data from all periods appear tofollow the same scaling relation and are reasonably well characterizedby a single prefactor that applies across periods. In the SupplementaryMaterials, and especially table S5B, we show that once again there isno evidence of change in the scaling parameters for this relationship
A B
Fig. 3. Histograms of domestic-mound areas. (A) Distribution of log-transformed domestic moundareas across all sites. (B) Distribution of residuals from OLS regression of log [settlement population] versus
log [mean house area]. Note that both distributions are approximately normal [Kolmogorov-Smirnov(Lilliefors) test results are P < 0.001 for (A) and P = 0.2 for (B)].5 of 8
R E S EARCH ART I C L E
through time. This suggests that the baseline productivity of individ-uals Y(N = 1) = y0 did not change appreciably over time. Yet, theseresults also suggest that the average wealth of households could havevaried as a result of changes in the distribution of settlement sizes dur-ing different periods. In this way, the material conditions of life wouldhave improved for many households, even if there were no significantimprovements in baseline productivity. We consider this issue in moredetail below.
DISCUSSION
We have outlined an approach to the analysis of ancient societiesrooted in complex systems concepts and applied this framework todata from the pre-Hispanic BOM to investigate the degree to whichpatterns of contemporary urban scaling also characterized this ancientsociety. We are not the first to notice the fundamental importance ofsettlement population in structuring many observable properties ofhuman societies [see, for example, (24–27)]. What we have attemptedto do is extend this work by proposing that the exponents that de-scribe the average relative effects of settlement population for variousaggregate socioeconomic measures take specific numerical values, andthese values can be derived from models that frame human settle-ments as social reactors embedded in space. In other words, we donot merely suggest that there are power-law relationships betweenpopulation and a variety of other measures across settlements in a sys-tem, but we predict that the exponents of these relationships shouldhave specific values. Further, we suggest that the prefactors of averagescaling relations are given by specific combinations of additional param-eters and, thus, that it is possible to infer the values of combinations ofthese parameters from empirical estimates of these prefactors. This pro-vides a general testable framework in the context of archaeology char-acterized by a set of key predictions for how settled space, population,infrastructure, and rates of socioeconomic production are all interdepen-dent. In the present article, we were able to show not only how archae-ological observables characterizing social productivity express increasingreturns to scale in the settlements of the BOM but also how such rela-tions relate, as predicted by theory, to patterns of spatial settlement andtheir statistics.
The analysis developed here requires a number of assumptions,linking arguments and data selection criteria that should be investigatedfurther. It is also important to recognize that, even if the scalingphenomena reported here prove to be universal, scaling relationshipsmay not be universally observable due to the nature of archaeologicaland historical data. Nevertheless, settlement scaling theory should ap-ply to any society due to its basic underlying assumptions, and theBOM surveys represent one of the most systematic documentationsof an ancient non-Western civilization ever accomplished. Thus, thefact that the archaeological record of this society can be shown to ex-hibit the same quantitative relationships between population, infra-structure, and socioeconomic outputs predicted by theory andobserved in modern urban systems is, in our view, a striking andexciting result.
Settlement scaling theory proposes that one can use a variety ofaggregate quantities as measures of infrastructure, socioeconomic out-puts, social network connectivity, and their evolution over time in anysociety. In this case, we have shown that in the pre-Hispanic BOM,larger population aggregates used space more efficiently, produced
Ortman et al. Sci. Adv. 2015;1:e1400066 20 February 2015
public goods more rapidly, and were more productive per household.Further, the congruence of these results with theory suggests that thebenefits of scale across all these domains ultimately derive from theproperties of strongly interacting social networks embedded in struc-tured spaces. This reinforces our view that human settlements of alltimes and places function in the same way by manifesting stronglyinteracting social networks, thus magnifying rates of social interactionand increasing the productivity and scope of material resources, hu-man labor, and knowledge (2, 7, 13).
In addition to the constancy of scaling exponents, our analysessuggest a, perhaps surprising, consistency in scaling prefactors acrosscultural periods. Scaling theory predicts that scaling prefactors shouldchange in cases where transport costs or the average productivity ofindividual interactions changes over time. (In contemporary societies,rates of change are very fast, of the order of a few percent a year.) Suchchanges could arise from technological innovations such as beasts ofburden or wheeled vehicles, changes in information technology suchas currency or literacy, or any number of factors that facilitate the flowof goods and services through a social network. The system-leveleffects of such innovations should be perceptible through scalinganalyses of quantities measured before and after their appearance,as our comparison of the pre-Hispanic and 1960 census data illustrates.Given this, the fact that such changes are not evident across the pre-Hispanic periods suggests that one of the two sources of modern eco-nomic growth—increases in baseline productivity—was limited in thissociety (14). Agricultural production per unit of land clearly improvedover time (16, 28), and this had a significant impact on the maximalsize of settlements and their spatial distribution, but the overall produc-tivity of an individual working alone appears to have been relativelyconstant. As a result, any changes in per capita economic output overtime are most likely traceable to changes in the size and density ofsocial networks in larger settlements. This may have affected aver-age household “income” during periods when sociocultural and po-litical institutions enabled larger fractions of the population to livein larger settlements, but changes in the material conditions of lifewould have depended on the economies and returns associatedwith social interaction as opposed to increases in essential laborproductivity. This is potentially a striking and important realizationwith wide-ranging implications for our understanding of humancivilization.
If, in fact, larger social networks are intrinsically more efficient andproductive, there is at least the potential for the majority of individualsin a society to benefit from increases in their scale and scope. Whetherindividuals actually do depends on the way in which the system-levelbenefits of scale are distributed among the individuals comprisingthese networks. Our analyses suggest that the material conditions oflife did improve for that fraction of the BOM population that lived inlarger settlements, but the baseline area per person, and roofed spaceper person, did not change much over time in small settlements de-voted primarily to food production. This suggests that there was littlechange in the conditions of life for primary producers in this society,regardless of the way the benefits of scale were distributed among themore urbanized population. During periods of larger-scale social co-ordination, the BOM population was more productive and more effi-cient overall, but disparities in production (income) were high in allperiods, with 40 to 50% of total house area encompassed by the topdecile of households. This is comparable to levels of income disparityseen in the contemporary United States [see table S4 and (29)].
6 of 8
R E S EARCH ART I C L E
The conclusion we draw from these findings is that the (latent)benefits of scale for human groups are universal and are likely respon-sible for the long-term increase in human group sizes worldwide (30),but there are fewer constraints on how these benefits are distributedamong individuals in groups. Thus, we suspect that one of the mostfundamental dynamics in early civilizations was the age-old tensionbetween the benefits of scale and the allocation of these benefits. Inthis particular case, it appears that reinvestment of surpluses towardinnovations that increased baseline productivity was quite rare, and thatthis choice limited intensive economic growth in the long run. It is alsoimportant to emphasize that we have focused on increasing returns toscale in economic production, but negative effects of intensified socialinteraction, such as contagious disease and violence, also increase super-linearly with population in contemporary urban systems [see (5)] andcan reduce the net benefit of social interactions encapsulated in theparameter g, or indeed destroy the necessary conditions for large-scalesettled sociality (2). One might expect the same to have occurred inancient societies, and future research could investigate this possibility.
The findings and suggestions for future research discussed in thispaper reinforce our view that the archaeological record presents a vastarchive of information on the determinants of socioeconomic devel-opment and that settlement scaling theory provides a useful frame-work for organizing various findings and examining potentiallyuniversal patterns in these processes while also allowing some degreeof historical contingency. We thus believe that settlement scaling the-ory offers a means through which archaeology can make a broadercontribution to the social sciences and perhaps even to contemporary pol-icy (30–32).
MATERIALS AND METHODS
Data sourcesWe use settlement data from archaeological surface surveys conductedin the BOM, the epicenter of pre-Hispanic Mesoamerican civilization.These surveys took place between 1960 and 1975, before the destruc-tion of many sites by the expansion of modern Mexico City. Figure1 shows the location of our study area, the surveyed areas relative toMexico City when the surveys took place, and the distribution of pre-Hispanic settlements for the Formative period. We compiled a data-base of information for some 4000 archaeological sites resulting fromthese surveys, beginning with existing digital compilations (33, 34) andadding information from the original survey reports (15, 35–42). Wealso added data for a few important sites, some of which were outsidethe survey area, based on information in the literature (43–48). In ad-dition, we tabulated the dimensions of civic-ceremonial mounds re-ported in the survey volumes or in other sources (16, 44, 45, 49, 50),and we associated Aztec-period settlements with native political unitsbased on ethnohistoric information summarized by Hodge and others(17–19). The resulting database contains information on the settledarea, population, time period, location, functional classification, po-litical affiliations, and architectural remains of every recorded settle-ment. For additional details and background on this database, see (7)and the Supplementary Materials.
Site population and parameter estimationA potential problem with the BOM survey data is that the methodused to estimate population for most sites was not independent of
Ortman et al. Sci. Adv. 2015;1:e1400066 20 February 2015
the settled area (16, 35). This method involved (i) determining the ex-tent of the surface artifact scatter for each period of occupation bymapping its boundary on low-altitude aerial photos, (ii) assigning eachscatter to one of a series of artifact density classes based on the ob-served potsherd density within the scatter, and (iii) multiplying theextent of the scatter for each period by a population density derivedfrom associations of surface potsherd densities with population den-sities of various settlement types in 16th and 20th century records fromthe area. This method ensures that there will be a relationship betweenthe settled area and settlement population. In (7), we show that theestimates produced by this area-density method are nearly identicalto those produced using house-counting methods that rely on thecount or surface area of residential mounds at well-preserved sitesin lieu of settled area. Thus, there is a basis for viewing the BOMpopulation estimates as reasonably accurate in both a relative andan absolute sense. In all analyses, we use OLS regression of the log-transformed data to estimate scaling exponents, prefactors, and confi-dence intervals for these parameters.
SUPPLEMENTARY MATERIALS
Supplementary material for this article is available at http://advances.sciencemag.org/cgi/content/full/1/1/e1400066/DC1Materials and MethodsFig. S1. The Basin of Mexico.Table S1. Civic-ceremonial structures at Tenochtitlan-Tlatelolco.Table S2. Civic-ceremonial architecture volumes and associated subject populations.Table S3. Mean domestic-mound areas and settlement populations.Table S4. Domestic mound area distributions in the Basin of Mexico through time.Table S5. Within-period scaling analyses.
REFERENCES AND NOTES
1. L. Sveikauskas, The productivity of cities. Q. J. Econ. 89, 393–413 (1975).2. L. M. A. Bettencourt, The origins of scaling in cities. Science 340, 1438–1441 (2013).3. L. M. A. Bettencourt, J. Lobo, D. Helbing, C. Kühnert, G. B. West, Growth, innovation, scaling,
and the pace of life of cities. Proc. Natl. Acad. Sci. U.S.A. 104, 7301–7306 (2007).4. L. M. A. Bettencourt, J. Lobo, D. Strumsky, Invention in the city: Increasing returns to pa-
tenting as a scaling function of metropolitan size. Res. Policy 36, 107–120 (2007).5. L. M. A. Bettencourt, J. Lobo, D. Strumsky, G. B. West, Urban scaling and its deviations:
Revealing the structure of wealth, innovation and crime across cities. PLOS One 5,e13541 (2010).
6. H. Samaniego, M. E. Moses, Cities as organisms: Allometric scaling of urban road networks.J. Transp. Land Use 1, 2139 (2009).
7. S. G. Ortman, A. H. F. Cabaniss, J. O. Sturm, L. M. A. Bettencourt, The pre-history of urbanscaling. PLOS One 9, e87902 (2014).
8. R. W. Helsley, W. C. Strange, Matching and agglomeration economies in a system of cities.Reg. Sci. Urban Econ. 20, 189–212 (1990).
9. M. Fujita, P. Krugman, A. J. Venables, The Spatial Economy: Cities, Regions, and InternationalTrade (MIT Press, Cambridge, MA, 2001).
10. P. Haggett, R. J. Chorley, Network Analysis in Geography (Edward Arnold, London, 1969).11. K. V. Flannery, The origins of the village revisited: From nuclear to extended households.
Am. Antiq. 67, 417–433 (2002).12. L. M. A. Bettencourt, Impact of changing technology on the evolution of complex infor-
mational networks. Proc. IEEE 102, 1878–1891 (2014).13. L. M. A. Bettencourt, H. Samaniego, H. Youn, Professional diversity and the productivity of
cities. Sci. Rep. 4, Article number, 5393 (2014).14. J. Lobo, L. M. A. Bettencourt, D. Strumsky, G. B. West, Urban scaling and the production
function for cities. PLOS One 8, e58407 (2013).15. J. R. Parsons, E. Brumfiel, M. Parsons, D. Wilson, Prehispanic Settlement Patterns in the Southern
Valley of Mexico: The Chalco-Xochimilco Region (Museum of Anthropology, University of Mich-igan, Ann Arbor, MI, 1982).
16. W. T. Sanders, J. R. Parsons, R. S. Santley, The Basin of Mexico: Ecological Processes in theEvolution of a Civilization (Academic Press, New York, 1979).
7 of 8
R E S EARCH ART I C L E
17. M. G. Hodge, Polities composing the Aztec empire’s core, in Economies and Polities in theAztec Realm, M. G. Hodge, M. E. Smith, Eds. (Institute for Mesoamerican Studies, Albany,NY, 1994), pp. 43–72.
18. M. G. Hodge, Political organization of the central provinces, in Aztec Imperial Strategies(Dumbarton Oaks, Washington, DC, 1996), pp. 17–46.
19. M. G. Hodge, When is a city-state? Archaeological measures of Aztec city-states and Azteccity-state systems, in The Archaeology of City-States: Cross-Cultural Approaches, D. L. Nichols,T. H. Charlton, Eds. (Smithsonian Institution Press, Washington, DC, 1997), pp. 209–228.
20. R. E. Blanton, S. A. Kowalewski, G. M. Feinman, J. Appel, Ancient Mesoamerica: A Comparisonof Change in Three Regions (Cambridge University Press, Cambridge, 1993).
21. T. H. Charleton, D. L. Nichols, Diachronic studies of city-states: Permutations on a theme—Central Mexico from 1700 B.C. to A.D. 1600, in The Archaeology of City-States: Cross-CulturalApproaches, D. L. Nichols, T. H. Charleton, Eds. (Smithsonian Institution Press, Washington,DC, 1997), pp. 169–208.
22. E. W. Montroll, M. F. Schlesinger, On 1/f noise and other distributions with long tails. Proc. Natl.Acad. Sci. U.S.A. 79, 3380–3383 (1982).
23. A. Gomez-Lievano, H. Youn, L. M. A. Bettencourt, The statistics of urban scaling and theirconnection to Zipf's law. PLOS One 7, e40393 (2012).
24. R. L. Carneiro, On the relationship between size of population and complexity of socialorganization. Southwest. J. Anthropol. 23, 234–243 (1967).
25. R. L. Carneiro, The transition from quantity to quality: A neglected causal mechanism inaccounting for social evolution. Proc. Natl. Acad. Sci. U.S.A. 97, 12926–12931 (2000).
26. G. Chick, Cultural complexity: The concept and its measurement. Cross Cult. Res. 31, 275–307(1997).
27. R. Naroll, A preliminary index of social development. Am. Anthropol. 56, 687–715 (1956).28. W. T. Sanders, The agricultural history of the basin of Mexico, in The Valley of Mexico: Studies in
Pre-Hispanic Ecology and Society, E. R. Wolf, Ed. (University of New Mexico Press, Albuquerque,NM, 1976), pp. 101–159.
29. T. Picketty, E. Saez, Inequality in the long run. Science 344, 838–843 (2014).30. I. Morris, Why the West Rules—For Now (Farrar, Strauss and Giroux, New York, 2010).31. M. E. Smith, G. M. Feinman, R. D. Drennan, T. Earle, I. Morris, Archaeology as a social science.
Proc. Natl. Acad. Sci. U.S.A. 109, 7617–7621 (2012).32. K. W. Kintigh, J. H. Altschul, M. C. Beaudry, R. D. Drennan, A. P. Kinzig, T. A. Kohler, W. Fredrick
Limp, Herbert D. G. Maschner, W. K. Michener, T. R. Pauketat, P. Peregrine, J. A. Sabloff,T. J. Wilkinson, H. T. Wright, M. A. Zeder, Grand challenges for archaeology. Am. Antiq.79, 5–24 (2014).
33. J. R. Parsons, K. W. Kintigh, S. Gregg, Archaeological Settlement Pattern Data from theChalco, Xochimilco, Ixtapalapa, Texcoco and Zumpango Regions, Mexico (Museum of An-thropology, University of Michigan, Ann Arbor, MI, 1983).
34. L. J. Gorenflo, W. T. Sanders, Archaeological Settlement Pattern Data from the Cuautitlan,Temascalapa, and Teotihuacan Regions, Mexico (The Pennsylvania State University, StateCollege, PA, 2007).
35. J. R. Parsons, Prehistoric Settlement Patterns in the Texcoco Region, Mexico (Museum of An-thropology, University of Michigan, Ann Arbor, MI, 1971).
36. J. R. Parsons, Prehispanic Settlement Patterns in the Northwestern Valley of Mexico: The ZumpangoRegion (Museum of Anthropology, University of Michigan, Ann Arbor, MI, 2008).
37. R. E. Blanton, Prehispanic Settlement Patterns of the Ixtapalapa Peninsula Region, Mexico(The Pennsylvania State University, State College, PA, 1972).
38. W. T. Sanders, L. J. Gorenflo, Prehispanic Settlement Patterns in the Cuautitlan Region, Mexico(The Pennsylvania State University, State College, PA, 2007).
Ortman et al. Sci. Adv. 2015;1:e1400066 20 February 2015
39. W. T. Sanders, The Teotihuacan Valley Project Final Report—Volume 2: The Formative PeriodOccupation of the Valley, Part 1: Texts and Tables (The Pennsylvania State University, StateCollege, PA, 1975).
40. S. T. Evans, W. T. Sanders, The Teotihuacan Valley Project Final Report Volume 5: The AztecPeriod Occupation of the Valley, Part 1—Natural Environment, 20th Century Occupation,Survey Methodology, and Site Descriptions (The Pennsylvania State University, State College,PA, 2000).
41. W. T. Sanders, The Teotihuacan Valley Project Final Report—Volume 4: The Toltec PeriodOccupation of the Valley, Part 2: Surface Survey and Special Studies (The Pennsylvania StateUniversity, State College, PA, 1987).
42. W. T. Sanders, The Teotihuacan Valley Project Final Report—Volume 3: The Teotihuacan PeriodOccupation of the Valley, Part 3: The Surface Survey (The Pennsylvania State University, StateCollege, PA, 1996).
43. R. Millon, R. B. Drewitt, G. L. Cowgill, The Teotihuacan Map (University of Texas Press, Austin, TX,1973).
44. M. E. Smith, Aztec City-State Capitals (University Press of Florida, Gainesville, FL, 2008).45. W. T. Sanders, Tenochtitlan in 1519: A pre-industrial megalopolis, in The Aztec World, E. Brumfiel,
G. Feinman, Eds. (Harry N. Abrams, New York, 2008), pp. 67–86.46. K. G. Hirth, Ancient Urbanism at Xochicalco: The Evolution and Organization of a Pre-Hispanic
Society (University of Utah Press, Salt Lake City, UT, 2000).47. E. Calnek, Tenochtitlan-Tlatelolco. The natural history of a city, in Urbanism in Mesoamerica,
vol. 1, W. T. Sanders, A. G. Mastache, R. H. Cobean, Eds. (Instituto Nacional de Antropologicaand Pennsylvania State University, State College, PA, 2003), pp. 149–202.
48. L. Manzanilla, Corporate groups and domestic activities at Teotihuacan. Latin Am. Antiq. 7,228–246 (1996).
49. T. Murakami, Power relations and urban landscape formation: A study of construction laborand resources at Teotihuacan, thesis, Arizona State University 2010).
50. M. Aguilar-Moreno, Handbook to Life in the Aztec World (Oxford University Press, New York,2005).
Acknowledgments: We thank G. Cowgill, J. Lobo, J. Parsons, I. Robertson, E. Rupley, J. Sabloff,and M. Smith for discussions, and two anonymous reviewers for many helpful comments onan earlier draft. Funding: This research was partially supported by the John Templeton Foun-dation (grant 15705), the Army Research Office Minerva Program (grant W911NF1210097), theBill and Melinda Gates Foundation (grant OPP1076282), the National Science Foundation(grant 1005075), and the Santa Fe Institute Omidyar Postdoctoral Fellows program. Authorcontributions: S.G.O. and L.M.A.B. designed the research; S.G.O., J.O.S., and A.H.F.C. compileddata; S.G.O., L.M.A.B., and A.H.F.C. performed analysis; S.G.O., L.M.A.B., A.H.F.C., and J.O.S. wrotethe paper. Competing interests: The authors declare that they have no competing interests.Data and materials availability: All data analyzed in this paper are available either within theSupplementary Materials or at www.tdar.org.
Submitted 31 October 2014Accepted 1 January 2015Published 20 February 201510.1126/sciadv.1400066
Citation: S. G. Ortman et al., Settlement scaling and increasing returns in an ancient society.Sci. Adv. 1, e1400066 (2015).
8 of 8
www.advances.sciencemag.org/cgi/content/full/1/1/e1400066/DC1
Supplementary Materials for
Settlement scaling and increasing returns in an ancient society
Scott G. Ortman,* Andrew H. F. Cabaniss, Jennie O. Sturm, Luís M. A. Bettencourt
*Corresponding author. E-mail: [email protected]
Published 20 February 2015, Sci. Adv. 1, e1400066 (2015)
DOI: 10.1126/sciadv.1400066 This PDF file includes:
Materials and Methods Fig. S1. The Basin of Mexico. Table S1. Civic-ceremonial structures at Tenochtitlan-Tlatelolco. Table S2. Civic-ceremonial architecture volumes and associated subject populations. Table S3. Mean domestic-mound areas and settlement populations. Table S4. Domestic mound area distributions in the Basin of Mexico through time. Table S5. Within-period scaling analyses.

1
Supplementary Materials
Settlement Scaling and Increasing Returns in an Ancient Society
Scott G. Ortman Department of Anthropology
University of Colorado Boulder Boulder, CO 80309-0233
Andrew H. F. Cabaniss Department of Classics
University of North Carolina Chapel Hill Chapel Hill, NC 27599
Jennie O. Sturm
Department of Anthropology University of New Mexico Albuquerque, NM 87131
Luís M. A. Bettencourt
Santa Fe Institute 1399 Hyde Park Rd. Santa Fe, NM 87501
Data Sources and the BOM Survey 2
A. Population and Settled Area 4 B. Polity Population and Monument Construction 4 C. Settlement Population and House Area 7
Within-period results 12
References 13
Figure S1 16
Table S1 17
Table S2 17
Table S3 19
Table S4 21
Table S5 22
2
Materials and Methods
We examine scaling relations in the ancient world using settlement data from
archaeological surface surveys conducted in the Basin of Mexico (BOM), the epicenter of Pre-
Hispanic Mesoamerican civilization. These surveys took place between 1960 and 1975, prior to
the destruction of many sites by the expansion of modern Mexico City. Figures 1 and S1 show
the location of our study area, the surveyed areas relative to Mexico City when the surveys took
place, and the distribution of Pre-Hispanic settlements for two cultural periods. We compiled a
database of information for some 4,000 archaeological sites resulting from these surveys,
beginning with existing digital compilations (1, 2) and adding information from the original
survey reports (3-11). We also added data for a few important sites outside the surveyed area
(Cuicuilco, Tenochtitlán/Tlatelolco, Tenayuca, Xochicalco) and for Teotihuacan based on
information in the literature (12-17). In addition, we tabulated the dimensions of civic-
ceremonial mounds reported in the survey volumes or in other sources (13, 14, 18-20) and we
associated Aztec-period settlements with native political units based on ethno-historic
information summarized by Hodge and others (21-23). The resulting database contains
information on the settled area, population, time period, location, functional classification,
political affiliations, and architectural remains of every recorded settlement. For more details and
background on this database, see (24).
The BOM survey data have two great advantages for settlement scaling research. First,
surveyors recorded data across the entire range of settlement sizes, from the smallest farming
hamlets to the largest cities, in a common format. Second, the survey methods allowed the
population densities of settlements to vary. As a result, it is possible to examine scaling relations
across five orders of magnitude in settlement population in a settlement system that spanned the
3
urban-nonurban divide. However, a potential problem with the BOM survey data is that the
method used to estimate population for most sites was not independent of the settled area (3, 19).
This method involved: 1) determining the extent of the surface artifact scatter for each period of
occupation by mapping its boundary on low-altitude aerial photos; 2) assigning each scatter to
one of a series of artifact density classes based on the observed potsherd density within the
scatter; and 3) multiplying the extent of the scatter for each period by a population density
derived from associations of surface potsherd densities with population densities of various
settlement types in 16th and 20th century records from the area. This method ensures that there
will be a relationship between the settled area and settlement population. Fortunately, we have
previously shown that the estimates produced by this area-density method are nearly identical to
those produced using house-counting methods that do not rely upon settled area but are instead
based on the count or surface area of residential mounds at sites where such remains are well-
preserved (24). Thus, there is a sound basis for viewing the population estimates derived from
the BOM surveys as reasonably accurate in both a relative and an absolute sense.
The BOM surveys assigned remains dating to each archaeological phase at each
settlement to a separate site record. We assigned these records to one of four chronological
periods dating from initial colonization of the Basin up to the Spanish Conquest, following the
chronology in the most recent publications of these data (4, 7). The Formative period (1150
B.C.E.-150 C.E.) saw the beginnings of detectable settlements and the rise of local polities; the
Classic period (150-650 C.E.), the political and economic dominance of Teotihuacan (ca.
100,000 people); the Toltec period (650-1200 C.E.), the formation of a number of small
competitive polities; and the Aztec period (1200-1520 C.E.), the unification of these into an
empire centered on Tenochtitlán-Tlatelolco (ca. 200,000 people). Collectively, these four

4
chronological groups span more than three millennia and capture the development of an ancient
urban system that was independent of its old-world counterparts.
Population and Settled Area
Data Selection
BOM surveyors classified each site into a series of settlement types based on the spatial
extent, density, and character of the surface remains. Because our theory suggests population-
area scaling relations arise from the interactions of residents within settlements, this analysis
excludes site types that do not conform to the "interaction container" model, namely: 1) sites
lacking permanent residential populations, such as isolated ceremonial centers, quarries and salt
mounds; and 2) dispersed sites consisting of isolated residences interspersed with farmland. We
also exclude sites with settled areas less than 1 ha from this analysis due to limits in the precision
of the recorded data. Approximately 1,500 settlements in our database meet these criteria. The
resulting dataset is available at http://www.tdar.org. In addition, we tabulated the populations and
settled areas of BOM settlements in the 1960 census of the area to provide a point of modern
comparison (24).
Polity Population and Monument Construction
Linking arguments
Several factors make it possible to treat the total volume of public monuments in
administrative and ceremonial centers as a measure of the total production of the subject
population over a period of time. First, ethno-historic evidence suggests these monuments were
5
constructed primarily using corvée labor, a type of labor tax in which each household owed the
polity a certain number of days of labor per year (13, 22). Second, cross-sections of these
buildings indicate that their final volumes accumulated over a period of time, as new phases of
construction encased the existing structure (13, 18, 25). Finally, a recent study of the energetics
of monument construction at Teotihuacan found that as much as 85% of the total cost involved in
building these monuments derived from transporting earth and stone to the construction site (18).
As a result, it is reasonable to view public monument volumes as resulting from the piling of
earth and stone by subject populations over a period of time.
To relate public monuments to settlement scaling theory, several additional assumptions
are necessary. First, following ethno-historic records, we assume corvée labor forces had some
freedom to self-organize: “The building of the temples and the houses of the lords and public
works was always a common undertaking, and many people worked together with much
merriment . . . Each worked a little and did what he could, and no one hurried or mistreated him
for it . . . Thus they went about their work, cheerfully and harmoniously” (Zorita, in 13:127).
Such statements suggest the labor forces involved in monument construction were mixing
populations of the type that produce emergent scaling properties. Second, we assume labor
forces derived from the total populations subject to specific administrative centers. During
certain periods, the political organization of the BOM was characterized by multi-level
administrative and decision-making hierarchies (19, 21, 22, 26, 27). We assume the composition
of labor forces reflected this multi-tiered organization. For example, “building the Great Temple
in Tenochtitlán was organized by a division of labor based on regional state or provincial
affiliation. When this temple was being enlarged by Motecuhzoma I, Texcoco and the Aculhua
communities built the front, Tlacopan and the Tepaneca the back, Chalca the left side, and the
6
Xochimilca the right. The Otomi area furnished sand and the Tierra Caliente area supplied lime”
(22). Finally, we assume corvée labor forces represent a relatively consistent fraction of subject
populations (for example, all males within a certain age range), and that the sizes of the labor
force varied much more substantially than the average labor tax imposed by political authorities
during different archaeological periods.
Data Compilation
Many settlements with civic-ceremonial architecture were inhabited during multiple
periods. In such sites, BOM surveyors examined the types of potsherds on the tops of mounds, or
eroding out of the sides, to estimate periods of construction and use. We simply carried forward
these field judgments in this analysis. We also estimated the volumes of civic-ceremonial
structures by modeling them as rectilinear pyramids, cones, or rectilinear solids, depending on
the recorded dimensions. For rectilinear solids 𝑉 = 𝑙 × 𝑤 × ℎ; for pyramids and cones, when
ℎ > 1𝑚, 𝑉 = 2 3⁄ 𝑏ℎ, with 𝑏 = 𝑏𝑎𝑎𝑎 𝑎𝑟𝑎𝑎; otherwise 𝑉 = 𝑏. When no height is recorded, we
conservatively assume ℎ = 1𝑚. The largest concentrations of civic-ceremonial architecture in
our database come from Teotihuacan, Texcoco and Tenochtitlán-Tlatelolco. The data for these
specific sites derive from Murakami (18) for Teotihuacan; Parsons (3:361-362) and Smith
(13:22) for Texcoco; and a variety of sources for Tenochtitlán-Tlatelolco (13, 14, 20). Table S1
presents our tabulation of public monuments at Tenochtitlán-Tlatelolco, the Mexica capital.
We estimate the average size of the labor force that built these monuments by combining
population estimates in BOM survey records with current understandings of the political
organization of each period. The oldest recorded public buildings date from the Late Formative
(500-250 BCE) and Terminal Formative (250 BCE – 150 CE) periods. For these periods, we
7
assume a strong correlation between settlements and political units, and thus infer that public
monuments were built primarily by the inhabitants of the settlements in which they occur.
During the subsequent Classic (150-650 CE) period, the entire BOM population was subject to
Teotihuacan, and we therefore assume the entire BOM population contributed labor to the
monuments there. In addition, we assume the smaller concentrations of civic-ceremonial
structures outside the Teotihuacan Valley were built by the residents of immediately-surrounding
settlement clusters (5). During the Early Toltec (650-900 CE) period political organization
appears to have fragmented into a series of independent city-states (27, 28). Accordingly, we
infer monuments dating to this period were built by the inhabitants of the sites in which they
occur along with the residents of immediately-adjacent smaller settlements. We have not
included monuments from the Late Toltec (950-1200 CE) period due to uncertainties
surrounding the political organization of this period. Finally, for the Aztec period we first assign
all settlements to the altepetl or city-state to which they belonged based on Hodge’s correlations
between the BOM survey data and ethno-historic sources (21-23); then we assign these altepéme
to their associated triple alliance political unit (Mexica and Aculhua). Following these groupings,
we infer the total population of each altepetl contributed labor to the monuments within those
settlements; and we assume the monuments at Tenochtitlán-Tlatelolco were built by citizens of
the Mexica confederacy, and the monuments at Texcoco by the Aculhua confederacy. The
resulting dataset of total monument volumes and subject populations is presented as Table S2.
8
Settlement Population and House Area
Linking arguments
Several studies have suggested that the distribution of house sizes is a reasonable proxy
for the distribution of wealth in ancient and preindustrial societies (29-34). In general, the
distribution of house sizes follows an approximate log-normal distribution, such that a histogram
of log-transformed house sizes follows a normal, bell-shaped curve. Income distributions in
contemporary societies are also typically log-normal over the lower 90-95% of the distribution
(35), thus supporting the idea that domestic mound areas offer a useful proxy for production
levels in archaeological contexts.
In many societies, larger residences house larger domestic groups, which can include
extended families, lineages, corporate groups, servants and retainers (33). The clearest examples
from the Pre-Hispanic BOM are the apartment compounds of Teotihuacan, which clearly housed
large corporate groups (17, 36, 37); but one would expect servants and retainers to have lived
with elite residents in the largest domestic structures dating to other periods as well. Given the
difficulties involved in specifying the relationship between domestic space and people across an
ancient complex society, we adopt a functional definition of the household as the basal unit of
production and consumption (38) and associate this unit with domestic mounds recorded in the
BOM surveys. From this perspective, domestic mound areas are a proxy for the relative
production levels of basal socioeconomic units. Even if the number of people comprising these
basal units varied over time, with socio-economic status, and with the position of residents in the
political hierarchy, the range of such variation (say, 10 to 100 persons) and its scaling effect
would have been small relative to aggregate effects derived from overall settlement populations
(10 to 200,000 persons) and their associated social interaction networks. We thus expect
9
summary statistics for house areas sampled across a settlement to be driven primarily by
properties of the social networks in which all households are embedded.
An interesting question with respect to comparisons of archaeological data with modern
economic data is whether house size is a better proxy for income inequality or wealth inequality.
On the one hand houses are forms of capital investment that can be inherited, and are thus a form
of wealth. On the other, most households in ancient societies stored the food and other goods
they produced directly in their residences, thus suggesting house area is a function of the income
of the resident group. Although it would seem that house areas are responsive to different aspects
of inequality depending on the social position of the occupants, we suspect they are a better
overall proxy for income than for capital accumulation, for three reasons. First, in modern
societies capital ownership tends to be highly concentrated, such that nearly all wealth is owned
by the top half of households (39), but the lower half of households still live in a dwelling, with
the size of the dwelling being related to household income via rents or mortgages. Second, in
modern societies income derives from both labor (wages) and wealth (rents, interest, dividends),
and it seems reasonable to suggest that the ruling elites of ancient societies had incomes of both
types (direct production, rents, taxes and tribute). Third, the long-term wealth to income ratios of
ancient societies were likely somewhat lower than is typical of modern societies due to relatively
low savings rates and high demographic rates (39). For these reasons it seems that house areas in
ancient pre-capitalist societies are more comparable to incomes in modern societies.
Data Compilation
The primary data for this analysis consist of domestic mound areas recorded in BOM
survey reports (3-11). The dimensions of domestic mounds are larger than those of the original

10
house that produced the mound, but excavations suggest house floor areas are generally
proportional to domestic-mound areas (11, 40), so the distribution of domestic-mound areas
should mirror the underlying distribution of house areas. In order to examine mean domestic-
mound areas from the full range of settlement sizes in Central Mexico, we included additional
data for 156 domestic mounds at Xochicalco, an Epi-Classic (Early Toltec) city of ca. 10,000
people some 50km south of the BOM; the areas of 14 apartment compounds at Teotihuacan, a
few of which are referred to as “palaces” (17, 18); and 56 house floor areas tabulated from ethno-
historic sources for Tenochtitlán (13, 16). For the Tenochtitlán data, we multiplied the recorded
house-floor area by 4 to convert these areas into estimates of domestic-mound area. This
conversion factor derives from excavations at Cihuatecpan, an Aztec-period settlement at which
excavated house areas are approximately one-fourth the area of the unexcavated mound (40)
across all house sizes. We also included the three imperial palace areas from Table S2 in our data
for Tenochtitlán-Tlatelolco because they were elite residences as well as administrative
buildings. Palaces from Texcoco were also included, using data from (13).
Using these data, we computed the mean of domestic-mound areas for 80 settlements that
are at least 1 hectare in area, possess well-preserved architectural remains, and are associated
with at least two recorded domestic mounds. Then, we multiplied this area by the population of
the settlement to create a measure of Y, the total production of that settlement, and we multiplied
the area per person at that settlement by the mean domestic mound area to calculate a measure of
G. This dataset is presented as Table S3.
It is important to acknowledge the limitations of these data. For many smaller settlements
it is reasonable to treat the available domestic-mound dimensions as a representative sample of
the total houses at those settlements. There are also a few larger, especially well-preserved
11
settlements (TE-CL-8, IX-A-26, TX-A-24, Xochicalco) where the distribution of domestic-
mound areas in the available sample likely reflects the real distribution across the population of
houses. But for many settlements we do not have a representative sample of domestic mound
areas, and we therefore expect the sample means to have significant errors relative to the
population means. However, so long as these errors are unstructured, and so long as we compare
data from a reasonable number of settlements spanning the range of variation in the data, we
would still expect scaling analysis to be able to recover the average underlying relationship
between household production and settlement population.
An interesting result of our approach is that it enables a direct comparison of the share of
“income” that went to the top decile of households in the Pre-Hispanic Basin of Mexico and in
20th century Europe and the United States. Table S4 presents summary statistics for measured
domestic mounds dating from the Classic, Toltec and Aztec periods. These data show that,
although both mean and median house mound area (and most likely household composition)
grew smaller through time, the distribution of house area across the population was relatively
consistent, with 40-50% of domestic-mound area occurring in the top decile of house areas and
10-15% occurring in the bottom half. The share of house area in the top decile is comparable to
the share of income in the top decile in contemporary US society, whereas the share of house
area in the bottom half is most comparable to the share of wealth in the bottom half of
contemporary US society (39). In light of the discussion above concerning the interpretation of
house-area distributions, these data suggest either that disparity of income was more extreme in
the Pre-Hispanic Basin of Mexico than in contemporary US society, or that disparity of wealth
was less extreme. Other factors, such as the variation in house “value” due to location and other
factors, should frame the further development of these questions.
12
Within-Period Results
In the main text we point out that the data for civic architecture construction rates and
mean house area per settlement are insufficient for time-series analyses of scaling parameters,
but we note that the aggregate analysis results (Figure 2) suggest constancy in scaling parameters
across cultural periods. The potential constancy of scaling prefactors is especially important as it
suggests limited change in the basic energetics of monument construction and household
economies over time. If this is the case, diachronic changes in monument construction rates and
house sizes are attributable primarily to social organization as opposed to technological progress.
Table S5 presents the within-period analyses that support this position. Section A of this
table shows that the relationship between polity population and civic architecture construction
rates is significant for each period, but it is not possible to reject the null hypothesis of constancy
in scaling parameters across periods. Section B shows that this null hypothesis also cannot be
rejected for the relationship between settlement population and mean house area across periods,
but in this case the within-period scaling relationships are only marginally-significant. So in the
latter case, we can say that there is no evidence for change in scaling parameters through time
but there is some possibility that this absence of evidence is due to limited data. In the former
case, however, the absence of evidence for change in scaling parameters appears to be evidence
of absence of change in these parameters.
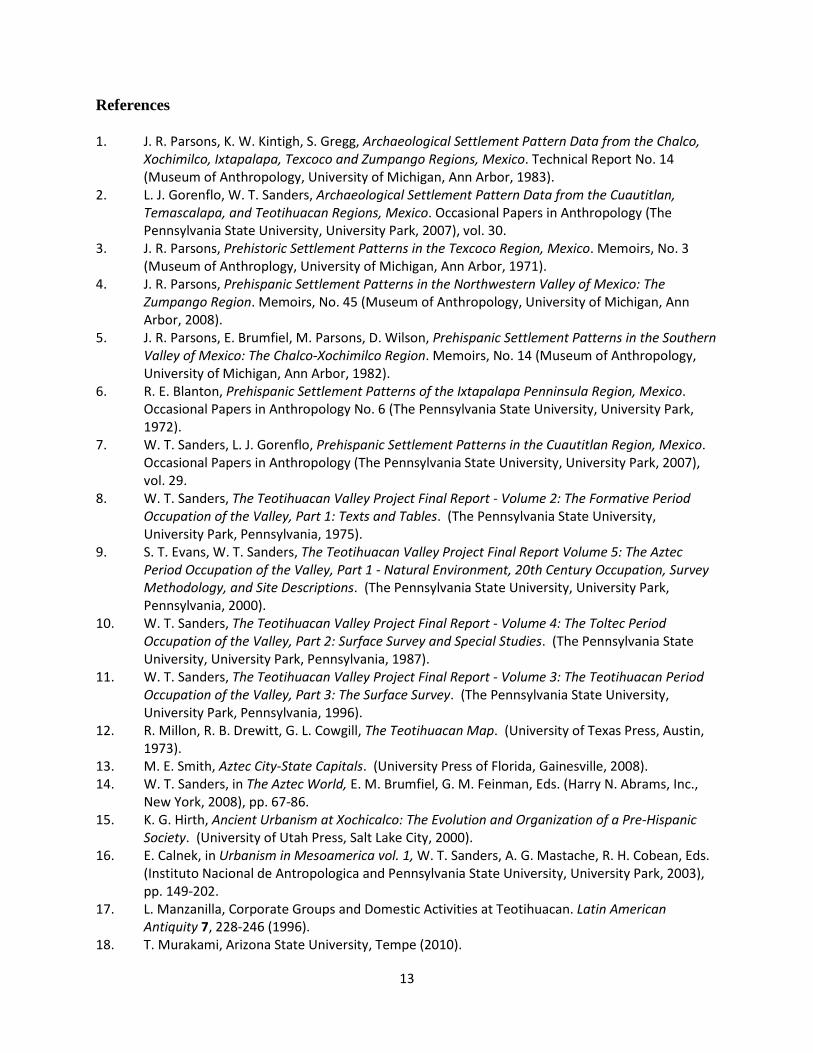
13
References
1. J. R. Parsons, K. W. Kintigh, S. Gregg, Archaeological Settlement Pattern Data from the Chalco, Xochimilco, Ixtapalapa, Texcoco and Zumpango Regions, Mexico. Technical Report No. 14 (Museum of Anthropology, University of Michigan, Ann Arbor, 1983).
2. L. J. Gorenflo, W. T. Sanders, Archaeological Settlement Pattern Data from the Cuautitlan, Temascalapa, and Teotihuacan Regions, Mexico. Occasional Papers in Anthropology (The Pennsylvania State University, University Park, 2007), vol. 30.
3. J. R. Parsons, Prehistoric Settlement Patterns in the Texcoco Region, Mexico. Memoirs, No. 3 (Museum of Anthroplogy, University of Michigan, Ann Arbor, 1971).
4. J. R. Parsons, Prehispanic Settlement Patterns in the Northwestern Valley of Mexico: The Zumpango Region. Memoirs, No. 45 (Museum of Anthropology, University of Michigan, Ann Arbor, 2008).
5. J. R. Parsons, E. Brumfiel, M. Parsons, D. Wilson, Prehispanic Settlement Patterns in the Southern Valley of Mexico: The Chalco-Xochimilco Region. Memoirs, No. 14 (Museum of Anthropology, University of Michigan, Ann Arbor, 1982).
6. R. E. Blanton, Prehispanic Settlement Patterns of the Ixtapalapa Penninsula Region, Mexico. Occasional Papers in Anthropology No. 6 (The Pennsylvania State University, University Park, 1972).
7. W. T. Sanders, L. J. Gorenflo, Prehispanic Settlement Patterns in the Cuautitlan Region, Mexico. Occasional Papers in Anthropology (The Pennsylvania State University, University Park, 2007), vol. 29.
8. W. T. Sanders, The Teotihuacan Valley Project Final Report - Volume 2: The Formative Period Occupation of the Valley, Part 1: Texts and Tables. (The Pennsylvania State University, University Park, Pennsylvania, 1975).
9. S. T. Evans, W. T. Sanders, The Teotihuacan Valley Project Final Report Volume 5: The Aztec Period Occupation of the Valley, Part 1 - Natural Environment, 20th Century Occupation, Survey Methodology, and Site Descriptions. (The Pennsylvania State University, University Park, Pennsylvania, 2000).
10. W. T. Sanders, The Teotihuacan Valley Project Final Report - Volume 4: The Toltec Period Occupation of the Valley, Part 2: Surface Survey and Special Studies. (The Pennsylvania State University, University Park, Pennsylvania, 1987).
11. W. T. Sanders, The Teotihuacan Valley Project Final Report - Volume 3: The Teotihuacan Period Occupation of the Valley, Part 3: The Surface Survey. (The Pennsylvania State University, University Park, Pennsylvania, 1996).
12. R. Millon, R. B. Drewitt, G. L. Cowgill, The Teotihuacan Map. (University of Texas Press, Austin, 1973).
13. M. E. Smith, Aztec City-State Capitals. (University Press of Florida, Gainesville, 2008). 14. W. T. Sanders, in The Aztec World, E. M. Brumfiel, G. M. Feinman, Eds. (Harry N. Abrams, Inc.,
New York, 2008), pp. 67-86. 15. K. G. Hirth, Ancient Urbanism at Xochicalco: The Evolution and Organization of a Pre-Hispanic
Society. (University of Utah Press, Salt Lake City, 2000). 16. E. Calnek, in Urbanism in Mesoamerica vol. 1, W. T. Sanders, A. G. Mastache, R. H. Cobean, Eds.
(Instituto Nacional de Antropologica and Pennsylvania State University, University Park, 2003), pp. 149-202.
17. L. Manzanilla, Corporate Groups and Domestic Activities at Teotihuacan. Latin American Antiquity 7, 228-246 (1996).
18. T. Murakami, Arizona State University, Tempe (2010).

14
19. W. T. Sanders, J. Parsons, R. S. Santley, The Basin of Mexico: Ecological Processes in the Evolution of a Civilization. (Academic Press, New York, 1979).
20. M. Aguilar-Moreno, Handbook to Life in the Aztec World. (Oxford University Press, New York, 2005).
21. M. G. Hodge, in Economies and Polities in the Aztec Realm, M. G. Hodge, M. E. Smith, Eds. (Institute for Mesoamerican Studies, Albany, New York, 1994), pp. 43-72.
22. M. G. Hodge, in Aztec Imperial Strategies. (Dumbarton Oaks, Washington, D.C., 1996), pp. 17-46. 23. M. G. Hodge, in The Archaeology of City-States: Cross-Cultural Approaches, D. L. Nichols, T. H.
Charlton, Eds. (Smithsonian Institution Press, Washington, D.C., 1997), pp. 209-228. 24. S. G. Ortman, A. H. F. Cabaniss, J. O. Sturm, L. M. A. Bettencourt, The Prehistory of Urban
Scaling. PLoS ONE 9, e87902 (2014)10.1371/journal.pone.0087902). 25. B. Cummings, Cuicuilco and the Archaic Culture of Mexico. Social Science Bulletin No. 4
(University of Arizona, Tucson, 1933). 26. R. E. Blanton, S. A. Kowalewski, G. Feinman, J. Appel, Ancient Mesoamerica: A Comparison of
Change in Three Regions. (Cambridge University Press, Cambridge, ed. 2nd., 1993). 27. T. H. Charleton, D. L. Nichols, in The Archaeology of City-States: Cross-Cultural Approaches, D. L.
Nichols, T. H. Charleton, Eds. (Smithsonian Institution Press, Washington, DC, 1997), pp. 169-208.
28. J. R. Alden, in Transformations: Mathematical Approaches to Culture Change, C. Renfrew, K. L. Cooke, Eds. (Academic Press, New York, 1979), pp. 169-200.
29. I. M. Morris, Economic Growth in Ancient Greece. Journal of Institutional and Theoretical Economics 160, 709-742 (2004).
30. A. Y. Abul-Megd, Wealth distribution in an ancient Egyptian society. Physical Review E 66, 1-3 (2002).
31. K. G. Hirth, in Prehispanic Domestic Units in Western Mesoamerica, R. S. Santley, K. G. Hirth, Eds. (CRC Press, Boca Raton, 1993), pp. 121-146.
32. J. H. Bodley, The Power of Scale: A Global History Approach. (M. E. Sharpe, Amonk, New York, 2003).
33. R. E. Blanton, Houses and Households: A Comparative Study. (Plenum, New York, 1994). 34. H. D. G. Maschner, R. A. Bentley, in Complex Systems and Archaeology, R. A. Bentley, H. D. G.
Maschner, Eds. (University of Utah Press, Salt Lake City, 2003), pp. 47-60. 35. E. W. Montroll, M. F. Schlesinger, On 1/f noise and other distributions with long tails.
Proceedings of the National Academy of Science of the U.S.A. 79, 3380-3383 (1982). 36. L. R. Manzanilla, in The Neighborhood as a Social and Spatial Unit in Mesoamerican Cities, M. C.
Arnauld, L. R. Manzanilla, M. E. Smith, Eds. (University of Arizona Press, Tucson, 2012), pp. 55-73.
37. R. J. Widmer, R. Storey, in Prehispanic domestic Units in Western Mesoamerica: Studies of the Household, Compound and Residence, R. S. Santley, K. G. Hirth, Eds. (CRC Press, Boca Raton, 1993), pp. 87-104.
38. R. R. Wilk, R. M. Netting, in Households: Comparative and Historical Studies of the Domestic Group, R. M. Netting, R. R. Wilk, E. J. Arnould, Eds. (University of California Press, Berkeley, 1984), pp. 1-28.
39. T. Picketty, E. Saez, Inequality in the long run. Science 344, 838-843 (2014)10.1126/science.1251936).
40. S. T. Evans, Ed., Excavations at Cihuatecpan, An Aztec Village in the Teotihuacan Valley, (Vanderbilt University Publications in Anthropology 36, Nashville, 1988).

15

16
Figure S1. The Basin of Mexico. A: Location within Mexico. B: Settlements during the Formative period (circle size is proportional to population; colors denote elevation; outline marks surveyed area; gray area is the extent of Mexico City in 1964). C: Settlements during the Aztec period. During the latter period settlement expanded into the shallows of the lake. Today, modern settlement covers the entire basin and the lake has been drained.
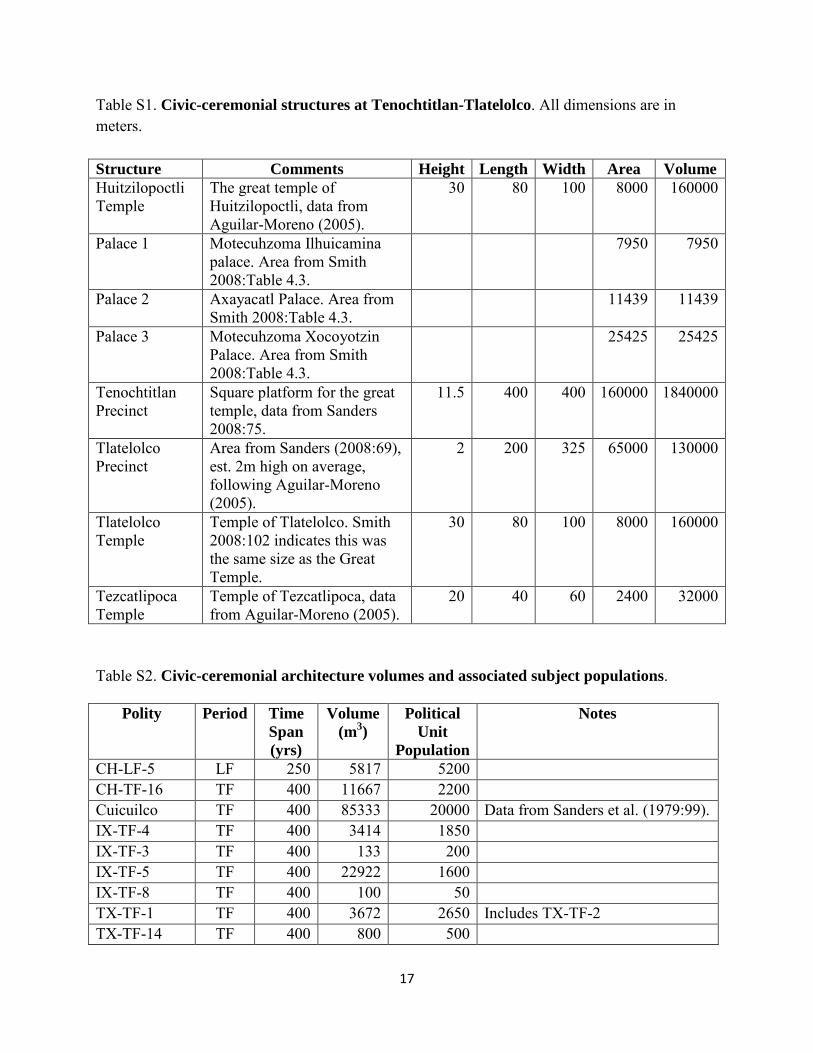
17
Table S1. Civic-ceremonial structures at Tenochtitlan-Tlatelolco. All dimensions are in meters. Structure Comments Height Length Width Area Volume Huitzilopoctli Temple
The great temple of Huitzilopoctli, data from Aguilar-Moreno (2005).
30 80 100 8000 160000
Palace 1 Motecuhzoma Ilhuicamina palace. Area from Smith 2008:Table 4.3.
7950 7950
Palace 2 Axayacatl Palace. Area from Smith 2008:Table 4.3.
11439 11439
Palace 3 Motecuhzoma Xocoyotzin Palace. Area from Smith 2008:Table 4.3.
25425 25425
Tenochtitlan Precinct
Square platform for the great temple, data from Sanders 2008:75.
11.5 400 400 160000 1840000
Tlatelolco Precinct
Area from Sanders (2008:69), est. 2m high on average, following Aguilar-Moreno (2005).
2 200 325 65000 130000
Tlatelolco Temple
Temple of Tlatelolco. Smith 2008:102 indicates this was the same size as the Great Temple.
30 80 100 8000 160000
Tezcatlipoca Temple
Temple of Tezcatlipoca, data from Aguilar-Moreno (2005).
20 40 60 2400 32000
Table S2. Civic-ceremonial architecture volumes and associated subject populations.
Polity Period Time Span (yrs)
Volume (m3)
Political Unit
Population
Notes
CH-LF-5 LF 250 5817 5200 CH-TF-16 TF 400 11667 2200 Cuicuilco TF 400 85333 20000 Data from Sanders et al. (1979:99). IX-TF-4 TF 400 3414 1850 IX-TF-3 TF 400 133 200 IX-TF-5 TF 400 22922 1600 IX-TF-8 TF 400 100 50 TX-TF-1 TF 400 3672 2650 Includes TX-TF-2 TX-TF-14 TF 400 800 500
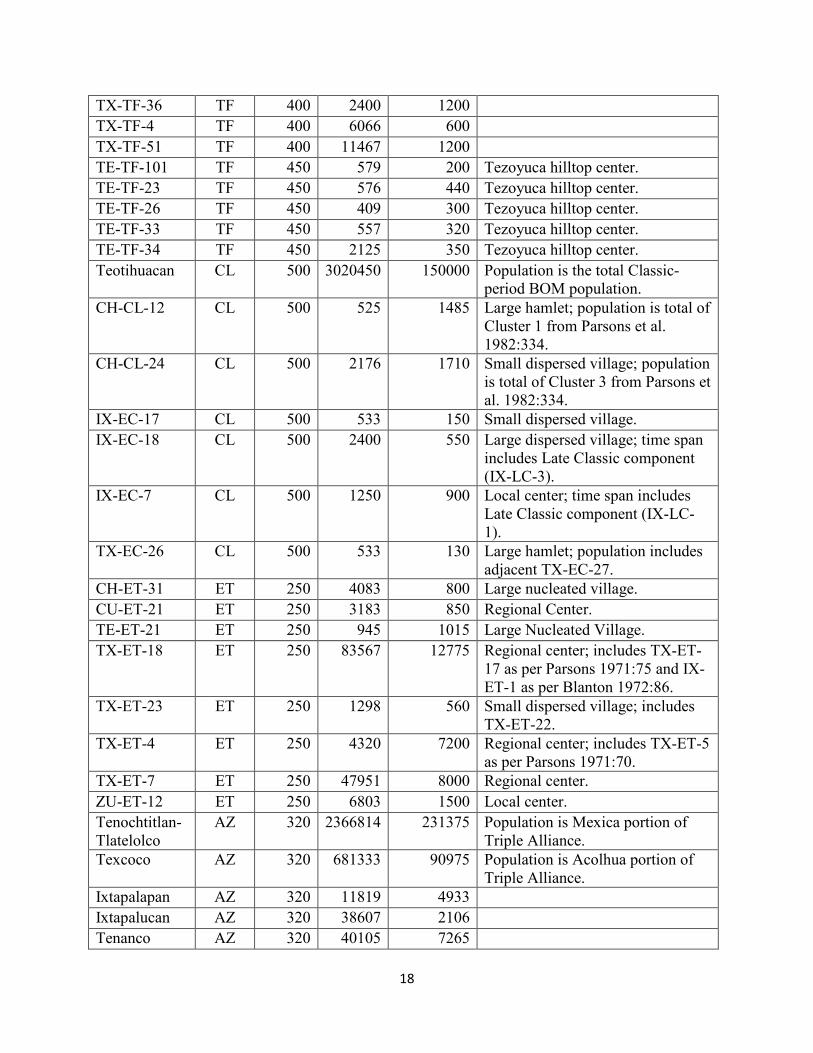
18
TX-TF-36 TF 400 2400 1200 TX-TF-4 TF 400 6066 600 TX-TF-51 TF 400 11467 1200 TE-TF-101 TF 450 579 200 Tezoyuca hilltop center. TE-TF-23 TF 450 576 440 Tezoyuca hilltop center. TE-TF-26 TF 450 409 300 Tezoyuca hilltop center. TE-TF-33 TF 450 557 320 Tezoyuca hilltop center. TE-TF-34 TF 450 2125 350 Tezoyuca hilltop center. Teotihuacan CL 500 3020450 150000 Population is the total Classic-
period BOM population. CH-CL-12 CL 500 525 1485 Large hamlet; population is total of
Cluster 1 from Parsons et al. 1982:334.
CH-CL-24 CL 500 2176 1710 Small dispersed village; population is total of Cluster 3 from Parsons et al. 1982:334.
IX-EC-17 CL 500 533 150 Small dispersed village. IX-EC-18 CL 500 2400 550 Large dispersed village; time span
includes Late Classic component (IX-LC-3).
IX-EC-7 CL 500 1250 900 Local center; time span includes Late Classic component (IX-LC-1).
TX-EC-26 CL 500 533 130 Large hamlet; population includes adjacent TX-EC-27.
CH-ET-31 ET 250 4083 800 Large nucleated village. CU-ET-21 ET 250 3183 850 Regional Center. TE-ET-21 ET 250 945 1015 Large Nucleated Village. TX-ET-18 ET 250 83567 12775 Regional center; includes TX-ET-
17 as per Parsons 1971:75 and IX-ET-1 as per Blanton 1972:86.
TX-ET-23 ET 250 1298 560 Small dispersed village; includes TX-ET-22.
TX-ET-4 ET 250 4320 7200 Regional center; includes TX-ET-5 as per Parsons 1971:70.
TX-ET-7 ET 250 47951 8000 Regional center. ZU-ET-12 ET 250 6803 1500 Local center. Tenochtitlan-Tlatelolco
AZ 320 2366814 231375 Population is Mexica portion of Triple Alliance.
Texcoco AZ 320 681333 90975 Population is Acolhua portion of Triple Alliance.
Ixtapalapan AZ 320 11819 4933 Ixtapalucan AZ 320 38607 2106 Tenanco AZ 320 40105 7265
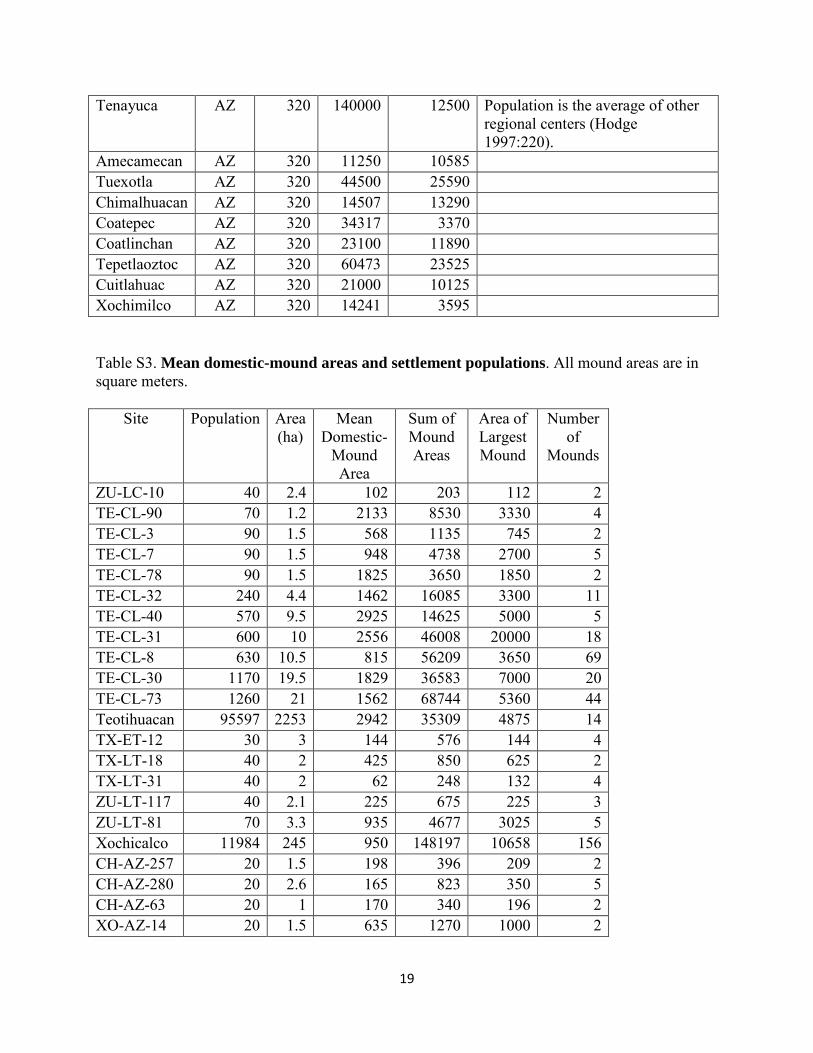
19
Tenayuca AZ 320 140000 12500 Population is the average of other regional centers (Hodge 1997:220).
Amecamecan AZ 320 11250 10585 Tuexotla AZ 320 44500 25590 Chimalhuacan AZ 320 14507 13290 Coatepec AZ 320 34317 3370 Coatlinchan AZ 320 23100 11890 Tepetlaoztoc AZ 320 60473 23525 Cuitlahuac AZ 320 21000 10125 Xochimilco AZ 320 14241 3595 Table S3. Mean domestic-mound areas and settlement populations. All mound areas are in square meters.
Site Population Area (ha)
Mean Domestic-
Mound Area
Sum of Mound Areas
Area of Largest Mound
Number of
Mounds
ZU-LC-10 40 2.4 102 203 112 2 TE-CL-90 70 1.2 2133 8530 3330 4 TE-CL-3 90 1.5 568 1135 745 2 TE-CL-7 90 1.5 948 4738 2700 5 TE-CL-78 90 1.5 1825 3650 1850 2 TE-CL-32 240 4.4 1462 16085 3300 11 TE-CL-40 570 9.5 2925 14625 5000 5 TE-CL-31 600 10 2556 46008 20000 18 TE-CL-8 630 10.5 815 56209 3650 69 TE-CL-30 1170 19.5 1829 36583 7000 20 TE-CL-73 1260 21 1562 68744 5360 44 Teotihuacan 95597 2253 2942 35309 4875 14 TX-ET-12 30 3 144 576 144 4 TX-LT-18 40 2 425 850 625 2 TX-LT-31 40 2 62 248 132 4 ZU-LT-117 40 2.1 225 675 225 3 ZU-LT-81 70 3.3 935 4677 3025 5 Xochicalco 11984 245 950 148197 10658 156 CH-AZ-257 20 1.5 198 396 209 2 CH-AZ-280 20 2.6 165 823 350 5 CH-AZ-63 20 1 170 340 196 2 XO-AZ-14 20 1.5 635 1270 1000 2
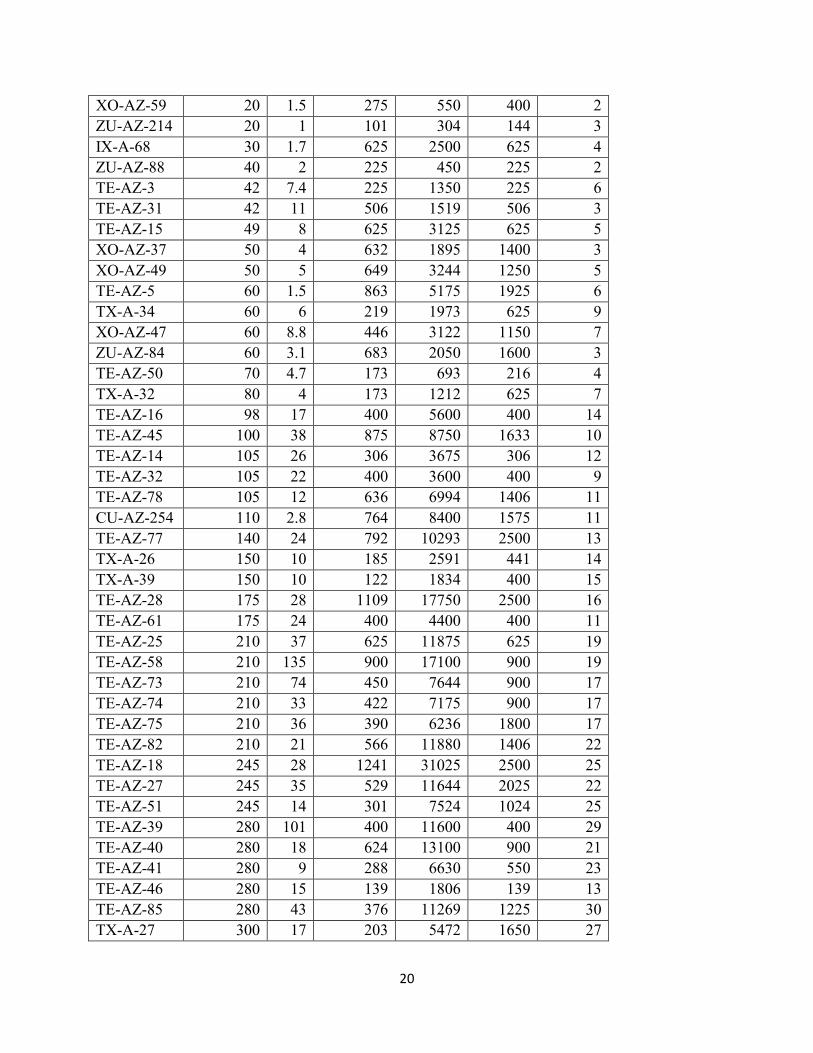
20
XO-AZ-59 20 1.5 275 550 400 2 ZU-AZ-214 20 1 101 304 144 3 IX-A-68 30 1.7 625 2500 625 4 ZU-AZ-88 40 2 225 450 225 2 TE-AZ-3 42 7.4 225 1350 225 6 TE-AZ-31 42 11 506 1519 506 3 TE-AZ-15 49 8 625 3125 625 5 XO-AZ-37 50 4 632 1895 1400 3 XO-AZ-49 50 5 649 3244 1250 5 TE-AZ-5 60 1.5 863 5175 1925 6 TX-A-34 60 6 219 1973 625 9 XO-AZ-47 60 8.8 446 3122 1150 7 ZU-AZ-84 60 3.1 683 2050 1600 3 TE-AZ-50 70 4.7 173 693 216 4 TX-A-32 80 4 173 1212 625 7 TE-AZ-16 98 17 400 5600 400 14 TE-AZ-45 100 38 875 8750 1633 10 TE-AZ-14 105 26 306 3675 306 12 TE-AZ-32 105 22 400 3600 400 9 TE-AZ-78 105 12 636 6994 1406 11 CU-AZ-254 110 2.8 764 8400 1575 11 TE-AZ-77 140 24 792 10293 2500 13 TX-A-26 150 10 185 2591 441 14 TX-A-39 150 10 122 1834 400 15 TE-AZ-28 175 28 1109 17750 2500 16 TE-AZ-61 175 24 400 4400 400 11 TE-AZ-25 210 37 625 11875 625 19 TE-AZ-58 210 135 900 17100 900 19 TE-AZ-73 210 74 450 7644 900 17 TE-AZ-74 210 33 422 7175 900 17 TE-AZ-75 210 36 390 6236 1800 17 TE-AZ-82 210 21 566 11880 1406 22 TE-AZ-18 245 28 1241 31025 2500 25 TE-AZ-27 245 35 529 11644 2025 22 TE-AZ-51 245 14 301 7524 1024 25 TE-AZ-39 280 101 400 11600 400 29 TE-AZ-40 280 18 624 13100 900 21 TE-AZ-41 280 9 288 6630 550 23 TE-AZ-46 280 15 139 1806 139 13 TE-AZ-85 280 43 376 11269 1225 30 TX-A-27 300 17 203 5472 1650 27

21
TE-AZ-43 315 18 437 8739 891 20 TE-AZ-29 350 44 306 11331 306 37 TE-AZ-36 350 72 625 20000 625 32 TE-AZ-57 350 161 874 24475 1225 28 TE-AZ-63 350 60 400 9600 400 24 TE-AZ-62 420 47 400 14000 400 35 TE-AZ-71 420 99 564 15794 1600 32 TE-AZ-38 490 88 650 1300 1000 2 TE-AZ-101 630 102 862 37947 5625 44 TE-AZ-103 630 103 652 42378 3516 66 TX-A-38 650 65 129 3355 400 26 TX-A-31 700 50 96 4873 375 51 TX-A-59 750 75 125 1878 400 15 TX-A-30 1500 100 120 10889 3025 91 IX-A-26 1630 90 845 4226 1456 5 TX-A-24 13500 450 244 27521 1600 114 Tenochtitlan 212500 1350 2227 131398 25425 59 Table S4. Domestic-mound area distributions in the Basin of Mexico through time. Period Measured
Mounds Total Area
Mean Med-ian
90th %-ile
100th %-ile
Share in Top 10%
Share in Bottom
50% Classic (150-650 CE)
398 420706 1057 490 2755 20000 0.45 0.11
Toltec (650-1200 CE)
355 258772 729 446 1536 10658 0.42 0.16
Aztec (1200-1520 CE)
2389 1377190 576 306 1000 33750 0.50 0.13
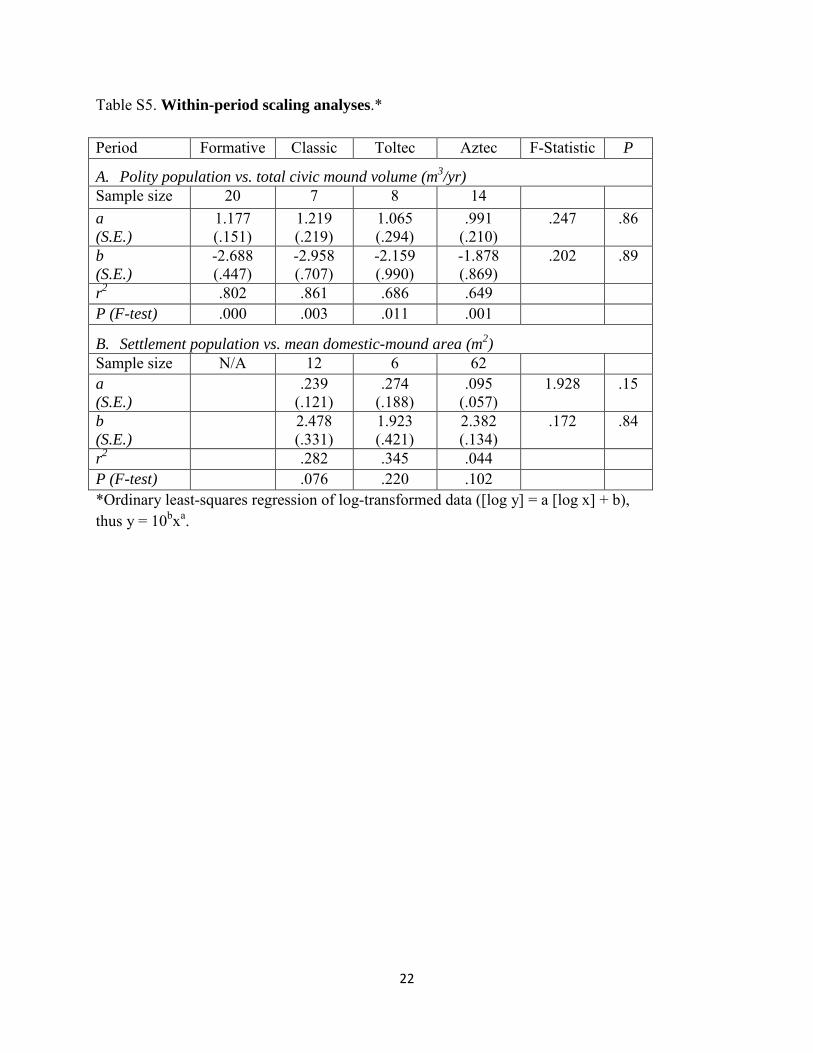
22
Table S5. Within-period scaling analyses.* Period Formative Classic Toltec Aztec F-Statistic P
A. Polity population vs. total civic mound volume (m3/yr) Sample size 20 7 8 14 a (S.E.)
1.177 (.151)
1.219 (.219)
1.065 (.294)
.991 (.210)
.247 .86
b (S.E.)
-2.688 (.447)
-2.958 (.707)
-2.159 (.990)
-1.878 (.869)
.202 .89
r2 .802 .861 .686 .649 P (F-test) .000 .003 .011 .001
B. Settlement population vs. mean domestic-mound area (m2) Sample size N/A 12 6 62 a (S.E.)
.239 (.121)
.274 (.188)
.095 (.057)
1.928 .15
b (S.E.)
2.478 (.331)
1.923 (.421)
2.382 (.134)
.172 .84
r2 .282 .345 .044 P (F-test) .076 .220 .102 *Ordinary least-squares regression of log-transformed data ([log y] = a [log x] + b), thus y = 10bxa.