Solucionario Ecuaciones Diferenciales Dennis Zill 7a edicion
Upload
khangminh22Category
view
3download
0
SESSION 7A
‘PRECISION FARMING SYSTEMS |
Chairman and Professor P C H Miller
Session Organiser ‘Silsoe ResearchInstitute, Bedford, UK
Papers 7A-| to 7A-6

THE 1999 BRIGHTON CONFERENCE- Weeds
The patch treatmentof weedsin cereals
S Christensen, A M Walter and T HeiselDanish Institute ofAgricultural Sciences, Department of Crop Protection, Flakkebjerg, DK-
4200 Slagelse, Denmark
ABSTRACT
Larger field sizes together with the concerns about pesticide residues leaching
into surface and groundwater has given impetus to research and development of
measures that can reduce pesticide use in Europe. Spatially variable application
or patch spraying of weeds is one of the measures that have shown potential
saving of herbicide usage. Manual weed counting has been used to establish
treatment maps for patch weeds. However, there is a need for development of
more rational weed surveying method, e.g. using image analysis to detect species
and measure density or weed coverage. Computerized decision support systems
have been developed for spatial weed management and several systems have
been developed as prototypes or commercial products. The ultimate goal of
patch sprayingis to select an efficient herbicide and an economically optimum
dose for each part of the field. This goal requires, among other things, a
position related decision support system that includes the yield variations in the
calculations. Further the breakthrough of new technologies may lead to research
and development of advanced weed control measures, such as real-time
intelligent robotic weed control system.
INTRODUCTION
During the last two centuries, fields throughout Europe have been amalgamated into larger
units which are now managed as one, although large within-field variation still exists.
Together with the concernsaboutpesticide residues leaching into surface and groundwaterit
gives impetus to research and development of measures that can reduce pesticide use in
Europe. Integrated weed management, site-specific weed management and non-chemical weed
control are options that maylead to herbicide savings and diminished herbicidal loading of the
environment. The development ofdifferential global positioning systems (DGPS) and yield
monitoring technologiesin the late 1980's inspired several scientists, advisors and farmers to
study the spatial variation of crop and soil parameters, in conjunction with weed occurrence
and density.
The great within-field variance of weeds, which has been found in several studies (Nordbo ef
al., 1995; Auld & Tisdell, 1988; Hughes, 1989; Thornton ef a/., 1990; Wilson & Brain, 1990;
Mortensen ef al., 1992) showsthat there is good reason to believe that herbicide input can be
diminished in manyfields, as compared to the standard whole-field spraying. New equipment
developed for patch spraying has provided a higher precision and the possibility to record and
explore the responses of crop and weeds due to spatial application of herbicide (Langkilde,
1999). Herbicide savings have a direct positive impact on the costs. Whether this will show
up as an increasing marginal return, depends largely on the cost of surveying the weeds but
59]

also to which extend crop yield and quality can be retained. The probable yield-reduction from
a higher over-all weed pressure in a patch-sprayed field may partly be compensated by a
decrease in possible direct herbicidal yield depressing effects. Also, a lower level of herbicide
residues in harvested crops may be regarded as a qualitative improvement. In all cases, to
managethe correct and timely spraying of small cells in the fields demands careful assessment
and sound decision-making can be carried outat the tactical control level.
WEED SURVEYING METHODS
To date, several weed surveying and mapping methods may be used for patch spraying in cereals
(Nordbo ef al, 1995; Nordmeyeref a/., 1996; Rew et al., 1996; Christensen ef al, 1998). The grid
weed surveying and mapping method is so far the most common method used in Europe. It
involves the detection and counting of weeds pnor the spraying. One advantage of this approach
is the possibility to choose a herbicide, a herbicide mixture or several herbicides applicable for
treating the varying weed composition and density. Further, it enables optimization of the
logistics of herbicide and water volumebefore entering the field.
Walter (1996) suggested a conceptusing historical weed mapse.g. from previous years as the basis
for spatial herbicide application in cereals, The author found that although the populations of
dicotyledonous. weed species were stationary, weed emergence varied between years, thus weed
density of the species had to be measured every year. Walter ef al. (1997) and Christensen ef al.
(1999a) used a stratified mapping method based onhistorical weed mapsto divide the field into
zones to orientate where manual weed surveying was to be carried out. Rew ef al. (1996) showed
that visual assessment of density of couch (E/ymus repens) could be used to map the spatial
distribution of this species. Rew e/ al. (1996, 1997) described a semi-automated system of
weed detection that relies on manual recognition from a vehicle. The absence of weeds, or
presence of low or high weed density of blackgrass (Alopecurus myosuroides) couch, Italian
ryegrass (Lolium multiflorum), bulbous oatgrass (Arrenhenathurumelatius), wild oat (Avena
fatua), sterile brome (Bromussterilis) and perennial thistle (Cirsium arvense) were recorded
onto dedicated keypads mounted on the vehicle.
Manual weed counting is time consuming and thus there is a need for the developmentofa rational
weed surveying method,e.g. using image analysis to detect and measure weed density. Thomtonef
al. (1990) was able to discriminate patches of blackgrass (Alopecurus myosuroides) at
flowering in a winter cereal field from colour aerial photographs. Brownef a/. (1994) used a
multi-spectralstill video camera from a low flying (500 to 700 m) aircraft to detect patches of
weed species in corn field and maize. The species could be fairly well discriminated by their
spectral characteristics of their reflectance characteristics. It must be noted that the spectral
characteristics of the weeds must be sampled from the local population andstatisticallyestablished shortly before the detection process, as the features are strongly variable with
growth stage. With remote sensing generally only a few weed species at a certain growth
stage and with a prolific growth penetrating the crop canapy can be distinguished. Patches
must be comparatively large and dense. Stafford ef al. (1997) showed the potential todiscriminate between some weedsand cereal using aerial and near-ground images. The authors
concluded that other methods must complement these approaches such as manual surveying.

Woebbecke ef al. (1995) used shape feature analyses on binary images originally obtained
from colour images of 10 common weeds. Shape features were generally independentofplant
size, image rotation, and plant location within most images. In cereals, however, feature
analyses are complicated by mutual coverage of leaves among weeds and between crop and
weeds. Gerhards & Kiihbauch (1993) digitised slides taken in the field and used image analysis
to estimate weed and crop cover, successfully. Martin-Chefson ef al. (1999) used image-
processing techniques to discriminate between weeds andcereals, that provide the potential of
mapping weed biomassof coverage.
Reflectance measurements may be used before crop-emergence or at crop ripeness. However,real time weed detection and spraying have only been developed for weed controlin stubble land
using simple sensors detecting green vegetation and an intermittent sprayer. Felton & McCloy
(1992) have described a commercially available sprayer and its profitability has been
investigated by Ahrens (1994).
Automatic detection and offset spraying for control of weeds along roadsides and public areas
have been investigated by Slaughter es al. (1999) who developed an image-based detection
system. A colour look-up table was developed from training data set and used to categorise
pixels into weed or background classes. The system was demonstrated on a commercialscale.
Shape- and colour-based algorithms were used by Lee ef a/. (1999) to discriminate between
weed and crop plants in tomatoes. Once weeds werelocated, a precision spray system applied
spray liquid exclusively onto the weed plants. Video imaging was used by Giles & Slaughter
(1997) to guide a precision band sprayer in row crops.
SPATIAL WEED MANAGEMENT
Computerized decision support systems offer an ideal means of achieving economical,environmentally safe, and sustainable weed management. Wilesez al. (1996) divided decision
support systems for weed managementinto either efficacy-based or population-based systems.
The efficacy-based systems assist decision-makers’ in choosing herbicide (e.g. SELOMA,
Stigliana & Resina, 1993) and herbicide dose (PC-Plant Protection, Rydahl & Thonke, 1993).
Population-based models incorporate weed biology and ecology through simple deterministic
models e.g. HERB (Wilkerson e/ a/., 1991) WEEDSIM (Swinton & King, 1994) GWM,
PALWEED(Kwonet al., 1995; Wiles ef al., 1996) and GESTINF (Berti & Zanin, 1997). The
efficacy-based system comprises large databases with herbicide performances in different
crops, weed species, growth stagesetc. that enable ranking and recommendations of the most
efficient herbicide or herbicide dose against a weed mixture. So far, none of these systems
relate weed control to the associated yield losses. In the population-based systems, the
estimatedyield loss or changesin the soil seed bank without weed control define the need for
weed control and determine whether a chemical or physical weed control may be beneficial.
An essential assumption in the population-based systems is a binary weed response to
herbicide doses, i.e. weeds that survive a herbicide treatment (dose) have the same
competitiveness and provide the sameyield loss as untreated weeds (Pannell 1990, Audsley
1993; Swinton & King, 1994). However, cereal crops, which by virtue of their rapid
development, high plant density and even spacing, can exert a high competitive ability, and asa consequence reduced herbicide dosages will often be sufficient to retard the growth of
593

weeds to such an extent that they will be suppressed completely by the crop (Christensen,
1994).
A decision algorithmfor patch spraying broad-leaved weedsin cereals (DAPS) has been developed
at the Danish Institute of Agricultural Sciences, Research Center Flakkebjerg (Christensen ef al.,
1996). DAPScalculates the total yield loss and finds the economical optimal dose of a herbicide or
mixtures of several herbicide in all points. Weed species competitiveness, weed density, crop andherbicide price, and dose-response parameters are included in calculating the economic maximal
herbicide dose. Kriging and a GIS are used to produce a treatment map for applying one
herbicide or several treatment maps for applying several herbicides with an injection sprayer
system.
At Silsoe Research Institute, UK, a spatial and temporal model has been developed tosimulated the temporal and spatial distribution of a weed species (Paice & Day, 1997). The
model describes propagation and dispersal of blackgrass and a temporal population model to
estimate the yearly state variable of population cycle of blackgrass. The model is comprised of
a dispersal model that manages migration between specified units, e.g. 1 m by | m cells.
Christensen ef al. (1999b) used the model to comparethree different weed control strategies
in a 140 m by 140 m areaofa field with varying infestation of blackgrass. The strategies were
the use of an economic threshold, the decision support system PC-Plant Protection and DAPS
every year. Eight years simulation runs with site-specific weed control showed significant
spatial and temporalvariation in the seed bankusing | plant/m? of bleckgrass as the economic
threshold and 3.5 I/ha of IPU beyond the threshold. The population size increased in the areas
with low initial Blackgrass infestations. Further, herbicide usage increased overthe eight years
period with the threshold strategy. The Blackgrass population decreased using the same low
IPU dose recommended by PC-Plant Protectionin all cells. However, the yield loss after weed
control was higher than expected indicating that the economic optimal IPU dose was higher
than the recommended dose. Over an eight-year period, DAPS showed the lowest herbicide
usage, lowest yield loss after spraying and lowest seed bank.
PATCH SPRAYING TECHNIQUES
In 1989, a Danish farmer develop a system for spatial application offertilizer and pesticides. A
computer program wasused to divide the field into specified treatment units, e.g. 12 m by 12
m units that fitted the distance between the spray tramlines. The treatment map was edit by
farmer using his knowledge about the occurrence of different weed species. The sprayer had
two tanks with two pesticides or two doses of a pesticide, i.e. four treatments could be
achieved including the no-spray treatment. The sprayer was mounted with two pumpsand an
on/off system of a dual independent nozzle system on two booms. The sprayer was controlled by
a on-board computer and an treatment map.
Since 1989, several patch sprayers have been developed as prototypes or commercial
products. An experimental patch spraying rig was designed and constructed at Silsoe ResearchInstitute in 1994 to 1996. The system had been designed to use a novel injection. meteringsystem in which the liquid chemical formulation was drawn into metering cylinders mounted
on the 12 m sprayer. The system was designed to operate with clean water in the spray tank.
Concentrated chemical formulation was metered into the spray delivery lines by pumpingwater into the base of the metering cylinders to displace the active formulation, at a rate

depending on speed of spraying vehicle and the dose requirements specified on a treatment
map (Paice et al., 1995). Further, an experimental patch sprayer in which a combination of
injection metering and on/off controls both the doses rate and pesticide mixture has been
constructed. The patch sprayer was controlled by a treatment map generated from field survey
data and an appropriate transform to accommodate a range of factors relevant to the applied
treatment. The boom wasarranged in 2 m sections with each section supplied by equal lengths
of small bore pipes from a central mixing chamber. The pipe size was designed to give a
response time ofless than 4.0 s when the sprayer wasfitted with nozzles to apply 120 litres/
ha at a speed of 8 km/h.
In Denmark, collaboration between Danish Institute of Agricultural Sciences, Flakkebjerg,
HARDI INTERNATIONAL,Dronningborg Industries and Datalogisk has led to development
of a system in which treatment maps were generated with DAPSonthe farm office computer
and then downloaded to the Fieldstar unit (AGCO DK) connected to a GPS receiver in the
tractor cab. The Fieldstar was connected to the Hardi Pilot that controlled the pressure of the
nozzles, At each position in the field, the control system sent a message to the sprayer
containing the required dose. The system has been used in three years at three locations for
patch spraying dicotyledonous weed species in cereals. Currently, the system has been modified
with a pulse-width modulation ofthe liquid flow from the nozzles developed at The University of
California, Davis (Giles ef al, 1999). In another collaboration between Danish Institute of
Agricultural Sciences, Flakkebjerg, HARDI INTERNATIONAL and Raven Industries, an
injection system with five pumps andfive tanks with concentrated herbicides has been used for
patch spraying mixtures of weed species in cereals. Each herbicide was metered into the spray
delivery lines by the individually operating pumps. A DGPS system and the software Patch
Pro® (Tech International) controlled the five pumps according to a treatment map for each
herbicide. Preliminary tests have shown that the pumps operate very accurately, however,
there is a need for improving the cleaning methodsof the system.
PATCH SPRAYING RESULTS
The potential reductions in herbicide usage that can be obtained by patch spraying depend on
the density and distribution of the w :d population and the strategy of spatial application of
herbicides. Varying potential herbicide savings obtained in field and desk studies are shown in
Table 1. In highly infested fields herbicide savings may be marginally, especially using the
or/off strategy with a low economic threshold. In otherfields with sparse weedsin distinct
patches herbicide saving can be very high (Table 1). A more conservative strategy, that
minimises the risk of weed population increase, is the species and density dependent choice ofherbicide and dose.
Having selected the density-specification of a weed patch the perception scale includes a
numeric and an area scale, the latter again split into one for sampling area and one for area of
a treatment unit. The choice of spatial and numeric scales for a certain task is a pragmatic
trade-off between the cost and benefit or saving of precision application of herbicides.
Obviously, the spatial resolution of the treatment unit scale should not exceed that of the
succeeding weed control technique. If, for example, the smallest area that can practically be
sprayed is 2 m by 2 m,the cell should not be madeless than this area. Similarly, the numeric
scale of number or coverage estimation of weeds should not aim at a precision higher than that
595

relevant for practical decision-making from an agronomic viewpoint.
Even before these resolution criteria are met, it is probable that the spatial resolution will be
limited by the cost of sampling. Weeds, therefore, can only be detected with some degree ofuncertainty, and it seemsaninevitable part of patch spraying, in research as well as practice, to
consider and evaluate the potential risk as a function of the assessment uncertainty or the
chosen 'error acceptance level’.
FUTURE DIRECTIONS
Herbicide efficacy varies among weed species, which must be taken into account in spatial
weed managementstrategies. Thus, the ultimate goal of patch spraying is to select an efficient
herbicide and an economically optimum dose for each part of the field. This goal requires,
among other things, a position related decision support system that includes the yield
variations in the calculations.
The economic threshold concept has been used for spatial studies to decide which field areas
should be sprayed orleft untreated. Wiles ef al. (1992) and Audsley (1993) used the threshold
concept to simulate economicbenefit of patch spraying with a single species population. Johnsonet
al. (1995) used a mean threshold value for varying mixtures ofbroad leaf and grass weed species to
simulate the spatial variation in the need for weed control. Weed populations, however, rarely
consist of single weed species or a uniform weed composition with a constant threshold. Further,
the threshold concept may causesignificant problems in following crops in uncontrolled areas
unless there are no weedsatall. Thus, spatial weed management needs to be based on a multi-
species decision modelthat includes the long-termeffect of the level ofweed control.
Experiments in winter wheat showed that the need for weed control varied among different
drilling dates, seed rates and varieties (Christensen & Rasmussen, 1996). The results showed
that the optimum crop competitiveness was obtained beyond a seed rate of 300 seeds/m’ and
with late sowing. However,there is a trade-off betweenall cropping factors and the value of
crop competitiveness, which depends on the current weed population and the cost of weed
control. The objectives of future research in precision weed management may be to integrate
spatial crop managementstrategies.
Weeddetectionis a critical componentin the utilization of the ideas developed in the research
projects carried out during thelast five years in Europe. Novel approachesarestill needed to
identify weed species and measure weed density. Cost-effective methodologies that combine
automatic and manual weed surveying may also be a direction for mapping permanent andsemi-permanent weed management zones, e.g. mapping areas with consistently high weed
pressure, areas with consistently low weed pressure or areas with unstable weed pressure.
Knowledge about the temporal and spatial stability of weed patches may be used to achieve
cost-effective weed mapping (Walter, 1996)

Table 1. Herbicide saving with spatial variable applicationof herbicide. Crop Experimental
layout
Decision
support
system
Savings Reference
Spring barley Complete
comparisonin
block design
DAPS 59% Heiselef al. (1997a)
Spring barley Desk-study DAPS 53% Christensen ef al. (1996)
Spring barley Whole-field trial DAPS 54% Heisel ef al. (1999)
Winter wheat Whole-field On/off
strategy withthreshold
40-50 % Gerhardsef al. (1995)
Winter wheat Whole-field On/off
strategy with
threshold
(only C.
arvense)
Potential
up to 89%
Nordmeyeref al. (1996)
Winter wheat Desk study On/off
strategy
9-32% Rew ef al, (1996)
Winter wheat Whole field Full rate/half
rate strategy
with
threshold
App. 21 % Gerhardsef al. (1997)
Winter barley Whole-field trial DAPS 66 — 75% Heisel et al. (1997b)
Winterbarley Desk-study DAPS 19% vs.
PCP
29% vs.
Threshold
Christensen ef al. (1999b)
Winter
wheat
Maize and
sugar beet
Whole-field On/off
strategy
Levels
based on
density
1. 54-70%
2,:25%
Gerhardse/ al. (1999)
Maize and
soybean
Desk study On/offstrategy
30-72% Johnsonef al. (1995)
Maize Desk-study on
12 farms
On/off
strategy with
threshold
71% broad-
leaf
94% grass
weeds
Mortensenef al. (1995)
Desk study On/off
strategy with
threshold
40 % Brown & Steckler (1995)
Wholefield On/offstrategy with
threshold 12-51 % Williams ef a/.(1998)
The breakthrough of new technologies and demands for reduced agro-chemical input to

benefit the environment and farm economy have given impetus to research and development
of advanced weed control measures, e.g. the real-time intelligent robotic weed control system
for selective spraying of in-row weeds using a machine vision system and a precision chemical
application system (Lee ef al., 1999).
REFERENCES
Ahrens W H (1994). Relative costs of a weed-activated versus conventional sprayer in
Northern Great Plains fallow. Weed Technology8, 50-7.
Audsley E (1993). Operational Research Analysis of Patch Spraying. Crop Protection 12,
111-9.
Auld B A; Tisdell C A (1988). Influence ofspatial distribution on weeds on crop yield loss.
Plant Protection Quarterly 3:81Berti A; Zanin G (1997). GESTINF: A Decision Model for Post-Emergence Weed
Managementin Soybean (Glycine Max (L) Merr). Crop Protection 16, 109-116.
Brown R B; Streckler J P G A; Anderson G W (1994). Remote sensing for identification of
weedsin no-till corn. Transaction of the ASAE 37, 297-302.
Brown R B; Steckler J-P G A (1995). Prescription maps for spatially variable herbicide
application in no-till corn. Transactions ofthe ASAL, 38, 1659-1666
Christensen S (1994). Crop weed competition and herbicide performance in cereal varieties
and species. Weed Research 34, 29-37.
Christensen S; Rasmussen G (1996). Crop-weed competition and choice of variety, seed rate
and drilling date in winter wheat. /3¢h Danish Plant Protection Conference Weeds, SP-
Report No. 4, 103-113.
Christensen S; Heisel T; Walter A M (1996). Patch spraying in cereals. Proceedings of the
Second international Weed Control Congress,. 963-968.
Christensen S; Heisel T; Benlloch J V (1999a). Patch Spraying and Rational Weed Mapping in
Cereals. Proceedings of the 4th International Conference on Precision Agriculture
(eds. Robert P C; Rust R H; Larson W E).Minneapolis, MN. USA., 773 - 785.
Christensen S; Heisel T; Paice M (1999b). Simulation of long term Alopecurus myosuroides
population using three patch spraying strategies. Proceedings of the Second European
Conference on Precision Agriculture (ed, JV Stafford), Part 2, 977-987.
Felton W L; McCloy K R (1992). Spot spraying. Agricu/tural Engineering 9, 1212
Giles D K; Slaughter D C (1997). Precision band spraying with machine-vision guidance and
adjustable yaw nozzles. 7ransactions of the ASAE 40(1), 29-36.Giles D K; Stone M L; Dieball K (i999). Distributed network system for control of spray
droplet size and application rate for precision chemical application. Proceedings of the
Second European Conference on Precision Agriculture (ed. JV Stafford), Part 2, 857-
866.
Gerhards R; Kithbauch W (1993). Dynamic Decision Model for Weed Control Methods in
Cereals by MeansofDigital Image Analysis. Journal ofAgronomy and Crop Science -
Zeitschrift Fur Acker Und Pflanzenbait 171(5), 329-35.
Gerhards R; Hayer R; Sdkefeld M; Schulze-Lohne K; Kithbauch W; Buchner W; Graff M
(1995) Ein Verfahren zur teilschlaggerechten Unkrautkontrolle in Winterweizen.
Mittelingen Gesundes Pflan.en Bauwissenschaften 8:172-175
Gerhards R; Sdékefeld M; Schulze-Lohne K; Mortensen D A; Kiihbauch W (1997). Site
specific weed control in Winter wheat. Journal of Agronomy and Crop Science 178,

219-225
Gerhards R; Sdkefeld M; Kithbauch W (1998), Einsatz der digitalen Bildverarbeitung bei der
teilschlagspezifischen Unkrautkontrolle. Zeitschrift fiir Pflanzenkrankheiten undPflanzenschutz, Sonderheft XV1, 273-278.
Gerhards R; Sékefeld M; TimmermannC; Reichart S$; Kihbauch W; Williams M M II (1999).
Results of a four-year study onsite-specific herbicide application. Proceedings of the
Second European Conference on Precision Agriculture (ed. JV Stafford), Part 2, 689-697.
Hausler A; Nordmeyer H; Nieman P (1998). Voraussetzungenfiir eine teilflachenspezifische
Unkrautbekampfung. Zeitschrift fiir Pflanzenkrankheiten und Pflanzenschutz,Sonderheft XVI, 249-256.
Heisel T; Christensen S; Walter M (1997a). Validation of weed patch spraying in spring barley
- preliminary trial. Proceedings of the First European Conference on PrecisionAgriculture (ed. JV Stafford), Vol Il, 879-886.
Heisel T; Christensen S; Walter A M (1997b). Weed managing model for patch spraying in
cereals. Proceedingsof the 3rd International Conference on Precision Agriculture (eds.
Robert P.C, Rust R.H. & Larson W.E.).Minneapolis, MN. USA., 999-1007.
Heisel T; Christensen S; Walter A M (1999). Whole-field experiments with site-specific weed
management. Proceedings of the Second European Conference on PrecisionAgriculture (ed. JV Stafford), Part 2, 759-768.
Hughes G (1989) Spatial heterogeneity in yield-weed relationships for crop-loss assessment.Crop Research 29, 87-94
Johnson G A; Mortensen D A; Martin A R (1995). A simulation of herbicide use based on
weedspatial distribution. Weed Research 35, 197-205.
Kwon T J; Young D L; Young F L; Boerboom CM (1995). PALWEED: WHEAT: A
bioeconomic decision model for postemergence weed management in winter wheat
(Triticum aestivum), Weed Science 43, 595-603.Langkilde N (1999). Practical experience with precision agriculture. Proceedings of the
Second European Conference on Precision Agriculture (ed. JV Stafford), Part 1, 35-49.Lee W S; Slaughter D C; Giles D K (1999). Robotic weed control system for tomatoes.
Precision Agriculture 1:95-119.
Martin-Chefson L; Chappron M;Philipp S (1999). A two dimensional method for recognising
weeds from multiband image processing. Proceedings of the Second international WeedControl Congress, 473-483.
Mortensen D A; Johnson G A; Young L J (1992). Weeddistribution in agricultural fields. In:
Proceedings of Soil Specific Crop Management. ASA-CSSA-SSSA, Madison,Wisconsin, USA, 113-124.
Mortensen D A; Johnson G A; Wyse D Y; Martin A R (1995). Managing spatially variable
weed populations. Sile-Specific Management for Agricultural Systems, ASA-CSSA-SSSA Publications, 397-415.
Nordmeyer H; Hausler A; Niemann P (1996), Patchy weed control as an approachin precision
farming. Proceedings of the First European Conference on Precision Agriculture (ed.JV Stafford), Part 1, 307-314.
Nordbo E; Christensen S; Kristensen K (1995). Teilflachen Unkrautmanagement. Zeitschrift
Sir Pflanzenkrankheit und Pflanzenschutz 102, 75-85.
Nordmeyer H; Hausler A; Nieman P (1996). Weed mapping as a tool for patchy control.
Proceedingsofthe Second International Weed Control Congress,. 125-130.
Paice M E P; Miller P C H; Bodle J (1995). An experimental machine for evaluating spatially
selective herbicide application. Journal of Agricultural Engineering Research 60, 107-
116.
Paice M; Day W (1997). Using computersimulation to compare patch spraying strategies, r
European Conference on Precision Agriculture, 421-428.
Pannell D J (1990). An economic response modelofherbicide application for weed control.
Australian Journal ofAgricultural Economics 34, 223-241.
Rew L J; Cussans G W; Mugglestone M A;Miller P C H (1996). A technique for mapping the
spatial distribution of Elymus repens, with estimates of the potential reduction in
herbicide usage frompatch spraying. Weed Research 36, 283-292.
Rew LJ; Miller P C H; Paice M E R (1997). The importance of patch mapping resolution for
sprayer control. Aspects ofApplied Biology — Optimising pesticide applications, 49 —
56.
Rydahl P; Thonke K E (1993). PC-Plant Protection: optimising chemical weed control.
Bulletin OEPP‘EPPOBulletin 23, 589-594.
Slaughter D C; Giles D K; Tauzer C J (1999). Precision offset spray system for roadway
shoulder weed control. Journal of Transportation Engineering 125(4), 364-371.
Stafford J V; Benlloch J V; Monto E:; Christensen S; Roger J-M (1997). Reducing or
eliminating agro-chemical inputs in efficient production of high quality produce with
conventional, sustainable and organic farming systems. Final Project Report for The
European Commission (Contact No. AIR3-CT93-1299), 118 pp.
Stigliani L; Resina C (1993). SELOMA- Expert System for Weed Managementin Herbicide-
Intensive Crops. Weed Technology 7, 550-559.
Swinton S$ M; King R P (1994). A Bioeconomic Model for Weed Management in Corn and
Soybean. Agricultural Systems 44, 313-335.
Thornton P K; Fawcett R H; Dent J B; Perkins T J (1990). Spatial weed distribution and
economic thresholds for weed control. Crop Protection 9, 337-342.
Walter A M (1996). Temporal and spatial stability of weeds. Proceedings of the Second
International Weed Control Congress, 125-130.
Walter A M; Heisel T; Christensen S$ (1997). Shortcuts in weed mapping. I" European
Conference on Precision Agriculture, 777-784.
Wiles L J; Wilkerson G G; Gold H J (1992). Value of Information About Weed Distribution
for Improving Postemergence Control Decisions. Crop Protection 11, 547-554.
Wiles L J; King R P; Schweizer E E; Lybecker D W; Swinton S M (1996). GWM: General
Weed Management Model. Agricultural Systems 50, 355-376.
Wilkerson G G; Modena S A; Coble H D (1991). HERB: Decision model for post-emergence
weed control in soybean. Agronomy Journal 83, 413-417.
Williams M M II; Gerhards R; Reichart S; Mortensen D A; Martin A R (1998). Weed seedling
population responses to a methodofsite-specific weed management. Proceedings of the
Fourth International Congress on Precision Agriculture (eds. Robert P.C., Rust R.H.,
Larson W.E.). Minneapolis, MN, USA, 123 — 133.
Wilson B J; Brain P (1990). Weed monitoring on a whole farm- patchiness andthe stability ofdistribution of A/opecuris myosuroides over a ten year period. In: Proceedings EWRSSymposium 1990: Integrated Weed Management in Cereals. EWRS, Vammela,Finland,
45-52.
Woebbecke D M: Meyer G E; Von Bergen K; Mortensen D (1995) Shape features for
identifying young weeds using image analysis. 7ransactions ofASAE 38(1), 271-281

THE 1999 BRIGHTON CONFERENCE- Weeds
Microcontroller-based multi-sensor system for online crop/weed detection
A Ruckelshausen, T Dzinaj, F Gelze, S Kleine-Hérstkamp, A Linz
University ofApplied Sciences Osnabriick; Department of Electrical and Computer
Engineering; Albrechtstr. 30, 49076 Osnabriick, Germany
J MarqueringAmazonen-Werke GmbH & Co. KG, Am Amazonenwerk 9-13, 49205 Hasbergen-Gaste,
Germany
ABSTRACT
Automatic crop-weed distinction has become increasingly important in weed
control applications. A newapproachbased on the combination of sensors with
different properties and a microcontroller hierarchy has been developed and
applied.
Plants may be described in terms of their geometrical, optical and mechanical
properties; each of the sensors selected is aimed at least at one of these
properties. Since selectivities vary, intelligent and real-time combination of
sensorsignals is crucial for distinguishing weed and crops, thereby compensating
for the lowerselectivities of single sensors. This is achieved by an architecture
utilizing high-end 8- and 16-bit microcontrollers communicating via CAN bus.
The high flexibility has been enhanced by adding programmable devices,
facilitating online adaption to specific crop-weed patterns. Sensors and software
are being activated as required. The system is designed for speeds up to 10 km/h
with a resolution of 1 sample/mm.
The multi-sensor-system has been applied to maize cultures in a greenhouse and
field experiments thereby activating mechanical hoes or position sprayers. The
first prototypes have been tested as mobile standalone equipmentand tractor-
mounted versions. The first experiments resulted in crop-weed-selectivities of
above 90 %.
INTRODUCTION
Ecological as well as economical demandsaim at further reduction of herbicide applications
for weed control. However, the local application of herbicides as well as mechanical weed
control systems strongly depend onthe availability of detection systems. The corresponding
sensorshaveto be able to distinguish between crop and weed or even recognize the different
weedplants. Moreover, the detection processhasto be veryfast for practical applications.
Up until nowno sensors have beenavailable satisfying the above mentioned requirements
with respect to quality and real time ("on-line") detection ability.

The most promising concepts for detecting single plants use optoelectronic devices, e.g.
image sensors or photodiodes.
The processing of image data obtained via a video camera has been improved during recent
years (Gerhards et al. 1998). However, the problems with respect to algorithms for
overlapping structures and the short processing time needed for on-line detection are not yet
solved. Addressable xy-imagers in CMOS technology have recently become available and
have been applied to crop-weed distinction by the authors (Linzet al., 1998, see table 1). The
high flexibility of these digital CMOS-cameras as well as their lowprice might result in a
strong impact of xy-imagers for on-line image analysis.
The second concept is based on the spectral properties of plants. Due to the typical reflection
in the near-infrared range caused bychlorophyll, green plants can be distinguished from soil
or wheat by relative measurements (Biller et al., 1997). Such systems are commercially
available for non-selective plant detection. Despite the fact that there are differences in the
reflection spectra from different weeds, the application of photo diodes with mountedfilters
for distinguishing "green" plants from "green" weed is limited caused by the mixed spectral
signature ofplants and soil.
The idea of combining different sensors in order to overcome the above described
disadvantages has recently been proposed by the authors (Dzinaj et al., 1998). The realisation
and application ofthis "multi-sensor-system" is described below.
MATERIALS AND METHODS
The multi-sensor-system has been designed for high precision agricultural applications to
detect single plants within rowcultures for crop/weed distinction and mechanical weed
control. The sensorsignals are available every millimeter up to a velocity of 10 km/h.
In order to detect single plants within rowcultures , the characteristics of crop and different
weed plants have to be considered. The spectral, geometric or mechanical properties could
vary due to their growth stages or environmental parameters. Thus a "plant database" is
generated which is crucial for the application. On the other hand, each sensor- as a part of a
multi-sensor-system - detects different aspects of the plants or non-target surfaces. The basic
idea of the concept is the correlation of different sensor signals with respect to the plant
characteristics. As an example the measured correlation of two optical sensors is shown in
figure 1.
The selectivity of the sensor signals with respect to the plant characteristics vary. A single
sensor signal might lead to a misinterpretation whereas the combination of all sensor signals
results in a higher selectivity for crop-weed-distinction.
The system architecture is shown in figure 2. Several sensors have been tested. including
various configurations with photodiodes and filters, CMOS-cameras, triangulation and
ultrasonic as well as pressure sensors (Dzinaj et al., 1998). In order to avoid high volume data
streams, each sensor has its own "intelligence" , namely an 8-bit microcontroller. In our
602

application the PIC-microcontroller from Arizona Microchip Technology was used . All
sensors were connected to the CAN bus via a CAN-interface. The multi-sensor-system was
controlled by a powerful 16-bit host microcontroller (C167 from Siemens). Data sampling on
the sensors was simultaniously triggered by a frame which is sent every millimeter by the
host controller. After a signal was detected by the CAN-interface a frame with reduced signal
data wasreturned to the host. The host combined the reduced signal data and took control
over a mechanical hoe, a position sprayer or any other actuator. The distance of the actuators
relative to the sensors as well as the velocity have been taken into account in the system
design.
Height-detector
Side-view sensor
Fig.1: Measured correlation of two optical sensor
signals. The information of a "Height-detector" (vertical axes)
is compared to corresponding numbers obtained from "Side-
view sensors"(horizontal axis).
The system is fully programmable thereby allowing a highflexibility with respect to different
row cultures, growth stages or environmental influences. The application of microcontrollers
has resulted in an embeddedsolution, no personal computer is needed for the application.
The humaninterface is realised via a touch panel, where input and output parameters can be
transfered.
The system setup consists of a learning phase, where the sensor data for a special row culture
are collected without any filtering. The high-volume data are analysed ("off-line") with a PC
and the correspondingcorrelations and thresholds are defined. These numbers are transfered
to the microcontrollers and the system is applicable. Depending on properties of the field and

the impact of environmental influences sensors as well as software programscan beactivated
or de-activated as required.
As far as possible standard sensor and electronic components have been used, thereby taking
into account cost considerations as an important issue during all stages of development.
ie ———) a aeItrasonic Sensor, Triangulation Sensor \ SensornTo T Sralaaae-
ae 8 bit 8 bit(Pecans Micrucontrviler Microcontroller}~_Sensor_—
a [canara] wees ips tn a="1IU CAN- interface CAN Interface LICAN- Interface 4
~y
— CAN- Bus16 bit CAN -
| |STSTeT Sos)
Interface |
CAN Interface \ICAN- Intertace, !issieo sae at
'8 bit
Micrucontrotler]
LtC Hoe>) Position~ a?
Microcontroller
a © Actuator n))
Fig.2 : Architecture of the multi-sensor-system for on-line crop/weed
detection.
DISCUSSION
The method has been applied to maize cultures as test plants for row cultures. This selection
has been influenced by selective geometric parameters of maize plants during the period of
mechanical weed contro].
Two different pieces of equipment have been constructed for use in practice (see table 1).
One multi-sensor-system was mounted on a vehicle and served as a test module (Sensor
Modul: "SEMO") for the implementation of newsensors or features (e.g. user interface,
position sprayer, slip correction, etc.) or test runs. The position of the vehicle was determined
by a position-sensitive sensor. Moreover a slip correction method has been developed by
using the information from the multi-sensor-system. A second multi-sensor-system (Low
Cost Modul: "LCM"; see fig. 3) has been designed with fewer sensors and optimised with
respect to lower susceptibility to malfunction, The influence of vibrations and dust or water
has been investigated and taken into account. Moreover, additional functionality - including
604

sensors - insure the reliability of the electronic signals. The LCM can beeasily changed from
a standalone mode fortest runs (similar to SEMO)to an aggregate coupled on a wagon for
agricultural tractor applications.
The multi-sensor-systems and the corresponding equipmenthasbeentested in different stages:
static and dynamic laboratory measurement setups , greenhouse and maize field. Experience
with respect to sensorselectivities and disturbances have been obtained.
To our knowledge, it has been demonstrated for the first time that a single crop (in our case:
maize) can be distinguished from a weed plant with an online multi-sensor system thereby
controlling a mechancial actuator or a position sprayer. A prototype version of the equipment
is available for determining agricultural parameters andreliability investigations.
Table 1 : Equipment for multi-sensor-systems
SEMO LCM
(mobile sensor module) (lowcost module)
Application Data collection
Test runs Test runs
UserInterface Aggregate for tractor-
Slip correction mounted hoe
Applied "Height-detector" "Height-profile-detector"
Sensors "Side-viewsensors" "Side-viewsensors"
"Soil-plant sensor" "Soil-plant sensor"
CMOS-camera CMOS-camera
Pressure sensors
Triangulation sensors
Ultrasonic sensors
Actors Hoe
Position sprayer
Acoustic or optical signals
There is still some optimisation to be done in order to create semi-automatic adaptions of the
system for different growth stages or soil structures. The corresponding task is dominated by
analyzing measurement data and changing the software of the microcontroller devices. The
whole system can be easily extended by connecting another sensor to the CAN-bus(see fig. 2)
and modifying the corresponding host controller software. The development of a multi-
sensor-system has movedstrongly from hardware optimisation to software activities.
The first field experiments in a greenhouse and a test maize field have been analyzed.
Preliminary results showthat typically 2-5 % of the maize plants were detected as weed, while
1-8 % of weed were detected as maize. Depending on the strategy of the actuator (position

sprayer, mechanical hoe) this would result in a loss of maize plants up to 5 % or an
incomplete weed control of 8 %. This numberstrongly depends on the soil structure and the
numberand shape of the weed plants.
Fig.3: Low-Cost-Modul (LCM) with a mechanical actuator
ACKNOWLEDGEMENTS
The work is supported by the "Deutsche Bundesstiftung Umwelt".
REFERENCES
Biller R H; Hollstein A; Sommer C (1997). Precision application of herbicides by use of
optoelectronic sensors. In: Proceedings of First European Conference on Precision Agri-
culture, Warwick University/UK, Vol. 2, Technology IT and Mangagement, p 451-458
Dzinaj T; Kleine Hérstkamp S; Linz A; Ruckelshausen A; Bottger O; Kemper M; Marquering
J; Naescher J; Trautz D; Wiferodt E (1998). Multi-Sensor-System zur Unterscheidung von
Nutzpflanzen und Beikrautern. In: Z.PflKrankh. PflSchutz, Sonderh. XVI, 233-242
Gerhards R; Sdkefeld M; Ktihbauch W(1998). Einsatz der digitalen Bildverarbeitung bei der
teilschlagspezifischen Unkrautkontrolle. In: Z.PflKrankh. PflSchutz, Sonderh. XVI, 273-278
Linz A; Klamt S; Berg T; Dzinaj T; Kleine Hérstkamp S; Ruckelshausen A; Sperschneider V;
Wiibben M (1998). Einsatz des FUGAI5C xc-Photodiodenarrays zur Erfassung von
Pflanzenmerkmalen. In: Z.PflKrankh. PflSchutz, Sonderh. XVI, 297-305

THE 1999 BRIGHTON CONFERENCE- Weeds 7TA-3
Vision system for weed detection using hyper-spectral imaging, structural field infor-
mation and unsupervised training sample collection
F Feyaerts, P Pollet, L Van Gool, P WambacqK.U.Leuven, Dept. ofElectrical Engineering, ESAT-PSI, Heverlee, B-3001, Belgium
ABSTRACT
Restricting the spraying of herbicides to control weeds is desirable, both from aneconomic and environmental point of view. Using an imaging spectrograph, hy-
per-spectral signatures of vegetation samples are gathered online. A classifier notonly distinguishes soil and vegetation but also recognises different vegetation
classes.
As the reflectance of plants varies with plant stress, depending on the unknown
field situation, a representative set of field samples must be collected for training
on a specific field. Manually collecting a representative set of samples requires
user-knowledge and time and is not economically feasible. Semi-supervised la-belling based on k-meansclustering, enables a system to automatically collect,
label andtrain the classifier for a set of hyper-spectral data samples.
Using this system to selectively spray on weeds only would result in acceptable
weed hit rates of 89% or higher and significant reductions in herbicide use (15-
67%), depending on the actual weed density in the field.
INTRODUCTION
Growing environmental consciousness and increased competition are the driving forces be-
hind precisionfarming. This trend encompassesefforts to decrease the use of herbicides. One
of the most promising techniques toward this end is place-specific spraying, i.e. to only spray
where the weed is. Studies have shownthat this approach could reduce the use of herbicides
for dicotyleclons (most of the vegetation) by 30-71% and for monocotyleclons (mostly
grasses) by 70-94% (Johnsonet al., 1995).
Initial attempts to reduce the use of herbicides were focused on distinguishing vegetationfrom soil. Spraying would thenberestricted to patches covered with vegetation, i.e. weeds
and crop. The goal of the reported work in this paper is to go a step further and also make themore subtle distinction between crop and different weeds. A few approaches have already
been suggested. One approach has been based on analysing the shapes and sizes of leaves
(Guyer et al., 1986; Gerhards et al., 1993; Franz et al., 1995). However, the current computa-
tional real-time requirements are probably beyond those that are economically feasible. Otherresearch has shownthat spectral reflectance of different plants may sufficeto tell them apart
(Knipling, 1970; Nitsch et al., 1991; Price, 1992 & 1994; Hahn & Muir, 1993). Classical
multi-spectral measurement devices (like a filter wheel held before a camera) are cumber-
some, slow, too expensive and too vulnerable to be mounted on a spray boom,or, as de-
scribed by Felton & McCloy (1992), they suffer from having too lowspatial resolution.

The work reportedin this paper aimedto establish the necessary technology to achieve these
goals. In particular, our aim was to design a weed sensorthat was sufficiently cheap and rug-
ged to be used on spray booms, repeated at distances of approximately 2.5 m. Real-time
analysis, high crop/weed recognition rates and minimal user-interaction are required to be
economically feasible.
Additional applications include selective fertilising or chemical thinning of crops(like sugar
beet) or fruit (e.g. apples). In combination with a GPS positioning system, the sensor can beused to make weed maps, importanttools in the decision part of the Precision Agriculture
chain.
METHODS AND MATERIALS
Multi-spectral sensor
The proposed weedsensoryields the spectrumof each point on a narrow linearstripe (Battey
and Slater, 1993; Herrala et al., 1994). The principle of operation is shownin Figure1.
Front
=
[siv\
x |}
Diffraction ~
Grating
ccDCamera
Figure 1: Working principle of imaging spectrograph
The objective lens (not shown in Figure 1) projects the image of a field patch on theslit ap-
erture of the spectrograph. This slit extracts a small stripe from the patch on the ground.
After collimating the incominglight in the front optics, the light is split into its spectral com-
ponents by a diffraction grating. The back optics form an image ofthe diffracted light on amonochromecamera. In this way, one of the axes of the camera acts as a spatial axis while
the other camera axis is a spectral axis. The quality of front and back optics, the height abovethe surface and the angle of view of the objective determine the spatial resolution along the
analysed stripe, while the resolution in the other direction is mainly determined by theslitwidth. The slit width and the numberof grooves in the diffraction grating mainly determinethe spectral resolution of this sensor.
It should be emphasised that the parameters of this spectrograph were designed to obtain a
low cost device that should operate under nermal daylight conditions with no light sources
other than the sun. With a slit width of 200 um, slit length of 8 mmand an objective with afocal distance of 3.5 mm,it is possible to analyse a stripe having a length of 2.5 m from a
height of 1 m with a spatial resolution of approximately 1.5 cm’. The spectral range (400-
1000 nm) with a resolution of about 35 nm, coincides with the typical spectral range of a
camera.

The imaging spectrograph has several clear advantages over other multi-spectral sensors. It
has no moving parts, resulting in high robustness with respect to vibrations of the sprayboom. All the spectral information relating to the analysed surface is available at once,
through diffraction of the reflected light. The limiting factor concerning speed is the frame
rate of the camera. Reflectance spectra can be gathered and processed online. There is also no
point in using the reflectance for all wavelengths. Computation times would be prohibitive
and there is substantial redundancy in the data. The optimal set of wavelengths depends on
the plants to be distinguished. One can take the wavelengths which maximise the following
class-to-class separation function in which theA/,(A)are the mean values of the reflected
light for class X and Y at wavelength A and in which thea? (A) are the class-dependent meas-
ured variancesat
F(aye IM» (A)=M,(A)| (1)
Voi (A)t+o7(A)
the same wavelength. Local extremes are found at certain wavelengths. The differences re-
flect underlying, physical differences between the plants (Hahn and Muir, 1993; Carter,
1993). Differences in the visible region are mainly determined by the plant-specific produc-tion of chlorophyll. It is even more important to analyse the reflectance in the near infrared
region where the reflectance depends rather on the internal structure of the plant like the
numberofcell layers, the size of cells and the orientation of the cell walls. The presence of
leaf hairs and waxes, characteristic for some plant species, can also influence the infrared re-
flectance.
Algorithms
Vegetation detection
Thefirst step in the process is to segment the vegetation parts from the background(soil) ona pixel-by-pixel basis, using the difference in reflectance of soil and vegetation in the red and
near infrared wavelength region.
Spectral reflectance of plants
Dueto intensity variations of sunlight and presence of shadowsyielding a higher share of
shorter wavelengths in the illuminating spectrum, reflectance (relative intensity) must bemeasured rather than irrradiance (absolute intensity). Comparing the irradiance from each
vegetation sampleto the irradiance from a referencedirectly illuminated by the sun orillumi-nated with shadow,results in illumination independentspectral plant signatures. Using a data
set of characteristic class spectral reflectance seems feasible. However, Carter (1993) showed
that plant reflectance is affected by external factors (stress) such as nutrient and water con-
tent, competition between plants, senescence, disease levels, herbicides and soil type. Notknowing in advance the actual parameters influencing the plant reflectance makes the use of
such a database impossible, as the actual field subset cannot be determined.
Scene prior knowledge
Presence of crop rows enablesthe use of prior knowledge about the scene, e.g. vegetation
between the crop rows can only be weed. However, the position of the spray boom with re-
609

spect to the crop rowsis not known exactly as the spray boom moves in the horizontal and
vertical planes. Therefore, the crop rows must be detected digitally by examining repetition
in the distances between the geometric centres of the vegetation parts, The distance between
the crop rowsis repeated most if weeds are uniformly distributed over the analysed area. It
needs mentioning that weeds need only be distributed uniformly on a local scale. On a field
scale, they may be, and often are, localised in patches.
Practically, repetition in plant-to-plant distances is determined counting the occurrence ofremainders x after division of the distance by some denominator 6. The denominators can berestricted to the set of plant-to-plant distances. The error in row establishment and measure-
ment (€) is also included to restrict the number of evaluations even further. All distances
closer than tolerance é can be regarded as the same distance. The base with the most almost
zero or almost base remainders, is probably the distance between the crop rows. In fact, the
distance between row-plants can bee larger or smaller than the average row-distance, re-
sulting in small or very large remainders.
The proposed algorithm only holds if weed is uniformly distributed at a local scale, if the
sensor is able to analyse a sufficient number of crop rows at the same time and if the weed
density is sufficiently small. It is noticed that if the weed density is too high, the crop rows
will not be recognised. In that case, if the number of vegetation parts is below weedtoler-ance, every plant sample needs to be evaluated spectrally. Otherwise, the spray nozzles can
be activated immediately.
Automatic gathering and labelling of data samples
Gathering a field representative training set suffices to discriminate betweenall the crop and
weedplants onthat field. This method requires gathering of samples and training ofthe clas-sifier on each field separately. Collecting samples manually is not feasible as the possible
end-users do not have the time and may not always have the required knowledge.
The proposed procedure eliminates these restrictions completely. User-interaction in particu-
lar is eliminated if the crop is planted in rows. This is the case for a lot of economically im-
portant crops such as maize or sugar beet. Spot spraying with a mix of herbicideskillingall
the weeds in one run,is feasible if the samples can be labelled as crop or weed. The weed
samples need not necessarily be groupedinto the individual weed classes.
Thebasic principle of the algorithm is that crop only appears in the rows while weed appearsboth in and between the rows. Each subset (cluster) jof the collected data set consists
ofN7; data samples with NR, row-samples and N7’, — NR, between-the-row (certainly weed)
samples. If V,(Eq.2) is the relative amount of row samples in cluster j, x, =1—V,is the
relative amount of known weed samplesin cluster j. x, is a good first order estimate for the
relative number of weed samplesin the set of row samplesif this subset is a good representa-
tive for the cluster population. The estimated relative number of weedsin cluster 7 (Q, seca )
and the corresponding variance (o ) are therefore calculated as in Eq.2.J.weed

vy, = NR, /NT,
NT,-NR, NR, NT,—NR,Pjweed = 4=1-V?
fatal=(=zvi}amDjseed =
Assigning a croplabelto the cluster samples is acceptable if the hypothesis that the samples
are weeds can berejected on a (high) significance level (.§ , Eq.3) calculated as the unilateral
Gaussian probability with expected number of weeds and corresponding variance.
_(eCEHwee
e 2a}ceed 2a?mit
2n- G5.weeda) ieo>.weedatie*
_ (NT, ~NR,)+x,NR,_NT,
The relative number of samples, given a crop label, labelled incorrectly ( € ) is given by Eq.3.
Labelling as crop after clustering the set of samples based on the spectral signatures of the
sampleswill actually result in even more errors at low values of V,. As crop and weeds have
characteristic spectral signatures, most of the row-samples in the set of samples that areclosely located to mostly weeds in the feature space, will probably be weeds also. At higher
values of V7, the error will probably be lower as there will be almost no known weed sam-
ples around inthe feature neighbourhood, so that the row-samples are mostlikely crop.
The collected set of data samples must be split in crop and weed clusters. The k-meansclus-
ter algorithm that was used, is a stochastic algorithm in which & cluster centres are chosen
randomly in a set of data samples. The cluster centres are shifted towards stable positions,minimising the summed distances between each sample and the cluster centre. Adaptation of
the algorithm by choosing the initial cluster centres evenly over the subsets of row-samples
and between-the-row samples, guarantees faster convergence towards crop and weedclusters.
The density of the crop samples may be much lowerthan the density of weed samples sothatrandominitialisation may result in only weed clusters. Each subset for which the hypothesis
of weed cannot be rejected with necessary significance must be split in two subsets of whichone may contain significantly more row-samples and one may contain less row-samples. As
shownpreviously, above a certain V’,, the latter may be interpreted as a weedcluster. To
keep the rejection significance high, clusters are also only split if they contain a large numberof samples of whichat least 10% are expected to be crop. Thesplitting algorithm stopsif the
resulting numberof crop samples reaches the expected number of crop samples. This number
can easily be calculated taking into account the length, width and numberofanalysed lines
and the real row-distance and distance between cropplants in the row.
Using high weed rejection significance, most of the samples in crop labelled clusters will
actually be crop samples. Also a small number ofreal weed samples will get the wrong la-
bels. On the other hand, weed labelled clusters may contain some false-labelled crop samples.
By iteration of the procedure, weeds will mostly be labelled as weed whereas crop will be
labelled as crop or weed, resulting in small variation in labels for weed and higher variation
61

for crop samples, The sampleis finally labelled as weed if the variance is lower than the re-
ciprocal of the numberofiterations, otherwiseit is labelled as crop.
RESULTS
Measurementconditions
The spectral measurements were obtained underreal-field conditions: outdoor measurements
for actual plants on real fields. Plant leaves and soil showed natural variation in orientation.The sun’s illumination (intensity, spectrum and direction of incidence) and the vehicle speed
varied while gathering the spectral data samples.
The experimentsin the rest of this paper were based on reflectance measurements (referencecorrected) of manually labelled plant samples on onefield only. Samples were collected until
a statistically relevant number of samples was obtained. The actual range of influencing fac-
tors on thatfield therefore most likely affects the reflectance of the samples. Special care was
taken to gather a data set of only healthy looking crop and weed samples. One of the most
economically important crops, sugar beet, was selected for the experiments. The data set con-
sisted of 905 samples of Beta vulgaris L. (commonbeet), together with Poa annua L. (annual
meadowgrass, 1830 samples), Plantago lanceolata L. (narrow-leaf plantain, 1412 samples),
Stellaria media L. (common chickweed, 1019 samples), Chenopodium album L. (fat-hen, 867
samples) and Polygonum persicaria L. (Redshank, 988 samples). The plants, fully grown,
varied in age from 4 to 8 weeks.
Measurements were performed using a monochrome 2” (4.8 x 6.4 mm) CCD-camera (MX5
of Adimec) coupled to the imaging spectrograph described earlier. The processing unit con-
sisted of a 166 MHz Pentium PC with 32 Mbytes RAM.
As we were dealing with more than two classes, wavelengths were selected for each combi-nation of crop and weed. The most separating wavelength for each pair was selected auto-
matically. Lower ranking wavelengths were only added if they were separated by more thanthe spectral resolution from those already selected (higher ranked extremes). The samples
were classified using a non-linear mapping neural network (Rumelhart et al., 1986) withthree layers: an input layer with 5 neurons, a hidden layer with 8 neurons and an output layer
with 2 neurons, one for each class (crop or weed). The training procedure was implementedwith a back-propagation learning rule using an adaptive learning rate and momentum. The
former minimises the learning time, the latter minimises the risk to get stuck in a local mini-
mum ofthe error function.
Case study
For the experiments, data sets were created synthetically from the perfectly labelled set, con-taining crop and weed samplesin selected amounts. Every crop sample and part of the weeds,
depending on the ratio of rowtolerance W (7.5 cm) and distance between the rows K (45 cm),
were given a row label. The rest of the weed samples were given a between-the-row (known
weed) label. This kind oflabelling is possible with the algorithm presented above. The cluster
procedure was repeated on data sets with different relative amounts of crop and weed sam-
ples for a fixed row width W and compared to classification, weed hit rates and herbicide re-
ductions with perfect labelling calculated under standard conditions on sugar beet fields. The
612

spray resolution was determined by spray width and spray length. The spray width is the size
of the spray pattern along the axis of the spray boom. The resolution in the driving direction(spray length) was determinedbythesize of the spray pattern in that direction, the on/off fre-
quency of the spray nozzle in combination with the driving speed and the set-up time for a
stable spray pattern. A planar spray pattern, extremely small in the driving direction and sta-
ble within milliseconds, has an achievable on/off frequency, limited by fluid dynamics, of 15
Hz. Driving at a speed of 4.05 km/h resulted in a spray length of 7.5 cm.
Table 1: Classification results, hit rate and herbicide reduction for varying weed density after
proposedlabelling (left) and perfect labelling (right)
Weed density (#m~) 12 37 86 Weed density (#/m”) 37Proposedlabelling Perfectly labelled
Sugarbeet 97 97 99
Weed 95 96 97
Weedin row as weed 75 85Average Noofclusters 9 14
Classification Classification
Sugarbeet 97 96 98 Sugar beet 97Weed 91 88 61 Weed 99
Average 94 92 80 Average 98
Spraying effect Spraying effect
Hit rate 93 94 89 Hit rate 99
Herbicide reduction 68 31 15 Herbicide reduction 26
Table 1, right showsthat for perfectly labelled samples, the classifier has an average sample
classification success rate of 98%, an expected weed hit rate of 99% and a herbicide reduc-
tion of 26% for an average weed density of 37 weed plants/m’. With the proposedlabelling,
Table 1 showsthat the labelling accuracy is almost insensitive to the weed density. A low
increase in accuracy with increasing weed density could be explained by the fact that rela-
tively more weed samples present between the rows(certainly weed) enable to cluster the
weed samples more accurately. For the same reason, crop could also be labelled more accu-
rately. Correspondingclassification success rates do not differ significantly from the case in
which the sample labels are perfectly known. The success rate for the crop samples follows
the same tendency as the crop labelling accuracy. However, they show a decrease in recog-
nising the weeds with increasing weed density. Weedhit rates arestill acceptable for all weed
densities. Herbicide reductions decrease, as expected, with increasing weed density. Due to
an increase in the classification error, the herbicide reduction remains significant, even for
the higher weed density.
CONCLUSIONS
Existing spectral measurement techniques are far too slowto beintegrated into an online in-
telligent spray apparatus. The spectral measurement technique we implemented combines
spectral resolution andspatial sensitivity to a fast and sufficiently accurate crop versus non-
cropclassifier.

The proposed cluster algorithm can be used to label a set of data samples, collected with the
proposed multi-spectral image sensor. Prior row or between-the-row labels that were as-
signed to each of the samples suffice to eliminate every user-interaction and user-knowledgein collecting and labelling the data set. Based on the labelled data set, a classifier was trainedto recognise crop and weed for selective spraying of weeds only. This resulted in acceptable
weed hit rates of 89% or higher and significant reductions in herbicide use (15-67%), which,
for the simulated weed densities, spot-spraying becomes economically feasible.
ACKNOWLEDGEMENTS
Our special thanks go to the Flemish Community (VLIM-project), the Belgian Ministry of
Agriculture (IWONL-project) and Ecospray, our industrial partner, for the financial support
for this project.
REFERENCES
Battey D E; Slater S J (1993). Compact holographic imaging spectrograph for process con-
trol applications. In: Optical methodsfor chemical process control, SPIE 2069, 60-64.
Carter G A (1993). Responsesof leaf spectral reflectance to plant stress. In: American Jour-
nalofBotany 80(3), 239-243.
Felton W L; McCloy K R (1992). Spot Spraying, Microprocessor controlled, weed-detecting
technology helps save money and the environment. In: Agricultural Engineering.Franz E; Gebhardt M R; Unklesbay K B (1995). Algorithmsfor extracting leaf boundary
information fromdigital images of plant foliage. In: Transactions of the ASAE, 32(2),
625-633.
Gerhards R; Nabout A; Sokefeld M; Kihbauch W; Nour Eldin H A (1993). Automatische
Erkennung von zehn Unkrautern mit Hilfe digitaler Bildverarbeitung und Fouriertrans
formation. In: Journal ofAgronomy and Crop Science, 171, 321-328.
Guyer D E; Miles G E; Screiber M M; Mitchell O R; Vanderbilt V C (1986). Machine vision
and image processing for plant identification. In: 7ransactions ofthe ASAE, 29(6),
1500-1507.
Hahn F; Muir A Y (1993). Weed-crop discrimination by optical reflectance. In: /V’ Jnterna-
tional Symposium on Fruit, Nut, and Vegetable Production Engineering.
Herrala E; Okkonen J; Hyvarinen T; Aikio M; Lammasniemi J (1994). Imaging spectrometerfor process industry applications. In: SP/E 2248, 33-40.
Johnson G A; Mortensen D A; Martin A R (1995). A simulation of herbicide use based on
weedspatial distribucion. In: Weed research, 35, 197-205.
Knipling E B (1970). Physical and Physiological Basis for the Reflectance of Visible andNear-Infrared Radiation from Vegetation. In: Remote Sensing ofEnvironment, Ameri-
can Elsevier Publishing Company.Inc.Nitsch B B; Von Bargen K; Meyer G E (1991). Visible and Near-Infrared Plant, Soil and
Cropresidue. In: Reflectivityfor weed sensor design, ASAE International SummerMeeting Presentation, paper No.913006.
Price J C (1992). Variability of high-resolution crop reflectance spectra. In: JiternationalJournal ofRemote Sensing, 13(14).
Price J C (1994). How Unique are Spectral Signatures? In: Remote Sensing ofEnvironment,
American Elsevier Publishing Company.Inc.
Rumelhart D E; Hinton G E; Williams R J (1986). Learning internal representations by error
propagation. In: Parallel Data Processing, 1(8), 318-362, MIT Press, Cambridge.

THE 1999 BRIGHTON CONFERENCE - Weeds
Theinfluence of growth stage of weeds on the glyphosate dose needed
H de Ruiter, AJ M Uffing & N M van Dijk
Research Institutefor Agrobiology and Soil Fertility (AB-DLO), P O Box 14, NL-6700 AA
Wageningen, The Netherlands
ABSTRACT
Three distinct growth stages of black nightshade and couch grass were treatedwith eight different glyphosate rates. Black nightshade wastreated at the 3-4,
5-6 and 9-10 leaf stage and couch grass wastreated at the 3-4, 5-6 and 7-9 leaf
stage. Dose responserelationships demonstrated that the EDso for glyphosate
was 7, 36 and 130 g ae/ha with black nightshade at the 3-4, 5-6 and 9-10 leaf
stages, respectively. The EDso (dose giving 50 % response) with couch grass
was on average 18 g ae/ha and wasfairly constant at the different growth
stages investigated. Relevance of relative growth rate, absolute fresh weight,
spray retention and species-dependenceis discussed.
INTRODUCTION
Insight into the impact of different weed species and the weed growth stage on herbicide
susceptibility may contribute to reduction of application rates (Kudsk, 1989). In this studywe investigated the influence of growth stage on the susceptibility for the herbicide
glyphosate. The application of glyphosate in glyphosate-resistant crops with a population
of weedsat various stages of growth is another argumentfor this study.
Previous reports indicated that plants at later growth stages are less susceptible to
glyphosate (Ahmadief a/., 1980; Mesa-Garcia ef al., 1984; Ralphs ef al., 1992; Taylor &Oliver, 1997). Broad bean (Vicia faba L.) (Mesa-Garcia ef al., 1984) and duncecap
larkspur (Delphinium occidentale S. Wats.) (Ralphs ef al., 1992) becameless susceptibleduring and after flowering. The perennial couch grass (Elytrigia repens L. Nevski)
appearedto beless susceptible at young stages (1-3 leaf) when compared with the 4-7 leaf
stages (Rioux ef al., 1974; Ivany, 1975). A study onfive species of annual morningglory
(Ipomea spp.) demonstrated that the influence of growth stage on glyphosate efficacy
depended onthe species (Wehtje and Walker, 1997).
The stage of growth may influence the susceptibility-determining factors like entry of
glyphosate into the plant and the distribution in the plant. Young barnyardgrass absorbed
more glyphosate and translocatedthe herbicide moreefficiently than older stages (Ahmadiet al., 1980). At the shoot elongationstage, ligustrum (Ligustrum japonicum Thunb.) and
blue pacific juniper (Juniperus conferta Parl.) absorbed more glyphosate than at other
stages (Neal e# al., 1985). Studies on flax (Linus usitassimum L.) (Harvey et al., 1985) andCanada thistle [Cirsium arvense (L.)] (Hunter, 1995) indicated that the source-sink
relation at the different stages of growth determined the direction of the glyphosate
translocation in the plant.
In addition to the obvious demand for entry of glyphosate into the plant and translocation
of sufficient amounts to the meristems, we argue that the plant’s response, after inhibition
of the enzyme EPSP synthase by glyphosate, may also depend on the growth stage. A
young rapidly growing plant needs the functioning of the target and will be harmed more
by target-inhibition than an older plant growing notat all or slowly. Studies on water-
stressed plants provided some evidencefor this idea (de Ruiter and Meinen, 1998). In thisstudy we wanted to investigate whether relative growth rate is a suitable tool for fine-
tuning of glyphosate application rates. Therefore, we measured the influence of growth
stage on glyphosate susceptibility in relation to the growth rate at different stages. To
determine accurately the influence of growth stage, we established a dose-responserelationship at each growth stage using black nightshade (Solanum nigrum L) and the
perennial couch grass. Wealso investigated whether spray retention was affected by
growthstage.
METHODS AND MATERIALS
Plant material
Black nightshade and couch grass were grown in 1 1-cm diam.potsfilled with a mixture of
sand and humicpotting soil (1:2, v/v/). After emergence the black nightshade plants were
thinned to one plant per pot. Five one-node segments of couch grass rhizomes were
planted and the plants emerged were thinned to three per pot. The plants were grownunder the following conditions: additional light (high-pressure mercury lamps, 12 h),
18/12 °C (light on/light off) temperature and 70/80% (light on/light off) relative humidity.
The pots were placed on sub-irrigation matting which was wetted daily with water andtwice a week with nutrient solution.
Characterization of plant growth
The growth ofblack nightshade and couch grass plants was monitored during a period of
eleven weeks. The first harvest of both species was ten days after emergence and was
followed by twenty-one harvests with an intervening period ofalternately three and four
days. The growth of black nightshade was analyzed by measuring fresh and dry weight ofthe aerial parts and the roots. The growth of couch grass was analyzed by measuring fresh
and dry weight of the aerial parts, the roots and the rhizomes. Wealso determined per pot(three plants) the numberof rhizomes, the length of the rhizomes and the numberofbuds.
The influence of growth stage on glyphosateefficacy
Black nightshade plants at the 3-4, 6-7 and the 9-10 leaf stage and couch grassat the 3-4,
5-6 and the 7-9 leaf stage were sprayed with glyphosate solutions. In one experiment wealso treated black nightshadeat the 1 1-leaf (flowering) and the]3-leaf stage (seed-filling).
Each week, the growth of a new batch ofplants was started such that the different growthstages of one species could be treated on the same day. Prior to treatment four pots were
used to characterize the plants at the time of treatment as described above. Another fourpots were used to determinethe retention of spray solution on the foliage for each stage of
growth. The glyphosate solutions contained the monoisopropylamine salt of glyphosate ateight different concentrations and the polyoxyethylene (15) tallow amine surfactant

(Ethomeen 1/25) at 2.5 g/litre. The 3-4 leaf and the 6-7 leaf stage of black nightshade
weretreated with glyphosate at application rates ranging from 1 to 265 gae/ha. The 7-9
leaf stage and older stages were treated with rates ranging from | to 1908 g ae/ha. Couch
grass was treated with glyphosate at application rates from 1 to 578g ae/ha. The
glyphosateefficacy was determined by measuring the fresh weight of the aerial parts two
weeks (black nightshade) and two or three weeks (couch grass) after treatment. The
glyphosate solutions were applied with an air-pressured laboratory track sprayer delivering
400litres/ha at 303 kPa. Spray solutions used for quantification of retention on the foliage
contained the fluorescent dye Na-fluorescein at a concentration of 0.1 g/litre and the
surfactant at 2.5 g/litre. Retention of the spray solution was quantified by
spectrofluorometry according to Richardson (1984).
Experimental design and data analysis
Period of growth wasthe variable in the growth experiment. At each of twenty-two time
points four pots were takenout for harvest of the plants. Due to a limitation in the number
of pots that could be placed in a tray, the pots were distributed over two randomized
blocks with each two replicates. One experiment was conducted under the greenhouse
conditions as described underplant material and another experiment was conducted under
similar conditions in a climate chamber. The mean fresh weights ofthe aerial parts were
subjected to nonlinear regression (Genstat 5) using the equation for the Gompertz curve:
y =atcexp (-exp (-b (x-m)))
In this equation y is the fresh weight, x is the numberof days after emergence, a, b, and c
are parameters describing the shape andthe position of the curve. The calculation of
relative growth (RGR) wasbased on the equation for growth by using:
RGR= (1/y) (dy/dx).
Glyphosateefficacy
All pots of one growthstage wereplaced in one completely randomized block with four
replicates in the block. The positions of the blocks were randomized. At least four separate
experiments were conducted with each species. The mean fresh weights ofthe aerial parts
were subjected to nonlinear regression (Genstat 5) using the equation:
y=a+c/(1 + exp (-b (x-m))
In this equation, y is the fresh weight, x is In(glyphosate concentration), a is the lower
limit at large doses, a + c is the upper limit at zero dose, m is the InNEDso (EDso is
equivalent dose for 50 % response) andb is the slope parameter that determines the slope
around the EDso. The InEDso values were subjected to analysis of variance.
RESULTS AND DISCUSSION
Growth of black nightshade and couch grass

Growth of black nightshade (Fig. 1A) was monitored until 83 days after emergence andthat of couch grass (2A) was monitored until 81 days after emergence.
40 0.8Black nightshade (A) Black nightshade (B)
30 } 06
20 - 0.4 +
Freshweight(g)
10 + 0.2 +
0 1 i 1 1 L 4 0 4 L 4 4
10 20 30 40 50 60 70 80 10 20 30 40 50 60 70 80Daysafter emergence Daysafter emergence
Figure 1. Fitted growth (A)andrelative growth (RGR)ofblack nightshade(aerial parts)grownin the greenhouse.
Couch grass (A) (Couch grass|
Fres
hweight
(g)
RGR(day"')
sli
10 20 30 40 50 60 70 80 10 20 30 40 50 60 70 80Days after emergence Daysafter emergence
Figure 2. Fitted growth (A)andrelative growth (RGR)ofcouch grass(aerial parts)grownin the greenhouse.
The flowering of black nightshade started around 40 days after emergence and the seed-
filling period started around 60 days after emergence. Couch grass did not flower during
the growth experiment. Development of rhizomes started from 33 to 36 days after
emergence and the numberofrhizome budsperpot(three plants) was 80 at the end of the
monitoring-period. The RGR ofboth species was relatively low 40 days after emergence(Figs. 1B and 2B). At the young stage of couch grass, the fitted growth curve diverged
somewhatfrom thepattern in the plot of the fresh weights measured (not shown) and this
resulted in unrealistic high values for the RGR between 10 and 20 days after emergence.
Influence of growth stage on susceptibility for glyphosate
Black nightshade becameless susceptible at later stages of growth (Table 1) as was shownfor other species (Ahmadi et al., 1980; Mesa-Garcia et al., 1984: Ralphs et al., 1992;
Taylor & Oliver, 1997). At the flowering stage (49 days after emergence) and the seed
filling stage (63 days after emergence) the plants lost their susceptibility almostcompletely. The limited number of growthstages tested so far (5) do not allow to consider
accurately a mathematical relationship between EDso and RGR (Table 1B). There seemsto be a clear inverse relationship: EDso increases when RGR (based on aerial parts)decreases.

Table 1. Influence of growth stage on the susceptibility ofblack nightshade for glyphosate
EDso (g ae/ha)
Experiment
DAE! Leaves 1 3 4 5 Mean
21-22 3-4 6.7 10.9 4.9 9.1 Ta28-29 5-6 14.9 44 10.4 nd 36b33-36 9-10 nd 133.9 86.6 258.4 130¢49 1 >>63 13 >>?
' DAE days after emergence.? Means within one experiment followed by the same letter do not differ at the 5 %
probability level (LSD).> Glyphosate at 1908 g ae/ha reduced the fresh weight by less than 20 % ofthe control
plants.
Byusing the data of the separate experiments we could describe a linear relation between
fresh weight on the day of treatment (x) and the EDso (y) as y=12.3x (R7=0.75). The
retention of spray solution (y) was influenced by the fresh weight on the day of treatment
(x) according to y=0.7x?-52x+1021 (R?=0.97). This means that the retention decreasesfrom 1000 to 100 yl g-' dry wt from the very young stageto theseedfilling stage. The
retention decreases by 50 % from thefirst stage to the third stage (from 21 to 36 days after
emergence) and we do notthink that this explains the substantial increase of EDso (Table
1). The surfactant selected was included for its property to enhancethe foliar uptake of
glyphosate (de Ruiter 1998). Although foliar uptake is not yet determined at the older
stages we suggestthat the source-sink relationships in the plant and the RGR rather thanthe targeting of the herbicide determined the influence of growth stage on glyphosateefficacy. The data indicated that the absolute fresh weight on the day of treatment and
RGRofthe aerial parts of black nightshade hasthe potential to serve as an indicator for
glyphosateefficacy.
Couch grass demonstrated the same susceptibility for glyphosate at the stages tested
(Table 2). We did not find a lower susceptibility at a young stage (3-4 leaf) as mentioned
before for the 1-3 leaf stage (Rioux ef al., 1974; Ivany, 1975). Difference in growth stage
Table 2. Influence of growthstage onthe susceptibility of couch grass
for glyphosate.EDsv (g ae/ha)
Experiment
DAE! Leaves l 2 3 4 Mean’
17-18 3-4 nd 20.9 11.7 10.5x IS.la
23-25 5-6 20 28.4 16.7 18.8 21 a
31-37 7-9 22.9 26.2 9.7 10.4 17.34
TDAE days after emergence.
? Meanswithin one experiment followed by the same letter do not differ at the
5 % probability level (LSD).

and experimental procedures may explain this. Equal susceptibility at older stages wasfound previously (Ivany, 1975), The level of retention of spray solution varied between350 and 500 ul g’' dry wt among the separate experiments and was not influenced bygrowth stage (data not shown). The RGRofthe aerial parts was lower at the older stagestested but this had no impact on susceptibility for glyphosate. At the oldest stage tested(33-36 days after emergence, 9-10 leaf stage) the plants just started with the developmentof new rhizomes. This means that the foliage, although growing at a lower RGR, is anactive tissue involved in the translocation of assimilates and a phloem-mobile compoundlike glyphosate to the rhizomes and the roots. Apparently, RGR ofand fresh weight of theaerial parts of couch grass are no suitable parameters for fine-tuning of glyphosateapplication rates. We suggest that rhizome development and the ratio between aerial partsand the rhizomes maybetter parameters. We suggest that regrowth from budsis the bestand most relevant methodtotest this,
Weconclude that the usefulness ofthe relative growth rate of the aerial parts and the freshweight on the day of treatment, as indicators for glyphosate efficacy, is species-dependent.Our data with black nightshade indicate that these parameters are suitable for annualdicots.
REFERENCES
Ivany J A (1975). Effects of glyphosate application at different growth stages on quackgrass control. Canadian Journal of Plant Science 55, 861-863.
Ahmadi MS; Haderlie L C; Wicks G A (1980). Effect of growth stage and waterstress onBarnyardgrass (/chinocloa crus-galli) control and on glyphosate absorption andtranslocation. Weed Science 28, 277-282
De Ruiter H; Meinen E (1998). Influence of water stress and surfactant on the efficacy,
absorption, and translocation of glyphosate. Weed Science 46, 289-296,Harvey B M R; Spence L; Crothers S H (1985). Pre-harvest retting of flax with
glyphosate; effect of growth stage at application on uptake, translocation andefficacy of glyphosate. Annals ofApplied Biology 107, 263-270
Hunter J H (1995). Effect of bud vs rosette growth stage on translocation of 14C-glyphosate in Canadathistle (Cirsium arvense). Weed Science 43, 347-351.
Kudsk P (1989). Experiences with reduced herbicide doses in Denmark and thedevelopment of the concept of factor-adjusted doses. BCPC Crop ProtectionConference-Weeds 6a-1, 545-554.
Mesa-Garcia J; De Haro A, Garcia-Torres L (1984). Phytotoxicity and yield response ofbroad bean (Viciafaba) to glyphosate. Weed Science 32, 445-450.
Neal J C; Skroch W A; Monaco T J (1985). Effects of plant growth stage on glyphosateabsorption and transport in Ligustrum (Ligustrum japonicum) and Blue pacificjuniper (Juniperus conferta). Weed Science 34, 115-121
Ralphs M H; Evans J O; Dewey S A (1992). Timing ofherbicide applications for controlof larkspurs (Delphinium spp.). Weed Science 40, 264-269
Richardson, R. G. (1984). Fluorescent tracer technique for measuring total herbicidedeposits on plants. Australian Weeds 3, 123-124.
Rioux R; Bandeen J D; Anderson G W (1974). Effects of growth stage on translocation ofglyphosate in quack grass. Canadian Journal ofPlant Science 54, 397-401
Wehtje G; Walker R H (1997). Interaction of glyphosate and 2,4-DB for the control ofselected morningglory (/pomoeaspp.) species. Weed Technology 11, 152-156

THE 1999 BRIGHTON CONFERENCE- Weeds
Evaluating site-specific weed control in a maize-soybeanrotation system
HJ Goudy,F J Tardif,
Department ofPlant Agriculture, University ofGuelph, Guelph Ontario Canada
RB Brown, K A Bennett
SchoolofEngineering, University ofGuelph, Guelph Ontario Canada
ABSTRACT
Targeting weed patches for herbicide application potentially represents cost
savings for operators and reduction in environmental herbicide load. An
experiment wasinitiated in a no-till corn field in Ontario, Canada, in 1998 and
continued in rotation with no-till soybeans in 1999. Weeds were intensively
scouted in a 4 ha area and weed distribution maps were generated for both
years. Efficacy of weed control and yield were compared between
conventional broadcast treatments and site-specific application treatments.
Treatments were applied using a direct injection sprayer. Cornyield in 1998
wasidentical acrossall treatments. In 1998 and 1999 there was no difference
in the level of weed control between treatments and the percent area sprayed
in the site-specific treatments was reduced as much as 26 to 59% in some
treatments.
INTRODUCTION
In traditional agricultural weed managementsituations herbicides are sprayed on the entire
field with the assumption that weed distribution is random or uniform throughout the field.
However, in most cases weeds are patchy or clustered in distribution (Mortensen &
Dieleman, 1997; Cousens & Woolcock, 1997). The concept of site-specific herbicide
applications offers the opportunity to reduce the environmental impacts of herbicide use in
farming while maintaining efficacy and profitability. In theory, site-specific herbicide
applications would only target the areas in the field that have weed patchesat densities that
would impacton the yield of the crop. Stafford & Miller (1996) have suggested that there
would be a 40 to 60% reduction in the amountofherbicide inputs into the environmentif
site-specific applications were utilised. As well as the potential environmentalbenefits, site-
specific applications would economically optimise the use of herbicides and thus result in a
cost reduction for the farmer.
As of yet, there has been verylittle research done examining if site specific herbicide
applications would perform as effectively, with regard to weed control, compared to
broadcast herbicide applications. Another important issue relating to site-specific
applications that has not been adequately investigated is the effect of targeting weed patches
for herbicide applications onpatchstability. If patches remained relatively stable in a field
from year to year then farmers could use the same weed maps for several years without
havingto havetheir fields re-mapped yearly.

The objectives of this research are to monitor the efficacy of site-specific herbicideapplications comparedto broadcastherbicide applications for weed control andyield, and tomonitor the dynamics of weed patches and weedfree areas overtime.
METHODOLOGY
A commercial no-till field site in a corn-soybean-wheatrotation was chosen for the study. In
the spring of 1998, a 100 x 400m portion ofthe field was flagged on a 6 x 6m grid. Flags
were geo-referenced using a GPS andleft as semi-permanent markersin the field throughout
the summer. In 1998 the field was planted into corn and in 1999 wasplanted into soybeans.
Just prior to the 5" leaf stage of the corn and the 2”trifoliate stage of the soybeans weed
counts were conducted. At each flagged intersection point a 1 x 1m quadrat was laid down
on the ground and weeds within the quadrat wereidentified and counted.
From the weed counts, weed contour maps were developed for the most prevalent speciesusing the GIS program Surfer. Simple point kriging was used as the interpolation methodbased on the variograms developed in Gstat for each species.
The field was further divided into 16 plot areas of 28 x 85m. The experiment waslaid outaccording to a randomized complete block design with 4 replications and 4 treatments. The
same randomization was used from year to year. Each weed contour plot map was divided
into management units of 3 x 5m that the sprayer was capable of targeting. Decisions on
whether to spray or not were based on the presence of targeted weed species above thethreshold density of 1 shoot m? in any portion of each decision unit. For each plot there
were 136 decision units. The broadcast treatment plots were not assessed and the wholeplot
area was targeted for herbicide application. Depending on the treatment, twoorthree of the
weed density contour maps were overlaid. Once the decisions about what units would be
sprayed had been made, prescription maps were created that could be read by the on-sprayercomputer.
The direct injection sprayer system (Bennett & Brown, 1999) is equipped with a water tank
and a separate container of the herbicide that is to be injected according to the prescription
map. The sprayer constantly sprays the carrier and injects the herbicide only for those
decision units that have been prescribed for application. Therefore two types ofsite-specific
applications were possible, 1) injection of herbicide for targeted areas only or 2) injection ofherbicide for the targeted areas and simultaneous blanket coverage overthe entire plot area
with another herbicide mixed into the carrier tank.
In 1998the herbicides sprayed were nicosulfuron/rimsulfuron, flumetsulam/clopyralid/2,4-Dand atrazine at 0.10 kg ai/ha, 0.28 kg ai/ha and 1.15 kg ai/ha, respectively. In 1999 the
herbicides sprayed were chlorimuron ethyl at 0.009 kg ai/ha and acifluorfen at 0.6 kg ai/ha.Applications were madeat the 6" leaf stage of the corn in 1998 and the 2™trifoliate stage ofthe soybeans in 1999 according to the treatmentlists in tables 1 and 2. Three to four weeksafter application, weed counts were conducted on the same 6 x 6m sampling grid. Yield was
also collected in the autumn of 1998. Statistical analysis was performed using an ANOVAand means were compared using the LSD test.

Table 1. Herbicides applied and weeds targeted in 1998Weedstargeted”
Treatment no.
_
Herbicides TAROF SONAS EQUIR
Flumetsulam/clopyralid/2,4-D r° I I
Atrazine + nicosulfuron rimsulfuron I I I
Flumetsulam/clopyralid/2,4-D BC BC BC
Atrazine + nicosulfuron rimsulfuron x I I
Flumetsulam/clopyralid/2,4-D BC BC BC
Atrazine + nicosulfuron rimsulfuron I I I
Flumetsulam/clopyralid/2,4-D BC BC BC
Atrazine + nicosulfuron rimsulfuron BC BC BC
* TAROF: Taraxacum officinale, SONAS: Sonchus asper, EQUIR: Equisetum arvense.
> 1: herbicides injected for patches above threshold density, X: no injection even if density is
above threshold: and BC: broadcastapplication of the herbicides to the whole plotarea.
Table 2. Herbicides applied and weedstargeted in 1999Weedstargeted"
Treatment no. Herbicides CHEAL SONAS EQUIR
Chlorimuron +acifluorfen I I I
Chlorimuron BC BC BC
Acifluorfen I Xx I
Acifluorfen BC BC BC
Chlorimuron Xx I X
4 Chlorimuron +acifluorfen BC BC BC
* CHEAL: Chenopodium album, SONAS: Sonchus asper, EQUIR: Equisetumarvense.
® Symbolsas pertable 1.
RESULTS AND DISCUSSION
The most prevalent weed species found over the two years were field horsetail (Equisetum
arvense), spiny-annual sowthistle (Sonchus asper), common lambsquarters (Chenopodium
album) and dandelion (Taraxacum officinale). Visually the field horsetail patch was quite
localized and very dense and this was confirmed by the geostatical analysis. The variogram
equation reflected the high spatial correlation with a nugget value of zero and the range of
spatial dependence was of 61.54 m. The spiny-annual sowthistle patches ran lengthwise in
the field following the direction of the implementtraffic and this was reflected in the
variogram equations with north/south (N/S) anisotropy. Both spiny-annual sowthistle and
common lambsquarters had relatively low nugget values indicating that spatial correlation
existed but random variation was also present. Common lambsquarters had a muchshorter
range of spatial dependenceat 6.7 m while spiny-annual sowthistle had a range of 14.33 m.
Common lambsquarters was not present at high densities in 1998 and was not targeted.
Howeverit was found to be very abundantin this field in 1999 and densities warranted its
inclusion in the decision grid. Dandelion wastargeted for herbicide application in 1998 but
not in 1999. The variogram equation indicated that there was no spatial correlation and
623
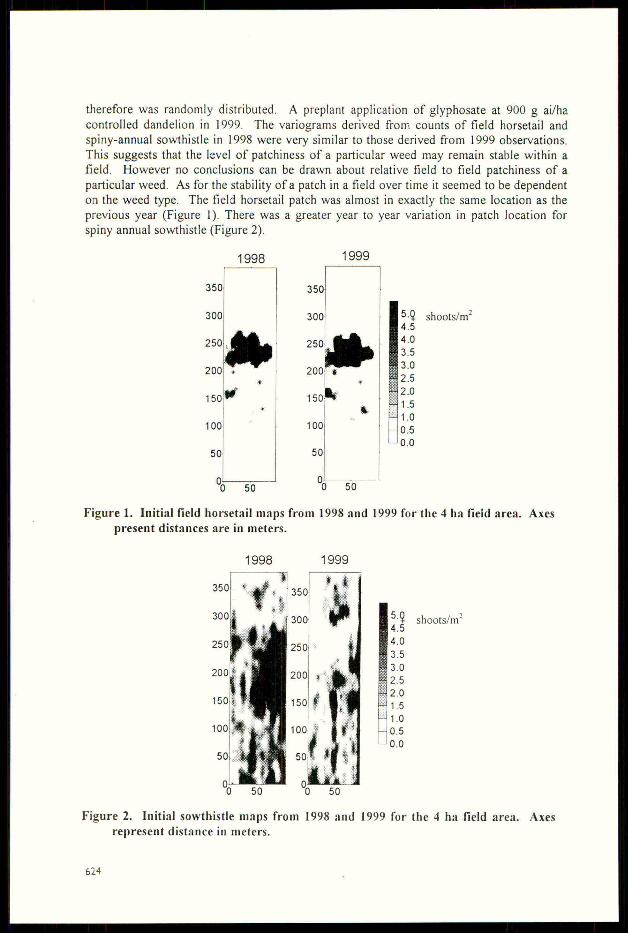
therefore was randomly distributed. A preplant application of glyphosate at 900 g ai/ha
controlled dandelion in 1999, The variograms derived from counts of field horsetail and
spiny-annual sowthistle in 1998 were very similar to those derived from 1999 observations.
This suggests that the level of patchiness of a particular weed may remain stable within a
field. However no conclusions can be drawn about relative field to field patchiness of a
particular weed. Asfor the stability of a patch in a field over time it seemed to be dependent
on the weed type. Thefield horsetail patch was almost in exactly the same location as the
previous year (Figure 1). There was a greater year to year variation in patch location forspiny annual sowthistle (Figure 2).
4998 1999
350
Figure 1. Initial field horsetail maps from 1998 and 1999 for the 4 hafield area. Axes
present distances are in meters.
5.9 shoots/m?4.5
4.0
Figure 2. Initial sowthistle maps from 1998 and 1999 for the 4 hafield area. Axes
represent distance in meters.

Weed control was assessed by comparing the initial weed counts in each quadrat with the
counts for that same quadrat 3 to 4 weeksafter application. Regardless of the year, there
wasno significant difference in weed control between any of the treatments for each species.
In 1998, excellent control of spiny-annual sowthistle and field horsetail were obtained with
values ranging between 76 to 92% and 86 to 99%, respectively. Control of dandelion ranged
between 69 to 80%. In 1999, control of spiny-annual sowthistle ranged between 97 to 99%.
Control of lambsquarters and field horsetail was lower which reflects the fact these species
are difficult to control with the herbicides used in 1999. Levels of control ranged between
28 to 70% for lambsquarters and 10 to 41%with field horsetail.
There were no differences in yield between any of the treatments in 1998 with values
ranging from 9.0 to 9.5 tonnes/ha. There was, therefore, no yield advantage in applying
herbicides to the whole field as compared to the site-specific applications. The absence of
yield differences among the four treatments is in agreement with the fact that weed control
levels were identical.
With these results in mind the next relevant question is whether the actual plot area sprayed
was reducedin the site-specific treatments and to what magnitude. In 1998 the actual area
sprayed in the site-specific treatment (1) was 26% less than the traditional broadcast
treatment (4 in Figure 3). However, the combination site-specific/broadcast treatments (2
and 3) were not different from treatment 4. In 1999, there was no differencein the total area
sprayed with site-specific treatment (1) as compared to treatment 4, but the combinationsite-specific/broadcast treatments (2 and 3) reduced the actual area sprayed by 59 and 50%,
respectively. The reductions seen in the combination site-specific/broadcast treatments (2and 3) are only representing the injection componentofthe application.
01998
m 1999
Aver
age%
AreaSprayedof
TreatmentArea
Treatment
Figure 3. Reduction of area sprayed by using site-specific herbicide applications in both
1998 and 1999 as comparedto broadcast.
Site-specific herbicide applications provided encouraging results in both years. Thereduction in herbicide inputs would be meaningful economically to a farmer as well as
environmentally to the public. However the entire process is in need of refinement.
Obviously, in a large field scale situation the intensive sampling method that was used would
be time consuming and costly. As technology progresses, better ways of accurately locating
weed patches in the field when the weeds are small and within the herbicide application
window will be developed. The direct injection sprayer restricted the size of our decision
unit. Perhaps a flexible decision unit size would reduce the number of zones that were
targeted where only a very small portion of the area was above the threshold density.Moreover, the decision whether to spray an area or not was based on single criteria forall
broadleaf weed species. Realistically, each weed species would have a different impact on
the crop based on density, location in the patch (Mortensen & Dieleman) and time of
emergence. Leaving an area unsprayed because it did not have weeds above threshold
densities may impact the possibility of using the same weed maps overseveral years. For
example in 1998 common lambsquarters was not targeted because it was not above the
threshold but in 1999 it was one of the major species in this field. More research into thedynamics of weed patches as well as the impact of site-specific herbicide applications is
required if precision weed managementis to be a success.
REFERENCES
Bennett K A; Brown R B (1999). Field Evaluation of a site specific direct injection herbicidesprayer. Presented at 1999 ASAE Annual International Meeting, Paper No. 99-1102.
ASAE, 2950 Niles Road, St. Joseph, MI 49085-9659 USA.
Cousens R D; Woolcock J L (1997). Spatial dynamics of weeds: an overview. Brighton
Crop Protection Conference - Weeds. 7B 7,613-618.Mortensen D A; Dieleman J A (1997). The biology underlying weed managementtreatment
mapsand maize. The Brighton Crop Protection Conference - Weed. TB 9, 645-648.
Stafford J V; Miller P C H (1996). Spatially variable treatment of weed patches. Precision
Agriculture 3, 465-473.
THE 1999 BRIGHTON CONFERENCE- Weeds
Methodsof weed patch detection in cereal crops
P J W Lutman, N H Perry
IACR-Rothamsted, Harpenden, Herts, ALS 2JQ, UK
ABSTRACT
This paper reviews the merits of real-time and map-based systems of weed
assessments and discusses the importance of the precision of the map.
‘Traditional’ mapping based on weed density counts on a regular grid are useful
for research purposes but are too expensive for practical on-farm mapping. Visual
weed detection systems can already be used to record weeds but tend to be labour
intensive and so need improvement to increase their cost-effectiveness. The
potential for automatic weed detection is being explored by a numberofresearch
teams. Reflectance techniques can already be used to detect weeds in uncropped
areas and between crop rows in crops sown with wide row spacings. However,
although progress is being made with experimental systems, commercially viable
methods to detect weeds within narrow row crops are not yet available. Systems
involving combinations of reflectance, colour and leaf shape are in development
and someare being tested in the field. There has to be a compromise between the
cost of mapping and the needfor the mapto reflect the distribution of weeds. Thus
fine maps are preferred to the cheaper coarse maps since some of the advantages of
the technique will be lost if sample grids are too coarse.
INTRODUCTION
The development of the mechanical and electronic components of spatially selective weed
control (patch spraying) is proceeding apace, in step with yield mapping andspatially variable
fertiliser application. A number of manufacturers are developing variable rate sprayers with
the capability to patch spray weeds. Control systems such as the AGCO Fieldstar have the
potential to control such sprayers and Global Positioning Systems (GPS)are able to locate the
sprayer’s position in the field with reasonable reliability. A recent (1998) survey of maize
(corn) growers in the mid-west USA reported by Robert (1999) indicated that 29% ofall
growers were field mapping in some way and 14% were yield monitoring. In Europe uptake of
this technology is also growing and the number of combine harvesters with a yield mapping
capability is increasing. However, the current low prices for grain may be slowing the uptake
of this new technology. Most emphasis, to date, has been put on spatially variable fertiliser
application. The use of this technology to control weeds on spatially selective basis is not so
far advanced. Oneof the main reasons forthis is the difficulty of resolving the question, how
do you assess the weeds? The answerto this question has considerable implications for the
economic success of the technique of patch spraying weeds, as expensive assessments could
nullify the cost savings arising from the reductions in herbicide use.
There are three basic questions that have to be answered.
1) Howdo yourecord the distribution of weeds? Can a visual (human) method
be used or should assessment be automated?

Should the assessment be based on creation of a weed distribution map for
subsequentuse in controlling the sprayer or should the weed mapping and
treatmentbe in one operation (real-time detection)?
3) Howprecise does the map have to be?
In the following sections we will review the current state of development of the various
techniques that can be used to assess weeds. It is clear that some potential users believe that
the only practical way forward is to combine detection and herbicide application in one
operation, with real-time detection of weeds. However, we believe that there are also
advantages to map-based systems, where the weeds are assessed either automatically or
visually prior to application and the herbicide application is controlled by an application map
derived from the weed map. The former has the advantage of immediacy, whilst the latter
offers the potential for consideration of herbicide choice and the need for buffers, prior to
treatment. Many of the mapping issues described belowrelate to both real-time and mapped
based application systems.
MANUAL WEED DETECTION TECHNIQUES
Assessment systems that involve some form of human assessment of weed distribution
normally require the production of a map which can then be used to control the herbicide
application. Except at a very primitive level, real-time detection and treatment is not possible
in such systems. It is possible for farmers, when treating weeds late in the season, to switch
spray booms on and off as they travel across fields, identifying primary weed patchesat the
same time. However,this is a very coarse approachto patch treatment.
Density assessments from GPSlocated quadrats
Most of the research programmes concerned with the potential of spatial treatment of weeds
have been based on grids of quadrats, located either with GPS or by measurement. The counts
generated by these quadrats have then been converted to weed contour mapsby kriging or a
related method. This is a satisfactory method for research purposes, although the issue of the
optimum grid size is still to be resolved (see below). The practical field mapping and spatial
treatment programmes in Germany (Gerhards et al., 1997; Hiusler er al., 1998), Denmark
(Heisel et al., 1999) and Canada (Goudy er al., 1999) all use grids of various sizes to
determine thespatial distribution of weeds. This technique is perfectly acceptable for research
purposes andis an invaluable tool for ‘ground truthing’ assessments made from aerial images
or from other automated detection methods (see Rewet al., 1999). It is, however, far too
labour intensive for practical farm use.
Ground-basedvisual detection
This technique is based on a humanobservertravelling in a regular pattern overthe fields to be
mapped, visually recording the presence and absence ofthe target species. The operator's
position is geo-referenced using a GPS system and the resultant map can be used subsequently
to control herbicide treatments. It is possible to map weeds using this technique from anall-
terrain vehicle (ATV), whilst the crop is small (e.g. in winter in autumn sown crops),
providing an opportunity for pre-treatment mapping. It is also possible to map certain species

during summerfrom a tractor or at harvest from a combine harvester, recording areas of poor
control, which will highlight those areas where seed return will be highest and where most
weedswill be expected in the following year. It is possible to record presence absence and/or
to quantify infestations into low/high. Such a technique wastested extensively by Rew in the
UK, (Rewet al., 1996; Lutman er al., 1998) but she used three people (a driver and two
assessors) to map weeds, whichis too extravagant with labour to be commercially viable. The
mapped species tend to be the more aggressive ones that inevitably are more visible. This is
an advantage,as it is these species that are the most appropriate targets for spatially selective
treatments, and are targeted with specific rather than broad-spectrum treatments, which tend to
be expensive (e.g. control of Alopecurus myosuroides (black-grass) and Galium aparine
(cleavers) in UK winter cereals). Faechner & Hall (1999) have reported a two-person system
ATV-based method for mapping Cirsium arvense (creeping thistle) and Sonchus sp. (sow-
thistle) in oilseed rape (canola). They were able to map presence and absenceofthethistles (at
20 mintervals) in a 28 ha field in | h. Colliver ez al. (1996) have compared quadrat counts of
Avena fatua (wild-oats) with observations of pre-harvest and at-harvest panicle distributions.
Quadrat counts were most time consuming but were mostaccurate.
Our ownstudies this year have explored the practicality of single-person mapping from an
ATY,atractor or from a combine harvester. It is possible to map in this way but current
mapping hardware needs to be modified for single person operation. Progress is being made
with voice-recognition software so that the tractor/combine driver mapping weeds has only to
speak into a microphone (M E Paice, pers. comm., 1999). Preliminary estimates from ATV
mapping based on 6 m intervals, and tractor mapping based on 12 m intervals, indicate thatit
is possible to map at 2-4 ha/h from an ATV and 3-6 ha/h from a tractor, depending on field
length and numberof turns (N H Perry, unpubl. obs.). Combine mappingis inevitably slower
than tractor mapping, but provided the driver is doing the mapping, this is not a problem.
Combine mapping has the advantage that the width of view (header width) would be less than
with other forms of mapping, providing a more accurate weed map. Howeveronly certain
weeds, such as A. fatua, C. arvense and Elymus repens (common couch) will be visible at this
time. Our work suggests that such visual methods are practical for commercial farmers or
their crop protection advisors, provided maps do not have to be created every year.
AUTOMATED WEED DETECTION TECHNIQUES
Automated detection systemsoffer the possibility of both creating weed maps that can be used
to control subsequent herbicide treatment, or could be connected directly to the sprayer
providing a mechanism for real-time detection and treatment.
Satellite and airborne remote sensing
Both these remote sensing techniques depend on automated detection, with sensors recording
multispectral differences in the landscape. These images can then be manipulated, if
necessary, to highlight the specific aspects of the image that are of interest, to create a
treatment map for subsequent herbicide application.

Satellite mapping
The accuracyofsatellite-based mapping has improved overthe last 10 years and such maps are
widely used to evaluate changes in larger scale features of the landscape. Their potential to
map weeds has been explored by several research teams, mostly concentrating on extensive
agriculture or weed problems of semi-natural and natural habitats. For example, Anderson et
al. (1993) report the use ofsatellite images to map Ericamera austrotexana (false broomrape)
in Texas rangelands. At certain times of the yearsatellites could be used to detect major
stands of this weed and produce geo-referenced maps. In this surveyeach cell (pixel) was 20
m*. This technique has limited relevance to weeds in arable fields, as satellites still have
relatively coarse spatial resolution and onlya limited range of spectral bands. Consequently,
the technique is more suited to mapping invasive weeds that inundate large areas, such as
bracken in the UK, than for mapping weedsin arable fields.
Aircraft based mapping
A numberof researchers concerned with extensive arable agriculture have investigated the
potential for aircraft mounted spectral reflectance meters to detect and locate weed patches. A
recent paper by Rewezal. (1999)reports the results of airborne mapping ofA.fatuain a field
oftriticale in Australia. Multispectral images were collected, with a pixel resolution of 1m and
the maps created were compared with maps from quadrat counts on a 7 x 7 m grid. The
multispectral images detected high infestation areas but could not detect those where A. fatua
density was below 20 plants/m’. A similar study on flowering infestations of Hieracium
pratense (yellow hawkweed) in meadowsofIdaho, also used multispectral images collected
from an aircraft (Carsonef al., 1995). They too achieved 1m ground resolutions. However, as
with the Rew study, the imaging system was unable to detect low infestations of the weed (less
than 20% cover).
At present, this technology does not provide adequate precision for the mapping of weed
infestations in arable fields, especially where weeds occurat relatively low, but still damaging,
levels of infestation. Improvements in sensor technology and in ground resolution down to sub
metre pixel sizes may result in more practical systems being developed in the future
(McGowan, 1998).
Vehicle and hand-held systems
Ground-based detectors that use red and infra-red reflectance to detect green weeds against a
brownsoil background, have been in existence for more than 15 years (Haggaret al., 1983).
Commercial machines have been developed for treatment of weeds pre-drilling, pre-harvest,post-harvest and in fallows, and for application between the rows of crops, such as maize and
soybeans sown with wide row spacings (Felton, 1995; Blackshaw er al., 1998; Hanks & Beck,
1998). Research on reflectance characteristics of the visual and infra-red spectra has shown
that individual plant species differ in their reflectance characteristics at certain wavelengths.
Consequently, it may be possible to utilise such differences to develop in-crop methods to
identify weeds. However, changes in sunlight, in plant age and in physiological conditionsall
alter reflectance characteristics, making reliable distinction between species hard to achieve.
More recent research has attempted to improvereliability, with some success. Vrindts ef al.
(1999) reported some progress with the technique when they comparedreflectance ratios ofsix
630

specific wavelengths on nine different species and were able to discriminate between sugar
beet and maize and weeds with a 99% level of accuracy. However, this work was done with
plants in containers and needs to be validated under more variable field conditions. The
research by Feyaerts et al. (1999), reported at this conference, continues the investigations of
the potential for multi-spectral reflectance to identify the presence of weedsin crops.
An alternative approach to exploit reflectance has also been investigated (Christensen, 1993).
This assumesthat the crop had a uniform green area and consequently it is possible to calibrate
a reflectance meter on weed free areas of the crop. The presence of weeds would result in a
change in reflectance from the background level. This technique will not identify species but
will indicate areas ofthe field that have high and low levels of weed infestations. However,it
has not been very successful becauseofspatial variability in crop cover.
Image-based systems
Becauseof the difficulties of detecting weeds within crops using spectral reflectance, a number
of researchers have been exploring the potential for using images from digital cameras to
detect weeds. There are a number of problems. Detection systems have difficulty
discriminating between species when the leaves overlap and the computing time to achieve
identification of species is appreciable, making fast real-time detection difficult. Andreasen et
al. (1997) have investigated the potential for integrating optical coloured images. Some
discrimination was possible. Research by Gerhards (Gerhardset al., 1998) has made progress
using a digital camera and computer system to identify plant species from their outline. A
similar system in Australia uses colour and shape to identify Chondrilla juncea (skeleton
weed) in wheat and lupin stubbles (Robbins, 1998). The prototype machines were able to
travel] at 12 kph, whilst still achieving 95%detection rates. Both these two examples use
shrouded cameras and artificial illumination to create even lighting conditions. Effective
visual detection may need to combine data relating to geometrical, optical and mechanical
properties of the species to be identified. The work of Chapron et al. (1999a) has attempted to
identify weed seedlings in maize using a combination of geometric and colourattributes of the
plants and has given encouraging results, even where leaves overlap. Chapron and his
colleagues have also been exploring the potential for using 3D images to enhance detection, as
this technique incorporates differences in heights of different species (Chapron et al., 1999b).
Only the Robbins project has reached the stage of extensive field validation, although the
Gerhards detector has also been tested in the field.
The aim ofall the research on automated detection is to develop accurate and speedy methods
for the field detection of weed species within narrow-row crops. Progress is being made but
although it is possible to detect weeds in wide row cropsorin fallows, it is not yet possible to
detect weeds in cereals, for example, reliably and quickly using automated techniques. It
seemslikely that successful systems will require computers to integrate information primarily
on plant colour and plant shape to create reliable detection methods
MappingIntensity and Accuracy of Maps
There has to be a compromise between intensity of sampling/detection that is required to
create an accurate weed map and the time and equipment required to do the work. This is
most clearly shown in the grid sampling for weed density, where researchers have used very
631

different grid sizes to detect patches. For example, Mortensen in the USA has generally used 7
m grids (Johnson et al., 1996), Christensen in Denmark 24 m (Christensen & Heisel, 1998)
and Hausler in Germany 30 and 50 m (Hiuslerer al., 1998). The coarser the grid theless is
the precision, the greater the percentage ofthe field that appears infested and the lower the
potential reduction in herbicide use. The early work done in the UK was based on mapsusing
2 x 1 m resolution and calculations were done to assess the consequences of increasing grid
size to 6 x 1 m. This increasedthe area treated by approximately 10%(Rewet al., 1997). The
potential reductions in herbicide use depends on the aggregation of the species concerned, the
size of the assessmentgrid and theflexibility in the sprayer, as to the minimum area that can
be treated. There is a direct mathematical relationship between the grid size, the aggregated
nature of the distribution of the weeds and the percentage of the field that is infested
(Wallinga, 1995). For example,in a patchy field with a 10 x 10 m assessment grid, 50% of the
field appeared infested but if the grid was reduced to 4.6 x 4.6 m only 25% of the field
appeared weedy. Weed assessments based onlarge grid sizes that are relatively cheap to
produce mayfail to deliver optimum savings in herbicide use.
Automated detection systems have similar problemsto grid samples, as although detection in a
forward direction can be continuous, the sprayer may only be equipped with one or two
expensive detectors. This will result in a grid that could be | x 6 m or even 1 x 24 m, if a wide
sprayer was only equipped with one detector. Ideally, each boom section should have its own
detector. The same problem arises with visual weed assessment from the tractor. Although
the operator will be assessing continuously in a forward direction, he/she will only be able to
detect weedsto the left or to the right of the tractor and thus will be constrained by the width
of the tramlines and the width of the sprayer. Thus mapping from a 24 m sprayer would result
in grid sizes of | x 12 m. This can be overcome with maps created from a combine harvester
or ATV, wherethe grid width of the former is the header width of the harvester (circa 6 m) and
that of the latter could be 1 x 6 m, as the ATV can be driven between tramlines to create a
smaller grid size.
CONCLUSIONS
From discussions we have had in recent months in the UK, and presentations at the recent
Precision Agriculture Conference in Odense (Stafford, 1999). it seems clear to us that for ‘in
crop’ weed assessment there is currently no commercial alternative to manual weed
assessments to create weed maps. Reflectance techniques are already commercialised for
applications of herbicides in fallow and other non-cropped areas and in crops grown on wide
rows, where the detector is distinguishing between green plants against a brown background.
At the moment, automated detection is not an option for commercial use in patch spray
systems, as the technology is not yet able to detect green weeds in a green crop. There are
some exciting developments involving detection based on combinationsof reflectance at a
range of different wavelengths, colourand leaf shape, but as yet, such techniquesare still at the
experimental stage. If manual visual assessmentis to be used, it needs to be a single person
operation, preferably with the potential for the vehicle driver to map weeds whilst doing
another operation. This could be possible with voice recognition software or with simple
combinations of toggle switches. Thefinal crucial issue is that we believe that to optimise the
technique weed mapsneedto becreated with relatively small grid sizes. It is our belief that

grids of 6 x 6 m should be the maximum size, otherwise too much of the potential of the
technology is discarded by the coarsenessofthe grid.
ACKNOWLEDGEMENTS
The IACR-Rothamsted research included in this review has been funded by the MAFF
SAPPIO/LINKproject ‘Exploiting Weed Patch Dynamics’. IACR-Rothamsted receives grant
aided support from the Biotechnology and Biological Sciences Research Council.
REFERENCES
Anderson G L; Everitt J H, Richardson A J; Escobar D E (1993). Using satellite data to map
false broomweed (Ericameria austrotexana) infestations in South Texas rangelands.
Weed Technology7, 865-871.
Andreasen C; Rudemo M; Sevestre S (1997). Assessment of weed density at an early stage by
use of image processing. Weed Research37, 5-18.
Blackshaw R E; Molnar L J; Lindwall, C W (1998). Merits of a weed-sensing sprayer to
control weeds in conservation fallow and cropping systems. Weed Science 46, 120-126.
Carson H W; Lass L W; Callihan R H (1995). Detection of yellow hawkweed (Hieracium
pratense) with high resolution multispectral digital imagery. Weed Technology 9, 447-
483.
Chapron M; Requena-Esteso M, Boissard P; Assemat L (1999a). A method for recognising
vegetal species from multispectral images. In: Precision Agriculture ‘99, ed. J V
Stafford, pp. 239-248. Sheffield Academic Press Ltd: Sheffield.
Chapron M; M, Boissard P; Assemat L (1999b). A method for 3D reconstruction of
vegetation by stereovision. In: Precision Agriculture 99, ed. J V Stafford, pp. 249-246.
Sheffield Academic Press Ltd: Sheffield.
Christensen S (1993). Electronic weed cover assessment. In: Quantitative approaches in weed
and herbicide research andtheir practical application: Proceedings 8 European Weed
Research Society Symposium. pp. 63-70, Braunschweig, Germany.
Christensen S$; Heisel T (1998). Patch spraying using historical, manual and real time
monitoring of weeds in cereals. Zeitschrift fiir Pflanzenkrankheiten und Pflanzenschutz
Sonderheft XVI, 257-263.Colliver C T; Maxwell B D; Tyler D A; Roberts D W; Long D S (1996). Georeferencing wild
oat infestations in small grains: accuracy and efficiency of three weed survey techniques.
In: Proceedings 3” International Conference on Precision Agriculture, eds P C Roberts,
RH Rust & W E Larson, pp 453-463. ASA/CSSA/SSSA: Madison.
Faechner T; Hall L (1999). Operational site specific spraying. Weed Science Society of
America Abstracts39, 34-35.
Felton W L (1995). Commercial progress in spot spraying weeds. Proceedings Brighton Crop
Protection Conference — Weeds, 1087-1096.Feyaerts F; Pollet P; Van Gool L; Wambacq P (1999). Vision system for weed detection using
hyper-spectral imaging, structural field information and unsupervised training sample
collection. Proceedings Brighton Crop Protection Conference — Weeds(this issue).
Gerhards R: Sdékefeld M: Schulze-Lohne K; Mortensen D A; Kiihbauch W (1997). Site
specific weed control in winter wheat. Journal of Agronomy and Crop Science 178,
219-225.

Gerhards R; Sdkefeld; Kiihbauch W (1998). Einsatz der digitalen Bildverarbeitung bei der
teilschlagspezifischen Unkrautkontrolle. Zeitschrift fiir Pflanzenkrankheiten und
Pflanzenschutz Sonderheft XV1, 273-278.
Goudy H J; Bennett K A; Brown R B;Tardif F J (1999). Evaluating site-specific weed control
in a maize-soybean rotation system. Proceedings Brighton Crop Protection Conference
— Weeds(this issue).
Haggar R J; Stent C J; Isaac S (1983). A prototype hand-help patch sprayer for killing weeds,
activated by spectral differences in crop/weed canopies. Journal of Agricultural
Engineering Research 28, 349-358.
Hanks J E; Beck J L (1998). Sensor-controlled hooded sprayer for row crops. Weed
Technology 12, 308-314.
Hausler A; Nordmeyer H; Nieman P (1998). Voraussetzungen fiir eine teilflachenspezifische
Unkrautbekampfung. Zeitschrift fiir Pflanzenkrankheiten und Pflanzenschutz Sonderheft
XVI, 249-256,
Heisel T; Christensen $; Walter A M (1999). Whole-field experiments with site-specific weed
management. In: Precision Agriculture 99, ed. J V Stafford, pp. 759-768. Sheffield
Academic Press Ltd: Sheffield.
Johnson G A; Mortensen, D A; Gotway C A (1996). Spatial and temporal analysis of weed
seedling populations using geostatistics. Weed Science 44, 704-710.
Lutman P J W; Rew L J; Cussans G W; Miller P C H; Paice M E R; Stafford J V (1998).
Development of a ‘Patch Spraying’ system to control weeds in winter wheat. In: Home
Grown Cereals Authority Project Report. 158, pp80.
McGowan I J (1998). Remote sensing: background to the technology and opportunities for
mapping pasture weeds. In: Precision Weed Management in Crops and Pastures, eds R
W Medd & J E Pratley, pp. 36-47. CRC for Weed Management Systems: Adelaide.
Rew LJ; Cussans G W; Mugglestone M A; Miller P C H (1996). A technique for mapping the
spatial distribution of Elymus repens, with estimates of the potential reduction in
herbicide usage from patch spraying. Weed Research 36, 283-292.
Rew L J; Miller P C H, Paice M E R (1997). The importance of patch mapping resolution for
sprayer control. In: Aspects of Applied Biology 48; Optimising pesticide applications,
pp. 49-55.
Rew L J; Lamb D W; Weedon M M Lucas J L; Medd R W; Lemerle D (1999). Evaluating
airborne multispectral imagery for detecting wild oats in a seedling triticale crop. In:
Precision Agriculture 99, ed. J V Stafford, pp. 265-274. Sheffield Academic Press Ltd:
Sheffield.
Robbins B (1998). Real-time weed detection and classification via computer vision, In:
Precision Weed Management in Crops and Pastures, eds R W Medd & J E Pratley, pp.
119-122. CRC for Weed Management Systems: Adelaide.
Robert P C (1999). Precision agriculture: research needs andstatus in the USA. In: Precision
Agriculture 99, ed. J V Stafford, pp. 19-34. Sheffield Academic Press Ltd: Sheffield.
Stafford J V (ed.) (1999), Precision Agriculture ’99. Sheffield Academic Press Ltd:
Sheffield.Vrindts E; Baerdemaeker J de: Ramon H (1999). Weed detection using canopyreflectance. In:
Precision Agriculture '99, ed. J V Stafford, pp. 257-264. Sheffield Academic Press Ltd:
Sheffield.
Wallinga J (1995). A closer look at the spatial distribution of weeds — perspectives for patch
spraying. In: Challenges for Weed Science in a Changing Europe: Proceedings 9"
European Weed Research Society Symposium, pp. 647-653. Budapest, Hungary.
Copyright © 2022 FDOKUMEN