Serving You In Many Ways - Sindh Bank Limited
114
3rd Floor, Federation House, Abdullah Shah Ghazi Road, Clifton, Karachi-75600. UAN: +92-21-111-333-225 Call Centre: 0800-33322 Web: www.sindhbankltd.com • Attractive Deposit Schemes • Sukoon Current Account • Asaan Account • Women Empowerment Account • Young Talent Account • Foreign Currency Accounts • Auto Finance Facility for Locally Manufactured & Imported Cars • Call Center 24/7 • Agriculture Loans • Mark-Up Free Student Loans • Islamic Banking • ATM Network • Lockers Facility • VISA, PayPak & UnionPay Debit Cards Services & Facilities SMS Banking • All Transactions Alert • Utility Bills Payment • Mobile Top-ups • Airline Ticket Payment • Internet Service Providers (ISPS) • Fee Payments of Educational Institutions • Insurance Premium Payment • Intra Bank Funds Transfer (PAYC) • Inter Bank Funds Transfer (IBFT) • Balance Enquiry • Mini Statement • Complete Statement of Account Via Email • E-commerce • Email Alerts Serving You In Many Ways
-
Upload
khangminh22 -
Category
Documents
-
view
1 -
download
0
Transcript of Serving You In Many Ways - Sindh Bank Limited

3rd Floor, Federation House,Abdullah Shah Ghazi Road, Clifton, Karachi-75600.UAN: +92-21-111-333-225 Call Centre: 0800-33322
Web: www.sindhbankltd.com
• Attractive Deposit Schemes • Sukoon Current Account• Asaan Account • Women Empowerment Account• Young Talent Account • Foreign Currency Accounts• Auto Finance Facility for Locally Manufactured
& Imported Cars • Call Center 24/7• Agriculture Loans • Mark-Up Free Student Loans• Islamic Banking • ATM Network • Lockers Facility• VISA, PayPak & UnionPay Debit Cards
Services & Facilities SMS Banking• All Transactions Alert • Utility Bills Payment• Mobile Top-ups • Airline Ticket Payment• Internet Service Providers (ISPS)• Fee Payments of Educational Institutions• Insurance Premium Payment• Intra Bank Funds Transfer (PAYC)• Inter Bank Funds Transfer (IBFT)• Balance Enquiry • Mini Statement• Complete Statement of Account Via Email• E-commerce • Email Alerts
Serving You In Many Ways

Annual Report2017

Annual Report2017
MissionTo develop as a leading Commercial Bank in the countryby meeting its stated objectives of promoting economicdevelopment of the country in general and in the Provinceof Sindh in particular.
VisionOur vision is to be a leading bank which would play apositive role to generate economic activities for empoweringthe people by meeting their financial needs for running asuccessful business and create employment opportunities.
ContentsEntity Ratings 01
Core Values 02
Corporate Information 03
Corporate Objectives 04
Chairman’s Message 05
Major Achievements in 2017 07
Board of Directors 09
Committees of the Board 12
Statement of Ethics and Business Practices 13
Organogram 15
Directors’ Report 17
Financial Highlights 37
Value Added Statement 39
Vertical Analysis 40
Horizontal Analysis 41
Key Performance Indicators 42
Corporate Governance Statement 43
Review Report on Code of Corporate Governance 46
Statement of Internal Controls 47
Disclosure on Consumer Grievances Handling Mechanism 48
Auditors’ Report on Unconsolidated Financial Statements 49
Unconsolidated Financial Statements 52
Islamic Banking Business 121
Shariah Advisor’s Report 129
Auditors’ Report on Shariah Compliance 133
Auditors’ Report on Consolidated Financial Statements 135
Consolidated Financial Statements 136
Notice of Seventh Annual General Meeting 203
Pattern of Shareholding 204
Branch Network 208

Annual Report2017
01 02
Entity Ratings
Long-Term Rating AAShort-Term Rating A-1+
Definitions by JCR-VIS Credit Rating Co. Ltd.
Long-Term Rating AAHigh Credit Quality. Protection factors are strong.Risk is modest but may vary slightly from time totime because of economic conditions. Short-Term Rating A-1+Highest certainty of timely payment; Short-term liquidity,including internal operating factors and/or access toalternative sources of funds, is outstanding and safetyis just below risk free Government of Pakistan’s short-term obligations.
Core Values
IntegrityTake pride in everything that is fair, honest and buildtrust in every situation.
Customer FocusWe live by our customers’ success. We build lastingrelationships with our clients.
Team WorkWe communicate actively and openly. We build trustby honoring our commitments. We show respect foreach other.
InnovationWe are constantly looking for ways to innovate andimprove. We embrace change as an opportunity.

Annual Report2017
04
Corporate InformationBoard of DirectorsAfzal Ghani Chairman/Independent Director
Syed Hasan Naqvi* Non Executive Director
Mohammad Shahid Murtaza** Non Executive Director
Muhammad Naeem Sahgal Independent Director
Tajammal Husain Bokharee Independent Director
Raja Muhammad Abbas** Independent Director
Muhammad Bilal Sheikh Non Executive Director
Tariq Ahsan President & CEO
Chief Financial Officer Saeed Jamal Tariq
Company Secretary Shamsuddin Khan
Auditors EY Ford Rhodes
Chartered Accountants
Legal Advisors Mohsin Tayebaly & Co
Share Registrar Central Depository Company
of Pakistan Limited
Registered/Head Office 3rd, Floor Federation House
Abdullah Shah Ghazi Road
Clifton, Karachi-75600
UAN : +92-21-111-333-225
Fax : +92-21-35870543
Registration Number 0073917
NTN Number 3654008-7
Website www.sindhbankltd.com
03
* Mr. Naqvi ceased to be the Director w.e.f 22nd December 2017, due to his transfer from the position of Finance Secretary GoS.* * These Directors had completed their tenure under Banking Companies Ordinance 1962 and FPT documents have been submitted to SBP to fill thevacancies.
Corporate ObjectivesSindh Bank's vision for promoting economic activity to empower the people of Pakistan andcreate employment opportunities, brings upon it an onerous responsibility to deliver results.
Thus the Bank's policies are focused on:
• Enhancing small farmers access to institutional credit and supporting national strategyfor increasing agricultural output by funding farm and non-farm projects.
• Promoting SME sector by providing financial solutions to small and medium sized entrepreneurs.
• Funding projects yielding economic benefits to the country.
• Supporting projects that empower women.
• Providing banking facilities in the unbanked areas particularly in the province of Sindh.
• Providing e-banking services to enable Bank's customers to have fast and easy access meetingtheir banking requirements by installing the most modern and efficient technological applicationsthat satisfy customers’ expectations.
• Fulfilling its Corporate Social Responsibility in all segments of the Society, particularly forpromoting and enhancing education in Pakistan, by supporting and providing interest freeloans to meritorious students for higher education, with job guarantee in Sindh Bank.
• Laying a sound foundation for the bank and delivering attractive value for the shareholders'investment while remaining within the ambit of regulatory requirements.

Annual Report2017
0605
On behalf of the Board of Directors of Sindh Bank, it gives me great pleasure to present this review, along-withthe financial statements of the Bank for the year ended December 31, 2017. The Bank's branch network grew to300 branches established in 151 cities in Pakistan.
Profit (before tax) for 2017 decreased by 10.11% to Rs. 2,182 million from Rs. 2,428 million earned during 2016which is attributed to lower capital gains on Government Securities during 2017, although on a positive note coreincome increased by over 35.2%. This translates into EPS (after tax) of Rs. 1.25. The financial results and appropriations,as recommended by the Board, are summarized below:
Total Deposits as at December 31, 2017 amounted to Rs. 134.2 billion, registering an increase of 12.8% from Rs.119billion on December 31, 2016. Gross advances increased by 23.5% to Rs. 69.1 billion as compared to Rs.56 billionon December 31, 2016.
As at the year-end, Sindh Bank's Equity (i.e. Paid up Capital, Reserves & Unappropriated profits) stood at Rupees16.64 billion, increasing by about 8.06% over Rupees 15.397 billion last year. The Bank's risk adjusted CapitalAdequacy stood at 15.67% against the year-end 2017 requirement of 11.275%.
Pakistan's economic growth is on track to achieve its highest level in the last eleven years though deteriorationin external account are likely to cause further devaluation of the Pak Rupee. Devaluation of the Pak Rupee andrising fuel prices are likely to build inflationary pressures hence further rise(s) in the Policy rate cannot be ruledout. Improvement in business volumes and efficiencies are expected to drive future profitability of the Bank.
I would like to thank the Government of Sindh for their continued support towards promotion and progress ofthe Bank. I am also thankful to the State Bank of Pakistan and other regulators for their guidance and support.The Board, management and myself are collectively grateful for the support of our customers who are the realpurpose for us to be in business.
I would also like to appreciate the efforts, commitment and team work of the Bank's Executives and Staff due towhich the Bank was able to achieve such results despite challenges.
I, on behalf of the Board would like to assure all the stakeholders of our full cooperation and support for thefuture development and progress of the Bank.
Afzal GhaniChairman
Karachi: March 7, 2018
This review forms an integral part of the Directors' Report to the Shareholders.
Rupees in '000Profit before provisions and tax 2,434,868General Provisions against consumer & small enterprise Advances (2,156)Specific provisions against non-performing advances-net 254,590Profit before tax 2,182,434Taxation- Current 806,948- Prior year 161,950- Deferred (42,299)
926,599Profit after tax 1,255,835Un-appropriated profit brought forward 4,185,911Other comprehensive loss (14,759)Profit available for appropriation 5,426,987Appropriations:Transfer to Statutory Reserve (251,167)Un-appropriated profit carried forward 5,175,820
Chairman’sMessage

Annual Report2017
0807
Major Achievements in 2017• 40 on-line branches established expanding Sindh bank's branch network to 300 locations
spread over 151 cities/towns across Pakistan.
• Sindh Bank's ATM network in 2017 stands at 240 ATM's.
• Training activities during 2017 involved training of 1856 staff members in differentdisciplines focus of which was on areas that were identified/observed during SBPinspection. Besides, online testing on AML/CFT and class room trainings on this topicwere also conducted. The Area Managers, Branch Managers and Operations Managerswere given the responsibility to conduct training sessions at their respective brancheson the highly sensitive topic of security features of cheques.
• A new product Auto Loans with attractive features was added to the Sindh bankproduct portfolio.
• The Bank has been handling Benazir Income Support Program since its start for theTando Muhammad Khan district in Sindh. The number of beneficiaries stands at 41,833.Total amount disbursed during 2017 amounted to Rs 806 million as compared toRs 798 million disbursed in 2016.
• Sindh Bank's branches handled home remittances to the tune of Rs 1.715 billion through37,159 transactions during 2017 as compared to Rs 1.667 billion through 39,169transactions in 2016.
• Initiatives taken by IT this year were on the Issuance of Chip based (EMV) ATM / DebitCard and upgrading all the Bank's ATMs to read Chip based Cards, including internationalcards such as VISA, MASTERCARD etc.
• SMS Banking has been enhanced with an interface on Internet. The customer can nowlogin by visiting http://smsbanking.sindhbankltd.com and enjoy a secure internet-cum-sms banking experience.
• A long awaited facility has been added in SMS Banking by enabling the payment of utilitybills, mobile top-up etc. on 24 hours basis.
• Sindh Microfinance Bank (SMFB) has been running a profitable operation with capitaland reserves of Rs. 797.42 million as at December 31, 2017. Besides its flagship loanproduct branded as 'SUJAG AURAT' (which means 'Visionary Woman') another productnamely “Fisheries Loan” in the category of non-farm Agri loan was also launched inearly 2017.
• An increased trend of skimming of ATM cards data and fraudulent transactions werenoted in the industry in 2017. To minimize the same, a facility with four new commandswere added to the Bank's SMS Banking facility, to further secure against ATM/Debitcard frauds.
• The new release of our core banking system for conventional and Islamic banking wasimplemented which included various enhancements with user friendly interface.
• To cater to SBP requirement for enhanced reporting of data files in XML formatcompatible with their new GO AML software, a system was developed in-house andimplemented to the satisfaction of the stakeholders.
• On demand of FBR, SMS banking was enhanced to include payment of Taxthrough SMS. An entity or individual gets a receipt number after visiting the FBRwebsite after filling the required information. This receipt number is used for sendingan SMS and system automatically fetches the data and amount to be paid and the sameis paid after receiving confirmation by return SMS. The facility is linked with 1Link billpayment system.
• In order to promote a local product, customers were encouraged to use thePAYPAK local ATM/Debit cards. Todate 9,980 cards have been issued to customers.
• Sindh Bank is serving more than 42,000 beneficiaries under the BISP scheme everyquarter. A BVS system for verification of the BISP beneficiaries has been developed formore secure and transparent disbursement of quarterly installments which will befunctional at the time of payment of the next installment.
• During 2017, the Bank facilitated payments amounting to Rs. 806 million to around42 thousand beneficiaries under Government of Pakistan's Benazir Income SupportProgram. Further disbursement of an amount of Rs. 779 million to over 97 thousandZakat beneficiaries on behalf of the Sindh Zakat & Ushar Department,Government of Sindh was facilitated through Sindh Bank's Benazir Muawanat Card.


1211
Committees of the Board:
Risk Management Committee:Tajammal Husain Bokharee ChairmanMohammad Shahid Murtaza MemberPresident & CEO MemberHead of Risk Management Secretary
Procurement, Information Technology & Security Committee:Finance Secretary (GoS) ChairmanMohammad Shahid Murtaza MemberTajammal Husain Bokharee MemberRaja Muhammad Abbas MemberPresident & CEO MemberHead of Information Technology Secretary
Human Resource & Remuneration Committee:Afzal Ghani ChairmanMuhammad Naeem Sahgal MemberMuhammad Bilal Sheikh MemberPresident & CEO MemberHead of Human Resource Secretary
Audit Committee:Muhammad Naeem Sahgal ChairmanFinance Secretary (GoS) MemberMuhammad Bilal Sheikh MemberRaja Muhammad Abbas MemberHead of Internal Audit Secretary
Nomination Committee:Tajammal Husain Bokharee ChairmanMuhammad Bilal Sheikh MemberFinance Secretary (GoS) MemberCompany Secretary Secretary
Board of Directors:
1 Afzal Ghani Chairman/Independent Director
2 Finance Secretary (GoS) Non Executive Director
3 Mohammad Shahid Murtaza Non Executive Director
4 Muhammad Naeem Sahgal Independent Director
5 Tajammal Husain Bokharee Independent Director
6 Raja Muhammad Abbas Independent Director
7 Muhammad Bilal Sheikh Non Executive Director
8 Tariq Ahsan President & CEO
From left to right: Tajammal Husain Bokharee, Muhammad Naeem Sahgal, Mohammad Shahid Murtaza Afzal Ghani (Chairman), Raja Muhammad Abbas, Muhammad Bilal Sheikh and Tariq Ahsan (President & CEO)

Annual Report2017
13 14
9. We, besides working with honesty and faithfulness shall maintain strict secrecy regarding theBank's affairs and the affairs of its constituents and subsidiaries, if any. We shall use our utmostendeavors to promote the interest of the Bank and shall show courtesy and attention in alldealing with customers.
10. We shall not use for personal gain or benefit or, except insofar as it is necessary in the regularcourse of business, disclose to anyone within or outside the Bank any information obtainedin the course of work that is of confidential nature. We will not disclose intentionally orcarelessly, any information that is of confidential nature without the prior approval from therespective departmental head. In official communication or prospective communication withprospective or current client, ensure that information is given only on need to know basis.
11. We shall not engage in any other profession, trade or business activity for remuneration orenter into the employment of any other person, firm or company. An engagement insocial and welfare service beyond normal office hours may however, be encouraged.
12. We shall not make any false or misleading statement in relation to our appointment orperformance of our duties in the Bank. To ensure accuracy of information that would beprovided to the public, the employees are prohibited from making any statement, includingstatements about financial matters (written or verbal) on behalf of the Bank to media, newspublications, business publications, or any other source without prior approval from therespective department of the Bank.
13. Personal, social and unofficial visits during working hours are discouraged. In the event ofan emergency, visitors may be entertained outside the work area, or in the designated receptionarea to ensure confidentiality of information and minimum disruption.
14. We shall not bring or attempt to bring political or other influence, directly or indirectly, norshall we take part in, subscribe to and or assist in any way, any political activity.
15. If we are found involved or convicted in a criminal offence, we shall immediately bring to thenotice of the Management through our head of department or, if arrested and released onbail, soon after such release.
16. We shall generally dissuade from following evils:
• Inappropriate Conduct • Sexual Harassment • Corruption and Retaliation• Discriminatory Behavior • Grapevine and Gossips• Intentional Dishonesty • Drug Abuse and Anti Environmental Activities• Insider Trading • Money Laundering
In terms of Regulation 4, Item # 10 notified by State Bank of Pakistan (SBP) vide BPRD CircularNo. 02 dated 13/09/2012, Employees of the banks are strictly prohibited to disclose the facts tothe customer or any other quarter that a suspicious transaction or related information is beingor has been reported to any authority, except if required by law.
Statement of Ethics and Business PracticesThis Statement of Ethics and Business Practices applies to all Employees of Sindh Bank Limited.It strives to set forth certain standards and rules of conduct followed in the corporate entities,globally. Our culture of ethics and integrity shall from the beginning define who we are as a Bankand how we as colleagues treat each other, our customers and stakeholders.
This Statement of Ethics and Business Practices attempts to introduce the Employees to thetypes of attitudes and conduct that create an honest, fair and legal workplace. It will be surroundedby 3 basic beliefs:
• Respect for the Individual • Service to the Customer • Striving for Excellence
General Principles and Significant Aspects of Code of Ethics:
1. We will abide by the laws of the Country in all activities at work and beyond. Any suspectedmaterial violation of a law, regulation or ethical standard must be reported to the appropriatelevel of authority within the Bank. Where appropriate, the authority will report to the relevantstatutory authority.
2. We will always demonstrate high standard of conduct at work place or outside as good citizensof Pakistan.
3. We will adhere to a high level of professional practices commensurate with Bank's aim toachieve growth in earning for shareholders over the long term undertaking business compatiblewith our character and business norms.
4. We will behave with integrity and honesty in our dealing with customers, colleagues, supervisorsand all others with whom we interact.
5. We, as the Bank’s employees have a responsibility towards all stakeholders to make decisionsstrictly on the basis of Bank's interests, without regard to personal gain. A conflict of interestcan arise when one's judgement could be influenced, or might appear as being influenced, bythe possibility of personal benefit. Even if it's not intentional, the appearance of a conflict maybe just as damaging to employees' and Bank's reputation, as an actual conflict. We would alwaysbe on the lookout for situations that may create a conflict of interest, and do everything wecan to avoid them.
6. Situation may arise holding an employee in conflict of his interest with the interest of theBank. In such situation, to enable the Bank to make objective decisions, the employee mustdeclare in advance the possible conflict of interest, to his/her senior. The management mayrequire the employee to disassociate him/her from any involvement in a decision by the Bankthat relates to such personal conflict.
7. Our involvement in an outside activity or any external position held must not give rise to anyreal or apparent conflict with a customer's interest, must not adversely reflect on the Bankand must not interfere with an individual's performance.
8. We will not solicit or accept gifts, sponsorship, hospitality or favor which would compromise,or give the appearance of compromising our position or any business decision taken by oron behalf of the Bank. Accepting gifts and entertainment can cause a conflict of interest, orthe appearance of a conflict between personal interests and professional responsibility. TheBank's culture is to never accept gifts or entertainment from any supplier, potential supplier,or any person the employee has reason to believe may be seeking to influence businessdecisions or transactions.

Annual Report2017
1615
BOARD OF DIRECTORS
ORGANOGRAM
AKHTAR ALI KHANADVISOR
FARHAN A. KHANSEVP/GROUP HEADNORTHERN REGION
SYED ASSAD ALIEVP/GROUP HEAD
RURAL SINDH REGION
A. RAUF CHANDIOEVP/GROUP HEAD
SOUTHERN REGION
MASOOMA HUSSAINEVP/ACTING HEAD OF CREDIT,
CORPORATE & SME
ANIS IQBALSEVP/HEAD OF I.T.
NADEEM ALTAFEVP/HEAD OF RISK MANAGEMENT
LT. COL(R) SHAHZAD BEGGEVP/HEAD OF ADMINISTRATION
RUKHSANA NAREJOSVP/HEAD OF TREASURY
(FRONT OFFICE)
SAEED JAMAL TARIQEVP/CFO/HEAD OF FINANCE
NAVEED E. MALIKSVP/HEAD OF COMPLIANCE,
VIG. & FRM
SHAMS-UL-ABBAS MALLAHSVP/HEAD OF AGRI CREDIT
JEANETTE CHOHANEVP/HEAD OF F.I. & FOREX TRADE
KH. TAJAMMUL HUSSAINSEVP/HEAD OF HUMANRESOURCE & TRAINING
TARIQ AHSANPRESIDENT & CEO
BOARD’S INDEPENDENTAUDIT COMMITTEE
SHAHID S.A. MUGHALEVP/HEAD OF AUDIT
Position as on March 01, 2018
SHAMSUDDIN KHANEVP/COMPANY SECRETARY
JAWAID HUSAINSVP/HEAD OF OPERATIONS
SHARIQ H. JALEESISVP/ HEAD OF CREDIT
ADMIN DIV (CAD)
ALIZAIN WAHABSVP/HEAD OF ISLAMIC BANKING
MUHAMMAD IRFAN ZAFARVP/HEAD OF LEGAL
SHAUKAT A. LARIKSVP/HEAD SERVICE QUALITY
DIVISION

Annual Report2017
1817
On behalf of the Board of Directors, I am pleased to present the 7th Annual Report of the Bank for the yearended December 31, 2017. Financial highlights for the year are as follows:
A. DEPOSITSTotal Deposits registered an increase of 12.8 percent and stood at Rs. 134.2 billion compared to Rs.119.0billion on December 31, 2016. Ratio of Finance Department, Government of Sindh (GoS) Deposits to otherDeposits was 14:86 as compared to 17:83 at the year ended 2016 and number of customer accounts at 475,801registered an increase of 13.7 percent over 2016 indicating enhanced customer confidence in the Bank.
B. ADVANCESGross Advances increased by 23.5 percent to Rs. 69.1 billion as compared to Rs. 56.0 billion on December31, 2016. Sector-wise exposure is as follows:
(Rupees in '000)
Paid up CapitalReserves & un-appropriated profitsPaid up Capital & Reserves(Deficit)/Surplus on RevaluationEquityDepositsInvestments (net of repos)Gross Advances
10,010,1306,627,799
16,637,929(570,121)
16,067,808134,207,05663,154,89769,112,166
10,010,1305,386,723
15,396,853134,032
15,530,885119,022,24070,290,53355,979,573
-23.04%8.06%
3.46%12.76%
-10.15%23.46%
% age ChangeBalance SheetAs on
December 31, 2017As on
December 31, 2016
% age Change
Markup/return/interest income
Markup/return/interest expenses
Net markup/return/interest income
Capital gains & Dividends
Fee, Commission & Other Income
Non-mark-up/non-interest income
Non mark-up/interest expenses
Provisions-general
Provisions-specific
Provisions
Profit before Tax
Profit After Tax
Earnings per share (Rupees)
Profit & Loss Account
11,541,183
6,276,431
5,264,752
760,487
567,209
1,327,696
4,157,580
(2,156)
254,590
252,434
2,182,434
1,255,835
1.25
9,775,399
5,371,167
4,404,232
3,075,173
420,777
3,495,950
3,864,804
1,501,834
105,614
1,607,448
2,427,930
1,390,826
1.39
19.54%
-62.02%
7.58%
-10.11%
-9.71%
-9.35%
Year EndedDecember 31, 2017
Year EndedDecember 31, 2016
Other InformationAs on
December 31, 2017As on
December 31, 2016
475,801300
418,454260
13.70%15.38%
No. of AccountsNumber of Branches
% age Change
Directors’Report

Annual Report2017
2019
Against Bank's exposure in the Sugar sector, an amount of Rs.3.7 billion is fully secured against cash collateraland Rs. 6.4 billion against pledge of Sugar with 20% margin whereas a major portion of the remaining exposureis secured by tangible collateral. Exposure in the Food sector consists mainly of financing of Rs. 11.5 billionto the Food Department, GoS which is secured against GoP guarantee. Exposure of Rs. 2.0 billion andRs. 2.2 billion in the Power and Mining & Quarrying sectors respectively are secured by GoP/GoS guarantee/comfort letter.
C. INVESTMENTSInvestment in Government securities increased by 63.2 percent to Rs. 108.7 billion on December 31, 2017compared to Rs. 66.6 billion as at December 31, 2016. While investment in long-term Pakistan InvestmentBonds remained almost static, investment in short-term Market Treasury bills increased by Rs. 42.6 Billion.
Investment in the equities and mutual funds stood at Rs. 4,250 million, increasing by 33 percent over December31, 2016 (Rs. 3,197 million). Break-down by type of investments is as under:
D. PROFIT AND LOSSPre-tax profit for the year ended December 31, 2017 amounted to Rs. 2,182 million as against Rs. 2,428 millionearned last year, a decrease of 10.11%. Breakup is as follows:
The Bank had made windfall gains of Rs. 2,644 million during 2016 on the sale of PIBs and as an abundant caution,it was decided to set aside an amount of Rs. 1.5 billion to general reserve to deal with any unforeseen contingenciesi.e. rise in Policy rate and others etc. Therefore the net impact of this on the 2016 bottom line was Rs. 1,144 million.Compared to this, Capital Gains on sale of PIBs of Rs. 446 million have been realized in 2017. It is for this reasonthat the 2017 pre-tax profit, instead of a respectable increase, shows a decline of 10.1%. However, if we exclude theimpact of the PIB gain minus general provision from both years, the Bank shows an impressive increase in coreprofitability of 35.2%, which was achieved due to the following reasons:
• Increase in Net Mark-up/Interest Income by 19.5 percent compared to 2016. This is a positive reversal of the trend from last year;
• Increase in Fee and Commission income by 26.5 percent; and• Controlling administrative expenses, which increased by just 7.3 percent.
Non-markup/interest income recorded a decrease of 62 percent mainly due to reduction in gain on sale of investmentsto Rs. 604.4 million compared to Rs.2,933.7 million in the same period last year. Fee and Other income howeverincreased by 34.8 percent over the same period. Break-up is as follows:
PAT; 1,391
PBT; 2,428
Operating Expenses;3,865
Non Mark-up Income;3,496
Net Interest Income;4,404
Provisions; 1,607
Profit 2016(Rs. in Million)
FY 2017
30.2%
9.4%
4.6%17.5%
5.2%
6.4%
3.3%
3.9%
14.9%
1.9%
2.7%
Operating Expenses;4,158
PAT; 1,256
PBT; 2,182
Non Mark-up Income;1,328
Net Interest Income;5,265
Provisions; 252
Profit 2017(Rs. in Million)
Gain on sale ofshares/mutual funds
ect; 290
Other income;9
Fee, commission &brokerage income;
359
income from dealingin foreign currencies;
53Gain on sale of Govt. Securities;2,644
Non-Markup Income 2016(Rs. in Million)
Gain on sale ofshares/mutual funds ect;
158
Other income; 10
Fee, commission& brokerage income;
454
Non-Markup Income 2017(Rs. in Million)
Dividend income;156
Gain on sale of Govt.securities; 2,644
Gain on sale ofGovt. securities;
446
Income from dealingin foreign currencies;
104
FY 2016
29.5%
11.4%
4.9%12.1%
4.4%
7.8%
3.6%
4.6%
4.6%
15.1%
2.0%
FY 2017
3.7%0.6%1.3%
94.4%
FY 2016
4.5%
1.1%1.1%
93.3%
Dividend income;141
Agri-business
Automobile and transportation equipmentBasic iron and steelConstruction, Real Estate and societiesFinancialFoodMining and QuarryingPower Electricity and GasSugarTransport, Storage and Communication
Others
Investment in Govt. Securities
Investment in shares and mutualfunds
Investment in Subsidiary
Other Investments

Annual Report2017
2221
E. BRANCH NETWORKThe Bank has its presence at 300 locations spread over 151 cities/towns all over Pakistan and include14 branches which are dedicated to Islamic Banking. Region wise breakup is as under:
Regions
South: Karachi and other cities/towns in Sindh & Balochistan
North: Punjab, Islamabad, KPK, AJK & GB
Total
No. of Branches No. of Cities/Towns
186
114
300
83
68
151
RISK MANAGEMENT FRAMEWORKSindh Bank has in operation a risk management system commensurate with the size and complexity of itsoperations to provide reasonable assurance that the risks undertaken are adequately managed and are withinits risk appetite. During the year, further refinements/enhancements to the automated risk management systemwere made to strengthen controls over the Bank's operations. Efforts continue to bring about qualitativeimprovements to ensure that the Bank's risk management system is well equipped to assess major/material risksparticularly credit, market and operational risks associated with the banking sector.
INTERNAL CONTROLS OVER FINANCIAL REPORTINGSindh Bank has established an ongoing process for identifying, evaluating and managing significant risks faced bythe Bank and this process includes the system of Internal Control over Financial Reporting. The process is regularlyreviewed by the Board Audit Committee.
The Board is of the view that the system of Internal Control over Financial Reporting in place is sound andadequate to provide reasonable assurance regarding the reliability of Financial Reporting and that the preparationof Financial Statements for external purposes is in accordance with relevant accounting principles and regulatoryrequirements.
The management assists the Board in implementation of the Board's policies and directives pertaining to InternalControl over Financial Reporting. The management is working continuously towards enhancing the system ofInternal Control over Financial Reporting.
The Board is pleased to endorse the statement made by management relating to Internal Controlsincluding management's evaluation of ICFR. The Management's Statement on Internal Controls is included in thisAnnual Report.
MAJOR HIGHLIGHTS
• Islamic Banking DivisionAlhamdulillah, Islamic Banking segment of the bank made impressive strides during the year 2017. Not onlythe deposit base rose to Rs. 6.9 bln, as compared to Rs. 3.4 bln of the previous year, the deposit mix alsoimproved thereby reducing the cost of deposit from 4.96% to 3.90%. All these developments made it possiblefor the Islamic Banking Division to record an operating profit of Rs. 25 mln in the last quarter, despite someoperating constraints and particularly liquidity management issues. This is not a small achievement withinthree and a half years of launch of Islamic Banking and can be favorably compared with the peer banks. Thetrend is expected to continue rather gain further momentum during 2018 as with the passage of time, IBBsmarket reach has gained depth.
• Microfinance BankSindh Microfinance Bank Limited (SMFB), the wholly owned subsidiary of Sindh Bank Limited, startedmicrofinance operations in May 2016 with an aim to promote self-sufficiency and economic developmentamong people especially women who do not have access to the traditional financial services. As a rareexample in Microfinance sector, from the very first month of its operations, SMFB has been running a profitableoperation with capital and reserves of Rs.797.42 million as at December 31, 2017. In accordance with itsmid-term plan, SMFB is focusing on its flagship loan product branded as 'SUJAG AURAT' (which means'Visionary Woman') which is designed exclusively for women empowerment. However, another productnamely “Fisheries Loan” in the category of non-farm Agri loan was also launched in early 2017. With cumulativeloan disbursements of over Rs. 515 million, the total outstanding loans as of December 31, 2017 stood atRs. 338.38 million to 23,221 female borrowers. Due to strict risk control measures, there were no NPLs/Over-dues outstanding on December 31, 2017.
SMFB has established Ten (10) functional branches and Forty (40) micro-credit centers, mostly in rural andfar-flung parts of Sindh, like Mithi, Islamkot, Umarkot, Golarchi, Kunri, Digri, Mirpur Sakro, and other similarareas. Furthermore, State Bank of Pakistan has recently approved SMFB's Annual Branch Expansion Plan-2018for opening of 5 branches and 22 micro-credit centres by the end of this year which will greatly increaseSMFB's outreach especially in upper Sindh to enhance its penetration and market share in extending benefitsof micro finance business to masses specially in the banked areas of the region.
ECONOMIC REVIEWDuring FY 2016, Pakistan's economy recorded an eight year high GDP growth of 4.7 percent. FY 2017 figuresshow GDP growth at 5.3 percent, a ten year high.
Industrial sector witnessed growth of 5.0 percent compared to 5.8 percent in the last fiscal. Large ScaleManufacturing (LSM) posted YOY growth of 5.0 percent against 2.9 percent last year. Agriculture sector achievedits targeted growth of 3.5 percent, much above the growth of 0.3 percent in FY 2016 while Services sectorrecorded 6.0 percent growth as compared to 5.5 percent last year.
Average CPI inflation during FY 2017 stood at 4.2 percent compared to 2.9 in FY 2016. This eased slightly to4.1 percent during the first half of FY 2018. Core inflation (non-food non-energy) was recorded at 5.5 percentduring the first half of FY 2018, which together with PKR depreciation (about 5%) and rising international oilprices are likely to increase inflation in the coming period. In their Monetary Policy Statement, the MPC hasincreased the policy rate by 25 bps to 6.0 percent. Average CPI inflation is expected to remain within SBP'sprojected FY 2018 range of 4.5 - 5.5 percent.
During FY 2017, current account deficit of US$ 12.1 billion was registered as exports and workers' remittancesdeclined while imports surged by 17.7 percent, owing mainly to machinery imports both for CPEC and non-CPEC energy and infrastructure projects. In the first half of FY 2018 however, exports posted the highest halfyear growth of 10.8 percent in the past seven years compared to a decline of 1.5 percent in the same periodlast year. Workers remittances also recorded growth of 2.5 percent compared to a decline of 1.4 percent inthe same period last year. The high economic growth is exerting pressure on the external sector with currentaccount deficit for the first six months of FY 2018 widening to US$ 7.4 billion driven mainly by strong growthin imports of goods and services. Recent depreciation of PKR by about 5 percent appears to be aimed atcontaining the deficit.
FX reserves as at end FY 2017 closed at US$ 21.4 billion, down from US$ 23.1 bn at end of FY 2016. Thesehave declined further to US$ 20.2 billion as on December 31, 2017. The decline is attributed to burgeoningcurrent account deficit Euro club loan payments, withdrawal of Chinese government deposit with SBP and otherexternal debt servicing.
KSE 100 index ended the year at 40,471 points, down 15.3 percent over 47,807 points at December 31, 2016.Technical correction after multiple years of bull run and political uncertainty have been weighing down on theindex.
CREDIT RATINGJCR-VIS Credit Rating has maintained the Bank’s medium to long term entity rating of 'AA' (Double A) and shortterm rating of 'A-1+' (A One Plus), with a 'Rating Watch-Developing' status due to the proposed merger ofSummit Bank into Sindh Bank and surviving entity being Sindh Bank.
MINIMUM CAPITAL REQUIREMENT & CAPITAL ADEQUACY RATIOThe Bank is fully compliant with the minimum capital requirement prescribed by the State Bank of Pakistanwhile its Capital Adequacy Ratio stood at 15.67% as against the minimum requirement of 11.275% as onDecember 31, 2017.

Annual Report2017
2423
• Benazir Income Support ProgramThe Bank has been handling this scheme since its start for the Tando Muhammad Khan district in Sindh. Thenumber of beneficiaries stood at 41,833. Total amount disbursed during 2017 amounted to Rs.806 millionas compared to Rs.798 million disbursed in 2016. Handling BISP provides the Bank an opportunity to servethe less privileged segments of the population.
• Home RemittancesSindh Bank's branches handled home remittances to the tune of Rs 1.715 billion through 37,159 transactionsduring 2017 as compared to Rs 1.667 billion through 39,169 transactions in 2016. Sindh Bank has arrangementsin this regard with globally reputed companies such as Western Union, Money Gram & others.
IT INITIATIVES
• Issuance of Chip based (EMV) ATM / Debit CardIssuance of Chip based (EMV) ATM / Debit Card was not only mandated by SBP, but is also the needof the hour to minimize misuse of cards and avoid fraudulent transactions.
• Upgrading of ATMs to read Chip based CardsUpgrading all the Bank's ATMs to read Chip based Cards, including international cards such as VISA,MASTERCARD etc.
• SMS Banking on InternetThe Bank already has a unique and state of the art SMS banking service where a customer can enjoyvarious facilities such as balance query, Mini statement, Mobile top-up, payment of utility Bills, transfer offunds etc. instantly by just sending a simple SMS. This has now been enhanced with an interface on Internet.The customer can now login by visiting http://smsbanking.sindhbankltd.com and enjoy a secure internet-cum-sms banking experience.
• 24X7 SMS BankingA long awaited facility has been added in SMS banking by enabling the payment of utility bills, mobile top-upetc. on 24 hours basis. Previously only limited functions which did not involve financial transactions (exceptinterbank fund transfer) were available on a 24 hours basis due to End of Day Process restrictions.
• Deactivation and Activation of ATM / Debit Cards through SMSA facility with four new commands was added to the Bank's SMS banking facility, to further secure againstATM/Debit card frauds.
• New Release of core banking system, Conventional & IslamicThe new release of our core banking system was implemented which included various enhancements withuser friendly interface.
• GO AMLTo cater to the SBP requirement for enhanced reporting of data files in XML format compatible with theirnew GO AML software, a system was developed in-house and implemented to the satisfaction of thestakeholders.
• Collection / Payment of Federal Tax through SMSOn demand of FBR, SMS banking was enhanced to include payment of Tax through SMS. An entity or individualgets a receipt number after visiting the FBR website after filling the required information. This receipt numberis used for sending an SMS and the system automatically fetches the data and amount to be paid and thesame is paid after receiving confirmation by return SMS. The facility is linked with 1Link bill payment system.
• Issuance of PAYPAK, a local ATM / Debit CardIn order to promote a local product, customers were encouraged to use the PAYPAK local ATM/Debit cards.To date 9,980 cards have been issued to customers.
• Bio Verification System for BISP beneficiaries.Sindh bank is serving more than 42,000 beneficiaries under the scheme every quarter. A BVS system forverification of the BISP beneficiaries has been developed for more secure and transparent disbursement ofquarterly instalments which will be functional at the time of payment of the next BISP instalment.
STAFF, TRAINING & DEVELOPMENTTotal bank staff i.e. executives, officers and support staff as at December 31, 2017 numbered 2,109.
Training activities during 2017 involved training of 1856 staff members in different disciplines focus of which wason areas that were identified/observed during SBP inspection. Besides, online testing on AML/CFT and class roomtrainings on this topic were also conducted. The Area Managers, Branch Managers and Operations Managerswere given the responsibility to conduct training sessions at their respective branches on the highly sensitivetopic of security features of cheques.
CORPORATE SOCIAL RESPONSIBILITY (CSR)During 2017, the Bank facilitated payments amounting to Rs. 806 million to around 42 thousand beneficiariesunder Government of Pakistan's Benazir Income Support Program. Further disbursement of an amount ofRs. 779 million to over 97 thousand Zakat beneficiaries on behalf of the Sindh Zakat & Ushar Department,Government of Sindh was facilitated through Sindh Bank's Benazir Muawanat Card.
In addition, the Bank disbursed an amount of Rs.7.5 billion directly to growers for procurement of wheat onbehalf of the Food Department, Government of Sindh.
CORPORATE AND FINANCIAL REPORTING FRAMEWORK
• The financial statements prepared by the management of the bank, present fairly its state of affairs, the resultof its operations, cash flows and changes in equity.
• Proper books of accounts of the bank have been maintained.
• Appropriate accounting policies have been applied consistently in preparation of financial statements andaccounting estimates are based on reasonable and prudent judgment.
• The International Financial Reporting Standards, as applicable to banks in Pakistan, have been followed inpreparation of financial statements and any departures there from have been adequately disclosed andexplained.
• The system of internal control is sound in design and has been effectively implemented and monitored.
• There is no doubt about the Bank's ability to continue as a going concern in the foreseeable future.
• Statement of compliance with the Public Sector Companies (Corporate Governance) Rules, 2013 is givenseparately in the Annual Report.
• During the year a Directors' Orientation Course on Corporate Governance was conducted throughan ICAP approved trainer and was attended by all directors including the President & CEO.
• Key financial and operating data for seven years is being provided in this annual report.
• All the statutory liabilities, if any have been adequately disclosed in the financial statements.
• The appointment of the Chairman and other members of the Board and the terms of their appointmentalong with remuneration policy adopted are in the best interest of the Bank as well as in line with bestpractices.

Annual Report2017
2625
• Value of investments of Sindh Bank Limited Employees Provident Fund as at December 31, 2017 amountedto Rs. 439.3 million (2016-Rs.346.8 million). Value of investments of Sindh Bank Limited Employees GratuityFund as at December 31, 2017 amounted to Rs.167.6 million (2016-Rs.120.3 million) and further an amountof Rs. 71.45 million has been transferred subsequent to the balance sheet date, based on actuarial valuationof the fund.
EVALUATION OF BOARD, CHAIRMAN, INDIVIDUAL DIRECTORS, INDEPENDENTDIRECTORS, PRESIDENT & CEO AND COMMITTEES
In terms of SBP, BPRD Circular # 11, dated August 22, 2016 and the Public Sector Companies (CorporateGovernance) Rules 2013, the Board of Directors in its 44th Meeting held on November 21, 2016 had approvedthe evaluation criteria and procedure for evaluation of its own performance, performance of Chairman,Individual/Sponsor Directors, Independent Directors, President & CEO and its Committees.
The Board members carried out annual evaluation based on the in-house developed mechanism and submittedtheir reports to the Chairman. The Performance of the Board was evaluated by all Directors on individual basison the criteria which included Board composition and structure, Board contribution towards developing strategies,policy frame work, robust and effective risk management, internal control and audit functions etc.
Performance evaluation of Chairman, Independent Directors & President & CEO was carried out by the allmembers, excluding the evaluating Director. Performance evaluation of the non-independent directors was carriedout by the Independent Directors. The Performance of the Committees was evaluated by the non-members.
BOARD OF DIRECTORSDuring the year under review attendance of Directors at the Board meetings were as under:
BOARD COMMITTEES MEETINGSDetails of the Board Committees meetings is disclosed in Statement of compliance with the Public SectorCompanies (Corporate Governance) Rules, 2013 in this report.
PATTERN OF SHAREHOLDINGThe pattern of shareholding is attached with this report.
EXTERNAL AUDITORSThe retiring auditors, being eligible, offer themselves for re-appointment for the year 2018. The Audit Committeeof the Board has recommended M/s EY Ford Rhodes, Chartered Accountants, the retiring auditors, as externalauditors of the Bank for another term.
FUTURE OUTLOOKIMF's world economic outlook released in January 2018 revises upward by 0.2 percentage points to 3.9 percent,global growth prospects for 2018 and 2019 barring some challenges that need to be addressed.
As stated in the Monetary Policy Statement of January 2018, Pakistan's economic growth is on track to achieveits highest level in the last eleven years. It also announced a 25 bps increase in the Policy rate to 6.0 percent.Recent and expected further devaluation of the Pak Rupee and rising fuel prices are likely to build inflationarypressures and hence further rise(s) in the Policy rate cannot be ruled out.
The process of potential amalgamation/merger of Summit Bank into Sindh Bank has encountered some delaysand subject to required corporate and regulatory approvals it is now expected to be completed during thefirst half of 2018.
30 branches are planned to be opened during 2018, thereby expanding the Bank's network to 330 by the 2018year end.
The Bank will continue to pursue the strategy for increasing business, net interest/markup income and feebased income by improving profitability of established branches.
ACKNOWLEDGEMENTSOn behalf of the Board of Directors, I would like to sincerely thank the regulators, shareholders and customersfor their continued guidance, support and confidence reposed in the Bank and its Management.
My thanks to the staff of Sindh Bank whose team spirit, hard work and commitment has enabled the Bank toachieve these excellent results in such a short time. I am hopeful that they will continue to serve the Bankwith the same zeal and spirit.
On behalf of the Board of Directors
Tariq AhsanPresident/CEOKarachi, March 07, 2018
Name of DirectorsS.No.
Mr. Afzal Ghani
Mr. Syed Hasan Naqvi*
Mr. Mohammad Shahid Murtaza
Mr. Muhammad Naeem Sehgal
Mr. Tajammal Husain Bokharee
Mr. Raja Muhammad Abbas
Mr. Muhammad Bilal Sheikh
Mr. Tariq Ahsan
1
2
3
4
5
6
7
8
TotalMeetings Attended
7
7
7
7
7
7
7
7
45thMeetingheld on
09.02.2017
47thMeetingheld on
28.04.2017
46thMeetingheld on
02.03.2017
49thMeetingheld on
04.08.2017
48thMeetingheld on
19.07.2017
8 8Meeting Attendance 8 8 8
50thMeetingheld on
28.08.2017
8
51stMeetingheld on
17.10.2017
8
Mr. Syed Hasan Naqvi, Finance Secretary, Government of Sindh, has been transferred on 22.12.2017 and posting of a Regular Finance Secretary isstill awaited.
The Board places on record its appreciation for the support and contribution extended by the outgoingdirectors during their association with the Board/Bank.
*

Annual Report2017
2827
475,801300
418,454260
13.70%15.38%
10,010,1306,627,799
16,637,929(570,121)
16,067,808134,207,05663,154,89769,112,166
10,010,1305,386,723
15,396,853134,032
15,530,885119,022,24070,290,53355,979,573
-23.04%8.06%
3.46%12.76%
-10.15%23.46%
11,541,183
6,276,431
5,264,752
760,487
567,209
1,327,696
4,157,580
(2,156)
254,590
252,434
2,182,434
1,255,835
1.25
9,775,399
5,371,167
4,404,232
3,075,173
420,777
3,495,950
3,864,804
1,501,834
105,614
1,607,448
2,427,930
1,390,826
1.39
19.54%
-62.02%
7.58%
-10.11%
-9.71%
-9.35%
119.012.8
17:8314:86

Annual Report2017
3029
FY 2017
30.2%
9.4%
4.6%17.5%
5.2%
6.4%
3.3%
3.9%
14.9%
1.9%
2.7%
FY 2016
29.5%
11.4%
4.9%12.1%
4.4%
7.8%
3.6%
4.6%
4.6%
15.1%
2.0%
FY 2017
3.7%0.6%1.3%
94.4%
FY 2016
4.5%
1.1%1.1%
93.3%
PAT; 1,391
PBT; 2,428
Operating Expences;3,865
Non Mark-up Income;3,496
Net Interest Income;4,404
Provisions; 1,607
Profit 2016(Rs. in Million)
Operating Expences;4,158
PAT; 1,256
PBT; 2,182
Non Mark-up Income;1,328
Net Interest Income;5,265
Provision; 252
Profit 2017(Rs. in Million)
Gain on sale ofshares/mutual fund
ect; 290
Other income;9
Fee, commission &brokerage income;
359
income from dealingin foreign currencies;
53Gain on sale of Govt. Securities;2,644
Non-Markup Income 2016(Rs. in Million)
Gain on sale ofshares/mutual fund ect;
158
Other income; 10
Fee, commission& brokerage income;
454
Non-Markup Income 2017(Rs. in Million)
Dividend income;156
Gain on sale of Govt.securities; 2,644
Gain on sale ofGovt. securities;
446
Income from dealingin foreign currencies;
104 Dividend income;142
19.5
Agri-business
Automobile and transportation equipmentBasic iron and steelConstruction, Real Estate and societiesFinancialFoodMining and QuarryingPower Electricity and GasSugarTransport, Storage and Communication
Others
Investment in Govt. Securities
Investment in shares and mutualfunds
Investment in Subsidiary
Other Investments

Annual Report2017
3231
186
114
300
83
68
151

Annual Report2017
3433

Annual Report2017
3635
1
2
3
4
5
6
7
8
7
7
7
7
7
7
7
7
09.02.201728.04.2017 02.03.201704.08.2017 19.07.2017
88 888
28.08.2017
8
17.10.2017
8
45464748495051

Annual Report2017
Events
Commissioner Karachi Mr. Ejaz Ahmed Khan inaugurates Sindh Bank ATM at the Commissioner House Karachi.Also seen in the photograph are Mr. M. Bilal Sheikh and Sindh Bank President/CEO Mr. Tariq Ahsan.
Prize distribution ceremony held in Sindh Bank for successful employees who passed IBP Exams 2017.Seen in the photograph are Sindh Bank President/CEO Mr. Tariq Ahsan and HR Head Mr. Tajammul Hussain.
Ms. Erum Khalid Special Assistant to CM Sindh on Women Development (GoS) visited Sindh Bank,also seen in the photograph are Sindh Bank President/CEO Mr. Tariq Ahsan.
SMS Banking
● All Transactions Alert(PTCL, SSGC, KE, LESCO, KWSB & others)
● Utility Bills Payment(PTCL, SSGC, KE, LESCO, KWSB & others)
● MOBILE TOP-UPS(UFONE, MOBILINK, TELENOR, WARID, ZONG & Vfone)
● INTERNET SERVICE PROVIDERS (ISPS)(PTCL EVO, WI-TRIBE, QUBEE & WATEEN)
● FEE PAYMENTS OF EDUCATIONAL INSTITUTIONS(LUMS, PGOC)
● AIRLINE TICKET PAYMENT
● INSURANCE Premium PAYMENT(EFU & JUBILEE LIFE)
● INTRA BANK FUNDS TRANSFER (PAYC)
● INTER BANK FUNDS TRANSFER (IBFT)(HBL, UBL, ABL, SCB & Many Others)
● BALANCE ENQUIRY
● MINI STATEMENT
● EMAIL ALERTS
● COMPLETE STATEMENT OF ACCOUNT VIA EMAIL
● E-Commerce(On Visa Debit Card Only)
For Web Interface SMS Bankinghttp://smsbanking.sindhbankltd.com/

Annual Report2017
37 38
FINANCIAL HIGHLIGHTSRupees In billion
DEPOSITS
INVESTMENTS /LENDINGSRupees In billion
Investments Lending to financial institutions
DEC-11 DEC-12 DEC-13 DEC-14 DEC-15 DEC-16 DEC-17
140
120
100
80
60
40
20
INVESTMENT IN GOP SECURITIESRupees In billion
(Rupees in billions)
PROFIT
3.00
2.50
2.00
1.50
1.00
0.50
Profit before Taxation Profit after Taxation
DEC-11 DEC-12 DEC-13 DEC-14 DEC-15 DEC-16 DEC-17
1.14
0.75
1.29
0.89 0.95
0.67
1.61
2.43
1.39
2.05
1.231.08 1.26
2.18
Rupees In billion
DEPOSITS
ADVANCES
160
120
100
80
60
40
20
140
TERM SAVING CURENT
DEC-11 DEC-12 DEC-13 DEC-14 DEC-16 DEC-17DEC-15
Commodity Finance
Islamic financing and related assets
Bills discounted and purchased (excluding MTB)
Loan cash credits, running finance etc.
78.82%FY 2017
1.31%
3.19%
16.68%
FY 2017
TERM SAVING CURRENT
29.10% 40.30%
30.60%
DEC-11 DEC-12 DEC-13 DEC-14 DEC-15 DEC-16 DEC-17
Islamic Financing and related assets
Commodity FinanceBills discounted and purchased (excluding MTB)
Loan, cash credits, running finances etc.
60
40
20
80
DEC-11 DEC-12 DEC-13 DEC-14 DEC-15 DEC-16 DEC-17
Market Treasury Bills
Ijarah Sukuk
Sukur Certificate
GIS - Bai Muajil
Pakistan Investment Bonds
120
100
80
60
40
-
20
Mark-up / interest onloans & advances50.8% 29.8%
26.3% 1.6%
42.3%
2.1%10.3%
36.8%
Profit / return onlending / depositswith Fls / Banks
Non mark-up / non-interest income
Profit / return oninvestments
INCOME
FY 2016FY 2017
45.6% 8.0%
35.7%8.5%
2.2%
36.8%
8.7%
32.5%13.5%
8.5%
Mark-up / return ondeposits
Provision againstNPLs
Administrativeexpenses
Mark-up / return onborrowings
Taxation
EXPENSES
FY 2016FY 2017

Annual Report2017
4039
Value Added Statement Vertical AnalysisStatement of Financial Position / Profit & Loss
STATEMENT OF FINANCIAL POSITIONASSETSCash and balances with treasury banksBalances with other banksLendings to financial institutionsInvestmentsAdvancesOperating fixed assetsDeferred tax assets-netOther assets
LIABILITIESBills payableBorrowings from financial institutionsDeposits and other accountsDeferred tax liability-netOther liabilities
NET ASSETS
REPRESENTED BYShare capitalReservesUnappropriated profit(Deficit)/Surplus on revaluation of assets - net of related deferred tax
PROFIT & LOSS ACCOUNTMark-up / return / interest earnedFee, commission and brokerageIncome from dealing in foreign currenciesCapital gain and dividend incomeOther incomeTotal income
Mark-up / return / interest expensedOperating & admin expensesProvision against advances & othersTaxationTotal ExpensesProfit after taxation
2015Rs. in
million %
5,298 1,936
- 70,394 44,169 1,899
301 4,245
128,242
289 27,161 84,077
- 1,958
113,484
14,758
10,000 923
3,077
759 14,758
10,127 234 69
3,183 6
13,619
5,685 3,367 2,516
821 12,389 1,230
4%2%0%
55%35%1%0%3%
100%
0%21%65.%
2%88%
12%
8%1%2%
1%11%
74%2%1%
23%0%
100%
42%25%18%6%
91%9%
2014Rs. in
million %
5,066 538
12,665 59,467 41,185 1,812
4,138 124,871
400 46,077 61,884
903 1,506
110,769
14,102
10,000 676
2,102
1,325 14,102
8,932 184 66
702 4
9,889
5,497 2,759
21 532
8,809 1,079
4%0%
10%48%33%1%
3%100%
0%37%50%1%1%
89%
11%
7%1%2%
1%11%
90%2%1%7%0%
100%
56%28%0%5%
89%11%
2013Rs. in
million %
3,519 191
4,036 36,786 26,565 1,766
2,170 75,033
363 16,758 45,756
10 820
63,706
11,327
10,000 460
1,242
(375) 11,327
6,329 163 44
651 3
7,189
4,072 2,142
22 287
6,523 666
242
5%0%5%
49%35%2%
3%100%
0%23%61%0%1%
85%
15%
13%1%2%
-1%15%
88%2%1%9%0%
100%
57%30%0%4%
91%9%
2012Rs. in
million %
2,431 425
4,620 62,631 19,282 1,557
1,347 92,291
176 48,602 31,470
207 747
81,203
11,088
10,000 327 710
51 11,088
6,141 99 44
382 1
6,667
4,103 1,278
1 399
5,781 887
242
3%0%5%
68%21%2%
1%100%
0%53%34%0%1%
88%
12%
11%0%1%
0%12%
92%1%1%6%0%
100%
62%19%0%6%
87%13%
2011Rs. in
million %
1,656 244
10,905 26,082 7,259
584
1,000 47,730
42 13,013 23,518
10 484
37,067
10,663
10,000 150 600
(87) 10,663
3,704 11 2
209 0.34
3,926
2,241 514 31
390 3,177
750
3%1%
23%55%15%1%
2%100%
0%27%50%0%1%
78%
22%
21%0%1%
0%22%
95%0%0%5%0%
100%
57%13%1%
10%81%19%
2016Rs. in
million %
7,501 791
6,939 71,539 51,833 1,825 1,191 4,736
146,355
714 8,911
119,022
2,177 130,824
15,531
10,010 1,201 4,186
134 15,531
9,775 359 53
3,075 9
13,271
5,371 3,865 1,607 1,037
11,880 1,391
5%1%5%
49%35%1%1%3%
100%
0%7%
81%0%1%
89%
11%
7%1%3%
0%11%
74%3%0%
23%0%
100%
41%29%12%8%
90%10%
2017Rs. in
million %
9,680 3,023 5,331
114,260 64,713 1,655 1,612 4,209
204,482
905 50,971
134,207 -
2,331 188,414
16,068
10,010 1,452 5,176
(570) 16,068
11,541 454 104 760 10
12,869
6,276 4,158
252 927
11,613 1,256
5%1%3%
56%31%1%1%2%
100%
0%25%66%0%1%
92%
8%
5%1%2%
0%8%
90%3%1%6%0%
100%
49%32%2%7%
90%10%
Value Added
Net markup interest income
Non markup interest income
Operating expenses excluding staff costs
depreciation, amortization and donations
Provision against advances, investments & others
Value added available for distribution
Distribution of value added:
To employees
Remuneration, provident fund and other benefits
To government
Income tax
To expansion and growth
Depreciation
Amortization
Retained in business
2017Rs. in million
5,264
1,328
(1,756)
(252)
4,584
2,020
927
352
29
1,256
1,637
4,584
%
44.07%
20.21%
7.69%
0.63%
27.40%
35.72%
100%
2016Rs. in million
4,404
3,496
(1,645)
(1,607)
4,648
1,816
1,037
374
30
1,391
1,795
4,648
%
39.07%
22.31%
8.04%
0.65%
29.93%
38.62%
100%
2017
Expansionand growth
36%
Employees44%
Government20%
2016
Expansionand growth
39%
Employees39%
Government22%

Annual Report2017
4241
Key Performance Indicators
Financial
Investments-Gross
Advances-Gross
Deposits
Shareholders' Equity
Total Assets
Net Markup Interest Income
Non Markup Interest Income
Operating Expenses
Profit before provisions
Provision against advances & others
Profit before Taxation
Profit after Taxation
Dividend Paid
Non Financial
No. of Customers (as of)
No. of New Branches Opened
No. of New Accounts Opened
No. of ATM/Debit Cards Issued (as of)
No. of Permanent Employees (as of)
No. of ATM Machines (as of)
No. of Mobile Banking Customers
Key Financial Ratios
Earnings Per Share - Pre tax
Book Value Per Share
Return on Equity - Pre tax
Return on Assets - Pre tax
Capital Adequacy Ratio
Rs. In million
" "
" "
" "
" "
" "
" "
" "
" "
" "
" "
" "
" "
Numbers
" "
" "
" "
" "
" "
" "
Rupees
" "
%
" "
" "
2014
57,437
41,204
61,884
12,777
124,871
3,435
956
2,759
1,633
21
1,612
1,079
-
162,992
25
47,419
32,293
1,298
105
86,045
1.61
12.78
13.17%
1.61%
22.57%
2013
37,383
26,565
45,756
11,702
75,033
2,258
860
2,142
975
22
953
666
-
120,643
40
56,541
17,926
1,167
24
62,248
0.95
11.70
8.39%
1.14%
23.97%
2012
62,556
19,282
31,470
11,037
92,291
2,038
527
1,278
1,287
1
1,286
887
600
74,600
110
74,949
6,923
924
19
34,040
1.29
11.09
11.81%
1.97%
38.51%
2011
26,246
7,259
23,518
10,750
47,730
1,463
222
514
1,171
31
1,140
750
-
8,120
50
9,971
1,158
462
3
5,983
1.14
10.66
9.09%
2.21%
56.28%
69,235
46,708
84,077
14,000
128,242
4,442
3,492
3,367
4,567
2,516
2,051
1,230
-
355,567
25
192,572
83,729
1456
192
143,608
2.05
14.00
15.32%
1.62%
20.13%
20152016
71,341
55,980
119,022
15,397
146,355
4,404
3,496
3,865
4,035
1,607
2,428
1,391
-
414,944
10
61,638
128,667
1501
225
170,367
2.43
15.38
16.52%
1.77%
17.50%
2017
115,145
69,112
134,207
16,638
204,482
5,265
1,328
4,158
2,435
252
2,182
1,256
-
471,439
40
57,657
244,659
1,466
240
188,157
2.18
16.63
13.63%
1.24%
15.67%
Horizontal Analysis
STATEMENT OF FINANCIAL POSITION
2015Rs. in
million
15 vs 14%
2014Rs. in
million
14 vs 13%
2013Rs. in
million
13 vs 12%
2012Rs. in
million
12 vs 11%
2011Rs. in
million
2
47%
74%
-58%
140%
166%
167%
35%
93%
317%
274%
34%
1908%
54%
119%
4%
0%
118%
18%
-159%
4%
66%
830%
1840%
83%
311%
70%
83%
149%
-97%
2%
82%
18%
1,656
244
10,905
26,082
7,259
584
-
1,000
47,730
42
13,013
23,518
10
484
37,067
10,663
10,000
150
600
(87)
10,663
3,704
11
2
209
0.34
3,926
2,241
514
31
390
3,177
750
16 vs 15%
ASSETS
Cash and balances with treasury banks
Balances with other banks
Lendings to financial institutions
Investments
Advances
Operating fixed assets
Deferred tax assets-net
Other assets
LIABILITIES
Bills payable
Borrowings from financial institutions
Deposits and other accounts
Deferred tax liability
Other liabilities
NET ASSETS
REPRESENTED BY
Share capital
Reserves
Unappropriated profit
Surplus / (Deficit) on revaluation of
assets - net of related deferred tax
PROFIT & LOSS ACCOUNT
Mark-up / return / interest earned
Fee, commission and brokerage
Income from dealing in foreign currencies
Capital gain and dividend income
Other income
Total income
Mark-up / return / interest expensed
Operating & admin expenses
Provision against advances & others
Taxation
Total Expenses
Profit after taxation
2
45%
-55%
-13%
-41%
38%
13%
61%
-19%
106%
-66%
45%
-95%
10%
-22%
2%
0%
41%
75%
-838%
2%
3%
65%
-1%
70%
102%
8%
-1%
68%
1942%
-28%
13%
-25%
2,431
425
4,620
62,631
19,282
1,557
1,347
92,291
176
48,602
31,470
207
747
81,203
11,088
10,000
327
710
51
11,088
6,141
99
44
382
1
6,668
4,103
1,278
1
399
5,781
887
2
44%
182%
214%
62%
55%
3%
91%
66%
10%
175%
35%
9391%
84%
74%
25%
0%
47%
69%
-453%
25%
41%
13%
51%
8%
41%
38%
35%
29%
-3%
85%
35%
62%
3,519
191
4,036
36,786
26,565
1,766
2,170
75,033
363
16,758
45,756
10
820
63,706
11,327
10,000
460
1,242
(375)
11,327
6,329
163
44
651
3
7,189
4,072
2,142
22
287
6,523
666
2
5%
260%
-100%
18%
7%
5%
3%
3%
-28%
-41%
36%
-
30%
2%
5%
0%
37%
46%
-43%
5%
13%
27%
4%
353%
46%
38%
3%
22%
11719%
54%
41%
14%
5,066
538
12,665
59,467
41,185
1,812
4,138
124,871
400
46,077
61,884
903
1,506
110,769
14,102
10,000
676
2,102
1,325
14,102
8,932
184
66
702
4
9,889
5,497
2,759
21
532
8,809
1,079
2
42%
-59%
-
2%
17%
-4%
296%
12%
14%
147%
-67%
42%
-
11%
15%
5%
0%
30%
36%
-82%
5%
-3%
53%
-24%
-3%
60%
-3%
-6%
15%
-36%
26%
-4%
13%
5,298
1,936
-
70,394
44,169
1,899
301
4,245
128,242
289
27,161
84,077
-
1,958
113,484
14,758
10,000
923
3,077
759
14,758
10,127
234
69
3,183
6
13,619
5,685
3,367
2,516
821
12,389
1,230
2016Rs. in
million
17 vs 16%
2
29%
282%
-23%
60%
25%
-9%
35%
-11%
40%
27%
472%
13%
-
7%
44%
3%
0%
21%
24%
-525%
3%
18%
26%
96%
-75%
8%
-3%
17%
8%
-84%
-11%
-2%
-10%
7,501
791
6,939
71,539
51,833
1,825
1,191
4,736
146,355
714
8,911
119,022
-
2,177
130,824
15,531
10,010
1,201
4,186
134
15,531
9,775
359
53
3,075
9
13,271
5,371
3,865
1,607
1,037
11,880
1,391
2017Rs. in
million
9,680
3,023
5,331
114,260
64,713
1,655
1,612
4,209
204,482
905
50,971
134,207
-
2,331
188,414
16,068
10,010
1,452
5,176
(570)
16,068
11,541
454
104
760
10
12,869
6,276
4,158
252
927
11,613
1,256

Annual Report2017
4443
I. This statement is being presented to comply with the Public Sector Companies (Corporate Governance) Rules, 2013 (hereinafter called "theRules") issued for the purpose of establishing a framework of good governance, whereby a public sector company is managed in compliancewith the best practices of public sector governance.
II. The company has complied with the provisions of the Rules in the following manner:
Statement of Compliance with the Public Sector Companies (Corporate Governance) Rules, 2013
Name of company - Sindh Bank Limited
Name of the line ministry - Finance Department Govt. of Sindh
For the year ended - 31st December, 2017
(SCHEDULE-I)
S. No. Provision of the Rules
A non-executive director, Mr. Syed Hasan Naqvi (ex-Finance Secretary of Govt. of Sindh) hasbeen transferred by the Govt. of Sindh (GoS) on 22.12.2017 and posting of a Regular FinanceSecretary is still awaited (also see point 33).The directors have confirmed that none of them is serving as a director on more than fivepublic sector companies and listed companies simultaneously, except their subsidiaries.The ex-Finance Secretary, GoS in the capacity of “Ex-officio” is Director in more than '5'Public Sector Companies, for which relaxation has been given by SECP vide its LetterNo.CLD/CCD/PSC/37/2015/4457, dated 03.03.2017The appointing authorities have applied the fit and proper criteria given in the Annexure inmaking nominations of the persons for election as board members under the provisions ofthe Companies Act, 2017.The Chairman of the Board is working separately from the Chief Executive of the Company.The Chairman has been elected from amongst the Independent directors by the Board ofDirectors.The Board has evaluated the candidates for the position of the Chief Executive on the basisof the fit and proper criteria in terms of Prudential Regulations of State Bank of Pakistan.(a) The Company has prepared a “Code of Conduct” and has ensured that appropriate stepshave been taken to disseminate it throughout the Company along with its supporting policiesand procedures, including posting the same on the company's website i.e. www.sindhbankltd.com(b) The Board has set in place adequate systems and controls for the identification andredressal of grievances arising from unethical practices.The Board has established a system of sound internal control, to ensure compliance with thefundamental principles of probity and propriety; objectivity, integrity and honesty; and relationshipwith the stakeholders, in the manner prescribed in the Rules.The Board has developed and enforced an appropriate conflict of interest policy to lay downcircumstances or considerations when a person may be deemed to have actual or potentialconflict of interests, and the procedure for disclosing such interest.The Board has developed and implemented a policy on anti-corruption to minimize actualor perceived corruption in the company.(a) The Board has ensured equality of opportunity by establishing open and fair proceduresfor making appointments and for determining terms and conditions of service.(b) A Committee has been formed to investigating deviations from the company's code ofconduct.The Board has ensured compliance with the law as well as the company's internal rules andprocedures relating to public procurement, tender regulations, and purchasing and technicalstandards, when dealing with suppliers of goods and services.
Y NTick therelevant box
Rule No.
CategoryIndependent Directors
Names Date of appointment07.04.201507.04.201507.04.201507.04.2015
(As N.Ex Dir.) &15.02.2017 (As Ind. Dir.)
Non-Executive Directors*(see point 2.1 and 33)
1The Board has the requisite percentage of independent directors. At present the board includes:
4
Rule-3(2) a
The independent directors meet the criteria of independence, as defined under the Rules.
1. Mr. Mohammad Shahid Murtaza2. Mr. Muhammad Bilal Sheikh
1. Mr. Afzal Ghani2. Mr. Muhammad Naeem Sehgal3. Mr. Tajammal Husain Bokharee4. Mr. Raja Muhammad Abbas
Mr. Tariq AhsanPresident & CEO
07.04.201508.02.201605.09.201615.04.2016
2
*2.1
3
5
6
7
8
9
10
11
12
13
Rule-3(5)
Rule-3(7)
Rule-4(1)Section 192 of
Companies Act 2017Prudential Regulations
of SBP
Rule-5(4)
Rule-5(5)
Rule-5(5)(b)(ii)
Rule-5(5)(b)(vi)
Rule-5(5)(c)(ii)
Rule-5(5)(c)(iii)
a
a
a
a
a
a
a
a
a
a
a
The Board has developed a vision or mission statement, corporate strategy and significant policiesof the company. A complete record of particulars of significant policies along with the dates onwhich they were approved or amended has been maintained.The Board has quantified the outlay of any action in respect of any service delivered or goodssold by the Company as a public service obligation, and has submitted its request for appropriatecompensation to the Government for consideration.(a) The Board has met at least four times during the year and all the meetings were presidedover by the Chairman.(b) Written notices of the board meetings, along with agenda and working papers, were circulatedat least seven days before the meetings.(c) The minutes of the meetings were appropriately recorded and circulated. The board hascomplied with the requirements of Act and the Regulations with respect to frequency, recordingand circulating minutes of meeting of board.The Board has carried out performance evaluation of its members, including the chairman andthe chief executive, on the basis of a process, based on specified criteria, developed by it. Theboard has also monitored and assessed the performance of senior management on annual basis.The Board has reviewed and approved the related party transactions placed before it afterrecommendations of the audit committee. A party wise record of transactions entered into withthe related parties during the year has been maintained.The Board has approved the profit and loss account for, and balance sheet as at the end of, thefirst, second and third quarter of the year as well as the financial year end, and has placed theannual financial statements on the company's website.All the board members underwent an orientation course arranged by the company to apprisethem of the material developments and information as specified in the Rules. One of the Directorsnamely Mr. Naeem Sahgal is a Certified Director from PICG.(a) The board has formed the requisite committees, as specified in the Rules.(b) The committees were provided with written term of reference defining their duties, authority
and composition.(c) The minutes of the meetings of the committees were circulated to all the board members.(d) The committees were chaired by the following non-executive directors:
The Board has approved appointment of Chief Financial Officer, Company Secretary and ChiefInternal Auditor, with their remuneration and terms and conditions of employment, and as pertheir prescribed qualifications.The Company has adopted International Financial Reporting Standards notified by the Commissionunder clause (i) of sub-section (3) of section 234 of the Ordinance.The Directors' report for this year has been prepared in compliance with the requirements ofthe Ordinance and the Rules and fully describes the salient matters required to be disclosed.The directors, CEO and executives do not hold any interest in the shares of the company otherthan that disclosed in the pattern of shareholding.A formal and transparent procedure for fixing the remuneration packages of individual directorshas been set in place, according to the Prudential Regulations of SBP & Articles of Associationof the bank. The annual report of the company contains criteria and details of remuneration ofeach director.The financial statements of the company were duly endorsed by the chief executive and chieffinancial officer, before approval of the board.
Committee Number of members Name of Chair
Audit Committee 03 Mr. Muhammad Naeem Sahgal,(see point 2.1 and 33) Independent Director
Risk Management Committee 03 Mr. Tajammal Husain Bokharee,Independent Director
Human Resources Committee 04 Mr. Afzal Ghani,Independent Director
Procurement, I.T & 04 See point 2.1 and 33(see point 2.1and 33)
Nomination Committee 04 Mr. Raja Muhammad AbbasIndependent Director
14
15
16
17
18
19
20
21
22
23
24
25
26
27
Rule-5(6) a
Rule-5(8) N/A
Rule-6(1)
Rule-6(2)
Rule-6(3)a
Rule-8
Rule-9
Rule-10
Rule-11
Rule-12
a
a
a
a
a
a
a
a
a
a
a
Rule-13/14
Rule-16
Rule-17
Rule-18
Rule-19
Rule-20
Rule-2(d)
S. No. Provision of the Rules
Tick therelevant box
Rule No. Y N

Annual Report2017
45 46
aRule-21
Rule-23/5
Rule-23/4
Rule-23
Rule-22 a
a
a
a
a
a
a
28
The board has set up an effective internal audit function, which has an audit charter, dulyapproved by the audit committee, and which worked in accordance with the applicablestandards.
The company has appointed its external auditors in line with the requirements envisagedunder the Rules.
The external auditors of the company have confirmed that the firm and all its partners arein compliance with International Federation of Accountants (IFAC) guidelines on Code ofEthics as applicable in Pakistan.
The external auditors have not been appointed to provide non-audit services and the auditorshave confirmed that they have observed applicable guidelines issued by IFAC in this regard.
A casual vacancy has occurred on the board, as Finance Secretary, was transferred by Govt.of Sindh on 22.12.2017, which will be filled-up on posting a Regular Finance Secretary, in duecourse of time.
The Company has complied with all the corporate and financial reporting requirements ofthe Rules.
All the resident directors of the Company are registered as taxpayers and none of them hasdefaulted in payment of any loan to a banking company, a DFI or an NBFI.
Tariq AhsanPresident & CEO
Afzal GhaniChairman/Independent Director
Number ofmembers Category Professional background
The board has formed an Audit Committee, with defined and written terms ofreference and having the following members:
AuditCommittee
Advocate Supreme Court
Secretary Finance Govt. of Sindh(see point 2.1 and 33)
Mr. Naeem SahgalChairman/Independent Director
Finance Secretary (GoS)Member/Non-Executive Director
(see point 2.1 and 33)
Mr. Raja Muhammad AbbasMember/Independent Director
Mr. Muhammad Bilal SheikhMember/Non Executive Director
Retired Civil Servant
Banker
The chief executive and chairman of the Board are not members of the audit committee.
29
30
31
32
33
34
35
S. No. Provision of the Rules
Tick therelevant box
Rule No. Y N

Annual Report2017
47 48
Statement of Internal ControlsThis statement is presented to comply with the requirement of State Bank of Pakistan BSD circular No. 07 dated May 27, 2004 on “Guidelines onInternal Controls” and Annexure A of OSED Circular No. 01 dated February 07, 2014 on Internal Controls over Financial Reporting (ICFR).
The Board of Directors of the Bank is responsible for establishing and maintaining an adequate and effective system of internal controls which hasthe main objectives of ensuring effectiveness and efficiency of operations, reliability of financial reporting, safeguarding of assets and compliance withapplicable laws and regulations. These regulations which contain information requirements on how internal control is organized are designed to providereasonable certainty of the reliability of financial reporting.
The Board has established an ongoing process for identifying, evaluating and managing the significant risks faced by the Bank and this process includesthe system of Internal Control over Financial Reporting. The process is regularly reviewed by the Board and the control activities are being closelymonitored across the Bank through, Internal Control Committee (ICC), Compliance Division, Internal Audit Division, Risk Management Division andInternal Control Department covering key internal controls in all banking activities.
In order to discharge the above responsibility, the Board Audit Committee has direct oversight responsibility to ensure the independence of the internalaudit function and external audit. The Audit Committee meetings are held once in every quarter to discuss the scope and results of the work performedby the Internal Audit Department.
The Audit Committee also meets with external auditors prior to approval of half-yearly and final results of the Bank. Based on observations andweaknesses found and identified by the internal and external auditors, appropriate improvements in internal controls are made wherever possible, bythe management and approval of the Board of Directors is taken where required.
Due to inherent limitations, any system of internal controls is exposed to the risk of human error, system failure, circumvention and overriding ofcontrols. Therefore, evaluation and monitoring of existing internal controls is an ongoing process. It is pertinent to mention that an internal controlsystem is designed to manage rather than eliminate the risk. As such it can only provide reasonable and not absolute assurance against materialmisstatement or loss.
The Bank has adopted and implemented the internationally accepted COSO (Committee of Sponsoring Organizations of Tread way Commission)Framework of Internal Control-Integrated Framework to further enhance its internal control system and to manage bank risk on an integrated enterprisewide basis enabling it to meet the requirements of 'Guidelines on Internal Controls' issued by the State Bank of Pakistan. The Bank has developed acomprehensive testing and reporting framework for ensuring ongoing operating effectiveness of majority of key controls and has significantly addressedthe design improvement opportunities identified to complete the project related initiatives.
In order to ensure consistency in the process of compliance with the relevant guidelines, the Bank followed a structured roadmap by carrying outdetailed documentation of the important processes and controls, together with comprehensive gap analysis of the control design and developed andimplemented remediation plans for the gaps.
The management assists the Board in the implementation of its approved policies and procedures pertaining to Internal Control over Financial Reporting.The management is continuously in the process of enhancing the documentation of the system of Internal Control over Financial Reporting. Whileconcerted efforts have always been made to comply with the guidelines issued by SBP, the identification, evaluation, and management of risks withineach of the Bank's key activities, and their continued evaluation and changes to policies and procedures remains an ongoing process. The bank hasdeveloped a comprehensive management testing and reporting framework for ensuring ongoing operating effectiveness of majority of key controlsand has significantly addressed the design improvement opportunities identified to complete the project related initiatives.
In accordance with SBP directives, the Bank has completed all the stages of ICFR and upon satisfactory completion of ICFR roadmap, the SBP hadgranted waiver for the submission of Long Form Reports from external auditors from the year 2015. An annual assessment report on ICFR has beensubmitted to SBP by the Board Audit Committee (BAC) for the year 2016.
The Bank also successfully completed the cycle of review Internal Control over Financial Reporting for the year 2017 and the process shall continuegoing forward, under the SBP Internal Control Guidelines. In accordance with SBP's directives, the Annual Assessment Report for the year 2017 shallbe submitted by Board Audit Committee to the State Bank of Pakistan by March 31, 2018.
The Board is of the view that the system of Internal Control over Financial Reporting in place is sound and adequate to provide reasonable assuranceregarding the reliability of Financial Reporting and that the preparation of Financial Statements for external purposes is in accordance with relevantaccounting principles, standards and regulatory requirements
Based on the above, the Board of Directors endorses the management's evaluation of Internal Controls.
On behalf of the Board
Tariq AhsanPresident & CEO
KarachiMarch 07, 2018
Sindh Bank recognizes Consumer Grievances Handling Mechanism as a key process in
supporting its business and is all the time striving hard to promote a culture that values
customer experience as an important factor to derive growth.
Towards achievement of this goal, Sindh Bank has put in place a fair and efficient mechanism
for handling Consumer Grievances:
1- Customer lodges a complaint against the bank through call center, branch, email and
Bank's website etc.
2- All complaints will be forwarded to the Complaint Management Unit (CMU) of
the bank.
3- Customer complaints are acknowledged within two working days.
4- Complaints will be investigated and resolved within the time limit prescribed by the
State Bank of Pakistan (Seven to Thirty days depending on the severity of the complaint).
5- In case a complaint is not resolved within the stipulated time, customer will be advised
of the status through an interim reply.
6- In case a complaint is declined by the bank the customer will be provided with the
alternative grievance redressel forums.
During the year 2017, 102 complaints were directly received by the bank and the average
resolution time was 7 days.
DISCLOSURE ON CONSUMER GRIEVANCESHANDLING MECHANISM
Annual Report2017
5049
Annual Report2017
52
UNCONSOLIDATEDFINANCIAL STATEMENTSFOR THE YEAR ENDED
DECEMBER 31, 2017
PayPak, UnionPay & VISADebit Cards
Sindh Bank VISA and UnionPay Debit Cardscan be used anywhere in the world.
PakPak Debit Cards can only be used in Pakistan.These Debit Cards keep your wallet light and
your money safe.

Annual Report2017
53 54
ASSETSCash and balances with treasury banks 6 9,679,582 7,500,675Balances with other banks 7 3,023,451 791,478Lendings to financial institutions 8 5,331,327 6,938,610Investments - net 9 114,259,902 71,539,737Advances - net 10 64,713,341 51,833,182Operating fixed assets 11 1,654,427 1,825,483Deferred tax assets - net 12 1,611,943 1,190,485Other assets - net 13 4,208,503 4,735,723
204,482,476 146,355,373LIABILITIESBills payable 14 905,423 714,212Borrowings 15 50,971,174 8,910,738Deposits and other accounts 16 134,207,056 119,022,240Sub-ordinated loan - -Liabilities against assets subject to finance leaseDeferred tax liabilities - net 12 - -Other liabilities 17 2,331,015 2,177,298
188,414,668 130,824,488
NET ASSETS 16,067,808 15,530,885
REPRESENTED BY
Shareholders' equityShare capital 18 10,010,130 10,010,130Reserves 1,451,979 1,200,812Unappropriated profit 5,175,820 4,185,911
16,637,929 15,396,853(Deficit) / surplus on revaluation of assets - net of deferred tax 19 (570,121) 134,032
16,067,808 15,530,885CONTINGENCIES AND COMMITMENTS 20
The annexed notes from 1 to 40 and Annexure I form an integral part of these unconsolidated financial statements.
2017 2016Note (Rupees in '000)
Sindh Bank LimitedUnconsolidated Statement of Financial PositionAs at December 31, 2017
Chairman President and Chief Executive Officer Director Director Chief Financial Officer
Sindh Bank LimitedUnconsolidated Profit and Loss AccountFor the year ended December 31, 2017
Mark-up / return / interest earned 21 11,541,183 9,775,399Mark-up / return / interest expensed 22 6,276,431 5,371,167Net mark-up / return / interest income 5,264,752 4,404,232
Provision against non performing loans and advances - net 10.5.3 252,434 1,607,448Provision for diminution in the value of investments - net - -Bad debts written off directly - -
252,434 1,607,448Net mark-up / return / interest income after provisions 5,012,318 2,796,784
Non mark-up / interest income
Fee, commission and brokerage income 453,691 358,828Dividend income 156,062 141,517Income from dealing in foreign currencies 103,555 52,754Gain on sale of securities - net 23 604,425 2,933,656Unrealised gain on revaluation of investments
classified as 'held-for-trading' - -Other income 24 9,963 9,195Total non mark-up / interest income 1,327,696 3,495,950
6,340,014 6,292,734Non mark-up / interest expenses
Administrative expenses 25 4,148,159 3,864,279Other provisions / (reversals) against other assets - -Other charges 26 9,421 525Total non mark-up / interest expenses 4,157,580 3,864,804
2,182,434 2,427,930Extraordinary / unusual items - -Profit before taxation 2,182,434 2,427,930
Taxation- Current 806,948 1,404,921- Prior years 161,950 185,408- Deferred (42,299) (553,225)
27 926,599 1,037,104
Profit after taxation 1,255,835 1,390,826
Basic and diluted earnings per share (Rupees) 28 1.25 1.39
The annexed notes from 1 to 40 and Annexure I form an integral part of these unconsolidated financial statements.
2017 2016Note (Rupees in '000)
Chairman President and Chief Executive Officer Director Director Chief Financial Officer

Annual Report2017
55 56
2017 2016Note (Rupees in '000)
Profit after taxation 1,255,835 1,390,826
Other comprehensive income
Components of comprehensive income reflected in equity
Items that will be reclassified subsequently to profit and loss account - -
Items that will not be reclassified subsequently to profit and loss account:
Measurement of net defined benefit liability (22,706) (5,639)Related current tax credit 7,947 1,974
(14,759) (3,665)Total comprehensive income for the year transferred to equity 1,241,076 1,387,161
Components of comprehensive income reflected below equity
Items that will be reclassified subsequently to profit and loss account:
Net change in fair value of available for sale securities (1,083,312) (961,303)Related deferred tax credit 379,159 336,455
(704,153) (624,848)Items that will not be reclassified subsequently to profit and loss account - -
Total comprehensive income 536,923 762,313
The annexed notes from 1 to 40 and Annexure I form an integral part of these unconsolidated financial statements.
Sindh Bank LimitedUnconsolidated Statement of Comprehensive IncomeFor the year ended December 31, 2017
Chairman President and Chief Executive Officer Director Director Chief Financial Officer
Sindh Bank LimitedUnconsolidated Cash Flow StatementFor the year ended December 31, 2017
2017 2016Note (Rupees in '000)
CASH FLOW FROM OPERATING ACTIVITIESProfit before taxation 2,182,434 2,427,930Less: Dividend income (156,062) (141,517)
2,026,372 2,286,413Adjustments:Depreciation 11.2 352,614 374,452Amortisation 11.3 28,652 29,791Provision against non-performing loans and advances - net 10.5.3 252,434 1,607,448Written-off operating fixed assets 732 -Charge for defined benefit plan 31 48,740 44,842Gain on sale of operating fixed assets 24 (2,964) (4,146)
680,208 2,052,387 2,706,580 4,338,800
(Increase) / decrease in operating assetsLendings to financial institutions 1,607,283 (6,938,610)Advances - net (13,132,593) (9,271,541)Other assets - net 552,355 (489,843)
(10,972,955) (16,699,994)Increase / (decrease) in operating liabilitiesBills payable 191,211 425,531Borrowings 42,060,436 (18,249,959)Deposits and other accounts 15,184,816 34,945,596Other liabilities (excluding current taxation) 142,566 339,452
57,579,029 17,460,620 49,312,654 5,099,426
Contribution to gratuity fund 31 (50,481) (49,287)Income tax paid (960,919) (1,709,405)Net cash flow from operating activities 48,301,254 3,340,734
CASH FLOW FROM INVESTING ACTIVITIESNet investment in available-for-sale securities (34,089,595) (2,686,633)Net investment in held-to-maturity securities (9,713,882) 579,838Investment in subsidiary - -Dividend received 130,195 140,849Investments in operating fixed assets (222,548) (342,988)Sale proceeds of operating fixed assets disposed off 11.4 5,456 16,485Net cash used in investing activities (43,890,374) (2,292,449)
CASH FLOW FROM FINANCING ACTIVITIESIssue of share capital - 10,181Net cash flow from financing activities - 10,181
Increase in cash and cash equivalents 4,410,880 1,058,466Cash and cash equivalents at the beginning of the year 8,292,153 7,233,687Cash and cash equivalents at the end of the year 29 12,703,033 8,292,153
The annexed notes from 1 to 40 and Annexure I form an integral part of these unconsolidated financial statements.
Chairman President and Chief Executive Officer Director Director Chief Financial Officer

Annual Report2017
57 58
Sindh Bank LimitedNotes to the Unconsolidated Financial StatementsFor the year ended December 31, 2017
1. STATUS AND NATURE OF BUSINESS
1.1 Sindh Bank Limited (the Bank) was incorporated in Pakistan on October 29, 2010 as a public unlisted company and is engaged in Commercial Banking, Corporate and Investment related activities. The Bank operates 300(2016: 260) branches including 8 (2016: 8) sub-branches and 14 (2016: 14) Islamic banking branches in Pakistan. TheBank's registered office is located at 3rd floor, Federation House, Abdullah Shah Ghazi Road, Clifton, Karachi, Pakistan.
1.2 The Government of Sindh, through its Finance Department owns 99.9% ordinary shares of the Bank.
1.3 JCR –VIS Credit Rating Company Limited has reaffirmed the Bank's medium to long term entity rating of ‘AA’(Double A) with a 'Rating Watch-Developing' status and short term rating of ‘A-1+’ (A-One plus).
1.4 The State Bank of Pakistan (SBP) granted license to the Bank to conduct banking business subject to certainconditions which inter alia includes that the Bank shall get listed on stock exchange within three years from thedate of commencement of business. The Bank, however, from time to time had obtained extensions in the time limitfrom SBP. During 2016, the Bank initiated the process of listing of its shares on Pakistan Stock Exchange(PSX). Approval of the draft Prospectus was given by PSX on October 25, 2016 with a deadline to publish the samein the newspapers by October 31, 2016. Publication of the Prospectus was however halted and the listing process was put on hold as the Government of Sindh (sole sponsor of Sindh Bank Limited) and the majorityshareholders / sponsors of Summit Bank Limited agreed in principle, to consider a merger of the two institutions, withthe Bank being the surviving entity. SBP's approval to conduct due diligence of Summit Bank was grantedon December 27, 2016. On completion of the due diligence exercise, the Board of Directors and Shareholders ofthe respective banks had proposed a share swap ratio of 1:4.17 for which sanction was requested from SBP. However,subsequently, on the advice of SBP, it has been decided by the Board of Directors to re-star t duediligence process to arrive at fresh swap ratio based on the audited financial statements for the year ended 31December 2017 and accordingly, formal approvals from the Board, shareholders and the SBP will be obtainedfor finalization of the merger process.
2. BASIS OF PRESENTATION
2.1 These unconsolidated financial statements represent separate financial statements of the Bank. The consolidatedfinancial statements of the Group are being issued separately.
2.2 These unconsolidated financial statements have been prepared on the format prescribed by SBP under BSDCircular No. 4 dated February 17, 2006, 'Revised Forms of Annual Financial statements', effective from theaccounting year ended December 31, 2006. The SBP vide BPRD circular no. 2 dated January 25, 2018 has specifiedthe new reporting format for the financial statements of banking companies. The new format has revised the disclosurerequirements and will become applicable for the financial statements of the Bank for the year ending December 31, 2018.
2.3 In accordance with the directives of the Federal Government regarding the shifting of the Banking system toIslamic modes, the State Bank of Pakistan has issued various circulars from time to time. Permissible forms oftrade-related modes of financing include purchase of goods by Banks from their customers and immediate resale tothem at appropriate mark-up in price on deferred payment basis. The purchases and sales arising under thesearrangements are not reflected in these unconsolidated financial statements as such but are restricted to theamount of facility actually utilised and the appropriate portion of mark-up thereon. The Islamic Banking branches ofthe Bank have complied with the requirements set out under the Islamic Financial Accounting Standards (IFAS) issuedby the Institute of Char tered Accountants of Pakistan (ICAP) and notified under the provisions of therepealed Companies Ordinance, 1984.
2.4 The financial results of the Islamic Banking branches have been consolidated in these unconsolidated financialstatements for reporting purposes, after eliminating material inter-branch transactions / balances. Key financialfigures of the Islamic Banking branches are disclosed in Annexure I to these unconsolidated financial statements.
Sindh Bank LimitedUnconsolidated Statement of Changes in EquityFor the year ended December 31, 2017
Balance as at January 01, 2016 10,000,000 - 922,596 3,076,915 13,999,511
Profit for the year ended December 31, 2016 - - - 1,390,826 1,390,826Other comprehensive loss - - - (3,665) (3,665)
Total comprehensive income for the yearended December 31, 2016 - - - 1,387,161 1,387,161
Transfer to statutory reserve - - 278,165 (278,165) -Issue of share capital 10,130 51 - - 10,181
Balance as at December 31, 2016 10,010,130 51 1,200,761 4,185,911 15,396,853
Profit for the year ended December 31, 2017 - - - 1,255,835 1,255,835Other comprehensive loss - - - (14,759) (14,759)
Total comprehensive income for the yearended December 31, 2017 - - - 1,241,076 1,241,076
Transfer to statutory reserve - - 251,167 (251,167) -
Balance as at December 31, 2017 10,010,130 51 1,451,928 5,175,820 16,637,929
ShareCapital
StatutoryReserve *
Unappropriatedprofit **
TotalShare
Premium--------------------- (Rupees in '000) ---------------------
Capital Reserves Revenue Reserves
* Statutory reserve represents amount set aside as per the requirements of section 21 of the Banking CompaniesOrdinance, 1962.
** As more fully explained in note 10.5.2 of these unconsolidated financial statements, unappropriated profit includes anamount of Rs.1,594.62 million net of tax as at December 31, 2017 (December 31, 2016: Rs.472.71 million) representingadditional profit arising from availing forced sale value benefit for determining provisioning requirement which is notavailable for the purpose of distribution of dividend to shareholders.
The annexed notes from 1 to 40 and Annexure I form an integral part of these unconsolidated financial statements.
Chairman President and Chief Executive Officer Director Director Chief Financial Officer

Annual Report2017
59 60
3. STATEMENT OF COMPLIANCE
3.1 These unconsolidated financial statements have been prepared in accordance with approved accounting standardsas applicable in Pakistan. Approved accounting standards comprise of such International Financial Reporting Standards(IFRS) issued by the International Accounting Standards Board as are notified under the repealed Companies Ordinance,1984, Islamic Financial Accounting Standards (IFAS) issued by the Institute of Chartered Accountants of Pakistan (ICAP)as are notified under the repealed Companies Ordinance, 1984, provisions of and directives issued under the repealedCompanies Ordinance, 1984 and the Banking Companies Ordinance, 1962 and the directives issued by the State Bankof Pakistan (SBP) and the Securities and Exchange Commission of Pakistan (SECP). In case requirements differ, theprovisions and directions issued under repealed Companies Ordinance, 1984, the Banking Companies Ordinance,1962 and the directives issued by the SBP and SECP shall prevail.
3.2 Effective May 30, 2017, the Companies Act, 2017 (the Act) has been promulgated, however, the Securities and ExchangeCommission of Pakistan (SECP) vide its circular No. 23 of 2017 dated October 04, 2017 decided that the companieswhose financial year closes on or before December 31, 2017 shall prepare their financial statements in accordancewith the provisions of the repealed Companies Ordinance, 1984.
The SBP vide BSD Circular No. 10, dated August 26, 2002 has deferred the applicability of International AccountingStandard 39, Financial Instruments: Recognition and Measurement (IAS 39) and International Accounting Standard40, Investment Property (IAS 40) for Banking companies till further instructions. Further, according to the notificationof the Securities and Exchange Commission of Pakistan (SECP) dated April 28, 2008, the IFRS - 7 ‘Financial Instruments:Disclosures’ has not been made applicable for banks. Accordingly, the requirements of these standards have not beenconsidered in the preparation of these unconsolidated financial statements. However, investments have been classifiedand valued in accordance with the requirements of various circulars issued by the SBP.
IFRS 8, ‘Operating Segments’ is effective for the Bank’s accounting period beginning on or after January 01, 2009. Allbanking companies in Pakistan are required to prepare their annual financial statements in line with the formatprescribed under BSD Circular No. 4 dated February 17, 2006, ‘Revised Forms of Annual Financial Statements’, effectivefrom the accounting year ended December 31, 2006. The management of the Bank believes that as the SBP hasdefined the segment categorization in the above mentioned circular, the SBP requirements prevail over the requirementsspecified in IFRS 8. Accordingly, segment information disclosed in these financial statements is based on the requirementslaid down by the SBP.The SBP vide its BSD Circular No. 07 dated April 20, 2010 has clarified that for the purpose of preparation of financialstatements in accordance with International Accounting Standard - 1 (Revised), 'Presentation of Financial Statements',two statement approach shall be adopted i.e. separate 'Profit and Loss Account' and 'Statement of ComprehensiveIncome' shall be presented and Balance Sheet shall be renamed as 'Statement of Financial Position'. The surplus /(deficit) on revaluation of available for sale (AFS) securities is required to be included in the 'Statement of ComprehensiveIncome'. However, it should continue to be shown separately in the Statement of Financial Position below equity.Accordingly, the above requirements have been adopted in the preparation of these financial statements.
3.3 The Bank has adopted the following accounting standards, amendments and interpretations of IFRSs which becameeffective for the current year :
Standard or Interpretation
IAS 7 Statement of Cash Flows - Disclosure Initiative - (Amendment)
IAS 12 Income Taxes – Recognition of Deferred Tax Assets for Unrealized losses (Amendments)
Improvements to Accounting Standards Issued by the IASB
IFRS 12 Disclosure of Interests in Other Entities -Clarification of the scope of the disclosure requirements in IFRS 12
The adoption of the above amendments, improvements to accounting standards and interpretations did not haveany effect on the financial statements.
3.4 New accounting standards / amendments and IFRS interpretations that are not yet effective
The following standards, amendments and interpretations with respect to the approved accounting standards asapplicable in Pakistan would be effective from the dates mentioned below against the respective standard or interpretation:
Effective date (annualStandard or Interpretation periods beginning on or after)
IFRS 2 – Share-based Payments – Classification and Measurementof Share-based Payments Transactions – (Amendments) January 01, 2018
IFRS 10 – Consolidated Financial Statements and IAS 28 – Investmentin Associates and Joint Ventures - Sale or Contribution of Assetsbetween an Investor and its Associate or Joint Venture – (Amendment) Not yet finalized
IFRS 15 – Revenue from Contracts with Customers July 01, 2018
IFRIC Interpretation 22 – Foreign Currency Transactionsand Advance Consideration January 01, 2018
IFRIC 23 – Uncertainty over Income Tax Treatments January 01, 2019
IFRS 9 – Financial Instruments: Classification and Measurement July 01, 2018
IFRS 9 Prepayment Features with Negative Compensation –(Amendments) January 01, 2018
IFRS 4 Insurance Contracts: Applying IFRS 9 Financial Instruments with IFRS 4 Insurance Contracts – (Amendments) January 01, 2018
The above standards, amendments and interpretations are not expected to have any material impact on the Bank'sfinancial statements in the period of initial application. With regard to IFRS -9, the Bank considers that as the PrudentialRegulations and other SBP directives currently provide the accounting framework for the measurement and valuationof investments and provision against non-performing financings, the implementation of IFRS-9 may require changesin the regulatory regime. Therefore, the Bank expects that the SBP would issue suitable guidance and instruction onthe application of IFRS-9 for the banking sector of Pakistan.
In addition to the above standards and amendments, improvements to various accounting standards have also beenissued by the IASB in December 2016. Such improvements are generally effective for accounting periods beginningon or after January 01, 2018 and January 01, 2019. The Bank expects that such improvements to the standards willnot have any material impact on the Bank's financial statements in the period of initial application.
Further, following new standards have been issued by IASB which are yet to be notified by the SECP for the purposeof applicability in Pakistan.
IASB Effective date (annualStandard periods beginning on or after)
IFRS 14 – Regulatory Deferral Accounts January 01, 2016
IFRS 16 – Leases January 01, 2019
IFRS 17 – Insurance Contracts January 01, 2021
4. BASIS OF MEASUREMENT
4.1 Accounting convention
These unconsolidated financial statements have been prepared under the historical cost convention except for certaininvestments and commitments in respect of foreign exchange contracts and futures contracts which are measuredat fair values and certain employee benefits and investments which are measured on present value basis.

Annual Report2017
61 62
Items included in the unconsolidated financial statements are measured using the currency of the primaryeconomic environment in which the Bank operates. The unconsolidated financial statements are presented inPak Rupee, which is the Bank's functional and presentation currency.
4.2 Critical accounting estimates and judgmentsThe preparation of unconsolidated financial statements in conformity with approved accounting standards requiresmanagement to make judgments, estimates and assumptions that affect the reported amounts of assets andliabilities and income and expenses. Actual results may differ from these estimates. These estimates and assumptionsare reviewed on an ongoing basis. Revisions to accounting estimates are recognized in the period in which theestimate is revised if the revision affects only that period, or in the period of revision and future periods if therevision affects both current and future periods.
In par ticular, information about significant areas of estimates, uncer tainty and critical judgments in applyingaccounting policies that have the most significant affect on the amounts recognized in the unconsolidated financialstatements are as follows:
i) classification and impairment against investments (notes 5.3 and 9);ii) classification and provision against advances (notes 5.4 and 10);iii) depreciation and amortization / useful lives of operating fixed assets (5.5 and 11);iv) taxation (note 5.7);v) staff retirement and other benefits (note 5.8);vi) fair value of derivatives (note 5.14); andvii) judgements made by management in ident i f icat ion and repor t ing segment information.
5. SUMMARY OF SIGNIFICANT ACCOUNTING POLICIES
The accounting policies adopted in the preparation of these unconsolidated financial statements are consistent withthose of the previous financial year, unless otherwise disclosed or specified.
5.1 Cash and cash equivalents
For the preparation of cash flow statement, cash and cash equivalents include cash and balances with treasury banksand balances with other banks excluding any term deposits with original term of greater than three months.
5.2 Repurchase / resale agreements
The Bank enters into transactions of repos and reverse repos at contracted rates for a specified period of time. Theseare recorded as under:
a) Sale of securities under repurchase agreement
Securities sold subject to repurchase agreements (repo) remain on the unconsolidated statement of financialposition as investments and the counter party liability is included in borrowings from financial institutions. Thedifference between the sale and repurchase price is treated as mark-up / return expense and accrued over theperiod of the agreement using the effective interest rate method.
b) Purchase of securities under resale agreement
Securities purchased under agreements for resale (reverse repo) are recorded as lendings to financial institutions.These transactions are accounted for on the settlement date. The difference between the purchase and resaleprice is recognized as mark-up / return income over the period of the agreement using the effective interest ratemethod.
5.3 Investments
The bank classifies its investments as follows:
a) Held-for-trading
These are securities which are either acquired for generating profit from short-term fluctuations in market prices,interest rate movements, dealers margin or are securities included in a portfolio in which a pattern of short-termprofit taking exists.
b) Held-to-maturity
These are securities with fixed or determinable payments and fixed maturity that the Bank has the positive intent andability to hold till maturity.
c) Available-for-sale
These are investments, which do not fall under the held-for-trading and held-to-maturity categories.
d) Subsidiaries
Subsidiary is an entity over which the Bank has control. Investment in subsidiary is carried at cost less accumulatedimpairment losses, if any.
All purchases and sales of investments that require delivery within the time frame established by regulations or marketconvention are recognized at the trade date. Trade date is the date on which the Bank commits to purchase or sellthe investment.
Investments other than those categorized as 'held-for-trading' are initially recognized at fair value and includes transactioncosts associated with the investment. Investments classified as 'held-for-trading' are initially recognized at fair valueand transaction costs are expensed in the unconsolidated profit and loss account.
Quoted securities, other than those classified as held-to-maturity are subsequently stated at fair value.
Investments classified as held-to-maturity are carried at amortized cost. Unquoted equity securities are valued at lowerof cost and break-up value. Break-up value of unquoted equity securities is calculated with reference to the net assetsof the investee company as per the latest available audited financial statements. Investments in other unquoted securitiesare valued at cost less impairment losses, if any.Unrealized surplus / deficit arising on revaluation of quoted securities classified as 'available-for-sale' is disclosed belowshareholders' equity in the statement of financial position. Unrealized gain / loss arising on revaluation of quotedsecurities which are classified as 'held-for-trading' is taken to the unconsolidated profit and loss account.
Cost of investment is determined on moving average basis.
Impairment
Impairment loss in respect of investments classified as available-for-sale and held-to-maturity is recognized on the basisof management's assessment of objective evidence of impairment as a result of one or more events that may havean impact on the estimated future cash flows of the investments. A significant or prolonged decline in market valueof an equity security is considered as an objective evidence of impairment, significant means 20% decline in marketvalue as compared to cost, rebutted by in certain cases such as material market volatility, uncertainty and other marketimpacting external events, in which cases, a higher percentage is also considered by the management for determinationof what is presumed as significant decline. Provision for diminution in the value of term finance certificates is madeas per the requirements of Prudential Regulations issued by the State Bank of Pakistan. In case of impairment ofavailable-for-sale securities, the cumulative loss that has been recognized directly in the surplus / (deficit) on revaluationof securities on the unconsolidated statement of financial position below equity is removed there from and recognizedin the unconsolidated profit and loss account. For investments classified as held-to-maturity, the impairment loss isrecognized in the unconsolidated profit and loss account.

Annual Report2017
63 64
Gain or loss on sale of investments is included in the profit and loss account in the year in which they arise.
Bai Maujjal
In Bai Maujjal, the Bank sells Shariah compliant instruments on credit to other financial institutions. The credit price isagreed at the time of sale and such proceeds are received at the end of the credit period. The difference betweenthe sale and the credit pr ice is recognised over the credit per iod and recorded as income.
5.4 Advances
Advances are stated net of provisions for non-performing advances. Specific and general provisions are made basedon appraisal of the loan portfolio that takes into account the requirements of the Prudential Regulations issued bythe State Bank of Pakistan. The provisions against non-performing advances are charged to the unconsolidated profitand loss account. Advances are written off when there is no realistic prospect of recovery after explicit approval fromthe Board of Directors. The general provision is for the inherent risk of losses which are known from experience tobe present in any loan portfolio.
Ijarah Financing
Applying IFAS-2 method, assets underlying Ijarah have been carried at cost less accumulated depreciation andimpairment, if any, and are shown under Islamic financing and related assets. Rentals accrued from Ijarah financing netof depreciation charge are taken to the unconsolidated profit and loss account. Depreciation on Ijarah assets is chargedby applying the straight line method over the Ijarah period which is from the date of delivery of respective assets tomustajir upto the date of maturity / termination of Ijarah agreement.
Diminishing Musharakah
In Musharakah based financing, the Bank enters into Musharakah for financing an agreed share of fixed assets with itscustomer and enters into periodic profit payment agreement for the utilization of the Bank's Musharakah share bythe customer. Specific and general provisions are made in accordance with the requirement of prudential regulationsand other directives issued by the SBP and charged to unconsolidated profit and loss account.
5.5 Operating fixed assets and depreciation
a) Property and equipment - owned
Proper ty and equipment are stated at cost less accumulated depreciation and accumulated impairmentlosses, if any.
Cost includes expenditure that is directly attributable to the acquisition of the asset. Subsequent costs are includedin an asset's carrying amount or recognized as a separate asset as appropriate, only when it is probable that futurebenefits associated with the item will flow to the Bank and the cost of the item can be measured reliably. All otherrepairs and maintenance expenses are charged to the unconsolidated profit and loss account as and when incurred.
Depreciation is charged to the unconsolidated profit and loss account applying the straight line method at the ratesspecified in note 11 to these unconsolidated financial statements after taking into account residual value, if significant.The residual values, useful lives and depreciation method are reviewed and adjusted, if appropriate, at each date ofunconsolidated statement of financial position. Depreciation is charged from the month the assets are available foruse while no depreciation is charged in the month in which the assets are disposed off.
Gains or losses on disposal, if any, are recognized in the unconsolidated profit and loss account in the year in whichthey arise.
b) Capital work-in-progress
Capital work-in-progress is stated at cost less accumulated impairment losses, if any. All expenditure connectedwith specific assets incurred during installation and related advances there against, if any, are carried under thishead. These are transferred to specific assets as and when the assets become available for use.
c) Intangible assets
Intangible assets are stated at cost less accumulated amortisation and accumulated impairment losses, if any.Amortisation is charged to the unconsolidated profit and loss account applying the straight line method at therate specified in note 11, to these unconsolidated financial statements from the date an intangible asset is availablefor use. The useful life and amortisation method are reviewed and adjusted, if appropriate, at each date ofunconsolidated statement of financial position.
5.6 Impairment of financial assets
The carrying amount of assets is reviewed at each reporting date to determine whether there is any indication ofimpairment of any asset or group of assets. If any such indication exists, the recoverable amount of such assets isestimated and impairment losses are recognized immediately in the unconsolidated financial statements. The resultingimpairment loss is taken to the unconsolidated profit and loss account.
5.7 Taxation
Taxation (Income tax) expense relates to current and prior years and deferred tax. Income tax expense is recognizedin the unconsolidated profit and loss account except to the extent that it relates to items recognized directly in equityor in other comprehensive income.
a) Current
Provision for current tax is the tax payable on the expected taxable income for the year using tax rates enactedor substantively enacted at the reporting date and, any adjustment to tax payable relating to prior years, aftertaking into consideration available tax credits, rebates, tax losses etc.
b) Deferred
Deferred tax is recognized using the balance sheet liability method, providing for temporary differences between thecarrying amounts of assets and liabilities for financial reporting purposes and the amounts used for taxation purposes.
Deferred tax is measured at the tax rates that are expected to be applied to the temporary differences when theyreverse, based on the laws that have been enacted or substantively enacted by the reporting date.
Deferred tax liabilities are generally recognised for all taxable temporary differences and deferred tax assets arerecognised for all deductible temporary differences and carried forward unused tax losses, to the extent that it isprobable that future taxable profit will be available against which the deductible temporary differences and carriedforward unused tax losses can be utilized. Deferred tax assets are reviewed at each reporting date and are reducedto the extent that it is no longer probable that the related tax benefits will be realized.
5.8 Staff retirement and other benefits
a) Defined contribution plan
The Bank operates recognised contributory provident fund for all its permanent employees to which equal contributionsat the rate of 10 percent (2015: 10 percent) of basic salary are made by both the Bank and the employees. Thecontributions are recognized as employee benefit expense when they are due.
b) Defined benefit plan
The Bank operates recognised gratuity scheme for all its permanent employees who complete the prescribedeligibility period of service. Provision is made annually to meet the cost of such gratuity benefits on the basis ofactuarial recommendations using the Projected Unit Credit Method.

Annual Report2017
65 66
c) Compensated absences
The Bank makes provision in the financial statements for its liabilities towards compensated absences. Liabilityunder the scheme is determined on the basis of actuarial advice using the Projected Unit Credit Method.
5.9 Provisions against liabilities
Provisions are recognized when the Bank has a legal or constructive obligation as a result of past events and it isprobable that an outflow of resources will be required to settle the obligation and a reliable estimate of the amountcan be made. Provisions are reviewed at each date of unconsolidated statement of financial position and are adjustedto reflect the current best estimate.
5.10 Borrowings / deposits and their cost
Borrowings / deposits are recorded at the proceeds received. Borrowing / deposit costs are recognized as an expensein the period in which these are incurred using the effective mark-up / interest rate method.
5.11 Revenue recognition
Revenue is recognized to the extent that the economic benefit associated with the transaction will flow to the Bankand the revenue can be reliably measured.
5.11.1 Mark-up / return / interest on loans and advances and return on investments are recognized on a time proportionbasis using the effective interest rate method except that mark-up / return / interest on non-performing advancesand investments is recognized on receipt basis, in accordance with the requirements of the Prudential Regulationsissued by the SBP. Where debt securities are purchased at a premium or discount, such premium or discount isamortised through the unconsolidated profit and loss account over the remaining period of maturity.
5.11.2 Dividend income from investments is recognized when the Bank's right to receive the dividend is established.
5.11.3 Fees, brokerage and commission on letters of credit / guarantees and others is recognized on time proportion basis.
5.11.4 Financial advisory fees is recognized when the right to receive the fees is established.
5.11.5 Gain or loss on sale of investments is included in unconsolidated profit and loss account in the year in whichthey arise.
5.11.6 Rentals from Ijarah is recognized as income over the term of the contract net of depreciation expense.
5.11.7 Profit on Diminishing Musharakah is recognized in unconsolidated profit and loss account on accrual basis.
5.12 Proposed dividend and transfers between reserves
Dividends and appropriations to reserves, except appropriations which are by law required to be made subsequentto the date of statement of financial position are considered as non-adjusting events and are recorded in the financialstatements in accordance with the requirements of International Accounting Standard (IAS) 10, 'Events after theBalance Sheet Date' in the period in which they are approved / transfers are made.
5.13 Foreign currency translation
Transactions in foreign currencies are translated into Pak Rupees at the exchange rates prevailing at the transactiondate. Monetary assets and liabilities denominated in foreign currencies are re-translated to Pak Rupees at the ratesof exchange prevailing at the reporting date. Translation gains and losses are included in the unconsolidated profitand loss account.
5.14 Financial instruments
a) Financial assets and liabilities
Financial assets and liabilities carried on the unconsolidated statement of financial position include cash and bankbalances, lendings to financial institutions, investments, advances, certain receivables, bills payable, borrowings fromfinancial institutions, deposits, subordinated loans and certain payables. The particular recognition methods adoptedfor significant financial assets and financial liabilities are disclosed in the individual policy notes associated with them.
b) Derivative financial instruments
Derivative financial instruments are initially recognised at fair value on the date at which the derivative contract isentered into and subsequently remeasured at fair value using appropriate valuation techniques. All derivative financialinstruments are carried as assets where fair value is positive and as liabilities where fair value is negative. Any changesin the fair value of derivative financial instruments are taken to unconsolidated profit and loss account.
5.15 Offsetting
Financial assets and financial liabilities are set off and the net amount is reported in the unconsolidated financialstatements only when the Bank has a legally enforceable right to set off and the Bank intends to either settle on anet basis, or to realize the assets and to settle the liabilities simultaneously.
5.16 Segment reporting
A segment is a distinguishable component of the Bank that is engaged either in providing particular products orservices (business segment), or in providing products or services within a particular economic environment (geographicalsegment), and is subject to risks and rewards that are different from those of other segments.
Business segments
a) Corporate Finance
It includes investment banking activities such as mergers and acquisitions, underwriting, privatization, securitization,Initial Public Offerings (IPOs) and secondary private placements.
b) Trading and sales
It includes fixed income, equity, foreign exchanges, commodities, credit, funding, own position securities, lendings andrepos, brokerage debt and prime brokerage.
c) Retail Banking
It includes mortgage finance and personal loans to individual customers.
d) Commercial banking and others
It includes loans, deposits and other transactions with corporates, small and medium sized customers including agriculture loans.
Geographical segments
The Bank operates only in Pakistan.

Annual Report2017
67 68
5.17 Dividend distribution and appropriation
Dividends and other appropriations (except appropriations which are required by law) are recognized in the periodin which these are approved.
5.18 Earnings per share
The Bank presents basic earnings per share (EPS) which is calculated by dividing the profit or loss attributable toordinary shareholders of the Bank by the weighted average number of ordinary shares outstanding during the year/ period. Diluted EPS is determined by adjusting the unconsolidated profit or loss attributable to ordinary shareholdersand the weighted average number of ordinary shares outstanding adjusted for the effects of all dilutive potentialordinary shares, if any.
5.19 Acceptances
Acceptances comprise of undertakings made by the Bank to pay bills of exchange drawn on customers. The Bankexpects most acceptances to be simultaneously settled with reimbursement from the customers. Acceptances areaccounted for as off balance sheet transactions and are disclosed as contingent liabilities and commitments.
5.20 Commitments
Commitments for outstanding forward foreign exchange contracts are disclosed in these unconsolidated financialstatements at committed amounts. Contingent liabilities / commitments for letters of credit and letters of guaranteedenominated in foreign currencies are expressed in Rupee terms at the rates of exchange prevailing at the date ofthe unconsolidated statement of financial position.
5.21 Provision against off balance sheet obligations
Provision for guarantees, claims and other off balance sheet obligations is made when the Bank has a legal orconstructive obligation as a result of past events and it is probable that an outflow of resources will be required tosettle the obligation and a reliable estimate of the amount can be made. Charge to unconsolidated profit and lossaccount is stated net of expected recoveries.
6. CASH AND BALANCES WITH TREASURY BANKS
In handLocal currency 6.1 2,226,303 1,873,000Foreign currency 181,013 77,766
2,407,316 1,950,766With State Bank of Pakistan (SBP) inLocal currency current accounts 6.2 6,024,205 4,510,387Foreign currency current accounts 6.3 51,816 5,156Foreign currency deposit accounts- Non Remunerative 6.4 83,421 62,289- Remunerative 6.5 230,932 168,666
6,390,374 4,746,498With National Bank of Pakistan inLocal currency current account 863,596 786,674Local currency Profit and loss (PLS) account 18,296 16,737
881,892 803,411 9,679,582 7,500,675
2017 2016Note (Rupees in '000)
6.1 This includes national prize bonds of Rs.3.13 (2016: Rs.1.03) million.
6.2 This represents the cash reserve required to be maintained with SBP as per the requirement of Section 22 of theBanking Companies Ordinance, 1962. This is a sum not less than such percentage of its time and demand liabilitiesin Pakistan as may be prescribed by the SBP.
6.3 This represents US Dollar Settlement Account maintained with SBP.
6.4 This represents foreign currency (FCY) cash reserve maintained with SBP to comply with statutory reserve requirementapplicable to Bank's FCY deposits.
6.5 This represents foreign currency special cash reserve maintained with SBP. The Bank is entitled to earn profit whichis declared by SBP on a monthly basis. During the period, the SBP has declared profits in the range of 0.06% to 0.37%(2016: Nil) per annum.
7. BALANCES WITH OTHER BANKS
In PakistanIn current accounts 56,460 15,016In saving accounts 7.1 15,935 90,746In term deposit accounts 7.2 2,200,000 200,000
Outside PakistanIn current accounts 7.3 751,056 485,716
3,023,451 791,478
7.1 This includes saving deposits with a commercial bank carrying profit at the rate of 3.75% (2016: 3.75%) per annum.
7.2 This represents term deposit accounts with commercial banks having maturity from January 2018 to March 2018(2016: 3 months) carrying mark-up ranging from 6.76% to 7.20% (2016: 6.95%) per annum.
7.3 This includes Rs.521.74 (2016: Rs.201.87) million held in Automated Investment Plans. This balance is current in natureand in case this balance goes above a specified amount, the Bank is entitled to earn interest from the correspondentbanks at the agreed rates.
8. LENDINGS TO FINANCIAL INSTITUTIONS
Call money lendings - 2,000,000Bai Muajjal 8.2 364,577 -Repurchase agreement lendings (reverse repo) 8.3 & 8.4 4,966,750 4,938,610
5,331,327 6,938,610
8.1 Particulars of lendings - by currencyLocal currency 5,331,327 6,938,610Foreign currency - -
5,331,327 6,938,610
8.2 This represents outright purchase of Government Ijarah Sukuk from SBP on deferred payment basis (Bai-Muajjal), at a return of 5.27% (2016: Nil) per annum maturing on June 21, 2018 (2016: Nil).
8.3 This represents resale agreement lending with a commercial bank carrying mark-up at a rate of 5.78% (2016: 5.80%)per annum maturing on January 05, 2018 (2016: January 03, 2017).
2017 2016Note (Rupees in '000)
2017 2016Note (Rupees in '000)

Annual Report2017
69 70
Preference sharesListed 9.2.7 - 249,961Unlisted 9.2.8 61,305 -
61,305 249,961Term finance certificatesListed 9.2.9 324,127 324,272Unlisted 9.2.10 754,686 12,527
1,078,813 336,799
Investment in Subsidiary - unlisted 9.3 750,000 750,000
Other investmentsUnits of mutual funds 9.2.11 613,493 613,533Islamic funds REIT 9.2.12 99,000 99,000Sukuk certificates 9.2.4 142,857 178,571
855,350 891,104
Total investments at cost 115,144,821 71,341,344
Provision for diminution in value of investments 9.4 (7,810) (7,810)
Investments (net of provisions) 115,137,011 71,333,534
(Deficit) / Surplus on revaluation of available-for-sale securities 19 (877,109) 206,203
Total investments at market value - net of provisions 114,259,902 71,539,737
2017 2016Note (Rupees in '000)
9.2.1 These securities have tenure of 10 to 20 (2016: 10 to 20) years. The effective yield on these investments ranges from6.92% to 12.94% (2016: 6.92% to 12.98%) per annum with maturities from August 2021 to August 2031 (2016:August 2021 to August 2031).
9.2.2 These securities are for a maximum period of 3 months (2016: 6 months). The effective yield on these investmentsranges from 5.98% to 6.14% (2016: 5.78% to 5.90%) per annum with maturities from 1 months to 2 months (2016:1 months to 2 months).
9.2.3 This represents investment in sukuk certificates of WAPDA maturing on October 14, 2021 and carries profit at therate 6M KIBOR plus 1.00% (2016: 6M KIBOR plus 1.00%) per annum payable semi annually.
9.2.4 This represents investment in privately placed sukuk certificate of AL Baraka Bank Pakistan Limited maturing onSeptember 26, 2021 and carries profit at the rate 6M KIBOR plus 1.25% (2016: 6M KIBOR plus 1.25%) per annum,payable semi-annually.
9.2.5 This represents investment in Ijarah Sukuk of Government of Pakistan (GoP) having maturities from December 2018to June 2020 (2016: December 2018) and carry profit at the rates ranging from 5.24% to 6.10% (2016: 3.98% to5.45%) per annum.
Held byBank
2017Furthergiven as
collateral
TotalHeld by
Bank
2016Furthergiven ascollateral
Total
-------------------------- (Rupees in '000) ----------------------------
Market Treasury Bills 4,974,450 - 4,974,450 - 4,940,415 4,940,415
Held byBank
2017given as
collateralTotal
Held byBank
2016given ascollateral
Total
-------------------------- (Rupees in '000) ----------------------------Note
9. INVESTMENTS - NET
9.1 Investments by types
8.4 Securities held as collateral against lendings to financial institutions
Available-for-sale securitiesPakistan Investment Bonds 9.2.1 17,774,769 20,970,031 38,744,800 49,193,663 - 49,193,663Market Treasury Bills 9.2.2 21,810,464 30,325,395 52,135,859 8,233,454 1,249,209 9,482,663Fully paid ordinary shares - listed 9.2.6 3,476,796 - 3,476,796 2,235,424 - 2,235,424Term finance certificates - listed 9.2.9 99,840 - 99,840 99,880 - 99,880Term finance certificates - unlisted 9.2.10 - - - 12,527 - 12,527Units of mutual funds 9.2.11 613,493 - 613,493 613,533 - 613,533Islamic funds REIT 9.2.12 99,000 - 99,000 99,000 - 99,000Government of Pakistan - Ijarah Sukuk 9.2.5 952,926 - 952,926 200,000 - 200,000Sukuk certificates 9.2.3 &
9.2.4 385,714 - 385,714 482,143 - 482,143 45,213,002 51,295,426 96,508,428 61,169,624 1,249,209 62,418,833
Held-to-maturity securitiesPakistan Investment Bonds 9.2.1 16,846,115 - 16,846,115 7,458,429 - 7,458,429Government of Pakistan - Ijarah Sukuk 9.2.5 - - - 239,729 - 239,729Preference shares - listed 9.2.7 - - - 249,961 - 249,961Preference shares - unlisted 9.2.8 61,305 - 61,305 - - -Term finance certificates - listed 9.2.9 224,287 - 224,287 224,392 - 224,392Term finance certificates - unlisted 9.2.10 754,686 - 754,686 - - -
17,886,393 - 17,886,393 8,172,511 - 8,172,511Investment in SubsidiaryFully paid ordinary shares 9.3 750,000 - 750,000 750,000 - 750,000
Total investments at cost 63,849,395 51,295,426 115,144,821 70,092,135 1,249,209 71,341,344Less: Provision for diminution in
value of investments 9.4 (7,810) - (7,810) (7,810) - (7,810)
Investments (net of provisions) 63,841,585 51,295,426 115,137,011 70,084,325 1,249,209 71,333,534
(Deficit) / surplus on revaluation ofavailable-for-sale securities 19 (686,688) (190,421) (877,109) 206,208 (5) 206,203
Total investments at market value - net of provisions 63,154,897 51,105,005 114,259,902 70,290,533 1,249,204 71,539,737
9.2 Investments by segment
Federal Government SecuritiesPakistan Investment Bonds 9.2.1 55,590,915 56,652,092Market Treasury Bills 9.2.2 52,135,859 9,482,663Sukuk certificates 9.2.3 242,857 303,572Government of Pakistan - Ijarah Sukuk 9.2.5 952,926 439,729
108,922,557 66,878,056Fully paid ordinary sharesListed companies 9.2.6 3,476,796 2,235,424
2017 2016Note (Rupees in '000)

Annual Report2017
71 72
9.2.9.2 Other particulars of listed term finance certificates are as follows:
ParticularsCoupon / Profit rates Profit payment Maturity
MCB Bank Limited (Formerly NIB Bank Limited) - second issue (unsecured) 6M KIBOR plus 1.15% Semi-annually June 19, 2022Summit Bank Limited (unsecured) 6M KIBOR plus 3.25% Semi-annually October 27, 2018
9.2.10 Details of investment in term finance certificates - unlisted
----- (Rupees in '000) ----
RatingNumber
ofcertificates
Paid-upvalue per certificate
Marketvalue Cost
2016
----- (Rupees in '000) ----
RatingNumber
ofcertificates
Paid-upvalue per certificate
Marketvalue Cost
2017
Note
Held-to-maturity securitiesAl-Arabia Sugar Mills Limited -
1st issue Unrated 105,937 5,000 529,686 529,686 - - - - -
Silk Bank Limited - 1st issue 9.2.10.1 A- 45,000 5,000 225,000 225,000 - - - - -
Available-for-sale securitiesFaysal Bank Limited -
2nd issue - - - - - AA- 5,000 5,000 12,628 12,527
754,686 754,686 12,628 12,527
9.2.10.1These term finance certificates are sub-ordinated in nature. In case of default, the payment in respect of principal and profit will rank subordinated to all the depositors and other creditors of the issuing banks.
9.2.10.2Other particulars of un-listed term finance certificates are as follows:
Particulars Coupon / Profit rates Profit payment Maturity
Al-Arabia Sugar Mills Limited 6M KIBOR plus 0.20% Semi-annually December 30, 2026(inclusive 1.5 years grace
period)Silk Bank Limited
6M KIBOR plus 1.85% Semi-annually August 10, 2025
9.2.11 Details of investments in mutual funds
CostRatingNumber of
units Market /net asset
value
----- (Rupees in '000) ---- ----- (Rupees in '000) ----
2017 2016
CostRating Number ofunits
Market /net asset
value
Available for sale securities
Open endNational Investment Unit Trust AM2++ 5,594,093 394,775 500,000 AM2+ 5,892,058 515,791 500,000
Closed endPICIC Growth Fund AM2 1,049,500 29,753 28,459 AM2 1,049,500 31,968 28,459PICIC Investment Fund AM2 6,343,500 84,686 85,034 AM2 6,346,500 88,216 85,074
114,439 113,493 120,184 113,533
Total investments in mutual funds 509,214 613,493 635,975 613,533
9.2.12 Details of investments in Islamic funds
Arif Habib Dolmen (REIT) RR1 9,000,000 99,000 99,000 AM2- 9,000,000 96,570 99,000
2017 2016
-----(Rupees in '000)-----
Rating Number ofshares
Marketvalue Cost Rating Number of
shares Marketvalue Cost
-----(Rupees in '000)-----
9.2.6 Details of investments in shares of listed companies
Available-for-sale securitiesFully paid ordinary shares of Rs.10 each
(unless stated otherwise)Pakistan Refinery Limited A-/A2 108,100 3,803 7,682 A-/A2 108,100 4,716 7,682Fauji Fertilizer Company Limited AA/A1+ 3,775,700 298,696 387,761 AA/A1+ 3,701,600 386,336 479,074Fauji Fertilizer Bin Qasim Limited Unrated 7,318,000 260,082 362,224 Unrated 3,018,000 154,552 188,364Fatima Fertilizer Company Limited AA-/A1+ 1,591,500 49,146 65,002 AA-/A1+ 1,541,500 56,866 63,357Amreli Steels Limited - - - - A/A1 50,000 3,330 2,531Crescent Steel & Allied Products Limited - - - - A+/A-1 50,000 7,709 6,042Mughal Iron & Steel Industries Limited - - - - Unrated 150,000 13,224 10,651Thatta Cement Company Limited A-/A-2 3,375,000 74,250 102,852 A-/A-2 3,375,000 132,908 121,703Nishat Chunian Power Limited Unrated 3,950,500 130,011 176,658 A+/A-2 1,741,500 96,618 100,011Hub Power Company Limited AA+/A1+ 445,000 40,495 57,071 AA+/A1+ 445,000 54,949 57,071Sui Southern Gas Company Limited A+/A1 11,296,500 344,430 484,566 A+/A1 11,296,500 410,628 447,043Sui Northern Gas Pipelines Limited AA-/A1 2,728,800 258,172 361,177 AA-/A1 4,532,500 369,716 369,798Pakistan Stock Exchange Unrated 17,692,319 396,308 495,385 - - - -Silk Bank Limited A-/A-2 31,962,500 50,501 58,517 - - - -Bank Al-Falah Limited - - - - AA/A1+ 1,110,000 42,136 31,201National Bank of Pakistan AAA/A1+ 7,161,000 347,738 483,610 AAA/A1+ 3,265,500 244,553 243,993NIB Bank Limited N/A - - - AA-/A1+ 28,394,500 51,394 60,264MCB Bank Limited AAA/A1+ 470,530 99,903 128,782 - - - -Summit Bank Limited A-/A-1 82,427,063 228,323 305,509 A/A-1 11,546,585 50,805 46,639Total investment in shares of
listed companies 2,581,858 3,476,796 2,080,440 2,235,424
9.2.7 Details of investments in preference shares - listed2017 2016
Rating Number ofshares
Marketvalue Cost Rating Number of
shares Marketvalue Cost
----- (Rupees in '000) ---- ----- (Rupees in '000) ----Held to maturity securities
Summit Bank Limited - - - - A/A-1 24,996,067 249,961 249,961
----- (Rupees in '000) ----
RatingNumber
ofcertificates
Face value per
certificateMarketvalue Cost
2016
UnsecuredAvailable-for-sale securities 9.2.9.1NIB Bank Limited - - - - - A+ 20,000 5,000 101,014 99,880MCB Bank Limited AAA 20,000 5,000 101,393 99,840 - - - - -
Held-to-maturity securities 9.2.9.1Summit Bank Limited A- (SO) 44,982 5,000 224,287 224,287 A (SO) 44,982 5,000 224,392 224,392
325,680 324,127 325,406 324,272
9.2.9.1 These term finance certificates are sub-ordinated in nature. In case of default, the payment in respect of principaland profit will rank subordinated to all the depositors and other creditors of the issuing banks.
----- (Rupees in '000) ----
RatingNumber
ofcertificates
Face value per
certificateMarketvalue Cost
2017
Note
9.2.9 Details of investment in term finance certificates - listed
2017 2016
Rating Number ofshares
Marketvalue
Amortized cost Rating Number of
shares Marketvalue
Amortized cost
----- (Rupees in '000) ---- ----- (Rupees in '000) ----
Held to maturity securitiesAl-Arabia Sugar Mills Limited Unrated 6,130,480 61,305 61,305 - - - -
9.2.8 Details of investments in preference shares - unlisted

Annual Report2017
73 74
Number ofshares held
Paid -upvalue per
share
Total bookvalue
Percentageholding
Break-upvalue per
share
Based onaudited
accounts as atName of Chief Executive
Rupees (Rupees in ‘000) Rupees
Sindh Microfinance Bank Limited - unlisted December(incorporated on March 27, 2015) 75,000,000 10.00 750,000 100% 10.66 31, 2017 Mr. Shoaib Arif
9.4 Particulars of provision for diminution in the value ofinvestments - netOpening balance 7,810 490
Charge for the year - through other comprehensive income - 7,320Closing balance 9.4.1 7,810 7,810
9.4.1 Particulars of provision by type and segment
Available-for-sale securitiesShares of listed companies 7,810 7,810
10. ADVANCES - NET
Loans, cash credits, agriculture, running finances etc.- In Pakistan 54,364,488 47,168,443Commodity finance- In Pakistan 10.2 11,552,078 6,245,905Islamic financing and related assets- Diminishing musharakah financing 10.3 2,187,739 2,075,944- Ijarah financing 10.4 103,583 74,647
68,207,888 55,564,939Bills discounted and purchased (excluding market treasury bills)- Payable in Pakistan 794,124 404,430- Payable outside Pakistan 110,154 10,204
904,278 414,634Advances - gross 10.1 69,112,166 55,979,573Provision for non-performing advances- Specific provision 10.5 (397,624) (143,034)- General provision against consumer and small enterprise advances 10.5.3.2 (1,201) (3,357)- General provision 10.5.3.1 (4,000,000) (4,000,000)
(4,398,825) (4,146,391)Advances - net 64,713,341 51,833,182
10.1 Particulars of advances - gross
10.1.1In local currency 10.1.2 69,112,166 55,979,573In foreign currency - -
69,112,166 55,979,573
10.1.2Short term (for upto one year) 39,313,913 29,108,692Long term (for more than one year) 29,798,253 26,870,881
69,112,166 55,979,573
2017 2016Note (Rupees in '000)
9.3 Particulars of investment in subsidiary
10.2 This represents commodity financing provided to Food Department, Government of Sindh, in syndication withother commercial banks.
Cost Accumulated Depreciation
Cost Accumulated Depreciation
2017 2016Note (Rupees in '000)10.3 Diminishing musharakah financing
Diminishing musharakah 2,187,739 2,075,944
10.4 Ijarah financingNet book value of assets 10.4.1 86,279 50,732Advance against Ijarah financing 17,304 23,915
103,583 74,647
10.4.1 Particulars of assets under Ijarah
Vehicle 33,455 56,701 90,156 8,848 14,874 23,722 66,434 Over the Plant and machinery 27,605 - 27,605 1,480 6,280 7,760 19,845 Ijarah Total 61,060 56,701 117,761 10,328 21,154 31,482 86,279 period
As atJanuary
01
AdditionsAs at
December31
As atJanuary
01Charge
As atDecember
31
Book ValueAs at
December31
Rate ofdepreciation
(%)
2017
As atJanuary
01
AdditionsAs at
December31
As atJanuary
01Charge
As atDecember
31
Book ValueAs at
December31
Rate ofdepreciation
(%)
2016
Vehicle 15,724 17,731 33,455 1,808 7,040 8,848 24,607 Over thePlant and machinery - 27,605 27,605 - 1,480 1,480 26,125 IjarahTotal 15,724 45,336 61,060 1,808 8,520 10,328 50,732 period
10.4.2 Future Ijarah payments receivableNot later than one year 27,378 14,028Later than one year and not later than five years 58,901 36,704
86,279 50,732
2017 2016Note (Rupees in '000)
10.5 Advances include Rs.5,462.16 (2016: Rs.1,569.38) million which have been placed under non-performing statusas detailed below:
Other Assets EspeciallyMentioned (OAEM) 10.5.1 75,652 - 75,652 - - 77,514 - 77,514 - -
Substandard 2,775,339 - 2,775,339 54,265 54,265 727,957 - 727,957 4,878 4,878Doubtful 900,000 - 900,000 3,884 - 3,884 139,090 - 139,090 20,291 20,291Loss 1,711,164 - 1,711,164 339,475 339,475 624,814 - 624,814 117,865 117,865
5,462,155 - 5,462,155 397,624 397,624 1,569,375 - 1,569,375 143,034 143,034
2017 2016
Classified AdvancesDomestic Overseas Total
Classified AdvancesDomestic Overseas Total
Note
Provision ProvisionRequired Held
Provision ProvisionRequired Held
--------------- (Rupees '000) --------------- --------------- (Rupees '000) ---------------
Category of classification
-------------------------------- (Rupees '000) -----------------------------
-------------------------------- (Rupees '000) -----------------------------

Annual Report2017
75 76
2017 2016Note (Rupees in '000)
10.5.1 This represents non-performing portfolio of agricultural and small and medium enterprise financing classified as OAEM as per the requirements of the Prudential Regulations for Agricultural and Small and Medium Enterprise Financing issued by the State Bank of Pakistan.
10.5.2 The Bank has availed the benefit of forced sale value on plant and machinery under charge and mortgaged residentialand commercial property (land and building only) held as collateral against non-performing advances on the basisof instructions of State Bank of Pakistan. Had the benefit not been taken by the Bank, specific provision against non-performing advances would have been higher by Rs.2,453.26 (2016: Rs.727.25) million. The resultant increase inprofit due to FSV benefit taken will not be available for distribution as cash and stock dividend to shareholders.
10.5.3 Particulars of provision against non-performing advances
2017 2016Note Specific General Total Specific General Total
--------------------------- (Rupees '000) -------------------------
Opening balance 143,034 4,003,357 4,146,391 37,420 2,501,523 2,538,943Charge for the year- Specific provision 263,199 - 263,199 105,614 - 105,614- General provision 10.5.3.1 - - - - 1,500,000 1,500,000- General provision against
consumer and small enterprise advances 10.5.3.2 - - - - 1,834 1,834
Reversals (8,609) (2,156) (10,765) - - -Net charge 254,590 (2,156) 252,434 105,614 1,501,834 1,607,448Amount written off - - - - - -Closing balance 397,624 4,001,201 4,398,825 143,034 4,003,357 4,146,391
10.5.3.1 In line with prudent policies, the Bank has made general provision against its loans and advances portfolio. Thisgeneral provision is in addition to the requirements of the Prudential Regulations in relation to objective basis ofprovisioning.
10.5.3.2 General provision against consumer loans represents provision maintained at an amount equal to 1% (2016: 1%)of the fully secured performing portfolio and 4% (2016: 4%) of the unsecured performing portfolio as requiredby the Prudential Regulations issued by SBP. General provision against Small Enterprise Financing represents provisionmaintained at an amount equal to 0% (2016: 1%) of the fully secured performing portfolio and 1% of the unsecuredperforming portfolio as required by the Prudential Regulations issued by SBP.
Debts due by directors, executives or officers of the Bank or anyof them either severally or jointly with any other persons:Balance at beginning of the year 396,663 278,549Loans granted during the year 180,005 225,376Repayments made during the year (119,379) (107,262)Balance at end of the year 10.6.1 457,289 396,663
Debts due by companies or firms in which the directors of the Bank areinterested as directors, partners or in the case of private companiesas members:Balance at beginning of the year 234,375 296,875Loans granted during the year 743,253 -Repayments made during the year (698,117) (62,500)Balance at end of the year 10.6.2 279,511 234,375
736,800 631,038
10.6 Particulars of loans and advances to directors, executives / officersassociated companies, subsidiaries etc.
10.6.1 This represents staff loans given by the Bank to its executives / officers as per their terms of employment.
10.6.2 This includes balance of loan outstanding of entities where more than 20% equity was acquired by the Governmentof Sindh.
2017 2016Note (Rupees in '000)11. OPERATING FIXED ASSETS
Capital work-in-progress 11.1 24,481 31,064Property and equipment 11.2 1,569,395 1,728,128Intangible assets 11.3 60,551 66,291
1,654,427 1,825,483
11.1 This represents advance payment for purchase of software, furniture and fixture, office equipment and vehicles.
11.2 Property and equipment - owned
As atJanuary 01
Additions /(disposals)
As atDecember 31
As atJanuary 01
Charge forthe year /(disposals)
As atDecember 31
Book valueas at
Decembe31
Rate ofdepreciation
%
---------------------------------------------------------------- (Rupees in '000) -------------------------------------------------------------
2017Cost Accumulated depreciation
Leasehold improvements 1,039,601 87,043 1,126,644 191,227 53,026 244,253 882,391 5- -
Furniture and fixtures 473,086 18,672 491,462 184,152 47,781 231,808 259,654 10 (296) (125)
Computer and office 1,265,333 40,653 1,303,527 806,043 202,761 1,006,811 296,716 33.33 & 20equipment (2,459) (1,993)
-
Vehicles 262,737 50,737 286,016 131,207 49,046 155,382 130,634 20 (27,458) (24,871)
3,040,757 197,105 3,207,649 1,312,629 352,614 1,638,254 1,569,395 (30,213) (26,989)
As atJanuary 01
Additions /(disposals)
As atDecember 31
As atJanuary 01
Charge forthe year /(disposals)
As atDecember 31
Book valueas at
Decembe31
Rate ofdepreciation
%
2016Cost Accumulated depreciation
Leasehold improvements 1,014,723 24,878 1,039,601 140,122 51,106 191,227 848,374 5 - -
Furniture and fixtures 449,376 23,710 473,086 137,776 46,377 184,152 288,934 10 - -
Computer and office 1,080,006 186,834 1,265,333 579,639 227,630 806,043 459,290 33.33 & 20equipment (1,507) (1,225)
Vehicles 212,662 104,904 262,737 124,639 49,339 131,207 131,530 20 (54,829) (42,771)
2,756,767 340,326 3,040,757 982,176 374,452 1,312,629 1,728,128 (56,336) (43,996)
------------------------------------------------------------------ (Rupees in '000) ---------------------------------------------------------------

Annual Report2017
77 78
12. DEFERRED TAX ASSETS / (LIABILITIES) - net
Deductible temporary differences on:- Provision against advances - general 1,400,000 1,400,000- Provision for diminution in the value of investments 2,733 171- Surplus / (deficit) on revaluation of investments - net 306,988 (72,171)
1,709,721 1,328,000Taxable temporary differences on:- Operating fixed assets - tangible (88,584) (127,651)- Operating fixed assets - intangible (9,194) (9,864)
(97,778) (137,515)1,611,943 1,190,485
2017 2016Note (Rupees in '000)
Deductible temporary differences on:- Provision against advances - general 1,400,000 - - 1,400,000 875,000 525,000 - 1,400,000- Provision for diminution in the value
of investments 171 2,562 - 2,733 171 - - 171- (Deficit) / surplus on revaluation
of investments (72,171) - 379,159 306,988 (408,626) - 336,455 (72,171) 1,328,000 2,562 379,159 1,709,721 466,545 525,000 336,455 1,328,000
Taxable temporary differences on:- Operating fixed assets - tangible (127,651) 39,067 - (88,584) (155,221) 27,570 - (127,651)- Operating fixed assets - intangible (9,864) 670 - (9,194) (10,519) 655 - (9,864)
(137,515) 39,737 - (97,778) (165,740) 28,225 - (137,515) 1,190,485 42,299 379,159 1,611,943 300,805 553,225 336,455 1,190,485
Balance asat January
01
Recognizedin profit andloss account
Recognizedin equity
Balance as atDecember 31
Balance asat January
01
Recognizedin profit andloss account
Recognizedin equity
Balance as atDecember 31
------------------------------------------------------ (Rupees in '000) ---------------------------------------------------------------
2017 2016
13. OTHER ASSETS - NETAccrued income on bank deposits, investments, COIs,
placements and advances 3,385,097 3,218,063Accrued commission income 11,210 322Advances, deposits, advance rent and other prepayments 246,658 192,393Advance against term finance certificates and preference shares - 608,183Receivable against sale of shares 147,531 369,716Unrealised gain on forward forex revaluation - net 64,115 -Insurance premium receivable against agriculture loans 26,991 45,166Stationery and stamps on hand 10,088 12,359Dividend receivable 26,535 668Receivable against 1 Link ATM settlement account 273,165 275,379Insurance claims receivable 746 3,306Other receivables 16,367 10,168
4,208,503 4,735,72314. BILLS PAYABLE
In Pakistan 905,423 714,212Outside Pakistan - -
905,423 714,212
2017 2016Note (Rupees in '000)
12.1 Reconciliation of deferred tax
-------------- Rupees in '000 --------------
11.2.1 The cost of fully depreciated furniture and fixture, office and computer equipment still in use amounted to Rs.678.87 (2016: Rs.328.19) million.
11.3 Intangible assets
------------------------------------------------------------ (Rupees in '000) ------------------------------------------------------------
As atJanuary 01
AdditionsAs at
December 31As at January
01Amortizationfor the year
As atDecember 31
Book valueas at
December31
Rate ofamortization
%
2017Cost Accumulated amortization
Software 186,841 22,912 209,753 120,550 28,652 149,202 60,551 20
186,841 22,912 209,753 120,550 28,652 149,202 60,551
Software 163,317 23,524 186,841 90,759 29,791 120,550 66,291 20
163,317 23,524 186,841 90,759 29,791 120,550 66,291
------------------------------------------------------------ (Rupees in '000) ------------------------------------------------------------
As atJanuary 01
AdditionsAs at
December 31As at January
01Amortizationfor the year
As atDecember 31
Book valueas at
December 31
Rate ofamortization
%
2016Cost Accumulated amortization
11.4 Disposals
Details of disposal of fixed assets having cost of more than Rs.1,000,000 or net book value of Rs.250,000 or above are given below:
VehicleHonda Civic 1,794 1,794 - - As per Bank Policy Mr. Saeeduddin KhanToyota Corolla XLI 1,628 895 733 - As per Bank Policy Mr. Fazal Ellahi (Late)Toyota Corolla XLI 1,357 1,357 - 1,357 As per Bank Policy Mr. Syed Farrukh RazaSuzuki Mehran 678 181 497 625 Insurance Claim Sindh Insurance Co LtdSuzuki Mehran 673 314 359 471 As per Bid Mr. Rana Abdul SamadSuzuki Cultus VXR 1,099 348 751 769 As per Bank Policy Mr. Arshad HussainAggregate of disposals
not meeting criteria 20,229 19,982 247 1,623 As per Bank Policy/Bid Various
27,458 24,871 2,587 4,845Office equipmentAggregate of disposals
not meeting criteria 2,394 1,946 448 421 Various Various
ComputersAggregate of disposals
not meeting criteria 65 47 18 19 Various Various
Furniture and fixtureAggregate of disposals
not meeting criteria 296 125 171 171 Various Various
December 31, 2017 30,213 26,989 3,224 5,456
December 31, 2016 56,336 43,997 12,339 16,485
CostAccumulateddepreciation
Bookvalue
Saleproceeds
Mode ofdisposal
Particulars of buyers

Annual Report2017
79 80
17. OTHER LIABILITIES
Mark-up / return / interest payable in local currency 1,322,913 1,173,337Mark-up / return / interest payable in foreign currency 4,170 5,041Accrued expenses 139,837 107,585Net defined benefit liability 31.1.2 71,446 50,481Provision for compensated absences 32 144,125 118,612Unrealised loss against forward forex revaluation - net - 45,039Payable against purchase of operating fixed assets 99,853 45,892Payable against purchase of shares 358,505 393,307Retention money 67,872 60,459Federal excise duty / sales tax on services payable 6,303 4,617Provision for taxation - net 32,910 32,878Withholding tax payable 16,821 8,866Others 66,260 131,184
2,331,015 2,177,29818. SHARE CAPITAL
18.1 Authorised capital
2017 2016 2017 2016Number of shares ----- (Rupees in '000) ----
1,200,000,000 1,200,000,000 Ordinary shares of Rs.10 each 12,000,000 12,000,000
18.2 Issued, subscribed and paid-up share capital
Ordinary shares of Rs.10 each 1,001,013,000 1,001,013,000 Fully paid in cash 10,010,130 10,010,130
19. (DEFICIT) / SURPLUS ON REVALUATION OFASSETS - NET OF DEFERRED TAX
Available-for-sale securitiesFederal government securities 101,915 319,177Fully paid ordinary shares - listed (887,129) (147,175)Units of mutual funds (units / certificates) (104,279) 21,272Sukuk certificates 10,831 11,693Term finance certificates 1,553 1,236
9.1 (877,109) 206,203Related deferred taxation 12 306,988 (72,171)
(570,121) 134,032
2017 2016Note (Rupees in '000)15. BORROWINGS
In Pakistan 50,971,174 8,910,738Outside Pakistan - -
15.1 50,971,174 8,910,73815.1 Particulars of borrowings
In local currency 50,971,174 8,910,738In foreign currency - -
50,971,174 8,910,73815.2 Details of borrowings
SecuredBorrowings from State Bank of Pakistan (SBP) under export
refinance scheme 15.2.1 1,136,500 1,081,500Repurchase agreement borrowingsState Bank of Pakistan (SBP) 15.2.2 29,402,212 -Other commercial banks / DFIs 15.2.3 8,434,593 6,187,415
37,836,805 6,187,415Call borrowings 15.2.4 11,997,869 -
UnsecuredCall / Clean borrowings - 1,641,823
50,971,174 8,910,738
2017 2016Note (Rupees in '000)
15.2.1 These represent borrowings from SBP under export refinance scheme at the rates ranging from 1.00% to 2.00%(2016: 1.00% to 2.00%) per annum having maturity upto six months.
15.2.2 These represent repurchase agreement borrowings (2016: Nil) maturing on January 05, 2018. These borrowings aresecured against Pakistan Investment Bonds and Treasury Bills and carry mark-up at 5.87% (2016: nil) per annum.
15.2.3 These repurchase agreement borrowings are secured against Pakistan Investment Bonds and Treasury Bills and carrymark-up at rates ranging from 5.78% to 6.00% (2016: 5.78%) per annum. These borrowings are repayable latest byFebruary 27, 2018. The carrying value of securities given as collateral against these borrowings is given in note 9.1.
15.2.4 These represent call money borrowing from a commercial bank at the rate of 5.83% (2016: Nil) per annum withmaturities in August and October 2018. The Bank has placed Pakistan Investment Bonds as collateral against theseborrowings
16. DEPOSITS AND OTHER ACCOUNTS
CustomersFixed deposits 36,674,370 33,787,351Savings deposits 49,675,892 44,489,694Current accounts - non-remunerative 39,775,348 31,360,250Margin and other accounts - non-remunerative 653,611 799,926
126,779,221 110,437,221Financial InstitutionsRemunerative deposits 7,262,182 8,454,596Non-remunerative deposits 165,653 130,423
7,427,835 8,585,01916.1 134,207,056 119,022,240
16.1 Particulars of depositsIn local currency 132,599,636 117,854,636In foreign currency 1,607,420 1,167,604
134,207,056 119,022,240
2017 2016Note (Rupees in '000)

Annual Report2017
81 82
21. MARK-UP / RETURN / INTEREST EARNED
On loans and advances to:Customers 4,737,030 3,958,291
On investments in:Available-for-sale securities 4,716,681 4,630,339Held-to-maturity securities 1,818,558 987,771
On deposits with financial institutions 36,725 35,297On securities purchased under resale agreements 134,496 132,371On call / clean lending 97,693 31,330
11,541,183 9,775,399
22. MARK-UP / RETURN / INTEREST EXPENSED
Deposits 5,289,872 4,361,730Securities sold under repurchase agreements 604,936 850,375Other short term borrowings 381,623 159,062
6,276,431 5,371,16723. GAIN ON SALE OF SECURITIES - NET
Federal government securities- Market Treasury Bills 562 44- Pakistan Investment Bonds 445,729 2,643,990
Others- Units of mutual funds 26,632 36,174- Shares of listed companies 131,202 253,048- Other investments 300 400
604,425 2,933,65624. OTHER INCOME
Incidental charges 24.1 4,761 2,351Gain on sale of operating fixed assets 2,964 4,146Rent on property 1,800 2,240Prequalification application fee for tender 134 108Others 304 350
9,963 9,195
24.1 Includes account maintenance, statement issuance, bill collection and other charges recovered from customers.
2017 2016Note (Rupees in '000)
2017 2016Note (Rupees in '000)
20. CONTINGENCIES AND COMMITMENTS
20.1 Direct credit substitutesIncludes general guarantees of indebtedness in favor of:Government 1,881,587 2,479,754Banking companies and other financial institutions 1,530,553 382,618Others 1,440,255 739,659
4,852,395 3,602,031 20.2 Trade related contingent liabilities
- Others 4,713,833 4,953,626
20.3 Commitments to extend creditThe Bank makes commitments to extend credit in the normal course of its business but these are revocablecommitments that do not attract any significant penalty or expense if the facility is unilaterally withdrawn.
20.4 Transaction related contingent liabilitiesContingent liabilities in respect of guarantees given, favoring others 393,990 248,638
20.5 Commitments in respect of forward rate agreements - currency- Purchase 5,108,914 7,407,583
- Sale 4,798,804 6,960,019
20.6 Commitments in respect of repo / reverse repo transactions- Sale and repurchase agreements 37,861,932 6,191,349
- Purchase and resale agreements 4,974,614 4,941,750
20.7 Other commitmentsAgainst purchase of shares - 23,591

Annual Report2017
83 84
26. OTHER CHARGES
Penalties imposed by the SBP 8,689 525Others 732 -
9,421 52527. Relationship between tax expense and accounting profit
Profit before tax 2,182,434 2,427,930
Tax on income @ 35% (2016: 35%) 763,852 849,776Effects of prior year on current taxation 161,950 184,845Effects of permanent differences 797 2,483
926,599 1,037,104
2017 2016Note (Rupees in '000)
27.1 The Income Tax returns of the Bank have been filed up to the tax year 2017 (accounting year ended December 31,2016) and amendment of deemed assessment were carried out till tax year 2016, whereby certain disallowances tothe taxable income were made.
Appeals against amended orders were filed before Commissioner Inland Revenue Authority (CIRA), who deleted allmajor disallowances and additions except some disallownces in 2014 on which demand of Rs.5.95 million arose.
Subsequently, the Bank has filed an appeal before Appellate Tribunal Inland Revenue (ATIR) in respect of demand ofRs.5.95 million as mentioned above, which are pending. Large Tax Payers Introduced the Unit (LTU) has also filedappeals in the ATIR against the decision of CIRA.
After legislation of 18th amendment to the Constitution, Government of Sindh through the Sindh WWF Act, 2014levy of SWWF was also introduced. As per Sindh WWF Act, 2014, banks/financial institutions are included in definitionof “Industrial Establishment” Sindh WWF is imposed @ of 2% of the total income; Since the Bank’s operations are inall the three other Provinces and Azad Jammu & Kashmir as well, the Bank along with other banks has filed a suitbefore Honorable Sindh High Court and challenged the vires of SWWF, which is pending for adjudication.
2017 2016Note (Rupees in '000)25. ADMINISTRATIVE EXPENSES
Salaries, allowances and other benefits 25.1 1,913,174 1,720,429Contribution to defined benefit plan 31.1.4 48,740 44,842Contribution to defined contribution plan 31.2 58,291 50,499Non-Executive Directors' fees 19,450 12,325Rent, taxes, insurance, electricity, etc. 814,207 752,065Legal and professional charges 29,181 21,495Communications 118,540 146,473Repairs and maintenance 210,252 189,583Stationery and printing 78,238 74,738Security services 248,114 232,559Advertisement and publicity 74,351 65,456Auditors' remuneration 25.2 7,690 7,221Depreciation 11.2 352,614 374,452Amortization 11.3 28,652 29,791Travelling and conveyance 20,029 20,418Brokerage and commission 8,338 10,643Fees and subscription 56,671 51,418Miscellaneous expense 61,627 59,872
4,148,159 3,864,279
25.1 This includes balance of compensated absences amounting to Rs.30.92 (2016: Rs.57.10) million. Further refernote 32.
25.2 Auditors’ remunerationGrant Thornton Anjum RahmanAudit fee - 2,855Half yearly review - 1,172Certifications and other advisory services - 2,575Out-of-pocket expenses 1,131 619
1,131 7,221EY Ford RhodesAudit fee 3,240 -Half yearly review 1,620 -Certifications and other advisory services 1,512 -Out-of-pocket expenses 187 -
6,559 -
7,690 7,221
25.3 The Bank operates a short term employee benefit scheme which includes grant of special bonus to employees. Underthis scheme, the special bonus for employees, including the President & Chief Executive Officer of the Bank isdetermined on the basis of employees evaluation and the Bank's performance during the year. The aggregate amountdetermined for eligible employees in respect of the above scheme relating to Executives and Chief Executive Officerof the Bank amounted to Rs.35.19 (2016: Rs.23.37) million and Rs.3.13 (2016: Rs.23.66) million respectively and isincluded in salaries, allowances and benefits.
2017 2016Note (Rupees in '000)

Annual Report2017
85 86
31.1.2 Reconciliation of net defined benefit liability
Present value of defined benefit liability 31.1.5 239,044 170,787Fair value of plan assets 31.1.6 (167,598) (120,306)Payable to defined benefit plan 31.1.3 71,446 50,481
31.1.3 Movement in net defined benefit liability
Opening balance 50,481 49,286Charge to profit and loss during the year 31.1.4 48,740 44,842Remeasurement loss recognized in OCI 31.1.4 22,706 5,639Bank's contribution` (50,481) (49,286)Closing balance 71,446 50,481
31.1.4 Charge for defined benefit plan
In profit and lossCurrent service cost 46,342 42,378Interest cost - net 2,398 2,464Charge for the year 48,740 44,842
In other comprehensive incomeRemeasurement loss on defined benefit obligation 16,048 3,653Remeasurement loss on plan assets 6,658 1,986
22,706 5,63931.1.5 Changes in present value of defined benefit liability
Opening balance 170,787 118,574Current service cost 46,342 42,378Interest cost 15,755 11,587Benefits paid (9,888) (5,405)Actuarial loss / (gain) on obligations- Financial assumptions - -- Experience assumptions 16,048 3,653
16,048 3,653Closing balance 239,044 170,787
31.1.6 Fair value of plan assets
Fair value of plan assets at the beginning of the year 120,306 69,288Expected return on plan assets 13,357 9,123Bank's contributions 50,481 49,286Benefits paid (9,888) (5,405)Actuarial loss on assets - experience assumptions (6,658) (1,986)Fair value of plan assets at the end of the year 31.1.7 167,598 120,306
31.1.7 Plan assets comprise
Balance held in bank accounts 167,598 120,306
2017 2016Note (Rupees in '000)28. BASIC AND DILUTED EARNINGS PER SHARE
Profit after taxation 1,255,835 1,390,826
----------- (Numbers) -----------
Weighted average number of ordinary shares 1,001,013,000 1,000,334,899
----------- (Rupees) -----------
Basic and diluted earnings per share 1.25 1.39
2017 2016Note (Rupees in '000)
28.1 Diluted earnings per share has not been presented separately as the Bank does not have any convertible instrumentsin issue at December 31, 2017 or 2016.
29. CASH AND CASH EQUIVALENTS
Cash and balances with treasury banks 6 9,679,582 7,500,675Balances with other banks 7 3,023,451 791,478
12,703,033 8,292,15330. STAFF STRENGTH
----------- (Numbers) -----------Permanent 1,466 1,501Temporary / on contractual basis 240 210Bank's own staff strength at the end of the year 1,706 1,711Outsourced 30.1 403 388Total staff strength 2,109 2,099
30.1 This represents personnel hired by an outside contractor / agency and posted in the Bank to perform various tasks/ activities of the Bank.
31. DEFINED BENEFIT AND CONTRIBUTION PLANS
31.1 Defined benefit plan
The Bank operates a recognised gratuity plan for all its permanent and full time employees in the management cadrewho have completed the minimum qualifying period of three years. Contributions are made to the fund in accordancewith the recommendations of an actuary. Employees are entitled to the benefits under the plan which comprise ofthe last drawn basic salary for each completed year of service, subject to completion of minimum three years serviceswith the Bank.
31.1.1Principal actuarial assumptions
The latest actuarial valuation was carried out as at December 31, 2017 using the Projected Unit Credit Method.Following are the significant assumptions used in the actuarial valuation:
2017 2016
- Discount rate 9.50% 9.50%- Expected rate of increase in salaries 9.00% 9.00%- Expected return on plan assets 9.50% 9.50%
2017 2016Note (Rupees in '000)

Annual Report2017
87 88
31.1.8 Sensitivity analysis
Reasonably possible changes at the reporting date to one of the relevant actuarial assumptions, holding otherassumptions constant, would have affected the defined benefit obligation by the amounts shown below:
Discount rate (1% variation) 127,323 151,585
Future salary growth (1% variation) 165,072 194,690
Future mortality (1 year variation) 238,988 170,826
2017 2016Note (Rupees in '000)
Although the analysis does not take account of the full distribution of cash flows expected under the plan, it doesprovide an approximation of sensitivity of the assumptions shown.
31.1.9 The expected gratuity expense for the year commencing January 01, 2018 works out to Rs.30.28 (2016: Rs.47.03)million.
31.1.10 Maturity analysis
The weighted average duration of the defined benefit obligation works out to be 12.30 years. Expected benefitpayments for the next five years are:
2018 2019 2020 2021 2022---------------------------- Rupees in '000 --------------------------
Expected benefit payments 9,389 12,827 14,495 15,294 15,090
31.2 Defined contribution plan
The Bank operates a recognised provident fund plan for all its permanent employees. Equal monthly contributionsare made, both by the Bank and its employees, to the fund at the rate of 10% of basic salaries of the employees.The minimum qualifying period of service for the purpose of the Bank's contribution is one year. The contributionmade by the Bank and its employees during the year amounted to Rs.116.58 (2016: Rs.100.99) million. The numberof employees as at December 31, 2017 eligible under the plan were 1,448 (2016: 1,428).
32. COMPENSATED ABSENCES
The Bank grants compensated absences to all its regular employees as per service rules. Minimum qualifying periodfor encashment is three years of services. Regular employees are entitled to 30 days privilege leave for each completedyear of service. Unutilized privilege leaves are accumulated upto a maximum of 60 days which would be encashedat the time of retirement from the regular service of the Bank or severance of service except in case of dismissal.These are encashable on the basis of last drawn gross salary. The Bank recognises the liability for compensatedabsences in respect of employees in the period in which these are earned up to the balance sheet date. The provisionamount of Rs.144.13 (2016: Rs.118.61) million has been provided on the basis of actuarial recommendations.
32.1 Movement of compensated absences
Opening balance 118,612 63,498Expense for the year 30,918 57,101Benefit paid for the year (5,405) (1,987)Closing balance 144,125 118,612
2017 2016Note (Rupees in '000)
Fees - - 19,450 12,325 - -Managerial remuneration 14,545 11,008 - 3,097 428,152 355,296Charge for defined benefit plan 1,247 814 - - 25,039 21,601Contribution for defined
contribution plan 1,455 803 - - 30,772 25,231Rent and house maintenance 6,545 4,953 - 1,394 192,669 159,883Utilities 1,455 1,101 - 310 42,815 35,530Medical 1,455 1,101 - 310 42,815 35,530Conveyance 610 510 - 158 109,350 84,355Bonus 2,424 1,847 - 257 71,573 56,001Others 1,905 2,392 1,517 1,603 50,397 40,632
31,641 24,529 20,967 19,454 993,582 814,059
Number of Persons 1 2 7 7 379 325
President / Chief Directors ExecutivesExecutive Officer2017 2016 2017 2016 2017 2016
--------------------------------- (Rupees in '000) ---------------------------------
33. COMPENSATION OF CHIEF EXECUTIVE OFFICER, DIRECTORS AND EXECUTIVES
33.1 The Chief Executive Officer and certain executives of the Bank are provided with free use of the Bank's maintainedcars.
33.2 Executives mean employees, other than the President & Chief Executive Officer and Directors, whose basic salaryexceeds five hundred thousand Rupees in a financial year.
33.3 In addition to above, all executives, including the President & Chief Executive Officer of the Bank are also entitledto performance bonus which is disclosed in note 25.3 to these unconsolidated financial statements.
34. FAIR VALUE OF FINANCIAL INSTRUMENTS
IFRS 13 "Fair Value Measurement" defines fair value as the price that would be received to sell an asset or paid totransfer a liability in an orderly transaction between market participants at the measurement date.
The fair value of quoted securities other than those classified as held to maturity, is based on quoted market price.Fair value of fixed term loans, other assets, other liabilities and fixed term deposits cannot be calculated withsufficient reliability due to absence of current and active market for assets and liabilities and reliable data regardingmarket rates for similar instruments. The provision for impairment of loans and advances has been calculated inaccordance with the Bank's accounting policy as stated in note 5.6 to these financial statements.
The repricing profile, effective rates and maturity profile are stated in note 38.3.5 to these financial statements.
In the opinion of the management, the fair value of the remaining financial assets and liabilities are not significantlydifferent from their carrying values since assets and liabilities are either short term in nature or in the case ofcustomer loans and deposits are frequently repriced.
Fair value hierarchy
IFRS 13 requires the Bank to classify fair value measurement using a fair value hierarchy that reflects the significanceof the inputs used in making the measurements. The fair value hierarchy has following levels:
Level 1: Quoted prices (unadjusted) in active markets for identical assets or liabilities that the entity canaccess at the measurement date.
Level 2: Inputs other than quoted prices included within Level 1 that are observable for the asset or liability,either directly or indirectly.

Annual Report2017
89 90
Item
Open ended mutual funds
Pakistan Investment Bonds / Market Treasury Bills
Government of Pakistan (GoP) - Ijarah Sukuks
Term Finance, Bonds and Sukuk certificates
Valuation techniques and input used
Fair value is based on redemption prices as at the close of thebusiness day.
Fair values of Pakistan Investment Bonds and Treasury Bills arederived using the PKRV rates (Reuters page).
Fair values derived using the PKISRV rates announced by theFinancial Market Association (FMA) through Reuters.
Investments in debt securities (comprising term finance certificates,bonds, sukuk certificates and any other security issued by acompany or a body corporate for the purpose of raising fundsin the form of redeemable capital) are valued on the basis ofthe rates announced by the Mutual Funds Association of Pakistan(MUFAP) in accordance with the methodology prescribed bythe Securities and Exchange Commission of Pakistan.
The valuation techniques used for the above assets are the same as disclosed below.
35. SEGMENT DETAILS WITH RESPECT TO BUSINESS ACTIVITIES
The segment analysis with respect to business activities is as follows:
Total income 7,619,710 1,532 - 5,247,637 12,868,879
Inter segment revenue - net (6,781,650) - - 6,781,650 -Total income - net 838,060 1,532 - 12,029,287 12,868,879
Total expenses (1,114,196) (1,434) - (9,570,815) (10,686,445)
Net income / (loss) before tax (276,136) 98 - 2,458,472 2,182,434
Segment assets 130,468,420 123,892 - 73,890,163 204,482,475
Segment liabilities 50,338,354 651 - 138,075,663 188,414,668
Segment return on assets 7.80% 9.46% - 9.25% -(ROA) (%)
Segment cost of funds (%) 5.87% 4.09% - 4.00% -
Includes inter-segment revenue / cost.
Trading andsales
Retailbanking
Commercialbanking and
othersTotal
--------------------------------- (Rupees in '000) ---------------------------------
Corporatefinance
2017
34.1 The table below analyses the financial and non-financial assets carried at fair values, by valuation methods. For financialassets, the Bank essentially carries its investments in debt and equity securities at fair values. Valuation of investmentsis carried out as per guidelines specified by the SBP.
On balance sheet financial instruments
Financial assets measured at fair value
Available-for-sale securities
Pakistan Investment Bonds 38,841,721 - 38,841,721 - 38,841,721Market Treasury Bills 52,136,358 - 52,136,358 - 52,136,358Shares of listed companies 2,581,857 2,581,857 - - 2,581,857Term finance certificates - Listed 101,393 - 101,393 - 101,393Units of mutual funds 608,214 213,439 394,775 - 608,214Sukuk bonds 1,353,966 - 1,353,966 - 1,353,966
Off balance sheet financial instruments
Foreign exchange contracts (purchase) - - 5,108,914 - 5,108,914
Foreign exchange contracts (sale) - - 4,798,804 - 4,798,804
On balance sheet financial instruments
Financial assets measured at fair valueAvailable-for-sale securities
Pakistan Investment Bonds 49,507,894 - 49,507,894 - 49,507,894Market Treasury Bills 9,482,710 - 9,482,710 - 9,482,710Shares of listed companies 2,080,439 2,080,439 - - 2,080,439Term finance certificates - listed 101,014 101,014 - - 101,014Term finance certificates - unlisted 12,629 - 12,629 - 12,629Units of mutual funds 733,805 218,014 515,791 - 733,805Sukuk bonds 698,735 - 698,735 - 698,735
Off balance sheet financial instruments
Foreign exchange contracts (purchase) - - 7,407,583 - 7,407,583
Foreign exchange contracts (sale) - - 6,960,019 - 6,960,019
2016Fair Value
Carrying Level 1 Level 2 Level 3 Totalvalue (Rupees
in '000) ------------------ (Rupees in '000) -----------------
2017Fair Value
Carrying Level 1 Level 2 Level 3 Totalvalue (Rupees
in '000) ------------------ (Rupees in '000) -----------------
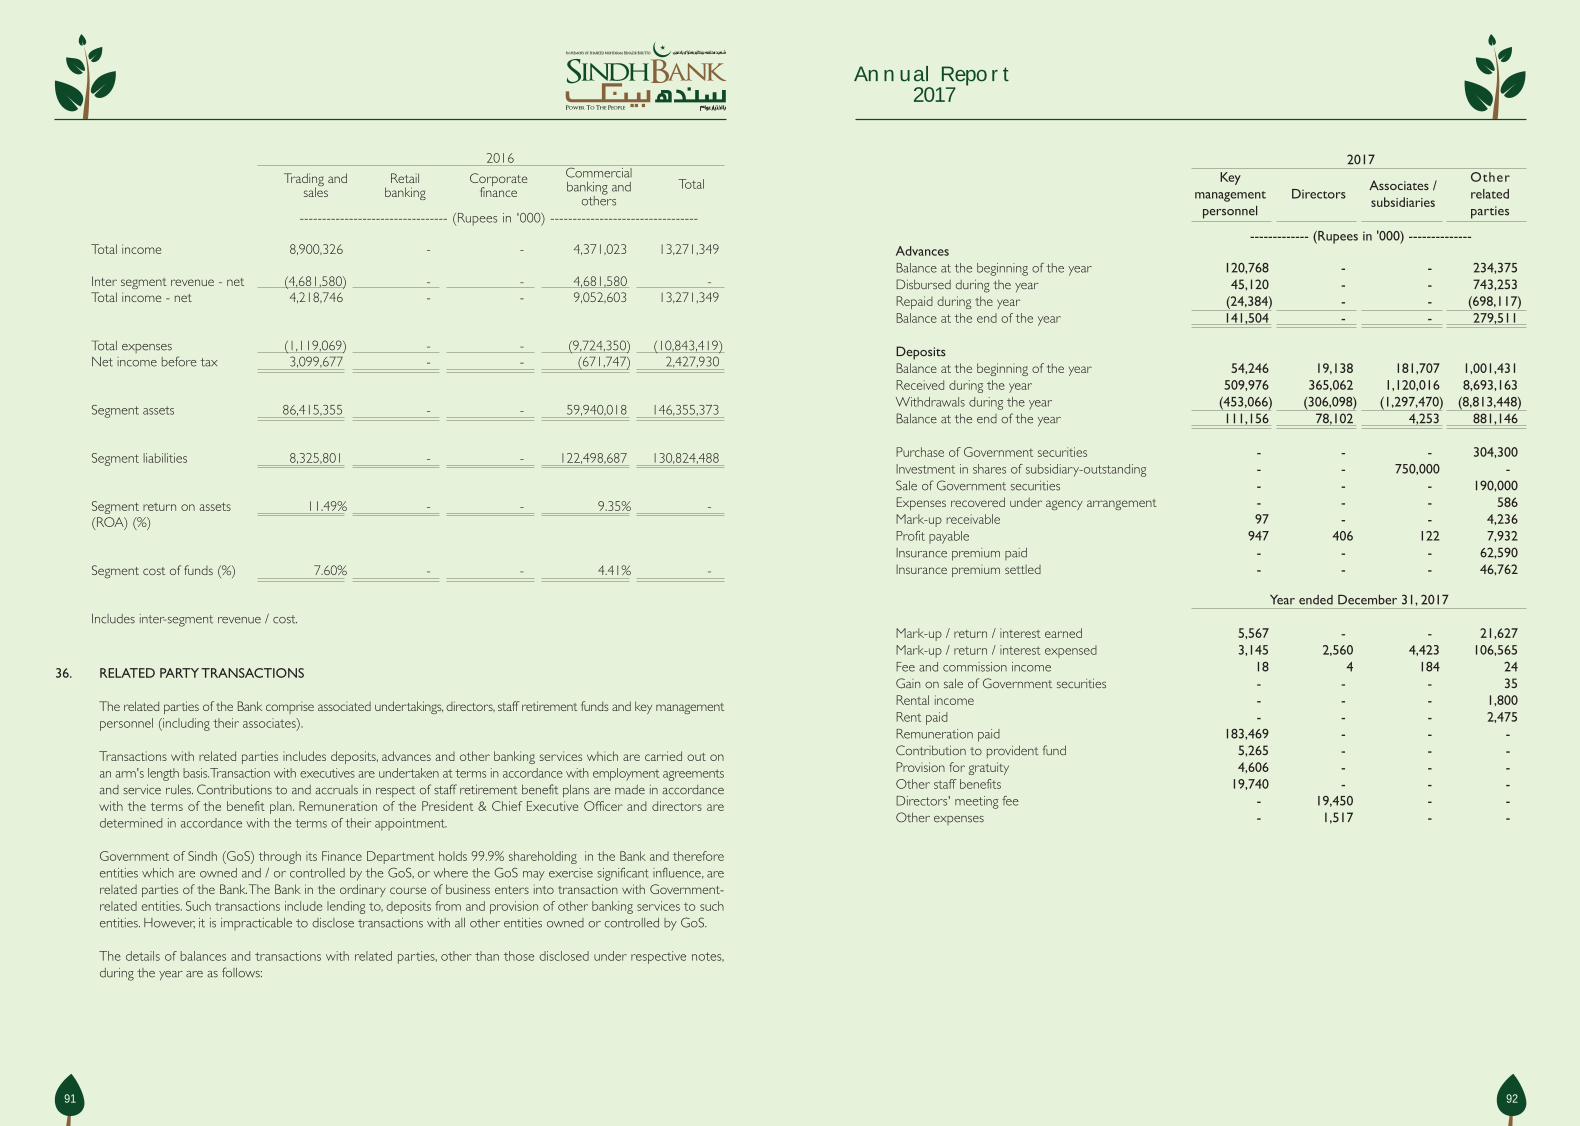
Annual Report2017
91 92
Trading andsales
Retailbanking
Corporatefinance
Commercialbanking and
othersTotal
--------------------------------- (Rupees in '000) ---------------------------------
2016
Total income 8,900,326 - - 4,371,023 13,271,349
Inter segment revenue - net (4,681,580) - - 4,681,580 -Total income - net 4,218,746 - - 9,052,603 13,271,349
Total expenses (1,119,069) - - (9,724,350) (10,843,419)Net income before tax 3,099,677 - - (671,747) 2,427,930
Segment assets 86,415,355 - - 59,940,018 146,355,373
Segment liabilities 8,325,801 - - 122,498,687 130,824,488
Segment return on assets 11.49% - - 9.35% -(ROA) (%)
Segment cost of funds (%) 7.60% - - 4.41% -
Includes inter-segment revenue / cost.
36. RELATED PARTY TRANSACTIONS
The related parties of the Bank comprise associated undertakings, directors, staff retirement funds and key managementpersonnel (including their associates).
Transactions with related parties includes deposits, advances and other banking services which are carried out onan arm's length basis. Transaction with executives are undertaken at terms in accordance with employment agreementsand service rules. Contributions to and accruals in respect of staff retirement benefit plans are made in accordancewith the terms of the benefit plan. Remuneration of the President & Chief Executive Officer and directors aredetermined in accordance with the terms of their appointment.
Government of Sindh (GoS) through its Finance Department holds 99.9% shareholding in the Bank and thereforeentities which are owned and / or controlled by the GoS, or where the GoS may exercise significant influence, arerelated parties of the Bank. The Bank in the ordinary course of business enters into transaction with Government-related entities. Such transactions include lending to, deposits from and provision of other banking services to suchentities. However, it is impracticable to disclose transactions with all other entities owned or controlled by GoS.
The details of balances and transactions with related parties, other than those disclosed under respective notes,during the year are as follows:
AdvancesBalance at the beginning of the year 120,768 - - 234,375Disbursed during the year 45,120 - - 743,253Repaid during the year (24,384) - - (698,117)Balance at the end of the year 141,504 - - 279,511
DepositsBalance at the beginning of the year 54,246 19,138 181,707 1,001,431Received during the year 509,976 365,062 1,120,016 8,693,163Withdrawals during the year (453,066) (306,098) (1,297,470) (8,813,448)Balance at the end of the year 111,156 78,102 4,253 881,146
Purchase of Government securities - - - 304,300Investment in shares of subsidiary-outstanding - - 750,000 -Sale of Government securities - - - 190,000Expenses recovered under agency arrangement - - - 586Mark-up receivable 97 - - 4,236Profit payable 947 406 122 7,932Insurance premium paid - - - 62,590Insurance premium settled - - - 46,762
Keymanagementpersonnel
DirectorsOtherrelatedparties
Associates /subsidiaries
2017
------------- (Rupees in '000) --------------
Year ended December 31, 2017
Mark-up / return / interest earned 5,567 - - 21,627Mark-up / return / interest expensed 3,145 2,560 4,423 106,565Fee and commission income 18 4 184 24Gain on sale of Government securities - - - 35Rental income - - - 1,800Rent paid - - - 2,475Remuneration paid 183,469 - - -Contribution to provident fund 5,265 - - -Provision for gratuity 4,606 - - -Other staff benefits 19,740 - - -Directors' meeting fee - 19,450 - -Other expenses - 1,517 - -

Annual Report2017
93 94
37.2 Capital Management
Objectives and goals of managing capitalThe Bank manages its capital to attain the following objectives and goals:- an appropriately capitalized status, as defined by banking regulations;- acquire strong credit ratings that enable an optimized funding mix and liquidity sources at lesser costs;- cover all risks underlying business activities; and- retain flexibility to harness future investment opportunities, build and expand even in stressed times.
Statutory Minimum Capital Requirement and Capital Adequacy Ratio
The State Bank of Pakistan through BSD Circular No. 07 of 2009 dated April 15, 2009 required the minimum paid-up capital (net of losses) for all locally incorporated banks to be raised to Rs.10 billion by the year ended on December31, 2017. The raise was to be achieved in a phased manner. The paid-up capital of the Bank for the year endedDecember 31, 2017 stands at Rs.10.01 billion and is in compliance with the SBP requirement.
The capital adequacy ratio of the Bank is subject to the Basel-III capital adequacy guidelines stipulated by the StateBank of Pakistan through BPRD Circular No. 06 of 2013 dated August 15, 2013. These requirements are applicablefrom December 31, 2013 with full implementation in a phased manner intended by December 31, 2019. Underthe Basel-III guidelines, banks are required to maintain the following ratios on an ongoing basis:
Phase-in arrangement and full implementation of the minimum capital requirements:
1 CET1 5.50% 6.00% 6.00% 6.00% 6.00% 6.00%2 ADT-1 1.50% 1.50% 1.50% 1.50% 1.50% 1.50%3 Tier-1 7.00% 7.50% 7.50% 7.50% 7.50% 7.50%4 Total Capital 10.00% 10.00% 10.00% 10.00% 10.00% 10.00%5 * CCB 0.00% 0.25% 0.65% 1.275% 1.90% 2.50%6 Total Capital plus CCB 10.00% 10.25% 10.65% 11.275% 11.90% 12.50%
* (Consisting of CET1 only)
S. Ratio Year endedNo. 2014 2015 2016 2017 2018 2019
37.3 Bank's regulatory capital is analysed into three tiers
- Common Equity Tier 1 capital (CET1), which includes fully paid-up capital (including the bonus shares), balancein share premium account, general reserves, statutory reserves as per the financial statements and net unappropriatedprofits after all regulatory adjustments applicable on CET1 (refer to note 37.5).
- Additional Tier 1 Capital (AT1), which includes perpetual non-cumulative preference shares and share premiumresulting from the issuance of preference shares, balance in share premium account after all regulatory adjustmentsapplicable on AT1 (refer to note 37.5).
- Tier 2 capital, which includes Subordinated debt / Instruments, share premium on issuance of Subordinated debt/ instruments, general provisions for loan losses (up to a maximum of 1.25% of credit risk weighted assets), netof tax reserves on revaluation of fixed assets and equity investments up to a maximum of 45% of the balanceand foreign exchange translation reserves after all regulatory adjustments applicable on Tier-2 (refer to note37.5).
As at the date of unconsolidated statement of financial position, loans/advances and deposits related to governmentrelated entities amounted to Rs.11,552.08 million (note 10.2) and Rs.66,230.26 million (note 16). The above includesdeposits amounting to Rs.19,333.93 (2016: Rs.19,896.41) million received through the Finance Department,Government of Sindh.
37. CAPITAL ADEQUACY RATIO
37.1 The Basel-III Framework is applicable to the Bank both at the consolidated level (comprising of wholly ownedsubsidiaries) and on a stand alone basis. Subsidiary is included while calculating consolidated capital adequacy forthe Bank using full consolidation method. Standardized approach is used for calculating the capital adequacy forcredit and market risk, whereas, basic indicator approach (BIA) is used for operational risk capital adequacy purposes.
AdvancesBalance at the beginning of the year 31,480 - - 296,875Disbursed during the year 103,001 - - -Repaid during the year (13,713) - - (62,500)Balance at the end of the year 120,768 - - 234,375
DepositsBalance at the beginning of the year 52,469 19,796 153,710 457,948Received during the year 369,131 154,367 1,464,380 10,471,174Withdrawals during the year (367,354) (155,025) (1,436,383) (9,927,691)Balance at the end of the year 54,246 19,138 181,707 1,001,431
Purchase of Government securities - - - 508,017Investment in shares of subsidiary - outstanding - - 750,000 -Sale of Government securities - - - 799,537Expenses recovered under agency arrangement - - - 591Mark-up receivable 69 - - 4,972Profit payable 367 163 326 10,824Insurance premium paid - - - 63,762Sale proceeds received - - - 10,157
Keymanagementpersonnel
DirectorsOtherrelatedparties
Associates /subsidiaries
2016
------------- (Rupees in '000) --------------
Year ended December 31, 2016Mark-up / return / interest earned 1,596 - - 22,536Mark-up / return / interest expensed 2,096 1,379 14,834 41,997Gain on sale of Government securities - - - 346Rental income - - - 2,240Remuneration paid 154,970 5,491 - -Contribution to provident fund 4,606 - - -Provision for gratuity 3,916 - - -Other staff benefits 16,354 257 - -Directors' meeting fee - 12,325 - -Other expenses - 1,380 - -

Annual Report2017
95 96
The required capital adequacy ratio (11.275% of the risk-weighted assets) is achieved by the Bank throughimprovement in the asset quality at the existing volume level, ensuring better recovery management andcomposition of asset mix with low risk. Banking operations are categorized as either trading book or bankingbook and risk-weighted assets are determined according to specified requirements of the State Bank of Pakistanthat seek to reflect the varying levels of risks attached to assets and off-balance sheet exposures. The total risk-weighted exposures comprise of the credit risk, market risk and operational risk.
Basel-III Framework enables a more risk-sensitive regulatory capital calculation to promote long term viabilityof the Bank. As the Bank carries on the business on a wide area network basis, it is critical that it is able tocontinuously monitor the exposure across the entire organization and aggregate the risks so as to take anintegrated approach / view. Maximization of the return on risk-adjusted capital is the principal basis to be usedin determining how capital is allocated within the Bank to particular operations or activities.
37.4 Leverage Ratio
The leverage ratio of the Bank as at December 31, 2017 is 7.13% (2016: 9.50%). The ratio has been computedas prescribed by the State Bank of Pakistan through instructions for Basel-III implementation in Pakistan.
As on December 31, 2017 total Tier 1 Capital of the Bank amounts to Rs.14,914 (2016: Rs.14,943) million whereasthe total exposure measure amounts to Rs.208.981 (2016: Rs.157.330) million.
37.5 Capital Adequacy
The Bank remained compliant with all externally imposed capital requirements through out the year. Further, therehas been no material change in the Bank’s management of capital during the year.
2017 2016(Rupees in '000)37.5.1 Capital Adequacy
Common Equity Tier 1 capital (CET1): Instruments and reserves
1 Fully Paid-up Capital/ Capital deposited with SBP 10,010,130 10,010,1302 Balance in Share Premium Account 51 513 Reserve for issue of Bonus Shares - -4 Discount on Issue of shares - -5 General/Statutory Reserves 1,451,928 1,200,7616 Gain/(Losses) on derivatives held as Cash Flow Hedge - -7 Unappropriated/unremitted profits/ (losses) 5,175,820 4,185,9118 Minority Interests arising from CET1 capital instruments issued to third parties
by consolidated bank subsidiaries (amount allowed in CET1 capital of theconsolidation group) - -
9 CET 1 before Regulatory Adjustments 16,637,929 15,396,85310 Total regulatory adjustments applied to CET1 (note 37.6.1) 1,724,120 454,26111 Common Equity Tier 1 14,913,809 14,942,592
Additional Tier 1 (AT 1) Capital
12 Qualifying Additional Tier-1 capital instruments plus any related share premium - -13 of which: Classified as equity - -14 of which: Classified as liabilities - -15 Additional Tier-1 capital instruments issued to third parties by consolidated
subsidiaries (amount allowed in group AT 1) - -16 of which: instrument issued by subsidiaries subject to phase out - -17 AT1 before regulatory adjustments - -
18 Total regulatory adjustment applied to AT1 capital (note 37.6.2) - -19 Additional Tier 1 capital after regulatory adjustments - -20 Additional Tier 1 capital recognized for capital adequacy - -21 Tier 1 Capital (CET1 + admissible AT1) (11+20) 14,913,809 14,942,592
Tier 2 Capital22 Qualifying Tier 2 capital instruments under Basel III plus any related share
premium - -23 Tier 2 capital instruments subject to phase-out arrangement issued under
pre-Basel 3 rules - -24 Tier 2 capital instruments issued to third parties by consolidated subsidiaries
(amount allowed in group tier 2) - -25 of which: instruments issued by subsidiaries subject to phase out - -26 General provisions or general reserves for loan losses-up to maximum of
1.25% of Credit Risk Weighted Assets 811,379 635,30627 Revaluation Reserves (net of taxes)28 of which: Revaluation reserves on fixed assets - -29 of which: Unrealized gains/losses on AFS - 134,03230 Foreign Exchange Translation Reserves - -31 Undisclosed/Other Reserves (if any) - -32 T2 before regulatory adjustments 811,379 769,33833 Total regulatory adjustment applied to T2 capital (note 37.6.3) 547,220 381,17434 Tier 2 capital (T2) after regulatory adjustments - -35 Tier 2 capital recognized for capital adequacy - -36 Portion of Additional Tier 1 capital recognized in Tier 2 capital - -37 Total Tier 2 capital admissible for capital adequacy 264,159 388,164
38 TOTAL CAPITAL (T1 + admissible T2) (21+37) 15,177,968 15,330,756
39 Total Risk Weighted Assets (RWA) {for details refer note 37.7} 96,873,102 87,624,250
Capital Ratios and buffers (in percentage of risk weighted assets)
40 CET1 to total RWA 15.40% 17.05%41 Tier-1 capital to total RWA 15.40% 17.05%42 Total capital to total RWA 15.67% 17.50%
43 Bank specific buffer requirement (minimum CET1 requirement pluscapital conservation buffer plus any other buffer requirement) 7.28% 6.65%
44 of which: capital conservation buffer requirement 1.28% 0.65%45 of which: counter cyclical buffer requirement 0.00% 0.00%46 of which: D-SIB or G-SIB buffer requirement 0.00% 0.00%47 CET1 available to meet buffers (as a percentage of risk weighted assets) 8.12% 10.40%
National minimum capital requirements prescribed by SBP
48 CET1 minimum ratio 6.00% 6.00%49 Tier 1 minimum ratio 7.50% 7.50%50 Total capital minimum ratio 10.00% 10.00%51 Total capital minimum ratio plus CCB 11.275% 10.65%
2017 2016(Rupees in '000)

Annual Report2017
97 98
37.6 Regulatory Adjustments and Additional Information:
37.6.1 Common Equity Tier 1 capital: Regulatory adjustments1 Goodwill (net of related deferred tax liability) - - - -2 All other intangibles (net of any associated deferred tax liability) 51,357 51,357 56,427 56,4273 Shortfall in provisions against classified assets - - - -4 Deferred tax assets that rely on future profitability excluding those
arising from temporary differences (net of related tax liability) - - - -5 Defined-benefit pension fund net assets - - - -6 Reciprocal cross holdings in CET1 capital instruments of banking,
financial and insurance entities - - - -7 Cash flow hedge reserve - - - -8 Investment in own shares/ CET1 instruments - - - -9 Securitization gain on sale - - - -10 Capital shortfall of regulated subsidiaries - - - -11 Deficit on account of revaluation from bank's holdings of fixed
assets/AFS 570,122 570,122 - -12 Investments in the capital instruments of banking, financial and
insurance entities that are outside the scope of regulatoryconsolidation, where the bank does not own more than 10% of theissued share capital (amount above 10% threshold) 817,503 654,003 38,056 22,834
13 Significant investments in the common stocks of banking, financialand insurance entities that are outside the scope of regulatoryconsolidation (amount above 10% threshold) - - - -
14 Deferred tax assets arising from temporary differences (amountabove 10% threshold, net of related tax liability) 92,048 73,638 - -
15 Amount exceeding 15% threshold - -16 of which: significant investments in the common stocks of financial
entities - - - -17 of which: deferred tax assets arising from temporary differences - - - -18 National specific regulatory adjustments applied to CET1 capital - - - -19 Investments in TFCs of other banks exceeding the prescribed limit - - - -20 Any other deduction specified by SBP (mention details) - - - -21 Adjustment to CET1 due to insufficient AT1 and Tier 2 to cover
deductions - 375,000 - 375,00022 Total regulatory adjustments applied to CET1 (sum of 1 to 21) 1,531,030 1,724,120 94,483 454,261
37.6.2 Additional Tier-1 & Tier-1 Capital: regulatory adjustments23 Investment in mutual funds exceeding the prescribed limit [SBP
specific adjustment] - - - -24 Investment in own AT1 capital instruments - - - -25 Reciprocal cross holdings in Additional Tier 1 capital instruments of
banking, financial and insurance entities - - - -
2017 2016 Amounts Amounts
subject to Pre- subject to PreBasel III Basel III
Amount treatment Amount treatment---------------- Rupees in '000 ---------------
26 Investments in the capital instruments of banking, financial andinsurance entities that are outside the scope of regulatoryconsolidation, where the bank does not own more than 10% of theissued share capital (amount above 10% threshold) - - - -
27 Significant investments in the capital instruments of banking, financialand insurance entities that are outside the scope of regulatoryconsolidation - 375,000 - 375,000
28 Portion of deduction applied 50:50 to Tier-1 and Tier-2 capitalbased on pre-Basel III treatment which, during transitional period,remain subject to deduction from additional tier-1 capital - - - -
29 Adjustments to Additional Tier 1 due to insufficient Tier 2 to coverdeductions - - - -
30 Total regulatory adjustment applied to AT1 capital (sum of 23to 29) - 375,000 - 375,000
37.6.3 Tier 2 Capital: regulatory adjustments31 Portion of deduction applied 50:50 to Tier-1 and Tier-2 capital
based on pre-Basel III treatment which, during transitional period,remain subject to deduction from tier-2 capital - 375,000 - 375,000
32 Reciprocal cross holdings in Tier 2 instruments of banking, financialand insurance entities - - - -
33 Investment in own Tier 2 capital instrument - - - -34 Investments in the capital instruments of banking, financial and
insurance entities that are outside the scope of regulatoryconsolidation, where the bank does not own more than10% of the issued share capital (amount above 10% threshold) 215,275 172,220 10,290 6,174
35 Significant investments in the capital instruments issued by banking,financial and insurance entities that are outside the scope ofregulatory consolidation - - - -
36 Total regulatory adjustment applied to T2 capital (sum of 31 to 35) 215,275 547,220 10,290 381,174
2017 2016-------------- Rupees in '000 -------------
37.6.4 Additional InformationRisk weighted assets in respect of deduction items (which during the transitionalperiod will be risk weighted subject to Pre-Basel III treatment)
(i) of which: deferred tax assets - -(ii) of which: defined-benefit pension fund net assets - -(iii) of which: recognized portion of investment in capital of banking, financial and
insurance entities where holding is less than 10% of the issued common sharecapital of the entity 2,634,423 1,582,389
(iv) of which: recognized portion of investment in capital of banking, financial andinsurance entities where holding is more than 10% of the issued common sharecapital of the entity - -
2,634,423 1,582,389
2017 2016 Amounts Amounts
subject to Pre- subject to PreBasel III Basel III
Amount treatment Amount treatment---------------- Rupees in '000 ---------------

Annual Report2017
99 100
AssetsCash and balances with treasury banks 9,679,582 9,679,582 Balanced with other banks 3,023,451 3,023,451 Lending to financial institutions 5,331,327 5,331,327 Investments 114,259,902 114,259,902 - of which: non-significant capital investments in capital of other financial
institutions exceeding 10% threshold 826,223 826,223 a- of which: significant capital investments in financial sector entities
exceeding regulatory threshold - - b- of which: mutual funds exceeding regulatory threshold - - c- of which: reciprocal crossholding of capital instrument - - d- of which: others (mention details) 113,433,679 113,433,679 eAdvances 64,713,341 64,713,341 Shortfall in provisions/ excess of total EL amount over eligible provisions - - f
under IRBGeneral provisions reflected in Tier 2 capital 811,459 811,459 gFixed assets 1,654,427 1,654,427 Deferred tax assets 1,538,305 1,538,305 - of which: DTAs excluding those arising from temporary differences - - h- of which: DTAs arising from temporary differences exceeding regulatory threshold 73,638 73,638 iOther assets 4,208,503 4,208,503 - of which: goodwill - - j- of which: intangibles 60,551 60,551 k- of which: Defined-benefit pension fund net assets - - lTotal assets 204,482,476 204,482,476
Liabilities and equityBills payable 905,423 905,423 Borrowings 50,971,174 50,971,174 Deposits and other accounts 134,207,056 134,207,056 Sub-ordinated loans - - - of which: eligible for inclusion in AT1 - - m- of which: eligible for inclusion in Tier 2 - - nLiabilities against assets subject to finance lease - - Deferred tax liabilities 9,194 9,194 - of which: DTLs related to goodwill - - o- of which: DTLs related to intangible assets 9,194 9,194 p- of which: DTLs related to defined pension fund net assets - - q- of which: other deferred tax liabilities - - rOther liabilities 2,331,015 2,331,015 Total liabilities 188,414,668 188,414,668
Share capital 10,010,130 10,010,130 - of which: amount eligible for CET1 10,010,130 10,010,130 s- of which: amount eligible for AT1 - - tReserves 1,451,979 1,451,979 - of which: portion eligible for inclusion in CET1 1,451,979 1,451,979 u- of which: portion eligible for inclusion in Tier 2 - - v
Step 2
As perpublishedfinancial
statements
Underregulatoryscope of
consolidationDecember 31, 2017
Rupees in '000
Reference37.6.5 Amounts below the thresholds for deduction (before risk weighting)38 Non-significant investments in the capital of other financial entities - -39 Significant investments in the common stock of financial entities - -40 Deferred tax assets arising from temporary differences (net of related
tax liability) 1,611,943 1,190,485 1,611,943 1,190,485
37.6.6 Applicable caps on the inclusion of provisions in Tier 241 Provisions eligible for inclusion in Tier 2 in respect of exposures subject
to standardized approach (prior to application of cap) - -42 Cap on inclusion of provisions in Tier 2 under standardized approach - -43 Provisions eligible for inclusion in Tier 2 in respect of exposures subject
to internal ratings-based approach (prior to application of cap) - -44 Cap for inclusion of provisions in Tier 2 under internal ratings-based
approach - -
37.7 Capital Structure ReconciliationAs per published
financialstatements
Underregulatoryscope ofreporting
December 31, 2017Rupees in '000
Step 1
AssetsCash and balances with treasury banks 9,679,582 9,679,582Balanced with other banks 3,023,451 3,023,451Lending to financial institutions 5,331,327 5,331,327Investments 114,259,902 114,259,902Advances 64,713,341 64,713,341Operating fixed assets 1,654,427 1,654,427Deferred tax assets 1,611,943 1,611,943Other assets 4,208,503 4,208,503Total assets 204,482,476 204,482,476
Liabilities and equityBills payable 905,423 905,423Borrowings 50,971,174 50,971,174Deposits and other accounts 134,207,056 134,207,056Sub-ordinated loans - -Liabilities against assets subject to finance lease - -Deferred tax liabilities - -Other liabilities 2,331,015 2,331,015Total liabilities 188,414,668 188,414,668
Share capital / head office capital account 10,010,130 10,010,130Reserves 1,451,979 1,451,979Unappropriated / unremitted profit / (losses) 5,175,820 5,175,820Minority interest - -Surplus on revaluation of assets (570,121) (570,121)Total equity 16,067,808 16,067,808Total liabilities and equity 204,482,476 204,482,476
2017 2016 ---------------- Rupees in '000 ---------------

Annual Report2017
101 102
As perpublishedfinancial
statements
Underregulatoryscope of
consolidationDecember 31, 2017
Rupees in '000
Reference
Unappropriated profit / (losses) 5,175,820 5,175,820 wMinority interest - - - of which: portion eligible for inclusion in CET1 - - x- of which: portion eligible for inclusion in AT1 - - y- of which: portion eligible for inclusion in Tier 2 - - z(Deficit) on revaluation of assets (570,121) (570,121)- of which: revaluation reserves on property - - - of which: unrealized gains / (losses) on AFS - - aa- In case of deficit on revaluation (deduction from CET1) 570,121 570,121 ab
Total equity 16,067,808 16,067,808
Total liabilities and equity 204,482,476 204,482,476
Step 2
Step 3
Rupees in '000
Source basedon referencenumber from
step 2
Source basedon referencenumber from
step 2
Common Equity Tier 1 capital (CET1): Instruments and reserves
1 Fully paid-up capital / capital deposited with SBP 10,010,130 (s)2 Balance in share premium account 51 3 Reserve for issue of bonus shares -4 General / statutory reserves 1,451,928 (u)5 Gain / (loss) on derivatives held as cash flow hedge -6 Unappropriated / unremitted profits / (losses) 5,175,820 (w)7 Minority Interests arising from CET1 capital instruments issued to third party
by consolidatedbank subsidiaries (amount allowed in CET1 capital of the consolidation group) - (x)
8 CET 1 before Regulatory Adjustments 16,637,929
Common Equity Tier 1 capital: Regulatory Adjustments9 Goodwill (net of related deferred tax liability) - (j) - (o)10 All other intangibles (net of any associated deferred tax liability) 51,357 (k) - (p)11 Shortfall of provisions against classified assets - (f)12 Deferred tax assets that rely on future profitability excluding those arising
from temporary differences (net of related tax liability) - {(h) - (r} * x%13 Defined-benefit pension fund net assets - {(l) - (q)} * x%14 Reciprocal cross holdings in CET1 capital instruments - (d)15 Cash flow hedge reserve - 16 Investment in own shares/ CET1 instruments - 17 Securitization gain on sale - 18 Capital shortfall of regulated subsidiaries -19 Deficit on account of revaluation from bank's holdings of property / AFS 570,121 (ab)20 Investments in the capital instruments of banking, financial and insurance
entities that are outside the scope of regulatory consolidation, where thebank does not own more than 10% of the issued share capital(amount above 10% threshold) 654,003 (a) - (ac) - (ae)
Step 3
Rupees in '000
Source basedon referencenumber from
step 2
Sourcebased
on referencenumber
21 Significant investments in the capital instruments issued by banking, financial andinsuranceentities that are outside the scope of regulatory consolidation (amount above10% threshold) - (b) - (ad) - (af)
22 Deferred tax assets arising from temporary differences (amount above 10%threshold, net of related tax liability) 73,638 (i)
23 Amount exceeding 15% threshold24 - of which: significant investments in the common stocks of financial entities - 25 - of which: deferred tax assets arising from temporary differences -26 National specific regulatory adjustments applied to CET1 capital - 27 Investment in TFCs of other banks exceeding the prescribed limit - 28 Any other deduction specified by SBP (mention details) - 29 Regulatory adjustment applied to CET1 due to insufficient AT1 and Tier 2 to
cover deductions 375,000 30 Total regulatory adjustments applied to CET1 1,724,119
31 Common Equity Tier 1 14,913,810 Additional Tier 1 (AT 1) Capital
32 Qualifying additional Tier-1 instruments plus any related share premium - 33 - of which: classified as equity - (t)34 - of which: classified as liabilities - (m)35 Additional Tier-1 capital instruments issued by consolidated subsidiaries and
held by third parties (amount allowed in group AT 1) - (y)36 - of which: instrument issued by subsidiaries subject to phase out - 37 AT1 before regulatory adjustments -
Additional Tier 1 Capital: regulatory adjustments
38 Investment in mutual funds exceeding the prescribed limit (SBPspecific adjustment) -
39 Investment in own AT1 capital instruments - 40 Reciprocal cross holdings in additional Tier 1 capital instruments - 41 Investments in the capital instruments of banking, financial and insurance
entities that are outside the scope of regulatory consolidation, wherethe bank does not own more than 10% of the issued share capital
(amount above 10% threshold) - (ac)42 Significant investments in the capital instruments issued by banking, financial and
insurance entities that are outside the scope of regulatory consolidation - (ad)43 Portion of deduction applied 50:50 to core capital and supplementary
capital based on pre-Basel III treatment which, during transitional period,remain subject to deduction from tier-1 capital 375,000
44 Regulatory adjustments applied to additional Tier 1 due to insufficient Tier 2to cover deductions -
45 Total of regulatory adjustment applied to AT1 capital 375,000

Annual Report2017
103 104
46 Additional Tier 1 capital -47 Additional Tier 1 capital recognized for capital adequacy -
48 Tier 1 Capital (CET1 + admissible AT1) 14,913,810
Tier 2 Capital49 Qualifying Tier 2 capital instruments under Basel III - (n)50 Capital instruments subject to phase out arrangement from tier 2 (Pre-Basel III
instruments) - 51 Tier 2 capital instruments issued to third party by consolidated subsidiaries
(amount allowed in group tier 2) - (z)52 - of which: instruments issued by subsidiaries subject to phase out -53 General Provisions or general reserves for loan losses-up to maximum of
1.25% of Credit risk weighted assets 811,459 (g)54 Revaluation reserves eligible for Tier 2 - 55 - of which: portion pertaining to Property - portion of (aa)56 - of which: portion pertaining to AFS securities - 57 Foreign exchange translation reserves - (v)58 Undisclosed / other reserves (if any) - 59 T2 before regulatory adjustments 811,459
Tier 2 Capital: regulatory adjustments60 Portion of deduction applied 50:50 to core capital and supplementary
capital based on pre-Basel III treatment which, during transitional period,remain subject to deduction from tier-2 capital 375,000
61 Reciprocal cross holdings in Tier 2 instruments - 62 Investment in own Tier 2 capital instrument - 63 Investments in the capital instruments of banking, financial and insurance
entities that are outside the scope of regulatory consolidation, where thebank does not own more than 10% of the issued share capital(amount above 10% threshold) 172,220 (ae)
64 Significant investments in the capital instruments issued by banking, financial andinsurance entities that are outside the scope of regulatory consolidation - (af)
65 Amount of regulatory adjustment applied to T2 capital 547,220 66 Tier 2 capital (T2) 264,239 67 Tier 2 capital recognized for capital adequacy 264,239
68 Excess additional Tier 1 capital recognized in Tier 2 capital - 69 Total Tier 2 capital admissible for capital adequacy 264,239
Total capital (T1 + admissible T2) 15,178,049
Rupees in '000
Source basedon referencenumber from
step 2
Sourcebased
on referencenumber
Step 3
1 Issuer Sindh Bank Ltd2 Unique identifier (e.g PSX Symbol or Bloomberg identifier etc.) Un-quoted3 Governing law(s) of the instrument Laws applicable in Pakistan
Regulatory treatment4 - Transitional Basel III rules Common Equity Tier 15 - Post-transitional Basel III rules Common Equity Tier 16 - Eligible at solo / group / group & solo Group & Solo7 - Instrument type Ordinary Shares8 Amount recognized in regulatory capital (currency in PKR thousands
as of reporting date) 10,010,1309 Par value of instrument Rs.1010 Accounting classification Shareholders11 Original date of issuance October 29, 201012 Perpetual or dated Perpetual13 Original maturity date Not applicable14 Issuer call subject to prior supervisory approval No15 Optional call date, contingent call dates and redemption amount Not applicable16 Subsequent call dates, if applicable Not applicable
Coupons / Dividends17 Fixed or floating dividend/ coupon Floating Dividend18 Coupon rate and any related index/ benchmark Not applicable19 Existence of a dividend stopper No20 Fully discretionary, partially discretionary or mandatory Fully discretionary21 Existence of step up or other incentive to redeem No22 Non-cumulative or cumulative
Convertible or non-convertible Non-convertible23 If convertible, conversion trigger(s) Not applicable24 If convertible, fully or partially Not applicable25 If convertible, conversion rate Not applicable26 If convertible, mandatory or optional conversion Not applicable27 If convertible, specify instrument type convertible into Not applicable28 If convertible, specify issuer of instrument it converts into Not applicable
Write-down feature29 If write-down, write-down trigger(s) Not applicable30 If write-down, full or partial Not applicable31 If write-down, permanent or temporary Not applicable32 If temporary write-down, description of write-up mechanism Not applicable33 Position in subordination hierarchy in liquidation (specify instrument)
type immediately senior to instrument Residual Interest34 Non-compliant transitioned features No35 If yes, specify non-compliant features Not applicable
37.8 Main features template of Regulatory Capital Instruments

Annual Report2017
105 106
37.9 Risk Weighted Assets
The risk weighted assets to capital ratio, calculated in accordance with the State Bank of Pakistan’s guidelines oncapital adequacy are as follows:
CapitalRequirements
RiskWeighted
Assets
CapitalRequirements
RiskWeighted
Assets
2017 2016
(Rupees in '000)Credit Risk:Credit Risk on Balance Sheet Portfolios
subject to standardized approach (simple)
Cash and cash equivalents - - - -Sovereign - - - -Public sector entities 5,149 51,494 16,079 160,787Banks 108,345 1,083,452 122,961 1,229,611Corporate 4,023,993 40,239,929 3,442,382 34,423,821Retail 188,278 1,882,779 188,409 1,884,092Residential mortgages 12,184 121,836 11,444 114,441Past due loans 577,705 5,777,048 157,316 1,573,164Deferred tax assets 381,815 3,818,145 295,155 2,951,553Listed equity investment 38,983 389,828 58,176 581,756Un-listed equity investment 9,196 91,958 - -Operating fixed assets 159,388 1,593,875 175,919 1,759,193Other assets 62,580 625,795 84,851 848,510
5,567,616 55,676,139 4,552,692 45,526,928
Off-Balance sheet:Non-market relatedFinancial guarantees, acceptances, performance related
commitments, trade related etc. 918,905 9,189,047 525,953 5,259,529Market relatedForeign exchange contracts/ derivatives etc. 4,514 45,140 3,801 38,011
923,419 9,234,187 529,754 5,297,540
TOTAL CREDIT RISK (a) 6,491,035 64,910,326 5,082,446 50,824,468
Market Risk:Capital Requirement for portfolios subject to
standardized approachInterest rate risk 1,688,026 16,880,264 2,265,247 22,652,465Equity position risk 507,214 5,072,138 555,238 5,552,376Foreign exchange risk 11,897 118,968 2,702 27,020TOTAL MARKET RISK (b) 2,207,137 22,071,370 2,823,187 28,231,861
Operational Risk:Capital Requirement for portfolios
subject to basic indicator approachOperational risk (c) 989,141 9,891,406 856,792 8,567,921
TOTAL RISK WEIGHTED ASSETS (a)+(b)+(c) 9,687,313 96,873,102 8,762,425 87,624,250
2017 2016
Capital Adequacy Ratios Required Actual Required Actual
CET1 to total RWA 6.00% 15.40% 6.00% 17.05%
Tier-1 capital to total RWA 7.50% 15.40% 7.50% 17.05%
Total capital to total RWA 10.00% 15.67% 10.00% 17.50%
Total capital plus CCB to total RWA 11.275% 15.67% 10.65% 17.50%
38. RISK MANAGEMENT
Under the Bank's risk management framework, the Board's Risk Management Committee (BRMC) is responsible forreview and improvement of the risk policies of the Bank. On a management level, the Bank has set up a Risk ManagementDivision (RMD) to identify, assess and monitor credit risk, market risk and operational risk in the activities of the Bankand take adequate measures to manage and control risks on timely basis.
38.1 Credit risk
Credit risk strives to maximize the Bank's risk adjusted rate of return by maintaining credit risk exposure withinacceptable parameters. The effective management of credit risk is a critical component of a comprehensive approachto risk management and essential to the long term success of any banking organization.
The Bank's lending function is primarily focused on small and medium sized secured loans in agriculture, SME andconsumer products. Large corporate, commercial and industrial loans are provided on selective basis whose policyis subject to review as and when required.
Under RMD, the Credit Risk Management Department (CRMD) is responsible to ensure that credit risk stays withinthe parameters set by the Board, and to set up and monitor system parameters for identifying risks, monitoring ofthese risks and early warning systems. RMD monitors credit on a portfolio basis using the auto risk system and reportsto the CEO and the BRMC on a regular basis.
38.2 Segments by class of business
38.2.1 Segmental information
Segmental information by the class / nature of business and segment by distribution of advances, deposits & contingenciesis given below:

Annual Report2017
107 108
2017
(Rupees in Percent '000)
Contingencies andAdvances (Gross) Deposits commitments
(Rupees in Percent '000)
(Rupees in Percent '000)
Chemical and pharmaceuticals 1,471,125 2.13% 2,241,584 1.67% 82,331 0.13%Agriculture business 1,872,350 2.71% 2,099,868 1.56% - -Manufacturing of textile 291,210 0.42% 105,643 0.08% 433,368 0.69%Cement 373,223 0.54% 3,019 0.00% - -Transport, storage and communication 1,341,428 1.94% 443,966 0.33% 25,225 -Importers / exporters 344,651 0.50% 272,701 0.20% 209,189 0.33%Wholesale and retail trade 793,957 1.15% 4,008,679 2.99% 192,616 0.31%Mining and quarrying 3,156,122 4.57% 60,890 0.05% 120,834 0.19%Hotel and restaurants 1,038,560 1.50% 60,814 0.05% - -Petroleum 132,463 0.19% 142,592 0.00% 1,362,052 -Media channel 1,101,572 1.59% - 0.00% - -Manufacture of basic iron and steel 2,280,460 3.30% 61,773 0.05% 265,565 0.42%Sugar 20,791,965 30.08% 194,371 0.14% 324,055 0.52%Automobile and transportation
equipment 2,711,143 3.92% 191,383 0.14% 665,443 1.06%Financial 3,611,767 5.23% 10,498,483 7.82% 53,494,264 85.31%Rice 340,252 0.49% 58,765 0.04% - -Construction, real estate and societies 4,439,688 6.42% 5,944,410 4.43% 977,303 1.56%Public sector - provincial
government funds / departments - - 19,333,927 14.41% - -Food 12,096,598 17.50% 78,765 0.06% 133,272 0.21%Insurance 17,537 - 129,495 0.10% - -Power, electricity and gas 6,492,534 9.39% 2,537,379 1.89% 2,135,452 3.41%Education 54,208 0.08% 11,859,253 8.84% 40,678 -Individuals 524,319 0.76% 11,274,998 8.40% - -Others 3,835,034 5.56% 62,604,298 46.66% 2,242,835 3.58%Total 69,112,166 100% 134,207,056 100% 62,704,482 100%
2016
(Rupees in Percent '000)
Contingencies andAdvances (Gross) Deposits commitments
(Rupees in Percent '000)
(Rupees in Percent '000)
Chemical and pharmaceuticals 960,124 1.72% 1,485,771 1.25% 22,893 0.07%Agri-business 2,567,016 4.59% 2,002,432 1.68% - -Manufacturing of textile 167,442 0.30% 144,630 0.12% 413,386 1.21%
Cement 432,121 0.77% 81,059 0.07% - -Transport, storage
and communication 1,122,293 2.00% 995,841 0.84% - -Importers / exporters 378,983 0.68% 198,700 0.17% 127,147 0.37%Wholesale and retail trade 414,094 0.74% 4,396,380 3.69% 173,299 0.51%Mining and quarrying 2,758,299 4.93% 69,434 0.06% 20,420 0.06%Hotel and restaurants 1,074,455 1.92% 96,894 0.08% - -Manufacture of basic iron and steel 1,985,919 3.55% 17,005 0.01% 107,912 0.31%Sugar 16,484,721 29.45% 269,064 0.23% 121,294 0.35%Automobile and transportation
equipment 2,597,492 4.64% 147,097 0.12% 1,197,805 3.49%Financial 2,458,866 4.39% 8,573,048 7.20% 26,097,164 76.07%Rice 318,184 0.57% 70,053 0.06% - -Construction, real estateand societies 4,375,160 7.82% 7,427,251 6.24% 1,157,825 3.38%Public sector - provincial
government funds / departments - - 19,896,414 16.72% - -Food 6,781,675 12.11% 155,090 0.13% 189,562 0.55%Insurance - - 11,971 0.01% - -Power, electricity and gas 6,396,929 11.43% 565,145 0.47% 1,626,946 4.74%Education 170,939 0.31% 10,315,436 8.67% 1,150 0.00%Individuals 415,890 0.74% 8,923,446 7.50% - -Others 4,118,971 7.37% 53,180,079 44.69% 3,048,193 8.89%Total 55,979,573 100% 119,022,240 100% 34,304,996 100%
2016
(Rupees in Percent '000)
Contingencies andAdvances (Gross) Deposits commitments
(Rupees in Percent '000)
(Rupees in Percent '000)
38.2.2 Details of non-performing advances and specific provisions by class of business segment
2017 2016 ClassifiedAdvances
Specificprovision
heldPercentage Classified
Advances Specificprovision
heldPercentage
(Rupees in '000) % (Rupees in '000) %
Agriculture business 313,622 67,997 5.73% 297,846 29,268 18.97%Importers / exporters 48,478 18,498 0.89% 18,498 18,498 1.18%Sugar 3,754,252 150,034 68.73% 500,000 84,128 32.00%Wholesale and retail trade 195,922 9,747 3.59% - - 0.00%Construction, real
estate and societies 760,463 107,471 13.92% 616,686 - 39.00%Food 188,660 43,877 3.45% 88,779 11,140 6.00%Others 200,758 - 3.68% 47,566 - 3.03%Total 5,462,155 397,624 100% 1,569,375 143,034 100%

Annual Report2017
109 110
38.3 Market risk
Market Risk is the risk that the value of ‘on’ or ‘off ’ balance sheet positions will be adversely affected by movements in equity and interest rate markets, currency exchange rates and commodity prices.
The market risk management organization in the Bank comprises of the Board of Directors, BRMC, Asset and LiabilityCommittee (ALCO), RMD and within the RMD the Market and Asset Liability Risk Management Department.
38.3.1 Foreign exchange risk
Foreign exchange risk is the risk that the Bank may suffer losses as a result of adverse exchange rate movementsduring a period in which it has an open position, either in the form of a balance sheet asset or liability account, oroff balance sheet item. Likewise, foreign exchange settlement risk is the risk of loss when a bank in a foreign exchangetransaction pays the currency it sold but does not receive the currency it bought. foreign exchange settlement failurescan arise from counter par ty default, operational problems, market liquidity constraints and other factors.
2017
Assets LiabilitiesOff-balancesheet items
Net foreigncurrencyexposure
----------------------- (Rupees in '000) -----------------------
Pakistani Rupee 203,184,239 186,803,081 (310,109) 16,071,049United States Dollar 1,031,318 1,244,601 145,875 (67,408)Great Britain Pound 166,008 280,138 132,900 18,770Euro 63,060 86,848 31,334 7,546Japanese Yen 1,081 - - 1,081Canadian Dollar 17,736 - - 17,736Saudi Riyal 1,341 - - 1,341UAE Dirham 17,692 - - 17,692
204,482,475 188,414,668 - 16,067,807
2016
Assets LiabilitiesOff-balancesheet items
Net foreigncurrencyexposure
Pakistani Rupee 145,555,780 129,651,840 (447,564) 15,456,376United States Dollar 490,410 1,004,314 573,879 59,975Great Britain Pound 199,142 122,301 (76,915) (74)Euro 96,610 46,033 (49,400) 1,177Japanese Yen 1,449 - - 1,449UAE Dirham 11,982 - - 11,982
146,355,373 130,824,488 - 15,530,885
----------------------- (Rupees in '000) -----------------------
38.2.3 Segment by sector
Public / Government 11,552,078 16.71% 79,666,844 59.36% 178,644 0.28%Private 57,560,088 83.29% 54,540,212 40.64% 62,525,838 99.72%Total 69,112,166 100% 134,207,056 100% 62,704,482 100%
2017
(Rupees in Percent'000
Contingencies andAdvances (Gross) Deposits commitments(Rupees in Percent
'000(Rupees in Percent
'000
2016
(Rupees in Percent'000
Contingencies andAdvances (Gross) Deposits commitments(Rupees in Percent
'000(Rupees in Percent
'000
Public / Government 6,245,905 20.15% 68,044,899 58.07% 248,586 0.72%Private 49,733,668 79.85% 50,977,341 41.93% 34,056,410 99.28%Total 55,979,573 100% 119,022,240 100% 34,304,996 100%
Public / Government - - - - - -Private 5,462,155 397,624 100% 1,569,375 143,034 100%Total 5,462,155 397,624 100% 1,569,375 143,034 100%
2017 2016 ClassifiedAdvances
Specificprovision
heldPercentage Classified
Advances Specificprovision
heldPercentage
------(Rupees in '000)------ % ------(Rupees in '000)------ %
38.2.4 Details of non-performing advances and specific provisions by sector
Pakistan 2,182,434 204,482,476 16,067,808 62,704,482
Profitbeforetaxation
Total assetsemployed
Net assetsemployed
Contingenciesand
commitments
2017
-------------------------- (Rupees in '000) --------------------------
Pakistan 2,427,930 146,355,373 15,530,885 34,304,996
Profitbefore
taxation
Total assetsemployed
Net assetsemployed
Contingenciesand
commitments
2016
-------------------------- (Rupees in '000) --------------------------
38.2.5 Geographical segment analysis

Annual Report2017
111 112
38.3.2 Equity position risk
Equity position risk in trading book arises due to change in price of shares or levels of equity indices.
The Bank’s equity and mutual fund exposure is managed within the SBP limits for overall investment and per scripexposure. In addition, there are internal limits for trading positions as well as stop loss limits, dealer limits, futurecontracts limits and continuous funding system limits.
38.3.3 Yield / interest rate risk
Yield / interest rate risk reflects the degree of vulnerability of an organization to adverse changes in mark-up / interestrates. Such risk taking is normal in a financial institution and could be an important source of profit earning. However,excess yield / interest rate risk may create a serious threat to a Bank’s returns and capital base. ALCO, TreasuryDivision and RMD monitor the repricing / mismatch risks, basis risks, yield curve risks, and option risks on a continuousbasis to minimize the yield / interest rate risk.
38.3.4 Price risk
Price risk is the risk that the value of a security or portfolio of securities will decline in the future. It is the risk oflosing money due to a fall in the market price of a security that the Bank owns. It results from changes in the value of marked-to-market financial instruments. Transactions in equity securities are subject to systemic and non-systemicrisks. In order to counter these the BRMC has laid down the limits of various investments, while the Treasury Divisionand RMD monitor these investments on a daily basis.
38.3.5 Mismatch of interest rate sensitive assets and liabilities
Interest rate risk is the risk that the value of a financial instrument will fluctuate due to changes in the market interestrates. The Bank is exposed to interest / mark-up rate risk as a result of mismatches or gaps in the amount of interest/ mark-up based assets and liabilities that mature or reprice in a given period. The Bank manages this risk by matching/ re-pricing of assets and liabilities. The Assets and Liabilities Committee (ALCO) of the Bank monitors and managesthe interest rate risk with the objective of limiting the potential adverse effects on the profitability of the Bank.
2017
----
----
----
----
----
----
----
----
----
----
----
----
----
----
----
----
----
----
----
----
-- (
Rup
ees
in '0
00)
----
----
----
----
----
----
----
----
----
----
----
----
----
----
----
----
----
----
----
Exp
osed
to
Yie
ld /
Inte
rest
ris
k
Ove
r 1
to 2
year
sO
ver
3 to
5ye
ars
Tota
l
Effe
ctiv
eY
ield
/In
tere
stra
te
Upt
o 1
mon
thO
ver
1 to
3m
onth
sO
ver
3 to
6m
onth
s
Ove
r 6
mon
ths
to 1
year
Abo
ve 1
0ye
ars
Non
-inte
rest
bear
ing
finan
cial
inst
rum
ents
Ove
r 5
to 1
0ye
ars
Ove
r 2
to 3
year
s
9,
679,
582
3,
023,
451
5,
331,
327
114
,259
,902
64
,713
,341
4,
208,
503
201
,216
,106
90
5,42
3 5
0,97
1,17
4 1
34,2
07,0
56 2
,331
,015
188
,414
,668
12
,801
,438
37
,861
,932
4,
974,
614
42
,836
,546
201
,216
,106
1,
654,
427
1,
611,
943
204
,482
,476
188
,414
,668
-
188
,414
,668
74
,595
2,
015,
935
4,
966,
750
27
,281
,369
54
,527
,730
-
88,
866,
379 -
36
,004
,969
57
,554
,636
-
93,
559,
605
(4,
693,
226)
34,8
90,7
67
4,97
4,61
4
39,8
65,3
81
35,1
72,1
55
35,1
72,1
55
30,
089
20
0,00
0
-
25,4
79,0
87
1,44
1,62
0
-
27,1
50,7
96
-
2,
968,
335
12
,655
,427 -
15
,623
,762
11
,527
,034
2,
971,
165
-
2,
971,
165
14
,498
,199
49
,670
,354
30
,281
-
36
4,57
7 1
,810
,233
48
6,96
4
-
2,69
2,05
5
-
-
10,
715,
001
-
10,
715,
001
(8,
022,
946)
-
- -
(8,
022,
946)
41,
647,
408
124
,772 - -
-
4,
238,
546
-
4,
363,
318
-
11,
997,
870
12,
228,
620
-
24,
226,
490
(19,
863,
172)
-
-
-
(19
,863
,172
)
21,
784,
236
-
-
-
-
508
,274 -
50
8,27
4
-
-
8,
393
-
8,
393
49
9,88
1
-
-
-
49
9,88
1
22
,284
,117
-
- - -
715,
358
-
71
5,35
8
-
-
46
,696
-
46
,696
66
8,66
2
-
-
-
66
8,66
2
22,
952,
779
-
-
-
19,
897,
430
1,
774,
642
-
21,
672,
072
-
-
40
3,67
0
-
403,
670
21,
268,
402
-
-
-
21,
268,
402
44,
221,
181
-
- -
29,
316,
713
86
2,21
5 -
30,
178,
928
- - -
- -
30,
178,
928
- -
-
30,
178,
928
74,
400,
109
-
-
-
6,
473,
693
93
,056
-
6,
566,
749
-
-
-
-
-
6,
566,
749
-
-
-
6,
566,
749
80,
966,
858
9,
419,
845
807,
516
-
4,00
1,37
7 6
4,93
64,
208,
503
18,5
02,1
77
90
5,42
3 -40
,594
,613
2,33
1,01
5 4
3,83
1,05
1(2
5,32
8,87
4)
-
-
-
(25,
328,
874)
55,6
37,9
84
On-
bala
nce
shee
t fin
anci
al in
stru
men
ts
Ass
ets
Cas
h an
d ba
lance
s with
trea
sury
ban
ksBa
lance
s with
oth
er b
anks
4.97
%Le
ndin
gs to
fina
ncial
inst
itutio
ns5.
67%
Inve
stm
ents
7.92
%A
dvan
ces
7.42
%O
ther
ass
ets
Liab
ilitie
s
Bills
pay
able
Borr
owin
gs fr
om fi
nanc
ial in
stitu
tions
5.75
%D
epos
its a
nd o
ther
acc
ount
s4.
09%
Oth
er li
abilit
ies
On-
bala
nce
shee
t gap
Off-
bala
nce
shee
t fin
anci
al in
stru
men
tsPu
rcha
se a
nd re
sale
agr
eem
ents
Sale
and
repu
rcha
se a
gree
men
tsO
ff-ba
lanc
e sh
eet g
ap
Tota
l yie
ld /
Inte
rest
Risk
Sen
sitiv
ity G
ap
Cum
ulat
ive y
ield
/ In
tere
st R
isk S
ensit
ivity
Gap
Reco
ncili
atio
n w
ith to
tal a
sset
s:A
sset
s as p
er a
bove
Fixed
ass
ets
Def
erre
d ta
x as
set
Ass
ets a
s per
unc
onso
lidat
ed
stat
emen
t of f
inan
cial p
ositi
on
Reco
ncili
atio
n w
ith to
tal l
iabi
litie
s:Li
abilit
ies a
s per
abo
veD
efer
red
tax
liabi
lity
Liab
ilitie
s as p
er u
ncon
solid
ated
stat
emen
t of f
inan
cial p
ositi
on

Annual Report2017
113 114
2016
----
----
----
----
----
----
----
----
----
----
----
----
----
----
----
----
----
----
----
----
-- (
Rup
ees
in '0
00)
----
----
----
----
----
----
----
----
----
----
----
----
----
----
----
----
----
----
----
Exp
osed
to
Yie
ld /
Inte
rest
ris
kEf
fect
ive
Yie
ld /
Inte
rest
rate
Tota
lU
pto
1m
onth
Ove
r 1
to 3
mon
ths
Ove
r 3
to 6
mon
ths
Ove
r 6
mon
ths
to 1
year
Ove
r 1
to 2
year
sO
ver
2 to
3ye
ars
Ove
r 3
to 5
year
sO
ver
5 to
10
year
sA
bove
10
year
s
Non
-inte
rest
bear
ing
finan
cial
inst
rum
ents
7,5
00,6
75
791,
478
6,
938,
610
71,5
39,7
3751
,833
,182
4,
735,
723
143
,339
,405
71
4,21
2
8,91
0,73
8 1
19,0
22,2
40
2,17
7,29
8 1
30,8
24,4
88
12,5
14,9
17
4,9
41,7
50
6,19
1,34
9
11,1
33,0
99
143
,339
,405
1,8
25,4
831,
190,
485
146
,355
,373
130
,824
,488
-
130,
824,
488
47,
679
20
0,00
0
- 6
76,0
01
6,77
9,71
1
-
7,70
3,39
1
- 1
,081
,500
11,
524,
948
- 1
2,60
6,44
8
(4,9
03,0
57)
-
-
-
(4,9
03,0
57)
55
6,16
0
35
,171 -
-
1,
425,
830
41
3,77
9
-1,
874,
780
-
1,
491,
823
10,7
94,9
66 -12
,286
,789
(10,
412,
009)
- -
-
(10,
412,
009)
(9,
855,
849)
33,4
11
-
-20
4,90
03,
840,
968
-
4,07
9,27
9
- -13
,394
,522 -
13,3
94,5
22(9
,315
,243
)
- - -
(9,
315,
243)
(19,
171,
092)
-
- - -
1,0
33,9
35 - 1
,033
,935 - -
19
9,92
7
-
199,
927
83
4,00
8
-
-
-
83
4,00
8 (1
8,33
7,08
4)
-
-
-
-
91
5,29
6 -
915,
296
- -
11,3
10
-11
,310
90
3,98
6
-
-
-
90
3,98
6 (1
7,43
3,09
8)
- - -
11
8
2,54
5,90
9
-
2,54
6,02
7
-
-
10
2,80
0
-
102,
800
2,
443,
227
-
-
-
2,
443,
227
(14,
989,
871)
-
-
-
50,
442,
903
1,
633,
553
-
52,
076,
456
-
-
-
-
-
52,
076,
456
- - -
52,
076,
456
37,
086,
585
- - -
6,5
23,3
18
350,
358
-
6,8
73,6
76
-
-
-
-
-
6,8
73,6
76
-
-
-
6,8
73,6
76
43,
960,
261
7,
315,
272
15
,016
-
3,
283,
350
50
,188
4,
206,
038
14,8
69,8
64
714,
212
- 3
2,29
0,59
92,
177,
298
35,1
82,1
09 (
20,3
12,2
45)
- - -
(20,
312,
245)
23,6
48,0
16
69
,142
57
6,46
2
6,93
8,61
0
8,98
3,31
7 3
4,26
9,48
5
529,
685
51,
366,
701
-
6,
337,
415
50,
703,
168
-
57,
040,
583
(5
,673
,882
)
4,9
41,7
50 6
,191
,349
11,
133,
099
5,4
59,2
17
5,
459,
217
On-
balan
ce sh
eet f
inan
cial i
nstr
umen
tsA
sset
sC
ash
and
balan
ces w
ith tr
easu
ry b
anks
Balan
ces w
ith o
ther
ban
ks2.
04%
Lend
ings
to fi
nanc
ial in
stitu
tions
5.25
%In
vest
men
ts8.
73%
Adv
ance
s7.
76%
Oth
er a
sset
s6.
35%
Liab
ilitie
sBi
lls p
ayab
leBo
rrow
ings
from
fina
ncial
inst
itutio
ns6.
15%
Dep
osits
and
oth
er a
ccou
nts
4.51
%O
ther
liab
ilitie
s
On-
bala
nce
shee
t gap
Off-
bala
nce
shee
t fin
anci
al in
stru
men
tsPu
rcha
se a
nd re
sale
agr
eem
ents
Sale
and
repu
rcha
se a
gree
men
tsO
ff-ba
lanc
e sh
eet g
ap
Tota
l yie
ld /
Inte
rest
Risk
Sen
sitiv
ity G
ap
Cum
ulat
ive y
ield
/ In
tere
st R
isk S
ensit
ivity
Gap
Reco
ncili
atio
n w
ith to
tal a
sset
s:A
sset
s as p
er a
bove
Fixed
ass
ets
Def
erre
d ta
x as
set
Ass
ets a
s per
unc
onso
lidat
edst
atem
ent o
f fin
ancia
l pos
ition
Reco
ncili
atio
n w
ith to
tal l
iabi
litie
s:Li
abilit
ies a
s per
abo
veD
efer
red
tax
liabi
lity
Liab
ilitie
s as p
er u
ncon
solid
ated
st
atem
ent o
f fin
ancia
l pos
ition
2017
----
----
----
----
----
----
----
----
----
----
----
----
----
----
----
----
----
----
----
----
-- (
Rup
ees
in '0
00)
----
----
----
----
----
----
----
----
----
----
----
----
----
----
----
----
----
----
----
Upt
o 1
mon
thO
ver
1 to
3m
onth
sO
ver
3 to
6m
onth
s
Ove
r 6
mon
ths
to 1
year
Ove
r 1
to 2
year
sO
ver
2 to
3ye
ars
Ove
r 3
to 5
year
sO
ver
5 to
10
year
sA
bove
10
year
sTo
tal
38.4
Liqu
idity
ris
k
Liqu
idity
risk
ref
ers
to t
he p
oten
tial i
nabi
lity
of t
he B
ank
to m
eet
its fu
ndin
g re
quire
men
ts a
risin
g fr
om c
ash
flow
mism
atch
es a
t a
reas
onab
le c
ost
(fund
ing
liqui
dity
risk
). Li
quid
ity r
isk a
lso a
rises
due
to th
e Ba
nk’s
pote
ntia
l ina
bilit
y to
liqu
idat
e po
sitio
ns q
uick
ly an
d in
suf
ficie
nt v
olum
es, a
t a r
easo
nabl
epr
ice
(mar
ket
liqui
dity
risk
). Li
quid
ity r
isk m
anife
sts
in d
iffer
ent
dim
ensio
ns, v
iz. f
undi
ng r
isk, t
ime
risk
and
reas
ons
like
tight
liqu
idity
con
ditio
ns.
The
BRM
C h
as la
id d
own
polic
ies
to b
e fo
llow
ed t
o en
sure
pro
per
avai
labi
lity
of li
quid
ity a
nd A
LCO
mon
itors
the
liqu
idity
pos
ition
of t
he B
ank
ona
regu
lar
basis
. On
a da
y to
day
bas
is th
e Tr
easu
ry D
ivisi
on c
ontr
ols
the
liqui
dity
of t
he B
ank
and
it is
mon
itore
d by
the
Mar
ket
and
Ass
et L
iabi
lity
Risk
Man
agem
ent
Uni
t of
the
RM
D.
38.4
.1M
atur
ity o
f ass
ets
and
liabi
litie
s (b
ased
on
cont
ract
ual m
atur
ities
)
Ass
ets
Cas
h an
d ba
lance
s with
trea
sury
ban
ksBa
lance
s with
oth
er b
anks
Lend
ings
to fi
nanc
ial in
stitu
tions
Inve
stm
ents
Adv
ance
sO
pera
ting
fixed
ass
ets
Def
erre
d ta
x as
set
Oth
er a
sset
s
Liab
ilitie
sBi
lls p
ayab
leBo
rrow
ings
from
fina
ncial
inst
itutio
nsD
epos
its a
nd o
ther
acc
ount
sD
efer
red
tax
liabi
lity
Oth
er li
abilit
ies
Gap
Shar
e ca
pita
lRe
serv
esU
napp
ropr
iated
pro
fitD
efici
t on
reva
luat
ion
of in
vest
men
tsN
et a
sset
s
9,6
79,5
82
2,82
3,45
1
4,96
6,75
0 3
0,53
2,74
6 1
0,42
3,24
5
39,1
59
161,
194
2,
865,
933
61,
492,
060
90
5,42
3 3
4,86
8,46
9 96
,774
,667 -
1,
351,
781
133,
900,
340
(72,
408,
280)
-
20
0,00
0
-
24,8
54,9
903,
852,
659
29
,354
48
3,58
3
880,
803
30,3
01,3
89
-
4,10
4,83
512
,655
,427
-
31
6,66
1
17,0
76,9
2313
,224
,466
- -
-
52
7,10
013
,924
,232
90,0
1864
4,77
711
6,11
015
,302
,237
-
11,9
97,8
7012
,961
,626
-
396,
902
25,3
56,3
98(1
0,05
4,16
1)
-
-
36
4,57
7
- 1
6,33
6,08
9
44,5
20
322,
389
26
2,13
2 1
7,32
9,70
7
-
-
10,
715,
001
-
24
8,91
9 1
0,96
3,92
0
6,36
5,78
7
- - - 2
56,3
01 1
,245
,183
178
,568
-
62
,251
1,7
42,3
03 - - 8
,393
- 72
8,
465
1,7
33,8
38
-
-
-
49
9,70
0 3
,118
,400
17
8,57
6
- 1
4,35
3 3
,811
,029
-
-
46,
696
-
5,
614
52
,310
3,7
58,7
19
-
-
-20
,293
,975
5,2
32,3
14
302,
611
-
20
8 2
5,82
9,10
8
-
-
645,
994
-
11
,066
65
7,06
025
,172
,048
-
-
-
30,0
71,3
987,
063,
106
791,
621
-
6,71
337
,932
,838
-
-
399
,252 -
-
39
9,25
237
,533
,586
- - -
7,2
23,6
92 3
,518
,113 - - -
10,7
41,8
05 -
-
- - - -10
,741
,805
9,
679,
582
3,
023,
451
5,
331,
327
114,
259,
902
64,
713,
341
1,
654,
427
1,
611,
943
4,
208,
503
204,
482,
476
90
5,42
3 5
0,97
1,17
413
4,20
7,05
6
-
2,33
1,01
518
8,41
4,66
8 1
6,06
7,80
8
10,
010,
130
1,
451,
979
5,
175,
820
(5
70,1
21)
16,
067,
808

Annual Report2017
115 116
2016
----
----
----
----
----
----
----
----
----
----
----
----
----
----
----
----
----
----
----
----
-- (
Rup
ees
in '0
00)
----
----
----
----
----
----
----
----
----
----
----
----
----
----
----
----
----
----
----
Abo
ve 1
0ye
ars
Ove
r 5
to 1
0ye
ars
Ove
r 3
to 5
year
sO
ver
2 to
3ye
ars
Ove
r 1
to 2
year
s
Ove
r 6
mon
ths
to 1
year
Ove
r 3
to 6
mon
ths
Ove
r 1
to 3
mon
ths
Upt
o 1
mon
thTo
tal
Ass
ets
Cas
h an
d ba
lance
s with
trea
sury
ban
ksBa
lance
s with
oth
er b
anks
Lend
ings
to fi
nanc
ial in
stitu
tions
Inve
stm
ents
Adv
ance
sO
pera
ting
fixed
ass
ets
Def
erre
d ta
x as
set
Oth
er a
sset
s
Liab
ilitie
sBi
lls p
ayab
leBo
rrow
ings
from
fina
ncial
inst
itutio
nsD
epos
its a
nd o
ther
acc
ount
sD
efer
red
tax
liabi
lity
Oth
er li
abilit
ies
Gap
Shar
e ca
pita
lRe
serv
esU
napp
ropr
iated
pro
fitSu
rplu
s on
reva
luat
ion
of in
vest
men
tsN
et a
sset
s
7,
500,
675
79
1,47
8
6,93
8,61
0
71,5
39,7
37
51,8
33,1
82
1,82
5,48
3
1,19
0,48
5
4,73
5,72
3 1
46,3
55,3
73
71
4,21
2
8,91
0,73
8 1
19,0
22,2
40
-
2,17
7,29
8 1
30,8
24,4
88
15,5
30,8
85
10
,010
,130
1,
200,
812
4,1
85,9
11
134,
032
15,
530,
885
7,
500,
675
591
,478
6,9
38,6
10 1
2,26
6,66
6
9,15
1,15
4
48,9
61
118,
988
3,
103,
683
39,
720,
215
71
4,21
2
7,41
8,91
5 8
2,99
3,76
7
- 1
,333
,943
92,
460,
837
(52
,740
,622
)
-
20
0,00
0
-
497,
430
8,1
31,7
91 3
6,39
2 1
18,9
88
709,
117
9,6
93,7
18
- -
11,5
24,9
48
-
310,
843
11,
835,
791
(2,
142,
073)
-
-
-
24
5,82
6
2,37
7,93
9
54,8
87
118,
988
29
8,59
9
3,09
6,23
9
-
1,49
1,82
310
,794
,966
-
26
3,54
812
,550
,337
(9,
454,
098)
- -
-
53
6,57
7 7
,817
,823
108
,581
23
7,97
6
45,0
47 8
,746
,004 -
-
13,3
94,5
22
-
255,
678
13,
650,
200
(4,
904,
196)
- -
-
42
9,22
9 3
,379
,456
217
,758
29
7,47
0
45,0
09 4
,368
,922
-
-
199,
927
-
8,
055
20
7,98
24,
160,
940
-
-
-
40
2,
852,
593
21
7,77
0
298,
075
4,5
83
3,37
3,06
1
-
-
11,3
10
-
56
11,3
66
3,36
1,69
5
-
-
-
49
6,93
2
5,68
9,89
4
360,
380
-
52
9,68
5
7,07
6,89
1
- - 1
02,8
00 - 5
,175
107
,975
6,9
68,9
16
-
-
-
50,
543,
717
10,
147,
941
35
6,56
3
-
- 6
1,04
8,22
1
- - - - -
- 6
1,04
8,22
1
-
-
-
6,
523,
320
2,
284,
591
42
4,19
1
-
-
9,23
2,10
2
-
-
-
-
-
-
9,
232,
102
2017
----
----
----
----
----
----
----
----
----
----
----
----
----
----
----
----
----
----
----
----
-- (
Rup
ees
in '0
00)
----
----
----
----
----
----
----
----
----
----
----
----
----
----
----
----
----
----
----
Abo
ve 1
0ye
ars
Ove
r 5
to 1
0ye
ars
Ove
r 3
to 5
year
sO
ver
2 to
3ye
ars
Ove
r 1
to 2
year
s
Ove
r 6
mon
ths
to 1
year
Ove
r 3
to 6
mon
ths
Ove
r 1
to 3
mon
ths
Upt
o 1
mon
thTo
tal
Ass
ets
Cas
h an
d ba
lance
s with
trea
sury
ban
ksBa
lance
s with
oth
er b
anks
Lend
ings
to fi
nanc
ial in
stitu
tions
Inve
stm
ents
Adv
ance
sO
pera
ting
fixed
ass
ets
Def
erre
d ta
x as
set
Oth
er a
sset
s
Liab
ilitie
sBi
lls p
ayab
leBo
rrow
ings
from
fina
ncial
inst
itutio
nsD
epos
its a
nd o
ther
acc
ount
sD
efer
red
tax
liabi
lity
Oth
er li
abilit
ies
Gap
Shar
e ca
pita
lRe
serv
esU
napp
ropr
iated
pro
fitD
efici
t on
reva
luat
ion
of in
vest
men
tN
et a
sset
s
9,
679,
582
3,
023,
451
5,
331,
327
114
,259
,902
64
,713
,341
1,
654,
426
1,
611,
943
4,
208,
503
204
,482
,475
905
,423
50
,971
,174
134
,207
,056
-
2,
331,
015
188
,414
,668
16
,067
,807
10,
010,
130
1,
451,
979
5,
175,
820
(5
70,1
21)
16,
067,
808
2,
635,
973
2,
823,
451
4,9
66,7
5027
,281
,369
10,
423,
245
39
,158
16
1,19
4
2,86
5,93
3 5
1,19
7,07
3
905,
423
34,8
68,4
6917
,151
,679
-
1,35
1,78
154
,277
,352
(3,
080,
279)
1,
174,
978
20
0,00
0
-
26,2
06,8
74
3,85
2,65
9
29,3
54
483,
583
88
0,80
3
32,8
28,2
51
-
4,
104,
835
22
,022
,838
-
31
6,66
1
26,4
44,3
34
6,38
3,91
7
1,1
13,5
70
- 3
64,5
77
1,18
9,47
1 1
6,33
6,08
9
44,5
20 3
22,3
89
262,
132
19,
632,
748
- - 2
0,08
2,41
2 -
248
,919
20,
331,
331
(6
98,5
83)
4,
755,
061
-
-
1,
175,
818
13,
924,
232
90
,018
64
4,77
7
116,
110
20,
706,
016
-
11,
997,
870
73,
849,
793
-
39
6,90
2 8
6,24
4,56
5 (
65,5
38,5
49)
-
-
-
25
6,30
1 1
,245
,183
17
8,56
8
-
62,2
51 1
,742
,303
-
-
8,
393
-
72
8,
465
1,7
33,8
38
- -
-
49
9,70
0 3
,118
,400
17
8,57
6
-
14,3
53 3
,811
,029 - -
46,
696
- 5
,614
52,
310
3,7
58,7
19
-
-
-
20,2
93,9
75 5
,232
,314
30
2,61
1
-
208
25,8
29,1
08
-
-
645,
995
-
11
,066
65
7,06
125
,172
,047
-
-
-
30,
132,
703
7,
063,
106
79
1,62
1
-
6,71
3 3
7,99
4,14
3
-
-
39
9,25
0
-
-
399,
250
37,
594,
893
-
-
-
7,2
23,6
91 3
,518
,113
-
-
-
10,7
41,8
04 -
-
-
-
-
-10
,741
,804
38.4
.2M
atur
ity o
f ass
ets
and
liabi
litie
s (b
ased
on
SBP
BSD
Cir
cula
r N
o. 0
2 da
te F
ebru
ary
22, 2
011)
Whe
re a
n as
set
or a
liab
ility
doe
s no
t ha
ve a
con
trac
tual
mat
urity
dat
e, t
he p
erio
d in
whi
ch t
hese
are
ass
umed
to
mat
ure
have
bee
n ta
ken
asex
pect
ed d
ate
of m
atur
ity, b
ased
on
the
crite
ria d
eter
min
ed b
y A
LCO
of t
he B
ank.

Annual Report2017
117 118
2016
----
----
----
----
----
----
----
----
----
----
----
----
----
----
----
----
----
----
----
----
-- (
Rup
ees
in '0
00)
----
----
----
----
----
----
----
----
----
----
----
----
----
----
----
----
----
----
----
Abo
ve 1
0ye
ars
Ove
r 5
to 1
0ye
ars
Ove
r 3
to 5
year
sO
ver
2 to
3ye
ars
Ove
r 1
to 2
year
s
Ove
r 6
mon
ths
to 1
year
Ove
r 3
to 6
mon
ths
Ove
r 1
to 3
mon
ths
Upt
o 1
mon
thTo
tal
15
5,88
6
-
-
1,18
6,99
9
7,81
7,82
3
108,
581
237
,976
45,
047
9,
552,
312
-
-
31,
709,
259
-
28
8,59
8 3
1,99
7,85
7(2
2,44
5,54
5)
Whe
re a
n as
set
or a
lia
bilit
y do
es n
ot h
ave
a co
ntra
ctua
l m
atur
ity d
ate,
the
per
iod
in w
hich
the
se a
re a
ssum
ed t
o m
atur
e ha
ve b
een
take
n as
exp
ecte
d da
te o
f mat
urity
, bas
ed o
n th
e cr
iteria
det
erm
ined
by
ALC
O o
f the
Ban
k.
7,
500,
675
791
,478
6,
938,
610
71
,539
,737
51
,833
,182
1,
825,
483
1,
190,
485
4,
735,
723
146
,355
,373
71
4,21
2
8,91
0,73
8 1
19,0
22,2
40
-
2,17
7,29
8 1
30,8
24,4
88
15,5
30,8
85
10,0
10,1
301,
200,
812
4,18
5,91
113
4,03
215
,530
,885
3,
137,
597
59
1,47
8
6,93
8,61
0
8,68
0,96
6
9,15
1,15
4
48,9
61
119,
593
3,
100,
774
31,
769,
133
71
4,21
2
6,33
7,41
5 2
7,00
8,61
4
-
1,30
1,02
7 3
5,36
1,26
8
(3,5
92,1
35)
2,28
7,77
320
0,00
0
-1,
420,
801
8,
131,
791
36,3
9211
8,98
870
9,11
7 1
2,90
4,86
2
-
1,08
1,50
032
,128
,745
-
31
0,84
3 3
3,52
1,08
8(2
0,61
6,22
6)
1,
919,
419
-
-
1,
259,
515
2,
377,
939
54
,887
11
8,98
8
298,
599
6,
029,
347
-
1,
491,
823
27,
436,
495
-
26
3,54
8 2
9,19
1,86
6 (
23,1
62,5
19)
- - -
42
9,22
9 3
,379
,456
21
7,75
8
297,
470
45
,009
4,3
68,9
22
-
-
19
9,92
7
- 8
,055
20
7,98
2 4
,160
,940
-
-
-
250,
001
2,
852,
593
21
7,77
0
297,
470
4,
584
3,
622,
418
- - 1
1,31
0 - 5
6
11,3
66
3,61
1,05
2
- - -49
6,93
2 5
,689
,894
36
0,38
0
-
529,
685
7,07
6,89
1
-
-
102,
800
-
5,
171
107
,971
6,
968,
920
-
-
-
50,5
43,7
1710
,147
,941
356,
563
-
-
61,0
48,2
21
-
-
425,
090
-
-
425,
090
60,
623,
131
-
- -
7,2
71,5
77 2
,284
,591
42
4,19
1
-
2,90
8 9
,983
,267 - - - - -
- 9,9
83,2
67
Ass
ets
Cas
h an
d ba
lance
s with
trea
sury
ban
ksBa
lance
s with
oth
er b
anks
Lend
ings
to fi
nanc
ial in
stitu
tions
Inve
stm
ents
Adv
ance
sO
pera
ting
fixed
ass
ets
Def
erre
d ta
x as
set
Oth
er a
sset
s
Liab
ilitie
sBi
lls p
ayab
leBo
rrow
ings
from
fina
ncial
inst
itutio
nsD
epos
its a
nd o
ther
acc
ount
sD
efer
red
tax
liabi
lity
Oth
er li
abilit
ies
Gap
Shar
e ca
pita
lRe
serv
esU
napp
ropr
iated
pro
fitSu
rplu
s on
reva
luat
ion
of in
vest
men
tsN
et a
sset
s
HIGH QUALITY LIQUID ASSETSTotal high quality liquid assets (HQLA) - 58,757,071
CASH OUTLFLOWSRetail deposits and deposits from smallbusiness customers of which:
Stable deposit - -Less stable deposit 4,592,361 459,236
Unsecured wholesale funding of which:Operational deposits (all counterparties) - -Non-operational deposits (all counterparties) - -Unsecured debt 11,646,103 5,436,414Secured wholesale funding 20,963,844 2,791,315
Additional requirements of which:Outflows related to derivative exposures and
other collateral requirements - -Outflows related to loss of funding on debt products - -Credit and liquidity facilities 15,399,094 1,821,699Other contractual funding obligations 384,602 384,602Other contingent funding obligations 10,280,399 514,020TOTAL CASH OUTFLOWS 63,266,403 11,407,286
CASH INFLOWS Secured lending 1,489,466 -Inflows from fully performing exposures 9,600,128 5,002,847Other cash inflows 3,301,282 -
14,390,876 5,002,847
Total adjusted value
Total HQLA 58,757,071Total cash inflows 6,404,439LIQUIDITY COVERAGE RATIO (LCR) 917%
38.4.3 Liquidity Coverage Ratio (LCR)Asset & Liability Committee (ALCO) is responsible for reviewing and approving the liquidity risk limits, ensuring thatthe liquidity risk management practices are in line with the defined strategy. ALCO is also responsible to recommendLiquidity Risk policy for approval to BOD.
Liquidity risk is defined as the risk that a bank does not have sufficient financial resources to meet its obligations andcommitments as they fall due and have no other choice to secure funds at a higher cost. The Bank ensures to maintaina diversified portfolio of liquid assets and funding base. Sources of funding comprise of a good mix of deposits. Allliquidity limits including deposit concentration is reviewed in ALCO on a periodic basis. The Bank performs its LiquidityStress Test on a periodic basis in order to ensure that sufficient liquidity is always available in order to fulfill Bank’sfinancial commitments. Stress testing technique is also used to identify the potential impact of extreme yet plausibleevents or movements on the value of a portfolio. Stress testing scenarios are developed in guidance provided bythe Regulator. The Bank also has in place approved Liquidity Contingency Plan. Further, Liquidity Risk Managementis quantified by Liquidity Coverage Ratio and Net Stable Funding Ratio as communicated by the Regulator. LiquidityCoverage Ratio (LCR) refers to the highly liquid assets held by the bank to meet its short term obligations. LCR isused as a tool to manage liquidity risk. LCR has two components: high quality liquid asset (HQLA) and total net cashoutflows. HQLA comprises of those assets that can be readily sold or employed as collateral for obtaining funds.HQLA structure has been divided into 1) cash and treasury balances, 2) marketable securities, 3) corporate debtsecurities with credit rating and 4) non-financial equity shares.
Unweighted WeightedValue Value
---------- (Rupees in '000) ---------

Annual Report2017
119 120
38.4.4 Net Stable Funding Ratio (NSFR)The objective of NSFR is to reduce funding risk over a longer time horizon by requiring banks to fund their activitieswith sufficiently stable sources of funding in order to mitigate the risk of future funding stress.
The ratio has been computed as prescribed by the State Bank of Pakistan through instructions for Basel-III - LiquidityStandards implementation in Pakistan.
Capital:Regulatory capital 14,913,809 - - - 14,913,809Other capital instruments 264,239 - - - 1,381,324Retail deposits and deposit from smallbusiness customers:Stable deposits - - - - -Less stable deposits 10,997,656 3,044,866 460,601 1,294,781 13,052,811Wholesale funding: Operational deposits - - - - -Other wholesale funding 15,692,612 5,052,835 7,622,321 154,167 17,692,215Other liabilities: NSFR derivative liabilities - - - - -All other liabilities and equity not included in
other categories 71,240,671 57,346,594 16,143,567 292,962 47,256,802Total ASF 94,296,961
Total NSFR high-quality liquid assets (HQLA) - - - - -Deposits held at other financial institutions
for operational purposes - - - - -
Performing loans and securities:Performing loans to financial institutions secured
by Level 1 HQLA - - - - -Performing loans to financial institutions secured by
non-Level 1 HQLA and unsecured performing loansto financial institutions - 473,125 2,684,645 471,535 1,884,826
Performing loans to non- financial corporate clients,loans to retail and small business customers, andloans to sovereigns, central banks and PSEs, of which: - 29,540,065 11,092,197 19,390,101 38,191,662With a risk weight of less than or equal to 35% underthe Basel II Standardised Approach for credit risk - 626,099 148,585 315,481 661,285Securities that are not in default and do not qualify asHQLA including exchange-traded equities. - - - - -Other assets:Physical traded commodities, including gold - - - - -Assets posted as initial margin for derivative contracts - - - - -NSFR derivative assets - - - - -NSFR derivative liabilities before deduction ofvariation margin posted - - - - -All other assets not included in the above categories 16,106,355 60,952,291 527,100 59,170,653 32,387,893Off-balance sheet items - 25,385,674 4,978,192 5,255,126 1,780,950Total RSF 74,906,616
Net Stable Funding Ratio (%) 126%
---------------------------------- (Rupees in '000) -----------------------------
2017Unweighted value by residual maturity
No maturityBelow 6months
6 months tobelow 1 year
1 year andabove 1
yearWeighted
value
38.5 Operational risk
Operational risk is the risk of loss resulting from inadequate or failed internal processes, people and systems or fromexternal events, which includes legal risk, but excludes strategic and reputational risk.
The Operational Risk Management Department (ORMD) works under the RMD and its responsibilities includeidentifying, monitoring, measuring and managing operational risks assumed by the Bank. In adherence to industry bestpractice, the key functions of the ORMD are the operational risk policy and planning function, operational riskassessment function, operational risk measurement and analytics function and operational risk monitoring, mitigationand control function.
39. GENERAL
Figures have been rounded off to the nearest thousand rupee.
40. DATE OF AUTHORISATION FOR ISSUE
These unconsolidated financial statements were authorised for issue by the Board of Directors on March 07, 2018.
Chairman President and Chief Executive Officer Director Director Chief Financial Officer

Annual Report2017
121 122

Annual Report2017
123 124
Islamic Banking BusinessStatement of Financial PositionAs at December 31, 2017
ISLAMIC BANKING BUSINESS
The Bank commenced its Islamic Banking operations effective from June 26, 2014 and is operating with 14 Islamic Bankingbranches and 13 Islamic Banking Windows in Conventional branches (2015: 13 Branches and 2 Islamic Banking Windows)at the end of reporting period. The statement of financial position, profit and loss account and cash flow statement of theIslamic banking division are as follows:
Assets
Cash and balances with treasury banks 429,291 231,041Balances with other banks 132,556 100,595Due from financial institutions 2,989,577 330,000Investments 1,452,966 1,036,295Islamic financing and related assets A-I-1 2,291,322 2,150,591Operating fixed assets 98,710 115,160Deferred tax assets - -Due from head office - -Other assets 63,201 77,919
7,457,623 4,041,601Liabilities
Bills payable 43,574 30,232Due to financial institutions - 150,000Deposits and other accounts 6,975,899 3,433,210- Current accounts 2,687,771 277,699- Savings accounts 920,916 878,729- Term deposits 168,500 82,424- Other deposits and accounts 27,125 46,518- Deposits from financial institutions - remunerative 3,171,225 2,146,615- Deposits from financial institutions - non remunerative 362 1,225Deferred tax liability 5,218 5,661Due to head office 21,024 1,779Other liabilities 60,310 42,792
7,106,025 3,663,674Net Assets 351,598 377,927
Represented By
Islamic banking fund 500,000 500,000Reserves - -Accumulated losses (158,510) (131,835)
341,490 368,165Surplus on revaluation of investments 10,108 9,762
351,598 377,927
2017 2016Note (Rupees in '000)
Islamic Banking BusinessProfit and Loss AccountFor the year ended December 31, 2017
Profit / return on financing, investments and placements earned 329,516 196,576Return on deposits and other dues expensed (204,440) (151,357)Net income earned before provisions 125,076 45,219
Provision against non-performing financing - net - -Provision for diminution in value of investments - -
- -Net income earned after provisions 125,076 45,219
Other income
Fee, commission and brokerage income 6,852 4,457Income from dealing in foreign currencies 24 62Dividend income 13,050 10,621Gain on sale / redemption of securities 100 3,107Other income 1,298 1,228
21,324 19,475 146,400 64,694
Other expenses
Administrative expenses 173,025 152,439Other charges 50 -
(173,075) (152,439)Loss before taxation (26,675) (87,745)Accumulated losses brought forward (131,835) (44,090)Transferred to head office - -Accumulated losses carried forward (158,510) (131,835)
2017 2016Note (Rupees in '000)

Annual Report2017
125 126
2017 2016Note (Rupees in '000)
Islamic Banking BusinessStatement of Cash FlowsFor the year ended December 31, 2017
Adjustments
Depreciation 16,739 15,337Amortisation 3,474 3,474
20,213 18,811 (19,512) (79,555)
(Increase) / decrease in operating assets
Balances with and due from financial institutions (2,659,577) 320,000Islamic financing and related assets - net (140,731) (1,629,834)Other assets 14,718 (2,544)
(2,785,590) (1,312,378)(Decrease) / increase in operating liabilities
Bills payable 13,342 29,906Due to financial institutions (150,000) 18,578Deposits and other accounts 3,542,689 1,113,398Due to head office 19,245 (59,105)Other liabilities 17,518 8,882
3,442,794 1,111,659 637,692 (280,274)
Income tax paid - -Net cash (used in) / flow from operating activities 637,692 (280,274)
CASH FLOW FROM INVESTING ACTIVITIESNet investment in securities (416,768) 359,360Dividend received 13,050 10,621Investment in operating fixed assets (3,763) (39,073)Net cash flow from / (used in) investing activities (407,481) 330,908
CASH FLOW FROM FINANCING ACTIVITIES
Increase in cash and cash equivalents 230,211 50,634
Cash and cash equivalents at beginning of the year 331,636 281,002
Cash and cash equivalents at end of the year A-I-2 561,847 331,636
CASH FLOW FROM OPERATING ACTIVITIES
Loss before taxation (26,675) (87,745)Less: Dividend income (13,050) (10,621)
(39,725) (98,366)
2017 2016Note (Rupees in '000)
Islamic Banking BusinessNotes to Annexure-1For the year ended December 31, 2017
A-I-2 CASH AND CASH EQUIVALENT AT THE END OF THE YEARCash and balances with treasury banks 429,291 231,041Balances with other banks 132,556 100,595
561,847 331,636
A-I-3 REMUNERATION TO SHARIAH ADVISOR 2,759 2,518
A-I-4 CHARITY FUNDOpening balance - -Addition during the year 45 -Payment / utilization during the year - -Closing balance 45 -
A-I-5 Sindh Bank Limited - SA' ADAT Islamic Banking Division is maintaining the following pools for profit declaration and distribution:
(i) General Pool, Special Pool and FI Pool
(a) Priority of utilization of funds in the general pool shall be as follows:- Depositors Funds- Equity Funds
Priority of utilization of funds in the FI pool shall be:- FI Funds- Equity Funds
(b) Weightages for distribution of profit in general pool
Profits are calculated on the basis of weightages assigned to different tiers and tenors. These weightages are announcedquarterly. While considering weightages emphasis is given to the quantum, type and period of risk assessedby applying following factors:
- Contracted period, nature and type of deposits / fund.- Payment cycle of profit on such deposits / fund i.e. monthly, quarterly or on maturity.- Magnitude of Risk.
Any change in profit sharing weightages of any category of deposit / fund providers shall be applicable from nextperiod.
Special and Financial Institution Pools. Profit is calculated and distributed on the basis of pre agreed Profit SharingRatio.
A-I-1 ISLAMIC FINANCING AND RELATED ASSETSNet book value of assets / investment in Ijarah under IFAS 2 103,583 74,647Diminishing musharaka 2,187,739 2,075,944
2,291,322 2,150,591

Annual Report2017
127 128
(c) Identification and allocation of Pool related income and expenditure
The allocation of income and expenditure to different pools is being done based on a pre-defined basis and accounting principles as mentioned below.
Any direct expenditure shall be charged to respective pools, while indirect expenses including the establishmentcosts shall be borne by Sindh Bank - Islamic Banking Division (SNDB - IBD) as Mudarib. The direct expenses tobe charged to the pool may include depreciation for Ijarah assets, Takaful expenses of pool assets,stamp fees or documentation charges, brokerage fee on purchase of securities, impairment / losses due to physicaldamages to specific assets in pool etc. However, this is not an exhaustive list. SNDB - IBD pool managementframework and the respective pool creation memo may identify and specify these and other similar expenses tobe charged to the pool.
(d) Parameters associated with risks and rewards
Following are the consideration attached with risks and rewards of the general pool:
- Period, return, safety, security and liquidity of investment;- All financing proposal under process at various stages and likely to be extended in the near future;- Expected withdrawal of deposits according to the maturities affecting the deposit base;- Maturities of funds obtained under Modaraba arrangements from Head Office and Islamic Banking Financial
Institutions;- Elements of risks associated with different kind of investments;- Regulatory requirements; and- Shariah compliance.
A-I-6 BASIS OF PROFIT ALLOCATION
During the year, the profit was distributed between Mudarib and Rubbal Maal as per following profit sharing ratiobased upon gross income level less direct expenses.
Islamic Banking BusinessNotes to Annexure-1For the year ended December 31, 2017
Rubbal Maal 61.50% 65.00%Mudarib 28.50% 35.00%
A-I-7 MUDARIB SHARE (in amount and percentage of distributable income)Rubbul Maal (%) 61.50% 65.00%Rubbul Maal (amount) 34,404 27,006Mudarib (%) 38.50% 35.00%Mudarib (amount) 21,540 14,542
A-I-8 Amount and percentage of mudarib share transferred todepositors thought Hiba
Mudarib share 21,540 14,542Hiba 3,337 3,230Hiba percentage of mudarib share 15.49% 22.21%
Amount and percentage of Mudarib share transferred to depositors thought Hiba for Special Pool during 2017:
Islamic Banking BusinessNotes to Annexure-1For the year ended December 31, 2017
Mudarib share 40,664 18,691Hiba 14,345 1,539Hiba percentage of mudarib share 35.28% 8.23%
A-I-9 Profit rate earned vs profit rate distributed to the depositors during the year
2017 2016Note (Rupees in '000)
2017 2016Note (Rupees in '000)
Profit rate earned 6.79% 6.76%Profit rate distributed to depositors 5.44% 5.35%
2017 2016

Annual Report2017
130129
vi. While the Bank is actively pursuing training of its human resource about various aspects of IslamicBanking & Finance through training sessions and seminars, however, further improvement is requiredto raise the level of awareness of Islamic Banking & Finance of the staff, management and the BODthrough enhanced training mechanism for each level. The management and the BOD have madesincere efforts and appreciate the importance of Shariah compliance in the overall operations ofSNDB-IBD.
vii. The RSBM is acting as Head, Shariah Compliance Department (SCD) and, the bank is in process tostrengthen SCD by inducting suitable resource (s), as soon as possible.
viii. Shariah Board of the Bank also takes this opportunity to place on record its gratitude to the IslamicBanking Division of SBP, for its continuous guidance and support.
Report of Shariah Board(For the Year ended December 31, 2017)
In the name of Allah, the Beneficent, the Merciful
While the Board of Directors and Executive Management are solely responsible to ensure that theoperations of Sindh Bank Islamic Banking Division (SNDB-IBD) are conducted in compliance with Shariahprinciples at all times, we the Shariah Board Members are required to submit a report on the overallShariah compliance environment of SNDB-IBD.
During the year ended December 31, 2017, Shariah Board meetings were held on quarterly basis, as under:
To form our opinion as expressed in this report, the Shariah Compliance Department of SNDB- IBDcarried out reviews, of each class of transactions, products, process flows and concepts. Further, the ShariahBoard has also reviewed the periodical reports of Resident Shariah Board Member (RSBM) as well as theInternal Shariah Audit Division. The External Shariah Audit for the year 2017 is in process at the moment.Based on the above, Shariah Board is of the view that:
i. SNDB-IBD has complied with Shariah rules and principles in the light of Fatwas (Shariah Rulings),instructions and guidelines issued by the Shariah Board from time to time, with regards to transactionsand overall Shariah Compliance.
ii. SNDB-IBD has complied with the directives, regulations and guidelines related to Shariah complianceissued by State Bank of Pakistan (SBP) from time to time in accordance with the rulings of SBP, ShariahBoard.
iii. SNDB-IBD has a comprehensive mechanism in place to ensure Shariah compliance in their overalloperations.
iv. In the course of Shariah compliance of transactions, it was highlighted that SNDB-IBD has realizedan amount of Rs.45,454/- as Non Shariah compliant, mainly on account of deduction of notice periodpay of some employees who left bank during the year, which was instructed to be transferred intothe Charity Account. The Bank has transferred the said amount into Charity Fund and will disburseit soon as per the Charity Policy of the Bank.
v. SNDB- IBD has complied with the SBP instructions on profit and loss distribution and pool managementin spirit of the related guidelines issued by SBP.
Meetings Dates
First Sharia'ah Board Meeting March 29, 2017
Second Sharia'ah Board Meeting June 19, 2017
Third Sharia'ah Board Meeting September 29 , 2017
Fourth Shar'iah Board Meeting December 29 , 2017

Annual Report2017
132131

Annual Report2017
133 134

Annual Report2017
135 136
CONSOLIDATEDFINANCIAL STATEMENTSFOR THE YEAR ENDED
DECEMBER 31, 2017

Annual Report2017
137 138
Sindh Bank LimitedConsolidated Profit and Loss AccountFor the year ended December 31, 2017
ASSETS
Cash and balances with treasury banks 6 9,680,631 7,502,624Balances with other banks 7 3,442,989 1,191,478Lendings to financial institutions 8 5,331,327 6,938,610Investments - net 9 113,509,902 70,889,737Advances - net 10 65,051,730 51,901,838Operating fixed assets 11 1,663,440 1,832,882Deferred tax assets - net 12 1,611,539 1,190,077Other assets - net 13 4,233,506 4,758,407
204,525,064 146,205,653LIABILITIES
Bills payable 14 905,423 714,212Borrowings 15 50,971,174 8,910,738Deposits and other accounts 16 134,204,090 118,843,374Sub-ordinated loanLiabilities against assets subject to finance lease Deferred tax liabilities - net 12 - -Other liabilities 17 2,327,166 2,178,766
188,407,853 130,647,090
NET ASSETS 16,117,211 15,558,563
REPRESENTED BY
Shareholders' equityShare capital 18 10,010,130 10,010,130Reserves 1,464,329 1,207,731Unappropriated profit 5,212,873 4,206,670
16,687,332 15,424,531
(Deficit) / surplus on revaluation of assets - net of deferred tax 19 (570,121) 134,032 16,117,211 15,558,563
CONTINGENCIES AND COMMITMENTS 20
The annexed notes from 1 to 40 form an integral part of these consolidated financial statements.
2017 2016Note (Rupees in '000)
Sindh Bank LimitedConsolidated Statement of Financial PositionAs at December 31, 2017
Mark-up / return / interest earned 21 11,656,377 9,821,409Mark-up / return / interest expensed 22 6,271,962 5,356,366Net mark-up / return / interest income 5,384,415 4,465,043
Provision against non performing loans and advances - net 10.5.3 255,160 1,608,142Provision for diminution in the value of investments - net - -Bad debts written off directly 470 -
255,630 1,608,142Net mark-up / return / interest income after provisions 5,128,785 2,856,901
Non mark-up / interest income
Fee, commission and brokerage income 453,507 358,828Dividend income 156,062 141,517Income from dealing in foreign currencies 103,555 52,754Gain on sale of securities - net 23 604,425 2,933,656Unrealised gain on revaluation of investments
classified as 'held-for-trading' - -Other income 24 9,973 9,211Total non mark-up / interest income 1,327,522 3,495,966
6,456,307 6,352,867Non mark-up / interest expenses
Administrative expenses 25 4,233,499 3,903,667Other provisions / (reversals) against other assets - -Other charges 26 9,421 525Total non mark-up / interest expenses 4,242,920 3,904,192
2,213,387 2,448,675Extraordinary / unusual items - -Profit before taxation 2,213,387 2,448,675
Taxation - Current 816,180 1,411,760 - Prior years 161,950 185,359 - Deferred (42,303) (551,735)
27 935,827 1,045,384Profit after taxation 1,277,560 1,403,291
Basic and diluted earnings per share (Rupees) 28 1.28 1.40
The annexed notes from 1 to 40 form an integral part of these consolidated financial statements.
2017 2016Note (Rupees in '000)
Chairman President and Chief Executive Officer Director Director Chief Financial Officer Chairman President and Chief Executive Officer Director Director Chief Financial Officer

Annual Report2017
139 140
2017 2016Note (Rupees in '000)
Profit after taxation 1,277,560 1,403,291
Other comprehensive income
Components of comprehensive income reflected in equity
Items that will be reclassified subsequently to profit and loss account - -
Items that will not be reclassified subsequently to profit and loss account:
Measurement of net defined benefit liability (22,706) (5,639)Related current tax credit 7,947 1,974
(14,759) (3,665)Total comprehensive income for the year transferred to equity 1,262,801 1,399,626
Components of comprehensive income reflected below equity
Items that will be reclassified subsequently to profit and loss account:
Deficit on revaluation of investments (1,083,312) (961,303)Related deferred tax credit 379,159 336,455
(704,153) (624,848)
Items that will not be reclassified subsequently to profit and loss account - -
Total comprehensive income 558,648 774,778
The annexed notes from 1 to 40 form an integral part of these consolidated financial statements.
Sindh Bank LimitedConsolidated Statement of Comprehensive IncomeFor the year ended December 31, 2017
Chairman President and Chief Executive Officer Director Director Chief Financial Officer
Sindh Bank LimitedConsolidated Cash Flow StatementFor the year ended December 31, 2017
2017 2016Note (Rupees in '000)
CASH FLOW FROM OPERATING ACTIVITIESProfit before taxation 2,213,387 2,448,675Less: Dividend income (156,062) (141,517)
2,057,325 2,307,158Adjustments:Depreciation 11.2 354,102 375,215Amortisation 11.3 28,994 30,104Provision against non performing loans and advances - net 10.5.3 255,160 1,608,142Written-off operating fixed assets 732 -Charge for defined benefit plan 31 48,740 44,842Gain on sale of operating fixed assets 24 (2,964) (4,146)
684,764 2,054,1572,742,089 4,361,315
(Increase) / decrease in operating assetsLendings to financial institutions 1,607,283 (6,538,610)Advances - net (13,405,052) (9,340,891)Other assets - net 550,036 (499,822)
(11,247,733) (16,379,323)Increase / (decrease) in operating liabilitiesBills payable 191,211 425,531Borrowings 42,060,436 (18,249,959)Deposits and other accounts 15,360,716 34,922,574Other liabilities (excluding current taxation) 143,824 340,290
57,756,187 17,438,43649,250,543 5,420,428
Contribution to gratuity fund 31 (50,481) (49,287)Income tax paid (976,725) (1,722,513)Net cash flow from operating activities 48,223,337 3,648,628
CASH FLOW FROM INVESTING ACTIVITIESNet investment in available-for-sale securities (34,089,595) (2,686,633)Net investment in held-to-maturity securities (9,613,882) 479,838Dividend received 130,195 140,849Investments in operating fixed assets (225,993) (348,943)Sale proceeds of operating fixed assets disposed-off 11.4 5,456 16,485Net cash used in investing activities (43,793,819) (2,398,404)
CASH FLOW FROM FINANCING ACTIVITIESIssue of share capital - 10,181Net cash flow from financing activities - 10,181
Increase in cash and cash equivalents 4,429,518 1,260,405Cash and cash equivalents at the beginning of the year 8,694,102 7,433,697Cash and cash equivalents at the end of the year 29 13,123,620 8,694,102
The annexed notes from 1 to 40 form an integral part of these consolidated financial statements.
Chairman President and Chief Executive Officer Director Director Chief Financial Officer

Annual Report2017
141 142
Sindh Bank LimitedNotes to the Consolidated Financial StatementsFor the year ended December 31, 2017
1. STATUS AND NATURE OF BUSINESS
The "Group" consists of:
1.1 Holding Company
1.1.1 Sindh Bank Limited (the Bank) was incorporated in Pakistan on October 29, 2010 as a public unlisted companyand is engaged in Commercial Banking, Corporate and Investment related activities. The Bank operates 300(2016: 260) branches including 8 (2016: 8) sub branches and 14 (2016: 14) Islamic banking branches in Pakistan.The Bank's registered office is located at 3rd Floor, Federation House, Abdullah Shah Ghazi Road, Clifton, Karachi,Pakistan.
1.1.2 The Government of Sindh, through its Finance Department owns 99.9% ordinary shares of the Bank.
1.1.3 JCR –VIS Credit Rating Company Limited has reaffirmed the Bank's medium to long term entity rating of ‘AA’(Double A) with a 'Rating Watch-Developing' status and short term rating of ‘A-1+’ (A-One plus).
1.1.4 The State Bank of Pakistan (SBP) granted license to the Bank to conduct banking business subject to certainconditions which inter alia includes that the Bank shall get listed on stock exchange within three years fromthe date of commencement of business. The Bank, however, from time to time had obtained extensions in thetime limit from SBP. During 2016, the Bank initiated the process of listing of its shares on Pakistan Stock Exchange(PSX). Approval of the draft Prospectus was given by PSX on October 25, 2016 with a deadline to publish thesame in the newspapers by October 31, 2016. Publication of the Prospectus was however halted and the listingprocess was put on hold as the Government of Sindh (sole sponsor of Sindh Bank Limited) and themajority shareholders / sponsors of Summit Bank Limited agreed in principle, to consider a merger of the twoinstitutions, with the Bank being the surviving entity. SBP's approval to conduct due diligence of Summit Bankwas granted on December 27, 2016. On completion of the due diligence exercise, the Board of Directors andShareholders of the respective banks had proposed a share swap ratio of 1:4.17 for which sanction was requestedfrom SBP. However, subsequently, on the advice of SBP, it has been decided by the Board of Directors to restart due diligence process to arrive at fresh swap ratio based on the audited financial statements for the yearended 31 December 2017 and accordingly, formal approvals from the Board, shareholders and the SBP will beobtained for finalization of the merger process.
1.2 Subsidiary company
1.2.1 Sindh Microfinance Bank Limited
Sindh Microfinance Bank Limited (the Microfinance Bank) was incorporated on March 27, 2015 as a publiccompany limited by shares under the Companies Ordinance, 1984. The Microfinance Bank obtained Microfinancebanking license from State Bank of Pakistan (SBP) on October 16, 2015, to operate in Sindh Province.Subsequently the Microfinance Bank has received the certificate of commencement of business from Securities& Exchange Commission of Pakistan (SECP) on November 30, 2015. The Microfinance Bank's registered officeis situated at 39/F, 2nd Floor, Muhammad Ali Cooperative Housing Society, Karachi. The Microfinance Bank'sprincipal business will be to provide microfinance services to the poor and underserved segment of the societyas envisaged under the Microfinance Institutions Ordinance, 2001. The Microfinance Bank operates with a networkof 10 (2016: 5) branches and 40 (2016: 19) service centers. The Bank holds 99.99% shares of the MicrofinanceBank and remaining shares are held by the nominees of the Bank.
2. BASIS OF PRESENTATION
The consolidated financial statements of the Group consist of financial statements of the holding company andthe subsidiary company for the year ended December 31, 2017.
ShareCapital
Depositors'protection
fundreserve **
Total
--------------------- (Rupees in '000) ---------------------
Capital Reserve
Balance as at January 01, 2016 10,000,000 - 925,638 761 3,088,325 14,014,724
Profit for the year ended December 31, 2016 - - - - 1,403,291 1,403,291Other comprehensive loss - - - - (3,665) (3,665)
Total comprehensive income for the year endedDecember 31, 2016 - - - - 1,399,626 1,399,626
Transfer to depositors' protection fund - 5% of the profit after tax for the year - - - 623 (623) -Transfer to statutory reserve - - 280,658 - (280,658) -Issue of share capital (note 18.3) 10,130 51 - - - 10,181
Balance as at December 31, 2016 10,010,130 51 1,206,296 1,384 4,206,670 15,424,531
Profit for the year ended December 31, 2017 - - - - 1,277,560 1,277,560Other comprehensive loss - - - - (14,759) (14,759)
Total comprehensive income for the year endedDecember 31, 2017 - - - - 1,262,801 1,262,801
Transfer to statutory reserve - - 255,512 - (255,512) -
Transfer to depositors' protection fund - 5% of the profit after tax for the year - - - 1,086 (1,086) -
Balance as at December 31, 2017 10,010,130 51 1,461,808 2,470 5,212,873 16,687,332
* Statutory reserve represents amount set aside as per the requirements of section 21 of the Banking CompaniesOrdinance, 1962 in case of the Bank and under Microfinance Institution Ordinance, 2001 and Prudential Regulations"R-4 - Statutory Reserve" in the case of Sindh Microfinance Bank, to create a reserve fund to which shall be creditedan amount equal to at least 20% of its annual profits after taxes.
** The Sindh Microfinance Bank Limited is required under Microfinance Institutions Ordinance, 2001 to contribute 5%of its annual after tax profit to the Depositors' Protection Fund and profit earned on investments of the fund shallalso be credited to the fund.
*** As more fully explained in note 10.5.2 of these consolidated financial statements, unappropriated profit includes anamount of Rs.1,594.62 million net of tax as at December 31, 2017 (2016: Rs.472.71 million) representing additionalprofit arising from availing forced sale value benefit for determining provisioning requirement which is not availablefor the purpose of distribution of dividend to shareholders.
The annexed notes from 1 to 40 form an integral part of these consolidated financial statements.
Sindh Bank LimitedConsolidated Statement of Changes in EquityFor the year ended December 31, 2017
Revenue Reserve
Unappropriatedprofit ***
Chairman President and Chief Executive Officer Director Director Chief Financial Officer
SharePremium
StatutoryReserve *

Annual Report2017
143 144
These consolidated financial statements have been prepared on the format prescribed by SBP under BSD CircularNo. 4 dated February 17, 2006, 'Revised Forms of Annual Financial Statements', effective from the accountingyear ended December 31, 2006. The SBP vide BPRD circular No. 2 dated January 25, 2018 has specified thenew reporting format for the financial statements of banking companies. The new format has revised the disclosurerequirements and will become applicable for the consolidated financial statements of the Group for the yearending December 31, 2018.
In accordance with the directives of the Federal Government regarding the shifting of the Banking system toIslamic modes, the SBP has issued various circulars from time to time. Permissible forms of trade-related modesof financing include purchase of goods by banks from their customers and immediate resale to them at appropriatemark-up in price on deferred payment basis. The purchases and sales arising under these arrangements are notreflected in these consolidated financial statements as such but are restricted to the amount of facility actuallyutilized and the appropriate por tion of mark-up thereon. The Islamic Banking branches of the Group havecomplied with the requirements set out under the Islamic Financial Accounting Standards (IFAS) issued by theInstitute of Chartered Accountants of Pakistan (ICAP) and notified under the provisions of the repealed CompaniesOrdinance, 1984.
3. STATEMENT OF COMPLIANCE
3.1 These consolidated financial statements have been prepared in accordance with approved accounting standardsas applicable in Pakistan. Approved accounting standards comprise of such International Financial ReportingStandards (IFRS) issued by the International Accounting Standards Board as are notified under the repealedCompanies Ordinance, 1984, Islamic Financial Accounting Standards (IFAS) issued by the Institute of CharteredAccountants of Pakistan (ICAP) as are notified under the repealed Companies Ordinance, 1984, provisions ofand directives issued under the repealed Companies Ordinance, 1984 and the Banking Companies Ordinance,1962 and the directives issued by the State Bank of Pakistan (SBP) and the Securities and Exchange Commissionof Pakistan (SECP). In case requirements differ, the provisions and directions issued under repealed CompaniesOrdinance, 1984, the Banking Companies Ordinance, 1962 and the directives issued by the SBP and SECP shallprevail.
3.2 Effective May 30, 2017, the Companies Act, 2017 (the Act) was promulgated, however, the Securities andExchange Commission of Pakistan (SECP) vide its circular No. 23 of 2017 dated October 04, 2017 decided thatthe companies whose financial year closes on or before December 31, 2017 shall prepare their financial statementsin accordance with the provisions of the repealed Companies Ordinance, 1984.
The SBP vide BSD Circular No. 10, dated August 26, 2002 has deferred the applicability of International AccountingStandard 39, Financial Instruments: Recognition and Measurement (IAS 39) and International Accounting Standard40, Investment Proper ty (IAS 40) for banking companies till fur ther instructions. Fur ther, according to thenotification of the Securities and Exchange Commission of Pakistan (SECP) dated April 28, 2008, the IFRS - 7‘Financial Instruments: Disclosures’ has not been made applicable for Group. Accordingly, the requirements ofthese standards have not been considered in the preparation of these consolidated financial statements. However,investments have been classified and valued in accordance with the requirements of various circulars issued bythe SBP.
IFRS 8, ‘Operating Segments’ is effective for the Group’s accounting periods beginning on or after January 01,2009. All banking companies in Pakistan are required to prepare their annual financial statements in line withthe format prescribed under BSD Circular No. 4 dated February 17, 2006, ‘Revised Forms of Annual FinancialStatements’, effective from the accounting year ended December 31, 2006. The management of the Groupbelieves that as the SBP has defined the segment categorization in the above mentioned circular, the SBPrequirements prevail over the requirements specified in IFRS 8. Accordingly, segment information disclosed inthese consolidated financial statements is based on the requirements laid down by the SBP.
The SBP vide its BSD Circular No. 07 dated April 20, 2010 has clarified that for the purpose of preparation offinancial statements in accordance with International Accounting Standard - 1 (Revised), 'Presentation of FinancialStatements', two statement approach shall be adopted i.e. separate 'Profit and Loss Account' and 'Statementof Comprehensive Income' shall be presented and Balance Sheet shall be renamed as 'Statement of FinancialPosition'. The surplus / (deficit) on revaluation of available for sale (AFS) securities is required to be included inthe 'Statement of Comprehensive Income'. However, it should continue to be shown separately in the Statementof Financial Position below equity. Accordingly, the above requirements have been adopted in the preparationof these consolidated financial statements.
3.3 The Group has adopted the following accounting standards, amendments and interpretations of IFRSs which becameeffective for the current year :
Standard or Interpretation
IAS 7 Statement of Cash Flows - Disclosure Initiative - (Amendment)
IAS 12 Income Taxes – Recognition of Deferred Tax Assets for Unrealized losses (Amendments)
Improvements to Accounting Standards Issued by the IASB
IFRS 12 Disclosure of Interests in Other Entities -Clarification of the scope of the disclosure requirements in IFRS 12
The adoption of the above amendments, improvements to accounting standards and interpretations did not have anyeffect on the consolidated financial statements.
3.4 New accounting standards / amendments and IFRS interpretations that are not yet effective
The following standards, amendments and interpretations with respect to the approved accounting standards asapplicable in Pakistan would be effective from the dates mentioned below against the respective standard or interpretation:
Effective date (annual Standard or Interpretation periods beginning on or after)
IFRS 2 – Share-based Payments – Classification and Measurementof Share-based Payments Transactions – (Amendments) January 01, 2018
IFRS 10 – Consolidated Financial Statements and IAS 28 – Investmentin Associates and Joint Ventures - Sale or Contribution of Assetsbetween an Investor and its Associate or Joint Venture – (Amendment) Not yet finalized
IFRS 15 – Revenue from Contracts with Customers July 01, 2018
IFRIC Interpretation 22 – Foreign Currency Transactionsand Advance Consideration January 01, 2018
IFRIC 23 – Uncertainty over Income Tax Treatments January 01, 2019
IFRS 9 – Financial Instruments: Classification and Measurement July 01, 2018
IFRS 9 Prepayment Features with Negative Compensation –(Amendments) January 01, 2018
IFRS 4 Insurance Contracts: Applying IFRS 9 Financial Instruments with IFRS 4 Insurance Contracts – (Amendments) January 01, 2018
The above standards, amendments and interpretations are not expected to have any material impact on the Group'sconsolidated financial statements in the period of initial application. With regard to IFRS -9, the Group considers thatas the Prudential Regulations and other SBP directives currently provide the accounting framework for the measurementand valuation of investments and provision against non-performing financings, the implementation of IFRS-9 may requirechanges in the regulatory regime. Therefore, the Group expects that the SBP would issue suitable guidance andinstruction on the application of IFRS-9 for the banking sector of Pakistan.
In addition to the above standards and amendments, improvements to various accounting standards have also beenissued by the IASB in December 2016. Such improvements are generally effective for accounting periods beginningon or after January 01, 2018 and January 01, 2019. The Group expects that such improvements to the standards willnot have any impact on the Group's consolidated financial statements in the period of initial application.

Annual Report2017
145 146
is fully consolidated from the date on which control is transferred to the Group. The assets and liabilities of subsidiarycompany have been consolidated on a line by line basis based on the financial statements as at December 31, 2017and the carrying value of investments held by the Bank is eliminated against the subsidiary's shareholders’ equity inthese consolidated financial statements. Material intra-group balances and transactions have been eliminated.
The accounting policies adopted by the Group and applied in the preparation of these consolidated financial statementsare set out below:
5.2 Cash and cash equivalents
For the preparation of consolidated cash flow statement, consolidated cash and cash equivalents include cash andbalances with treasury banks and balances with other banks excluding any term deposits with original term of greaterthan three months.
5.3 Repurchase / resale agreements
The Group enters into transactions of repos and reverse repos at contracted rates for a specified period of time.These are recorded as under:
a) Sale of securities under repurchase agreement
Securities sold subject to repurchase agreements (repo) remain on the consolidated statement of financialposition as investments and the counter par ty liability is included in borrowings from financial institutions.The difference between the sale and repurchase price is treated as mark-up / return expense and accruedover the period using the effective interest rate method.
b) Purchase of securities under resale agreement
Securities purchased under agreements for resale (reverse repo) are recorded as lendings to financial institutions.These transactions are accounted for on the settlement date. The difference between the purchase and resaleprice is recognized as mark-up / return income over the period of the agreement using the effective interestrate method.
5.4 Investments
The Group classifies its investments as follows:
a) Held-for-trading
These are securities which are either acquired for generating profit from short-term fluctuations in marketprice, interest rate movements, dealers margin or are securities included in a por tfolio in which a patternof short-term profit taking exists.
b) Held-to-maturity
These are securities with fixed or determinable payments and fixed maturity that the Group has the positiveintent and ability to hold till maturity.
c) Available-for-sale
These are investments which do not fall under the held-for-trading and held to maturity categories.
All purchases and sales of investments that require delivery within the time frame established by regulationsor market convention are recognized at the trade date. Trade date is the date on which the Group commitsto purchase or sell the investment.
Investments other than those categorized as 'held-for-trading' are initially recognized at fair value and includestransaction costs associated with the investment. Investments classified as 'held-for-trading' are initially
Further, following new standards have been issued by IASB which are yet to be notified by the SECP for the purposeof applicability in Pakistan.
4. BASIS OF MEASUREMENT
4.1 Accounting convention
These consolidated financial statements have been prepared under the historical cost convention except for certaininvestments and commitments in respect of foreign exchange contracts and futures contracts which are measuredat fair values, certain employee benefits and certain investments which are measured on present value basis.
Items included in these consolidated financial statements are measured using the currency of the primary economicenvironment in which the Group operates. These consolidated financial statements are presented in Pak Rupee,which is the Group's functional and presentation currency.
4.2 Critical accounting estimates and judgments
The preparation of consolidated financial statements in conformity with approved accounting standards requiresmanagement to make judgments, estimates and assumptions that affect the reported amounts of assets andliabilities and income and expenses. Actual results may differ from these estimates. These estimates and assumptionsare reviewed on an ongoing basis. Revisions to accounting estimates are recognized in the period in which theestimate is revised if the revision affects only that period, or in the period of revision and future periods if therevision affects both current and future periods. In particular, information about significant areas of estimates,uncertainty and critical judgments in applying accounting policies that have the most significant affect on theamounts recognized in the consolidated financial statements are as follows:
i) classification and impairment against investments (notes 5.4 and 9);ii) classification and provision against advances (notes 5.5 and 10);iii) depreciation and amortization / useful lives of operating fixed assets (notes 5.6 and 11); iv) taxation (note 5.8);v) staff retirement and other benefits (note 5.9);vi) fair value of derivatives (note 5.15); andvii) judgements made by management in identification and reporting segment information.
5. SUMMARY OF SIGNIFICANT ACCOUNTING POLICIES
5.1 Basis of consolidation
These consolidated financial statements include the financial statements of the Bank and its subsidiary. Subsidiary isan entity over which the Group has the power to govern the financial and operating policies accompanying ashareholding of more than one half of the voting rights. The existence and effect of potential voting rights that arecurrently exercisable are considered when assessing whether the Group controls another entity. Subsidiary
IASB Effective date (annualStandard periods beginning on or after)
IFRS 14 – Regulatory Deferral Accounts January 01, 2016
IFRS 16 – Leases January 01, 2019
IFRS 17 – Insurance Contracts January 01, 2021

Annual Report2017
147 148
Ijarah Financing
Applying IFAS-2 , assets underlying Ijarah have been carried at cost less accumulated depreciation and impairment, ifany, and are shown under Islamic financing and related assets. Rentals accrued from Ijarah financing net of depreciationcharge are taken to the consolidated profit and loss account. Depreciation on Ijarah assets is charged by applying thestraight line method over the Ijarah period which is from the date of delivery of respective assets to mustajir uptothe date of maturity / termination of Ijarah agreement.
Diminishing Musharakah
In Musharakah based financing, the Group enters into Musharakah for financing an agreed share of fixed assets withits customer and enters into periodic profit payment agreement for the utilization of the Group's Musharakah shareby the customer. Specific and general provisions are made in accordance with the requirement of prudential regulationsand other directives issued by the SBP and charged to consolidated profit and loss account.
5.6 Operating fixed assets and depreciation
a) Property and equipment - owned
Property and equipment are stated at cost less accumulated depreciation and accumulated impairment losses,if any.
Cost includes expenditure that is directly attributable to the acquisition of the asset. Subsequent costs are includedin an asset's carrying amount or recognized as a separate asset as appropriate, only when it is probable thatfuture benefits associated with the item will flow to the Group and the cost of the item can be measured reliably.All other repairs and maintenance expenses are charged to the consolidated profit and loss account as and whenincurred.
Depreciation is charged to the consolidated profit and loss account applying the straight line method at the ratesspecified in note 11 after taking into account residual value, if significant. The residual values, useful lives anddepreciation method are reviewed and adjusted, if appropriate, at each date of consolidated statement of financialposition. Depreciation is charged from the month the assets are available for use while no depreciation is charged in the month in which the assets are disposed off.
Gains or losses on disposal, if any, are recognized in the consolidated profit and loss account in the year in whichthey arise.
b) Capital work-in-progressCapital work-in-progress is stated at cost less accumulated impairment losses, if any. All expenditure connectedwith specific assets incurred during installation and related advances there against, if any, are carried under thishead. These are transferred to specific assets as and when the assets become available for use.
c) Intangible assets
Intangible assets are stated at cost less accumulated amortization and accumulated impairment losses, if any.Amortization is charged to the consolidated profit and loss account applying the straight line method at the ratespecified in note 11 to these consolidated financial statements from the date an intangible asset is available foruse. The useful life and amortization method are reviewed and adjusted, if appropriate, at each date of consolidatedstatement of financial position.
recognized at fair value and transaction costs are expensed in the consolidated profit and loss account.
Quoted securities, other than those classified as held-to-maturity are subsequently stated at fair value.
Investments classified as held-to-maturity are carried at amortized cost. Unquoted equity securities are valued at lowerof cost and break-up value. Break-up value of unquoted equity securities is calculated with reference to the net assetsof the investee company as per the latest available audited financial statements. Investments in other unquoted securitiesare valued at cost less impairment losses, if any.
Unrealized surplus / deficit arising on revaluation of quoted securities classified as 'available-for-sale' is disclosed belowshareholders' equity in the consolidated statement of financial position. Unrealized gain / loss arising on revaluationof quoted securities which are classified as 'held-for-trading' is taken to the consolidated profit and loss account.
Cost of investment is determined on moving average basis.
Impairment
Impairment loss in respect of investments classified as available-for-sale and held-to-maturity is recognized on the basisof management's assessment of objective evidence of impairment as a result of one or more events that may havean impact on the estimated future cash flows of the investments. A significant or prolonged decline in market valueof an equity security is considered as an objective evidence of impairment, significant means 20% decline in marketvalue as compared to cost, rebutted by in certain cases such as material market volatility, uncertainty and other marketimpacting external events, in which cases, a higher percentage is also consider by the management for determinationof what is presumed as significant decline. Provision for diminution in the value of term finance certificates is madeas per the requirements of Prudential Regulations issued by the State Bank of Pakistan. In case of impairment ofavailable-for- sale securities, the cumulative loss that has been recognized directly in the surplus / deficit on revaluationof securities on the consolidated statement of financial position below equity is removed there from and recognizedin the consolidated profit and loss account. For investments classified as held-to-maturity, the impairment loss isrecognized in the consolidated profit and loss account.
Gain or loss on sale of investments is included in the consolidated profit and loss account in the year in which theyarise.
Bai Muajjal
In Bai Muajjal, the Group sells Shariah compliant instruments on credit to other financial institutions. The credit priceis agreed at the time of sale and such proceeds are received at the end of the credit period. The difference betweenthe sale and the credit price is recognized over the credit period and recorded as income.
5.5 Advances
Advances are stated net of provisions for non-performing advances. Specific and general provisions are made basedon appraisal of the loan portfolio that takes into account the requirements of the Prudential Regulations issued bythe State Bank of Pakistan. The provisions against non-performing advances are charged to the consolidated profitand loss account. Advances are written off when there is no realistic prospect of recovery after explicit approval fromthe Board of Directors. The general provision is for the inherent risk of losses which are known from experience tobe present in any loan portfolio

Annual Report2017
149 150
5.7 Impairment of financial assets
The carrying amount of assets is reviewed at each reporting date to determine whether there is any indication ofimpairment of any asset or group of assets. If any such indication exists, the recoverable amount of such assets isestimated and impairment losses are recognized immediately in the consolidated financial statements. The resultingimpairment loss is taken to the consolidated profit and loss account.
5.8 Taxation
Taxation (income tax) expense relates to current and prior years and deferred tax. Income tax expense is recognizedin the consolidated profit and loss account except to the extent that it relates to items recognized directly in equityor in other comprehensive income.
a) Current
Provision for current tax is the tax payable on the expected taxable income for the year using tax rates enacted or substantively enacted at the reporting date and, any adjustment to tax payable relating to prior years, after taking into consideration available tax credits, rebates, tax losses etc.
b) Deferred
Deferred tax is recognized using the balance sheet liability method, providing for temporary differences between the carrying amounts of assets and liabilities for financial reporting purposes and the amounts used for taxation purposes.
Deferred tax is measured at the tax rates that are expected to be applied to the temporary differences when they reverse, based on the laws that have been enacted or substantively enacted by the reporting date.
Deferred tax liabilities are generally recognized for all taxable temporary differences and deferred tax assets arerecognized for all deductible temporary differences and carried forward unused tax losses, to the extent that itis probable that future taxable profit will be available against which the deductible temporary differences andcarried forward unused tax losses can be utilized. Deferred tax assets are reviewed at each reporting date and are reduced to the extent that it is no longer probable that the related tax benefits will be realized.
5.9 Staff retirement and other benefits
a) Defined contribution plan
The Group operates recognized contributory provident fund for all its permanent employees to whichequal contributions at the rate of 10% (2016: 10%) of basic salary are made by both the Group and theemployees. The contr ibutions are recognized as employee benefit expense when they are due.
b) Defined benefit scheme
The Group operates recognized gratuity scheme for all its permanent employees who complete theprescribed eligibility period of service. Provision is made annually to meet the cost of such gratuity benefitson the basis of actuarial recommendations using the Projected Unit Credit Method.
c) Compensated absences
The Group makes provision in the consolidated financial statements for its liabilities towards compensatedabsences. Liability under the scheme is determined on the basis of actuarial advice using the Projected UnitCredit Method.
5.10 Provisions against liabilities
Provisions are recognized when the Group has a legal or constructive obligation as a result of past events andit is probable that an outflow of resources will be required to settle the obligation and a reliable estimate of theamount can be made. Provisions are reviewed at each date of consolidated statement of financial position andare adjusted to reflect the current best estimate.
5.11 Borrowings / deposits and their cost
Borrowings / deposits are recorded at the proceeds received. Borrowing / deposit costs are recognized as an expensein the period in which these are incurred using the effective mark-up / interest rate method.
5.12 Proposed dividend and transfers between reserves
Dividends and appropriations to reserves, except appropriations which are required by law, made subsequent to thedate of consolidated statement of financial position are considered as non-adjusting events and are recorded in theconsolidated financial statements in accordance with the requirements of International Accounting Standard (IAS)10, 'Events after the Balance Sheet Date' in the period in which they are approved / transfers are made.
5.13 Revenue recognition
5.13.1 Mark-up /return / interest on loans and advances and return on investments are recognized on a time proportionbasis using the effective interest rate method except that mark-up / return / interest on non-performing advancesand investments is recognized on receipt basis, in accordance with the requirements of the Prudential Regulationsissued by the SBP. Where debt securities are purchased at a premium or discount, such premium or discountis amor tized through the consolidated profit and loss account over the remaining period till maturity.
5.13.2 Dividend income from investments is recognized when the Group's right to receive the dividend is established.
5.13.3 Fees, brokerage and commission on letters of credit / guarantees and others is recognized on time proportion basis.
5.13.4 Financial advisory fees is recognized when the right to receive the fees is established.
5.13.5 Gain or loss on sale of investments is included in consolidated profit and loss account in the year in which they arise.
5.13.6 Rentals from Ijarah are recognized as income over the term of the contract net of depreciation expense.
5.13.7 Profit on Diminishing Musharakah is recognized in consolidated profit and loss account on accrual basis.
5.14 Foreign currency translation
Transactions in foreign currencies are translated into Pak Rupees at the exchange rates prevailing at the transactiondate. Monetary assets and liabilities denominated in foreign currencies are re-translated to Pak Rupee at the ratesof exchange prevailing at the reporting date. Translation gains and losses are included in the consolidated profit andloss account.
5.15 Financial instruments
a) Financial assets and liabilities
Financial assets and liabilities carried on the consolidated statement of financial position include cash and bankbalances, lendings to financial institutions, investments, advances, certain receivables, bills payable, borrowings

Annual Report2017
151 152
from financial institutions, deposits, subordinated loans and certain payables. The particular recognition methodsadopted for significant financial assets and financial liabilities are disclosed in the individual policy notes associatedwith them.
b) Derivative financial instruments
Derivative financial instruments are initially recognized at fair value on the date at which the derivative contractis entered into and subsequently remeasured at fair value using appropriate valuation techniques. All derivativefinancial instruments are carried as assets where fair value is positive and as liabilities where fair value is negative.Any changes in the fair value of derivative financial instruments are taken to consolidated profit and loss account.
5.16 Offsetting
Financial assets and financial liabilities are set off and the net amount is reported in the consolidated financialstatements only when the Group has a legally enforceable right to set off and the Group intends to either settleon a net basis, or to realize the assets and to settle the liabilities simultaneously.
5.17 Segment reporting
A segment is a distinguishable component of the Group that is engaged either in providing particular productsor services (business segment), or in providing products or services within a particular economic environment(geographical segment), and is subject to risks and rewards that are different from those of other segments.
5.18 Dividend distribution and appropriation
Dividends and other appropriations (except appropriations which are required by law) are recognized in the periodin which these are approved.
5.19 Earnings per share
The Group presents basic earnings per share (EPS) which is calculated by dividing the profit or loss attributable toordinary shareholders of the Group by the weighted average number of ordinary shares outstanding during the year/ period. Diluted EPS is determined by adjusting the consolidated profit or loss attributable to ordinary shareholdersand the weighted average number of ordinary shares outstanding adjusted for the effects of all dilutive potentialordinary shares, if any.
5.20 Acceptances
Acceptances comprise of undertakings made by the Group to pay bills of exchange drawn on customers. The Groupexpects most acceptances to be simultaneously settled with reimbursement from the customers. Acceptances areaccounted for as off balance sheet transactions and are disclosed as contingent liabilities and commitments.
5.21 Business segments
a) Corporate finance
This includes investment banking activities such as mergers and acquisitions, underwriting, privatization, securitization,Initial Public Offerings (IPOs) and secondary private placements.
b) Trading and sales
It includes fixed income, equity, foreign exchanges, commodities, credit, funding, own position securities, lendingsand repos, brokerage debt and prime brokerage.
c) Retail banking
It includes mortgage finance and personal loans to individual customers.
d) Commercial banking and others
It includes loans, deposits and other transactions with corporates, small and medium sized customers including agriculture loans.
Geographical segments
The Group operates only in Pakistan.
5.22 Commitments
Commitments for outstanding forward foreign exchange contracts are disclosed in these consolidated financialstatements at committed amounts. Contingent liabilities / commitments for letters of credit and letters of guaranteedenominated in foreign currencies are expressed in Pak Rupee terms at the rates of exchange prevailing at the dateof the consolidated statement of financial position.
5.23 Provision against off-balance sheet obligations
Provision for guarantees, claims and other off balance sheet obligations is made when the Group has legal or constructiveobligation as a result of past events and it is probable that an outflow of resources will be required to settle theobligation and a reliable estimate of amount can be made. Charge to consolidated profit and loss account is statednet of expected recoveries.
6. CASH AND BALANCES WITH TREASURY BANKS
In handLocal currency 6.1 2,226,583 1,873,185Foreign currency 181,013 77,766
2,407,596 1,950,951With State Bank of Pakistan (SBP) inLocal currency current accounts 6.2 6,024,930 4,510,719Foreign currency current accounts 6.3 51,816 5,156Foreign currency deposit accounts- Non Remunerative 6.4 83,421 62,289- Remunerative 6.5 230,932 168,666
6,391,099 4,746,830With National Bank of Pakistan inLocal currency current account 863,596 788,106Local currency Profit and loss (PLS) account 18,340 16,737
881,936 804,843 9,680,631 7,502,624
2017 2016Note (Rupees in '000)

Annual Report2017
153 154
6.1 This includes national prize bonds of Rs.3.13 (2016: Rs.1.03) million.
6.2 This represents the cash reserve required to be maintained with SBP as per the requirement of Section 22 of theBanking Companies Ordinance, 1962 and regulation R-3A of the Prudential Regulations, as applicable to the subsidiary.This is a sum not less than such percentage of Group's time and demand liabilities in Pakistan as may be prescribedby the SBP.
6.3 This represents US Dollar Settlement Account maintained with SBP.
6.4 This represents Foreign Currency (FCY) cash reserve maintained with SBP to comply with statutory reserve requirementapplicable to Group's FCY deposits.
6.5 This represents foreign currency special cash reserve maintained with SBP, The Group is entitled to earn profit whichis declared by SBP on a monthly basis. During the period, SBP has declared profits in the range of 0.06 % to 0.37 %(2016: Nil) per annum.
7. BALANCES WITH OTHER BANKS
In PakistanIn current accounts 56,460 15,016In saving accounts 7.1 35,473 90,746In term deposit accounts 7.2 2,600,000 600,000
Outside PakistanIn current accounts 7.3 751,056 485,716
3,442,989 1,191,478
2017 2016Note (Rupees in '000)
7.1 This includes saving deposits with a commercial bank carrying profit at the rate of 3.75% (2016: 3.75 to 3.85%) perannum.
7.2 This represents term deposit account with a commercial banks and microfinance banks for maturity from 3 monthsto 1 year (2016: 3 months) carrying mark-up ranging from 6.76% to 11.25% (2016: 6.95% to 11.25%) per annum.
7.3 This includes Rs.521.74 (2016: Rs.201.87) million held in Automated Investment Plans. This balance is current in natureand in case this balance goes above a specified amount, the Group is entitled to earn interest from the correspondentbanks at the agreed rates.
8. LENDINGS TO FINANCIAL INSTITUTIONS
Call money lendings - 2,000,000Bai Muajjal 8.2 364,577 -Repurchase agreement lendings (reverse repo) 8.3 & 8.4 4,966,750 4,938,610
5,331,327 6,938,610
8.1 Particulars of lendings - by currencyLocal currency 5,331,327 6,938,610Foreign currency - -
5,331,327 6,938,610
2017 2016Note (Rupees in '000)
Market Treasury Bills 4,974,450 - 4,974,450 - 4,940,415 4,940,415
Available-for-sale securities
Pakistan Investment Bonds 9.2.1 17,774,769 20,970,031 38,744,800 49,193,663 - 49,193,663Market Treasury Bills 9.2.2 21,810,464 30,325,395 52,135,859 8,233,454 1,249,209 9,482,663Fully paid ordinary shares - listed 9.2.6 3,476,796 - 3,476,796 2,235,424 - 2,235,424Term finance certificates - listed 9.2.9 99,840 - 99,840 99,880 - 99,880Term finance certificates - unlisted 9.2.10 - - - 12,527 - 12,527Units of mutual funds 9.2.11 613,493 - 613,493 613,533 - 613,533Islamic funds REIT 9.2.12 99,000 - 99,000 99,000 - 99,000Government of Pakistan - Ijarah
Sukuk 9.2.5 952,926 - 952,926 200,000 - 200,000Sukuk certificates 9.2.3 &
9.2.4 385,714 - 385,714 482,143 - 482,143 45,213,002 51,295,426 96,508,428 61,169,624 1,249,209 62,418,833
Held-to-maturity securitiesPakistan Investment Bonds 9.2.1 16,846,115 - 16,846,115 7,458,429 - 7,458,429Government of Pakistan - Ijarah
Sukuk 9.2.5 - - - 239,729 - 239,729Preference shares - listed 9.2.7 - - - 249,961 - 249,961Preference shares - unlisted 9.2.8 61,305 - 61,305 - - -Term finance certificates - listed 9.2.9 224,287 - 224,287 224,392 - 224,392Certificate of deposit - - - 100,000 - 100,000Term finance certificates - Unlisted 9.2.10 754,686 - 754,686 - - -
17,886,393 - 17,886,393 8,272,511 - 8,272,511
Total investments at cost 63,099,395 51,295,426 114,394,821 69,442,135 1,249,209 70,691,344Less: Provision for diminution in
value of investments 9.3 (7,810) - (7,810) (7,810) - (7,810)
Investments (net of provisions) 63,091,585 51,295,426 114,387,011 69,434,325 1,249,209 70,683,534(Deficit) / surplus on revaluation of
available-for-sale securities 19 (686,688) (190,421) (877,109) 206,208 (5) 206,203
Total investments at market value- net of provisions 62,404,897 51,105,005 113,509,902 69,640,533 1,249,204 70,889,737
Held byGroup
2017Furthergiven as
collateral
TotalHeld byGroup
2016Furthergiven ascollateral
Total
-------------------------- (Rupees in '000) ----------------------------
9.1 Investments by types Held byGroup
2017Given ascollateral
TotalHeld byGroup
2016Given ascollateral
Total
-------------------------- (Rupees in '000) ----------------------------
9. INVESTMENTS - NET
Note
8.2 This represents outright purchase of Government Ijarah Sukuk from SBP on deferred payment basis (Bai-Muajjal),at a return of 5.27% (2016: Nil) per annum maturing on June 21, 2018 (2016: Nil).
8.3 This represents resale agreement lending with a commercial bank carrying mark-up at a rate of 5.78%(2016: 5.80%) per annum maturing on January 05, 2018 (2016: January 03, 2017).
8.4 Securities held as collateral againstlendings to financial institutions

Annual Report2017
155 156
9.2 Investments by segment
Federal Government SecuritiesPakistan Investment Bonds 9.2.1 55,590,915 56,652,092Market Treasury Bills 9.2.2 52,135,859 9,482,663Sukuk certificates 9.2.3 242,857 303,572Government of Pakistan - Ijarah Sukuk 9.2.5 952,926 439,729
108,922,557 66,878,056Fully paid-up ordinary sharesListed companies 9.2.6 3,476,796 2,235,424
Preference sharesListed 9.2.7 - 249,961Unlisted 9.2.8 61,305 -
61,305 249,961Term finance certificatesListed 9.2.9 324,127 324,272Unlisted 9.2.10 754,686 12,527
1,078,813 336,799Other investmentsUnits of mutual funds 9.2.11 613,493 613,533Islamic funds REIT 9.2.12 99,000 99,000Sukuk certificates 9.2.4 142,857 178,571Certificate of deposit - 100,000
855,350 991,104
Total investments at cost 114,394,821 70,691,344
Provision for diminution in value of investments 9.3 (7,810) (7,810)
Investments (net of provisions) 114,387,011 70,683,534
(Deficit) / surplus on revaluation of available-for-sale securities 19 (877,109) 206,203
Total investments at market value - net of provisions 113,509,902 70,889,737
9.2.1 These securities have tenure of 10 to 20 (2016: 10 to 20) years. The effective yield on these investments ranges from6.92% to 12.94% (2016: 6.92% to 12.98%) per annum with maturities from August 2021 to August 2031 (2016: August2021 to August 2031).
9.2.2 These securities are for a maximum period of 3 months (2016: 6 months). The effective yield on these investmentsranges from 5.98% to 6.14% (2016: 5.78% to 5.90%) per annum with maturities from 1 months to 2 months (2016:1 months to 2 months).
9.2.3 This represents investment in sukuk certificates of WAPDA maturing on October 14, 2021 and carries profit at therate 6M KIBOR plus 1.00% (2016: 6M KIBOR plus 1.00%) per annum payable semi annually.
9.2.4 This represents investment in privately placed sukuk certificate of AL Baraka Bank Pakistan Limited maturing onSeptember 26, 2021 and carries profit at the rate 6M KIBOR plus 1.25% (2016: 6M KIBOR plus 1.25%) per annum,payable semi-annually.
9.2.5 This represents investment in Ijarah Sukuk of Government of Pakistan (GoP) having maturities from December 2018to June 2020 (2016: December 2018) and carry profit at the rates ranging from 5.24% to 6.10% (2016: 3.98% to5.45%) per annum.
2017 2016Note (Rupees in '000)
9.2.7 Details of investments in preference shares - listed
Held to maturity securitiesSummit Bank Limited - - - - A/A-1 24,996,067 249,961 249,961
9.2.6 Details of investment in shares of listed companies
2017 2016
--------------------------------------(Rupees in '000)--------------------------------------
Rating Number ofshares
Marketvalue Cost Rating Number of
shares Marketvalue Cost
Available-for-sale securitiesFully paid ordinary shares of Rs.10 each
(unless stated otherwise)Pakistan Refinery Limited A-/A2 108,100 3,803 7,682 A-/A2 108,100 4,716 7,682Fauji Fertilizer Company Limited AA/A1+ 3,775,700 298,696 387,761 AA/A1+ 3,701,600 386,336 479,074Fauji Fertilizer Bin Qasim Limited Unrated 7,318,000 260,082 362,224 Unrated 3,018,000 154,552 188,364Fatima Fertilizer Company Limited AA-/A1+ 1,591,500 49,146 65,002 AA-/A1+ 1,541,500 56,866 63,357Amreli Steels Limited - - - - A/A1 50,000 3,330 2,531Crescent Steel & Allied Products Limited - - - - A+/A-1 50,000 7,709 6,042Mughal Iron & Steel Industries Limited - - - - Unrated 150,000 13,224 10,651Thatta Cement Company Limited A-/A-2 3,375,000 74,250 102,852 A-/A-2 3,375,000 132,908 121,703Nishat Chunian Power Limited Unrated 3,950,500 130,011 176,658 A+/A-2 1,741,500 96,618 100,011Hub Power Company Limited AA+/A1+ 445,000 40,495 57,071 AA+/A1+ 445,000 54,949 57,071Sui Southern Gas Company Limited A+/A1 11,296,500 344,430 484,566 A+/A1 11,296,500 410,628 447,043Sui Northern Gas Pipelines Limited AA-/A1 2,728,800 258,172 361,177 AA-/A1 4,532,500 369,716 369,798Pakistan Stock Exchange Unrated 17,692,319 396,308 495,385 - - - -Silk Bank Limited A-/A-2 31,962,500 50,501 58,517 - - - -Bank Al-Falah Limited - - - - AA/A1+ 1,110,000 42,136 31,201National Bank of Pakistan AAA/A1+ 7,161,000 347,738 483,610 AAA/A1+ 3,265,500 244,553 243,993NIB Bank Limited - - - - AA-/A1+ 28,394,500 51,394 60,264MCB Bank Limited AAA/A1+ 470,530 99,903 128,782 - - - -Summit Bank Limited A-/A-1 82,427,063 228,323 305,509 A/A-1 11,546,585 50,805 46,639Total investment in shares of
listed companies 2,581,858 3,476,796 2,080,440 2,235,424
2017 2016
Rating Number ofshares
Marketvalue
Amortized cost Rating Number of
shares Marketvalue
Amortized cost
----- (Rupees in '000) ---- ----- (Rupees in '000) ----
9.2.8 Details of investments in preference shares - unlisted
Held to maturity securitiesAl-Arabia Sugar Mills Limited Unrated 6,130,480 61,305 61,305 - - - -
9.2.9 Details of investment in term finance certificates - listed
2017 2016
Rating Number ofshares
Marketvalue
Amortized cost Rating Number of
shares Marketvalue
Amortized cost
----- (Rupees in '000) ----- ----- (Rupees in '000) -----
Unsecured
Available-for-sale securitiesNIB Bank Limited - - - - - A+ 20,000 5,000 101,014 99,880MCB Bank Limited 9.2.9.1 AAA 20,000 5,000 101,393 99,840 - - - - -
Held-to-maturity securitiesSummit Bank Limited 9.2.9.1 A- (SO) 44,982 5,000 224,287 224,287 A (SO) 44,982 5,000 224,392 224,392
325,680 324,127 325,406 324,272
Rating Number ofcertificates
Face value per
certificateMarket value Cost Rating Number of
certificates
Face value per
certificateMarket value Cost
----- (Rupees in '000) ---- ----- (Rupees in '000) ----
2017 2016
Note

Annual Report2017
157 158
Available for sale securitiesOpen endNational Investment Unit Trust AM2++ 5,594,093 394,775 500,000 AM2+ 5,892,058 515,791 500,000
Closed endPICIC Growth Fund AM2 1,049,500 29,753 28,459 AM2 1,049,500 31,968 28,459PICIC Investment Fund AM2 6,343,500 84,686 85,034 AM2 6,346,500 88,216 85,074
114,439 113,493 120,184 113,533
Total investments in mutual funds 509,214 613,493 635,975 613,533
----- (Rupees in '000) ---- ----- (Rupees in '000) ----
Rating Number ofunits
Market/net asset
value Cost
2017 2016
Rating Number ofunits
Market/net asset
value Cost
9.2.11 Details of investments in mutual funds
9.2.10 Details of investment in term finance certificates - unlisted
Held-to-maturity securities NoteAl-Arabia Sugar Mills Limited -
1st issue Unrated 105,937 5,000 529,686 529,686 - - - - -Silk Bank Limited - 1st issue 9.2.10.1 A- 45,000 5,000 225,000 225,000 - - - - -
Available-for-sale securitiesFaysal Bank Limited -
2nd issue - - - - - AA- 5,000 5,000 12,628 12,527 754,686 754,686 12,628 12,527
Rating Number ofcertificates
Paid-upvalue percertificate
Market value Cost Rating Number ofcertificates
Paid-upvalue percertificate
Market value Cost
----- (Rupees in '000) ---- ----- (Rupees in '000) ----
2017 2016
9.2.10.1These term finance cer tificates are sub-ordinated in nature. In case of default, the payment in respect ofprincipal and profit will rank subordinated to all the depositors and other creditors of the issuing banks.
9.2.10.2Other particulars of un-listed term finance certificates are as follows:
Particulars Coupon / Profit rates Profit payment Maturity
Al-Arabia Sugar Mills Limited 6M KIBOR plus 0.20% Semi-annually December 30, 2026 (inclusive 1.5 yearsgrace period)Silk Bank Limited 6M KIBOR plus 1.85% Semi-annually August 10, 2025
9.2.9.1 These term finance certificates are sub-ordinated in nature. In case of default, the payment in respect of principal and profitwill rank subordinated to all the depositors and other creditors of the issuing banks.
9.2.9.2 Other particulars of listed term finance certificates are as follows:
Particulars Coupon / Profit rates Profit payment MaturityMCB Bank Limited (Formerly NIB Bank Limited) - second issue (unsecured) 6M KIBOR plus 1.15% Semi-annually June 19, 2022
Summit Bank Limited (unsecured) 6M KIBOR plus 3.25% Semi-annually October 27, 2018
9.2.12 Details of investments in Islamic funds
Arif Habib Dolmen (REIT) RR1 9,000,000 99,000 99,000 AM2- 9,000,000 96,570 99,000
2017 2016Note (Rupees in '000)
9.3 Particulars of provision for diminution in the value ofinvestments - net
2017 2016Note (Rupees in '000)
Opening balance 7,810 490Charge for the year - through other comprehensive income - 7,320Closing balance 9.4.1 7,810 7,810
9.3.1 Particulars of provision by type and segmentAvailable-for-sale securitiesShares of listed companies 7,810 7,810
10. ADVANCES - NET
Loans, cash credits, agriculture, running finances etc.- In Pakistan 54,706,297 47,237,793Commodity finance- In Pakistan 10.2 11,552,078 6,245,905Islamic financing and related assets- Diminishing musharakah financing 10.3 2,187,739 2,075,944- Ijarah financing 10.4 103,583 74,647
68,549,697 55,634,289Bills discounted and purchased (excluding market treasury bills)- Payable in Pakistan 794,124 404,430- Payable outside Pakistan 110,154 10,204
904,278 414,634Advances - gross 10.1 69,453,975 56,048,923Provision for non-performing advances - Specific provision 10.5 (397,624) (143,034) - General provision against consumer
and small enterprise advances 10.5.3.2 (4,621) (4,051) - General provision 10.5.3.1 (4,000,000) (4,000,000)
(4,402,245) (4,147,085)Advances - net 65,051,730 51,901,838
10.1 Particulars of advances - gross
10.1.1 In local currency 10.1.2 69,453,975 56,048,923In foreign currency - -
69,453,975 56,048,923
10.1.2 Short term (for upto one year) 39,655,722 28,576,547Long term (for more than one year) 29,798,253 27,472,376
69,453,975 56,048,923
10.2 This represents commodity financing provided to Food Department, Government of Sindh, in syndication withother commercial banks.
10.3 Diminishing musharakah financingDiminishing musharakah 2,187,739 2,075,944
10.4 Ijarah financingNet book value of assets 10.4.1 86,279 50,732Advance against Ijarah financing 17,304 23,915
103,583 74,647

Annual Report2017
159 160
10.5.3.1 In line with prudent policies, the Group has made general provision against its loans and advances portfolio. This general provisionis in addition to the requirements of the Prudential Regulations in relation to objective basis of provisioning.
10.5.3.2 General provision against consumer loans represents provision maintained at an amount equal to 1% (2016: 1%) ofthe fully secured performing portfolio and 4% (2016: 4%) of the unsecured performing portfolio as required by the PrudentialRegulations issued by SBP. General provision against Small Enterprise Financing represents provision maintained at an amountequal to 0% (2016: 1%) of the fully secured performing portfolio and 1% of the unsecured performing portfolio as requiredby the Prudential Regulations issued by SBP.
10.6 Particulars of loans and advances to directors, executives / officersassociated companies, subsidiaries etc.
Debts due by directors, executives or officers of the Bank or anyof them either severally or jointly with any other persons:Balance at beginning of the year 396,663 278,549Loans granted during the year 180,005 225,376Repayments made during the year (119,379) (107,262)Balance at end of the year 10.6.1 457,289 396,663
Debts due by companies or firms in which the directors of the Bankare interested as directors, partners or in the case of private companiesas members:Balance at beginning of the year 234,375 296,875Loans granted during the year 743,253 -Repayments made during the year (698,117) (62,500)Balance at end of the year 10.6.2 279,511 234,375
736,800 631,038
10.6.1 This represents staff loans given by the group to its executives / officers as per their terms of employment.
10.6.2 This includes balance of loan outstanding of entities where more than 20% equity was acquired by the Governmentof Sindh.
2017 2016Note (Rupees in '000)
2017 2016Note Specific General Total Specific General Total
Opening balance 143,034 4,004,051 4,147,085 37,420 2,501,523 2,538,943Charge for the year- Specific provision 263,199 - 263,199 105,614 - 105,614- General provision 10.5.3.1 - - - - 1,500,000 1,500,000- General provision
against consumerand small enterpriseadvances - net 10.5.3.2 - 2,726 2,726 - 2,528 2,528
Reversals (8,609) (2,156) (10,765) - - -Net charge 254,590 570 255,160 105,614 1,502,528 1,608,142Amount written off - - - - - -Closing balance 397,624 4,004,621 4,402,245 143,034 4,004,051 4,147,085
--------------------------- (Rupees '000) -------------------------
10.5.3 Particulars of provision against non-performing advances
-------------------------------- (Rupees '000) -----------------------------
Cost Accumulated DepreciationAs at
January01
As atDecember
31
As atJanuary
01Charge
As atDecember
31
BookValue As atDecember
31
Rate ofdepreciation
(%)
201710.4.1 Particulars of assets under Ijarah
Vehicle 33,455 56,701 90,156 8,848 14,874 23,722 66,434 Over thePlant and machinery 27,605 - 27,605 1,480 6,280 7,760 19,845 Ijarah Total 61,060 56,701 117,761 10,328 21,154 31,482 86,279 period
-------------------------------- (Rupees '000) -----------------------------
Cost Accumulated DepreciationAs at
January01
As atDecember
31
As atJanuary
01Charge
As atDecember
31
BookValue As atDecember
31
Rate ofdepreciation
(%)
2016
Vehicle 15,724 17,731 33,455 1,808 7,040 8,848 24,607 Over thePlant and machinery - 27,605 27,605 - 1,480 1,480 26,125 IjarahTotal 15,724 45,336 61,060 1,808 8,520 10,328 50,732 period
10.4.2 Future Ijarah payments receivableNot later than one year 27,378 14,028Later than one year and not later than five years 58,901 36,704
86,279 50,732
10.5 Advances include Rs.5,462.16 (2016: Rs.1,569.38) million which have been placed under non-performing status asdetailed below:
2017 2016
Category of classification
NoteOther Assets Especially
Mentioned (OAEM) 10.5.1 75,652 - 75,652 - - 77,514 - 77,514 - -Substandard 2,775,339 - 2,775,339 54,265 54,265 727,957 - 727,957 4,878 4,878Doubtful 900,000 - 900,000 3,884 3,884 139,090 - 139,090 20,291 20,291Loss 1,711,164 - 1,711,164 339,475 339,475 624,814 - 624,814 117,865 117,865
5,462,155 - 5,462,155 397,624 397,624 1,569,375 - 1,569,375 143,034 143,034
--------------- (Rupees '000) ---------------
Classified AdvancesDomestic Overseas Total
Provision ProvisionRequired Held
--------------- (Rupees '000) ---------------
2017 2016Note (Rupees in '000)
10.5.1 This represents non-performing portfolio of agricultural and small and medium enterprise financing classified asOAEM as per the requirements of the Prudential Regulations for Agricultural and Small and Medium EnterpriseFinancing issued by the State Bank of Pakistan.
10.5.2 The Group has availed the benefit of forced sale value (FSV) on plant and machinery under charge and mortgagedresidential and commercial property (land and building only) held as collateral against non-performing advanceson the basis of instructions of State Bank of Pakistan. Had the benefit not been taken by the Group, specific provisionagainst non-performing advances would have been higher by Rs.2,453.26 (2016: Rs.727.25) million. The resultantincrease in profit due to FSV benefit taken will not be available for distribution as cash and stock dividend toshareholders.
Additions
Additions
Classified AdvancesDomestic Overseas Total
Provision ProvisionRequired Held

Annual Report2017
161 162
Capital work-in-progress 11.1 24,481 31,064Property and equipment 11.2 1,577,352 1,734,129Intangible assets 11.3 61,607 67,689
1,663,440 1,832,882
2017 2016Note (Rupees in '000)
Leasehold improvements 1,014,844 25,204 1,040,048 140,122 51,114 191,236 848,812 5 - -
Furniture and fixtures 449,559 23,873 473,432 137,778 46,410 184,188 289,244 10 - -
Computer and office 1,080,063 190,589 1,269,145 579,640 227,862 806,277 462,868 33.33 & 20equipment (1,507) (1,225)
Vehicles 215,120 104,903 265,194 124,931 49,829 131,989 133,205 20(54,829) (42,771)
2,759,586 344,569 3,047,819 982,471 375,215 1,313,690 1,734,129 (56,336) (43,996)
------------------------------------------------------------ (Rupees in '000) ------------------------------------------------------------
As atJanuary 01
Additions /(disposals)
As atDecember 31
As atJanuary 01
Charge forthe year /
(disposals) /
As atDecember 31
Book valueas at
December 31
Rate ofdepreciation
%
2016Cost Accumulated depreciation
Leasehold improvements 1,040,048 88,110 1,128,158 191,236 53,060 244,296 883,862 5 - -
Furniture and fixtures 473,432 19,052 492,188 184,188 47,832 231,895 260,293 10 (296) (125)
Computer and office 1,269,145 42,649 1,309,335 806,277 203,673 1,007,957 301,378 33.33 & 20equipment (2,459) (1,993)
Vehicles 265,195 50,737 288,474 131,989 49,537 156,655 131,819 20 (27,458) (24,871)
3,047,820 200,548 3,218,155 1,313,690 354,102 1,640,803 1,577,352 (30,213) (26,989)
------------------------------------------------------------ (Rupees in '000) ------------------------------------------------------------
As atJanuary 01
Additions /(disposals)
As atDecember 31
As atJanuary 01
Charge forthe year /
(disposals) /
As atDecember 31
Book valueas at
December 31
Rate ofdepreciation
%
2017Cost Accumulated depreciation
11.2 Property and equipment - owned
11.2.1The cost of fully depreciated furniture and fixture, office and computer equipment still in use amounted toRs.678.87 (2016: Rs.328.19) million.
11.1 This represents advance payment for purchase of software, furniture and fixture, office equipment and vehicles.
11. OPERATING FIXED ASSETS
As atJanuary 01,
AdditionsAs at
December 31,As at
January 01,Amortizationfor the year
As atDecember 31,
Book valueas at
December 31,
Rate ofamortization
%
2017Cost Accumulated amortization
Software 188,552 22,912 211,464 120,863 28,994 149,857 61,607 20
188,552 22,912 211,464 120,863 28,994 149,857 61,607
------------------------------------------------------------ (Rupees in '000) ------------------------------------------------------------
11.3 Intangible assets
11.4 Disposals
Details of disposal of fixed assets having cost of more than Rs.1,000,000 or net book value of Rs.250,000 or aboveare given below:
VehicleHonda Civic 1,794 1,794 - - As per Group Policy Mr. Saeeduddin KhanToyota Corolla XLI 1,628 895 733 - As per Group Policy Mr. Fazal Ellahi (Late)Toyota Corolla XLI 1,357 1,357 - 1,357 As per Group Policy Mr. Syed Farrukh RazaSuzuki Mehran 678 181 497 625 Insurance Claim Sindh Insurance Co LtdSuzuki Mehran 673 314 359 471 As per Bid Mr. Rana Abdul SamadSuzuki Cultus VXR 1,099 348 751 769 As per Group Policy Mr. Arshad HussainAggregate of disposals As per Group Policy/Bid Various not meeting criteria 20,229 19,982 247 1,623
27,458 24,871 2,587 4,845
Office equipmentAggregate of
disposals notmeeting criteria 2,394 1,946 448 421 Various Various
ComputersAggregate of disposals
not meeting criteria 65 47 18 19 Various Various
Furniture and fixturesAggregate of disposals
not meeting criteria 296 125 171 171 Various Various
December 31, 2017 30,213 26,989 3,224 5,456
December 31, 2016 56,336 43,997 12,339 16,485
As atJanuary 01,
As atDecember 31,
As atJanuary 01,
Amortizationfor the year
As atDecember 31,
Book valueas at
December 31,
Rate ofamortization
%
2016Cost Accumulated amortization
Software 163,317 25,235 188,552 90,759 30,104 120,863 67,689 20
163,317 25,235 188,552 90,759 30,104 120,863 67,689
------------------------------------------------------------ (Rupees in '000) ------------------------------------------------------------
Additions
-------------- Rupees in '000 --------------
CostAccumulateddepreciation
Bookvalue
Saleproceeds
Mode ofdisposal
Particulars of buyers
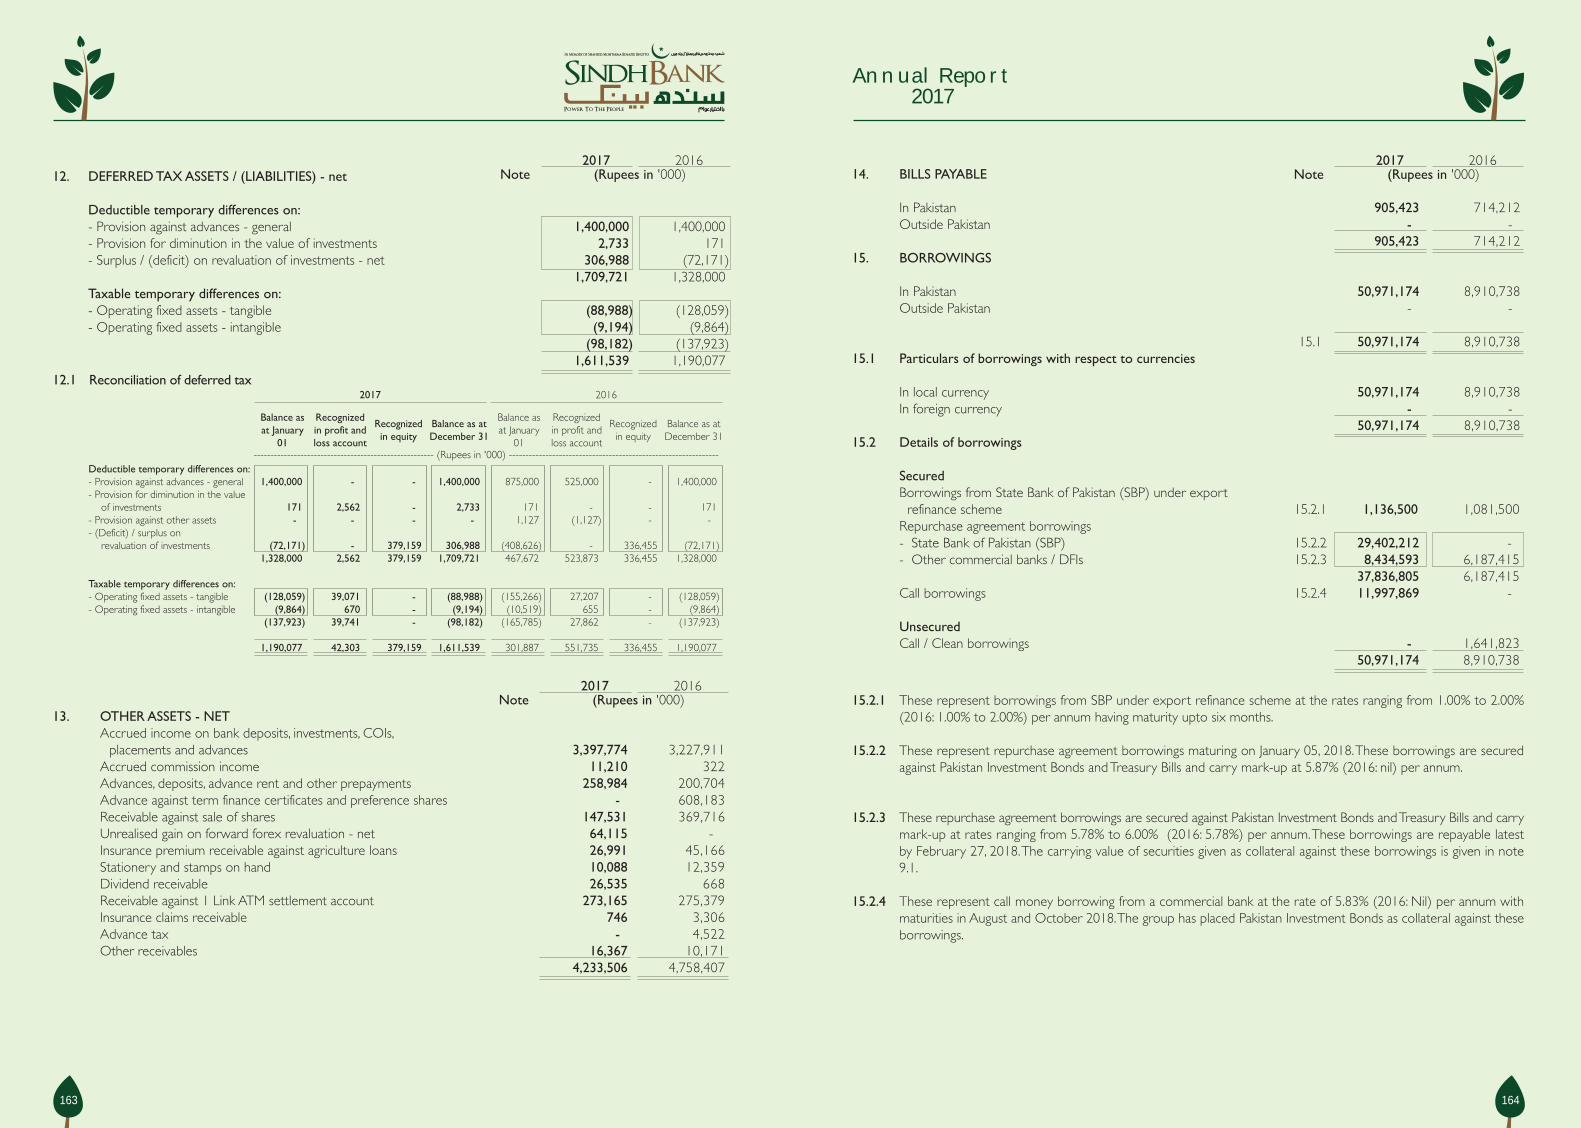
Annual Report2017
163 164
12. DEFERRED TAX ASSETS / (LIABILITIES) - net
Deductible temporary differences on:- Provision against advances - general 1,400,000 1,400,000- Provision for diminution in the value of investments 2,733 171- Surplus / (deficit) on revaluation of investments - net 306,988 (72,171)
1,709,721 1,328,000Taxable temporary differences on:- Operating fixed assets - tangible (88,988) (128,059)- Operating fixed assets - intangible (9,194) (9,864)
(98,182) (137,923) 1,611,539 1,190,077
12.1 Reconciliation of deferred tax
Balance asat January
01
Recognizedin profit andloss account
Recognizedin equity
Balance as atDecember 31
Balance asat January
01
Recognizedin profit andloss account
Recognizedin equity
Balance as atDecember 31
------------------------------------------------------ (Rupees in '000) ---------------------------------------------------------------Deductible temporary differences on:- Provision against advances - general 1,400,000 - - 1,400,000 875,000 525,000 - 1,400,000- Provision for diminution in the value
of investments 171 2,562 - 2,733 171 - - 171- Provision against other assets - - - - 1,127 (1,127) - -- (Deficit) / surplus on
revaluation of investments (72,171) - 379,159 306,988 (408,626) - 336,455 (72,171) 1,328,000 2,562 379,159 1,709,721 467,672 523,873 336,455 1,328,000
Taxable temporary differences on:- Operating fixed assets - tangible (128,059) 39,071 - (88,988) (155,266) 27,207 - (128,059)- Operating fixed assets - intangible (9,864) 670 - (9,194) (10,519) 655 - (9,864)
(137,923) 39,741 - (98,182) (165,785) 27,862 - (137,923)
1,190,077 42,303 379,159 1,611,539 301,887 551,735 336,455 1,190,077
2017 2016
13. OTHER ASSETS - NETAccrued income on bank deposits, investments, COIs,
placements and advances 3,397,774 3,227,911Accrued commission income 11,210 322Advances, deposits, advance rent and other prepayments 258,984 200,704Advance against term finance certificates and preference shares - 608,183Receivable against sale of shares 147,531 369,716Unrealised gain on forward forex revaluation - net 64,115 -Insurance premium receivable against agriculture loans 26,991 45,166Stationery and stamps on hand 10,088 12,359Dividend receivable 26,535 668Receivable against 1 Link ATM settlement account 273,165 275,379Insurance claims receivable 746 3,306Advance tax - 4,522Other receivables 16,367 10,171
4,233,506 4,758,407
2017 2016Note (Rupees in '000)
2017 2016Note (Rupees in '000) 14. BILLS PAYABLE
In Pakistan 905,423 714,212Outside Pakistan - -
905,423 714,21215. BORROWINGS
In Pakistan 50,971,174 8,910,738Outside Pakistan - -
15.1 50,971,174 8,910,73815.1 Particulars of borrowings with respect to currencies
In local currency 50,971,174 8,910,738In foreign currency - -
50,971,174 8,910,73815.2 Details of borrowings
SecuredBorrowings from State Bank of Pakistan (SBP) under export
refinance scheme 15.2.1 1,136,500 1,081,500Repurchase agreement borrowings- State Bank of Pakistan (SBP) 15.2.2 29,402,212 -- Other commercial banks / DFIs 15.2.3 8,434,593 6,187,415
37,836,805 6,187,415Call borrowings 15.2.4 11,997,869 -
UnsecuredCall / Clean borrowings - 1,641,823
50,971,174 8,910,738
2017 2016Note (Rupees in '000)
15.2.1 These represent borrowings from SBP under export refinance scheme at the rates ranging from 1.00% to 2.00%(2016: 1.00% to 2.00%) per annum having maturity upto six months.
15.2.2 These represent repurchase agreement borrowings maturing on January 05, 2018. These borrowings are securedagainst Pakistan Investment Bonds and Treasury Bills and carry mark-up at 5.87% (2016: nil) per annum.
15.2.3 These repurchase agreement borrowings are secured against Pakistan Investment Bonds and Treasury Bills and carrymark-up at rates ranging from 5.78% to 6.00% (2016: 5.78%) per annum. These borrowings are repayable latestby February 27, 2018. The carrying value of securities given as collateral against these borrowings is given in note9.1.
15.2.4 These represent call money borrowing from a commercial bank at the rate of 5.83% (2016: Nil) per annum withmaturities in August and October 2018. The group has placed Pakistan Investment Bonds as collateral against theseborrowings.

Annual Report2017
165 166
19. (DEFICIT) / SURPLUS ON REVALUATION OFASSETS - NET OF DEFERRED TAX
Available-for-sale securitiesFederal government securities 101,915 319,177Fully paid ordinary shares - listed (887,129) (147,175)Units of mutual funds (units / certificates) (104,279) 21,272Sukuk certificates 10,831 11,693Term finance certificates 1,553 1,236
9.1 (877,109) 206,203Related deferred taxation 12 306,988 (72,171)
(570,121) 134,03220. CONTINGENCIES AND COMMITMENTS
20.1 Direct credit substitutesIncludes general guarantees of indebtedness in favor of:Government 1,881,587 2,479,754Banking companies and other financial institutions 1,530,553 382,618Others 1,440,255 739,659
4,852,395 3,602,03120.2 Trade related contingent liabilities
- Others 4,713,833 4,953,626
20.3 Commitments to extend creditThe Group makes commitments to extend credit in the normal course of its business but these are revocablecommitments that do not attract any significant penalty or expense if the facility is unilaterally withdrawn.
20.4 Transaction related contingent liabilitiesContingent liabilities in respect of guarantees given, favoring others 393,990 248,638
20.5 Commitments in respect of forward rate agreements - currency- Purchase 5,108,914 7,407,583
- Sale 4,798,804 6,960,019
20.6 Commitments in respect of repo / reverse repo transactions- Sale and repurchase agreements 37,861,932 6,191,349
- Purchase and resale agreements 4,974,614 4,941,750
20.7 Other commitmentsAgainst purchase of shares - 23,591
2017 2016Note (Rupees in '000)
16. DEPOSITS AND OTHER ACCOUNTS
CustomersFixed deposits 36,674,370 33,787,351Savings deposits 49,676,100 44,489,733Current accounts - non-remunerative 39,776,448 31,361,350Margin and other accounts - non-remunerative 653,611 799,926
126,780,529 110,438,360Financial InstitutionsRemunerative deposits 7,257,908 8,274,591Non-remunerative deposits 165,653 130,423
7,423,561 8,405,01416.1 134,204,090 118,843,374
16.1 Particulars of depositsIn local currency 132,596,670 117,675,770In foreign currency 1,607,420 1,167,604
134,204,090 118,843,374
17. OTHER LIABILITIESMark-up / return/ interest payable in local currency 1,322,913 1,173,337Mark-up / return/ interest payable in foreign currency 4,170 5,041Accrued expenses 141,743 108,431Net defined benefit liability 31.1.2 71,446 50,481Payable to employees' provident fund 397 252Provision for compensated absences 32 144,125 118,612Unrealised loss against forward forex revaluation - net - 45,039Payable against purchase of operating fixed assets 99,853 45,892Payable against purchase of shares 358,505 393,307Retention money 67,872 60,459Federal excise duty / sales tax on services payable 6,303 4,617Provision for taxation - net 26,336 32,878Withholding tax payable 17,113 9,170Others 66,390 131,250
2,327,166 2,178,76618. SHARE CAPITAL
18.1 Authorised capital
2017 2016 2017 2016Number of shares (Rupees in '000)
1,200,000,000 1,200,000,000 Ordinary shares of Rs. 10/- each 12,000,000 12,000,000
18.2 Issued, subscribed and paid-up share capital
Ordinary shares of Rs. 10/- each 1,001,013,000 1,001,013,000 Fully paid in cash 10,010,130 10,010,130
2017 2016Note (Rupees in '000)
18.3 The Government of Sindh, through its Finance Depar tment, owns 99.9% ordinary shares of the Group.

Annual Report2017
167 168
21. MARK-UP / RETURN / INTEREST EARNED
On loans and advances to:Customers 4,808,795 3,963,112
On investments in:Available-for-sale securities 4,716,681 4,630,339Held-to-maturity securities 1,820,056 993,043
On deposits with financial institutions 78,656 53,530On securities purchased under resale agreements 134,496 132,371On call / clean lending 97,693 49,014
11,656,377 9,821,409
22. MARK-UP / RETURN / INTEREST EXPENSED
Deposits 5,285,403 4,346,929Securities sold under repurchase agreements 604,936 850,375Other short term borrowings 381,623 159,062
6,271,962 5,356,36623. GAIN ON SALE OF SECURITIES - NET
Federal government securities- Market Treasury Bills 562 44- Pakistan Investment Bonds 445,729 2,643,990
Others- Units of mutual funds 26,632 36,174- Shares of listed companies 131,202 253,048- Other investments 300 400
604,425 2,933,65624. OTHER INCOME
Incidental charges 24.1 4,761 2,351Gain on sale of operating fixed assets 2,964 4,146Prequalification application fee for tender 143 124Rental income 1,800 2,240Others 305 350
9,973 9,211
2017 2016Note (Rupees in '000)
24.1 Includes account maintenance, statement issuance, bill collection and other charges recovered from customers.
2017 2016Note (Rupees in '000)
25. ADMINISTRATIVE EXPENSESSalaries, allowances and other benefits 25.1 1,970,385 1,746,439Contribution to defined benefit plan 31.1.4 48,740 44,842Contribution to defined contribution plan 31.2 60,330 51,446Non-Executive Directors' fees 19,660 12,490Rent, taxes, insurance, electricity, etc. 825,232 756,638Legal and professional charges 29,729 21,544Communications 120,302 146,986Repairs and maintenance 214,035 191,186Stationery and printing 79,276 75,011Security services 248,114 232,559Advertisement and publicity 74,558 65,661Auditors' remuneration 25.2 8,168 7,504Depreciation 11.2 354,102 375,215Amortization 11.3 28,994 30,104Travelling and conveyance 21,636 20,935Brokerage and commission 8,338 10,643Fees and subscription 58,996 54,190Miscellaneous expense 62,904 60,274
4,233,499 3,903,667
25.1 This includes balance of compensated absences amounting to Rs.30.92 (2016: Rs.57.10) million. Further refernote 32.
25.2 Auditors’ remuneration
Grant Thornton Anjum RahmanAudit fee 175 2,945Half yearly review 80 1,213Certifications and other advisory services 198 2,706Out-of-pocket expenses 1,156 640
1,609 7,504EY Ford RhodesAudit fee 3,240 -Half yearly review 1,620 -Certifications and other advisory services 1,512 -Out-of-pocket expenses 187 -
6,559 -
8,168 7,504
2017 2016Note (Rupees in '000)
25.3 The Group operates a short term employee benefit scheme which includes grant of special bonus to employees.Under this scheme, the special bonus for employees, including the President & Chief Executive Officer of the Groupis determined on the basis of employees evaluation and the Group's performance during the year. The aggregateamount determined for eligible employees in respect of the above scheme relating to Executives and Chief ExecutiveOfficer of the Group amounted to Rs.35.19 (2016: Rs.23.37) million and Rs.3.13 (2016: Rs.23.66) million respectivelyand is included in salaries, allowances and benefits.

Annual Report2017
169 170
26. OTHER CHARGES
Penalties imposed by the SBP 8,689 525Others 732 -
9,421 52527. TAXATION
Relationship between tax expense and accounting profit
Profit before tax 2,213,387 2,448,675
Tax on income 773,081 858,106Effects of prior year on current taxation 161,950 184,795Effects of permanent differences 796 2,483
935,827 1,045,384
2017 2016Note (Rupees in '000)
27.1 The Income Tax returns of the Group have been filed up to the tax year 2017 (accounting year ended December31, 2016) and amendment of deemed assessment were carried out till tax year 2016, whereby certain disallowancesto the taxable income were made.
Appeals against amended orders were filed before Commissioner Inland Revenue Authority (CIRA), who deletedall major disallowances and additions except some disallownces in 2014 on which demand of Rs.5.95 million arose.
Subsequently, the Group has filed an appeal before Appellate Tribunal Inland Revenue (ATIR) in respect of demandof Rs.5.95 million as mentioned above, which are pending. Large Tax Payers Unit (LTU) has also filed appeals in theATIR against the decision of CIRA.
After legislation of 18th amendment to the Constitution, Government of Sindh through the Sindh WWF Act, 2014levy of SWWF was also introduced. As per Sindh WWF Act, 2014, banks/financial institutions are included in definitionof “Industrial Establishment” Sindh WWF is imposed @ of 2% of the total income; Since the Group's operations arein all the three other Provinces and Azad Jammu & Kashmir as well, the Group along with other banks has filed a SUITbefore honorable Sindh High Court and challenged the vires of SWWF, which is pending for adjudication.
2017 2016Note (Rupees in '000)28. BASIC AND DILUTED EARNINGS PER SHARE
Profit after taxation 1,277,560 1,403,291
------------(Numbers)------------
Weighted average number of ordinary shares 1,001,013,000 1,000,334,899
------------ (Rupees) --------------
Basic and diluted earnings per share 1.28 1.40
28.1 Diluted earnings per share has not been presented separately as the Group does not have any convertibleinstruments in issue at December 31, 2017 or 2016.
29. CASH AND CASH EQUIVALENTS
Cash and balances with treasury banks 6 9,680,631 7,502,624Balances with other banks 7 3,442,989 1,191,478
13,123,620 8,694,102
30. STAFF STRENGTH ------------- (Numbers) -------------
Permanent 1,677 1,595Temporary / on contractual basis 240 210group own staff strength at the end of the year 1,917 1,805Outsourced 30.1 403 388Total staff strength 2,320 2,193
30.1 This represents personnel hired by an outside contractor / agency and posted in the Group to perform various tasks/ activities of the Group.
31. DEFINED BENEFIT AND CONTRIBUTION PLANS
31.1 Defined benefit plan
The Group operates a recognised gratuity plan for all its permanent and full time employees in the management cadrewho have completed the minimum qualifying period of three years. Contributions are made to the fund in accordancewith the recommendations of an actuary. Employees are entitled to the benefits under the plan which comprise ofthe last drawn basic salary for each completed year of service, subject to completion of minimum three years serviceswith the Group.
31.1.1Principal actuarial assumptions
The latest actuarial valuation was carried out as at December 31, 2017 using the Projected Unit Credit Method.Following are the significant assumptions used in the actuarial valuation:
2017 2016
- Discount rate 9.50% 9.50%- Expected rate of increase in salaries 9.00% 9.00%- Expected return on plan assets 9.50% 9.50%

Annual Report2017
171 172
Discount rate (1% variation) 127,323 151,585
Future salary growth (1% variation) 165,072 194,690
Future mortality (1 year variation) 238,988 170,826
Although the analysis does not take account of the full distribution of cash flows expected under the plan, it doesprovide an approximation of sensitivity of the assumptions shown.
31.1.9 The expected gratuity expense for the year commencing January 01, 2018 works out to Rs.30.28 (2016: Rs.47.03)million.
31.1.10 Maturity analysis
The weighted average duration of the defined benefit obligation works out to be 12.30 years. Expected benefitpayments for the next five year are:
2018 2019 2020 2021 2022------------------------------- Rupees in '000 ------------------------------
Expected benefit payments 9,389 12,827 14,495 15,294 15,090
31.2 Defined contribution plan
The Group operates a recognised provident fund plan for all its permanent employees. Equal monthly contributionsare made, both by the Group and its employees, to the fund at the rate of 10% of basic salaries of the employees.The minimum qualifying period of service for the purpose of the Group's contribution is one year. The contributionmade by the Group and its employees during the year amounted to Rs.120.66 (2016: Rs.101.94) million. The numberof employees as at December 31, 2017 eligible under the plan were 1,498 (2016: 1,449).
32. COMPENSATED ABSENCES
The Group grants compensated absences to all its regular employees as per service rules. Minimum qualifying periodfor encashment is three years of service. Regular employees are entitled to 30 days privilege leave for each completedyear of service. Unutilized privilege leaves are accumulated upto a maximum of 60 days which would be encashedat the time of retirement from the regular service of the Group or severance of service except in case of dismissal.These are encashable on the basis of last drawn gross salary. The Group recognises the liability for compensatedabsences in respect of employees in the period in which these are earned up to the balance sheet date. The provisionamount of Rs.144.13 (2016: Rs.118.61) million has been provided on the basis of actuarial recommendations.
32.1 Movement of compensated absencesOpening balance 118,612 63,498Expense for the year 30,918 57,101Benefit paid for the year (5,405) (1,987)Closing balance 144,125 118,612
2017 2016Note (Rupees in '000)
31.1.8 Sensitivity analysis
Reasonably possible changes at the reporting date to one of the relevant actuarial assumptions, holding otherassumptions constant, would have affected the defined benefit obligation by the amounts shown below:
2017 2016Note (Rupees in '000)
31.1.2 Reconciliation of net defined benefit liability
Present value of defined benefit liability 31.1.5 239,044 170,787Fair value of plan assets 31.1.6 (167,598) (120,306)Payable to defined benefit plan 31.1.3 71,446 50,481
31.1.3 Movement in net defined benefit liability
Opening balance 50,481 49,286Charge to profit and loss during the year 31.1.4 48,740 44,842Remeasurement loss recognized in OCI 31.1.4 22,706 5,639group contribution (50,481) (49,286)Closing balance 71,446 50,481
31.1.4 Charge for defined benefit plan
In profit and lossCurrent service cost 46,342 42,378Interest cost - net 2,398 2,464Charge for the year 48,740 44,842
In other comprehensive incomeRemeasurement loss on defined benefit obligation 16,048 3,653Remeasurement loss on plan assets 6,658 1,986
22,706 5,639
2017 2016Note (Rupees in '000)
31.1.5 Changes in present value of defined benefit liability
Opening balance 170,787 118,574Current service cost 46,342 42,378Interest cost 15,755 11,587Benefits paid (9,888) (5,405)Actuarial loss / (gain) on obligations- Financial assumptions - -- Experience assumptions 16,048 3,653
16,048 3,653Closing balance 239,044 170,787
31.1.6 Fair value of plan assets
Fair value of plan assets at the beginning of the year 120,306 69,288Expected return on plan assets 13,357 9,123group contributions 50,481 49,286Benefits paid (9,888) (5,405)Actuarial loss on assets - experience assumptions (6,658) (1,986)Fair value of plan assets at the end of the year 31.1.7 167,598 120,306
31.1.7 Plan assets comprise
Balance held in bank accounts 167,598 120,306

Annual Report2017
173 174
33. COMPENSATION OF CHIEF EXECUTIVE OFFICER,DIRECTORS AND EXECUTIVES
President / Chief ExecutivesDirectorsExecutive Officer2017 2016 2017 2016 2017 2016
--------------------------------- (Rupees in '000) ---------------------------------
Fees - - 19,450 12,325 210 165Managerial remuneration 14,545 11,008 - 3,097 440,566 363,644Charge for defined benefit plan 1,247 814 - - 25,039 21,601Contribution for defined contribution plan 1,455 803 - - 32,014 26,019Rent and house maintenance 6,545 4,953 - 1,394 198,255 163,640Utilities 1,455 1,101 - 310 44,057 36,365Medical 1,455 1,101 - 310 44,057 36,365Conveyance 610 510 - 158 109,350 84,355Bonus 2,424 1,847 - 257 73,768 56,001Others 1,905 2,392 1,517 1,603 51,903 40,788
31,641 24,529 20,967 19,454 1,019,219 828,943
Number of Persons 1 2 7 7 393 334
33.1 The Chief Executive Officer and certain executives of the Group are provided with free use of the Group's maintainedcars.
33.2 Executives mean employees, other than the President & Chief Executive Officer and Directors, whose basic salaryexceeds five hundred thousand Rupees in a financial year.
33.3 In addition to above, all executives, including the President & Chief Executive Officer of the Group are also entitledto performance bonus which is disclosed in note 25.3 to these consolidated financial statements.
34. FAIR VALUE OF FINANCIAL INSTRUMENTS
IFRS 13 'Fair Value Measurement' defines fair value as the price that would be received to sell an asset or paid totransfer a liability in an orderly transaction between market participants at the measurement date.
The fair value of quoted securities other than those classified as held to maturity, is based on quoted market price.Fair value of fixed term loans, other assets, other liabilities and fixed term deposits cannot be calculated with sufficientreliability due to absence of current and active market for assets and liabilities and reliable data regarding market ratesfor similar instruments. The provision for impairment of loans and advances has been calculated in accordance withthe Group's accounting policy as stated in note 5.6 to these consolidated financial statements.
The repricing profile, effective rates and maturity profile are stated in note 38.3.5 to these consolidated financialstatements.
In the opinion of the management, the fair value of the remaining financial assets and liabilities are not significantlydifferent from their carrying values since assets and liabilities are either short term in nature or in the case of customerloans and deposits are frequently repriced.
Fair value hierarchy
IFRS 13 requires the Group to classify fair value measurement using a fair value hierarchy that reflects the significanceof the inputs used in making the measurements. The fair value hierarchy has following levels:
Level 1: Quoted prices (unadjusted) in active markets for identical assets or liabilities that the entity can accessat the measurement date.
Level 2: Inputs other than quoted prices included within Level 1 that are observable for the asset or liability, eitherdirectly or indirectly.
Level 3: Unobservable inputs for the asset or liability.
34.1 The table below analyses the financial and non-financial assets carried at fair values, by valuation methods. For financialassets, the Group essentially carries its investments in debt and equity securities at fair values. Valuation of investmentsis carried out as per guidelines specified by the SBP.
On balance sheet financial instruments
Financial assets measured at fair value
Available-for-sale securities
Pakistan Investment Bonds 38,841,721 - 38,841,721 - 38,841,721Market Treasury Bills 52,136,358 - 52,136,358 - 52,136,358Shares of listed companies 2,581,857 2,581,857 - - 2,581,857Term finance certificates - listed 101,393 - 101,393 - 101,393Units of mutual funds 608,214 213,439 394,775 - 608,214Sukuk bonds 1,353,966 - 1,353,966 - 1,353,966
Off balance sheet financial instruments
Foreign exchange contracts (purchase) - - 5,108,914 - 5,108,914
Foreign exchange contracts (sale) - - 4,798,804 - 4,798,804
2017Fair Value
Carrying Level 1 Level 2 Level 3 Totalvalue
----------------------------- (Rupees in '000) -----------------------------
2016Fair Value
Carrying Level 1 Level 2 Level 3 Totalvalue
----------------------------- (Rupees in '000) -----------------------------On balance sheet financial instruments
Financial assets measured at fair value
Available-for-sale securities
Pakistan Investment Bonds 49,507,894 - 49,507,894 - 49,507,894Market Treasury Bills 9,482,710 - 9,482,710 - 9,482,710Shares of listed companies 2,080,439 2,080,439 - - 2,080,439Term finance certificates - listed 101,014 - 101,014 - 101,014Term finance certificates - unlisted 12,629 - 12,629 - 12,629Units of mutual funds 733,805 218,014 515,791 - 733,805Sukuk bonds 698,735 - 698,735 - 698,735
Off balance sheet financial instruments
Foreign exchange contracts (purchase) - - 7,407,583 - 7,407,583
Foreign exchange contracts (sale) - - 6,960,019 - 6,960,019

Annual Report2017
175 176
ItemOpen ended mutual funds
Pakistan Investment Bonds / MarketTreasury BillsGovernment of Pakistan (GoP) - IjarahSukuksTerm Finance, Bonds and Sukuk certificates
Valuation techniques and input usedFair value is based on redemption prices as at the close of thebusiness day.Fair values of Pakistan Investment Bonds and Treasury Bills are derivedusing the PKRV rates (Reuters page).Fair values derived using the PKISRV rates announced by the FinancialMarket Association (FMA) through Reuters.Investments in debt securities (comprising term finance certificates,bonds, sukuk certificates and any other security issued by a companyor a body corporate for the purpose of raising funds in the form ofredeemable capital) are valued on the basis of the rates announcedby the Mutual Funds Association of Pakistan (MUFAP) in accordancewith the methodology prescribed by the Securities and ExchangeCommission of Pakistan.
35. SEGMENT DETAILS WITH RESPECT TO BUSINESS ACTIVITIES
The segment analysis with respect to business activities is as follows:
The valuation techniques used for the above assets are the same as disclosed below.
Total income 7,723,790 1,532 - 5,258,761 12,984,083
Inter segment revenue - net (6,781,650) - - 6,781,650 -Total income - net 942,140 1,532 - 12,040,411 12,984,083
Total expenses (1,224,473) (1,434) - (9,544,789) (10,770,696)
Net income / (loss) before tax (282,333) 98 - 2,495,622 2,213,387
Segment assets 130,473,857 123,892 - 73,927,314 204,525,063
Segment liabilities 50,318,536 651 - 138,088,665 188,407,852
Segment return on assets (ROA) (%)* 7.80% 9.46% - 9.25% -
Segment cost of funds (%)* 5.87% 4.09% - 4.00% -
* Includes inter-segment revenue / cost.
Trading andsales
Retailbanking
Corporatefinance
Commercialbanking and
othersTotal
--------------------------------- (Rupees in '000) ---------------------------------
2017
Total income 8,969,910 - - 4,375,844 13,345,754
Inter segment revenue - net (4,709,959) - - 4,681,580 (28,379)Total income - net 4,259,951 - - 9,057,424 13,317,375
Total expenses (1,144,350) - - (9,724,350) (10,868,700)Net income before tax 3,115,601 - - (666,926) 2,448,675
Segment assets 86,196,979 - - 60,008,675 146,205,654
Segment liabilities 8,148,404 - - 122,498,687 130,647,091
Segment return on assets(ROA) (%)* 11.49% - - 9.35% -
Segment cost of funds (%)* 7.60% - - 4.41% -
* Includes inter-segment revenue / cost.
36. RELATED PARTY TRANSACTIONS
The related parties of the Group comprise associated undertakings, directors, staff retirement funds and keymanagement personnel (including their associates).
Transactions with related parties includes deposits, advances and other banking services which are carried out onan arm's length basis. Transaction with executives are undertaken at terms in accordance with employment agreementsand service rules. Contributions to and accruals in respect of staff retirement benefit plans are made in accordancewith the terms of the benefit plan. Remuneration of the President & Chief Executive Officer and directors aredetermined in accordance with the terms of their appointment.
Government of Sindh (GoS) through its Finance Department holds 99.9% shareholding in the Group and thereforeentities which are owned and / or controlled by the GoS, or where the GoS may exercise significant influence, arerelated parties of the Group. The Group in the ordinary course of business enters into transaction with Government-related entities. Such transactions include lending to, deposits from and provision of other banking services to suchentities. However, it is impracticable to disclose transactions with all other entities owned or controlled by GoS.
The details of balances and transactions with related parties, other than those disclosed under respective notes, duringthe year are as follows:
Trading andsales
Retailbanking
Corporatefinance
Commercialbanking and
othersTotal
--------------------------------- (Rupees in '000) ---------------------------------
2016

Annual Report2017
177 178
AdvancesBalance at the beginning of the year 120,768 - - 234,375Disbursed during the year 45,120 - - 743,253Repaid during the year (24,384) - - (698,117)Balance at the end of the year 141,504 - - 279,511
DepositsBalance at the beginning of the year 54,246 19,138 - 1,001,431Received during the year 509,976 365,062 - 8,693,163Withdrawals during the year (453,066) (306,098) - (8,813,448)Balance at the end of the year 111,156 78,102 - 881,146
Purchase of Government securities - - - 304,300Investment in shares of subsidiary-outstanding - - - -Sale of Government securities - - - 190,000Fee and commission income 18 4 - 24Gain on sale of Government securities - - - 35Expenses recovered under agency arrangement - - - 586Mark-up receivable 97 - - 4,236Profit payable 947 406 - 7,932Insurance premium paid - - - 62,810Insurance premium settled - - - 46,762
Year ended December 31, 2017
Mark-up / return / interest earned 5,567 - - 21,627Mark-up / return / interest expensed 3,145 2,560 - 106,565Gain on sale of Government securities - - - 4,518Rental income - - - 1,800Rent paid - - - 2,475Remuneration paid 183,469 - - -Contribution to provident fund 5,265 - - -Provision for gratuity 4,606 - - -Other staff benefits 19,740 - - -Directors' meeting fee - 19,660 - -Other expenses - 1,517 - 808
Keymanagementpersonnel
DirectorsOtherrelatedparties
Associates /subsidiaries
2017
------------- (Rupees in '000) --------------
As at the date of consolidated statement of financial position, loans/advances and deposits related to governmentrelated entities amounted to Rs.11,552.08 million (note 10.2) and Rs.66,230.26 million (note 16). The above includesdeposits amounting to Rs.19,333.93 (2016: Rs.19,896.41) million received through the Finance Department,Government of Sindh.
AdvancesBalance at the beginning of the year 31,480 - - 296,875Disbursed during the year 103,001 - - -Repaid during the year (13,713) - - (62,500)Balance at the end of the year 120,768 - - 234,375
DepositsBalance at the beginning of the year 52,469 19,796 - 457,948Received during the year 369,131 154,367 - 10,471,174Withdrawals during the year (367,354) (155,025) - (9,927,691)Balance at the end of the year 54,246 19,138 - 1,001,431
Purchase of Government securities - - - 508,017Sale of Government securities - - - 799,537Expenses recovered under agency arrangement - - - 591Mark-up receivable 69 - - 4,972Profit payable 367 163 - 10,824Insurance premium paid - - 63,762Sale proceeds received - - - 10,157
Year ended December 31, 2016Mark-up / return / interest earned 1,596 - - 22,536Mark-up / return / interest expensed 2,096 1,379 - 41,997Gain on sale of Government securities - - - 346Rental income - - - 2,240Remuneration paid 154,970 5,491 - -Contribution to provident fund 4,606 - - -Provision for gratuity 3,916 - - -Other staff benefits 16,354 257 - -Directors' meeting fee - 12,325 - -Other Expenses - 1,380 - -
Keymanagementpersonnel
DirectorsOtherrelatedparties
Associates /subsidiaries
2016
------------- (Rupees in '000) --------------
37. CAPITAL ADEQUACY RATIO
37.1 The Basel-III Framework is applicable to the Group both at the consolidated level (comprising of wholly ownedsubsidiary) and on unconsolidated basis. Subsidiary is included while calculating consolidated capital adequacy forthe Group using full consolidation method whereas associates in which the Group has significant influence on equitymethod. Standardized approach is used for calculating the capital adequacy for credit and market risk, whereas, BasicIndicator Approach (BIA) is used for operational risk capital adequacy purposes.
37.2 Capital Management
Objectives and goals of managing capitalThe Group manages its capital to attain the following objectives and goals:- an appropriately capitalized status, as defined by banking regulations;- acquire strong credit ratings that enable an optimized funding mix and liquidity sources at lesser costs;- cover all risks underlying business activities; and- retain flexibility to harness future investment oppor tunities, build and expand even in stressed times.
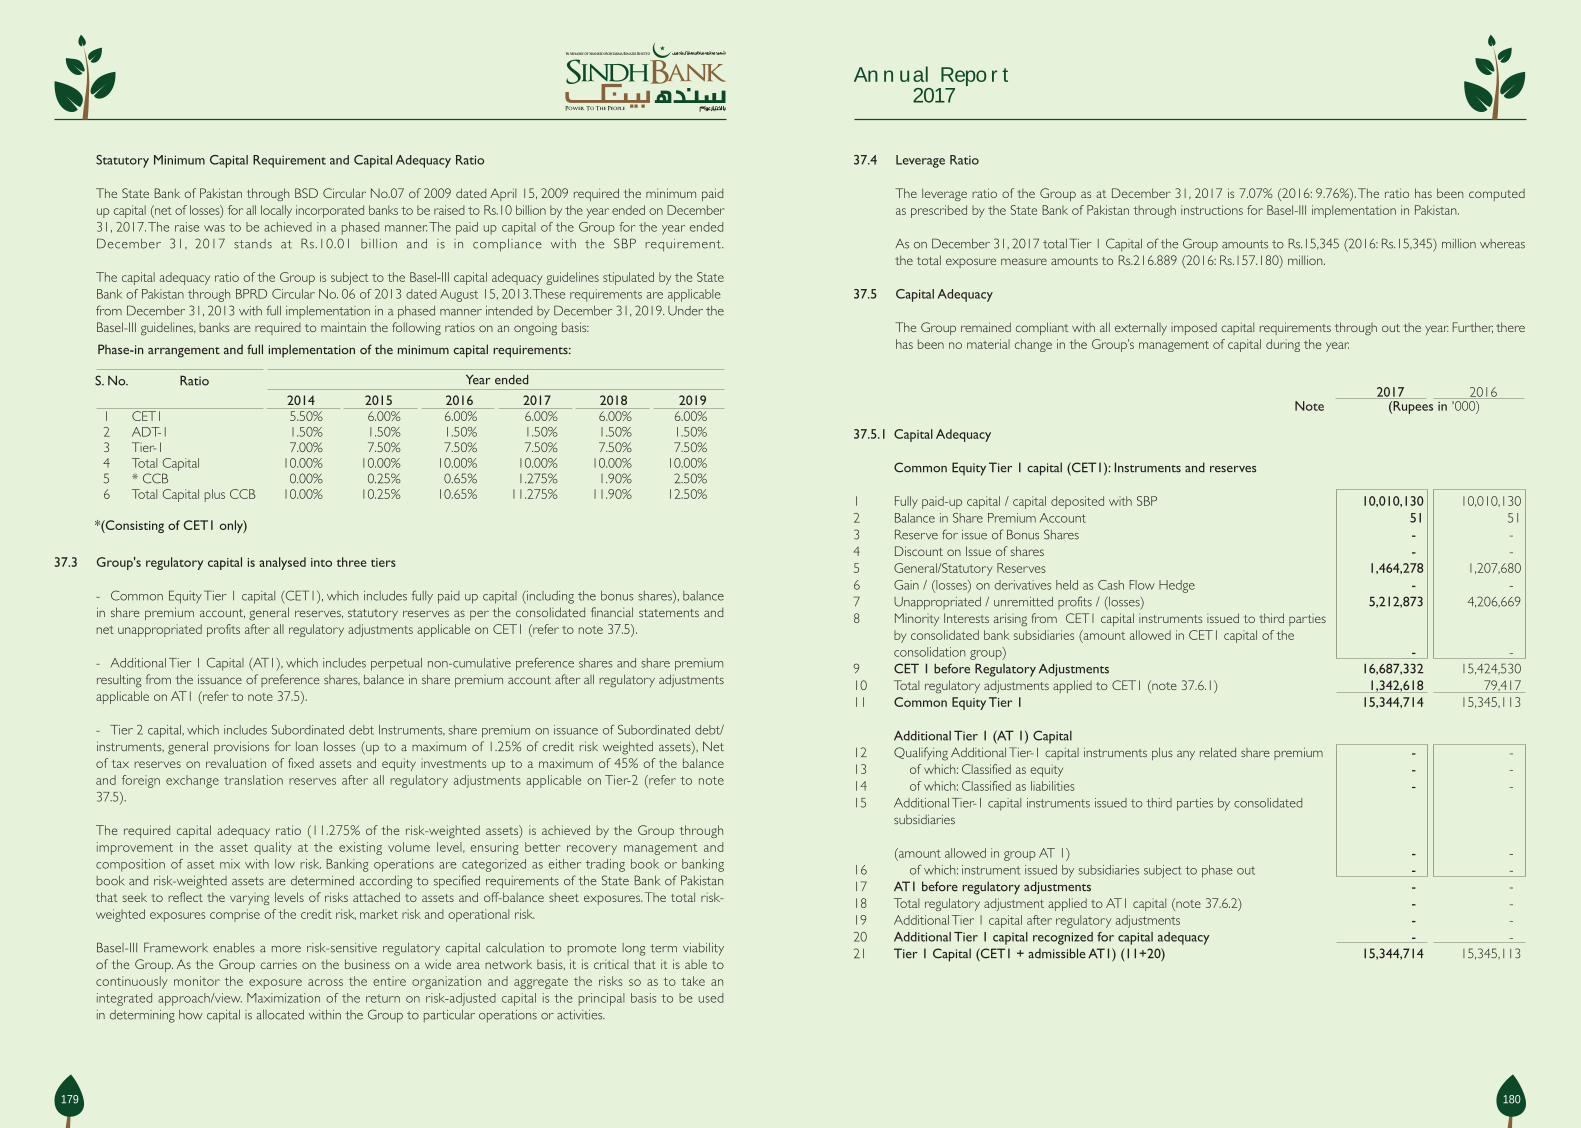
Annual Report2017
179 180
Statutory Minimum Capital Requirement and Capital Adequacy Ratio
The State Bank of Pakistan through BSD Circular No.07 of 2009 dated April 15, 2009 required the minimum paidup capital (net of losses) for all locally incorporated banks to be raised to Rs.10 billion by the year ended on December31, 2017. The raise was to be achieved in a phased manner. The paid up capital of the Group for the year endedDecember 31, 2017 stands at Rs.10.01 billion and is in compliance with the SBP requirement.
The capital adequacy ratio of the Group is subject to the Basel-III capital adequacy guidelines stipulated by the StateBank of Pakistan through BPRD Circular No. 06 of 2013 dated August 15, 2013. These requirements are applicablefrom December 31, 2013 with full implementation in a phased manner intended by December 31, 2019. Under theBasel-III guidelines, banks are required to maintain the following ratios on an ongoing basis:
37.3 Group's regulatory capital is analysed into three tiers
- Common Equity Tier 1 capital (CET1), which includes fully paid up capital (including the bonus shares), balancein share premium account, general reserves, statutory reserves as per the consolidated financial statements andnet unappropriated profits after all regulatory adjustments applicable on CET1 (refer to note 37.5).
- Additional Tier 1 Capital (AT1), which includes perpetual non-cumulative preference shares and share premiumresulting from the issuance of preference shares, balance in share premium account after all regulatory adjustmentsapplicable on AT1 (refer to note 37.5).
- Tier 2 capital, which includes Subordinated debt Instruments, share premium on issuance of Subordinated debt/instruments, general provisions for loan losses (up to a maximum of 1.25% of credit risk weighted assets), Netof tax reserves on revaluation of fixed assets and equity investments up to a maximum of 45% of the balanceand foreign exchange translation reserves after all regulatory adjustments applicable on Tier-2 (refer to note37.5).
The required capital adequacy ratio (11.275% of the risk-weighted assets) is achieved by the Group throughimprovement in the asset quality at the existing volume level, ensuring better recovery management andcomposition of asset mix with low risk. Banking operations are categorized as either trading book or bankingbook and risk-weighted assets are determined according to specified requirements of the State Bank of Pakistanthat seek to reflect the varying levels of risks attached to assets and off-balance sheet exposures. The total risk-weighted exposures comprise of the credit risk, market risk and operational risk.
Basel-III Framework enables a more risk-sensitive regulatory capital calculation to promote long term viabilityof the Group. As the Group carries on the business on a wide area network basis, it is critical that it is able tocontinuously monitor the exposure across the entire organization and aggregate the risks so as to take anintegrated approach/view. Maximization of the return on risk-adjusted capital is the principal basis to be usedin determining how capital is allocated within the Group to particular operations or activities.
Phase-in arrangement and full implementation of the minimum capital requirements:
S. No. Ratio
1 CET1 5.50% 6.00% 6.00% 6.00% 6.00% 6.00%2 ADT-1 1.50% 1.50% 1.50% 1.50% 1.50% 1.50%3 Tier-1 7.00% 7.50% 7.50% 7.50% 7.50% 7.50%4 Total Capital 10.00% 10.00% 10.00% 10.00% 10.00% 10.00%5 * CCB 0.00% 0.25% 0.65% 1.275% 1.90% 2.50%6 Total Capital plus CCB 10.00% 10.25% 10.65% 11.275% 11.90% 12.50%
*(Consisting of CET1 only)
Year ended
2014 2015 2016 2017 2018 2019
37.4 Leverage Ratio
The leverage ratio of the Group as at December 31, 2017 is 7.07% (2016: 9.76%). The ratio has been computedas prescribed by the State Bank of Pakistan through instructions for Basel-III implementation in Pakistan.
As on December 31, 2017 total Tier 1 Capital of the Group amounts to Rs.15,345 (2016: Rs.15,345) million whereasthe total exposure measure amounts to Rs.216.889 (2016: Rs.157.180) million.
37.5 Capital Adequacy
The Group remained compliant with all externally imposed capital requirements through out the year. Further, therehas been no material change in the Group’s management of capital during the year.
37.5.1 Capital Adequacy
Common Equity Tier 1 capital (CET1): Instruments and reserves
1 Fully paid-up capital / capital deposited with SBP 10,010,130 10,010,1302 Balance in Share Premium Account 51 513 Reserve for issue of Bonus Shares - -4 Discount on Issue of shares - -5 General/Statutory Reserves 1,464,278 1,207,6806 Gain / (losses) on derivatives held as Cash Flow Hedge - -7 Unappropriated / unremitted profits / (losses) 5,212,873 4,206,6698 Minority Interests arising from CET1 capital instruments issued to third parties
by consolidated bank subsidiaries (amount allowed in CET1 capital of theconsolidation group) - -
9 CET 1 before Regulatory Adjustments 16,687,332 15,424,53010 Total regulatory adjustments applied to CET1 (note 37.6.1) 1,342,618 79,41711 Common Equity Tier 1 15,344,714 15,345,113
Additional Tier 1 (AT 1) Capital12 Qualifying Additional Tier-1 capital instruments plus any related share premium - -13 of which: Classified as equity - -14 of which: Classified as liabilities - -15 Additional Tier-1 capital instruments issued to third parties by consolidated
subsidiaries
(amount allowed in group AT 1) - -16 of which: instrument issued by subsidiaries subject to phase out - -17 AT1 before regulatory adjustments - -18 Total regulatory adjustment applied to AT1 capital (note 37.6.2) - -19 Additional Tier 1 capital after regulatory adjustments - -20 Additional Tier 1 capital recognized for capital adequacy - -21 Tier 1 Capital (CET1 + admissible AT1) (11+20) 15,344,714 15,345,113
2017 2016Note (Rupees in '000)

Annual Report2017
000 000
Annual Report2017
181 182
2017 2016Note (Rupees in '000)
Tier 2 Capital22 Qualifying Tier 2 capital instruments under Basel III plus any related share
premium - -23 Tier 2 capital instruments subject to phase-out arrangement issued under
pre-Basel 3 rules - -24 Tier 2 capital instruments issued to third parties by consolidated subsidiaries
(amount allowed in group tier 2) - -25 of which: instruments issued by subsidiaries subject to phase out - -26 General provisions or general reserves for loan losses-up to maximum of
1.25% of Credit Risk Weighted Assets 815,886 639,29227 Revaluation Reserves (net of taxes)28 of which: Revaluation reserves on fixed assets - -29 of which: Unrealized gains/losses on AFS - 134,03230 Foreign Exchange Translation Reserves - -31 Undisclosed/Other Reserves (if any) - -32 T2 before regulatory adjustments 815,886 773,324
33 Total regulatory adjustment applied to T2 capital (note 37.6.3) 171,414 5,83834 Tier 2 capital (T2) after regulatory adjustments - -35 Tier 2 capital recognized for capital adequacy - -36 Portion of Additional Tier 1 capital recognized in Tier 2 capital - -37 Total Tier 2 capital admissible for capital adequacy 644,472 767,486
38 TOTAL CAPITAL (T1 + admissible T2) (21+37) 15,989,186 16,112,599
39 Total Risk Weighted Assets (RWA) {for details refer note 37.7} 97,376,623 88,659,191Capital Ratios and buffers (in percentage of risk weighted assets)
40 CET1 to total RWA 15.76% 17.31%41 Tier-1 capital to total RWA 15.76% 17.31%42 Total capital to total RWA 16.42% 18.17%
43 Bank specific buffer requirement (minimum CET1 requirement plus capitalconservation buffer plus any other buffer requirement) 7.28% 6.65%
44 of which: capital conservation buffer requirement 1.28% 0.65%45 of which: counter cyclical buffer requirement 0.00% 0.00%46 of which: D-SIB or G-SIB buffer requirement 0.00% 0.00%47 CET1 available to meet buffers (as a percentage of risk weighted assets) 8.48% 10.66%
National minimum capital requirements prescribed by SBP48 CET1 minimum ratio 6.00% 6.00%49 Tier 1 minimum ratio 7.50% 7.50%50 Total capital minimum ratio 10.00% 10.00%51 Total capital minimum ratio plus CCB 11.275% 10.65%
37.6 Regulatory Adjustments and Additional Information:
37.6.1 Common Equity Tier 1 capital: Regulatory adjustments1 Goodwill (net of related deferred tax liability) - - - -2 All other intangibles (net of any associated deferred tax liability) 52,413 52,413 57,825 57,8253 Shortfall in provisions against classified assets - - - -4 Deferred tax assets that rely on future profitability excluding those
arising from temporary differences (net of related tax liability) - - - -5 Defined-benefit pension fund net assets - - - -6 Reciprocal cross holdings in CET1 capital instruments of banking,
financial and insurance entities - - - -7 Cash flow hedge reserve - - - -8 Investment in own shares/ CET1 instruments - - - -9 Securitization gain on sale - - - -10 Capital shortfall of regulated subsidiaries - - - -11 Deficit on account of revaluation from bank's holdings of fixed
assets/AFS 570,122 570,122 - -12 Investments in the capital instruments of banking, financial and
insurance entities that are outside the scope of regulatoryconsolidation, where the bank does not own more than 10% of theissued share capital (amount above 10% threshold) 813,676 650,941 35,987 21,592
13 Significant investments in the common stocks of banking, financialand insurance entities that are outside the scope of regulatoryconsolidation (amount above 10% threshold) - - - -
14 Deferred tax assets arising from temporary differences(amount above 10% threshold, net of related tax liability) 86,427 69,142 - -
15 Amount exceeding 15% threshold - -16 of which: significant investments in the common stocks of financial
entities - - - -17 of which: deferred tax assets arising from temporary differences - - - -18 National specific regulatory adjustments applied to CET1 capital - - - -19 Investments in TFCs of other banks exceeding the prescribed limit - - - -20 Any other deduction specified by SBP (mention details) - - - -21 Adjustment to CET1 due to insufficient AT1 and Tier 2 to cover
deductions - - - -22 Total regulatory adjustments applied to CET1 (sum of 1 to 21) 1,522,638 1,342,618 93,812 79,417
2017 2016 Amount Amounts Amounts
subject to Pre- subject to Pre-Basel III Basel III
treatment treatment
---------------- Rupees in '000 ---------------

Annual Report2017
000 000
Annual Report2017
183 184
37.6.4 Additional InformationRisk weighted assets in respect of deduction items (which during the transitionalperiod will be risk weighted subject to Pre-Basel III treatment)
(i) of which: deferred tax assets - -(ii) of which: defined-benefit pension fund net assets - -(iii) of which: recognized portion of investment in capital of banking, financial and
insurance entities where holding is less than 10% of the issued common share capital of the entity 2,634,423 1,582,389
(iv) of which: recognized portion of investment in capital of banking, financial andinsurance entities where holding is more than 10% of the issued common sharecapital of the entity - -
2,634,423 1,582,38937.6.5 Amounts below the thresholds for deduction (before risk weighting)38 Non-significant investments in the capital of other financial entities - -39 Significant investments in the common stock of financial entities - -40 Deferred tax assets arising from temporary differences (net of related tax liability) 1,611,539 1,190,077
1,611,539 1,190,07737.6.6 Applicable caps on the inclusion of provisions in Tier 241 Provisions eligible for inclusion in Tier 2 in respect of exposures subject to - -
standardized approach (prior to application of cap) - -42 Cap on inclusion of provisions in Tier 2 under standardized approach - -43 Provisions eligible for inclusion in Tier 2 in respect of exposures subject to
internal ratings-based approach (prior to application of cap) - -
44 Cap for inclusion of provisions in Tier 2 under internal ratings-based approach - -37.7 Capital Structure Reconciliation
Step 1
AssetsCash and balances with treasury banks 9,680,631 9,680,631Balanced with other banks 3,442,989 3,442,989Lending to financial institutions 5,331,327 5,331,327Investments 113,509,902 113,509,902Advances 65,051,730 65,051,730Operating fixed assets 1,663,440 1,663,440Deferred tax assets 1,611,539 1,611,539Other assets 4,233,506 4,233,506Total assets 204,525,064 204,525,064
2017 2016-------------- Rupees in '000 -------------
As per publishedfinancial
statements
Underregulatoryscope ofreporting
December 31, 2017Rupees in '000
2017 2016 Amount Amounts Amounts
subject to Pre- subject to Pre-Basel III Basel III
treatment treatment
---------------- Rupees in '000 ---------------37.6.2 Additional Tier-1 & Tier-1 Capital: regulatory adjustments
23 Investment in mutual funds exceeding the prescribed limit[SBP specific adjustment] - - - -
24 Investment in own AT1 capital instruments - - - -25 Reciprocal cross holdings in Additional Tier 1 capital instruments
of banking, financial and insurance entities - - - -26 Investments in the capital instruments of banking, financial and
insurance entities that are outside the scope of regulatoryconsolidation, where the bank does not own more than 10%of the issued share capital (amount above 10% threshold) - - - -
27 Significant investments in the capital instruments of banking, financialand insurance entities that are outside the scope of regulatoryconsolidation - - - -
28 Portion of deduction applied 50:50 to Tier-1 and Tier-2 capitalbased on pre-Basel III treatment which, during transitional period,remain subject to deduction from additional tier-1 capital - - - -
29 Adjustments to Additional Tier 1 due to insufficient Tier 2 tocover deductions - - - -
30 Total regulatory adjustment applied to AT1 capital(sum of 23 to 29) - - - -
37.6.3 Tier 2 Capital: regulatory adjustments
31 Portion of deduction applied 50:50 to Tier-1 and Tier-2 capitalbased on pre-Basel III treatment which, during transitional period,remain subject to deduction from tier-2 capital - - - -
32 Reciprocal cross holdings in Tier 2 instruments of banking, financialand insurance entities - - - -
33 Investment in own Tier 2 capital instrument - - - -34 Investments in the capital instruments of banking, financial and
insurance entities that are outside the scope of regulatoryconsolidation, where the bank does not own more than10% of the issued share capital (amount above 10% threshold) 214,268 171,414 9,731 5,838
35 Significant investments in the capital instruments issued by banking,financial and insurance entities that are outside the scope ofregulatory consolidation - - - -
36 Total regulatory adjustment applied to T2 capital (sum of 31 to 35) 214,268 171,414 9,731 5,838

Annual Report2017
185 186
Liabilities & EquityBills payable 905,423 905,423Borrowings 50,971,174 50,971,174Deposits and other accounts 134,204,090 134,204,090Sub-ordinated loans - -Liabilities against assets subject to finance lease - -Deferred tax liabilities - -Other liabilities 2,327,166 2,327,166Total liabilities 188,407,853 188,407,853
Share capital / head office capital account 10,010,130 10,010,130Reserves 1,464,329 1,464,329Unappropriated / unremitted profit / (losses) 5,212,873 5,212,873Minority interest - -Surplus on revaluation of assets (570,121) (570,121)Total equity 16,117,211 16,117,211Total liabilities & equity 204,525,064 204,525,064
2017 2016-------------- Rupees in '000 -------------
Step 2
As perpublishedconsolidated financialstatements
Underregulatoryscope of
consolidation Reference
------ Rupees in '000 ------December 31, 2017
AssetsCash and balances with treasury banks 9,680,631 9,680,631Balanced with other banks 3,442,989 3,442,989 Lending to financial institutions 5,331,327 5,331,327Investments 113,509,902 113,509,902- of which: non-significant capital investments in capital of other financial
institutions exceeding 10% threshold 822,355 822,355 a - of which: significant capital investments in financial sector entities exceeding regulatory threshold - - b- of which: mutual funds exceeding regulatory threshold - - c- of which: reciprocal crossholding of capital instrument - - d- of which: others (mention details) 112,687,547 112,687,547 eAdvances 65,051,730 65,051,730 Shortfall in provisions/ excess of total EL amount over eligible provisions - - funder IRBGeneral provisions reflected in Tier 2 capital 815,886 815,886 gFixed assets 1,663,440 1,663,440 Deferred tax assets 1,542,397 1,542,397 - of which: DTAs excluding those arising from temporary differences - - h- of which: DTAs arising from temporary differences exceeding regulatory threshold 69,142 69,142 iOther assets 4,233,506 4,233,506 - of which: goodwill - - j- of which: intangibles 61,607 61,607 k- of which: Defined-benefit pension fund net assets - - lTotal assets 204,525,064 204,525,064
Liabilities & EquityBills payable 905,423 905,423 Borrowings 50,971,174 50,971,174 Deposits and other accounts 134,204,090 134,204,090 Sub-ordinated loans - - - of which: eligible for inclusion in AT1 - - m- of which: eligible for inclusion in Tier 2 - - nLiabilities against assets subject to finance lease - - Deferred tax liabilities 9,194 9,194 - of which: DTLs related to goodwill - - o- of which: DTLs related to intangible assets 9,194 9,194 p- of which: DTLs related to defined pension fund net assets - - q- of which: other deferred tax liabilities - - rOther liabilities 2,327,166 2,327,166 Total liabilities 188,407,853 188,407,853 Share capital 10,010,130 10,010,130 - of which: amount eligible for CET1 10,010,130 10,010,130 s- of which: amount eligible for AT1 - - t
Reserves 1,464,329 1,464,329 - of which: portion eligible for inclusion in CET1 1,464,329 1,464,329 u- of which: portion eligible for inclusion in Tier 2 - - vUnappropriated profit / (losses) 5,212,873 5,212,873 wMinority interest - -- of which: portion eligible for inclusion in CET1 - - x- of which: portion eligible for inclusion in AT1 - - y- of which: portion eligible for inclusion in Tier 2 - - zSurplus on revaluation of assets (570,121) (570,121)- of which: revaluation reserves on property - - - of which: unrealized gains / (losses) on AFS - - aa- In case of deficit on revaluation (deduction from CET1) 570,121 570,121 ab
Total Equity 16,117,211 16,117,211 Total liabilities & Equity 204,525,064 204,525,064
Step 2
As perpublishedconsolidated financialstatements
Underregulatoryscope of
consolidation Reference
------ Rupees in '000 ------December 31, 2017

Annual Report2017
187 188
Common Equity Tier 1 capital (CET1): Instruments and reserves
1 Fully Paid-up capital/ capital deposited with SBP 10,010,130 (s)2 Balance in share premium account 51 3 Reserve for issue of bonus shares - 4 General/ statutory reserves 1,464,278 (u)5 Gain/(Losses) on derivatives held as cash flow hedge - 6 Unappropriated/unremitted profits/(losses) 5,212,873 (w)7 Minority Interests arising from CET1 capital instruments issued to third party
by consolidated bank subsidiaries (amount allowed in CET1 capital of the - (x)consolidation group)
8 CET 1 before Regulatory Adjustments 16,687,332
Common Equity Tier 1 capital: Regulatory Adjustments
9 Goodwill (net of related deferred tax liability) - (j) - (o)10 All other intangibles (net of any associated deferred tax liability) 52,413 (k) - (p)11 Shortfall of provisions against classified assets - (f)12 Deferred tax assets that rely on future profitability excluding those arising from
temporary differences (net of related tax liability) - {(h) - (r} * x%13 Defined-benefit pension fund net assets - {(l) - (q)} * x%14 Reciprocal cross holdings in CET1 capital instruments - (d)15 Cash flow hedge reserve - 16 Investment in own shares/ CET1 instruments - 17 Securitization gain on sale - 18 Capital shortfall of regulated subsidiaries - 19 Deficit on account of revaluation from bank's holdings of property / AFS 570,121 (ab)20 Investments in the capital instruments of banking, financial and insurance
entities that are outside the scope of regulatory consolidation, where the bankdoes not own more than 10% of the issued share capital (amount above 10%threshold) 650,941 (a) - (ac) - (ae)
21 Significant investments in the capital instruments issued by banking, financial andinsurance entities that are outside the scope of regulatory consolidation(amount above 10% threshold) - (b) - (ad) - (af)
22 Deferred tax assets arising from temporary differences (amount above 10%threshold, net of related tax liability) 69,142 (i)
23 Amount exceeding 15% threshold24 - of which: significant investments in the common stocks of financial entities - 25 - of which: deferred tax assets arising from temporary differences - 26 National specific regulatory adjustments applied to CET1 capital - 27 Investment in TFCs of other banks exceeding the prescribed limit - 28 Any other deduction specified by SBP (mention details) - 29 Regulatory adjustment applied to CET1 due to insufficient AT1 and Tier 2 to
cover deductions - 30 Total regulatory adjustments applied to CET1 1,342,617
31 Common Equity Tier 1 15,344,715
Additional Tier 1 (AT 1) Capital32 Qualifying additional Tier-1 instruments plus any related share premium - 33 - of which: classified as equity - (t)34 - of which: classified as liabilities - (m)35 Additional Tier-1 capital instruments issued by consolidated subsidiaries and
held by third parties (amount allowed in group AT 1) - (y)36 - of which: instrument issued by subsidiaries subject to phase out - 37 AT1 before regulatory adjustments
Step 3Source basedon referencenumber from
step 2
Rupees in '000
Source basedon referencenumber from
step 2
Additional Tier 1 Capital: regulatory adjustments38 Investment in mutual funds exceeding the prescribed limit (SBP specific
adjustment) - 39 Investment in own AT1 capital instruments - 40 Reciprocal cross holdings in additional Tier 1 capital instruments - 41 Investments in the capital instruments of banking, financial and insurance
entities that are outside the scope of regulatory consolidation, where the bankdoes not own more than 10% of the issued share capital (amount above10% threshold) - (ac)
42 Significant investments in the capital instruments issued by banking, financial andinsurance entities that are outside the scope of regulatory consolidation - (ad)
43 Portion of deduction applied 50:50 to core capital and supplementary capitalbased on pre-Basel III treatment which, during transitional period, remainsubject to deduction from tier-1 capital -
44 Regulatory adjustments applied to additional Tier 1 due to insufficient Tier 2to cover deductions -
45 Total of regulatory adjustment applied to AT1 capital - 46 Additional Tier 1 capital - 47 Additional Tier 1 capital recognized for capital adequacy -
48 Tier 1 Capital (CET1 + admissible AT1) 15,344,715
Tier 2 Capital49 Qualifying Tier 2 capital instruments under Basel III - (n)50 Capital instruments subject to phase out arrangement from tier 2
(Pre-Basel III instruments) - 51 Tier 2 capital instruments issued to third party by consolidated subsidiaries
(amount allowed in group tier 2) - (z)52 - of which: instruments issued by subsidiaries subject to phase out - 53 General Provisions or general reserves for loan losses-up to maximum of
1.25% of Credit risk weighted assets 815,886 (g)54 Revaluation reserves eligible for Tier 2 - 55 - of which: portion pertaining to Property - portion of (aa)56 - of which: portion pertaining to AFS securities - 57 Foreign exchange translation reserves - (v)58 Undisclosed / other reserves (if any) - 59 T2 before regulatory adjustments 815,886
Tier 2 Capital: regulatory adjustments60 Portion of deduction applied 50:50 to core capital and supplementary capital
based on pre-Basel III treatment which, during transitional period, - remain subject to deduction from tier-2 capital
61 Reciprocal cross holdings in Tier 2 instruments - 62 Investment in own Tier 2 capital instrument - 63 Investments in the capital instruments of banking, financial and insurance entities
that are outside the scope of regulatory consolidation, where the bank does notown more than 10% of the issued share capital (amount above 10% threshold) 171,414 (ae)
64 Significant investments in the capital instruments issued by banking, financial andinsurance entities that are outside the scope of regulatory consolidation - (af)
65 Amount of regulatory adjustment applied to T2 capital 171,414 66 Tier 2 capital (T2) 644,472 67 Tier 2 capital recognized for capital adequacy 644,472 68 Excess additional Tier 1 capital recognized in Tier 2 capital - 69 Total Tier 2 capital admissible for capital adequacy 644,472
Total capital (T1 + admissible T2) 15,989,187
Step 3Source basedon referencenumber from
step 2
Rupees in '000
Source basedon referencenumber from
step 2

Annual Report2017
189 190
37.8 Main features template of Regulatory Capital Instruments
1 Issuer Sindh Bank Ltd2 Unique identifier (e.g PSX Symbol or Bloomberg identifier etc.) Un-quoted3 Governing law(s) of the instrument Laws applicable in Pakistan
Regulatory treatment4 - Transitional Basel III rules Common Equity Tier 15 - Post-transitional Basel III rules Common Equity Tier 16 - Eligible at solo / group / group & solo Group & Solo7 - Instrument type Ordinary Shares8 Amount recognized in regulatory capital (currency in PKR thousands
as of reporting date) 10,010,1309 Par value of instrument Rs.1010 Accounting classification Shareholders11 Original date of issuance October 29, 201012 Perpetual or dated Perpetual13 Original maturity date Not applicable14 Issuer call subject to prior supervisory approval No15 Optional call date, contingent call dates and redemption amount Not applicable16 Subsequent call dates, if applicable Not applicable
Coupons / Dividends17 Fixed or floating dividend/ coupon Floating Dividend18 Coupon rate and any related index/ benchmark Not applicable19 Existence of a dividend stopper No20 Fully discretionary, partially discretionary or mandatory Fully discretionary21 Existence of step up or other incentive to redeem No22 Non-cumulative or cumulative
Convertible or non-convertible Non-convertible23 If convertible, conversion trigger (s) Not applicable24 If convertible, fully or partially Not applicable25 If convertible, conversion rate Not applicable26 If convertible, mandatory or optional conversionNot applicable Not applicable27 If convertible, specify instrument type convertible into Not applicable28 If convertible, specify issuer of instrument it converts into Not applicable
Write-down feature29 If write-down, write-down trigger(s) Not applicable30 If write-down, full or partial Not applicable31 If write-down, permanent or temporary Not applicable32 If temporary write-down, description of write-up mechanism Not applicable33 Position in subordination hierarchy in liquidation (specify instrument)
type immediately senior to instrument Residual Interest34 Non-compliant transitioned features No35 If yes, specify non-compliant features Not applicable
37.9 Risk Weighted Assets
The risk weighted assets to capital ratio, calculated in accordance with the State Bank of Pakistan’s guidelines on capitaladequacy are as follows:
CapitalRequirements
Risk WeightedAssets
CapitalRequirements
Risk WeightedAssets
2017 2016
(Rupees in '000)Credit Risk:Credit Risk on Balance Sheet Portfoliossubject to standardized approach (simple)Cash and cash equivalents - - - -Sovereign - - - -Public sector entities 5,149 51,494 16,079 160,787Banks 129,159 1,291,588 143,153 1,431,530Corporate 4,028,223 40,282,227 3,444,490 34,444,902Retail 188,278 1,882,779 193,688 1,936,882Residential mortgages 24,147 241,469 11,449 114,490Past due loans 577,705 5,777,049 157,316 1,573,164Deferred tax assets 381,278 3,812,783 297,519 2,975,193Listed equity investment 39,063 390,634 58,232 582,316Un-listed equity investment 9,196 91,958 - -Operating fixed assets 160,183 1,601,831 176,519 1,765,194Other assets 63,471 634,712 86,135 861,347
5,605,852 56,058,524 4,584,580 45,845,805Off-Balance sheet:Non-market relatedFinancial guarantees, acceptances, performancerelated commitments, trade related etc. 916,718 9,167,179 525,953 5,259,528Market relatedForeign exchange contracts/ derivatives etc. 4,514 45,140 3,801 38,011
921,232 9,212,319 529,754 5,297,539
TOTAL CREDIT RISK (a) 6,527,084 65,270,843 5,114,334 51,143,344
Market Risk:Capital Requirement for portfolios subject tostandardized approachInterest rate risk 1,688,026 16,880,264 2,265,246 22,652,460Equity position risk 507,826 5,078,262 555,651 5,556,513Foreign exchange risk 11,897 118,968 2,703 27,025TOTAL MARKET RISK (b) 2,207,749 22,077,494 2,823,600 28,235,998
Operational Risk:Capital Requirement for portfolios subject tobasic indicator approachOperational risk (c) 1,002,829 10,028,286 927,985 9,279,849
TOTAL RISK WEIGHTED ASSETS (a)+(b)+(c) 9,737,662 97,376,623 8,865,919 88,659,191

Annual Report2017
191 192
CET1 to total RWA 6.00% 15.76% 6.00% 17.31%Tier-1 capital to total RWA 7.50% 15.76% 7.50% 17.31%Total capital to total RWA 10.00% 16.42% 10.00% 18.17%Total capital plus CCB to total RWA 11.275% 16.42% 10.65% 18.17%
2017 2016Capital Adequacy Ratios Required Actual Required Actual
38. RISK MANAGEMENT
Under the Group's risk management framework, the Group's Risk Management Committee (BRMC) is responsiblefor review and improvement of the risk policies of the Group. On a management level, the Group has set up a RiskManagement Division (RMD) to identify, assess and monitor credit risk, market risk and operational risk in the activitiesof the Group and take adequate measures to manage and control risks on timely basis.
38.1 Credit risk
Credit risk strives to maximize the Group's risk adjusted rate of return by maintaining credit risk exposure withinacceptable parameters. The effective management of credit risk is a critical component of a comprehensive approachto risk management and essential to the long term success of any banking organization.
The Group's lending function is primarily focused on small and medium sized secured loans in agriculture, SME andconsumer products. Large corporate, commercial and industrial loans are provided on selective basis whose policyis subject to review as and when required.
Under RMD, the Credit Risk Management Department (CRMD) is responsible to ensure that credit risk stays withinthe parameters set by the Board, and to set up and monitor system parameters for identifying risks, monitoring ofthese risks and early warning systems. RMD monitors credit on a portfolio basis using the auto risk system andreports to the CEO and the BRMC on a regular basis.
38.2 Segments by class of business
38.2.1 Segmental information
Segmental information by the class / nature of business and segment by distribution of advances, depositsand contingencies is given below:
Chemical and pharmaceuticals 1,471,125 2.12% 2,241,584 1.67% 82,331 0.13%Agri-business 1,872,350 2.70% 2,099,868 1.56% - -Manufacturing of textile 291,210 0.42% 105,643 0.08% 433,368 0.69%Cement 373,223 0.54% 3,019 0.00% - -Transport, storage and communication 1,341,428 1.93% 443,966 0.33% 25,225 -Importers / exporters 344,651 0.50% 272,701 0.20% 209,189 0.33%Wholesale and retail trade 793,957 1.14% 4,008,679 2.99% 192,616 0.31%Mining and quarrying 3,156,122 4.54% 60,890 0.05% 120,834 Hotel and restaurants 1,038,560 1.50% 60,814 0.05% - -Petroleum 132,463 0.19% 142,592 0.11% 1,362,052 2.17%Media channel 1,101,572 1.59% - - Manufacture of basic iron and steel 2,280,460 3.28% 61,773 0.05% 265,565 0.42%Sugar 20,791,965 29.94% 194,371 0.14% 324,055 0.52%Automobile and transportation equipment 2,711,143 3.90% 191,383 0.14% 665,443 1.06%Financial 3,611,767 5.20% 10,494,209 7.82% 53,494,264 85.31%
2017
(Rupees in Percent (Rupees in Percent (Rupees in Percent'000) '000) '000)
Contingencies andAdvances (Gross) Deposits commitments
Chemical and pharmaceuticals 960,124 1.71% 1,485,771 1.25% 22,893 0.07%Agri-business 2,567,016 4.58% 2,002,432 1.68% - -Manufacturing of textile 167,442 0.30% 144,630 0.12% 413,386 1.21%Cement 432,121 0.77% 81,059 0.07% - -Transport, storage
and communication 1,122,293 2.00% 995,841 0.84% - -Importers / exporters 378,983 0.68% 198,700 0.17% 127,147 0.37%Wholesale and retail trade 414,094 0.74% 4,396,380 3.70% 173,299 0.51%Mining and quarrying 2,758,299 4.92% 69,434 0.06% 20,420 0.06%Hotel and restaurants 1,074,455 1.92% 96,894 0.08% - -Manufacture of basic iron and steel 1,985,919 3.54% 17,005 0.01% 107,912 0.31%Sugar 16,484,721 29.41% 269,064 0.23% 121,294 0.35%Automobile and transportation
equipment 2,597,492 4.63% 147,097 0.12% 1,197,805 3.49%Financial 2,458,866 4.39% 8,393,043 7.06% 26,100,701 76.08%Rice 318,184 0.57% 70,053 0.06% - -Construction, real estate
and societies 4,375,160 7.81% 7,427,251 6.25% 1,157,825 3.38%Public sector - provincial - 0.00% 19,896,414 16.74% - 0.00%
government funds / departmentsFood 6,781,675 12.10% 155,090 0.13% 189,562 0.55%Insurance - - 11,971 0.01% - -Power, electricity and gas 6,396,929 11.41% 565,145 0.48% 1,626,946 4.74%Education 170,939 0.30% 10,315,436 8.68% 1,150 0.00%Individuals 485,240 0.87% 8,924,585 7.51% - -Others 4,118,971 7.36% 53,180,079 44.76% 3,044,656 8.88%Total 56,048,923 100% 118,843,374 100% 34,304,996 100%
2016
(Rupees in (Rupees in (Rupees in'000) % '000) Percent '000) %
Contingencies andAdvances (gross) Deposits commitments
Rice 340,252 0.49% 58,765 0.04% - -Construction, real estate and societies 4,439,688 6.39% 5,944,410 4.43% 977,303 1.56%Public sector - provincial
government funds / departments - - 19,333,927 14.41% - -Food 12,096,598 17.42% 78,765 0.06% 133,272 0.21%Insurance 17,537 - 129,495 0.10% - -Power, electricity and gas 6,492,534 9.35% 2,537,379 1.89% 2,135,452 3.41%Education 54,208 0.08% 11,859,253 8.84% 40,678 -Individuals 866,128 1.25% 11,274,998 8.40% - -Others 3,835,034 5.53% 62,605,606 46.66% 2,242,835 3.58%Total 69,453,975 100% 134,204,090 100% 62,704,482 100%
2017
(Rupees in Percent (Rupees in Percent (Rupees in Percent'000) '000) '000)
Contingencies andAdvances (gross) Deposits commitments

Annual Report2017
193 194
Pakistan 2,448,675 146,205,654 15,558,563 34,304,996
38.3 Market risk
Market Risk is the risk that the value of ‘on’ or ‘off ’ balance sheet positions will be adversely affected by movementsin equity and interest rate markets, currency exchange rates and commodity prices.
The market risk management organization in the Group comprises of the Board of Directors, BRMC, Asset andLiability Committee (ALCO), RMD and within the RMD the Market and Asset Liability Risk Management Department.
38.3.1 Foreign exchange risk
Foreign exchange risk is the risk that the Group may suffer losses as a result of adverse exchange rate movementsduring a period in which it has an open position, either in the form of a balance sheet asset or liability account, oroff balance sheet item. Likewise foreign exchange settlement risk is the risk of loss when a Group in a foreign exchangetransaction pays the currency it sold but does not receive the currency it bought. FX settlement failures can arisefrom counter party default, operational problems, market liquidity constraints and other factors.
Pakistan Rupee 145,406,060 129,474,442 (447,564) 15,484,054United States Dollar 490,410 1,004,314 573,879 59,975Great Britain Pound 199,142 122,301 (76,915) (74)Euro 96,610 46,033 (49,400) 1,177Japanese Yen 1,449 - - 1,449UAE Dirham 11,982 - - 11,982
146,205,653 130,647,090 - 15,558,563
----------------------- (Rupees in '000) -----------------------
Assets LiabilitiesOff-balancesheet items
Net foreigncurrencyexposure
As at December 31, 2016
Pakistan Rupee 203,226,828 186,796,266 (310,109) 16,120,453United States Dollar 1,031,318 1,244,601 145,875 (67,408)Great Britain Pound 166,008 280,138 132,900 18,770Euro 63,060 86,848 31,334 7,546Japanese Yen 1,081 - - 1,081Saudi Riyal 1,341 - - 1,341Canadian Dollar 17,736 17,736UAE Dirham 17,692 - - 17,692
204,525,064 188,407,853 - 16,117,211
As at December 31, 2017
Assets LiabilitiesOff-balancesheet items
Net foreigncurrencyexposure
----------------------- (Rupees in '000) -----------------------
Profitbefore
taxation
Total assetsemployed
Net assetsemployed
Contingenciesand
commitments
2016
(Rupees in '000)
Agri-business 313,622 67,997 5.73% 297,846 29,268 19.00%Importers / exporters 48,478 18,498 0.89% 18,498 18,498 1.00%Sugar 3,754,252 150,034 68.73% 500,000 84,128 32.00%Wholesale and retail trade 195,922 9,747 3.59% - - -Construction, real estate
and societies 760,463 107,471 13.92% 616,686 - 39.00%Food 188,660 43,877 3.45% 88,779 11,140 6.00%Others 200,758 - 3.68% 47,566 - 3.00%Total 5,462,155 397,624 100% 1,569,375 143,034 100%
2017 2016 ClassifiedAdvances
Specificprovision
held
ClassifiedAdvances
Specificprovision
held%
2016
38.2.4 Details of non-performing advances and specific provisions by sector
Public /Government - - - - - -
Private 5,462,155 397,624 100% 1,569,375 143,034 100%Total 5,462,155 397,624 100% 1,569,375 143,034 100%
38.2.5 Geographical segment analysis
ClassifiedAdvances
Specificprovision
held Percentage Classified
Advances
Specificprovision
held Percentage
2017 2016
(Rupees in '000) % (Rupees in '000) %
Pakistan 2,213,387 204,525,064 16,117,211 62,704,482
Profitbeforetaxation
Total assetsemployed
Net assetsemployed
Contingenciesand
commitments
2017
(Rupees in '000)
38.2.2 Details of non-performing advances and specific provisions by class of business segment
(Rupees in '000) % (Rupees in '000) %
%
2017
Public /Government 11,552,078 16.63% 79,666,844 59.36% 178,644 0.28%
Private 57,901,897 83.37% 54,537,246 40.64% 62,525,838 99.72%Total 69,453,975 100% 134,204,090 100% 62,704,482 100%
Advances (Gross) Deposits Contingencies andcommitments
38.2.3 Segment by sector
(Rupees in'000) Percent (Rupees in
'000) Percent (Rupees in'000) Percent
Public /Government 6,245,905 20.15% 68,044,899 58.07% 248,586 0.72%
Private 49,803,018 79.85% 50,798,475 41.93% 34,056,410 99.28%Total 56,048,923 100% 118,843,374 100% 34,304,996 100%
Advances (Gross) Deposits Contingencies andcommitments
(Rupees in'000) Percent (Rupees in
'000) Percent (Rupees in'000) Percent
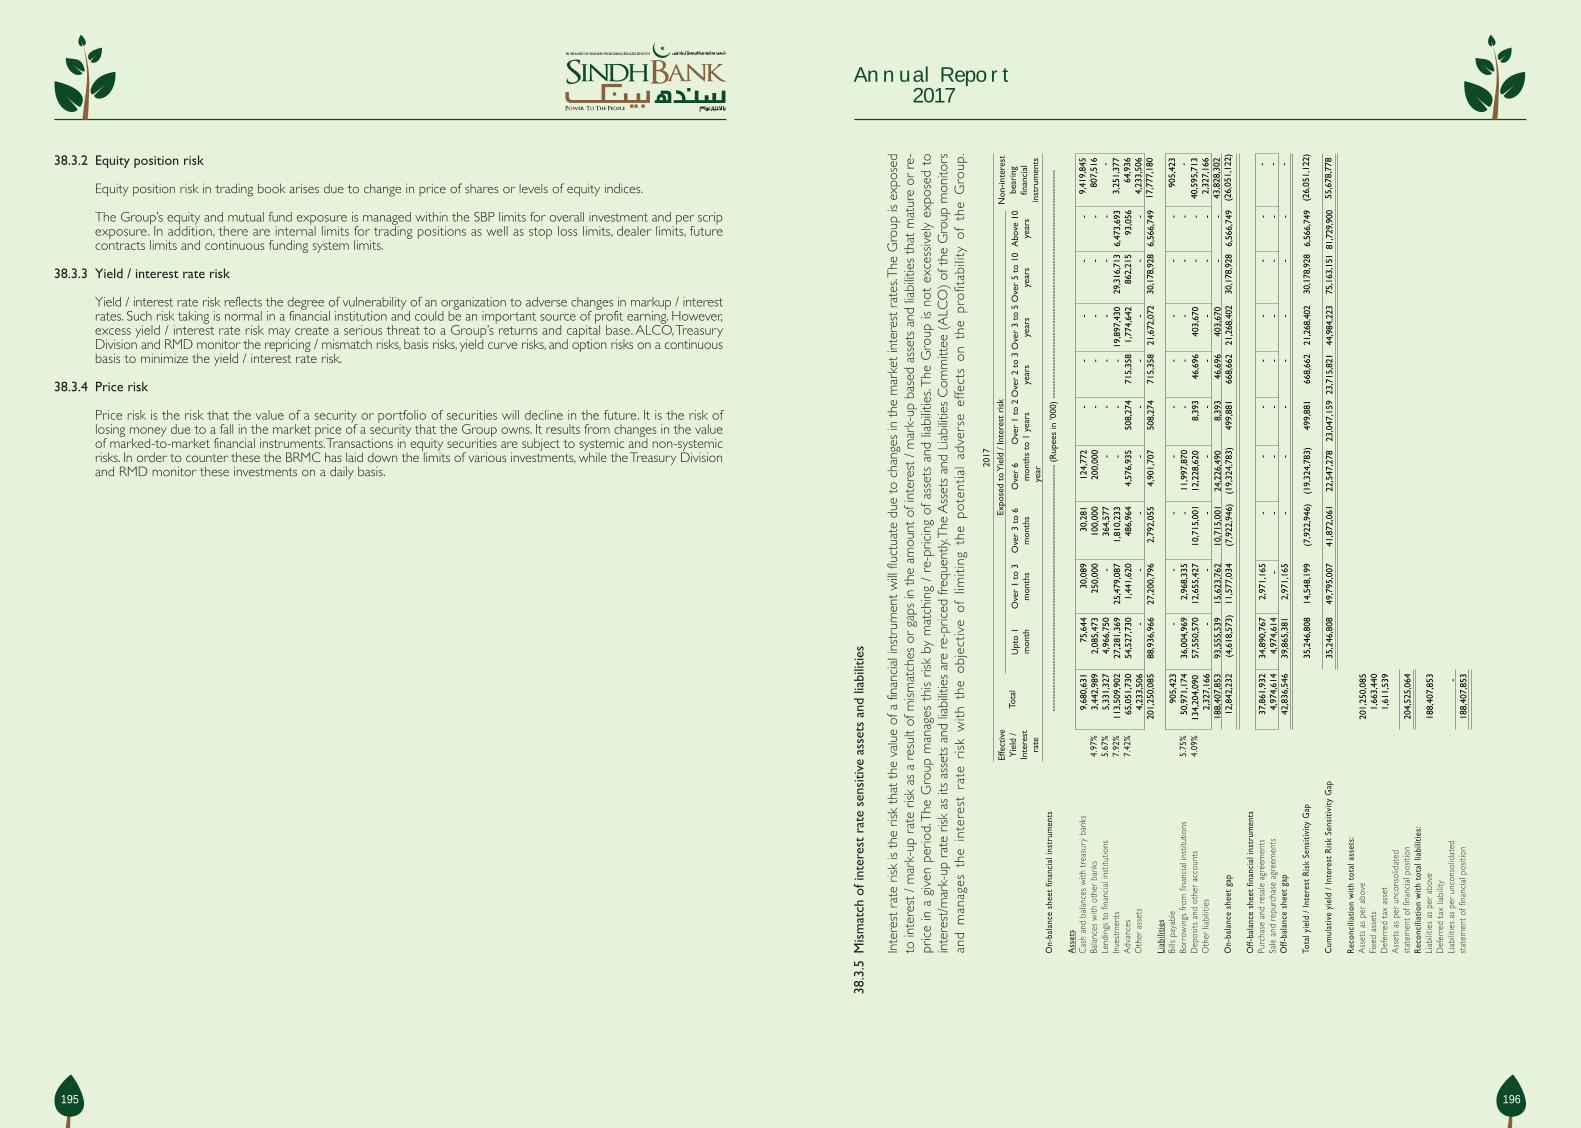
Annual Report2017
195 196
38.3.2 Equity position risk
Equity position risk in trading book arises due to change in price of shares or levels of equity indices.
The Group’s equity and mutual fund exposure is managed within the SBP limits for overall investment and per scripexposure. In addition, there are internal limits for trading positions as well as stop loss limits, dealer limits, futurecontracts limits and continuous funding system limits.
38.3.3 Yield / interest rate risk
Yield / interest rate risk reflects the degree of vulnerability of an organization to adverse changes in markup / interestrates. Such risk taking is normal in a financial institution and could be an important source of profit earning. However,excess yield / interest rate risk may create a serious threat to a Group’s returns and capital base. ALCO, TreasuryDivision and RMD monitor the repricing / mismatch risks, basis risks, yield curve risks, and option risks on a continuousbasis to minimize the yield / interest rate risk.
38.3.4 Price risk
Price risk is the risk that the value of a security or portfolio of securities will decline in the future. It is the risk oflosing money due to a fall in the market price of a security that the Group owns. It results from changes in the valueof marked-to-market financial instruments. Transactions in equity securities are subject to systemic and non-systemicrisks. In order to counter these the BRMC has laid down the limits of various investments, while the Treasury Divisionand RMD monitor these investments on a daily basis.
38.3
.5M
ism
atch
of i
nter
est
rate
sen
sitiv
e as
sets
and
liab
ilitie
s
Inte
rest
rat
e ris
k is
the
risk
that
the
val
ue o
f a fi
nanc
ial i
nstr
umen
t w
ill flu
ctua
te d
ue t
o ch
ange
s in
the
mar
ket
inte
rest
rat
es. T
he G
roup
is e
xpos
edto
inte
rest
/ m
ark-
up r
ate
risk
as a
res
ult
of m
ismat
ches
or
gaps
in t
he a
mou
nt o
f int
eres
t / m
ark-
up b
ased
ass
ets
and
liabi
litie
s th
at m
atur
e or
re-
pric
e in
a g
iven
per
iod.
The
Gro
up m
anag
es t
his
risk
by m
atch
ing
/ re
-pric
ing
of a
sset
s an
d lia
bilit
ies.
The
Gro
up is
not
exc
essiv
ely
expo
sed
toin
tere
st/m
ark-
up r
ate
risk
as it
s as
sets
and
liab
ilitie
s ar
e re
-pric
ed fr
eque
ntly.
The
Ass
ets
and
Liab
ilitie
s C
omm
ittee
(A
LCO
) of
the
Gro
up m
onito
rsan
d m
anag
es t
he i
nter
est
rate
ris
k w
ith t
he o
bjec
tive
of
limiti
ng t
he p
ote
ntia
l ad
vers
e ef
fect
s o
n th
e pr
ofit
abili
ty o
f th
e G
roup
.
On-
bala
nce
shee
t fin
anci
al in
stru
men
ts
Ass
ets
Cas
h an
d ba
lanc
es w
ith t
reas
ury
bank
sBa
lanc
es w
ith o
ther
ban
ks4.
97%
Lend
ings
to
finan
cial
inst
itutio
ns5.
67%
Inve
stm
ents
7.92
%A
dvan
ces
7.42
%O
ther
ass
ets
Liab
ilitie
sBi
lls p
ayab
leBo
rrow
ings
from
fina
ncia
l ins
titut
ions
5.75
%D
epos
its a
nd o
ther
acc
ount
s4.
09%
Oth
er li
abili
ties
On-
bala
nce
shee
t ga
p
Off-
bala
nce
shee
t fin
anci
al in
stru
men
tsPu
rcha
se a
nd r
esal
e ag
reem
ents
Sale
and
rep
urch
ase
agre
emen
tsO
ff-ba
lanc
e sh
eet
gap
Tota
l yie
ld /
Inte
rest
Ris
k Se
nsiti
vity
Gap
Cum
ulat
ive
yiel
d / I
nter
est
Risk
Sen
sitiv
ity G
ap
Reco
ncili
atio
n w
ith t
otal
ass
ets:
Ass
ets
as p
er a
bove
Fixe
d as
sets
Def
erre
d ta
x as
set
Ass
ets
as p
er u
ncon
solid
ated
stat
emen
t of
fina
ncia
l pos
ition
Reco
ncili
atio
n w
ith t
otal
liab
ilitie
s:Li
abili
ties
as p
er a
bove
Def
erre
d ta
x lia
bilit
yLi
abili
ties
as p
er u
ncon
solid
ated
stat
emen
t of
fina
ncia
l pos
ition
9,
680,
631
3,44
2,98
9
5,33
1,32
7 1
13,5
09,9
02
65,0
51,7
30
4,23
3,50
6 2
01,2
50,0
85
90
5,42
3
50,9
71,1
74 1
34,2
04,0
90
2,32
7,16
6 1
88,4
07,8
53
12,8
42,2
32
37
,861
,932
4,
974,
614
42,
836,
546
201,
250,
085
1,
663,
440
1,
611,
539
204,
525,
064
188,
407,
853 -
188,
407,
853
75,6
442,
085,
473
4,96
6,75
027
,281
,369
54,5
27,7
30
-88
,936
,966 -
36,0
04,9
6957
,550
,570 -
93,5
55,5
39
(4,6
18,5
73)
34,8
90,7
674,
974,
614
39,8
65,3
81
35,2
46,8
08
35,2
46,8
08
30
,089
250
,000 -
25
,479
,087
1,
441,
620
-
27
,200
,796
-
2,
968,
335
12,
655,
427
-
15
,623
,762
11
,577
,034
2,
971,
165
-
2,
971,
165
14,
548,
199
49
,795
,007
30
,281
10
0,00
0
364,
577
1,
810,
233
48
6,96
4
-
2,79
2,05
5
-
-
10,
715,
001
-
10,
715,
001
(7,
922,
946)
-
-
-
(7,
922,
946)
41,
872,
061
12
4,77
2
200,
000
-
-
4,
576,
935
-
4,
901,
707
-
11,
997,
870
12,
228,
620
-
24,
226,
490
(19,
324,
783)
-
-
-
(19,
324,
783)
22,
547,
278
-
-
-
-
508,
274
-
50
8,27
4
- -
8,39
3
-
8,39
3
499,
881
-
-
-
49
9,88
1
23,0
47,1
59
- - - -
715
,358
-
71
5,35
8
- - 4
6,69
6
-
46,6
96
668,
662
- -
-
66
8,66
2 23
,715
,821
-
-
-
19,8
97,4
301,
774,
642
-
21,
672,
072
- -
403,
670
-
403,
670
21,
268,
402
- -
-
21,
268,
402
44,
984,
223
-
-
-
29,
316,
713
862,
215 -
30,
178,
928
-
-
-
-
-
30,
178,
928
- -
-
30,
178,
928
75,
163,
151
-
-
-
6,4
73,6
93
93,0
56
- 6
,566
,749
-
-
-
-
-
6,5
66,7
49
-
-
-
6,5
66,7
49
81,7
29,9
00
9,
419,
845
80
7,51
6
-
3,25
1,37
7
64,9
36
4,23
3,50
6 1
7,77
7,18
0
90
5,42
3
- 4
0,59
5,71
3
2,32
7,16
6 4
3,82
8,30
2 (
26,0
51,1
22)
-
-
-
(26
,051
,122
)
55,6
78,7
78
2017
----
----
----
----
----
----
----
----
----
----
----
----
----
----
----
----
----
----
----
----
-- (
Rup
ees
in '0
00)
----
----
----
----
----
----
----
----
----
----
----
----
----
----
----
----
----
----
----
Exp
osed
to
Yie
ld /
Inte
rest
ris
kEf
fect
ive
Yie
ld /
Inte
rest
rate
Tota
lU
pto
1m
onth
Ove
r 1
to 3
mon
ths
Ove
r 3
to 6
mon
ths
O
ver
6m
onth
s to
1ye
ar
Ove
r 1
to 2
year
sO
ver
2 to
3ye
ars
Ove
r 3
to 5
year
sO
ver
5 to
10
year
sA
bove
10
year
s
Non
-inte
rest
bear
ing
finan
cial
inst
rum
ents

Annual Report2017
197 198
Ove
r 1
to 3
mon
ths
On-
bala
nce
shee
t fin
anci
al in
stru
men
ts
Ass
ets
Cas
h an
d ba
lanc
es w
ith t
reas
ury
bank
sBa
lanc
es w
ith o
ther
ban
ks2.
04%
Lend
ings
to
finan
cial
inst
itutio
ns5.
25%
Inve
stm
ents
8.73
%A
dvan
ces
7.76
%O
ther
ass
ets
6.38
%
Liab
ilitie
sBi
lls p
ayab
leBo
rrow
ings
from
fina
ncia
l ins
titut
ions
6.15
%D
epos
its a
nd o
ther
acc
ount
s4.
51%
Oth
er li
abilit
ies
On-
bala
nce
shee
t ga
p
Off-
bala
nce
shee
t fin
anci
al in
stru
men
tsPu
rcha
se a
nd r
esal
e ag
reem
ents
Sale
and
rep
urch
ase
agre
emen
tsO
ff-ba
lanc
e sh
eet
gap
Tota
l yie
ld /
Inte
rest
Ris
k Se
nsiti
vity
Gap
Cum
ulat
ive
yiel
d / I
nter
est
Ris
k Se
nsiti
vity
Gap
Rec
onci
liatio
n w
ith t
otal
ass
ets:
Ass
ets
as p
er a
bove
Fixe
d as
sets
Def
erre
d ta
x as
set
Ass
ets
as p
er u
ncon
solid
ated
sta
tem
ent
of fi
nanc
ial p
ositi
on
Rec
onci
liatio
n w
ith t
otal
liab
ilitie
s:Li
abilit
ies
as p
er a
bove
Def
erre
d ta
x lia
bilit
yLi
abilit
ies
as p
er u
ncon
solid
ated
stat
emen
t of
fina
ncia
l pos
ition
7,5
02,6
24 1
,191
,478
6,9
38,6
10
70,8
89,7
37
51,9
01,8
38
4,75
8,40
7 1
43,1
82,6
94
71
4,21
2
8,91
0,73
8 1
18,8
43,3
74
2,17
8,76
6 1
30,6
47,0
90
12,5
35,6
04
4,
941,
750
6,
191,
349
11
,133
,099
143
,182
,694
1,
832,
882
1,
190,
077
146
,205
,653
130,
647,
090
-
130
,647
,090
47,6
7920
0,00
0 -
676,
001
6,77
9,71
1
-7,
703,
391
-1,
081,
500
11,5
24,9
48 -12
,606
,448
(4,9
03,0
57)
-
-
-
(4,9
03,0
57)
736,
126
35
,171
40
0,00
0
- 1
,525
,830
41
3,77
9
- 2
,374
,780
-
1,4
91,8
2310
,794
,966
-
12,2
86,7
89 (
9,91
2,00
9)
-
-
-
(9,
912,
009)
(9,
175,
883)
Ove
r 2
to 3
year
sO
ver
3 to
5ye
ars
Ove
r 5
to 1
0ye
ars
Abo
ve 1
0ye
ars
Effe
ctiv
eY
ield
/In
tere
stra
te
Upt
o 1
mon
th
2016
----
----
----
----
----
----
----
----
----
----
----
----
----
----
----
----
----
----
----
----
-- (
Rup
ees
in '0
00)
----
----
----
----
----
----
----
----
----
----
----
----
----
----
----
----
----
----
----
Exp
osed
to
Yie
ld /
Inte
rest
risk
Ove
r 3
to 6
mon
ths
O
ver
6m
onth
s to
1ye
ar
Non
-inte
rest
bear
ing
finan
cial
inst
rum
ents
Tota
l
69
,142
57
6,46
2
6,93
8,61
0
8,98
3,31
7
34,2
69,4
85
529,
685
51,3
66,7
01
-6,
337,
415
50,5
23,2
02
-56
,860
,617
(5
,493
,916
)
4,
941,
750
6,19
1,34
911
,133
,099
5,63
9,18
3
5,63
9,18
3
33
,411
- -
204,
900
3,90
9,62
4 -
4,14
7,93
5
- -13
,394
,522
-
13,3
94,5
22(9
,246
,587
)
- - -
(9,2
46,5
87)
18,4
22,4
70
- - - -
1,0
33,9
35 -
1,03
3,93
5
- - 1
99,9
27 -
199,
927
83
4,00
8
-
- -
83
4,00
8
(17,
588,
462)
-
-
-
-
915,
296
-
91
5,29
6
-
-
11
,310
-
11
,310
90
3,98
6
-
- -
90
3,98
6
(16,
684,
476)
- - -
118
2,5
45,9
09 - 2
,546
,027
-
-
10
2,80
0
-
102,
800
2,4
43,2
27 -
-
-
2,44
3,22
7
(14,
241,
249)
- - - 5
0,44
2,90
3 1
,633
,553 -
52,
076,
456
-
-
-
- -
52,
076,
456
-
-
-
52,
076,
456
37,
835,
207
- - - 6
,523
,318
35
0,35
8
-
6,87
3,67
6
-
- - - -
6,8
73,6
76 - -
-
6,
873,
676
44,7
08,8
83
7,3
17,2
21 1
5,01
6 -
2,5
33,3
50
50,1
88 4
,228
,722
14
,144
,497
71
4,21
2
-
32,2
91,6
99 2
,178
,766
35,
184,
677
(21
,040
,180
)
- - - (21
,040
,180
)
23,6
68,7
03
Ove
r 1
to 2
year
s
2017
Tota
lU
pto
1m
onth
Ove
r 1
to 3
mon
ths
Ove
r 3
to 6
mon
ths
Ove
r 6
mon
ths
to 1
yea
rO
ver
1 to
2yea
rsO
ver
2 to
3ye
ars
Ove
r 3
to 5
year
sO
ver
5 to
10
year
sA
bove
10
year
s
----
----
----
----
----
----
----
----
----
----
----
----
----
----
----
----
----
----
----
----
----
----
- (R
upee
s in
'000
) --
----
----
----
----
----
----
----
----
----
----
----
----
----
----
----
----
----
----
----
----
----
----
----
-
38.4
Liqu
idity
ris
kLi
quid
ity r
isk r
efer
s to
the
pot
entia
l ina
bilit
y of
the
Gro
up t
o m
eet
its fu
ndin
g re
quire
men
ts a
risin
g fr
om c
ash
flow
mism
atch
es a
t a
reas
onab
leco
st (
fund
ing
liqui
dity
risk
). Li
quid
ity r
isk a
lso a
rises
due
to
the
Gro
up’s
pote
ntia
l ina
bilit
y to
liqu
idat
e po
sitio
ns q
uick
ly a
nd in
suf
ficie
nt v
olum
es,
at a
rea
sona
ble
pric
e (m
arke
t liq
uidi
ty r
isk).
Liqu
idity
risk
man
ifest
s in
diff
eren
t di
men
sions
, viz
. fun
ding
risk
, tim
e ris
k an
d re
ason
s lik
e tig
ht li
quid
ityco
nditi
ons.
The
BRM
C h
as la
id d
own
polic
ies
to b
e fo
llow
ed to
ens
ure
prop
er a
vaila
bilit
y of
liqu
idity
and
ALC
O m
onito
rs th
e liq
uidi
ty p
ositi
on o
f the
Gro
upon
a r
egul
ar b
asis.
On
a da
y to
day
bas
is th
e Tr
easu
ry D
ivisi
on c
ontr
ols
the
liqui
dity
of t
he G
roup
and
it is
mon
itore
d by
the
Mar
ket
and
Ass
etLi
abilit
y Ri
sk M
anag
emen
t U
nit
of t
he R
MD
.38
.4.1
Mat
urity
of a
sset
s an
d lia
bilit
ies
(bas
ed o
n co
ntra
ctua
l mat
uriti
es)
Ass
ets
Cas
h an
d ba
lanc
es w
ith t
reas
ury
bank
sBa
lanc
es w
ith o
ther
ban
ksLe
ndin
gs t
o fin
anci
al in
stitu
tions
Inve
stm
ents
Adv
ance
sO
pera
ting
fixed
ass
ets
Def
erre
d ta
x as
set
Oth
er a
sset
s
Liab
ilitie
sBi
lls p
ayab
leBo
rrow
ings
from
fina
ncia
l ins
titut
ions
Dep
osits
and
oth
er a
ccou
nts
Def
erre
d ta
x lia
bilit
yO
ther
liab
ilitie
s
Gap
Shar
e ca
pita
lRe
serv
esU
napp
ropr
iate
d pr
ofit
Def
icit
on r
eval
uatio
n of
inve
stm
ents
Net
ass
ets
9,
680,
631
3,
442,
989
5,
331,
327
113,
509,
902
65,
051,
730
1,
663,
440
1,
611,
539
4,
233,
506
204,
525,
064
90
5,42
3 5
0,97
1,17
413
4,20
4,09
0
-
2,32
7,16
618
8,40
7,85
3 1
6,11
7,21
1
10,0
10,1
30
1,46
4,32
9
5,21
2,87
3
(570
,121
) 1
6,11
7,21
1
9,
680,
631
2,8
92,9
89
4,96
6,75
0
30,5
32,7
46
10,4
23,2
45
39,1
59
161,
121
2,
890,
937
61
,587
,578
905,
423
34,8
68,4
6996
,771
,701
-
1,34
7,93
313
3,89
3,52
6 (
72,3
05,9
48)
-
25
0,00
0
- 2
4,85
4,99
0
3,85
2,65
9
29,3
54
483,
583
88
0,80
3 3
0,35
1,38
9 -
4,10
4,83
5 1
2,65
5,42
7
-
316,
661
17,
076,
923
13,
274,
466
-
10
0,00
0
364,
577
-
16,
336,
089
44
,520
32
2,38
9
262,
132
17,
429,
707
-
-
10,
715,
001
-
24
8,91
9 1
0,96
3,92
0
6,46
5,78
7
-
200
,000
-
52
7,10
0 1
4,26
2,62
1
90,0
18
644,
446
11
6,11
0 1
5,84
0,29
5 - 1
1,99
7,87
0 1
2,96
1,62
6
-
396,
902
25,
356,
398
(9,
516,
103)
-
-
-
256,
301
1,2
45,1
83
178,
568
-
62
,251
1,7
42,3
03
-
-
8,
393
-
72
8,
465
1,7
33,8
38
-
-
-
49
9,70
0 3
,118
,400
17
8,57
6
-
14,3
53 3
,811
,029
-
-
46
,696
-
5,
614
52
,310
3,7
58,7
19
- -
-
20,
293,
975
5,
232,
314
30
2,61
1
-
208
25,
829,
108 -
-
64
5,99
4
- 1
1,06
5
657,
059
25,
172,
049
-
-
-
30,
071,
398
7,
063,
106
80
0,63
4
- 6
,712
37,
941,
850 -
-
39
9,25
2
-
-
399,
252
37,
542,
598
-
-
-
6,4
73,6
92 3
,518
,113 -
-
-
9,9
91,8
05
-
- -
-
-
-
9,9
91,8
05

Annual Report2017
199 200
2016
Tota
lU
pto
1m
onth
Ove
r 1
to 3
mon
ths
Ove
r 3
to 6
mon
ths
Ove
r 6
mon
ths
to 1
yea
rO
ver
1 to
2ye
ars
Ove
r 2
to 3
year
sO
ver
3 to
5ye
ars
Ove
r 5
to 1
0ye
ars
Abo
ve 1
0ye
ars
----
----
----
----
----
----
----
----
----
----
----
----
----
----
----
----
----
----
----
----
----
----
- (R
upee
s in
'000
) --
----
----
----
----
----
----
----
----
----
----
----
----
----
----
----
----
----
----
----
----
----
----
----
-A
sset
sC
ash
and
bala
nces
with
tre
asur
y ba
nks
Bala
nces
with
oth
er b
anks
Lend
ings
to
finan
cial
inst
itutio
nsIn
vest
men
tsA
dvan
ces
Ope
ratin
g fix
ed a
sset
sD
efer
red
tax
asse
tO
ther
ass
ets
Liab
ilitie
sBi
lls p
ayab
leBo
rrow
ings
from
fina
ncia
l ins
titut
ions
Dep
osits
and
oth
er a
ccou
nts
Def
erre
d ta
x lia
bilit
yO
ther
liab
ilitie
s
Gap
Shar
e ca
pita
lRe
serv
esU
napp
ropr
iate
d pr
ofit
Surp
lus
on r
eval
uatio
n of
inve
stm
ents
Net
ass
ets
7,
502,
624
1,1
91,4
78
6,93
8,61
0
70,8
89,7
37 5
1,90
1,83
8
1,83
2,88
2
1,19
0,07
7
4,75
8,40
7 1
46,2
05,6
53
714,
212
8,
910,
738
118
,843
,374
-
2,1
78,7
66 1
30,6
47,0
90
15,5
58,5
63
10
,010
,130
1,2
07,7
31
4,20
6,67
0
134,
032
15
,558
,563
7,5
02,6
24 5
91,4
78
6,93
8,61
0 1
2,26
6,66
6
9,15
1,15
4
48,9
60
118,
580
3,
126,
367
39,
744,
439
714,
212
7,
418,
915
82,
814,
901
-
1,
335,
412
92,
283,
440
(52
,539
,001
)
-
200
,000 -
49
7,43
0 8
,131
,791
36
,392
11
8,98
8
709,
117
9,6
93,7
18 - -11
,524
,948 -
31
0,84
3 1
1,83
5,79
1 (
2,14
2,07
3)
-
40
0,00
0 -
34
5,82
6 2
,377
,939
54
,887
11
8,98
8
298,
599
3,5
96,2
39 -1,
491,
823
10,7
94,9
66
-
263,
548
12,5
50,3
37(8
,954
,098
)
-
-
-
536,
577
7,88
6,47
910
8,58
123
7,97
645
,047
8,81
4,66
0 -
-13
,394
,522
-
255,
678
13,6
50,2
00(4
,835
,540
)
-
-
-
42
9,22
9 3
,379
,456
21
7,75
8
297,
470
45
,009
4,3
68,9
22 - - 1
99,9
27 -
8,05
5
207,
982
4,1
60,9
40
-
-
-
40
2,
852,
593
21
7,77
0
298,
075
4,
583
3,
373,
061 -
-
11
,310
-
55
11
,365
3,
361,
696
- - -
496,
932
5,
689,
894
36
0,38
0
-
529,
685
7,
076,
891 - -
10
2,80
0
- 5
,175
10
7,97
5
6,96
8,91
6
- -
-
50,
543,
717
10,
147,
941
35
6,56
3 - -
61,
048,
221
-
- -
-
-
- 6
1,04
8,22
1
- - - 5
,773
,320
2,2
84,5
91 4
31,5
91
- -
8,48
9,50
2
-
-
-
-
-
-
8,48
9,50
2
2017
----
----
----
----
----
----
----
----
----
----
----
----
----
----
----
----
----
----
----
----
----
----
---
(Rup
ees
in '0
00)
----
----
----
----
----
----
----
----
----
----
----
----
----
----
----
----
----
----
----
----
----
----
---
Tota
lU
pto
1m
onth
Ove
r 1
to 3
mon
ths
Ove
r 3
to 6
mon
ths
Ove
r 6
mon
ths
to 1
yea
rO
ver
1 to
2ye
ars
Ove
r 2
to 3
year
sO
ver
3 to
5ye
ars
Ove
r 5
to 1
0ye
ars
Abo
ve 1
0ye
ars
Ass
ets
Cas
h an
d ba
lanc
es w
ith t
reas
ury
bank
sBa
lanc
es w
ith o
ther
ban
ksLe
ndin
gs t
o fin
anci
al in
stitu
tions
Inve
stm
ents
Adv
ance
sO
pera
ting
fixed
ass
ets
Def
erre
d ta
x as
set
Oth
er a
sset
s
Liab
ilitie
sBi
lls p
ayab
leBo
rrow
ings
from
fina
ncia
l ins
titut
ions
Dep
osits
and
oth
er a
ccou
nts
Def
erre
d ta
x lia
bilit
yO
ther
liab
ilitie
s
Gap
Shar
e ca
pita
lRe
serv
esU
napp
ropr
iate
d pr
ofit
Def
icit
on r
eval
uatio
n of
inve
stm
ents
Net
ass
ets
2,63
7,02
22,
892,
989
4,96
6,75
027
,281
,369
10,4
23,2
4539
,159
161,
121
2,89
0,93
751
,292
,592
905,
423
34,8
68,4
6917
,148
,713
-
1,34
7,93
354
,270
,538
(2,
977,
946)
9,68
0,63
13,
442,
989
5,33
1,32
711
3,50
9,90
265
,051
,730
1,66
3,44
01,
611,
539
4,23
3,50
620
4,52
5,06
4
905,
423
50,9
71,1
7413
4,20
4,09
0 -
2,32
7,16
618
8,40
7,85
3 1
6,11
7,21
1
10,
010,
130
1,4
64,3
29 5
,212
,873
(57
0,12
1)16
,117
,211
1,17
4,97
825
0,00
0
-26
,206
,874
3,85
2,65
929
,354
483,
583
880,
803
32,8
78,2
51
-
4,10
4,83
522
,022
,838
-
316,
661
26,4
44,3
346,
433,
917
1,11
3,57
010
0,00
036
4,57
71,
189,
471
16,6
74,4
7844
,520
322,
389
262,
132
20,0
71,1
37
-
-
20,0
82,4
12
-24
8,91
920
,331
,331
(260
,194
)
4,
755,
061
200
,000 -
1,
175,
818
13
,924
,232
90
,018
64
4,44
6
116,
110
20
,905
,685
-
11,
997,
870
73,
849,
793
-
39
6,90
2
86,2
44,5
65 (
65,3
38,8
80)
-
-
-
256,
301
1,24
5,18
317
8,56
8
-62
,251
1,74
2,30
3
-
-
8,39
3 - 728,
465
1,73
3,83
8
-
-
-
49
9,70
0 3
,118
,400
17
8,57
6
-
14,3
53 3
,811
,029
-
-
46
,696
-
5,
614
52
,310
3,7
58,7
19
-
-
-
20,2
93,9
75 5
,232
,314
30
2,61
1
- 208
25,
829,
108
-
-
64
5,99
5
-
11,0
65
657,
060
25,
172,
048
-
-
-
30,
132,
703
7,
063,
106
80
0,63
4
-
6,71
2 3
8,00
3,15
5
-
-
39
9,25
0
-
-
399,
250
37,
603,
905
38.4
.2M
atur
ity o
f ass
ets
and
liabi
litie
s (b
ased
on
SBP
BSD
Cir
cula
r N
o. 0
2 da
te F
ebru
ary
22, 2
011)
-
-
-
6,4
73,6
91 3
,518
,113
-
-
-
9,9
91,8
04
-
-
-
-
-
-
9,9
91,8
04
Whe
re a
n as
set
or a
liab
ility
doe
s no
t ha
ve a
con
trac
tual
mat
urity
dat
e, t
he p
erio
d in
whi
ch t
hese
are
ass
umed
to
mat
ure
have
bee
n ta
ken
asex
pect
ed d
ate
of m
atur
ity, b
ased
on
the
crite
ria d
eter
min
ed b
y A
LCO
of t
he G
roup
.

Annual Report2017
201 202
2016
----
----
----
----
----
----
----
----
----
----
----
----
----
----
----
----
----
----
----
----
----
----
---
(Rup
ees
in '0
00)
----
----
----
----
----
----
----
----
----
----
----
----
----
----
----
----
----
----
----
----
----
----
---
Tota
lU
pto
1m
onth
Ove
r 1
to 3
mon
ths
Ove
r 3
to 6
mon
ths
Ove
r 6
mon
ths
to 1
yea
rO
ver
1 to
2ye
ars
Ove
r 2
to 3
year
sO
ver
3 to
5ye
ars
Ove
r 5
to 1
0ye
ars
Abo
ve 1
0ye
ars
Ass
ets
Cas
h an
d ba
lanc
es w
ith tr
easu
ry b
anks
Bala
nces
with
oth
er b
anks
Lend
ings
to
finan
cial
inst
itutio
nsIn
vest
men
tsA
dvan
ces
Ope
ratin
g fix
ed a
sset
sD
efer
red
tax
asse
tO
ther
ass
ets
Liab
ilitie
sBi
lls p
ayab
leBo
rrow
ings
from
fina
ncia
l ins
titut
ions
Dep
osits
and
oth
er a
ccou
nts
Def
erre
d ta
x lia
bilit
yO
ther
liab
ilitie
s
Gap
Shar
e ca
pita
lRe
serv
esU
napp
ropr
iate
d pr
ofit
Surp
lus
on r
eval
uatio
n of
inve
stm
ents
Net
ass
ets
7,
502,
624
1,
191,
478
6,
938,
610
70
,889
,737
51
,901
,838
1,
832,
882
1,
190,
077
4,
758,
407
146
,205
,653
714
,212
8,9
10,7
38 1
18,8
43,3
74 -
2,17
8,76
6 1
30,6
47,0
90
15,5
58,5
63
10
,010
,130
1,
207,
731
4,
206,
670
13
4,03
2
15,5
58,5
63
3,
139,
546
59
1,47
8
6,93
8,61
0
8,98
5,05
8
9,15
1,15
4
48,9
60
119,
185
3,
123,
459
32,
097,
450
71
4,21
2
6,33
7,41
5 2
6,82
9,74
8
-
1,30
2,49
6 3
5,18
3,87
1
(3,0
86,4
21)
1,
919,
419
40
0,00
0
- 1
,237
,878
2,
377,
939
54
,887
11
8,98
8
298,
599
6,
407,
710
-
1,
491,
823
27,
436,
495
-
26
3,54
8 2
9,19
1,86
6(2
2,78
4,15
6)
15
5,88
6
-
-
1,09
5,77
2
7,88
6,47
9
108,
581
23
7,97
6
45,0
47
9,52
9,74
1
-
-
31,
709,
259
-
28
8,59
8 3
1,99
7,85
7 (
22,4
68,1
16)
-
-
-
42
9,22
9 3
,379
,456
21
7,75
8
297,
470
45
,009
4,3
68,9
22
-
-
19
9,92
7
-
8,05
5
207,
982
4,1
60,9
40
-
-
-
25
0,00
1
2,85
2,59
3
217,
770
29
7,47
0 4
,584
3,
622,
418
-
-
11
,310
-
55
11
,365
3,
611,
053
- - -
49
6,93
2 5
,689
,894
36
0,38
0
- 5
29,6
85 7
,076
,891
-
-
10
2,80
0
-
5,17
1 1
07,9
71 6
,968
,920
-
-
-
50,
543,
717
10,1
47,9
41
356,
563
-
-
61,
048,
221
-
-
42
5,09
0
-
-
425,
090
60,
623,
131
-
-
- 6
,521
,577
2,2
84,5
9143
1,59
1 -
2,90
7 9
,240
,666
-
-
-
-
-
-
9,2
40,6
66
Whe
re a
n as
set o
r a
liabi
lity
does
not
hav
e a
cont
ract
ual m
atur
ity d
ate,
the
perio
d in
whi
ch th
ese
are
assu
med
to m
atur
e ha
ve b
een
take
n as
exp
ecte
dda
te o
f mat
urity
, bas
ed o
n th
e cr
iteria
det
erm
ined
by
ALC
O o
f the
Gro
up.
2,
287,
773
20
0,00
0 -
1,3
29,5
738,
131,
791
36,
392
11
8,98
8
709,
117
12,
813,
634
- 1
,081
,500
32,
128,
745
-31
0,84
333
,521
,088
(20
,707
,454
)
38.5 Operational risk
Operational risk is the risk of loss resulting from inadequate or failed internal processes, people and systems or fromexternal events; which includes legal risk, but excludes strategic and reputational risk.
The Operational Risk Management Department (ORMD) works under the RMD and its responsibilities includeidentifying, monitoring, measuring and managing operational risks assumed by the Group. In adherence to industrybest practice, the key functions of the ORMD are the operational risk policy and planning function, operational riskassessment function, operational risk measurement and analytics function and operational risk monitoring, mitigationand control function.
39. GENERAL
Figures have been rounded off to the nearest thousand rupee.
40. DATE OF AUTHORISATION FOR ISSUE
These consolidated financial statements were authorised for issue by the Board of Directors on March 07, 2018.
Chairman President and Chief Executive Officer Director Director Chief Financial Officer

Annual Report2017
204203
NOTICE OF SEVENTH ANNUAL GENERAL MEETINGNOTICE is hereby given that the Seventh Annual General Meeting of Sindh Bank Limited will be held on March 29, 2018 at 10.00 a.m at Federation House, Clifton,Karachi to transact the following business:
Ordinary Business:1- To confirm the minutes of 4th Extra-ordinary General Meeting held on 7th November, 2017.2- To receive, consider and adopt the Audited consolidated/un-consolidated Accounts of the Bank for the period ended 31st December,2017, together with
Directors' and Auditors' Reports thereon and pass necessary Resolutions in this regard.3. To consider appointment of Auditors of the Bank for the year 2018 and fix their remuneration. The retiring Auditors M/s. EY Ford Rhodes , Chartered
Accountants, being eligible, have offered themselves for reappointment.4- To elect 7 directors of the Bank as fixed by the Directors in their meeting held on 6th February, 2018, for the next term of three years in terms of section
159 of Companies Act, 2017. Following directors of the Bank will stand retired on 6th April, 2018 and retiring directors at Sr. # 3, 4 and 5 having completedtheir tenure under the Banking Companies Ordinance 1962 are not eligible for re-election.
1. Mr. Afzal Ghani 2. Finance Secretary (GoS) 3. Mr. Mohammad Shahid Murtaza 4. Mr. Muhammad Naeem Sahgal5. Mr. Raja Muhammad Abbas 6. Mr. Tajammal Husain Bokharee 7. Mr. Muhammad Bilal Sheikh
Special Business:1- To approve amendment in Article 116 of Articles of Association to bring it in conformity of Prudential Regulations # G-2 of SBP.2- To approve payment of remuneration and provision of certain facilities to the President/CEO of the Bank.3- To approve reimbursement of administrative expenses pertaining to office, staff and security of the Chairman in terms of SBP BPRD Circular # 09 of 2015
dated May 06, 2015.4- To grant post facto approval for the payment of remuneration to non-executive Directors including Chairman, fixed by the Board, in terms of SBP Prudential
Regulations # G-1C(2).
A statement of material facts under section 134(3) of the Companies Act, 2017 relating to aforesaid special business to be transacted is appended below.
5- Any other business with the permission of the chair.
By order of the Board
Shamsuddin KhanCompany Secretary
NOTES:(i) All members are entitled to attend and vote at the Meeting.(ii) A member entitled to attend and vote at this meeting may appoint any other member as his/her proxy to attend and vote.(iii) The instrument of proxy and the power of attorney or other commission (if any) under which it is signed, or notarized certified copy of that power of
attorney or authority to be effective must be deposited at the Registered Office of the company, not less than 48 hours before the time for holding theMeeting.
(iv) Members are advised to bring their National Identity Cards along with CD Participant ID and account number at the meeting venue(v) If any proxies are granted by any such shareholders, the same must be accompanied with attested copies of the National Identify Cards/Authority Letter
of the grantors and the signatures on the proxy form should be the same as that appearing on the National Identity Cards/Authority Letter.(vi) Any person who seeks to contest the election for the office of directors shall, whether he is a retiring director or otherwise, file with the Bank's registered
office not later than 14 days before the date of meeting at which election are to be held, his intention to offer himself for the election of directors in termsof section 159 of the Companies Act, 2017.
The Share transfer books of the company will remain closed from 23rd March, 2018 to 29th March, 2018 (both days inclusive). CDC Transaction IDs received inorder at the Registered Office of the Company up to the close of business on 22nd March, 2018 will be considered as on time for the determination of entitlementof shareholder to attend and vote at the meeting. Members are required to notify immediately changes, if any, in their registered address.
Statement under section 134(3)1- Article 116 of the Articles of Association of the Bank was considered by SBP in contradiction of Regulation # G-2 of Prudential Regulations of SBP and
had suggested for its amendment. Accordingly, the said Article 116 is intended to be amended to bring it in conformity with the Prudential Regulations.The resolution to amend the said Article is proposed as under:
“RESOLVED THAT Article 116 of the Articles of Association of Sindh Bank to be amended to read as:
Banks/DFIs shall not enter into leasing, renting and sale/purchase of any kind with their directors, officers, employees or such persons who either individuallyor in concert with family members beneficially own 5% or more of the equity of the bank/DFI. This restriction does not apply in case of purchase of vehiclesby the paid directors, officers or employees of the banks/DFIs which remained in their own use, provided such sale is covered under the employees servicerules duly approved by the Board of Directors of the banks/DFIs and is effected by the banks/DFIs at least at book value at the date of such transaction'.”
2- The Shareholders' approval is sought for the payment of remuneration and provision of certain facilities to the President/CEO of the Bank. The followingresolution may be passed:
“RESOLVED THAT the payment of remuneration to the President/CEO and to the Executive Director for the year 2017 a gross sum of Rs.24,554,000/- inaddition to bonus and other perquisites as per their terms of appointment be and are hereby approved.”
3- The meeting fee payable to the non-executive members of the Board has been approved by the Board of Directors in its 43rd meeting held on 18th October,2016 @ Rs.250,000/- and Rs.200,000/- per meeting of the Board and Committees of the Board, respectively. Payment of administrative expenses pertainingto the office, fuel, staff and security allocated to the Chairman. The decision of the Board, in terms of Article 104 of the Articles of Association of the Bankrequires approval of the shareholders in Annual General Meeting as per Regulation G-1(C-2) of SBP Prudential Regulations and BPRD Circular # 09 of2015. The non-executive members of the Board and the Board Committees are interested in the payment of fee and executive members of the Boardhave no interest in the matter.
PATTERN OF SHAREHOLDINGSAS ON DECEMBER 31, 2017
Number of Size of TotalShareholders From Shareholding To Shares held
5 1 100 5
31 101 500 15,500
36 501 1000 36,000
31 1001 5000 104,500
6 5001 10000 60,000
3 10001 15000 42,000
1 15001 20000 20,000
1 20001 25000 25,000
2 25001 30000 60,000
1 45001 50000 50,000
4 95001 100000 400,001
1 195001 200000 200,001
1 999995001 1000000000 999,999,993
123 1,001,013,000

Annual Report2017
206205
CATEGORIES OF SHAREHOLDERSAS ON DECEMBER 31, 2017
CategoryCategory Shareholders Number of wise No. of (%)
No. Shares held Shareholders
1 Individuals 100,000 1 0.00
2 Investment Companies
3 Joint Stock Companies
4 Directors, Chief Executive Officer, and their
Spouse and Minor Children
Mr. Afzal Ghani 200,001 1
Mr. Syed Hasan Naqvi* 1 1
Mr. Muhammad Shahid Murtaza 1 1
Mr. Muhammad Naeem Sahgal 1 1
Mr. Tajammal Husain Bokharee 1 1
Mr. Raja Muhammad Abbas 1 1
Mr. Muhammad Bilal Sheikh 100,001 1
Mr. Tariq Ahsan 100,000 1
Sub-Total: 400,007 8 0.04
5 Executives/Employees/Group employees 513,000 113 0.05
6 NIT / ICP
7 Associated Companies, undertakings and related parties
8 Banks, DFIs, NBFIs, Insurance companies, Modarabas& Mutual Funds
9 Foreign Investors
10 Co-operative Societies
11 Charitable Trusts
12 Others - Government of Sindh, through its Finance Department 999,999,993 1 99.90
Total 1,001,013,000 123 100.00
Shareholders holding ten percent or more voting interest in the listed company
Total Paid-up Capital of the company 1,001,013,000 shares10% of the paid-up capital of the Company 100,101,300 shares
Name(s) of Shareholder(s) No. of Shares held Percentage(%)
Government of Sindh, through its 999,999,993 99.90Finance Department
Mr. Syed Hasan Naqvi, Ex-Finance Secretary, Government of Sindh has been transferred on 22.12.2017, Share held willbe transfer after posting of a new regular finance secretary.
*
Sindh Microfinance Bank(SMFB) is a wholly ownedsubsidiary of Sindh Bank.

Annual Report2017
207 208
• Asaan Account
• Sukoon Current Account
• Foreign Currency Accounts
• Young Talent Account
• Women Empowerment Account
• Attractive Deposit Schemes
• Auto Finance Facility for Locally Manufactured & Imported Cars
• Prime Minister Youth Business Loan
• Mark-Up Free Student Loans
• Sa’adat Islamic Banking
• Small & Medium Enterprise (SME) Credits
• SMS Banking
• ATM Network
• VISA, PayPak & UnionPay Debit Cards
• Call Center 24/7
• Lockers Facility
• Benazir Muawanat Card
• Agriculture Loans
• Sindh Abadgar Tractor Scheme
• Loans for Dairy/Cattle Farming
• Loans for Poultry Farming
• Benazir Revolving Credit Scheme for Purchased of Inputs(Seeds, Fertilizers & Pesticides)
Sindh Bank Services & Facilities
Branch Network

Annual Report2017
209 210
SINDH & BALOCHISTANREGION BRANCHES
KARACHI BRANCHES
BAHADURSHAH ZAFAR MARKET BRANCHProperty No. G-3 of R. B. 11/22,III-A-239-B, Rambagh Quarters,Gwali Lane No.1, Karachi.Tel: 021-32743514, 32743515-6Fax: 021-32743517
BUFFERZONE, NAGAN CHOWRANGIBRANCHPlot No. 32, Sector 11-H,North Karachi Township Scheme, Karachi.Tel: 021-36409291, 36409294Fax: 021-36409293
BAHADURABAD BRANCHPlot No.111, Shop No.4, The City Towers,Bahadur Yar Jang Co-operative Housing Society,Alamgir Road, Karachi.Tel: 021-34892113-14, 34892116
BHAINS COLONY BRANCHPlot No. 217, Block-A,Cattle (Bhains) Colony Landhi, Karachi.Tel: 021-35130661-62, 35130663
BAHRIA COMPLEX-II BRANCHPlot # Misc.-2, Bahria Complex-IIM.T. Khan Road, Karachi.Tel: 021-35642110, 35642109Fax: 021-35642108
BOHRAPIR BRANCHShop No. 3 & 4, Plot Survey No. 88, RC.12Ranchore Line Quarter, KarachiTel: 021-32777761-62
CLIFTON BRANCH Ground Floor, St-28, Block-5,Federation House, Clifton, Karachi.Tel: 021-35829460, 35829474Fax: 35290333
COURT ROAD BRANCHGround floor, G-5-A, Court View Apartments,Opposite Sindh Assembly, KarachiTel: 021-35640032, 35640033Fax: 021-35640034
CLOTH MARKET BRANCHShop No. 28, Ground Floor, Cochinwala Market,Bunder Road Quarters, KarachiTel: 021-32400790, 32424177Fax: 021-32424175
CIVIC CENTER BRANCHGround Floor, Civic Center, Gulshan-e-Iqbal, Karachi.Tel: 021-99232501, 99232500
DHORAJEE BRANCHPlot # 35/243, Block 7&8, C.P. Berar CooperativeHousing Society, Dhorajee Colony, Karachi.Tel: 021-34891246, 34891247, 34891249Fax: 021-34891248
D.H.A. PHASE-II BRANCHPlot No. 13-C, Commercial Area “A”,DHA Phase-II, Karachi.Tel: 021-35883711-12
DHA Phase-IV BRANCHShop# 1,2,3, and 4, Plot No. III9th Commercial Street, Phase-IV,DHA, Clifton Cantonment, Karachi.Tel: 021-35313005Fax: 021-35313007
DHA 26th STREET BRANCHPlot No.14-E, 26th Street,Phase 5 Ext. D.H.A, Karachi.Tel: 021-35875805, 35875809Fax: 021-35875807
DHA PHASE-VIII BRANCHGround Floor, Plot No. 75-C,Al-Murtaza, Lane-3, DHA, Phase-VIII, Karachi
DR. ZIAUDDIN AHMED ROAD BRANCHPlot No. 2/1, Sheet No. C 11-9,Imperial Court, Dr. Ziauddin Ahmed Road,Karachi . Tel: 021-35680251, 35680252
GARDEN EAST BRANCHPlot No. GRE-491/2-B,Shop No.2 & 3, Seven Star Residency,Garden East Quarters, Karachi.Tel: 021-32243481
GOLE MARKET BRANCHPlot # 16, Row # 18, Sub-Block-F inBlock-III, Gole Market, Karachi.Tel: 021-36614461, 36614462Fax: 021-36614463
GULISTAN-E-JOHAR BRANCHShop # 7 & 8, Casim Paradise, Block-18,Scheme 33, Gulistan-e-Johar, Karachi.Tel: 021-34623030, 302, 34623031Fax: 021-3462033
GULSHAN-E-HADEED BRANCHPlot No.C-53, Phase-I, Gulshan-e-Hadeed, Karachi.Tel: 021-34715101,34715103Fax: 021-34715104
GULSHAN-E-IQBAL BRANCHFl : 1/13, block 5, KDA Scheme No.24,Main Rashid Minhas Road, Gulshan-e-Iqbal Karachi.Tel: 021-34968976, 34968977, 34968979
GULSHAN-E-MAYMAR BRANCHPlot No.SB-016, Sector-7, Sub-Sector IV,Gulshan-e-Maymar , Karachi.Tel: 021-36832561, 36832562Fax: 021-36832562
GIZRI BRANCHCommercial Plot No.G-1/2 & 23Lower Gizri Bazar Area, Clifton Cantonment,Karachi.Tel: 021-35862711, 35862713, 35862713Fax: 021-35862728
HYDERI BRANCHPlot No. SD-27, Block-G, Scheme No.2.Hyderi Market, North Nazimabad, Karachi.Tel: 021-36722084, 36722085, 36722087-88Fax: 021-36722086
I. I. CHUNDRIGAR ROAD BRANCHGround Floor, P & O Plaza, OppositeI.I. Chundrigar Road, Karachi.Tel: 021-32415399, 32463748, 32463744-45
IBRAHIM HYDERI BRANCHCommercial Plot, Situated in Naclass 25,Deh Ibrahim Hyderi, Karachi.Tel: 021-35090044
JAMSHED QUARTER BRANCHHouse # 13/B, Plot # 710/6, Survey Sheet # J.M.Quarters, Karachi.Tel: 021-34911841, 34911842Fax: 021-34911843
JODIA BAZAR BRANCHShop No. 1 Ground Floor, Soomro Center,Jodia Bazar, Napier Quarter, Karachi.Tel: 021-32500380,32500383Fax: 021-32500384
JINNAH AVENUE BRANCHShop No.G-08, Plot o.02/18,Sector-40, Mahran M. M. Alam Road,Malir Cantt. Karachi.Tel: 021-34027770-72
KARACHI ADMINISTRATION SOCIETYBRANCHPlot # SA/90, Block-8, KAECHS Society,Opposite Shaheed-e-Millat Road, Karachi.Tel: 021-34300432, 34300433Fax:021-34300434
KHAYABAN-E-ITTEHAD BRANCHPlot No.128-N, Muslim Commercial Area,Khayaban-e-Ittehad, DHA, Phase-VI, Karachi.Tel: 021-35846658, 35846375Fax: 021-35847709
KHAYABAN-E-SHAHBAZ BRANCHPlot No.11-C, Shop No.1 & 2, Ground Floor,Shahbaz Lane-2, Phase-VI, Pakistan DefenceHousing Authority, Karachi.Tel: 021-35855724-5, 35855727
KORANGI INDUSTRIAL AREA BRANCHPlot No.27/28, Showroom No.5, Korangi Industrial Area, Sector-16, Karachi.Tel: 021-35144261, 35144262Fax: 021-35144263
KEHKASHAN CLIFTON BRANCHPlot No. F/101, Block # 7,Scheme No.5, Kehkashan, Clifton, Karachi.Tel: 021-35295343, 35295342
KARIMABAD BRANCHC-23, Al-Habib Blessing, Block-4,Federal B Area, Meena Bazar,Karimabad, Karachi.Tel: 021-36425541, 36425545Fax : 021-36425542
KARACHI UNIVERSITY BRANCHMain Campus, University of KarachiUniversity Road, Karachi.Tel: 021-99261588, 99261586-87
KORANGI TOWNSHIP BRANCHPlot No.0-13, Sector 33-A,Korangi, Karachi.Tel: 021-35121134-6
KEAMARI BRANCHPlot No.18, Locality No.11,Jungle Shah Keamari, Karachi.Tel: 021-32851793-94
KHADDA MARKET BRANCHGround Floor, Plot No.18/2, Survey Sheet No.LY-6Khadda Market, Lyari, KarachiTel: 021-32385612
LANDHI BRANCHQuarter No.14/10, Block-5 D,Landhi Township, Karachi.Tel: 021-35046151, 35046152-3Fax: 021-35046153
LEA MARKET BRANCHPlot Survey # 2, Lea Quarters,Lea Market, Karachi.Tel: 021-32526863, 32526864Fax:021-32526865
LIAQUATABAD BRANCHPlot # 2, Block-3, Machine AreaSurvey Sheet # 7/9, Liaquatabad, Karachi.Tel: 021-34856645, 34856646Fax: 021-34856647
M. A. JINNAH ROAD BRANCHPlot No.28/2, Shop No. 13, 14 & 15Amber Medical Centre, M.A. Jinnah Road, Karachi.Tel: 021-32710835, 32710836
MALIR CANTT. BRANCHPlot No.11, Block-S, Cantt. Bazar Area,Malir Cantonment, Karachi.Tel: 021-34490951-4Fax: 021-34490954
MEHMOODABAD BRANCHPlot No. 476 & 476A, MAC-IIMehmoodabad, Karachi.Tel: 021-35319351-2Fax: 021-35319353
MEMON GOTH BRANCHPlot No.232 Deh. Malh, Tapu Dersano Chano,Murad Memon Goth, Karachi.Tel: 021-34562327, 34562326Fax: 021-34562325
METROVILLE BRANCHPlot No.F-5, Block-3, Category-B,KDA Scheme, Metroville No.1,S.I.T.E., Karachi.Tel: 021-36696925,36696926
MOHAMMAD ALI SOCIETY BRANCHPlot No.39/F, Mohammad Ali Society, Karachi.Tel: 021-34168112, 34168111-3
MALIR CITY BRANCHPlot No. 46, Block-A,Malir Township, Near Atia Hospital,National Highway, Karachi.Tel: 021-34492291, 34492294Fax: 021-34492293
NEW CHALLI BRANCHProperty Bearing # 37, Survey Sheet # SR-7,Serai Quarters New Challi, Karachi.Tel: 021-32623227, 32623228Fax: 021-32623229
NEW KARACHI BRANCHPlot # AS-24, Street # 3, Sector # 5-H,North Karachi Township, Karachi.Tel: 021-36949292, 36949291, 36949294
NORTH KARACHI INDUSTRIAL AREABRANCH 1/1, Sector 12-A, North KarachiIndustrial Area, Karachi.Tel: 021-36963174, 36963171-2Fax: 021-36963173
NORTH NAPIER ROAD BRANCHPlot # 32/2, Survey # NP-10, Sheet # 10Napier Quarters, Napier Road, Karachi.Tel: 021-32526345, 32526346-7Fax:021-32526347
NORTH NAZIMABAD BRANCHPlot No.B-65, Block-L, Improvement Scheme # 2,North Nazimabad, Karachi.Tel: 021-36725893, 36725892Fax: 021-36725894
NISHTAR ROAD BRANCHShop No.1A, Ground Floor, Building Bearing SurveyNo.61/II, Nishtar Road, Karachi.Tel: 021-32731115, 32731117
NAZIMABAD BRANCHShop No.S-1, Plot No.26 Row-01, Sub Block-A,Block-1, Nazimabad, Liaquatabad Town, Karachi.Tel: 021-36610470
ORANGI TOWN BRANCHPlot No.C.1-57, Sector No.11,Orangi Township, Karachi.Tel: 021-3660173-4
PAPER MARKET BRANCHPlot No.22/2, Sheet No.SR.18,Serai Quarters, Saddar Town, Karachi.Tel: 021-32600936-9, 32600940Fax:021-32600940
P.E.C.H.S. COMMERCIAL AREA BRANCHPlot No.187-3A, Shop No. 3 & 4, Ground Floor,Dawood Apartment, Block-2, PECHS, Karachi.Tel: 021-34529071, 34529072
PIA EMPLOYEES CO-OPERATIVE HOUSINGSOCIETY BRANCHPlot No.B-44, Block-9, KDA Scheme # 36,PIA Employees Co-Operative Housing Society,Gulistan-e-Jauhar, Karachi.Tel: 34161331-2Fax: 021-34161333
P.I.B. COLONY BRANCHShop No. 2, Plot No.340, Pir Illahi Bux Co-operativeHousing Society Ltd., PIB Colony, Karachi.Tel: 021-34860542-3Fax: 021-34860544
PREEDY STREET, SADDAR BRANCH Property bearing # 326/2, Artillery Maidan,Preedy Street, Saddar Karachi.Tel: 32751704-05Fax: 021-32711487
RASHID MINHAS ROAD BRANCHPlot No. A-2, Shop No.S12 to S-15, Akbar Paradise,Block-A, National Cement, Employees CooperativeHousing Society, Rashid Minhas Road, Karachi.Tel: 021-34834581, 34834582Fax: 021-34834583
SAFOORA GOTH BRANCHPlot No.SB-23, Shop No.2, Euro Heights,Block-7, KDA Scheme # 36, Gulistan-e-Johar, Karachi.Tel: 021-34663920, 34663921
SHAHEED-E-MILLAT ROAD BRANCHShow Room # G-01,Sagar Heights, Block-3,M.S.G.P. Cooperative Housing Society,Shaheed-d-Millat Road, Karachi.Tel: 021-34373972, 34373975Fax: 021-34373974
S.I.T.E., BRANCHB/9-B-2, SITE, Karachi.Tel: 021-36404032-33, 36404031Fax: 021-36404033
SHAHRAH-E-FAISAL BRANCHPlot No.30-A, Ground Floor,Showroom No. 4, 5 & 6, Progressive Centre,Block-6, P.E.C.H.S, Shahrah-e-Faisal, Karachi.Tel: 021-34322270-73, 34322272Fax: 021-34322271
SHERSHAH BRANCHPlot No.D/95, Shop# A-1 & A-2,SITE Area, Karachi.Tel: 021-32580000, 32583257Fax:021-32583259
SIR SYED HOSPITAL – SUB BRANCHPlot No.887, Block-A, Korangi Road,Near KPT Interchange, Qayyumabad,Opposite DHA Phase-VII Ext. Karachi.Tel: 021-35882591, 35882592Fax: 021-35882594
SINDH SECRETARIAT – SUB BRANCHC.S. No.409, Sheet No. AM-1,Artillery Maidan Quarter, Karachi.Tel: 021-32622045, 32622046-48
SOHRAB GOTH BRANCHShop # 14/A & B, 15/A & B, Ground Floor,Al-Asif Square, Sohrab Goth, Karachi.Tel: 021-36370520, 36370521Fax: 021-36370523
STOCK EXCHANGE BRANCHProperty No. 142 & 143, Third Floor,Stock Exchange Building, Karachi.Tel: 021-32467891-2, 32467892Fax:021-32467894
SINDHI MUSLIM HOUSING SOCIETY BRANCHPlot No. 117 & 118, Shah Abdul Latif Education Trust,Block-A, Sub-Block B, Sindh Muslim CooperativeHousing Society, Main Chowrangi, Karachi.Tel: 021-34188530, 34188531 & 33Fax: 021-34188532
SHIREEN JINNAH COLONY BRANCHPlot No.46, Block-I, Category-B, Scheme No. 05,Shireen Jinnah Colony, Clifton, Karachi.Tel: 021-34166144-5
SHAH FAISAL COLONY BRANCHHouse No.CB-52, Ground Floor,Alfalah Co-operative Housing Society (Drigh Colony)Shah Faisal Colony, Karachi.Tel: 021-34686441, 34686442
SINDH SOCIAL SECURITY INSTITUTION (SESSI)BRANCHGround Floor, Sindh Employees Social SecurityInstitute , Head Office, ST/17, Block-06,Gulshan-e-Iqbal, Karachi.Tel: 021-34833834-35

Annual Report2017
211 212
TARIQ ROAD BRANCHPlot No.55-C, 56-C, Central Commercial Area,Block-2, PECHS, Karachi.Tel: 021-34535131-2 33, 34535134Fax: 021-34535135
TIMBER MARKET BRANCHPlot Survey # 22 (Old Survey # E-5/3-14),Lawrence Quarter, Siddique Wahab Road,Timber Market, Karachi.Tel: 021-32751623, 32751625Fax: 021-327551624
UNIVERSITY ROAD, GULSHAN-E-IQBALBRANCHShop # 2 & 3 Bearing Plot # SB-13,Ground Floor, Gulshan Centre, Block-13-C,Scheme-24, Gulshan-e-Iqbal, Karachi.Tel: 021-34826534, 34826535Fax: 021-34826536
WATER PUMP BRANCHPlot # 9, Block-16, Scheme # 16,Federal ‘B’ Area, Karachi.Tel: 021-36372419, 36372417Fax: 021-36372419
WEST WHARF BRANCHPlot No. 20, Warehouse Area,West Wharf Road, Karachi.Tel: 021-32330319, 32330320Fax: 021-32330321
INTERIOR SINDH BRANCHES
BADAH BRANCHJuryan No.87, Main Badah Road, Badah,Tehsil Dokri, District Larkana.Tel: 074-4081305, 074-4081306
BADIN BRANCHPlot / Survey No.157, Main Bus Stop,Hyderabad Badin Road, Badin.Tel: 0297-862035, 861222Fax:0297-862035
BAWANI SUGAR MILLS – SUB-BRANCHAhmed Nagar, Talhar Distt. Badin.Tel: 0297-830084-5
BHAN SAEEDABAD BRANCHJaryan No.698, Main Bhan Saeedabad Road,District Jamshoro.Tel: 025-4660552-4, 4660553
BERANI BRANCHSurvey No.45(1-2-3) & 46, Deh Berani,Taluka Jam Nawaz Ali, District Sanghar.Tel: 0235-577501-2
BANDHI DISTRICT SHAHEED BENAZIRABADBRANCHPlot No.13 & 14 Farooque Town Bandhi,Deh 64, Nasrat Bandhi, Taluka Daur,Distt. Shaheed Benazirabad
CITIZEN COLONY, HYDERABAD BRANCHShop No.3-7, Royal City Project,Citizen Colony, Jamshoro Road, HyderabadTel: 022-2100840, 022-2100842-3
CHACHRO DISTRICT THARPARKAR BRANCHShop Constructed on Jaryan No.285,Chachro, District TharparkarTel: 0232-273132
DADU BRANCHPlot No. 54, RS No. 987, Opposite Degree College,Dadu City, District Dadu.Tel: 025-9200305, 025-9239059
DADU SUGAR MILLS – SUB BRANCHPyaro Goth, Distt. Dadu. Tel: 025-4551115
DAHARKI BRANCHSurvey No. 446, Main Daharki Road,Taluka Daharki, District Ghotki.Tel: 0723-641450-4, 0723-641451
DIGRI BRANCHPlot No. 118, Deh, 178, Mirwah Road, Digri.Tel: 0233-869589, 869591
DOKRI, DISTT. LARKANA BRANCHShop No. 3&4 Dokro, Moen-Jo-Daro Road, DokeriTel: 0744-08006
GAMBAT BRANCHPlot No. 2153-A, Near Sui Gas Office,Main Gambat Road, District Khairpur.Tel: 0243-720431, 720430
GHARO BRANCHJaryan No.197, Main National Highway Road,Taluka Gharo, District Thatta.Tel: 0298-760224, 760227
GHOTKI BRANCHPlot/City Survey No.890, Ward-B,Main Deviri Sahib Road, GhotkiTel: 0723-684431, 684434Fax:0723-684432
GHOUSPUR BRANCHShop No.1 & 2, Shahi Bazar,Near Shah Hussain Masjid Ghouspur,Taluka Kandhkot, District Kashmore-KandhkotTel: 072-2574407, 2574417
GHARI KHATA BRANCHShop No.CSF/C/1075,20,Qazi Qayoom Road, Hyderabad.Tel: 022-2782203, 2783303
GARHI YASIN, DISTRICT SHIKARPUR BRANCHCity Survey No.148, Main BazarGarhi Yasin , District Shikarpur.
HALA BRANCHSurvey No. 1397/88, Ward B,Gulshan Fahim Colony, Hala, District Matiari.Tel: 0223-331147, 331116Fax: 0223-331117
SADDAR HYDERABAD BRANCHProperty No.91/3-4, Main Saddar Cantt,Hyderabad.Tel: 022-9201456, 9201460Fax:022-9201457
ISLAMKOT BRANCHPlot No.17, 18 & 20, Near Jamia MasjidTaluka Islamkot, District Tharparkar.Tel: 0232-263233, 263234Fax:0232-263232
JACOBABAD BRANCHProperty No.232, Ward-6,Main Quetta Road, Jacobabad.Tel: 0722-652913-14
JAMSHORO BRANCHPlot No. A-133, Sindh UniversityEmployees Co-operative, Housing Society,Phase-I, Taluka Kotri, District Jamshoro.Tel: 022-2771710, 2771712
JOURNALIST SOCIETY BRANCHPlot No.9, Journalist Co-operative Housing Society,Near Center Jail, Hyderabad.Tel: 022-2107054, 2107053
JATI DISTRICT SUJAWAL BRANCHRevenue No.789/766,Memon Shopping Mall Jati District SujawalTel: 0298-777010
JHUDO DISTRICT MIRPURKHAS BRANCHShop on Plot No.96,Qureshi & Qasia Mohallah Katchi Abadi, JhudoTel: 02338-77072
KHANPUR MAHAR, DISTT. GHOTKI BRANCHPlot No.115-II, Khanpur Mahar,Taluka Khan Gharh, District Ghotki.Tel: 0723-653003
KANDHKOT BRANCHS.No.167, opposite Shams petroleum ServicesDeh Akhero Kandhkot, District Kashmore Kandhkot.Tel: 0722-572006-07 Fax:0722-572007
KANDIARO BRANCHJaryan No.1588, Opposite Zarai TaraqiatiBank Ltd. Hospital Road, Taluka Kandiaro,District Naushero Feroze.Tel: 0242-449946, 449945
KASHMORE BRANCHJaryan No.874, Main Kashmore Kandhkot Road,Kashmore District Kandhkot.Tel: 0722-576325, 576315Fax: 0722-567289
KHAIRPUR BRANCHGround Floor, Syed Ramzan Ali ShahTrade Centre,KhairpurmirsTel: 0243-715405, 715406, 715406-8Fax:0243-715407
KHAIRPUR NATHAN SHAH BRANCHShop No.C/407-A, Taluka KhairpurNathan Shah, District Dadu.Tel: 0254-720525, 720527
KHOSKI SUGAR MILLS – SUB BRANCHKhoski Sugar Mills Ltd. Khoski, District Badin.Tel: 0297-806033, 710044, 710055 & 66
KOTRI BRANCHCity Survey No.290, Ward-A, Shop No.8-10, PlotNo.1, River Point Kotri, District JamshoroTel: 022-3874221, 3874216-19Fax: 022-3874219
KUNRI BRANCHPlot No. 10, Survey No.263/4, Block-6 Deh Garaho,Main Station Road, Kunri, District Umerkot.Tel: 0238-557412, 557413, 557415Fax: 0238-557414
KHIPRO BRANCHPlot No.Z-437, Khipro Town, Main Sanghar KhiproRoad, Taluka Khipro, District Sanghar.Tel: 0235-865210-12, 865213
KOT BANGLOW DISTT. KHAIRPUR, BRANCHCity Survey No.388, Deh Tando Shah,Tapo Kotdiji Distt KhairpurTel: 0243-556030-31
LARKANA BRANCHGround Floor, City Survey No. 1Raza Shah Mohalla, VIP Road, LarkanaTel: 074-4040752, 799,074-404076Fax:074-4040753
LATIFABAD HYDERABAD BRANCHPlot No.06, Block-D, Unit No. VII, Latifabad, Hyderabad.Tel: 022-3816373, 3816371
MARKET AREA, HYDERABAD BRANCHShop No.A/1194, Ward-A, Market Road, Hyderabad.Tel: 022-2610706, 2610703
MATIARI BRANCHPlot # 125, Situated Ward-A TownOpposite NADRA Office, Matiari.Tel: 022-2760104, 2760105Fax: 022-2760106
MEHAR BRANCHShop No.1086, Ward-A, Mehar, District DaduTel: 0254-73060, 730602Fax: 0254-730603
MILITARY ROAD SUKKUR BRANCHSurvey No.717, 071-5633128Main Military Road, SukkurTel: 071-5633129Fax: 071-5633126-30
MIRPUR MATHELO BRANCHPlot No.24(2-01) Deh, Tapo Mirpur,Main Mirpur Mathelo Road, District Ghotki.Tel: 0723-663166, 663177
MIRPURKHAS BRANCHPlot No. RCN-18, Survey No.864/6,Main Umerkot Road, MirpurkhasTel: 023-3876405, 3876407Fax:0233-876406
MITHI BRANCHPlot/Jaryan No.50, Opposite Hyderi Hotel, MithiTel: 0232-920191, 920192-5Fax: 0232-262195
MORO BRANCHPlot No.14, Main Road Moro,District Noshero Feroze.Te: 0242-410458, 410500-1
MEHRABPUR BRANCHPTD No.III-A-43, Ward-16,Thari Road, Mehrabpur, Taluka Mehrabpur,District NaushahrofrozeTel: 0242-430862, 430863
MATLI DISTRICT BADIN BRANCHPlot No.381/1, Unit-II, Category II,Noor Hamd Nodakari Colony,Taluka Matli, District BadinTel: 0297-840444, 840443Fax:0297-840442
MIRPUR BATHORO BRANCHSurvey No.381/A, Ward-A,Main Road Sujawal to Mirpur Bathoro,Taluka Mirpur Bathoro, District SujawalTel: 0298-779124
MUHALLA LUQMAN, KHAIRPUR BRANCHPlot No.7,8,9,10,33,34,35 & 36CS Nos.169,170 & 171, Arisha ColonyOpp. Mill Colony Ciivil Hospital Road,Distt. Khairpur.Tel: 0243-685102-3
MIROKHAN, DISTRICTQAMBER SHAHDADKOT BRANCHJiryan No.105, Deh Shah Ali Tunia,Tappo & Taluka Mero Khan,District Qamber ShahdadkotTel: 074-4049001-2
NAUDERO BRANCHNaudero Sugar Mills,Main Larkana Road, District LarkanaTel: 074-4047526-7, 4047528Fax:074-4047526
NAUSHAHRO FEROZ BRANCHProperty Jaryan No. 185/28-5-2005,Deh Survey No.137, Main Naushahro Feroz RoadOpposite National Savings Centre TalukaNaushahro Feroz.Tel: 0242-481550, 481553Fax: 0242-481553
NASIRABAD BRANCHShop No.1-8, Madina Shopping Center,Mohallah Kathia Bazar, Badah Road,Nasirabad, District Kambar ShahdadkotTel: 074-4710522, 471523-25
PANO AQIL BRANCHProperty Survey No.436,Main Pano Aqil Sukkur Road, Taluka Pano Aqil,District Sukkur.Tel: 071-5692007, 5692009Fax: 071-5692006
PIR JO GOTH BRANCHShop No.2180, Anaj Mandi,Pir Jo Goth, Taluka Kingri, District KhairpurTel: 0243-610350 & 53, 610352
QAMBAR BRANCHCity Survey No.121 & 122, Ward-B, Near ShahiBazar Station Road, Qambar, ShahdadkotTel: 074-4211193, 4211196, 4211180-84
QASIMABAD, HYDERABAD BRANCHPlot No.11, Rs No.274/1, Faraz Villas,Qasimabad, HyderabadTel: 022-9240091-95
QAZI AHMED BRANCHSurvey No.313, Main Qazi Ahmed Road,Taluka Qazi Ahmed,District Shaheed BenazirabadTel: 0244-321585, 321586
RATODERO BRANCHCity Survey No.795/5, Ward B,Ratodero Bus Stand, Ratodero, LarkanaTel: 074-4048471, 4048470Fax: 074-4048478
ROHRI BRANCHCity Survey No.2181/9,Ward-B, Mohallah Kot Janullah Shah,G.T. Road, Rohri, District SukkurTel: 071-5810701-2Fax: 071-5810703
SAEEDABAD BRANCHShop No.53/2-36, Main Saeedabad Road,Taluka Saeedabad, District Matiari.Tel: 022-2767380, 2767381
SAKRAND BRANCHShop No.355/1-4, 356, 357, 367, Main Sakrand Road,Taluka Sakrand, District Shaheed Benazirabad.Tel: 0244-323391-2,
SANGHAR BRANCHPlot No.A-B, City Survey No.124/A-B,Cooperative Housing Society, SangharTel: 0235-542680, 542682Fax: 0235-542683
SAJAWAL BRANCHPlot No.CS-239/2 & 239/3,Mohalla Ward, Near UBL, Sajawal, District Thatta.Tel: 0298-510680, 510660
SEHWAN BRANCHPlot No./Survey No.20/49/1951,Alam Channa Mohalla, Sehwan, District JamshoroTel: 0254-620523, 620513Fax: 025-4620513
SHAHDADKOT BRANCHBuilding Survey No.652, Ward C,Main Kotoo Motoo Chowk, ShahdadkotTel: 074-4012303, 4012309Fax: 074-4012310
SHIKARPUR BRANCHSurvey No.34/3, Ward No.23, Station Road,Opposite Library, ShikarpurTel: 0726-521645-6, 521648Fax:0726-521647
SUKKUR BRANCHPlot No. C-550/17, Shalimar, Minara Road, Sukkur.Tel: 071-5623961, 5623963Fax: 071-5623960
SHAHDADPUR BRANCHCity Survey No.543, 548 Muhaga LandStation Road, Shahdadpur, District Sanghar.Tel: 0235-843151, 843153
SHAHEED BENAZIRABAD BRANCHPlot No.2481/13, VIP Road, Near Doctor's Colony,Nawabshah, District Shaheed Benazirabad.Tel: 0244-330695, 330692-4
SHIKARPUR RICE MILLS – SUB BRANCHShikarpur Rice Mills, Main Jacobabad Road,Village Lodhra, District Shikarpur.Tel: 0726-618177
SULTANABAD BRANCHSabzi Mandi, Sultanabad, Deh Salki Tapo Kamaro,Taluka & District Tando Allahyar.Tel: 022-3404161, 3404162-3
STATION ROAD LARKANA BRANCHPlot No.03, Near Al-Abbas Chowk,Station Road, Larkana.Tel: 074-4040745-46
SALEHPAT DISTT. SUKKUR BRANCHShop No.1,2,3 & 4 Plot No.135 to 156Deh Chak No.5, Salehpat, Distt. SukkurTel: 071-5660065-66

Annual Report2017
213 214
BAHRIA TOWN LAHORE BRANCHShop No.1, 2 & 3, Ground Floor, D Plaza,Commercial Area, Bahria Town, Lahore.Tel: 042-35340503-04
BLUE AREA ISLAMABAD BRANCHShop No. 1-5 & Mezzanine 1, Sohrab Plaza,Jinnah Avenue, Blue Area, IslamabadTel: 051-2206329-31
BANK ROAD RAWALPINDI BRANCHKichlew Building, Bank Road, Saddar, Rawalpindi.Tel: 051-9270151-54
BURKI BRANCHKhasra # 1523, Khewat # 50, Khatoni # 82,Village Burki, Lahore.Tel: 042-36560431Fax: 042-36560432
BANK SQUARE MODEL TOWN LAHOREBRANCHShop No.88, Bank Squre Market,Model Town, Lahore.Tel: 042-35915748-9
BUND ROAD LAHORE BRANCHKhewat No.15, Khatooni # 84, Khasra #546/115/16, Mohallah Sanda, Bhatianwala, BundRoad, Gulshan-e-Ravi, Lahore.Tel: 042-37412216
CHAK GHANIAN, DISTRICT GUJRATBRANCHVillage & PO Chak Ghanian,Tehsil Sarai Alamgir, District Gujrat.Tel: 0544-652536-37
CHICHAWATNI BRANCHPlot No.376, Main Bazar Chichawatni,District Sahiwal.Tel: 040-5482225-6Fax: 040-5482227
CHINIOT BRANCHKhewat No.3133/3117, Khasra No.13557/9602,Chah Karian Wala, Faisalabad Road, Chiniot.Tel:0476-332401-3
CIRCULAR ROAD LAHORE BRANCHShop No.1, SE-38-R-55/D,Opposite Akbari Mandi. Circular Road, Lahore.Tel: 042-37379401-03Fax: 042-37379404
DALWAL, CHAKWAL BRANCHVillage & Post Office Dalwal,Tehsil Choa Saidan Shah, District Chakwal.Tel: 0543-582070, 582071
DAVIS ROAD LAHORE BRANCHPlot No.28, Escorts House, Davis Road, Lahore.Tel: 042-36297740Fax: 042-36297742
DERA GHAZI KHAN BRANCHOpposite Medical Collage,Jampur Road, Dera Ghazi KhanTel: 064-2471301Fax: 064-2471304
D.H.A. LAHORE BRANCHPlot No.159, Sector Y, Commercial Area,Defence Housing Authority, Lahore Cantt.Tel: 042-99264334, 99264345
TANDO ADAM BRANCHShop No.1,2,3, Prime Tower, Hogani Colony,Hyderabad Road, Tando Adam, District SangharTel: 0235-571281-82Fax:0235-571282
TANDO ALLAHYAR BRANCHPlot No.4-4A & 5, Survey No.272/1, Al Habib Plaza,Main Tando Allahyar Hyderabad Road, Tando AllahyarTel: 022-3890198, 3890195Fax: 022-3890197
TANDO MUHAMMAD KHAN BRANCHPlot. Survey No.34, Jaryan No.13/10-7-08,Tando Muhammad KhanTel: 022-3342039, 3342040
THATTA BRANCHSurvey No.115, near Badshahi Masjid,Thatta Sijawal Road, Thatta.Tel: 0298-550528, 550529, 550539Fax:0298-550529
THUL BRANCHProperty No.484, Kandhkot Road,Thul, District JacobabadTel: 0722-610134, 610135
THATTA CEMENT – SUB-BRANCHThatta Cement Company Limited,Makli Ghulamullah Road, Thatta.Tel: 0298-555231, 555235
TANDO ALLAHYAR SUGAR MILLS– SUB BRANCHTando Allahyar Sugar Mills, Deh Kanidar, UC SanjarChang, Taluke Chamber, District Tando Allahyar.Tel: 0233-514268
THARI MIRWAH, DISTT. KHAIRPUR BRANCHNear Police Station Thari Mirwah,Taluka Mirwah Distt. Khairpur.Tel: 0243-790032-4
UMERKOT BRANCHPlot No.52, Survey No.111, Umerkot Nagori Society,Tehsil & District Umerkot.Tel: 0238-920339, 920340
UBARO BRANCHSurvey No.714 & 722, Main Ubaro Road,Taluka Ubaro, District Ghotki.Tel: 0723-688063-4
BALOCHISTAN BRANCHES
CHAMAN BRANCHKhasra No.1311 & 1312, Dularam Road, Chaman.Tel: 0826-615417, 615415-6
DERA MURAD JAMALI BRANCHKhatoni # 3014, Block # 84, National Highway MainBazar, Dera Murad Jamali, District Naseerabad.Tel: 0838-710135-36Fax:0838-710138
DERA ALLAHYAR BRANCHShop No.36 & 37, Near Sohbat Pur Chowk,Quetta Road, Dera Allah Yar, Balochistan.Tel:0838-510123
GAWADAR BRANCHThe Coast Medical BuildingAirport Road, Moza Thani Ward, Gawadar.Tel: 0864-211410, 211401
HUB BRANCHShop No.1 & 2, International Shopping Mall 7 HotelMouza Baroot, Tehsil Hub, District Lasbella.Tel: 0853-363910-11
JINNAH ROAD QUETTA BRANCHShop# 20-21, Ward # 18,Main M.A. Jinnah Road, QuettaTel: 081-2865680, 2865683
KHUZDAR BRANCHShop No.B-39, to B-42, Agha Abdul Zahir MarketRabia Khusdari Road, Khuzdar, Balochistan.
LIAQAT BAZAR QUEETA BRANCHProperty Bearing Khasra No.75, 76, 77 & 79,Ward-22, Halqa Arban No.1, Tehsil City QuettaTel: 0812-843431, 32Fax: 0812843429
LORALAI BRANCHShop No.1011-995, Bhagi Bazar,Loralai, Balochistan.Tel: 0824-660113
SIRKI ROAD QUETTA BRANCHCommercial Plot # C-48-A,Small Industrial Estate, Sirki Road, Quetta.Tel: 081-2472521, 2472523
SIBI BRANCHShop No.3-1/1, 3-1/2 & 3-1/2-1, Jinnah Road,Saqi Chowk, Sibi, Balochistan
SARANAN BRANCHshop No.3/3, Qita-2, Sikni Bazar, Battay Zai,Shabo Kanal, Tehsil Saranan, Distt. Pishin, Balochistan.Tel: 0862-452013-15
USTA MUHAMMAD BRANCHShop No.494/14-3-1 & Shop No.494/14-4,Jinnah Road, Usta Muhammad, Balochistan.Tel: 0838-612051-3
ZHOB BRANCHHouse # H/176-A, Shop # H/148,Tehsil Road, Zhob.Tel: 0822-413020-21, 413022
PUNJAB BRANCHES
ALI PUR CHATHA BRANCHKhewat No.979, Khatooni No.1414,Khasra No.3620/1683, Gujranwala Road, Ali PurChatha, Tehsil Wazirabad, District Gujrawanwala.Tel: 055-6332740, 6332741-42
ALLAMA IQBAL TOWN LAHORE BRANCH503-Karim Block (Commercial), Allama Iqbal Town,Lahore. Tel: 042-35295581-3Fax: 042-35295584
ASHRAFABAD, DISTRICT BAHAWALPURBRANCHAshrafabad Sugar Mill,Village Ashrafabad,Disrtict Bahawalpur.Tel: 062-2870091-2
ALI WALA BRANCHKhewat No.403, 414, 507, Village Ali Wala,Tehsil & District Muzaffargarh.Tel: 066-2013819
DHA PHASE-IV, LAHORE BRANCH145 CCA, Sector DD,Phase-IV, DHA, Lahore Cantt.Tel: 042-37185731-2
DHA PHASE-V, LAHORE BRANCHPlot No.CCA-39, Phase 5-C,Defence Housing Authority, Lahore.Tel: 042-37182146-7
DHA PHASE-VI LAHORE BRANCH15-C, Main Boulevard, DHA Phase-VI, Lahore.Tel: 042-37180190-2, 37187445
DEPALPUR, DISTRICT OKARA BRANCHKhewat No.35-36, Grains Market,Main Bazar Depalpur, District Okara.Tel: 0444-541516-19
DAROGHAWALA, LAHORE BRANCHKhasr No.449/289, Khewat No.289, Khtoni No.639,Main G.T. Road, Hadbast MasoodpuraDaroghawala, Lahore.Tel: 042-36551500-02
E-11 BRANCH, ISLAMABAD BRANCHPlot No.1, Sector E-11/3, 051-2318103-4M.P.C.H.S, Islamabad.Tel: 051-2318105Fax: 051-2318102
FAISALABAD BRANCH7-D, Commercial Area, 0418-711692-3People Colony No.1, Faisalabad.Tel: 0418-711691-3
FEROZEPUR ROAD BRANCHPlot # S-86-R-79, 79/2,Main Ferozepur Road, Ichra, Lahore.Tel: 042-37428322-5
FAISAL TOWN BRANCHPlot No.25, Block A, Near Faisal Hospital,Faisal Town, Lahore.Tel: 042-35160996, 35160994-7Fax: 042-35160997
FATEH JANG, DISTT. ATTOCK BRANCHShop No.1-5, Ward No.6,057-2212882Moza Fateh Jang, District Attock. Tel: 057-2212988
F-11 MARKAZ, ISLAMABAD BRANCHPlot No.39, Shops No.3, 4, 5, 18, & 19,Near Rahat Bakery, F-11, Markaz,Islamabad. Tel: 051-2224247, 2224249
G.T. ROAD GUJRANWALA BRANCHProperty No. B-XII-7S-60/A, Bhatia Nagar.G.T.Road, GujranwalaTel: 055-3840015, 9200992
GAGGO MANDI BRANCHKhewat No.58, Chak No.187/E.B.Opposite Police Station, Main Multan Road,Gaggo Mandi, Tehsil Burewala, District Vehari.Tel: 067-3500495, 3500497
GILGIT BRANCHKhasra No.104/5093-5339, Khewat No.185/185,Z.S. Plasa, Main Shahrah-e-Quaid-Azam, GilgitTel: 05811-922528 Fax: 05811-922526-27
GHURKI LAHORE BRANCHKhewat No. 8, Khatooni No.576/568, Khata No.156/702, Ghurki Union Council, District Lahore.Tel: 042-36581845, 36581847
GHARI SHAHU LAHORE BRANCHProperty No.SE-6R-107/B, Ground Floor,Allama Iqbal Road, Ghari Shahu, Lahore.Tel: 042-36294721-24
HARAPPA BRANCHMain G.T. Road, Near Harappa Railway Station,Harappa, District Sahiwal. Tel: 040-4504066-67
HAROONABAD DISTRICT BAHAWALNAGARBRANCHPlot No.1/7, Bangla Road, Opposite Grain Market,Haroonabad, District Bahawalnagar.Tel: 06322-50310-13
HAVELI LAKHA, DISTRICT OKARA BRANCHKhewat No.410/410, Khatoni No.526 to 542,Khasra No.35, Pakpatan Road,Haverli Lakha, Tehsil Depalpur, District Okara.Tel: 0444-775527-28
HEIR VILLAGE BEDIAN ROAD BRANCHKhewat # 236, Khatooni # 360-366, Khasra # 2940,Mouza Heir, Tehsil Cantt, LahoreTel: 042-35600231-2
JEHLUM BRANCHProperty No. 17, Kohinoor Plaza,Old G.T. Road, Jehlum. Tel: 0544-622028
JANDIALA DHABWALA BRANCHKhewat No. 216, Khatoni No. 512-514,G.T. Road, Jandiala Dhabwala, Near Motorway PoliceOffice, District Gujranwala.Tel: 055-6587171-72 Fax: 055-6587171
JOHAR TOWN LAHORE BRANCHPlot No. 7, Block-B, Near Allah Hoo Chowk,Johar Town, Lahore Tel: 042-35172833-35Fax: 042-35172836
ADDA JANPUR, DISTT. RAHIM YAR KHANBRANCHKLP Road, Adda Janpur, Tehsil Liaqatpur,Distt. Rahim Yar Khan.Tel: 068-5791001
KALRA KHASA BRANCHKhewat No. 91, Khatoni No.140, Khasra No.648,053-3515175, G.T. Road, Near Vita Fan, Shabnum Colony,Kalra Khasa, Tehsil & District Gujrat. Tel: 053-3515176
KUNJAH BRANCHPlot No. 5-A/15, Ward No.3, Kunjah,Tehsil & District Gujrat.Tel: 053-3383152, 3383154
KASUR BRANCHB-2/13, R-1/D, Haji Farid Road, Kasur.Tel: 049-2720120-30
KHANEWAL BRANCHPlot No.1743, Ground Floor,Sir Syed Road, Khanewal.Tel: 065-2558804, 2558806
KHUDDIAN KASUR BRANCHKhewat # 3218, Khasra # 6671,Khuddian, District Kasur.Tel: 049-2790189-92
LALAMUSA BRANCHPlot No.1/123 Tehsil Kharian, Lalamusa,District GujratTel: 053-7511422-23Fax: 053-7511425
LIDHAR BRANCHVillage Lidhar, Wagha Town, Lahore.Tel: 042-37165307Fax: 042-37165309
LILA DISTRICT JEHLUM BRANCHPost Office Lilla Town, Tehsil PindDaden Khan, District Jehlum.Tel: 0544-217661Fax: 0544-217662
MULTAN BRANCH64-Abdali Road, MultanTel: 061-4585203, 4585207
MANAWALA DISTRICT SHEIKHUPURABRANCHMain Bazar Village Manawala, Sheikhupura.Tel: 056-3771151, 3771153
MIAN CHANNU BRANCHKhewat No. 635, Khatooni No. 647, Khasra No.1671& 1672, Lakar Mandi, Mian Channu, District Khanewal.Tel: 065-2660227, 2660229
MAIN BOULEVARD DHA LAHORE BRANCHShop No. 4, Mujtaba Plaza, Main Boulevard,DHA, Lahore Cantt.Tel: 042-36685800-01
MUREE ROAD RAWALPINDI BRANCHK-583, Ch. Mouladad Khan Road,Main Murree Road, RawalpindiTel: 051-5781071-73
MAIN BOULEVARD GULBERG LAHOREBRANCH61-Main Bolulevard, Gulberg, LahoreTel: 042-99268880-83Fax: 042-99268882
MOHLANWAL BRANCHKhewat No.126, Khatoni No.524 to 527,Main Defence Road, Village Mohlanwal, Lahore.Tel: 042-35966762, 35966590
MORR AIMANABAD BRANCHKhasra No.1215/1 & 2, Khewat No.968,Khatoni No.11, Main G.T. Road, Morr Aminabad,District Gujranwala.Tel: 055-3263127-29
MUGHAL PURA LAHORE ARANCHPlot No.13, Street No.17, Near Lalpul,Mughal Pura, Lahore.Tel: 042-36524972-74
MOUZA GOJRA BRANCHKhasra No.237, Khewat No.64/65,Khatoni No.435 to 452, Mouza Gojra,Tehsil Malakwal, District Mandi Bahauddin.Tel: 0546-599111-12Fax: 0546-599113
MINHALA VILLAGE LAHORE BRANCHMinhala Village , Main Road, Near Govt. HigherSecondary School, Tehsil Shalamar, District Lahore.Tel: 042-36590663-64
MUSTAFAABAD (LALYANI) BRANCHKhewat No.39 & 40, Khatooni # 44 & 45,Transfer # 6753, Khasra # 1177/3, Main FerozepurRoad, Lalyani (Mustafaabad) Kasur.Tel: 049-2450081-4

Annual Report2017
215 216
WALTON ROAD LAHORE BRANCHHouse No.E/48, Khasra No .2328/280,Kheot No.1, Khatoni No.537, Super Town,Walton Road, Lahore.Tel: 042-36626072-73
WAPDA TOWN LAHORE BRANCHPlaza No.12, Block-A-1, P.E.C.H.S.,Valencia (Commercial Area),Wapda Town, Lahore.Tel: 042-35224695-6
KPK & MIRPUR AJK
ABBOTTABAD BRANCHOpposite Radio Pakistan,Mansehra Road,Abbottabad.Tel: 0992-330391Fax: 0992-330393
G.T. ROAD PESHAWAR BRANCHShop No.1 & 2 Jibran Adeel Plaza,Bilal Town, G.T. Road, Peshawar.Tel: 091-2584452-3Fax: 091-2584454
HAYATABAD PESHAWAR BRANCHUnit No.13, Sector D-1, Phase-1,Bilal Commercial Market, Hayatabad,Peshawar Tel: 091-5823855, 5823873
KARKHANO MARKET PESHAWAR BRANCHC-Block, Palace Plaza, Karkhano Market,Regi Lalma, Peshawar.Tel: 091-5893146, 5893139Fax: 091-5893148
KOHAT BRANCHShop No.889 to 896, Syed Saadullah Shah Building,Kacher Chowk, Bank Square, Hangu Road, Kohat.Tel: 0922-511675-78
MIRPUR AZAD KASHMIR BRANCHGround Floor, Portion No.2, Younus Plaza,Allama Iqbal Road, Mirpur, Azad Jammu & Kasmir.Tel: 05827-444520, 444550
MUZAFFARABAD BRANCHKhasra No.1845/1314, Bank Road, MuzaffarabadTel: 05822-920620, 920630
MERAN VILLAGE BRANCHMeran Village Tehsil Parva(Tandianwala Sugar Mills Ltd) Dera Ismail Khan.Tel: 0966-756112-4
PESHAWAR BRANCHShop No. 4, Ground floor, Jasmine Arcade,1-Bashir lane, Fakhar-e-Alam Road, Peshawar. Tel: 091-5271950-51, 5250601
RAWALAKOT, AJK BRANCHPlot No.D-20, Housing Scheme, Rawalakot, AJK. Tel: 05824-442571-72, 442620
UNIVERSITY ROAD PESHAWAR BRANCHKhata No.179/661 & 662 New KhataJamabandi No.193/738, University Road,PeshawarTel: 091-5711606-07Fax: 091-5711608
MINGORA DISTRICT SWAT BRANCHKhata # 1495, Khatooni # 1688, Khasra # 809,Shahdra, Watkey, Opposite Sabzi Mandi,Mingora, Tehsil Babuzai, District Swat.Tel: 0946-815011
NANKANA SAHIB BRANCHKhewat No.309, Khatoni No.521,Khasra No.1503 & 1504, Ghala Mandi,Tehsil & District Nankana Sahib.Tel: 056-2875087-8
OKARA BRANCHKhasra # 52/12/1, Khewat # 428, Khatoni No.1085,Mian Colony, M.A. Jinnah Road, Okara.Tel:044-2511555, 2511234Fax: 044-2511551
PECO ROAD LAHORE BRANCHPlot No.1-C/P-II, Phase-III, Main Peco Road, Lahore.Tel: 042-35970192-93Fax: 042-35172836
PESHAWAR ROAD RAWALPINDI BRANCHPlot No.1211, Chur Harpal, Near Govt. Collegefor Women, Peshawar Road, Rawalpindi.Tel: 051-5492992, 5492994Fax: 051-5492995
PINDI BAHAUDDIN BRANCHVillage Pindi Bahauddin, Rasool Road,Tehsil & District Mandi Bahauddin.Tel: 0546-600446
PWD HOUSING SOCIETY ISLAMABADBRANCH3-Civic Center, Block-A, PWD EmployeesCooperative Housing Society, Islamabad.Tel:051-5970735-37Fax: 051-5970734
PABBI DISTSTRICT NOWSHEHRA BRANCHSr. No.9015, Khasra # 1244 & 1245,Main G.T. Road, Pabbi, District Nowshehra.Tel: 0923-529217-18
RAHIM YAR KHAN BRANCH24 Model Town 068-5877062, Rahim Yar Khan.Tel: 068-5877062, 5877064
RAIWIND LAHORE BRANCHPlot 4-A, Mouza Niaz Baig,Main Raiwind Road, Lahore.Tel: 042-35963295-96
RAJA BAZAR RAWALPINDI BRANCHShop No.U/1328, Dingi Khuee,Raja Bazar, Rawalpindi.Tel: 051-5778509, 5778506-07
RING ROAD PESHAWAR BRANCHShop No.1-7, Block-C, Noor Decoration Plaza,Main Ring Road, Near Namkeen Restaurant,Mouza Achesni Yaban, Had Bast# 228, Distt. Peshawar.Tel: 091-5622597
SARGODHA BRANCHPrince Cinema Market, Railway Road, SargodhaTel: 048-9230510-11 Fax: 048-9230512
SATGARAH DISTRICT OKARA BRANCHAdda Chow, Sat Garah, Tehsil and District Okara.Tel: 0442-664064-65
SIALKOT BRANCHKhasra No.834/2, Khatooni # 39, Khewat No.29,Shahab Pura Road, Near Masjid Tajdar-e-MadinaSialkot. Tel: 052-3242701-3
SHAHRAH-E-FATIMA JINNAH QUETTABRANCHG-4, G-12 & 13, Queens Center, 33-Shahrah-e-Fatima Jinnah (Queens Road), Lahore.Tel: 042-37424054, 37425878
SHAHDARA LAHORE BRANCHShop No. 1 & 2, Malik Market, Bus Stop Yousaf Park,Sheikhupura Road, Shahdara Lahore.Tel: 042-37912550
SABZAZAR SCHEME LAHORE BRANCHPlot No. 308, Block-B, Sabzazar Scheme, LahoreTel: 042-37497101-2
SHEIKHUPURA ROAD, GUJRANWALABRANCHSr. No.11273, Khata # 122 $ 128, 754/183,Had # 76, Tehsil Khiali, Shahpur Town, GujranwalaTel: 055-4254601-2
SHAHKAS KHYBER AGENCY BRANCHMuqaddas Market, Wazir Dhand,Shahkas, Khyber Agency. Tel: 091-5814428
TARAMARI ISLAMABAD BRANCHKhewat No.18, Khatoni No.19, Khasra No.197/139,Taramari, Tehsil & District Islamabad.Tel: 051-2616001-02
TOBA TEK SINGH BRANCHKhewat No.7/7, Khatoni No.7,Allama Iqbal Road, Mohalla Janj Ghar,Toba Tek Singh.Tel: 0462-512751-52
TALAGANG ROAD, CHAKWAL BRANCHKhasra No.6150/2284, Khewat No.68,Khatooni No.143, Talagang Road, Chakwal.Tel: 0543-542066-8
TARA GARH DISTT. KASUR BRANCHKhewat # 155, Khatooni No.499 & 505,tara Garh Chowk, Tara Garh, District Kasur.Tel: 049-2719015-18
VILLAGE KAHNA BRANCHHakim Ghulam Hussain Colony,Mozoa Gajomata, Kahna,Distt. Lahore.Tel: 042-35270082-83
VILLAGE HUJRA SHAH MUQEEM BRANCHKhasra No.362/354, Khewat No.859,Hujra Road, Near Gillani Marriage Hall,Hujra Shah Muqeem, Tehsil Depalpur,District Okara.Tel: 044-4860051-2
VILLAGE MANGA MANDI BRANCHNear Javed High School, Multan Road,Manga Mandi, Tehsil & District Lahore.Tel: 042-35385062
VILLAGE QILA DEEDAR SINGH BRANCHKhewat No.459, Khatooni # 539,Khasra # 4311/2716/2437, Hafizabad Road, (South)Mouza Qila Deedar Singh, District Gujranwala.Tel: 055-4711036-7
WAH CANTT RAWALPINDI BRANCH82-A, Minar Road, Lala Rukh, Wah Cantt.Tel: 0514-4531862-63
ISLAMIC BANKINGBRANCHES & ISLAMIC BANKING
WINDOWS (IBWs)
AIRPORT ROAD BRANCH, QUETTAKhasra No.1246/140, Ground Floor, Pak Red CrescentBalochistan Almo Chowk, Airport Road, QuettaTel: 081-2864804-5
ALLAMA SHABBIR AHMED USMANI ROADBRANCH, KARACHIShop No. 2,3, & 4, Shaheen Heights, Block-7,KDA Scheme No.24, Gulshan-e-Iqbal, Karachi.Tel.: 34833516-7
ASHRAF ROAD BRANCH, PESHAWARHaji Darvesh Plaza, New Rampura Gate,Ashraf Road, PeshawarTel: 091-2600028, 0912600237
DADYAL BRANCH, AJKCommercial Plots No.108 & 109,Dadyal Hamlet, District Mirpur Azad Kashmir.Tel: 05827-465990
EIDGAH ROAD BRANCH, BAHAWALPURKhata No. 62/119, Mouza Bahawalpur, Milad Chowk,Eidgah Road, BahawalpurTel: 062-2880857,2880858
GHALLA MANDI BRANCH, SHEIKHUPURAShop No.V-4, S112, Ghalla Mandi, SheikhupuraTel: 056-3790205-7
GHORI TOWN BRANCH, RAWALPINDIPlot # MC-16, Ghori Town, Phase IV-A, RawalpindiTel: 051-2158511-2
KACHEHRI ROAD BRANCH, GUJRATKhewat No. 562-565, Khatooni No. 651-654,Khasra No. 2199/490, 2205/492, 2201/490,Nanwan Shah Pur, Kacheheri Road, GujratTel: 053-3600071-73
KHAYABAN-E-ITTEHAD BRANCH, KARACHIPlot # 13-C, Khayaban-e-Ittehad, Phase-II Ext.,DHA, Karachi. Tel: 021-35316805 Fax: 021-35316807
MODEL COLONY BRANCH, KARACHIPlot No. 9-1/2-A Model Colony,Near National Saving Centre, KarachiTel.: 021-34510021-23
MALL ROAD BRANCH, LAHOREShop No. 30 & 30/A, 1st & 2nd Floor,Plot No. S.19-R-30, Commercial Building,Shahrah-e-Quaid-e-Azam, Mall Road, Lahore.Tel: 042-37241866 Fax: 042-37241870
MARDAN BRANCHShop No. C-959/C, B/435/5, Survey No. 127/4(New No. 401) Bank Road Mardan Cantt. MardanTel: 0937-875342-44
SAHIWAL BRANCHKhewat # 142, Khatoni No. 161, Liaquat Road, SahiwalTel: 040-4223102 Fax: 040-4223104
SAMANABAD BRANCH, LAHOREPlot # 91, Main Road, Samanabad LahoreTel: 042-37535523
Bahadurabad Branch, KarachiShop # 4, The City Towers,Bahadur Yar Jang Cooperative Housing Society,Alamgir Road, KarachiTel: 021-34892113-14 Fax: 021-34892115
Clifton Branch, KarachiGround Floor, Block-5, Federation House,Abdullah Shah Ghazi Road, Clifton, KarachiTel: 021-35290332-35 Fax: 021-35290333
DHA, Phase-II Branch, KarachiPlot # 13-C, Commercial Area "A",DHA Phase-II, KarachiTel: 021-35883711-12 Fax: 021-35883713
DHA, Phase-V Branch, LahoreCCA-39, Phase 5-C, DHA, LahoreTel: 042-37182146-47 Fax: 042-37182147
Dhorajee Branch, KarachiBlock 7 & 8, C.P., Berar Cooperative Housing Society,Dhorajee Colony, KarachiTel: 021-34891246-47 Fax: 021-34891248
Ferozepur Road Branch, Lahore79/2, Main Ferozepur Road,Ichra, LahoreTel: 042-37428322-25 Fax: 042-37428321
Ghari Shahu Branch, LahoreProperty # SE-6R-107/B,Allama Iqbal Road, Ghari Shahu,Tel: 042-36294721-22 Fax: 042-36294725
I.I. Chundrigar Road Branch, KarachiP & O Building, I.I. Chundrigar Road, KarachiTel: 021-32463744-45 Fax: 021-32463757
PECO Road Branch, LahorePhase-III, Main Peco Road, LahoreTel: 042-35970192-93 Fax: 042-35970191
Raiwind Road Branch, LahorePlot # 4/4-A, Sultan Town,Main Raiwind Road, LahoreTel: 042-35963295-96 Fax: 042-35963296
Sindhi Muslim Housing Society Branch, KarachiShah Abdul Latif Education Trust,Block-A, Sub-Block B,Sindhi Muslim Housing Society,Main Chowrangi, KarachiTel: 021-34188530-31 Fax: 021-34188532
Sohrab Goth Branch, KarachiGround Floor, Al-Asif Square,Sohrab Goth, KarachiTel: 021-36370520-21 Fax: 021-36370523
Tariq Road Branch, Karachi56-C, Central Commercial Area,PECHS, Block-2, KarachiTel: 021-34535131-34 Fax: 021-34535135
ISLAMIC BANKING WINDOWS (IBW)ISLAMIC BANKING BRANCHES

Annual Report2017
218217
I/We, ____________________________S/o._________________________, being member of Sindh Bank
Limited and holding ____ ordinary share as per CDC Participant ID & Account No. ______________, do hereby
appoint Mr______________________________ s/o___________________________ or failing him
Mr_________________________ s/o __________________ as my/our Proxy in my/our absence to attend and
vote for me/us and on my/our behalf at the 7th Annual General Meeting of the Bank to be held on 29th March 2018
at 10.00 a.m at the Head Office of Sindh Bank Limited, 3rd Floor Federation House, Clifton, Karachi, and at any
adjournment thereof.
NOTES:
1. A member entitled to attend and vote at the 7th Annual General Meeting of the Bank may appoint any otherperson as his/her/its proxy to attend and vote instead of his/her/its. The proxy shall have the right to attend,speak and vote in place of the member appointing him at the meeting.
2. The instrument appointing a proxy should be signed by the member(s) or by his/her/its Attorney, duly authorizedin writing. If the member is a Corporation, its common seal should be affixed to the instrument.
3. The Proxy Form duly completed, must be deposited at the Bank's Registered Office at 3rd Floor, FederationHouse, Abdullah Shah Ghazi Road, Clifton, Karachi not less than 48 hours before the time of holding themeeting.
4. CDC account holder or sub-account holder appointing a proxy should furnish attested copies of his/her/itsown as well as the proxy's CNIC / Passport with the proxy form. The proxy shall also produce his/her/itsoriginal CNIC or passport at the time of meeting. In case of corporate entity, the Board of Directors' resolution/ power of attorney with specimen signature shall be submitted along with proxy form.
As witness my/our hand this ________________ day of __________________________2018.
1. Witness_____________________________
Signature____________________________
CNIC No.___________________________
Address_____________________________
2. Witness_____________________________
Signature____________________________
CNIC No.___________________________
Address_____________________________
Member’s Signatureon Rs.5.00
Revenue Stamp
(Signature should agree withthe specimen signature
Registered with the Bank)

219
292018
7th
2018
7th
Long Term: AAShort Term: A-1+
(JCR-VIS)
Serving You In Many Ways
• Attractive Deposit Schemes• Women Empowerment Account• Young Talent Account • Asaan Account• Auto Finance Facility for Locally
Manufactured & Imported Cars• Foreign Currency Accounts• Agriculture Loans • Lockers Facility• Mark-Up Free Student Loans • Call Center 24/7• Small & Medium Enterprises (SME) Credits• Islamic Banking • ATM Network• VISA, PayPak & UnionPay Debit Cards
• All Transactions Alert • Utility Bills Payment• Mobile Top-ups • Airline Ticket Payment• Internet Service Providers (ISPS)• Fee Payments of Educational Institutions• Insurance Premium Payment• Intra Bank Funds Transfer (PAYC)• Inter Bank Funds Transfer (IBFT)• Balance Enquiry • Mini Statement• Complete Statement of Account Via Email• E-commerce • Email Alerts
SMS BankingServices & Facilities
www.sindhbankltd.comCall Centre: 0800-33322