Potential Application in Sindh Field
16
135 MEHRAN UNIVERSITY RESEARCH JOURNAL OF ENGINEERING & TECHNOLOGY, VOLUME 30, NO. 1, JANUARY, 2011 [ISSN 0254-7821] Design and Operation of Laboratory Combustion Cell for Air Injection into Light Oil Reservoirs: Potential Application in Sindh Field ABDUL HAQUE TUNIO*, HAFEEZ-UR-REHMAN MEMON**, AND SHAHEEN AZIZ*** RECEIVED ON 12.09.2010 DATED ON 03.01.2011 ABSTRACT Historical experimental work on the combustion oil recovery processes consists of both laboratory and field studies. Although field experiments are the ultimate test of any oil recovery process, they are costly, time consuming and difficult to analyze quantitatively. Laboratory CC (Combustion Cell) experiments are cost effective and less time consuming, but are subject to scaling and interpretation challenges. Experimental set up has been developed to understand air injection process for improving oil recovery from light oil reservoirs taking into account the sand pack petro physical and fluid properties. Some important design problems; operational criteria and considerations important to interpretation of results are pointed out. To replicate subsurface reservoir conditions or pressure and temperature, experiments up to 6895 KPa, at non-isothermal conditions with 5 o C/min ramp-up are performed on unconsolidated cores with reservoir oil samples. Correlations were obtained for low temperature oxidation rate of oil, the fuel deposition rate and the rate of burning fuel as a fuel concentration. Various parameters such as (sand pack, pressure, oil saturation and flow rate/air flux) were changed to investigate their impact on reaction and chemical nature of the fuel burned. To determine the importance of distribution and pyrolysis on these reactions, the hydrogen-carbon ratio and m-ratio was calculated. For further confirmation Arrhenius graphs were drawn by assuming 1.0 order of reaction with carbon concentration which is also confirmed. This research will contribute to the overall understanding of air injection process; help to determine the most appropriate IOR (Improved Oil Recovery) technique in the development of the tertiary phase of production in light oil reservoirs in Lower Indus Basin (Sindh) fields. Key Words: Air Injection, Oil Recovery, Light Oil, Combustion Cell and Oxidation Kinetics. 1. INTRODUCTION * Associate Professor, Institute of Petroleum and Natural Gas Engineering, Mehran University of Engineering & Technology, Jamshoro. ** Professor, Institute of Petroleum and Natural Gas Engineering, Mehran University of Engineering & Technology, Jamshoro. *** Assistant Professor, Department of Chemical Engineering, Mehran University of Engineering and Technology Jamshoro. I njection of air into depleted light oil reservoir may be regarded as a new alternative IOR method for both secondary and tertiary processes. Many field and laboratory studies of the forward combustion oil recovery process have been conducted since the early publication of Kuhn, and Koch [1] and Grant and Szasz [2]. In view of
-
Upload
khangminh22 -
Category
Documents
-
view
0 -
download
0
Transcript of Potential Application in Sindh Field

135 MEHRAN UNIVERSITY RESEARCH JOURNAL OF ENGINEERING & TECHNOLOGY, VOLUME 30, NO. 1, JANUARY, 2011 [ISSN 0254-7821]
Design and Operation of Laboratory Combustion Cell for AirInjection into Light Oil Reservoirs: Potential Application in
Sindh FieldABDUL HAQUE TUNIO*, HAFEEZ-UR-REHMAN MEMON**, AND SHAHEEN AZIZ***
RECEIVED ON 12.09.2010 DATED ON 03.01.2011
ABSTRACTHistorical experimental work on the combustion oil recovery processes consists ofboth laboratory and field studies. Although field experiments are the ultimate test ofany oil recovery process, they are costly, time consuming and difficult to analyzequantitatively. Laboratory CC (Combustion Cell) experiments are cost effective andless time consuming, but are subject to scaling and interpretation challenges.Experimental set up has been developed to understand air injection process forimproving oil recovery from light oil reservoirs taking into account the sand packpetro physical and fluid properties. Some important design problems; operationalcriteria and considerations important to interpretation of results are pointed out. Toreplicate subsurface reservoir conditions or pressure and temperature, experimentsup to 6895 KPa, at non-isothermal conditions with 5oC/min ramp-up are performed onunconsolidated cores with reservoir oil samples. Correlations were obtained for lowtemperature oxidation rate of oil, the fuel deposition rate and the rate of burning fuelas a fuel concentration.Various parameters such as (sand pack, pressure, oil saturation and flow rate/air flux)were changed to investigate their impact on reaction and chemical nature of the fuelburned. To determine the importance of distribution and pyrolysis on these reactions,the hydrogen-carbon ratio and m-ratio was calculated. For further confirmationArrhenius graphs were drawn by assuming 1.0 order of reaction with carbonconcentration which is also confirmed.This research will contribute to the overall understanding of air injection process;help to determine the most appropriate IOR (Improved Oil Recovery) technique in thedevelopment of the tertiary phase of production in light oil reservoirs in Lower IndusBasin (Sindh) fields. Key Words: Air Injection, Oil Recovery, Light Oil, Combustion Cell and Oxidation
Kinetics.
1. INTRODUCTION
* Associate Professor, Institute of Petroleum and Natural Gas Engineering, Mehran University of Engineering &Technology, Jamshoro.
** Professor, Institute of Petroleum and Natural Gas Engineering, Mehran University of Engineering & Technology,Jamshoro.
*** Assistant Professor, Department of Chemical Engineering, Mehran University of Engineering and TechnologyJamshoro.
Injection of air into depleted light oil reservoir may beregarded as a new alternative IOR method for bothsecondary and tertiary processes. Many field and
laboratory studies of the forward combustion oil recoveryprocess have been conducted since the early publicationof Kuhn, and Koch [1] and Grant and Szasz [2]. In view of

MEHRAN UNIVERSITY RESEARCH JOURNAL OF ENGINEERING & TECHNOLOGY, VOLUME 30, NO. 1, JANUARY, 2011 [ISSN 0254-7821] 136
DESIGN AND OPERATION OF LABORATORY COMBUSTION CELL FOR AIR INJECTION INTO LIGHT OIL RESERVOIRS: POTENTIALAPPLICATION IN SINDH FIELD
the complex and costly nature of this type of investigation,it is not surprising that no complete theory of the natureof the forward combustion process is yet developed.However, gross effects are well understood and reasonabledesign procedure is available for planning field operations.
Laboratory combustion tube studies have already yieldedimportant information regarding the combustion process.However, concerning the design, construction andoperation of combustion tubes and combustion cells arenot available in this region. Combustion tubes and CCused by various investigators vary in size, length andmode of the operation.
Therefore, one purpose of this paper is to presentconsiderations important to the design, construction andoperation of combustion cell in order to better understandthe air injection process into oil reservoirs particularly forthe Lower Indus Basin region. Nelson and McNeil [3-4]have published two comprehensive papers regardingdesign procedures. Greaves, M., suggested that, large fieldwell spacing provides the more residence time requiredfor complete oxygen utilization [5]. Gordon Moore hasobserved that, fire flooding of heavy oil deposits is muchmore displacement process than thermal process [6]. Anaccelerating rate calorimeter with adiabatic temperaturecontrol has also been employed to study oil reactivity [7].Laboratory experiments and computer simulations showthat air injection is feasible for IOR after water flooding inlight oil fractured chalk reservoir [8-9]. The air injectionproject in WBRRU (West Buffalo Red River Unit) has beentechnically more successful in terms of incremental, quickresponse and higher production as compared to the waterflood project in WBRRU [10].
The air injection LTO (Low Temperature Oxidation) processworks by removing the oxygen from the injected air throughLTO with oil in the reservoir [11-12]. Unlike in-situcombustion, a stabilized high temperature front, orcombustion zone, is not necessary. The LTO reaction isspontaneous and independent of oxygen partial pressureso that complete oxygen consumption can be achieved in
the reservoir. A small amount of oxygen will be left in theoil if there is an insufficient reactive component left toreact with the oxygen. The process is quite flexibleregarding air injection rate. The only restriction on the airinjection rate is to ensure a sufficiently long residencetime in the reservoir for complete oxygen removal. Thiswill not present any problem in reservoirs with a fairlylong well spacing. In light oil reservoirs, well spacingbetween injection and production wells is hundreds offeet or meters Greaves, M., et. al. [5, 11].
2. EXPERIMENTAL SET-UP
Experimental apparatus was constructed in the Instituteof Petroleum & Natural Gas Engineering, MehranUniversity of Engineering and Technology, Jamshoro,Pakistan, for understanding air injection process fordepleted light oil reservoirs.
Fig. 1 shows the schematic diagram of the air injectionexperimental apparatus with GC (Gas Chromatograph). TheCC and assembly were enclosed in an angle iron frame6x4x2 ft. Components mounted in this frame include thepressure shell, and combustion cell with the necessaryheating device, temperature processor controller, digitaltemperature indicator, product separation, recordingequipment, thermocouples, pressure regulator, pressuregauges, control valves and high pressure air cylinder.
High-pressure autoclave/reactor detail is presented inFig. 2. Reactor comprises of a thick wall autoclave madeup of 304 stainless steel and has flanges at the bottom ofthe reactor along with 5.08 cm nut. The reactor hasdimensions of 8.255cm OD, 5.715cm ID, 35.56 cm length,and 1.27cm wall thickness designed for a working pressureof 20685 KPa and temperature up to 600-700oC. The reactorwas hydraulically tested up to 34475 KPa.
A thin wall CC made up of stainless steel 316, withdimensions of 3.81cm OD, 3.175cm ID and 25.4cm lengthis placed inside the autoclave. Two stainless steel wirescreens of 200 meshes size are placed at the bottom of the

137 MEHRAN UNIVERSITY RESEARCH JOURNAL OF ENGINEERING & TECHNOLOGY, VOLUME 30, NO. 1, JANUARY, 2011 [ISSN 0254-7821]
DESIGN AND OPERATION OF LABORATORY COMBUSTION CELL FOR AIR INJECTION INTO LIGHT OIL RESERVOIRS: POTENTIALAPPLICATION IN SINDH FIELD
CC to prevent the sand entering to the production line.The volume of the combustion cell is 325cm3. Reactorassembly was fabricated using local vendors ofHyderabad, Sindh, Pakistan.
In the first series of experiments one electric heater(1.0KW) was wrapped around the top of the reactor toheat the autoclave to simulate reservoir temperature tocreate ignition in the sand pack. The heater is enclosedin a close muffled type demountable container andcontrolled by Honey well, PID temperature processorcontroller. In these experiments two heaters (1.0KW each)were installed; one at the top of high pressure autoclavefor the ignition purpose and another at the centre of theautoclave to maintain reservoir conditions oftemperature. Finally, three heaters (1.0KW each) wereinstalled; one at the top of the autoclave and anothertwo heaters were installed to cover the full length of theautoclave. A transformer/regulator was installed to
maintain the constant temperature of the heaters. Thethermowell of 0.635cm diameter was held in the centre ofthe CC and contained three chromel-alumelthermocouples of 0.1cm diameter to measure thetemperature of the reaction zone at different depthintervals. T1 (Thermocouple-1) was placed in the uppermost area of the CC (2.54cm to inlet), T2 (Thermocouple-2) was placed at 12.7cm from top of the CC, and T3(Thermocouple-3) was placed at 17.78cm from top of theCC. These thermocouples are connected with recorderto record the values of different temperatures i.e. T1), T2and T3. The upper most thermocouple placed very closeto the inlet of CC was used to control the ramp-uptemperature through PID controller. At the outlet of thereactor, the pressure transducer was installed andconnected to the recorder to record the injectionpressure. High pressure and low-pressure separatorswere installed along with deflector plates at the out let ofthe reactor with three sieve plates.
AC is Air Cylinder, BP is Baffle Plates, D is Dryer (filled with silica gel), FCV is Flow Control Valve, FM is Flow meter, GC is GasChromatograph, GSP is Gas Sampling Point, GT is Glass Tubes (Absorbent), HG is Hydrogen Generator, HPA is High Pressure Autoclave,HP Sep is High Pressure Separator, LP Sep is Low Pressure Separator, NV is Needle Valve, PG is Pressure Gauge, PR is Pressure Regulator,PT is Pressure Transducer, PID is Temperature Processor, R is Relay (PID Type), Re is Recorder/Chromatocorder-12, RE is Recorder/Eco-Graph (Six Pen Paper Less), S is Scrubber (filled with wire mesh), and TI is Temperature Indicator (Digital)
FIG. 1. SCHEMATIC OF THE AIR IJECTION EXPERIMENTAL APPARATUS

MEHRAN UNIVERSITY RESEARCH JOURNAL OF ENGINEERING & TECHNOLOGY, VOLUME 30, NO. 1, JANUARY, 2011 [ISSN 0254-7821] 138
DESIGN AND OPERATION OF LABORATORY COMBUSTION CELL FOR AIR INJECTION INTO LIGHT OIL RESERVOIRS: POTENTIALAPPLICATION IN SINDH FIELD
GC-1880 was connected with the experimental set-up forthe analysis of exhaust gases by injection of 1.0 ml samplewith tight gas syringe at the top of the column of injectionport, after every 10 minutes, the various peaks of theproduced gases were recorded and integrated. Pressureregulator attached at the outlet of the autoclave reducedpressure from 34475 KPa to atmospheric pressure for betterseparation of fluids and flow rate of effluent gas wascontrolled by pressure regulator for accurate analysis.However, due to blockage of pressure regulator causedby the oil production from the reactor, the flow of theexhaust gas was not smooth and fluctuated. It varied from50-200 ml/minute. After few experiments the set-up wasmodified to avoid the blockage of pressure regulator andto maintain the constant outlet flow. The reduction inpressure to atmospheric level was achieved by large
volume of down stream equipments. Later the pressureregulator was installed at downstream of the high-pressureseparator. This maintained the constant flow rate. Regulatorneeded cleaning with ethanol after 2-3 experiments due tooil accumulation inside it. Equipment was modified andtested upto 12411 KPa. Pressure beyond the regulatorwas maintained up to 34.5 KPa maximum, which eventuallydecreased to around 6.895-13.79 KPa at sampling point.
3. EXPERIMENTAL PROCEDURE
A given weight of the sand was placed in a container andthe required weight of the oil added to the sand and mixedwith the help of spatula, until the mixture becamehomogenous. Unconsolidated sand equivalent to theweight of the consolidated core was placed into thecombustion cell. The sand mixture impregnated with lightoil was packed into the CC using a steel rod with a flatmetal plate attached to it to closely pack the mixture. Thetop of the sand pack was set at 24.1cm from the bottomflange. The clean sand was packed up to the level of theigniter in order to prevent premature cracking reactionswith oil in the sand pack. The sand pack properties arepresented in Table 1. Packed with the CC, the bottom flangeassembly was secured in placed, the cell was inserted inthe pressure shell and connected to the inlet gas lines andthe outlet production and gas analysis system.
The air was supplied by high-pressure (13652 KPa) cylinderof compressed synthetic air with high-pressure regulator.The inlet gas stream was admitted at the top of the reactor(Vertical), while the exhaust gases were withdrawn fromthe bottom of the reactor. The injected flow rate of air wascontrolled by needle valve/flow control valve. Pressureregulator was used to control the pressure of the reactor.Downstream of the regulator produced gases were allowedto flow through the low pressure separator, scrubber andto the sample collection point. After 30 minutes the requiredpressure was maintained, stabilized and then both theheaters were turned ON. The reactor was heated with aramp of (5oC/min.) up to the ignition was observed bychange of slope versus time on the recorder The igniter
FIG. 2. HIGH PRESSURE AUTOCLAVE

139 MEHRAN UNIVERSITY RESEARCH JOURNAL OF ENGINEERING & TECHNOLOGY, VOLUME 30, NO. 1, JANUARY, 2011 [ISSN 0254-7821]
DESIGN AND OPERATION OF LABORATORY COMBUSTION CELL FOR AIR INJECTION INTO LIGHT OIL RESERVOIRS: POTENTIALAPPLICATION IN SINDH FIELD
TABLE 1. SAND PACK PROPERTIES
Length of the Combustion Cell, cm CL 25.4
Length of the sand Pack, cm L 24.1
Radius of the Cell, Cm rc 1.5875
Bulk volume, cubic cm Vb 325.0
Sand density, gm/cc Ps 2.67
Oil density, gm/cc P o 0.836
Oil saturation, % Sw 57.41 -80
Weight of the sand in the Cell, gms Ws 200
Weight of the oil in the Cell, gms Wo 66
Volume of the oil, cubic cm Vo 80
Water Saturation, % Ws 20-41.25
was switch OFF and another heater was used to maintainthe reservoir temperature (about 100oC), which wascontrolled by transformer/regulator (120V) for the durationof experiments and held constant. Required air flow wasestablished through the pack while the differentthermocouples were measuring the temperature at the sandface and also at the different depth intervals of thecombustion cell. The ignition could be observed on thetemperature recorder by change of slope on thetemperature versus time chart. Samples of exhaust gaseswere analyzed at 10-minute intervals for the entire durationof reaction. For each oxidation run, the CO2, CO, O2 and N2
concentrations in the exhaust gas were determined asfunction of time. The produced liquid from the high-pressure and low-pressure separators was collected afterthe end of the experiment (Tunio, A.H., [13]).
4. COMBUSTION CELL TEMPERATUREPROFILES
The impregnated unconsolidated core sample was placedin a CC which was heated by igniter with a ramp of 5oC/min. The temperature profiles during the combustion areshown in Fig. 3. A small variation in the peak temperatureis noticeable. This is due to rate at which exothermiccombustion reaction generated heat as compared withheat losses from the combustion. Heat losses from thecombustion zone are the result of conduction throughthe radial cell wall, combined with axial heat conductionand convection down stream to the steam zone. Littledisturbance was`created on the process because of veryquick ignition that takes place as shown in Fig. 3. Afterswitching OFF the igniter, the combustion frontpropagation stabilizes quickly and thereafter continues to
FIG. 3. GAS COMPOSITION AND TEMPERATURE VERSUS TIME FOR RUN-5

MEHRAN UNIVERSITY RESEARCH JOURNAL OF ENGINEERING & TECHNOLOGY, VOLUME 30, NO. 1, JANUARY, 2011 [ISSN 0254-7821] 140
DESIGN AND OPERATION OF LABORATORY COMBUSTION CELL FOR AIR INJECTION INTO LIGHT OIL RESERVOIRS: POTENTIALAPPLICATION IN SINDH FIELD
maintain constant temperature of about 250oC at the endof the experiment. The ignition temperature was noted atabout 500oCC. Due to movement of the combustion frontfrom 1st-2nd zone and finally in 3rd zone of the CC, ignitiontook place and the peak temperatures of both the zoneswere noted at about 380 and 280oC respectively. Theincreasing trend of the average peak temperature withoxygen concentration is shown in Table 2. With air-assisted combustion, the peak temperature is notsignificantly affected by the increase in pressure, varyingfrom 300-350oC over the pressure range of 2069-3448 KPaas presented shown in Table 2. One explanation for this isthat at higher injection pressures, the distillation rate ofvolatile components in the steam zone is lower. This meansthat more fuel is potentially available for combustion. As aconsequence, a peak temperature would be expected butthe convective heat transport from the CC/zone alsoincreases due to larger fraction of nitrogen in thecombustion gases. Thus, when this is combined with theradial heat loss by conduction, the net result is to suppressany increased temperature effect resulting from higher fuelconcentration.
5. PRESENTATION AND DISCUSSIONOF RESULTS
The analysis is based on the effluent gas data obtainedfrom the various experiments. The analysis will bequantitative and qualitative description of the generaltrends observed. Experiments were performed forobtaining useful kinetic data for air injection process forthe improved recovery of the light oil. These experimentswere conducted so that more reliable and comprehensivedata could be obtained for air injection process in theincremental recovery of light oil reservoirs at high pressureand high temperature usually after water flooding. Theunconsolidated core (sand pack) with different sand grainsize impregnated with light oil was used in this series ofexperiments.
A total of 50 kinetics runs were made. The parameters thatwere varied from run to run- included system pressure,rock formation/sand matrix, flow rate (Air flux), oxidationtemperature/heat input, and oil and water saturations.
TABLE 2. SUMMARY OF COMBUSTION CELL RESULTS
Parameters R-5 R-2 R-4 R-17 R-20 R-24 R-29
Run Duration, (Minutes) 300 460 420 240 300 300 180
Cumulative Oil Production, Ml 67 65 70 46 65 62 61
Final Oil Recovery, (% OOIP) 83.75 81.25 87.5 61.33 86.66 82.66 81.33
Average Combustion Front Peak Temperature (C) 489 372 499 350 448 486 400
Maximum Conclude of Produced CO22, Mole % 10.14 7.18 6.3-2.5 5.55 9.21 10.15 5.7
Maximum Conclude of Produced CO, Mole % 5.43 4.052 3.8-1.2 4.83 4.69 5.41 3.1
Maximum Conclude of Consumed O2, Mole % 19.16 19.21 16.55-7.63 13.76 19.25 19.2 15.9
Utilization of O2, % 97 96.5 96.3 65 92 92 76
Apparent Hydrogen Carbon Ratio 1.92 2.83 3.21 2.25
m-Ratio 0.33 0.23 0.25 0.13
Peak Temp. (K) Of H/C & M-Ratio 608 660 580 692
35.0 59.0 34 21
29.5 42.5 33 25
16.0 36.0 33. 8.0
Activation Energy (E) KJ/MoleFuel Combustion (E1)Fuel Deposition (E2)
LTO (E3

141 MEHRAN UNIVERSITY RESEARCH JOURNAL OF ENGINEERING & TECHNOLOGY, VOLUME 30, NO. 1, JANUARY, 2011 [ISSN 0254-7821]
DESIGN AND OPERATION OF LABORATORY COMBUSTION CELL FOR AIR INJECTION INTO LIGHT OIL RESERVOIRS: POTENTIALAPPLICATION IN SINDH FIELD
However, oxygen concentration was kept constant for allthe runs. The effect of each parameter upon the oxygenconversion was determined from analysis of the inletoxygen and exhaust gases, oxygen and carbon oxides.The pressure was varied from 690-11032 KPa; outlet flowrate from 50-500 ml/min at room temperature andatmospheric pressure. These rates correspond to air fluxesranging from 3.797-37.97 Sm3/m2-hr. At temperature below100oC, the oxygen conversion was too small to besatisfactorily used in the quantitative analysis of the kineticdata. The data reported here are for oxidation temperaturesabove 200oC.
5.1 Effluent Gas Analysis
Fig. 4 represents only one peak that appears in theproduction of carbon oxides at temperature about 300oC.In this peak amount of oxygen consumed exceeds that
recovered as carbon oxides gas. Oxygen mole fractiondecreasing in the produced gas indicates that the producedreaction gases exhibit an increased amount of CO2
generated gradually displaced the air saturation in thesand pack. The final O2 consumed was less than 2%.
Fig. 5 shows two apparent peaks in the production ofcarbon oxides at different temperature. This as well as theresult of differential Thermal Analysis, confirm theexistence of at least two reactions. First peak appears attemperature (around 300oC); the mole fraction of theoxygen consumption is equal to mole fraction of theproduced CO2 and 0.5 CO. But the 2nd peak at hightemperature (about 425oC), the O2 consumption is largerthan CO2 and CO produced. The temperature below 100oC,some O2 is consumed but no carbon oxides are produced.The first peak at low temperature in the gas concentrationgraphs corresponds to the oil oxidation however, the smallpeak corresponds to fuel combustion at high temperatures.
FIG. 5. GAS COMPOSITION AND TEMPERATURE VERSUS TIME FOR RUN-4
FIG. 4. GAS COMPOSITION AND TEMPERATURE VS TIME FOR RUN-2
MEHRAN UNIVERSITY RESEARCH JOURNAL OF ENGINEERING & TECHNOLOGY, VOLUME 30, NO. 1, JANUARY, 2011 [ISSN 0254-7821] 142
DESIGN AND OPERATION OF LABORATORY COMBUSTION CELL FOR AIR INJECTION INTO LIGHT OIL RESERVOIRS: POTENTIALAPPLICATION IN SINDH FIELD
Comparing the results presented in Figs. 4-5, it is clearthat the first peak is higher or smaller than the 2nd one,depending on the rock proerties and crude oil properties.As shown in Figs. 4-5, the light oil of Badin Oil Field dueto its high reactivity with oxygen at low temperature has afirst peak, which is much higher than the second one. Incontrast, for the heavy viscous Wolf Lake Oil, thecombustion peak is much higher than the low temperaturepeak. Kazi, R.A., [14], who used 10o API Wolf Lake Oil.This indicates the propensity of this crude oil for fueldeposition. The produced carbon oxide gases can accountfor almost all the oxygen consumed at high temperatures.Since the production of carbon oxide gases representsthe removal of carbon, the reaction associated with 2ndpeak is controlled by the simultaneous availability of fueland O2 at high temperature. The fuel is considered to beburning when conditions associated with the 2nd peakprevail i.e. the amount of O2 consumed is eventuallybalanced by the amount of produced carbon oxide gases.In this low temperature region the fuel is being oxygenated,rather than burned; a smoldering rather than burning takesplace.
5.2 Effect of System Pressure
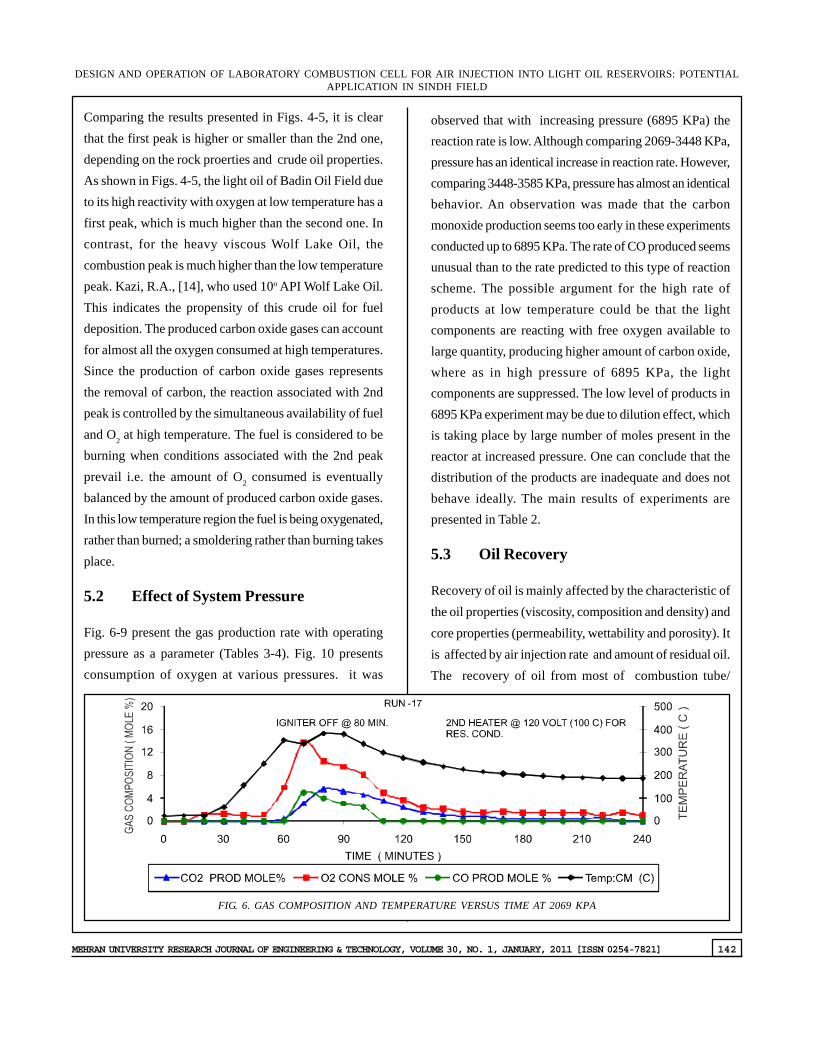
Fig. 6-9 present the gas production rate with operatingpressure as a parameter (Tables 3-4). Fig. 10 presentsconsumption of oxygen at various pressures. it was
observed that with increasing pressure (6895 KPa) thereaction rate is low. Although comparing 2069-3448 KPa,pressure has an identical increase in reaction rate. However,comparing 3448-3585 KPa, pressure has almost an identicalbehavior. An observation was made that the carbonmonoxide production seems too early in these experimentsconducted up to 6895 KPa. The rate of CO produced seemsunusual than to the rate predicted to this type of reactionscheme. The possible argument for the high rate ofproducts at low temperature could be that the lightcomponents are reacting with free oxygen available tolarge quantity, producing higher amount of carbon oxide,where as in high pressure of 6895 KPa, the lightcomponents are suppressed. The low level of products in6895 KPa experiment may be due to dilution effect, whichis taking place by large number of moles present in thereactor at increased pressure. One can conclude that thedistribution of the products are inadequate and does notbehave ideally. The main results of experiments arepresented in Table 2.
5.3 Oil Recovery
Recovery of oil is mainly affected by the characteristic ofthe oil properties (viscosity, composition and density) andcore properties (permeability, wettability and porosity). Itis affected by air injection rate and amount of residual oil.The recovery of oil from most of combustion tube/
FIG. 6. GAS COMPOSITION AND TEMPERATURE VERSUS TIME AT 2069 KPA

143 MEHRAN UNIVERSITY RESEARCH JOURNAL OF ENGINEERING & TECHNOLOGY, VOLUME 30, NO. 1, JANUARY, 2011 [ISSN 0254-7821]
DESIGN AND OPERATION OF LABORATORY COMBUSTION CELL FOR AIR INJECTION INTO LIGHT OIL RESERVOIRS: POTENTIALAPPLICATION IN SINDH FIELD
oxidation tube tests above 75% of original oil in placewas obtained leaving residual oil saturation of about 15%in the sand packs, the latter is, of course, governed by thelimited duration of the oxidation inside the CC. As the
pressure increased from 2069-3448 KPa, cumulative oilproduction increased about 15%, however, at pressure6895 KPa no significant effect was observed as given inTable 2.
FIG. 7. GAS COMPOSITION AND TEMPERATURE VERSUS TIME AT 3448 KPA
FIG. 8. GAS COMPOSITION AND TEMPERATURE VERSUS TIME AT 3585 KPA
FIG. 9. GAS CONCENTRATION AND TEMPERATURE VERSUS TIME AT 6895 KPA

MEHRAN UNIVERSITY RESEARCH JOURNAL OF ENGINEERING & TECHNOLOGY, VOLUME 30, NO. 1, JANUARY, 2011 [ISSN 0254-7821] 144
DESIGN AND OPERATION OF LABORATORY COMBUSTION CELL FOR AIR INJECTION INTO LIGHT OIL RESERVOIRS: POTENTIALAPPLICATION IN SINDH FIELD
5.4 Apparent Hydrogen Carbon RatioApparent HC (Hydrogen Carbon) ratio which characterizesoxidation and is indicative of the nature of the fuel beingburned is a useful indicator for a process involving bothsimultaneously hydrocarbon and a coke oxidation. Thenature of the fuel changes as the hydrocarbons and cokeare oxidized simultaneously. In most of the runs LTOreactions were observed. Therefore, the calculations arebased on assumption that 100% was not observed in theexit gas had reacted from water and have been averagedto the temperature range of interest (HTO zone). The HC
ratios for these experiments are presented in Fig. 11.Table 2 presents HC ratio, peak temperature and detailedresults are presented graphically.
Abu-Khamsin, et al., [15] found the distillation of crude
plays an important role in shaping the nature and extent of
the cracking reactions. With extensive distillation they
observed less weight loss due to visbreaking, leaving a
larger oil fraction transforming to coke. When LTO occurs
in unconsolidated formations the heavier residual oil is
produced and visbreaking is more effective leading to larger
TABLE 4. SUMMARY 0F OPERATING AND CONTROL PARAMETERS
RunInjected Gas Operating Flow Air
No.Analysis Mole Pressure Temperature Conductivity (C) Rate Flux(%)
(KPa) (ml/min) (Sm3/m2-hr)O2 N2
5 21 79 3600 100 7.595
2 21 79 3516 100 7.595
4 21 79 3516 Non-Isothermal 5 (C/min) 100 7.595
17 21 79 2069 2nd Heater Installed @ 120V to 125 9.493
20 21 79 3448 Maintain the Reservoir temperature (100C) 125 9.493
24 21 79 3585 125 9.493
29 21 79 6895 125 9.493
TABLE 3. SUMMARY OF SAND PACK PARAMETERS
Run Percent by WightTotal Weight (%)
Oil Volume So Oil by
No. 80M 100M 200M API of Oil (ml) (%) Weight (%)
5 10 80 10 100 37.5 80 81.25 24.5
2 22 65 13 100 37.5 80 81.25 24.5
4 10 60 30 100 37.5 80 81.25 24.5
17 10 76 20 100 36.0 70 64.0 22.5
20 10 70 20 100 36.0 70 64.0 22.5
24 10 70 20 100 36.0 70 64.0 22.5
29 10 70 20 100 36.0 70 64.0 22.5

145 MEHRAN UNIVERSITY RESEARCH JOURNAL OF ENGINEERING & TECHNOLOGY, VOLUME 30, NO. 1, JANUARY, 2011 [ISSN 0254-7821]
DESIGN AND OPERATION OF LABORATORY COMBUSTION CELL FOR AIR INJECTION INTO LIGHT OIL RESERVOIRS: POTENTIALAPPLICATION IN SINDH FIELD
amount of coke and higher fuel deposition with a smaller
HC ratio of the fuel burned. Dabbous and Fulton [16]
observed similar HC ratio in the presence and absence of
LTO reactions. High HC ratio was obtained from soft
brown coke in absence of LTO reactions. In contrast a low
HC ratio was obtained from hard black coke in presence
of LTO reactions. Ramey [17] obtained oxidized residues
at temperatures as low as 149oC.
5.5 m-Ratios
The behavior of m-ratio under these conditions versuscombustion time is presented in Fig. 12. The productionof (CO2 and CO) gases was very low at the low temperature
range of 180-280oC. m-ratio decreased from 0.7-0.15 andfairly constant (0.15) was measured at temperatures from340-370oC. Table 2 presents the m-ratio, peak temperatureand few results are presented graphically (Fig. 12).
Lewis [18] observed that m-ratio for the combustionreaction for charcoal is about 0.24. The value of 0.24 isattributed to the carbon oxidation or coke combustion;value different from this indicates that different reactionsare taking place. Fassihi, et. al., [19] has attributed valueshigher than 0.24 to the burned fuel in the combustion ashydrocarbon reaction. The trend of the both the HC andthe m-ratio in consolidated formations indicates that theburned fuel in the HTO region may consist of a heavy
FIG. 11. APPARENT HC RATIO VERSUS TIME FOR DIFFERENT SYSTEM PRESSURES
FIG. 10. OXYGEN CONSUMPTION WITH DIFFERENT SYSTEM PRESSURE VERSUS TIME FOR R-17,20,24 AND R-29

MEHRAN UNIVERSITY RESEARCH JOURNAL OF ENGINEERING & TECHNOLOGY, VOLUME 30, NO. 1, JANUARY, 2011 [ISSN 0254-7821] 146
DESIGN AND OPERATION OF LABORATORY COMBUSTION CELL FOR AIR INJECTION INTO LIGHT OIL RESERVOIRS: POTENTIALAPPLICATION IN SINDH FIELD
residue plus coke in the temperature range considered.The decrease of the HC and m-ratio in unconsolidatedformations suggests that the burning fuel in the HTO regionis more likely coke.
5.6 Total System Pressure Effect
Arrhenius graphs were drawn by assuming (1.0, 0.5 and2) order of reaction rate with concentration of carbon ,which also confirmed that increased pressure (3446 KPa)has high activation energy of 59 KJ/mole than to theexperiments conducted at lower pressure (2069 KPa), 35KJ/mole for high temperature reaction zones. The possibleargument for the high rate of products at low temperaturecould be that the light components are reacting with freeoxygen available. To large quantity, producing higheramount of Carbon oxide, where as in high pressure of6895 KPa the light components are suppressed. The lowlevel of products in 6895 KPa experiment may be due todilution effect, which is taking place by large number ofmoles present in the reactor on increased pressure. Onecan conclude that the distribution of the products areinadequate and does not behave like ideal. This non-ideal behavior of the reactor could be attributed to themixing of the reactor. This is in depth investigation ofthe effect of pressure on this process was conductedusing 36oAPI oil.
6. KINETIC PARAMETERS
As mentioned earlier Arrhenius method for the analysis ofkinetic data were used for considering the relative reactionrate of carbon burned in terms of carbon oxides producedeffluent gas. As the reactant is the crude oil, or its residue,whatever the composition, the resultant kinetic parametersare only accounted for over a limited temperature range.Fig. 13 shows the effect of system pressure for air 21% O2.The plots did not behave as expected. The high pressureline should lie above the low pressure line, where as nosuch trend was observed. This phenomenon is notcompletely under stood. But up to the pressure of 3585KPa low pressure line lies above the high pressure line.Similar curves were drawn for 21% O2 concentrations ininlet gas and the same mixed plots were obtained for fueldeposition and LTO reactions as presented in Figs. 14-15respectively. The kinetic parameters were calculated foreach run at different depth of combustion cell. Table 2presents the kinetic data evaluated using Arrheniusmethod by considering the order of reaction with respectto fuel n is equal to (1.0, 0.5 and 2.0). The kinetic parametersfor various runs at different pressures show that thecalculated activation energies are similar but not in completeagreement. Again, the discrepancy appears to be an artifactof the data analysis procedure by which the temperature
FIG. 12. M- RATIO VERSUS TIME FOR DIFFERENT SYSTEM PRESSURE

147 MEHRAN UNIVERSITY RESEARCH JOURNAL OF ENGINEERING & TECHNOLOGY, VOLUME 30, NO. 1, JANUARY, 2011 [ISSN 0254-7821]
DESIGN AND OPERATION OF LABORATORY COMBUSTION CELL FOR AIR INJECTION INTO LIGHT OIL RESERVOIRS: POTENTIALAPPLICATION IN SINDH FIELD
ranges were decoupled. Irrespective of small differencesin activation energies these have been plotted against the
total pressure and for better observation, these valueswere linearized.
FIG. 13. ARRHENIUS PLOT FOR FUEL COMBUSTION REACTION WITH DIFFERENT SYSTEM PRESSURE
FIG. 14. ARRHENIUS PLOT FOR FUEL DEPOSITION REACTION AT DIFFERENT SYSTEM PRESSURE
FIG. 15. ARRHENIUS PLOT FOR LTO REACTION WITH DIFFERENT SYSTEM PRESSURES

MEHRAN UNIVERSITY RESEARCH JOURNAL OF ENGINEERING & TECHNOLOGY, VOLUME 30, NO. 1, JANUARY, 2011 [ISSN 0254-7821] 148
DESIGN AND OPERATION OF LABORATORY COMBUSTION CELL FOR AIR INJECTION INTO LIGHT OIL RESERVOIRS: POTENTIALAPPLICATION IN SINDH FIELD
7. REPEATABILITY AND ACCURACYOF RESULTS
All runs were repeatable using the same fuel in repeated
runs. The run results are not reported in this paper
due to the similar results. The same procedure wasfollowed in matching the other results and the
repeatability of the test was confirmed. To verify that
the activation energies and the reaction orders derivedfrom the analysis were reasonable. The amount of
oxygen consumed in the three reactions was supper
imposed upon one another and the results werecompared to the experimental oxygen consumption
curves. The match was good for these and other similar
data. To integrate the area under the oxygenconsumption curve trapezoidal rule was used. This
induced some errors when there was a sharp change
in gas composition. It also introduced some errors intothe calculations of curve fitting and extrapolation of
the reaction rates of lower temperatures. These
calculations were particularly sensitive to the choiceof the point at which the relative reaction rate curve
would deviate from the straight line. Thus in all runs
using the same fuel except few runs; the calculatedactivation energy (E) was not the same. Therefore to
normalize the data, first the E, which was quite different
from the average value, were not present in the graph.Then calculated values of the activation energy of the
slope of straight line were drawn through experimental
data points on the Arrhenius plot (Fig. 13 and 15).This was achieved by selecting an arbitrary data point
at the mid range of the abscissa as the focal point. For
a combustion reaction (Fig. 13), this point was about1.5x10-3k-1. The corresponding points of deposition
of fuel as presented in Fig. 14 and LTO kinetic reaction
is shown in Fig. 15. Relative reaction rate versusinverse of temperature for fuel deposition and LTO
are 1.6x10⁻³ and 2.3x10⁻³k-1, respectively.
8. CONCLUSIONS
(i) A new slim and short CC strategy was developedto assess the recovery potential by air injectioninto depleted light oil reservoirs of Sindh,Pakistan. All the experiments are performed withloose sand pack mixed with Light oil.
(ii) At high, medium and low temperature, ignitionwas observed and efficient combustion takesplace in all reported runs. It was observed thatflue gases were generated by oxidation reactionat different temperature. The average percentagesof gases are as follows:
Production of carbon dioxide is 10.2%.
Production of carbon monoxide is 4.4%and balance is unreacted oxygen.
Oxygen consumption varies from 6597%.
(iii) It was observed that by increasing the pressureincreased, the peak in temperature and decreasedvelocity in combustion zone were resulted.
(iv) Direct Arrhenius method was applied withrespect to carbon concentration for evaluatingorder of reaction from 0.5, 1.0, 1.5 and 2. In looserock formations, behavior of kinetic indicatesmoderate reactive depositiopn of fuel. Activationenergy for fuel combustion, fuel deposition andLTO reactions varied from 21-59, 25-43, and 8-36KJ/mole respectively.
(v) m-ratio (about 0.13) and hydrogen carbon ratio(about 1.92) were calculated at varioustemperature and pressure for this air injectionprocess. The results obtained from the airinjection equipment, indicate that the light oil ishighly reactive at reservoir conditions for airinjection process.

149 MEHRAN UNIVERSITY RESEARCH JOURNAL OF ENGINEERING & TECHNOLOGY, VOLUME 30, NO. 1, JANUARY, 2011 [ISSN 0254-7821]
DESIGN AND OPERATION OF LABORATORY COMBUSTION CELL FOR AIR INJECTION INTO LIGHT OIL RESERVOIRS: POTENTIALAPPLICATION IN SINDH FIELD
(vi) These first stage experiments are very positiveindication of the potential viability of the airinjection process in light oil fields.
ACKNOWLEDGEMENTS
The authors gratefully acknowledge the financial supportof the Higher Education Commission, Islamabad, thatmade this research work possible. Further the authorsextended sincere thanks to Dr. Gordon Moore, Chairman,Department of Chemical and Petroleum Engineering,University of Calgary, Alberta, Canada, for his valuablesuggestions. Finally, the technical support provided bythe Mehran University of Engineering and Technology,Jamshoro, Pakistan, in general and Institute of Petroleumand Natural Gas Engineering in particular are highlyacknowledged.
REFERENCES
[1] Kuhn, C.S., and Koch, R.L, " In-Situ Combustion NewestMethod of Increasing Oil Recovery", Journal of Oil and
Gas, Volume 92, August 10, 1953.
[2] Grant, B.F., and Szasz, S.F., “Development of anUnderground Heat Wave for Oil Recovery",Transactions on AIME, Volume 201, No. 108, 1954.
[3] Nelson, T.W., and McNeil, J.S., "Thermal MethodsProvide Three Ways to Improve Oil Recovery", Journal
of Oil and Gas, Volume 86, January 19, 1959.
[4] Nelson, T.W., and McNeil, J.S., "How to Engineer an In-Situ Combustion Project", Journal of Oil and Gas,Volume 58, June 5, 1961.
[5] Greaves, M., Ren, S.R., Rathbone, R.R., Fishlock, T.,and Ireland, R., "Improved Residual Light Oil Recovery
by Air Injection (LTO Process)", 49th Annual TechnicalMeeting, Volume 39, No. 1, Calgary, Alberta., Canada,January, 2000.
[6] Moore, R.G., "New Strategies for In-Situ combustion",Journal of Canadian Petroleum Technology, Volume 32,No. 10, 1993.
[7] Yannimaras, D.V., and Tiffin, D.L., "Screening of Oils
for In-Situ Combustion at Reservoir Conditions by
Accelerating-Rate calorimeter", SPE Reservoir
Engineering, Volume 10, pp. 36, February, 1995.
[8] Greaves, M., Benther, A.H., and Rathbone, R.R., "Air
Injection into Light Oil Reservoirs-Oxidation Kinetics
and Simulation", European Symposium on Improved
Oil Recovery, Budapest, April, 2005.
[9] Stoka, S., Rogaland, R.F., and Oesthus, A., "Evaluation
of Air Injection as an IOR Method for The Giant Ekofish
Chalk Field", SPE International IOR Conference in Asia
Pacific, Kuala Lumpur, Malaysia, December, 2005.
[10] Kumar, V.K., Gutierrez, D., Moore, R.G., and Mehta,
S.A., "Air Injection and Water Flooded Performance
Comparison of Two Adjacent Units in Buffalo Field:
Technical Analysis", SPE Paper/DOE Symposium on
IOR, Tulsa, Oklahoma, USA, April, 2006.
[11] Greaves, M., Ren, S.R., and Rathbone, R.R., "Air Injection
Technique (LTO Process) for IOR from Light Oil
Reservoirs: Oxidation Rate and Displacement Studies",
SPE Paper/DOE IOR Symposium, Tulsa, Oklahoma,
USA, April, 1998.
[12] Greaves, M., Ren, S.R., and Xia, T.X., "New Air Injection
Technology for IOR Operations in Light and Heavy Oil
Reservoirs", SPE Paper on Improved Oil Recovery, Kuala
Lumpur, Malaysia, October, 1999.
[13] Tunio, A.H., "To Investigate the Use of Air Injection to
Improve Oil Recovery from Light Oil Reservoirs", Ph.D.
Thesis, Institute of Petroleum & Natural Gas Engineering,
Mehran University of Engineering & Technology,
Jamshoro, Pakistan, March, 2008.
[14] Kazi, R.A., "A High Pressure Kinetic study of the In-Situ
Combustion Process for Oil Recovery", Ph.D. Thesis,
University of Salford, 1995.
[15] Abu-Khamsin, William, E.B., and Ramey, "Reaction
Kinetics of Fuel Formation for In-Situ Combustion",
Society of Petroleum Engineering Reserviors,
pp. 1308-1316, November, 1988.

MEHRAN UNIVERSITY RESEARCH JOURNAL OF ENGINEERING & TECHNOLOGY, VOLUME 30, NO. 1, JANUARY, 2011 [ISSN 0254-7821] 150
DESIGN AND OPERATION OF LABORATORY COMBUSTION CELL FOR AIR INJECTION INTO LIGHT OIL RESERVOIRS: POTENTIALAPPLICATION IN SINDH FIELD
[16] Dabbous, M.K., and Fulton, P.F., “Low Temperature
Oxidation Reaction Kinetics and Effects of the In-Situ
Combustion Process", Society of Petroleum Engineering
Reserviors, pp. 253-262, June, 1974.
[17] Ramey, H.J., Jr., “In-Situ Combustion" Proceedings of
the 8th World Petroleum Congress, pp. 253-262,
Moscow, 1971.
[18] Lewis, W.K., Gilliland, E.R., and Pakston, R.R., “LowTemperature Oxidation of Carbon", Industrial andEngineering Chemical, Volume 46. No. 2, pp. 1327-1331, 1954.
[19] Fassihi, M.R., and Brigham, W.E., "Analysis of FuelOxidation in In-Situ Combustion Oil recovery", TopicalReport, Stanford University Petroleum ResearchInstitute Stanford, California. August, 1982