Service Delivery in Rural Municipalities: Privatize, Cooperate, or Go It Alone?
31
Service Delivery in Rural Municipalities: Privatize, Cooperate, or Go It Alone? John M. Halstead Professor Department of Natural Resources and the Environment University of New Hampshire Durham, NH 03824 Robert Mohr Associate Professor Department of Economics University of New Hampshire Durham, NH 03824 Steven C. Deller Professor Department of Agricultural and Applied Economics University of Wisconsin-Madison Madison, Wisconsin Selected Paper prepared for presentation at the Agricultural & Applied Economics Association’s 2010 AAEA, CAES & WAEA Joint Annual Meeting, Denver, Colorado, July 25- 27, 2010. Copyright 2010 by Halstead, Deller, and Mohr. All rights reserved. Readers may make verbatim copies of this document for non-commercial purposes by any means, provided this copyright notice appears on all such copies. We are indebted to Norm Walzer for sharing the Illinois data with us. Deller received support from the University of Wisconsin Cooperative Extension and the University of Wisconsin Agricultural Experiment Station. Mohr thanks the Federal Reserve Bank of Boston for hosting him as a visiting scholar to complete this research.
Transcript of Service Delivery in Rural Municipalities: Privatize, Cooperate, or Go It Alone?

Service Delivery in Rural Municipalities: Privatize, Cooperate, or Go It Alone?
John M. Halstead
Professor
Department of Natural Resources and the Environment
University of New Hampshire
Durham, NH 03824
Robert Mohr
Associate Professor
Department of Economics
University of New Hampshire
Durham, NH 03824
Steven C. Deller
Professor
Department of Agricultural and Applied Economics
University of Wisconsin-Madison
Madison, Wisconsin
Selected Paper prepared for presentation at the Agricultural & Applied Economics
Association’s 2010 AAEA, CAES & WAEA Joint Annual Meeting, Denver, Colorado, July 25-
27, 2010. Copyright 2010 by Halstead, Deller, and Mohr. All rights reserved. Readers may
make verbatim copies of this document for non-commercial purposes by any means, provided
this copyright notice appears on all such copies. We are indebted to Norm Walzer for sharing the
Illinois data with us. Deller received support from the University of Wisconsin Cooperative
Extension and the University of Wisconsin Agricultural Experiment Station. Mohr thanks the
Federal Reserve Bank of Boston for hosting him as a visiting scholar to complete this research.

1
Alternative Methods of Service Delivery in Small and Rural Municipalities
Abstract: Choices in production and contracting arrangements for a wide range of services were
studied using data from approximately 1,000 small, mostly rural municipalities from Illinois,
New Hampshire and Wisconsin. Results suggest the use of both for-profit contractors and
cooperative agreements with other governments correlate negatively with population. Small
municipalities are less likely to use competitive bidding processes, compare costs between
production options, or report that privatization produces savings. Median income, rural
geography, and ideology show statistically-significant associations with contracting choices.
Respondents generally consider themselves ―satisfied‖ with services provided by contract,
although satisfaction levels are lower than those associated with self-provision. Satisfaction
associated with services provided by other governments is lower than satisfaction with services
provided by private contractors, suggesting no tradeoff in service quality directly attributable to
―for-profit‖ contractors.

2
Introduction
Many small and rural local governments face the stresses of economic downturns or
stagnation and are struggling to maintain service levels. Other municipalities, amenity rich or
within commuting distance to urban areas, cope with population growth and additional service
demands. Local governments also face long-term declines in state and federal support and
resistance towards expanding traditional revenue sources like property taxes or exploring new
revenue sources like user fees and charges. These governments feel pressure to find more
efficient ways to produce necessary services. One option receiving significant attention in urban
settings is privatization, where a municipality uses competitive bidding to contract out
production of services to for-profit firms. While this option has enjoyed success in larger and
medium sized cities, it poses potential problems for smaller, rural communities. Producing
public services by engaging for-profit firms requires clearly delineated, enforceable contracts,
sufficient numbers of qualified contractors to allow competitive bidding, and managerial
capacity to supervise contractor performance, which the smallest municipalities may lack.
If privatization through contracting with a for-profit firm is not feasible for the
production of a particular service in a small municipality, a cooperative agreement to work
jointly with a neighboring government to produce services might be an alternative.1 Lackey et
al. (2002, 138) argue that such agreements offer ―increased local decision-making capacity,
retention of local identity, increased access to external resources, economies of scale, cost-
effectiveness, protection for resource-dependent economies, and greater political influence
through strength in numbers.‖ Nonetheless, much of the literature perceives inter-governmental
cooperation as a relatively rare event, with the exception of emergency services (Cigler 1994).

3
This study considers a full range of choices that small and rural municipalities face:
providing services themselves, entering into an agreement with a profit or not-for-profit
contractor, or entering into an agreement with another government or authority. Unlike most
studies, which focus on specific services, our data cover 59 common municipal functions. By
studying small and rural communities, a broad range of services, and a menu of different options
for production of those services, we hope to shed light on some issues that are currently only
incompletely understood. For example, the data can highlight the very different constraints
faced by small and rural communities compared to their larger urban or suburban counterparts,
and provide detailed insight into how factors like fiscal stress, prior experiences, and future
expectations might shape production decisions. Analysis of the data can highlight how the
choices of privatization and inter-governmental cooperation relate and provide insight into the
relative outcomes of privatization and cooperative agreements. This study is among the first to
examine the levels of satisfaction associated with different forms of service provision.
Background
Focusing on small municipalities is particularly interesting when considered from
different theoretical perspectives relating to privatization. Bel and Fageda (2008), for example,
classify most of the theoretical work as taking either a public choice, or transactions costs
approach. The public choice approach can often be characterized by a ―leviathan‖ view of
government, which argues that government monopoly over public services leads to over
production and inefficiency.2 This view suggests that outsourcing the production of public
services may not only be a sound management decision, but also a sound economic growth
decision. The belief that governments tend towards inefficiency has helped bolster the New
Public Management philosophy and management approach (Terry 2005; Hood 1995; Kettl

4
1997). The logic behind New Public Management is that government officials and managers
need to be more entrepreneurial in their approach to service production. While the provisionary
decisions of which services to provide and how to pay for them remain within the political realm
of elected officials, production decisions are more technical and more in line with the
functioning of private businesses. As such, public administration can benefit from studying
business concepts of customer service, total quality management and outsourcing (Lyons and
Lowery 1989). One of the ramifications of this approach has been a rapid increase in exploring
alternative service delivery options such as contracts with for-profit firms or non-profits and
forming cooperative agreements with neighboring local governments for joint service delivery.
The adoption of New Public Management approaches has led to concerns that center on
what Terry (2005) describes as the ―hollowing of the state.‖ As governments increasingly rely
on contracts with private providers, traditional public institutions are radically restructured. In
the extreme, rather than managing personnel or organizing departments, public administrators
are reduced to monitoring contracts. The concern is that, as public institutions are restructured
around an expertise in managing private contractors, the ability to return to traditional
arrangements will be difficult, even if the new contracts prove to be disadvantageous.
The transactions costs approach (e.g. Williamson 1979 and 1999) maintains that factors
that affect transactions costs, like the ability to monitor and enforce contracts, determine the
relative benefits of different forms of service provision. Much of the current work in New Public
Management focuses on methods of developing, monitoring and enforcing contracts (Brown and
Potoski 2003; Rornzek and Johnston 2005). Skeptics of public-private collaboration note that
poor contract structure is a problem (Bloomfield 2006). Especially in smaller and more rural
municipalities, much of the decision to ―outsource‖ service production may hinge on the ability

5
to write and monitor enforceable contracts. In a series of studies looking at managerial capacity
of smaller and rural governments, Honadle (e.g. 1981, 2001) finds that many of these
governments are run by volunteers and a small staff of employees. The municipal clerk may
have an associate’s degree in accounting and the public works director spends the majority of her
time plowing roads and filling potholes. Given the lack of professional or trained staff, smaller
municipalities may be at a relative disadvantage in writing and monitoring enforceable contracts.
Other studies reinforce the conclusion that small communities face higher and different
forms of transaction costs. Deller (1998) shows that the ability for smaller and rural local
governments to enact and supervise contracts, which requires tasks like auditing, maintaining
quality standards, and responding to cost overruns, is particularly limited. Brown and Potoski
(2003, 154) argue that contract management is ―a highly complex process requiring multiple
types of expertise from public managers.‖ The small municipalities studied here (over half with
a population of under 5,000) might be unable to provide such a level of expertise. Terry (2005)
and Brown, Potoski and Van Slyke (2006) show that even large units of government have
difficulty negotiating, monitoring and enforcing contracts. It is likely that these challenges are
magnified in smaller and rural local governments, so that these communities lack capacity to
fully benefit from outsourcing provision responsibilities to private providers. Since lack of
managerial capacity may make it difficult for the smallest municipalities to benefit fully from
privatization, our work also considers the degree that such municipalities provide services
through cooperative agreements between governments such as formal and informal agreements
to lend each other support for emergency services.3
Few studies look closely at the experiences of small municipalities using cross-sectional
data. Research typically draws on the International City and County Management Association

6
surveys (e.g. Greene 1996; Ferris and Graddy 1986; Warner and Hefetz 2002), or the Census of
Governments (e.g., Kodrzycki 1994; Lopez-de-Silanes, Shleifer and Vishny 1997). Such
analyses have three central limitations. First, they lack detail in terms of history of service
provision methods used. Contracts that have been in place for years are treated the same as
newly adopted forms of provision. Today’s characteristics might be used to explain patterns of
decisions that were made years prior.4 Second, many studies use a dichotomous dependent
variable often in the form of a yes/no response. This masks the continuous nature of many
service-production arrangements. Municipalities may contract for road construction but retain
maintenance responsibilities; some state mandated social services cannot be contracted out but
supplemental services such as domestic abuse support services are contracted to non-profits.
Forms of contracting also differ. Contracted services might be produced by another municipality
or a for-profit firm. Third, and most relevant to our work, is that surveys of municipalities
typically exclude municipalities of less than 10,000, or provide data only at the county level.5
Data
The research presented here uses survey data from approximately 1,000 municipalities in
Illinois (IL), New Hampshire (NH), and Wisconsin (WI). All of the included municipalities are
small, over a third have populations less than 1,000, and a significant proportion is rural. New
Hampshire is a small, rural, somewhat conservative state with a long tradition of decentralized,
local control. Illinois is dominated by a large metro area and therefore allows for insights into
patterns of service production at the edge of the urban fringe. Wisconsin contains a
heterogeneous mix of small and medium sized communities. While there are state specific
characteristics that make each state unique, the only ―oddity‖ might be the lack of a viable
network of county governments in New Hampshire. In Illinois and Wisconsin the county is a

7
viable potential partner for many small and rural municipalities whereas this option is not
available for New Hampshire municipalities. The classic example is contracting with the county
sheriff department to provide law enforcement services to municipal residents.
Primary data for this study come from three separate municipal surveys in Illinois,
Wisconsin, and New Hampshire. The first was the 1995 Illinois Municipal Privatization
Questionnaire, which served as a model for the subsequent studies in WI (1997) and NH (2004).
In each state, the survey was distributed jointly by researchers at one of the state’s public
universities and a local government association (Illinois Municipal League, Wisconsin League of
Municipalities, and The NH Local Government Center). The IL survey produced 516 responses,
the WI Survey produced 452 responses and the NH survey produced 138 responses, yielding
response rates of 40%, 73%, and 59%, respectively. Johnson and Walzer (1996, 1998), Deller,
Hinds, and Hinman (2001) and Girard et al. (2009) provide detailed descriptions of the survey
design and implementation for each survey. Survey instruments followed identical formats
across all three states; while the disparate timing of the three surveys makes it impossible to
differentiate between state-specific and year-specific trends in the data, the survey instruments
were administered with the ultimate intent of assembling a multi-state data set.
In addition to asking about fiscal health and background materials, the surveys focus on
asking how each of 82 services is provided and the level of satisfaction (a 5 point Likert scale)
with the service provision arrangement. Choices over service provision include ―municipal
provision‖ (either ―entirely‖ or ―in part‖), ―another government or authority,‖ or ―private‖ (either
―for-profit‖ or ―non-profit‖). The survey also asks general questions about plans for future
outsourcing, the government’s role in providing services to other municipalities, experiences
with privatization in nearby municipalities, and experiences with bidding and contracts.

8
A number of the 82 services are only rarely provided by municipalities across all three
states. In such cases, respondents were instructed to not respond to the questions. To avoid
drawing inferences from very small samples, we exclude 21 services that have less than a 40
percent response rate among completed surveys. Because our study focuses on the tradeoffs
faced by small and rural municipalities, we also exclude data from municipalities with
populations exceeding 50,000. The remaining data cover 1,083 municipalities and 59 services.
After excluding non-responses for particular questions, this produces a data set with 36,605
municipality-service combinations. In addition to providing a descriptive summary of the survey
results, we also use a multivariate analysis to identify effects of factors such as population,
income levels, and fiscal stress on the decision to use alternative delivery options.
Descriptive Results
Characteristics of Municipalities. Fiscal stress, managerial capacity, and scale may influence
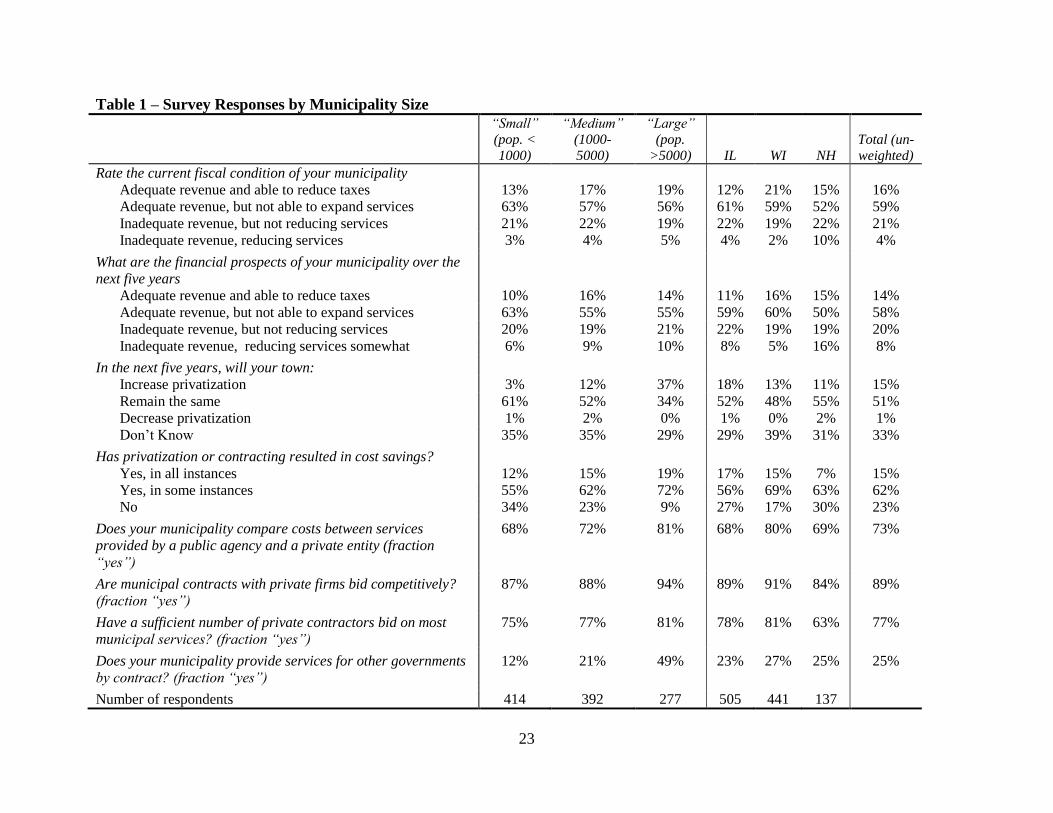
the choices made by small and rural governments over the production of services. Table 1 shows
that measures of fiscal health correlate with municipal size. The smallest governments are less
likely to describe a revenue shortfall requiring a reduction in services, while larger municipalities
are more likely to give a pessimistic view of the next five years. Ten percent of the largest
municipalities anticipate service reductions.6 Smaller municipalities might feel less pressure to
use external contracts to address short-term fiscal stress; when asked about future plans for
privatization, the smallest local governments are least likely to consider expanding privatization.
[Table 1 here]
When municipalities do use private contractors, the process and outcomes differ
significantly. The smallest municipalities are least likely to report comparing costs between
public and private production methods, using a competitive bidding process, or generating a

9
sufficient number of bids from private contractors. Perhaps due to these reasons, respondents
from smaller municipalities are also least likely to report that privatization produces cost savings.
Write-in responses suggest that smaller, rural local governments appear to use privatization as a
matter of practicality. Respondents described scenarios like hiring out tasks to avoid investments
in equipment or the need to hire more than a portion of a specialist’s time.
Patterns in the Production of Services. In table 2 we detail the patterns of how municipalities in
our sample actually produce services. Because decisions over the form of service provision may
relate to the degree that a service involves client contact, italics denote services where citizens
might be particularly likely to interact with service providers. Local officials may view services
that are more ―out of sight out of mind‖ more suitable to contracting out.
[Table 2 here]
This descriptive information reveals a number of patterns. First, both privatization and
cooperative agreements are quite common. For about half of the 59 services, one of these two
forms of production is used by more than 20 percent of municipalities. Over 80 percent of
surveyed municipalities rely on another government for production of at least one service, with
programs for the elderly, delinquent tax collection, title record/plot map maintenance, animal
shelter operation and tax billing processing most frequently provided through inter-governmental
cooperation. Services provided by contract, either by a private contractor or another
government, include nearly all the services likely to involve client contact.
These results also raise the question of whether cooperative agreements should be viewed
as an alternative to privatization. While the descriptive results do not allow a formal test of this
relationship, they indicate that many services frequently provided through cooperative
agreements are also among the least frequently contracted to for-profit contractors. Ranking

10
services according to the proportion of municipalities employing a particular method of
provision and deriving a rank correlation produces a Spearman correlation coefficient of –0.26,
significant at the 5 percent level. Services that are among the most frequently provided by
private, for-profit contractors tend to be closer to the bottom of the list of services ranked
according to the frequency that they are contracted to another government.
Responsibilities like management and training of first-responders (e.g. fire, police,
emergency medical services) are frequently shared with other governments, but almost never
delegated to private for-profit entities. It may be the case that in emergency situations first-
responders are the ―face of local government‖ and local officials want to retain tighter control
over these services. In the last section of table 2 we identify services where privatization and
contracting with other governments are both used significantly. For these 11 services, including
tax assessing, insect/rodent control, and traffic signal maintenance, it is likely that many
municipalities face a menu of provision options.
Results in table 3 give further insight into conditions under which a municipality is likely
to enlist a private contractor or another governmental entity for production of a particular
service. The analysis identifies the proportion of municipalities (by size) using a particular
method of service production for a subset of approximately 30 services frequently produced
either by private contractors or another government or municipality.7 Results indicate smaller
municipalities are much more likely to use contracts with other governments, relative to their
larger counterparts. For 26 of 33 services, the smallest municipalities use contracts with other
governments more frequently than the largest. Privatization does not have a clear population
trend: relationship between municipality size and proportion of governments relying on for-profit

11
contractors appears to vary by the type of service. For 14 of the 33 services identified in table 3,
larger municipalities use private contractors more frequently than their smaller counterparts.
[Table 3 here]
Satisfaction with Contracted Services. The survey asked respondents to indicate satisfaction
with services, using a five point Likert scale, where responses range from ―very satisfied‖ to ―not
satisfied.‖ In table 4 we report mean satisfaction levels, by form of service provision for each of
the services shown in table 3. Nearly all response means are close to 3, indicating that
respondents consider themselves ―satisfied‖ with the services provided, regardless of the form of
production. Production by the municipality’s own employees generally associates with the
highest level of satisfaction. This may indicate that the various forms of contracting involve a
tradeoff in terms of service quality and suggests that a desire for improved service quality is not
a key motivation for privatization or intergovernmental cooperation.
[Table 4 here]
It is worth noting that the results may also simply reflect the bias of respondents, who
may directly supervise production of services. Although respondents may favor their own
employees, they are less likely to have systematic biases in relative satisfaction with other forms
of service production. In particular, comparing satisfaction between services produced by other
governments and those produced by private contractors offers some indication of whether the
profit-motive of private contractors creates some systematic tradeoff in terms of quality. Based
on raw data, satisfaction levels associated with services produced by other governments are
roughly comparable to satisfaction levels with services produced by private contractors.
Multivariate Analysis Results

12
Multivariate analyses identify municipal characteristics that correlate to: (1) a municipality’s
current choices of service provision; (2) its plans to increase privatization; and (3) the
relationship between choice of production method and reported satisfaction by local government
officials. Regardless of the dependent variable, all estimations use as explanatory variables five
sets of factors that we hypothesize will correlate to decisions over contracting: measures of scale,
indicators of rural communities, measures of stress, a focus on efficiency, and a measure of local
ideology. In addition, estimations include a vector of dummy variables capturing state-specific
effects and, when appropriate, a full set of 58 service-specific indicator variables. Our dependent
variables (decision to contract out, the likelihood to contract out in the future, and level of
satisfaction) are discrete. Here traditional regression analysis is inappropriate and we use both
logit and ordered probit estimators as necessary. Where our dependent variables vary by both
service and municipality, we have about 36,000 observations and cluster standard errors.
Explanatory Variables. Measures of scale, which proxy for the constraints faced by the smallest
municipalities, include population, population squared, and median income. The smallest or
most impoverished municipalities, which cannot efficiently produce a full range of services,
might have the most to gain from employing external contracts. These municipalities also face
some of the largest obstacles towards using contracts effectively. Decisions might be made by
elected officials rather than professional managers, who have specific training and may be better
attuned to quality. We use Census Bureau’s estimated population for the survey year (1995,
1997, and 2004). The 2000 census provides the source for the median income and population
density measures. Even after controlling for scale, rural communities might be different from
their urban counterparts. Geographic dispersion may make it harder for these communities to
attract a sufficient number of bids from private contractors, or even to forge close contracts with

13
neighboring communities. We include two variables, population density, and a dummy variable
that identifies municipalities that are close to an urban area.
Decisions to contract may be a response to fiscal stress or difficulty in providing services
to growing populations. Two variables capture stress: an indicator variable that takes a value of
one if the municipality reports ―inadequate‖ revenues, and a measure of population growth (in
percentage terms) derived from comparing the 1990 and 2000 Census population measures. An
additional set of variables intends to capture the degree that municipal officials focus on
efficiency. If municipalities routinely compare costs and use competitive bidding processes, this
may indicate that these municipalities have implemented systems to control costs. Regressions
also include the percentage of Republican voters in the previous gubernatorial election as an
indication of local ideology. Only NH provides these data at a municipal level and we use
county-level returns for WI and IL.8 Voting patterns, which correlate to privatization decisions
in López-de-Silanes, Shleifer and Vishny’s (1997) county-level analysis, may reflect ideological
predisposition towards private markets and against government provision.
The final independent variables are fixed-effects indicator variables for services and
geographic regions. Service indicator variables, one for each of the 59 services, control for
otherwise unobserved characteristics of the individual services (like the degree of client contact).
We also experiment with replacing these 59 variables with a single indicator for services where
citizens interact directly with providers. The geographic indicators identify the three states. We
separately identify small municipalities within Cook County (which contains the City of
Chicago) from the remainder of IL. It is important to note that the New Hampshire survey was
completed much later than the others and there has been a significant increase in the degree of
reliance on contracting in the past decade. The geography variables control for both state and

14
year, but the data do not allow us to distinguish the effect of geography from the effect of time.
These geographic indicators also control for structural difference across states like laws,
financing arrangements, and the presence of functioning county government, among others.
Relationship between Municipality Characteristics and Service Production: Pooled Model.
Our first set of estimations considers the relationship between characteristics of a municipality
and the choice of a particular form of service production (table 5). Coefficient signs are
consistent across specifications. The correlation between municipal attributes and the tendency
to contract out services does not particularly depend upon how the form of contracting is defined.
The types of municipalities that enter into contracts with private contractors also enter into
agreements with other governments. Population correlates negatively with contracting decisions.
The smallest municipalities do appear to have the most to benefit from scale, scope and
flexibility offered by external contracts, a finding consistent with Kodrzycki (1994, 32) that
patterns in privatization are largely ―bottom up.‖ Our results indicate that this conclusion
extends to even the smallest municipalities, though the relationship appears to be nonlinear.
Median income correlates positively to all forms of contracting.
[Table 5 here]
Although the coefficient of population density is always statistically insignificant, the
indicator for municipalities within a Metropolitan Statistical Area supports the conclusion that
rural municipalities provide fewer services using outside contracts. Furthermore, the combined
effect of population and MSA in these estimations indicate that outside contracts may be
particularly attractive option for smaller cities in (or on the fringes of) metropolitan areas. Such
municipalities are small enough to benefit from the scale economies that outside contracts offer.

15
At the same time, they have access to a large number of potential collaborators, both other
governments and a significant pool of private contractors.
Fiscal stress, population growth, or current fiscal management practices are not strongly
correlated to contracting decisions. Coefficients on fiscal stress, population growth, and use of
competitive bidding processes all have insignificant (5 percent level) associations with use of
contracts. Municipalities that compare costs between public and private production, however,
are less likely to use private contractors. While contrary to our hypothesis, this finding is
consistent with earlier observation that respondents appear to use privatization as a matter of
practicality, rather than as a general cost-saving strategy. Our measure of ideology reinforces the
conclusion that contracting decisions, particularly those with for-profit contractors are driven by
more than a focus on efficiency. Ideology matters; it is positively associated with the use of for-
profit contractors as well as contracting, broadly defined. Kodrzycki (1994) finds lower rates of
privatization in New England, which are not replicated in our results. The omitted state, NH,
shows a propensity to use private, for profit contractors more commonly than WI or most of IL.9
Municipalities might be more reluctant to cede provision responsibility for services
involving direct contact with citizens; we re-estimate the three models using a single indicator
variable for ―high-contact‖ services identified in italics in table 2. Signs and significance levels
for coefficients on other explanatory variables (population, income, stress, etc.) are unchanged in
this specification (not shown). The coefficient on the variable measuring high contact, shown
separately at the bottom of the table, is positive and strongly significant. Municipalities in this
sample are more likely to contract out services involving direct contact with clients.
While we cannot formally test if some underlying set of characteristics determine both
privatization and contracts with other governments, the data appear consistent with this

16
hypothesis. Types of services contracted with other governments typically differ from the types
of services privatized, arguing that they are not direct substitutes. At the same time, municipal
features that correlate to privatization decisions correlate similarly with the decision to engage in
contracts with other governments.
Relationship between Municipal Characteristics and Plans for Future Privatization:
Cross-Sectional Model. An important limitation of cross-sectional results like those reported in
table 5 is the potential for endogeneity. All variation in the model comes from differences
between municipalities; we do not observe the decision within a municipality to change
provision of any particular service. Results from such cross-sectional estimation can be biased if
explanatory variables are causally linked to past production decisions. Current fiscal stress and
administrative practices like comparing costs or using competitive bids may associate with prior
procurement and production decisions. This limitation cannot be fully mitigated without long-
duration panel data. For this reason, results from the pooled cross-sectional model should be
viewed as indications of correlation, rather than evidence of causality.
Data used here offer a dependent variable less likely to raise issues of endogeneity, thus
allowing stronger causal inferences. Survey respondents are not only asked about current
practices, but also about future plans. The second set of empirical models estimate focus on if
the municipality plans to increase privatization in the future. Here, we measure fiscal stress both
in terms of current and expected future stress controlling for prior privatization experiences. We
first use expected stress, based on the hypothesis that future plans are based on expected future
conditions. In a separate estimation we include current stress, to allow for the possibility that
plans for future privatization are a reaction to current conditions. To control for a municipality’s
existing experiences, we add an index variable based on number of services privatized. While

17
using plans to increase privatization as a dependent variable has the benefit of reducing the
likelihood of bias, the model also has limitations. We now focus exclusively on privatization,
instead of the full menu of production options. In addition, the dependent variable elicits
information about general privatization plans rather than information about specific services.
The results for this analysis are provided in the first two columns of table 6.
[Table 6 here]
The population coefficient estimate is positive and significant, while the squared
population term has a negative and significant coefficient. This concave relationship may reflect
more sophisticated planning processes of larger municipalities. High-growth areas are more
likely to plan increases in privatization. Indicators for rural counties, self-reported fiscal stress,
sensitivity to costs, and ideology all have statistically insignificant relationships with plans to
increase privatization. It may be that either the question about increasing privatization or the
explanatory variables are too general to identify specific patterns in privatization decisions. The
weak relationship between plans to contract and measures of fiscal stress is particularly
surprising. Perhaps local governments see themselves as needed to provide jobs and therefore
choose not to enter into new contracts at times when a private sector contraction is taking place.
It is also possible that the results are consistent with a long-run equilibrium. Municipalities have
already chosen their optimal bundle of production choices based on observable characteristics of
municipalities, and plans for future changes represent largely idiosyncratic variations to specific
and otherwise unobservable changes at the local government level.
Relationship between Forms of Service Provision and Satisfaction. While the results presented
in table 5 and the left columns of table 6 identify factors associated with different forms of
service production, they provide no indication of perceived quality. To gain insight into this

18
question, we estimate an ordered probit model to identify the relationship between municipal
characteristics and satisfaction, controlling for the service and form of service provision. Table
6, column 3, reports results using the full set of indicator variables. The last column uses a
single indicator to capture the effect of services with a great deal of client contact.
The majority of control variables have statistically insignificant relationships with
satisfaction. The measure of fiscal stress and the indicator for services involving client contact
both have negative and significant coefficients. The variables of most interest are the last four,
which measure satisfaction with form of service production relative to ―private, for profit,‖ the
omitted group. As suggested by analysis presented in table 4, satisfaction with ―your employees
entirely‖ is higher than satisfaction with any other form of service production. Furthermore, the
difference between ―private for profit‖ and ―other government or authority‖ is statistically
significant at the 1 percent level. This result suggests that, in a comparison that avoids the bias
respondents have for their own employees, private contractors offer comparable or better quality
service relative to their public counterparts.
Conclusions
Despite extensive literature examining options in the delivery of public services, few
studies focus on smaller and rural municipalities. This research addresses this shortcoming.
Using survey data from three states, we document that even the smallest municipalities use a
range of provision methods, including contracting with for-profit private firms, non-profit
organizations, and other governments. Even in a sample of communities with population less
than 10,000, contracting in all its forms is a ―bottom-up‖ phenomenon negatively associated with
population. Nonetheless, small municipalities face significant constraints, especially insufficient
bids. This is notable because a necessary condition for outsourcing to be effective is sufficient

19
number of entities competing for the contract. When such a critical mass of competing entities is
not present, outsourcing may be an unrealistic or a less preferred option. When facing very few
bids, the ultimate check on monopoly pricing is the ability of a local government to deliver the
service itself. It is perhaps not surprising then, that smaller municipalities are less likely to report
cost savings associated with private contracts.
Since survey data do not directly suggest how small, rural local governments overcome
the challenges of administering public-private contracts, we cannot directly test the hypothesis
that transactions costs are too high for small and rural municipal officials and administrators to
effectively write, monitor and enforce service contracts. We can observe that while
municipalities frequently work together to produce services, they do not seem to cooperate in
development and management of outside contracts. When NH survey respondents were asked if
bordering municipalities had privatized services, a majority answered ―don’t know.‖ Only three
of 138 surveyed NH municipalities indicated that decisions of their neighbors had an effect on
their own decision to privatize services. Of those, one cited learning from another municipality’s
experience and two referred to combining their needs to collectively bid out a contract.
Small municipalities might benefit by expanding from collaboration in production of
services to collaboration in managing external contracts, if only by sharing information with
other municipalities. More sophisticated collaboration would involve multi-community contracts
for service production; these might justify the expense of setting up competitive bidding
processes to generate sufficient numbers of bids, and allow communities to consolidate oversight
expenses and other costs. In IL and WI smaller municipalities may join together and approach
the county for help in writing requests for bids, soliciting, monitoring and enforcing contracts.

20
The potential for greater use of ad hoc collaborative arrangements may be a salient issue
for the smallest municipalities. It seems unlikely that benefits of collaborative agreements have
been fully exploited regionally. The fact that local government officials are not influenced by, or
even aware of the actions of neighboring municipalities, is an indicator of this. Lackey,
Freshwater and Rupasingha (2002, 149) find that ―isolation can be a major impediment to local
government cooperation.‖ Structural or legal barriers, and traditional protection of powers can
contribute to this isolation. Meanwhile, many municipalities report significant fiscal stress.
Therefore, collaboration is generating increased attention as a cost-saving, efficiency enhancing
option, especially if there are too few private suppliers to provide true competition. Here small
neighboring municipalities could agree to support each other as is commonly done with
protective services where municipal employees work together to produce services to jointly
contracting with private for profit firms or non-profit agencies. The use of policy and planning
networks can facilitate this (Leroux and Clark 2007; Thurmaier and Wood 2002).
In spite of the constraints and limits of collaboration, small communities seem to manage
well. The smallest communities are least likely to report severe fiscal stress or to expect to
reduce future services. Although contracting decisions may not always be part of an overall
cost-savings strategy, these municipalities effectively use contracts to produce specific and
specialized services they cannot produce themselves. While reported satisfaction associates
slightly negatively to population, respondents in small and rural municipalities generally indicate
that they are ―satisfied‖ with services received. Estimation results suggest that satisfaction with
private contractors exceeds satisfaction reported with services produced by other governments.
References
Agranoff, Robert and Michael McGuire. 2004. Another Look at Bargaining and Negotiating in
Intergovernmental Management. Journal of Public Administration Research and Theory
14(4): 495-512.

21
Bel, Germà and Xavier Fageda. 2008. ―Reforming the Local Public Sector: Economics and
Politics in Privatization of Water and Solid Waste.‖ Journal of Economic Policy Reform
11(1): 45-65.
Bloomfield, Pamela. 2006. The Challenging Business of Long-Term Public-Private Partnerships:
Reflections on Local Experience. Public Administration Review 66(3): 400-11.
Boettke, Peter. 2008. Maximizing Behavior & Market Forces: the Microfoundations of
Spontaneous Order Theorizing in Gordon Tullock's Contributions to Smithian Political
Economy. Public Choice 135(1-2): 3-11.
Brown, Trevor L. and Matthew Potoski. 2003. Contract-Management Capacity in Municipal and
County Governments. Public Administration Review 63(2): 153-64.
Brown, Trevor L., Matthew Potoski and David Van Slyke. 2006. Managing Public Service
Contracts: Aligning Values, Institutions, and Markets. Public Administration Review
66(3): 323-31.
Casas-Pardo, Jose. and Miguel Puchades-Navarro. 2001. ―A Critical Comment on Niskanen's
Model.‖ Public Choice 107(1-2): 147-67.
Cigler, Beverly A. 1994. Pre-conditions for Multi-Community Collaboration. In Towards an
Understanding of Multicommunity Collaboration, edited by Beverly A. Cigler, A.C.
Jansen, V.D. Ryan and J.C. Stabler, 53-74. Washington D.C.: USDA/ERS.
Deller, Steven. C. 1998. Local Government Structure, Devolution, and Privatization. Review of
Agricultural Economics 20(1): 135-54.
Deller, Steven. C., David G. Hinds, and Donald L. Hinman. 2001. Local Public Services in
Wisconsin: Alternatives for Municipalities with a Focus on Privatization. Department of
Agricultural and Applied Economics Staff Paper No. 441, University of Wisconsin –
Madison. 52pp.
Fase, Martinus M. G. and Cornelius C.A. Winder. 1999. Baumol’s Law and Verdoorn’
Regularity. De Economist 147(3): 277-91.
Ferris, James M. and Elizabeth Graddy. 1986. Contracting out: For what? With whom? Public
Administration Review 46(4): 332-44.
Girard, Peter, Robert D. Mohr, Steven C. Deller, and John M. Halstead. 2009. Public-Private
Partnerships and Cooperative Agreements in Municipal Service Delivery. International
Journal of Public Administration 32(5): 370-92.
Greene, Jeffrey D. 1996. How Much Privatization? A Research Note Examining the Use of
Privatization by Cities in 1982 and 1992. Policy Studies Journal 24(4): 632-40.
Honadle, Beth W. 1981. A capacity-building framework: A search for concept and purpose.
Public Administration Review 41(5): 575-80.
———. 2001. Theoretical and Practical Issues of Local Government Capacity in an Era of
Devolution. Journal of Regional Analysis and Policy 31(1): 77-90.
Hood, Christopher. 1995. The New Public Management in the 1980s: Variations on a Theme.
Accounting, Organizations and Society, 20(2-3): 93-109.

22
Jang, HeeSoun. 2006. Contracting Out Parks and Recreation Services: Correcting for Selection
Bias Using a Heckman Selection Model. International Journal of Public Administration
29(10-11): 799-818.
Joassart-Marcelli, Pascale and Juliet Musso. 2005. Municipal service provision choices within a
metropolitan area. Urban Affairs Review 40(4):492-519.
Johnson, Robin A. and Norman Walzer. 1996. Competition for city services: Has the time
arrived? Privatization in Illinois Municipalities. Macomb, IL, Illinois Institute for Rural
Affairs.
———. 1998. Efficiency in County Government: The Role of Intergovernmental Agreements
and Privatization. Macomb: IL Institute for Rural Affairs.
Kettl, Donald F. 1997. The Global Revolution in Public Management: Driving Themes, Missing
Links. Journal of Public Policy Analysis and Management 16(3): 446-462.
Kodrzycki, Yolanda. 1994. Privatization of Local Public Services: Lessons for New England.
New England Economic Review May-June, 31-46.
Lackey, Steven .B., David Freshwater and Anil Rupasingha. 2002. Factors Influencing Local
Government Cooperation in Rural Areas: Evidence for the Tennessee Valley. Economic
Development Quarterly 16(2): 138-54.
Leroux, Kelly and Jared B. Carr. 2007. Explaining Local Government Cooperation on Public
Works: Evidence from Michigan. Public Works Management & Policy 12(1): 344-58.
Lopez-de-Silanes, Florencio A., Andrei Shleifer, and Robert W. Vishny. 1997. Privatization in
the United States. RAND Journal of Economics 28(3): 447-71.
Lyons, William E. and David Lowery. 1989. Governmental Fragmentation Versus
Consolidation: Five public-choice myths about how to Create Informed, Involved, and
Happy citizens. Public Administration Review 49(6): 533-43.
Niskanen, William A. 1971. Bureaucracy and Representative Government. Chicago, IL: Aldine.
Rornzek, Barbara S. and Jocelyn M. Johnston. 2005. State Social Services Contracting:
Exploring the Determinants of Effective Contract Accountability. Public Administration
Review 65(4): 436-49.
Terry, Larry D. 2005. ―The thinning of administrative institutions in the hollow state.‖
Administration and Society. 37(4): 426-44.
Thurmaier, Kurt and Curtis Wood. 2002. Interlocal Agreements as Overlapping Social
Networks: Picket-Fence Regionalism in Metropolitan Kansas City. Public
Administration Review 62(5): 585-96.
Warner, Mildred and Amir Hefetz. 2002. Applying Market Solutions to Public Services: An
Assessment of Efficiency, Equity and Voice. Urban Affairs Review 38(1): 70-89.
Williamson, Oliver E. 1979. Transaction Cost Economics: The Governance of Contractual
Relationships. Journal of Law and Economics 22(Oct): 233-61.
———. 1999. Public and Private Bureaucracies: a Transaction Cost Economics Perspective. The
Journal of Law, Economics, and Organization 15(1): 306-42.
23
Table 1 – Survey Responses by Municipality Size
“Small”
(pop. <
1000)
“Medium”
(1000-
5000)
“Large”
(pop.
>5000) IL WI NH
Total (un-
weighted)
Rate the current fiscal condition of your municipality
Adequate revenue and able to reduce taxes 13% 17% 19% 12% 21% 15% 16%
Adequate revenue, but not able to expand services 63% 57% 56% 61% 59% 52% 59%
Inadequate revenue, but not reducing services 21% 22% 19% 22% 19% 22% 21%
Inadequate revenue, reducing services 3% 4% 5% 4% 2% 10% 4%
What are the financial prospects of your municipality over the
next five years
Adequate revenue and able to reduce taxes 10% 16% 14% 11% 16% 15% 14%
Adequate revenue, but not able to expand services 63% 55% 55% 59% 60% 50% 58%
Inadequate revenue, but not reducing services 20% 19% 21% 22% 19% 19% 20%
Inadequate revenue, reducing services somewhat 6% 9% 10% 8% 5% 16% 8%
In the next five years, will your town:
Increase privatization 3% 12% 37% 18% 13% 11% 15%
Remain the same 61% 52% 34% 52% 48% 55% 51%
Decrease privatization 1% 2% 0% 1% 0% 2% 1%
Don’t Know 35% 35% 29% 29% 39% 31% 33%
Has privatization or contracting resulted in cost savings?
Yes, in all instances 12% 15% 19% 17% 15% 7% 15%
Yes, in some instances 55% 62% 72% 56% 69% 63% 62%
No 34% 23% 9% 27% 17% 30% 23%
Does your municipality compare costs between services
provided by a public agency and a private entity (fraction
“yes”)
68% 72% 81% 68% 80% 69% 73%
Are municipal contracts with private firms bid competitively?
(fraction “yes”)
87% 88% 94% 89% 91% 84% 89%
Have a sufficient number of private contractors bid on most
municipal services? (fraction “yes”)
75% 77% 81% 78% 81% 63% 77%
Does your municipality provide services for other governments
by contract? (fraction “yes”)
12% 21% 49% 23% 27% 25% 25%
Number of respondents 414 392 277 505 441 137

24
Table 2 – Distribution of Service provision (all three states)
Services typically provided
exclusively by municipal
employees
Respon-
ses
Municipal
Employees
Entirely
Municipal
Employees
in part
Another
Govern
ment or
Authority
Private,
for
profit
Private,
not for
profit
Building security 498 78.5% 10.0% 3.6% 7.6% 0.2%
Building/grounds maintenance 880 72.8% 20.0% 0.3% 6.5% 0.3%
Payroll administration 940 92.0% 4.2% 0.9% 3.0% 0.0%
Personnel services 645 90.9% 6.7% 0.8% 1.7% 0.0%
Public relations/information 544 79.4% 16.2% 2.2% 1.7% 0.6%
Secretarial services 748 92.7% 5.4% 0.9% 1.1% 0.0%
Snowplowing sanding 1029 77.1% 11.0% 4.1% 7.4% 0.5%
Street repair/maintenance 1017 45.8% 40.5% 3.4% 9.9% 0.2%
Traffic control/parking
enforcement 724 83.7% 6.63% 8.7% 1.0% 0.00%
Water distribution 860 83.1% 7.44% 4.5% 4.2% 0.70%
Services frequently privatized
Vehicles, not emergency or
heavy equipment 596 58.7% 28.7% 1.7% 10.7% 0.2%
Bill collection 617 69.4% 15.9% 1.8% 12.8% 0.2%
Building security 474 62.7% 13.7% 8.4% 15.0% 0.2%
Commercial solid waste
collection 765 7.2% 4.1% 2.4% 85.8% 0.7%
Fleet management/vehicle
maint 708 52.4% 35.0% 0.6% 11.4% 0.6%
Heavy equipment 592 55.6% 27.2% 1.7% 15.2% 0.3%
Inspection/code enforcement 717 70.3% 13.5% 4.0% 11.7% 0.4%
Labor relations 546 59.2% 23.3% 2.6% 14.8% 0.2%
Legal services 848 12.1% 7.0% 4.2% 75.6% 1.1%
Recycling 862 12.3% 9.0% 8.6% 66.7% 3.4%
Residential solid waste
collection 919 15.3% 2.2% 2.7% 79.2% 0.5%
Street light operation 842 19.2% 10.3% 8.0% 60.2% 2.3%
Street parking lot cleaning 736 73.1% 12.2% 2.3% 11.7% 0.7%
Street sweeping 828 71.4% 5.0% 5.1% 18.0% 0.6%
Tree trimming/planting 832 34.0% 40.3% 1.6% 22.8% 1.3%
Utility billing 886 76.7% 6.2% 2.8% 14.0% 0.2%
Utility meter reading 847 73.7% 5.8% 3.7% 16.5% 0.4%
Vehicle towing and storage 613 10.8% 5.7% 7.2% 75.7% 0.7%
Yard waste collection 697 38.0% 19.7% 2.0% 39.2% 1.1%
Note: italics denote services likely to involve direct contact between service providers and citizens

25
Table 2 – Distribution of Service provision (cont).
Resp-
onses
Municipal
Employees
Entirely
Municipal
Employees
in part
Another
Govern
ment or
Authority
Private,
for
profit
Private,
not for
profit
Services frequently provided
through cooperative
agreements
Animal control 786 43.8% 17.9% 28.5% 6.4% 3.3%
Crime prevention/patrol 909 73.5% 12.2% 13.6% 0.4% 0.2%
Data processing 627 72.2% 14.0% 10.5% 3.2% 0.0%
Delinquent tax collection 749 31.6% 9.5% 57.4% 0.8% 0.7%
Fire communication 772 36.3% 10.6% 47.2% 0.9% 5.1%
Fire prevention/suppression 767 51.4% 9.8% 32.9% 0.5% 5.5%
Fire training 749 26.2% 25.6% 39.8% 2.3% 6.0%
Operation and maintenance
of recreation facilities 810 70.7% 12.3% 13.2% 1.5% 2.2%
Operation of libraries 655 52.2% 6.3% 37.9% 0.5% 3.2%
Parks landscaping/maint. 856 69.3% 13.2% 11.0% 5.5% 1.1%
Police communication 813 41.3% 15.9% 39.9% 1.5% 1.5%
Police training 766 28.6% 27.8% 37.9% 3.5% 2.2%
Programs for the elderly 436 7.8% 13.1% 62.8% 3.4% 12.8%
Recreation services 741 61.3% 17.7% 15.9% 1.1% 4.0%
Sanitation inspection 529 34.6% 14.7% 46.9% 3.0% 0.8%
Sewage collection 806 78.7% 6.5% 10.5% 4.0% 0.4%
Sewage treatment 781 71.6% 5.5% 17.5% 4.9% 0.5%
Tax billing processing 787 37.9% 11.3% 48.4% 1.9% 0.5%
Water treatment 808 75.6% 5.8% 12.3% 5.4% 0.9%
Services with a broad mix of
provision options
Ambulance service 844 29.5% 3.8% 35.6% 19.2% 11.97%
Animal shelter operation 556 9.7% 5.2% 50.5% 18.2% 16.4%
Cemetery admin/maint 510 49.2% 9.0% 13.5% 12.2% 16.1%
Emergency medical service 821 33.4% 8.2% 37.5% 10.2% 10.7%
Emergency vehicles 625 44.2% 25.4% 15.2% 12.6% 2.6%
Insect/rodent control 457 25.8% 13.8% 27.6% 31.9% 0.9%
Sludge disposal 596 43.5% 9.40% 20.1% 25.2% 1.85%
Solid waste disposal 838 10.1% 5.1% 10.5% 72.8% 1.4%
Tax assessing 805 22.6% 7.5% 34.4% 35.2% 0.4%
Title record/plot map maint 646 15.9% 13.6% 55.4% 14.2% 0.8%
Traffic signal install/maint 576 32.1% 20.1% 25.3% 22.0% 0.3%
Note: italics denote services likely to involve direct contact between service providers and citizens.

26
Table 3 – Rates of privatization or Cooperative Arrangement, by town size for select services
(conditional on providing service) Another Government or
Authority
Private, for profit
―Small‖
(pop. <
1000)
―Medium‖
(pop.
1000-
5000)
―Large‖
(pop.
>5000)
―Small‖
(pop. <
1000)
―Medium‖
(pop.
1000-
5000)
―Large‖
(pop.
>5000)
Ambulance service 51.9% 36.1% 15.6% 21.4% 16.8% 19.8%
Animal control 40.2% 24.1% 22.1% 7.8% 3.5% 8.7%
Animal shelter operation 67.6% 51.8% 37.1% 15.1% 15.5% 23.4%
Cemetery admin/maint 17.3% 13.3% 9.6% 12.0% 11.1% 14.1%
Commercial solid waste collection 4.1% 2.2% 0.5% 81.0% 86.7% 90.4%
Delinquent tax collection 65.3% 51.5% 56.2% 0.0% 0.7% 2.0%
Emergency medical service 55.9% 38.0% 17.9% 10.3% 8.1% 12.7%
Emergency vehicles 30.0% 15.9% 4.4% 10.2% 16.8% 10.0%
Fire communication 60.6% 55.0% 26.3% 1.8% 1.0% 0.0%
Fire prevention/suppression 49.8% 36.9% 13.3% 1.3% 0.3% 0.0%
Fire training 48.8% 43.2% 26.5% 2.5% 2.2% 2.1%
Legal services 6.1% 4.0% 2.4% 81.9% 79.1% 63.7%
Operation of libraries 47.6% 31.9% 39.1% 0.7% 0.3% 0.5%
Police communication 56.6% 43.3% 22.0% 3.2% 1.2% 0.4%
Police training 59.1% 33.8% 26.9% 3.6% 2.2% 5.1%
Recycling 13.6% 7.6% 4.6% 59.3% 66.8% 74.3%
Residential solid waste collection 4.7% 2.5% 0.4% 77.4% 81.8% 78.2%
Sanitation inspection 60.5% 44.2% 40.8% 4.7% 3.5% 1.5%
Sewage Treatment 9.5% 14.7% 30.1% 2.0% 5.0% 7.9%
Sludge disposal 11.6% 15.8% 31.8% 29.0% 24.2% 23.4%
Solid waste disposal 12.1% 8.2% 11.7% 69.9% 74.0% 74.5%
Street light operation 8.3% 9.8% 5.3% 78.8% 54.1% 44.7%
Street repair/maintenance 6.9% 1.9% 0.7% 18.3% 5.4% 4.5%
Street sweeping 11.7% 3.3% 1.5% 25.2% 16.0% 14.3%
Tax assessing 30.4% 28.8% 47.7% 41.7% 42.5% 16.2%
Tax billing processing 45.8% 45.1% 56.2% 2.8% 1.6% 1.4%
Title record/plot map maintenance 63.9% 53.9% 49.2% 15.2% 17.4% 9.1%
Traffic signal installation/maintenance 16.9% 27.8% 27.3% 12.7% 13.9% 33.3%
Tree trimming/planting 2.3% 1.6% 0.8% 30.8% 18.3% 20.2%
Utility billing 2.2% 2.5% 4.0% 19.7% 11.7% 9.5%
Utility meter reading 2.7% 3.6% 4.9% 21.9% 14.1% 13.0%
Vehicle towing and storage 18.2% 5.2% 2.5% 65.7% 73.3% 84.0%
Yard waste collection 3.2% 1.9% 1.2% 33.9% 32.4% 50.4%

27
Table 4 – Satisfaction levels with select services
Municipal
Employees
Entirely
Municipal
Employees
in part
Another
Government
or Authority
Private,
for profit
Private,
not for
profit
Ambulance service 4.5 3.8 4.2 4.0 4.4
Animal control 3.9 3.6 3.4 3.7
Animal shelter operation 3.7 3.6 3.8 3.9
Cemetery admin/maint 3.2 2.8 2.9 2.9 3.1
Commercial solid waste collection 4.4 3.8 4.0
Delinquent tax collection 4.3 3.9 3.9
Emergency medical service 4.5 4.1 4.1 4.0 4.3
Emergency vehicles 3.4 2.9 3.1 2.9
Fire communication 4.3 4.1 4.1 4.3
Fire prevention/suppression 4.4 4.1 4.1 4.4
Fire training 4.4 4.2 4.1 4.2
Legal services 4.2 4.0 4.4 4.1
Operation of libraries 4.3 4.2 4.2
Police communication 4.3 4.0 3.9
Police training 4.2 4.2 4.1
Recycling 4.2 4.0 4.1 4.1
Residential solid waste collection 4.4 4.1
Sanitation inspection 4.2 3.7 3.6
Sludge disposal 4.3 4.2 3.9 4.0
Solid waste disposal 4.3 3.9 3.8 4.1
Street light operation 4.4 4.0 4.1 4.1
Street repair/maintenance 4.1 3.9 4.2 4.1
Street sweeping 4.2 3.6 3.8 3.8
Tax assessing 4.5 4.0 3.5 4.1
Tax billing processing 4.5 4.3 3.9
Title record/plot map maintenance 4.2 3.7 3.9 3.9
Traffic signal
installation/maintenance
4.3 4.0 3.9 3.9
Tree trimming/planting 4.1 3.9 4.0
Utility billing 4.4 4.0 4.1
Utility meter reading 4.3 3.9 3.8 4.1
Vehicle towing and storage 4.2 3.6 3.8 3.9
Yard waste collection 4.3 3.8 3.9
Notes: Satisfaction measured according to a 5 point Likert scale. Mean satisfaction levels suppressed if
fewer than 30 respondents reported using the provision method.

28
Table 5: Forms of Service Provision. Logit Model
Private, for
profit
Another
government or
Authority
Other than
“Your
Employees
Entirely”
Population (thousands) -0.034*** -0.081*** -0.049***
(3.34) (7.12) (5.08)
Population squared 0.0003 0.001*** 0.001***
(1.23) (5.12) (3.15)
Median Household inc 0.005** 0.007*** 0.009***
(2.19) (3.59) (4.51)
Population density 0.019 -0.005 -0.025
(0.54) (0.15) (1.00)
MSA dummy 0.176** 0.099 0.134*
(2.24) (1.15) (1.91)
Current stress -0.031 -0.103 0.008
(0.45) (1.37) (0.13)
Population growth 0.001 0.002* 0.001
(0.97) (1.95) (1.08)
Compares costs -0.149** 0.042 0.004
(2.25) (0.56) (0.07)
Competitive bids 0.007 -0.120 -0.085
(0.07) (0.95) (0.97)
% Repub 0.019*** -0.001 0.010**
(4.02) (0.27) (2.28)
IL – Cook County -0.208 1.632*** 0.601***
(1.00) (6.68) (3.21)
IL – Other -0.538*** 1.715*** 0.469***
(3.15) (8.76) (3.29)
WI -0.653*** 0.840*** -0.141
(4.32) (4.82) (1.11)
High-contact service 0.381*** 0.583*** 0.481***
(14.94) (19.80) (19.44)
Logit Coefficients. N=36,605. Each estimation at top of table includes 59 control
variables for individual services. Coefficients for ―high-contact service‖ come from
separate estimations that use a single indicator for services involving citizen contact.
Absolute value of z statistics in parentheses (clustered standard errors). * significant at
10%; ** significant at 5%; *** significant at 1%

29
Table 6: Plans to Increase Privatization (Logit); Satisfaction with Provision (Ordered Probit)
Plans
Increase
Plans
Increase
Reported
Satisfaction
Reported
Satisfaction
Population (thousands) 0.227*** 0.227*** -0.014 -0.014
(6.76) (6.82) (1.41) (1.46)
Population squared -0.004*** -0.004*** 0.0005* 0.0004*
(5.11) (5.15) (1.78) (1.82)
Median household income -0.004 -0.003 -0.001 -0.001
(0.61) (0.48) (0.48) (0.56)
Population density 0.045 0.040 -0.007 -0.008
(0.46) (0.41) (0.19) (0.23)
MSA dummy 0.138 0.129 0.037 0.033
(0.53) (0.49) (0.56) (0.50)
Future fiscal stress 0.054
(0.23)
Current fiscal stress 0.106 -0.287*** -0.287***
(0.44) (4.65) (4.68)
Population growth 0.006** 0.006* 0.001 0.001
(1.96) (1.86) (1.12) (1.07)
Compares costs 0.477* 0.399 0.012 0.010
(1.78) (1.51) (0.18) (0.15)
Competitive bids -0.540 -0.565* 0.124 0.120
(1.64) (1.73) (1.41) (1.38)
% Republican 0.003 0.005 0.003 0.003
(0.22) (0.31) (0.67) (0.66)
Number of services privatized 0.031 0.027
(1.19) (1.05)
IL – Cook County 0.630 0.623 -0.236 -0.238
(1.01) (1.00) (1.24) (1.27)
IL – Other 0.568 0.573 -0.232* -0.240*
(1.03) (1.05) (1.65) (1.73)
WI 0.750 0.720 -0.041 -0.043
(1.49) (1.44) (0.32) (0.34)
High-contact service -0.062***
(4.95)
―Your employees entirely‖ 0.404*** 0.361***
(11.02) (12.14)
―Your employees in part‖ -0.025 -0.082**
(0.65) (2.43)
―Another govt or authority‖ -0.112*** -0.110***
(2.66) (3.14)
―Private, not for profit‖ 0.094 0.117*
(1.34) (1.74)
Observations 862 878 31,310 31,310
Column 3 includes full set of 59 control variables for individual services; column 4 includes
indicator for services involving citizen contact. Absolute value of z statistics in parentheses
(clustered standard errors for ordered probits). * significant at 10%; ** significant at 5%; ***
significant at 1%.

30
Notes
1. Here we refer to a cooperative agreement as any arrangement for another government or authority to
provide a service. Such an arrangement may, but does not have to, be in the form of a partnership with an
even two-sided cooperative process and joint resource contributions.
2. Versions of this hypothesis include Niskanen’s Law, Tullock’s Law, and Baumol’s Law. Niskanen’s
Law maintains that government bureaucrats maximize their own personal objectives of increasing
authority, controlling more personnel, and administering larger budgets. These objectives necessitate
larger and inefficient government (Niskanen 1971; Casas-Pardo and Puchades-Navarro 2001). Tullock’s
Law maintains that the lack of competitive market forces and the power of Adam Smith’s Invisible Hand
introduce bureaucratic waste into the public arena (Boettke 2008). Baumol’s Law argues that, since the
public sector lacks profit motivations, there is little incentive for government to innovate in the name of
increasing efficiencies (Fase and Winder 1999).
3. The possibilities for such collaboration are much broader, however, and only a few authors (Lackey,
Freshwater, and Rupasingha 2002; Agranoff and McGuire 2004) provide in-depth discussions of
collaboration. Furthermore, Warner and Hefetz (2002) point out that the literature generally does not
jointly consider cooperation and privatization as differing options for service production.
4. Jang (2006) discusses this and other potential sources of selection bias, and then uses a Heckman
Selection model to mitigate the problem.
5. A number of case studies focus on smaller communities. Particularly relevant are Lackey et al. (2002),
who study cooperation among counties in Tennessee, and Jossart-Marcelli and Musso (2005), who
undertake an extensive study of ―make or buy‖ decisions for a set of southern California cities.
6. Because the surveys reflect conditions from different years and the summary statistic is an unweighted
mean, this result might be driven by changing economic conditions. The same pattern (smallest towns
least likely to report inadequate revenues) holds for both WI and NH. IL does not show notable
correlation between population and measures of fiscal stress.
7. We select services provided by at least 500 municipalities and where at least 20% of municipalities
providing a service choose to do so through a contract with either a for-profit firm or another government
or municipality.
8. A township may include parts of several villages (municipalities). If a village crosses a township line,
we use a weighted average based on the number of 2006 polling stations in each township.
9. This finding, in conjunction with Kodrzycki’s result, may mean some New England communities are
catching up in terms of contracting trends (recall that the NH survey was implemented several years after
the IL and WI data had been collected). Differing conclusions might also be driven by differences
between the larger municipalities observed by Kodrzycki and the smaller municipalities observed here, or
by differences in the way ―privatization‖ is measured. We do find support for Kodrzycki’s finding when
using the broader measure of external contracts, like agreements with other governments or even any
service that is provided in a way other than the municipality’s ―employees entirely.‖