Th1 and Th17 immunocompetence in humanized NOD/SCID/IL2rγ null mice
Upload
independentCategory
view
2download
0
Aquaculture International 4, 31-41 (1996)
Serum haemolytic and agglutinating activity as indicators of fish immunocompetence: their suitability in stress and dietary studies Lluis Tort 1., Eladi Gbmez 1, Daniel Montero 2 and J. Oriol Sunyer ~ 1Dpt. Ce// Bio/ogy and Physio/ogy, Universitat Autonoma de Barcelona, 08193-Cerdanyo/a, Spain 2/nstituto Canario de Ciencias Marinas and Univ. Las Pa/mas Gran Canaria, Spain.
Gilthead sea bream, Sparus aurata, were subjected to different stressful situations and the haemolytic activity mediated by the alternative complement and the agglutinating serum activity were tested as indicators of immunocompetence. The results show that both parameters were significantly compromised after chronic or repeated acute stress as well as in groups fed with vitamin E or o)3 highly unsaturated fatty acids (HUFA) deficient diets and in infected fish. These results suggest that both haemolytic and agglutinating activity are suitable indicators for immunocompetence as they are non-specific responses induced by non-specific stressors. In addition, a comparison is performed with other immune indicators subjected to the same stressors.
KEYWORDS: Agglutinating activity, Complement, Haemolytic activity, Immunocompetence, Sea bream (Sparus aurata), Stress
INTRODUCTION
Among the cons equences of a stressful si tuation it is well known that p r imary responses , such as the release of the h o r m o n e s cort isol and catecholamines , induce changes in the immune system. In many cases these changes are immunode- pressive. Thus, Ellsaesser and Clem (1986), Fries (1986), Maule et al. (1989) and Maule and Schreck (1990) showed reduct ions in several parameters such as circulating lymphocytes , mitogen activity and an t ibody produc t ion (plaque-forming cells, an t ibody-producing cells (APC) activity or roset te formation).
I m m u n o d e p r e s s e d s tates are of part icular impor tance in aquaculture, as fish canno t e scape from the imposed environmental or social condi t ions and may even be subjec ted to the s t ressor in a pe rmanen t or intermit tent way. In such eventual deleter ious condit ions, fish show a clear rise in disease incidences and mortality. Therefore, there is a need to identify those pa ramete r s that could show whether the fish is s t ressed and whe the r the immune sys tem is competen t . Several indicators of the immune sys tem have been used. General, rough indicators such as leukocrit or white b lood cell numbers have been used in the past, a l though they have a limited value. More recently, several au thors have used a number of more specific and
* Author to whom correspondence should be addressed.
0967-6120 © 1996 Chapman & Hall
32 L. Tort et al.
representative tests (Maule et al., 1987; Chung and Secombes, 1988; Anderson, 1990; Hardie et al., 1990; Thompson et al., 1993, Sunyer et al., 1995).
The gilthead sea bream, Sparus aurata, is the major species produced in Spain as far as seawater fish culture is concerned, and one of the most important in the Mediterranean area. Commercial culture has expanded very quickly in recent years and therefore the incidence of stress and its consequences on the immune system have become of increasing importance in this intensive culture.
Hence, the aim of this work is to test two parameters, the agglutinating activity and the haemolytic activity of the serum as indicators of non-specific immune response of the sea bream in different stress conditions. Moreover, the test was also applied in fish subjected to infection and dietary deficiencies to test their suitability in these challenging situations.
MATERIALS AND METHODS
Fish
Gilthead sea bream, obtained from the AQUADELT S.A. fish farm in the Ebre Delta (East Spain) were acclimated for 1 month in 400 1 fibreglass tanks before the beginning of the experiment. During that time, fish were maintained in a closed seawater circulation system equipped with physical and biological filters. Condi- tions of aeration, ammonia and nitrite levels were monitored continuously. Water temperature was kept at 12 °C, salinity at 38%o and photoperiod constant at 12:12 h light:dark. Fish were fed daily with extruded pellets (PURINA) at 1% body weight.
Sampling and blood preparation Sampling procedure consisted of rapidly capturing the fish and extracting blood (0.8 ml) from the caudal vessels with a syringe. Sampled fish were always killed, thus not being reused. Each sampling day, controls were processed first, and stressed fish were sampled later. Therefore, sharp peaks of acute stress response because of sampling were avoided. After each sampling, the water level was adjusted to maintain the tank densities. A portion of blood was placed in cold heparinized tubes for cell counting and plasma analysis. The remaining blood was allowed to clot at 4 °C for 2 h. The serum was then separated by 10 min centrifugation and several aliquots were stored at -80 °C to retain complement activity. All samples were stored in this way and the analyses were performed all together for each experiment and variable within 3-5 days after extraction, except for cortisol values that were analysed all together.
Experimental conditions
E x p e r i m e n t 1. Acu te stress
After acclimation, fish were chased with a hand-held net for 2 min. The first group of eight fish was sampled after 5 min. The next groups, without any further disturbance, were sampled after 10 min, 2, 4, 24 and 48 h. The results were compared with a group of undisturbed fish sampled at the same time periods. The levels of haemolytic activity mediated by the alternative complement pathway (ACH50), serum agglutination, circulating lymphocytes and plasma cortisol were

Immune indicators for stress studies 33
determined. Mean (SD) fish weight at the beginning of the experiment was 220 (20) g and the density was 7 kg m -3.
Experiment 2. Crowding stress
After the acclimation time, one group of eight fish were subjected to crowding stress by increasing the density from 7 kg m -3 of the control group to 22 kg m -~. After 2 days, the first sample group was obtained and further samples were withdrawn at days 5, 9, 15 and 21. The levels of ACH50, agglutination, lymphocytes and cortisol were determined. Mean (SD) fish weight at the beginning of the experiment was 190 (25) g.
Experiment 3. Repeated acute stress
After acclimation, 30 fish were chased in the tank with a hand-held net for 8 min every day during the 16 days of the experiment. Fish were sampled at 1, 3, 7 and 16 days. The samples were obtained before the chasing period in order to avoid immediate stress reactions. Twenty-seven undisturbed fish served as controls. The levels of ACH50, agglutination, lymphocytes and cortisol were determined. Mean (sD) fish weight at the beginning of the experiment was 210 (30) g and the density was 7 kg m -3.
Experiment 4. Dietary deficiencies
Seventy-two fish were randomly distributed in three groups and were subjected to the following diets: The vitamin E-deficient group received no c¢-tocopherol but 2% o)3 HUFA. The ¢03 HUFA-deficient group received 150 mg kg -1 c¢-tocopherol but 0.5% 003 HUFA and the control group received 150 mg kg -1 c~-tocopherol and 2% 0)3 HUFA. The level of 0.5% (o3 HUFA can be considered as deficient for this species as it was previously demonstrated that deficiency is apparent below 0.9% 0beas et al., 1994). The diet composition is shown in Table 1. These diets were followed for 2 months. After that time samples were taken. Only the levels of ACH50 and growth rate could be determined in this experiment. Mean (so) fish weight at the beginning of the experiment was 160 (15) g and the density was 7 kg m -3.
Experiment 5. Pathogenic infection
Three different stock tanks became accidentally infected when they had contact with fish infected by Vibrio sp. As this happened, a protocol was established to assess the dynamics of specific variables. When the first signs appeared in some fish, samples were taken immediately and the next sampling was performed 5 days later. At the same time, the corresponding control groups were sampled from healthy fish of other tanks. The levels of ACH50, agglutination and lymphocytes were determined. Mean (SD) fish weight at the beginning of the experiment was 230 (40) g and the density was 7 kg m -3
Buffers and rabbit blood preparation
The following buffers were used: isotonic veronal-buffered saline (GVB) pH 7.3, containing 0.1% gelatine, and the same buffer but containing 20 mM EDTA (EDTA- GVB). To measure the alternative complement pathway (ACP), serum samples were

34 L. Tort et al.
TABLE 1. Composition of control and experimental diets (%). Proximal and fatty acid components. In the column for the experimental diet, only changes with respect to the control diet are specified. (1) (03HUFA-deficient diet; (2) vitamin E-deficient diet
Component Control Experimental Component Control Experimental (1)
Fish meal (FM) 64.02 16.00 (1) Crude protein 50.92 49.52 Oil-extracted FM 42.94 (1) Moisture 10.80 11.57 Fish oil 1.83 Crude lipids 12.27 12.98 Beef tallow 3.40 10.31 (1) (0HUFA 1.78 0.52 Starch 12.00 20:4(03 0.05 0.01 Dextrin 4.00 20:5(03 0.22 0.22 Cellulose 10.04 22:5(03 0.03 0.03 Carboxymethylcellulose 0.50 22:6(03 0.75 0.26 Vitamin mix a 2.00 Mineral mix b 1.30 Choline chloride 0.90 o¢-tocopherol (mg kg -1) 150 0 (2)
a vitamin mix (rng per kg diet): Vit. A, 25; Vit D3, 5; Vit. K, 20; Vit. B12, 0.5; Vit. H, 1; Folic acid, 10; Vit. B6, 40; Vit. B2, 50; pantothenic acid, 117; nicotinic acid, 200; myo-inositol, 2000; ascorbic acid, 5000; plus Ethoxyquin, 100. b Mineral mix (g per kg diet): (H2PO4)Ca, 1.605; CaCO 3, 4.0; FeSO4.7H20, 1.5; MgSO4.7H20, 1.605; K2HPO 4, 2.8; Na2PO4.H20, 1; AI(SO4)3.6H20, 0.02; ZnSO4.7H20, 0.24; CuSO4.5H20, 0.12; KI, 0.02; COSO4.7H20, 0.08; MnSO4.H20, 0.08.
diluted in GVB containing 10 mM Mg 2÷ and 10 mM EGTA (Mg2÷-EGTA-GVB). Rabbit red b lood cells (RaRBC) were used for the immune tes ts and p repared as follows: b lood was wi thdrawn from the ear a r t e ry of a rabbi t and p laced into cold hepar in ized tubes. Red blood cells were washed four t imes in GVB and r e suspended to a concen t ra t ion of 2.5 x 10⁸ ceils m1-1 with the appropr ia te buffer.
Haemolytic assay
The haemolyt ic activity dr iven by the al ternat ive complemen t pa thway (ACH50) was measu red as desc r ibed by Sunyer and Tort (1995): 25 I~1 of RaRBC were added to 100 I~1 of serially di luted S. aurata se rum in Mg2÷-EGTA-GVB buffer. The tubes were incuba ted at 20-22 °C for 100 min with regular shaking. The react ion was s t o p p ed by adding 1 ml of cold EDTA-GVB. The tubes were then centr i fuged and the extent of haemolys is was de te rmined by measur ing the optical dens i ty of the supe rna tan t at 414 nm. Total 100% haemolysis is given by the optical reading of the supe rna tan t from 25 i~1 of the used RaRBC suspens ion added to 1100 I~1 of distilled water. The reciprocal of the se rum dilution causing 50% lysis of RaRBC was des ignated as ACH50. Results are p re sen ted as ACH50 units m1-1.
Haemagglutination assay
Haemagglut inat ion assays were pe r fo rmed in micro V-plates (Daslab). Serial dilution of each se rum sample were made in 25 i~1 of EDTA-GVB. Twenty-five microli tres of a suspens ion of washed RaRBC containing 2% cells in the same buffer, were added to each well. The micropla tes were allowed to s tand for 1 h at room t empera tu re and

Immune indicators for stress studies 35
macroscopic agglutination was recorded. Results are given as log 2 of the final serum dilution giving agglutination.
Cortisol determination
Plasma cortisol was determined by radioimmunoassay following the method of trypsin-antitrypsin. This method has been validated in our laboratory for sea bream among other fish species. Corticosteroid binding globulin was hydrolysed using trypsin (Boehringer Mannheim). Samples were analysed in duplicate. [1,2,6,7-3H]cortisol (Amersham International) and antiserum raised in donkeys against serum-albumin-conjugated cortisol-3-(0-carboxymethyl)oxine-bovine (BioClin) were used. Cross-reaction was 100% with cortisol and 0.36% with 17cz-hydroxyprogester- one. A strong agreement was found between different dilutions of the samples and the standard curve. Sensitivity was 12.5 pg per tube and recovery ranged from 94 to 105%. The intra-assay coefficient of variation was 4.3%. All samples were processed simultaneously in order to eliminate inter-assay variations. (Further details: Moll- nero and Gonz~lez, 1995).
Erythrocyte and lymphocyte counts
Erythrocytes were counted in a cell counter (Laboratory Instruments) after blood dilution. Lymphocyte numbers were determined under the microscope in a Neubauer haemocytometer after diluting the blood 1:20 with Tfirck liquid. Lympho- cytes were distinguished morphologically from monocytes and they were counted as reported elsewhere (Houston, 1990).
Statistics
For all parameters homogeneity of variances (Cochran and Bartlett-Box tests) were checked. A one-way analysis of variance (ANOVA) was applied to determine significant differences between controls at the different sampling times. Where there were no differences, the whole control groups were pooled and used as control values. ANOVA was also used to assess the presence of significant variation factors, followed by Duncan's multiple-range test in order to determine the specific differences between groups. When non-homogeneous variances were encountered (agglutination and plasma cortisol), the non-parametric Mann-Whitney and Kruskal- Wallis tests were used. In all cases p < 0.05 was the accepted significance level. Mean values are presented with standard errors (SEM).
RESULTS
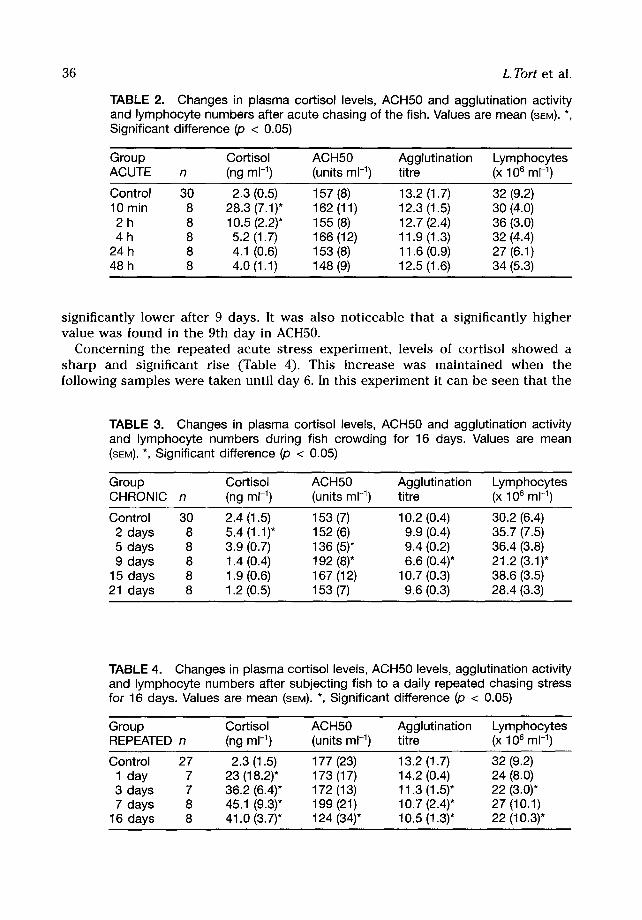
No changes were found in immune parameters after acute treatment. Cortisol levels exhibited the expected sharp rise after 10 min, and recovery to basal levels was detected between 4 and 8 h (Table 2). The crowding stress produced significant changes in all parameters recorded (Table 3). Cortisol levels increased only twofold compared with control values, being significantly elevated after 2 and 5 days, then returning to basal levels by day 9. However, both alternative complement activity and agglutination levels showed significant changes. ACH50 showed significantly reduced levels after 5 days, whereas agglutination and lymphocyte numbers were
36 L. Tort et al.
TABLE 2. Changes in plasma cortisol levels, ACH50 and agglutination activity and lymphocyte numbers after acute chasing of the fish. Values are mean (SEM). *, Significant difference (p < 0.05)
Group Cortisol ACH50 Agglutination Lymphocytes ACUTE n (ng m1-1) (units m1-1) titre (x 10 ° ml -~)
Control 30 2.3 (0.5) 157 (8) 13.2 (1.7) 32 (9.2) 10 min 8 28.3 (7.1)* 162 (11) 12.3 (1.5) 30 (4.0) 2 h 8 10.5 (2.2)* 155 (8) 12.7 (2.4) 36 (3.0) 4 h 8 5.2 (1.7) 166 (12) 11.9 (1.3) 32 (4.4)
24 h 8 4.1 (0.6) 153 (8) 11.6 (0.9) 27 (6.1) 48 h 8 4.0 (1.1) 148 (9) 12.5 (1.6) 34 (5.3)
significantly lower after 9 days. It was also not iceable that a significantly higher value was found in the 9th day in ACH50.
Concerning the repea ted acute s t ress exper iment , levels of cor t isol showed a sha rp and significant rise (Table 4). This increase was maintained when the following samples were taken until day 6. In this exper iment it can be seen that the
TABLE 3. Changes in plasma cortisol levels, ACH50 and agglutination activity and lymphocyte numbers during fish crowding for 16 days. Values are mean (SEM). *, Significant difference (p < 0.05)
Group Cortisol ACH50 Agglutination Lymphocytes C H R O N I C n (ng m1-1) (units m1-1) titre (x 106 m1-1)
Control 30 2.4 (1.5) 153 (7) 10.2 (0.4) 30.2 (6.4) 2 days 8 5.4 (1.1)* 152 (6) 9.9 (0.4) 35.7 (7.5) 5 days 8 3.9 (0.7) 136 (5)* 9.4 (0.2) 36.4 (3.8) 9 days 8 1.4 (0.4) 192 (8)* 6.6 (0.4)* 21.2 (3.1)*
15 days 8 1.9 (0.6) 167 (12) 10.7 (0.3) 38.6 (3.5) 21 days 8 1.2 (0.5) 153 (7) 9.6 (0.3) 28.4 (3.3)
TABLE 4. Changes in plasma cortisol levels, ACH50 levels, agglutination activity and lymphocyte numbers after subjecting fish to a daily repeated chasing stress for 16 days. Values are mean (SEM). *, Significant difference (p < 0.05)
Group Cortisol ACH50 Agglutination Lymphocytes REPEATED n (ng m1-1) (units m1-1) titre (x 106 ml -~)
Control 27 2.3 (1.5) 177 (23) 13.2 (1.7) 32 (9.2) 1 day 7 23 (18.2)* 173 (17) 14.2 (0.4) 24 (8.0) 3 days 7 36.2 (6.4)* 172 (13) 11.3 (1.5)* 22 (3.0)* 7 days 8 45.1 (9.3)* 199 (21) 10.7 (2.4)* 27 (10.1)
16 days 8 41.0 (3.7)* 124 (34)* 10.5 (1.3)* 22 (10.3)*

Immune indicators for stress studies
TABJ_E 5. Levels of ACH50 and agglutination after diet- deficient treatments and vibriosis infection. Values are mean (SEM). *, Significant difference (p < 0.05)
ACH50 Agglutination Group n (units m1-1) titre
Control 16 160 (12) 11.7 (0.7) Infected day 1 8 146 (15) 10.5 (0.5) Infected day 5 8 133 (14)* 9.2 (0.4)*
Control 18 169 (13) 11.3 (1.5) Vitamin E deficiency 18 90 (20)* ex3 HUFA deficiency 18 88 (13)* 10.7 (2.4)
37
alternative complement activity (ACH50) showed a significant reduction after 16 days. Additionally, the levels of agglutination and lymphocytes showed a significant decrease after 5 days and 5 and 9 days respectively (Table 4).
Table 5 shows the values corresponding to diet deficiencies and experimental infection. All three treatments (Vitamin E deficiency, 0~3 HUFA deficiency and Vibrio infection) caused significant reductions in the parameters measured. Comparing the treatments, it can be observed that dietary deficiencies caused the most marked reductions in ACH50 levels and vibriosis resulted in a less marked reduction in ACH50 but a greater reduction in agglutination capacity.
DISCUSSION
As shown in the results, fish subjected to different kinds of stressors show a decrease in the two parameters selected in this work, agglutination activity and alternative complement activity, with the exception of short, acute stress. In the acute stress experiment, fish were subjected to only 2 min of handling. This stress may not be strong enough to produce changes in responses other than short-term as cortisol. Hence, plasma cortisol shows a significant rise, but this only lasts for a short time (between 2 and 4 h). Therefore, it is possible that there was not enough time to induce such changes in agglutination or haemolytic activities.
When the stress is repeated for some days or when the stressor is continuously present such as in experiments 2 and 3, the parameters tested changed significantly. In addition with the results of experiment 4, where fish were subjected to other types of deleterious conditions, it seems apparent that agglutination and ACH50 activities need some time t o develop and to show significant differences and, similarly, that the stressor must be present to some extent during this time. The results also suggest that neither agglutination or haemolytic activity would be suitable indicators for a rapid response of the immune system in sea bream, at least in the conditions studied. However, they appear to be useful indicators of immunocompetence when chronic or repeated stressors are present, which are the most common stress situations in aquaculture. Nevertheless, more work has to be done in this field in order to be more precise about the dynamics of both parameters, especially in time intervals not studied up to now.

38 L. Tort et al.
How the immune response is induced and the relationship between the endocrine system and immune system or the nervous and immune system, are important areas of basic research that are intensively studied. Both cortisol and cate- cholamines are known to produce immune changes. It has been shown in mammals that catecholamine secretion can induce redistribution of leukocytes (Landman et al., 1984) and suppression of lymphocyte proliferation to mitogen (Khansari et al., 1990). Injection of cortisol in coho salmon, Oncorhynchus kisutch, has been shown to produce changes in leukocyte numbers (Maule et al.,1987), but no changes in lymphocyte numbers in brown trout, Sa lmo trutta (Pickering and Pottinger, 1985). Cortisol causes reduction in the percentage of phagocytosis and the B lymphocytes in channel catfish, Ictalurus punctatus (Ainsworth et a/.,1991), and reduction of IgM levels in masu salmon, O. masou (Nagae et al., 1994). In addition, it has been shown in mammals that glucocorticoids reduce the formation of basic interface molecules such as interleukins (Khansari et al., 1990; Amano et al., 1993) and similar processes have been shown in fish (Kaatari and Tripp, 1987; Maule and Schreck, 1990, 1991). Diets can also influence immune functions as dietary lipids can influence different structures or functions related to membranes. Thus, ingested lipids may modify fatty acid composition of membrane phospholipids, production of eicosanoids, alter the physical properties of cell membranes and alter the activity of membrane- associated receptors (Sheldon and Blazer, 1991). Concerning the parameters chosen in the present work, the induction mechanism for the changes in agglutination and lytic activities is not known at present, although it has been shown in mammals that glucocorticoids affect the synthesis of the C3 component of the complement system by a decrease in gene transcription (Lappin and Whaley, 1991). In other work, Li and Lowell (1985) showed complement inhibition by reduction of its component C1Q.
It is noteworthy that a very significant reduction in both indicators is observed following dietary deficiencies. It has been previously shown that non-specific humoral factors were affected by deficiencies in vitamin E in S. salar, as total complement activity was depleted. The reduction (about 30% with respect to controls) was significant, although lower than the reduction shown in the present results (about 47%). Because the values measured in the present work correspond to the alternative pathway of complement, it remains to be elucidated whether the depletion of complement is mostly dependent on the ACP. Although the relationship between ACP depletion and vitamin E deficiency is not understood, a decrease of certain serum proteins has been detected in vitamin E-deficient rainbow trout, O. mykiss (Blazer and Wolke, 1984). Similarly, reduced levels of hemolysisn and agglutination titres have been found in vitamin E-depleted trout (Blazer and Wolke, 1984).
Due to the close relationship between the status of the immune system and fish health, the search for possible and reliable indicators of the immune system has been a subject of primary interest in fish health and aquaculture. Thus, several authors have looked to a number of indicators to be tested in fish (Stolen et al., 1990). In applied work, these indicators should accomplish several conditions at the same time if they are to be useful and used. One is that they must be really indicative of immunocompetence of one of the different types of responses (i.e. humoral, cellular) developed by the immune system. In this respect, it has recently been shown that both ACH50 and agglutination show good correlation with other

Immune indicators for stress studies 39
indicators of the immune responses such as total antibody titre, lymphocyte numbers and classical or total complement activity (Sunyer et al., 1995). Second, they must be simple enough to be used in laboratories or fish health facilities with a reduced scope of techniques and equipment. Therefore, although indicators like the classical complement activity (CH50) or the antibody titre are interesting immune indicators, it would be more complicated to routinely work with them. Thus, CH50 requires sensitized rabbit red blood ceils against the serum of the fish used, and the antibody titre requires the specific monoclonal antibody, which is not easily found for many fish species. Other indicators that have been used and are easy to perform like leukocrit are not really precise enough to show immuno- competence. Finally, if we are not facing a particular disease or infection, but trying to monitor fish while they are subjected to normal handling procedures in aquaculture, the best immune indicators would probably be those that show the natural and non-specific responses, rather than others more specific or dependent on previous exposures to particular antigens. In this respect, alternative comple- ment ( together with lysozyme activity) shows high sensitivity and even predomi- nance for bactericidal activity (Hajji et al., unpublished data).
CONCLUSIONS
Therefore, both agglutination activity and complement activity seem to be suitable indicators of the humoral non-specific immune response in fish, at least as shown in sea bream.
ACKNOWLEDGEMENTS
This work was suppor ted by the grant MAR90-0453 of CICYT (Spanish Government). Thanks are given to Marc Puigcerver for his technical help, Ferran Costa and the staff of the Aquarama (Zoo de Barcelona) for aquarium facilities and to Nell Caldentey (Purina SA) for fish food supply.
References
Ainsworth, A.J. Dexiang, C. and Waterstrat, P.R. (1991) Changes in peripheral blood leukocyte percentages and function of neutrophils in stressed channel catfish. Journal of Aquatic Animal Health 3, 41--47.
Amano, Y., Lee, S.W. and Allison, A.C. (1993). Inhibition by glucocorticoids of the formation of interleukin-l~, interleukin-l~, and interleukin-6: mediation by decreased mRNA stability. Molecular Pharmacology 43, 176-182.
Anderson, D.P. (1990) Immunological indicators: effects of environmental stress on immune protection and disease outbreaks. American Fisheries Society Symposium 8, 38-50.
Blazer, V.S. and Wolke, R.E. (1984) The effects of c~-tocopherol on the immune response and non-specific resistance factors of the rainbow trout (Salmo gairdneri Richardson). Aquaculture 37, 1-9.
Chung, S. and Secombes, C.J. (1988) Analysis of events occurring within teleost macrophages during the respiratory burst. Comparative Biochemistry and Physiology 89, 539-544.
Ellsaesser, C.E and Clem, L.W. (1986) Haematological and immunological changes in channel catfish stressed by handling and transport. Journal ofFish Biology 28, 511-521.

40 L. Tort et al.
Fries, C.R. (1986) Effects of environmental stressors and immunosuppressants on immunity in Fundulus heteroclitus. American Zoologist 26, 271-282.
Hardie, L.J., Fletcher, T.C. and Secombes, C.J. (1990) The effect of vitamin E on the immune response of the Atlantic salmon (Salmo salar L.). Aquaculture 87, 1-13.
Houston, A.H. (1990) Blood and circulation. In: Methods forFish Biology (eds C.B. Schreck and P.B. Moyle) American Fisheries Society: Bethesda MD, pp. 273-334.
Ibeas, C., lzquierdo, M.S. and Lorenzo, A. (1994) Effect of different levels of c0 highly unsaturated fatty acids on growth and fatty acid composition of juvenile gilthead seabream (Sparus aurata). Aquaculture 127, 177-188.
Kaatari, S.L. and Tripp, R.A. (1987) Cellular mechanisms of glucocorticoid immunosuppres- sion in salmon. Journal ofFish Biology 31 (Suppl. A), 129-132.
Khansari, D.N., Murgo, A.J. and Faith, R.E. (1990) Effects of stress on the immune system. Immunology Today 11, 170-175.
Landman, R.M.A., Muller, F.B., Perini, C., Wesp, M., Erne, P. and Buhler, F.R. (1984) Changes of immunoregulatory cells induced by psychological and physical stress: Relationship to plasma catecholamines. Clin. Exp. Immunol. 58, 127-135.
Lappin, D.E and Whaley, K. (1991) Modulation of complement gene expression by gluco- corticoids. Biochemical Journal 280, 117-123.
Li, Y. and Lowell, R.T. (1985) Elevated levels of dietary ascorbic acid increase immune responses in channel catfish. Journal of Nutrition 115, 123-131.
Maule, A.G. and Schreck, C.B. (1990) Glucocorticoid receptors in leukocytes and gill of juvenile coho salmon (Oncorhynchus kisutch). General and Comparative Endocrinology 77, 448--455.
Maule, A.G. and Schreck, C.B. (1991) Stress and cortisol treatment changed the affinity and number of glucocorticoid receptors in leukocytes and gill of Coho salmon. General and Comparative Endocrinology, 84, 83--93.
Maule, A.G., Schreck, C.B. and Kaatari, S.L. (1987) Changes in the immune system of coho salmon (Oncorhynchus kisutch) during the parr-smolt transformation and after implanta- tion of cortisol. Canadian Journal of Fisheries and Aquatic Sciences, 44, 161-166.
Maule, A.G., Tripp, R.A., Kaatari, S.L. and Schreck, C.B. (1989) Stress alters the immune function and disease resistance in chinook salmon Oncorhynchus tsawytscha. Journal of Endocrinology, 120, 135-142.
Molinero, A. and Gonzfilez, J. (1995) Comparative effects of MS 222 and 2-phenoxyethanol on gilthead sea bream (Sparus aurata L.) during confinement. Comparative Biochemistry and Physiology 111,405-414.
Nagae, M., Fuda, H., Ura, K., Kawamura, H., Adachi, S., Hara, A. and Yamauchi, K. (1994) The effect of cortisol administration on blood plasma immunoglobulin M (IgM) concentra- tions in masu salmon (Oncorhynchus masou). Fish Physiology and Biochemistry 13, 41-48.
Pickering, A.D. and Pottinger, T.G. (1985) Cortisol can increase the susceptibility of brown trout Salmo truttu L. to disease without reducing white blood cell count. Journal of Fish Biology 27, 611-619.
Sheldon, W.H. and Blazer, V.S. (1991) Influence of dietary lipid and temperature on bactericidal activity of channel catfish macrophages. Journal of Aquatic Animal Health 3, 87-93.
Stolen, J.S., Fletcher, T.C., Anderson, D.P., Roberson, B.S. and Van Muiswinkel, W.B. (1990) Techniques in Fish Immunology. SOS Publications: Fair Haven, NJ. 197 pp.
Sunyer, J.O. and Tort, L. (1995) Haemolytic and bacteriolytic activities of sea bream serum are mediated by the Alternative Complement Pathway. Veterinary Immunology and Im- munopathology 45, 333-345.
Sunyer, J.O., G6mez, E., Navarro, V., Quesada, J. and Tort, L. (1995) Depression of humoral components of the immune system and physiological responses in gilthead sea bream

Immune indicators for stress studies 41
Sparus aurata from daily acute stress. Canadian Journal of Fisheries and Aquatic Sciences (In press).
Thompson, I., White, A., Fletcher, T.C., Houlihan, D.F. and Secombes, C.J. (1993) The effect of stress on the immune response of Atlantic salmon (Salmo salar L.) fed diets containing different amounts of Vitamin C. Aquaculture 114, 1-18.
Copyright © 2022 FDOKUMEN