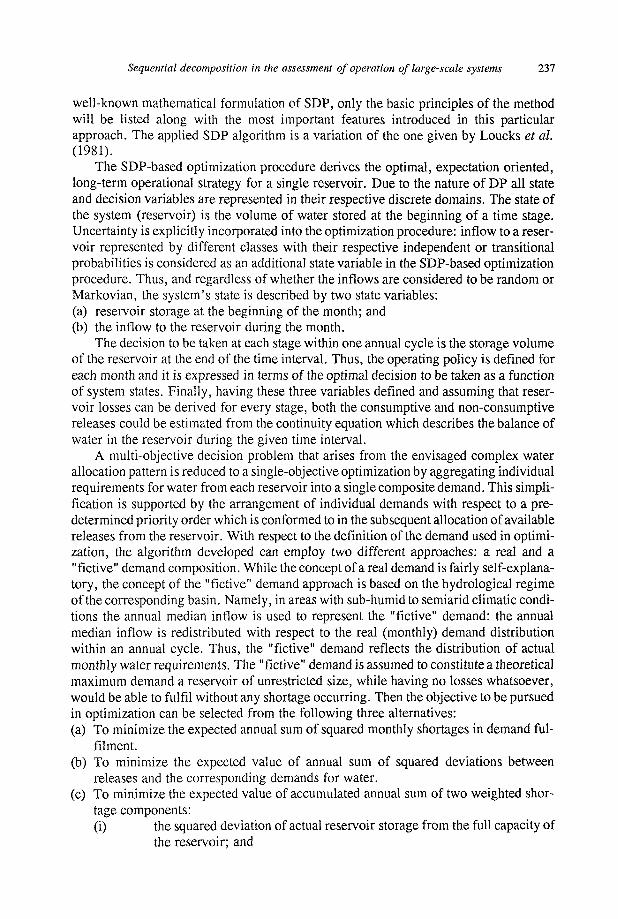
BD Aria Fusion Standard Operation Protocol – Basic Operation
Upload
independentCategory
view
3download
0
Modelling and Management of Sustainable Basin-scale Water Resource Systems {Proceedings of a Boulder Symposium, July 1995). IAHS Publ. no. 231, 1995. 233
Sequential decomposition in the assessment of long-term operation of large-scale systems
JANOS J. BOGARDI & DARKO MILUTIN Department of Water Resources, Wageningen Agricultural University, Nieuwe Kanaal 11, 6709 PA Wageningen, The Netherlands
Abstract The paper presents a methodology devised to determine and to assess long-term operation of multiple-reservoir water supply systems. The algorithm is based on the decomposition of a multidimensional decision problem into a series of a single decision tasks solved by stochastic dynamic programming. The uncertainty of river flows is explicitly incorporated into the optimization procedure by considering inflows to a reservoir as an additional, stochastic state variable. Although it is recognized that the derived overall operational strategy of a complex reservoir system would result in its near-optimal performance rather than in the global optimum, it is expected that the method provides efficient means for planning studies in water resources management. The flexibility and applicability of the approach is presented on a seven-reservoir water supply system excerpted from a broad water resources planning study for which the method was originally formulated.
INTRODUCTION
Dynamic programming (DP) has been broadly used in water resources management, and especially in reservoir operation. This popularity is due to DPs inherent flexibility and ability to accommodate most important features of water resources systems, such as: their dynamic nature, nonlinear interrelationships, and stochasticity of processes involved. However, the discrete nature of DP means that the required computational burden can easily become prohibitive by increasing the number of elements of the system considered, thus increasing the number of state and decision variables needed to describe the system. Many DP-based algorithms have been developed aiming to overcome this so called "curse of dimensionality" problem. The method presented in this paper combines decomposition of a system with DP-based optimization, trying to incorporate several important aspects of long-term operational assessment of multiple-reservoir supply systems: (a) stochastic nature of river flows; (b) non-separability between individual reservoir operational objectives; (c) complex demand structure; and (d) consideration of priorities among multiple demand targets.
234 Janos J. Bogardi & Darko Milutin
METHODOLOGY
Problem formulation
A multiple-reservoir water supply system is envisaged to provide water for a number of users in a geographically large area. The system may include an arbitrary number of reservoirs situated in several neighbouring and/or distant river basins. Reservoirs interact by means of serial and parallel interconnections, allowing water to be transferred from one basin to another, both to demand centres and/or other reservoirs. Regarding possible supply-demand patterns it should be emphasized that a single reservoir could supply multiple demand targets while any of the demand centres could be associated with a number of reservoirs.
The objective of the analysis is to derive the best achievable long-term operational strategy for such a system to meet foreseeable water demands. The operational policy should consist of 12 distinctive control rules defined for each month within an annual cycle. The devised methodology should describe water demands as deterministic variables while the consideration of stochasticity of river flows should be incorporated into the optimization procedure. It is thus assumed that the uncertainty of the system's operation could be sufficiently represented by the stochasticity of river flows. The inherent uncertainty in water demands and the system configuration itself could be modelled by considering sets of feasible scenarios and the subsequent analyses of the system operation under such conditions.
Decomposition
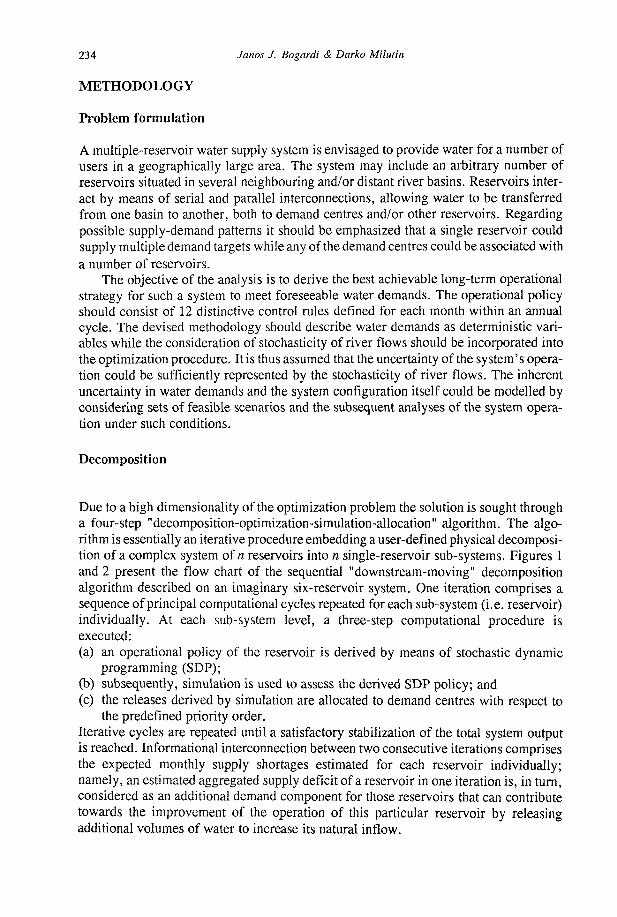
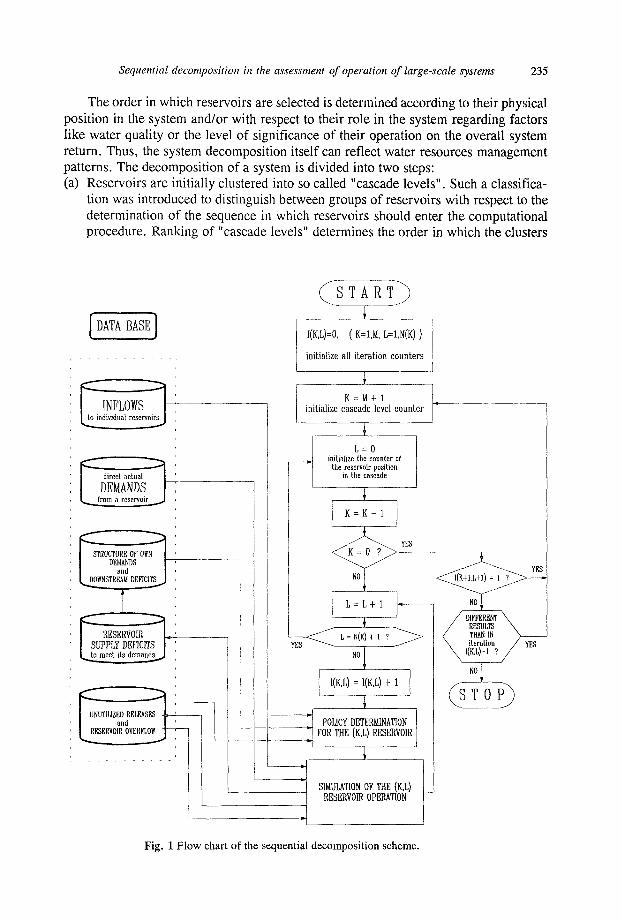
Due to a high dimensionality of the optimization problem the solution is sought through a four-step "decomposition-optimization-simulation-allocation" algorithm. The algorithm is essentially an iterative procedure embedding a user-defined physical decomposition of a complex system of n reservoirs into n single-reservoir sub-systems. Figures 1 and 2 present the flow chart of the sequential "downstream-moving" decomposition algorithm described on an imaginary six-reservoir system. One iteration comprises a sequence of principal computational cycles repeated for each sub-system (i.e. reservoir) individually. At each sub-system level, a three-step computational procedure is executed: (a) an operational policy of the reservoir is derived by means of stochastic dynamic
programming (SDP); (b) subsequently, simulation is used to assess the derived SDP policy; and (c) the releases derived by simulation are allocated to demand centres with respect to
the predefined priority order. Iterative cycles are repeated until a satisfactory stabilization of the total system output is reached. Informational interconnection between two consecutive iterations comprises the expected monthly supply shortages estimated for each reservoir individually; namely, an estimated aggregated supply deficit of a reservoir in one iteration is, in turn, considered as an additional demand component for those reservoirs that can contribute towards the improvement of the operation of this particular reservoir by releasing additional volumes of water to increase its natural inflow.
Sequential decomposition in the assessment of operation of large-scale systems 235
T h e order in which reservoirs are selected is determined according to their physical posit ion in the system and/or with respect to their role in the system regarding factors l ike water quality or the level of significance of their operation on the overall system re turn . Thus , the system decomposi t ion itself can reflect water resources management pa t terns . The decomposi t ion of a system is divided into two steps: (a) Reservoirs are initially clustered into so called "cascade levels" . Such a classifica
tion was introduced to distinguish between groups of reservoirs with respect to the determination of the sequence in which reservoirs should enter the computat ional p rocedure . Ranking of "cascade levels" determines the order in which the clusters
S T A R T
DATA BASE
INFLOWS to individual reservoirs
direct actual
DEMANDS from a reservoir
STRUCTURE OF OWN DEMANDS
and DOWNSTREAM DEFICITS
UNUTILIZED RELEASES a n d
RESERVOIR OVERFLOW
I I(K,L)=0, ( K=l,M, L=l,N(K) )
initialize all iteration counters
T K = M + 1
initialize cascade level counter
L = 0 initialize the counter of the reservoir position
in the cascade
POLICY DETERMINATION FOR THE (K,L) RESERVOIR
SIMULATION OF THE (K.L) RESERVOIR OPERATION
Fig. 1 Flow chart of the sequential decomposition scheme.
236 Janos J. Bogardi & Darko Milutin
i=i A
LU(3.1)=0 / \
M
L = 2 A
LU(3,Z)=0 / \
M K = 3
N(3) = 2
K = 2
N(2) = 3
N(l) = I
L E G E N D
Rl, R2, R3, R4, R5, k R6
M
K
N(K), [K=1,M]
L
I(K,L), [K=1,M; L=1,N(K)]
LU(K.L). [K=1,M; L=1,N(K)
- reservoirs
- number of cascade levels
- cascade level counter
- number of reservoirs in cascade level K
- reservoir counter at a cascade level
- iteration ordinal number of the (K,L) reservoir
- upstream reservoir identifier
Fig. 2 Six-reservoir system: the legend of Fig. 1.
are taken into consideration. For instance, in a "downstream-moving" decomposition all the reservoirs belonging to cluster three (see Fig. 2) would be selected prior to any of the reservoirs from cluster two, which in turn would precede the reservoir in cluster one. The number of "cascade levels" is virtually unlimited.
(b) Reservoir selection order within a certain "cascade level" could be determined by any rules imposed by the analyst. These principles may include firm water allocation schemes, water quality constraints, or some empirically devised rules that could be based on economic, social or environmental requirements.
Optimization
The core of the method is the SDP-based optimization algorithm. Without going into the
Sequential decomposition in the assessment of operation of large-scale systems 237
well-known mathematical formulation of SDP, only the basic principles of the method will be listed along with the most important features introduced in this particular approach. The applied SDP algorithm is a variation of the one given by Loucks et al. (1981).
The SDP-based optimization procedure derives the optimal, expectation oriented, long-term operational strategy for a single reservoir. Due to the nature of DP all state and decision variables are represented in their respective discrete domains. The state of the system (reservoir) is the volume of water stored at the beginning of a time stage. Uncertainty is explicitly incorporated into the optimization procedure: inflow to a reservoir represented by different classes with their respective independent or transitional probabilities is considered as an additional state variable in the SDP-based optimization procedure. Thus, and regardless of whether the inflows are considered to be random or Markovian, the system's state is described by two state variables: (a) reservoir storage at the beginning of the month; and (b) the inflow to the reservoir during the month.
The decision to be taken at each stage within one annual cycle is the storage volume of the reservoir at the end of the time interval. Thus, the operating policy is defined for each month and it is expressed in terms of the optimal decision to be taken as a function of system states. Finally, having these three variables defined and assuming that reservoir losses can be derived for every stage, both the consumptive and non-consumptive releases could be estimated from the continuity equation which describes the balance of water in the reservoir during the given time interval.
A multi-objective decision problem that arises from the envisaged complex water allocation pattern is reduced to a single-objective optimization by aggregating individual requirements for water from each reservoir into a single composite demand. This simplification is supported by the arrangement of individual demands with respect to a predetermined priority order which is conformed to in the subsequent allocation of available releases from the reservoir. With respect to the definition of the demand used in optimization, the algorithm developed can employ two different approaches: a real and a "fictive" demand composition. While the concept of a real demand is fairly self-explanatory, the concept of the "fictive" demand approach is based on the hydrological regime of the corresponding basin. Namely, in areas with sub-humid to semiarid climatic conditions the annual median inflow is used to represent the "fictive" demand: the annual median inflow is redistributed with respect to the real (monthly) demand distribution within an annual cycle. Thus, the "fictive" demand reflects the distribution of actual monthly water requirements. The "fictive" demand is assumed to constitute a theoretical maximum demand a reservoir of unrestricted size, while having no losses whatsoever, would be able to fulfil without any shortage occurring. Then the objective to be pursued in optimization can be selected from the following three alternatives: (a) To minimize the expected annual sum of squared monthly shortages in demand ful
filment. (b) To minimize the expected value of annual sum of squared deviations between
releases and the corresponding demands for water. (c) To minimize the expected value of accumulated annual sum of two weighted shor
tage components: (i) the squared deviation of actual reservoir storage from the full capacity of
the reservoir; and
238 Janos J. Bogardi & Darko Milutin
(ii) the squared deficiency in supply. Weight factors are assigned to each of the components according to the user's preferences.
Simulation and release allocation
Once an operational strategy is defined simulation is carried out to assess and to incorporate the effects of the reservoir's performance into the operation of the system as a whole. The role of simulation in the presented approach is twofold: (a) It is used to evaluate the effectiveness of a reservoir's operating policy. (b) In conjunction with release allocation, algorithm simulation provides necessary
information on the interaction among reservoirs (i.e. expected levels of each individual demand fulfilment and deficit, potential additional flows available to reservoirs situated downstream on the river course, and expected shortages in supply that a reservoir is going to encounter by following the derived operating policy).
Consequently, the updated values of the expected unsatisfied demands, available non-utilized releases over the whole simulation period and the expected supply shortages of the reservoir are passed through to computational cycles involving reservoirs whose operation is directly influenced by these factors. This amount of information is assumed sufficient to model the interactions among reservoirs in the system.
APPLICATION
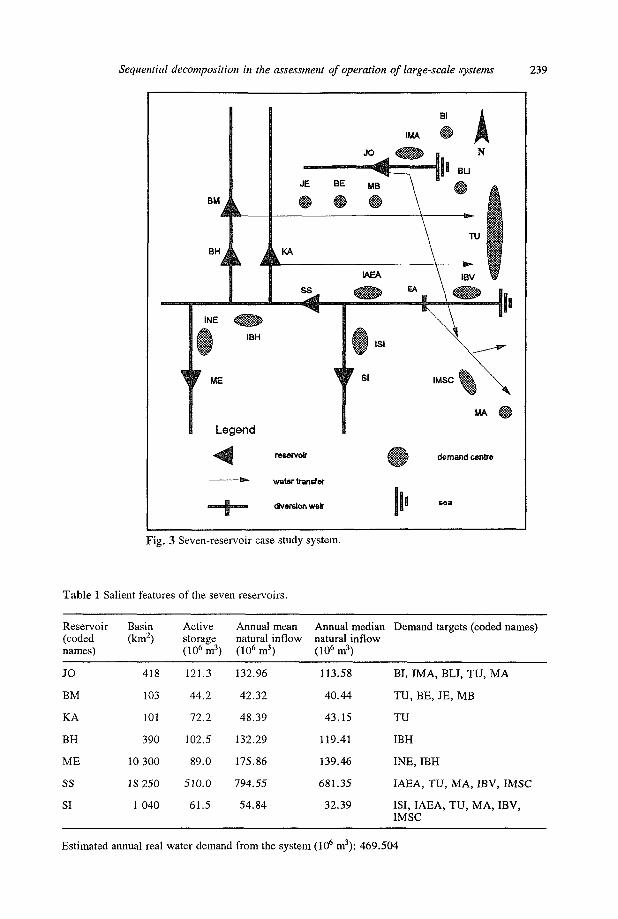
The presented approach was tested within a water resources master plan for Tunisia executed through the project EAU2000 (Agrar-und Hydrotechnik, 1993). The main objective was to derive and to assess feasible water resources management strategies through five development stages up to the year 2010. To illustrate the application of the proposed methodology a seven-reservoir system presented in Fig. 3 is selected. Salient features of the reservoirs along with the list of their respective demand targets and the results are given in Table 1 and Table 2, respectively. Assuming river flows as random processes, two decomposition schemes were employed to derive a long-term operational strategy of the case study system: (a) Setup 1 Sequential decomposition applying the following sequence of reservoir
consideration within one iteration cycle: "JO-BM-KA-BH-ME-SS-SI". (b) Setup 2 Sequential decomposition including, in the same iterative cycle, repeated
optimization and simulation of the operation of reservoirs that can utilize non-consumptive releases from more than one reservoir situated upstream in the basin. In this case the optimization sequence is as follows: "JO-BM-KA-SS-BH-SS-ME-SS-SI".
Based on two characteristic "demand-objective" schemes two operational strategies were derived in both cases: (a) Objective 1 Under the "fictive" demand concept the objective was to minimize the
expected annual sum of squared monthly shortages in demand fulfilment. (b) Obj ective 2 To mini mize the expected value of the annual sum of squared deviations
between releases and the corresponding real demands.
Sequential decomposition in the assessment of operation of large-scale systems 239
Fig. 3 Seven-reservoir case study system.
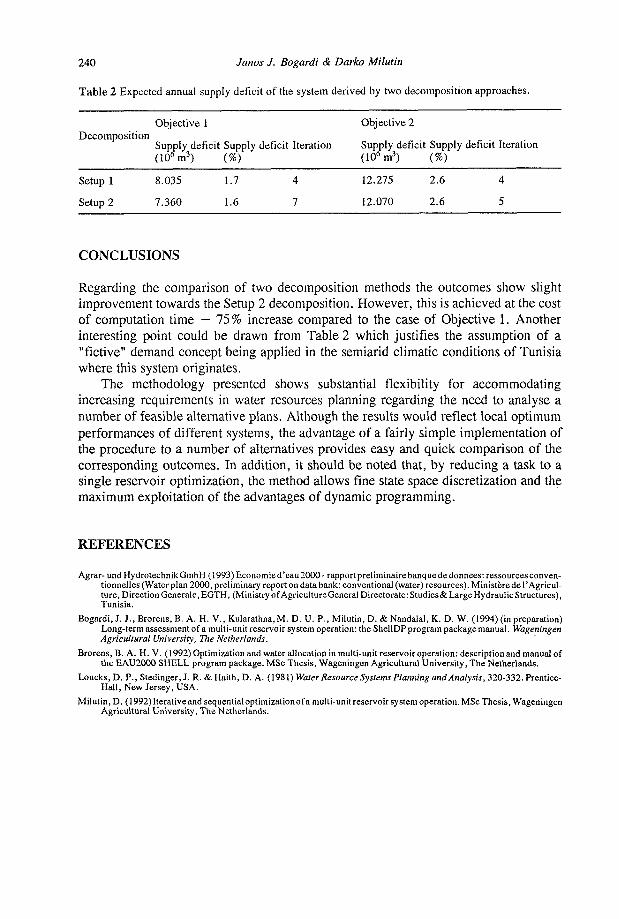
Table 1 Salient features of the seven reservoirs.
Reservoir (coded names)
JO
BM
KA
BH
ME
SS
SI
Basin (km2)
418
103
101
390
10 300
18 250
1 040
Active storage (106 m3)
121.3
44.2
72.2
102.5
89.0
510.0
61.5
Annual mean natural inflow (106 m3)
132.96
42.32
48.39
132.29
175.86
794.55
54.84
Annual median natural inflow (106 m3)
113.58
40.44
43.15
119.41
139.46
681.35
32.39
Demand targets (coded names)
BI, IMA, BLI, TU, MA
TU, BE, JE, MB
TU
IBH
INE, IBH
IAEA, TU, MA, IBV, IMSC
ISI, IAEA, TU, MA, IBV, IMSC
Estimated annual real water demand from the system (106 m3): 469.504
240 Janos J. Bogardi & Darko Milutin
Table 2 Expected annual supply deficit of the system derived by two decomposition approaches.
Objective 1 Objective 2 Decomposition
Supply deficit Supply deficit Iteration Supply deficit Supply deficit Iteration (ICTm3) (%) (10* m3) (%)
Setup 1 8.035 1.7 4 12.275 2.6 4
Setup 2 7.360 1.6 7 12.070 2.6 5
CONCLUSIONS
Regarding the comparison of two decomposition methods the outcomes show slight improvement towards the Setup 2 decomposition. However, this is achieved at the cost of computation time — 75% increase compared to the case of Objective 1. Another interesting point could be drawn from Table 2 which justifies the assumption of a "fictive" demand concept being applied in the semiarid climatic conditions of Tunisia where this system originates.
The methodology presented shows substantial flexibility for accommodating increasing requirements in water resources planning regarding the need to analyse a number of feasible alternative plans. Although the results would reflect local optimum performances of different systems, the advantage of a fairly simple implementation of the procedure to a number of alternatives provides easy and quick comparison of the corresponding outcomes. In addition, it should be noted that, by reducing a task to a single reservoir optimization, the method allows fine state space discretization and the maximum exploitation of the advantages of dynamic programming.
REFERENCES
Agrar- und Hydrotechnik GmbH ( 1993) Economie d'eau 2000 - rapport préliminaire banquede données: ressources conventionnelles (Water plan 2000, preliminary report on data bank: conventional (water) resources). Ministère de l'Agriculture, Direction Générale, EGTH, (Ministry of Agriculture General Directorate: Studies& Large Hydraulic Structures), Tunisia.
Bogardi, J. J., Brorens, B. A. H. V., Kularathna.M. D. U. P., Milutin, D. & Nandalal, K. D. W. (1994) (inpreparation) Long-term assessment of a multi-unit reservoir system operation: the ShellDP program package manual. Wageningen Agricultural University, The Netherlands.
Brorens, B. A. H. V. (1992) Optimization and water allocation in multi-unit reservoir operation: description and manual of the EAU2000 SHELL program package. MSc Thesis, Wageningen Agricultural University, The Netherlands.
Loucks, D. P., Stedinger, J. R. & Haith, D. A. (1981) Water Resource Systems Planning and Analysis, 320-332. Prentice-Hall, New Jersey, USA.
Milutin, D. (1992) Iterativeand sequential optimizationofa multi-unit reservoir system operation. MSc Thesis, Wageningen Agricultural University, The Netherlands.

Modelling and Management of Sustainable Basin-scale Water Resource Systems (Proceedings of a Boulder Symposium, July 1995). 1AHS Publ. no. 231, 1995. 241
Hybrid expert system for operation of a small surface storage system
S. MOHAN & N. ARUMUGAM Department of Civil Engineering, Indian Institute of Technology, Madras 600 036, India
Abstract Irrigation systems must be operated efficiently and optimally to manage them under practical situations. Much complexity is involved in respect to system operation and management which puts water managers and operators in a predicament. An expert system (ES) would be an appropriate tool to address these complex problems. In this paper, a hybrid expert system that has been developed for operation of a tank irrigation system in South India, is presented. The heuristics and optimal knowledge are integrated with algorithmic techniques to operate the system under real-time conditions.
INTRODUCTION
Irrigation accounts for more than 80% of the total water resources utilization in India (Shah, 1993). On the other hand, domestic and municipal sectors consume about 5 % of the total water use.
Tank irrigation systems are largely prevalent in south India and account for about 33% of the total irrigated area. Under tank irrigation, water is released to irrigate an area immediately downstream of the storage, unlike the river-reservoir systems where the water is distributed through a network of canals, distributaries and channels over a larger area. In tank systems, water can be retained for a relatively shorter period than the river-reservoir systems. Although tank systems are structurally simple, their operation and management is not as systematic as that of the river-reservoir systems. This is attributable to poor irrigation planning and improper release schedules. Optimal water management practices are not strictly followed, leading to water shortages and reduced production in the command areas.
HYBRID EXPERT SYSTEM
Knowledge, expertise and experience are important in all respects of tank system operation and management. Heuristics and subjective knowledge have to be acquired to assess such factors as the amount of water available for irrigation, projected water requirements and other crop growth considerations (Mohan & Arumugam, 1994). Experts, by virtue of their experience and professional skills, possess a chunk of knowledge and would make the decision making process efficiently, if they are involved. However, if these experts are unavailable, their special knowledge which may otherwise perish, must
242 S. Mohan & N. Arumugam
be compiled and used in a systematic way. This aspect is represented by expert systems (ES).
A water resources ES is a computer application that assists in solving complicated water resources problems by incorporating multidisciplinary engineering knowledge, principles of systems analysis, experience, intuition and engineering judgment in a solution procedure (Simonovic, 1991). Although optimization models are more useful for water resources management, the heuristic knowledge and experience are not explicitly included in these models. Furthermore, these models do not provide a means of representing the management policies in a flexible way that can be handled by a user. These issues are addressed by a hybrid expert system. A hybrid system represents the integration of algorithmic techniques, such as optimization models, with expert system techniques. With a user-friendly interface it provides an opportunity to link the experience and special knowledge of system operators and specialists with problem solving algorithms to address complex problems.
Some of the earlier hybrid ES have been reported by Reboh et al. (1982) and Engman et al. (1986). Buffaut et al. (1989) presented an ES for estimating parameters used in the Storm Water Management Model. ES for real-time operation of reservoir systems was first discussed by Floris et al. (1988). In a recent paper, Fischer & Schultz (1991) discussed the applicability of ES to real-time reservoir operation. They, however, did not consider algorithmic routines to address the complexity.
The present paper demonstrates the applicability of a hybrid expert system for optimal operation of a tank irrigation system. The knowledge and heuristics are derived from a simulation study on the tank system using a three step procedure.
STUDY AREA
The hybrid expert system is envisaged for the optimal operation of Veeranam tank irrigation system in south India. The tank is located at a distance of 245 km south of Madras. It serves an extent of 18 000 ha and has a storage capacity of 26 million m3
(MCum). Paddy rice is the principal crop which occupies about 90 % of the total irrigated area.
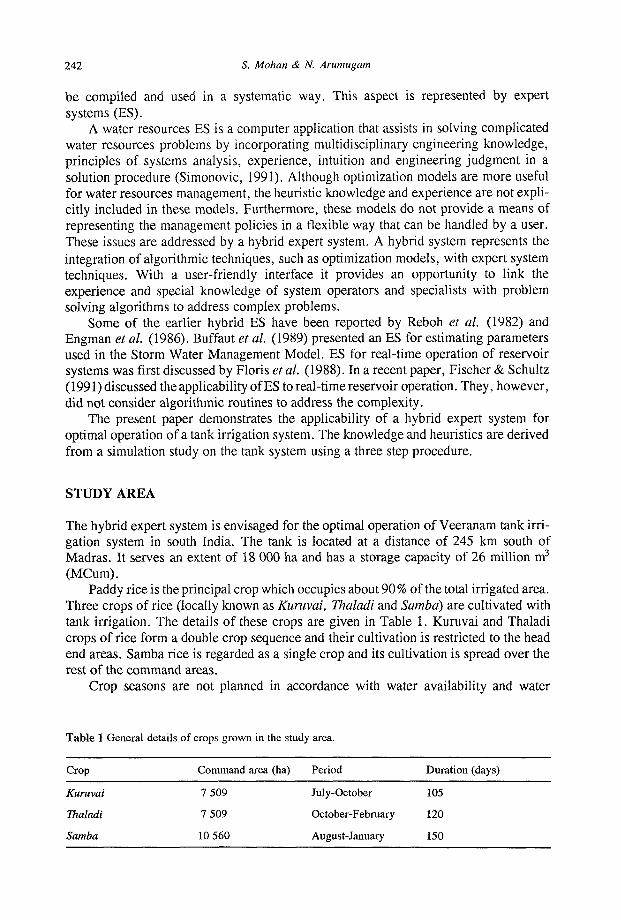
Three crops of rice (locally known as Kuruvai, Thaladi and Samba) are cultivated with tank irrigation. The details of these crops are given in Table 1. Kuruvai and Thaladi crops of rice form a double crop sequence and their cultivation is restricted to the head end areas. Samba rice is regarded as a single crop and its cultivation is spread over the rest of the command areas.
Crop seasons are not planned in accordance with water availability and water
Table 1 General details of crops grown in the study area.
Crop Command area (ha) Period Duration (days)
Kuruvai 7 509 July-October 105
Thaladi 7 509 October-February 120
Samba 10 560 August-January 150
Hybrid expert system for operation of a small surface storage system 243
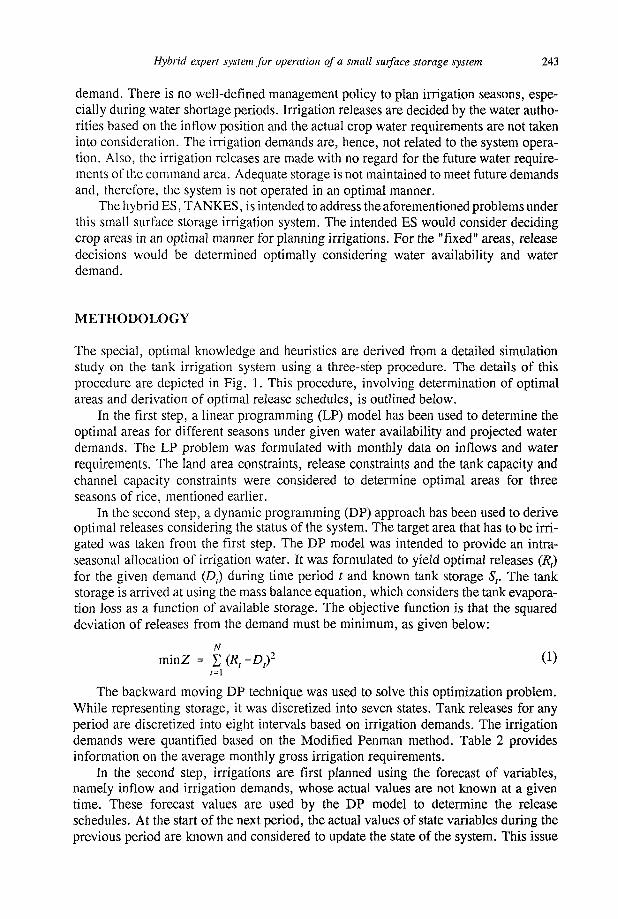
demand. There is no well-defined management policy to plan irrigation seasons, especially during water shortage periods. Irrigation releases are decided by the water authorities based on the inflow position and the actual crop water requirements are not taken into consideration. The irrigation demands are, hence, not related to the system operation. Also, the irrigation releases are made with no regard for the future water requirements of the command area. Adequate storage is not maintained to meet future demands and, therefore, the system is not operated in an optimal manner.
The hybrid ES, TANKES, is intended to address the aforementioned problems under this small surface storage irrigation system. The intended ES would consider deciding crop areas in an optimal manner for planning irrigations. For the "fixed" areas, release decisions would be determined optimally considering water availability and water demand.
METHODOLOGY
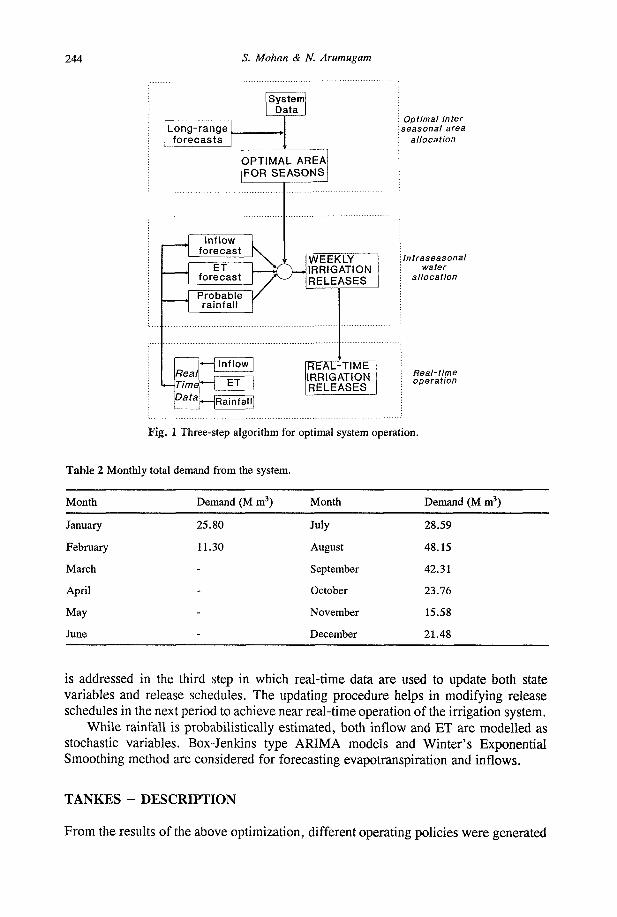
The special, optimal knowledge and heuristics are derived from a detailed simulation study on the tank irrigation system using a three-step procedure. The details of this procedure are depicted in Fig. 1. This procedure, involving determination of optimal areas and derivation of optimal release schedules, is outlined below.
In the first step, a linear programming (LP) model has been used to determine the optimal areas for different seasons under given water availability and projected water demands. The LP problem was formulated with monthly data on inflows and water requirements. The land area constraints, release constraints and the tank capacity and channel capacity constraints were considered to determine optimal areas for three seasons of rice, mentioned earlier.
In the second step, a dynamic programming (DP) approach has been used to derive optimal releases considering the status of the system. The target area that has to be irrigated was taken from the first step. The DP model was intended to provide an intra-seasonal allocation of irrigation water. It was formulated to yield optimal releases (R,) for the given demand (£>,) during time period t and known tank storage Sr The tank storage is arrived at using the mass balance equation, which considers the tank evaporation loss as a function of available storage. The objective function is that the squared deviation of releases from the demand must be minimum, as given below:
N
minZ = T,(Rt-D,)2 (1)
The backward moving DP technique was used to solve this optimization problem. While representing storage, it was discretized into seven states. Tank releases for any period are discretized into eight intervals based on irrigation demands. The irrigation demands were quantified based on the Modified Penman method. Table 2 provides information on the average monthly gross irrigation requirements.
In the second step, irrigations are first planned using the forecast of variables, namely inflow and irrigation demands, whose actual values are not known at a given time. These forecast values are used by the DP model to determine the release schedules. At the start of the next period, the actual values of state variables during the previous period are known and considered to update the state of the system. This issue
244 S. Mohan & N. Arumugam
System Data
Long - range f o r e c a s t s
OPT IMAL AREA FOR SEASONS
Inf low forecast
ET fo recas t
Probable ra in fa l l
Optimal Inter seasonal area
allocation
WEEKLY IRRIGATION RELEASES
Real Time Data
Inf low
Intraseasonal water
allocation
HUT R E A L - T I M E " IRRIGATION RELEASES
HRainfall
Real-time operation
Fig. 1 Three-step algorithm for optimal system operation.
Table 2 Monthly total demand from the system.
Month
January
February
March
April
May
June
Demand (M m3)
25.80
11.30
-
-
-
-
Month
July
August
September
October
November
December
Demand (M m3)
28.59
48.15
42.31
23.76
15.58
21.48
is addressed in the third step in which real-time data are used to update both state variables and release schedules. The updating procedure helps in modifying release schedules in the next period to achieve near real-time operation of the irrigation system.
While rainfall is probabilistically estimated, both inflow and ET are modelled as stochastic variables. Box-Jenkins type ARIMA models and Winter's Exponential Smoothing method are considered for forecasting évapotranspiration and inflows.
TANKES - DESCRIPTION
From the results of the above optimization, different operating policies were generated
Hybrid expert system for operation of a small surface storage system 245
to build the knowledge-base of TANKES. The knowledge was represented by rules that help in solving all possible tank operation problems. Some of the heuristic information such as rules for accounting for water supply shortages and excess releases over time were acquired from domain experts. Experts were also consulted to provide other judgmental, procedural and experiential knowledge regarding the system operation. The acquired knowledge was implemented in the form of rules in VP-EXPERT ES development shell (Paperback Software, 1987). This shell affords access to exchange data with dBASE data base and worksheet files and also to execute external routines. The knowledge representation and utilization capabilities of the shell were combined with these routines to develop an integrated system.
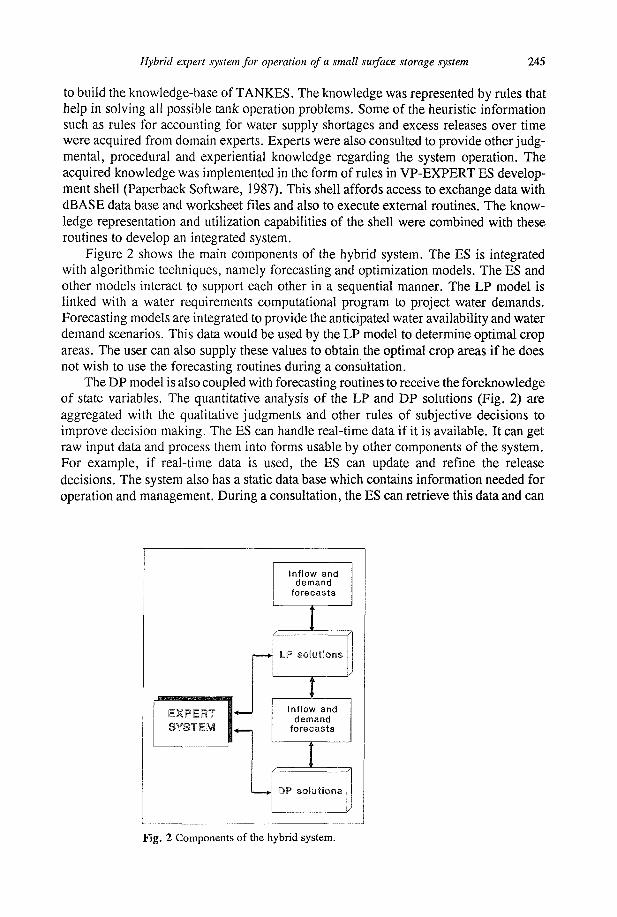
Figure 2 shows the main components of the hybrid system. The ES is integrated with algorithmic techniques, namely forecasting and optimization models. The ES and other models interact to support each other in a sequential manner. The LP model is linked with a water requirements computational program to project water demands. Forecasting models are integrated to provide the anticipated water availability and water demand scenarios. This data would be used by the LP model to determine optimal crop areas. The user can also supply these values to obtain the optimal crop areas if he does not wish to use the forecasting routines during a consultation.
The DP model is also coupled with forecasting routines to receive the foreknowledge of state variables. The quantitative analysis of the LP and DP solutions (Fig. 2) are aggregated with the qualitative judgments and other rules of subjective decisions to improve decision making. The ES can handle real-time data if it is available. It can get raw input data and process them into forms usable by other components of the system. For example, if real-time data is used, the ES can update and refine the release decisions. The system also has a static data base which contains information needed for operation and management. During a consultation, the ES can retrieve this data and can
EXPERT SYSTEM
• —
>
• — * •
Inflow and demand
forecasts
I LP solut ions
i
Inflow and demand
forecasts
DP soSutions
Fig. 2 Components of the hybrid system.
246 S. Mohan & N. Arumugam
combine it with user-supplied information. The optimization models can be run, if desired by the user. The ES can directly give
operational instructions based on its knowledge. In this case, the optimal policies are stored and utilized to aid in decision making. A typical rule representing optimal operational knowledge is given below.
IF Month = August AND Initial storage = 10-14 MCum AND Demand = 20-25 MCum
THEN Release = 20 MCum The above rule was framed based on the analysis of DP solutions. The initial storage
can be arrived at with the value of inflow specified by the user. Other rules representing heuristics and experience were developed to incorporate the qualitative aspects of system operation. The explanation facilities of the ES provide the user with answers about its line of reasoning. At any point in time, the user can ask why a query is being posed and can get the explanation.
CONCLUSIONS
The problems related to operation and management of a small-scale surface storage system viz. a tank have been discussed in this paper. The problems necessitate the application of a hybrid expert system.
The developed hybrid system considers the use of problem solving algorithms. This makes a strong integration of knowledge that is required to address a great deal of complexity in respect to system operation and management. The entire approach is based on a three-step procedure that helps in near real-time operation of the system.
REFERENCES
Bafaut, C.&Delleur, J. W. (1989) Expert system for calibratingSWMM. J. Wat. Resour. Plan. Manage. 115(3), 278-298.
Engman, E. T., Rango, A. &Martinec, J. (1986) An expert system for snowmelt runoff modelling and forecasting. Water Forum 86, vol. 1, 174-180. ASCE, New York, USA.
Fischer, H. &Schultz,G. A. ( 1991) An expertsystem for real-time operationof a multi-purposemulti-unit reservoir system. In: Hydrology of'NaturalandManmadeLakes(ed.by G. Schiller, R. Lemmelâ&M. Spreafico)(Proc. ViennaSymp., August 1991), 151-157.1AHS Publ. no. 206.
Floris, V. D. Simons & Simons, R. (1988) Development of an expert system for Mark Twain reservoir operation. In: Computerized Decision Support System for Water Managers. ASCE, New York, USA.
Mohan, S. & Arumugam, N. (1994) CROPES: a rule-based expert system for crop selection in India. Trans. Am. Soc. Agric. Engrs. 37(4), 1355-1363.
Paperback Software (1987) VP-EXPERT: Rule-based Expert System Development Tool. Paperback Software Inc., Berkeley, California, USA.
Reboh, R. J., Reiter, R. J. & Gashnig, J. (19S2) Development of a Knowledge-based Interface to a Hydrological Simulation Program. SRI International,Menlo Park, California, USA.
Shah, R. B. (1993) Role of major dams in the Indian economy. Wat. Resour. Develop. 9(3), 319-336.
Simonovic, S. P. (1991) Knowledge-based systems and operational hydrology. Can. J. Civil Engg. 18, 1-11.
Modelling and Management of Sustainable Basin-scale Water Resource Systems (Proceedings of a Boulder Symposium, July 1995). IAHS Publ. no. 231, 1995. 247
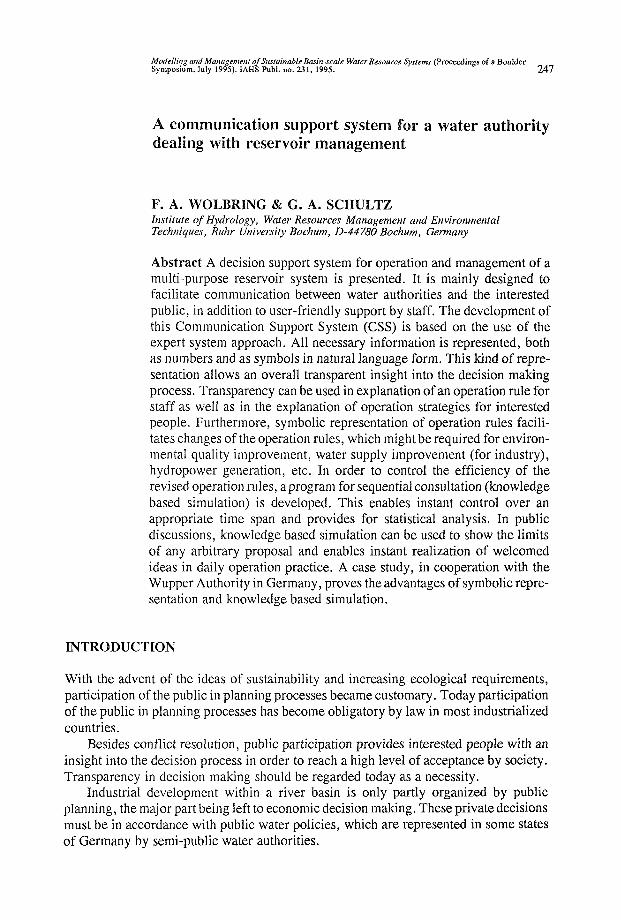
A communication support system for a water authority dealing with reservoir management
F. A. WOLBRING & G. A. SCHULTZ Institute of Hydrology, Water Resources Management and Environmental Techniques, Ruhr University Bochum, D-44780 Bochum, Germany
Abstract A decision support system for operation and management of a multi-purpose reservoir system is presented. It is mainly designed to facilitate communication between water authorities and the interested public, in addition to user-friendly support by staff. The development of this Communication Support System (CSS) is based on the use of the expert system approach. All necessary information is represented, both as numbers and as symbols in natural language form. This kind of representation allows an overall transparent insight into the decision making process. Transparency can be used in explanation of an operation rule for staff as well as in the explanation of operation strategies for interested people. Furthermore, symbolic representation of operation rules facilitates changes of the operation rules, which might be required for environmental quality improvement, water supply improvement (for industry), hydropower generation, etc. In order to control the efficiency of the revised operation rules, aprogram for sequential consultation (knowledge based simulation) is developed. This enables instant control over an appropriate time span and provides for statistical analysis. In public discussions, knowledge based simulation can be used to show the limits of any arbitrary proposal and enables instant realization of welcomed ideas in daily operation practice. A case study, in cooperation with the Wupper Authority in Germany, proves the advantages of symbolic representation and knowledge based simulation.
INTRODUCTION
With the advent of the ideas of sustainability and increasing ecological requirements, participation of the public in planning processes became customary. Today participation of the public in planning processes has become obligatory by law in most industrialized countries.
Besides conflict resolution, public participation provides interested people with an insight into the decision process in order to reach a high level of acceptance by society. Transparency in decision making should be regarded today as a necessity.
Industrial development within a river basin is only partly organized by public planning, the major part being left to economic decision making. These private decisions must be in accordance with public water policies, which are represented in some states of Germany by semi-public water authorities.

248 F. A. Wolbring & G. A. Schultz
These authorities have to deal with private and public proposals, which are sometimes easy to handle and sometimes hard to negotiate. Depending on the complexity of the proposal, the consequences for the water resources system and all riparians are hard to convey. Such situations are quite unsatisfactory for both parties. The proponents are not able to realize the problems that are connected with their proposal. They are left to accept or reject the technical arguments put forward by the authority as they have no direct access to the problem. The authority, on the other hand, is unable to mediate problems that would arise by an arbitrary proposal. They have to rely on their technical expertise, which may, depending on the power structure, be welcome or not.
Figure 1 shows the triangular relation between problem, authority and public. The white arrows demonstrate the present situation.
From the point of view of both parties it would be desirable to enable direct access of the public to the problem. A real discussion based on technical arguments could then be held. The proponent would be in a much better satisfactory position and the authorities could draw back, to mediate only between the problem and the public. The black arrow in Fig.l shows that desirable relation.
Today's computer technology facilitates the development of a tool that supports the communication between problem, authority and public. Here it is called a Communication Support System (CSS). Figure 1 shows the triangular relation that must be covered. The relation between authority and problem is the well known topic which is covered by Decision Support Systems and has been extensively discussed in the literature, e.g. Simonovic (1994).
FROM DECISION SUPPORT SYSTEMS TO COMMUNICATION SUPPORT SYSTEMS
With development of computers and the conquest of offices by the personal computer, Decision Support Systems (DSS) became part of a software environment and were used as a vehicle to transfer scientific knowledge into practice. The resulting structure of DSS was a composite of different models, grouped in a model base, data base and user interface. The use of models required deep insight into the theory of models and led to a gap
//Authority/ / /Public \\
Fig. 1 Extension of decision support systems to communication support systems.
Communication support system for a reservoir management authority 249
between science and practice. By developing sophisticated user interfaces, the gap between theory and practice should be bridged. Today, expert system technology is mostly used for DSS to store engineering expertise in using models to guarantee a correct and comfortable use of models.
This brief summary is merely intended to underline the obvious fact that Decision Support Systems are destined to support decision makers in their decision making processes and are not naturally workable as a tutorial for a non-specialist. The main differences between CSS and DSS result from differences in intention and in the groups of people addressed.
The intention of a decision support system is mainly to support a professional user in finding an optimal solution for his problem. The user might not be familiar with the handling of the tool, but at least he is familiar with the function of the tool and is very familiar with the reservoir system he is working with.
The intention of a communication support system is, first, to demonstrate to an inexperienced group of people the functionality of the system and the influence of the current operation rule on it. Secondly, it will demonstrate the consequences of changing the operation rule for the system. It can be used as a tool to facilitate the process of learning for experts as well as for the public.
Using a classical model-based Decision Support System as a tutoring system leads to the following difficulties: (a) Simulation models programmed in procedural languages are not transparent for
outsiders. To understand functionality, manuals have to be read or, in the worst case, source code has to be analysed. In a discussion between a member of the authority and an interested person, communication starts with a long monologue. The layman has to understand the complete program before he is able to understand the parameters he can alter. The consequence is that people do not get in touch with the program.
(b) If the function is understood it should be possible to change an existing operation rule according to the expectations of people. Procedural programs are only able to change parameters, which enable a limited range of variability for the whole system, but do not cover the necessary freedom to represent an arbitrary proposal for an operation rule by laymen. In the sense of dialogue, i.e. two-way communication, it would be desirable to provide that freedom.
(c) Some people are not willing to deal with the complete context of operation rules, but are just concerned with a single item. Integration of single ideas into the context of an operational strategy usually needs some system analytical work before implementation into a source code. A tool that is able to neglect the strict rules of system analysis but include all ideas is desirable in order to demonstrate malfunctioning.
According to these problems a CSS should meet the requirements of transparency, representability of any proposal and the ability to supplement operational rules.
WUPEX - A COMMUNICATION SUPPORT SYSTEM FOR THE WUPPER AUTHORITY
The concept of WUPEX as a decision support system for real-time operation of the upper Wupper Reservoir system was presented first by Fischer & Schultz (1991). Its
250 F. A. Wolbring & G. A. Schultz
realization and extension to drought management was reported by Napiorkowski et al. (1993).
The river basin and multi-purpose reservoir system is well described in both papers. Here it should just be mentioned that the river basin is highly industrialized and the river is severely polluted. A system of four reservoirs is installed mainly for low flow augmentation, recreation and hydropower generation. The management of water quantity is strongly dependent on water quality.
Industrial expansion is regulated by administrative regulations that take into account the environmental impact. In the Wupper catchment the impact on the Wupper River is assessed by the Wupper authority. Its statement for a privately planned project, e.g. expansion of industry, thermopower plant etc., is crucial to the administrative approval process.
Quite often the Wupper authority has to deal with licensing applications. Usually their job is done by giving a statement but sometimes authorities are involved in discussions in which they have to defend their position. If their reasoning deals with the interrelation of all objectives, the operation rule of the reservoir system is affected by arguments which surpass the limit of comprehension of most of the people involved. For those people, just "technical reasons", which are quite opaque, are jeopardizing their project. Usually this is the end of serious communication and the beginning of exerting pressure.
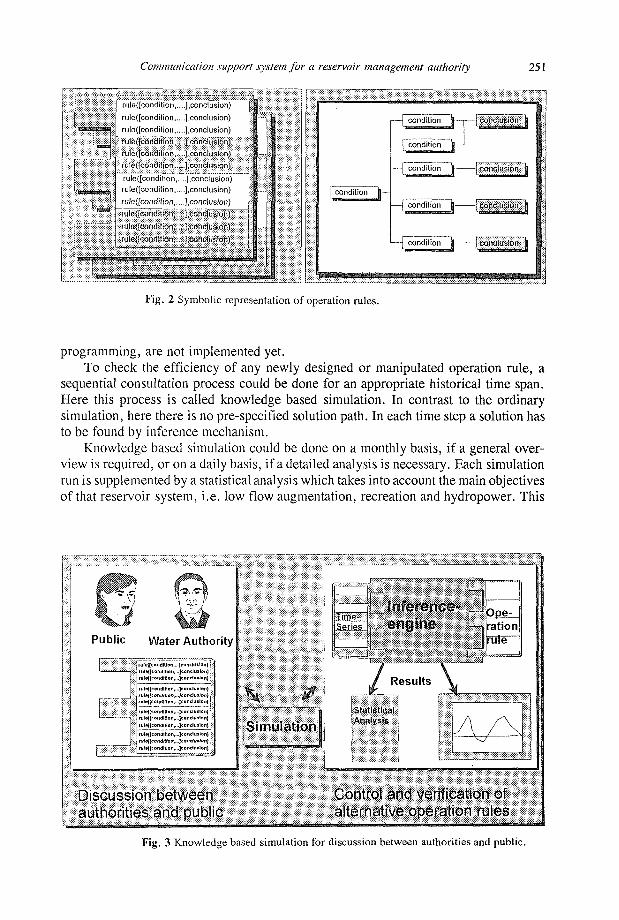
In order to overcome the problem already mentioned, the DSS for real time operation of the reservoir system is enhanced to enable communication between authorities and the public. In DSS the operation rule of the reservoir system is represented in symbolic form. Symbols which represent facts, like "Reservoir is empty", are connected in the form of rules, which have lists of conditions and a conclusion. A knowledge base contains a set of rules, which represents the logic of one operation rule. Originally this representation form was chosen to facilitate communication between staff and computer to allow a check-back of given recommendations.
In CSS the natural language form of all symbols is welcomed because of simplicity of comprehension for everyone (Fig. 2). To visualize the interrelation of all facts and to recognize the overall structure of an operation rule, a decision tree can be composed and displayed on screen. To underline the simplicity of exchanging the operation rule the knowledge base is represented in Fig. 2 as one component of the overall structure shown in Fig. 3.
The ability to supplement single ideas in an existing operation rule is quite easy to achieve by adding new rules to a knowledge base. Only the position inside the knowledge base has to be considered, because the position of the rule is equivalent to the priority of that rule. The freedom to choose any form of conditions and conclusions is only limited by the amount of symbols that can be interpreted by the inference machine.
In order to guarantee the realization of any chosen operation rule in a short time, i.e. during a discussion, in addition to the used operation rule, a set of different operation rules is prepared. Adoption of one of the operation rules to that which is proposed saves time. All the prepared strategies are based on a kind of level matrix, in which a low flow augmentation target is selected according to the amount of stored water. It should be mentioned here that this set of operation rules might be a product of an optimization procedure in which different weights are given to a set of objectives. So this is the interface to multi-objective optimization techniques. Operational strategies, like dynamic
Commun!cation support system for a reservoir management authority 251
rufe([condition,.
rule ([condition,.
rule([condition,.
.j.conclusion)
.],conclusion)
.],conclusion)
h
; ru teiffcbntj if fort; ;
rule([condilion,.
ruleflcondition...
rule([condition,..
..],conclusion) ^.conclusion)
^.conclusion) ::ru1ppqnd^i^S
iji^fiaïiisfôff;:!;
^sU
condition
— condition
— condition
{ij'ëSftcïBëion i
condition
condition
J '-jiïn tïiÏMÏiïiïiïnïï
condition ~\—~~|g^ljj|için|:i|
J Fig. 2 Symbolic representation of operation rules.
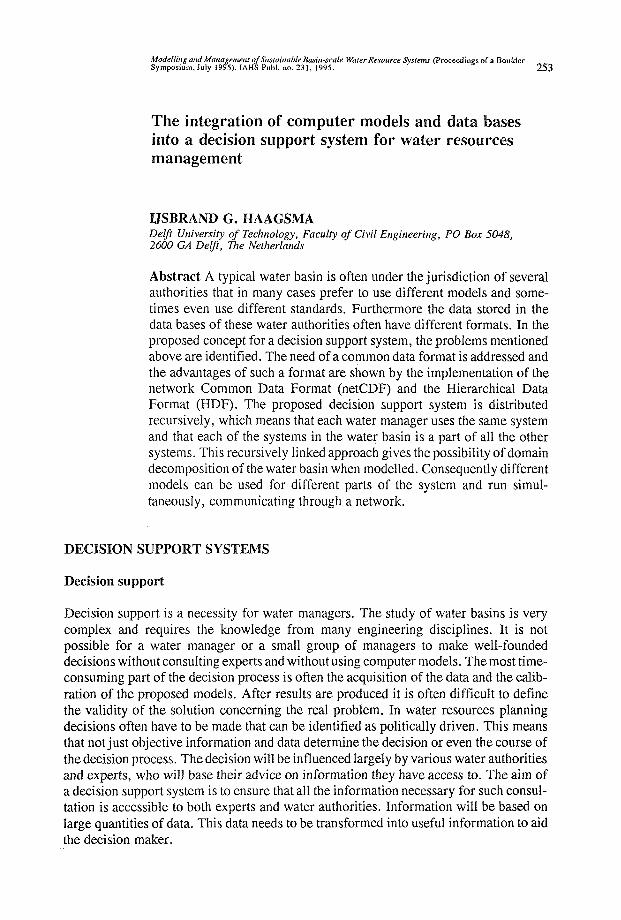
programming, are not implemented yet. To check the efficiency of any newly designed or manipulated operation rule, a
sequential consultation process could be done for an appropriate historical time span. Here this process is called knowledge based simulation. In contrast to the ordinary simulation, here there is no pre-specified solution path. In each time step a solution has to be found by inference mechanism.
Knowledge based simulation could be done on a monthly basis, if a general overview is required, or on a daily basis, if a detailed analysis is necessary. Each simulation run is supplemented by a statistical analysis which takes into account the main objectives of that reservoir system, i.e. low flow augmentation, recreation and hydropower. This
Public Water Authority
PHI
mmm \mm
r i i i r
ru[e([condlOon,..,]concfui)on] rtite([cQndltloii, ..Jeonduilon) ml(K[cor1im!on,...]condutJon)
iul»Heondrtlon,...]eo[iclLji!lQn) ruletfeondltlon,...Jeonduilon) rule([condltl on,. ..Jeonduilon)
r ul [c ond Itl o n.... J c on du 11 o n) ru !•( [c o nd 11! o n,.. .]c ontiu t l o n ) tu lef[c o nd Itl on,...] c o rtcl u » 1 on J
rul *([c o n ditto n, ...Je o n d u i fo n) rute( [ t on d IH o n,.. .Je on du 11 o n) iule{[rondllloTi, Jconclutlon)
Simulation
i l
Ope-ration rule
Results
Statistical Analysis
Discission between autilities and public
Control and vérification of alternative operation rules
Fig. 3 Knowledge based simulation for discussion between authorities and public.

252 F. A. Wolbring & G. A. Schultz
numeric result can be commented by the program in verbal form. The comment is composed of a set of standard phrases. This feature is installed to guarantee an objective interpretation of the consequences of the proposed operation rule.
If a very detailed analysis of the simulation output is required, numeric results can be loaded into a spreadsheet program to conduct more statistical analysis or to plot trajectories.
The CSS WUPEX is installed with the Wupper authorities and was already used in discussions with private investors. Authority representatives succeeded in mediating technical problems with these people and were able to conduct a much more problem-oriented discussion than usual.
REFERENCES
Fischer, H. & Schultz, G. A. ( 1991 ) An expert system for real-time operation of a multi-purpose multi-unit reservoir system. In: Hydrology oj'Naturaland'ManmadeLakes (ed. by G, Schiller, R. Lemmcla&M. Spreafico)(Proc. ViennaSymp., August 1991). IAHS Publ. no. 206.
Napiorkowski, J. J., Wolbring, F. A. & Schultz, G. A. (1993) Expert system application for real-time risk management duringdrought. In: Extreme Hydrological Events, Precipitation, Floods and Droughts (ed. by Z. W. Kundzewicz, D. Rosbjerg.S. P. Simonovic & K. Takcuchi) (Proc. Yokohama Symp., July 1993). IAHS Publ. no. 213.
Simonovic, S. P. (1994) Decision support for sustainable water resources development. In: Water Resources Planning in a Changing World. International UNESCO Symp., Karlsruhe, Germany.
Modelling and Management of Sustainable Basin-scale Water Resource Systems (Proceedings of a Boulder Symposium, July 1995). IAHS Publ.no. 231, 1995. 2 5 3
The integration of computer models and data bases into a decision support system for water resources management
USBRAND G. HAAGSMA Delft University of Technology, Faculty of Civil Engineering, PO Box 5048, 2600 GA Delft, ne Netherlands
Abstract A typical water basin is often under the jurisdiction of several authorities that in many cases prefer to use different models and sometimes even use different standards. Furthermore the data stored in the data bases of these water authorities often have different formats. In the proposed concept for a decision support system, the problems mentioned above are identified. The need of a common data format is addressed and the advantages of such a format are shown by the implementation of the network Common Data Format (netCDF) and the Hierarchical Data Format (HDF). The proposed decision support system is distributed recursively, which means that each water manager uses the same system and that each of the systems in the water basin is a part of all the other systems. This recursively linked approach gives the possibility of domain decomposition of the water basin when modelled. Consequently different models can be used for different parts of the system and run simultaneously, communicating through a network.
DECISION SUPPORT SYSTEMS
Decision support
Decision support is a necessity for water managers. The study of water basins is very complex and requires the knowledge from many engineering disciplines. It is not possible for a water manager or a small group of managers to make well-founded decisions without consulting experts and without using computer models. The most time-consuming part of the decision process is often the acquisition of the data and the calibration of the proposed models. After results are produced it is often difficult to define the validity of the solution concerning the real problem. In water resources planning decisions often have to be made that can be identified as politically driven. This means that not just objective information and data determine the decision or even the course of the decision process. The decision will be influenced largely by various water authorities and experts, who will base their advice on information they have access to. The aim of a decision support system is to ensure that all the information necessary for such consultation is accessible to both experts and water authorities. Information will be based on large quantities of data. This data needs to be transformed into useful information to aid the decision maker.
254 Usbrand G. Haagsma
Computer systems
Fast communication and access to the same data by all can be ensured by a computer system. Such a computer system should, therefore, be the core of a decision support system. However, we have to realize that the decision is likely to be more dependent on a convincing presentation of the supporting information than on the data itself. If the decision is based on public information rather than on some sort of classified information or data, then all relevant data sources should be made available to anyone taking part in the decision process, through a computer network. Special interest groups should then also have access to the relevant computer models and the expertise to use them, on request. This can be accomplished by a computer network for integrated water resources management that is partly open to the public.
Data exchange
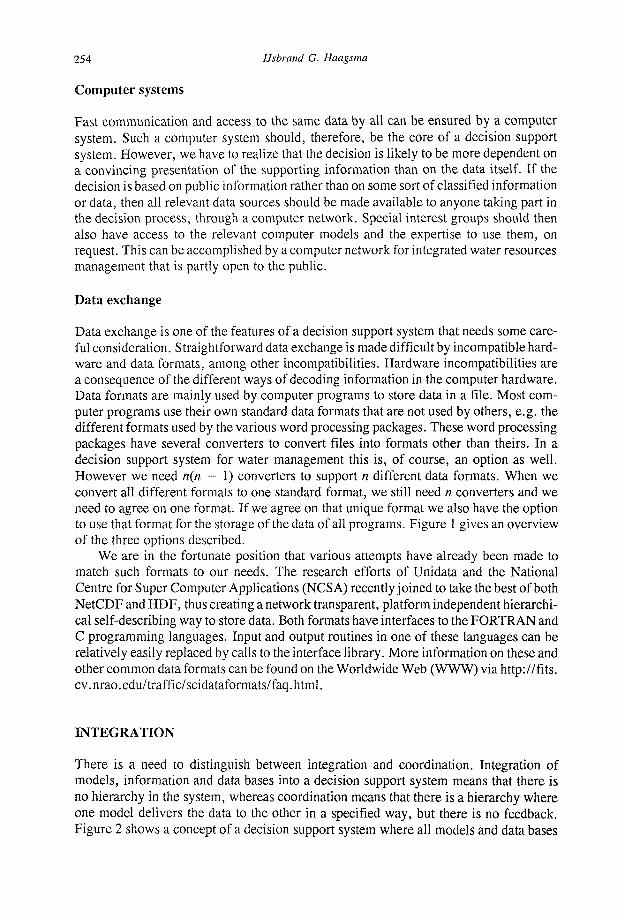
Data exchange is one of the features of a decision support system that needs some careful consideration. Straightforward data exchange is made difficult by incompatible hardware and data formats, among other incompatibilities. Hardware incompatibilities are a consequence of the different ways of decoding information in the computer hardware. Data formats are mainly used by computer programs to store data in a file. Most computer programs use their own standard data formats that are not used by others, e.g. the different formats used by the various word processing packages. These word processing packages have several converters to convert files into formats other than theirs. In a decision support system for water management this is, of course, an option as well. However we need n(n — 1) converters to support n different data formats. When we convert all different formats to one standard format, we still need n converters and we need to agree on one format. If we agree on that unique format we also have the option to use that format for the storage of the data of all programs. Figure 1 gives an overview of the three options described.
We are in the fortunate position that various attempts have already been made to match such formats to our needs. The research efforts of Unidata and the National Centre for Super Computer Applications (NCSA) recently joined to take the best of both NetCDF and HDF, thus creating a network transparent, platform independent hierarchical self-describing way to store data. Both formats have interfaces to the FORTRAN and C programming languages. Input and output routines in one of these languages can be relatively easily replaced by calls to the interface library. More information on these and other common data formats can be found on the Worldwide Web (WWW) via http://fits. cv.nrao.edu/traffic/scidataformats/faq.html.
INTEGRATION
There is a need to distinguish between integration and coordination. Integration of models, information and data bases into a decision support system means that there is no hierarchy in the system, whereas coordination means that there is a hierarchy where one model delivers the data to the other in a specified way, but there is no feedback. Figure 2 shows a concept of a decision support system where all models and data bases
Integration of computer models and data bases into a decision support system 255
a o
o O
« Û
<u IL,
O
S o U
3 a Q
u ra H-,
o do
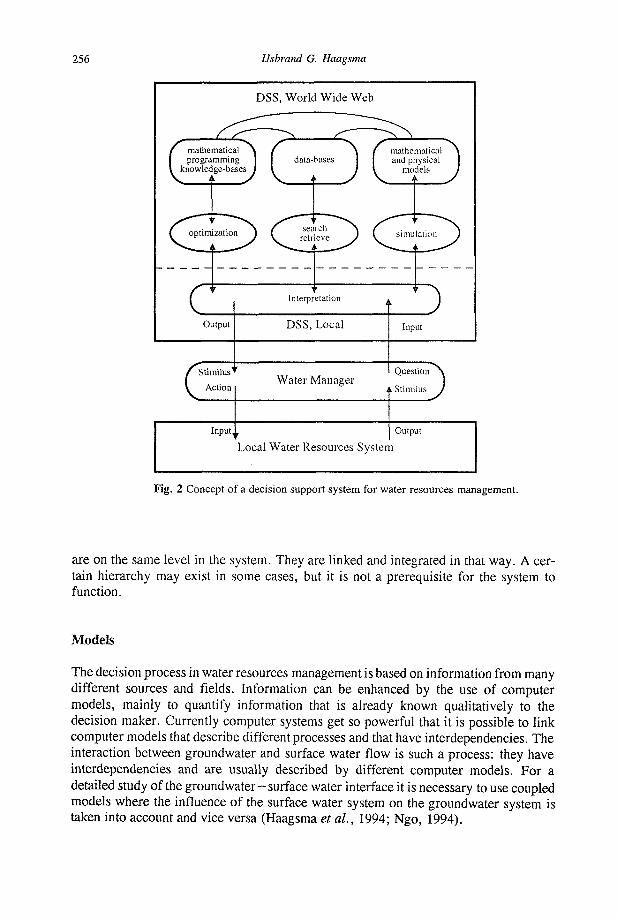
256 IJsbrand G. Haagsma
DSS, World Wide Web
mathematical \ programming I
knowledge-bases J
c Output
Interpretation
DSS, Local
/s t imilus»
I Action
D Input
Water Manager
Input,
Question ^
Stimilus J
Output
Local Water Resources System
Fig. 2 Concept of a decision support system for water resources management.
are on the same level in the system. They are linked and integrated in that way. A certain hierarchy may exist in some cases, but it is not a prerequisite for the system to function.
Models
The decision process in water resources management is based on information from many different sources and fields. Information can be enhanced by the use of computer models, mainly to quantify information that is already known qualitatively to the decision maker. Currently computer systems get so powerful that it is possible to link computer models that describe different processes and that have interdependencies. The interaction between groundwater and surface water flow is such a process: they have interdependencies and are usually described by different computer models. For a detailed study of the groundwater-surface water interface it is necessary to use coupled models where the influence of the surface water system on the groundwater system is taken into account and vice versa (Haagsma et al., 1994; Ngo, 1994).
Integration of computer models and data bases into a decision support system 257
Data bases
Models are always driven by vast amounts of data that is stored in various data bases. Off-the-shelf models normally do not have interfaces that can access these data bases. However it is not immensely difficult to create an interface that can access these data bases and transform the necessary data into a format that can be used for the models. Data bases are normally not the fastest and easiest way to store and retrieve data. Therefore data bases, as we know them, should not be used for the storage of temporary data produced and needed by computer models. However, the nature of data base makes them more suitable for storage of permanent data, i.e. measurement data and results of long computer calculations. Permanent data can easily be presented and manipulated by presentation tools, such as geographic information systems, when stored in data bases. Presentation of these data and the access of the data by computer models, if necessary through an interface, integrate data bases into the decision support system.
Other information
Other information that can be part of an integrated system can be divided into computerized and non-computerized data. Examples of computerized data are handbooks available in browsable form on a network, experience of people with the water system put into some sort of expert system, or rules put into a knowledge base. It is erroneous to expect however, that all supporting information will be provided to a decision maker by computers. Non-machine-readable information will continue to play an important role in the decision process. It is not only that some information will not be available in a machine readable form - perhaps in the near future this will be overcome. But the decision maker may not be using computers optimally. For me it is unthinkable that information coming out of a meeting will ever be completely simulated by computer programs. Decision making in water resources planning will ultimately always be a political process and computer simulations of a political process may be done in hindsight. It may never become a reliable enough process to generate, in advance, accurate evaluations of all possible side effects. Hence decision makers will not accept that computer programs take over part of the political decision process and determine the results of that process.
DISTRIBUTION
Models
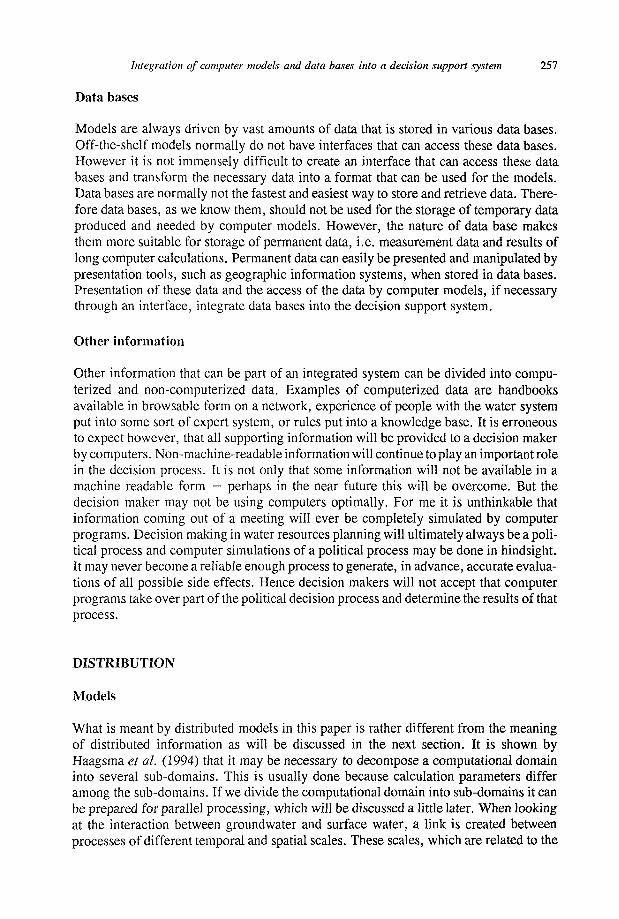
What is meant by distributed models in this paper is rather different from the meaning of distributed information as will be discussed in the next section. It is shown by Haagsma et al. (1994) that it may be necessary to decompose a computational domain into several sub-domains. This is usually done because calculation parameters differ among the sub-domains. If we divide the computational domain into sub-domains it can be prepared for parallel processing, which will be discussed a little later. When looking at the interaction between groundwater and surface water, a link is created between processes of different temporal and spatial scales. These scales, which are related to the

258 Usbrand G. Haagsma
physical scales of the hydrological processes, will also be reflected in the time and space step used in the computer models. Figure 3 shows how, in the case of a groundwater -surface water interaction, the computational domain can be decomposed, where characteristic space steps are identified.
The second reason to use sub-domains is a consequence of the distribution of information. It can be easier to match the boundaries of a computational (sub-) domain with the boundaries of a water authority. As discussed in the next section the information over the boundary of a water authority will be stored in a separate data base. It is not impossible to combine data from both data bases into one file that can act as the input file for a computer model, but it is easier to use separate files. Since we have the option to divide the computational domain into sub-domains, we will use it in this case.
Information
Although in the case of computer models everything is done locally, however sometimes after the data is retrieved from a date base elsewhere, information should be stored in a place where it is likely to be maintained in the best way. The best place to do that is the source of the information. Often this will be at the site of the local water authority that did most of the measurements themselves and are very likely the most frequent users
The around water system: very large time scales (time step - 1 week)
relatively large time scales (time step - 1 day)
medium time scales (time step - 5 hours)
SiSSÏSSSj relatively small time scales (time step ~ 1 hour)
The surface water system: very small time scales
"" (time step - 10 minutes)
Flow paths:
_»
Fig. 3 Decomposition of the computational domain for the study of groundwater — surface water interaction, according to the time scales of the underlying hydrological processes.
Integration of computer models and data bases into a decision support system 259
of the data. Data that is not geographically determined, like legislation, can be stored at sites or departments dependent on the topic of the data. Legislation that can be translated into rules is best maintained at a judicial department of the ministry of the infrastructure, i.e. the ministry that will develop legislation in the field of water management.
Knowledge
Knowledge will often be in the form of experience and expert systems. Distribution of expert systems may be even more wise than distribution of data bases, because the experience that has to be put in such an expert system is undoubtedly dependent on local situations and therefore not generic. To avoid general use when put in a central expert system it makes more sense to maintain these sources of experience locally.
Parallel processing
As discussed by Roest (1993), the optimal way to use parallel processing is to make all computer code suitable to a parallel machine and let both the compiler and the machine decide how they want to process the code, similar to the data parallel paradigm. Distributing sub-processes over the processors yourself, which is similar to what is known as the large grain data flow paradigm, is what we propose to do, since we divide the computational domain into sub-domains as discussed earlier. When we have more processors, e.g. if more computers are available for the calculation, it is possible to distribute the calculation of the sub-domains over the available processors. Communication can be accomplished using a network transparent data format or by a more sophisticated method: inter-process communication.
COMMUNICATION
Inter-process communication
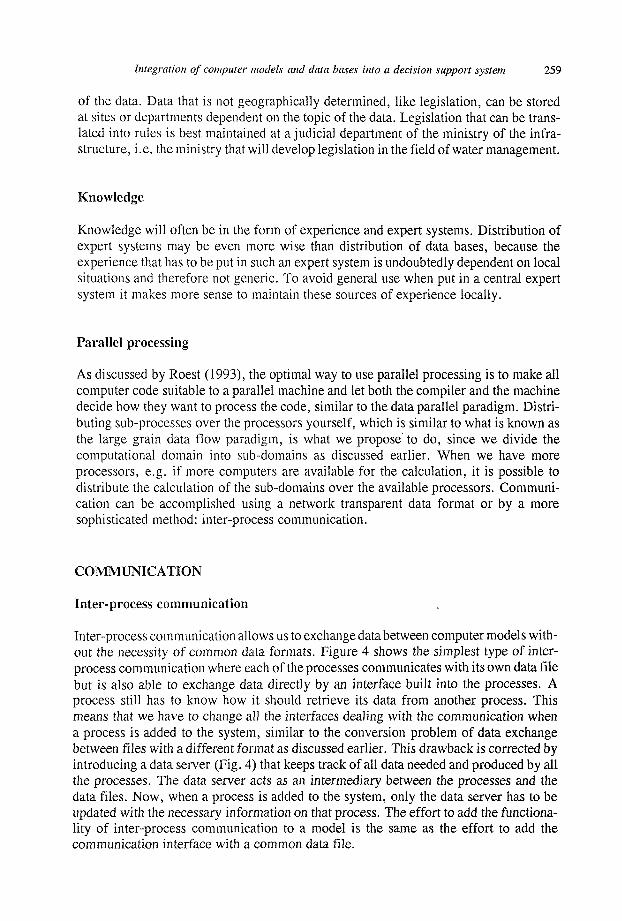
Inter-process communication allows us to exchange data between computer models without the necessity of common data formats. Figure 4 shows the simplest type of interprocess communication where each of the processes communicates with its own data file but is also able to exchange data directly by an interface built into the processes. A process still has to know how it should retrieve its data from another process. This means that we have to change all the interfaces dealing with the communication when a process is added to the system, similar to the conversion problem of data exchange between files with a different format as discussed earlier. This drawback is corrected by introducing a data server (Fig. 4) that keeps track of all data needed and produced by all the processes. The data server acts as an intermediary between the processes and the data files. Now, when a process is added to the system, only the data server has to be updated with the necessary information on that process. The effort to add the functionality of inter-process communication to a model is the same as the effort to add the communication interface with a common data file.
260 Usbrand G. Haagsma
I Process 1 J-^- ( Process 1
Process 2 ) Data Server
I Process n f^ ^ Data n Process n r
Data 1
Data 2
Data n
Fig. 4 Different methods for inter-process communication.
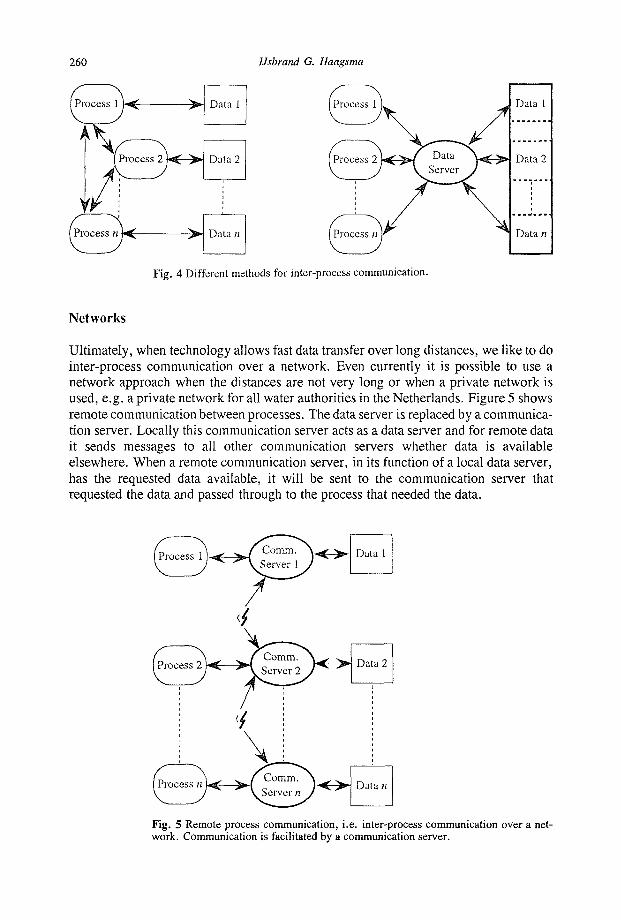
Networks
Ultimately, when technology allows fast data transfer over long distances, we like to do inter-process communication over a network. Even currently it is possible to use a network approach when the distances are not very long or when a private network is used, e.g. a private network for all water authorities in the Netherlands. Figure 5 shows remote communication between processes. The data server is replaced by a communication server. Locally this communication server acts as a data server and for remote data it sends messages to all other communication servers whether data is available elsewhere. When a remote communication server, in its function of a local data server, has the requested data available, it will be sent to the communication server that requested the data and passed through to the process that needed the data.
Fig. 5 Remote process communication, i.e. inter-process communication over a network. Communication is facilitated by a communication server.
Integration of computer models and data bases into a decision support system 261
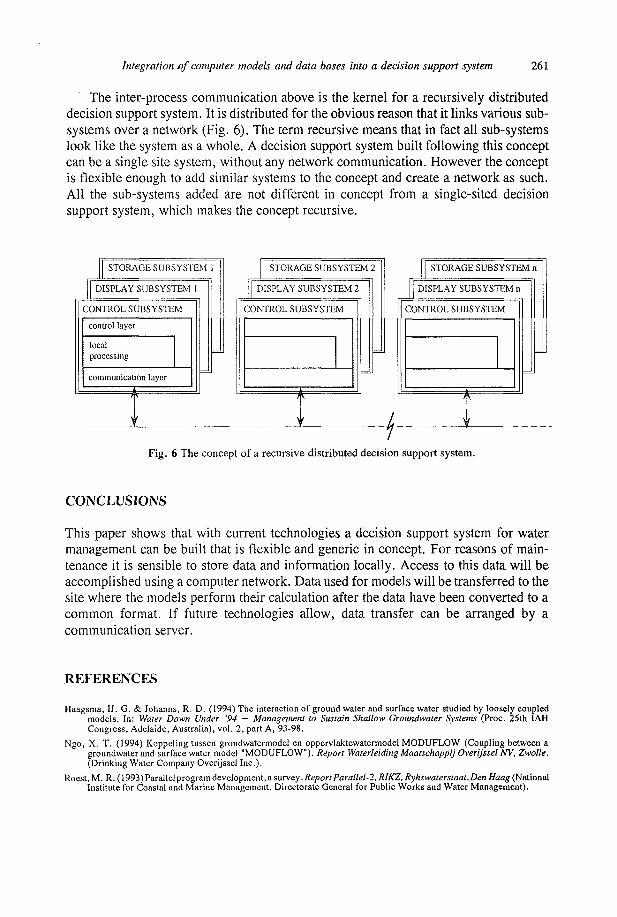
The inter-process communication above is the kernel for a recursively distributed decision support system. It is distributed for the obvious reason that it links various subsystems over a network (Fig. 6). The term recursive means that in fact all sub-systems look like the system as a whole. A decision support system built following this concept can be a single site system, without any network communication. However the concept is flexible enough to add similar systems to the concept and create a network as such. All the sub-systems added are not different in concept from a single-sited decision support system, which makes the concept recursive.
STORAGE SUBSYSTEM 1
DISPLAY SUBSYSTEM 1
CONTROL SUBSYSTEM
control layer
local processing
communication layer
STORAGE SUBSYSTEM 2
DISPLAY SUBSYSTEM 2
CONTROL SUBSYSTEM
STORAGE SUBSYSTEM n
DISPLAY SUBSYSTEM n
CONTROL SUBSYSTEM
Fig. 6 T h e concept of a recursive distributed decision support sys tem.
CONCLUSIONS
This paper shows that with current technologies a decision support system for water management can be built that is flexible and generic in concept. For reasons of maintenance it is sensible to store data and information locally. Access to this data will be accomplished using a computer network. Data used for models will be transferred to the site where the models perforin their calculation after the data have been converted to a common format. If future technologies allow, data transfer can be arranged by a communication server.
REFERENCES
Haagsma, IJ. G. & Johanns, R. D. (1994) The interaction of ground water and surface water studied by loosely coupled models. In: Water Down Under '94 — Management to Sustain Shallow Groundwater Systems (Proc. 25th IAH Congress, Adelaide, Australia), vol. 2, part A, 93-98.
Ngo, X. T. (1994) Koppeling tussen grondwatermodel en oppervlaktewatermodel MODUFLOW (Coupling between a groundwater and surface water model "MODUFLOW"). Report Waterleiding Maatschappij Overijssel NV, Zwolle. (Drinking Water Company Overijssel Inc.).
Roest, M. R. (1993) Parallel program development, a survey. Report Parallel-!, RIKZ, Ryhswaterstaat,Den Haag (National Institute for Coastal and Marine Management, Directorate General for Public Works and Water Management).

Modelling and Management of Sustainable Basin-scale Water Resource Systems (Proceedings of a Bouider Symposium, July 1995). IAHS Publ. no. 231, 1995. 263
GIS "hydromonitoring" and optimization model of enterprise water protection activity
ALEXANDER TSKHAI & SVETLANA SHIROKOVA Institute for Water and Environmental Problems, Siberian Branch of the Russian Academy of Sciences, Papanintsev Str. 105, Barnaul 656099, Russia
DMITRII KONEV, KONSTANTIN KOSHELEV & TATJANA TSKHAI Altai State Technical University, Lenina Str. 46, Barnaul 656099, Russia
Abstract Geographic Information System (GIS) "hydromonitoring" is elaborated for an assessment of the anthropogenic impact on water quality in a river basin. The results of GIS application for the urban region of the Upper Ob Basin in Siberia are shown in the report. The ecological-economic model of enterprise water protection activity was developed in accordance with present day Russian regulations. The results of its application for the enterprise of Barnaul (an industrial city near the Ob River) are presented.
INTRODUCTION
A management information system is developed for forecasting water quality in a river basin. It takes into consideration the basin's natural complexity and the economic mechanisms governing the water resources management.
The paper presents the results of the results of the application of the system. (a) GIS "hydromonitoring" for the Upper Ob River basin in the Altai region This
includes the tasks of data gathering, storing and processing of information on water quality. It provides for modelling the river ecosystem state, depending on different anthropogenic loads, and taking into consideration the river's self-purification capability. At present, certain experience in river hydrochemical regime modelling is accumulated (see, e.g. Shnoor etal., 1987). The simple variation of this approach is used in this research.
(b) Ecological-economic model of enterprise paying for its water pollution The most effective way to decrease the anthropogenic load is the introduction of a deterrent tax. These funds can then be used for development of environmentally safe technologies (Smith, 1994). The new environmental protection State law (The Law, 1992) provides this opportunity for environmental management in Russia. In accordance with this law the enterprise pays for its pollution out of profits. Therefore, in this research the optimal criterion is maximization of enterprise net profit. Formerly the optimization goal for Russian enterprises was to minimize the annual expenses for environmental protection. The simulation of different economic mechanisms corresponding to present day Russian regulations are discussed for the case study enterprise.
264 Alexander Tskhai et al.
GIS "HYDROMONITORING"
Data base
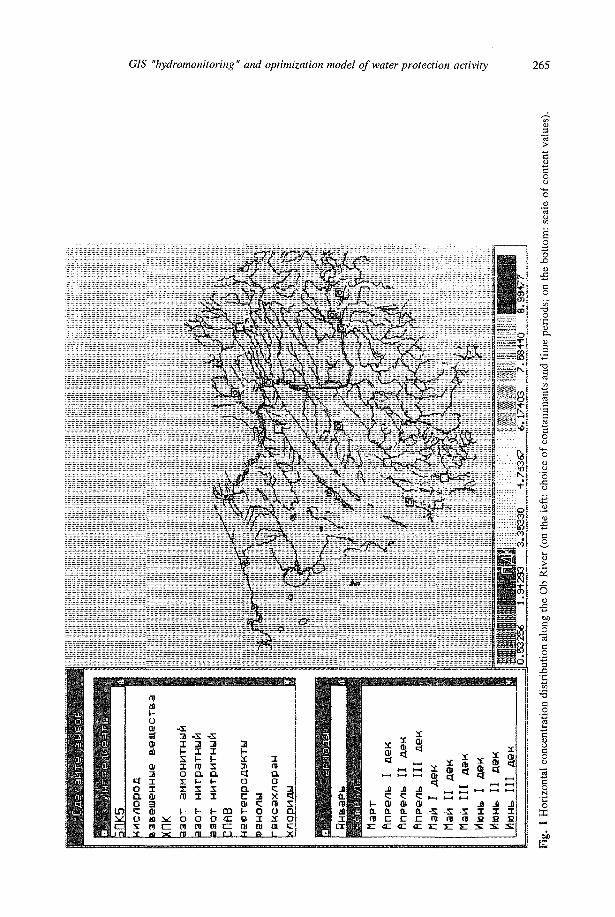
The main component of GIS "hydromonitoring" is the spatial data base with a graphical map interface. A geographic description of the Upper Ob Basin is shown in Fig. 1.
The Ob River basin is situated in southwestern Siberia. It occupies an area of 216 000 km2. The average annual runoff value is 52.8 km3. The geochemistry of the natural landscape defines background concentrations of contaminants being taken into account for long-term monitoring.
Economic activity of the Altai region population (more than two million inhabitants) is also one of the most important factors affecting water quality. The large industrial centres Barnaul, Biisk and Rubtsovsk are situated on the banks of the Upper Ob basin. The regional agriculture is a source of non-point pollution. It produces about 40 % of all Siberian grain, as well as a large volume of fodder crops and vegetables. Cattle breeding in the region is also important. These factors define the anthropogenic component of the river's hydrochemical regime.
The GIS interface allows for presentation of alphabetical information and graphical map data bases. Data base management system FoxPro, accessible to many Russian users, is used for this development. The structure of information reference forms for the system corresponds to Russian National Committee of Environmental Monitoring data base standards.
River water quality model
The hydraulic model component is based on a one-dimensional equation for quasi-steady state and non-uniform flow lateral inflow in a nonprismatic channel (Spitsin & Sokolova, 1990). The forecasts provided for 18 periods during the year, including every ten day interval during the flood season (April-June) and every month during the rest of the year.
The model of the channel consists of a sequence of reaches separated by cross-sections. The width of the cross-sections is calculated by means of a linear interpolation depending on the true water level. For this purpose measurements of present day river characteristics are used. Therefore it is assumed that the natural deformation of the channel is negligible. The channel bottom slope within every reach is assumed to be constant. First, the lateral inflow per unit length of channel is calculated by means of specified discharges in the cross-sections and the point tributaries (or agro-industrial waste). After that, in accordance with the continuity equation, the discharge distribution in nodal points of the calculated network is found. Finally the depth and true level in the final cross-section is determined using an empirical rating curve.
The spatial distribution of the channel depth (h), the area of the flow cross-section (w) and the mean discharge velocity (w) are determined using Euler's solution method for the set of dynamic equations.
The water quality model simulates the spatial distribution of values for 20 contaminants: (1) BOD, (2) DO, (3) total dissolved solids, (4) COD, (5) ammonia, (6) nitrite, (7) nitrate, (8) synthetic surface active matter, (9) oil pollution, (10) phenol, (11) hexachlorane, (12) chlorine, (13) sulphate, (14) magnesium, (15) calcium, (16) lindane,
GIS "hydromonhoring " and optimization model of water protection activity 265
'M 'it
I -,.i =11
•-.•",
I«l • " ? •
<:' :,» . 1 1
7£J
m ^ [
j n
d o a o c o X a:
la 1-O 01 3 <b tH
0! 2 I I 0) 3 0) a ^ B CZ
m x
•CE T X h 5 I o Î" y m i-o n «
-5 -S 3 3 3 I I 1-1- 1- Ï r? S 31 a a q 1- 1- O s s a I I C
* t- h m ^ o o <c » m m cz m il m o i
i rç a o
3 x 3 Ç (ï S O 0 CL X X O1
œ n c
s S « H H ï J J
ft « •»
>- n m D CL CL û. û.
J» -a _ r; >-. ~ ~ " " J J
•S - S -S I I I nj rç rç 2 S S C C
266 Alexander Tskhai et al.
(17) iron, (18) copper, (19) lead and (20) phosphate. The quasi-steady state one-dimensional model is defined as:
d(<2 * Q d dC, m
_ Z l 'i = JL(E*W*—'-) + w*Hi + G, (l> dx dx dx
where x is the longitudinal coordinate of the cross-section; Q is the rate of water discharge; C, is the concentration of the ith chemical compound (index i varies from 1 to 20) ; E is the coefficient of longitudinal dispersion ; //,- characterizes the rate of kinetic transformation for the /th chemical compound; and G( is the lateral load per unit length of the channel (the characteristic of non-point pollution sources).
An assumption of first order kinetics is used in the model. The form of dependencies Hj from hydrological characteristics and the values of non-conservative substances are given in Tskhai et al. (1994).
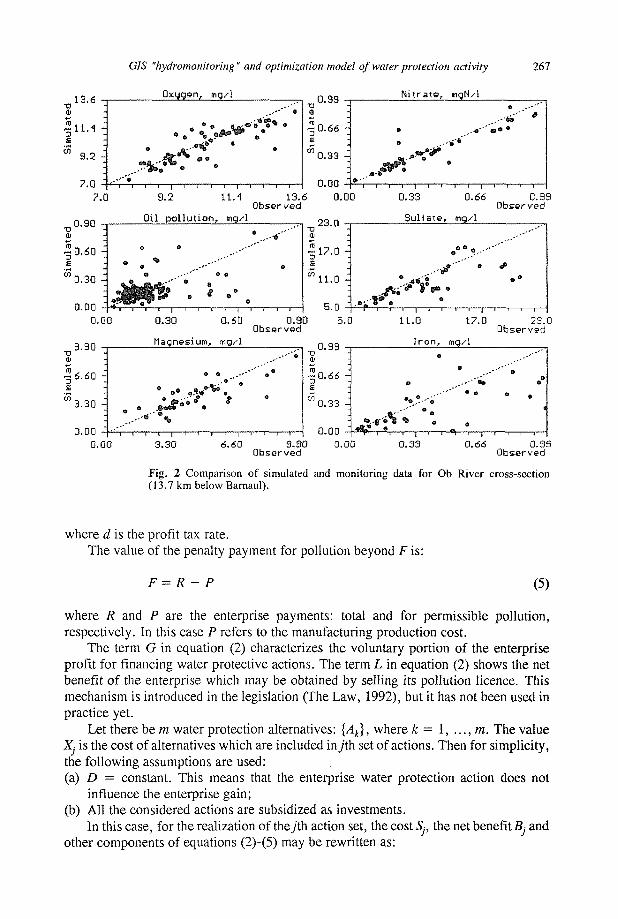
The analytical solution of the differential equation with corresponding initial and boundary conditions (1) is used for the calibration of the self-purification model. The observed hydrochemical data for the period 1984-1988 are used for the calibration. These data correspond to the Ob River reach limited by two cross-sections: 7 km above and 13.7 km below Barnaul city.
For simplicity we considered two assumptions in the simulation. First, distribution of pollution sources along the river part is uniform. Second, the pollution intensity is constant. This hypothesis is only a crude approximation of reality. The main pollution sources in this region are urban and industrial centres which diffuse waste along the river.
The unknown parameter values in equation (1) were estimated by the least squares method. The comparison of simulated and observed data for the chemical compounds is shown in Fig. 2.
OPTIMIZATION MODEL OF ENTERPRISE WATER PROTECTION ACTIVITY
Formulation of the model
Maximum of the net profit A is chosen as a criterion for the optimization. It represents the remains at the disposal of the enterprise after paying for water pollution and water protection:
A=B-N-F-G + L (2)
Here B is the net benefit to the enterprise, which is calculated as:
B = D - S (3)
where D represents benefits and S the production cost; N is the profit tax value, which is estimated as:
N = d*B (4)
GIS "hydromonitoring " and optimization model of water protection activity 267
•o .13.6
11.4
9.2
7.0
Oxggen, mg/ i
« / \*f0J*m\*
«ft A . • ' '«%»
0 99 _,
0.66 -_
0.33 -_
0.00 - — i
N i t r a t e , ngN/ l
0 . « "
i i — i ï i i r i i
9
— i — , — f -—1— 7.0 9.2
Oi l p o l l u t i o n , mqA
11.4 13.6 Observed
X)
.2 0 . 6 0 -£
<°0.30-
0.00 -
e
%S . *
• * - r = T
o o
% 0 m ..•''
£fe . A , i i ,
<S
,--'" .,-"'**
© 0
a
* S° 1 1 1 1
.--«""'
0
.,,,,, .. ,
0.00
23.0
0.33
SuUa te , mq/1
0.66 0.99 Observed
0.00
9.90
0.30 O.60 0.90 Observed
Magnesium, itig/1
0.00 3.30 6.60 9.90 Observed
0.D0 0.33 0.66 0.39 Observed
Fig. 2 Comparison of simulated and monitoring data for Ob River cross-section (13.7 km below Barnaul).
where d is the profit tax rate. The value of the penalty payment for pollution beyond F is:
F = R - P (5)
where R and P are the enterprise payments: total and for permissible pollution, respectively. In this case P refers to the manufacturing production cost.
The term G in equation (2) characterizes the voluntary portion of the enterprise profit for financing water protective actions. The term L in equation (2) shows the net benefit of the enterprise which may be obtained by selling its pollution licence. This mechanism is introduced in the legislation (The Law, 1992), but it has not been used in practice yet.
Let there be m water protection alternatives: {Ak}, where k = 1, ..., m. The value Xj is the cost of alternatives which are included iny'th set of actions. Then for simplicity, the following assumptions are used: (a) D = constant. This means that the enterprise water protection action does not
influence the enterprise gain; (b) All the considered actions are subsidized as investments.
In this case, for the realization of the/th action set, the cost Sj, the net benefit Bj and other components of equations (2)-(5) may be rewritten as:
268 Alexander Tskhai et al.
Sj = 5(0) - P(0) + Pj + n-Xj Bj = D - Sj (6)
where 5(0) and P(0) are the production cost and enterprise payment for permissible pollution in the absence of water protective actions respectively; n is the coefficient of the depreciation charges, taking into account the fixed assets and investments; P- is the payment for permissible pollution after the realization ofy'th actions set:
Pj = E vij (7)
where VtJ = {0, if (M,.(0) - MtJ) < 0; 2 , (^(0) - Mtj), if 0 < (M,(0) - Mv) < Mni; and Qt*Mni, if (M,.(0) - Mtj) > Mj.
Here M,-(0) is the real pollution mass of the /th compound in the absence of actions; Mni is the maximum permissible norm of enterprise pollution mass for the /th compound; Qj is the corresponding differential payment rate for pollution for the /th compound within the maximum permissible limit. The portion of the total pollution mass exceeding the norm Mni is paid at the Ki rate. The 5Kt rate is applied to the portion exceeding Msi. The value My characterizes the decrease of the /th compound of pollution mass as a result of the realization of they'th actions set.
The expression for the profit tax under permissible Law privilege can be written as:
Nj = d[Bj - min (0.3 X} ; 0.5 5,)] (8)
The term F- is the cost of beyond permissible pollution. It is calculated as:
Fj = mxnlWjj,c{BrNJ) (9)
where Wtj = 0, if (A/,-(0) - M,J) < Msi, K,(M,(0) - Mni), ifM,,(0) - M,j) < Msi; and Ki(Msi - M J + 5A:,.(M,.(0) - MtJ - Msi), if Msi < (M,(0) - Mtj). Here c is the maximum level of payment for beyond-permissible pollution as percent of the net profit. In this case it is essential that the enterprise activities not be terminated:
Fj <Bj- Nj (10)
The level of financing of water protection activities of the enterprise limits its possible actions realization. This condition is written as:
Xj < / + T + n *Xj + G (11)
where / is the budgetary subsidy; and T is the receipts from territorial ecological foundations.
The third term in the right hand side part of the inequality equation (11) characterizes the depreciation charges included in production costs associated with the water protection operations.
RESULTS AND DISCUSSION
The change of the optimum actions set for different alternative subsidies is considered.
GIS "hydromonitoring " and optimization model of water protection activity 269
This question is studied on one of Barnaul chemical enterprises data bases. The real payment rates for the pollution are used. These rates are prescribed by Altai local authorities in 1991. The information on real actions, their efficiency and expenses for their implementation at the 1989 price is used.
The mechanism for distribution of the territorial ecological foundation resources has not been regulated yet. These foundation resources are formed, mainly from the enterprise payments for environmental pollution. In calculations, three alternative principles of subsidies from territorial foundations were used: (a) The proportion principle The value Tin equation (11) is estimated on the basis that
the territorial foundation returns a fixed percent of R to the enterprise for implementation of protection plans.
(b) The "abnormal" compound principle In specific cases the subsidy may even exceed R. In this case study, when the zinc content is "abnormal", this principle is used. It is assumed that territorial foundation will subsidize only two actions for decreasing zinc gross pollution mass in the waste water. In this case the enterprise is provided with its profit to finance the implementation of all other protection actions. Alternatively the enterprise has to pay more for beyond-permissible water pollution.
(c) No subsidy principle In this case the set of the enterprise "regulators" is used to help the enterprise implement its water protection plans in order to maximize the net profit. Here, payment rates and pollution norm are considered as "regulators". The calculations showed that the most effective policies, both for decreasing the
pollution mass and for the improvement in economy of territorial foundation resources, is the selective support of specific actions in combination with corresponding "regulators".
Our research considers the order of licensing as a mechanism of enterprise selling its right for pollution to other organizations. To increase the seller's interest the expression for net profit in equation (10) should be given with the following definition
fori/
LJ = l*lZu ( 1 2) i
where / is the coefficient showing which part of proceeds of license sales forms net income of an enterprise; and
Ztj = tmx(0, Q^M^-My) (13)
The situation when the territorial foundation with current information becomes a mediator between participants bargaining is considered. In this case, the foundation obtains the income for its mediator role. This procedure guarantees the enterprise wishing to sell the licence. Thus / is the given constant in equation (12). The mechanism with an element of administrative participation in the redistribution of the pollution rights is used in our simulation.
Our consideration clearly shows that the use of a licensing mechanism gives the enterprise the opportunity to find the resources for additional water protection.

270 Alexander Tskhai et al.
REFERENCES
Behrendt.H. &Bohme,M. (1992) Point and diffuse loads of selected pollutants in the Rhine River and its tributaries. HASA, Laxenburg, Austria, Working Paper 92-15.
Shnoor, J. L., Sato, C , McKetchnie, D. & Sahoo, D. (1987) Processes, coefficients and models for simulating toxic organics and heavy metals in surface waters. EPA/600/3-87/015, US EPA, Athens, Georgia, USA.
Smith, M. G. (1994) The state of the art in economic instruments and institutions for water quality management. In: Remediation and Management of Degraded River Basins with Emphasis on Central and Eastern Europe (Prep. NATO Advanced Research Workshop, IIASA, Laxenburg, Austria), 1-27.
Spitsin, 1. P. & Sokolova, V. A. (1990) General and River Hydraulics (in Russian). Gidrometeoizdat, Leningrad.
The Law "About Environmental Protection" (1992) (in Russian). Respublika. Moscow.
Tskhai, A. A., Agcikov, V. Yu., Koshelcv.K. B., Leitcs.M. A. & Tskhai, T. V. (1994) Models for water monitoring and optimization of enterprise water protectiveactivity in present-day conditions. In: Water: Ecology & Technology (Proc. Int. Congress, Moscow), 161-170.

3 Sustainability in Modelling and Management of Water Resource Systems: Relevant Issues

Modelling and Management of Sustainable Basin-scale Water Resource Systems (Proceedings of a Boulder Symposium, July 1995). 1AHS Publ. no. 231, 1995. 273
Interactive management of a conjunctive use system considering quality aspects
MAX H. A. BILLIB, PETER W. BOOCHS, ANDREAS MATHEJA & BERND RUSTEBERG Institute of Water Resources Management, Hydrology and Agricultural Hydraulic Engineering, University of Hanover, Appelstr. 9A, D-30167 Hanover, Germany
Abstract A multi-step modelling approach is presented for a multi-objective decision problem of a conjunctive use system. The system includes a surface water reservoir with hydropower plant, a groundwater reservoir, an artificial recharge area and pumping fields as well as a channel distribution system for five irrigation areas. The water is conjunctively used for irrigation, hydro-energy production and domestic and industrial water supply. Based on a long-term analysis of the hydrological system, an interactive procedure — using the Incremental Dynamic Solving Technique, groundwater flow and solute transport simulation — is introduced for selecting preferred decisions. The applicability of the approach is illustrated by a case study of the Rio San Juan in Argentina.
INTRODUCTION
Efficient management of water resources is required to increase and sustain crop productivity in arid areas. An optimum utilization of the surface and groundwater resources is essential when demands are increasing and available resources are limited.
The systems approach has long been used in analysing conjunctive use problems. Several approaches, such as linear programming, dynamic programming, simulation, hierarchical or multi-level optimization have been used (e.g. Buras, 1963; Young & Bredehoeft, 1972; Haimes &Dreizen, 1977; Ontzetal, 1991). A multi-step modelling approach is presented for a multi-objective decision problem of a conjunctive use system which is affected by salinization and groundwater quality problems.
SYSTEM DESCRIPTION
The management model developed is applied to the conjunctive use system of Rio San Juan in Argentina (Fig. 1). The system includes a surface water reservoir with hydro-power plant, a groundwater reservoir, artificial recharge areas and pumping fields, as well as a complex channel distribution system for five irrigation areas, which consists of secondary and tertiary canals.
The water resources are used conjunctively for irrigation, hydro-energy and water supply of the city. The main hydrological characteristic of the project is its situation in an arid climate where annual precipitation is very low and nearly all runoff is produced
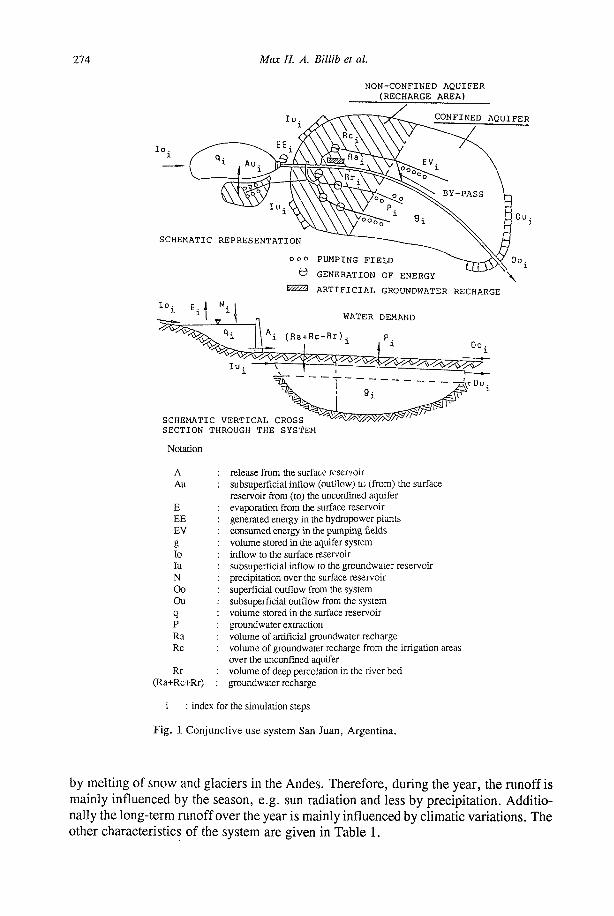
274 Max H. A. Billib et al.
NON-CONFINED AQUIFER (RECHARGE AREA)
SCHEMATIC REPRESENTATION
lo, E.| «il
ooo PUMPING FIELD
C? GENERATION OF ENERGY
V*2 ARTIFICIAL GROUNDWATER RECHARGE
Ai (Ra+Rc+Rr),
HATER DEMAND
P.
S^fe^ Oo.
T" 9i SCHEMATIC VERTICAL CROSS '^ 55?5^^ SECTION THROUGH THE SYSTEM
Notation
A Au
E EE EV g lo lu N Oo Ou q p Ra Re
Rr (Ra+Rc+Rr)
release from the surface reservoir subsuperficial inflow (outflow) to (from) the surface reservoir from (to) the unconfined aquifer evaporation from the surface reservoir generated energy in the hydropower plants consumed energy in the pumping fields volume stored in the aquifer system inflow to the surface reservoir subsuperficial inflow to the groundwater reservoir precipitation over the surface reservoir superficial outflow from the system subsuperficial outflow from the system volume stored in the surface reservoir groundwater extraction volume of artificial groundwater recharge volume of groundwater recharge from the irrigation areas over the unconfined aquifer volume of deep percolation in the river bed groundwater recharge
i : index for the simulation steps
Fig. 1 Conjunctive use system San Juan, Argentina.
by melting of snow and glaciers in the Andes. Therefore, during the year, the runoff is mainly influenced by the season, e.g. sun radiation and less by precipitation. Additionally the long-term runoff over the year is mainly influenced by climatic variations. The other characteristics of the system are given in Table 1.
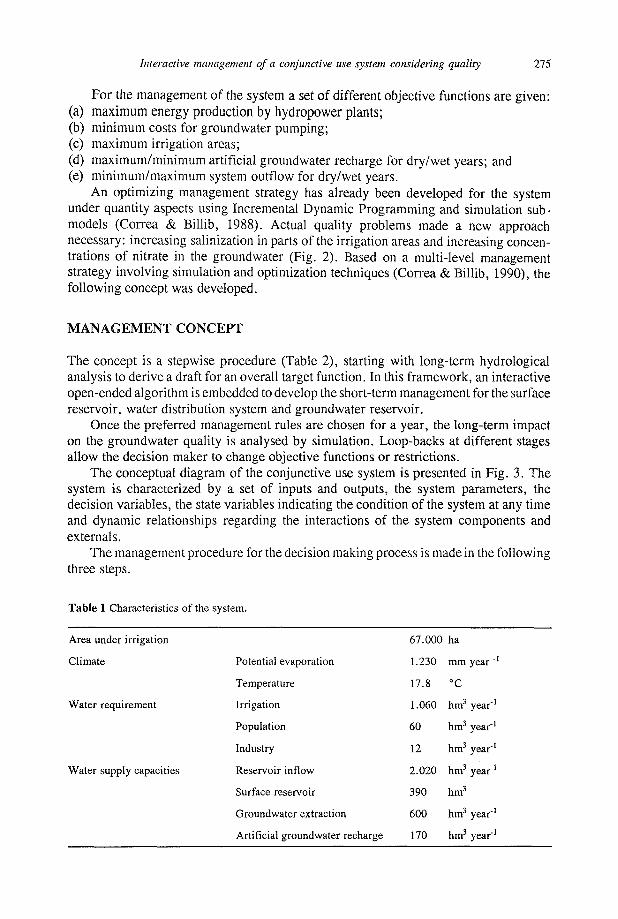
Interactive management of a conjunctive use system considering quality 275
For the management of the system a set of different objective functions are given: (a) maximum energy production by hydropower plants; (b) minimum costs for groundwater pumping; (c) maximum irrigation areas; (d) maximum/minimum artificial groundwater recharge for dry/wet years; and (e) minimum/maximum system outflow for dry/wet years.
An optimizing management strategy has already been developed for the system under quantity aspects using Incremental Dynamic Programming and simulation submodels (Correa & Billib, 1988). Actual quality problems made a new approach necessary: increasing salinization in parts of the irrigation areas and increasing concentrations of nitrate in the groundwater (Fig. 2). Based on a multi-level management strategy involving simulation and optimization techniques (Correa & Billib, 1990), the following concept was developed.
MANAGEMENT CONCEPT
The concept is a stepwise procedure (Table 2), starting with long-term hydrological analysis to derive a draft for an overall target function. In this framework, an interactive open-ended algorithm is embedded to develop the short-term management for the surface reservoir, water distribution system and groundwater reservoir.
Once the preferred management rules are chosen for a year, the long-term impact on the groundwater quality is analysed by simulation. Loop-backs at different stages allow the decision maker to change objective functions or restrictions.
The conceptual diagram of the conjunctive use system is presented in Fig. 3. The system is characterized by a set of inputs and outputs, the system parameters, the decision variables, the state variables indicating the condition of the system at any time and dynamic relationships regarding the interactions of the system components and externals.
The management procedure for the decision making process is made in the following three steps.
Table 1 Characteristics of the system.
Area under irrigation
Climate
Water requirement
Water supply capacities
Potential evaporation
Temperature
Irrigation
Population
Industry
Reservoir inflow
Surface reservoir
Groundwater extraction
Artificial groundwater recharge
67.000 ha
1.230
17.8
1.060
60
12
2.020
390
600
170
mm year "l
°C
hm3 year"1
hm3 year"1
hm3 year"1
hm3 year"1
hm3
hm3 year"1
hm3 year"1
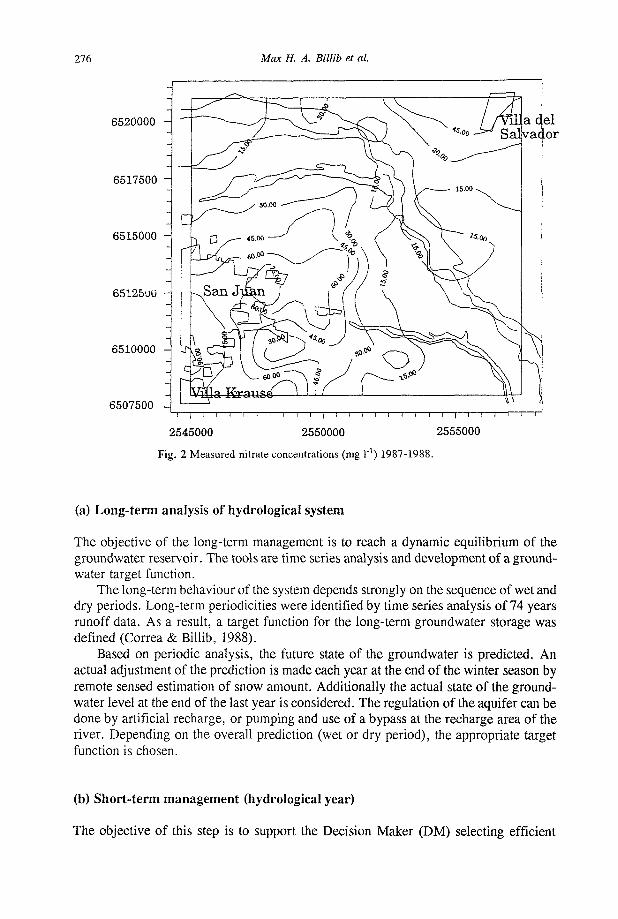
276 Max H. A. Billib et al.
i — I — i — i — i — i — i — i — i — I — i — | — i — i — i — i — i — i — i — i — i — | — I — I — i — i — i — r
2545000 2550000 2555000
Fig. 2 Measured nitrate concentrations (mg l"1) 1987-1988.
(a) Long-term analysis of hydrological system
The objective of the long-term management is to reach a dynamic equilibrium of the groundwater reservoir. The tools are time series analysis and development of a groundwater target function.
The long-term behaviour of the system depends strongly on the sequence of wet and dry periods. Long-term periodicities were identified by time series analysis of 74 years runoff data. As a result, a target function for the long-term groundwater storage was defined (Correa & Billib, 1988).
Based on periodic analysis, the future state of the groundwater is predicted. An actual adjustment of the prediction is made each year at the end of the winter season by remote sensed estimation of snow amount. Additionally the actual state of the groundwater level at the end of the last year is considered. The regulation of the aquifer can be done by artificial recharge, or pumping and use of a bypass at the recharge area of the river. Depending on the overall prediction (wet or dry period), the appropriate target function is chosen.
(b) Short-term management (hydrological year)
The objective of this step is to support the Decision Maker (DM) selecting efficient
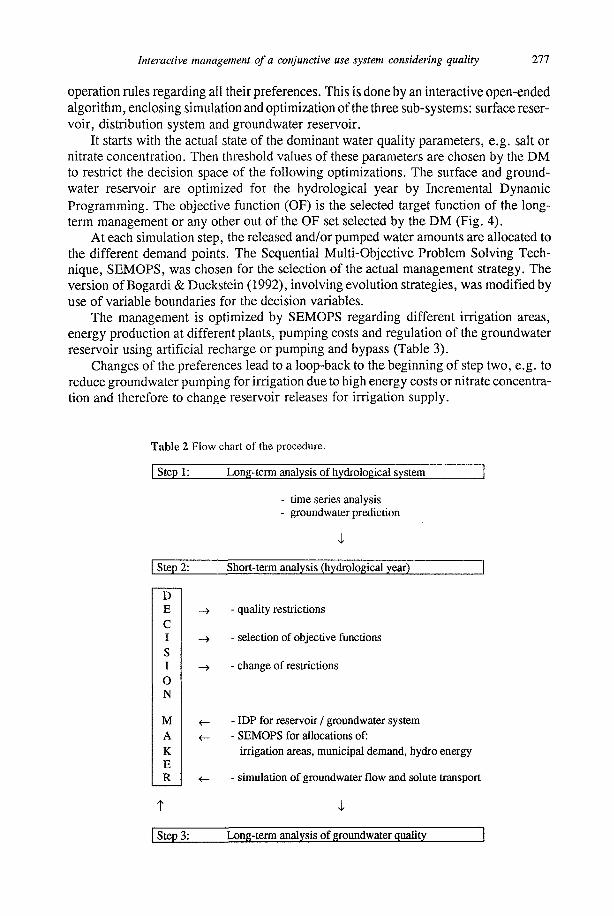
Interactive management of a conjunctive use system considering quality 277
operation rules regarding all their preferences. This is done by an interactive open-ended algorithm, enclosing simulation and optimization of the three sub-systems: surface reservoir, distribution system and groundwater reservoir.
It starts with the actual state of the dominant water quality parameters, e.g. salt or nitrate concentration. Then threshold values of these parameters are chosen by the DM to restrict the decision space of the following optimizations. The surface and groundwater reservoir are optimized for the hydrological year by Incremental Dynamic Programming. The objective function (OF) is the selected target function of the long-term management or any other out of the OF set selected by the DM (Fig. 4).
At each simulation step, the released and/or pumped water amounts are allocated to the different demand points. The Sequential Multi-Objective Problem Solving Technique, SEMOPS, was chosen for the selection of the actual management strategy. The version of Bogardi & Duckstein (1992), involving evolution strategies, was modified by use of variable boundaries for the decision variables.
The management is optimized by SEMOPS regarding different irrigation areas, energy production at different plants, pumping costs and regulation of the groundwater reservoir using artificial recharge or pumping and bypass (Table 3).
Changes of the preferences lead to a loop-back to the beginning of step two, e.g. to reduce groundwater pumping for irrigation due to high energy costs or nitrate concentration and therefore to change reservoir releases for irrigation supply.
Table 2 Flow chart of the procedure.
| Step 1: Long-term analysis of hydrological system
time series analysis groundwater prediction
i
\ Step 2: Short-term analysis (hydrological year)
D E C I S I o N
M A K E R
-> - quality restrictions
—> - selection of objective functions
—> - change of restrictions
<_ - IDP for reservoir / groundwater system «_ - SEMOPS for allocations of:
irrigation areas, municipal demand, hydro energy
<— - simulation of groundwater flow and solute transport
I
Step 3: Long-term analysis of groundwater quality
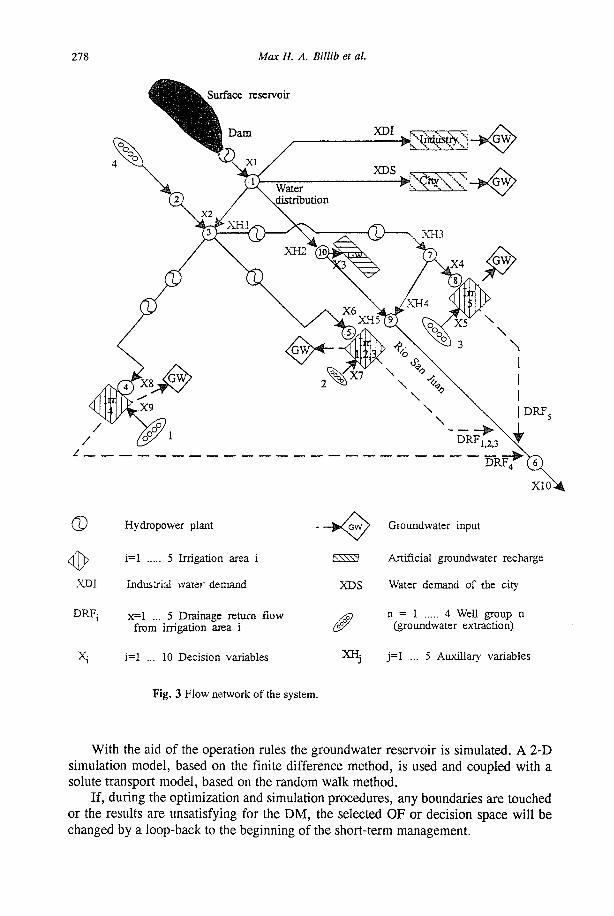
278 Max H. A. Billib et al.
Surface reservoir
>T"I usiJr)Ol -XGW>
>jNfo^;\i -xpy>
QJ Hydropower plant
i=l 5 Irrigation area i
XDI Industrial water demand
DRFj x=i 5 Drainage return flow from irrigation area i
Xj i=l ... 10 Decision variables
- ^ / G W / Groundwater input
N W \ I Artificial groundwater recharge
XDS Water demand of the city
yQ n = 1 4 Well group n (£/ (groundwater extraction)
XHj j=i ... 5 Auxiliary variables
Fig. 3 Flow network of the system.
With the aid of the operation rules the groundwater reservoir is simulated. A 2-D simulation model, based on the finite difference method, is used and coupled with a solute transport model, based on the random walk method.
If, during the optimization and simulation procedures, any boundaries are touched or the results are unsatisfying for the DM, the selected OF or decision space will be changed by a loop-back to the beginning of the short-term management.
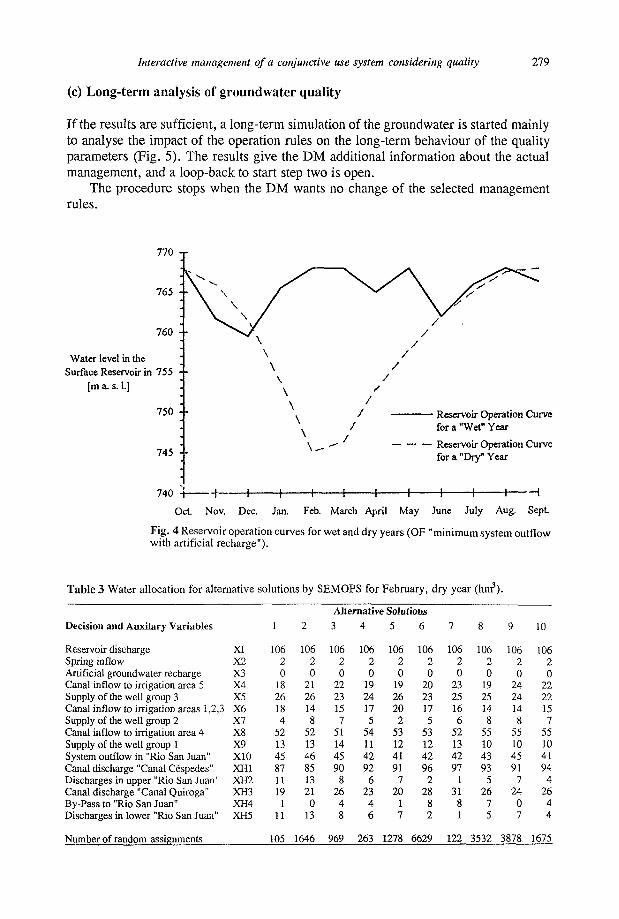
Interactive management of a conjunctive use system considering quality 279
(c) Long-term analysis of groundwater quality
If the results are sufficient, a long-term simulation of the groundwater is started mainly to analyse the impact of the operation rules on the long-term behaviour of the quality parameters (Fig. 5). The results give the DM additional information about the actual management, and a loop-back to start step two is open.
The procedure stops when the DM wants no change of the selected management rules.
770
765
760 -•
Water level in the Surface Reservoir in 755
[m a. s. 1.]
750
745 --
Reservoir Operation Curve for a "Wet" Year
740
Oct Nov. Dec. Jan. Feb. March April May June July Aug. Sept.
Fig. 4 Reservoir operation curves for wet and dry years (OF "minimum system outflow with artificial recharge").
Table 3 Water allocation for alternative solutions by SEMOPS for February, dry year (hm3).
Decision and Auxilary Variables
Reservoir discharge Spring inflow Artificial groundwater recharge Canal inflow to irrigation area 5 Supply of the well group 3 Canal inflow to irrigation areas 1,2,3 Supply of the well group 2 Canal inflow to irrigation area 4 Supply of the well group 1 System outflow in "Rio San Juan" Canal discharge "Canal Céspedes" Discharges in upper "Rio San Juan" Canal discharge "Canal Quiroga" By-Pass to "Rio San Juan" Discharges in lower "Rio San Juan"
Number of random assignments
XI X2 X3 X4 X5 X6 X7 X8 X9 X10 XH1 XH2 XH3 XH4 XH5
1
106 2 0
18 26 18 4
52 13 45 87 11 19
1 11
105
2
106 2 0
21 26 14 8
52 13 46 85 13 21
0 13
1646
Alternative Solutions 3
106 2 0
22 23 15 7
51 14 45 90
8 26 4 8
969
4
106 2 0
19 24 17 5
54 11 42 92
6 23 4 6
263
5
106 2 0
19 26 20 2
53 12 41 91
7 20
1 7
1278
6
106 2 0
20 23 17 5
53 12 42 96 2
28 8 2
6629
7
106 2 0
23 25 16 6
52 13 42 97
1 31
8 1
122
8
106 2 0
19 25 14 8
55 10 43 93
5 26
7 5
3532
9
106 2 0
24 24 14 8
55 10 45 91
7 24
0 7
3878
10
106 2 0
22 22 15 7
55 10 41 94 4
26 4 4
1675
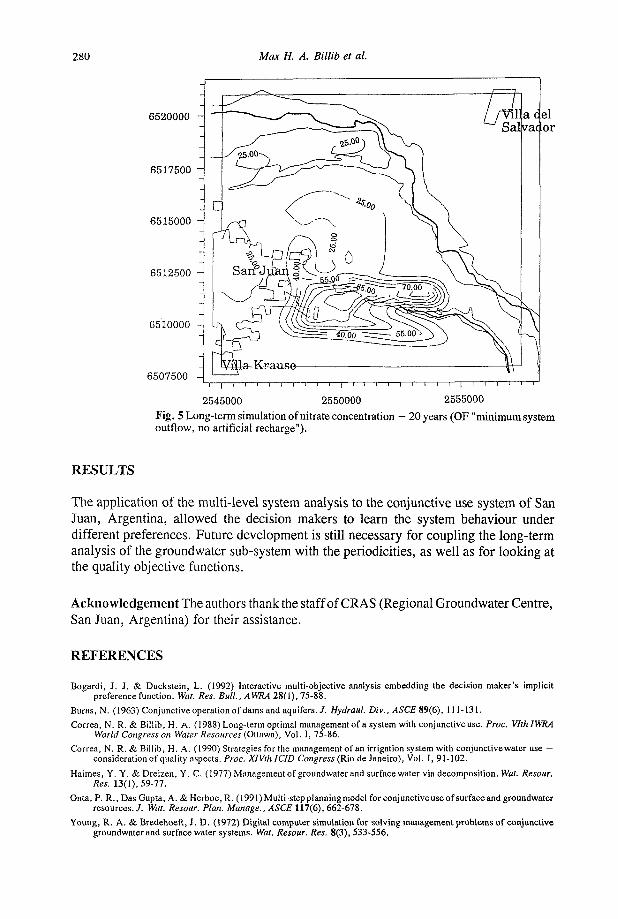
280 Max H. A. Billib et al.
6520000
6517500
6515000 -
6512500 -
6510000
6507500 -
2545000 2550000 2555000 Fig. 5 Long-term simulation of nitrate concentration - 20 years (OF "minimum system outflow, no artificial recharge").
RESULTS
The application of the multi-level system analysis to the conjunctive use system of San Juan, Argentina, allowed the decision makers to learn the system behaviour under different preferences. Future development is still necessary for coupling the long-term analysis of the groundwater sub-system with the periodicities, as well as for looking at the quality objective functions.
Acknowledgement The authors thank the staff of CRAS (Regional Groundwater Centre, San Juan, Argentina) for their assistance.
REFERENCES
Bogardi, J. J. & Duckstein, L. (1992) Interactive multi-objective analysis embedding the decision maker's implicit preference function. Wat. Res. Bull.,AWRA 28(1), 75-88.
Buras, N. (1963) Conjunctive operation of dams and aquifers. J. Hydraul. Div., ASCE 89(6), 111-131.
Correa, N. R. & Billib, H. A. (1988) Long-term optimal management of a system with conjunctive use. Proc. VhhIWRA World Congress on Water Resources (Ottawa), Vol. I, 75-86.
Correa, N. R. & Billib, H. A. ( 1990) Strategies for the management of an irrigation system with conjunctive water use — consideration of quality aspects. Proc. XlVth ICID Congress (Rio de Janeiro), Vol. I, 91-102.
Haimes, Y. Y. & Dreizen, Y. C. (1977) Management of groundwater and surface water via decomposition. Wat. Resour. Res. 13(1), 59-77.
Onta.P. R., Das Gupta, A. &Herboe,R. (1991) Multi-step planning model for conjunctive use of surfaceand groundwater resources. J. Wat. Resour. Plan. Manage., ASCE 117(6), 662-678.
Young, R. A. & Bredehoeft, J. D. (1972) Digital computer simulation for solving management problems of conjunctive groundwater and surface water systems. Wat. Resour. Res. 8(3), 533-556.
Modelling and Management of Sustainable Basin-scale Water Resource Systems (Proceedings of a Boulder Symposium, July 1995). IAHS Publ. no. 231, 1995. 281
A demand management policy dictated by resource availability (with reference to an existing river system)
A. J . TOLLOW Department of Civil Engineering, University of Durban, Box 684, Kloof 3640, Natal, South Africa
Abstract An existing compact river basin (4400 km2) is used for formulating water resources operating policies. As well as major industrial components of demand (more than 50%) there are many informal settlements without formal reticulation. As a result, a high percentage of "domestic" water is used at the place of work. It is becoming necessary to manage demand so that the available resources are not exceeded. Management of domestic and agricultural demand is relatively straightforward. The main difficulty in curtailing demand occurs with the industrial user. However, effluent management from an individual industry, when combined with a water recycling policy, is a useful means of encouraging efficient use of scarce resources. Although there are a number of difficulties to overcome, it is feasible to extend the concept of infinite recycling to the general supply of water. The basic equations are developed so that methods of solution may be derived for the various components. Different techniques are required to satisfy the aspirations of the different categories of users. The environment needs to be considered when policies for water supply and effluent disposal are formulated.
additional cost of recycling; capital and running costs of providing storage reservoirs; cost of providing "fresh water"; cost of treating and recycling; penalty cost of unsatisfied demand; pumping cost of abstracting water from rivers; cost of treating "fresh water"; cost of treating effluent before discharge; cost of pumping the stored water to treatment works; cost of treating the recycled water; cost of reticulating water (capital & running); cost of treating reclaimed water to potable standard; cost of treating the effluent; total or maximum demand; "fresh water"; "recycled" water;
NOTATION
AC1R
CCS CIF
CIR
CVD CWP1R
CWTF
CWTpp CWTPIR
CWTR
eWTw CWTRAW CWTm
h
A. J. Tollow
evaporative losses from maturation ponds, etc.; losses in a river system; losses in a large raw water storage reservoir; losses in potable water reticulation system; losses in sewers; losses when treating water to potable quality; losses in reclamation works; probable natural inflow into Inanda Dam; probable natural inflow into Midmar Dam; probable natural inflow into Albert Falls; storage volume in each of the above three dams; and quantity of water available;
INTRODUCTION
The Umgeni River basin (4400 km2), Fig. 1, consists of two major demand areas of Durban and Pietermaritzburg, and three major impounding reservoirs, Midmar (177 M m3) and Albert Falls (289 M m3) in series and Inanda (225 M m3), which relies on a major tributary for most of its yield. In addition, there is an inter-basin transfer into Midmar Reservoir. This sub-tropical region of South Africa on the western fringes of the Indian Ocean has a predominantly summer rainfall pattern and forms a compact system in the most densely populated part of KwaZulu Natal Province. Yields have been assessed (Tollow, 1989b) and a linear optimization technique has been developed (Tollow, 1991). Using this information as a guide, concepts of management of the "demand", rather than allocating resources to meet an ever increasing demand, are being formulated (Tollow, 1994).
Characteristics of demand
Water use in the region is split into four distinct components: (a) agriculture, which is subdivided into:
(i) irrigation; (ii) other uses such as livestock watering.
(b) industry; (c) domestic use; and (d) ecological requirements such as in river demands.
In the Umgeni , the irrigation demand is relatively small. Both irrigation and other needs are often met by small on-farm storage dams. Industry takes over 5 0 % of the potable supply and domestic users take the balance (McLeod, 1983). However , there are many rural areas adjacent to the main conurbations which have an inadequate water supply, resulting in industry using a greater volume of water for the "domestic purposes" of its employees. Many firms also provide both protective and general clothing, which tends to be laundered within the industrial complex. Showers also tend to be heavily used and one local construction feature on most premises is the provision of dedicated washing and shower facilities for the workers . There is thus a tendency for
282
LE, LRn
LSsl
LT}
LT}
LW-t
LW,
w
RAF
RAW
TF
PI; PI; PI S VA
TR
UD1
UM2
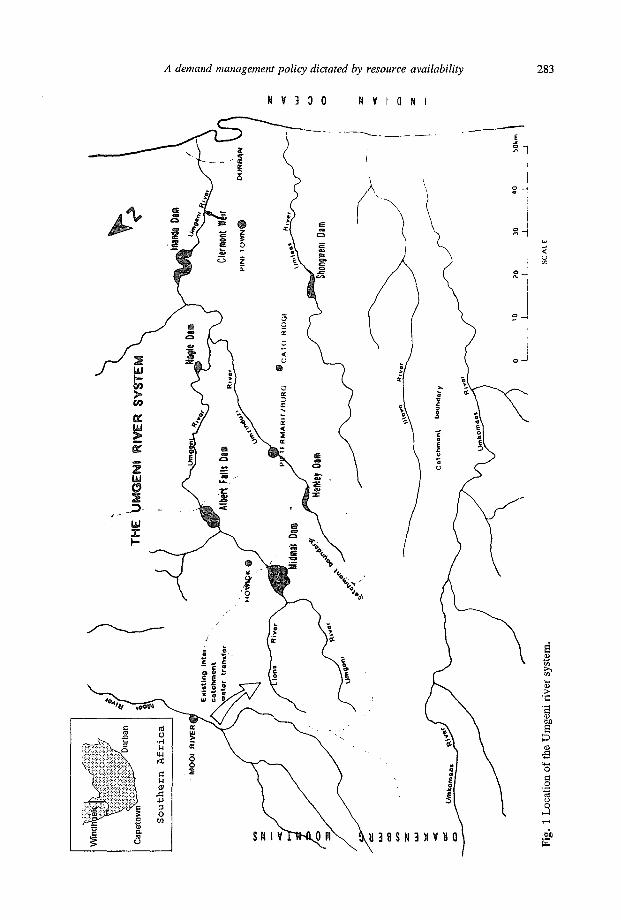
A demand management policy dictated by resource availability
N V 3 0 0 N V I Q N I
283
00
s
a BO
E
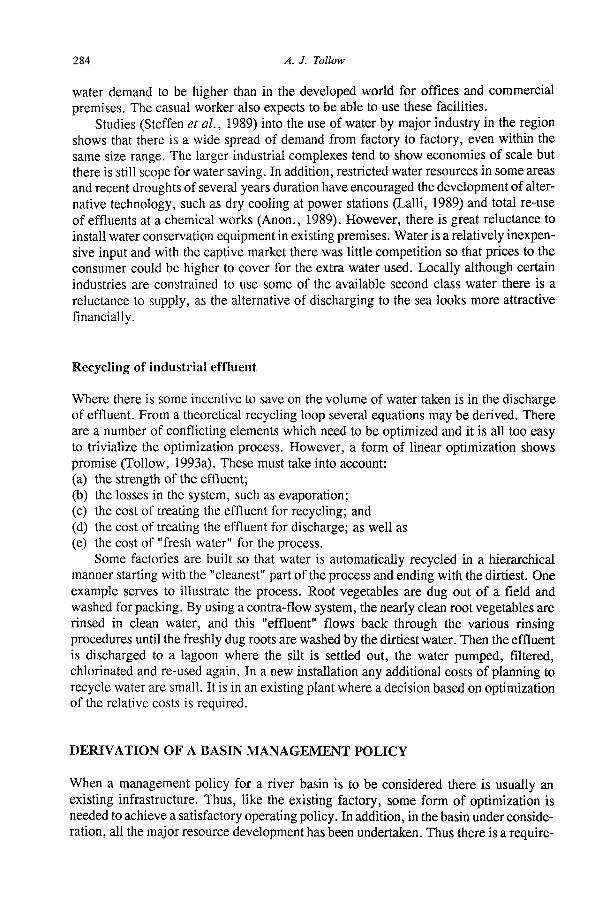
284 A. J. Tollow
water demand to be higher than in the developed world for offices and commercial premises. The casual worker also expects to be able to use these facilities.
Studies (Steffen et al, 1989) into the use of water by major industry in the region shows that there is a wide spread of demand from factory to factory, even within the same size range. The larger industrial complexes tend to show economies of scale but there is still scope for water saving. In addition, restricted water resources in some areas and recent droughts of several years duration have encouraged the development of alternative technology, such as dry cooling at power stations (Lalli, 1989) and total re-use of effluents at a chemical works (Anon., 1989). However, there is great reluctance to install water conservation equipment in existing premises. Water is a relatively inexpensive input and with the captive market there was little competition so that prices to the consumer could be higher to cover for the extra water used. Locally although certain industries are constrained to use some of the available second class water there is a reluctance to supply, as the alternative of discharging to the sea looks more attractive financially.
Recycling of industrial effluent
Where there is some incentive to save on the volume of water taken is in the discharge of effluent. From a theoretical recycling loop several equations may be derived. There are a number of conflicting elements which need to be optimized and it is all too easy to trivialize the optimization process. However, a form of linear optimization shows promise (Tollow, 1993a). These must take into account: (a) the strength of the effluent; (b) the losses in the system, such as evaporation; (c) the cost of treating the effluent for recycling; and (d) the cost of treating the effluent for discharge; as well as (e) the cost of "fresh water" for the process.
Some factories are built so that water is automatically recycled in a hierarchical manner starting with the "cleanest" part of the process and ending with the dirtiest. One example serves to illustrate the process. Root vegetables are dug out of a field and washed for packing. By using a contra-flow system, the nearly clean root vegetables are rinsed in clean water, and this "effluent" flows back through the various rinsing procedures until the freshly dug roots are washed by the dirtiest water. Then the effluent is discharged to a lagoon where the silt is settled out, the water pumped, filtered, chlorinated and re-used again. In a new installation any additional costs of planning to recycle water are small. It is in an existing plant where a decision based on optimization of the relative costs is required.
DERIVATION OF A BASIN MANAGEMENT POLICY
When a management policy for a river basin is to be considered there is usually an existing infrastructure. Thus, like the existing factory, some form of optimization is needed to achieve a satisfactory operating policy. In addition, in the basin under consideration, all the major resource development has been undertaken. Thus there is a require-
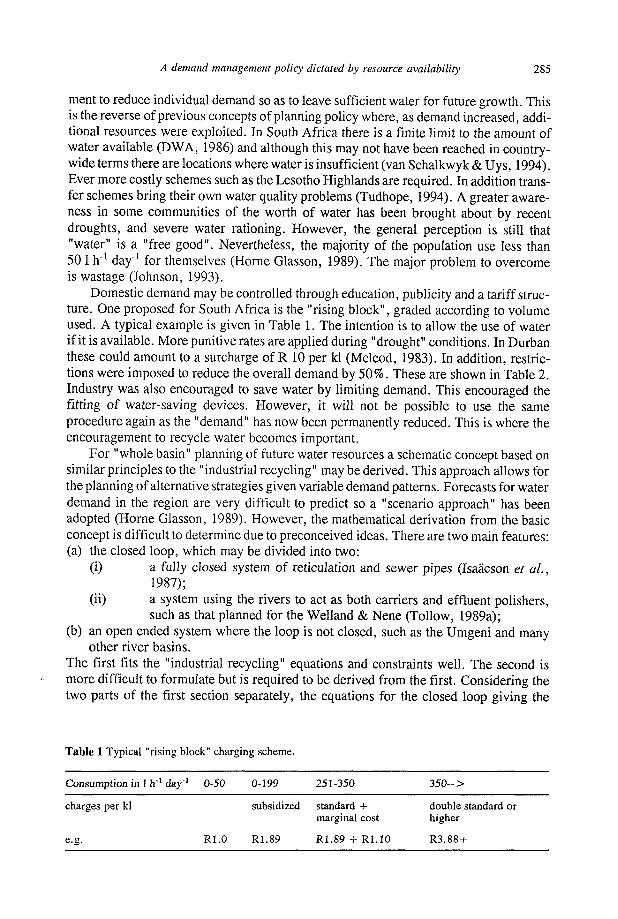
A demand management policy dictated by resource availability 285
ment to reduce individual demand so as to leave sufficient water for future growth. This is the reverse of previous concepts of planning policy where, as demand increased, additional resources were exploited. In South Africa there is a finite limit to the amount of water available (DWA, 1986) and although this may not have been reached in countrywide terms there are locations where water is insufficient (van Schalkwyk & Uys, 1994). Ever more costly schemes such as the Lesotho Highlands are required. In addition transfer schemes bring their own water quality problems (Tudhope, 1994). A greater awareness in some communities of the worth of water has been brought about by recent droughts, and severe water rationing. However, the general perception is still that "water" is a "free good". Nevertheless, the majority of the population use less than 50 1 h"1 day"1 for themselves (Home Glasson, 1989). The major problem to overcome is wastage (Johnson, 1993).
Domestic demand may be controlled through education, publicity and a tariff structure. One proposed for South Africa is the "rising block", graded according to volume used. A typical example is given in Table 1. The intention is to allow the use of water if it is available. More punitive rates are applied during "drought" conditions. In Durban these could amount to a surcharge of R 10 per kl (Mcleod, 1983). In addition, restrictions were imposed to reduce the overall demand by 50%. These are shown in Table 2. Industry was also encouraged to save water by limiting demand. This encouraged the fitting of water-saving devices. However, it will not be possible to use the same procedure again as the "demand" has now been permanently reduced. This is where the encouragement to recycle water becomes important.
For "whole basin" planning of future water resources a schematic concept based on similar principles to the "industrial recycling" may be derived. This approach allows for the planning of alternative strategies given variable demand patterns. Forecasts for water demand in the region are very difficult to predict so a "scenario approach" has been adopted (Home Glasson, 1989). However, the mathematical derivation from the basic concept is difficult to determine due to preconceived ideas. There are two main features: (a) the closed loop, which may be divided into two:
(i) a fully closed system of reticulation and sewer pipes (Isaacson et al., 1987);
(ii) a system using the rivers to act as both carriers and effluent polishers, such as that planned for the Welland & Nene (Tollow, 1989a);
(b) an open ended system where the loop is not closed, such as the Umgeni and many other river basins.
The first fits the "industrial recycling" equations and constraints well. The second is more difficult to formulate but is required to be derived from the first. Considering the two parts of the first section separately, the equations for the closed loop giving the
Table 1 Typical "rising block" charging scheme.
Consumption in 1 h-1 day"1 0-50 0-199 251-350 350->
subsidized standard + double standard or marginal cost higher
R1.0 R1.89 R1.89 + R1.10 R3.88 +
charges per kl
e.g.
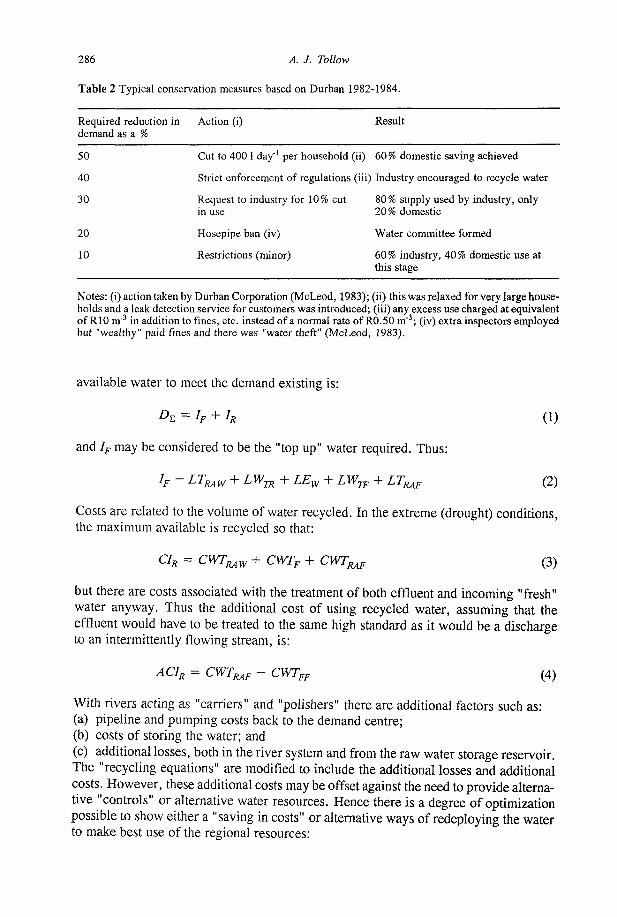
286 A. J. Tollow
Table 2 Typical conservation measures based on Durban 1982-1984.
Required reduction in Action (i) Result demand as a %
50 Cut to 400 1 day"1 per household (ii) 60% domestic saving achieved
40 Strict enforcement of regulations (iii) Industry encouraged to recycle water
30 Request to industry for 10% cut 80% supply used by industry, only in use 20 % domestic
20 Hosepipe ban (iv) Water committee formed
10 Restrictions (minor) 60% industry, 40% domestic use at this stage
Notes: (i) action taken by Durban Corporation (McLeod, 1983); (ii) this was relaxed for very large households and a leak detection service for customers was introduced; (iii) any excess use charged at equivalent of RIO m"3 in addition to fines, etc. instead of a normal rate of R0.50 m"3; (iv) extra inspectors employed but "wealthy" paid fines and there was "water theft" (McLeod, 1983).
available water to meet the demand existing is:
DE=IF + IR (1)
and IF may be considered to be the "top up" water required. Thus:
h - LTMW + LWTR + LEW + LWW + LTMF (2)
Costs are related to the volume of water recycled. In the extreme (drought) conditions, the maximum available is recycled so that:
CIR = CWTMW + CWTF + CWT^p (3)
but there are costs associated with the treatment of both effluent and incoming "fresh" water anyway. Thus the additional cost of using recycled water, assuming that the effluent would have to be treated to the same high standard as it would be a discharge to an intermittently flowing stream, is:
ACIR = CWT^p - CWTFF (4)
With rivers acting as "carriers" and "polishers" there are additional factors such as: (a) pipeline and pumping costs back to the demand centre; (b) costs of storing the water; and (c) additional losses, both in the river system and from the raw water storage reservoir. The "recycling equations" are modified to include the additional losses and additional costs. However, these additional costs may be offset against the need to provide alternative "controls" or alternative water resources. Hence there is a degree of optimization possible to show either a "saving in costs" or alternative ways of redeploying the water to make best use of the regional resources:
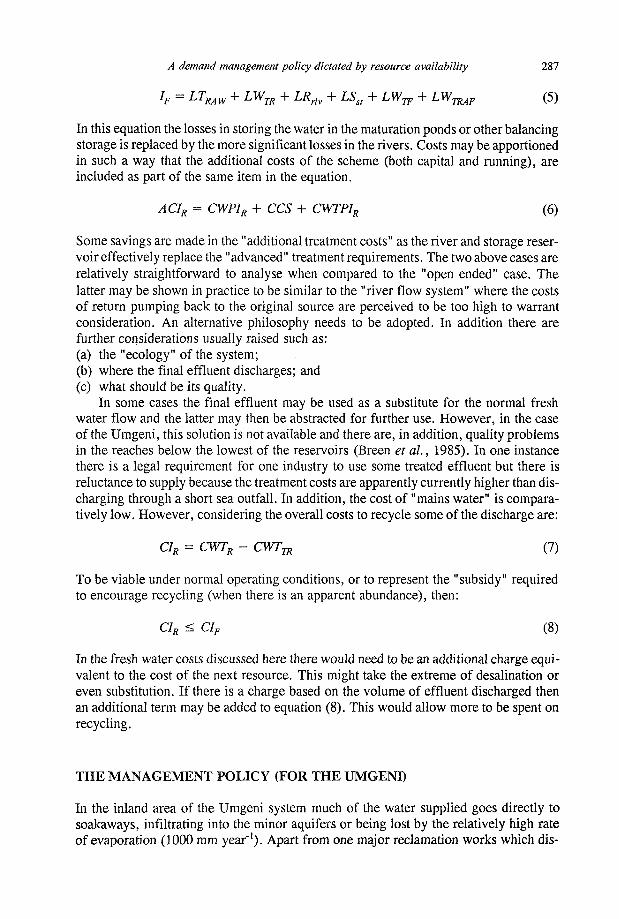
A demand management policy dictated by resource availability 287
h = LTMW + LWm + LRriv + LSst + LW^ + LWmAF (5)
In this equation the losses in storing the water in the maturation ponds or other balancing storage is replaced by the more significant losses in the rivers. Costs may be apportioned in such a way that the additional costs of the scheme (both capital and running), are included as part of the same item in the equation.
AC1R = CWPIR + CCS + CWTPIR (6)
Some savings are made in the "additional treatment costs" as the river and storage reservoir effectively replace the "advanced" treatment requirements. The two above cases are relatively straightforward to analyse when compared to the "open ended" case. The latter may be shown in practice to be similar to the "river flow system" where the costs of return pumping back to the original source are perceived to be too high to warrant consideration. An alternative philosophy needs to be adopted. In addition there are further considerations usually raised such as: (a) the "ecology" of the system; (b) where the final effluent discharges; and (c) what should be its quality.
In some cases the final effluent may be used as a substitute for the normal fresh water flow and the latter may then be abstracted for further use. However, in the case of the Umgeni, this solution is not available and there are, in addition, quality problems in the reaches below the lowest of the reservoirs (Breen et al, 1985). In one instance there is a legal requirement for one industry to use some treated effluent but there is reluctance to supply because the treatment costs are apparently currently higher than discharging through a short sea outfall. In addition, the cost of "mains water" is comparatively low. However, considering the overall costs to recycle some of the discharge are:
CIR = CWTR - CWTm (7)
To be viable under normal operating conditions, or to represent the "subsidy" required to encourage recycling (when there is an apparent abundance), then:
CIR < CIF (8)
In the fresh water costs discussed here there would need to be an additional charge equivalent to the cost of the next resource. This might take the extreme of desalination or even substitution. If there is a charge based on the volume of effluent discharged then an additional term may be added to equation (8). This would allow more to be spent on recycling.
THE MANAGEMENT POLICY (FOR THE UMGENI)
In the inland area of the Umgeni system much of the water supplied goes directly to soakaways, infiltrating into the minor aquifers or being lost by the relatively high rate of evaporation (1000 mm year"1). Apart from one major reclamation works which dis-

288 A. J. Tollow
charges upstream of the lowest of the main reservoirs, most other major discharges are either coastal or to streams outside the collecting catchment. Features of the area are the number of diffuse discharges coming from septic tanks and other sources, even in the suburbs. Operating policies, such as quota allowances during drought conditions have encouraged industry to consider recycling. In the domestic area the use of "grey water" is discouraged and apart from the more rural locations the storage of rain water is not encouraged. The region around Durban is currently free of malaria but there is always a risk of it developing if the mosquito is allowed to breed and a rain water tank is an ideal location unless precautions are taken. Other problems of the subtropics include the breeding of bilharzia carrying snails and other vectors in slow moving streams, as well as prolific blooms of aquatic plants in the nutrient rich water. Despite exhortations to plant indigenous species, which are more drought tolerant, exotic garden plants and green close-cut lawns are the aspiration of most gardeners. In addition, wild areas within the garden tend to encourage highly poisonous snakes such as the green and black mambas. Although the sea is relatively near, incidents on the beaches at peak holiday times have encouraged the building of garden swimming pools. Thus the domestic demand for water in the suburbs tends to be high with the water going in evaporation rather than as return flows to the reclamation works.
Formal agriculture meets its relatively small demand from streams and on-farm storage dams (DWA, 1986). The local peri-urban and rural communities are being provided with a minimum of 50 1 h"1 day"1 under various works programmes from the mains (Home Glasson, 1989). However, these settlements tend to result in areas of high erosion resulting in the silting up of reservoirs and the degradation of water resources. Any policy has to be sensitive to all the issues in the region including the provision of adequate sanitation and a balance of meeting ecological demands as well as preserving existing gathering grounds from exploitation. To manage such a diverse region a "whole catchment" management policy is required. The various conflicts of interest would need to be resolved so that the same authority deals with reclamation and water supply, as well as the safeguarding of both the upland and lowland ecology for the benefit of all. The components making up the demand and thus affecting the policy are: (a) agriculture, both spray irrigation and cattle watering; (b) industry and commerce; (c) urban and rural domestic use; and (d) ecological demands of the system. The availability of water is governed by: (a) the volume of water currently in the reservoirs; (b) the probable inflow (whether it is a dry or wet cycle); (c) the size and location of the treatment works; (d) the provision of supply mains, both raw and treated; and (e) the degree of recycling feasible. There are also other factors directly related to the operation of the water supply system such as: (a) the water quality; (b) unaccounted-for water, which may be governed by pressure in the water mains and
their age. Many of the components can have a "cost" associated with them. For example a
value can be place on the "unaccounted water" so that system losses are reduced to an
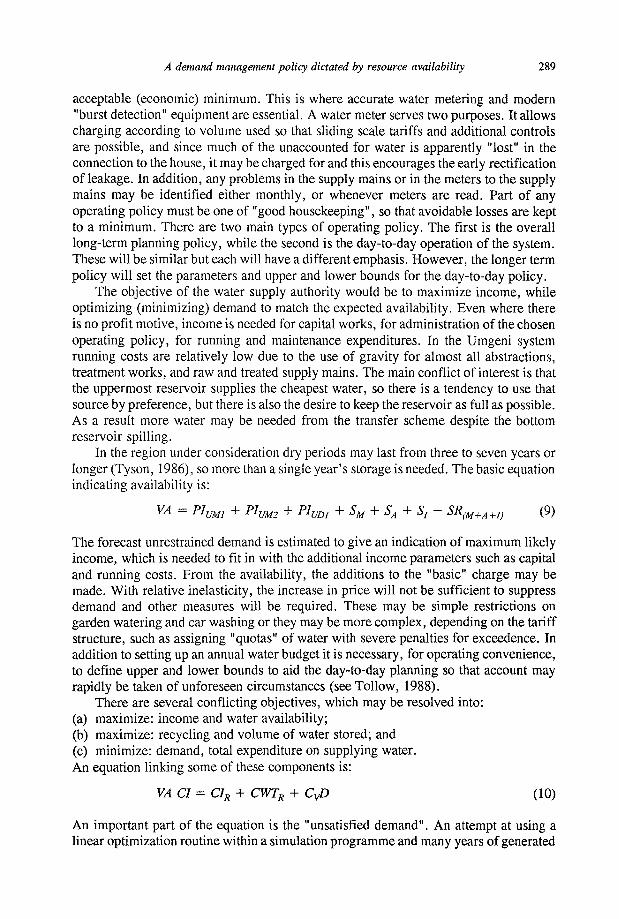
A demand management policy dictated by resource availability 289
acceptable (economic) minimum. This is where accurate water metering and modem "burst detection" equipment are essential. A water meter serves two purposes. It allows charging according to volume used so that sliding scale tariffs and additional controls are possible, and since much of the unaccounted for water is apparently "lost" in the connection to the house, it may be charged for and this encourages the early rectification of leakage. In addition, any problems in the supply mains or in the meters to the supply mains may be identified either monthly, or whenever meters are read. Part of any operating policy must be one of "good housekeeping", so that avoidable losses are kept to a minimum. There are two main types of operating policy. The first is the overall long-term planning policy, while the second is the day-to-day operation of the system. These will be similar but each will have a different emphasis. However, the longer term policy will set the parameters and upper and lower bounds for the day-to-day policy.
The objective of the water supply authority would be to maximize income, while optimizing (minimizing) demand to match the expected availability. Even where there is no profit motive, income is needed for capital works, for administration of the chosen operating policy, for running and maintenance expenditures. In the Umgeni system running costs are relatively low due to the use of gravity for almost all abstractions, treatment works, and raw and treated supply mains. The main conflict of interest is that the uppermost reservoir supplies the cheapest water, so there is a tendency to use that source by preference, but there is also the desire to keep the reservoir as full as possible. As a result more water may be needed from the transfer scheme despite the bottom reservoir spilling.
In the region under consideration dry periods may last from three to seven years or longer (Tyson, 1986), so more than a single year's storage is needed. The basic equation indicating availability is:
VA = Plum + Plum + PIUD1 + SM + SA + Sf- SR^+A+D (9)
The forecast unrestrained demand is estimated to give an indication of maximum likely income, which is needed to fit in with the additional income parameters such as capital and running costs. From the availability, the additions to the "basic" charge may be made. With relative inelasticity, the increase in price will not be sufficient to suppress demand and other measures will be required. These may be simple restrictions on garden watering and car washing or they may be more complex, depending on the tariff structure, such as assigning "quotas" of water with severe penalties for exceedence. In addition to setting up an annual water budget it is necessary, for operating convenience, to define upper and lower bounds to aid the day-to-day planning so that account may rapidly be taken of unforeseen circumstances (seeTollow, 1988).
There are several conflicting objectives, which may be resolved into: (a) maximize: income and water availability; (b) maximize: recycling and volume of water stored; and (c) minimize: demand, total expenditure on supplying water. An equation linking some of these components is:
VA CI = C1R + CWTR + CyD (10)
An important part of the equation is the "unsatisfied demand". An attempt at using a linear optimization routine within a simulation programme and many years of generated
290 A. J. Tollow
data produced satisfactory annual operating strategies (Tollow, 1993). However, a full solution would not appear to be amenable to linearization and other approaches are being sought. Nevertheless, it is possible to put the philosophy into practice without obtaining the mathematical ideal solution. In practice the use of "control bands" (in the daily operating programme) when carefully implemented, should approach the "ideal solution".
CONCLUSIONS
Managing the demand will become more important as the availability of resources declines. Much research is still required to ascertain the most viable approaches, which will differ according to local circumstances. It is feasible to derive mathematical equations to aid the solution of the methods to be employed when "managing the demand". However, on the system tested, further research is required to test whether it is feasible to develop a complete linear optimization routine. Nevertheless it has been found possible to use linear optimization in conjunction with simulation to derive annual operating strategies.
Acknowledgements The author wishes to acknowledge the assistance of the Computer Centre for Water Research (CCWR) for providing computer facilities.
REFERENCES
Anon. (1989) Sasol pollution free water. Technology SA, June. Breen, C. M., Akhurst, E. G. J. & Walmsley, R. D. (1985) Water quality management in the Mgni catchment. (Proc.
Workshop, Durban, February). NatalTown and Regional Planning Supplementary Report no. 12, Pietermaritzburg. DWA (1986) Management ofthe Water Resources of the Republic of South Africa. Dept. of Wat. Affairs (DWA), Pretoria. Home Glasson & Partners (1989) Umgeni Water Plan 2025. Durban. Isaacson, M., Sayed, A. R. &Hattingh, W. H. J. (1987) Studies on health aspects of water reclamation during 1974 to 1983
in Windhoek, South West Africa, Namibia. Report 38/1/87, Wat. Res. Commission, Pretoria. Johnson, E. H. (1993) Water demand forecasting for urban areas. Wat. Sewage & Effluent SA 13(1), 49-55. Lalli, P. A. (1987) Matimba power station site selection. Civ. Engng S. Afr. 29(7), 245-248. Mcleod, N. (1983) Perspective of water consumption in Durban. / . Fac. Engng., Univ. Durban-Westville 1(2), 26-32. Steffen Robertson & Kirsten Inc. (1989) National industrial water and wastewater survey - Natsurv. 1-14, Wat. Res.
Commission, Pretoria. Tollow, A. J. (1989a) Operation of water supply reservoirs by "control bands "derived by simulation. Hydrol. Sci.J. 34(4),
449-463. Tollow, A. J. (1989b) A further approach to the assessment of reservoir yield. Proc. British Hydrol. Soc. Conf. (Sheffield,
UK, September 1989), 4.39-4.46. Tollow, A. J. (1991) Optimisation of system demand by linearprogramming and assessmentofsubsequentreliability (based
on the Umgeni system). Proc. British Hydrol. Soc. Symp. (Southampton, September 1991), 2.1-2.8. Tollow, A. J. (1993a) Using constrained optimisation to control growth in demand by means of a combined water and
effluent pricing policy (with reference to the Greater Durban region). Proc. 4th British Hydrol. Soc. Symp. (Cardiff, September 1993).
Tollow, A. J. (1993b) Applying constrained optimisation to water supply and demand management. /. S. Afr. Inst. Civ. Engng. 35(4), 13-17.
Tollow, A. J. (1994) Conservation of water resources - the next step - a totally managed system. Proc. 50 Years of Water Engineering in South Africa (Univ. of Witwatersrand, July 1994), 77-91.
Tudhope, I. S. D. (1994) Inter-catchment transfers - practical schemes to preserve water quality. Proc. 50 Years of Water Engineering in South Africa (Univ. of Witwatersrand, July 1994), 183-192.
Tyson, P. D. (1986) Climate Change and its Variability in Southern Africa. Oxford University Press, Capetown. van Schalkwyk, A. & Uys, W. J. (1994) Water supply to developing communities in the rural areas of the northern
Transvaal region during the last fifty years. Proc. 50 Years of Water Engineering in South Africa (Univ. of Witwatersrand, July 1994), 103-115.
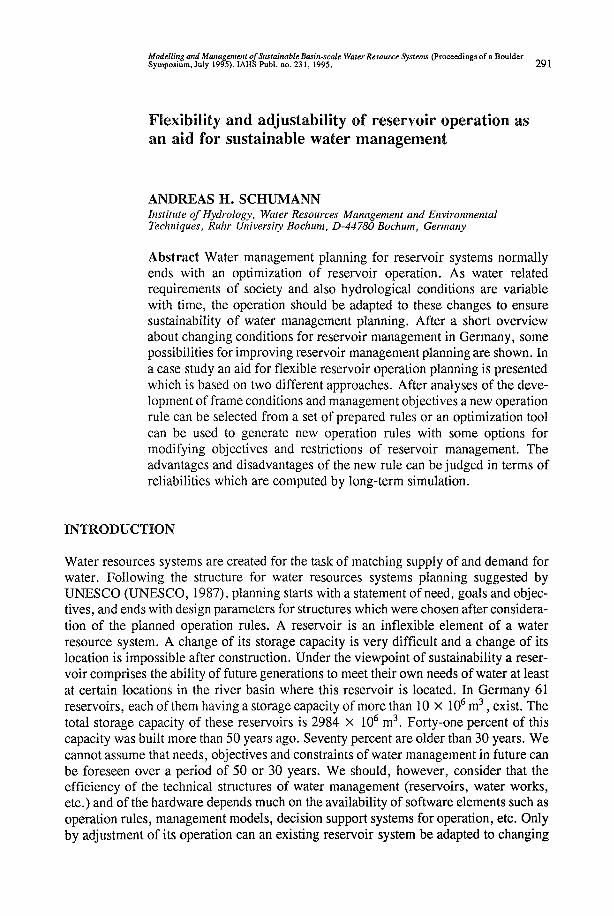
Modelling and Management of Sustainable Basin-scale Water Resource Systems (Proceedings of a Boulder Symposium, July 1995). IAHS Publ. no. 231, 1995. 291
Flexibility and adjustability of reservoir operation as an aid for sustainable water management
ANDREAS H. SCHUMANN Institute of Hydrology, Water Resources Management and Environmental Techniques, Ruhr University Bochum, D-44780 Bochum, Germany
Abstract Water management planning for reservoir systems normally ends with an optimization of reservoir operation. As water related requirements of society and also hydrological conditions are variable with time, the operation should be adapted to these changes to ensure sustainability of water management planning. After a short overview about changing conditions for reservoir management in Germany, some possibilities for improving reservoir management planning are shown. In a case study an aid for flexible reservoir operation planning is presented which is based on two different approaches. After analyses of the development of frame conditions and management objectives a new operation rule can be selected from a set of prepared rules or an optimization tool can be used to generate new operation rules with some options for modifying objectives and restrictions of reservoir management. The advantages and disadvantages of the new rule can be judged in terms of reliabilities which are computed by long-term simulation.
INTRODUCTION
Water resources systems are created for the task of matching supply of and demand for water. Following the structure for water resources systems planning suggested by UNESCO (UNESCO, 1987), planning starts with a statement of need, goals and objectives, and ends with design parameters for structures which were chosen after consideration of the planned operation rules. A reservoir is an inflexible element of a water resource system. A change of its storage capacity is very difficult and a change of its location is impossible after construction. Under the viewpoint of sustainability a reservoir comprises the ability of future generations to meet their own needs of water at least at certain locations in the river basin where this reservoir is located. In Germany 61 reservoirs, each of them having a storage capacity of more than 10 x 106 m3, exist. The total storage capacity of these reservoirs is 2984 x 106 m3. Forty-one percent of this capacity was built more than 50 years ago. Seventy percent are older than 30 years. We cannot assume that needs, objectives and constraints of water management in future can be foreseen over a period of 50 or 30 years. We should, however, consider that the efficiency of the technical structures of water management (reservoirs, water works, etc.) and of the hardware depends much on the availability of software elements such as operation rules, management models, decision support systems for operation, etc. Only by adjustment of its operation can an existing reservoir system be adapted to changing
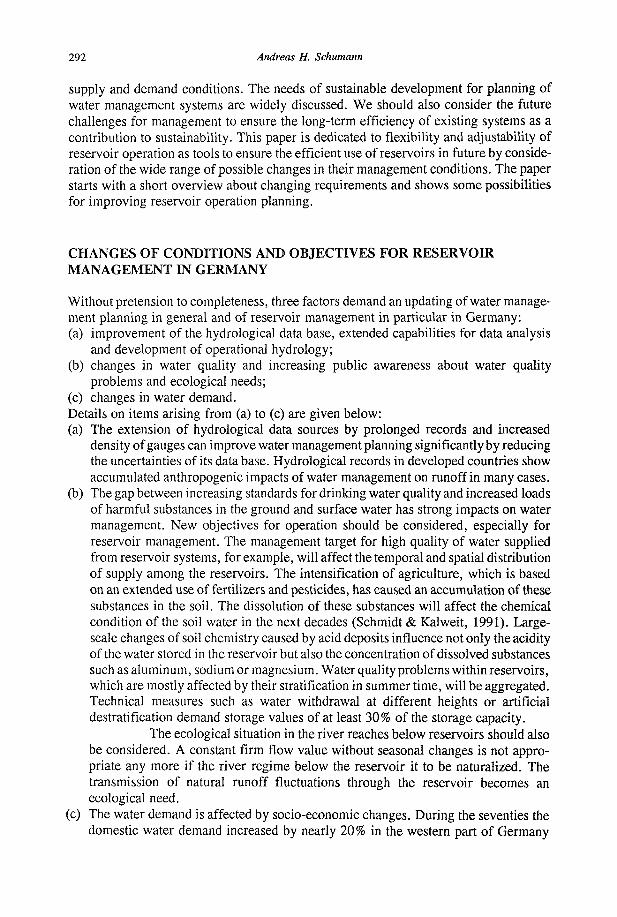
292 Andreas H. Schumann
supply and demand conditions. The needs of sustainable development for planning of water management systems are widely discussed. We should also consider the future challenges for management to ensure the long-term efficiency of existing systems as a contribution to sustainability. This paper is dedicated to flexibility and adjustability of reservoir operation as tools to ensure the efficient use of reservoirs in future by consideration of the wide range of possible changes in their management conditions. The paper starts with a short overview about changing requirements and shows some possibilities for improving reservoir operation planning.
CHANGES OF CONDITIONS AND OBJECTIVES FOR RESERVOIR MANAGEMENT IN GERMANY
Without pretension to completeness, three factors demand an updating of water management planning in general and of reservoir management in particular in Germany: (a) improvement of the hydrological data base, extended capabilities for data analysis
and development of operational hydrology; (b) changes in water quality and increasing public awareness about water quality
problems and ecological needs; (c) changes in water demand. Details on items arising from (a) to (c) are given below: (a) The extension of hydrological data sources by prolonged records and increased
density of gauges can improve water management planning significantly by reducing the uncertainties of its data base. Hydrological records in developed countries show accumulated anthropogenic impacts of water management on runoff in many cases.
(b) The gap between increasing standards for drinking water quality and increased loads of harmful substances in the ground and surface water has strong impacts on water management. New objectives for operation should be considered, especially for reservoir management. The management target for high quality of water supplied from reservoir systems, for example, will affect the temporal and spatial distribution of supply among the reservoirs. The intensification of agriculture, which is based on an extended use of fertilizers and pesticides, has caused an accumulation of these substances in the soil. The dissolution of these substances will affect the chemical condition of the soil water in the next decades (Schmidt & Kalweit, 1991). Large-scale changes of soil chemistry caused by acid deposits influence not only the acidity of the water stored in the reservoir but also the concentration of dissolved substances such as aluminum, sodium or magnesium. Water quality problems within reservoirs, which are mostly affected by their stratification in summer time, will be aggregated. Technical measures such as water withdrawal at different heights or artificial destratification demand storage values of at least 30% of the storage capacity.
The ecological situation in the river reaches below reservoirs should also be considered. A constant firm flow value without seasonal changes is not appropriate any more if the river regime below the reservoir it to be naturalized. The transmission of natural runoff fluctuations through the reservoir becomes an ecological need.
(c) The water demand is affected by socio-economic changes. During the seventies the domestic water demand increased by nearly 20% in the western part of Germany
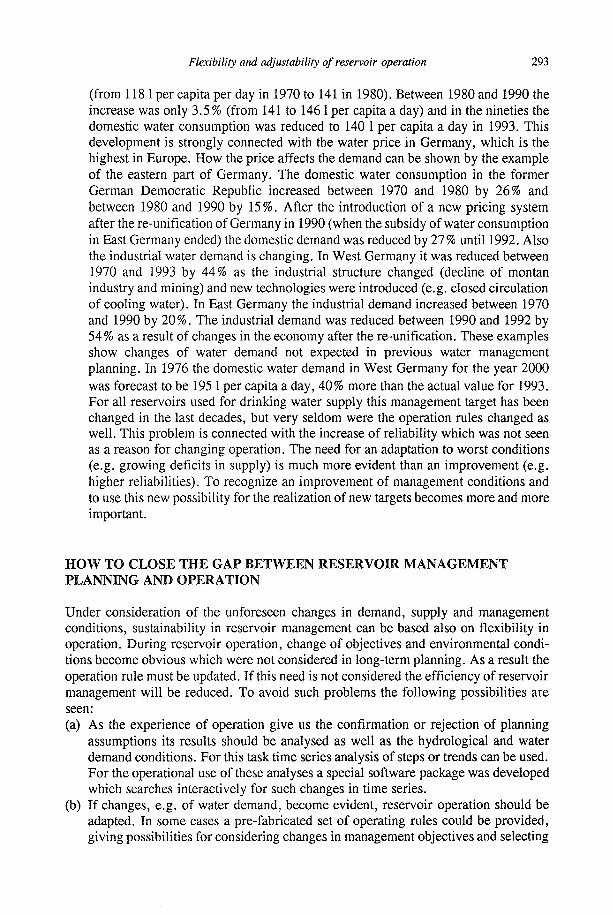
Flexibility and adjustability of reservoir operation 293
(from 118 1 per capita per day in 1970 to 141 in 1980). Between 1980 and 1990 the increase was only 3.5% (from 141 to 1461 per capita a day) and in the nineties the domestic water consumption was reduced to 140 1 per capita a day in 1993. This development is strongly connected with the water price in Germany, which is the highest in Europe. How the price affects the demand can be shown by the example of the eastern part of Germany. The domestic water consumption in the former German Democratic Republic increased between 1970 and 1980 by 26% and between 1980 and 1990 by 15%. After the introduction of a new pricing system after the re-unification of Germany in 1990 (when the subsidy of water consumption in East Germany ended) the domestic demand was reduced by 27% until 1992. Also the industrial water demand is changing. In West Germany it was reduced between 1970 and 1993 by 44% as the industrial structure changed (decline of montan industry and mining) and new technologies were introduced (e.g. closed circulation of cooling water). In East Germany the industrial demand increased between 1970 and 1990 by 20%. The industrial demand was reduced between 1990 and 1992 by 54% as a result of changes in the economy after the re-unification. These examples show changes of water demand not expected in previous water management planning. In 1976 the domestic water demand in West Germany for the year 2000 was forecast to be 195 1 per capita a day, 40% more than the actual value for 1993. For all reservoirs used for drinking water supply this management target has been changed in the last decades, but very seldom were the operation rules changed as well. This problem is connected with the increase of reliability which was not seen as a reason for changing operation. The need for an adaptation to worst conditions (e.g. growing deficits in supply) is much more evident than an improvement (e.g. higher reliabilities). To recognize an improvement of management conditions and to use this new possibility for the realization of new targets becomes more and more important.
HOW TO CLOSE THE GAP BETWEEN RESERVOIR MANAGEMENT PLANNING AND OPERATION
Under consideration of the unforeseen changes in demand, supply and management conditions, sustainability in reservoir management can be based also on flexibility in operation. During reservoir operation, change of objectives and environmental conditions become obvious which were not considered in long-term planning. As a result the operation rule must be updated. If this need is not considered the efficiency of reservoir management will be reduced. To avoid such problems the following possibilities are seen: (a) As the experience of operation give us the confirmation or rejection of planning
assumptions its results should be analysed as well as the hydrological and water demand conditions. For this task time series analysis of steps or trends can be used. For the operational use of these analyses a special software package was developed which searches interactively for such changes in time series.
(b) If changes, e.g. of water demand, become evident, reservoir operation should be adapted. In some cases a pre-fabricated set of operating rules could be provided, giving possibilities for considering changes in management objectives and selecting
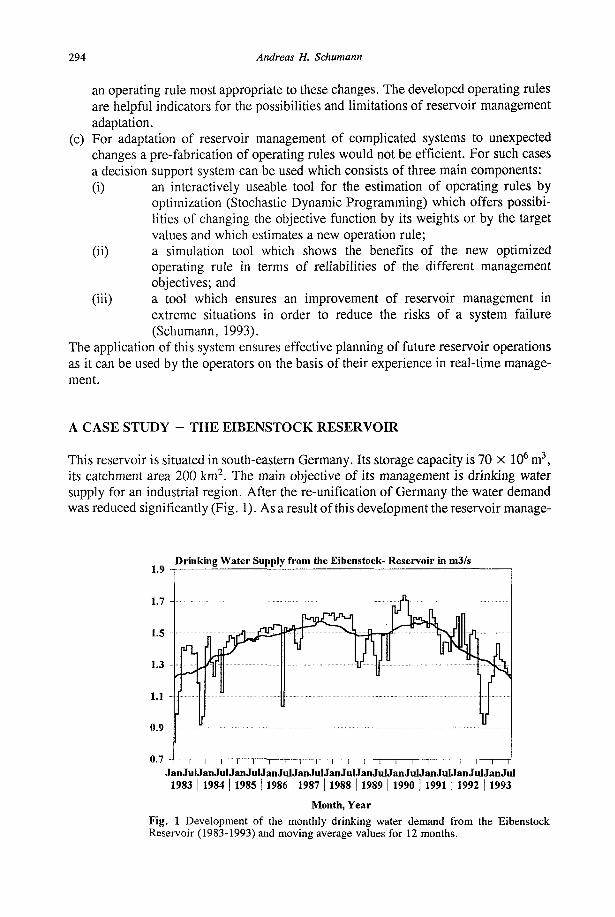
294 Andreas H. Schumann
an operating rule most appropriate to these changes. The developed operating rules are helpful indicators for the possibilities and limitations of reservoir management adaptation.
(c) For adaptation of reservoir management of complicated systems to unexpected changes a pre-fabrication of operating rules would not be efficient. For such cases a decision support system can be used which consists of three main components: (i) an interactively useable tool for the estimation of operating rules by
optimization (Stochastic Dynamic Programming) which offers possibilities of changing the objective function by its weights or by the target values and which estimates a new operation rule;
(ii) a simulation tool which shows the benefits of the new optimized operating rule in terms of reliabilities of the different management objectives; and
(iii) a tool which ensures an improvement of reservoir management in extreme situations in order to reduce the risks of a system failure (Schumann, 1993).
The application of this system ensures effective planning of future reservoir operations as it can be used by the operators on the basis of their experience in real-time management.
A CASE STUDY - THE EIBENSTOCK RESERVOIR
This reservoir is situated in south-eastern Germany. Its storage capacity is 70 X 106 m3, its catchment area 200 km2. The main objective of its management is drinking water supply for an industrial region. After the re-unification of Germany the water demand was reduced significantly (Fig. 1). As a result of this development the reservoir manage-
Drinking Water Supply from the Eibenstock- Reservoir in m3/s
T — i — i — i — i — i — i — i — i — i — i — i — i — i — i — i — i — i — i — r JanJulJanJuIJanJulJanJulJanJuManJulJanJulJanJulJanJulJanJulJanJul
1983 | 1984 | 1985 | 1986 | 1987 | 1988 | 1989 | 1990 | 1991 | 1992 | 1993
Month, Year
Fig. 1 Development of the monthly drinking water demand from the Eibenstock Reservoir (1983-1993) and moving average values for 12 months.
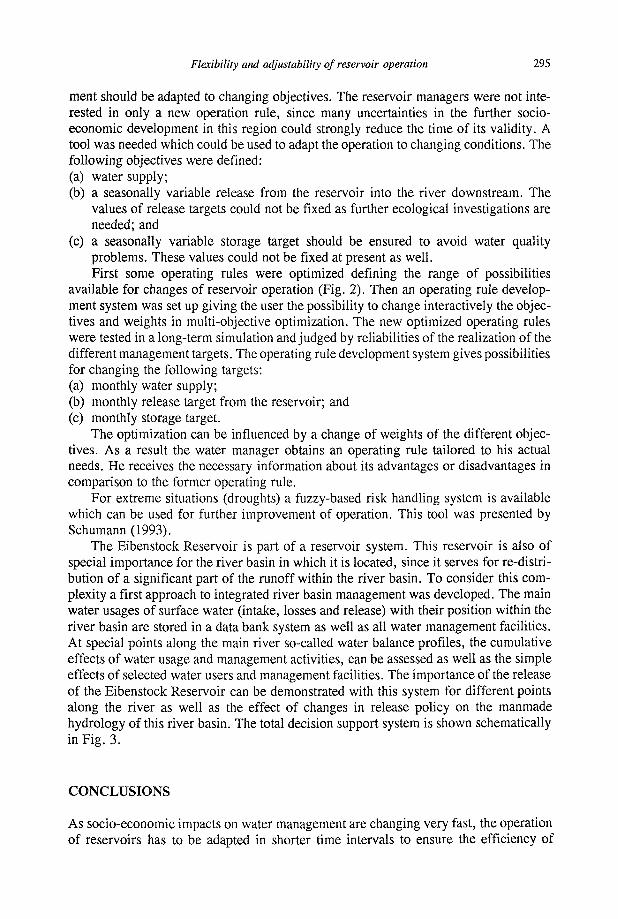
Flexibility and adjustability of reservoir operation 295
ment should be adapted to changing objectives. The reservoir managers were not interested in only a new operation rule, since many uncertainties in the further socioeconomic development in this region could strongly reduce the time of its validity. A tool was needed which could be used to adapt the operation to changing conditions. The following objectives were defined: (a) water supply; (b) a seasonally variable release from the reservoir into the river downstream. The
values of release targets could not be fixed as further ecological investigations are needed; and
(c) a seasonally variable storage target should be ensured to avoid water quality problems. These values could not be fixed at present as well. First some operating rules were optimized defining the range of possibilities
available for changes of reservoir operation (Fig. 2). Then an operating rule development system was set up giving the user the possibility to change interactively the objectives and weights in multi-objective optimization. The new optimized operating rules were tested in a long-term simulation and judged by reliabilities of the realization of the different management targets. The operating rule development system gives possibilities for changing the following targets: (a) monthly water supply; (b) monthly release target from the reservoir; and (c) monthly storage target.
The optimization can be influenced by a change of weights of the different objectives. As a result the water manager obtains an operating rule tailored to his actual needs. He receives the necessary information about its advantages or disadvantages in comparison to the former operating rule.
For extreme situations (droughts) a fuzzy-based risk handling system is available which can be used for further improvement of operation. This tool was presented by Schumann (1993).
The Eibenstock Reservoir is part of a reservoir system. This reservoir is also of special importance for the river basin in which it is located, since it serves for re-distribution of a significant part of the runoff within the river basin. To consider this complexity a first approach to integrated river basin management was developed. The main water usages of surface water (intake, losses and release) with their position within the river basin are stored in a data bank system as well as all water management facilities. At special points along the main river so-called water balance profiles, the cumulative effects of water usage and management activities, can be assessed as well as the simple effects of selected water users and management facilities. The importance of the release of the Eibenstock Reservoir can be demonstrated with this system for different points along the river as well as the effect of changes in release policy on the manmade hydrology of this river basin. The total decision support system is shown schematically in Fig. 3.
CONCLUSIONS
As socio-economic impacts on water management are changing very fast, the operation of reservoirs has to be adapted in shorter time intervals to ensure the efficiency of
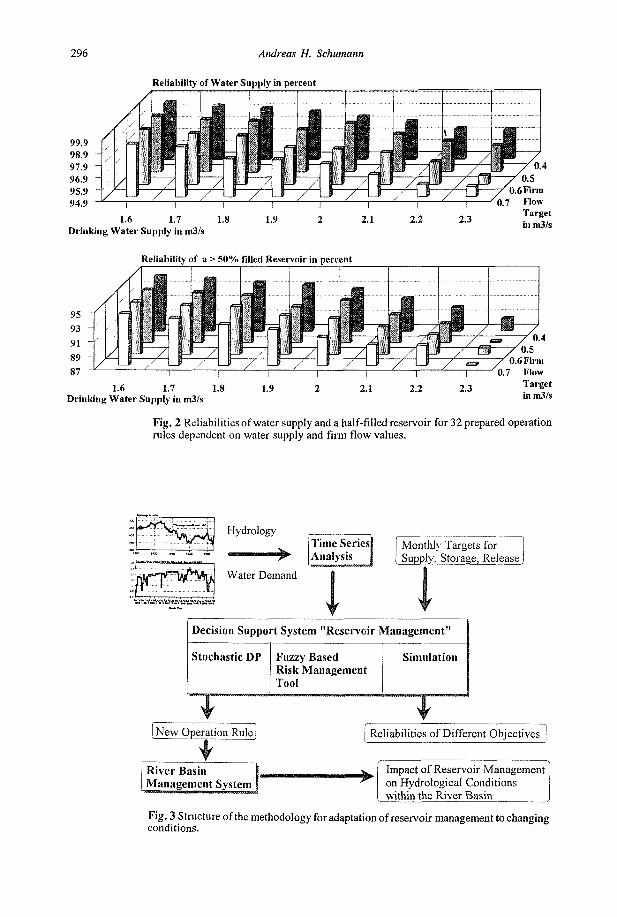
296 Andreas H. Schumann
Reliability of Water Supply in percent
i r 1.6 1.7 1.8
Drinking Water Supply in m3/s 1.9 2.1 2.2 2.3
0.7 Flow Target in m3/s
Reliability of a > 50% filled Reservoir in percent
1.6 1.7 1.8 Drinking Water Supply in m3/s
0.6 Firm
Target in m3/s
Fig. 2 Reliabilities of water supply and a half-filled reservoir for 32 prepared operation rules dependent on water supply and firm flow values.
: ^ v * * \ Hydrology
+> ffV^
Time Series Analysis
Water Demand
MtT^SSMBSKSMMM!
Monthly Targets for Supply, Storage, Release
I Decision Support System "Reservoir Management"
Stochastic DP Fuzzy Based Risk Management Tool
Simulation
I New Operation Rule |
I River Basin Management System
Reliabilities of Different Objectives
Impact of Reservoir Management on Hydrological Conditions within the River Basin
Fig. 3 Structure of the methodology for adaptation of reservoir management to changing conditions.
Flexibility and adjustability of reservoir operation 297
existing reservoirs. This can be seen as a contribution to sustainability of reservoirs as their efficient utilization in future can be ensured also if the weights of different management targets are changing.
The development of new operating rules cannot be seen as a long-term task, since in many cases the operation should be adapted in time intervals of some years to changing conditions. In order to avoid the utilization of non-optimal and empirical operation rules the operators themselves should have the possibility of optimizing management. A tool which can be used for this task was presented. It is, of course, necessary for the users to know the methodology of optimization. But it is also very important that the interactive system developed for this task provides all the necessary information about the advantages or disadvantages of a change in operation in order to give the possibility of judging the chances of an improvement in operation. For this task, integrated river basin management seems to be necessary.
REFERENCES
Schmidt, J. & Kalweit, H. (1991) Nitrate loads of drinking water reservoirs in Chemnitz area. Wasserwirtschafi-Wasser-technik 41 (Feb. 1991).
Schumann, A. H. (1993) Changes in hydrological time series - a challenge for water management. In : Extreme Hydrological Events: Precipitation, Floods and Droughts (ed. by Z. W. Kundzewicz.D. Rosbjerg.S. P. Simonovic&K. Takeuchi) (Proc. Yokohama Symp.). IAHS Publ. no. 213.
UNESCO (1987)The process of water resources project planning: a systems approach. UNESCO Studies and Reports in Hydrology no. 44 (ed. by Y. Y. Haimes & E. J. Plate).

Modelling and Management of Sustainable Basin-scale Water Resource Systems (Proceedings of a Boulder Symposium, July 1995). 1AHS Publ. no. 231, 1995. 299
Assessment of effectiveness of the use of inflow forecasts to reservoir management
KUNIYOSHI TAKEUCHI & VANCHAI SIVAARTHITKUL Department of Civil and Environmental Engineering, Yamanashi University, Kofu 400, Japan
Abstract Efficient reservoir management is the basic criteria for sustainable water resources development. The recent advancement of hydro-meteorological forecasting techniques is a strong support for more efficient use of reservoirs. In order to quantify the benefit of the use of inflow forecasts, this paper presents the results of comparative simulation studies with and without forecasts. Different forecasting accuracy and lead time are also investigated. It was found that reservoir size estimate is very sensitive to the effectiveness of inflow forecasts. Small reservoirs are more vulnerable to forecasting error, whereas large reservoirs have more short-term errors. It is recommended that in those countries with many small reservoirs, high accuracy short-term forecasts should be aimed at, and a hasty introduction of low level meteorological forecasts should be cautiously avoided. In those countries with large reservoirs, long-term forecasting techniques should be used withoutpaying too much attention to accuracy at each time period.
INTRODUCTION
According to the World Register of Dams (1988), there are 36 235 dams higher than 15 m in the 79 ICOLD (International Commission on Large Dams) member countries. The Reservoir Akosombo of the Volta River, Ghana, inundates 8482 km2, the world's largest area inundated by a single reservoir. The High Aswan Dam, Kuibyshev, Bukhtarma and Bratsk each inundate more than 5000 km2. According to the Japanese Yearbook of Dams (1994), there are 2536 dams in Japan as of April 1993, which store 20.4 x 10⁹ m3 and inundate a total of 1637 km2. Another 576 dams are under construction or in the planning stage. They will store 10.3 x 10⁹ m3 and inundate 825 km2.
Reservoirs are the most effective structures for controlling the distribution of water in time and space. They are indispensable for man's water utilization. However, dam construction and inundation necessarily bring about serious environmental destruction and ecological impacts. Therefore they are always subject to critical questions and objections related to their very necessity, the possibility of selecting alternative means of water supply, and the mode of construction. Nevertheless, reservoirs are still one of the most important means of sustainable development, since their long-term environmental effects are ecologically more acceptable than most other alternative means of development.
In order to make reservoir construction sustainable, there are three conditions to be
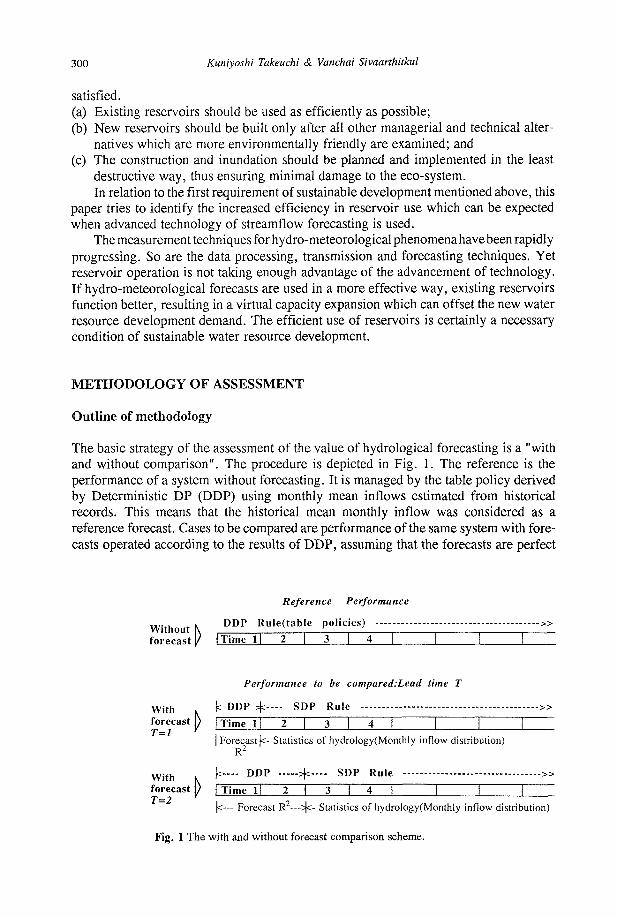
300 Kuniyoshi Takeuchi & Vanchai Sivaarthitkul
satisfied. (a) Existing reservoirs should be used as efficiently as possible; (b) New reservoirs should be built only after all other managerial and technical alter
natives which are more environmentally friendly are examined; and (c) The construction and inundation should be planned and implemented in the least
destructive way, thus ensuring minimal damage to the eco-system. In relation to the first requirement of sustainable development mentioned above, this
paper tries to identify the increased efficiency in reservoir use which can be expected when advanced technology of streamflow forecasting is used.
The measurement techniques for hydro-meteorological phenomena have been rapidly progressing. So are the data processing, transmission and forecasting techniques. Yet reservoir operation is not taking enough advantage of the advancement of technology. If hydro-meteorological forecasts are used in a more effective way, existing reservoirs function better, resulting in a virtual capacity expansion which can offset the new water resource development demand. The efficient use of reservoirs is certainly a necessary condition of sustainable water resource development.
METHODOLOGY OF ASSESSMENT
Outline of methodology
The basic strategy of the assessment of the value of hydrological forecasting is a "with and without comparison". The procedure is depicted in Fig. 1. The reference is the performance of a system without forecasting. It is managed by the table policy derived by Deterministic DP (DDP) using monthly mean inflows estimated from historical records. This means that the historical mean monthly inflow was considered as a reference forecast. Cases to be compared are performance of the same system with forecasts operated according to the results of DDP, assuming that the forecasts are perfect
Reference Performance
DDP Rule(table policies) Without I forecast V I Time 1|
With forecast |) | Time 1 T=l
Performance to be compared:Lead time T
|= DDP ^-— SDP Rule
With forecast \) | Time ll T=2
Forecast^- Statistics of hydrology(Monthly inflow distribution) R2
:-— DDP >|<—- SDP Rule »
\i— Forecast R2—^<- Statistics of hydrology(Monthly inflow distribution)
Fig. 1 The with and without forecast comparison scheme.
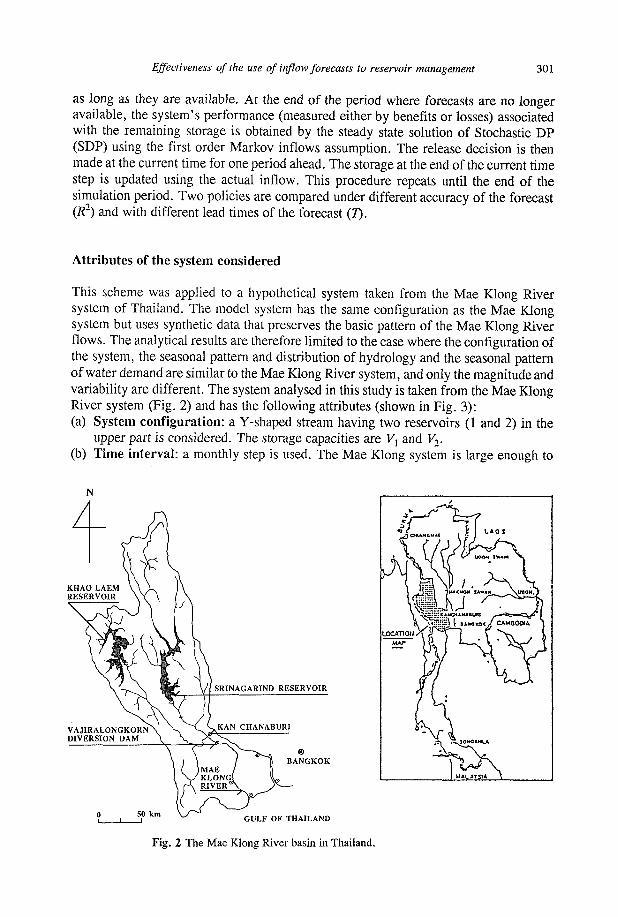
Effectiveness of the use of inflow forecasts to reservoir management 301
as long as they are available. At the end of the period where forecasts are no longer available, the system's performance (measured either by benefits or losses) associated with the remaining storage is obtained by the steady state solution of Stochastic DP (SDP) using the first order Markov inflows assumption. The release decision is then made at the current time for one period ahead. The storage at the end of the current time step is updated using the actual inflow. This procedure repeats until the end of the simulation period. Two policies are compared under different accuracy of the forecast (R2) and with different lead times of the forecast (7).
Attributes of the system considered
This scheme was applied to a hypothetical system taken from the Mae Klong River system of Thailand. The model system has the same configuration as the Mae Klong system but uses synthetic data that preserves the basic pattern of the Mae Klong River flows. The analytical results are therefore limited to the case where the configuration of the system, the seasonal pattern and distribution of hydrology and the seasonal pattern of water demand are similar to the Mae Klong River system, and only the magnitude and variability are different. The system analysed in this study is taken from the Mae Klong River system (Fig. 2) and has the following attributes (shown in Fig. 3): (a) System configuration: a Y-shaped stream having two reservoirs (1 and 2) in the
upper part is considered. The storage capacities are Vl and V2. (b) Time interval: a monthly step is used. The Mae Klong system is large enough to
Fig. 2 The Mae Klong River basin in Thailand.
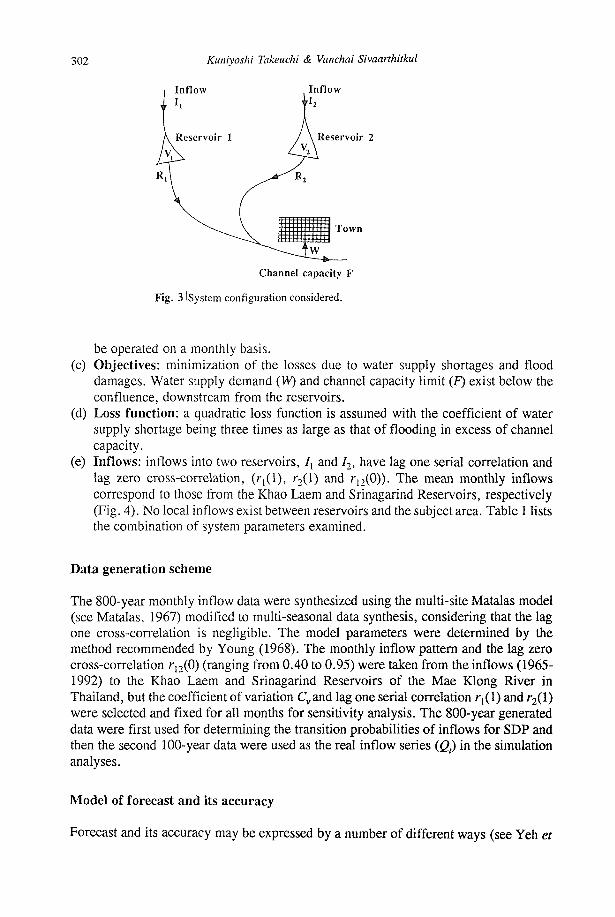
302 Kuniyoshi Takeuchi & Vanchai Sivaarthitkul
Channel capacity F
Fig. 3 (System configuration considered.
be operated on a monthly basis. (c) Objectives: minimization of the losses due to water supply shortages and flood
damages. Water supply demand (W) and channel capacity limit (F) exist below the confluence, downstream from the reservoirs.
(d) Loss function: a quadratic loss function is assumed with the coefficient of water supply shortage being three times as large as that of flooding in excess of channel capacity.
(e) Inflows: inflows into two reservoirs, /, and I2, have lag one serial correlation and lag zero cross-correlation, (r,(l), r2(l) and rn(0)). The mean monthly inflows correspond to those from the Khao Laem and Srinagarind Reservoirs, respectively (Fig. 4). No local inflows exist between reservoirs and the subject area. Table 1 lists the combination of system parameters examined.
Data generation scheme
The 800-year monthly inflow data were synthesized using the multi-site Matalas model (see Matalas, 1967) modified to multi-seasonal data synthesis, considering that the lag one cross-correlation is negligible. The model parameters were determined by the method recommended by Young (1968). The monthly inflow pattern and the lag zero cross-correlation r12(0) (ranging from 0.40 to 0.95) were taken from the inflows (1965-1992) to the Khao Laem and Srinagarind Reservoirs of the Mae Klong River in Thailand, but the coefficient of variation Cyand lag one serial correlation r,(l) and r2(l) were selected and fixed for all months for sensitivity analysis. The 800-year generated data were first used for determining the transition probabilities of inflows for SDP and then the second 100-year data were used as the real inflow series (Q) in the simulation analyses.
Model of forecast and its accuracy
Forecast and its accuracy may be expressed by a number of different ways (see Yeh et
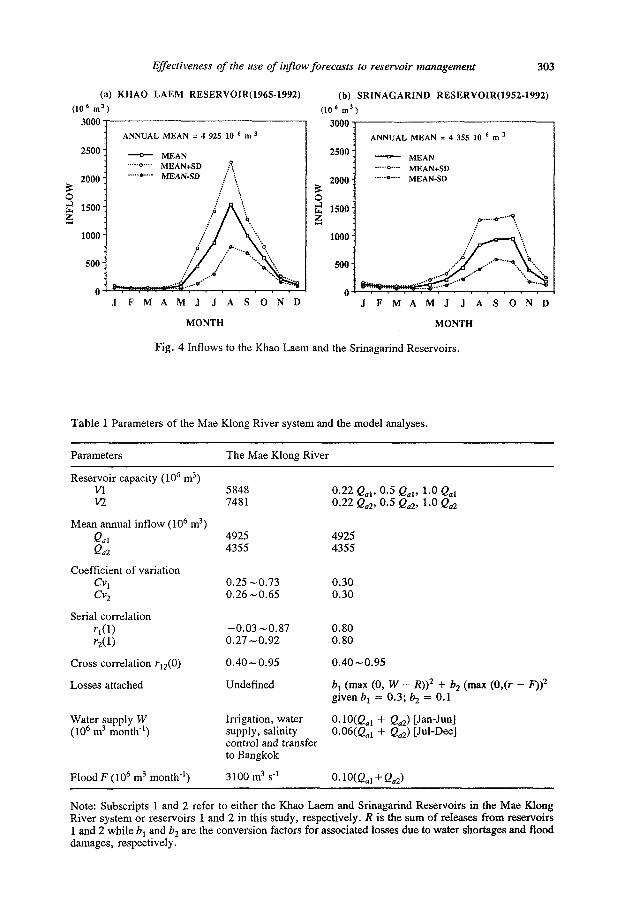
Effectiveness of the use of inflow forecasts to reservoir management 303
(a) KHAO LAEM RESERVOIRU965-1992) (10 6 m 3)
3000
2500
2000
o à 1500 Z
1000
500
0
ANNUAL MEAN = 4 925 10 6 m :
— ° — MEAN o-- MEAN+SD H • - • MEAN-SD / \
(b) SRINAGARIND RESERVOIR(1952-1992) I0 6 in3)
3000 ANNUAL MEAN = 4 355 10 ° m J
— ° — MEAN °"- MEAN+SD •— MEAN-SD
J F M A M J J A S O N D
MONTH
J F M A M J J A S O N D
MONTH
Fig. 4 Inflows to the Khao Laem and the Srinagarind Reservoirs.
Table 1 Parameters of the Mae Klong River system and the model analyses.
Parameters The Mae Klong River
Reservoir capacity VI V2
(106 m3)
Mean annual inflow (106 m3)
Qal Qa2
Coefficient of variation Cv, Cv2
Serial correlation r,(D r2(D
Cross correlation ;
Losses attached
Water supply W (106 m3 month-1)
n(0)
Flood F (106m3 month"1)
5848 7481
4925 4355
0.25-0.73 0.26-0.65
-0 .03-0.87 0.27-0.92
0.40-0.95
Undefined
Irrigation, water supply, salinity control and transfer to Bangkok
3100 m3^1
0.22 Qai, 0.5 QaV 1.0 Qal
0.22 Qa2, 0.5 Qa2, 1.0 Qa2
4925 4355
0.30 0.30
0.80 0.80
0.40-0.95
bx (max (0, W - R))2 + b-, given bx = 0.3; b2 = 0.1
0.10(j2a, + Qa2) [Jan-Jun] 0.06(eal + Qa2) [Jul-Dec]
O.W(Qal + Qa2)
Note: Subscripts 1 and 2 refer to either the Khao Laem and Srinagarind Reservoirs in the Mae Klong River system or reservoirs 1 and 2 in this study, respectively. R is the sum of releases from reservoirs 1 and 2 while b{ and b2 are the conversion factors for associated losses due to water shortages and flood damages, respectively.
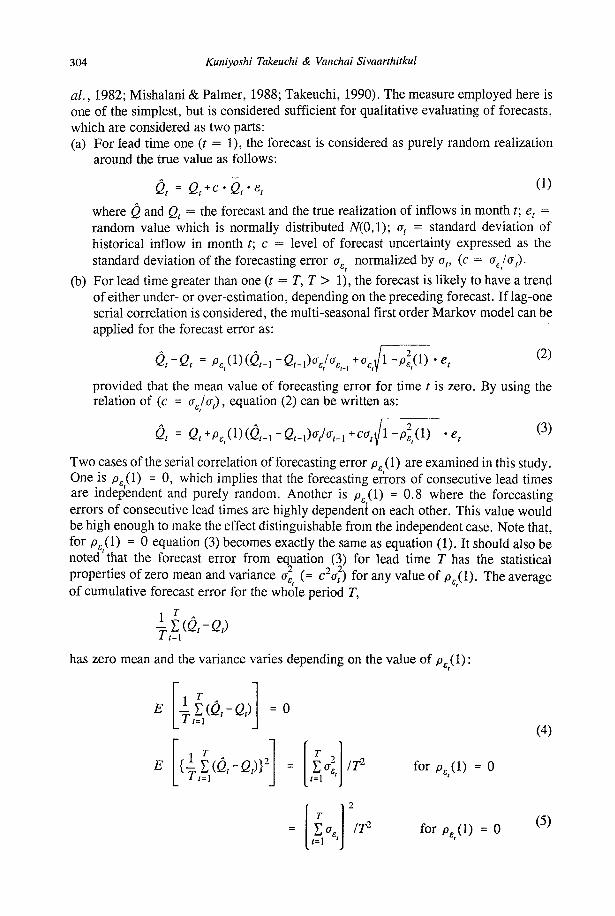
304 Kuniyoshi Takeuchi & Vanchai Sivaarthitkul
al., 1982; Mishalani & Palmer, 1988; Takeuchi, 1990). The measure employed here is one of the simplest, but is considered sufficient for qualitative evaluating of forecasts, which are considered as two parts: (a) For lead time one (t = 1), the forecast is considered as purely random realization
around the true value as follows:
Q, = Q,*C'Qret (!)
where Q and Qt = the forecast and the true realization of inflows in month t; et = random value which is normally distributed iV(0,l); a, = standard deviation of historical inflow in month t; c = level of forecast uncertainty expressed as the standard deviation of the forecasting error ae normalized by a,, (c — ae la).
(b) For lead time greater than one (t = T,T > 1), the forecast is likely to have a trend of either under- or over-estimation, depending on the preceding forecast. If lag-one serial correlation is considered, the multi-seasonal first order Markov model can be applied for the forecast error as:
Qr-Qr = Pei(l)(Gf_,-e,-l)VVi+°'«,V1-^(1) ' " (2)
provided that the mean value of forecasting error for time t is zero. By using the relation of (c = ff^la,), equation (2) can be written as:
Q, = G,+Pe,(l)(G,-, - & - > A - i +caJ\ -p-(l) • e, (3)
Two cases of the serial correlation of forecasting error p£(l) are examined in this study. One is p£(l) = 0, which implies that the forecasting errors of consecutive lead times are independent and purely random. Another is pc{\) = 0.8 where the forecasting errors of consecutive lead times are highly dependent on each other. This value would be high enough to make the effect distinguishable from the independent case. Note that, for pE{\) = 0 equation (3) becomes exactly the same as equation (1). It should also be noted'that the forecast error from equation (3) for lead time T has the statistical properties of zero mean and variance a] (= c2a^) for any value of p£(l). The average of cumulative forecast error for the whole period T,
has zero mean and the variance varies depending on the value of pE (1) :
= o
M ' IT1
(4)
for p£ (1) = 0
T
/=1 ' IT2 for Pe (1) = 0 (5)
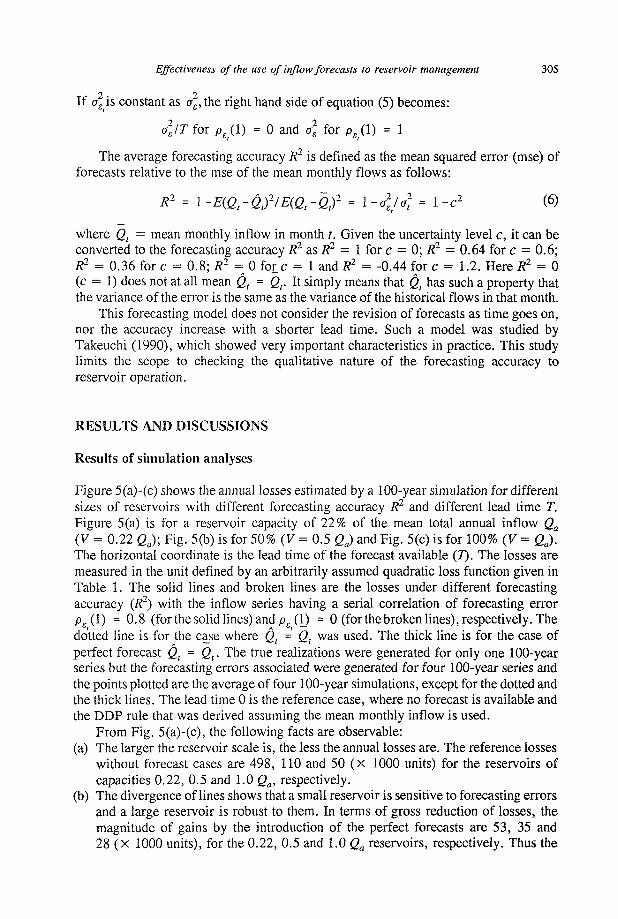
Effectiveness of the use of inflow forecasts to reservoir management 305
1 1
If aE is constant as ae, the right hand side of equation (5) becomes:
a~/T for p£ (1) = 0 and oe for p£ (1) = 1
The average forecasting accuracy R2 is defined as the mean squared error (mse) of forecasts relative to the mse of the mean monthly flows as follows:
R2 = 1 - E(Qt - QflE{Qt - Q)2 = 1 - a\l o? = 1 - c2 (6)
where Qt = mean monthly inflow in month t. Given the uncertainty level c, it can be converted to the forecasting accuracy R2 as R2 = 1 for c = 0; R2 = 0.64 for c = 0.6; R2 = 0.36 for c = 0.8; R2 = 0 for c = 1 and R2 = -0.44 for c = 1.2. Here i?2 = 0 (c = 1) does not at all mean Qt = Qr It simply means that Qt
nas such a property that the variance of the error is the same as the variance of the historical flows in that month.
This forecasting model does not consider the revision of forecasts as time goes on, nor the accuracy increase with a shorter lead time. Such a model was studied by Takeuchi (1990), which showed very important characteristics in practice. This study limits the scope to checking the qualitative nature of the forecasting accuracy to reservoir operation.
RESULTS AND DISCUSSIONS
Results of simulation analyses
Figure 5(a)-(c) shows the annual losses estimated by a 100-year simulation for different sizes of reservoirs with different forecasting accuracy R2 and different lead time T. Figure 5(a) is for a reservoir capacity of 22% of the mean total annual inflow Qa
(V = 0.22 Qa); Fig. 5(b) is for 50% (V = 0.5 QJ and Fig. 5(c) is for 100% (V = Qa). The horizontal coordinate is the lead time of the forecast available (7). The losses are measured in the unit defined by an arbitrarily assumed quadratic loss function given in Table 1. The solid lines and broken lines are the losses under different forecasting accuracy (R2) with the inflow series having a serial correlation of forecasting error pe(l) = 0.8 (for the solid lines) and ps (1) = 0 (for the broken lines), respectively. The dotted line is for the case where Qt = Qt was used. The thick line is for the case of perfect forecast Qt = Qr The true realizations were generated for only one 100-year series but the forecasting errors associated were generated for four 100-year series and the points plotted are the average of four 100-year simulations, except for the dotted and the thick lines. The lead time 0 is the reference case, where no forecast is available and the DDP rule that was derived assuming the mean monthly inflow is used.
From Fig. 5(a)-(c), the following facts are observable: (a) The larger the reservoir scale is, the less the annual losses are. The reference losses
without forecast cases are 498, 110 and 50 (X 1000 units) for the reservoirs of capacities 0.22, 0.5 and 1.0 Qa, respectively.
(b) The divergence of lines shows that a small reservoir is sensitive to forecasting errors and a large reservoir is robust to them. In terms of gross reduction of losses, the magnitude of gains by the introduction of the perfect forecasts are 53, 35 and 28 (x 1000 units), for the 0.22, 0.5 and 1.0 Qa reservoirs, respectively. Thus the
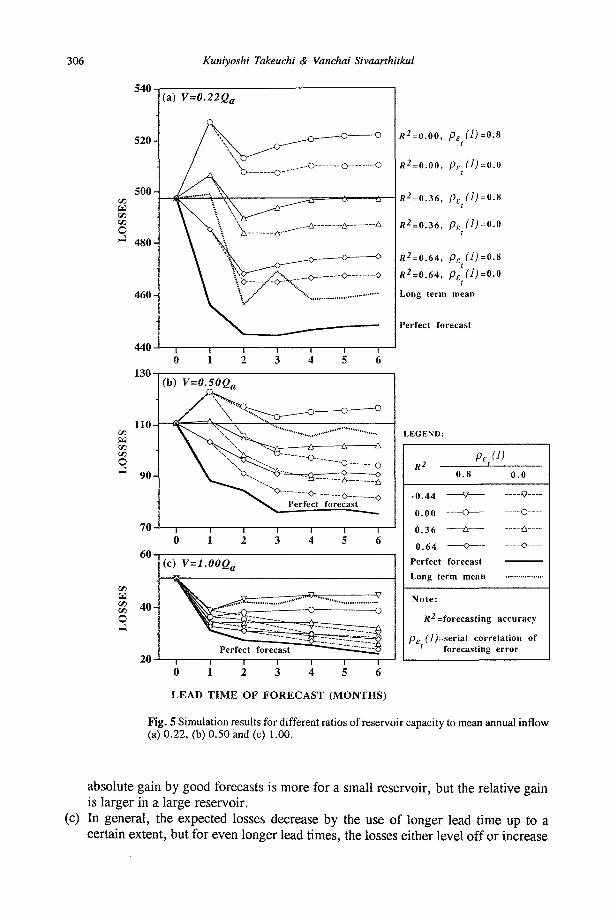
306 Kuniyoshi Takeuchi & Vanchai Sivaarthitkul
540
520
500 CO
ta CO co O
480 4
460
440
130-
(a) V=0.22Qa
110-
w CO CO
O
co Ed CO co O
70-
60
40
20
(b) F=0.50<2 f l
(c) V=1.00Qa
/?2 = 0.00, P £ (7) =0.8
«2 = 0.00, pf
R2 = 0.36, p ,
fl2 = 0.36, P£
R2 = 0.64, pe
fl2 = 0.64, Pj
M =0.0
M=0.8
^J=0.0
(7j=0.8
a ; =o.o
Long term mean
Perfect forecast
LEGEND
R2
-0 .44
0 .00
0 .36
0.64
Perfect
Pe, 0.8
_ ^ _
— o — A
0
forecast
Long term mean
Note :
R2 =
Pr (lh t
forecasting
(J)
0.0
—-V-—
—- o-— - — • & - —
O-—
accuracy
=seriai correlation of forecasting error
LEAD TIME OF FORECAST (MONTHS)
Fig. 5 Simulation results for different ratios of reservoir capacity to mean annual inflow (a) 0.22, (b) 0.50 and (c) 1.00.
absolute gain by good forecasts is more for a small reservoir, but the relative gain is larger in a large reservoir.
(c) In general, the expected losses decrease by the use of longer lead time up to a certain extent, but for even longer lead times, the losses either level off or increase
Effectiveness of the use of inflow forecasts to reservoir management 307
again. The exceptions are the increases of losses for lead time T = 1 (the spikes at T = 1) in 0.22 and 0.5 Qa reservoirs for the accuracy less than R2 = 0.36. Those spikes are not observable in a large reservoir of 1.0 Qa.
(d) If the forecasting accuracy is the same, the continued existence of errors or the higher serial correlation pE (1) in errors, increases the expected losses compared with the case that the errors' are independent of each other.
(e) If the perfect forecast (R2 = 1) were available, its use would reduce the losses a great deal. The longer the lead time is, the more losses are avoided. An exception is the case of a small reservoir in Fig. 5(a) where the minimum is at T = 2 — 3.
(f) The location of dotted lines or the relative usefulness of long-term monthly mean as compared with hydro-meteorological forecasts, differs greatly by the size of reservoirs. In a small reservoir V = 0.22 Qa, its use is nearly as good as the perfect forecasts or between the lines of R2 = 0.64 and 1. In the case of V = 0.5 Qa, however, it is very bad around R2 — 0 — 0.36 (for p£ (1) = 0.8) and poorer than R2 = 0 (for p£(l) = 0); and in the case of V = Qa, it is even worse around R2 = -0.44 - Ô (for p (1) = 0.8) and much poorer than R2 = 0 (for pE (1) = 0).
DISCUSSIONS
The calculated curves are not necessarily very smooth but bear various unreasonable undulations, especially for the long-term mean (dotted lines) and the perfect (thick lines) cases. The reasons may be the sampling variation due to the short-term simulation (100-year) and the round-off errors inherent to coarse discretization of DP analyses. The overall results, however, seem to deliver various strategic messages on the relative benefit of forecasts in different size reservoirs.
If the reservoir capacity is small, the forecasting error is very influential on the system performance. The allowable accuracy is R2 = 0.64 for V = 0.22 Qa in order to justify the use of meteorological forecast against the long-term historical means. On the other hand, if the reservoir size is as much as its total annual inflow, the justified forecasting accuracy is as low as R2 = —0.44.
The reason for (c), the odd spikes at T = 1, may be interpreted as follows: (a) In a relatively small reservoir, the over-estimate of the inflow leads to over-
withdrawal of water in order to avoid the expected flood. If the flood does not come, the mistake of the over-withdrawal cannot be recovered due to limited storage. This eventually causes a severe water shortage in water supply in the case where the water demand is relatively high. In this model, the annual water demand is assumed to be as much as 0.96 Qa and the water shortage loss is assumed to be three times as large as the flood loss for the same unit of water in the loss function, as listed in Table 1.
(b) However, for the lead time T = 2 or more, since the forecasting errors are random over time, the over-estimate of flood may be followed by under-estimate of ordinary flow, or vice versa, which reduces the chance and the effects of a mistake. The reduction is larger for broken lines, the independent cases for p£ (1) = 0) than the solid lines for p£(1) = 0.8). Note again that the forecast assumed in equation (3) is always unbiased for any lead time T and any value of p£ (1) but as equation (5) indicates, the variance of the average of cumulative forecasting error
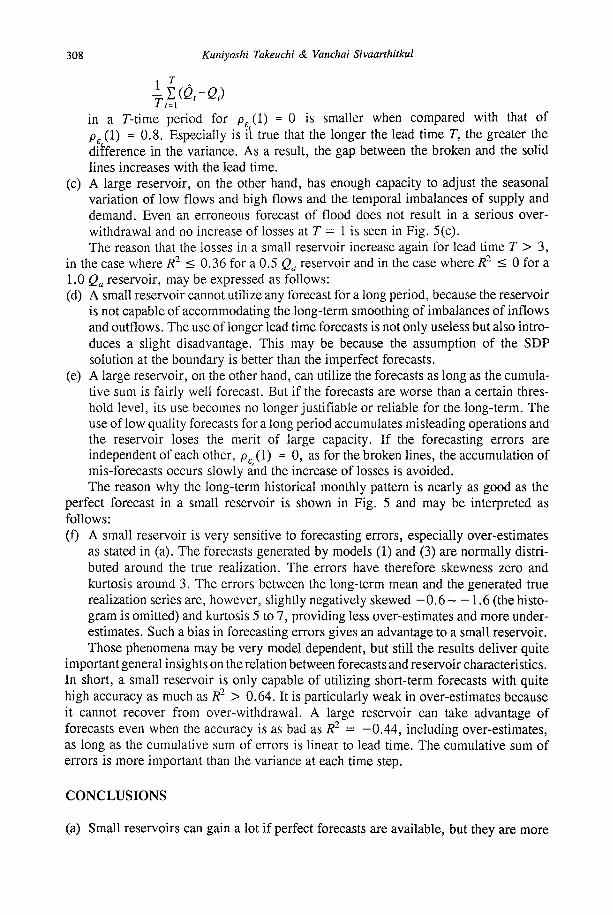
308 Kuniyoshi Takeuchi & Vanchai Sivaarthitkul
11=1
in a T-time period for pe(l) = 0 is smaller when compared with that of pE (1) = 0.8. Especially is i't true that the longer the lead time T, the greater the difference in the variance. As a result, the gap between the broken and the solid lines increases with the lead time.
(c) A large reservoir, on the other hand, has enough capacity to adjust the seasonal variation of low flows and high flows and the temporal imbalances of supply and demand. Even an erroneous forecast of flood does not result in a serious over-withdrawal and no increase of losses at T = 1 is seen in Fig. 5(c). The reason that the losses in a small reservoir increase again for lead time T > 3,
in the case where R2 < 0.36 for a 0.5 Qa reservoir and in the case where R2 < 0 for a 1.0 Qa reservoir, may be expressed as follows: (d) A small reservoir cannot utilize any forecast for a long period, because the reservoir
is not capable of accommodating the long-term smoothing of imbalances of inflows and outflows. The use of longer lead time forecasts is not only useless but also introduces a slight disadvantage. This may be because the assumption of the SDP solution at the boundary is better than the imperfect forecasts.
(e) A large reservoir, on the other hand, can utilize the forecasts as long as the cumulative sum is fairly well forecast. But if the forecasts are worse than a certain threshold level, its use becomes no longer justifiable or reliable for the long-term. The use of low quality forecasts for a long period accumulates misleading operations and the reservoir loses the merit of large capacity. If the forecasting errors are independent of each other, p£ (1) = 0, as for the broken lines, the accumulation of mis-forecasts occurs slowly and the increase of losses is avoided. The reason why the long-term historical monthly pattern is nearly as good as the
perfect forecast in a small reservoir is shown in Fig. 5 and may be interpreted as follows: (f) A small reservoir is very sensitive to forecasting errors, especially over-estimates
as stated in (a). The forecasts generated by models (1) and (3) are normally distributed around the true realization. The errors have therefore skewness zero and kurtosis around 3. The errors between the long-term mean and the generated true realization series are, however, slightly negatively skewed —0.6 1.6 (the histogram is omitted) and kurtosis 5 to 7, providing less over-estimates and more underestimates. Such a bias in forecasting errors gives an advantage to a small reservoir. Those phenomena may be very model dependent, but still the results deliver quite
important general insights on the relation between forecasts and reservoir characteristics. In short, a small reservoir is only capable of utilizing short-term forecasts with quite high accuracy as much as R2 > 0.64. It is particularly weak in over-estimates because it cannot recover from over-withdrawal. A large reservoir can take advantage of forecasts even when the accuracy is as bad as R2 = -0.44, including over-estimates, as long as the cumulative sum of errors is linear to lead time. The cumulative sum of errors is more important than the variance at each time step.
CONCLUSIONS
(a) Small reservoirs can gain a lot if perfect forecasts are available, but they are more
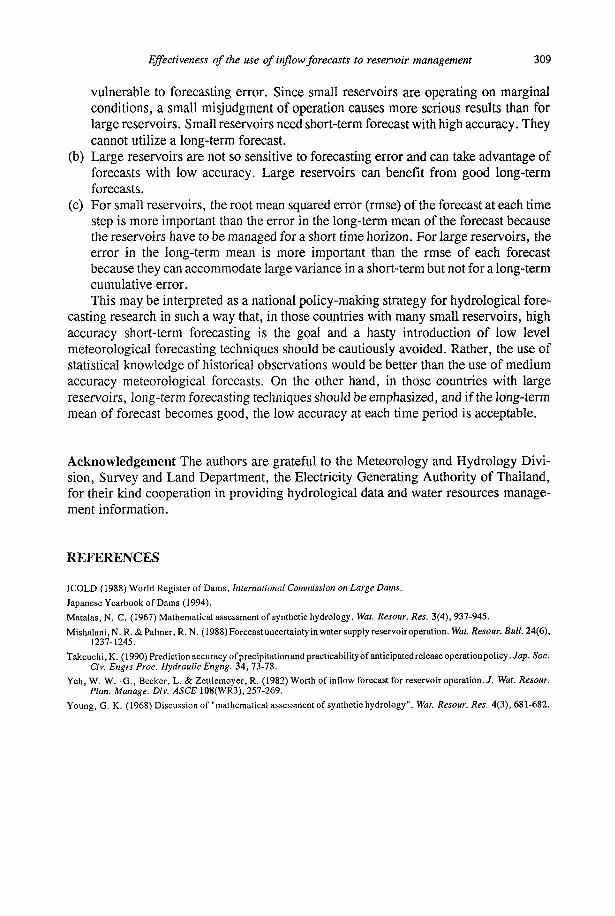
Effectiveness of the use of inflow forecasts to reservoir management 309
vulnerable to forecasting error. Since small reservoirs are operating on marginal conditions, a small misjudgment of operation causes more serious results than for large reservoirs. Small reservoirs need short-term forecast with high accuracy. They cannot utilize a long-term forecast.
(b) Large reservoirs are not so sensitive to forecasting error and can take advantage of forecasts with low accuracy. Large reservoirs can benefit from good long-term forecasts.
(c) For small reservoirs, the root mean squared error (rmse) of the forecast at each time step is more important than the error in the long-term mean of the forecast because the reservoirs have to be managed for a short time horizon. For large reservoirs, the error in the long-term mean is more important than the rmse of each forecast because they can accommodate large variance in a short-term but not for a long-term cumulative error. This may be interpreted as a national policy-making strategy for hydrological fore
casting research in such a way that, in those countries with many small reservoirs, high accuracy short-term forecasting is the goal and a hasty introduction of low level meteorological forecasting techniques should be cautiously avoided. Rather, the use of statistical knowledge of historical observations would be better than the use of medium accuracy meteorological forecasts. On the other hand, in those countries with large reservoirs, long-term forecasting techniques should be emphasized, and if the long-term mean of forecast becomes good, the low accuracy at each time period is acceptable.
Acknowledgement The authors are grateful to the Meteorology and Hydrology Division, Survey and Land Department, the Electricity Generating Authority of Thailand, for their kind cooperation in providing hydrological data and water resources management information.
REFERENCES
ICOLD (1988) World Register of Dams, International Commission on Large Dams.
Japanese Yearbook of Dams (1994).
Matalas, N. C. (1967) Mathematical assessment of synthetic hydrology. War. Resour. Res. 3(4), 937-945.
Mishalani.N. R. & Palmer, R. N. (1988) Forecast uncertainty in water supply reservoiroperation. Wat. Resour. Bull. 24(6), 1237-1245.
Takeuchi, K. (1990) Prediction accuracy of precipitationand practicability of anticipatedreleaseoperationpolicy. Jap. Soc. Civ. Engrs Proc. Hydraulic Engng. 34, 73-78.
Yeh, W. W. -G., Becker, L. & Zettlemoyer, R. (1982) Worth of inflow forecast for reservoir operation. / . Wat. Resour. Plan. Manage. Div. ASCE 108(WR3), 257-269.
Young, G. K. (1968) Discussion of "mathematical assessmentof synthetic hydrology". Wat. Resour. Res. 4(3), 681-682.

Copyright © 2022 FDOKUMEN