Sequence-specific priming and exonuclease-released fluorescence assay for rapid and reliable HLA-A...
16
Copyriglrr 0 Muitk.r.qci<ircl 1996 TISSUE ANTIGENS ISSN 0001-2815 Sequence-specific priming and exonuclease-released fluorescence detection of HLA-DQB1 alleles S. J. Faas, R. Menon, E. R. Braun, W. A. Ruden, M. Trucco. Sequence-specific priming and exonuclease-released fluorescence detection of HLA-DQB 1 alleles. Tissue Antigens 1996: 48: 97-1 12.0 Munksgaard, 1996 Molecular typing of HLA DQB 1 alleles, employing sequence-specific primers (SSP) for PCR amplification, was used to test a novel method that eliminates the requirement for subsequent gel electrophoresis or additional hybridization steps by directly detecting positive reactions. We have evaluated the perfor- mance of this fluorescence-based oligonucleotide probe assay to assign the most common DQB 1 alleles on DNA from 14 homozygous cell lines and in a blind study of 50 diabetic patient samples that had been previously typed at the DQB 1 locus using SSOP and conventional SSP-based approaches. We used a panel of 14 DQB 1 SSP primer pairs, internal control primers, and a combination of 4 fluorescent oligonucleotide probes to detect 14 alleles or groups of alleles and controls. We can reliably detect single-base allelic differ. ences, observe 100% concordance with the results obtained using both of the standard methods, and are able to further subtype several alleles that are not easily distinguished using SSOP (e.g. DQB I *0401/0402 and DQB I *0302/ 0303). Sequence-specific priming and exonuclease-released fluorescence (SSPERF) detection is technically simple and can be performed in less than 2 hours, including DNA extraction, PCR amplification, data analysis and allele identification. This method is particularly useful for the analysis of large num. bers of samples, for which high throughput is critical and for which gel-based approaches are difficult to perform. This technique may also be useful for small-scale class I and class I1 molecular typing in clinically oriented labora- High-resolution HLA class I1 typing at the molecular level has become a routine laboratory assay, provid- ing considerable information in such diverse areas as transplantation biology (1 -3), population genetics (4- 6) and disease susceptibility (7-9). These advances in class I1 molecular typing have been made possible by the development and application of a variety of tech- niques including restriction fragment length poly- morphism (RFLP) analysis (10-14), polymerase chain reaction (PCR) DNA amplification (15.16). PCR-RFLP ( 17-20), sequence-specific oligonucle- otide probe (SSOP) hybridization (2 1-23). PCR ani- plification using sequence-specific primers (PCR- SSP) (24-26). “reverse” dot blot hybridization (27- 29). and finally. direct sequencing (30). S. J. Faas, R. Menon, E. R. Braun, W. A. Rudert and M. Trucco Division of Immunogenetics, Department of Pediatrics, Ufliversity of Pittsburgh, School of Medicine, Pittsburgh, Pennsylvania, USA Key words: fluorescence detection -sequence- specific primer- HLA-DQBI -molecular typing - 5’ exonuclease Received 15 November 1995, revised, accepted for publication 5 February 1996 Serology, SSOP and SSP are the principal techni- cal approaches used for the detection of class I and class I1 alleles. Each, approach has its own advan- tages and.disadvantages. Current serologic methods, while highly specific, demand the use of nonrenew- able pools of antisera that must be continually tested and validated, and which may not adequately detect alleles associated with different racial or ethnic groups. For example, some of the phenotypic poly- morphisms within the DQB I locus are not revealed by serological typing (3 1, 32). The SSOP-based assay is currently widely used for the detection of HLA-DRB polymorphisms. While this assay is more feasible for testing large numbers of samples, it has the disadvantage of tak- 97
Transcript of Sequence-specific priming and exonuclease-released fluorescence assay for rapid and reliable HLA-A...
Copyriglrr 0 Muitk.r.qci<ircl 1996
T I S S U E A N T I G E N S ISSN 0001-2815
Sequence-specific priming and exonuclease-released fluorescence detection of HLA-DQB1 alleles
S . J. Faas, R. Menon, E. R. Braun, W. A. Ruden, M. Trucco. Sequence-specific priming and exonuclease-released fluorescence detection of HLA-DQB 1 alleles. Tissue Antigens 1996: 48: 97-1 12.0 Munksgaard, 1996
Molecular typing of HLA DQB 1 alleles, employing sequence-specific primers (SSP) for PCR amplification, was used to test a novel method that eliminates the requirement for subsequent gel electrophoresis or additional hybridization steps by directly detecting positive reactions. We have evaluated the perfor- mance of this fluorescence-based oligonucleotide probe assay to assign the most common DQB 1 alleles on DNA from 14 homozygous cell lines and in a blind study of 50 diabetic patient samples that had been previously typed at the DQB 1 locus using SSOP and conventional SSP-based approaches. We used a panel of 14 DQB 1 SSP primer pairs, internal control primers, and a combination of 4 fluorescent oligonucleotide probes to detect 14 alleles or groups of alleles and controls. We can reliably detect single-base allelic differ. ences, observe 100% concordance with the results obtained using both of the standard methods, and are able to further subtype several alleles that are not easily distinguished using SSOP (e.g. DQB I *0401/0402 and DQB I *0302/ 0303). Sequence-specific priming and exonuclease-released fluorescence (SSPERF) detection is technically simple and can be performed in less than 2 hours, including DNA extraction, PCR amplification, data analysis and allele identification. This method is particularly useful for the analysis of large num. bers of samples, for which high throughput is critical and for which gel-based approaches are difficult to perform. This technique may also be useful for small-scale class I and class I1 molecular typing in clinically oriented labora-
High-resolution HLA class I1 typing at the molecular level has become a routine laboratory assay, provid- ing considerable information in such diverse areas as transplantation biology (1 -3), population genetics (4- 6 ) and disease susceptibility (7-9). These advances in class I1 molecular typing have been made possible by the development and application of a variety of tech- niques including restriction fragment length poly- morphism (RFLP) analysis (10-14), polymerase chain reaction (PCR) DNA amplification (15.16). PCR-RFLP ( 17-20), sequence-specific oligonucle- otide probe (SSOP) hybridization (2 1-23). PCR ani- plification using sequence-specific primers (PCR- SSP) (24-26). “reverse” dot blot hybridization (27- 29). and finally. direct sequencing (30).
S. J. Faas, R. Menon, E. R. Braun, W. A. Rudert and M. Trucco Division of Immunogenetics, Department of Pediatrics, Ufliversity of Pittsburgh, School of Medicine, Pittsburgh, Pennsylvania, USA
Key words: fluorescence detection -sequence- specific primer- HLA-DQBI -molecular typing - 5’ exonuclease Received 15 November 1995, revised, accepted for publication 5 February 1996
Serology, SSOP and SSP are the principal techni- cal approaches used for the detection of class I and class I1 alleles. Each, approach has its own advan- tages and.disadvantages. Current serologic methods, while highly specific, demand the use of nonrenew- able pools of antisera that must be continually tested and validated, and which may not adequately detect alleles associated with different racial or ethnic groups. For example, some of the phenotypic poly- morphisms within the DQB I locus are not revealed by serological typing (3 1, 32).
The SSOP-based assay is currently widely used for the detection of HLA-DRB polymorphisms. While this assay is more feasible for testing large numbers of samples, it has the disadvantage of tak-
97
Faas et al.
ing approximately four days from DNA extraction to allele designation. High-resolution analysis of the DQB 1 alleles is more challenging than DRB 1 anal- ysis using SSOP. Laboratories employing SSOP analysis of DQB 1 alleles often report difficulties in assigning some alleles due to cross reactivities among the probes used. SSOP analysis is also lim- ited in identifying certain heterozygous combina- tions that yield identical probe patterns with other heterozygous combinations.
The third type of approach described by a number of groups (24-26) uses sequence-specific primers (SSP) and PCR in a gel-based assay, in which the presence and length of the PCR product is the final readout. For example, Olerup and colleagues have described a set of SSP primers that defines 13 of the most common alleles at the DQBl locus (24). SSP has also been employed to identify alleles at the DRB 1 (25) and HLA class I loci (33-36). The speci- ficity of PCR priming is augmented by inhibiting nonspecific amplification through the introduction of a nucleotide mismatch near the 3’ end of the primer (37). Although this strategy demands that a panel of PCR reactions be performed on each sam- ple tested, an SSP-based approach can offer higher resolution than SSOP alone. The number of speci- ficities identified by this approach can continue to expand with the implementation of new or slightly modified primers, or by performing a “two-step” as- say that incorporates a second round of PCR with additional primer sets.
The SSP approach offers several positive features for molecular typing: first, a DNA template can be used, thus obviating the requirement and expense of using viable cells as the source of mRNA for typing (a prerequisite for certain typing strategies (30)). Second, the amplified fragments are short enough that they can be validated or confirmed by sequenc- ing during the course of assay development. Third, from DNA extraction to allele identification, reli- able and easily interpretable results can be gener- ated in a few hours (24, 25). This short timeframe makes the SSP molecular alternative especially ap- pealing for clinical HLA laboratories involved with cadaveric transplantation.
Although the SSP strategy is particularly well- suited for laboratories that analyze small numbers of samples, a gel-based strategy is less feasible for lab- oratories performing large-scale molecular typing. We wanted to design a molecular typing strategy that would combine the high-throughput advantage of SSOP with the speed, high resolution and relative ease of SSP analysis. To this end, we have used SSP together with a modification of a recently described method that permits the amplification and direct de- tection of specitic target DNA (38) with no require-
98
ment for post-amplification hybridization or gel analysis steps. This assay takes advantage of the 5’ to 3’ exonuclease activity of the Taq DNA poly- merase normally used in PCR DNA amplification (39). An oligonucleotide probe, labelled at the 5’ end with a “reporter” fluorescent dye and at the 3’ end with a “quencher” fluorescent dye, is added to each PCR reaction containing allele-specific prim- ers. Internal control primers and a second doubly-la- belled fluorescent probe containing a spectrally dis- tinct 5‘ reporter dye are also present in each PCR re- action. The annealing of either probe to its comple- mentary PCR template strand during the course of amplification generates a substrate suitable for exo- nuclease attack. Cleavage of the hybridized probe generates smaller fragments that physically release the reporter from the quenching residue, enabling its detection by an increase in sample fluorescence (Fig. 1). Thus the accumulation of specifically-am- plified DNA product is detected only under condi- tions in which the fluorogenic probe hybridizes to
A
B
C
D Figure I. Schematic of sequence-specific priming and exonu- clease-released fluorescence detection. A) Hybridization of a doubly-labelled fluorogenic probe to target DNA sequences during PCR amplification. The positions of the reporter dye (FAM or HEX) and the quencher dye (TAMRA) are indicated by the symbols 0 and 0, respectively. The 3’ phosphate is indi- cated by the k. The increased length of the probes (relative to that of the primers) favors the hybridization of the probe prior to the annealing of the primers. B) Primer annealing to the tem- plate DNA. C) Extension of the primer by Tat1 polymerase. D) Encounter of the double-stranded templnte Formed by hybrid- izution of the probe initiates clenvnge of the probe at its 5’ end by T q polymerase. Clenvnge of the probe physically separates the reporter and quencher dye iiiolecules, which ithrogates the quencher effect nnd results i n ;in iiicre;ise in rcportcr Huores- cence.
SSPERF detection of HLA/DQBl alleles Table 1. Homozygous cell lines, primers and fluorescent probes used for the SSPERF assay
HLA-DQB1 Other alleles Cell line allele Primer set5 Amplified Probe
EHM ‘0501 (1) 8-5’014-3’01 Q B O ~ SP0010 ‘0502 (2) 8-5‘024-3’02 Q B O ~
FUR0 ‘0601 (4) 8-5’034-3’04 Q B O ~
wT47 ‘0604 (7) B-5‘06tB-3’06 Q B O ~ H0301 ‘0605 Y (8) 8-5’134-3’06 P B O ~ cox ’0201 (9) 8-5’074-3’07 111302 BM16 ‘0301 (10) B - S O ~ + B - ~ ’ O ~ *a304 Q B O ~
YT ‘0401 (13) 8-5’104-3’11 0805 MADURA ‘0402 (14) 6-5’1 1 tB-3‘11 Q B O ~
EK ‘0503 (3) 8-5’024-3‘03 0805 GN009 ‘0504 8-5’124-3’02 * 0805
PGF ‘0602 (5) 8-5’04tB-3‘05 0605 CB6B *0603 (6) 8-5’05tB-3’05 “0607 R 0605
WT5 1 ‘0302 (1 1) 8-5‘08tB-3‘08 t ‘0201 0803 OKB ‘0303 (1 2) 8-5‘08tB-3’10 t 0803
ORB intron All reactions all ORB C5tC3
the amplified DNA and is enzymatically cleaved by the Taq polymerase. The fluorescence signal is read directly from the PCR reaction mixture using a fluo- rescence spe’ctrometer.
Material and methods Cells and cell lines
A panel of homozygous cell lines from the 11 th In- ternational Workshop covering 15 different DQB 1 alleles was used as the source of DNA to establish the method (Table 1). DNA was prepared from cell lines and from peripheral blood lymphocytes ob- tained from 50 unrelated patients with insulin-de- pendent diabetes mellitus (IDDM) using a modified salting-out protocol (40).
Sequence specific oligonucleotide probe (SSOP) based typing
Dot blotting and SSOP hybridization of generic DQBl PCR reaction products were performed as previously described (23) with some modifications. Briefly, DNAs from homozygous cell lines and pa- tient samples were subjected to PCR using primers that amplify all HLA-DQB 1 alleles. The amplifica- tion products were dotted onto positively-charged nylon membranes (Boehringer Mannheim, India- napolis, IN) and hybridized using a panel of fluores- ceinated oligonucleotide probes. Hybridization was carried out for 2 hours at 42°C in buffer containing 50mM Tris-HC1 (pH 8.0), 3.OM tetramethylammo- nium chloride (TMAC), 2mM EDTA and 0.1% SDS. Following hybridization and washing, the an- nealing of specific probes was revealed by incuba- tion of the membranes with an anti-fluorescein- horseradish peroxidase (HRP) conjugate, followed by detection of the bound peroxidase using an ECL detection system (Amersham, Arlington Heights, IL) .
Sequence-specific primers (SSP) for DQBI typing
The SSP assay was tested and validated using 14 se- quence-specific pairs of primers for HLA-DQB 1 al- lele DNA amplification, selected according to Ole- rup et al. (24). In each PCR reaction, a segment of the third DRBl intron was co-amplified as a posi- tive control (24). Sense and anti-sense DQBl and control primers are listed in Table 1. All primers were generated in our laboratory by standard meth- ods using an ABI 394 automated DNA synthesizer (Applied Biosystems, Foster City. CAI.
Cell lines are homozygous for the indicated OQBl allele with the exception of GN009, which is a ‘0504/’0201 heterozygote. 5 The combination of primers used for detection of each 0081 allele and for
detection of the ORB intron are taken directly from reference 24. Note that some primer pairs amplify more than one allele.
4 This primer pair was included in the initial testing to establish the method, but was not included in routine assays because of the rarity of the ‘0504 al- lele. The remainder of the primer pairs (14 total) constituted the panel de- scribed in the text.
# In addition to ‘0603, the primer pair 8-5‘05tB-3’05 amplifies 0081 ‘0607 (45) rather than ‘0608 as was originally described (24).
Y The H0301 cell line has been recently designated as ‘0609 (46). The ampli- fication of a true ‘0605 allele using this primer pair has not yet been con- firmed in our laboratory.
t The sequence of primer 8-3’08 was modified from that originally described (24) to include two additional bases at the 5’ end, as well as an inosine sub- stitution as follows: 5’ggctgttccagtactcgicgg-3’. The sequence of primer B- 3’10 was similarly modified as follows: Sggctgttccagtactiggcgt-3’. These changes improved the efficiency and specificity of the primers.
Fluorescent DQBI-specific and DRBI control probes
Three fluorescent probes (QB02, QB03 and QB05) were generated that differentially hybridize with DNA sequences internal to the sequence-specific primers used for DQBI-SSP. A fourth fluorescent probe, specific for a segment of the DRBl third in- tron, was also generated to reveal amplification of the internal-control sequences in each PCR reaction. Each DQB 1 probe was synthesized with the reporter dye 6-carboxyfluorescein (6-FAM, Applied Biosys- tems, Foster City, CA) at the 5’ end and at the 3’ end, an amino-modifier C6 dT linker (L) arm nucleotide (Glen Research, Sterling, VA) followed by a 3’ phos- phate (Phosphalink, Applied Biosysterns, Foster City, CA) to prevent extension of the hybridized probe during PCR amplification. (These reagents were diluted with acetonitrile and coupled to the ex- tending oligonucleotides under conditions specified by the rnanufxturers.) A different reporter dye. 4.7, 2’. 4’. 7’. 5’-hexachloro-6-carboxyHuol-escei1~ (HEX, Applied Biosystenis. Foster City, CA) was siniilnrly
99
Faas et al.
attached to the 5' end of the control probe. Following deprotection, the singly-labelled oligonucleotides were ethanol precipitated, resuspended in 0.25 M NaHCO,/Na,CO, (pH 9.0), and incubated overnight at 37°C with the quencher dye 6-carboxy-tetrameth- ylrhodamine (TAMRA NHS ester, Applied Biosys- tems, Foster City, CA). Unreacted dye was removed by passage of the reaction mixture over a PD-10 Sephadex column (Pharmacia Biotech Inc., Piscat- away, NJ). FAM-TAMRA and HEX-TAMRA dou- bly-labelled probes were purified by reverse-phase HPLC using a DeltaPak C18 column (Waters, Bed- ford, MA) and an acetonitrile gradient that ranged from 10-80% acetonitrile in 0.1M triethyl ammo- nium acetate (pH 7.0). The detailed conditions of HPLC purification will be published elsewhere (Braun, E. et al., manuscript in preparation). Individ- ual fractions were collected, dried down, ethanol precipitated, resuspended in sterile water and evalu- ated both for DNA concentration (by measuring the absorbance at 260nm) and for low ( 4 ) reporter-to- quencher ratios by measuring emission intensities at 518, 556 and 580nm (the approximate maximum emission intensities for FAM, HEX and TAMRA, respectively) with the excitation wavelength set at 488nm. The sequences and melting temperatures of the fluorescent probes are as follows:
QB02:5'FAM-ccgagaagagatcgcacgcttcgaca- L(TAMRA)PO,-3' (8OOC)
QB03: 5'FAM-cgagaggagtacgcacgcttcgacagc- L(TAMRA)PO,-3' (8 1°C)
7 ,
QB05: 5'F~-ataaccgagag>acgtgcgcttcgac-
DRCON: S'HEX-tcccacatcctattttcatttgctcca- L(TAMRA)PO4-3' (80°C)
L(TAMRA)PO,-3' (75°C).
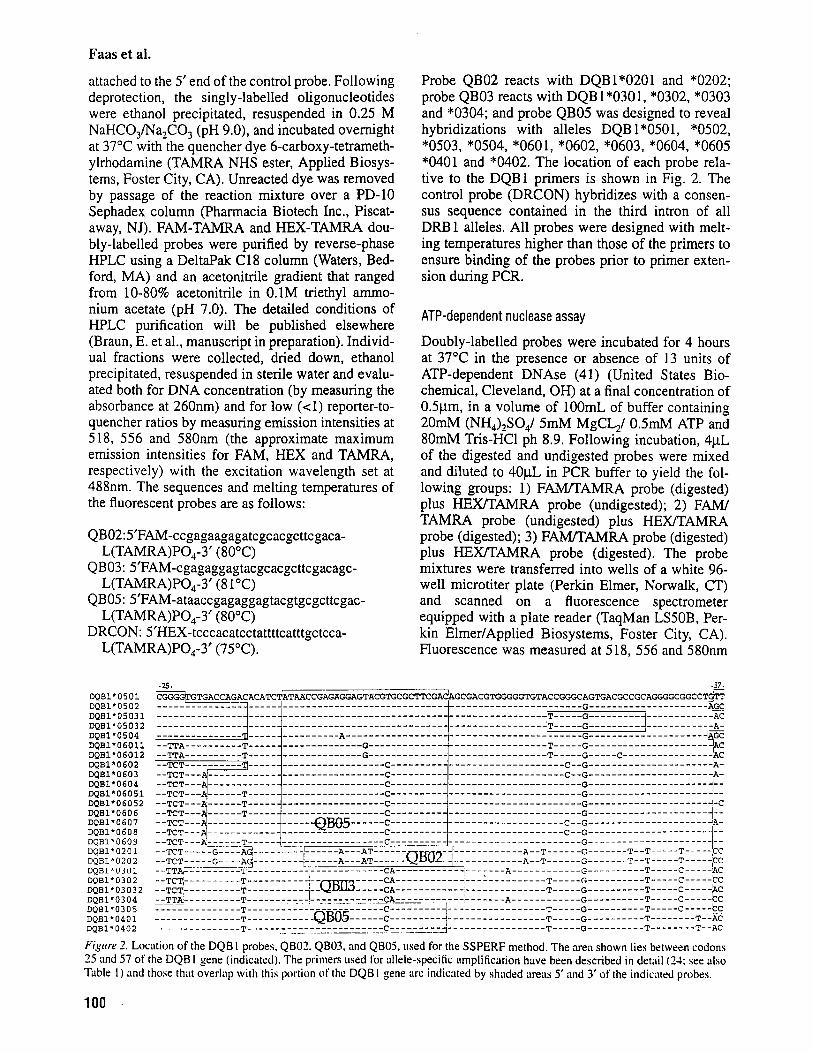
Probe QB02 reacts with DQB1*0201 and *0202; probe QB03 reacts with DQB1*0301, *0302, *0303 and *0304; and probe QB05 was designed to reveal hybridizations with alleles DQB 1*0501, "0502, "0503, *0504, "0601, *0602, *0603, *0604, *0605 *0401 and *0402. The location of each probe rela- tive to the DQBl primers is shown in Fig. 2. The control probe (DRCON) hybridizes with a consen- sus sequence contained in the third intron of all DRBl alleles. All probes were designed with melt- ing temperatures higher than those of the primers to ensure binding of the probes prior to primer exten- sion during PCR.
ATP-dependent nuclease assay
Doubly-labelled probes were incubated for 4 hours at 37°C in the presence or absence of 13 units of ATP-dependent DNAse (41) (United States Bio- chemical, Cleveland, OH) at a final concentration of OSpm, in a volume of lOOmL of buffer containing 20mM (NH4),SO4/ 5mM MgCL,/ 0.5m.M ATP and 80mM Tris-HCl ph 8.9. Following incubation, 4pL of the digested and undigested probes were mixed and diluted to 40pL in PCR buffer to yield the fol- lowing groups: 1) F M A M R A probe (digested) plus HEX/TAMRA probe (undigested); 2) FAM/ TAMRA probe (undigested) plus HEXfTAMRA probe (digested); 3) FAM/"AMRA probe (digested) plus HEX/TAMRA probe (digested). The probe mixtures were transferred into wells of a white 96- well microtiter plate (Perkin Elmer, Norwalk, CT) and scanned on a fluorescence spectrometer equipped with a plate reader (TaqMan LSSOB, Per- kin ElmedApplied Biosystems, Foster City, CA). Fluorescence was measured at 518, 556 and 580nm
100
SSPEFW detection of HLA/DQBl alleles
sophistication is certainly not required, we used i t to initially test the method and to provide an alternate means of confirming data obtained using a fluores- cence spectrometer. Intact probes could be easily re- solved from cleaved probes, both in the gel image and by histogram display of the migrated probe. Once the feasibility of the assay had been demon- strated, we began to use the following methodology to analyze the data from subsequent experiments: 40ml of each PCR amplification mixture were trans- ferred from the thermocycler tubes into wells of white 96-well microtiter plates (Perkin Elmer, Nor- walk, CT) and scanned on a fluorescence spectrom- eter equipped with a plate reader (TaqMan LSSOB, Perkin ElrnedApplied Biosystems, Foster City, CA). In each experiment, 40pL of the ATP-depen- dent DNAse digested and undigested probe mix- tures were also transferred to certain wells of the microtiter plate for comparison of fluorescence val-
as described above. Ratios of fluorescence intensity for FAM/TAMRA and HEXRAMRA were calcu- lated as described below.
PCR reactions
In preliminary experiments, “generic” amplifica- tions were performed using 1 lth International Histo- compatibility Workshop DQBampA and DQBampB primers (42), together with a single DQB 1-specific fluorogenic probe. PCR mixtures consisted of 500ng genomic DNA, lx PCR buffer (50mM KCV 2.0mM MgCL,/ lOmM Tris-C1 pH 8.3), 200mM of each dNTP, 0.25yM DQBl generic primers, 50nM fluo- rescent probe and 1.25 Ulreaction Taq polymerase. All subsequent experiments were performed using SSP primers: each PCR reaction mixture contained two DQBI-specific primers, one DQB 1-specific flu- orescent probe, two DRB 1 -specific control primers and one fluorescent DRB 1-positive control probe. The PCR mixtures consisted of 500ng genomic DNA, l x PCR buffer (50mM KCV2.0mM MgCL,/ lOmM Tris-C1 pH 8.3), 200mM of each dNTP, 0.25yM DQBl primers, 0.075pM DRB control primers, 50nM each fluorescent probe and 1.25 U/ reaction Taq polymerase. Negative controls con- sisted of lx PCR buffer containing both allele-spe- cific and internal control fluorescent probes and dNTPs. In a single 96-well format, a total of 6 sam- ples, including all controls, can be typed using the 14 DQBl primer pairs. PCR amplifications were performed in a GeneAmp PCR System 9600 ther- mocycler (Perkin Elmer, Norwalk CT) using both two-step and three-step cycling parameters with es- sentially similar results. Two-step reactions were performed as follows: 35 cycles of 95°C for 20 secl 65°C for 1 min, followed by a final extension of 72°C for 5 min. Three-step reactions consisted of 30 cycles of 96°C for 20sec/ 65°C for 30 sec and 72°C for 30 sec. Positive and negative amplifications were visualized by ethidium bromide staining following electrophoresis on a 1.5% agarose gel.
Fluorescence measurements
In preliminary experiments, a 0.3 pL aliquot of each PCR reaction was evaluated for evidence of probe cleavage by electrophoresis on 6% native polyacry- lamide gels in lx TBE (pH 8.3) and analysis of the size of the fluorescent probe and/or its cleavage products on a 373 DNA Sequencer using the GENESCAN analysis program (Applied Biosys- tems, Foster City, CA). Electrophoresis was per- formed for 90 minutes at constant power of 35 watts, and the gel visiinlized using the 53 1, 545. 560 and 580 nrn filter set. While this degree of analytical
2 5 0 300 350 2 5 0 300 350 , I
I I I
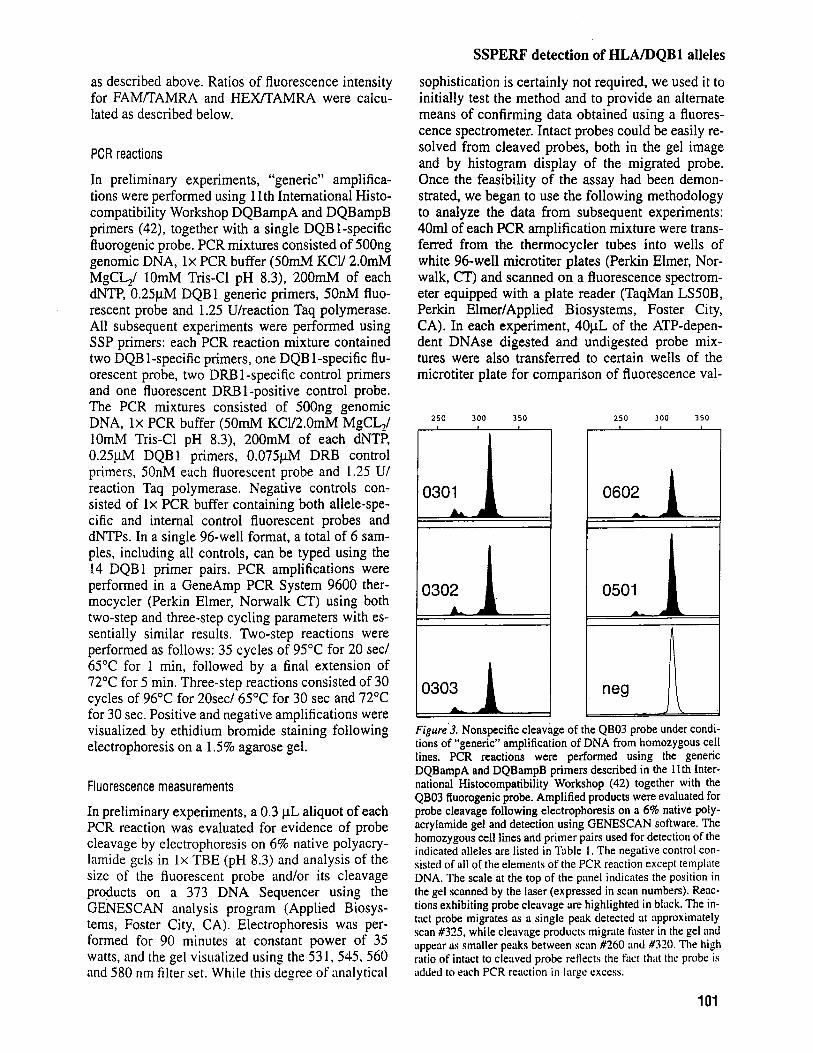
Figure.3. Nonspecific cleavage of the QB03 probe tinder condi- tions of “generic” amplification of DNA from homozygous cell lines. PCR reactions were performed using the generic DQBampA and DQBampB primers described in the 1 1 th Inter- national Histocompatibility Workshop (42) together with the QB03 fluorogenic probe. Amplified products were evaluated for probe cleavage following electrophoresis on a 6% native poly- acrylamide gel and detection using GENESCAN software. The homozygous cell lines and primer pairs used for detection of the indicated alleles are listed in Table 1 . The negative control con- sisted of all of the elements of the PCR reaction except template DNA. The scale at the top of the panel indicates the position in the gel scanned by the laser (expressed in scan numbers). Reac- tions exhibiting probe cleavage are highlighted in black. The in- tact probe migrates as a single peak detected iit approximately scan #335, while cleavage products migrate kister in the gel nnd uppear iis smaller peaks between scan #260 and #320. The high ratio of intact to cleaved probe reHrcts the fact that the probe is added to each PCR reaction in luge excess.
101
Faas et al.
250 300 350 400 250 300 350 400
0602 I
250 300 3 5 0 400 1
n
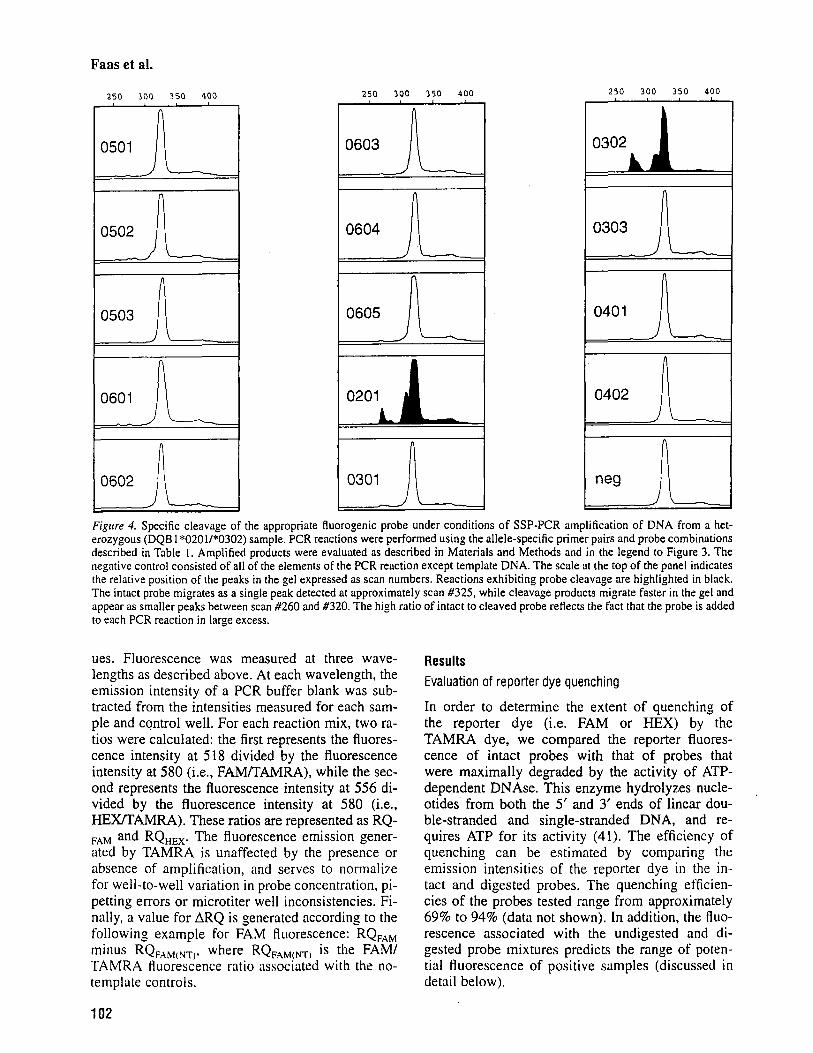
0402 A Figure 4. Specific cleavage of the appropriate Ruorogenic probe under conditions of SSP-PCR amplification of DNA from a het- erozygous (DQB 1 *0201/*0302) sample. PCR reactions were performed using the allele-specific primer pairs and probe combinations described in Table 1. Amplified products were evaluated as described in Materials and Methods and in the legend to Figure 3. The negative control consisted of all of the elements of the PCR reaction except template DNA. The scale at the top of the panel indicates the relative position of the peaks in the gel expressed as scan numbers. Reactions exhibiting probe cleavage are highlighted in black. The intact probe migrates as a single peak detected at approximately scan #325, while cleavage products migrate faster in the gel and appear as smaller peaks between scan #260 and #320. The high ratio of intact to cleaved probe reHects the fact that the probe is added to each PCR reaction in large excess.
ues. Fluorescence was measured at three wave- lengths as described above. At each wavelength, the emission intensity of a PCR buffer blank was sub- tracted from the intensities measured for each sam- ple and control well. For each reaction mix, two ra- tios were calculated: the first represents the fluores- cence intensity at 518 divided by the fluorescence intensity at 580 (i.e., FAMRAMRA), while the sec- ond represents the fluorescence intensity at 556 di- vided by the fluorescence intensity at 580 (i.e., HEXlTAMRA). These ratios are represented as RQ- FAM and RQ,,,. The fluorescence emission gener- ated by TAMRA is unaffected by the presence or absence of amplification, and serves to normalize for well-to-well variation in probe concentration, pi- petting errors or microtiter well inconsistencies. Fi- nally, a value for ARQ is generated according to the following example for FAM fluorescence: RQF.4, minus RQFAM,N-,-,, where RQF,qC,(NT, is the FAM/ TAMRA fluorescence ratio associated with the no- template controls.
Results Evaluation of reporter dye quenching
In order to determine the extent of quenching of the reporter dye (i.e. FAM or HEX) by the TAMRA dye, we compared the reporter fluores- cence of intact probes with that of probes that were maximally degraded by the activity of ATP- dependent DNAse. This enzyme hydrolyzes nucle- otides from both the 5’ and 3’ ends of linear dou- ble-stranded and single-stranded DNA, and re- quires ATP for its activity (41). The efficiency of quenching can be estimated by comparing the emission intensities of the reporter dye in the in- tact and digested probes. The quenching efficien- cies of the probes tested range from approximately 69% to 94% (data not shown). In addition, the fluo- rescence associated with the undigested and di- gested probe mixtures predicts the range of poten- tial fluorescence of positive samples (discussed in detail below).
,
102
SSPERF detection of HLA/DQBl alleles
Experimental Design 5 6 7 8 9 10 1 2 3 4 11 12
DRCON DRCON DRCON DRCON PCR
BUFFER * DRCOA
QB05 -l3R€m
QB05 DRCOP
QB05 DRCOb
QB05 DRCON
QB05 DRCON
QB02 DRCON
5.13.3.06
5.073.07
A
B
C
D
E
F
. c
H
P:
QB05 DRCON 5.01,3.01
QB05 DRCON
5.013.01
QB05 DRCOh 5.01,3.01
QB05 DRCON
QB05 DRCOP
5.01,3.01
5.02,3.02
QB05 DRCOA
4805 DRCOK
QB05 DRCON
QB05 DRCON
5.01,3.01
502,3.02
5.02,3.03
5.033.04
QB05 DRCOA
QB05 DRCOIi
QB05 DRCON
5.01,3.01
5.02,3.02
5.02,3.03
4805 DRCOb
QB02 DRCOA 5.073.07
5.13.3.06 DRCON 5.131.06
DRCON 5.07.3.07
~
QB05 DRCOh 5.0‘2,3.02
QB05 DRCON 5.02,3.02
QB05 DRCON 5.023.02
QB05 DRCON 5.023.03
QB05 DRCON 5.023.03
QB03 DRCON 5.093.09
QB03 DRCON 5.09,3.09
QB03 DRCON 5.09.3.09
QB05 DRCON
QB05 DRCON
QB05 DRCON
5.022.03
5.03,3.04
5.04.3.05
QB05 DRCON
QB05 DRCON
5.02,3.03
5.03,3.M
~~
QB05 DRCON
QB05 DRCON
QB05 DRCON
5.03,3.04
3.04,3.03
5.05,3.05
QB05 DRCON 506.3.06
QB03 DRCON 5.08,3.08
4803 DRCON 5.083.08
4803 DRCON
4803 DRCON
QB05 IRCON
5.08,3.08
5.08,3.10
5.10,3.11
QB05 IRCON 5.11.3.11
QB05 DRCON
QB05 DRCON
5.03,3.01
5.04,3.05
QB05 DRCON
QB05 DRCON
QB05 DRCON
5.03,3.04
5.01,3.05
5.052.05
QB05 DRCON 5.04.3.05
4805 DRCON 5.043.05
QB03 DRCON
QB05 DRCON
5.08.3.10
5.10,3.11
DRCON 5.11.3.11
4803 DRCON
4805 3RCON
5.08,3 10
5.10.3.11
QB05 3RCON 5.113.11
QB05 DRCON 5.053.05
QB05 DRCON 5.052.05
QB05 DRCON 5.06,3.06
QBO5 DRCON 5.05,3.05
QB05 DRCON 5.063.06
QB05 DRCON 5.05,3.05
QB05 DRCON 5.06,3.06
QB05 DRCON 5.063.06
6
QB05 DRCON 5.06,3.06
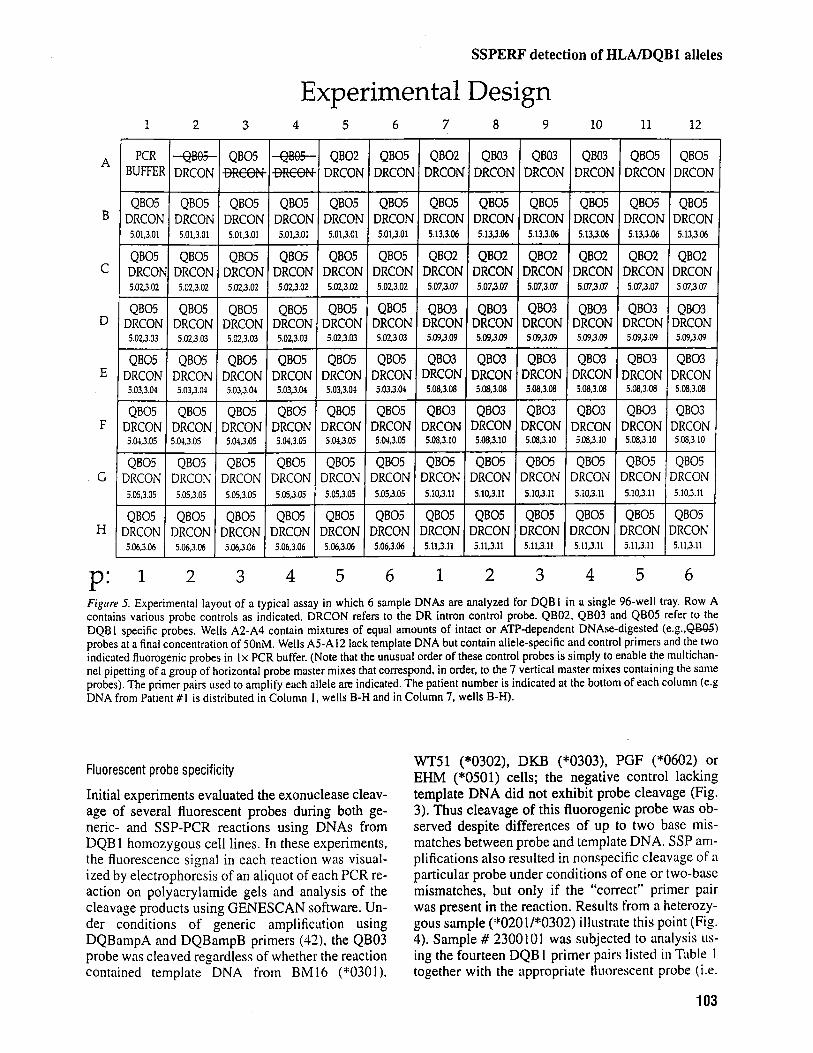
5 1 2 3 4 4 5 1 2 3 Figure 5. Experimental layout of a typical assay in which 6 sample DNAs are analyzed for DQB I in il single 96-well tray. ROW A contains various probe controls as indicated. DRCON refers to the DR intron control probe. QB02, QB03 and QB05 refer to the DQB 1 specific probes. Wells A2-A4 contain mixtures of equal amounts of intact or ATP-dependent DNAse-digested (e.g.,Q€W probes at a final concentration of 50nM. Wells A5-Al2 lack template DNA but contain allele-specific and control primers and the two indicated fluorogenic probes in Ix PCR buffer. (Note that the unusual order of these control probes is simply to enable the multichan- nel pipetting of a group of horizontal probe master mixes that correspond, in order, to the 7 vertical master mixes containing the same probes). The primer pairs used to amplify each allele are indicated. The patient number is indicated at the bottom of each column (e.g DNA from Patient # I is distributed in Column 1, wells B-H and in Column 7, wells B-H).
WT51 (*0302), DKB (*0303), PGF (“0602) or EHM (*0501) cells; the negative control lacking template DNA did not exhibit probe cleavage (Fig. 3). Thus cleavage of this fluorogenic probe was ob- served despite differences of up to two base mis- matches between probe and template DNA. SSP am- plifications also resulted in nonspecific cleavage of a particular probe under conditions of one or two-base mismatches, but only if the “correct” primer pair was present in the reaction. Results from a heterozy- gous sample (*0201/*0302) illustrate this point (Fig. 4). Sample # 23001 0 I was subjected to analysis us- ing the fourteen DQB I primer pairs listed in Table I together with the appropriate Huorescent probe (i.e.
103
Fluorescent probe specificity
Initial experiments evaluated the exonuclease cleav- age of several fluorescent probes during both ge- neric- and SSP-PCR reactions using DNAs from DQB 1 homozygous cell lines. In these experiments, the fluorescence signal in each reaction was visual- ized by electrophoresis of an aliquot of each PCR re- action on polyacrylamide gels and analysis of the cleavage products using GENESCAN software. Un- der conditions of generic amplification using DQBampA and DQBampB primers (421, the QB03 probe was cleaved regardless of whether the reaction contained template DNA from B M 16 p030 I ) .
Faas et al.
9
86.009
64.126
47.027
50.436
347.519
51.826
84.558
84.960
FAM 10 11
26.563 32.231
46.699 57.824
169.938 43.837
60.848 64.018
92.204 327.134
56.942 54.991
89.006 82.657
93.976 89.677
A
B
C
D
E
F
G
H
P:
A
B
C
D
E
F
G
H
P:
115.m
85 046
67655
78.758 78.591 81.537 82.790 82.682 202.683
83.323 84.531 85.061 302.259 337.683 81.629
90420 87383 92537 87922 69869 200 142
1 2
1 2
28.226 33.216
59.580 57.681
68.146 66.373
71.335 69.065
31.319
59.927
50.288
55.560
96.767
59.298
64.947
69.904
68.081
69.513
3 4
172.637
103.201
67.900
70.636
74.510
71.646
-0.071
1 2
112.750
3 4
54.747
62.168
65.427
70.213
77.201
72.288
80.911
5 6 1
92.927
56.484
63.379
67.633
68.934
70.657
80.010
HEX
62.486
68.827
60.162
79.352
115.605
48.849 59.329 61.827
111.474 67.287 108.579
60.698 61.864 61.593
75.964 78.654 72.411
76.963 87.829 81.769
73.292
73.994
119.480
77.545
8
37.637
68.510
47.964
72.587 64.222
71.801 86.479
125.060 70.714
76.053 95.973
65.390
97.923
53.055
89.281
236.200
2
8 9 10 11
31.766 37.001 25.712 28.658
58.406 56.116 40.210 50.780
56.714 57.943 80.730 54.643
12
31.888
66.677
204.938
63.130
87.711
51.504
86.816
82.533
6
12
28.067
57.568
82.955
___I
60.378
65.261
57.743
73.862
70.993 ~
I 6
104
A
B
C
D
E
F
G
H
P:
-0.030
SSPERF detection of HLA/DQBl alleles
TAMRA 1 2 3 4 5 6 7 8 9 10 11 12
65.016 71.565 80.W 32.929 43.975 35.649 35.825 34.072 31.292 38.815 38.562 ~
54.225 59.274 57.916 60.379 59.754 55.737 40.307 52.287 60.941
70.117 70.198 69.866 --l--I-
55.410
63.465
65.507
79.370 1 79.348 I 76.538
56.087 58.355
58.428 65.387
64.253 68.602
t - t t 68.783 69.723 69.387 43.200 49.763
52.680
54.457
53.096
80.781
85.883
70.069 72.023 70.177 47.200 Icc 50.239 54.254 48.562
40.152 50.016 52.612
56.236 53.356 57.379
52.240 54.463 53.828
75.925 77.963 73.516
75.018 84.217 80.547
70.503 74.757 73.175 74.067 I l l 81.831 1 78.523 1 77.525 1 71.364
1 2 3 4 5 6 1
‘J 52.123
53.655
52.140
76.509
I 72.752
1 6
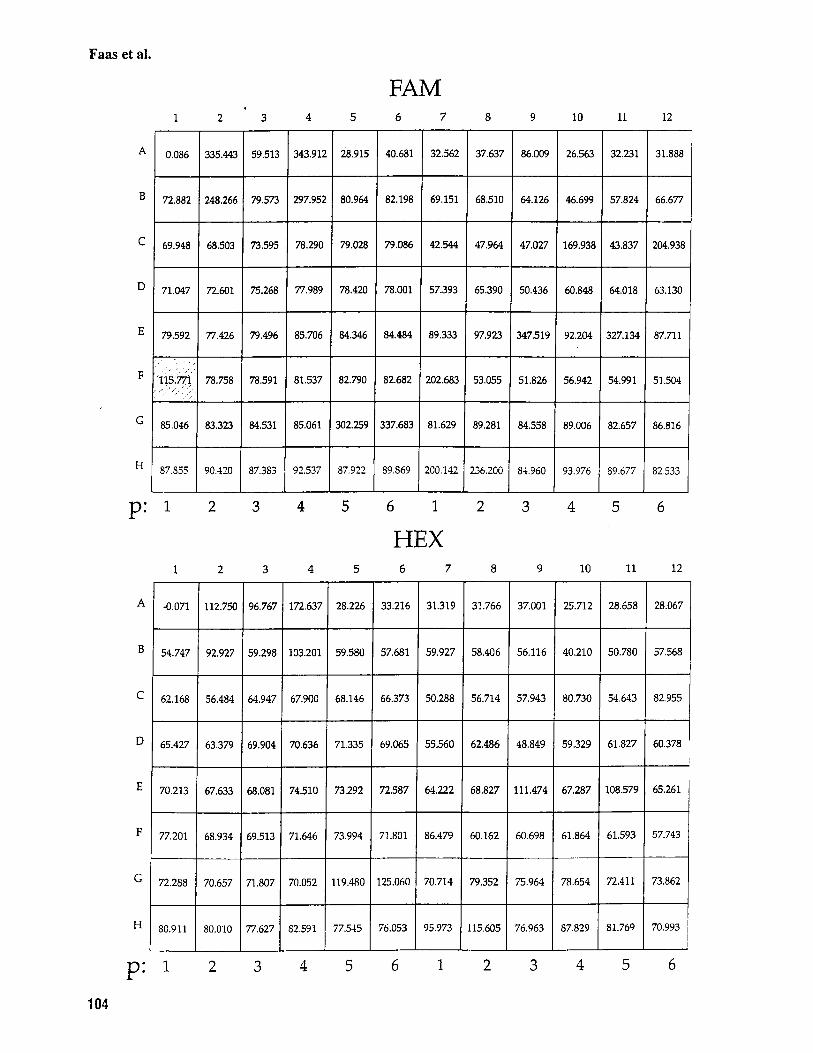
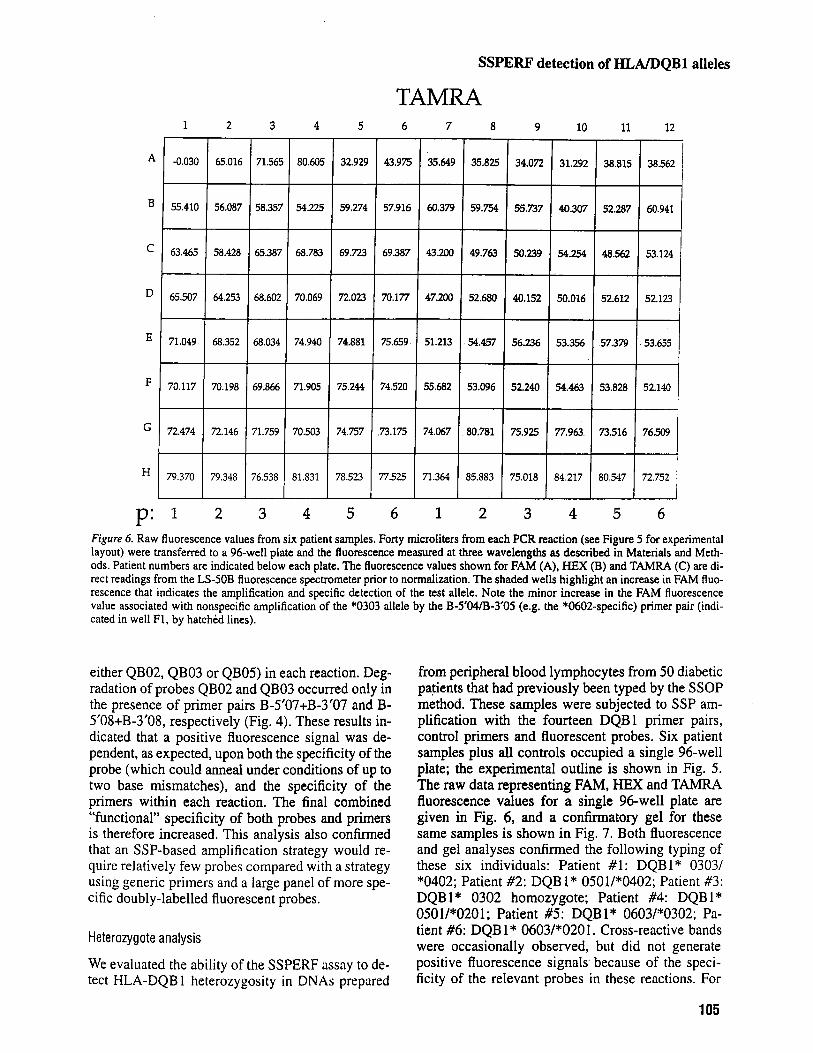
5 for exDerimenta1 Figure 6. Raw fluorescence values from six patient samples. Forty microliters from each PCR reaction (see Figun layout) were transferred to a 96-well plate and the fluorescence measured at three wavelengths as described in Materials A d Meth- ods. Patient numbers are indicated below each plate. The fluorescence values shown for FAM (A), HEX (B) and TAMRA (C) are di- rect readings from the LSJOB fluorescence spectrometer prior to normalization. The shaded wells highlight an increase in FAM fluo- rescence that indicates the amplification and specific detection of the test allele. Note the minor increase in the FAM fluorescence value associated with nonspecific amplification of the *0303 allele by the B-5‘04/J3-3‘05 (e.g. the *0602-specific) primer pair (indi- cated in well F1, by hatched lines).
either QB02, QB03 or QB05) in each reaction. Deg- radation of probes QB02 and QB03 occurred only in the presence of primer pairs B-5’07+B-3’07 and B- 5’08+B-3’08, respectively (Fig. 4). These results in- dicated that a positive fluorescence signal was de- pendent, as expected, upon both the specificity of the probe (which could anneal under conditions of up to two base mismatches), and the specificity of the primers within each reaction. The final combined “functional” specificity of both probes and primers is therefore increased. This analysis also confirmed that an SSP-based amplification strategy would re- quire relatively few probes compared with a strategy using generic primers and a large panel of more spe- cific doubly-labelled fluorescent probes.
Heterozygote analysis
We evaluated the ability of the SSPERF assay to de- tect HLA-DQB 1 heterozygosity in DNAs prepared
from peripheral blood lymphocytes from 50 diabetic patients that had previously been typed by the SSOP method. These samples were subjected to SSP am- plification with the fourteen DQBl primer pairs, control primers and fluorescent probes. Six patient samples plus all controls occupied a single 96-well plate; the experimental outline is shown in Fig. 5 . The raw data representing FAM, HEX and TAMRA fluorescence values for a single 96-well plate are given in Fig. 6, and a confirmatory gel for these same samples is shown in Fig. 7. Both fluorescence and gel analyses confirmed the following typing of these six individuals: Patient #I: DQB1* 0303/ *0402; Patient #2: DQB I* 0501/*0402; Patient #3: DQB1* 0302 homozygote; Patient #4: DQBI* 0501/*0201; Patient #5: DQB 1* 0603P0302; Pa- tient #6: DQB l* 0603/*0201. Cross-reactive bands were occasionally observed, but did not generate positive fluorescence signals because of the speci- ficity of the relevant probes in these reactions. For
105
Faas et al.
1
patient 1
1
7 1
patient 2
7 1
7 1 7
patient 3
7 1 7
c
patient 4 patient 5 patient 6
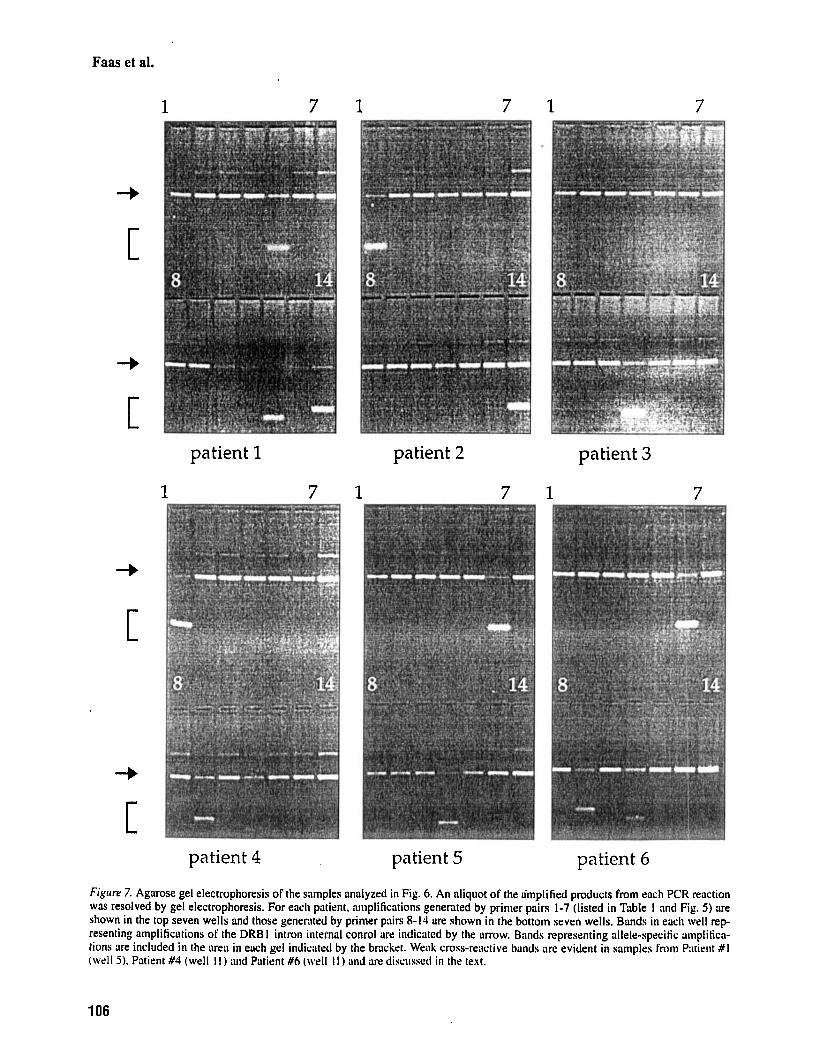
Figwe 7. Agarose gel electrophoresis of the samples analyzed in Fig. 6. An aliquot of the a'mplified products from each PCR reaction was resolved by gel electrophoresis. For each patient. iimplifications generated by primer pairs 1-7 (listed in Table I and Fig. 5 ) are shown in the top seven wells and those generated by primer piirs 8-14 are shown in the bottom seven wells. Bands in each well rep- resenting amplifications of the DRB I intron internal conrol are indicated by the arrow. Bands representing allele-specitic oniplitica- tions are included in the areil in each gel indicated by the bracket. Weak cross-reociive kinds arc evident in samples from Pntient # I (well 5) . Patient #4 (well I I ) and Patient #6 (well I I ) and are discussed in the text.
106
SSPERF detection of HLA/DQBl alleles
generate an enormous increase in FAM (DQB I-spe- cific) fluorescence values that was easily separable from the fluorescence associated with amplifications of the DRB 1 control alone.
example, a band amplified by the "0602 primer pair was evident in the gel representing the typing for Patient # 1 (Fig. 7. patient #1, lane 5 ) , but did not hy- bridize with the QB05 probe used to detect authen- tic "0602 alleles; thus no significant cleavage of the probe occurred (Fig. 6, well Fl). Similarly, although the *0201/*0302 primer pair can amplify either of these alleles, the QB03 probe in this reaction mix efficiently hybridized to amplified *0302 sequences (see Fig. 7, Patients #3 and #5, lane 11 and Fig. 6 wells E9 and E l l ) but was not cleaved in the pres- ence of an amplified "0201 allele (see Fig. 7, pa- tients #4 and #6, lane 11 and Fig. 6, wells E l0 and E12). The DRBl control band was easily visualized in each reaction. The intensity of this band was of- ten characteristically weaker than that of the specific band in positive specific reactions, due to PCR con- ditions that favor DQB 1 -specific amplifications by using lower concentrations of DRBl primers rela- tive to specific primers.
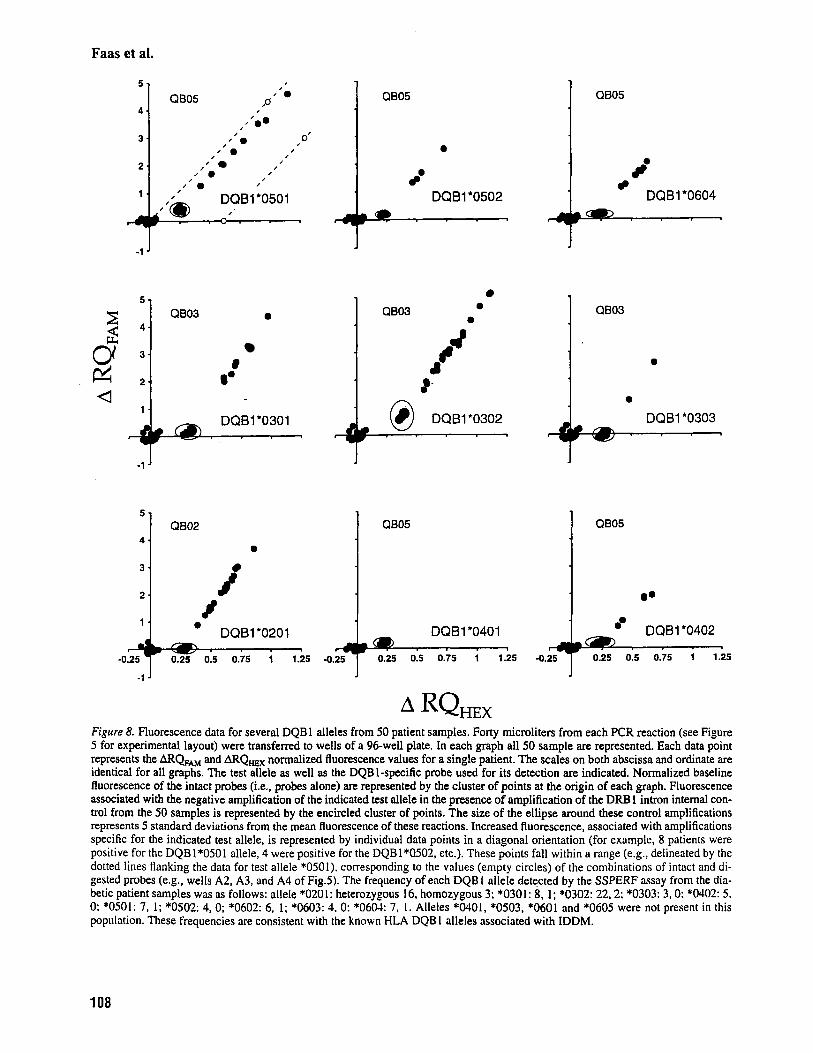
Figure 8 displays representative alleles detected by each of the three DQBI fluorescent probes; the data represent the typing results obtained for all 50 diabetic patient samples. An example of an allele that was not detected in this population (DQBl"0401) is included. The group of points that represents negative controls (i.e. probes alone) are tightly clustered around the origin of each graph. The negative amplifications for each indicated allele from all fifty samples are represented by another tight cluster of points that is shifted to the right in each graph due to the increased HEX fluorescence generated by the DRB 1 positive control amplifica- tion in these samples. The ellipse around each clus- ter of data points reflects 5 standard deviations from the mean fluorescence generated by these DRB 1 amplifications. The minimal observed increase in ARQHEX fluorescence observed in these reactions versus the mean fluorescence of the negative con- trols also varied slightly and ranged from 4.7-8.5 standard deviations. The points depicting samples that were positive for the indicated allele appear along a diagonal whose slope approximates the in- crease in FAM fluorescence as measured at both the FAM and HEX emission maxima. These points fall within a range, indicated by the dotted lines that represent the fluorescence associated with increas- ing FAMRAMRA cleavage in combination with ei- ther minimal or maximal cleavage of the HEX/ TAMRA probe, as determined by ATP-dependent nuclease digestion. The difference in ARQFAC, Ruo- rescence between the weakest positive signal und the negative amplifications also varied from allele to allele and ranged from 8.6 to 74 standard deviations. Thus even a "weak positive" anipliticntion resulted i n sufficient cleavage of the hybridized probe to
Discussion Probe design
In the study described herein, we have used previ- ously described primer pairs (24) in combination with doubly-labelled fluorescent probes to amplify and directly detect the presence of 14 different DQB 1 alleles in DNA prepared from both homozy- gous cell lines and from heterozygous IDDM pa- tient samples. The SSPERF method for the detec- tion of HLA-DQBl alleles is highly specific, sensi- tive and rapid. This approach offers all of the advan- tages of a conventional SSP-PCR assay without the requirement for post-PCR gel analysis. In addition, the ability to construct probes with different reporter dyes permits the simultaneous amplification and de- tection of an internal control target sequence within the same PCR tube.
The most critical element in the SSPERF assay is the synthesis of appropriate fluorogenic probes. Such probes must exhibit 1) low background fluo- rescence (i.e. efficient quenching of the reporter dye fluorescence by the quenching dye); 2) efficient cleavage by Taq polymerase between the nucle- otides carrying the reporter and quencher dyes; 3) high specificity for the target DNA sequence; 4) compatibility with the temperature, MgCI, and cy- cling conditions optimal for SSP-amplifications; and 5) an inability to form hairpins, dimers or other significant secondary structures with the other prim- ers or probes within the reaction.
The factors affecting reporter dye quenching are not completely predictable. In our experience to date, the position of the quencher dye does not ap- pear to influence the efficiency of quenching to a great degree; however, others have reported that a G residue next to the reporter dye can impart a quenching effect that is independent of probe cleav- age (43). The choice of reporter and quencher dyes also potentially affects quenching, although we have not systematically compared probes synthesized with different combinations of fluorescent dyes. The degree of TAMRA labelling and the purity of the probe may affect probe performance because the presence of significant levels of singly-labelled oli- gonucleotides results in a poorly quenched probe and a high background reporter fluorescence. An ideal intact fluorogenic probe should exhibit ap- proximately 90% quenching, although in practice. depending upon the probe sequence. this level of quenching is not always achievable. Every probe
107
Faas et al.
5 7
4 .
3 -
2 .
QB05
,A@ , ' 0 0'
' 0 / , ,' , , J .
I
j o ,
5
E 4 s a 3 % 2
4 1
d
-1
5
4
3
2
1
4 -0.25
-1
QB03 0
8 a.
DQB1*0301
QB02
8
i 8
DQB1'0201 0 -
0.25 0.5 0.75 1 1.25
1 QB05
1 0 1
DQB1*0502 I, 0
0 0
QB03
J I )
4 ?-
4 -0.25
QB05
DQB1*0401 L
0.25 0.5 0.75 1 1.25
QB05
z' 0 DQB1'0604
4 -0.25
QB03
0
0
DQB1'0303 - QB05
oo DQB1*0402 u 0.25 0.5 0.75 1 1.25
Figure 8. Fluorescence data for several DQBl alleles from 50 patient samples. Forty microliters from each PCR reaction (see Figure 5 for experimental layout) were transferred to wells of a 96-well plate. In each graph all 50 sample are represented. Each data point represents the ARQ,, and ARQ,, normalized fluorescence values for a single patient. The scales on both abscissa and ordinate are identical for all graphs. The test allele as well as the DQB 1-specific probe used for its detection are indicated. Normalized baseline fluorescence of the intact probes (i.e., probes alone) are represented by the cluster of points at the origin of each graph. Fluorescence associated with the negative amplification of the indicated test allele in the presence of amplification of the DRB 1 intron internal con- trol from the 50 samples is represented by the encircled cluster of points. The size of the ellipse around these control amplifications represents 5 standard deviations from the mean fluorescence of these reactions. Increased fluorescence, associated with amplifications specific for the indicated test allele, is represented by individual data points in a diagonal orientation (for example, 8 patients were positive for the DQB 1*0501 allele, 4 were positive for the DQBl*Q502, etc.). These points fall within a range (e.g., delineated by the dotted lines flanking the data for test allele *0501), corresponding to the values (empty circles) of the combinations of intact and di- gested probes (e.g,, wells A2, A3, and A4 of Fig.5). The frequency of each DQB 1 allele detected by the SSPERF assay from the dia- betic patient samples was as follows: allele *0201: heterozygous 16. homozygous 3; *0301: 8, l: *0302: 22.2; *0303: 3,O: *0402: 5. 0: *0501: 7, I ; *0502: 4, 0; *0602: 6, I ; *0603: 4. 0: *0604: 7, I . Alleles '0401, *0503, *0601 and *0605 were not present in this population. These frequencies are consistent with the known HLA DQB I alleles associated with IDDM.
108
SSPERF detection of HLA/DQBl alleles
mented and widely used method of increasing typ- ing resolution, or clarifying “ambiguous alleles” flagged by SSOP. Adding fluorogenic probes to these reactions not only eliminates the requirement for a gel-based readout, but, in some cases, also adds a second degree of specificity. For example, the primer pair B-5’08-B-3’08 originally described by Olerup et al. (24) amplifies both DQB1*0201 and “0302 alleles. The detection of both of these al- leles in a conventional SSP assay demands two ad- ditional amplifications using B-5‘07-B-3’07 prim- ers (for the detection of the *0201 allele) and B- 5’08-B-3’09 primers (for the detection of the *0302/ *0303 alleles). In our assay system, however, the QB03 probe discriminates between *0302 and *020 1 alleles amplified by our modified primer pair B-5’08-B-3’08, and only the *0302 allele is detected (Fig. 6 and 7). Similarly, the QB02 probe hybridizes only with *0201 target sequences and is used in combination with the B-5’07-B-3’07 primer pair to detect this allele. Thus the resolution of these two alleles is accomplished with only two amplification reactions, each using a different probe, rather than with three reactions as in conventional SSP. Elimi- nating this third reaction allowed us to include an additional primer pair for the detection of the *0605 allele (Table l), while limiting the total number of reactions to 14. This array permits us to analyze 6 DNA samples (including controls) on a single 96- well plate.
Since the SSPERF assay detects the presence of specific amplification, but does not reveal any infor- mation regarding the size of the amplimer, it is im- portant to validate the specificity of the SSP primers used before relying solely on the fluorescence read- out. Obviously, primer pairs that give rise to non- specific amplification of other HLA alleles, which can still anneal to the included probe, will yield false-positive results. However, the specificity of “problem” primers can often be enhanced by modi- fications such as those we describe for the B-3’08 and B-3’10 primers: the primer efficiency and speci- ficity of these primers was improved upon by mak- ing the inosine substitutions detailed in the footnote to Table 1. Under our conditions, the modified B- 3’10 primer, in combination with the B-5’08 primer, amplifies the DQB1*0303 allele in the absence of cross-reactive amplification of the DQB 1 *0302 al- lele. These primer modifications thus permit better discrimination between *0302 and *0303 alleles de- spite the use of a single probe (QB03) in both reac- tions. Taken together, these examples illustrate how the combined specificity of primers and probes in- crease the total functional specificity of an individ- ual reaction beyond that of either component alone. A similar approach may be used to reduce the cross-
that we have used is not quenched to this extent, but still worked well in this assay.
Factors that affect the efficiency of probe cleavage include the placement of the quenching dye relative to the reporter dye and the extent of hybridization of the probe to target DNA. While some investigators have placed the quencher dye internally (44), others suggest that placing the quencher dye at the 3’ end both maximizes the potential to cleave the probe be- tween the two dyes, and minimizes any likelihood that the dye will interfere with hybridization (43). All of the probes that we describe in these experiments contain the reporter dye at the 5’ end and the quencher dye at the 3’end of the oligonucleotide. Since most of the specificity of this assay comes from the choice of primers, probe design must conform to the con- straints set by the primers themselves. As with con- ventional primer-probe combinations, adjustments in the’length or in the choice of the particular sequence of a given probe are often sufficient to resolve addi- tional problems associated with Specificity, cycling parameters, secondary structure or incompatibility with other primers and probes.
Considering all of the criteria for appropriate probe design, we chose to implement an approach that would require as few fluorogenic probes as possible. Thus, we used only three fluorescent probes, de- signed to absorb up to two-base mismatches, to detect all of the most common HLA-DQB 1 alleles. Analysis of other loci by this method may require even fewer probes: our experiments using the SSPERF strategy to detect 34 HLA-DRB 1 alleles indicates that for this locus, only one DR-specific probe is required (Rud- ert, Menon, Braun, Faas and Trucco, manuscript in preparation). Although the preparation and purifica- tion of fluorescent probes is more time-consuming than the simple synthesis and labelling of conven- tional fluorescent or radioactive probes for SSOP- based typing, such probes, once validated in the assay system, can be generated in large-scale (1 - 1Op.M) syntheses that will provide sufficient reagents for many thousands of reactions. For example, a single 1 pM oligonucleotide synthesis would generate enough purified probe for approximately 200,000 re- actions, taking into account the anticipated losses that are inevitable at each step in the synthesis and puri- fication scheme. Once generated, the doubly-labelled probes can be aliquotted, together with the relevant SSP primer pairs, into appropriate master mixes and stored indefinitely at -20°C in PCR strip tubes.
Specificity
The use of SSP primers to generate allele- or group- specific amplification products is a well-docu-
109
Faas et a].
amplification of “0303 by *0602-specific primer pairs (see for example Fig. 7, Patient #l), although this cross-reactivity does not interfere with the as- say, as discussed above.
We have observed complete concordance be- tween the results we obtained using our SSPERF method and those using the conventional SSP method. In addition, even poorly amplified specific products, that are weak or are not easily visible in a gel, are readily detectable by our assay. As ex- pected, this assay proved to be more reliable than SSOP for the analysis of the 50 diabetic patient samples. In some cases, we have been able to sub- type certain alleles not resolved by SSOP (for exam- ple, our assay, as well as conventional SSP, differen- tiates “0401 from “0402 alleles). Also, in two cases we were able to assign *0302 homozygosity to sam- ples that had previously been typed as potential *0302/*0302/3 heterozygotes by SSOP (for exam- ple, see the data for Patient #3 in Figs. 6 and 7). In two additional samples, we were able to reliably identify a heterozygous *0301/ *0302 typing where previous SSOP typing results had been ambiguous (i.e., unable to clearly differentiate between *0302 and “0303 alleles). In one other case we were able to discount the possible presence of a *0301 allele and confirm homozygosity of the *020 1 allele. Sim- ilarly, in an additional sample, we could reject the previous typing results of a *0302/:k0603 heterozy- gote in favor of a clear *0302 homozygote. For the routine DQB I typing of diabetic patients, this level of discrimination is invaluable, since, for example, it permits the discrimination between alleles that are important for the determination of IDDM suscepti- bility or resistance (e.g. alleles expressing non-Asp versus Asp amino acids at position 57 of the DQP chain) (9, 22,23).
The fluorescence data summarized in Fig. 8 illus- trate several points that require discussion. Al- though the two reporter dyes, FAM and HEX, are spectrally distinct at 518 and 556nm, there is still some spectral overlap between them. (This is physi- cally unavoidable since one prefers to excite both dyes at the same wavelength in this assay). Thus the signal generated by an increase in FAM fluores- cence is detected primarily at the 518 wavelength, but is also observed to a lesser degree at the 556 (HEX) wavelength. These increases in apparent HEX fluorescence, due to FAM, can readily be ob- served in the raw data (see Fig. 6B) and translate graphically into the diagonal line that represents samples that are positive for the test allele (see Fig. 8). Although it would be possible to mathematically separate the fluorescent components into those inde- pendently contributed by the FAM and the HEX dyes. this degree of sophisticntion W;IS l~nnecessnry
110
for our application. Since the HEX signal was infor- mative only for the case of the negative amplifica- tions of the test alleles, it was only necessary to ac- curately determine the HEX signal in the absence of a strong FAM signal.
The differences observed between high and low positives are likely due to sample-related excipient effects, such as trace salts or other impurities, that may affect probe hybridization and/or cleavage, as well as DNA amplification. However, it should be stressed that even the weakest positive sample gen- erated a fluorescence signal that was almost 9 stan- dard deviations higher than the average negative amplification. Of course, the threshold for what can be considered a positive sample depends upon the number of samples analyzed and the confidence limits one wishes to assign to the typing. In this as- say, we permitted a sample to be called “positive” if its fluorescence value were at least 3 standard devia- tions above that demarcated by the ellipse around the control amplifications negative for the test al- lele. (Note that the size of these ellipses also repre- sents a variation in fluorescence equivalent to 5 standard deviations from the mean, although in most cases we observe differences of less than 2 standard deviations from the mean among these negative samples).
The data representing two of the test alleles shown in Fig. 8 indicate DRBl control amplifica- tions that exhibit slightly higher FAM fluorescence than those associated with the other test alleles (see Fig. 8, DQB1*0501 and “0302). This increased FAM fluorescence did not interfere with our ability to discriminate between positive and negative al- lele-specific amplifications. We suspect that this ef- fect may be due to a low level of cleavage of the QB05 and QB03 probes in these negative reactions. Analysis of the potential interactions between these probes and each of the other oligonucleotides present in these particular reactions has revealed a weak dimerization between probe QB05 and primer B-5’01, and between probe QB03 and primer B- 3’08. The stability of this dimerization may be suffi- cient to initiate a low level of Taq polymerase-medi- ated cleavage of the probe in the absence of target DNA amplification. However, dimerization does not appear to significantly inhibit target DNA amplifica- tion or reduce the level of fluorescence associated with samples positive for the test allele.
The SSPERF assay should be directly applicable to the molecular typing of alleles at other HLA loci as well. We have already made considerable progress in establishing the iisefiilness of this tech- nique for DRB I molecular typing (Rudert. Menon, Braun, Faas and Trucco. manuscript in preparation), and have begun testing the method for HLA class I
SSPERF detection of HLA/DQBl alleles
ments describe allelic series. Proc Natl Acad Sci U S A
Cascino I, Rosenshire S, Turco E. Marrari M, Duquesnoy RJ, Trucco M. Relationship between DQ alpha and DQ beta RFLP and serologically defined class II HLA antigens. J Immunogenet 1986: 13: 387-400. Carsson B, Wallin J, Bohme J, Moller E. HLA-DR-DQ haplotypes defined by restriction fragment length analysis: correlation to serology. Hum Immunol 1987: 20: 95-1 13. Trucco M, Ball E. RFLP analysis of DQ-beta chain gene: workshop report. In: Histocompatibility testing 1987. Vol.
Mullis KB, Faloona FA. Specific synthesis of DNA in vitro via a polymerase-catalyzed chain reaction. In: Diego RW, ed. Methods in enzymology. San Diego, CA: Academic Press, 1987: 335-50. S a k i RK. Gelfand OH, Stoffel S et al. Primer-directed en- zymatic amplification of DNA with a thermostable DNA polymerase. Science 1989: 239: 487-9 1. Trucco G. Fritsch R, Giorda R, Trucco M. Rapid detection of IDDM susceptibility, using amino acid 57 of the HLA- DQ beta chain ils a marker. Diabetes 1989: 38: 1617-22. Nomura N, Ota M, Tsuji K, Inoko H. HLA-DQB 1 genotyp- ing by a modified PCR-RFLP method combined with group-specific primers. Tissue Antigens 199 1: 38: 53-9. Ota M, Seki T, Nomura N et al. Modified PCR-RFLP method for HLA-DPB I and -DQAI genotyping. Tissire An- tigens 199 1 : 38: 60-7 1. Tong JY, Hsia S, PYris GL et al. Molecular compatibility and renal graft survival: the HLA DQB I genotyping. Transplantation 1993: 55: 390-5. Saiki RK, Bugawan TL, Horn GT, Mullis KB, Erlich HA. Analysis of enzymatically amplified beta-globin and HLA- DQ alpha DNA with allele-specific oligonucleotide probes. Nature 1986: 324: 163-6. Todd JA. Acha-Orbea H, Bell JI et al. A molecular basis for MHC class 11-associated autoimmunity. Science 1988: 240:
Morel PA, Dorman JS, Todd JA, McDevitt HO, Tnicco M. Aspartic acid at position 57 of the HLA-DQ beta chain pro- tects against type I diabetes: a family study. Proc Ncitl Accrrl Sci U S A 1988: 85: 8111-16. Olerup 0, Aldener A, Fogdell A. HLA-DQB 1 and -DQA I typing by PCR amplification with sequence-specific prim- ers (PCR-SSP) in 2 hours. Tissue Antigens 1993: 41: 119- 34. Olerup 0, Zetterquist H. HLA-DR typing by PCR amplifi- cation with sequence-specific primers (PCR-SSP) in 2 hours: an alternative to serological DR typing in clinical practice including donor-recipient matching in cadaveric transplantation. Tissue Antigens 1992: 39: 225-35. Bunce M, Taylor CJ, Welsh KI. Rapid HLA-DQB typing by eight polymerase chain reaction amplifications with se- quence-specific primers (PCR-SSP). Hum Immunol 1993:
Saiki RK, Walsh PS, Levenson CH, Erlich HA. Genetic analysis of amplified DNA with immobilized sequence- specific oligonucleotide probes. Proc Narl Acad Sci U S A
Rudert WA, Tnicco M. DNA polymers of protein binding sequences generated by PCR. Nirckic Acids Res 1990: 18: 6460. Rudert WA. Trucco M. Rapid detection of sequence vorin- tions using polymers of specific oligonuclroticles. Nrrcleic 4cids Res 1992: 5: 1146. Santiirnaria P. Boyoe-Jacino MT, Lindstroin AL. Bnrbosu IJ. Fnras AJ. Rich SS. HLA-closs II "typing": direct se-
1984: 81: 7870-4.
1. 1989 860-7.
1003-9.
37: 201-6.
1989: 86: 6230-4.
111
typing. We anticipate that the typing of selected al- leles or groups of alleles for DRB l , DQB l , HLA-A, HLA-B and HLA-C will be possible using 2 full 96- well trays for a single individual. If the trays are set up in advance, such an assay could be performed in less than 2 1/2 hours including DNA extraction (15 min), 2-step PCR (1 1/4 hours), fluorescence mea- surements (20min/tray), data analysis and allele designation (10 min).
Acknowledgments
We thank Angela Alexander and Theresa Castelli for providing the SSOP typing results and IDDM patient sample DNAs, Dr. Gayle Rosner for helpful discussions, Read Fritsch for preparation of the fig- ures and Patrick Hnidka for preparation of the manuscript. This work was supported in part by grant #N00014-94-1-1199 from the Office of Naval Research.
References
I . Starzl TE, Demetris AJ, Murase N, Ilstad S, Ricordi C, Trucco M. Cell migration, chimerism, and graft accep- tance. Lnncet 1992: 339: 1579-82.
2. Hsia S, Tong JY, Parris GL et al. Molecular compatibility
3.
4.
5 .
6.
7.
8.
9.
10.
I t .
and renal iraft survival: the HLA DRBl genotyping. Transplantation 1993: 55: 395-9. Starzl TE. Demetris AJ, Trucco M et al. Chimerism after liver transplantation for type IV glycogen storage disease and type I Gaucher's disease. N Engl J Med 1993: 328:
Dijoulah S, Sanchez-Mazas A, Khalil I et al. HLA-DRB I , DQAl and DQBl DNA polymorphisms in healthy Alge- rian and genetic relationships with other populations. Tis- sire Antigens 1994: 43: 102-9. De Pablo R, Vilches C, Moreno ME, Rementeria MC, Solis R, Kreisler M. Distribution of HLA antigen in Spanish Gypsies: a comparative study. Tissue Anrigens 1992: 40:
Reed E, Ho E, Lupu F et al. Polymorphism of HLA in the Romanian population. Tissue Antigens 1992: 39: 8-13. Stastny P, Fernandez-Vina M. Cerna M, Havelka S, Ivask- ova E, Vavrincova P. Sequences of HLA alleles associated with arthritis in adults and children. J Rherimatol 1993: 20:
Tandon N, Zhang L, Weetman AP. HLA association with Hashimoto's thyroiditis. Clin Endocrinol 1994: 34: 383- 386. Dorman J. LaPorte R, Stone R, Trucco M. Worldwide dif- ferences in the incidence of Type I diabetes are associated with amino acid variation at position 57 of the HLA-DQ beta chain. Proc Natl Acnd Sci U S A 1990: 87: 7370-4. Spielman R, Lee J , Bodmer W, Bodmer J. Trowsdale J. Six HLA-D region alpha chain genes of human chromosonie 6: polymorphisms and associations of DC alpha related se- quences with DR types. Proc NtrrlAccrclSci U S A 1984: 81:
Cohen D. LeGull I. Mnrcndet A, Font MP. LiiloUel Jbl. Diiiisset J. Clusters of HLA chss I 1 beta restriction frng-
145-9.
187-96.
5-8.
346 1-5.
12.
13.
14.
15.
16.
17.
18.
19.
20.
21.
22.
23.
24.
25 I
26.
27.
28.
29.
30.
Faas et al.
quencing of DRB, DQB, and DQA genes. Hum lmmrrnol
31. Imanishi T, Akaza T, Kimura A, Tokunaga K. Gojobori T. Allele and haplotype frequencies for HLA and complement loci in various ethnic groups. In: Tsuji K, Aizawa M, Sasa- zuki T, ed. HLA 1991: Proceedings of the Eleventh Interna- tional Histocompatibility Workshop and Conference. OX- ford: Oxford University Press, 1992: 1065-220.
32. Aizawa M. Antigens and gene frequencies of ethnic groups. In: Aizawa M, Natori T, Wakisaka A, Konoeda Y, ed. HLA in Asia-Oceana. Sapporo: Hokkaido University Press, 1986: 1079-91.
33. Browning MJ, Krausa P, Rowan A, Bicknell DC, Bodmer JG, Bodmer WF. Tissue typing the HLA-A locus from ge- nomic DNA by sequence-specific PCR: comparison of HLA genotype and surface expression on colorectal tumor cell lines. Proc Natl Acad Sci U S A 1993: 90: 2842-5.
34. Karusa P, Bodmer JG, Browning MJ. Defining the common subtypes of HLA A9, A10, A28 and A19 by use of ARMS/ PCR. Tissue Antigens 1993: 42: 91-9.
35. Sadler AM, Petronzelli F, Krausa P et al. Low-resolution DNA typing for HLA-B using sequence-specific primers in allele- or group-specific ARMSIPCR. ‘lssue Anrigens
36. Bunce M, Welsh KI. Rapid DNA typing for HLA-C using sequence-specific primers (PCR-SSP): identification of se- rological and non-serologically defined HLA-C alleles in- cluding several‘new alleles. ‘lssue Antigens 1994: 43: 7-17.
37. Newton CR, Graham A, Heptinstall LE et al. Analysis of any point mutation in DNA. The amplification refractory mutation system (ARMS). Nuclcic Acids Res 1989: 17:
38. Livak KJ, Marmaro J, Todd JA. Towards fully automated genome-wide polymorphism screening. Nature Genet 1995: 9: 341-2.
39. Holland PM, Abramson RD, Waton R, Gelfand DH. Detec- tion of specific polymerase chain reaction product by utiliz- ing the 5’ to 3’ exonuclease activity of Thermrrs aquaticus
1992: 33: 69-81.
1994: 44: 148-54.
2503-16.
DNA polymerase. Proc Narl Acad Sci U S A 1991: 88:
40. Maniatis T, Fritsh EF, Sambrook J . Molecular cloning: a laboratory manual. Cold Spring Harbor, NY Cold Spring Harbor Laboratory Press, 1982.
41. Anai M, Hirahashi T, Takagi Y. A deoxyribonuclease which requires nucleoside triphosphate from Micrococcus lysodeikticus. I. Purification and characterization of the deoxyribonuclease activity. J Biol Chem 1970: 245: 767- 74.
42. XIth International HLA Workshop DNA Component. Ref- erence protocols (general remarks) Fukuoka, Japan, July 1990.
43. Livak KJ, Flood SJA, Marmaro J, Giusti W, Deetz K. Oli- gonucleotides with fluorescent dyes at opposite ends pro- vide a quenched probe system useful for detecting PCR product and nucleic acid hybridization. PCR Methods Appl
44. Lee LG, Connell CR, Bloch W. Allelic discrimination by nick-translation PCR with fluorogenic probes. Nucleic Ac- ids Res 1993: 21: 3761-6.
45. Smith S, Taylor CJ. Discrepant sequence at codon 57 of DQB 1: implication on HLA typing of “Asp 57” in IDDM. Tissue Antigens 1995: 46: 7 1-2.
46. Bodmer JG, Marsh SGE, Albert ED et al. Nomenclature for factors of the HLA system, 1995. Tissue Antigens 1995: 46: 1-18.
7276-80.
1995: 4: 1-6.
Address: Massimo Trucco Children’s Hospital of Pittsburgh Rangos Research Center 3705 Fifth Avenue at DeSoto Street Pittsburgh, PA 15213 USA Fax: +I (412) 692-5809
112