Tenth external quality assessment scheme for typing of Shiga ...
73
TECHNICAL REPORT Tenth external quality assessment scheme for typing of Shiga toxin-producing Escherichia coli www.ecdc.europa.eu
-
Upload
khangminh22 -
Category
Documents
-
view
3 -
download
0
Transcript of Tenth external quality assessment scheme for typing of Shiga ...
TECHNICAL REPORT
Tenth external quality assessment scheme for typing
of Shiga toxin-producing Escherichia coli
www.ecdc.europa.eu

ECDC TECHNICAL REPORT
Tenth external quality assessment scheme for typing of Shiga toxin-producing Escherichia coli
ii
This report was commissioned by the European Centre for Disease Prevention and Control (ECDC), coordinated by Taina Niskanen (ECDC, Emerging, Food- and Vector-borne Diseases Programme) and produced by Susanne Schjørring, Louise Gade Dahl, Gitte Sørensen, Kristoffer Kiil, Flemming Scheutz, and Eva Møller Nielsen of the Foodborne Infections Unit at Statens Serum Institut, Copenhagen, Denmark.
Suggested citation: European Centre for Disease Prevention and Control. External quality assessment scheme for typing of Shiga toxin-producing Escherichia coli. Stockholm: ECDC; 2021.
Stockholm, November 2021
ISBN 978-92-9498-557-6 DOI 10.2900/581918 Catalogue number TQ-01-21-438-EN-N
© European Centre for Disease Prevention and Control, 2021
Reproduction is authorised, provided the source is acknowledged.
For any use or reproduction of photos or other material that is not under the EU copyright, permission must be sought directly from the copyright holders.

TECHNICAL REPORT Tenth external quality assessment scheme for Shiga toxin-producing Escherichia coli
iii
Contents Abbreviations ................................................................................................................................................ v Executive summary ........................................................................................................................................ 1 1. Introduction .............................................................................................................................................. 3
1.1 Background ........................................................................................................................................ 3 1.2 Surveillance of STEC infections ............................................................................................................. 3 1.3 STEC characterisation .......................................................................................................................... 4 1.4 Objectives .......................................................................................................................................... 4
2. Study design .............................................................................................................................................. 5 2.1 Organisation ....................................................................................................................................... 5 2.2 Selection of test isolates/genomes ........................................................................................................ 5 2.3 Distribution of isolates/genomes ........................................................................................................... 6 2.4 Testing ............................................................................................................................................... 6 2.5 Data analysis ...................................................................................................................................... 6
3. Results ...................................................................................................................................................... 8 3.1 Participation ....................................................................................................................................... 8 3.2 Serotyping .......................................................................................................................................... 8 3.3 Virulence profile determination ............................................................................................................. 9 3.4 Molecular typing-based cluster analysis ............................................................................................... 12
4. Discussion ............................................................................................................................................... 22 4.1 Serotyping ........................................................................................................................................ 22 4.2 Virulence profile determination ........................................................................................................... 22 4.3 Molecular typing-based cluster analysis ............................................................................................... 23
5. Conclusions ............................................................................................................................................. 25 6. Recommendations .................................................................................................................................... 26
6.1 Laboratories ..................................................................................................................................... 26 6.2 ECDC and FWD-Net ........................................................................................................................... 26 6.3 EQA provider .................................................................................................................................... 26
7. References .............................................................................................................................................. 27 Annex 1. List of participants .......................................................................................................................... 29 Annex 2. Participation overview EQA-9/EQA-10 ................................................................................................ 30 Annex 3. Reason(s) for participating in EQA ................................................................................................... 31 Annex 4. Serotyping result scores .................................................................................................................. 32 Annex 5. Virulence profiles result scores ........................................................................................................ 33 Annex 6. EQA provider cluster analysis-based on WGS-derived data ................................................................. 35 Annex 7. Reported cluster of closely related isolates based on PFGE-derived data .............................................. 36 Annex 8. Reported sequencing details............................................................................................................ 37 Annex 9. Reported cluster of closely related isolates based on WGS-derived data .............................................. 38 Annex 10. Reported SNP distance and allelic differences.................................................................................. 39 Annex 11. Reported QC parameters ............................................................................................................... 40 Annex 12. Calculated qualitative/ quantitative parameters ............................................................................... 41 Annex 13. Results of the participants’ assessment of the EQA provided genomes............................................... 46 Annex 14. Word format of the online form ..................................................................................................... 51
Tenth external quality assessment scheme for Shiga toxin-producing Escherichia coli TECHNICAL REPORT
iv
Figures Figure 1. Participant percentage scores for O grouping and H typing .................................................................. 9 Figure 2. Average percentage test isolate score for serotyping of O and H .......................................................... 9 Figure 3. Participant percentage scores for genotyping of aaiC and aggR .......................................................... 10 Figure 4. Participant percentage scores for genotyping of eae .......................................................................... 10 Figure 5. Participant percentage scores for detection of stx1 and stx2 .............................................................. 11 Figure 6. Participant percentage scores for subtyping of stx1 and stx2 .............................................................. 11 Figure 7. Average percentage test isolate score for subtyping of stx1 and stx2 .................................................. 12 Figure 8. Reported SNP distances or allelic differences for each test isolate to selected cluster representative isolate ..... 16 Figure 9. Minimum spanning tree of core genome multilocus sequence typing participant FASTQ files ................. 17 Figure 10. Participant allele difference from reference result (EQA-provider) for each test isolate ........................ 18
Tables Table 1. Characterisation of test isolates/genomes ............................................................................................ 5 Table 2. Number and percentage of laboratories submitting results for each part ................................................ 8 Table 3. Detailed participation information for the parts of serotyping, virulence profile determination and molecular typing-based cluster analysis............................................................................................................ 8 Table 4. Incorrect stx2 subtype results .......................................................................................................... 12 Table 5. Results of cluster identification based on PFGE-derived data ............................................................... 13 Table 6. Results of cluster identification based on WGS-derived data ................................................................ 13 Table 7. Results of SNP-based cluster analysis ................................................................................................ 14 Table 8. Results of allele-based cluster analysis .............................................................................................. 15 Table 9. Summary of selected QC parameters reported by participants ............................................................. 19 Table 10. Results of raw reads submitted by participants evaluated by EQA provider QC pipeline summarised by laboratory ................................................................................................................................................... 20 Table 11. Results of the participants’ assessment of the EQA provided genomes ................................................ 21

TECHNICAL REPORT Tenth external quality assessment scheme for Shiga toxin-producing Escherichia coli
v
Abbreviations aaiC aai chromosomal Type VI Secretion System AEEC Attaching and effacing E. coli aggR Gene encoding the master regulator in enteroaggregative E. coli BN BioNumerics bp Base pair cgMLST Core genome multilocus sequence typing eae The intimin gene EAEC Enteroaggregative E. coli EFSA European Food Safety Authority EQA External quality assessment EURL European Union Reference Laboratory FWD Food- and waterborne diseases FWD-Net Food- and Waterborne Diseases and Zoonoses Network GFN Global Foodborne Infections Network, Food Safety HUS Haemolytic uraemic syndrome ND Not done NSF Non-sorbitol fermenter NT Non-typeable PFGE Pulsed-field gel electrophoresis NPHRL National public health reference laboratory QC Qualitative control SF Sorbitol fermenting SKESA Strategic k-mere extension for scrupulous assemblies SNP Single nucleotide polymorphism SOP Standard operating procedure SPAdes St. Petersburg genome assembler SSI Statens Serum Institut ST Sequence type STEC Shiga toxin-producing E. coli (synonymous with verocytotoxin-producing E. coli; VTEC) Stx1 Shiga toxin 1 stx1 Gene encoding Shiga toxin 1 Stx2 Shiga toxin 2 stx2 Gene encoding Shiga toxin 2 TESSy The European Surveillance System wgMLST Whole genome multilocus sequence typing WGS Whole genome sequencing


Tenth external quality assessment scheme for Shiga toxin-producing Escherichia coli TECHNICAL REPORT
1
Executive summary This report presents the results of the 10th round of the external quality assessment (EQA-10) scheme for typing of Shiga toxin-producing Escherichia coli (STEC). This EQA was organised for national public health reference laboratories (NPHRLs) providing data to the Food- and Waterborne Diseases and Zoonoses Network (FWD-Net) managed by the European Centre for Disease Prevention and Control (ECDC). Since 2012, the unit of Foodborne Infections at Statens Serum Institut (SSI) in Denmark has arranged this EQA under a framework contract with ECDC. EQA-10 contains serotyping, detection of virulence genes, and molecular typing-based cluster analysis.
Human STEC infection is a zoonotic disease. In 2019, the disease had an EU notification rate of 2.2 cases per 100 000 population, with a similar rate in 2018. The most commonly reported STEC O group was O157 (26.6% of cases with known O group).
Since 2007, ECDC has been responsible for the EU-wide surveillance of STEC, including facilitating the detection and investigation of food-borne outbreaks. Surveillance data, including basic typing parameters and molecular typing data for the isolated pathogen, are reported by Member States to The European Surveillance System (TESSy). The surveillance system relies on the capacity of NPHRLs in FWD-Net providing data to produce comparable typing results. To ensure that the EQA is linked to the development of surveillance methods used by NPHRLs, a molecular typing-based cluster analysis using either pulsed-field gel electrophoresis (PFGE) and/or whole genome sequencing (WGS)-derived data has been included since EQA-8. The quality assessment of PFGE as performed in EQA-4 to-7 has been excluded.
The objectives of the EQA are to assess the quality and comparability of typing data reported by NPHRLs participating in FWD-Net. Test isolates for the EQA were selected to cover strains currently relevant to public health in Europe and represent a broad range of clinically relevant types of STEC. Two separate sets of 10 test isolates were selected for serotyping/virulence profile determination and molecular typing-based cluster analysis respectively.
Twenty-seven laboratories registered and 26 completed the exercise, representing a small increase in participation of 10% from the EQA-9.
The full O:H serotyping was performed by 62% (16/26) of participating laboratories, with an average score of 94%. In general, the more common European serotypes generated the highest scores, e.g. 100% for O157:H7 isolates, while the less frequent O5:H19 and O80:H2 obtained an average score of 88%. Notably, not all laboratories demonstrated the capacity to determine all O groups and H types and participation in H typing was low (16/26). A shift towards the WGS-based method was observed for O grouping, 52% (11/21) compared to 50% in EQA-9 and only 26% EQA-8.
The quality of the virulence profile determination results was generally good, with high average scores of 98%, 100%, and 99% for eae, stx1, and stx2, respectively, similar to previous EQAs. The participants identified the true enteroaggregative E. coli (EAEC) isolate by correctly reporting the presence of the aaiC and/or aggR for 19/21 laboratories (90%). However, the additional isolate with an aaiC variant was identified by 10/21 laboratories, as the variant is only detectable by WGS (virulence finder) or dot blot hybridisation but not by PCR using Boisen et al. 2008 primers (see section 3.4.3 and Annex 23 in ECDC’s report of STEC EQA-6 [20]). Correct subtyping of stx1 and stx2 obtained a combined average score of 97%, the highest score since EQA-4.
Out of the 26 laboratories participating in the EQA-10, 16 (62%) performed molecular typing-based cluster analysis using various methods. The purpose of the cluster analysis part of the EQA was to assess the NPHRL’s ability to identify a cluster of genetically closely related isolates i.e. to correctly categorise the cluster test isolates regardless of the method used, not to follow a specific procedure.
The EQA-10 included one cluster of closely related isolates. The cluster contained four ST21 isolates, and the expected cluster was based on a predefined categorisation by the organiser using WGS. Fifteen laboratories used WGS as the only method, one laboratory participated using PFGE, and one laboratory participated using both PFGE and WGS derived data for cluster analysis. This was a decrease from eight participants in EQA-9 to two using PFGE in this EQA.
Performance was high among the 15 laboratories using WGS-derived data, with 14 (93%) participants correctly identifying the cluster of closely related isolates. In this EQA, participants were free to choose their preferred analytical method for the WGS-based cluster identification. An allele-based method was most frequently used; 87% (13/15) used core genome MultiLlocus Sequence Type (cgMLST) compared to 13% (2/15) using single nucleotide polymorphism (SNP) for the reported cluster analysis as the main analysis.
In general, for cgMLST the reported results were at a comparable level despite analysis with different approaches and allelic calling methods. Only two laboratories reported SNP results. They showed similar SNP distances, but the conclusion of isolates within the cluster (cut-off) were different and one of the laboratories did not identify the correct cluster. For inter-laboratory comparability and communication about cluster definitions, cgMLST using a
TECHNICAL REPORT Tenth external quality assessment scheme for Shiga toxin-producing Escherichia coli
2
standard scheme (e.g. Enterobase) gives a very high degree of homogeneity in the results, while the use of non-standardised SNP analysis may be more challenging. There are two main challenges: difficulty in comparing SNP with cgMLST results, and variations between SNP analyses in general, as demonstrated in this EQA, which makes the comparison and communication between laboratories difficult.
In this EQA, the EQA provider introduced an additional part to the molecular typing-based cluster analysis: an assessment of five EQA provided genomes. In an urgent outbreak situation, the sequence data available are not always of high quality, so this EQA-part was designed to mimic this situation. The participants assessed additional genomes, some of which were modified by the EQA provider in order to give a realistic view of different quality issues. Most of the participants successfully identified the genomes of high quality as a cluster isolate or a non-cluster isolate. The 10% contamination with Klebsiella pneumonia was identified by 9/15 and the inter-species contamination with a different E. coli was only detected by 4/15. The poor quality for one genome was observed by 13/15 laboratories.
Tenth external quality assessment scheme for Shiga toxin-producing Escherichia coli TECHNICAL REPORT
3
1. Introduction 1.1 Background ECDC is a European Union (EU) agency with a mandate to operate dedicated surveillance networks. The agency’s mission is to identify, assess, and communicate about current and emerging threats to human health from communicable diseases. ECDC’s founding regulation outlines its mandate as fostering the development of sufficient capacity within the EU/European Economic Area (EEA) network for diagnosis, detection, identification, and characterisation of infectious agents that may threaten public health. ECDC maintains and extend such cooperation and support the implementation of quality assurance schemes [1].
External quality assessments (EQA) are an essential part of laboratory quality management and uses an external organiser to assess the performance of laboratories on test samples supplied specifically for the quality assessment purpose.
ECDC has outsourced the organisation of EQA schemes for EU/ EEA countries in the disease networks. EQAs aim to identify areas for improvement in laboratory diagnostic capacities relevant for epidemiological surveillance of communicable diseases as set forth in Decision No 1082/2013/EU [2] and ensure the reliability and comparability of results generated by laboratories across all EU/EEA countries.
The main purposes of EQA schemes are to:
• assess general standard of performance (‘state of the art’); • assess effects of analytical procedures (method principle, instruments, reagents, calibration); • evaluate individual laboratory performance; • identify of problem areas; • provide continuing education; and • identify needs for training activities.
Since 2012, the unit of Foodborne Infections at Statens Serum Institut (SSI), Denmark, has been the EQA provider for the three EQA schemes covering typing of Salmonella enterica ssp. enterica, Shiga toxin/verocytotoxin-producing Escherichia coli (E. coli; STEC/VTEC) and L. monocytogenes. In 2016, SSI was granted the new round of tenders (2017–2020) for all three schemes. For STEC, the EQA scheme no longer covers assessment of PFGE quality as was done in EQA-8 and EQA-9. However, it still covers serotyping, virulence profile determination, and molecular typing-based cluster analysis. This report presents the results of the 10th EQA scheme (STEC EQA-10).
1.2 Surveillance of STEC infections STEC is a group of E. coli characterised by the ability to produce Shiga toxins (Stxs).
Human pathogenic STEC often harbour additional virulence factors important to the pathogenesis of the disease. A large number of serotypes of E. coli have been recognised as Stx producers. Notably, the majority of reported human STEC infections are sporadic cases. Symptoms associated with STEC infection in humans vary from mild diarrhoea to life-threatening haemolytic uraemic syndrome (HUS), which is clinically defined as a combination of haemolytic anaemia, thrombocytopenia and acute renal failure.
In 2019, the EU notification rate of STEC infections was 2.2 cases per 100 000 population, which was similar to 2018 (2.3 cases per 100,000 population). The total number of confirmed STEC infection cases was 7 775, a slight decrease from 2018 (n=8 161). Ten deaths due to STEC infection were reported, resulting in an EU case fatality of 0.21%. As in previous years, the most commonly reported STEC O group was O157 (26.6% of cases with known O group), followed by O26 [3].
One of ECDC’s key objectives is to improve and harmonise the surveillance system in the EU to increase scientific knowledge of aetiology, risk factors, and burden of FWDs and zoonoses. Surveillance data, including some basic typing parameters for the isolated pathogen, are reported by Member States to TESSy. In addition to the basic characterisation of the pathogens isolated from human infections, there is public health value in using more discriminatory typing techniques for pathogen characterisation in the surveillance of food-borne infections. Since 2012, ECDC has enhanced EU surveillance by incorporating molecular typing data through isolate-based reporting. Three selected FWD pathogens were included: Salmonella enterica ssp. enterica, L. monocytogenes, and STEC/VTEC. The overall aims of integrating molecular typing into EU level surveillance are to:
• foster the rapid detection of dispersed international clusters/outbreaks; • facilitate the detection and investigation of transmission chains and relatedness of isolates across Member
States and contribution to global investigations; • detect the emergence of new evolving pathogenic isolates;
TECHNICAL REPORT Tenth external quality assessment scheme for Shiga toxin-producing Escherichia coli
4
• support investigations to trace the source of an outbreak and identify new risk factors; and • aid the study of a particular pathogen’s characteristics and behaviour in a community of hosts.
Molecular typing-enhanced surveillance gives Member State users access to EU-wide molecular typing data for the pathogens included. It also gives users the opportunity to perform cluster searches and cross-sector comparability of EU-level data to determine whether isolates characterised by molecular typing at the national level are part of a multinational cluster that may require cross-border response collaboration.
1.3 STEC characterisation State-of-the-art characterisation of STEC includes O:H serotyping in combination with a few selected virulence genes, i.e. the two genes for production of Shiga toxin Stx1 (stx1) and Stx2 (stx2) and the intimin (eae) gene associated with attaching and effacing lesion of enterocytes, also seen in attaching and effacing non-STEC E. coli (AEEC), including enteropathogenic E. coli (EPEC). The combination of virulence genes and subtypes of toxin genes is clinically relevant. The stx2a in eae-positive STEC and the activatable stx2d subtype in eae-negative STEC appear to be highly associated with the serious sequela HUS [4–6]. In the recent Scientific Opinion by EFSA, analysis of the confirmed reported human STEC infections in the EU/EEA (2012–2017) reveals that all Stx toxin subtypes may be associated with some cases of severe illness defined as bloody diarrhoea, HUS and/or hospitalisation [7]. Understanding the epidemiology of stx subtypes is therefore important to prevent the risk of STEC infection and for the surveillance of STEC.
The recommended method for stx subtyping is a specific PCR [8]. STEC serotype O157:[H7] may be divided into two groups: non-sorbitol fermenters (NSF) and a highly virulent sorbitol fermenting (SF) variant of O157. STEC EQA-10 included O:H serotyping, detection of virulence genes (eae, stx1 and stx2, including subtyping of stx genes) and aaiC and aggR genes specific for enteroaggregative E. coli (EAEC), and molecular typing-based cluster analysis.
1.4 Objectives EQA schemes offer quality support for those NPHRLs that are performing molecular typing-enhanced surveillance and those implementing it in their surveillance system at national level.
1.4.1 Serotyping The objectives of STEC serotyping in EQA-10 were to assess the ability to assign correct O groups and H types by using either serological (detection of somatic ‘O’ and flagellar ‘H’ antigens) or molecular typing methods (PCR or WGS).
1.4.2 Virulence profile determination The objectives of the virulence gene determination of STEC EQA-10 were to assess the ability to assign the correct virulence profile; the presence/absence of stx1, stx2, eae, aaiC and aggR genes and subtyping of stx genes (stx1a, stx1c and stx1d and stx2a to stx2g).
1.4.3 Molecular typing-based cluster analysis The objective of the molecular typing-based cluster analysis of STEC EQA-10 was to assess the ability to detect a cluster of closely related isolates. Laboratories could perform the analyses using PFGE or derived data from WGS. In addition, the participant was offered to assess extra genomes and determine whether the genomes were part of the defined cluster and describe their observations and considerations leading to the decision. The genomes were manipulated by the EQA provider. In the individual reports, this analysis was not evaluated and therefore not directly commented on, but will be summarised in this report.
Tenth external quality assessment scheme for Shiga toxin-producing Escherichia coli TECHNICAL REPORT
5
2. Study design 2.1 Organisation STEC EQA-10 was funded by ECDC and arranged by SSI following ISO/IEC 17043:2010 [9]. EQA-10 included serotyping, virulence gene determination, and a molecular typing-based cluster analysis, and was carried out between December 2019 and July 2020.
Invitations were emailed to ECDC contact points in FWD-Net (27 countries, which nominated laboratories to participate in the EQA rounds 2017-2020) by 6 December 2019 with a deadline to respond by 3 January 2020. In addition, invitations were sent to EU candidate and potential candidate countries Turkey and North Macedonia, which signed up to the STEC EQA rounds in 2017-2020. Each laboratory was asked to fill in the reason for participation or non-participation.
Twenty-seven NPHRLs in EU/EEA and EU candidate countries accepted the invitation to participate, and 26 submitted results (Annex 1). EQA test isolates were sent to participants from 26 February to 15 March 2019. In Annex 2, participation details in EQA-9 and EQA-10 are listed to give an overview of the trend in the number of participants. In addition, Annex 3 contains each laboratory’s reason for participating or not participating. Nineteen self-funded laboratories were invited to participate in the EQA. Participants were asked to submit their results to an SFTP-site and complete the online form before the extended deadline (because of the COVID-19 pandemic) of 17 June 2020 (Annex 14). Two laboratories asked for the submission protocol to be sent again, two other laboratories were asked to submit the missing raw reads, and two laboratories were asked to remember to complete data online; one never submitted any data. The EQA submission protocol, invitation letter, and an empty submission form were available on the website.
2.2 Selection of test isolates/genomes Thirty-five test isolates were selected to fulfil the following criteria:
• represent commonly reported strains in Europe; • remain stable during the preliminary test period at the organising laboratory; and • include genetically closely related isolates.
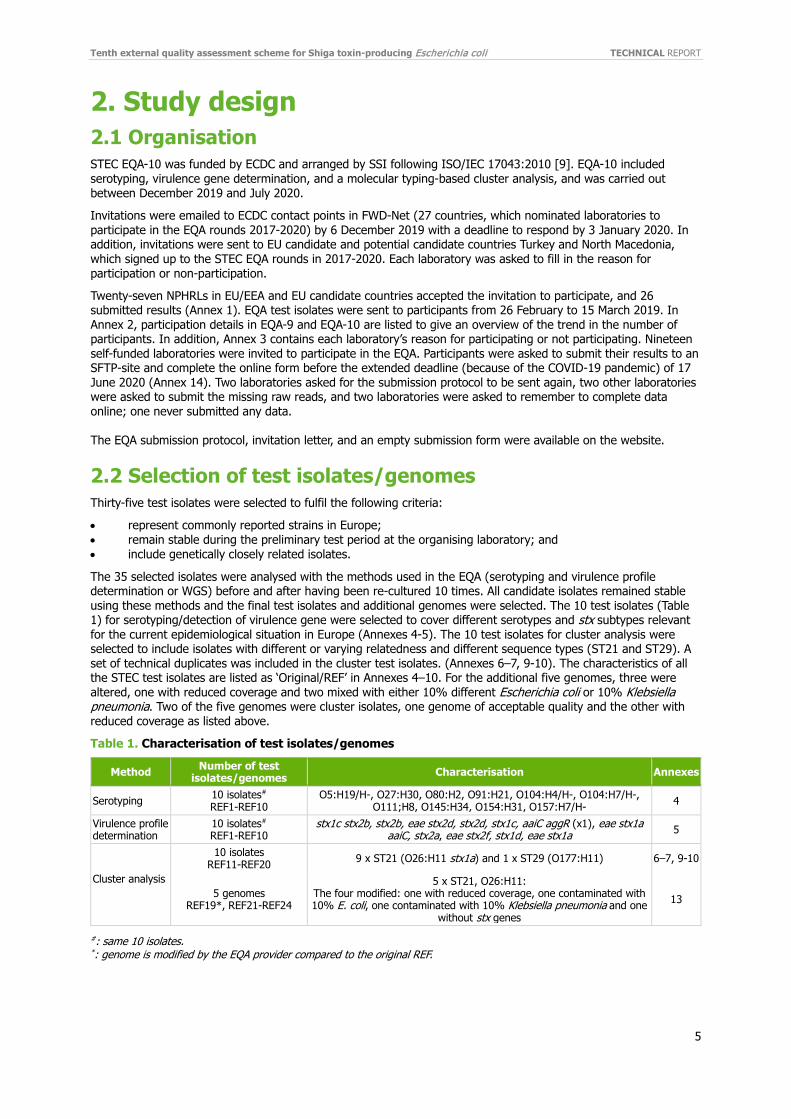
The 35 selected isolates were analysed with the methods used in the EQA (serotyping and virulence profile determination or WGS) before and after having been re-cultured 10 times. All candidate isolates remained stable using these methods and the final test isolates and additional genomes were selected. The 10 test isolates (Table 1) for serotyping/detection of virulence gene were selected to cover different serotypes and stx subtypes relevant for the current epidemiological situation in Europe (Annexes 4-5). The 10 test isolates for cluster analysis were selected to include isolates with different or varying relatedness and different sequence types (ST21 and ST29). A set of technical duplicates was included in the cluster test isolates. (Annexes 6–7, 9-10). The characteristics of all the STEC test isolates are listed as ‘Original/REF’ in Annexes 4–10. For the additional five genomes, three were altered, one with reduced coverage and two mixed with either 10% different Escherichia coli or 10% Klebsiella pneumonia. Two of the five genomes were cluster isolates, one genome of acceptable quality and the other with reduced coverage as listed above.
Table 1. Characterisation of test isolates/genomes
#: same 10 isolates. *: genome is modified by the EQA provider compared to the original REF.
Method Number of test isolates/genomes Characterisation Annexes
Serotyping 10 isolates# REF1-REF10
O5:H19/H-, O27:H30, O80:H2, O91:H21, O104:H4/H-, O104:H7/H-, O111;H8, O145:H34, O154:H31, O157:H7/H- 4
Virulence profile determination
10 isolates#
REF1-REF10 stx1c stx2b, stx2b, eae stx2d, stx2d, stx1c, aaiC aggR (x1), eae stx1a
aaiC, stx2a, eae stx2f, stx1d, eae stx1a 5
Cluster analysis
10 isolates REF11-REF20 9 x ST21 (O26:H11 stx1a) and 1 x ST29 (O177:H11) 6–7, 9-10
5 genomes REF19*, REF21-REF24
5 x ST21, O26:H11: The four modified: one with reduced coverage, one contaminated with 10% E. coli, one contaminated with 10% Klebsiella pneumonia and one
without stx genes 13

TECHNICAL REPORT Tenth external quality assessment scheme for Shiga toxin-producing Escherichia coli
6
2.3 Distribution of isolates/genomes All test isolates were blinded and shipped on 26 February 2020 (23/27 packages). Three were sent on 5 March and one was delayed shipment until 4 May. The delay was caused by sending the package with UN2814 during the of COVID-19 pandemic. Letters stating the unique isolate IDs were included in the packages and distributed individually to the participants by email on the day of shipment as an extra precaution. Thirteen participants received the isolates within one to two days, 10 within five to eight days and four within 10 to 20 days after shipment, respectively. No participants reported damage to the shipment or errors in the unique isolate IDs.
On 6 March 2020, instructions for the submission of results procedure were emailed to the participants. This included the links to the online site for uploading sequences and downloading the additional genomes and the empty submission form.
2.4 Testing In the serotyping part, 10 STEC isolates were tested to assess the participants’ ability to obtain the correct serotype. The participants could perform conventional serological methods according to suggested protocol [10] or molecular-based serotyping (PCR or WGS). The results of serotypes were submitted in the online form.
The same set of isolates as used for serotyping analysis was used for the virulence profile. The analyses were designed to assess the participants’ ability to obtain the correct virulence profile. The participants could choose to perform detection of aaiC and aggR (two EAEC associated genes), eae and stx1 and stx2, as well as subtyping of stx genes stx1 (stx1a, stx1c or stx1d) and stx2 (stx2a - stx2g) according to suggested protocol [11]. The results were submitted in the online form.
In the molecular typing-based cluster analysis part, participants could perform the laboratory part using PFGE [12] or WGS-derived data. Participants were instructed to report the IDs of isolates included in the cluster of closely related isolates by method. If PFGE analysis was conducted, the participant reported the total number of bands and number of shared bands with a selected cluster representative isolate.
Laboratories performing WGS could use their own analysis pipeline for cluster analysis, e.g. single nucleotide polymorphism analysis (SNP-based) or whole/core genome Multi Locus Sequence Typing (wgMLST/cgMLST) (allele-based) and were asked to submit the isolates identified as a cluster of closely related isolates based on the analysis used. Laboratories could report results from up to three analyses (one main and up to two additional), but the detected cluster were required to be based on results from the main analysis. The laboratories reported SNP distance or allelic differences between a selected cluster isolate and each test isolate and uploaded the raw reads (FASTQ files) to an SFTP site.
In addition, each participant could assess extra genomes (manipulated by the EQA provider) and determine whether the genomes were part of the defined cluster (Yes/No) and describe their observations and considerations leading to the decision.
2.5 Data analysis As the participating laboratories submitted their results, the serotype, virulence profile, and cluster analysis results, as well as the participants’ uploaded raw reads, were imported to a dedicated STEC EQA-10 BioNumerics (BN) database. If errors in the submission process were identified, the EQA provider reported this to participants, thereby obtaining analysable results. The EQA provider was in contact with two participants in order to ensure sequences were uploaded to the SFTP site.
Serotyping results were evaluated according to the percentage of correct results, generating a score from 0–100% for O group, H type and O:H serotype.
The virulence profile determination results were evaluated according to the percentage of correct results, generating a score from 0–100% for eae, aaiC, aggR, stx1, stx2, subtyping of stx1 and stx2 and combined subtype (Table 1).
Molecular typing-based cluster analysis was evaluated according to correct or incorrect identification of the expected cluster of closely related isolates based on a pre-defined categorisation by the organiser. The EQA provider’s WGS-derived cluster analysis was based on allele-based cgMLST [13] and SNP analysis (NASP) [14]. The cluster categorisation is based on WGS data and the correct cluster delineation might be difficult to obtain by the use of less discriminatory methods, e.g. PFGE. The cluster contained four ST21 isolates: REF11, REF15, REF19 and REF20 (REF11 and REF15 were technical duplicates). The EQA provider found at most two allele differences or three SNPs between any two isolates in the cluster. The rest of the cluster test isolates were additional five ST21s and one ST29.

Tenth external quality assessment scheme for Shiga toxin-producing Escherichia coli TECHNICAL REPORT
7
The participants’ descriptions of the manipulated genomes are listed in Annex 13. This analysis was not commented on in the individual reports but will be summarised in this report.
Individual evaluation reports were distributed to participants in September 2020 and certificates of attendance in October 2020. If WGS data were used, the evaluation report included a quality assessment made by the EQA provider’s in-house quality control pipeline (e.g. coverage, N50, sequence length, and number of contigs). The evaluation report did not include an evaluation based on quality thresholds.
TECHNICAL REPORT Tenth external quality assessment scheme for Shiga toxin-producing Escherichia coli
8
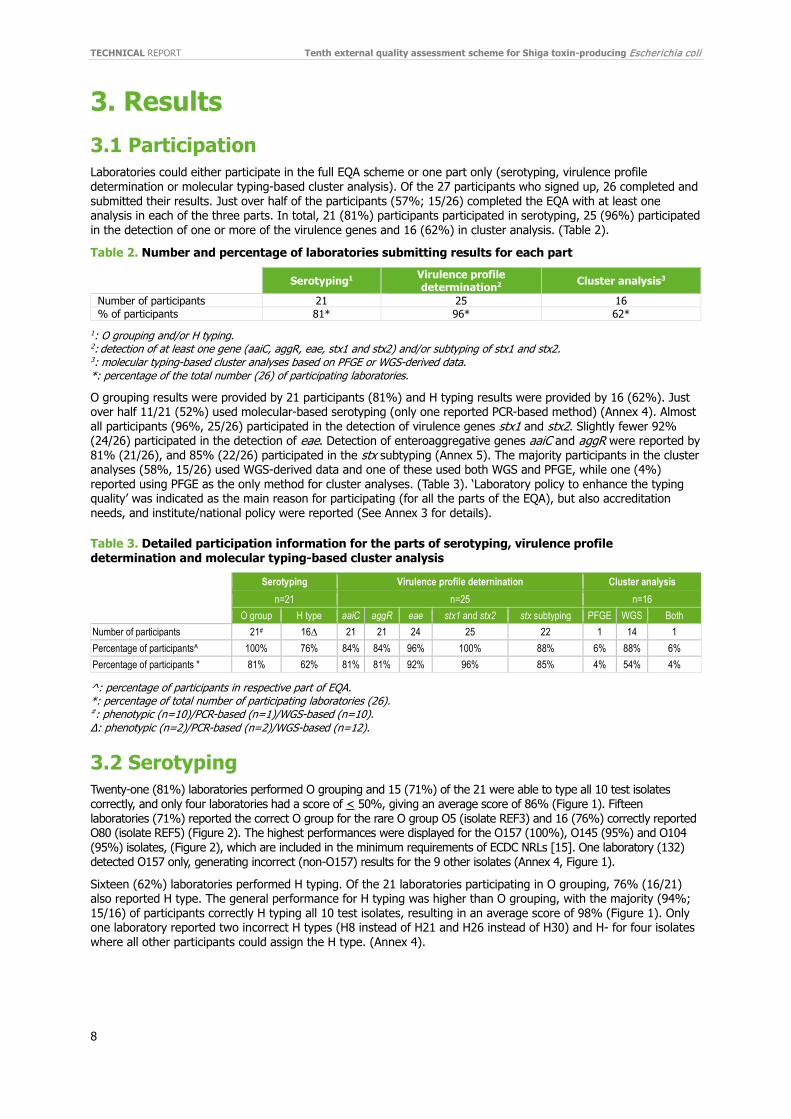
3. Results 3.1 Participation Laboratories could either participate in the full EQA scheme or one part only (serotyping, virulence profile determination or molecular typing-based cluster analysis). Of the 27 participants who signed up, 26 completed and submitted their results. Just over half of the participants (57%; 15/26) completed the EQA with at least one analysis in each of the three parts. In total, 21 (81%) participants participated in serotyping, 25 (96%) participated in the detection of one or more of the virulence genes and 16 (62%) in cluster analysis. (Table 2).
Table 2. Number and percentage of laboratories submitting results for each part
1: O grouping and/or H typing. 2: detection of at least one gene (aaiC, aggR, eae, stx1 and stx2) and/or subtyping of stx1 and stx2. 3: molecular typing-based cluster analyses based on PFGE or WGS-derived data. *: percentage of the total number (26) of participating laboratories.
O grouping results were provided by 21 participants (81%) and H typing results were provided by 16 (62%). Just over half 11/21 (52%) used molecular-based serotyping (only one reported PCR-based method) (Annex 4). Almost all participants (96%, 25/26) participated in the detection of virulence genes stx1 and stx2. Slightly fewer 92% (24/26) participated in the detection of eae. Detection of enteroaggregative genes aaiC and aggR were reported by 81% (21/26), and 85% (22/26) participated in the stx subtyping (Annex 5). The majority participants in the cluster analyses (58%, 15/26) used WGS-derived data and one of these used both WGS and PFGE, while one (4%) reported using PFGE as the only method for cluster analyses. (Table 3). ‘Laboratory policy to enhance the typing quality’ was indicated as the main reason for participating (for all the parts of the EQA), but also accreditation needs, and institute/national policy were reported (See Annex 3 for details).
Table 3. Detailed participation information for the parts of serotyping, virulence profile determination and molecular typing-based cluster analysis
Serotyping Virulence profile deternination Cluster analysis
n=21 n=25 n=16 O group H type aaiC aggR eae stx1 and stx2 stx subtyping PFGE WGS Both
Number of participants 21# 16∆ 21 21 24 25 22 1 14 1 Percentage of participants^ 100% 76% 84% 84% 96% 100% 88% 6% 88% 6% Percentage of participants * 81% 62% 81% 81% 92% 96% 85% 4% 54% 4%
^: percentage of participants in respective part of EQA. *: percentage of total number of participating laboratories (26). #: phenotypic (n=10)/PCR-based (n=1)/WGS-based (n=10). ∆: phenotypic (n=2)/PCR-based (n=2)/WGS-based (n=12).
3.2 Serotyping Twenty-one (81%) laboratories performed O grouping and 15 (71%) of the 21 were able to type all 10 test isolates correctly, and only four laboratories had a score of < 50%, giving an average score of 86% (Figure 1). Fifteen laboratories (71%) reported the correct O group for the rare O group O5 (isolate REF3) and 16 (76%) correctly reported O80 (isolate REF5) (Figure 2). The highest performances were displayed for the O157 (100%), O145 (95%) and O104 (95%) isolates, (Figure 2), which are included in the minimum requirements of ECDC NRLs [15]. One laboratory (132) detected O157 only, generating incorrect (non-O157) results for the 9 other isolates (Annex 4, Figure 1).
Sixteen (62%) laboratories performed H typing. Of the 21 laboratories participating in O grouping, 76% (16/21) also reported H type. The general performance for H typing was higher than O grouping, with the majority (94%; 15/16) of participants correctly H typing all 10 test isolates, resulting in an average score of 98% (Figure 1). Only one laboratory reported two incorrect H types (H8 instead of H21 and H26 instead of H30) and H- for four isolates where all other participants could assign the H type. (Annex 4).
Serotyping1 Virulence profile determination2 Cluster analysis3
Number of participants 21 25 16 % of participants 81* 96* 62*

Tenth external quality assessment scheme for Shiga toxin-producing Escherichia coli TECHNICAL REPORT
9
Figure 1. Participant percentage scores for O grouping and H typing
Arbitrary numbers represent participating laboratories. Bars represent the percentage of correctly assigning O groups (light green), n= 21 participants, H types (dark green), n=16 participants, Combined O:H serotypes (grey), n=16 participants.
Complete O:H serotyping was performed by 16 (62%) participants with an average score of 94%, and for each isolate the score was ranging from 88% (14/16) for O5:H19(H-) (REF3) and O80:H2 (REF5) to 100% (16/16) for isolate O104:H7 (REF1), O157:H7(H-) (REF2) and O145:H34 (REF4) of the participants reporting the correct serotype (Figure 2).
Figure 2. Average percentage test isolate score for serotyping of O and H
Bars represent the percentage of laboratories correctly assigning O groups (light green): n=21 participants. H types (dark green): n=16 participants. Combined O:H serotypes (grey): n=16 participants. Average scores: O group, 86%; H type, 98% and combined O:H serotype, 94%.
3.3 Virulence profile determination Between 21 and 25 laboratories submitted results for each of the virulence genes, consisting of detection of EAEC (aaiC and aggR) and virulence genes (eae, stx1 and stx2) and subtyping of stx1 and stx2 genes. Twenty-four participants submitted results for eae and 25 stx genes. Twenty-two laboratories submitted subtyping results of stx1 and stx2 genes and 21 the EAEC genes aggR and aaiC.
3.3.1 Detection of EAEC genes (aaiC and aggR) Among the isolates in this EQA, REF9 was an EAEC isolate containing both aggR and aaiC. The isolate of O104:H7 from EQA-6 was also included. This isolate REF1 contains a variant of aaiC, which has a 66% amino acid identity compared with the FN554766 (EAEC 042, serotype O44:H18). The variant is only detectable by WGS
TECHNICAL REPORT Tenth external quality assessment scheme for Shiga toxin-producing Escherichia coli
10
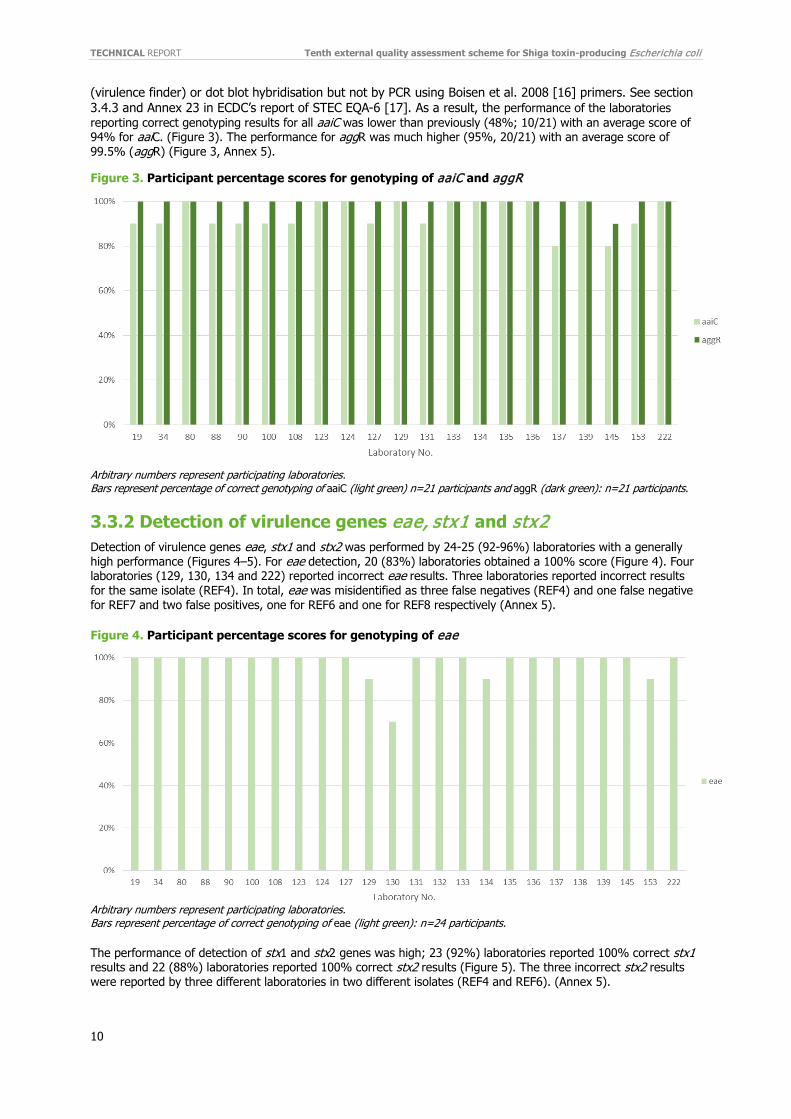
(virulence finder) or dot blot hybridisation but not by PCR using Boisen et al. 2008 [16] primers. See section 3.4.3 and Annex 23 in ECDC’s report of STEC EQA-6 [17]. As a result, the performance of the laboratories reporting correct genotyping results for all aaiC was lower than previously (48%; 10/21) with an average score of 94% for aaiC. (Figure 3). The performance for aggR was much higher (95%, 20/21) with an average score of 99.5% (aggR) (Figure 3, Annex 5).
Figure 3. Participant percentage scores for genotyping of aaiC and aggR
Arbitrary numbers represent participating laboratories. Bars represent percentage of correct genotyping of aaiC (light green) n=21 participants and aggR (dark green): n=21 participants.
3.3.2 Detection of virulence genes eae, stx1 and stx2 Detection of virulence genes eae, stx1 and stx2 was performed by 24-25 (92-96%) laboratories with a generally high performance (Figures 4–5). For eae detection, 20 (83%) laboratories obtained a 100% score (Figure 4). Four laboratories (129, 130, 134 and 222) reported incorrect eae results. Three laboratories reported incorrect results for the same isolate (REF4). In total, eae was misidentified as three false negatives (REF4) and one false negative for REF7 and two false positives, one for REF6 and one for REF8 respectively (Annex 5).
Figure 4. Participant percentage scores for genotyping of eae
Arbitrary numbers represent participating laboratories. Bars represent percentage of correct genotyping of eae (light green): n=24 participants.
The performance of detection of stx1 and stx2 genes was high; 23 (92%) laboratories reported 100% correct stx1 results and 22 (88%) laboratories reported 100% correct stx2 results (Figure 5). The three incorrect stx2 results were reported by three different laboratories in two different isolates (REF4 and REF6). (Annex 5).

Tenth external quality assessment scheme for Shiga toxin-producing Escherichia coli TECHNICAL REPORT
11
Figure 5. Participant percentage scores for detection of stx1 and stx2
Arbitrary numbers represent participating laboratories. Bars represent percentage of correct genotyping of stx1 (light green) and stx2 (dark green): n=25 participants. Average scores: stx1, 99%; stx2, 99%.
3.3.3 Subtyping of stx1 and stx2 Subtyping of stx1 and stx2 was performed by 22 laboratories. All 22 (100%) subtyped stx1 correctly and 18 (82%; 18/22) reported correct stx2 subtype for all 10 test isolates (Figure 6; Annex 5).
Laboratories were not allowed to only report results for selected test isolates for a particular test, so reporting ND was considered as an incorrect result if the laboratory reported results of other isolates for that test.
Only four laboratories (18%) reported an incorrect subtyping of stx2 for one or more isolates, primarily by reporting incorrect stx subtypes for the isolates and not ND. In total, the average score was 97% (Figure 6). The number of instances of mis-subtyping stx2 was seven. Laboratory 180 reported three of the seven incorrect stx2 subtypes. Laboratory 131 reported two incorrect stx2 subtypes and laboratories 127 and 133 reported one incorrect result each.
Figure 6. Participant percentage scores for subtyping of stx1 and stx2
Arbitrary numbers represent participating laboratories. Bars represent percentage of correct subtyping of stx1 (light green), stx2 (dark green), combined stx1 and stx2 (grey), n=22 participants. Reporting ND (not done) evaluated as incorrect.

TECHNICAL REPORT Tenth external quality assessment scheme for Shiga toxin-producing Escherichia coli
12
Figure 7. Average percentage test isolate score for subtyping of stx1 and stx2
Bars represent percentage of laboratories correctly subtyping stx1 (light green), stx2 (dark green) and combined stx1 and stx2 (grey), n=22. Average scores: stx1, 100%; stx2, 97% and combined stx1 and stx2, 97%.
Most incorrect results are no longer due to reporting ND instead of negative result, as in EQA-8. The incorrect results of stx2 subtyping shown in Table 4 are divided into three categories: false negatives, incorrect subtype of stx2 (6/7) or ND (1/7).
Table 4. Incorrect stx2 subtype results Incorrect subtype results Isolate
ID EQA
provider False
negative Incorrect Total true errors Errors by reporting ND#
REF1 - REF2 - REF3 stx2b stx2a (1) 1 REF4 stx2f stx2c (1) 1 REF5 stx2d stx2a (1) 1 1 REF6 - REF7 stx2a stx2b (1) 1 REF8 stx2d stx2f (1) 1 REF9 - REF10 stx2b stx2a (1) 1 Total 6 1
ND#: not done.
3.4 Molecular typing-based cluster analysis In this part of the EQA, participants were asked to identify a cluster of closely related isolates among 10 test isolates by using either PFGE and/or WGS-derived data. The cluster test isolates were pre-categorised by the EQA provider.
The expected cluster of closely related STEC ST21 (O26:H11 stx1a) isolates contained four isolates based on WGS derived data. The characteristics of the test isolates and reported results are listed in Annexes 6-7 and 9-10.
3.4.1 PFGE-derived data Of the 26 participants in the EQA, two (8%) performed cluster analysis using PFGE-derived data. Laboratory 127 correctly identified the cluster of closely related isolates defined by a pre-categorisation from the EQA provider among the 10 cluster test isolates. Laboratory 90 only identified two (REF15 and REF20) of the four cluster isolates. Table 5 shows the overview of the isolates each participant included or excluded in cluster identification. Laboratory 90 missed one of the technical duplicate isolates (REF11) and REF19 in the cluster of closely related isolates.

Tenth external quality assessment scheme for Shiga toxin-producing Escherichia coli TECHNICAL REPORT
13
Table 5. Results of cluster identification based on PFGE-derived data Laboratory number
Isolate ID ST 90 127 REF11‡# 21 No Yes REF12 21 No No REF13 21 No No REF14 29 No No REF15‡# 21 Yes Yes REF16 21 No No REF17 21 No No REF18 21 No No REF19‡ 21 No Yes REF20‡ 21 Yes Yes Cluster-identified No Yes ‡: closely related isolates (in grey). #: technical duplicates isolates (in bold). (Annex 7)
3.4.2 WGS-derived data 3.4.2.1 Reported results from participants Fifteen participants (58%) performed cluster analysis using WGS-derived data. Two laboratories reported using external assistance for sequencing. Different sequencing platforms were listed among the participants: 2 MiniSeq, 5 MiSeq, 1 HiSeq, 4 NextSeq, 1 Novaseq, 2 Ion Torrent (Ion GeneStudio S5 System and Ion Torrent S5XL). All laboratories reported using commercial kits for library preparation. Of the 15 participants, 11 (73%) used Illumina’s Nextera kit. Three participants reported changes from the manufacturer protocol, two in the volume, and one in the shearing time (Annex 8).
Performance was high in cluster analysis with WGS-derived data. Fourteen participants (93%) correctly identified the cluster of closely related isolates defined by pre-categorisation from the EQA provider among the 10 test isolates (Table 6). One laboratory did not include isolate REF19 (ST21) in the cluster of closely related isolates.
Table 6. Results of cluster identification based on WGS-derived data Isolate ID ST Laboratory number Isolate ID ST 19 34 80 100 108 123 124 127 133 134 135 136 137 139 222
REF11‡# 21 Yes Yes Yes Yes Yes Yes Yes Yes Yes Yes Yes Yes Yes Yes Yes REF12 21 No No No No No No No No No No No No No No No REF13 21 No No No No No No No No No No No No No No No REF14 29 No No No No No No No No No No No No No No No REF15‡# 21 Yes Yes Yes Yes Yes Yes Yes Yes Yes Yes Yes Yes Yes Yes Yes REF16 21 No No No No No No No No No No No No No No No REF17 21 No No No No No No No No No No No No No No No REF18 21 No No No No No No No No No No No No No No No REF19‡ 21 Yes Yes Yes Yes Yes Yes Yes Yes Yes Yes Yes Yes No Yes Yes REF20‡ 21 Yes Yes Yes Yes Yes Yes Yes Yes Yes Yes Yes Yes Yes Yes Yes Main analysis Allele Allele Allele Allele SNP Allele Allele Allele Allele Allele Allele Allele SNP Allele Allele
Additional analysis SNP SNV Allele SNP
Additional analysis 2 SNP Allele
Cluster-identified Yes Yes Yes Yes Yes Yes Yes Yes Yes Yes Yes Yes No Yes Yes ‡: closely related isolates (in grey). #: technical duplicates isolates (in bold). ST: sequence type. Allele: allele-based analysis. SNP: single-nucleotide polymorphism. SNV: single-nucleotide variant. (Annex 9)
TECHNICAL REPORT Tenth external quality assessment scheme for Shiga toxin-producing Escherichia coli
14
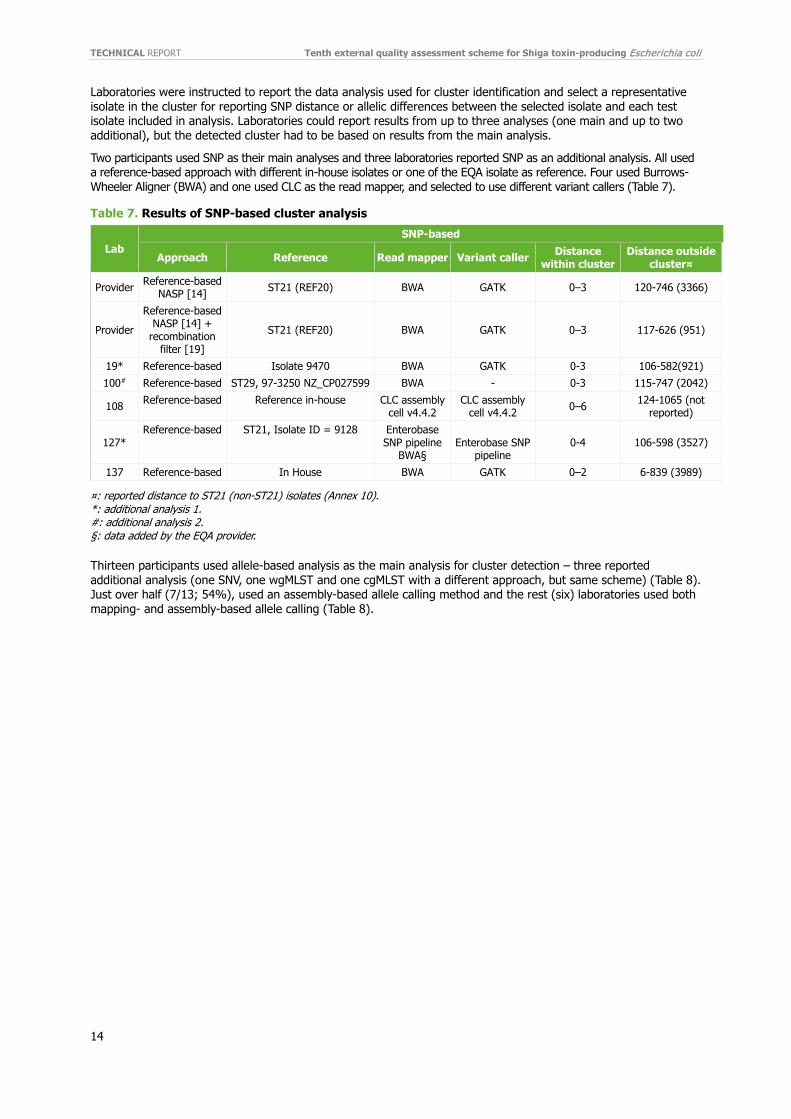
Laboratories were instructed to report the data analysis used for cluster identification and select a representative isolate in the cluster for reporting SNP distance or allelic differences between the selected isolate and each test isolate included in analysis. Laboratories could report results from up to three analyses (one main and up to two additional), but the detected cluster had to be based on results from the main analysis.
Two participants used SNP as their main analyses and three laboratories reported SNP as an additional analysis. All used a reference-based approach with different in-house isolates or one of the EQA isolate as reference. Four used Burrows-Wheeler Aligner (BWA) and one used CLC as the read mapper, and selected to use different variant callers (Table 7).
Table 7. Results of SNP-based cluster analysis
Lab SNP-based
Approach Reference Read mapper Variant caller Distance within cluster
Distance outside cluster¤
Provider Reference-based NASP [14] ST21 (REF20) BWA GATK 0–3 120-746 (3366)
Provider Reference-based
NASP [14] + recombination
filter [19] ST21 (REF20) BWA GATK 0–3 117-626 (951)
19* Reference-based Isolate 9470 BWA GATK 0-3 106-582(921) 100# Reference-based ST29, 97-3250 NZ_CP027599 BWA - 0-3 115-747 (2042)
108 Reference-based Reference in-house CLC assembly cell v4.4.2
CLC assembly cell v4.4.2 0–6 124-1065 (not
reported)
127* Reference-based ST21, Isolate ID = 9128
Enterobase SNP pipeline
BWA§ Enterobase SNP
pipeline 0-4 106-598 (3527)
137 Reference-based In House BWA GATK 0–2 6-839 (3989)
¤: reported distance to ST21 (non-ST21) isolates (Annex 10). *: additional analysis 1. #: additional analysis 2. §: data added by the EQA provider.
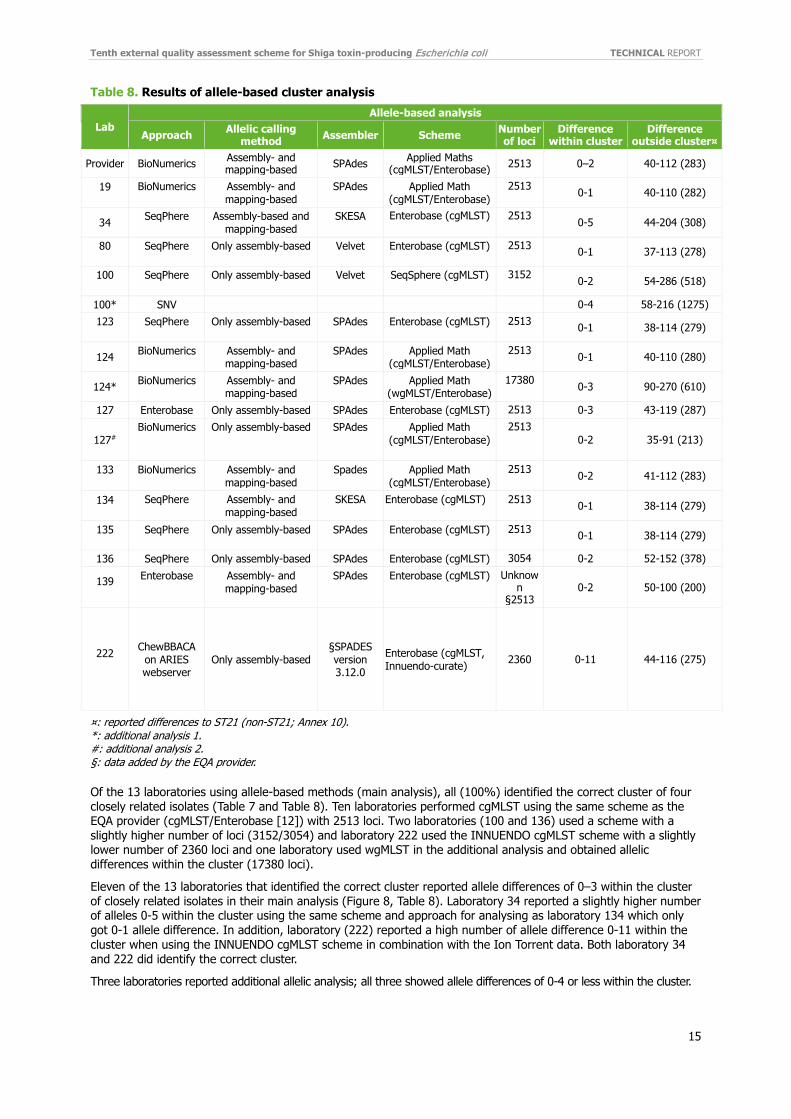
Thirteen participants used allele-based analysis as the main analysis for cluster detection – three reported additional analysis (one SNV, one wgMLST and one cgMLST with a different approach, but same scheme) (Table 8). Just over half (7/13; 54%), used an assembly-based allele calling method and the rest (six) laboratories used both mapping- and assembly-based allele calling (Table 8).
Tenth external quality assessment scheme for Shiga toxin-producing Escherichia coli TECHNICAL REPORT
15
Table 8. Results of allele-based cluster analysis
Lab Allele-based analysis
Approach Allelic calling method Assembler Scheme Number
of loci Difference
within cluster Difference
outside cluster¤
Provider BioNumerics Assembly- and mapping-based SPAdes Applied Maths
(cgMLST/Enterobase) 2513 0–2 40-112 (283)
19
BioNumerics Assembly- and mapping-based
SPAdes Applied Math (cgMLST/Enterobase)
2513 0-1 40-110 (282)
34 SeqPhere Assembly-based and mapping-based
SKESA Enterobase (cgMLST) 2513 0-5 44-204 (308)
80
SeqPhere Only assembly-based Velvet Enterobase (cgMLST) 2513 0-1 37-113 (278)
100
SeqPhere Only assembly-based Velvet SeqSphere (cgMLST)
3152 0-2 54-286 (518)
100* SNV 0-4 58-216 (1275) 123
SeqPhere Only assembly-based SPAdes Enterobase (cgMLST) 2513 0-1 38-114 (279)
124 BioNumerics Assembly- and mapping-based
SPAdes Applied Math (cgMLST/Enterobase)
2513 0-1 40-110 (280)
124* BioNumerics Assembly- and mapping-based
SPAdes Applied Math (wgMLST/Enterobase)
17380 0-3 90-270 (610)
127 Enterobase Only assembly-based SPAdes Enterobase (cgMLST) 2513 0-3 43-119 (287)
127# BioNumerics Only assembly-based SPAdes Applied Math
(cgMLST/Enterobase)
2513 0-2 35-91 (213)
133
BioNumerics Assembly- and mapping-based
Spades Applied Math (cgMLST/Enterobase)
2513 0-2 41-112 (283)
134
SeqPhere Assembly- and mapping-based
SKESA Enterobase (cgMLST) 2513 0-1 38-114 (279)
135
SeqPhere Only assembly-based SPAdes Enterobase (cgMLST) 2513 0-1 38-114 (279)
136 SeqPhere Only assembly-based SPAdes Enterobase (cgMLST) 3054 0-2 52-152 (378)
139
Enterobase Assembly- and mapping-based
SPAdes Enterobase (cgMLST) Unknown
§2513 0-2 50-100 (200)
222
ChewBBACA on ARIES webserver
Only assembly-based §SPADES version 3.12.0
Enterobase (cgMLST, Innuendo-curate) 2360 0-11 44-116 (275)
¤: reported differences to ST21 (non-ST21; Annex 10). *: additional analysis 1. #: additional analysis 2. §: data added by the EQA provider.
Of the 13 laboratories using allele-based methods (main analysis), all (100%) identified the correct cluster of four closely related isolates (Table 7 and Table 8). Ten laboratories performed cgMLST using the same scheme as the EQA provider (cgMLST/Enterobase [12]) with 2513 loci. Two laboratories (100 and 136) used a scheme with a slightly higher number of loci (3152/3054) and laboratory 222 used the INNUENDO cgMLST scheme with a slightly lower number of 2360 loci and one laboratory used wgMLST in the additional analysis and obtained allelic differences within the cluster (17380 loci).
Eleven of the 13 laboratories that identified the correct cluster reported allele differences of 0–3 within the cluster of closely related isolates in their main analysis (Figure 8, Table 8). Laboratory 34 reported a slightly higher number of alleles 0-5 within the cluster using the same scheme and approach for analysing as laboratory 134 which only got 0-1 allele difference. In addition, laboratory (222) reported a high number of allele difference 0-11 within the cluster when using the INNUENDO cgMLST scheme in combination with the Ion Torrent data. Both laboratory 34 and 222 did identify the correct cluster.
Three laboratories reported additional allelic analysis; all three showed allele differences of 0-4 or less within the cluster.
TECHNICAL REPORT Tenth external quality assessment scheme for Shiga toxin-producing Escherichia coli
16
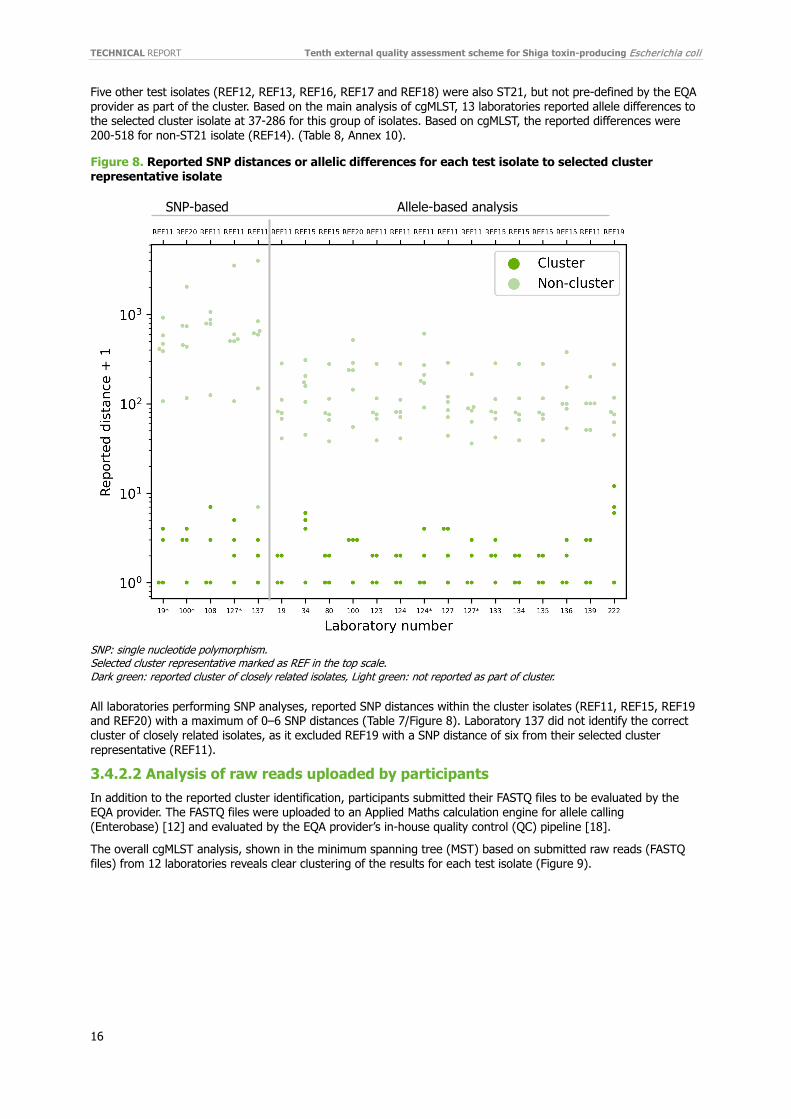
Five other test isolates (REF12, REF13, REF16, REF17 and REF18) were also ST21, but not pre-defined by the EQA provider as part of the cluster. Based on the main analysis of cgMLST, 13 laboratories reported allele differences to the selected cluster isolate at 37-286 for this group of isolates. Based on cgMLST, the reported differences were 200-518 for non-ST21 isolate (REF14). (Table 8, Annex 10).
Figure 8. Reported SNP distances or allelic differences for each test isolate to selected cluster representative isolate
SNP: single nucleotide polymorphism. Selected cluster representative marked as REF in the top scale. Dark green: reported cluster of closely related isolates, Light green: not reported as part of cluster.
All laboratories performing SNP analyses, reported SNP distances within the cluster isolates (REF11, REF15, REF19 and REF20) with a maximum of 0–6 SNP distances (Table 7/Figure 8). Laboratory 137 did not identify the correct cluster of closely related isolates, as it excluded REF19 with a SNP distance of six from their selected cluster representative (REF11).
3.4.2.2 Analysis of raw reads uploaded by participants In addition to the reported cluster identification, participants submitted their FASTQ files to be evaluated by the EQA provider. The FASTQ files were uploaded to an Applied Maths calculation engine for allele calling (Enterobase) [12] and evaluated by the EQA provider’s in-house quality control (QC) pipeline [18].
The overall cgMLST analysis, shown in the minimum spanning tree (MST) based on submitted raw reads (FASTQ files) from 12 laboratories reveals clear clustering of the results for each test isolate (Figure 9).
SNP-based Allele-based analysis

Tenth external quality assessment scheme for Shiga toxin-producing Escherichia coli TECHNICAL REPORT
17
Figure 9. Minimum spanning tree of core genome multilocus sequence typing participant FASTQ files
Minimum spanning tree (MST) in log scale of core genome multilocus sequence typing (cgMLST) [12] based on submitted raw reads (FASTQ files). Each of the REF11–20 test isolates have a different colour. REF results from the EQA-provider are in grey and REF11 and REF15 were technical duplicates’ isolates. Results from laboratory 108 and 222 were run in CE (using Ion Torrent setup for allele calling).
The allele differences in Figure 9 do not exactly match those illustrated in the individual reports and consequently those in Figure 10, where the same data are used. This discrepancy is caused by loci being dropped if they did not pass QC for all isolates in the analysis. Joint analysis accordingly contains fewer loci. For each laboratory, cgMLST was performed on the submitted raw reads (FASTQ files), applying Applied Maths allele calling with the Enterobase scheme [12]. A hierarchical single linkage clustering was performed on the submitted data for each laboratory along with the EQA provider’s reference isolates. Figure 10 shows the allele differences between each submitted sequence and the corresponding reference.
TECHNICAL REPORT Tenth external quality assessment scheme for Shiga toxin-producing Escherichia coli
18
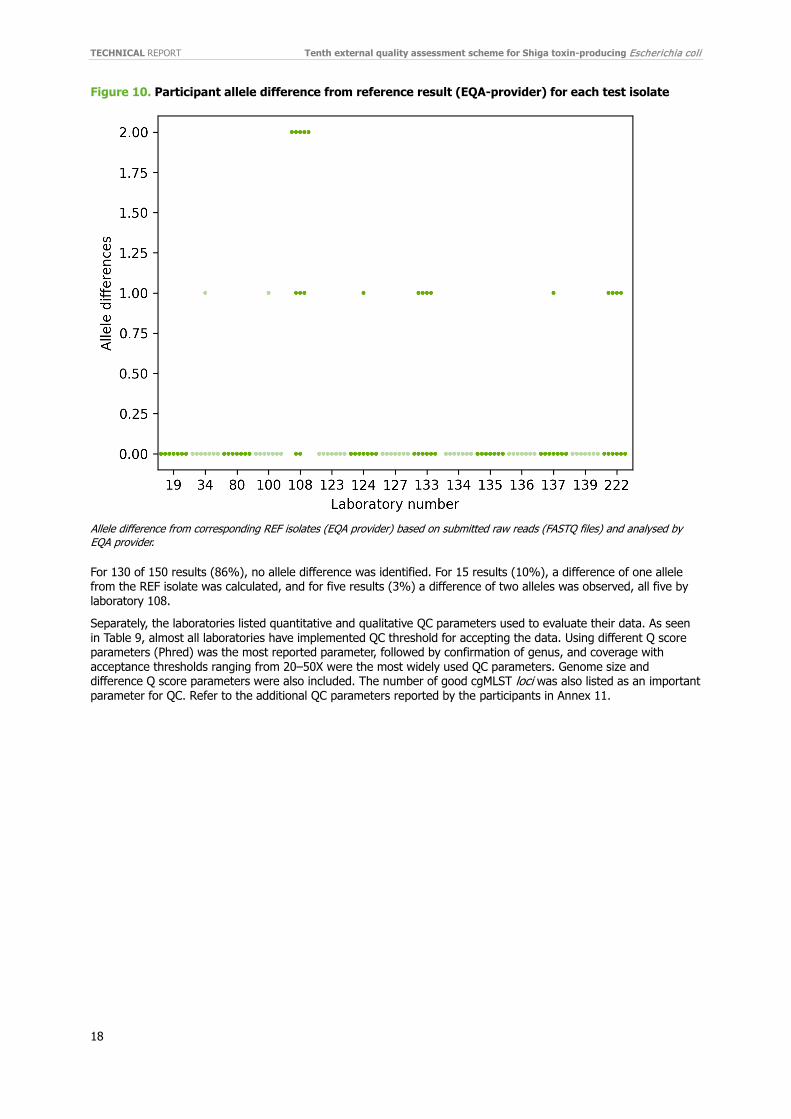
Figure 10. Participant allele difference from reference result (EQA-provider) for each test isolate
Allele difference from corresponding REF isolates (EQA provider) based on submitted raw reads (FASTQ files) and analysed by EQA provider.
For 130 of 150 results (86%), no allele difference was identified. For 15 results (10%), a difference of one allele from the REF isolate was calculated, and for five results (3%) a difference of two alleles was observed, all five by laboratory 108.
Separately, the laboratories listed quantitative and qualitative QC parameters used to evaluate their data. As seen in Table 9, almost all laboratories have implemented QC threshold for accepting the data. Using different Q score parameters (Phred) was the most reported parameter, followed by confirmation of genus, and coverage with acceptance thresholds ranging from 20–50X were the most widely used QC parameters. Genome size and difference Q score parameters were also included. The number of good cgMLST loci was also listed as an important parameter for QC. Refer to the additional QC parameters reported by the participants in Annex 11.

Tenth external quality assessment scheme for Shiga toxin-producing Escherichia coli TECHNICAL REPORT
19
Table 9. Summary of selected QC parameters reported by participants
Laboratory Confirmation of genus Coverage Q score (Phred) Genome size No. of good cgMLST loci
19 Kraken and < 5%
contamination with others Min x25 N50 value and number of
contigs - No threshold 4,64-5,56 Mbp
Core% and loci with multiple consensus - No actual threshold
employed on regular basis for either
34 Kraken RIDOM SeqSphere+ RIDOM SeqSphere+ RIDOM SeqSphere+ RIDOM SeqSphere+
80 - -
N50, Contig Count, Read Count, Average Coverage,
Perc. Good Targets more than 4 -
100 KmerFinder 3.2 CGE 40x FastQC assembled genome app.
5,2 Mbp) -
108 Species total match size
average similarity >20x Similarity, length, CDS
covered 1 All above, similarity, coverage >10
times
123
high percentage of cgMLST targets in E. coli
scheme is required >50 %cgMLST targets > 5 000 >98%
124 Genome size GC% in silico PCR e coli det >100
BioNumerics provides a quality statistics window for quality assessment. This is
used for assembly QC.
BioNumerics provides a quality statistics window for quality assessment. This is used for de novo
assembly QC.
BioNumerics provides a quality statistics window for quality
assessment. This is used for allele call QC.
127 Kraken in Enterobase >= 40 Number of contigs <= 800 between 4,2 - 6,5 Mbp Bionumerics summary calls % of core
present >=80
133 - - contig number, N50,
average read quality > 30
>4,7MB, <5,7MB No an exact rule further analysis
done if outside these parameters
NrAFPerfect, NrAFPresent, NrBAFPerfect, NrBAFPresent
134 match in SeqSphere
= 50x but if it's less the number of targets found should be >90% -
length of contigs assembled < ref genome
+ 10% cgMLST targets found and called >
90-95%
135 Kraken / Bracken, <4% contamination allowed -
number of contigs (>=500nt) <650
resulting genome size between 4,6 and 5,8 Mb >90% assigned alleles
136 k-mer > 95% N50, contig count, read count, average count more than 4 -
137 Kmer ID 1 - - Average coverage of all alleles
(Achtman 7 gene MLST)
139 - >50x
Use of Enterobase website and quality check, no of
contigs < 500 ¤N50 > 30 000 bp
Genome size 4.7 Mbp -
222 No mismatches (7 MLST
panel Warwick)
§Mentalist tool: 100% coverage in
length for all 7 MLST genes
>30x average depth of coverage
§ Mentalist tool: assessment of the depth of coverage,
correct allele calling of 7 MLST genes,
>80% of the 2360 total loci found.
N50 >30 000. -
At least 80% of the total 2360 loci of cgMLST scheme found.
% of laboratories using the QC
parameter 80% 80% 87% 80% 73%
§: Text adjusted for purpose of the table. ¤: ‘N50 >30 000bp’ reported by Lab 139 has been moved to the Q score column instead of Genome size column (details is added to the Annex 11).
TECHNICAL REPORT Tenth external quality assessment scheme for Shiga toxin-producing Escherichia coli
20
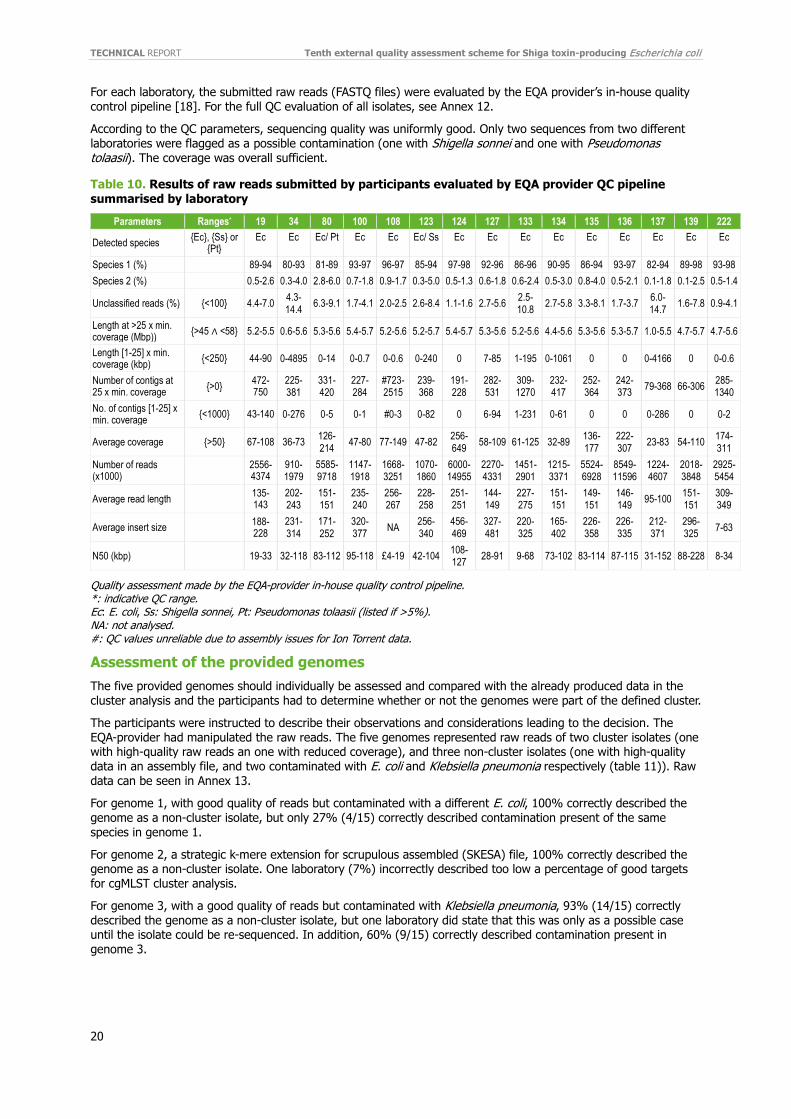
For each laboratory, the submitted raw reads (FASTQ files) were evaluated by the EQA provider’s in-house quality control pipeline [18]. For the full QC evaluation of all isolates, see Annex 12.
According to the QC parameters, sequencing quality was uniformly good. Only two sequences from two different laboratories were flagged as a possible contamination (one with Shigella sonnei and one with Pseudomonas tolaasii). The coverage was overall sufficient.
Table 10. Results of raw reads submitted by participants evaluated by EQA provider QC pipeline summarised by laboratory
Parameters Ranges* 19 34 80 100 108 123 124 127 133 134 135 136 137 139 222
Detected species {Ec}, {Ss} or {Pt}
Ec Ec Ec/ Pt Ec Ec Ec/ Ss Ec Ec Ec Ec Ec Ec Ec Ec Ec
Species 1 (%) 89-94 80-93 81-89 93-97 96-97 85-94 97-98 92-96 86-96 90-95 86-94 93-97 82-94 89-98 93-98 Species 2 (%) 0.5-2.6 0.3-4.0 2.8-6.0 0.7-1.8 0.9-1.7 0.3-5.0 0.5-1.3 0.6-1.8 0.6-2.4 0.5-3.0 0.8-4.0 0.5-2.1 0.1-1.8 0.1-2.5 0.5-1.4
Unclassified reads (%) {<100} 4.4-7.0 4.3-14.4 6.3-9.1 1.7-4.1 2.0-2.5 2.6-8.4 1.1-1.6 2.7-5.6 2.5-
10.8 2.7-5.8 3.3-8.1 1.7-3.7 6.0-14.7 1.6-7.8 0.9-4.1
Length at >25 x min. coverage (Mbp)) {>45 ∧ <58} 5.2-5.5 0.6-5.6 5.3-5.6 5.4-5.7 5.2-5.6 5.2-5.7 5.4-5.7 5.3-5.6 5.2-5.6 4.4-5.6 5.3-5.6 5.3-5.7 1.0-5.5 4.7-5.7 4.7-5.6
Length [1-25] x min. coverage (kbp) {<250} 44-90 0-4895 0-14 0-0.7 0-0.6 0-240 0 7-85 1-195 0-1061 0 0 0-4166 0 0-0.6
Number of contigs at 25 x min. coverage {>0} 472-
750 225-381
331-420
227-284
#723-2515
239-368
191-228
282-531
309-1270
232-417
252-364
242-373 79-368 66-306 285-
1340 No. of contigs [1-25] x min. coverage {<1000} 43-140 0-276 0-5 0-1 #0-3 0-82 0 6-94 1-231 0-61 0 0 0-286 0 0-2
Average coverage {>50} 67-108 36-73 126-214 47-80 77-149 47-82 256-
649 58-109 61-125 32-89 136-177
222-307 23-83 54-110 174-
311 Number of reads (x1000) 2556-
4374 910- 1979
5585-9718
1147-1918
1668-3251
1070-1860
6000-14955
2270-4331
1451-2901
1215-3371
5524-6928
8549-11596
1224-4607
2018-3848
2925-5454
Average read length 135-143
202-243
151-151
235-240
256-267
228-258
251-251
144-149
227-275
151-151
149-151
146-149 95-100 151-
151 309-349
Average insert size 188-228
231-314
171-252
320-377 NA 256-
340 456-469
327-481
220-325
165-402
226-358
226-335
212-371
296-325 7-63
N50 (kbp) 19-33 32-118 83-112 95-118 £4-19 42-104 108-127 28-91 9-68 73-102 83-114 87-115 31-152 88-228 8-34
Quality assessment made by the EQA-provider in-house quality control pipeline. *: indicative QC range. Ec: E. coli, Ss: Shigella sonnei, Pt: Pseudomonas tolaasii (listed if >5%). NA: not analysed. #: QC values unreliable due to assembly issues for Ion Torrent data.
Assessment of the provided genomes The five provided genomes should individually be assessed and compared with the already produced data in the cluster analysis and the participants had to determine whether or not the genomes were part of the defined cluster.
The participants were instructed to describe their observations and considerations leading to the decision. The EQA-provider had manipulated the raw reads. The five genomes represented raw reads of two cluster isolates (one with high-quality raw reads an one with reduced coverage), and three non-cluster isolates (one with high-quality data in an assembly file, and two contaminated with E. coli and Klebsiella pneumonia respectively (table 11)). Raw data can be seen in Annex 13.
For genome 1, with good quality of reads but contaminated with a different E. coli, 100% correctly described the genome as a non-cluster isolate, but only 27% (4/15) correctly described contamination present of the same species in genome 1.
For genome 2, a strategic k-mere extension for scrupulous assembled (SKESA) file, 100% correctly described the genome as a non-cluster isolate. One laboratory (7%) incorrectly described too low a percentage of good targets for cgMLST cluster analysis.
For genome 3, with a good quality of reads but contaminated with Klebsiella pneumonia, 93% (14/15) correctly described the genome as a non-cluster isolate, but one laboratory did state that this was only as a possible case until the isolate could be re-sequenced. In addition, 60% (9/15) correctly described contamination present in genome 3.
Tenth external quality assessment scheme for Shiga toxin-producing Escherichia coli TECHNICAL REPORT
21
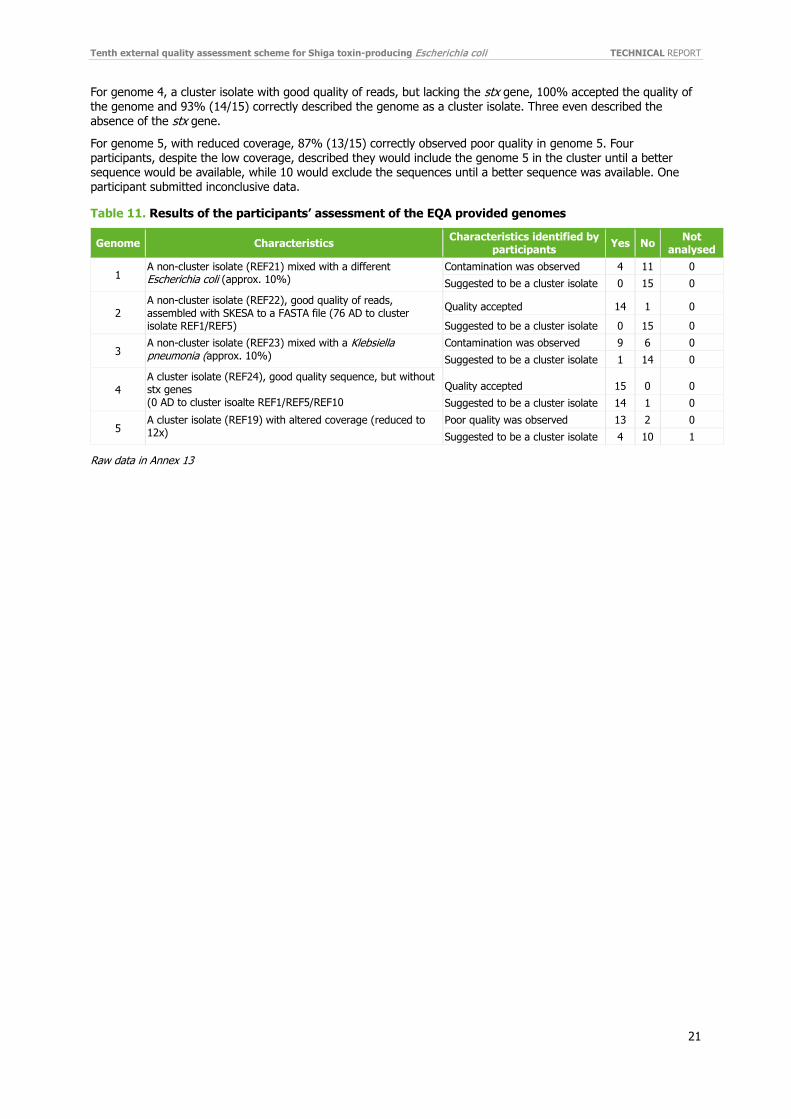
For genome 4, a cluster isolate with good quality of reads, but lacking the stx gene, 100% accepted the quality of the genome and 93% (14/15) correctly described the genome as a cluster isolate. Three even described the absence of the stx gene.
For genome 5, with reduced coverage, 87% (13/15) correctly observed poor quality in genome 5. Four participants, despite the low coverage, described they would include the genome 5 in the cluster until a better sequence would be available, while 10 would exclude the sequences until a better sequence was available. One participant submitted inconclusive data.
Table 11. Results of the participants’ assessment of the EQA provided genomes
Raw data in Annex 13
Genome Characteristics Characteristics identified by participants Yes No Not
analysed
1 A non-cluster isolate (REF21) mixed with a different Escherichia coli (approx. 10%)
Contamination was observed 4 11 0 Suggested to be a cluster isolate 0 15 0
2 A non-cluster isolate (REF22), good quality of reads, assembled with SKESA to a FASTA file (76 AD to cluster isolate REF1/REF5)
Quality accepted 14 1 0 Suggested to be a cluster isolate 0 15 0
3 A non-cluster isolate (REF23) mixed with a Klebsiella pneumonia (approx. 10%)
Contamination was observed 9 6 0 Suggested to be a cluster isolate 1 14 0
4 A cluster isolate (REF24), good quality sequence, but without stx genes (0 AD to cluster isoalte REF1/REF5/REF10
Quality accepted 15 0 0 Suggested to be a cluster isolate 14 1 0
5 A cluster isolate (REF19) with altered coverage (reduced to 12x)
Poor quality was observed 13 2 0 Suggested to be a cluster isolate 4 10 1
TECHNICAL REPORT Tenth external quality assessment scheme for Shiga toxin-producing Escherichia coli
22
4. Discussion 4.1 Serotyping Twenty-one (81%) laboratories participated in the serotyping part of the EQA-10, of which 10 participants (48%) provided phenotypic serotyping results and 11 (52%) provided molecular serotyping results (one by PCR and 10 by WGS). An increase from six to 10 participants from EQA-8 to EQA-9 using WGS-based serotyping, remained at 10 participants in this EQA. Sixteen participants performed both O group and H typing and 12 correctly assigned all 10 test isolates for both O and H.
4.1.1 O group From EQA-4 through EQA-10 (26/28; 26/29; 26/29; 27/30; 23/25; 20/24 to 21/26 [93%]), a decrease in participation in O grouping was observed.
The performance of O grouping was the same in EQA-10 as in EQA-9, but higher than in EQA-8. Fifteen participants (71%) reported the correct O group for all 10 test isolates compared to only 50% in EQA-9. All the incorrect O group results were reported by laboratories using phenotypic method. Eight of the 29 incorrect results were reported as an incorrect type, while the rest were reported as non-typable/rough or not done. Still, one laboratory only screens for O157, and is therefore responsible for nine of the 19 non-typable.
O group O5 is not so common in Europe and was reported as O8, O127 or non-typable by three laboratories. All six laboratories reporting incorrect result for O5 used phenotypic method for the O grouping. The EQA provider has no knowledge of cross-reaction of O5 with any of the mis-typed O groups (O8 and O127). Likewise, no cross-reactions between the other mis-typed O groups (O45/O103/O154 or O27/O45/O130) are known by the EQA provider.
Some of the more common O groups, also included in ECDC’s minimum requirements, generated the highest performances (O157: 100%, O145: 95%, O111:90%, O104:95/86% and O91: 86%). The average score was slightly higher in the current EQA (86%) compared to EQA-9 (85%) and EQA-8 (79%). The shift from phenotypic serotyping towards WGS based analysis that were observed from EQA-8 (26%) to EQA-9 (50%) increased slightly in EQA-10 (52%).
4.1.2 H type The decrease in H typing participation which was seen from EQA-4 (18 laboratories) to EQA-9 (13 laboratories) was not detected in EQA-10 as the number had increased to 16 laboratories. The general performance for H typing was higher than O grouping, but fewer performed H typing. Almost all participants (94%, 15/16) correctly H typed all 10 test isolates (Figure 5). One laboratory reported three errors. The EQA provider has no knowledge of cross-reaction between H8 and H21 or between H26 and H30. Compared to the previous EQAs, again this year the average score increased; 98% correct results compared to EQA-9 (94%), EQA-8 (92%) and EQA-7 (81%).
4.1.2 OH serotyping The O:H serotyping results ranged from 100% for isolate O157:H7 to 88% (14/16) of the participants reporting correct serotype for O5:H19 (H-) and O80:H2. The average percentage O:H serotyping in this EQA was again higher (94%) compared to EQA-9 (92%), EQA-8 (86%), EQA-7 (71%), and EQA-6 (78%). In general, the less common European serotypes generated were more difficult to identify.
In addition to O grouping, H typing is crucial for outbreak detection, epidemiological surveillance, taxonomic differentiation of E. coli and detection of pathogenic serotypes. As such, it remains a main challenge to enable more NPHRLs to perform complete and reliable O:H serotyping, particular H typing. However, with the use of WGS, this might be more feasible for some countries in future.
4.2 Virulence profile determination Twenty-five laboratories participated in the detection of the virulence profile with the participation rate and performance varying substantially between the different tests. As in previous EQAs, the participation rate was highest for the genotypic detection of the stx genes (96%) and detection of eae (92%), and lowest for the detection of aaiC/aggR (81%) and subtyping of stx genes (85%).
4.2.1 Detection of aaiC and aggR The performance of detection the EAEC aggR genes was high, with 94% of the participants detecting aggR correctly. The gene aaiC was detectable in two isolates, as the EQA provider included one isolate with both aggR and aaiC (REF9) and REF1 which only has an aaiC variant and which is only detectable by WGS (virulence finder)
Tenth external quality assessment scheme for Shiga toxin-producing Escherichia coli TECHNICAL REPORT
23
or dot blot hybridisation but not by PCR using Boisen et al. 2008 primers. This aaiC variant has a 66% amino acid identify compared with the FN554766 (EAEC prototype 042, serotype O44:H18) and was described in detail in the EQA-6 [16]. Because of this variant, the performance of the laboratories reporting correct genotyping results for, aaiC was lower than previously (48%; 10/21) with an average score of 94%. Seven of the 10 using WGS-based method detected the variant aaiC gene. In addition, three of the 11 were able to detect the aaiC variant using a ‘different’ method. Only one laboratory missed the aaiC gene in the EAEC isolate REF9.
4.2.2 Detection of eae Genotyping of eae had a high participation rate (92%) and performance; 20 (83%) laboratories obtained a 100% score, giving an average score of 98%. The average correct score has been fairly unchanged through the EQAs. (EQA-4 to EQA-9, 96%-99%).
4.2.3 Detection of stx1 and stx2 Both the participation (96%) and performance rates were high for genotyping of stx1 (99%) and stx2 genes (99%), similar to previous EQAs.
4.2.4 Subtyping of stx1 and stx2 The average scores of correct subtyping of stx1 and stx2 were 100% and 97% respectively, which is an increase compared to both EQA-9 (93% and 92%) and EQA-8 (84% and 87%) but also a higher performance compared to all previous EQAs. The unexpected reporting of ‘not done’ results, which was an issue in EQA-8, was only reported by one laboratory for one isolate. The EQA-provider specified in the invitation letter and in the submission protocol that when a participant signs up for a test and subsequently participates, all isolates must be analysed using this test.
In the current EQA, the true errors (‘not done’ results excluded) were six incorrect stx2 subtyping results. All errors were reported by four laboratories for three different isolates. New subtypes of stx (from stx2h-stx2l) have been identified in the recent years by different groups and is discussed by the EFSA BIOHAZ Panel in the EFSA report. [7]. The EQA provider is working on developing a new protocol for detecting these new variants.
4.3 Molecular typing-based cluster analysis Since EQA-8, the EQA scheme of STEC no longer covers PFGE as an independent part, but contains a cluster analysis using either PFGE and/or WGS-derived data. Fourteen laboratories participated in cluster identification using WGS-derived data, one laboratory participated using PFGE-derived data and one of the 16 laboratories participated in cluster identification using both methods. Two of the ‘PFGE participants’ from EQA-9 did not participate in EQA-10. In addition, one ‘PFGE participant’ from EQA-8, who did not participate in EQA-9, returned to participate with a WGS-based method in EQA-10.
4.3.1 PFGE-derived data Of the 26 laboratories, two (8%) performed cluster analysis using PFGE-derived data, and one of the two participants (50%) correctly identified the cluster of closely related isolates. The participation using PFGE in the cluster analysis decreased clearly as eight laboratories performed PFGE in EQA-9. This indicates that PFGE is no longer a main method used by the laboratories for cluster identification.
Compared to PFGE analysis of Salmonella or Listeria, the PFGE profile of E. coli contains a large number of bands within the region of 200–350 kb, which makes the cluster analysis based on PFGE harder to interpret. The PFGE gel needs to be of a very good quality in order to correctly assign all bands in this region. The one laboratory (only using PFGE) that did not identify the correct cluster missed one of the technical duplicates (REF11) and RFE19 in the cluster. The other laboratory performed cluster analysis using both PFGE and WGS.
4.3.2 WGS-derived data Fifteen of 26 laboratories (58%) performed cluster analysis using WGS-derived data. Two laboratories reported the use of external assistance for sequencing, and the majority (13/15) reported using an Illumina platform. All reported using commercial kits for preparing the library.
Performance was very high, with 14 (93%) laboratories correctly identifying the cluster of closely related isolates, which is comparable to last year (92%). Of 15 laboratories, 13 (87%) reported using an allele-based method as the main analysis and two (13%) reported using SNP analysis. The two laboratories that used SNP-based analysis reported the same SNP distances for the pre-determined cluster isolates, but one laboratory used a stricter cut-off (below 6 SNPs) and did therefor not identify the correct cluster. The distances reported using SNP-based analyses were 0–6 inside the cluster and the number of allele differences using cgMLST were 0–11 inside the cluster. However, 11/13 laboratories reported 0-3 allele differences within the cluster.
TECHNICAL REPORT Tenth external quality assessment scheme for Shiga toxin-producing Escherichia coli
24
When assessing the reported allele difference or SNP distances, both approaches showed comparable results as both show a clear separation of the cluster and non-cluster isolates. One exception was the results from one laboratory using allelic-based analysis with a lower number of loci and Ion Torrent data. A higher number of allelic differences was observed by this laboratory (222) among the cluster isolates when using their scheme of a reduced number of loci (2360) compared to the Enterobase scheme (2513 loci). Laboratory 222 reported 0-11 allelic differences within the cluster compared to 0-3 by most of the other laboratories, whereas the allele difference among the rest of the ST21 isolates was very similar to the other laboratories. However, this year the results from laboratory 222 show a clear separation between the cluster isolates and the rest and reported the correct cluster.
When testing the submitted raw reads from laboratory 222 (IonTorret data) in BioNumerics (Enterobase) scheme, the allele differences observed were similar to the EQA provider’s analysis (1 AD difference). Last year, the conclusion on the INNOENDO scheme and ChewBBACA pipeline was that the analysis only used assembly-based mapping, and the Ion Torrent data are not assembled correctly leading to the many incorrect allele calls.
High similarity was seen for the reported cgMLST results based on Enterobase (most had three allele differences or below three within the cluster). Only one laboratory (using Enterobase scheme in SeqPhere and SKESA as assembler) reported five allelic differences within the cluster, a slight increase compared to other laboratories using the same scheme and approach. Additionally, the laboratory (222) reported 0-11 alleles as described above.
SNP analyses can provide valid cluster detection at a national level and can be used for communication about cluster definitions, but the two laboratories using SNP as the main analysis reported six SNP to the cluster isolate REF19. One laboratory excluded the isolate (REF19) with six SNPs, the other laboratory accepted the distance of six SNPs. The EQA provider’s analysis using NASP with standard settings gave three SNPs to this REF19. An additional NASP analysis with changed settings; allowing duplicated regions showed six SNPs difference of the same sequence. This emphasises the importance of understanding the pipeline and carefully evaluating the data. From the data visualised in Figure 8, there is a clear separation between the cluster isolates and the remaining isolates. The EQA provider highlights that a definitive cut-off in STEC WGS analysis has not been formally established as this is of course difficult to do. This REF19 was one isolate among 38 in this specific outbreak (0-3 AD, cgMLST), primarily among children in day-care centres across Denmark during September-November 2018.
Recombination had no significance for the cluster identification. However, some discrepancies were observed depending on which software was used. The highest variations in the SNP distances were outside the cluster depending on the SNP pipeline and additional analysis performed.
The main reported QC parameters were genome size, number of contigs, %cgMLST and confirmation of genus, which are all essential for the end use of the data. A higher number of laboratories report they use QC parameters and the genome size and number of loci in particular was frequently reported.
In order to compare the quality of the raw data, the EQA provider analysed the submitted raw reads to obtain selected QC parameters. All laboratories submitted sequences of fine quality, with only two sequences flagged as potentially contaminated with 5-6% of a different species.
The EQA provider’s analysis of the submitted raw data showed that when using a standardised cgMLST analysis, it is not unlikely to observe a random variation of one allele, even with high coverage (Figure 10). However, one participant (108) deviated consistently. This is likely due to a combination of sequencing technology and allele-calling software.
In the assessment of the additional EQA-provided genomes, most of the participants successfully determined whether or not the genomes (of good quality) were part of the defined cluster sequences. Only one participant did not identify Genome 4 as a cluster isolate (without the stx gene) as part of the cluster. The analysis was done by SNPs, but the other participant known to use SNP did identify the genome 4 as a cluster isolate. Almost all laboratories (13/15) correctly reported low coverage for the cluster isolate (Genome 5). It is very important to identify low coverage issues because they higly affect the conclusions as less called loci resulting in missing data.
As expected, it was easier for the laboratories to identify the contamination with Klebsiella pneumonia (9/15) than for the genome contaminted with a different E. coli (4/15). Three participants used ‘too large’ genome size as a partial agument as well as too many contigs, high multiple consensus loci and/or many unidentified bases to discard the genome as not having sufficient quality. One laboratory detected two different alleles for three loci (fumC, gyrB and icd) of the MLST scheme.
The FASTA file of genome 2 was analysed by 14/15 and correctly identified as a non-cluster sequence. Only one reported that genome 2 had a too low percentage of good targets for cgMLST cluster analysis, but still identified it as non-cluster isolate.
Almost all the laboratories had in this EQA used more time to assess the modified genomes. In general, the participants had described in detail what they observed and not just as previous suggested the re-run of the isolate. It seems as if the participants accepted the challenge and used the time to try to analyse the more questionable data and suggest if it was a cluster isolate or not.

Tenth external quality assessment scheme for Shiga toxin-producing Escherichia coli TECHNICAL REPORT
25
5. Conclusions Twenty-six laboratories participated in the EQA-10 scheme, with 21 (81%) performing the serotyping part, 25 (96%) the virulence profile determination part, and 16 (62%) cluster identification. As in the EQA-9, this EQA contains the inclusion of molecular typing-based cluster analysis using either PFGE and/or WGS-derived data. This adjustment of the EQA seemed to be well accepted by most Member States, but a decrease in the number of participants was seen compared with previous years for the cluster analysis (one less than in EQA-9). In addition, a small increase was seen both for serotyping (one participant) and virulence profile determination (two participants) in EQA-10 compared to EQA-9.
The O:H serotyping was only performed by 62% (16/26) of the participants, with an average score of 94%. As in previous EQAs, participation in the O grouping was higher than in H typing. Notably, not all laboratories demonstrated the capacity to determine all O groups and H types. In general, the more common European serotypes generated the highest scores. Serotype O5:H19 generated the lowest scores, correctly reported by 14 laboratories.
Detection of the true EAEC isolate was frequent. However, the isolate with the variant of aaiC reduced the overall performance of detecting both aaiC isolates to 45%. The present EQA demonstrated a high performance for aggR, with 99.5% average scores.
Detection of eae had high participation rates and average scores through the EQAs has always been above 96% (EQA-4: 96%; EQA-5: 98%; EQA-6: 97%; EQA-7: 98%; EQA-8: 96%; EQA-9: 99% and EQA-10: 98%).
Similarly to previous EQAs, the participation and average scores for stx1 and stx2 gene detection were high, with a 99% average score for both stx1 and stx2. Subtyping of stx1 and stx2 is valuable since specific subtypes (stx2a) have been associated with increased risk of HUS, hospitalisation, or bloody diarrhoea respectively [7]. The high participation rate of 85% is therefore very encouraging. The average score for subtyping of stx1 (100%) and stx2 (97%).
Incorporating the molecular typing-based cluster analysis in this EQA is up to date with the development of surveillance methods used by NPHRLs in Europe. Sixteen laboratories performed cluster analysis, while 15 used WGS-derived data (three more than in EQA-9). A clear decrease (from eight to two) was seen in the number of laboratories who used PFGE for cluster analysis. However, only two stopped completely participating in the cluster identification. Most of the laboratories continued using only WGS or switched to WGS instead of PFGE.
Performance was high among the participants using WGS, with 14 (93%) of participants correctly identifying the cluster of five closely related isolates. One laboratory missed one of the four cluster isolates. Only one of the two laboratories using PFGE for their cluster analysis identified the correct cluster using PFGE.
An allele-based method was preferred by most laboratories, as 87% (13/15) used cgMLST compared to 13% (2/15) using SNP as reported cluster analysis as the main analysis. The use of a standard cgMLST scheme (e.g. Enterobase) gives a very high degree of homogeneity in the results, and allele-based methods seem to be useful for inter-laboratory comparability and communication about cluster definitions. SNP analyses can also provide valid cluster detection at the national level and can be used for communication about cluster definitions. However, only the same two laboratories performed SNP analysis in this EQA and in EQA-9.
A new addition to the cluster analysis was introduced in EQA-10. Sequence data of five isolates were made accessible by the EQA provider, and the participants were asked to include these in the cluster analysis and report characteristics and quality issues. Contamination with a different species is easier to identify than inter-species contamination. All but two laboratories correctly concluded that the two genomes of high quality were part of the same cluster. For the genome with low coverage, most of the participants did identify the quality issues, and some suggested that the genome might be a part of the cluster, which was correct.
The current EQA scheme for typing STEC is the 10th EQA organised for laboratories in FWD-Net. The molecular surveillance system implemented as part of TESSy relies on the capacity of FWD-Net laboratories to produce analysable and comparable typing results into a central database. WGS-based typing for surveillance is increasingly used in EU. ECDC coordinates centralised analysis of WGS STEC data when needed to support multi-country outbreak investigations.

TECHNICAL REPORT Tenth external quality assessment scheme for Shiga toxin-producing Escherichia coli
26
6. Recommendations 6.1 Laboratories Participants are encouraged to assign sufficient resources to repeat failed analysis if required to meet the deadline of submission.
Laboratories are expected to employ each method as an individual test irrespective of results obtained in the screening and detection or any other test. Therefore, when a participant signs up for a test and subsequently participates, all isolates must be tested using this test, e.g. subtyping of stx.
6.2 ECDC and FWD-Net ECDC is working actively with FWD-Net to improve the quality of sequence data generation and analysis through appropriate means like EQA schemes, expert exchange visits and workshops.
ECDC encourages more participants to take part in the new molecular typing-based cluster analysis, as well as participants who have not previously participated in the PFGE gel analysis part.
6.3 EQA provider The evaluation of the provided genome sequences was a success. Almost all participants performed the analysis and identified the modifications introduced by the EQA provider. For the following EQA rounds, the EQA provider will continue and expand this part of the EQA in order to challenge the participants in their assessment of poor-quality genomes as well as contaminated ones, putting emphasis on the importance of assessing the genomes despite a low-level contamination or other quality issues – but of course concluded with the utmost caution.
The EQA provider will for the next FWD-Network meeting suggest an open ‘cut-off’ discussion of STEC cluster.
The newest published recommendation defines EAEC isolates as harbouring aggR and a complete cluster of AAF-encoding genes (usher, chaperone, and both major and minor pilin subunit genes) or the ETEC colonisation factor (CF) CS22 gene. As a result, the EQA provider recommends that the aaiC gene should not be evaluated in the EQA [20].
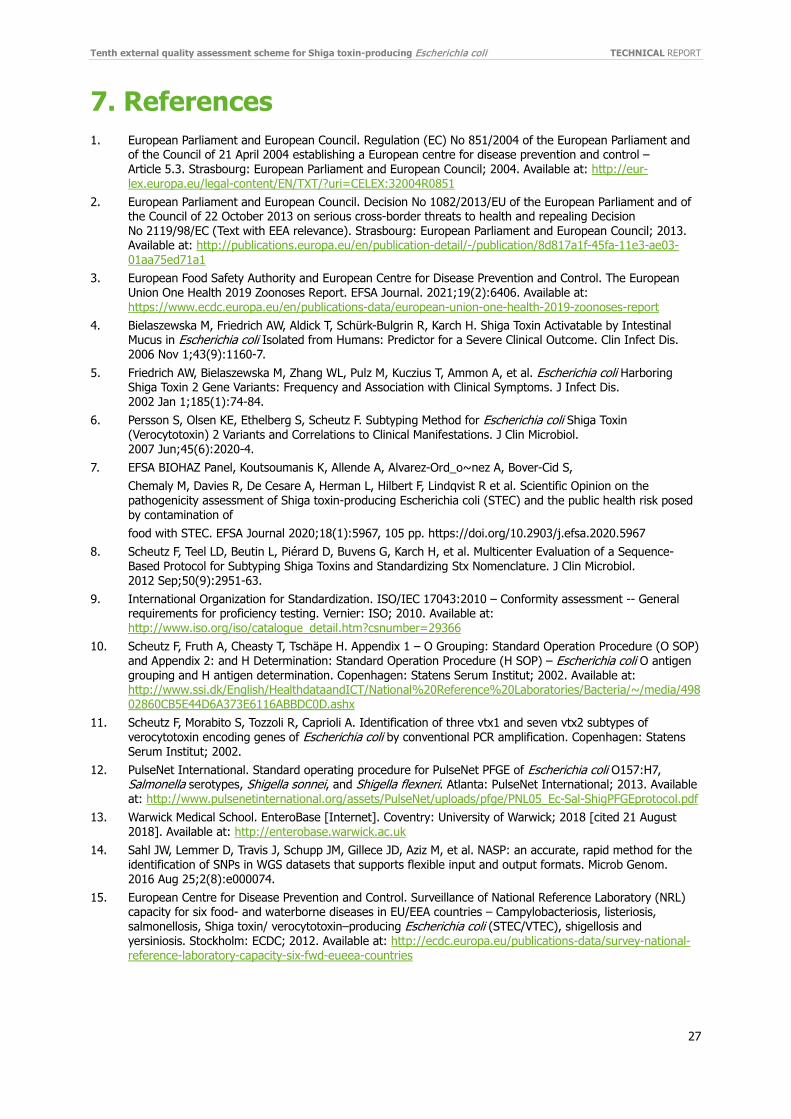
Tenth external quality assessment scheme for Shiga toxin-producing Escherichia coli TECHNICAL REPORT
27
7. References 1. European Parliament and European Council. Regulation (EC) No 851/2004 of the European Parliament and
of the Council of 21 April 2004 establishing a European centre for disease prevention and control – Article 5.3. Strasbourg: European Parliament and European Council; 2004. Available at: http://eur-lex.europa.eu/legal-content/EN/TXT/?uri=CELEX:32004R0851
2. European Parliament and European Council. Decision No 1082/2013/EU of the European Parliament and of the Council of 22 October 2013 on serious cross-border threats to health and repealing Decision No 2119/98/EC (Text with EEA relevance). Strasbourg: European Parliament and European Council; 2013. Available at: http://publications.europa.eu/en/publication-detail/-/publication/8d817a1f-45fa-11e3-ae03-01aa75ed71a1
3. European Food Safety Authority and European Centre for Disease Prevention and Control. The European Union One Health 2019 Zoonoses Report. EFSA Journal. 2021;19(2):6406. Available at: https://www.ecdc.europa.eu/en/publications-data/european-union-one-health-2019-zoonoses-report
4. Bielaszewska M, Friedrich AW, Aldick T, Schürk-Bulgrin R, Karch H. Shiga Toxin Activatable by Intestinal Mucus in Escherichia coli Isolated from Humans: Predictor for a Severe Clinical Outcome. Clin Infect Dis. 2006 Nov 1;43(9):1160-7.
5. Friedrich AW, Bielaszewska M, Zhang WL, Pulz M, Kuczius T, Ammon A, et al. Escherichia coli Harboring Shiga Toxin 2 Gene Variants: Frequency and Association with Clinical Symptoms. J Infect Dis. 2002 Jan 1;185(1):74-84.
6. Persson S, Olsen KE, Ethelberg S, Scheutz F. Subtyping Method for Escherichia coli Shiga Toxin (Verocytotoxin) 2 Variants and Correlations to Clinical Manifestations. J Clin Microbiol. 2007 Jun;45(6):2020-4.
7. EFSA BIOHAZ Panel, Koutsoumanis K, Allende A, Alvarez-Ord_o~nez A, Bover-Cid S, Chemaly M, Davies R, De Cesare A, Herman L, Hilbert F, Lindqvist R et al. Scientific Opinion on the
pathogenicity assessment of Shiga toxin-producing Escherichia coli (STEC) and the public health risk posed by contamination of
food with STEC. EFSA Journal 2020;18(1):5967, 105 pp. https://doi.org/10.2903/j.efsa.2020.5967 8. Scheutz F, Teel LD, Beutin L, Piérard D, Buvens G, Karch H, et al. Multicenter Evaluation of a Sequence-
Based Protocol for Subtyping Shiga Toxins and Standardizing Stx Nomenclature. J Clin Microbiol. 2012 Sep;50(9):2951-63.
9. International Organization for Standardization. ISO/IEC 17043:2010 – Conformity assessment -- General requirements for proficiency testing. Vernier: ISO; 2010. Available at: http://www.iso.org/iso/catalogue_detail.htm?csnumber=29366
10. Scheutz F, Fruth A, Cheasty T, Tschäpe H. Appendix 1 – O Grouping: Standard Operation Procedure (O SOP) and Appendix 2: and H Determination: Standard Operation Procedure (H SOP) – Escherichia coli O antigen grouping and H antigen determination. Copenhagen: Statens Serum Institut; 2002. Available at: http://www.ssi.dk/English/HealthdataandICT/National%20Reference%20Laboratories/Bacteria/~/media/49802860CB5E44D6A373E6116ABBDC0D.ashx
11. Scheutz F, Morabito S, Tozzoli R, Caprioli A. Identification of three vtx1 and seven vtx2 subtypes of verocytotoxin encoding genes of Escherichia coli by conventional PCR amplification. Copenhagen: Statens Serum Institut; 2002.
12. PulseNet International. Standard operating procedure for PulseNet PFGE of Escherichia coli O157:H7, Salmonella serotypes, Shigella sonnei, and Shigella flexneri. Atlanta: PulseNet International; 2013. Available at: http://www.pulsenetinternational.org/assets/PulseNet/uploads/pfge/PNL05_Ec-Sal-ShigPFGEprotocol.pdf
13. Warwick Medical School. EnteroBase [Internet]. Coventry: University of Warwick; 2018 [cited 21 August 2018]. Available at: http://enterobase.warwick.ac.uk
14. Sahl JW, Lemmer D, Travis J, Schupp JM, Gillece JD, Aziz M, et al. NASP: an accurate, rapid method for the identification of SNPs in WGS datasets that supports flexible input and output formats. Microb Genom. 2016 Aug 25;2(8):e000074.
15. European Centre for Disease Prevention and Control. Surveillance of National Reference Laboratory (NRL) capacity for six food- and waterborne diseases in EU/EEA countries – Campylobacteriosis, listeriosis, salmonellosis, Shiga toxin/ verocytotoxin–producing Escherichia coli (STEC/VTEC), shigellosis and yersiniosis. Stockholm: ECDC; 2012. Available at: http://ecdc.europa.eu/publications-data/survey-national-reference-laboratory-capacity-six-fwd-eueea-countries

TECHNICAL REPORT Tenth external quality assessment scheme for Shiga toxin-producing Escherichia coli
28
16. Boisen N, Struve C, Scheutz F, Krogfelt KA, Nataro JP, New adhesin of enteroaggregative Escherichia coli related to the Afa/Dr/AAF family, Infect Immu 2008 Jul;76(7):3281-92. doi: 10.1128/IAI.01646-07. Epub 2008 Apr 28.
17. European Centre for Disease Prevention and Control. Sixth external quality assessment scheme for typing of verocytotoxin-producing Escherichia coli. Stockholm: ECDC; 2015.
18. Statens Serum Institut. Bifrost_QC [Internet; software package]. Copenhagen: Statens Serum Institut; 2019. Available at: https://github.com/ssi-dk/bifrost
19. Østerlund M and Kiil K. CleanRecomb, a quick tool for recombination detection in SNP based cluster analysis. bioRxiv. 2018; Available at: https://github.com/ssi-dk/CleanRecomb
20. Boisen N, Østerlund M T, Joensen K G, Santiago A E, Mandomando I, Cravioto A el at. 2020, Redefining enteroaggregative Escherichia coli (EAEC): Genomic characterization of epidemiological EAEC strains, PLoS Negl Trop Dis. 2020 Sep 8;14(9):e0008613. doi: 10.1371/journal.pntd.0008613. eCollection 2020 Sep.

Tenth external quality assessment scheme for Shiga toxin-producing Escherichia coli TECHNICAL REPORT
29
Annex 1. List of participants Country Laboratory National institute
Austria National Reference Center for Escherichia coli including VTEC Institute for Medical Microbiology and Hygiene
Belgium National Reference Laboratory STEC Universitair Ziekenhuis Brussels
Czechia NRL for E. coli and Shigella National Institute of Public Health
Denmark International Escherichia and Klebsiella Centre Statens Serum Institut
Estonia Laboratory of Communicable Diseases Health Board
Finland Expert Microbiology Unit Finnish Institute for Health and Welfare
France Laboratoire de Microbiologie - Centre de Référence Escherichia coli Centre Hospitalo-Universitaire Robert-Debré
Germany NRC Salmonella Robert Koch Institute
Greece National Reference Centre for Salmonella, Shigella, VTEC
Department of Public Health Policy, School of Public Helath
Hungary Reference Laboratories, Department of Bacteriology National Public Health Center
Iceland Dept. of Clinical Microbiology Landspítali University Hospital
Ireland NRL-VTEC Public Health Laboratory
Italy Microbiological Food Safety and Foodborne Disease Unit
Istituto Superiore di Sanità
Latvia National Microbiology Reference laboratory Infectology Centre of Latvia
Lithuania National Public Health Surveillance laboratory National public health survellance labortaory
Luxembourg Epidemiology and Microbial Genomics (EPIGEM) Laboratoire National de Sante
North Macedonia
Food institute, Laboratory for molecular analysis of food and GMO Faculty of veterinary medicine-Skopje
Norway National Reference Laboratory for Enteropathogenic Bacteria Norwegian Institute of Public Health
Poland Department of Bacteriology and Biocontamination Control
National Institute of Public Health – National Institute of Hygiene
Portugal LNR Infeções Gastrintestinais Instituto Nacional de Saúde Dr. Ricardo Jorge
Romania Molecular Epidemiology Laboratory Cantacuzino National Medico-Military Institute of Research and Development
Slovenia Department for Public Health Microbiology National Laboratory of Health, Environment and Food
Spain Unidad de Enterobacterias Instituto de Salud Carlos III
Sweden Mikrobiologi Folkhäslomyndigheten
The Netherlands
Centre for Infectious Disease Research, Diagnostics and Laboratory Surveillance
RIVM
United Kingdom Gastrointestinal Bacteria Reference Unit Public Health England

TECHNICAL REPORT Tenth external quality assessment scheme for Shiga toxin-producing Escherichia coli
30
Annex 2. Participation overview EQA-9/EQA-10 2018-2019 (EQA-9) 2019-2020 (EQA-10)
Cluster Cluster Laboratory
number Participation (min. 1 part) Serotyping Virulence PFGE WGS Participation
(min. 1 part) Serotyping Virulence PFGE WGS
19 x x x x x x x x x 34 x x x x x x x x 80 x x x x x x x x 88 x x x x 90 x x x x x x 100 x x x x x x x x 108 x x x x x x x x 123 x x x x x x x x x 124 x x x x x x x x 127 x x x x x x x x x 128 x x x x x 129 x x x x x x 130 x x x x 131 x x x 132 x x x x x x x 133 x x x x x x x x 134 x x x x x x x x 135 x x x x x x x x 136 x x x x 137 x x x x x x x x 138 x x x x x x 139 x x x x x x x x 145 x x x x x 153 x x x x x x 180 x x x x 222 x x x x x x x x x
Number of participants 24 20 23 8 12 26 21 25 2 15
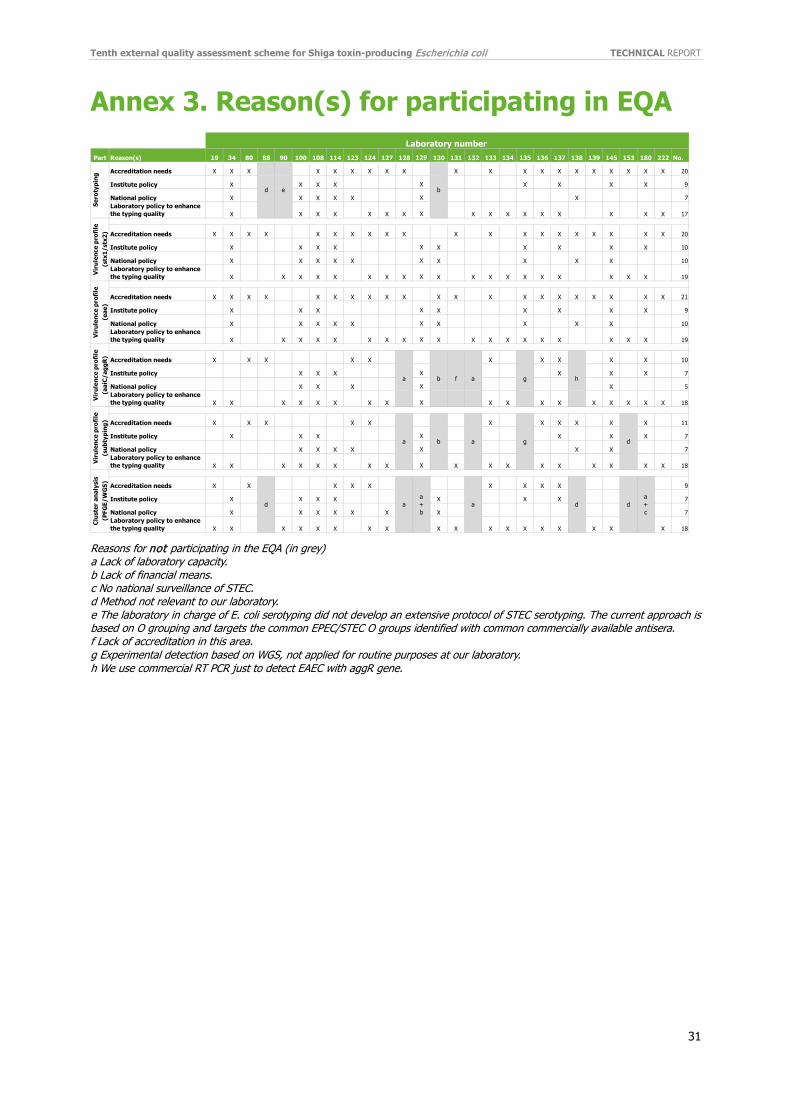
Tenth external quality assessment scheme for Shiga toxin-producing Escherichia coli TECHNICAL REPORT
31
Annex 3. Reason(s) for participating in EQA
Reasons for not participating in the EQA (in grey) a Lack of laboratory capacity. b Lack of financial means. c No national surveillance of STEC. d Method not relevant to our laboratory. e The laboratory in charge of E. coli serotyping did not develop an extensive protocol of STEC serotyping. The current approach is based on O grouping and targets the common EPEC/STEC O groups identified with common commercially available antisera. f Lack of accreditation in this area. g Experimental detection based on WGS, not applied for routine purposes at our laboratory. h We use commercial RT PCR just to detect EAEC with aggR gene.
Reason(s) 19 34 80 88 90 100 108 114 123 124 127 128 129 130 131 132 133 134 135 136 137 138 139 145 153 180 222 No.
Accreditation needs X X X X X X X X X X X X X X X X X X X X 20
Institute policy X X X X X X X X X 9
National policy X X X X X X X 7Laboratory policy to enhance the typing quality X X X X X X X X X X X X X X X X X 17
Accreditation needs X X X X X X X X X X X X X X X X X X X X 20
Institute policy X X X X X X X X X X 10
National policy X X X X X X X X X X 10Laboratory policy to enhance the typing quality X X X X X X X X X X X X X X X X X X X 19
Accreditation needs X X X X X X X X X X X X X X X X X X X X X 21
Institute policy X X X X X X X X X 9
National policy X X X X X X X X X X 10Laboratory policy to enhance the typing quality X X X X X X X X X X X X X X X X X X X 19
Accreditation needs X X X X X X X X X X 10
Institute policy X X X X X X X 7
National policy X X X X X 5Laboratory policy to enhance the typing quality X X X X X X X X X X X X X X X X X X 18
Accreditation needs X X X X X X X X X X X 11
Institute policy X X X X X X X 7
National policy X X X X X X X 7Laboratory policy to enhance the typing quality X X X X X X X X X X X X X X X X X X 18
Accreditation needs X X X X X X X X X 9
Institute policy X X X X X X X 7
National policy X X X X X X X 7Laboratory policy to enhance the typing quality X X X X X X X X X X X X X X X X X X 18
Viru
lenc
e pr
ofile
Vi
rule
nce
prof
ile
Viru
lenc
e pr
ofile
Cl
uste
r an
alys
is
(eae
)(s
tx1/
stx2
)(a
aiC/
aggR
)(s
ubty
ping
)(P
FGE/
WG
S)
Part
Sero
typi
ng
Viru
lenc
e pr
ofile
a + c
h
d
a
Laboratory number
a
a
a d
d
d
g
ga
aa + b
b
b
b
f
ed
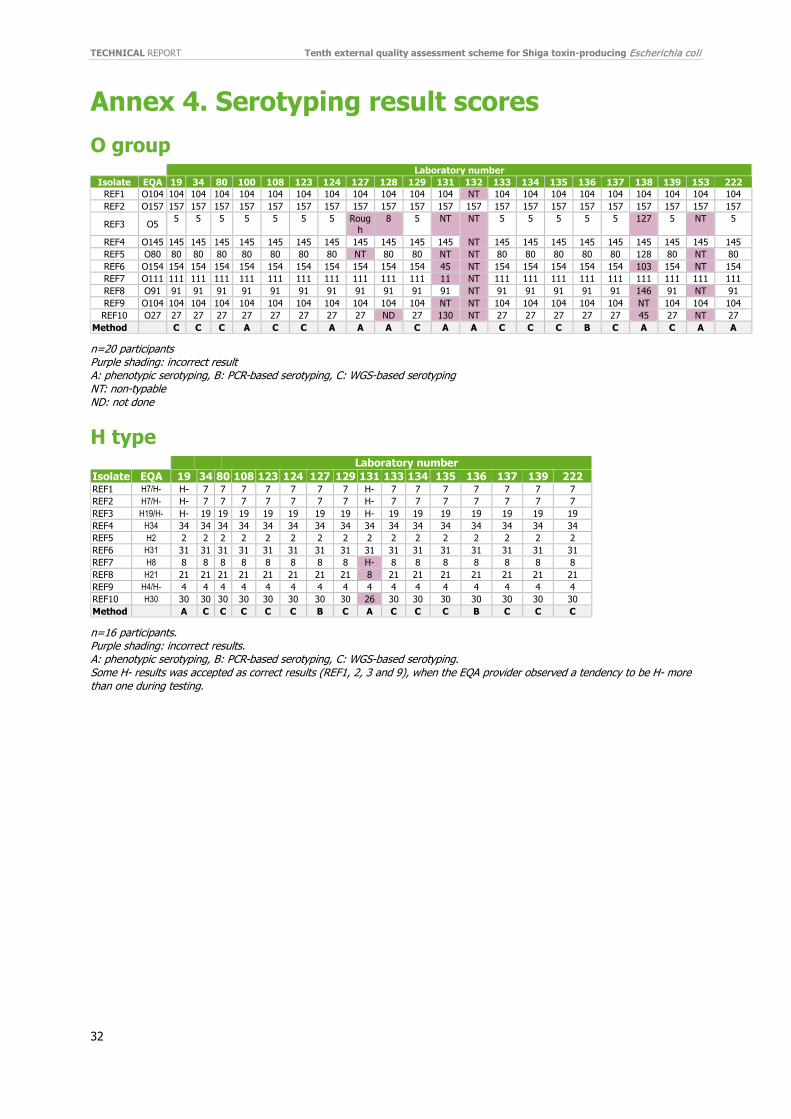
TECHNICAL REPORT Tenth external quality assessment scheme for Shiga toxin-producing Escherichia coli
32
Annex 4. Serotyping result scores O group
Laboratory number Isolate EQA 19 34 80 100 108 123 124 127 128 129 131 132 133 134 135 136 137 138 139 153 222
REF1 O104 104 104 104 104 104 104 104 104 104 104 104 NT 104 104 104 104 104 104 104 104 104 REF2 O157 157 157 157 157 157 157 157 157 157 157 157 157 157 157 157 157 157 157 157 157 157
REF3 O5 5 5 5 5 5 5 5 Rough
8 5 NT NT 5 5 5 5 5 127 5 NT 5
REF4 O145 145 145 145 145 145 145 145 145 145 145 145 NT 145 145 145 145 145 145 145 145 145 REF5 O80 80 80 80 80 80 80 80 NT 80 80 NT NT 80 80 80 80 80 128 80 NT 80 REF6 O154 154 154 154 154 154 154 154 154 154 154 45 NT 154 154 154 154 154 103 154 NT 154 REF7 O111 111 111 111 111 111 111 111 111 111 111 11 NT 111 111 111 111 111 111 111 111 111 REF8 O91 91 91 91 91 91 91 91 91 91 91 91 NT 91 91 91 91 91 146 91 NT 91 REF9 O104 104 104 104 104 104 104 104 104 104 104 NT NT 104 104 104 104 104 NT 104 104 104 REF10 O27 27 27 27 27 27 27 27 27 ND 27 130 NT 27 27 27 27 27 45 27 NT 27
Method C C C A C C A A A C A A C C C B C A C A A
n=20 participants Purple shading: incorrect result A: phenotypic serotyping, B: PCR-based serotyping, C: WGS-based serotyping NT: non-typable ND: not done
H type Laboratory number Isolate EQA 19 34 80 108 123 124 127 129 131 133 134 135 136 137 139 222 REF1 H7/H- H- 7 7 7 7 7 7 7 H- 7 7 7 7 7 7 7 REF2 H7/H- H- 7 7 7 7 7 7 7 H- 7 7 7 7 7 7 7 REF3 H19/H- H- 19 19 19 19 19 19 19 H- 19 19 19 19 19 19 19 REF4 H34 34 34 34 34 34 34 34 34 34 34 34 34 34 34 34 34 REF5 H2 2 2 2 2 2 2 2 2 2 2 2 2 2 2 2 2 REF6 H31 31 31 31 31 31 31 31 31 31 31 31 31 31 31 31 31 REF7 H8 8 8 8 8 8 8 8 8 H- 8 8 8 8 8 8 8 REF8 H21 21 21 21 21 21 21 21 21 8 21 21 21 21 21 21 21 REF9 H4/H- 4 4 4 4 4 4 4 4 4 4 4 4 4 4 4 4 REF10 H30 30 30 30 30 30 30 30 30 26 30 30 30 30 30 30 30 Method A C C C C C B C A C C C B C C C
n=16 participants. Purple shading: incorrect results. A: phenotypic serotyping, B: PCR-based serotyping, C: WGS-based serotyping. Some H- results was accepted as correct results (REF1, 2, 3 and 9), when the EQA provider observed a tendency to be H- more than one during testing.
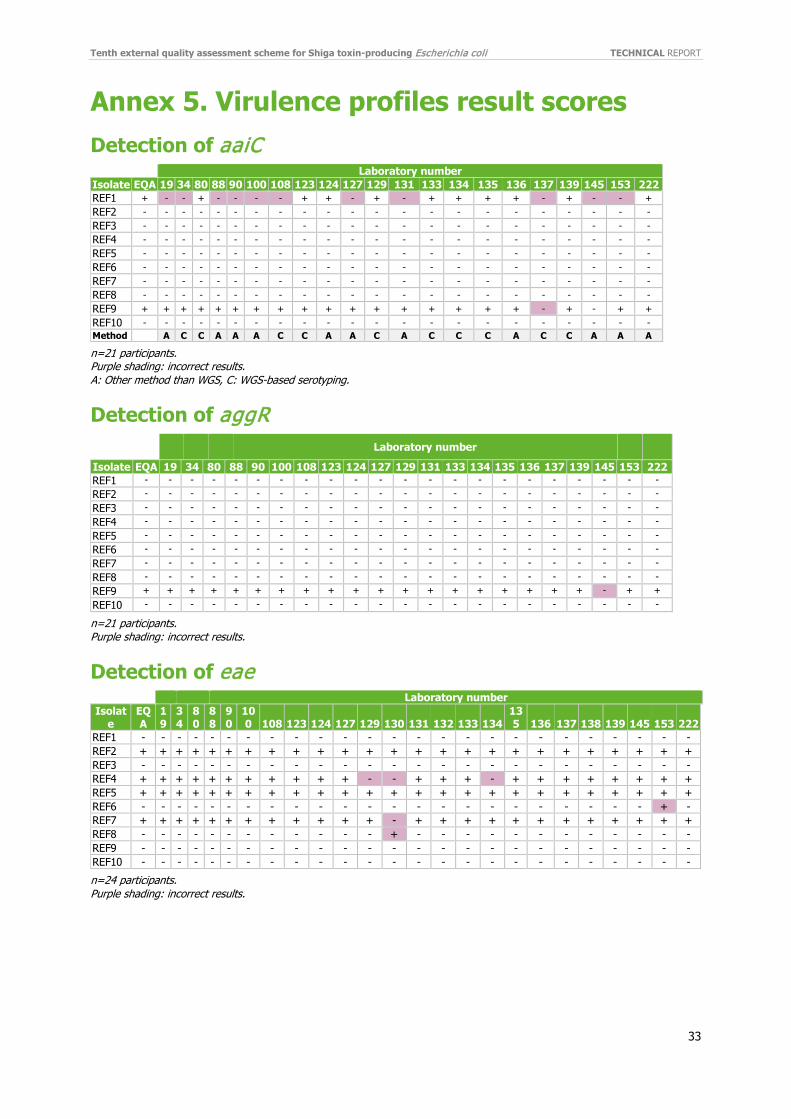
Tenth external quality assessment scheme for Shiga toxin-producing Escherichia coli TECHNICAL REPORT
33
Annex 5. Virulence profiles result scores Detection of aaiC
Laboratory number Isolate EQA 19 34 80 88 90 100 108 123 124 127 129 131 133 134 135 136 137 139 145 153 222 REF1 + - - + - - - - + + - + - + + + + - + - - + REF2 - - - - - - - - - - - - - - - - - - - - - - REF3 - - - - - - - - - - - - - - - - - - - - - - REF4 - - - - - - - - - - - - - - - - - - - - - - REF5 - - - - - - - - - - - - - - - - - - - - - - REF6 - - - - - - - - - - - - - - - - - - - - - - REF7 - - - - - - - - - - - - - - - - - - - - - - REF8 - - - - - - - - - - - - - - - - - - - - - - REF9 + + + + + + + + + + + + + + + + + - + - + + REF10 - - - - - - - - - - - - - - - - - - - - - - Method A C C A A A C C A A C A C C C A C C A A A
n=21 participants. Purple shading: incorrect results. A: Other method than WGS, C: WGS-based serotyping.
Detection of aggR
Laboratory number
Isolate EQA 19 34 80 88 90 100 108 123 124 127 129 131 133 134 135 136 137 139 145 153 222 REF1 - - - - - - - - - - - - - - - - - - - - - - REF2 - - - - - - - - - - - - - - - - - - - - - - REF3 - - - - - - - - - - - - - - - - - - - - - - REF4 - - - - - - - - - - - - - - - - - - - - - - REF5 - - - - - - - - - - - - - - - - - - - - - - REF6 - - - - - - - - - - - - - - - - - - - - - - REF7 - - - - - - - - - - - - - - - - - - - - - - REF8 - - - - - - - - - - - - - - - - - - - - - - REF9 + + + + + + + + + + + + + + + + + + + - + + REF10 - - - - - - - - - - - - - - - - - - - - - - n=21 participants. Purple shading: incorrect results.
Detection of eae Laboratory number
Isolate
EQA
19
34
80
88
90
100 108 123 124 127 129 130 131 132 133 134
135 136 137 138 139 145 153 222
REF1 - - - - - - - - - - - - - - - - - - - - - - - - - REF2 + + + + + + + + + + + + + + + + + + + + + + + + + REF3 - - - - - - - - - - - - - - - - - - - - - - - - - REF4 + + + + + + + + + + + - - + + + - + + + + + + + + REF5 + + + + + + + + + + + + + + + + + + + + + + + + + REF6 - - - - - - - - - - - - - - - - - - - - - - - + - REF7 + + + + + + + + + + + + - + + + + + + + + + + + + REF8 - - - - - - - - - - - - + - - - - - - - - - - - - REF9 - - - - - - - - - - - - - - - - - - - - - - - - - REF10 - - - - - - - - - - - - - - - - - - - - - - - - - n=24 participants. Purple shading: incorrect results.
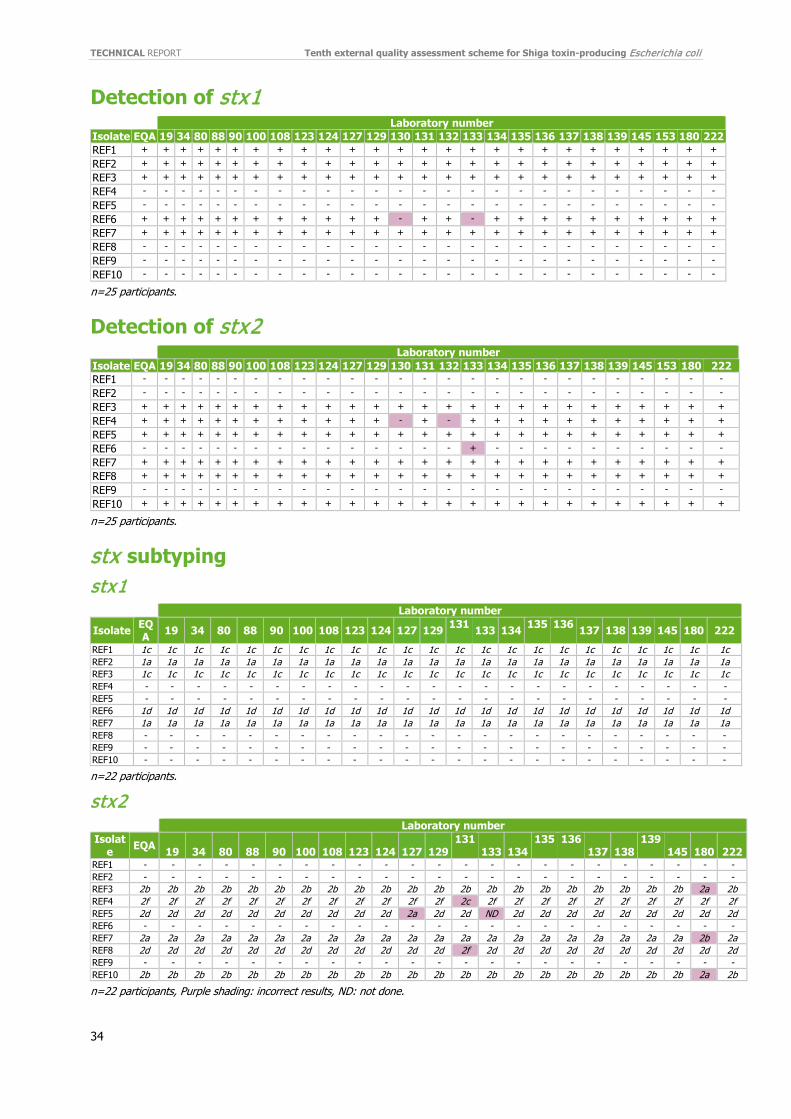
TECHNICAL REPORT Tenth external quality assessment scheme for Shiga toxin-producing Escherichia coli
34
Detection of stx1 Laboratory number
Isolate EQA 19 34 80 88 90 100 108 123 124 127 129 130 131 132 133 134 135 136 137 138 139 145 153 180 222 REF1 + + + + + + + + + + + + + + + + + + + + + + + + + + REF2 + + + + + + + + + + + + + + + + + + + + + + + + + + REF3 + + + + + + + + + + + + + + + + + + + + + + + + + + REF4 - - - - - - - - - - - - - - - - - - - - - - - - - - REF5 - - - - - - - - - - - - - - - - - - - - - - - - - - REF6 + + + + + + + + + + + + - + + - + + + + + + + + + + REF7 + + + + + + + + + + + + + + + + + + + + + + + + + + REF8 - - - - - - - - - - - - - - - - - - - - - - - - - - REF9 - - - - - - - - - - - - - - - - - - - - - - - - - - REF10 - - - - - - - - - - - - - - - - - - - - - - - - - -
n=25 participants.
Detection of stx2 Laboratory number
Isolate EQA 19 34 80 88 90 100 108 123 124 127 129 130 131 132 133 134 135 136 137 138 139 145 153 180 222 REF1 - - - - - - - - - - - - - - - - - - - - - - - - - - REF2 - - - - - - - - - - - - - - - - - - - - - - - - - - REF3 + + + + + + + + + + + + + + + + + + + + + + + + + + REF4 + + + + + + + + + + + + - + - + + + + + + + + + + + REF5 + + + + + + + + + + + + + + + + + + + + + + + + + + REF6 - - - - - - - - - - - - - - - + - - - - - - - - - - REF7 + + + + + + + + + + + + + + + + + + + + + + + + + + REF8 + + + + + + + + + + + + + + + + + + + + + + + + + + REF9 - - - - - - - - - - - - - - - - - - - - - - - - - - REF10 + + + + + + + + + + + + + + + + + + + + + + + + + +
n=25 participants.
stx subtyping stx1
Laboratory number
Isolate EQA 19 34 80 88 90 100 108 123 124 127 129 131 133 134 135 136 137 138 139 145 180 222
REF1 1c 1c 1c 1c 1c 1c 1c 1c 1c 1c 1c 1c 1c 1c 1c 1c 1c 1c 1c 1c 1c 1c 1c REF2 1a 1a 1a 1a 1a 1a 1a 1a 1a 1a 1a 1a 1a 1a 1a 1a 1a 1a 1a 1a 1a 1a 1a REF3 1c 1c 1c 1c 1c 1c 1c 1c 1c 1c 1c 1c 1c 1c 1c 1c 1c 1c 1c 1c 1c 1c 1c REF4 - - - - - - - - - - - - - - - - - - - - - - - REF5 - - - - - - - - - - - - - - - - - - - - - - - REF6 1d 1d 1d 1d 1d 1d 1d 1d 1d 1d 1d 1d 1d 1d 1d 1d 1d 1d 1d 1d 1d 1d 1d REF7 1a 1a 1a 1a 1a 1a 1a 1a 1a 1a 1a 1a 1a 1a 1a 1a 1a 1a 1a 1a 1a 1a 1a REF8 - - - - - - - - - - - - - - - - - - - - - - - REF9 - - - - - - - - - - - - - - - - - - - - - - - REF10 - - - - - - - - - - - - - - - - - - - - - - - n=22 participants.
stx2 Laboratory number
Isolate EQA 19 34 80 88 90 100 108 123 124 127 129
131 133 134
135 136 137 138
139 145 180 222
REF1 - - - - - - - - - - - - - - - - - - - - - - - REF2 - - - - - - - - - - - - - - - - - - - - - - - REF3 2b 2b 2b 2b 2b 2b 2b 2b 2b 2b 2b 2b 2b 2b 2b 2b 2b 2b 2b 2b 2b 2a 2b REF4 2f 2f 2f 2f 2f 2f 2f 2f 2f 2f 2f 2f 2c 2f 2f 2f 2f 2f 2f 2f 2f 2f 2f REF5 2d 2d 2d 2d 2d 2d 2d 2d 2d 2d 2a 2d 2d ND 2d 2d 2d 2d 2d 2d 2d 2d 2d REF6 - - - - - - - - - - - - - - - - - - - - - - - REF7 2a 2a 2a 2a 2a 2a 2a 2a 2a 2a 2a 2a 2a 2a 2a 2a 2a 2a 2a 2a 2a 2b 2a REF8 2d 2d 2d 2d 2d 2d 2d 2d 2d 2d 2d 2d 2f 2d 2d 2d 2d 2d 2d 2d 2d 2d 2d REF9 - - - - - - - - - - - - - - - - - - - - - - - REF10 2b 2b 2b 2b 2b 2b 2b 2b 2b 2b 2b 2b 2b 2b 2b 2b 2b 2b 2b 2b 2b 2a 2b n=22 participants, Purple shading: incorrect results, ND: not done.

Tenth external quality assessment scheme for Shiga toxin-producing Escherichia coli TECHNICAL REPORT
35
Annex 6. EQA provider cluster analysis-based on WGS-derived data
Single linked dendrogram of core genome multilocus sequence typing (cgMLST) profiles of STEC EQA-10 isolates (cgMLST, EnteroBase, http://enterobase.warwick.ac.uk). Analysed in BioNumerics: maximum distance of 200 exceeded, results clipped. Cluster isolates: dark grey, outside cluster isolates: light grey. REF11 and REF15 are technical duplicates.
wgMLST (Core (EnteroBase))
0 20
40
60
80 100
120
140
160
180
REF11
REF15
REF20
REF19
REF17
REF18
REF12
REF13
REF16
REF14
ST21
ST21
ST21
ST21
ST21
ST21
ST21
ST21
ST21
ST29
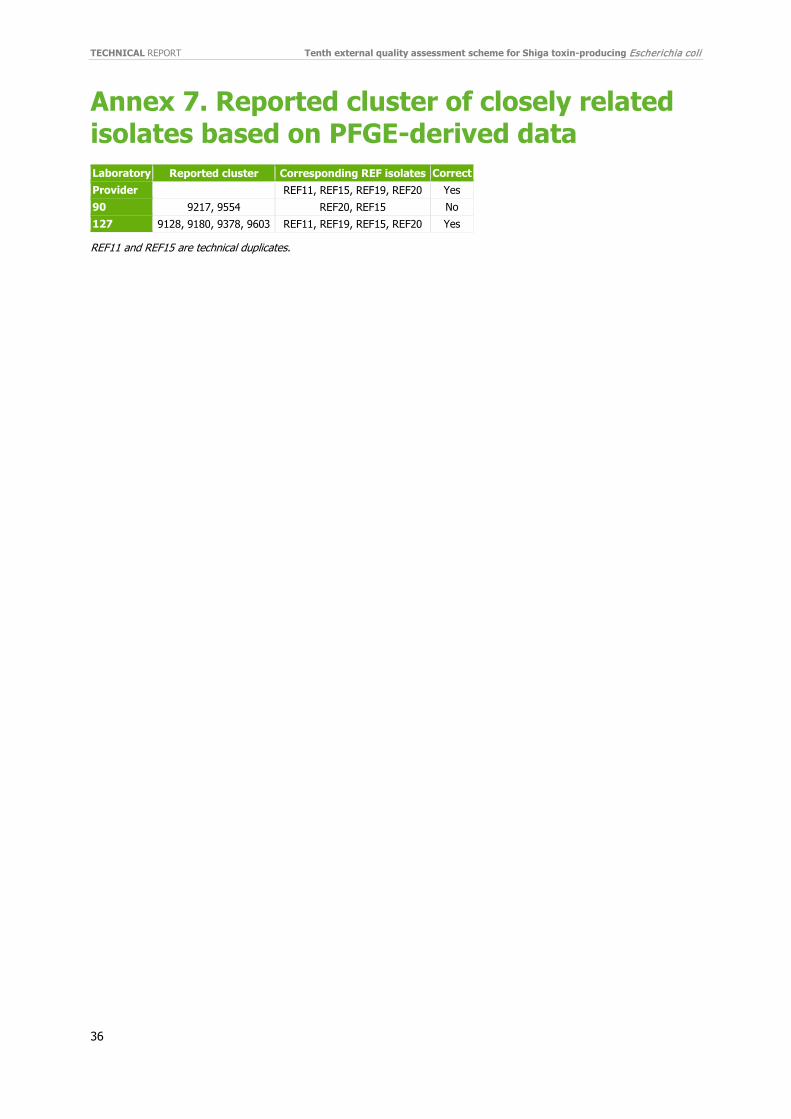
TECHNICAL REPORT Tenth external quality assessment scheme for Shiga toxin-producing Escherichia coli
36
Annex 7. Reported cluster of closely related isolates based on PFGE-derived data Laboratory Reported cluster Corresponding REF isolates Correct Provider REF11, REF15, REF19, REF20 Yes 90 9217, 9554 REF20, REF15 No 127 9128, 9180, 9378, 9603 REF11, REF19, REF15, REF20 Yes
REF11 and REF15 are technical duplicates.
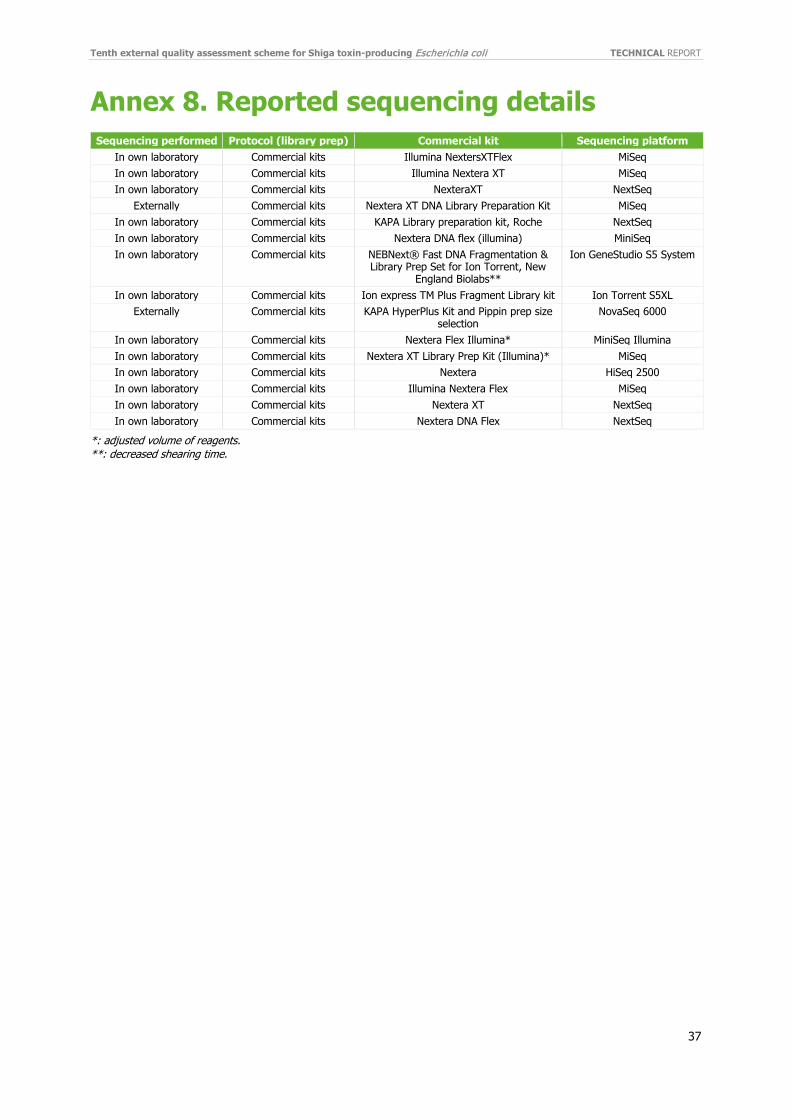
Tenth external quality assessment scheme for Shiga toxin-producing Escherichia coli TECHNICAL REPORT
37
Annex 8. Reported sequencing details Sequencing performed Protocol (library prep) Commercial kit Sequencing platform
In own laboratory Commercial kits Illumina NextersXTFlex MiSeq In own laboratory Commercial kits Illumina Nextera XT MiSeq In own laboratory Commercial kits NexteraXT NextSeq
Externally Commercial kits Nextera XT DNA Library Preparation Kit MiSeq In own laboratory Commercial kits KAPA Library preparation kit, Roche NextSeq In own laboratory Commercial kits Nextera DNA flex (illumina) MiniSeq In own laboratory Commercial kits NEBNext® Fast DNA Fragmentation &
Library Prep Set for Ion Torrent, New England Biolabs**
Ion GeneStudio S5 System
In own laboratory Commercial kits Ion express TM Plus Fragment Library kit Ion Torrent S5XL Externally Commercial kits KAPA HyperPlus Kit and Pippin prep size
selection NovaSeq 6000
In own laboratory Commercial kits Nextera Flex Illumina* MiniSeq Illumina In own laboratory Commercial kits Nextera XT Library Prep Kit (Illumina)* MiSeq In own laboratory Commercial kits Nextera HiSeq 2500 In own laboratory Commercial kits Illumina Nextera Flex MiSeq In own laboratory Commercial kits Nextera XT NextSeq In own laboratory Commercial kits Nextera DNA Flex NextSeq
*: adjusted volume of reagents. **: decreased shearing time.

TECHNICAL REPORT Tenth external quality assessment scheme for Shiga toxin-producing Escherichia coli
38
Annex 9. Reported cluster of closely related isolates based on WGS-derived data Laboratory Reported cluster Corresponding to REF isolates Correct
Provider REF11, REF15, REF19, REF20 Yes 19 9155, 9287, 9470, 9994 REF11, REF15, REF19, REF20 Yes 34 9477, 9561, 9575, 9878 REF15, REF11, REF20, REF19 Yes 80 9065, 9274, 9284, 9406 REF20, REF11, REF19, REF15 Yes
100 9247, 9466, 9923, 9987 REF11, REF15, REF20, REF19 Yes 108 9471, 9608, 9515, 9401 REF11, REF15, REF20, REF19 Yes 123 9120, 9185, 9423, 9491 REF11, REF15, REF20, REF19 Yes 124 9100, 9392, 9631, 9929 REF11, REF19, REF15, REF20 Yes 127 9128, 9180, 9378, 9603 REF20, REF19, REF15, REF11 Yes 133 9077, 9357, 9368, 9555 REF19, REF15, REF11, REF20 Yes 134 9745, 9108, 9907, 9226 REF20, REF19, REF11, REF15 Yes 135 9080, 9276, 9453, 9986 REF19, REF20, REF15, REF11 Yes 136 9415, 9181, 9409, 9898 REF19, REF20, REF15, REF11 Yes 137 9482, 9519, 9539 REF11, REF15, REF20 No 139 9173, 9450, 9468, 9746 REF19, REF11, REF15, REF20 Yes 222 9706, 9729, 9914, 9990 REF20, REF19, REF11, REF15 Yes
REF11 and REF15 are technical duplicates.

Tenth external quality assessment scheme for Shiga toxin-producing Escherichia coli TECHNICAL REPORT
39
Annex 10. Reported SNP distance and allelic differences SNP distances
Laboratory number
Isolate ID ST Provider Provider
(recombination –deleted [19])
19* 100* 108 127* 137
REF11‡# 21 2 2 0¤ 2 0¤ 0¤ 0¤ REF12 21 604 503 469 435 875 500 653 REF13 21 530 446 409 747 784 503 594
REF14 29 3366 951 921 2042 ND 3527 3989
REF15‡# 21 2 2 0 2 0 1 1 REF16 21 746 626 582 737 1065 598 839 REF17 21 120 117 106 115 124 106 148 REF18 21 538 413 387 454 791 527 614 REF19‡ 21 3 3 3 3 6 4 6 REF20‡ 21 0¤ 0¤ 2 0¤ 2 2 2
Allelic differences
ST: sequence type. ‡: closely related isolates (in grey). #: technical triplicates isolates. ¤: isolate used as cluster representative by participant. ND: isolates not included in analysis by participant.
Laboratory number Isolate
ID ST Provider 19 34 80 100 100* 123 124 124* 127 127* 133 134 135 136 139 222
REF11‡# 21 1 0¤ 4 0 2 2 0¤ 0¤ 0¤ 0¤ 0¤ 1 0 0 0 0¤ 5 REF12 21 78 78 173 75 237 165 75 80 210 84 62 79 75 75 99 100 75 REF13 21 80 81 157 78 238 157 79 80 170 104 91 81 79 79 99 100 80
REF14 29 283 282 308 278 518 1275 279 280 610 287 213 283 279 279 378 200 275
REF15‡# 21 1 0 0¤ 0¤ 2 2 0 0 1 3 0 0¤ 0¤ 0¤ 0¤ 0 6 REF16 21 112 110 204 113 286 216 114 110 270 119 83 112 114 114 152 100 116 REF17 21 40 40 44 37 54 58 38 40 90 43 35 41 38 38 52 50 44 REF18 21 67 67 104 65 143 156 67 70 180 70 88 67 65 67 87 50 61 REF19‡ 21 2 1 5 1 2 4 1 1 0 3 2 1 1 1 2 2 0¤ REF20‡ 21 0¤ 1 3 1 0¤ 0¤ 1 1 3 1 1 2 1 1 1 2 11

TECHNICAL REPORT Tenth external quality assessment scheme for Shiga toxin-producing Escherichia coli
40
Annex 11. Reported QC parameters Lab no.
1 2 3
Parameter Threshold Parameter Threshold Parameter Threshold
100
SAV
Cluster density, clusters passing filter and Q30 score
were all according to Illumina recommendations Contig count
Less than 35 contigs
108 Contamination Genome size, MLST all genes
100%
123 N50 >50 000
124 N50
Threshold set in the quality control window of
BioNumerics >52100 non-ACGT bases
Scatterplot (length vs non-ACGT bases)
Nr BAFPerfect
Scatterplot (length vs Nr BAFPerfect)
127 No. of N bases < 3%
133 core percent 97 NrNonACGT
look at ration to total length and
bases N50 70000
135 N50 >20 000 bp GC% GC% between
49.5 and 51.0% phred score >30
137
(Achtman 7 gene MLST) Min. consensus depth
Max. % non-consensus bases Average coverage of all
alleles
> 0 ≥ 15%
1 Variant ratio (SNP-typing) ≥ 0.9
Average depth
coverage (SNP-typing) ≥ 30x
222
N50
N50>30000 used as threshold when assessing contigs for which no fastq files were available, used
together with information on 7-loci MLST and number of
loci of cgMLST scheme found

Tenth external quality assessment scheme for Shiga toxin-producing Escherichia coli TECHNICAL REPORT
41
Annex 12. Calculated qualitative/ quantitative parameters Quality Assessment made by the SSI in-house quality control pipeline https://github.com/ssi-dk/bifrost [18]
Laboratory 19 Parameters Ranges* 9155 9191 9211 9287 9470 9487 9523 9668 9759 9994
Detected species {Ec} Ec Ec Ec Ec Ec Ec Ec Ec Ec Ec % Species 1 90.6 94.0 92.8 91.3 91.4 93.2 92.2 93.5 89.9 89.3 % Species 2 2.3 0.5 1.0 2.1 1.9 1.8 0.9 1.1 2.6 2.5
Unclassified reads (%) {<100} 5.8 5.0 5.4 5.4 5.4 4.4 5.8 5.2 6.0 7.0
Length at >25 x min. coverage (Mbp) {>45 ∧ <58} 5.5 5.2 5.5 5.5 5.5 5.2 5.4 5.3 5.4 5.4
Length [1-25] x min. coverage (kbp) {<250} 45.1 90.2 70.9 65.7 43.9 44.0 61.5 77.2 43.9 80.2
No. of contigs at 25 x min. coverage {>0} 664 718 614 644 557 472 594 661 685 750
No. of contigs [1-25] x min. coverage {<1 000} 56 140 100 81 43 43 68 101 53 101
Average coverage {>50} 108 67 77 88 96 76 85 93 107 86 No. of reads (x 1
000) 4368 2556 3104 3546 3909 2906 3338 3712 4374 3661 Average read length 141 142 142 142 141 143 142 140 138 135 Average insert size 212 217 223 222 216 228 217 210 200 188
N50 (kbp) 25 19 24 23 32 33 27 24 25 21
Laboratory 34 Parameters Ranges* 9062 9345 9477 9560 9561 9575 9820 9877 9878 9958
Detected species {Ec} Ec Ec Ec Ec Ec Ec Ec Ec Ec Ec % Species 1 88.3 86.1 84.6 93.1 84.0 79.7 91.0 88.5 80.5 92.8 % Species 2 1.3 3.6 3.8 2.0 4.0 4.0 0.3 0.8 3.6 1.0
Unclassified reads (%) {<100} 9.0 8.4 10.1 4.3 10.4 14.4 7.9 9.7 13.6 6.0
Length at >25 x min. coverage (Mbp) {>45 ∧ <58} 5.4 5.5 4.1 5.3 5.6 5.2 5.4 1.7 0.6 5.5
Length [1-25] x min. coverage (kbp) {<250} 33.4 2.0 1451.2 0.5 3.9 368.2 0.0 3913.1 4895.2 0.7
No. of contigs at 25 x min. coverage {>0} 298 310 294 250 307 381 320 254 225 332
No. of contigs [1-25] x min. coverage {<1000} 14 3 51 1 6 52 0 159 276 2
Average coverage {>50} 41 58 39 62 55 49 66 36 46 73 No. of reads (x 1000) 990 1580 1014 1623 1468 1455 1754 910 1129 1979 Average read length 243 215 233 216 224 202 215 235 238 216 Average insert size 314 256 302 254 278 231 251 303 302 250
N50 (kbp) 66 103 59 118 87 48 82 40 32 96
Laboratory 80 Parameters Ranges* 9065 9072 9074 9274 9284 9385 9406 9507 9797 9826
Detected species {Ec} or {Pt} Ec Ec Ec Ec Ec, Pt Ec Ec Ec Ec Ec % Species 1 85.5 86.9 85.9 83.8 80.9 83.9 86.8 87.7 87.5 88.5 % Species 2 4.4 4.2 5.0 4.6 6.0 4.6 3.3 3.3 3.3 2.8
Unclassified reads (%) {<100} 7.3 6.6 6.8 8.4 9.1 7.7 6.7 7.2 6.7 6.3
Length at >25 x min. coverage (Mbp) {>45 ∧ <58} 5.6 5.5 5.3 5.6 5.6 5.5 5.6 5.4 5.6 5.5
Length [1-25] x min. coverage (kbp) {<250} 0.0 0.0 0.0 0.0 0.0 0.0 13.6 0.0 0.0 0.0
No. of contigs at 25 x min. coverage {>0} 420 355 331 366 337 346 392 356 369 333
No. of contigs [1-25] x min. coverage {<1000} 0 0 0 0 0 0 5 0 0 0
Average coverage {>50} 207 151 214 126 133 134 152 146 145 149 No. of reads (x 1000) 9429 6698 9718 5585 6124 5977 6721 6105 6365 6289 Average read length 151 151 151 151 151 151 151 151 151 151 Average insert size 192 224 171 243 252 242 207 235 227 233
N50 (kbp) 87 103 103 83 87 104 87 95 89 112
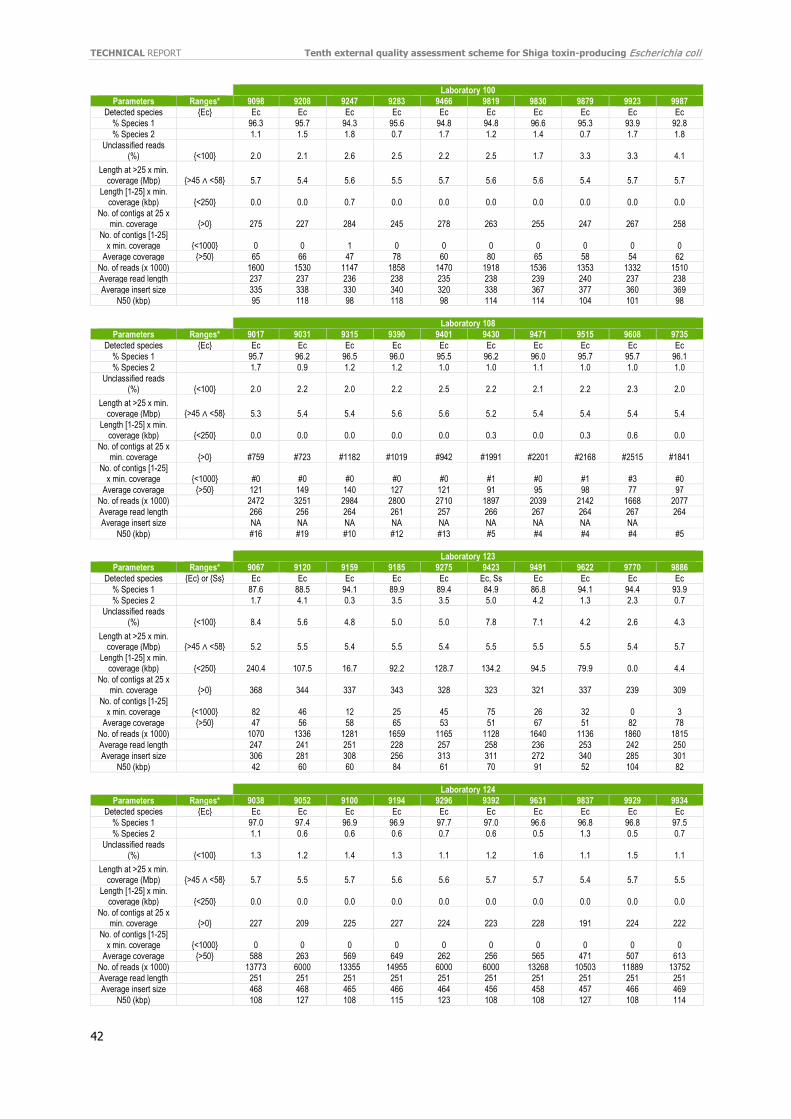
TECHNICAL REPORT Tenth external quality assessment scheme for Shiga toxin-producing Escherichia coli
42
Laboratory 100 Parameters Ranges* 9098 9208 9247 9283 9466 9819 9830 9879 9923 9987
Detected species {Ec} Ec Ec Ec Ec Ec Ec Ec Ec Ec Ec % Species 1 96.3 95.7 94.3 95.6 94.8 94.8 96.6 95.3 93.9 92.8 % Species 2 1.1 1.5 1.8 0.7 1.7 1.2 1.4 0.7 1.7 1.8
Unclassified reads (%) {<100} 2.0 2.1 2.6 2.5 2.2 2.5 1.7 3.3 3.3 4.1
Length at >25 x min. coverage (Mbp) {>45 ∧ <58} 5.7 5.4 5.6 5.5 5.7 5.6 5.6 5.4 5.7 5.7
Length [1-25] x min. coverage (kbp) {<250} 0.0 0.0 0.7 0.0 0.0 0.0 0.0 0.0 0.0 0.0
No. of contigs at 25 x min. coverage {>0} 275 227 284 245 278 263 255 247 267 258
No. of contigs [1-25] x min. coverage {<1000} 0 0 1 0 0 0 0 0 0 0
Average coverage {>50} 65 66 47 78 60 80 65 58 54 62 No. of reads (x 1000) 1600 1530 1147 1858 1470 1918 1536 1353 1332 1510 Average read length 237 237 236 238 235 238 239 240 237 238 Average insert size 335 338 330 340 320 338 367 377 360 369
N50 (kbp) 95 118 98 118 98 114 114 104 101 98
Laboratory 108 Parameters Ranges* 9017 9031 9315 9390 9401 9430 9471 9515 9608 9735
Detected species {Ec} Ec Ec Ec Ec Ec Ec Ec Ec Ec Ec % Species 1 95.7 96.2 96.5 96.0 95.5 96.2 96.0 95.7 95.7 96.1 % Species 2 1.7 0.9 1.2 1.2 1.0 1.0 1.1 1.0 1.0 1.0
Unclassified reads (%) {<100} 2.0 2.2 2.0 2.2 2.5 2.2 2.1 2.2 2.3 2.0
Length at >25 x min. coverage (Mbp) {>45 ∧ <58} 5.3 5.4 5.4 5.6 5.6 5.2 5.4 5.4 5.4 5.4
Length [1-25] x min. coverage (kbp) {<250} 0.0 0.0 0.0 0.0 0.0 0.3 0.0 0.3 0.6 0.0
No. of contigs at 25 x min. coverage {>0} #759 #723 #1182 #1019 #942 #1991 #2201 #2168 #2515 #1841
No. of contigs [1-25] x min. coverage {<1000} #0 #0 #0 #0 #0 #1 #0 #1 #3 #0
Average coverage {>50} 121 149 140 127 121 91 95 98 77 97 No. of reads (x 1000) 2472 3251 2984 2800 2710 1897 2039 2142 1668 2077 Average read length 266 256 264 261 257 266 267 264 267 264 Average insert size NA NA NA NA NA NA NA NA NA
N50 (kbp) #16 #19 #10 #12 #13 #5 #4 #4 #4 #5
Laboratory 123 Parameters Ranges* 9067 9120 9159 9185 9275 9423 9491 9622 9770 9886
Detected species {Ec} or {Ss} Ec Ec Ec Ec Ec Ec, Ss Ec Ec Ec Ec % Species 1 87.6 88.5 94.1 89.9 89.4 84.9 86.8 94.1 94.4 93.9 % Species 2 1.7 4.1 0.3 3.5 3.5 5.0 4.2 1.3 2.3 0.7
Unclassified reads (%) {<100} 8.4 5.6 4.8 5.0 5.0 7.8 7.1 4.2 2.6 4.3
Length at >25 x min. coverage (Mbp) {>45 ∧ <58} 5.2 5.5 5.4 5.5 5.4 5.5 5.5 5.5 5.4 5.7
Length [1-25] x min. coverage (kbp) {<250} 240.4 107.5 16.7 92.2 128.7 134.2 94.5 79.9 0.0 4.4
No. of contigs at 25 x min. coverage {>0} 368 344 337 343 328 323 321 337 239 309
No. of contigs [1-25] x min. coverage {<1000} 82 46 12 25 45 75 26 32 0 3
Average coverage {>50} 47 56 58 65 53 51 67 51 82 78 No. of reads (x 1000) 1070 1336 1281 1659 1165 1128 1640 1136 1860 1815 Average read length 247 241 251 228 257 258 236 253 242 250 Average insert size 306 281 308 256 313 311 272 340 285 301
N50 (kbp) 42 60 60 84 61 70 91 52 104 82
Laboratory 124 Parameters Ranges* 9038 9052 9100 9194 9296 9392 9631 9837 9929 9934
Detected species {Ec} Ec Ec Ec Ec Ec Ec Ec Ec Ec Ec % Species 1 97.0 97.4 96.9 96.9 97.7 97.0 96.6 96.8 96.8 97.5 % Species 2 1.1 0.6 0.6 0.6 0.7 0.6 0.5 1.3 0.5 0.7
Unclassified reads (%) {<100} 1.3 1.2 1.4 1.3 1.1 1.2 1.6 1.1 1.5 1.1
Length at >25 x min. coverage (Mbp) {>45 ∧ <58} 5.7 5.5 5.7 5.6 5.6 5.7 5.7 5.4 5.7 5.5
Length [1-25] x min. coverage (kbp) {<250} 0.0 0.0 0.0 0.0 0.0 0.0 0.0 0.0 0.0 0.0
No. of contigs at 25 x min. coverage {>0} 227 209 225 227 224 223 228 191 224 222
No. of contigs [1-25] x min. coverage {<1000} 0 0 0 0 0 0 0 0 0 0
Average coverage {>50} 588 263 569 649 262 256 565 471 507 613 No. of reads (x 1000) 13773 6000 13355 14955 6000 6000 13268 10503 11889 13752 Average read length 251 251 251 251 251 251 251 251 251 251 Average insert size 468 468 465 466 464 456 458 457 466 469
N50 (kbp) 108 127 108 115 123 108 108 127 108 114
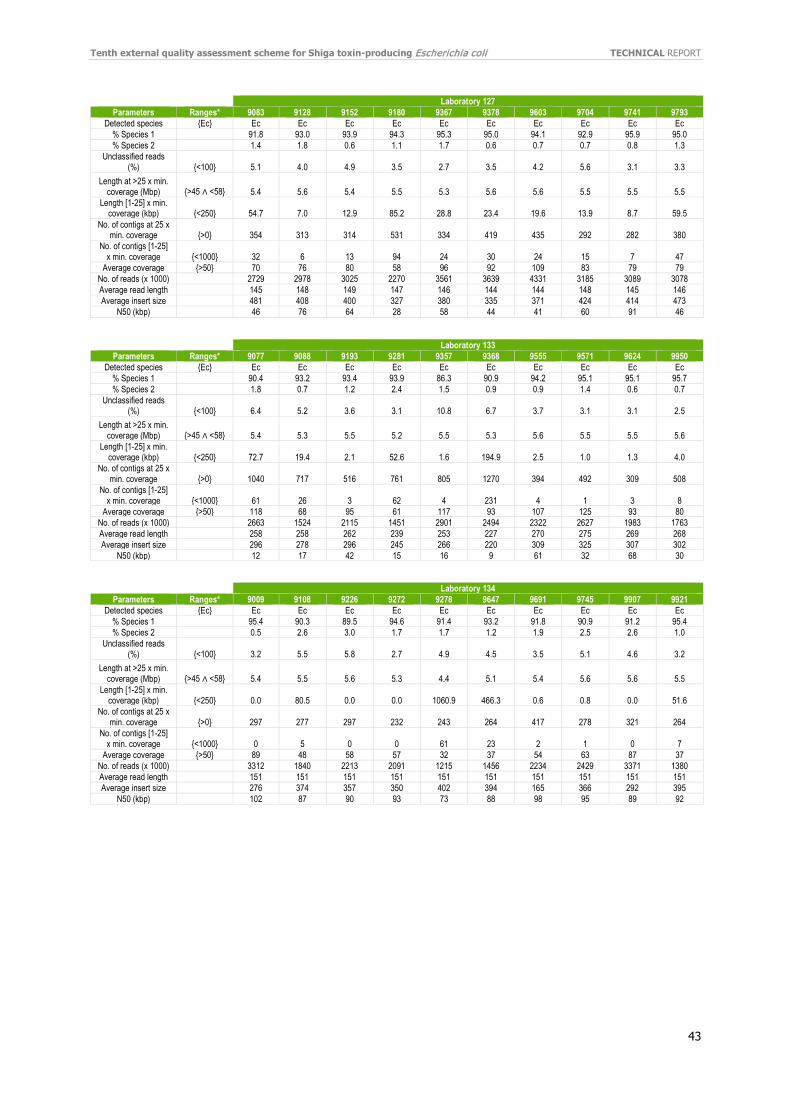
Tenth external quality assessment scheme for Shiga toxin-producing Escherichia coli TECHNICAL REPORT
43
Laboratory 127
Parameters Ranges* 9083 9128 9152 9180 9367 9378 9603 9704 9741 9793 Detected species {Ec} Ec Ec Ec Ec Ec Ec Ec Ec Ec Ec
% Species 1 91.8 93.0 93.9 94.3 95.3 95.0 94.1 92.9 95.9 95.0 % Species 2 1.4 1.8 0.6 1.1 1.7 0.6 0.7 0.7 0.8 1.3
Unclassified reads (%) {<100} 5.1 4.0 4.9 3.5 2.7 3.5 4.2 5.6 3.1 3.3
Length at >25 x min. coverage (Mbp) {>45 ∧ <58} 5.4 5.6 5.4 5.5 5.3 5.6 5.6 5.5 5.5 5.5
Length [1-25] x min. coverage (kbp) {<250} 54.7 7.0 12.9 85.2 28.8 23.4 19.6 13.9 8.7 59.5
No. of contigs at 25 x min. coverage {>0} 354 313 314 531 334 419 435 292 282 380
No. of contigs [1-25] x min. coverage {<1000} 32 6 13 94 24 30 24 15 7 47
Average coverage {>50} 70 76 80 58 96 92 109 83 79 79 No. of reads (x 1000) 2729 2978 3025 2270 3561 3639 4331 3185 3089 3078 Average read length 145 148 149 147 146 144 144 148 145 146 Average insert size 481 408 400 327 380 335 371 424 414 473
N50 (kbp) 46 76 64 28 58 44 41 60 91 46
Laboratory 133 Parameters Ranges* 9077 9088 9193 9281 9357 9368 9555 9571 9624 9950
Detected species {Ec} Ec Ec Ec Ec Ec Ec Ec Ec Ec Ec % Species 1 90.4 93.2 93.4 93.9 86.3 90.9 94.2 95.1 95.1 95.7 % Species 2 1.8 0.7 1.2 2.4 1.5 0.9 0.9 1.4 0.6 0.7
Unclassified reads (%) {<100} 6.4 5.2 3.6 3.1 10.8 6.7 3.7 3.1 3.1 2.5
Length at >25 x min. coverage (Mbp) {>45 ∧ <58} 5.4 5.3 5.5 5.2 5.5 5.3 5.6 5.5 5.5 5.6
Length [1-25] x min. coverage (kbp) {<250} 72.7 19.4 2.1 52.6 1.6 194.9 2.5 1.0 1.3 4.0
No. of contigs at 25 x min. coverage {>0} 1040 717 516 761 805 1270 394 492 309 508
No. of contigs [1-25] x min. coverage {<1000} 61 26 3 62 4 231 4 1 3 8
Average coverage {>50} 118 68 95 61 117 93 107 125 93 80 No. of reads (x 1000) 2663 1524 2115 1451 2901 2494 2322 2627 1983 1763 Average read length 258 258 262 239 253 227 270 275 269 268 Average insert size 296 278 296 245 266 220 309 325 307 302
N50 (kbp) 12 17 42 15 16 9 61 32 68 30
Laboratory 134 Parameters Ranges* 9009 9108 9226 9272 9278 9647 9691 9745 9907 9921
Detected species {Ec} Ec Ec Ec Ec Ec Ec Ec Ec Ec Ec % Species 1 95.4 90.3 89.5 94.6 91.4 93.2 91.8 90.9 91.2 95.4 % Species 2 0.5 2.6 3.0 1.7 1.7 1.2 1.9 2.5 2.6 1.0
Unclassified reads (%) {<100} 3.2 5.5 5.8 2.7 4.9 4.5 3.5 5.1 4.6 3.2
Length at >25 x min. coverage (Mbp) {>45 ∧ <58} 5.4 5.5 5.6 5.3 4.4 5.1 5.4 5.6 5.6 5.5
Length [1-25] x min. coverage (kbp) {<250} 0.0 80.5 0.0 0.0 1060.9 466.3 0.6 0.8 0.0 51.6
No. of contigs at 25 x min. coverage {>0} 297 277 297 232 243 264 417 278 321 264
No. of contigs [1-25] x min. coverage {<1000} 0 5 0 0 61 23 2 1 0 7
Average coverage {>50} 89 48 58 57 32 37 54 63 87 37 No. of reads (x 1000) 3312 1840 2213 2091 1215 1456 2234 2429 3371 1380 Average read length 151 151 151 151 151 151 151 151 151 151 Average insert size 276 374 357 350 402 394 165 366 292 395
N50 (kbp) 102 87 90 93 73 88 98 95 89 92
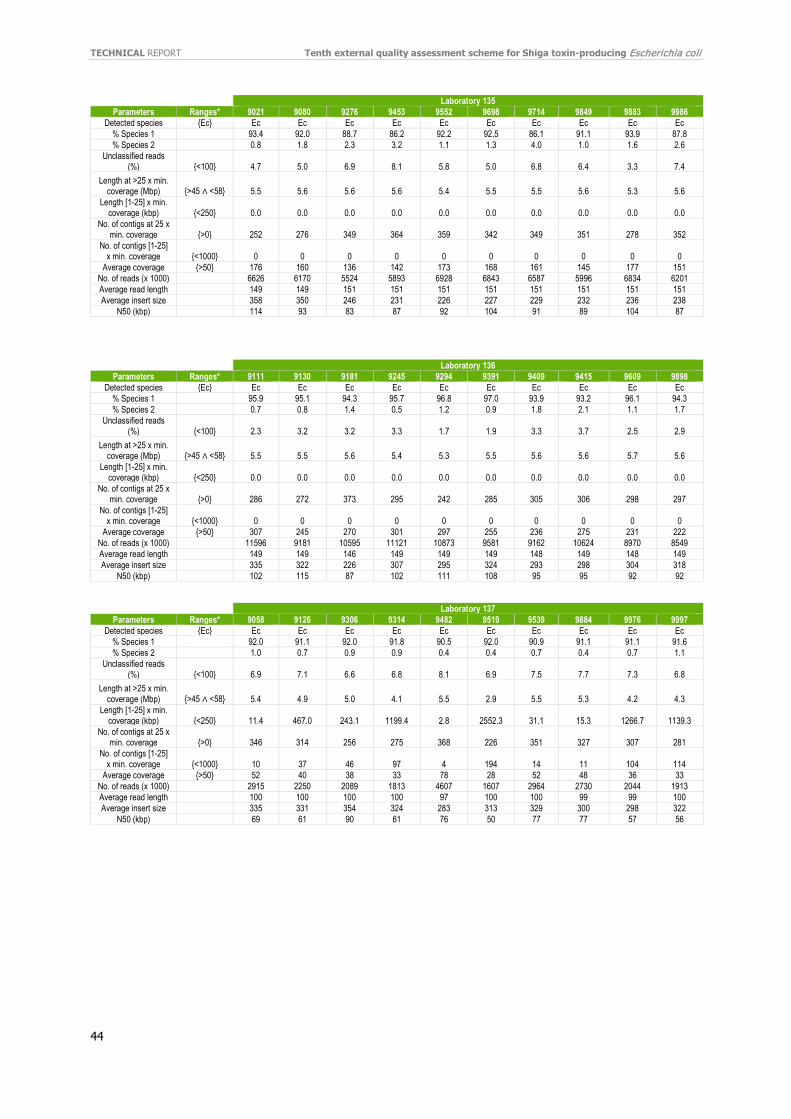
TECHNICAL REPORT Tenth external quality assessment scheme for Shiga toxin-producing Escherichia coli
44
Laboratory 135
Parameters Ranges* 9021 9080 9276 9453 9552 9698 9714 9849 9883 9986 Detected species {Ec} Ec Ec Ec Ec Ec Ec Ec Ec Ec Ec
% Species 1 93.4 92.0 88.7 86.2 92.2 92.5 86.1 91.1 93.9 87.8 % Species 2 0.8 1.8 2.3 3.2 1.1 1.3 4.0 1.0 1.6 2.6
Unclassified reads (%) {<100} 4.7 5.0 6.9 8.1 5.8 5.0 6.8 6.4 3.3 7.4
Length at >25 x min. coverage (Mbp) {>45 ∧ <58} 5.5 5.6 5.6 5.6 5.4 5.5 5.5 5.6 5.3 5.6
Length [1-25] x min. coverage (kbp) {<250} 0.0 0.0 0.0 0.0 0.0 0.0 0.0 0.0 0.0 0.0
No. of contigs at 25 x min. coverage {>0} 252 276 349 364 359 342 349 351 278 352
No. of contigs [1-25] x min. coverage {<1000} 0 0 0 0 0 0 0 0 0 0
Average coverage {>50} 176 160 136 142 173 168 161 145 177 151 No. of reads (x 1000) 6626 6170 5524 5893 6928 6843 6587 5996 6834 6201 Average read length 149 149 151 151 151 151 151 151 151 151 Average insert size 358 350 246 231 226 227 229 232 236 238
N50 (kbp) 114 93 83 87 92 104 91 89 104 87
Laboratory 136 Parameters Ranges* 9111 9130 9181 9245 9294 9391 9409 9415 9609 9898
Detected species {Ec} Ec Ec Ec Ec Ec Ec Ec Ec Ec Ec % Species 1 95.9 95.1 94.3 95.7 96.8 97.0 93.9 93.2 96.1 94.3 % Species 2 0.7 0.8 1.4 0.5 1.2 0.9 1.8 2.1 1.1 1.7
Unclassified reads (%) {<100} 2.3 3.2 3.2 3.3 1.7 1.9 3.3 3.7 2.5 2.9
Length at >25 x min. coverage (Mbp) {>45 ∧ <58} 5.5 5.5 5.6 5.4 5.3 5.5 5.6 5.6 5.7 5.6
Length [1-25] x min. coverage (kbp) {<250} 0.0 0.0 0.0 0.0 0.0 0.0 0.0 0.0 0.0 0.0
No. of contigs at 25 x min. coverage {>0} 286 272 373 295 242 285 305 306 298 297
No. of contigs [1-25] x min. coverage {<1000} 0 0 0 0 0 0 0 0 0 0
Average coverage {>50} 307 245 270 301 297 255 236 275 231 222 No. of reads (x 1000) 11596 9181 10595 11121 10873 9581 9162 10624 8970 8549 Average read length 149 149 146 149 149 149 148 149 148 149 Average insert size 335 322 226 307 295 324 293 298 304 318
N50 (kbp) 102 115 87 102 111 108 95 95 92 92
Laboratory 137 Parameters Ranges* 9058 9126 9306 9314 9482 9519 9539 9884 9976 9997
Detected species {Ec} Ec Ec Ec Ec Ec Ec Ec Ec Ec Ec % Species 1 92.0 91.1 92.0 91.8 90.5 92.0 90.9 91.1 91.1 91.6 % Species 2 1.0 0.7 0.9 0.9 0.4 0.4 0.7 0.4 0.7 1.1
Unclassified reads (%) {<100} 6.9 7.1 6.6 6.8 8.1 6.9 7.5 7.7 7.3 6.8
Length at >25 x min. coverage (Mbp) {>45 ∧ <58} 5.4 4.9 5.0 4.1 5.5 2.9 5.5 5.3 4.2 4.3
Length [1-25] x min. coverage (kbp) {<250} 11.4 467.0 243.1 1199.4 2.8 2552.3 31.1 15.3 1266.7 1139.3
No. of contigs at 25 x min. coverage {>0} 346 314 256 275 368 226 351 327 307 281
No. of contigs [1-25] x min. coverage {<1000} 10 37 46 97 4 194 14 11 104 114
Average coverage {>50} 52 40 38 33 78 28 52 48 36 33 No. of reads (x 1000) 2915 2250 2089 1813 4607 1607 2964 2730 2044 1913 Average read length 100 100 100 100 97 100 100 99 99 100 Average insert size 335 331 354 324 283 313 329 300 298 322
N50 (kbp) 69 61 90 61 76 50 77 77 57 56

Tenth external quality assessment scheme for Shiga toxin-producing Escherichia coli TECHNICAL REPORT
45
Laboratory 139
Parameters Ranges* 9171 9173 9450 9468 9476 9581 9632 9746 9900 9901 Detected species {Ec} Ec Ec Ec Ec Ec Ec Ec Ec Ec Ec
% Species 1 96.2 94.8 95.0 94.9 97.2 96.1 95.7 95.0 94.4 95.8 % Species 2 0.6 1.0 0.9 1.0 0.6 0.8 1.4 0.8 1.2 1.1
Unclassified reads (%) {<100} 2.4 2.8 2.8 2.7 1.8 2.4 1.9 2.9 2.8 2.5
Length at >25 x min. coverage (Mbp) {>45 ∧ <58} 5.5 5.6 5.6 5.6 5.5 5.4 5.3 5.6 5.5 5.7
Length [1-25] x min. coverage (kbp) {<250} 0.0 0.0 0.0 0.0 0.0 0.0 0.0 0.0 0.0 0.0
No. of contigs at 25 x min. coverage {>0} 290 299 296 298 297 291 234 299 293 306
No. of contigs [1-25] x min. coverage {<1000} 0 0 0 0 0 0 0 0 0 0
Average coverage {>50} 54 80 77 85 61 96 86 74 80 70 No. of reads (x 1000) 2018 3077 2945 3281 2300 3550 3185 2865 3035 2713 Average read length 151 151 151 151 151 151 151 151 151 151 Average insert size 307 310 325 313 300 308 296 308 306 307
N50 (kbp) 104 95 92 94 104 102 104 89 104 92
Laboratory 222 Parameters Ranges* 9012 9094 9369 9681 9706 9719 9729 9818 9914 9990
Detected species {Ec} Ec Ec Ec Ec Ec Ec Ec Ec Ec Ec % Species 1 97.3 96.6 96.8 97.0 96.8 96.5 96.5 96.3 96.7 96.5 % Species 2 1.2 1.4 1.2 0.9 0.8 1.1 1.0 1.0 1.1 0.9
Unclassified reads (%) {<100} 1.1 0.9 1.0 1.1 1.3 1.2 1.2 1.2 1.2 1.2
Length at >25 x min. coverage (Mbp) {>45 ∧ <58} 5.5 5.3 5.6 5.4 5.6 5.4 5.6 5.5 5.5 5.5
Length [1-25] x min. coverage (kbp) {<250} 0.6 0.0 0.0 0.0 0.0 0.0 0.0 0.0 0.2 0.0
No. of contigs at 25 x min. coverage {>0} #838 #651 #693 #531 #627 #647 #494 #515 #1322 #1340
No. of contigs [1-25] x min. coverage {<1000} #2 #0 #0 #0 #0 #0 #0 #0 #1 #0
Average coverage {>50} 178 272 206 263 250 232 260 300 174 189 No. of reads (x 1000) 3133 4551 3501 4512 4564 3970 4709 5454 2925 3084 Average read length 318 323 336 319 312 325 315 309 341 349 Average insert size NA NA NA NA NA NA NA NA NA NA
N50 (kbp) #15 #18 #20 #31 #24 #22 #33 #34 #8 #8
Quality assessment made by the EQA-provider in-house quality control pipeline. *: indicative QC ranges; Ec: E. coli, Ss: Shigella sonnei, Pt: Pseudomonas tolaasii (listed if >5%). NA: not analysed. #: QC values unreliable due to assembly issues for Ion Torrent data.

TECHNICAL REPORT Tenth external quality assessment scheme for Shiga toxin-producing Escherichia coli
46
Annex 13. Results of the participants’ assessment of the EQA provided genomes
Characteristics identified by participants EQA provider
Lab ID Cluster Genome 1 Contamination detected? Cluster
EQA provider No A non-cluster isolate (REF11) mixed with a different Escherichia coli (approx. 10%) Yes No
19 No
We would not include genome 1 in the cluster analysis because of a possible contamination. Genome 1 has many contigs, high multiple consensus loci, many unidentified bases, too large genome and failed in the species testing with Kraken - all indicating a possible contaminated sample. Despite that the genome would not be used for analysis before pure culture is available, when looking at allele differences (AD) to the cluster representative genome, genome 1 differs with 101 alleles and is therefore not considered closely related to the outbreak cluster.
Yes No
34 No Assembling by SKESA cgMLST by RIDOM SeqSphere+QC: excellent 97.2% good targets (only 70 missing) 929 contigs included in cluster analysis. No No
80 No Our cluster threshold is <=10 allelic differences and genome number 1 is 91 allelic differences. No No
100 No Genome 1 has 67 AD from the representative isolate. No No
108 No Genome 1 is more than 771 SNP from 9 471 and is thereby not included in the cluster. No No
123 No Genome 1 shows 98.5 % cgMLST targets (sufficient quality for routine analysis), it is ST 21, but another Complex Type (CT) (CT8917 and not CT3023 as the cluster isolates). It has 94 allelic differences to the representative isolate in the cluster 9 120 (threshold is 10). Because of the last two reasons, it does not belong to the cluster.
No No
124 No
Genome 1 has a genome size of 5.9 Mb, a high number of N bases, and a high number of multiple alleles, suggesting a mix of closely related organisms. After running KmerFinder, a query coverage of 84.06% and a template coverage of 34.56% was obtained, with E.coli O26:H11 as template. 2nd: a query coverage of 34.56% and a template coverage of 54.80% was obtained, with E.coli 118UI as template. After running the cgMLST (Core Enterobase) analysis we observe that genome 1 has 100 AD with the cluster representative. With all this information we can presume that genome 1 is not part of the cluster.
Yes No
127 No Genome 1 is not a member of the outbreak cluster. Based on the cgMLST analysis, the difference greater than 10 alleles between genome 1 and representative isolate of the outbreak cluster (9 128) exists.
No No
133 No 103 allele difference from representative strain 9 368. No No
134 No The sequence quality of Genome 1 is quite good, with 97.5% of the targets found and a number of contigs slightly high but still correct. Allele difference (AD) with the cluster = 92. The isolate is excluded from the cluster.
No No
135 No Genome 1 does not meet quality criteria – the genome size is too high. It is therefore not possible to state reliably whether it is part of the cluster. Isolate should be checked for contamination and WGS repeated from the start. When included in comparison in spite of quality issues, 104 alleles different from closest cluster isolate.
Yes No
136 No We define a cluster threshold of <=10 allelic differences and genome 1 does not match the criteria. No No
137 No 839 SNPs distance indicating it is not part of the cluster as it is too distantly related. No No
139 No
Quality is OK using Enterobase passing filters. Using cgMLST as a typing method, we conclude that this isolate does not belong to the cluster (same HC50 only). We detect two different alleles for three loci (fumC, gyrB and icd) of MLST scheme suggesting a possible contamination with another E. coli/shigella isolate. However, after a rapid check, all combinations of alleles for these seven MLST genes lead to the same clonal complex STc29.A subculture of the isolate would allow to check the purity of the congelation stock.
Yes No
222 No
2307/2360 loci of cgMLST scheme correctly mapped, satisfying our quality threshold set at 80% for reliability of cluster analysis. Moreover, the seven genes of conventional MLST (Warwick scheme) were all found 100% in length and with >=30 average depth of coverage. All quality criteria were satisfied for this sequence, which showed >=87 allelic differences from all the isolates part of the detected cluster. We set the threshold for considering a cluster at <=15 allelic differences, so this genome is not part of the cluster.
No No
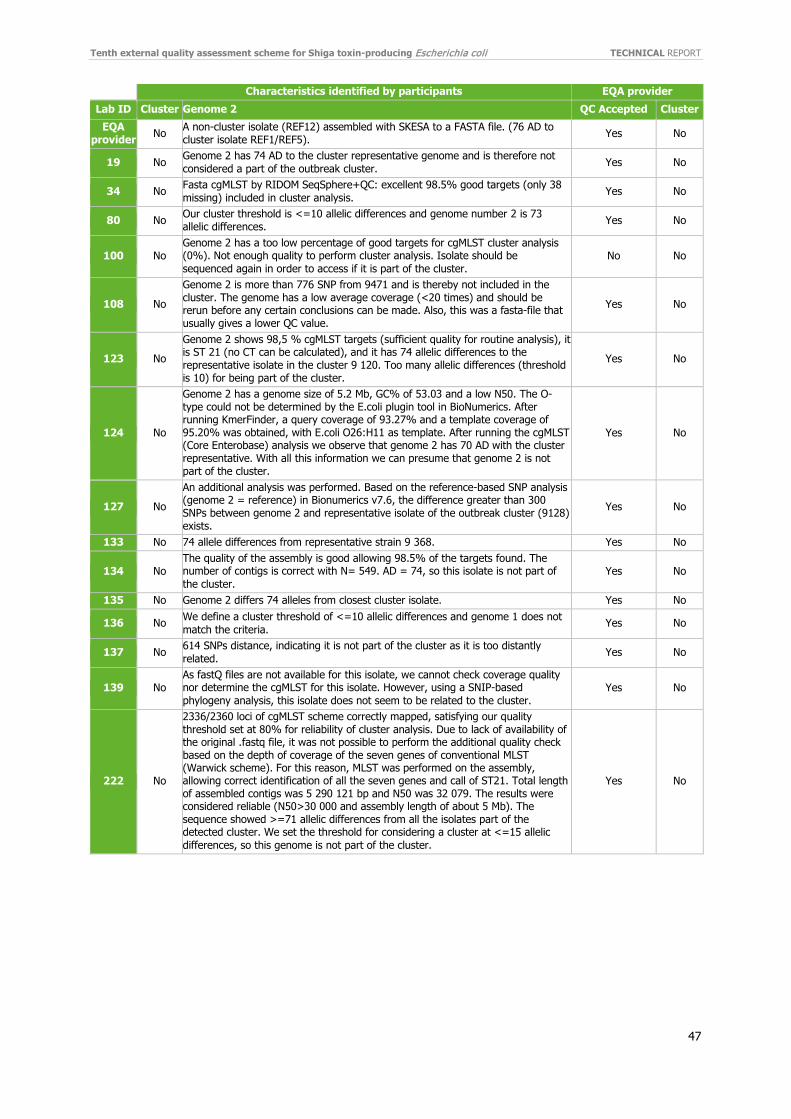
Tenth external quality assessment scheme for Shiga toxin-producing Escherichia coli TECHNICAL REPORT
47
Characteristics identified by participants EQA provider Lab ID Cluster Genome 2 QC Accepted Cluster
EQA provider No A non-cluster isolate (REF12) assembled with SKESA to a FASTA file. (76 AD to
cluster isolate REF1/REF5). Yes No
19 No Genome 2 has 74 AD to the cluster representative genome and is therefore not considered a part of the outbreak cluster. Yes No
34 No Fasta cgMLST by RIDOM SeqSphere+QC: excellent 98.5% good targets (only 38 missing) included in cluster analysis. Yes No
80 No Our cluster threshold is <=10 allelic differences and genome number 2 is 73 allelic differences. Yes No
100 No Genome 2 has a too low percentage of good targets for cgMLST cluster analysis (0%). Not enough quality to perform cluster analysis. Isolate should be sequenced again in order to access if it is part of the cluster.
No No
108 No
Genome 2 is more than 776 SNP from 9471 and is thereby not included in the cluster. The genome has a low average coverage (<20 times) and should be rerun before any certain conclusions can be made. Also, this was a fasta-file that usually gives a lower QC value.
Yes No
123 No Genome 2 shows 98,5 % cgMLST targets (sufficient quality for routine analysis), it is ST 21 (no CT can be calculated), and it has 74 allelic differences to the representative isolate in the cluster 9 120. Too many allelic differences (threshold is 10) for being part of the cluster.
Yes No
124 No
Genome 2 has a genome size of 5.2 Mb, GC% of 53.03 and a low N50. The O-type could not be determined by the E.coli plugin tool in BioNumerics. After running KmerFinder, a query coverage of 93.27% and a template coverage of 95.20% was obtained, with E.coli O26:H11 as template. After running the cgMLST (Core Enterobase) analysis we observe that genome 2 has 70 AD with the cluster representative. With all this information we can presume that genome 2 is not part of the cluster.
Yes No
127 No An additional analysis was performed. Based on the reference-based SNP analysis (genome 2 = reference) in Bionumerics v7.6, the difference greater than 300 SNPs between genome 2 and representative isolate of the outbreak cluster (9128) exists.
Yes No
133 No 74 allele differences from representative strain 9 368. Yes No
134 No The quality of the assembly is good allowing 98.5% of the targets found. The number of contigs is correct with N= 549. AD = 74, so this isolate is not part of the cluster.
Yes No
135 No Genome 2 differs 74 alleles from closest cluster isolate. Yes No
136 No We define a cluster threshold of <=10 allelic differences and genome 1 does not match the criteria. Yes No
137 No 614 SNPs distance, indicating it is not part of the cluster as it is too distantly related. Yes No
139 No As fastQ files are not available for this isolate, we cannot check coverage quality nor determine the cgMLST for this isolate. However, using a SNIP-based phylogeny analysis, this isolate does not seem to be related to the cluster.
Yes No
222 No
2336/2360 loci of cgMLST scheme correctly mapped, satisfying our quality threshold set at 80% for reliability of cluster analysis. Due to lack of availability of the original .fastq file, it was not possible to perform the additional quality check based on the depth of coverage of the seven genes of conventional MLST (Warwick scheme). For this reason, MLST was performed on the assembly, allowing correct identification of all the seven genes and call of ST21. Total length of assembled contigs was 5 290 121 bp and N50 was 32 079. The results were considered reliable (N50>30 000 and assembly length of about 5 Mb). The sequence showed >=71 allelic differences from all the isolates part of the detected cluster. We set the threshold for considering a cluster at <=15 allelic differences, so this genome is not part of the cluster.
Yes No

TECHNICAL REPORT Tenth external quality assessment scheme for Shiga toxin-producing Escherichia coli
48
Characteristics identified by participants EQA provider
Lab ID Cluster Genome 3 Contamination detected? Cluster
EQA provider No A non-cluster isolate (REF13) mixed with a Klebsiella pneumonia (approx. 10%). Yes No
19 No
We would not include genome 3 in the cluster analysis because of a possible contamination. Genome 3 had many contigs, high multiple consensus, many unidentified bases, double the size of expected genome size and failed in the species testing with Kraken – all indicating a possible contaminated sample. Despite that the genome would not be used for analysis before pure culture is available, when looking at AD to the cluster representative genome, genome 3 differ with 69 alleles and is therefore not considered closely related to the outbreak cluster.
Yes No
34 No Assembling by SKESA cgMLST by RIDOM SeqSphere+QC: bad 34.5% good targets (1 646 missing) no use for cluster analysis possible not included sequence data were contaminated (probably E.coli and Klebsiella) isolation of pure culture before rerunning.
Yes No
80 No Our cluster threshold is <=10 allelic differences and genome number 3 is 67 allelic differences No No
100 No Genome 3 has 134 AD from the representative isolate. No No
108 No This sample was contaminated (genome size 9,8Mbp, O26/O8:H11). SNP-analyses based on this contaminated sample shows that it´s not included in the cluster (more than 633 SNP from 9 471), but the sample must be recultivated before conclusions can be made.
Yes No
123 No
Allthough Genome 3 shows only 41,7 %cgMLST targets (which is a not sufficient Quality for Routine Analysis, our treshold is 98 %cgMLST Targets normally we would rerun, or suggest to rerun this sequence), we already see in a pairwise comparison to the representative Isolat in the cluster 9 120 24 allelic differences. If more alleles could be compared, even more differences, and not fewer, would occur; therefore, it does not belong to the cluster.
Yes No
124 No
Genome 3 has a genome size of 10.5 Mb, high number of N bases and a high number of multiple alleles, suggesting a mix of 2 distinct organisms (which was confirmed after running Kmer Finder: E.coli + Klebsiella pneumoniae) and probably contamination with other E.coli. The E.coli plugin tool in BioNumerics could determine the O-type (O26 or O8). After running the cgMLST (Core Enterobase) analysis we observe that genome 3 has 70 AD with the cluster representative. With all this information we can presume that genome 3 is not part of the cluster.
Yes No
127 No Genome 3 should be excluded from the analysis, because of sequence length (> 10 Mb) and high number of loci with multiple alleles. It seems that contamination might be present.
Yes No
133 No 73 allele difference from representative strain 9368. No No
134 Yes
The quality of the raw reads is really bad, only 31.7% of the targets are found after the assembly. The number of contigs is too high as well. However, the vtx_1a variant is well identified for this isolate and AD = 26. In an outbreak situation, I would not exclude this isolate and rerun the sequencing (and re-do the DNA extraction as well).
Yes Yes
135 No
genome 3 does not meet quality criteria: genome size too high, GC% too high, contig count too high, % assigned alleles too low, contamination too high (9% of total reads are Klebsiella pneumoniae). therefore it is not possible to reliably state if it is part of the cluster or not.isolate should be checked for contamination and WGS repeated from the start.
Yes No
136 No We define a cluster threshold of <=10 allelic differences and genome 1 does not match the criteria No No
137 No 3 989 SNPs distance, indicating it is not part of the cluster as it is too distantly related; it is also a different serotype, O177:H11. No No
139 No
Quality is OK using Enterobase passing filters. This isolate does not belong to the cluster as cgMLST is different (only the same HC100). We detect two different alleles for one loci (gyrB) of MLST scheme suggesting a possible contamination with another E. coli/shigella isolate. However, after a rapid check, the other possibility of combinations of alleles for these 7 MLST genes lead to the same clonal complex STc29. A subculture of the isolate would allow to check the purity of the congelation stock.
Yes No
222 No
2344/2360 loci of cgMLST scheme correctly mapped, satisfying our quality threshold set at 80% for reliability of cluster analysis. Moreover, the 7 genes of conventional MLST (Warwick scheme) were all found 100% in length and with >=30 average depth of coverage. All quality criteria were satisfied for this sequence, which showed >=64 allelic differences from all the isolates part of the detected cluster. We set the threshold for considering a cluster at <=15 allelic differences, so this genome is not part of the cluster.
No No
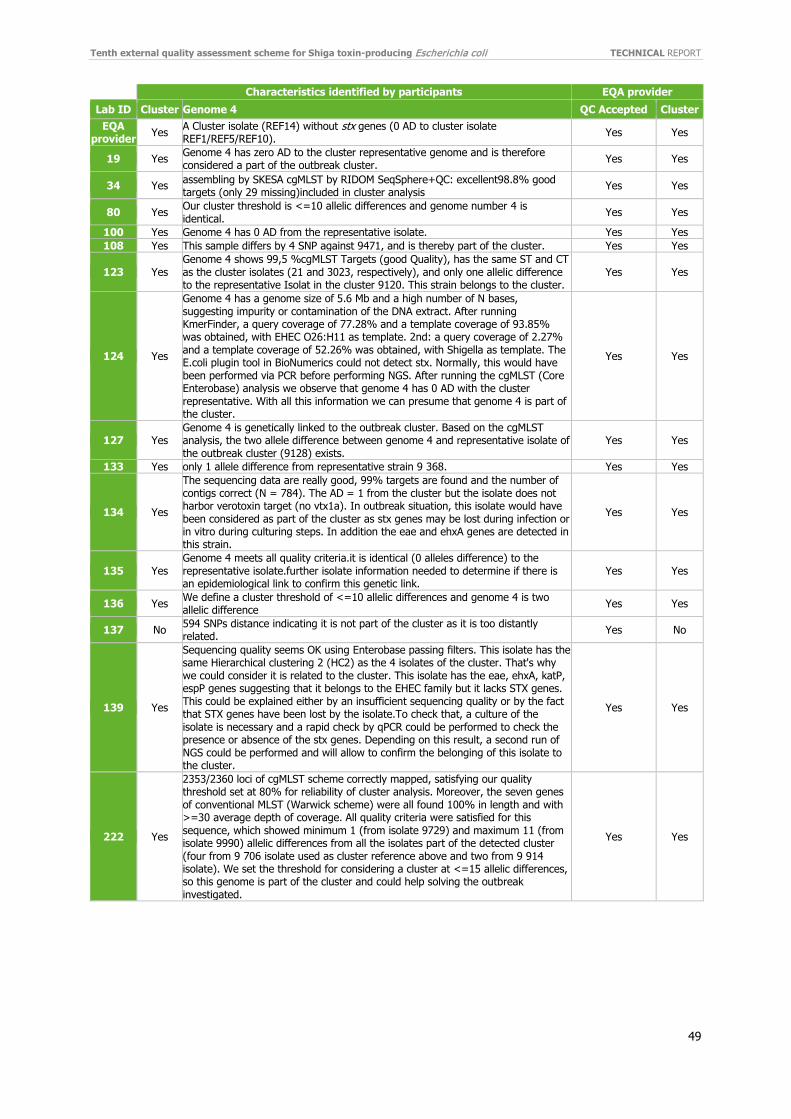
Tenth external quality assessment scheme for Shiga toxin-producing Escherichia coli TECHNICAL REPORT
49
Characteristics identified by participants EQA provider Lab ID Cluster Genome 4 QC Accepted Cluster
EQA provider Yes A Cluster isolate (REF14) without stx genes (0 AD to cluster isolate
REF1/REF5/REF10). Yes Yes
19 Yes Genome 4 has zero AD to the cluster representative genome and is therefore considered a part of the outbreak cluster. Yes Yes
34 Yes assembling by SKESA cgMLST by RIDOM SeqSphere+QC: excellent98.8% good targets (only 29 missing)included in cluster analysis Yes Yes
80 Yes Our cluster threshold is <=10 allelic differences and genome number 4 is identical. Yes Yes
100 Yes Genome 4 has 0 AD from the representative isolate. Yes Yes 108 Yes This sample differs by 4 SNP against 9471, and is thereby part of the cluster. Yes Yes
123 Yes Genome 4 shows 99,5 %cgMLST Targets (good Quality), has the same ST and CT as the cluster isolates (21 and 3023, respectively), and only one allelic difference to the representative Isolat in the cluster 9120. This strain belongs to the cluster.
Yes Yes
124 Yes
Genome 4 has a genome size of 5.6 Mb and a high number of N bases, suggesting impurity or contamination of the DNA extract. After running KmerFinder, a query coverage of 77.28% and a template coverage of 93.85% was obtained, with EHEC O26:H11 as template. 2nd: a query coverage of 2.27% and a template coverage of 52.26% was obtained, with Shigella as template. The E.coli plugin tool in BioNumerics could not detect stx. Normally, this would have been performed via PCR before performing NGS. After running the cgMLST (Core Enterobase) analysis we observe that genome 4 has 0 AD with the cluster representative. With all this information we can presume that genome 4 is part of the cluster.
Yes Yes
127 Yes Genome 4 is genetically linked to the outbreak cluster. Based on the cgMLST analysis, the two allele difference between genome 4 and representative isolate of the outbreak cluster (9128) exists.
Yes Yes
133 Yes only 1 allele difference from representative strain 9 368. Yes Yes
134 Yes
The sequencing data are really good, 99% targets are found and the number of contigs correct (N = 784). The AD = 1 from the cluster but the isolate does not harbor verotoxin target (no vtx1a). In outbreak situation, this isolate would have been considered as part of the cluster as stx genes may be lost during infection or in vitro during culturing steps. In addition the eae and ehxA genes are detected in this strain.
Yes Yes
135 Yes Genome 4 meets all quality criteria.it is identical (0 alleles difference) to the representative isolate.further isolate information needed to determine if there is an epidemiological link to confirm this genetic link.
Yes Yes
136 Yes We define a cluster threshold of <=10 allelic differences and genome 4 is two allelic difference Yes Yes
137 No 594 SNPs distance indicating it is not part of the cluster as it is too distantly related. Yes No
139 Yes
Sequencing quality seems OK using Enterobase passing filters. This isolate has the same Hierarchical clustering 2 (HC2) as the 4 isolates of the cluster. That's why we could consider it is related to the cluster. This isolate has the eae, ehxA, katP, espP genes suggesting that it belongs to the EHEC family but it lacks STX genes. This could be explained either by an insufficient sequencing quality or by the fact that STX genes have been lost by the isolate.To check that, a culture of the isolate is necessary and a rapid check by qPCR could be performed to check the presence or absence of the stx genes. Depending on this result, a second run of NGS could be performed and will allow to confirm the belonging of this isolate to the cluster.
Yes Yes
222 Yes
2353/2360 loci of cgMLST scheme correctly mapped, satisfying our quality threshold set at 80% for reliability of cluster analysis. Moreover, the seven genes of conventional MLST (Warwick scheme) were all found 100% in length and with >=30 average depth of coverage. All quality criteria were satisfied for this sequence, which showed minimum 1 (from isolate 9729) and maximum 11 (from isolate 9990) allelic differences from all the isolates part of the detected cluster (four from 9 706 isolate used as cluster reference above and two from 9 914 isolate). We set the threshold for considering a cluster at <=15 allelic differences, so this genome is part of the cluster and could help solving the outbreak investigated.
Yes Yes
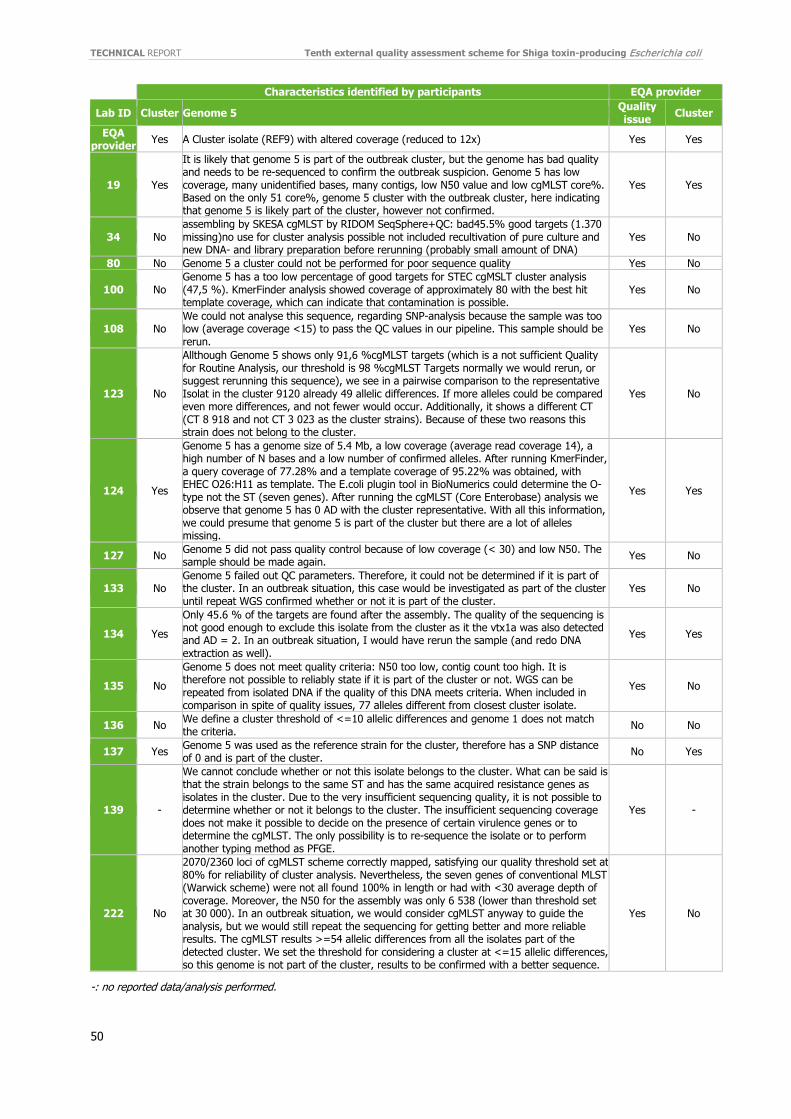
TECHNICAL REPORT Tenth external quality assessment scheme for Shiga toxin-producing Escherichia coli
50
Characteristics identified by participants EQA provider
Lab ID Cluster Genome 5 Quality issue Cluster
EQA provider Yes A Cluster isolate (REF9) with altered coverage (reduced to 12x) Yes Yes
19 Yes
It is likely that genome 5 is part of the outbreak cluster, but the genome has bad quality and needs to be re-sequenced to confirm the outbreak suspicion. Genome 5 has low coverage, many unidentified bases, many contigs, low N50 value and low cgMLST core%. Based on the only 51 core%, genome 5 cluster with the outbreak cluster, here indicating that genome 5 is likely part of the cluster, however not confirmed.
Yes Yes
34 No assembling by SKESA cgMLST by RIDOM SeqSphere+QC: bad45.5% good targets (1.370 missing)no use for cluster analysis possible not included recultivation of pure culture and new DNA- and library preparation before rerunning (probably small amount of DNA)
Yes No
80 No Genome 5 a cluster could not be performed for poor sequence quality Yes No
100 No Genome 5 has a too low percentage of good targets for STEC cgMSLT cluster analysis (47,5 %). KmerFinder analysis showed coverage of approximately 80 with the best hit template coverage, which can indicate that contamination is possible.
Yes No
108 No We could not analyse this sequence, regarding SNP-analysis because the sample was too low (average coverage <15) to pass the QC values in our pipeline. This sample should be rerun.
Yes No
123 No
Allthough Genome 5 shows only 91,6 %cgMLST targets (which is a not sufficient Quality for Routine Analysis, our threshold is 98 %cgMLST Targets normally we would rerun, or suggest rerunning this sequence), we see in a pairwise comparison to the representative Isolat in the cluster 9120 already 49 allelic differences. If more alleles could be compared even more differences, and not fewer would occur. Additionally, it shows a different CT (CT 8 918 and not CT 3 023 as the cluster strains). Because of these two reasons this strain does not belong to the cluster.
Yes No
124 Yes
Genome 5 has a genome size of 5.4 Mb, a low coverage (average read coverage 14), a high number of N bases and a low number of confirmed alleles. After running KmerFinder, a query coverage of 77.28% and a template coverage of 95.22% was obtained, with EHEC O26:H11 as template. The E.coli plugin tool in BioNumerics could determine the O-type not the ST (seven genes). After running the cgMLST (Core Enterobase) analysis we observe that genome 5 has 0 AD with the cluster representative. With all this information, we could presume that genome 5 is part of the cluster but there are a lot of alleles missing.
Yes Yes
127 No Genome 5 did not pass quality control because of low coverage (< 30) and low N50. The sample should be made again. Yes No
133 No Genome 5 failed out QC parameters. Therefore, it could not be determined if it is part of the cluster. In an outbreak situation, this case would be investigated as part of the cluster until repeat WGS confirmed whether or not it is part of the cluster.
Yes No
134 Yes Only 45.6 % of the targets are found after the assembly. The quality of the sequencing is not good enough to exclude this isolate from the cluster as it the vtx1a was also detected and AD = 2. In an outbreak situation, I would have rerun the sample (and redo DNA extraction as well).
Yes Yes
135 No Genome 5 does not meet quality criteria: N50 too low, contig count too high. It is therefore not possible to reliably state if it is part of the cluster or not. WGS can be repeated from isolated DNA if the quality of this DNA meets criteria. When included in comparison in spite of quality issues, 77 alleles different from closest cluster isolate.
Yes No
136 No We define a cluster threshold of <=10 allelic differences and genome 1 does not match the criteria. No No
137 Yes Genome 5 was used as the reference strain for the cluster, therefore has a SNP distance of 0 and is part of the cluster. No Yes
139 -
We cannot conclude whether or not this isolate belongs to the cluster. What can be said is that the strain belongs to the same ST and has the same acquired resistance genes as isolates in the cluster. Due to the very insufficient sequencing quality, it is not possible to determine whether or not it belongs to the cluster. The insufficient sequencing coverage does not make it possible to decide on the presence of certain virulence genes or to determine the cgMLST. The only possibility is to re-sequence the isolate or to perform another typing method as PFGE.
Yes -
222 No
2070/2360 loci of cgMLST scheme correctly mapped, satisfying our quality threshold set at 80% for reliability of cluster analysis. Nevertheless, the seven genes of conventional MLST (Warwick scheme) were not all found 100% in length or had with <30 average depth of coverage. Moreover, the N50 for the assembly was only 6 538 (lower than threshold set at 30 000). In an outbreak situation, we would consider cgMLST anyway to guide the analysis, but we would still repeat the sequencing for getting better and more reliable results. The cgMLST results >=54 allelic differences from all the isolates part of the detected cluster. We set the threshold for considering a cluster at <=15 allelic differences, so this genome is not part of the cluster, results to be confirmed with a better sequence.
Yes No
-: no reported data/analysis performed.
Tenth external quality assessment scheme for Shiga toxin-producing Escherichia coli TECHNICAL REPORT
51
Annex 14. Word format of the online form This is a preview of all the fields and questions available. Please keep in mind that, depending on your answers in the questionnaire, you will not necessarily have to answer all the questions (indicated by the ‘Go to’).
1. STEC EQA-10 2020 Dear Participant Welcome to the tenth External Quality Assessment (EQA-10) scheme for typing of STEC in 2019-2020. Please note that most of the fields are required to be filled in before the submission can be completed. Any comments can be written at the end of the form. You are always welcome to contact us at [email protected]. Please start by filling in your country, your Laboratory name and your LAB_ID. Available options in this submission form include: - Click ‘Options’ and ‘Pause’ to save your results and finish at a later time (using the same link) - Click ‘Options’ and ‘Print’ to print your answers. This can be done at any time, but before pressing ‘Submit results’ - Click ‘Previous’ to go back to the questions you have already answered Note: After pressing ‘Submit results’, you will not be able to review your results.
2. Country Austria Belgium Czechia Denmark Estonia Finland France Germany Greece Iceland Ireland Italy Latvia Lithuania Luxembourg Norway Poland Portugal North Macedonia Romania Scotland Slovenia Spain Sweden The Netherlands Turkey UK
TECHNICAL REPORT Tenth external quality assessment scheme for Shiga toxin-producing Escherichia coli
52
3. Institute name
4. Laboratory name
5. Laboratory ID Consisting of country code (two letters) Lab ID on the vial e.g. DK_SSI
6. E-mail
7. Serotyping and virulence gene determination of STEC 8. Submitting results (State one answer only) Submit serotyping/virulence gene determination results (please fill in the strain IDs in the next section) -
Go to 9 Did not participate in the serotyping nor virulence determination part(s) - Go to 21
9. Serotyping/virulence isolate IDs Please enter the strain ID (4 digits) We recommend to print this page out! To have the overview of isolate IDs and isolate No. 1-10, it will make the work easier. STEC Isolate 1 ___ Isolate 2 ___ Isolate 3 ___ Isolate 4 ___ Isolate 5 ___ Isolate 6 ___ Isolate 7 ___ Isolate 8 ___ Isolate 9 ___ Isolate 10 ___ 10. Submitting results - Serotyping (State one answer only) Both O group and H type - Go to 11 Only O Group - Go to 11 Only H type - Go to 13 Did not participate in serotyping - Go to 15 11. Results for serotyping (O Group) Please type the number of O Group by using (1-188) Non Typable: 7777, Rough: 8888, Not done: ND O Group Isolate 1 ___ Isolate 2 ___ Isolate 3 ___ Isolate 4 ___ Isolate 5 ___ Isolate 6 ___ Isolate 7 ___ Isolate 8 ___ Isolate 9 ___ Isolate 10 ___

Tenth external quality assessment scheme for Shiga toxin-producing Escherichia coli TECHNICAL REPORT
53
12. Please specify the method used: Phenotypic or molecular (PCR based, WGS based) (State only one answer per question) Method Phenotypic PCR based WGS based 13. Results for serotyping (H Type) Please type the number of H Type by using (1-56) H-: 6666, Non Typable: 7777, Not done: ND H type Isolate 1 ___ Isolate 2 ___ Isolate 3 ___ Isolate 4 ___ Isolate 5 ___ Isolate 6 ___ Isolate 7 ___ Isolate 8 ___ Isolate 9 ___ Isolate 10 ___ 14. Please specify the method used: Phenotypic or molecular (PCR based, WGS based) (State only one answer per question) Method Phenotypic PCR based WGS based 15. Submitting results - Virulence gene determination (State only one answer per question) Submit virulence gene determination data (eae, aaiC, aggR, stx1a, stx2 or subtyping Did not participate in the virulence gene determination (eae, aaiC, aggR, stx1a, stx2 or subtyping) - Go to
21 16. Please specify the method used for the virulence gene determination (incl. subtyping): (State only one answer per question) WGS Other 17. Results for virulence gene determination Please use 1 for detected and 0 for not detected, Not done: ND
eae aaiC aagR stx1 stx2 Isolate 1 ___ ___ ___ ___ ___ Isolate 2 ___ ___ ___ ___ ___ Isolate 3 ___ ___ ___ ___ ___ Isolate 4 ___ ___ ___ ___ ___ Isolate 5 ___ ___ ___ ___ ___ Isolate 6 ___ ___ ___ ___ ___ Isolate 7 ___ ___ ___ ___ ___ Isolate 8 ___ ___ ___ ___ ___ Isolate 9 ___ ___ ___ ___ ___

TECHNICAL REPORT Tenth external quality assessment scheme for Shiga toxin-producing Escherichia coli
54
Isolate 10 ___ ___ ___ ___ ___ 18. Submitting results – subtyping results (State one answer only) Submit subtyping data Did not participate in subtyping - Go to 21 19. Results for subtyping Subtyping of stx1, select variant (stx1a, stx1c, stx1d) All isolates have to be subtyped regardless of the results of the initial screening. ‘Not done/ND’ will by default be evaluated as an incorrect result. (State one answer only)
stx1a stx1c stx1d stx1a; stx1c
stx1a; stx1d
stx1c; stx1d Negative ND
Isolate 1
Isolate 2
Isolate 3
Isolate 4
Isolate 5
Isolate 6
Isolate 7
Isolate 8
Isolate 9
Isolate 10
20. Subtyping of stx2 select variant (stx2a, stxb, stx2c, stx2d, stx2e, stx2f, stx2g) All isolates have to be subtyped regardless of the results of the initial screening. ‘ND’ will by default be evaluated as an incorrect result. (State one answer only)
stx2a stx2b stx2c stx2d stx2e stx2f stx2g stx2a stx2b
stx2a stx2c
stx2a stx2d
stx2b; stx2c
stx2b stx2d
stx2c stx2d
stx2a stx2b stx2c
stx2a stx2c stx2d
stx2b stx2c stx2d
stx2a stx2b stx2cstx2d
Negative ND
Isolate 1
Isolate 2
Isolate 3
Isolate 4
Isolate 5
Isolate 6
Isolate 7
Isolate 8
Isolate 9
Isolate 10
Tenth external quality assessment scheme for Shiga toxin-producing Escherichia coli TECHNICAL REPORT
55
21. Submitting Cluster results (State one answer only)
Cluster analyses based on PFGE and/or WGS - Go to 22 Did not participate in the Cluster part - Go to 132
22. Cluster isolate IDs Please enter the cluster isolate ID (4 digits) We recommend to print this page out! To have the overview of isolate ID’s and isolate No. 1-10, it will make the work easier. Cluster strain ID Isolate 1 ___ Isolate 2 ___ Isolate 3 ___ Isolate 4 ___ Isolate 5 ___ Isolate 6 ___ Isolate 7 ___ Isolate 8 ___ Isolate 9 ___ Isolate 10 ___
23. Submitting Cluster analysis results (State one answer only)
Cluster analysis based on PFGE - Go to 24 Do not wish to submit any cluster results based on PFGE analysis - Go to 29
24. Cluster analysis based on PFGE data 25. Please list the ID for the isolate included in the cluster of closely related isolates detected by PFGE results (bands >33 kb): Please use semicolon (;) to separate the ID´s
26. Select a representative isolate with the cluster profile detected by PFGE: Indicate the isolate ID
27. xbaI - Total number of bands (>33kb) in the selected representative cluster isolate
28. Results for cluster analysis - PFGE (xbaI) Please use ND for not analysed
xbaI - Total number of bands (>33kb) xbaI - Number of bands with same/shared position as the profile of the selected cluster isolate (>33kb)
Isolate 1 ________________________________ __________________________________________ Isolate 2 ________________________________ __________________________________________ Isolate 3 ________________________________ __________________________________________ Isolate 4 ________________________________ __________________________________________ Isolate 5 ________________________________ __________________________________________ Isolate 6 ________________________________ __________________________________________ Isolate 7 ________________________________ __________________________________________ Isolate 8 ________________________________ __________________________________________ Isolate 9 ________________________________ __________________________________________ Isolate 10 ________________________________ __________________________________________
TECHNICAL REPORT Tenth external quality assessment scheme for Shiga toxin-producing Escherichia coli
56
29. Submitting Cluster results (State one answer only) Cluster analysis based on WGS data - Go to 30 Do not wish to submit any cluster results based on WGS data - Go to 132
30. Cluster analysis based on WGS data 31. Please select the analysis used to detect the cluster on data derived from WGS As basis for the cluster detection only one data analysis can be reported. If more than one analysis is performed please report later in this submission (State one answer only) SNP based - Go to 33 Allele based - Go to 40 Other - Go to 32
32. If another analysis is used please describe your approach: - Go to 47
33. Please report the used SNP-pipeline Reference if publicly available or in-house pipeline
34. Please select the approach used for the SNP analysis (State one answer only) Reference based - Go to 35 Assembly based - Go to 38
35. Reference genome used Please indicate Multi-locus Sequence Type (e.g. ST11) and isolate ID (e.g. one of the isolate from the current cluster, ID of a public reference isolate or an in-house isolate)
36. Please indicate the read mapper used (e.g. BWA, Bowtie2)
37. Please indicate the variant caller used (e.g. SAMtools, GATK)
38. Please indicate the assembler used (e.g. SPAdes, Velvet)
39. Please specify the variant caller used (e.g. NUCMER)
40. Please select tools used for the allele analysis (State one answer only) BioNumerics - Go to 42 SeqPhere - Go to 42 Enterobase - Go to 42 Other - Go to 41
41. If another tool is used please enter here:
Tenth external quality assessment scheme for Shiga toxin-producing Escherichia coli TECHNICAL REPORT
57
42. Please indicate allele calling method: (State one answer only) Assembly-based and mapping-based - Go to 43 Only assembly based - Go to 43 Only mapping based - Go to 44
43. Please indicate the assembler used (e.g. SPAdes, Velvet)
44. Please select scheme used for the allele analysis (State one answer only) Applied Math (wgMLST) - Go to 46 Applied Math (cgMLST/Enterobase) - Go to 46 Enterobase (cgMLST) - Go to 46 Other - Go to 45
45. If another scheme (e.g. in-house) is used, please give a short description
46. Please report the number of loci in the used allelic scheme
47. Cluster detected by analysis on data derived from WGS On this page you have to report the results for the cluster detected by the selected analysis (e.g. SNP based). If another additional analysis (e.g. allele based or another SNP-based analysis) is performed please report results later, but you will not be asked to submit the IDs for isolates in the cluster detected with the additional analysis.
48. Please list the IDs for the isolates included in the cluster Please use semicolon (;) to separate the isolate ID´s
49. Select a representative isolate in the cluster Indicate the isolate ID
50. Results for cluster analysis (e.g. SNP- or Allele-based) Please use ND for not analysed
7-Multi-locus Sequence Type (ST) Distance/Difference (e.g. SNP or AD) to the selected cluster isolate
Isolate 1 ________________________________ __________________________________________ Isolate 2 ________________________________ __________________________________________ Isolate 3 ________________________________ __________________________________________ Isolate 4 ________________________________ __________________________________________ Isolate 5 ________________________________ __________________________________________ Isolate 6 ________________________________ __________________________________________ Isolate 7 ________________________________ __________________________________________ Isolate 8 ________________________________ __________________________________________ Isolate 9 ________________________________ __________________________________________ Isolate 10 ________________________________ __________________________________________
51. Analysis of the EQA provided genomes The five genomes uploaded by the EQA provider should be included in the analysis and evaluated. Please evaluate this part as a simulation, mimicking a large outbreak situation in your country. These genomes (1-5) are very important because they might solve the outbreak. Each of the provided genomes should be assessed whether it could be a part of the cluster defined in first part.

TECHNICAL REPORT Tenth external quality assessment scheme for Shiga toxin-producing Escherichia coli
58
Explain your assessment of each genome in details, please not just suggesting rerunning the sequence, but explain what you observe and what you would suggest as the conclusion.
This part is not evaluated with a final score in the evaluation report, however the EQA provider list the characteristics of the isolates.
52. In an outbreak situation, would you consider the EQA provided genome 1 a part of the cluster of closely related isolates? (State one answer only)
Yes, genome 1 is a part of the cluster No, genome 1 is NOT a part of the cluster
53. Explain your assessment of genome 1 in details Please not just suggest rerunning, but explain what you observe and what you would propose as the conclusion. 54. In an outbreak situation, would you consider the EQA provided genome 2 a part of the cluster of closely related isolates? (State one answer only)
Yes, genome 2 is a part of the cluster No, genome 2 is NOT a part of the cluster
55. Explain your assessment of genome 2 in details Please not just suggest rerunning, but explain what you observe and what you would propose as the conclusion. 56. In an outbreak situation, would you consider the EQA provided genome 3 a part of the cluster of closely related isolates? (State one answer only)
Yes, genome 3 is a part of the cluster No, genome 3 is NOT a part of the cluster
57. Explain your assessment of genome 3 in details Please not just suggest rerunning, but explain what you observe and what you would propose as the conclusion. 58. In an outbreak situation, would you consider the EQA provided genome 4 a part of the cluster of closely related isolates? (State one answer only)
Yes, genome 4 is a part of the cluster No, genome 4 is NOT a part of the cluster
59. Explain your assessment of genome 4 in details Please not just suggest rerunning, but explain what you observe and what you would propose as the conclusion. 60. In an outbreak situation, would you consider the EQA provided genome 5 a part of the cluster of closely related isolates? (State one answer only)
Yes, genome 5 is a part of the cluster No, genome 5 is NOT a part of the cluster

Tenth external quality assessment scheme for Shiga toxin-producing Escherichia coli TECHNICAL REPORT
59
61. Explain your assessment of genome 5 in details Please not just suggest rerunning, but explain what you observe and what you would propose as the conclusion.
62. Would you like to add results performed with another additional analysis on the data derived from the WGS? e.g. if SNP-based results are submitted you can also report allele-based results or results from an additional SNP analysis (State one answer only) Yes - Go to 63 No - Go to 102
63. Please select the additional analysis used on data derived from WGS (State one answer only) SNP-based - Go to 65 Allele-based - Go to 72 Other - Go to 64
64. If another analysis is used please describe your approach - Go to 79
65. Please report the used SNP-pipeline Reference if publicly available or in-house pipeline
66. Please select the approach used for the SNP analysis (State one answer only) Reference-based - Go to 67 Assembly-based - Go to 70
67. Reference genome used Please indicate Multi-locus Sequence Type (e.g. ST8) and isolate ID (e.g. one of the isolate from the current cluster, ID of a public reference isolate or an in-house isolate)
68. Please indicate the read mapper used (e.g. BWA, Bowtie2)
69. Please indicate the variant caller used (e.g. SAMtools, GATK)
70. Please indicate the assembler used (e.g. SPAdes, Velvet)
71. Please specify the variant caller used (e.g. NUCMER)
72. Please select tool used for the allele analysis (State one answer only) BioNumerics - Go to 74 SeqPhere - Go to 74 Enterobase - Go to 74
TECHNICAL REPORT Tenth external quality assessment scheme for Shiga toxin-producing Escherichia coli
60
Other - Go to 73
73. If another tool is used please list here:
74. Please indicate allele calling method (State one answer only) Assembly-based and mapping-based - Go to 75 Only assembly-based - Go to 75 Only mapping-based - Go to 76
75. Please indicate the assembler used (e.g. SPAdes, Velvet)
76. Please select scheme used for the allele analysis (State one answer only) Applied Math (wgMLST) - Go to 78 Applied Math (cgMLST/Enterobase) - Go to 78 Enterobase (cgMLST) - Go to 78 Other - Go to 77
77. If another scheme (e.g. in-house) is used, please give a short description
78. Please report the number of loci in the used allelic scheme
79. Additional analysis on data derived from WGS
80. Select a representative isolate in the cluster detected by the additional analysis Indicate the isolate ID
81. Results for the additional cluster analysis (e.g. SNP- or Allele- based) Please use ND for not analysed
7-Multi-locus Sequence Type (ST) Distance (e.g. SNP) to selected cluster isolate Isolate 1 ________________________________ __________________________________________ Isolate 2 ________________________________ __________________________________________ Isolate 3 ________________________________ __________________________________________ Isolate 4 ________________________________ __________________________________________ Isolate 5 ________________________________ __________________________________________ Isolate 6 ________________________________ __________________________________________ Isolate 7 ________________________________ __________________________________________ Isolate 8 ________________________________ __________________________________________ Isolate 9 ________________________________ __________________________________________ Isolate 10 ________________________________ __________________________________________
82. Would you like to add results performed with a third analysis on the data derived from the WGS? e.g. if SNP-based results are submitted you can also report allele-based results or results from an additional SNP analysis (State one answer only)
Tenth external quality assessment scheme for Shiga toxin-producing Escherichia coli TECHNICAL REPORT
61
Yes - Go to 83 No - Go to 102
83. Please select the third analysis used on data derived from WGS (State one answer only) SNP-based - Go to 85 Allele-based - Go to 92 Other - Go to 84
84. If another analysis is used please describe your approach: - Go to 99
85. Please report the used SNP-pipeline Reference if publicly available or in-house pipeline
86. Please select the approach used for the SNP analysis (State one answer only) Reference-based - Go to 87 Assembly-based - Go to 90
87. Reference genome used Please indicate Multi-locus Sequence Type (e.g. ST8) and isolate ID (e.g. one of the isolate from the current cluster, ID of a public reference isolate or an in-house isolate)
88. Please indicate the read mapper used (e.g. BWA, Bowtie2)
89. Please indicate the variant caller used (e.g. SAMtools, GATK)
90. Please indicate the assembler used (e.g. SPAdes, Velvet)
91. Please specify the variant caller used (e.g. NUCMER)
92. Please select tool used for the allele analysis (State one answer only) BioNumerics - Go to 94 SeqPhere - Go to 94 Enterobase - Go to 94 Other - Go to 93
93. If another tool is used please enter here:
94. Please indicate allele calling method: (State one answer only) Assembly-based and mapping-based - Go to 95 Only assembly-based - Go to 95 Only mapping-based - Go to 96

TECHNICAL REPORT Tenth external quality assessment scheme for Shiga toxin-producing Escherichia coli
62
95. Please indicate the assembler used (e.g. SPAdes, Velvet)
96. Please select scheme used for the allele analysis (State one answer only) Applied Math (wgMLST) - Go to 98 Applied Math (cgMLST/Enterobase) - Go to 98 Enterobase (cgMLST) - Go to 98 Other - Go to 97
97. If another scheme (e.g. in-house) is used, please give a short description
98. Please report the number of loci in the used allelic scheme
99. Third analysis on data derived from WGS 100. Select a representative isolate in the cluster detected by the third analysis Indicate the isolate ID
101. Results for the third cluster analysis (e.g. SNP- or Allele-based) Please use ND for not analysed
7-Multi-locus Sequence Type (ST) Distance (e.g. SNP) to selected cluster isolate Isolate 1 ________________________________ __________________________________________ Isolate 2 ________________________________ __________________________________________ Isolate 3 ________________________________ __________________________________________ Isolate 4 ________________________________ __________________________________________ Isolate 5 ________________________________ __________________________________________ Isolate 6 ________________________________ __________________________________________ Isolate 7 ________________________________ __________________________________________ Isolate 8 ________________________________ __________________________________________ Isolate 9 ________________________________ __________________________________________ Isolate 10 ________________________________ __________________________________________
102. Additional questions to the WGS part 103 Where was the sequencing performed (State one answer only) In own laboratory Externally
104. Protocol used to prepare the library for sequencing: (State one answer only) Commercial kits - Go to 105 Non-commercial kits - Go to 107
105. Please indicate name of commercial kit:
106. If relevant please list deviation from commercial kit shortly in few bullets: - Go to 108

Tenth external quality assessment scheme for Shiga toxin-producing Escherichia coli TECHNICAL REPORT
63
107. For non-commercial kit please indicate a short summary of the protocol:
108. The sequencing platform used (State one answer only) Ion Torrent PGM - Go to 110 Ion Torrent Proton - Go to 110 Genome Sequencer Junior System (454) - Go to 110 Genome Sequencer FLX System (454) - Go to 110 Genome Sequencer FLX+ System (454) - Go to 110 PacBio RS - Go to 110 PacBio RS II - Go to 110 HiScanSQ - Go to 110 HiSeq 1000 - Go to 110 HiSeq 1500 - Go to 110 HiSeq 2000 - Go to 110 HiSeq 2500 - Go to 110 HiSeq 4000 - Go to 110 Genome Analyzer lix - Go to 110 MiSeq - Go to 110 MiSeq Dx - Go to 110 MiSeq FGx - Go to 110 ABI SOLiD - Go to 110 NextSeq - Go to 110 MinION (ONT) - Go to 110 Other - Go to 109
109. If another platform is used please list here: 110. Criteria used to evaluate the quality of sequence data In this section you can report criteria used to evaluate the quality of sequence data. Please first reply on the use of five EQA- provider selected criteria. Next you will be asked to report 1-5 additional criteria of your own choice. For each criteria please also report the threshold or procedure used to evaluate the current criteria.
111. Did you use confirmation of organism to evaluate the quality of sequence data? Yes No - Go to 115
112. Procedure used to evaluate confirmation of organism: 113. Did you use coverage to evaluate the quality of sequence data? (State one answer only) Yes No - Go to 115
114. Procedure or threshold used for coverage:
TECHNICAL REPORT Tenth external quality assessment scheme for Shiga toxin-producing Escherichia coli
64
115. Did you evaluate assembly quality? (State one answer only) Yes No - Go to 117
116. Procedure used to evaluate assembly quality:
117. Did you use assembly length to evaluate the quality of sequence data? (State one answer only) Yes No - Go to 119
118. Procedure or threshold used for assembly length:
119. Did you evaluate allele calling result? (State one answer only) Yes No - Go to 121
120. Procedure used to evaluate allele calling:
121. Other criteria used to evaluate the quality of sequence data Please list up to 5 additional criteria (e.g. N50, read length, contamination)
122. Other criteria used to evaluate the quality of sequence data – additional criteria 1
123. Threshold or procedure used to evaluate the additional criteria 1:
124. Other criteria used to evaluate the quality of sequence data – additional criteria 2:
125. Threshold or procedure used to evaluate the additional criteria 2:
126. Other criteria used to evaluate the quality of sequence data – additional criteria 3:
127. Threshold or procedure used to evaluate the additional criteria 3:
128. Other criteria used to evaluate the quality of sequence data – additional criteria 4: 129. Threshold or procedure used to evaluate the additional criteria 4:

Tenth external quality assessment scheme for Shiga toxin-producing Escherichia coli TECHNICAL REPORT
65
130. Other criteria used to evaluate the quality of sequence data – additional criteria 5: 131. Threshold or procedure used to evaluate the additional criteria 5:
132. Comment(s): e.g. remarks to the submission, the data analyses or the laboratory methods
133. Thank you for your participation Thank you for your submission of STEC EQA-10 results. For questions, please contact [email protected] or phone +45 3268 8341. We highly recommend to document this Submission form by printing it. You will find the Print option after pressing the ‘Options’ button. Important: After pressing ‘Submit results’ you will no longer be able to edit or print your information. For final submission, remember to press ‘Submit results’ after printing. REMEMBER to upload your raw reads to the ftp-site.

European Centre for Disease Prevention and Control (ECDC)
Gustav III:s Boulevard 40, 16973 Solna, Sweden
Tel. +46 858601000Fax +46 858601001www.ecdc.europa.eu
An agency of the European Unionwww.europa.eu
Subscribe to our publications www.ecdc.europa.eu/en/publications
Contact us [email protected]
Follow us on Twitter @ECDC_EU
Like our Facebook page www.facebook.com/ECDC.EU
ECDC is committed to ensuring the transparency and independence of its work
In accordance with the Staff Regulations for Officials and Conditions of Employment of Other Servants of the European Union and the ECDC Independence Policy, ECDC staff members shall not, in the performance of their duties, deal with matters in which they may, directly or indirectly, have a personal interest that could impair their independence. Declarations of interest must be received from any prospective contractor before a contract can be awarded. www.ecdc.europa.eu/en/aboutus/transparency