Proceedings of the Tenth Workshop on Innovative Use of NLP ...
282
NAACL HLT 2015 The Tenth Workshop on Innovative Use of NLP for Building Educational Applications Proceedings of the Workshop June 4, 2015 Denver, Colorado, USA
-
Upload
khangminh22 -
Category
Documents
-
view
1 -
download
0
Transcript of Proceedings of the Tenth Workshop on Innovative Use of NLP ...
NAACL HLT 2015
The Tenth Workshop onInnovative Use of NLP for
Building Educational Applications
Proceedings of the Workshop
June 4, 2015Denver, Colorado, USA

Gold Sponsors
Silver Sponsor
ii

c©2015 The Association for Computational Linguistics
Order print-on-demand copies from:
Curran Associates57 Morehouse LaneRed Hook, New York 12571USATel: +1-845-758-0400Fax: [email protected]
ISBN 978-1-941643-35-8
iii
Introduction
We are excited to be holding the 10th anniversary the BEA workshop. Since starting in 1997, the BEAworkshop, now one of the largest workshops at NAACL/ACL, has become one of the leading venues forpublishing innovative work that uses NLP to develop educational applications. The consistent interestin and growth of the workshop has clear ties to societal need and related advances in the technology, andthe maturity of the NLP/education field. NLP capabilities now support an array of learning domains,including writing, speaking, reading, and mathematics. Within these domains, the community continuesto develop and deploy innovative NLP approaches for use in educational settings. In the writing andspeech domains, automated writing evaluation (AWE) and speech scoring applications, respectively, arecommercially deployed in high-stakes assessment and instructional settings, including Massive OpenOnline Courses (MOOCs). We also see widely-used commercial applications for plagiarism detectionand peer review. Major advances in speech technology, have made it possible to include speech in bothassessment and Intelligent Tutoring Systems. There has been a renewed interest in spoken dialog andmulti-modal systems for instruction and assessment as well as feedback. We are also seeing explosivegrowth of mobile applications for game-based applications for instruction and assessment. The currenteducational and assessment landscape, continues to foster a strong interest and high demand that pushesthe state-of-the-art in AWE capabilities to expand the analysis of written responses to writing genresother than those traditionally found in standardized assessments, especially writing tasks requiring useof sources and argumentative discourse.
The use of NLP in educational applications has gained visibility outside of the NLP community. First,the Hewlett Foundation reached out to public and private sectors and sponsored two competitions: onefor automated essay scoring, and the other for scoring of short answer, fact-based response items. Themotivation driving these competitions was to engage the larger scientific community in this enterprise.MOOCs are now beginning to incorporate AWE systems to manage the thousands of constructed-response assignments collected during a single MOOC course. Learning@Scale is a recent venue fordiscussing NLP research in education. The NLP-TEA workshop, now in its second year (NLP-TEA2),gives special attention to papers working on Asian languages. The Speech and Language Technologyin Education (SLaTE), now in its sixth year, promotes the use of speech and language technology foreducational purposes. Another breakthrough for educational applications within the CL community isthe presence of a number of shared-task competitions over the last three years. There have been threeshared tasks on grammatical error correction with the most recent edition hosted at CoNLL 2014. In2014 alone, there were four shared tasks for NLP and Education-related areas.
As a community, we continue to improve existing capabilities and to identify and generate innovativeways to use NLP in applications for writing, reading, speaking, critical thinking, curriculumdevelopment, and assessment. Steady growth in the development of NLP-based applications foreducation has prompted an increased number of workshops, typically focusing on one specific subfield.In this volume, we present papers from these subfields: tools for automated scoring of text and speech,automated test-item generation, dialogue and intelligent tutoring, evaluation of genres beyond essays,feedback studies, grammatical error detection, native language identification, and use of corpora. Oneof the oral presentations proposes a Shared Task that addresses the task of automated evaluation ofscientific writing. This presentation will also be presented as a poster to allow greater opportunity fordiscussion beyond the main conference day.
iv
We received 44 submissions and accepted 10 papers as oral presentations and 19 as poster presentationand/or demos. Each paper was reviewed by three members of the Program Committee who werebelieved to be most appropriate for each paper. We continue to have a very strong policy to deal withconflicts of interest. First, we made a concerted effort to not assign papers to reviewers if the paper hadan author from their institution. Second, with respect to the organizing committee, authors of papersfor which there was a conflict of interest recused themselves from the discussion and decision making.
This workshop offers an opportunity to present and publish work that is highly relevant to ACL, butis also highly specialized, and so this workshop is often a more appropriate venue for such work. ThePoster session offers more breadth in terms of topics related to NLP and education, and maintains theoriginal concept of a workshop. We continue to believe that the workshop framework designed tointroduce work in progress and new ideas needs to be revived, and we hope that we have achieved thiswith the breadth and variety of research accepted for this workshop. The total number of acceptancesrepresents a 66% acceptance rate across oral (23%) and poster presentations (43%).
While the field is growing, we do recognize that there is a core group of institutions and researcherswho work in this area. With a higher acceptance rate, we were able to include papers from a widervariety of topics and institutions. The papers accepted to this workshop were selected on the basis ofseveral factors, including the relevance to a core educational problem space, the novelty of the approachor domain, and the strength of the research.
The accepted papers were highly diverse, falling into the following themes:
Speech-based and dialogue applications: Loukina et al. compare several methods of feature selectionfor speech scoring systems and show that the use of shrinkage methods such as Lasso regression makesit possible to rapidly build models that both satisfy the requirements of validity and intepretability;Volodina and Pijetlovic present the development and the initial evaluation of a dictation and spellingprototype exercise for second language learners of Swedish based on text-to-speech technology in aCALL context.; Somasundaran et al. investigate linguistically-motivated features for automaticallyscoring a spoken picture-based narration task by building scoring models with features for storydevelopment, language use and task relevance of the response; Jaffe et al. present a log-linear rankingmodel for interpreting questions in a virtual patient dialogue system.
Automated writing evaluation: Rahimi et al. present an investigation of score prediction for the“organization” dimension of an assessment of analytical writing for writers in the lower grades;Napoles and Callison-Burch explore applications of automatic essay scoring applied to a corpus ofessays written by college freshmen and discuss the challenges related to evaluation of essays thatdo not have a highly-constrained structure; Zesch et al. analyze the potential of recently proposedmethods for semi-supervised learning based on clustering for short-answer scoring; Ramachandran etal. present a new approach that uses word-order graphs to identify important patterns from scoringrubrics and top-scoring student answers; Farra and Somasundaran investigate whether the analysisof opinion expressions can help in scoring persuasive essays, and predict holistic essay scores usingfeatures extracted from opinion expressions and topical elements; Zesch et al. investigate task-independent features for automated essay scoring and evaluate their transferability on English andGerman datasets; Ramachandran et al. use an extractive summarization tool called MEAD to extracta set of responses that may be used as alternative reference texts to score responses; Mathew et al.identified computational challenges in restructuring encyclopedic resources (like Wikipedia or thesauri)
v

to reorder concepts with the goal of helping learners navigate through a concept network; Goutte etal. extract, from the text of the test items, keywords that are most relevant knowledge components,and using a small dataset from the PSLC datashop, they show that this is surprisingly effective;Yannakoudakis and Cummins perform a systematic study to compare the efficacy of different automatedtext scoring metrics under different experimental conditions; Chen et al. introduce a novel frameworkbased on a probabilistic model for emotion wording assistance; Madnani et al. conduct a crowd-sourcedstudy on Amazon Mechanical Turk to answer questions concerning the effects of type and amount ofwriting feedback; Wilson and Martin conduct a quasi-experimental study comparing the effects of afeedback condition on eighth-grade students’ writing motivation and writing achievement.
Test-item generation: Beinborn et al. describe a generalized framework for test difficulty predictionthat is applicable to several languages and test types., and develop two ranking strategies for candidateevaluation inspired by automatic solving methods based on language model probability and semanticrelatedness; Niraula and Rus discuss a study that uses active learning for training classifiers to judgethe quality of gap-fill questions; Kumar et al. describe RevUP , a system that deals with automaticallygenerating gap-fill questions.
Error detection: Ledbetter and Dickinson describe a morphological analyzer for learner Hungarian,built upon limited grammatical knowledge of Hungarian requiring very few resources and flexibleenough to do both morphological analysis and error detection, in addition to some unknown wordhandling; Kochmar and Briscoe present a novel approach to error correction in content words in learnerwriting focusing on adjective–noun (AN) combinations.
Use of corpora and annotation: Willis discusses the Amati system which aims to help human markersimprove the speed and accuracy of their marking for short-answer question types; Wang et al. presentthe Jinan Chinese Learner Corpus, a large collection of L2 Chinese texts produced by learners that canbe used for educational tasks, such as automated essay scoring.
Native language identification: Malmasi and Cahill propose a function to measure feature independencefor an NLI system, and analyze its effectiveness on a standard NLI corpus; Malmasi et al. examinedifferent ensemble methods, including an oracle, to estimate the upper limit of classification accuracyfor NLI, and show that the oracle outperforms state-of-the-art systems, and present a pilot study ofhuman performance for NLI, the first such experiment.
A shared task proposal (Daudaravicius) discusses a shared task for evaluating scientific writing, anddescribes the corpus and evaluation metrics associated with this task.
We wish to thank everyone who submitted a paper, all of the authors for their contributions, themembers of the Program Committee for their thoughtful reviews, and everyone who attended thisworkshop. We would especially like to thank our sponsors: American Institutes for Research, Appen,Educational Testing Service, Grammarly, McGraw-Hill Education/CTB, Pacific Metrics, Pearson andTurnitin LightSide, whose contributions allowed us to subsidize students at the workshop dinner, andmake workshop T-shirts! In addition, we thank Joya Tetreault for creating the T-shirt design.
Joel Tetreault, Yahoo LabsJill Burstein, Educational Testing ServiceClaudia Leacock, McGraw-Hill Education/CTB
vi
Organizers:
Joel Tetreault, Yahoo LabsJill Burstein, Educational Testing ServiceClaudia Leacock, McGraw-Hill Education/CTB
Program Committee:
Lars Ahrenberg, Linköping University, SwedenLaura Allen, Arizona State University, USATimo Baumann, Universität Hamburg, GermanyLee Becker, Hapara, USABeata Beigman Klebanov, Educational Testing Service, USADelphine Bernhard, LiLPa, Université de Strasbourg, FranceSuma Bhat, University of Illinois, USAKristy Boyer, North Carolina State University, USAChris Brew, Thomson-Reuters Research, UKTed Briscoe, University of Cambridge, UKChris Brockett, Microsoft Research, USAJulian Brooke, University of Toronto, CanadaAoife Cahill, Educational Testing Service, USAMin Chi, North Carolina State University, USAMartin Chodorow, Hunter College and the Graduate Center, CUNY, USAMark Core, University of Southern California, USAMarkus Dickinson, Indiana University, USAMyroslava Dzikovska, University of Edinburgh, UKKeelan Evanini, Educational Testing Service, USAMariano Felice, University of Cambridge, UKMichael Flor, Educational Testing Service, USAJennifer Foster, Dublin City University, IrelandThomas François, Université Catholique de Louvain, BelgiumAnette Frank, Heidelberg University, GermanyMichael Gamon, Microsoft Research, USABinyam Gebrekidan Gebre, Max Planck Institute for Psycholinguistics, NetherlandsKallirroi Georgila, University of Southern California, USADan Goldwasser, Purdue University, USACyril Goutte, National Research Council, CanadaIryna Gurevych, University of Darmstadt, GermanyTrude Heift, Simon Fraser University, CanadaMichael Heilman, Civis Analytics, USADerrick Higgins, Civis Analytics, USAAndrea Horbach, Saarland University, GermanyChung-Chi Huang, National Institutes of Health, USA
vii

Radu Ionescu, University of Bucharest, RomaniaRoss Israel, Factual, USALevi King, Indiana University, USAOla Knutsson, Stockholm University, SwedenEkaterina Kochmar, University of Cambridge, UKMamoru Komachi, Tokyo Metropolitan University, JapanLun-Wei Ku, Academia Sinica, TaiwanJohn Lee, City University of Hong Kong, Hong KongSungjin Lee, Yahoo Labs, USASamuel Leeman-Munk, North Carolina State University, USAChee Wee (Ben) Leong, Educational Testing Service, USAJames Lester, North Carolina State University, USAAnnie Louis, University of Edinburgh, UKAnastassia Loukina, Educational Testing Service, USAXiaofei Lu, Penn State University, USAWencan Luo, University of Pittsburgh, USANitin Madnani, Educational Testing Service, USAShervin Malmasi, Macquarie University, AustraliaMontse Maritxalar, University of the Basque Country, SpainMourad Mars, Umm Al-Qura University, KSAAurélien Max, LIMSI-CNRS and Univ. Paris Sud, FranceJulie Medero, Harvey Mudd College, USADetmar Meurers, Universität Tübingen, GermanyLisa Michaud, Merrimack College, USARada Mihalcea, University of Michigan, USAMichael Mohler, Language Computer Corporation, USAJack Mostow, Carnegie Mellon University, USASmaranda Muresan, Columbia University, USAAni Nenkova, University of Pennsylvania, USAHwee Tou Ng, National University of Singapore, SingaporeRodney Nielsen, University of North Texas, USAAlexis Palmer, Saarland University, GermanyAasish Pappu, Yahoo Labs, USATed Pedersen, University of Minnesota, Duluth, USAIldiko Pilan, University of Gothenburg, SwedenHeather Pon-Barry, Mount Holyoke College, USAPatti Price, PPRICE Speech and Language Technology, USAMartí Quixal, Universität Tübingen, GermanyLakshmi Ramachandran, Pearson, USAVikram Ramanarayanan, Educational Testing Service, USAArti Ramesh, University of Maryland, College Park, USAAndrew Rosenberg, CUNY Queens College, USAMihai Rotaru, Textkernel, NetherlandsAlla Rozovskaya, Columbia University, USAC. Anton Rytting, University of Maryland, USAKeisuke Sakaguchi, Johns Hopkins University, USA
viii
Elizabeth Salesky, MITLL, USAMathias Schulze, University of Waterloo, USASerge Sharoff, University of Leeds, UKSwapna Somasundaran, Educational Testing Service, USARichard Sproat, Google, USAHelmer Strik, Radboud University Nijmegen, NetherlandsDavid Suendermann-Oeft, Educational Testing Service, USASowmya Vajjala, Universität Tübingen, GermanyCarl Vogel, Trinity College, IrelandElena Volodina, University of Gothenburg, SwedenXinhao Wang, Educational Testing Service, USADenise Whitelock, The Open University, UKMagdalena Wolska, Eberhard Karls Universität Tübingen, GermanyPeter Wood, University of Saskatchewan, CanadaHuichao Xue, University of Pittsburgh, USAMarcos Zampieri, Saarland University, GermanyKlaus Zechner, Educational Testing Service, USATorsten Zesch, University of Duisburg-Essen, GermanyFan Zhang, University of Pittsburgh, USAXiaodan Zhu, National Research Council, Canada
ix

Table of Contents
Candidate evaluation strategies for improved difficulty prediction of language testsLisa Beinborn, Torsten Zesch and Iryna Gurevych . . . . . . . . . . . . . . . . . . . . . . . . . . . . . . . . . . . . . . . . . 1
Feature selection for automated speech scoringAnastassia Loukina, Klaus Zechner, Lei Chen and Michael Heilman . . . . . . . . . . . . . . . . . . . . . . . . 12
Incorporating Coherence of Topics as a Criterion in Automatic Response-to-Text Assessment of theOrganization of Writing
Zahra Rahimi, Diane Litman, Elaine Wang and Richard Correnti . . . . . . . . . . . . . . . . . . . . . . . . . . . 20
Automatic morphological analysis of learner HungarianScott Ledbetter and Markus Dickinson . . . . . . . . . . . . . . . . . . . . . . . . . . . . . . . . . . . . . . . . . . . . . . . . . . . 31
Automated Scoring of Picture-based Story NarrationSwapna Somasundaran, Chong Min Lee, Martin Chodorow and Xinhao Wang . . . . . . . . . . . . . . . 42
Measuring Feature Diversity in Native Language IdentificationShervin Malmasi and Aoife Cahill . . . . . . . . . . . . . . . . . . . . . . . . . . . . . . . . . . . . . . . . . . . . . . . . . . . . . . .49
Automated Evaluation of Scientific Writing: AESW Shared Task ProposalVidas Daudaravicius . . . . . . . . . . . . . . . . . . . . . . . . . . . . . . . . . . . . . . . . . . . . . . . . . . . . . . . . . . . . . . . . . . . 56
Scoring Persuasive Essays Using Opinions and their TargetsNoura Farra, Swapna Somasundaran and Jill Burstein . . . . . . . . . . . . . . . . . . . . . . . . . . . . . . . . . . . . . 64
Towards Automatic Description of Knowledge ComponentsCyril Goutte, Guillaume Durand and Serge Leger . . . . . . . . . . . . . . . . . . . . . . . . . . . . . . . . . . . . . . . . . 75
The Impact of Training Data on Automated Short Answer Scoring PerformanceMichael Heilman and Nitin Madnani . . . . . . . . . . . . . . . . . . . . . . . . . . . . . . . . . . . . . . . . . . . . . . . . . . . . 81
Interpreting Questions with a Log-Linear Ranking Model in a Virtual Patient Dialogue SystemEvan Jaffe, Michael White, William Schuler, Eric Fosler-Lussier, Alex Rosenfeld and Douglas
Danforth . . . . . . . . . . . . . . . . . . . . . . . . . . . . . . . . . . . . . . . . . . . . . . . . . . . . . . . . . . . . . . . . . . . . . . . . . . . . . . . . . . 86
Identifying Patterns For Short Answer Scoring Using Graph-based Lexico-Semantic Text MatchingLakshmi Ramachandran, Jian Cheng and Peter Foltz . . . . . . . . . . . . . . . . . . . . . . . . . . . . . . . . . . . . . . 97
Lark Trills for Language Drills: Text-to-speech technology for language learnersElena Volodina and Dijana Pijetlovic . . . . . . . . . . . . . . . . . . . . . . . . . . . . . . . . . . . . . . . . . . . . . . . . . . . 107
The Jinan Chinese Learner CorpusMaolin Wang, Shervin Malmasi and Mingxuan Huang . . . . . . . . . . . . . . . . . . . . . . . . . . . . . . . . . . . 118
Reducing Annotation Efforts in Supervised Short Answer ScoringTorsten Zesch, Michael Heilman and Aoife Cahill . . . . . . . . . . . . . . . . . . . . . . . . . . . . . . . . . . . . . . . 124
xi
Annotation and Classification of Argumentative Writing RevisionsFan Zhang and Diane Litman . . . . . . . . . . . . . . . . . . . . . . . . . . . . . . . . . . . . . . . . . . . . . . . . . . . . . . . . . . 133
Embarrassed or Awkward? Ranking Emotion Synonyms for ESL Learners’ Appropriate WordingWei-Fan Chen, MeiHua Chen and Lun-Wei Ku . . . . . . . . . . . . . . . . . . . . . . . . . . . . . . . . . . . . . . . . . . 144
RevUP: Automatic Gap-Fill Question Generation from Educational TextsGirish Kumar, Rafael Banchs and Luis Fernando D’Haro . . . . . . . . . . . . . . . . . . . . . . . . . . . . . . . . . 154
Preliminary Experiments on Crowdsourced Evaluation of Feedback GranularityNitin Madnani, Martin Chodorow, Aoife Cahill, Melissa Lopez, Yoko Futagi and Yigal Attali 162
Oracle and Human Baselines for Native Language IdentificationShervin Malmasi, Joel Tetreault and Mark Dras . . . . . . . . . . . . . . . . . . . . . . . . . . . . . . . . . . . . . . . . . 172
Using PEGWriting R© to Support the Writing Motivation and Writing Quality of Eighth-Grade Stu-dents: A Quasi-Experimental Study
Joshua Wilson and Trish Martin . . . . . . . . . . . . . . . . . . . . . . . . . . . . . . . . . . . . . . . . . . . . . . . . . . . . . . . .179
Towards Creating Pedagogic Views from Encyclopedic ResourcesDitty Mathew, Dhivya Eswaran and Sutanu Chakraborti . . . . . . . . . . . . . . . . . . . . . . . . . . . . . . . . . . 190
Judging the Quality of Automatically Generated Gap-fill Question using Active LearningNobal Bikram Niraula and Vasile Rus . . . . . . . . . . . . . . . . . . . . . . . . . . . . . . . . . . . . . . . . . . . . . . . . . . 196
Generating Reference Texts for Short Answer Scoring Using Graph-based SummarizationLakshmi Ramachandran and Peter Foltz . . . . . . . . . . . . . . . . . . . . . . . . . . . . . . . . . . . . . . . . . . . . . . . . 207
Evaluating the performance of Automated Text Scoring systemsHelen Yannakoudakis and Ronan Cummins . . . . . . . . . . . . . . . . . . . . . . . . . . . . . . . . . . . . . . . . . . . . . 213
Task-Independent Features for Automated Essay GradingTorsten Zesch, Michael Wojatzki and Dirk Scholten-Akoun . . . . . . . . . . . . . . . . . . . . . . . . . . . . . . . 224
Using Learner Data to Improve Error Correction in Adjective–Noun CombinationsEkaterina Kochmar and Ted Briscoe . . . . . . . . . . . . . . . . . . . . . . . . . . . . . . . . . . . . . . . . . . . . . . . . . . . . 233
Using NLP to Support Scalable Assessment of Short Free Text ResponsesAlistair Willis . . . . . . . . . . . . . . . . . . . . . . . . . . . . . . . . . . . . . . . . . . . . . . . . . . . . . . . . . . . . . . . . . . . . . . . . 243
Automatically Scoring Freshman Writing: A Preliminary InvestigationCourtney Napoles and Chris Callison-Burch . . . . . . . . . . . . . . . . . . . . . . . . . . . . . . . . . . . . . . . . . . . . 254
xii
Conference Program
Thursday, June 4, 2015
8:45–9:00 Load Presentations
9:00–9:15 Opening Remarks
9:15–9:40 Candidate evaluation strategies for improved difficulty prediction of language testsLisa Beinborn, Torsten Zesch and Iryna Gurevych
9:40–10:05 Feature selection for automated speech scoringAnastassia Loukina, Klaus Zechner, Lei Chen and Michael Heilman
10:05–10:30 Incorporating Coherence of Topics as a Criterion in Automatic Response-to-TextAssessment of the Organization of WritingZahra Rahimi, Diane Litman, Elaine Wang and Richard Correnti
10:30–11:00 Break
11:00–11:25 Automatic morphological analysis of learner HungarianScott Ledbetter and Markus Dickinson
11:25–11:45 Automated Scoring of Picture-based Story NarrationSwapna Somasundaran, Chong Min Lee, Martin Chodorow and Xinhao Wang
11:45–12:05 Measuring Feature Diversity in Native Language IdentificationShervin Malmasi and Aoife Cahill
12:05–12:25 Automated Evaluation of Scientific Writing: AESW Shared Task ProposalVidas Daudaravicius
12:30–2:00 Lunch
2:00–3:30 Poster Sessions
2:00–2:45 Poster Session A
xiii
Thursday, June 4, 2015 (continued)
Scoring Persuasive Essays Using Opinions and their TargetsNoura Farra, Swapna Somasundaran and Jill Burstein
Towards Automatic Description of Knowledge ComponentsCyril Goutte, Guillaume Durand and Serge Leger
The Impact of Training Data on Automated Short Answer Scoring PerformanceMichael Heilman and Nitin Madnani
Interpreting Questions with a Log-Linear Ranking Model in a Virtual Patient Dia-logue SystemEvan Jaffe, Michael White, William Schuler, Eric Fosler-Lussier, Alex Rosenfeldand Douglas Danforth
Identifying Patterns For Short Answer Scoring Using Graph-based Lexico-SemanticText MatchingLakshmi Ramachandran, Jian Cheng and Peter Foltz
Lark Trills for Language Drills: Text-to-speech technology for language learnersElena Volodina and Dijana Pijetlovic
The Jinan Chinese Learner CorpusMaolin Wang, Shervin Malmasi and Mingxuan Huang
Reducing Annotation Efforts in Supervised Short Answer ScoringTorsten Zesch, Michael Heilman and Aoife Cahill
Annotation and Classification of Argumentative Writing RevisionsFan Zhang and Diane Litman
2:45–3:30 Poster Session B
Embarrassed or Awkward? Ranking Emotion Synonyms for ESL Learners’ Appro-priate WordingWei-Fan Chen, MeiHua Chen and Lun-Wei Ku
RevUP: Automatic Gap-Fill Question Generation from Educational TextsGirish Kumar, Rafael Banchs and Luis Fernando D’Haro
Preliminary Experiments on Crowdsourced Evaluation of Feedback GranularityNitin Madnani, Martin Chodorow, Aoife Cahill, Melissa Lopez, Yoko Futagi andYigal Attali
xiv

Thursday, June 4, 2015 (continued)
Oracle and Human Baselines for Native Language IdentificationShervin Malmasi, Joel Tetreault and Mark Dras
Using PEGWriting R© to Support the Writing Motivation and Writing Quality ofEighth-Grade Students: A Quasi-Experimental StudyJoshua Wilson and Trish Martin
Towards Creating Pedagogic Views from Encyclopedic ResourcesDitty Mathew, Dhivya Eswaran and Sutanu Chakraborti
Judging the Quality of Automatically Generated Gap-fill Question using ActiveLearningNobal Bikram Niraula and Vasile Rus
Generating Reference Texts for Short Answer Scoring Using Graph-based Summa-rizationLakshmi Ramachandran and Peter Foltz
Evaluating the performance of Automated Text Scoring systemsHelen Yannakoudakis and Ronan Cummins
Task-Independent Features for Automated Essay GradingTorsten Zesch, Michael Wojatzki and Dirk Scholten-Akoun
3:30–4:00 Break
4:00–4:25 Using Learner Data to Improve Error Correction in Adjective–Noun CombinationsEkaterina Kochmar and Ted Briscoe
4:25–4:50 Using NLP to Support Scalable Assessment of Short Free Text ResponsesAlistair Willis
4:50–5:15 Automatically Scoring Freshman Writing: A Preliminary InvestigationCourtney Napoles and Chris Callison-Burch
5:15–5:30 Closing Remarks
xv

Proceedings of the Tenth Workshop on Innovative Use of NLP for Building Educational Applications, 2015, pages 1–11,Denver, Colorado, June 4, 2015. c©2015 Association for Computational Linguistics
Candidate Evaluation Strategies for Improved Difficulty Prediction ofLanguage Tests
Lisa Beinborn�, Torsten Zesch‡, Iryna Gurevych�§
� UKP Lab, Technische Universitat Darmstadt‡ Language Technology Lab, University of Duisburg-Essen§ UKP Lab, German Institute for Educational Research
http://www.ukp.tu-darmstadt.de
Abstract
Language proficiency tests are a useful toolfor evaluating learner progress, if the test diffi-culty fits the level of the learner. In this work,we describe a generalized framework for testdifficulty prediction that is applicable to sev-eral languages and test types. In addition,we develop two ranking strategies for candi-date evaluation inspired by automatic solvingmethods based on language model probabil-ity and semantic relatedness. These rankingstrategies lead to significant improvements forthe difficulty prediction of cloze tests.
1 Introduction
In learning scenarios, evaluating the learner’s pro-ficiency is crucial to assess differences in learnergroups and also individual learner progress. Thiskind of evaluation is usually performed over thelearner’s results on certain tasks or tests. For infor-mative results, it is important that the test difficultyis suitable for the learner. It needs to be challeng-ing enough to avoid boredom and stagnation, but thelearner should still be able to solve the task at leastpartially. In this work, we focus on language profi-ciency tests and aim at predicting the difficulty forfive different test datasets.
Understanding the challenging elements of a taskis an essential prerequisite for learner support. Innatural language processing, human performance isusually considered as the gold standard for auto-matic approaches. The models are tuned and ad-justed to reach human-like results. In learning set-tings, the human performance is flawed because of
limited knowledge and lack of experience. In thiswork, we thus apply a reverse approach: we exploitstrategies from automatic solving to model humandifficulties.
To enable the experiments, we retrieved datasetsfrom various testing institutions and conducted alearner study to obtain error rates for an additionaltest type.1 For a better understanding of the differ-ences between test types, we first calculate the can-didate space of potential answers and compare it tolearner answers. We assume that higher answer am-biguity leads to higher difficulty. As all datasets al-low binary scoring (correct/wrong), the difficulty ofan item is interpreted as the proportion of wrong an-swers, also referred to as the error rate. We thenbuild a generalized difficulty prediction frameworkbased on an earlier approach we presented in Bein-born et al. (2014a) which was limited to English andto one specific test type. We evaluate the predictionfor different test types and languages and obtain re-markable results for French and German.
Many language tests are designed as multiplechoice questions. The generalized prediction ap-proach lacks predictive power for this format be-cause the evaluation strategy for the answer candi-dates is solely based on word frequency. We developtwo strategies for more sophisticated candidate rank-ing that are inspired by automatic solving methodsbased on language models and semantic relatedness.We show that the candidate ranking can successfullymodel human evaluation strategies and leads to im-proved difficulty prediction for cloze tests.
1The dataset is available at:https://www.ukp.tu-darmstadt.de/data/c-tests
1
In order to establish common ground, we first in-troduce the concept of reduced redundancy testingand the most popular test types.
2 Reduced Redundancy Tests
In language learning, most proficiency tests rely onthe principle of reduced redundancy testing as intro-duced by Spolsky (1969). He formalized the ideathat “natural language is redundant” and that theproficiency level of language learners can be esti-mated by their ability to deal with reduced redun-dancy. For testing, redundancy can be reduced byeliminating (partial) words from a text to create agap. The learner is then asked to fill in the gaps i.e.to complete the missing words.
Reduced redundancy tests can be distinguishedinto open and closed answer formats. In open for-mats, the learner has to actually produce the solu-tion, while it can be selected from a small fixed set ofmultiple choice options in closed formats. This tech-nique provides full control over the candidate space,but the selection of good answer options (distrac-tors), that are not a proper solution, is a difficult task.Most previous works in the field of educational nat-ural language processing focus on the generation ofdistractors to manipulate the difficulty, i.e. for clozetests (Zesch and Melamud, 2014; Mostow and Jang,2012; Agarwal and Mannem, 2011; Mitkov et al.,2006), vocabulary exercises (Skory and Eskenazi,2010; Heilman et al., 2007; Brown et al., 2005) andgrammar exercises (Perez-Beltrachini et al., 2012).
In addition to the answer format, the test typescan be distinguished by the gap type and the dele-tion rate. On the local level, the gap type determineswhich portion of the word is deleted. On the globaltest level, the deletion rate determines the distribu-tion of gaps in the text. A higher number of gapsper sentence results in a higher redundancy reduc-tion. This increases the dependency between gapsas the mutilated context of a single gap can only berecreated by solving the surrounding gaps.
2.1 Cloze test
Cloze tests have been introduced by Taylor (1953)and have become the most popular form of reducedredundancy testing. In cloze tests, full words aredeleted from a text. This strategy requires compre-
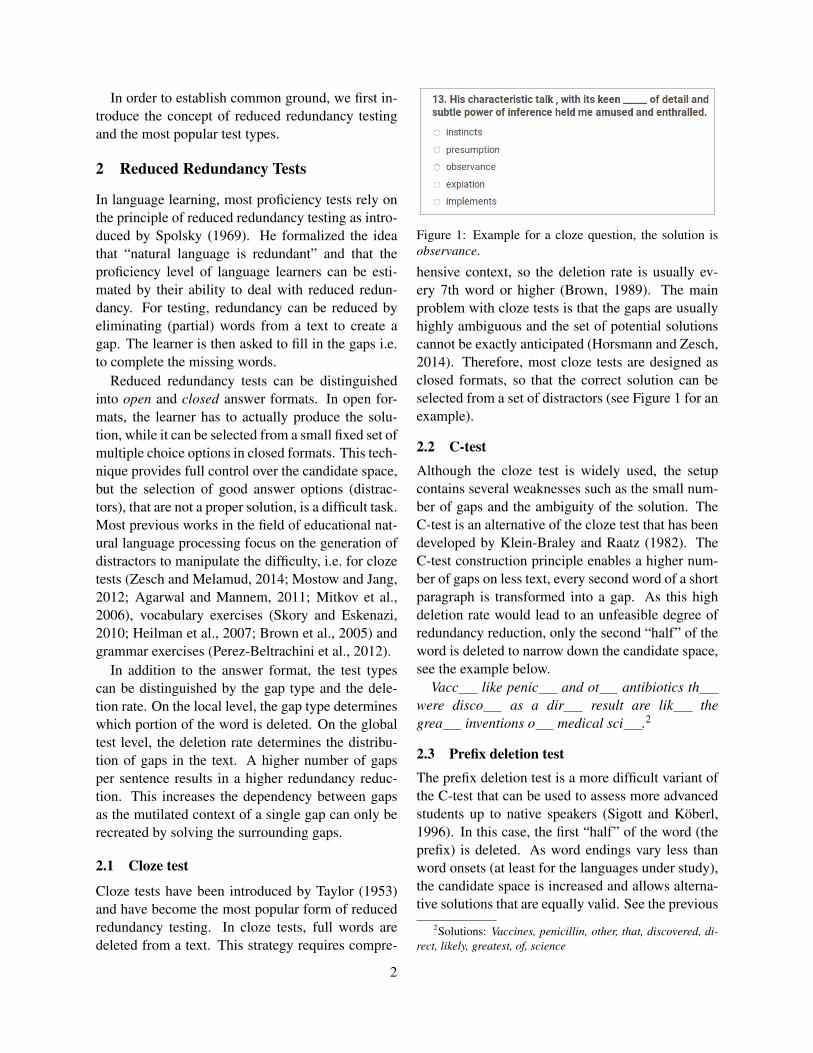
Figure 1: Example for a cloze question, the solution isobservance.
hensive context, so the deletion rate is usually ev-ery 7th word or higher (Brown, 1989). The mainproblem with cloze tests is that the gaps are usuallyhighly ambiguous and the set of potential solutionscannot be exactly anticipated (Horsmann and Zesch,2014). Therefore, most cloze tests are designed asclosed formats, so that the correct solution can beselected from a set of distractors (see Figure 1 for anexample).
2.2 C-test
Although the cloze test is widely used, the setupcontains several weaknesses such as the small num-ber of gaps and the ambiguity of the solution. TheC-test is an alternative of the cloze test that has beendeveloped by Klein-Braley and Raatz (1982). TheC-test construction principle enables a higher num-ber of gaps on less text, every second word of a shortparagraph is transformed into a gap. As this highdeletion rate would lead to an unfeasible degree ofredundancy reduction, only the second “half” of theword is deleted to narrow down the candidate space,see the example below.
Vacc like penic and ot antibiotics thwere disco as a dir result are lik thegrea inventions o medical sci .2
2.3 Prefix deletion test
The prefix deletion test is a more difficult variant ofthe C-test that can be used to assess more advancedstudents up to native speakers (Sigott and Koberl,1996). In this case, the first “half” of the word (theprefix) is deleted. As word endings vary less thanword onsets (at least for the languages under study),the candidate space is increased and allows alterna-tive solutions that are equally valid. See the previous
2Solutions: Vaccines, penicillin, other, that, discovered, di-rect, likely, greatest, of, science
2
example as a prefix deletion test below.ines like illin and er antibiotics at
were vered as a ect result are ely thetest inventions f medical nce.
In standard C-tests, a big challenge is to select thecorrect inflection of the solution, especially for lan-guages with a rich morphology. In prefix deletiontests, the inflected ending of the word is already pro-vided and thus the focus is shifted towards seman-tic challenges. Psycholinguistic experiments haveshown that the information value of the initial partof a word is higher than the final part (Broerse andZwaan, 1966; Kinoshita, 2000). This supports theassumption that prefix deletion tests are more diffi-cult.
In general, the following hypothesis is supposed:A higher degree of redundancy reduction for the gapresults in a bigger candidate space and leads to in-creased difficulty (compare the results by Sigott andKoberl (1996)). In the following section, we providean approximation of the candidate space for eachtest variant.
3 Candidate Space
The main difference between the different test typesis the number of competing candidates. In this sec-tion, we analyze the candidate space for the threelanguages English, French and German and for thetest types cloze, C-test and prefix deletion. We cal-culate the candidates for each word in the vocabu-lary and then average the results for words with thesame length to approximate the candidate space.
Language Words Mean word length
English (American) 99,171 8.5 ±2.6French 139,719 9.6 ±2.6German 332,263 12.0 ±3.5
Table 1: Vocabulary size and mean word length for dif-ferent languages
Candidate space for different languages We fo-cus on English, French and German because they areused in our datasets. The word list package providedby Ubuntu for spell-checking serves as vocabulary.3
The size of the lists vary depending on the mor-phological richness of the language; the German list
3http://packages.ubuntu.com/de/lucid/wordlist, 15.12.2014
is more than three times bigger than the English one(see Table 1). It should also be noted that the aver-age word length is much higher for German. This ismainly due to the existence of noun compounds thatconcatenate two or more words into one.
2 4 6 8 10 12 14 16 18 200
20
40
60
80
Word length
Mea
nnu
mbe
rofc
andi
date
s German C-testFrench C-testEnglish C-test
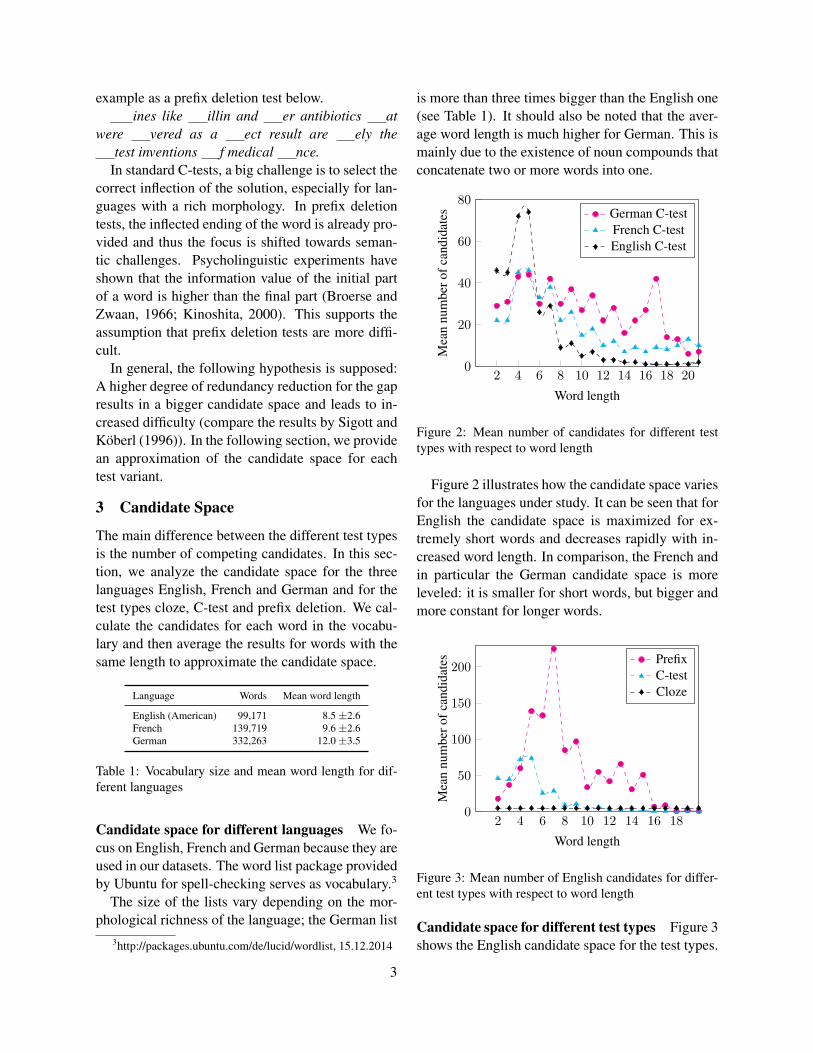
Figure 2: Mean number of candidates for different testtypes with respect to word length
Figure 2 illustrates how the candidate space variesfor the languages under study. It can be seen that forEnglish the candidate space is maximized for ex-tremely short words and decreases rapidly with in-creased word length. In comparison, the French andin particular the German candidate space is moreleveled: it is smaller for short words, but bigger andmore constant for longer words.
2 4 6 8 10 12 14 16 180
50
100
150
200
Word length
Mea
nnu
mbe
rofc
andi
date
s PrefixC-testCloze
Figure 3: Mean number of English candidates for differ-ent test types with respect to word length
Candidate space for different test types Figure 3shows the English candidate space for the test types.
3

The number of candidates for the cloze test with fivedistractors is of course always five. Compared tothe C-test, the candidate space for the prefix dele-tion test is extremely large, in particular for wordswith medium length (five to nine characters). Thiscould be an explanation why this test type is con-sidered to be more difficult than the standard C-test.However, following this hypothesis, the cloze testsshould be fairly easy given the consistently smallcandidate space. The obtained error rates and thefeedback of our test participants do not support thisassumption. This gives rise to the idea that the can-didate space considered by the learner differs fromthe computational one.
Candidate evaluation by learners When solvingopen formats, the learners cannot consider the fullcandidate space; only the words that are in the activevocabulary of the learner are accessible. In addition,the context can lead to priming effects and the testsituation might alter the stress level of the participantand apply further restrictions.
From the above arguments, one would expect thatthe learner’s candidate space is smaller than the ob-jective candidate space. However, we need to takeinto account that learners also consider wrong op-tions, see the different learner answers for the gapappro in Figure 4, for example. The computa-tional candidate space on the left consists of only9 candidates, but the participants provided 68 dif-ferent answers along with the solution appropriate(and only four of them intersect with the candidatespace). This example highlights the importance ofmodelling productive difficulties for test types withopen answer format.
For the closed cloze test, the candidate space isconstant. The learners seem to consider even feweroptions, on average only three of the five providedanswers are actually selected. For closed formats, itis thus more relevant to model candidate ambiguity.In the following section, we analyze if the difficultyprediction can be performed for all test types despitethe varying candidate space.
4 Difficulty prediction
Teachers are often not able to correctly anticipate thedifficulties a learner might face. For the examplein Section 2, one would probably expect high error
Figure 5: Visualization of gap difficulty. Easy gaps aremarked green, intermediate gaps yellow and difficult gapsred.
rates for vaccines and penicillin, while the problemswith likely and that might come as a surprise (seeFigure 5). For optimal learner support, it is impor-tant to predict these difficulties.
4.1 Previous work
The earliest analyses of test difficulty operate onthe level of the full text instead of individual gaps.Klein-Braley (1984) performs a linear regressionanalysis with only two difficulty indicators – averagesentence length and type-token ratio – and obtaineduseful predictions of the mean test difficulty for hertarget group. Eckes (2011) also focuses on the meantest difficulty and aims at calibrating C-tests using aRasch model to build a test pool.
Kamimoto (1993) performs classical item analy-sis on the gap level and creates a tailored C-test thatonly contains selected gaps which better discrimi-nate between students. However, the gap selectionis based on previous test results instead of gap fea-tures and cannot be applied on new tests.
In previous work (Beinborn et al., 2014a), we re-ported the first results for automatic difficulty pre-diction on the gap level. We introduced a model forthe difficulty prediction of English C-test gaps thatcombines aspects of text and word difficulty withproperties of the candidate space and gap dependen-cies. As the current work builds on this model, wesummarize the feature space below.
Text difficulty For all test types, the difficulty ofthe test text determines the available context for theparticipant. A more challenging text increases thedifficulty of all gaps as the participant’s orienta-tion in the text becomes more complicated (compareBrown (1989)). The difficulty of the underlying textcan be determined by readability features. Our ap-proach combines traditional features as the averagesentence and word length with more advanced fea-tures from all linguistic levels (e.g. lexical, syntac-tic, semantic, discourse) including features specificto readability for language learning as for example
4
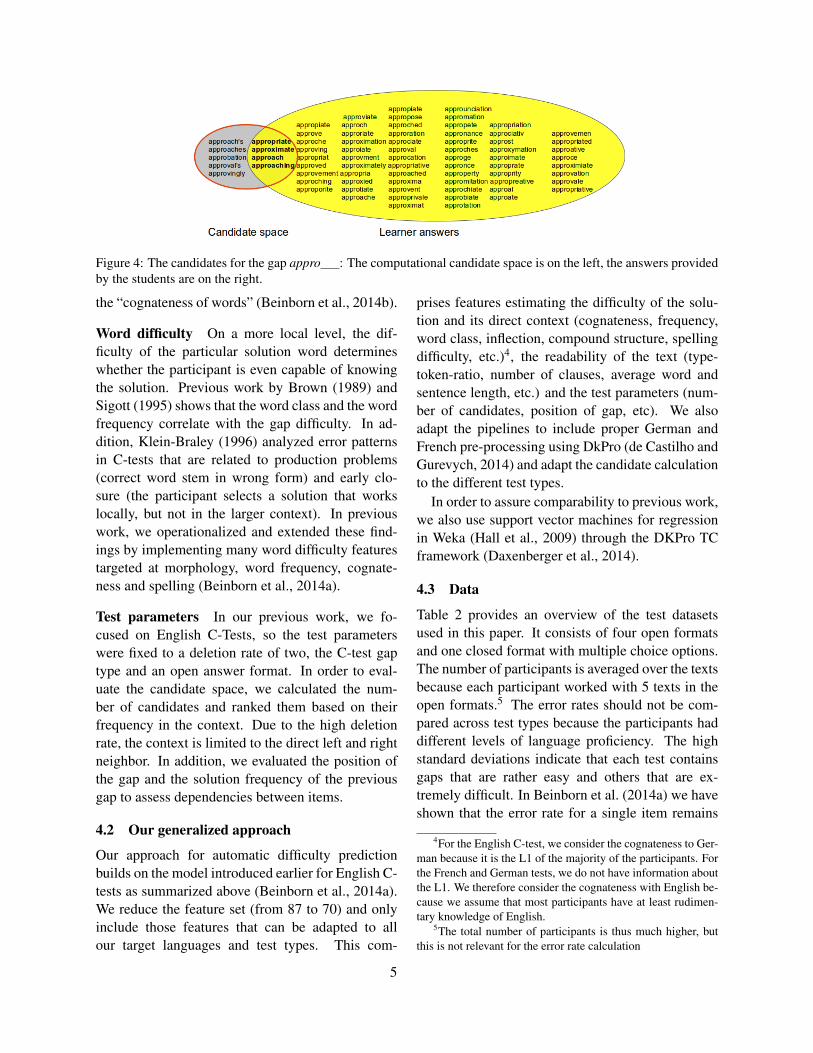
Figure 4: The candidates for the gap appro : The computational candidate space is on the left, the answers providedby the students are on the right.
the “cognateness of words” (Beinborn et al., 2014b).
Word difficulty On a more local level, the dif-ficulty of the particular solution word determineswhether the participant is even capable of knowingthe solution. Previous work by Brown (1989) andSigott (1995) shows that the word class and the wordfrequency correlate with the gap difficulty. In ad-dition, Klein-Braley (1996) analyzed error patternsin C-tests that are related to production problems(correct word stem in wrong form) and early clo-sure (the participant selects a solution that workslocally, but not in the larger context). In previouswork, we operationalized and extended these find-ings by implementing many word difficulty featurestargeted at morphology, word frequency, cognate-ness and spelling (Beinborn et al., 2014a).
Test parameters In our previous work, we fo-cused on English C-Tests, so the test parameterswere fixed to a deletion rate of two, the C-test gaptype and an open answer format. In order to eval-uate the candidate space, we calculated the num-ber of candidates and ranked them based on theirfrequency in the context. Due to the high deletionrate, the context is limited to the direct left and rightneighbor. In addition, we evaluated the position ofthe gap and the solution frequency of the previousgap to assess dependencies between items.
4.2 Our generalized approach
Our approach for automatic difficulty predictionbuilds on the model introduced earlier for English C-tests as summarized above (Beinborn et al., 2014a).We reduce the feature set (from 87 to 70) and onlyinclude those features that can be adapted to allour target languages and test types. This com-
prises features estimating the difficulty of the solu-tion and its direct context (cognateness, frequency,word class, inflection, compound structure, spellingdifficulty, etc.)4, the readability of the text (type-token-ratio, number of clauses, average word andsentence length, etc.) and the test parameters (num-ber of candidates, position of gap, etc). We alsoadapt the pipelines to include proper German andFrench pre-processing using DkPro (de Castilho andGurevych, 2014) and adapt the candidate calculationto the different test types.
In order to assure comparability to previous work,we also use support vector machines for regressionin Weka (Hall et al., 2009) through the DKPro TCframework (Daxenberger et al., 2014).
4.3 Data
Table 2 provides an overview of the test datasetsused in this paper. It consists of four open formatsand one closed format with multiple choice options.The number of participants is averaged over the textsbecause each participant worked with 5 texts in theopen formats.5 The error rates should not be com-pared across test types because the participants haddifferent levels of language proficiency. The highstandard deviations indicate that each test containsgaps that are rather easy and others that are ex-tremely difficult. In Beinborn et al. (2014a) we haveshown that the error rate for a single item remains
4For the English C-test, we consider the cognateness to Ger-man because it is the L1 of the majority of the participants. Forthe French and German tests, we do not have information aboutthe L1. We therefore consider the cognateness with English be-cause we assume that most participants have at least rudimen-tary knowledge of English.
5The total number of participants is thus much higher, butthis is not relevant for the error rate calculation
5

Format Test type Texts Gaps Particip. Avg. error rate
Open
C-test en 39 775 210 .35±.25C-test fr 40 799 24 .52±.28C-test de 82 1,640 251 .55±.26Prefix de 14 348 225 .36±.23
Closed Cloze en 100 100 22 .27±.22
Table 2: Overview of test data
quite stable for varying sample sizes.
C-test We use the same English C-test data as inour previous work (Beinborn et al., 2014a) and ad-ditionally obtained French tests. In both cases, thetests served as a placement test at the language cen-tre of the TU Darmstadt in order to assign students tolanguage levels. The participants had heterogeneousbackgrounds regarding their language proficiencyand mother tongue, but the majority was German.Furthermore, we received German C-tests from theTestDaf institute that have been administered to for-eign students who apply for studying in Germany. Itis a subset of the data described in Eckes (2011).
Prefix deletion For the prefix deletion test, wereceived German tests from the University ofDuisburg-Essen that test the proficiency of prospec-tive teachers.6 The participants are a mix of nativeGerman speakers and students with migratory back-ground (26%). Their language proficiency is muchhigher than that of the participants in the other tests.
Cloze tests For cloze tests, we could not findany test data with error rates. We thus conducteda study to collect error rates ourselves using theMicrosoft sentence completion dataset.7 For thisdataset, Zweig and Burges (2012) transformed 1400sentences from 5 Sherlock Holmes novels (writtenby Arthur Conan Doyle) into cloze tests. In each se-lected sentence, they replace a low-frequency con-tent word with a gap and provide the solution alongwith 4 distractors (so-called closed cloze). The dis-tractors were generated automatically based on n-gram frequencies and then handpicked by humanjudges. It should be noted that all distractors formgrammatically correct sentences and that the n-gramprobabilities for the answer options are comparable.
6http://zlb.uni-due.de/sprachkompetenz7http://research.microsoft.com/en-us/projects/scc/,
15.12.2014
Dataset LOO Gaps LOO Texts
C-test en .55 .47C-test fr .70 .67C-test de .63 .61Prefix de .54 .27Cloze en .20 .20
Table 3: Pearson correlation for difficulty prediction re-sults in an leave-one-out cross-validation setting on thegap and on the text level
We tested a subset of the cloze questions with aneloquent native speaker of English and he answered100% correctly. In order to determine the difficultyfor language learners, we set up 10 web surveys with10 questions each (as in Figure 1) and asked ad-vanced learners of English to answer them.
4.4 Prediction Results
Table 3 shows the correlation between the measuredhuman error rates and the predictions of our gener-alized prediction approach. It should be noted thatwe used the same features for each dataset. In prac-tical applications, it would of course be possible totune the feature selection for each task separately.For research purposes, however, we are interested increating uniform conditions to allow a more mean-ingful comparison.
In our previous approach, we performed leave-one-out testing on all gaps to account for the smallamount of training data. As each text of the open for-mat test types contains 20 gaps, leave-one-out test-ing on all gaps increases the risk of over-fitting themodel to specific text properties. For a more realis-tic prediction setting, we additionally perform leave-one-out testing on the texts, i.e. we always test on 20gaps from one coherent text. We will focus on theresults reported for this scenario, although they areslightly worse. The baseline, that always predictsthe mean error rate, yields a correlation of 0 for alltest types.
Languages The results show that the difficultyprediction can be successfully adapted to other lan-guages. The correlation for the English C-tests is abit lower than in previous work (0.60) because wereduced the set of features as described above. Thisallowed us to obtain results for German and Frenchthat are even better than the ones previously reportedfor English.
6
0.5 1
−0.4
−0.2
0.2
0.4
Error Rate
Pred
ictio
n
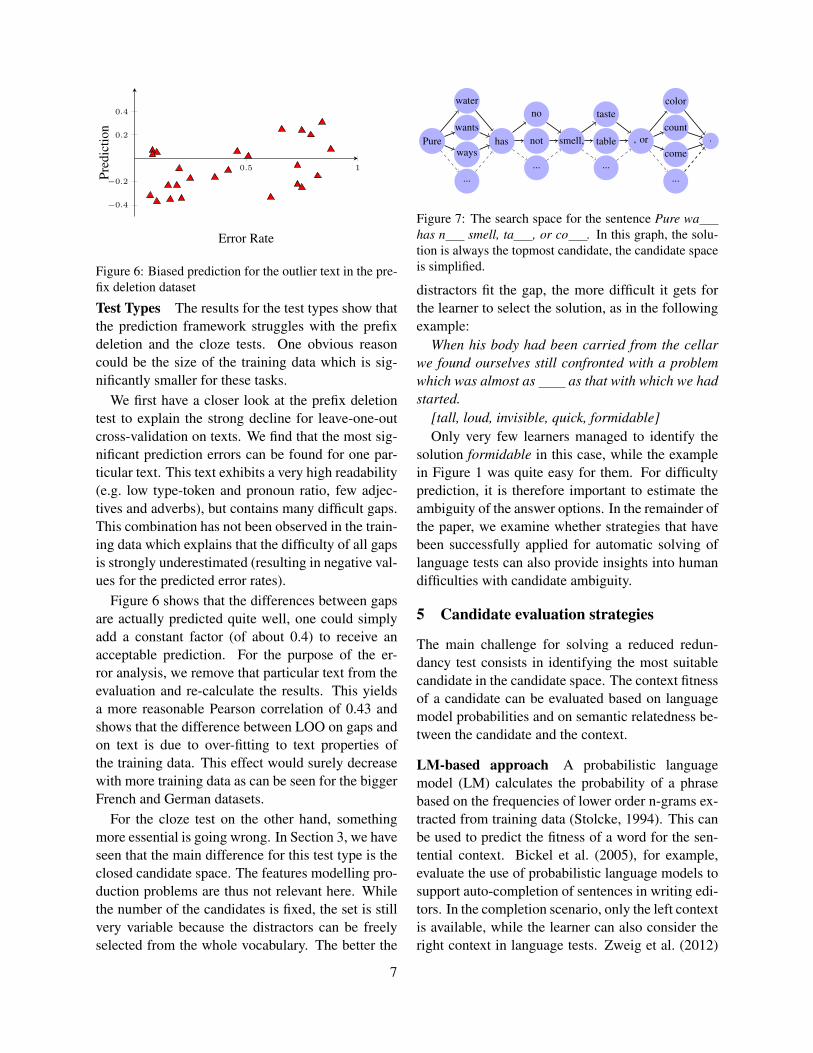
Figure 6: Biased prediction for the outlier text in the pre-fix deletion dataset
Test Types The results for the test types show thatthe prediction framework struggles with the prefixdeletion and the cloze tests. One obvious reasoncould be the size of the training data which is sig-nificantly smaller for these tasks.
We first have a closer look at the prefix deletiontest to explain the strong decline for leave-one-outcross-validation on texts. We find that the most sig-nificant prediction errors can be found for one par-ticular text. This text exhibits a very high readability(e.g. low type-token and pronoun ratio, few adjec-tives and adverbs), but contains many difficult gaps.This combination has not been observed in the train-ing data which explains that the difficulty of all gapsis strongly underestimated (resulting in negative val-ues for the predicted error rates).
Figure 6 shows that the differences between gapsare actually predicted quite well, one could simplyadd a constant factor (of about 0.4) to receive anacceptable prediction. For the purpose of the er-ror analysis, we remove that particular text from theevaluation and re-calculate the results. This yieldsa more reasonable Pearson correlation of 0.43 andshows that the difference between LOO on gaps andon text is due to over-fitting to text properties ofthe training data. This effect would surely decreasewith more training data as can be seen for the biggerFrench and German datasets.
For the cloze test on the other hand, somethingmore essential is going wrong. In Section 3, we haveseen that the main difference for this test type is theclosed candidate space. The features modelling pro-duction problems are thus not relevant here. Whilethe number of the candidates is fixed, the set is stillvery variable because the distractors can be freelyselected from the whole vocabulary. The better the
Pure
water
wants
ways
...
has
no
not
...
smell,
taste
table
...
, or
color
count
come
...
.
Figure 7: The search space for the sentence Pure wahas n smell, ta , or co . In this graph, the solu-tion is always the topmost candidate, the candidate spaceis simplified.
distractors fit the gap, the more difficult it gets forthe learner to select the solution, as in the followingexample:
When his body had been carried from the cellarwe found ourselves still confronted with a problemwhich was almost as as that with which we hadstarted.
[tall, loud, invisible, quick, formidable]Only very few learners managed to identify the
solution formidable in this case, while the examplein Figure 1 was quite easy for them. For difficultyprediction, it is therefore important to estimate theambiguity of the answer options. In the remainder ofthe paper, we examine whether strategies that havebeen successfully applied for automatic solving oflanguage tests can also provide insights into humandifficulties with candidate ambiguity.
5 Candidate evaluation strategies
The main challenge for solving a reduced redun-dancy test consists in identifying the most suitablecandidate in the candidate space. The context fitnessof a candidate can be evaluated based on languagemodel probabilities and on semantic relatedness be-tween the candidate and the context.
LM-based approach A probabilistic languagemodel (LM) calculates the probability of a phrasebased on the frequencies of lower order n-grams ex-tracted from training data (Stolcke, 1994). This canbe used to predict the fitness of a word for the sen-tential context. Bickel et al. (2005), for example,evaluate the use of probabilistic language models tosupport auto-completion of sentences in writing edi-tors. In the completion scenario, only the left contextis available, while the learner can also consider theright context in language tests. Zweig et al. (2012)
7
thus model the problem of solving cloze tests by ap-plying methods from lexical substitution to evaluateand rank the candidates. The part to be substitutedis a gap and the set of “substitution candidates” isalready provided by the answer options.
Unfortunately, we cannot rely on static sentencesfor the open test formats as the context needs tobe determined by solving the surrounding gaps.For each gap, we take all candidates into accountand generate all possible sentences resulting fromthe combinations with the candidates of subsequentgaps. This can lead to strong dependencies betweenitems, i.e. solving a subsequent item is facilitated,if the previous one has been solved correctly. Asa consequence, we need to evaluate a combinato-rial search space that grows exponentially with thenumber of gaps in the sentence (see Figure 7). Wethus use a pruning step after each gap that scores thegenerated sub-sentences using a language model andonly keeps the n best. For the closed cloze test, thenumber of generated sentences is of course limitedto the number of candidates (5) because each sen-tence contains only one gap.
We use 5-gram language models that are trainedon monolingual news corpora using berkeleylm withKneser-Ney smoothing.8 Zweig et al. (2012) trainedtheir models explicitly on training data only fromSherlock Holmes novels. In order to better sim-ulate learner knowledge, we use rather small andcontrolled training data from the Leipzig collection(Quasthoff et al., 2006) consisting of one millionsentences for each language.
For solving the test, we then select the generatedsentence with the highest log-probability in the lan-guage model and count how many gaps are solvedcorrectly. If several sentences obtain the same prob-ability, we pick one at random. We run this strategyten times and average the results. For comparison,we implement a baseline that always selects the mostfrequent candidate without considering the context.
Semantic relatedness approach Language mod-els cannot capture relations between distant words inthe sentence. To account for this constraint, Zweiget al. (2012) include information from latent se-mantic analysis (Deerwester et al., 1990). For thismethod, every word is represented by a vector of re-
8http://code.google.com/p/berkeleylm, 15.12.2014
Human Baseline LM-Based Semantic
C-test en .68 .11 .76 -C-test fr .48 .10 .79 -C-test de .45 .09 .76 -Prefix de .64 .09 .73 -Cloze en .70 .21 .26 .32
Table 4: Solving accuracy for the different candidateevaluation strategies
lated words that is calculated on the basis of train-ing data. The semantic relatedness between twowords can then be expressed by the cosine simi-larity of the two vectors. Similar to Zweig et al.(2012), we sum over the cosine similarity betweenthe candidate and every content word in the sentenceto calculate the candidate fitness. While they cal-culate relatedness based on a latent semantic anal-ysis index of the domain-specific Holmes corpus,we use explicit semantic analysis (Gabrilovich andMarkovitch, 2007) calculated on Wikipedia to bet-ter model the learner’s general domain knowledge.9
The semantic approach cannot be applied on openformats because semantic relatedness is not infor-mative for function words and inflections.
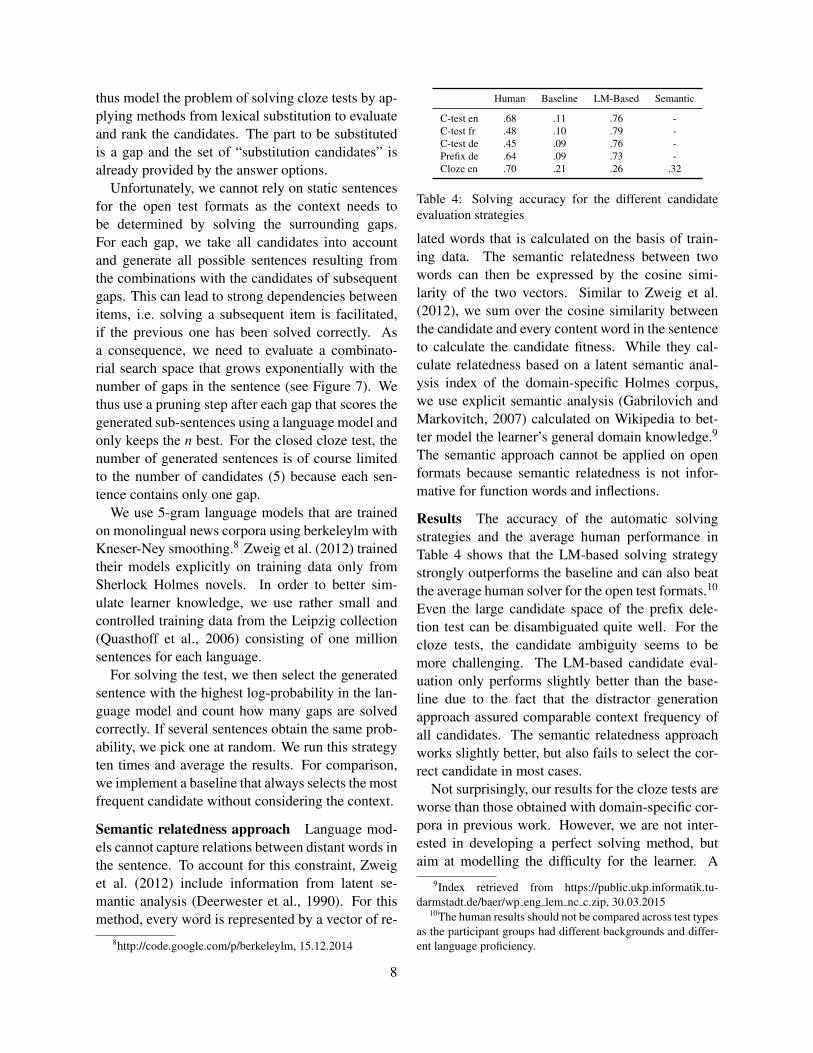
Results The accuracy of the automatic solvingstrategies and the average human performance inTable 4 shows that the LM-based solving strategystrongly outperforms the baseline and can also beatthe average human solver for the open test formats.10
Even the large candidate space of the prefix dele-tion test can be disambiguated quite well. For thecloze tests, the candidate ambiguity seems to bemore challenging. The LM-based candidate eval-uation only performs slightly better than the base-line due to the fact that the distractor generationapproach assured comparable context frequency ofall candidates. The semantic relatedness approachworks slightly better, but also fails to select the cor-rect candidate in most cases.
Not surprisingly, our results for the cloze tests areworse than those obtained with domain-specific cor-pora in previous work. However, we are not inter-ested in developing a perfect solving method, butaim at modelling the difficulty for the learner. A
9Index retrieved from https://public.ukp.informatik.tu-darmstadt.de/baer/wp eng lem nc c.zip, 30.03.2015
10The human results should not be compared across test typesas the participant groups had different backgrounds and differ-ent language proficiency.
8
question is less likely to be solved if the context fit-ness of a distractor is rated higher than that of the so-lution. The failures of the automatic solving mighthence be indicative for the difficulty prediction forcloze tests.
6 Improved difficulty prediction
The solving approaches described above provide aranking of the candidates that can be instrumentalfor difficulty prediction. We develop two new fea-tures that evaluate the context fitness of the candi-dates based on the measures described above and re-turn the rank of the solution. We assume that a gapis more difficult if the solution is not the top-rankedcandidate.
We have seen that many of the difficulty featuresthat have been developed for the C-test are not ap-plicable for the cloze data. The C-test difficulty hasbeen modelled by estimating the size of the candi-date space (which is constant in this case), produc-tion difficulties (which are not relevant in closed for-mats), and a frequency-based ranking of the candi-dates (which has been controlled by the test design-ers). The remaining features measure the readabil-ity of the text, the frequency of the direct context,and the word class of the gap and provide importantinformation about the general difficulty of the gapindependent of the answer options. We analyze ifthe ranking features can then capture the importantaspect of candidate ambiguity to improve difficultyprediction for cloze tests.
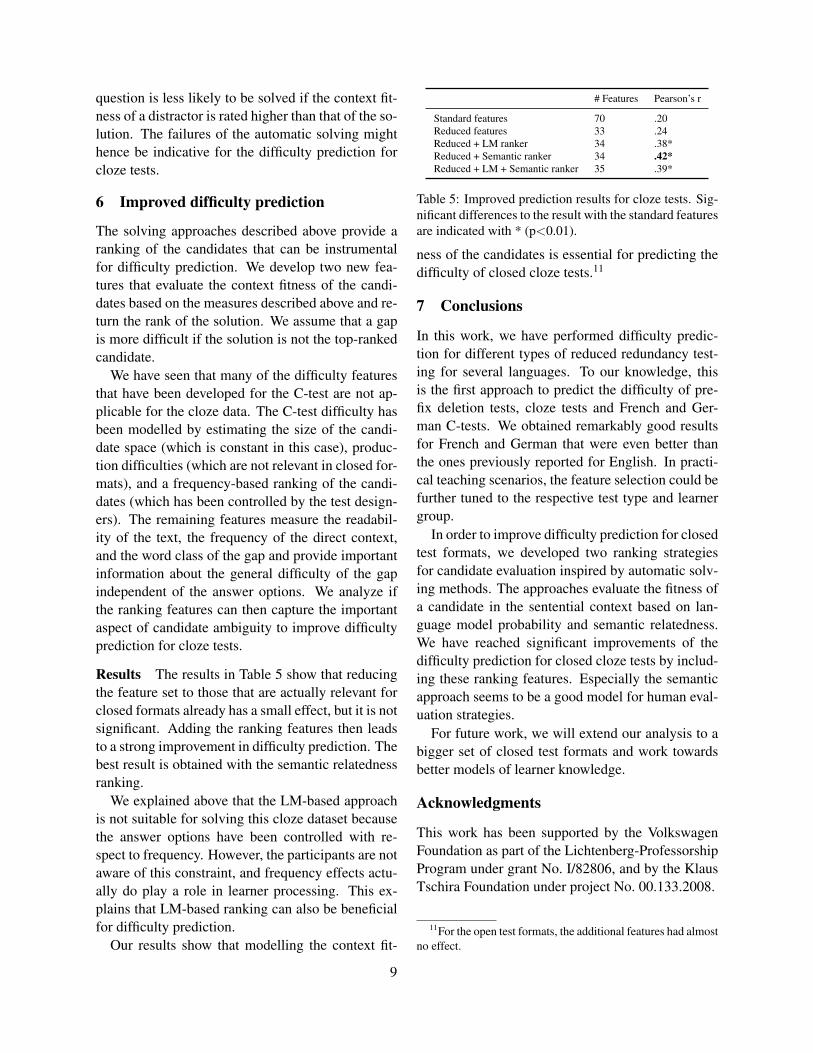
Results The results in Table 5 show that reducingthe feature set to those that are actually relevant forclosed formats already has a small effect, but it is notsignificant. Adding the ranking features then leadsto a strong improvement in difficulty prediction. Thebest result is obtained with the semantic relatednessranking.
We explained above that the LM-based approachis not suitable for solving this cloze dataset becausethe answer options have been controlled with re-spect to frequency. However, the participants are notaware of this constraint, and frequency effects actu-ally do play a role in learner processing. This ex-plains that LM-based ranking can also be beneficialfor difficulty prediction.
Our results show that modelling the context fit-
# Features Pearson’s r
Standard features 70 .20Reduced features 33 .24Reduced + LM ranker 34 .38*Reduced + Semantic ranker 34 .42*Reduced + LM + Semantic ranker 35 .39*
Table 5: Improved prediction results for cloze tests. Sig-nificant differences to the result with the standard featuresare indicated with * (p<0.01).
ness of the candidates is essential for predicting thedifficulty of closed cloze tests.11
7 Conclusions
In this work, we have performed difficulty predic-tion for different types of reduced redundancy test-ing for several languages. To our knowledge, thisis the first approach to predict the difficulty of pre-fix deletion tests, cloze tests and French and Ger-man C-tests. We obtained remarkably good resultsfor French and German that were even better thanthe ones previously reported for English. In practi-cal teaching scenarios, the feature selection could befurther tuned to the respective test type and learnergroup.
In order to improve difficulty prediction for closedtest formats, we developed two ranking strategiesfor candidate evaluation inspired by automatic solv-ing methods. The approaches evaluate the fitness ofa candidate in the sentential context based on lan-guage model probability and semantic relatedness.We have reached significant improvements of thedifficulty prediction for closed cloze tests by includ-ing these ranking features. Especially the semanticapproach seems to be a good model for human eval-uation strategies.
For future work, we will extend our analysis to abigger set of closed test formats and work towardsbetter models of learner knowledge.
Acknowledgments
This work has been supported by the VolkswagenFoundation as part of the Lichtenberg-ProfessorshipProgram under grant No. I/82806, and by the KlausTschira Foundation under project No. 00.133.2008.
11For the open test formats, the additional features had almostno effect.
9
ReferencesManish Agarwal and Prashanth Mannem. 2011. Auto-
matic Gap-fill Question Generation from Text Books.pages 56–64. Association for Computational Linguis-tics.
Lisa Beinborn, Torsten Zesch, and Iryna Gurevych.2014a. Predicting the difficulty of language profi-ciency tests. Transactions of the Association for Com-putational Linguistics, 2:517–529.
Lisa Beinborn, Torsten Zesch, and Iryna Gurevych.2014b. Readability for foreign language learning: Theimportance of cognates. International Journal of Ap-plied Linguistics.
Steffen Bickel, Peter Haider, and Tobias Scheffer. 2005.Predicting sentences using N-gram language models.In Proceedings of the conference on Human LanguageTechnology and Empirical Methods in Natural Lan-guage Processing - HLT ’05, pages 193–200, Mor-ristown, NJ, USA, October. Association for Compu-tational Linguistics.
Aleid C Broerse and EJ Zwaan. 1966. The infor-mation value of initial letters in the identification ofwords. Journal of Verbal Learning and Verbal Behav-ior, 5(5):441–446.
Jonathan C Brown, Gwen A Frishkoff, and Maxine Eske-nazi. 2005. Automatic Question Generation for Vo-cabulary Assessment. In HLT ’05: Proceedings ofthe conference on Human Language Technology andEmpirical Methods in Natural Language Processing,pages 819–826, Morristown, NJ, USA. Association forComputational Linguistics.
James Dean Brown. 1989. Cloze item difficulty. JALTjournal, 11:46–67.
Johannes Daxenberger, Oliver Ferschke, Iryna Gurevych,and Torsten Zesch. 2014. DKPro TC: A Java-basedFramework for Supervised Learning Experiments onTextual Data. In Proceedings of 52nd Annual Meetingof the Association for Computational Linguistics: Sys-tem Demonstrations, pages 61–66, Baltimore, Mary-land, June. Association for Computational Linguistics.
Richard Eckart de Castilho and Iryna Gurevych. 2014.A broad-coverage collection of portable NLP compo-nents for building shareable analysis pipelines. Pro-ceedings of the Workshop on Open Infrastructures andAnalysis Frameworks for HLT, pages 1–11.
Scott C. Deerwester, Susan T Dumais, Thomas K. Lan-dauer, George W. Furnas, and Richard A. Harshman.1990. Indexing by latent semantic analysis. Jour-nal of the American Society for Information Science,41(6):391–407.
Thomas Eckes. 2011. Item banking for C-tests: A poly-tomous Rasch modeling approach. Psychological Testand Assessment Modeling, 53(4):414–439.
Evgeniy Gabrilovich and Shaul Markovitch. 2007. Com-puting Semantic Relatedness using Wikipedia-basedExplicit Semantic Analysis. In Proceedings of the20th International Joint Conference on Artificial In-telligence, pages 1606–1611.
Mark Hall, Eibe Frank, Geoffrey Holmes, BernhardPfahringer, Peter Reutemann, and Ian H. Witten.2009. The WEKA data mining software: an update.11(1).
Michael J Heilman, Kevyn Collins-Thompson, JamieCallan, and Maxine Eskenazi. 2007. Combining lex-ical and grammatical features to improve readabilitymeasures for first and second language texts. In Pro-ceedings of NAACL-HLT, pages 460–467.
Tobias Horsmann and Torsten Zesch. 2014. Towardsautomatic scoring of cloze items by selecting low-ambiguity contexts. NEALT Proceedings Series Vol.22, pages 33–42.
Tadamitsu Kamimoto. 1993. Tailoring the Test to Fit theStudents: Improvement of the C-Test through Classi-cal Item Analysis. Language Laboratory, 30:47–61,November.
Sachiko Kinoshita. 2000. The left-to-right nature of themasked onset priming effect in naming. PsychonomicBulletin & Review, 7(1):133–141, March.
Christine Klein-Braley and Ulrich Raatz. 1982. DerC-Test: ein neuer Ansatz zur Messung allgemeinerSprachbeherrschung. AKS-Rundbrief, 4:23 – 37.
Christine Klein-Braley. 1984. Advance Prediction ofDifficulty with C-Tests. In Terry Culhane, Chris-tine Klein-Braley, and Douglas K. Stevenson, editors,Practice and problems in language testing, volume 7.
Christine Klein-Braley. 1996. Towards a theory of C-Test processing. In Rudiger Grotjahn, editor, Der C-Test. Theoretische Grundlagen und praktische Anwen-dungen 3, pages 23–94. Brockmeyer, Bochum.
Ruslan Mitkov, Le An Ha, and Nikiforos Karamanis.2006. A computer-aided environment for generatingmultiple-choice test items. Natural Language Engi-neering, 12(2):177–194, May.
Jack Mostow and Hyeju Jang. 2012. Generating Diag-nostic Multiple Choice Comprehension Cloze Ques-tions. pages 136–146.
Laura Perez-Beltrachini, Claire Gardent, and GermanKruszewski. 2012. Generating Grammar Exercises.In Proceedings of the Seventh Workshop on BuildingEducational Applications Using NLP, pages 147–156.
Uwe Quasthoff, Matthias Richter, and Christian Bie-mann. 2006. Corpus portal for search in monolingualcorpora. In Proceedings of the fifth international con-ference on language resources and evaluation, volume17991802.
10

Gunther Sigott and Johann Koberl. 1996. Deletionpatterns and C-test difficulty across languages. InRudiger Grotjahn, editor, Der C-Test. TheoretischeGrundlagen und praktische Anwendungen 3, pages159–172. Brockmeyer, Bochum.
Gunther Sigott. 1995. The C-test: some factors of diffi-culty. AAA. Arbeiten aus Anglistik und Amerikanistik,20(1):43–54.
Adam Skory and Maxine Eskenazi. 2010. PredictingCloze Task Quality for Vocabulary Training. In The5th Workshop on Innovative Use of NLP for BuildingEducational Applications (NAACL-HLT). Associationfor Computational Linguistics.
Bernard Spolsky. 1969. Reduced Redundancy as a Lan-guage Testing Tool. In G.E. Perren and J.L.M. Trim,editors, Applications of linguistics, pages 383–390.Cambridge University Press, Cambridge, August.
Andreas Stolcke. 1994. Bayesian learning of probabilis-tic language models. Ph.D. thesis, University of Cali-fornia, Berkeley.
Wilson L. Taylor. 1953. ”Cloze procedure”: a newtool for measuring readability. Journalism Quarterly,30:415–433.
Torsten Zesch and Oren Melamud. 2014. AutomaticGeneration of Challenging Distractors Using Context-Sensitive Inference Rules. In Proceedings of the NinthWorkshop on Innovative Use of NLP for Building Edu-cational Applications, pages 143–148. Association forComputational Linguistics.
Geoffrey Zweig and Chris JC Burges. 2012. A challengeset for advancing language modeling. In Proceedingsof the NAACL-HLT 2012 Workshop: Will We Ever Re-ally Replace the N-gram Model? On the Future ofLanguage Modeling for HLT, pages 29–36. Associa-tion for Computational Linguistics.
Geoffrey Zweig, John C Platt, Christopher Meek,Christopher JC Burges, Ainur Yessenalina, and QiangLiu. 2012. Computational approaches to sentencecompletion. In Proceedings of the 50th Annual Meet-ing of the Association for Computational Linguistics:Long Papers-Volume 1, pages 601–610. Associationfor Computational Linguistics.
11
Proceedings of the Tenth Workshop on Innovative Use of NLP for Building Educational Applications, 2015, pages 12–19,Denver, Colorado, June 4, 2015. c©2015 Association for Computational Linguistics
Feature selection for automated speech scoring
Anastassia Loukina, Klaus Zechner, Lei Chen, Michael Heilman∗
Educational Testing Service660 Rosedale Rd
Princeton, NJ, USA{aloukina, kzechner, lchen}@ets.org, [email protected]
Abstract
Automated scoring systems used for the eval-uation of spoken or written responses in lan-guage assessments need to balance good em-pirical performance with the interpretabilityof the scoring models. We compare severalmethods of feature selection for such scor-ing systems and show that the use of shrink-age methods such as Lasso regression makesit possible to rapidly build models that bothsatisfy the requirements of validity and in-tepretability, crucial in assessment contexts aswell as achieve good empirical performance.
1 Introduction
In this paper we compare different methods of se-lecting the best feature subset for scoring modelsused in the context of large-scale language assess-ments, with a particular look at the assessment ofspoken responses produced by test-takers.
The basic approach to automatically scoring writ-ten or spoken responses is to collect a training cor-pus of responses that are scored by human raters,use machine learning to estimate a model that mapsresponse features to scores from this corpus , andthen use this model to predict scores for unseen re-sponses (Page, 1966; Burstein et al., 1998; Landaueret al., 2003; Eskenazi, 2009; Zechner et al., 2009;Bernstein et al., 2010). While this method is oftenquite effective in terms of producing scoring mod-els that exhibit good agreement with human raters,it can lend itself to criticism from the educational
∗Currently at Civis Analytics
measurement community if it fails to address cer-tain basic considerations for assessment design andscoring that are common practice in that field.
For instance, Ramineni and Williamson (2013) ar-gue that automated scoring not only has to be reli-able (i.e., exhibiting a good empirical performanceas demonstrated, for example, by correlations be-tween predicted and human scores), but also valid.One very important aspect of validity is to what ex-tent the automated scoring model reflects importantdimensions of the construct measured by the test (aconstruct is the set of knowledge, skills, and abili-ties measured by a test). For example, a speakingproficiency test for non-native speakers may claimthat it assesses aspects such as fluency, pronunci-ation, and content accuracy in a test-taker’s spo-ken response(s). If the features that contribute tothe scoring models can be seen as measuring all ofthese aspects of spoken language well, the modelwould be considered valid from a construct point ofview. However, if certain dimensions of the con-struct are not represented (well) by the feature setused in the scoring model, and/or features containedin the model address aspects not considered to berelevant for measuring the test construct, the con-struct validity of the scoring model would not beconsidered ideal (cf. also Bernstein et al. (2010)and Williamson et al. (2012) who make similar ar-gument).
Furthermore, relative contributions by features toeach construct dimension should be easily obtain-able from the scoring model. To satisfy this require-ment, machine-learning approaches such as supportvector machines (SVMs) with non-linear kernels
12
may be less ideal than a simple straightforward lin-ear regression model, where the contribution of eachfeature in the model is immediately obvious.
Finally, the contribution of each feature to thefinal score should be consistent with the relevantconstructs: if all of the features in the model aredesigned to be positively correlated with humanscores, the coefficients of all such features in the fi-nal model should be positive as well.
Fulfilling all of these requirements when build-ing automated scoring models is not trivial and has,in the past, typically involved the participation andadvice of human content and measurement expertswhose role it is to optimize the feature set so thatit adheres to the aforementioned criteria as much aspossible, while still allowing for good empirical per-formance of the resulting automated scoring model(Zechner et al., 2009; Cheng et al., 2014). However,there are certain limitations to this manual processof scoring- model building, not the least of whichis the aspect of time it takes to build models withiterative evaluations and changes in the feature setcomposition.
Alternatively, one can compute a large number ofpotential features and then use automatic feature se-lection to identify the most suitable subset. This sec-ond approach is commonly used in studies that aimto maximize the performance of machine-learningsystems (cf. for example, Honig et al. (2010) amongmany others), but to our knowledge, it has not yetbeen applied in the assessment context where modelperformance needs to be balanced with model va-lidity in terms of construct coverage and other con-straints such as feature polarity.
We consider several methods of automatic fea-ture selection commonly applied to linear models(Hastie et al., 2013). These include subset selec-tion methods such as step-wise feature selection aswell as shrinkage methods such as Lasso regression(Tibshirani, 1996). We focus on feature selectionmethods that can be scaled to a large number of fea-tures which exclude, for example, the best-subsetapproach, which becomes unfeasible for more than30–40 features. We also exclude methods that usederived input such as principal component regres-sion or partial least squares because the contribu-tion of each feature in the final model would bemore difficult to interpret. Finally, we consider fea-
ture selection methods which make it possible to re-strict the coefficients to positive values. Such restric-tion is not specific to automated scoring and there-fore various algorithms have been developed to ad-dress this requirement (see, for example, Lipovet-sky (2009) for further discussion). We consider sev-eral of such methods including non-negative leastsquares regression Lawson and Hanson (1981) anda constrained version of Lasso regression (Goeman,2010).
In this paper we address the following questions:(a) What methods of automatic feature selection canaddress all or most of the requirements of automatedscoring and therefore are most suitable for this pur-pose? (b) Does more constrained selection affect theperformance of such scoring models? (c) How domodels based on automated feature selection com-pare to models based on human expert feature selec-tion in terms of empirical performance and constructcoverage?
The paper is organized as follows: Section 2 pro-vides a description of the data used in this study, fur-ther details about the feature-selection methods, andthe parameter setting for these methods. Section 3presents the comparison between different feature-selection methods in terms of performance, coeffi-cient polarity, and construct coverage of the selectedfeature subset. Finally, Section 4 summarizes the re-sults of our experiments.
2 Data and Methodology
2.1 Data
The study is based on spoken responses to an En-glish language proficiency test. During the originaltest administration, each speaker provided up to sixresponses. Two of the items required test takers tolisten to an audio file and respond to a prompt aboutthe conversation or lecture they heard. For the othertwo items, the test takers were required to read ashort passage and listen to an audio file, and thenintegrate information from both sources in their re-sponses to that prompt. The remaining two itemsasked the speakers to discuss a particular topic. Allresponses consisted of unscripted speech and wereno longer than 1 minute each.
Both the training and evaluation sets included re-sponses from about 10,000 speakers. With few ex-
13

ceptions, the training set included one response fromeach speaker, for a total of 9,956 responses and9,312 speakers. The evaluation set included a simi-lar number of speakers (8,101), but we used all avail-able responses for each speaker, for a total of 47,642responses1 . There was no overlap of speakers orprompts between the two sets.
All responses were assigned a holistic proficiencyscore by expert raters. The scores ranged from 1(low proficiency) to 4 (high proficiency). The ratersevaluated the overall intelligibility of responses,grammar, the use of vocabulary, and topic develop-ment. About 10% of the responses in the evaluationset and all responses of the training set were scoredby two raters. The agreement between the two raterswas Pearson’s r = 0.63 for the training set and r =0.62 for the evaluation set.
2.2 FeaturesFor each response, we extracted 75 different featureswhich covered five aspects of language proficiency:fluency, pronunciation accuracy, prosody, grammar,and vocabulary. Some examples of such featuresinclude speech rate (fluency), normalized acous-tic model score (pronunciation accuracy), languagemodel score (grammar), and average lexical fre-quency of words used in the response(vocabulary).Several features were closely related: for example,the speech rate was measured in both words per sec-ond and syllables per second.
All features are designed to be positively corre-lated with human proficiency scores. For featuresthat have a negative correlation with a proficiencyscore (such as the number of disfluencies), the val-ues are multiplied by -1 so that the final correlationis always positive.
The features for the baseline EXPERT model weremanually selected by an expert in English languagelearning to fulfill the criteria described in 1. Theexpert only had access to the training set while do-ing the feature selection. The model included 12features which represented the five dimensions oflanguage proficiency described above. The featureswere then used as independent variables in an ordi-nary least squares (OLS) linear regression using the
1A small number of responses originally collected fromthese speakers were not included in the evaluation set due totheir low audio quality or other problems.
proficiency score assigned by the first rater as thedependent variable.
We also built scoring models using all 75 featuresand several methods of automatic feature selection,following (Hastie et al., 2013). These are listed inTable 1.
Table 1: The methods used for automatic feature selec-tion in this study
Name DescriptionALL No feature selection. This model uses
OLS regression and all 75 availablefeatures.
STEP Features were identified by hybridstepwise selection with search in bothdirections
NNLS Features were identified by fitting thenon-negative least squares regressionmodel. (Lawson and Hanson (1981)as implemented by Mullen and VanStokkum (2012))
LASSO Used features that were assigned non-zero coefficients after fitting a Lasso re-gression (Tibshirani, 1996). All esti-mated coefficients were restricted to benon-negative (Goeman, 2010; Goemanet al., 2012). See 2.3 for details aboutparameter tuning.
We used 10-fold cross-validation on the trainingset to estimate model performance and tune the pa-rameters for the Lasso regression. The allocationof responses between the folds was the same for allmodels. In all cases, the feature selection was ap-plied separately to each fold.
The models were evaluated by the correlation be-tween predicted and observed scores, the number offeatures in the final model, the percentage of fea-tures with positive coefficients, and by the numberof constructs that were represented in the automati-cally selected subset model.
2.3 Setting parameters for LASSO model
We trained two versions of the LASSO models:LASSO where λ parameter for L1-regularization wastuned empirically to achieve the best model fit andLASSO* where λ was set to obtain the smallest pos-
14
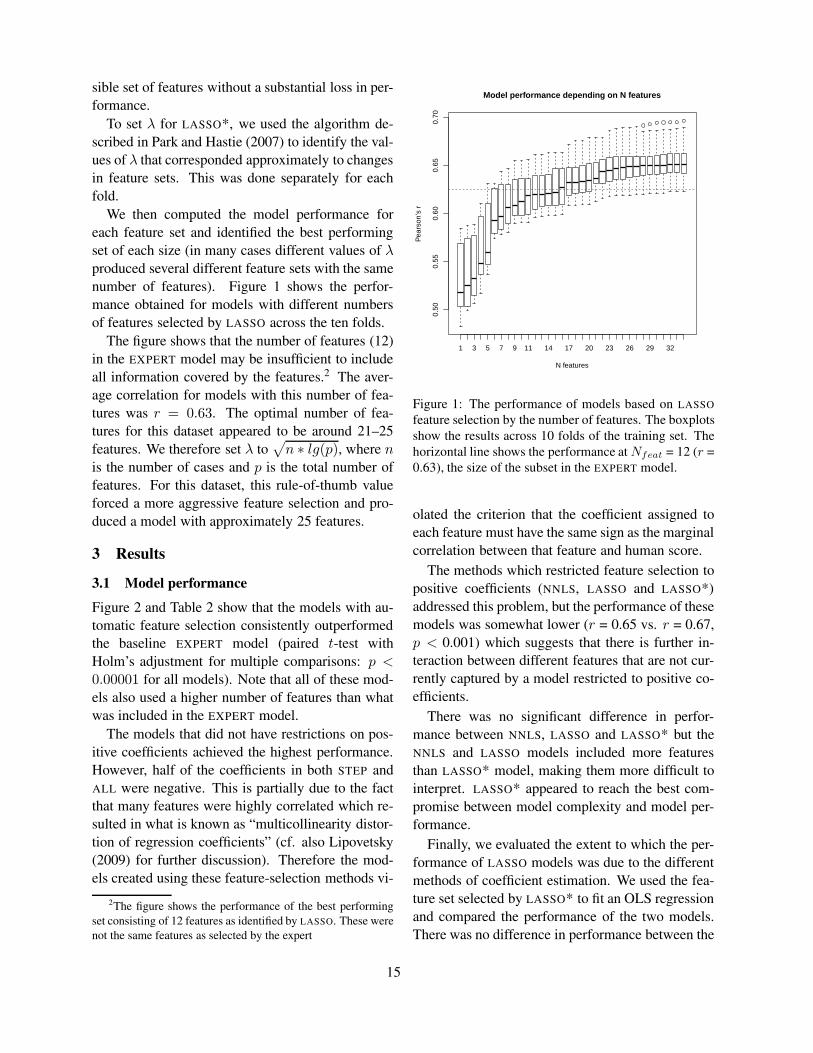
sible set of features without a substantial loss in per-formance.
To set λ for LASSO*, we used the algorithm de-scribed in Park and Hastie (2007) to identify the val-ues of λ that corresponded approximately to changesin feature sets. This was done separately for eachfold.
We then computed the model performance foreach feature set and identified the best performingset of each size (in many cases different values of λproduced several different feature sets with the samenumber of features). Figure 1 shows the perfor-mance obtained for models with different numbersof features selected by LASSO across the ten folds.
The figure shows that the number of features (12)in the EXPERT model may be insufficient to includeall information covered by the features.2 The aver-age correlation for models with this number of fea-tures was r = 0.63. The optimal number of fea-tures for this dataset appeared to be around 21–25features. We therefore set λ to
√n ∗ lg(p), where n
is the number of cases and p is the total number offeatures. For this dataset, this rule-of-thumb valueforced a more aggressive feature selection and pro-duced a model with approximately 25 features.
3 Results
3.1 Model performance
Figure 2 and Table 2 show that the models with au-tomatic feature selection consistently outperformedthe baseline EXPERT model (paired t-test withHolm’s adjustment for multiple comparisons: p <0.00001 for all models). Note that all of these mod-els also used a higher number of features than whatwas included in the EXPERT model.
The models that did not have restrictions on pos-itive coefficients achieved the highest performance.However, half of the coefficients in both STEP andALL were negative. This is partially due to the factthat many features were highly correlated which re-sulted in what is known as “multicollinearity distor-tion of regression coefficients” (cf. also Lipovetsky(2009) for further discussion). Therefore the mod-els created using these feature-selection methods vi-
2The figure shows the performance of the best performingset consisting of 12 features as identified by LASSO. These werenot the same features as selected by the expert
1 3 5 7 9 11 14 17 20 23 26 29 32
0.50
0.55
0.60
0.65
0.70
Model performance depending on N features
N features
Pea
rson
’s r
Figure 1: The performance of models based on LASSOfeature selection by the number of features. The boxplotsshow the results across 10 folds of the training set. Thehorizontal line shows the performance at Nfeat = 12 (r =0.63), the size of the subset in the EXPERT model.
olated the criterion that the coefficient assigned toeach feature must have the same sign as the marginalcorrelation between that feature and human score.
The methods which restricted feature selection topositive coefficients (NNLS, LASSO and LASSO*)addressed this problem, but the performance of thesemodels was somewhat lower (r = 0.65 vs. r = 0.67,p < 0.001) which suggests that there is further in-teraction between different features that are not cur-rently captured by a model restricted to positive co-efficients.
There was no significant difference in perfor-mance between NNLS, LASSO and LASSO* but theNNLS and LASSO models included more featuresthan LASSO* model, making them more difficult tointerpret. LASSO* appeared to reach the best com-promise between model complexity and model per-formance.
Finally, we evaluated the extent to which the per-formance of LASSO models was due to the differentmethods of coefficient estimation. We used the fea-ture set selected by LASSO* to fit an OLS regressionand compared the performance of the two models.There was no difference in performance between the
15
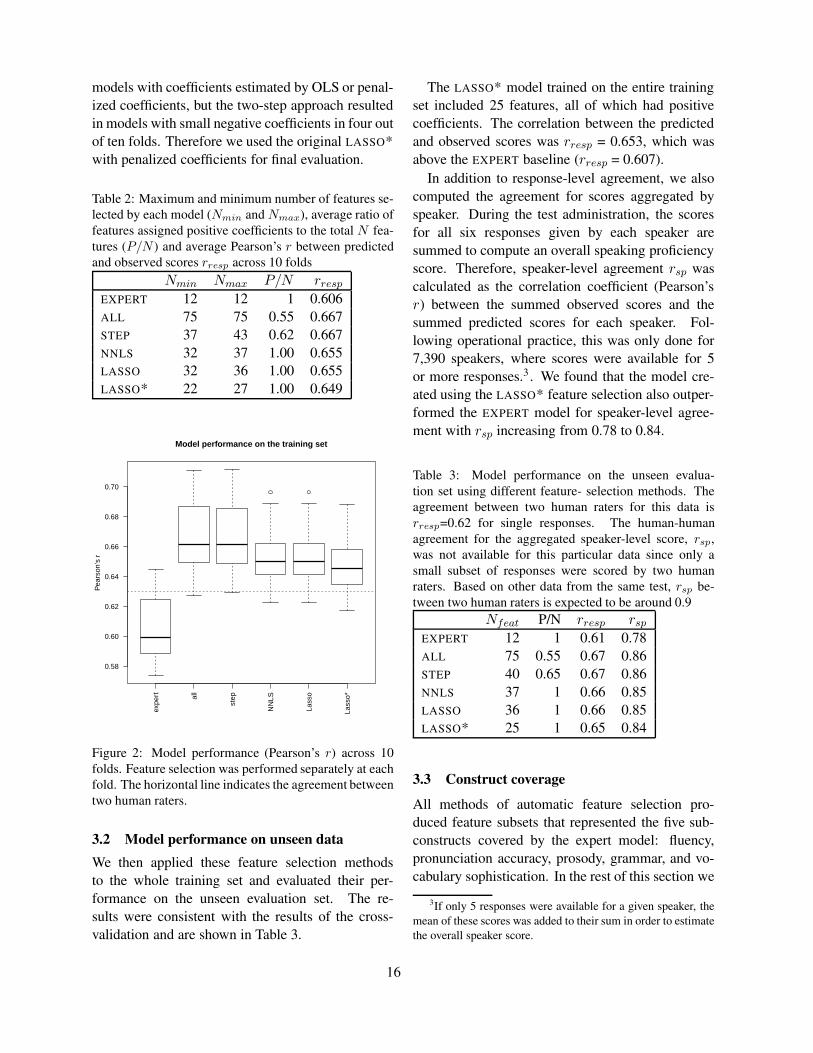
models with coefficients estimated by OLS or penal-ized coefficients, but the two-step approach resultedin models with small negative coefficients in four outof ten folds. Therefore we used the original LASSO*with penalized coefficients for final evaluation.
Table 2: Maximum and minimum number of features se-lected by each model (Nmin and Nmax), average ratio offeatures assigned positive coefficients to the total N fea-tures (P/N ) and average Pearson’s r between predictedand observed scores rresp across 10 folds
Nmin Nmax P/N rresp
EXPERT 12 12 1 0.606ALL 75 75 0.55 0.667STEP 37 43 0.62 0.667NNLS 32 37 1.00 0.655LASSO 32 36 1.00 0.655LASSO* 22 27 1.00 0.649
expe
rt all
step
NN
LS
Lass
o
Lass
o*
0.58
0.60
0.62
0.64
0.66
0.68
0.70
Model performance on the training set
Pea
rson
’s r
Figure 2: Model performance (Pearson’s r) across 10folds. Feature selection was performed separately at eachfold. The horizontal line indicates the agreement betweentwo human raters.
3.2 Model performance on unseen dataWe then applied these feature selection methodsto the whole training set and evaluated their per-formance on the unseen evaluation set. The re-sults were consistent with the results of the cross-validation and are shown in Table 3.
The LASSO* model trained on the entire trainingset included 25 features, all of which had positivecoefficients. The correlation between the predictedand observed scores was rresp = 0.653, which wasabove the EXPERT baseline (rresp = 0.607).
In addition to response-level agreement, we alsocomputed the agreement for scores aggregated byspeaker. During the test administration, the scoresfor all six responses given by each speaker aresummed to compute an overall speaking proficiencyscore. Therefore, speaker-level agreement rsp wascalculated as the correlation coefficient (Pearson’sr) between the summed observed scores and thesummed predicted scores for each speaker. Fol-lowing operational practice, this was only done for7,390 speakers, where scores were available for 5or more responses.3 . We found that the model cre-ated using the LASSO* feature selection also outper-formed the EXPERT model for speaker-level agree-ment with rsp increasing from 0.78 to 0.84.
Table 3: Model performance on the unseen evalua-tion set using different feature- selection methods. Theagreement between two human raters for this data isrresp=0.62 for single responses. The human-humanagreement for the aggregated speaker-level score, rsp,was not available for this particular data since only asmall subset of responses were scored by two humanraters. Based on other data from the same test, rsp be-tween two human raters is expected to be around 0.9
Nfeat P/N rresp rsp
EXPERT 12 1 0.61 0.78ALL 75 0.55 0.67 0.86STEP 40 0.65 0.67 0.86NNLS 37 1 0.66 0.85LASSO 36 1 0.66 0.85LASSO* 25 1 0.65 0.84
3.3 Construct coverage
All methods of automatic feature selection pro-duced feature subsets that represented the five sub-constructs covered by the expert model: fluency,pronunciation accuracy, prosody, grammar, and vo-cabulary sophistication. In the rest of this section we
3If only 5 responses were available for a given speaker, themean of these scores was added to their sum in order to estimatethe overall speaker score.
16
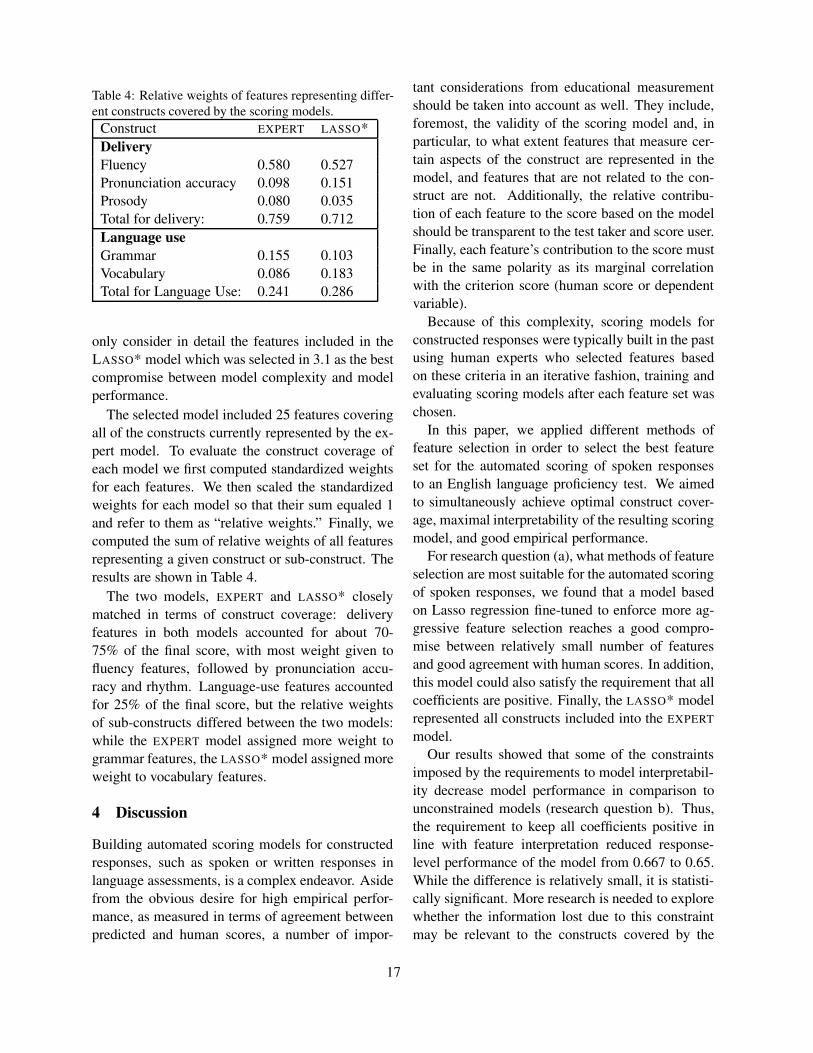
Table 4: Relative weights of features representing differ-ent constructs covered by the scoring models.
Construct EXPERT LASSO*DeliveryFluency 0.580 0.527Pronunciation accuracy 0.098 0.151Prosody 0.080 0.035Total for delivery: 0.759 0.712Language useGrammar 0.155 0.103Vocabulary 0.086 0.183Total for Language Use: 0.241 0.286
only consider in detail the features included in theLASSO* model which was selected in 3.1 as the bestcompromise between model complexity and modelperformance.
The selected model included 25 features coveringall of the constructs currently represented by the ex-pert model. To evaluate the construct coverage ofeach model we first computed standardized weightsfor each features. We then scaled the standardizedweights for each model so that their sum equaled 1and refer to them as “relative weights.” Finally, wecomputed the sum of relative weights of all featuresrepresenting a given construct or sub-construct. Theresults are shown in Table 4.
The two models, EXPERT and LASSO* closelymatched in terms of construct coverage: deliveryfeatures in both models accounted for about 70-75% of the final score, with most weight given tofluency features, followed by pronunciation accu-racy and rhythm. Language-use features accountedfor 25% of the final score, but the relative weightsof sub-constructs differed between the two models:while the EXPERT model assigned more weight togrammar features, the LASSO* model assigned moreweight to vocabulary features.
4 Discussion
Building automated scoring models for constructedresponses, such as spoken or written responses inlanguage assessments, is a complex endeavor. Asidefrom the obvious desire for high empirical perfor-mance, as measured in terms of agreement betweenpredicted and human scores, a number of impor-
tant considerations from educational measurementshould be taken into account as well. They include,foremost, the validity of the scoring model and, inparticular, to what extent features that measure cer-tain aspects of the construct are represented in themodel, and features that are not related to the con-struct are not. Additionally, the relative contribu-tion of each feature to the score based on the modelshould be transparent to the test taker and score user.Finally, each feature’s contribution to the score mustbe in the same polarity as its marginal correlationwith the criterion score (human score or dependentvariable).
Because of this complexity, scoring models forconstructed responses were typically built in the pastusing human experts who selected features basedon these criteria in an iterative fashion, training andevaluating scoring models after each feature set waschosen.
In this paper, we applied different methods offeature selection in order to select the best featureset for the automated scoring of spoken responsesto an English language proficiency test. We aimedto simultaneously achieve optimal construct cover-age, maximal interpretability of the resulting scoringmodel, and good empirical performance.
For research question (a), what methods of featureselection are most suitable for the automated scoringof spoken responses, we found that a model basedon Lasso regression fine-tuned to enforce more ag-gressive feature selection reaches a good compro-mise between relatively small number of featuresand good agreement with human scores. In addition,this model could also satisfy the requirement that allcoefficients are positive. Finally, the LASSO* modelrepresented all constructs included into the EXPERT
model.Our results showed that some of the constraints
imposed by the requirements to model interpretabil-ity decrease model performance in comparison tounconstrained models (research question b). Thus,the requirement to keep all coefficients positive inline with feature interpretation reduced response-level performance of the model from 0.667 to 0.65.While the difference is relatively small, it is statisti-cally significant. More research is needed to explorewhether the information lost due to this constraintmay be relevant to the constructs covered by the
17

model and can be incorporated into a future modelby developing new combined features.
Finally, for research question (c), how automaticand expert feature selection compare in terms ofempirical performance and construct coverage, wefound that in comparison to expert feature selec-tion, computing a large number of features with sub-sequent automatic selection leads to higher perfor-mance (for LASSO*: r = 0.84 vs. r = 0.78 onthe evaluation set for aggregated scores for each testtaker) while maintaining construct validity and inter-pretability of the resulting models. Furthermore, thefeature subset produced by LASSO* closely matchedthe EXPERT model in terms of the relative contribu-tion of each construct.
To summarize, the application of Lasso regressionto feature selection for automated speech scoringmade it possible to rapidly build models which bothachieved higher performance than the expert base-line and also satisfied the requirements of constructcoverage and interpretability of the model posed bythe assessment context. In this respect, Lasso re-gression was superior to other common methods offeature selection such as step-wise selection, whichcould not satisfy all of these requirements.
In this study, the features selected by LASSO*showed consistently good construct coverage across10 folds of the training set. Yet it is possible thatfor a different dataset the LASSO* method may leadto a feature subset which is considered sub-optimalby an expert. In this case, the automatically selectedfeature set can be adjusted by the expert to ensureappropriate construct coverage by adding additionalfeatures to the model or removing unwanted fea-tures from the original feature set and re-running themodel to estimate the coefficients. Of course, suchadjustments may lead to a loss in performance, inwhich case the optimal balance between constructvalidity and model performance will be determinedby other considerations such as the nature of the as-sessment or the role of the automated scoring systemin determining the final score.
5 Conclusion
In this paper we compared a range of differentmethods for the purpose of feature selection for theautomated scoring models of spoken language in
the context of language assessment and educationalmeasurement.
Based on a number of criteria as to what consti-tutes scoring models that have not only high empir-ical performance, are valid from a construct pointof view, and interpretable for the test taker or scoreuser, we demonstrated that in using the LASSO*method all criteria can be satisfied: the resultingscoring model has construct coverage commensu-rate to that built by a human expert and its empiricalperformance is, at the same time, superior.
In future work, we plan to refine the automatedfeature selection process by using construct con-straints directly in the feature selection procedure.
Acknowledgments
We would like to thank Lawrence Davis and Flo-rian Lorenz for their feedback and discussion; Kee-lan Evanini, Jidong Tao and Su-Youn Yoon for theircomments on the final draft and Rene Lawless foreditorial help.
ReferencesJared Bernstein, Alistaire Van Moere, and Jian Cheng.
2010. Validating automated speaking tests. LanguageTesting, 27(3):355–377.
Jill Burstein, Karen Kukich, Susanne Wolff, Chi Lu,Martin Chodorow, Lisa Braden-Harder, and Mary DeeHarris. 1998. Automated scoring using a hybridfeature identification technique. In Proceedings ofthe 36th annual meeting on Association for Computa-tional Linguistics - and 17th International Conferenceon Computational Linguistics, volume 1, pages 206–210, Morristown, NJ, USA. Association for Computa-tional Linguistics.
Jian Cheng, Yuan Zhao D’Antilio, Xin Chen, and JaredBernstein. 2014. Automatic Assessment of theSpeech of Young English Learners. Proceedings of the9th Workshop on Innovative Use of NLP for BuildingEducational Applications, pages 12–21.
Maxine Eskenazi. 2009. An overview of spoken lan-guage technology for education. Speech Communica-tion, 51(10):832–844.
Jelle J. Goeman, Rosa Meijer, and Nimisha Chaturverdi.2012. Penalized L1 (lasso and fused lasso) and L2(ridge) penalized estimation in GLMs and in the Coxmodel. R package version 0.9-42.
Jelle J. Goeman. 2010. L1 penalized estimation in theCox proportional hazards model. Biometrical journal,52(1):70–84.
18
Trevor Hastie, Robert Tibshirani, and Jerome Friedman.2013. The Elements of Statistical Learning: DataMining, Inference, and Prediction, Second Edition(Springer Series in Statistics). Springer, 2nd edition.
Florian Honig, Anton Batliner, Karl Weilhammer, andElmar Noth. 2010. Automatic assessment of non-native prosody for english as L2. Speech Prosody2010, 100973(1):1–4.
Thomas K. Landauer, D. Laham, and Peter W. Foltz.2003. Automated scoring and annotation of essayswith the Intelligent Essay Assessor. In Mark D. Sher-mis and Jill C. Burstein, editors, Automated essayscoring: A cross-disciplinary perspective, pages 87–112. Erlbaum, Hillsdale, NJ.
Charles L. Lawson and Richard J. Hanson. 1981. SolvingLeast Squares Problems. Prentice-Hall, EnglewoodCliffs, NJ, January.
Stan Lipovetsky. 2009. Linear regression with specialcoefficient features attained via parameterization in ex-ponential, logistic, and multinomiallogit forms. Math-ematical and Computer Modelling, 49(7-8):1427–1435.
Katharine M. Mullen and Ivo H.M. Van Stokkum. 2012.nnls: The Lawson-Hanson algorithm for non-negativeleast squares (NNLS). R package version 1.4.
Ellis B. Page. 1966. The imminence of... grading essaysby computer. The Phi Delta Kappan, 47(5):238–243.
Mee Young Park and Trevor Hastie. 2007. L1-regularization path algorithm for generalized linearmodels. Journal of the Royal Statistical Society: Se-ries B (Statistical Methodology), 69(4):659–677.
Chaitanya Ramineni and David M. Williamson. 2013.Automated essay scoring: Psychometric guidelinesand practices. Assessing Writing, 18(1):25–39, Jan-uary.
Robert Tibshirani. 1996. Regression shrinkages andselection via the Lasso. Journal of the Royal Sta-tistical Society: Series B (Statistical Methodology),58(1):267–288.
David M. Williamson, Xiaoming Xi, and F. Jay Breyer.2012. A framework for evaluation and use of auto-mated scoring. Educational measurement: issues andpractice, 31(1):2–13.
Klaus Zechner, Derrick Higgins, Xiaoming Xi, andDavid M. Williamson. 2009. Automatic scoring ofnon-native spontaneous speech in tests of spoken En-glish. Speech Communication, 51(10):883–895.
19
Proceedings of the Tenth Workshop on Innovative Use of NLP for Building Educational Applications, 2015, pages 20–30,Denver, Colorado, June 4, 2015. c©2015 Association for Computational Linguistics
Incorporating Coherence of Topics as a Criterion in AutomaticResponse-to-Text Assessment of the Organization of Writing
Zahra Rahimi1, Diane Litman1,2,3, Elaine Wang3, Richard Correnti31Intelligent Systems Program, 2Department of Computer Science
3Learning Research and Development CenterUniversity of Pittsburgh
Pittsburgh, PA 15260{zar10,dlitman,elw51,rcorrent}@pitt.edu
Abstract
This paper presents an investigation of scoreprediction for the Organization dimension ofan assessment of analytical writing in re-sponse to text. With the long-term goal ofproducing feedback for students and teach-ers, we designed a task-dependent model thataligns with the scoring rubric and makes useof the source material. Our experimental re-sults show that our rubric-based model per-forms as well as baselines on datasets fromgrades 6-8. On shorter and noisier essays fromgrades 5-6, the rubric-based model performsbetter than the baselines. Further, we showthat the baseline model (lexical chaining) canbe improved if we extend it with informationfrom the source text for shorter and noisierdata.
1 Introduction
As a construct, ‘Organization’ has figured in sys-tems for scoring student writing for decades. Onthe NAEP (National Assessment of EducationalProgress), the organization of the text, coherence,and focus are judged in relation to the writer’s pur-pose and audience (National Assessment GoverningBoard, 2010) to determine a single holistic score.Alternatively, when organization is considered asa separate dimension, some surface features of or-ganization are considered. Such surface featuresinclude: effective sequencing; strong inviting be-ginning; strong satisfying conclusion; and smoothtransitions1. Assessments aligned to the Common
1Retrieved from http://www.rubrics4teachers.com/pdf/6TRAITSWRITING.pdf, February 25, 2015
Core State Standards (CCSS), the academic stan-dards adopted widely in 2011 that guide K-12 ed-ucation, reflect a shift in thinking about the scoringof organization in writing to consider the coherenceof ideas in the text2. The consideration of coherenceas a critical aspect of organization of writing is rela-tively new.
Notably, prior studies in natural language process-ing have examined the concept of discourse coher-ence, which is highly related to the coherence oftopics in an essay, as a measure of the organizationof analytic writing. For example, in Somasundaranet al. (2014) the coherence elements are adherenceto the essay topic, elaboration, usage of varied vo-cabulary, and sound organization of thoughts andideas. In Crossley and McNamara (2011) the ele-ments are effective lead, clear purpose, clear plan,topic sentences, paragraph transitions, organization,unity, perspective, conviction, grammar, syntax, andmechanics.
Many computational methods are used to measuresuch elements of discourse coherence. Vector-basedsimilarity methods measure lexical relatedness be-tween text segments (Foltz et al., 1998) or betweendiscourse segments (Higgins et al., 2004). Centeringtheory (Grosz et al., 1995) addresses local coherence(Miltsakaki and Kukich, 2000). Entity-based essayrepresentation along with type/token ratios for eachsyntactic role is another method to evaluate coher-
2See, e.g., Grades 4 and 5 Expanded rubricfor analytic and narrative writing retrieved fromhttp://www.parcconline.org/sites/parcc/files/Grade 4-5 ELAExpanded Rubric FOR ANALYTIC AND NARRATIVEWRITING 0.pdf
20
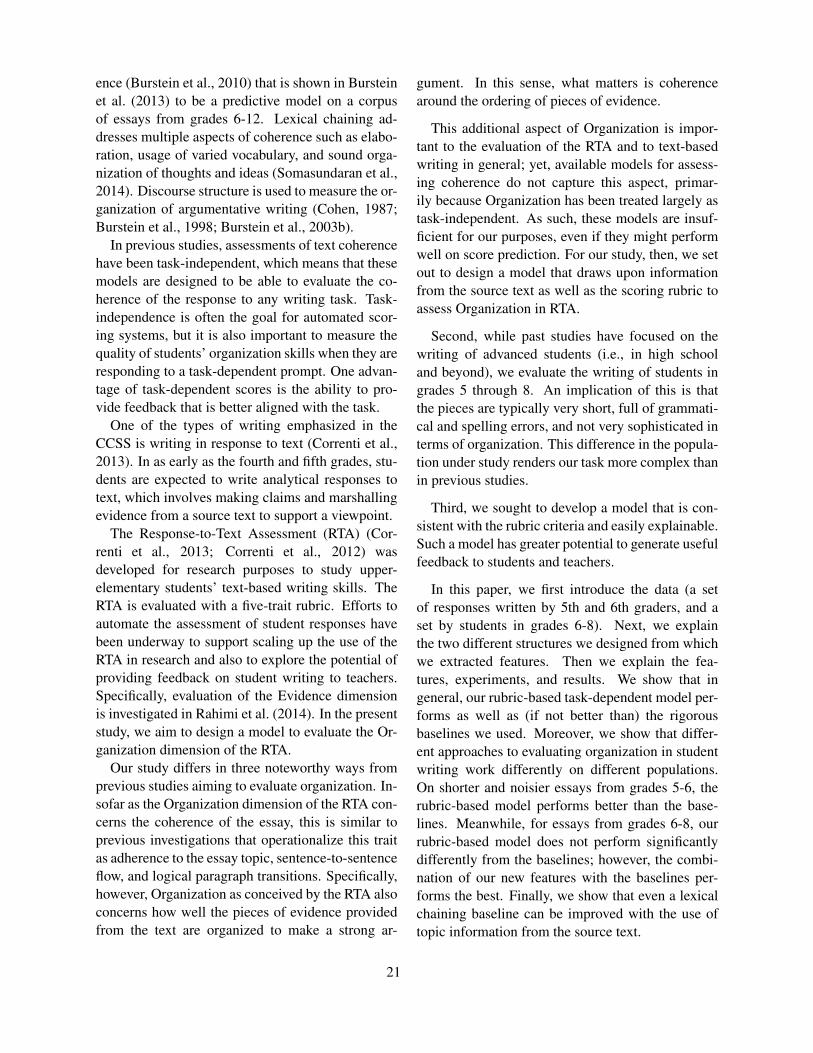
ence (Burstein et al., 2010) that is shown in Bursteinet al. (2013) to be a predictive model on a corpusof essays from grades 6-12. Lexical chaining ad-dresses multiple aspects of coherence such as elabo-ration, usage of varied vocabulary, and sound orga-nization of thoughts and ideas (Somasundaran et al.,2014). Discourse structure is used to measure the or-ganization of argumentative writing (Cohen, 1987;Burstein et al., 1998; Burstein et al., 2003b).
In previous studies, assessments of text coherencehave been task-independent, which means that thesemodels are designed to be able to evaluate the co-herence of the response to any writing task. Task-independence is often the goal for automated scor-ing systems, but it is also important to measure thequality of students’ organization skills when they areresponding to a task-dependent prompt. One advan-tage of task-dependent scores is the ability to pro-vide feedback that is better aligned with the task.
One of the types of writing emphasized in theCCSS is writing in response to text (Correnti et al.,2013). In as early as the fourth and fifth grades, stu-dents are expected to write analytical responses totext, which involves making claims and marshallingevidence from a source text to support a viewpoint.
The Response-to-Text Assessment (RTA) (Cor-renti et al., 2013; Correnti et al., 2012) wasdeveloped for research purposes to study upper-elementary students’ text-based writing skills. TheRTA is evaluated with a five-trait rubric. Efforts toautomate the assessment of student responses havebeen underway to support scaling up the use of theRTA in research and also to explore the potential ofproviding feedback on student writing to teachers.Specifically, evaluation of the Evidence dimensionis investigated in Rahimi et al. (2014). In the presentstudy, we aim to design a model to evaluate the Or-ganization dimension of the RTA.
Our study differs in three noteworthy ways fromprevious studies aiming to evaluate organization. In-sofar as the Organization dimension of the RTA con-cerns the coherence of the essay, this is similar toprevious investigations that operationalize this traitas adherence to the essay topic, sentence-to-sentenceflow, and logical paragraph transitions. Specifically,however, Organization as conceived by the RTA alsoconcerns how well the pieces of evidence providedfrom the text are organized to make a strong ar-
gument. In this sense, what matters is coherencearound the ordering of pieces of evidence.
This additional aspect of Organization is impor-tant to the evaluation of the RTA and to text-basedwriting in general; yet, available models for assess-ing coherence do not capture this aspect, primar-ily because Organization has been treated largely astask-independent. As such, these models are insuf-ficient for our purposes, even if they might performwell on score prediction. For our study, then, we setout to design a model that draws upon informationfrom the source text as well as the scoring rubric toassess Organization in RTA.
Second, while past studies have focused on thewriting of advanced students (i.e., in high schooland beyond), we evaluate the writing of students ingrades 5 through 8. An implication of this is thatthe pieces are typically very short, full of grammati-cal and spelling errors, and not very sophisticated interms of organization. This difference in the popula-tion under study renders our task more complex thanin previous studies.
Third, we sought to develop a model that is con-sistent with the rubric criteria and easily explainable.Such a model has greater potential to generate usefulfeedback to students and teachers.
In this paper, we first introduce the data (a setof responses written by 5th and 6th graders, and aset by students in grades 6-8). Next, we explainthe two different structures we designed from whichwe extracted features. Then we explain the fea-tures, experiments, and results. We show that ingeneral, our rubric-based task-dependent model per-forms as well as (if not better than) the rigorousbaselines we used. Moreover, we show that differ-ent approaches to evaluating organization in studentwriting work differently on different populations.On shorter and noisier essays from grades 5-6, therubric-based model performs better than the base-lines. Meanwhile, for essays from grades 6-8, ourrubric-based model does not perform significantlydifferently from the baselines; however, the combi-nation of our new features with the baselines per-forms the best. Finally, we show that even a lexicalchaining baseline can be improved with the use oftopic information from the source text.
21
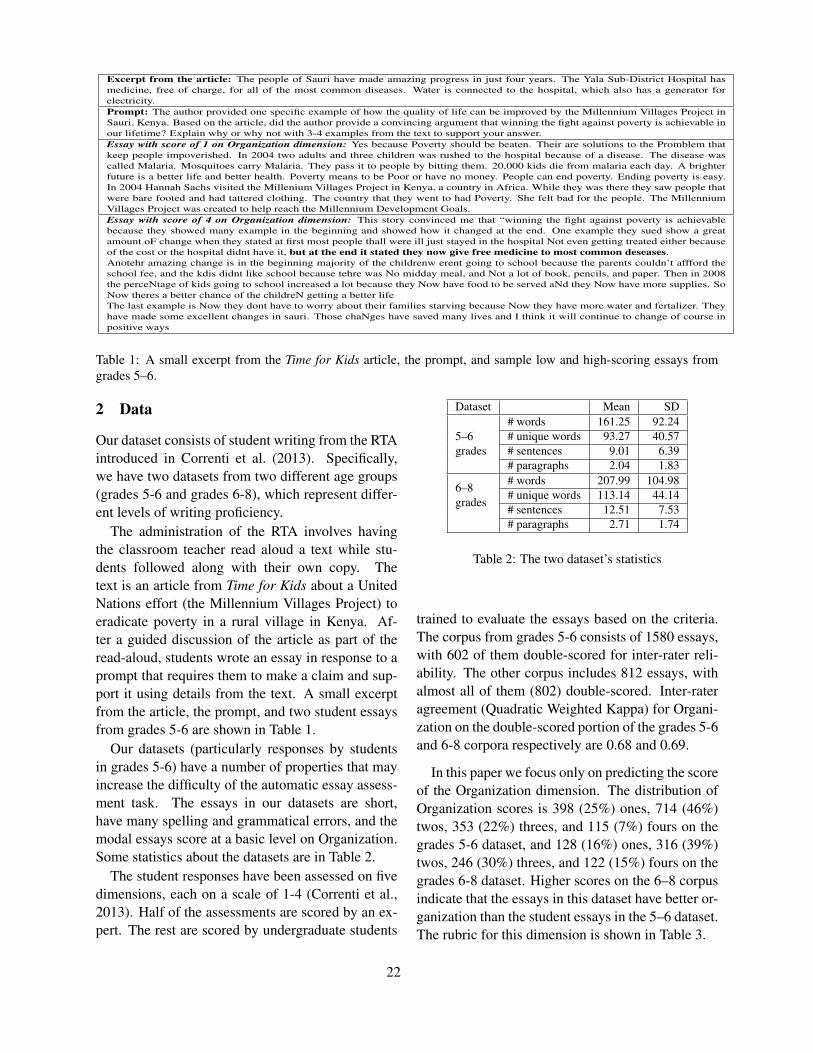
Excerpt from the article: The people of Sauri have made amazing progress in just four years. The Yala Sub-District Hospital hasmedicine, free of charge, for all of the most common diseases. Water is connected to the hospital, which also has a generator forelectricity.Prompt: The author provided one specific example of how the quality of life can be improved by the Millennium Villages Project inSauri, Kenya. Based on the article, did the author provide a convincing argument that winning the fight against poverty is achievable inour lifetime? Explain why or why not with 3-4 examples from the text to support your answer.Essay with score of 1 on Organization dimension: Yes because Poverty should be beaten. Their are solutions to the Promblem thatkeep people impoverished. In 2004 two adults and three children was rushed to the hospital because of a disease. The disease wascalled Malaria. Mosquitoes carry Malaria. They pass it to people by bitting them. 20,000 kids die from malaria each day. A brighterfuture is a better life and better health. Poverty means to be Poor or have no money. People can end poverty. Ending poverty is easy.In 2004 Hannah Sachs visited the Millenium Villages Project in Kenya, a country in Africa. While they was there they saw people thatwere bare footed and had tattered clothing. The country that they went to had Poverty. She felt bad for the people. The MillenniumVillages Project was created to help reach the Millennium Development Goals.Essay with score of 4 on Organization dimension: This story convinced me that “winning the fight against poverty is achievablebecause they showed many example in the beginning and showed how it changed at the end. One example they sued show a greatamount oF change when they stated at first most people thall were ill just stayed in the hospital Not even getting treated either becauseof the cost or the hospital didnt have it, but at the end it stated they now give free medicine to most common deseases.Anotehr amazing change is in the beginning majority of the childrenw erent going to school because the parents couldn’t affford theschool fee, and the kdis didnt like school because tehre was No midday meal, and Not a lot of book, pencils, and paper. Then in 2008the perceNtage of kids going to school increased a lot because they Now have food to be served aNd they Now have more supplies. SoNow theres a better chance of the childreN getting a better lifeThe last example is Now they dont have to worry about their families starving because Now they have more water and fertalizer. Theyhave made some excellent changes in sauri. Those chaNges have saved many lives and I think it will continue to change of course inpositive ways
Table 1: A small excerpt from the Time for Kids article, the prompt, and sample low and high-scoring essays fromgrades 5–6.
2 Data
Our dataset consists of student writing from the RTAintroduced in Correnti et al. (2013). Specifically,we have two datasets from two different age groups(grades 5-6 and grades 6-8), which represent differ-ent levels of writing proficiency.
The administration of the RTA involves havingthe classroom teacher read aloud a text while stu-dents followed along with their own copy. Thetext is an article from Time for Kids about a UnitedNations effort (the Millennium Villages Project) toeradicate poverty in a rural village in Kenya. Af-ter a guided discussion of the article as part of theread-aloud, students wrote an essay in response to aprompt that requires them to make a claim and sup-port it using details from the text. A small excerptfrom the article, the prompt, and two student essaysfrom grades 5-6 are shown in Table 1.
Our datasets (particularly responses by studentsin grades 5-6) have a number of properties that mayincrease the difficulty of the automatic essay assess-ment task. The essays in our datasets are short,have many spelling and grammatical errors, and themodal essays score at a basic level on Organization.Some statistics about the datasets are in Table 2.
The student responses have been assessed on fivedimensions, each on a scale of 1-4 (Correnti et al.,2013). Half of the assessments are scored by an ex-pert. The rest are scored by undergraduate students
Dataset Mean SD
5–6grades
# words 161.25 92.24# unique words 93.27 40.57# sentences 9.01 6.39# paragraphs 2.04 1.83
6–8grades
# words 207.99 104.98# unique words 113.14 44.14# sentences 12.51 7.53# paragraphs 2.71 1.74
Table 2: The two dataset’s statistics
trained to evaluate the essays based on the criteria.The corpus from grades 5-6 consists of 1580 essays,with 602 of them double-scored for inter-rater reli-ability. The other corpus includes 812 essays, withalmost all of them (802) double-scored. Inter-rateragreement (Quadratic Weighted Kappa) for Organi-zation on the double-scored portion of the grades 5-6and 6-8 corpora respectively are 0.68 and 0.69.
In this paper we focus only on predicting the scoreof the Organization dimension. The distribution ofOrganization scores is 398 (25%) ones, 714 (46%)twos, 353 (22%) threes, and 115 (7%) fours on thegrades 5-6 dataset, and 128 (16%) ones, 316 (39%)twos, 246 (30%) threes, and 122 (15%) fours on thegrades 6-8 dataset. Higher scores on the 6–8 corpusindicate that the essays in this dataset have better or-ganization than the student essays in the 5–6 dataset.The rubric for this dimension is shown in Table 3.
22
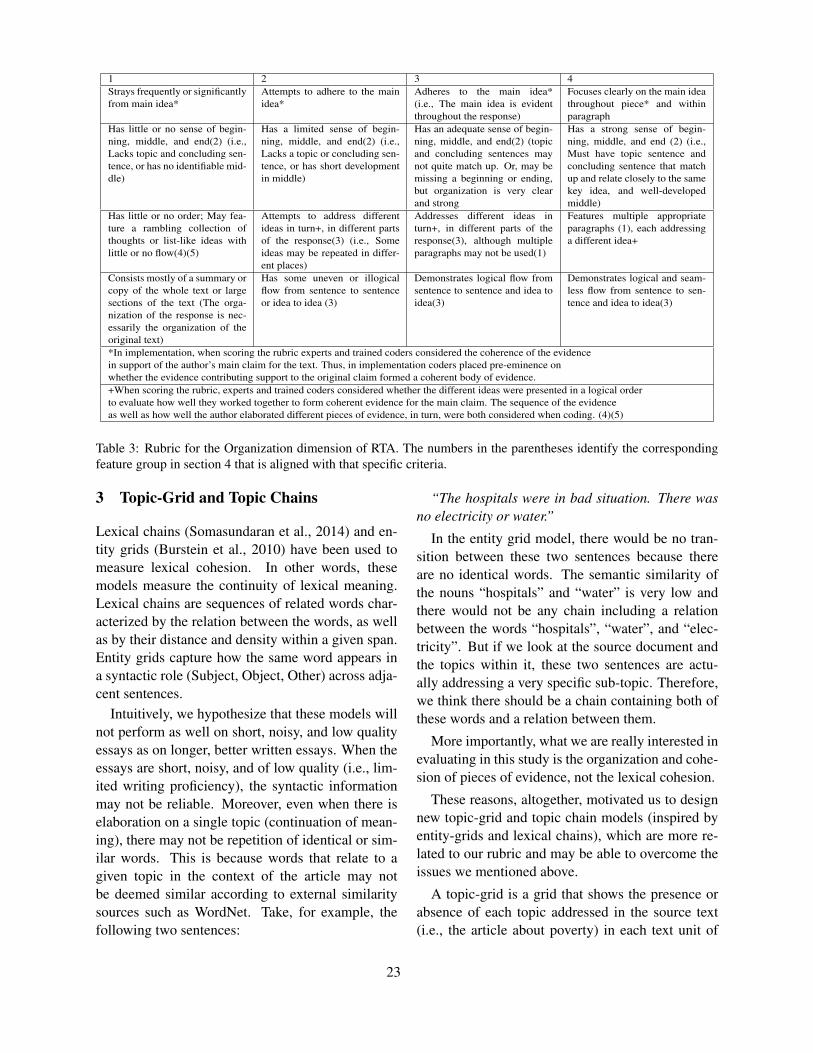
1 2 3 4Strays frequently or significantlyfrom main idea*
Attempts to adhere to the mainidea*
Adheres to the main idea*(i.e., The main idea is evidentthroughout the response)
Focuses clearly on the main ideathroughout piece* and withinparagraph
Has little or no sense of begin-ning, middle, and end(2) (i.e.,Lacks topic and concluding sen-tence, or has no identifiable mid-dle)
Has a limited sense of begin-ning, middle, and end(2) (i.e.,Lacks a topic or concluding sen-tence, or has short developmentin middle)
Has an adequate sense of begin-ning, middle, and end(2) (topicand concluding sentences maynot quite match up. Or, may bemissing a beginning or ending,but organization is very clearand strong
Has a strong sense of begin-ning, middle, and end (2) (i.e.,Must have topic sentence andconcluding sentence that matchup and relate closely to the samekey idea, and well-developedmiddle)
Has little or no order; May fea-ture a rambling collection ofthoughts or list-like ideas withlittle or no flow(4)(5)
Attempts to address differentideas in turn+, in different partsof the response(3) (i.e., Someideas may be repeated in differ-ent places)
Addresses different ideas inturn+, in different parts of theresponse(3), although multipleparagraphs may not be used(1)
Features multiple appropriateparagraphs (1), each addressinga different idea+
Consists mostly of a summary orcopy of the whole text or largesections of the text (The orga-nization of the response is nec-essarily the organization of theoriginal text)
Has some uneven or illogicalflow from sentence to sentenceor idea to idea (3)
Demonstrates logical flow fromsentence to sentence and idea toidea(3)
Demonstrates logical and seam-less flow from sentence to sen-tence and idea to idea(3)
*In implementation, when scoring the rubric experts and trained coders considered the coherence of the evidencein support of the author’s main claim for the text. Thus, in implementation coders placed pre-eminence onwhether the evidence contributing support to the original claim formed a coherent body of evidence.+When scoring the rubric, experts and trained coders considered whether the different ideas were presented in a logical orderto evaluate how well they worked together to form coherent evidence for the main claim. The sequence of the evidenceas well as how well the author elaborated different pieces of evidence, in turn, were both considered when coding. (4)(5)
Table 3: Rubric for the Organization dimension of RTA. The numbers in the parentheses identify the correspondingfeature group in section 4 that is aligned with that specific criteria.
3 Topic-Grid and Topic Chains
Lexical chains (Somasundaran et al., 2014) and en-tity grids (Burstein et al., 2010) have been used tomeasure lexical cohesion. In other words, thesemodels measure the continuity of lexical meaning.Lexical chains are sequences of related words char-acterized by the relation between the words, as wellas by their distance and density within a given span.Entity grids capture how the same word appears ina syntactic role (Subject, Object, Other) across adja-cent sentences.
Intuitively, we hypothesize that these models willnot perform as well on short, noisy, and low qualityessays as on longer, better written essays. When theessays are short, noisy, and of low quality (i.e., lim-ited writing proficiency), the syntactic informationmay not be reliable. Moreover, even when there iselaboration on a single topic (continuation of mean-ing), there may not be repetition of identical or sim-ilar words. This is because words that relate to agiven topic in the context of the article may notbe deemed similar according to external similaritysources such as WordNet. Take, for example, thefollowing two sentences:
“The hospitals were in bad situation. There wasno electricity or water.”
In the entity grid model, there would be no tran-sition between these two sentences because thereare no identical words. The semantic similarity ofthe nouns “hospitals” and “water” is very low andthere would not be any chain including a relationbetween the words “hospitals”, “water”, and “elec-tricity”. But if we look at the source document andthe topics within it, these two sentences are actu-ally addressing a very specific sub-topic. Therefore,we think there should be a chain containing both ofthese words and a relation between them.
More importantly, what we are really interested inevaluating in this study is the organization and cohe-sion of pieces of evidence, not the lexical cohesion.
These reasons, altogether, motivated us to designnew topic-grid and topic chain models (inspired byentity-grids and lexical chains), which are more re-lated to our rubric and may be able to overcome theissues we mentioned above.
A topic-grid is a grid that shows the presence orabsence of each topic addressed in the source text(i.e., the article about poverty) in each text unit of
23
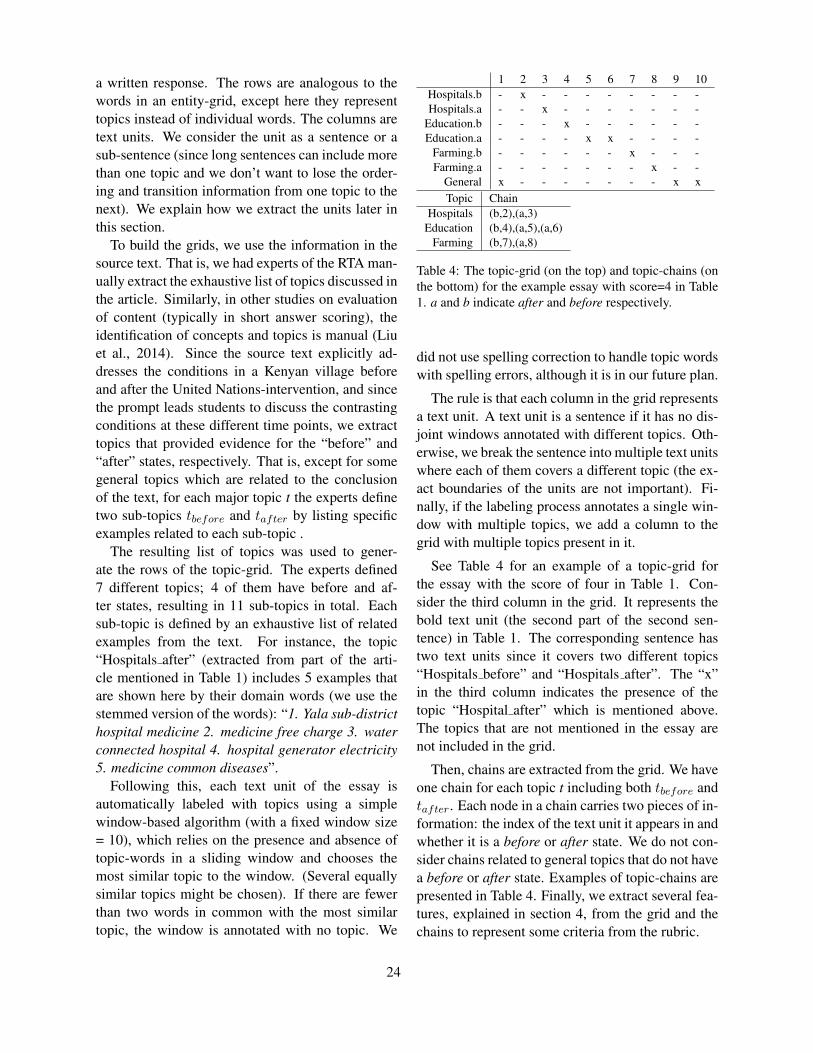
a written response. The rows are analogous to thewords in an entity-grid, except here they representtopics instead of individual words. The columns aretext units. We consider the unit as a sentence or asub-sentence (since long sentences can include morethan one topic and we don’t want to lose the order-ing and transition information from one topic to thenext). We explain how we extract the units later inthis section.
To build the grids, we use the information in thesource text. That is, we had experts of the RTA man-ually extract the exhaustive list of topics discussed inthe article. Similarly, in other studies on evaluationof content (typically in short answer scoring), theidentification of concepts and topics is manual (Liuet al., 2014). Since the source text explicitly ad-dresses the conditions in a Kenyan village beforeand after the United Nations-intervention, and sincethe prompt leads students to discuss the contrastingconditions at these different time points, we extracttopics that provided evidence for the “before” and“after” states, respectively. That is, except for somegeneral topics which are related to the conclusionof the text, for each major topic t the experts definetwo sub-topics tbefore and tafter by listing specificexamples related to each sub-topic .
The resulting list of topics was used to gener-ate the rows of the topic-grid. The experts defined7 different topics; 4 of them have before and af-ter states, resulting in 11 sub-topics in total. Eachsub-topic is defined by an exhaustive list of relatedexamples from the text. For instance, the topic“Hospitals after” (extracted from part of the arti-cle mentioned in Table 1) includes 5 examples thatare shown here by their domain words (we use thestemmed version of the words): “1. Yala sub-districthospital medicine 2. medicine free charge 3. waterconnected hospital 4. hospital generator electricity5. medicine common diseases”.
Following this, each text unit of the essay isautomatically labeled with topics using a simplewindow-based algorithm (with a fixed window size= 10), which relies on the presence and absence oftopic-words in a sliding window and chooses themost similar topic to the window. (Several equallysimilar topics might be chosen). If there are fewerthan two words in common with the most similartopic, the window is annotated with no topic. We
1 2 3 4 5 6 7 8 9 10Hospitals.b - x - - - - - - - -Hospitals.a - - x - - - - - - -
Education.b - - - x - - - - - -Education.a - - - - x x - - - -
Farming.b - - - - - - x - - -Farming.a - - - - - - - x - -
General x - - - - - - - x xTopic Chain
Hospitals (b,2),(a,3)Education (b,4),(a,5),(a,6)
Farming (b,7),(a,8)
Table 4: The topic-grid (on the top) and topic-chains (onthe bottom) for the example essay with score=4 in Table1. a and b indicate after and before respectively.
did not use spelling correction to handle topic wordswith spelling errors, although it is in our future plan.
The rule is that each column in the grid representsa text unit. A text unit is a sentence if it has no dis-joint windows annotated with different topics. Oth-erwise, we break the sentence into multiple text unitswhere each of them covers a different topic (the ex-act boundaries of the units are not important). Fi-nally, if the labeling process annotates a single win-dow with multiple topics, we add a column to thegrid with multiple topics present in it.
See Table 4 for an example of a topic-grid forthe essay with the score of four in Table 1. Con-sider the third column in the grid. It represents thebold text unit (the second part of the second sen-tence) in Table 1. The corresponding sentence hastwo text units since it covers two different topics“Hospitals before” and “Hospitals after”. The “x”in the third column indicates the presence of thetopic “Hospital after” which is mentioned above.The topics that are not mentioned in the essay arenot included in the grid.
Then, chains are extracted from the grid. We haveone chain for each topic t including both tbefore andtafter. Each node in a chain carries two pieces of in-formation: the index of the text unit it appears in andwhether it is a before or after state. We do not con-sider chains related to general topics that do not havea before or after state. Examples of topic-chains arepresented in Table 4. Finally, we extract several fea-tures, explained in section 4, from the grid and thechains to represent some criteria from the rubric.
24
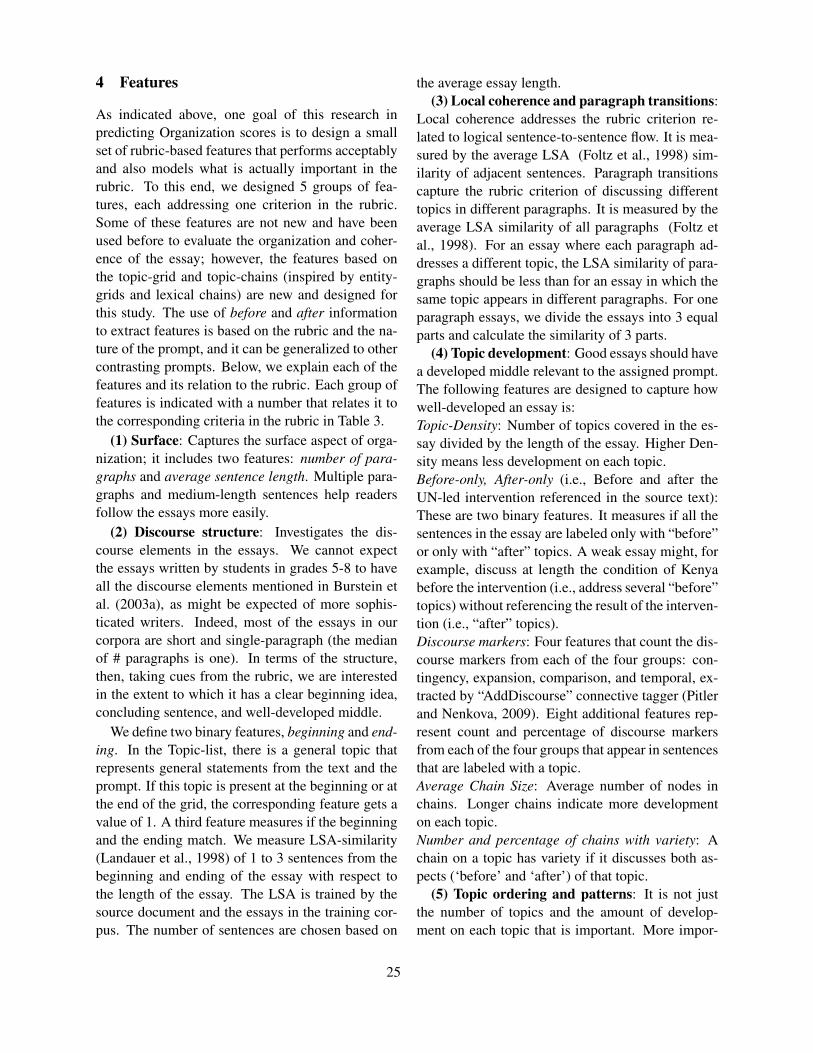
4 Features
As indicated above, one goal of this research inpredicting Organization scores is to design a smallset of rubric-based features that performs acceptablyand also models what is actually important in therubric. To this end, we designed 5 groups of fea-tures, each addressing one criterion in the rubric.Some of these features are not new and have beenused before to evaluate the organization and coher-ence of the essay; however, the features based onthe topic-grid and topic-chains (inspired by entity-grids and lexical chains) are new and designed forthis study. The use of before and after informationto extract features is based on the rubric and the na-ture of the prompt, and it can be generalized to othercontrasting prompts. Below, we explain each of thefeatures and its relation to the rubric. Each group offeatures is indicated with a number that relates it tothe corresponding criteria in the rubric in Table 3.
(1) Surface: Captures the surface aspect of orga-nization; it includes two features: number of para-graphs and average sentence length. Multiple para-graphs and medium-length sentences help readersfollow the essays more easily.
(2) Discourse structure: Investigates the dis-course elements in the essays. We cannot expectthe essays written by students in grades 5-8 to haveall the discourse elements mentioned in Burstein etal. (2003a), as might be expected of more sophis-ticated writers. Indeed, most of the essays in ourcorpora are short and single-paragraph (the medianof # paragraphs is one). In terms of the structure,then, taking cues from the rubric, we are interestedin the extent to which it has a clear beginning idea,concluding sentence, and well-developed middle.
We define two binary features, beginning and end-ing. In the Topic-list, there is a general topic thatrepresents general statements from the text and theprompt. If this topic is present at the beginning or atthe end of the grid, the corresponding feature gets avalue of 1. A third feature measures if the beginningand the ending match. We measure LSA-similarity(Landauer et al., 1998) of 1 to 3 sentences from thebeginning and ending of the essay with respect tothe length of the essay. The LSA is trained by thesource document and the essays in the training cor-pus. The number of sentences are chosen based on
the average essay length.(3) Local coherence and paragraph transitions:
Local coherence addresses the rubric criterion re-lated to logical sentence-to-sentence flow. It is mea-sured by the average LSA (Foltz et al., 1998) sim-ilarity of adjacent sentences. Paragraph transitionscapture the rubric criterion of discussing differenttopics in different paragraphs. It is measured by theaverage LSA similarity of all paragraphs (Foltz etal., 1998). For an essay where each paragraph ad-dresses a different topic, the LSA similarity of para-graphs should be less than for an essay in which thesame topic appears in different paragraphs. For oneparagraph essays, we divide the essays into 3 equalparts and calculate the similarity of 3 parts.
(4) Topic development: Good essays should havea developed middle relevant to the assigned prompt.The following features are designed to capture howwell-developed an essay is:Topic-Density: Number of topics covered in the es-say divided by the length of the essay. Higher Den-sity means less development on each topic.Before-only, After-only (i.e., Before and after theUN-led intervention referenced in the source text):These are two binary features. It measures if all thesentences in the essay are labeled only with “before”or only with “after” topics. A weak essay might, forexample, discuss at length the condition of Kenyabefore the intervention (i.e., address several “before”topics) without referencing the result of the interven-tion (i.e., “after” topics).Discourse markers: Four features that count the dis-course markers from each of the four groups: con-tingency, expansion, comparison, and temporal, ex-tracted by “AddDiscourse” connective tagger (Pitlerand Nenkova, 2009). Eight additional features rep-resent count and percentage of discourse markersfrom each of the four groups that appear in sentencesthat are labeled with a topic.Average Chain Size: Average number of nodes inchains. Longer chains indicate more developmenton each topic.Number and percentage of chains with variety: Achain on a topic has variety if it discusses both as-pects (‘before’ and ‘after’) of that topic.
(5) Topic ordering and patterns: It is not justthe number of topics and the amount of develop-ment on each topic that is important. More impor-
25

tant is how students organized these topics in theiressays. Logical and strategic organization of topicshelps to strengthen arguments. Meanwhile, as re-flected in the rubric in Table 3, little or no order inthe discussion of topics in the essay means poor or-ganization. In this section we present the features wedesigned to assess the quality of the essays in termsof organization of topics.Levenshtein edit-distance of the topic vector repre-sentations for “befores” and “afters”, normalized bythe number of topics in the essay. If the essay hasa good organization of topics, it should cover boththe before and the after examples on each discussedtopic. It is also important that they come in a sim-ilar order. For example, suppose the following twovectors represent the order of topics in an essay: be-fores=[3,4,4,5] , afters=[3,6,5]. First we compressthe vectors by combining the adjacent similar top-ics. In this example topic number 4 will be com-pressed. So the final vectors are: befores=[3,4,5], afters=[3,6,5]. The normalized Levensthein be-tween these two vectors is 1/4, which shows thenumber of edits required to change one numberstring into the other normalized by total number oftopics in the two vectors. The greater the value, theworse the pattern of discussed topics.Max distance between chain’s nodes: Large distancecan be a sign of repetition. The distance betweentwo nodes is the number of text units between thosenodes in the grid.Number of chains starting and ending inside anotherchain: There should be fewer in well-organized es-says.Average chain length (Normalized): The length ofthe chain is the sum of the distances between eachpair of adjacent nodes. The normalized feature isdivided by the length of the essay.Average chain density: Equal to average chain sizedivided by average chain length.
5 Experiments and Results
5.1 Experimental Setup
We configure a series of experiments to test the va-lidity of three hypotheses: H1) the new features per-form better than the baselines; H2) the topic-gridmodel performs better on shorter and noisier essaysthan longer and well-written essays; H3) the lexical
chaining baseline can be improved with the use oftopic information from the source document.
For all experiments we use 10 runs of 10 foldcross validation using Random Forest as a classifier(max-depth=5). We also tried some other classifica-tion and regression methods, such as logistic regres-sion and gradient boosting regression, and all theconclusions remained the same. Since our dataset isimbalanced, we use SMOTE (Chawla et al., 2002)oversampling method. This method involves cre-ating synthetic minority class examples. We onlyoversampled the training data, not the testing data.
All performance measures are calculated by com-paring the classifier results with the first humanrater’s scores. We chose the first human rater be-cause we do not have the scores of the second raterfor the entire dataset. We report the performanceas Quadratic Weighted Kappa, which is a standardevaluation measure for essay assessment systems.We use corrected paired t-test (Bouckaert and Frank,2004) to measure the significance of any differencein performance.
We use two well-performing baselines from re-cent methods to evaluate organization and coherenceof the essays. The first baseline (EntityGridTT) isbased on the entity-grid coherence model introducedby Barzilay and Lapata (2005). This method hasbeen used to measure the coherence of student es-says (Burstein et al., 2010). It includes transitionprobabilities and type/token ratios for each syntac-tic role as features. We perform a set of experi-ments using different configurations for the entity-grid baseline, and we find that the best model is anentity-grid model with history=2, salience=1, syn-tax=on and type/token ratios. We therefore use thisbest configuration in all experiments. It should benoted that this works to the advantage of the entity-grid baseline since we do not have parameter tuningfor the other models.
The second baseline (LEX1) is a set of featuresextracted from Lexical Chaining (Morris and Hirst,1991). We use Galley and McKeown (2003) lexicalchaining and extract the first set of features (LEX1)introduced in Somasundaran et al. (2014). We do notimplement the second set because we do not have theannotation or the tagger to tag discourse cues.
26

Model (5–6) (6–8)1 EntityGridTT 0.42 0.492 LEX1 0.45 0.53 (1)3 EntityGridTT+LEX1 0.46 (1) 0.54 (1)4 Rubric-based 0.51 (1,2,3) 0.515 EntityGridTT+Rubric-based 0.49 (1,2,3) 0.53 (1)6 LEX1+Rubric-based 0.51 (1,2,3) 0.55 (1)7 EntityGridTT+LEX1 0.50 (1,2,3) 0.56 (1)
+Rubric-based
Table 5: Performance of our rubric-based model com-pared to the baselines on both datasets. The numbers inparenthesis show the model numbers which the currentmodel performs significantly better than.
5.2 Results and Discussion
We first examine the hypothesis that the new featuresperform better than the baselines (H1). The resultson the corpus of grades 5-6 (see Table 5) show thatthe new features (Model 4) yield significantly higherperformance than either baseline (Models 1 and 2)or the combination of the baselines (Model 3). Theresults of Models 5, 6, and 7 show that our new fea-tures capture information that is not in the baselinemodels since each of these three models is signif-icantly better than models 1, 2, and 3 respectively.The best result in all experiments is bolded.
We repeated the experiments on the corpus ofgrades 6-8. The results in Table 5 show that thereis no significant difference between the rubric-basedmodel and the baselines, except that in general,models that include lexical chaining features per-form better than those with entity-grid features.
We configured another experiment to examinethe generalizability of the models across differentgrades. In this experiment, we used one dataset formodel training and the other for testing. We dividedthe test data into 10 disjoint sets to be able to per-form significance tests on the performance measure.The results in Table 6 show that for both experi-ments, the rubric-based model performs at least aswell as the baselines. Where the training is on grades6-8 and we test the model on the shorter and nois-ier set of 5-6, the rubric-based model performs sig-nificantly better than the baselines. Where we teston the 6-8 corpus, the rubric-based model performsbetter than the baselines (although not always sig-nificantly), and adding it to the baselines (Model 5)adds value to them significantly.
Model Train(5–6) Train(6–8)Test(6–8) Test(5–6)
1 EntityGridTT 0.51 (2) 0.432 LEX1 0.43 0.413 EntityGridTT+LEX1 0.52 (2) 0.424 Rubric-based 0.56 (2) 0.47 (1,2,3)5 EntityGridTT+LEX1 0.58 (2,3,1) 0.45
+Rubric-based
Table 6: Performance of our rubric-based model com-pared to the baselines. Each time, we train the models onone dataset and test on the other. The numbers in paren-thesis show the model numbers which the current modelperforms significantly better than.
Altogether, our first and second hypotheses seemto hold. On the grade 5-6 data, the rubric-basedmodel performs better than the baselines; for grades6-8, the rubric-based features add value to the base-lines. That is, with shorter and noisier essays, mod-els based on coarse-grained topic information out-perform state-of-the-art models based on syntacticand lexical information. Moreover, while the stateof the art models perform better on better-written es-says, to get an even better performing model for es-says written by younger children, we need a modelthat examines more and different aspects of orga-nization. Additionally, we believe that the rubric-based, task-dependent model yields more informa-tion about students’ writing skills that could be fedback to teachers (and students) than the baselines.
Next, we repeated all of the experiments usingeach of the isolated groups of features. The resultsin Table 7 show that Topic-Development and Topic-Ordering are the most predictive set of features.While the topic-based features may not be betterthan the baselines, they can be improved. One po-tential improvement is to enhance the alignment ofthe sentences with their corresponding topics (sincewe currently use a very simple model for alignment).Moreover, we believe that the topic ordering featuresare more substantive and potentially provide moreuseful information for students and teachers.
We also conducted an ablation test to investigatehow important each group of features is in the newmodel. In the first phase, we remove each group offeatures and select the one that decreases the perfor-mance most significantly. This group of features hasthe greatest influence after accounting for all other
27
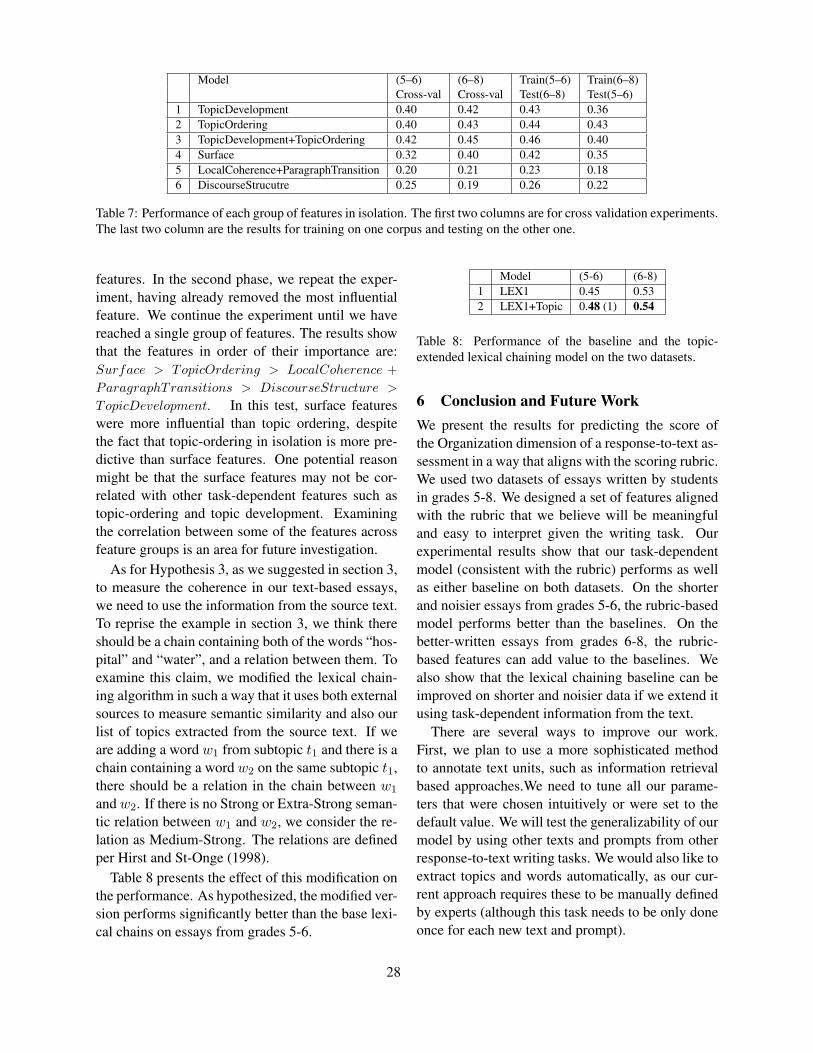
Model (5–6) (6–8) Train(5–6) Train(6–8)Cross-val Cross-val Test(6–8) Test(5–6)
1 TopicDevelopment 0.40 0.42 0.43 0.362 TopicOrdering 0.40 0.43 0.44 0.433 TopicDevelopment+TopicOrdering 0.42 0.45 0.46 0.404 Surface 0.32 0.40 0.42 0.355 LocalCoherence+ParagraphTransition 0.20 0.21 0.23 0.186 DiscourseStrucutre 0.25 0.19 0.26 0.22
Table 7: Performance of each group of features in isolation. The first two columns are for cross validation experiments.The last two column are the results for training on one corpus and testing on the other one.
features. In the second phase, we repeat the exper-iment, having already removed the most influentialfeature. We continue the experiment until we havereached a single group of features. The results showthat the features in order of their importance are:Surface > TopicOrdering > LocalCoherence +ParagraphTransitions > DiscourseStructure >
TopicDevelopment. In this test, surface featureswere more influential than topic ordering, despitethe fact that topic-ordering in isolation is more pre-dictive than surface features. One potential reasonmight be that the surface features may not be cor-related with other task-dependent features such astopic-ordering and topic development. Examiningthe correlation between some of the features acrossfeature groups is an area for future investigation.
As for Hypothesis 3, as we suggested in section 3,to measure the coherence in our text-based essays,we need to use the information from the source text.To reprise the example in section 3, we think thereshould be a chain containing both of the words “hos-pital” and “water”, and a relation between them. Toexamine this claim, we modified the lexical chain-ing algorithm in such a way that it uses both externalsources to measure semantic similarity and also ourlist of topics extracted from the source text. If weare adding a word w1 from subtopic t1 and there is achain containing a word w2 on the same subtopic t1,there should be a relation in the chain between w1
and w2. If there is no Strong or Extra-Strong seman-tic relation between w1 and w2, we consider the re-lation as Medium-Strong. The relations are definedper Hirst and St-Onge (1998).
Table 8 presents the effect of this modification onthe performance. As hypothesized, the modified ver-sion performs significantly better than the base lexi-cal chains on essays from grades 5-6.
Model (5-6) (6-8)1 LEX1 0.45 0.532 LEX1+Topic 0.48 (1) 0.54
Table 8: Performance of the baseline and the topic-extended lexical chaining model on the two datasets.
6 Conclusion and Future WorkWe present the results for predicting the score ofthe Organization dimension of a response-to-text as-sessment in a way that aligns with the scoring rubric.We used two datasets of essays written by studentsin grades 5-8. We designed a set of features alignedwith the rubric that we believe will be meaningfuland easy to interpret given the writing task. Ourexperimental results show that our task-dependentmodel (consistent with the rubric) performs as wellas either baseline on both datasets. On the shorterand noisier essays from grades 5-6, the rubric-basedmodel performs better than the baselines. On thebetter-written essays from grades 6-8, the rubric-based features can add value to the baselines. Wealso show that the lexical chaining baseline can beimproved on shorter and noisier data if we extend itusing task-dependent information from the text.
There are several ways to improve our work.First, we plan to use a more sophisticated methodto annotate text units, such as information retrievalbased approaches.We need to tune all our parame-ters that were chosen intuitively or were set to thedefault value. We will test the generalizability of ourmodel by using other texts and prompts from otherresponse-to-text writing tasks. We would also like toextract topics and words automatically, as our cur-rent approach requires these to be manually definedby experts (although this task needs to be only doneonce for each new text and prompt).
28
Acknowledgments
This work was supported by the Learning Researchand Development Center at the University of Pitts-burgh. We thank the ITSPOKE group for their help-ful feedback and suggestions.
References
Regina Barzilay and Mirella Lapata. 2005. Modelinglocal coherence: An entity-based approach. In Pro-ceedings of the 43rd Annual Meeting on Associationfor Computational Linguistics, ACL ’05, pages 141–148.
Remco R Bouckaert and Eibe Frank. 2004. Evaluat-ing the replicability of significance tests for comparinglearning algorithms. In Advances in knowledge dis-covery and data mining, pages 3–12.
Jill Burstein, Karen Kukich, Susanne Wolff, Chi Lu, andMartin Chodorow. 1998. Enriching automated essayscoring using discourse marking. In Proceedings ofthe Workshop on Discourse Relations and DiscourseMarking, Annual Meeting of the Association of Com-putational Linguistics.
Jill Burstein, Martin Chodorow, and Claudia Leacock.2003a. Criterion sm : Online essay evaluation: An ap-plication for automated evaluation of student essays.In Proceedings of the Fifteenth Annual Conference onInnovative Applications of Artificial Intelligence.
Jill Burstein, Daniel Marcu, and Kevin Knight. 2003b.Finding the write stuff: Automatic identification ofdiscourse structure in student essays. IEEE IntelligentSystems, 18(1):32–39, January.
Jill Burstein, Joel Tetreault, and Slava Andreyev. 2010.Using entity-based features to model coherence in stu-dent essays. In Human Language Technologies: The2010 Annual Conference of the North American Chap-ter of the Association for Computational Linguistics,HLT ’10, pages 681–684.
Jill Burstein, Joel Tetreault, and Martin Chodorow. 2013.Holistic discourse coherence annotation for noisy es-say writing. Dialogue & Discourse, 4(2):34–52.
Nitesh V. Chawla, Kevin W. Bowyer, Lawrence O. Hall,and W. Philip Kegelmeyer. 2002. Smote: Syntheticminority over-sampling technique. Journal of Artifi-cial Intelligence Research, 16:321–357.
Robin Cohen. 1987. Analyzing the structure of argu-mentative discourse. Comput. Linguist., 13(1-2):11–24, January.
Richard Correnti, Lindsay Clare Matsumura, Laura SHamilton, and Elaine Wang. 2012. Combining multi-ple measures of students’ opportunities to develop an-alytic, text-based writing skills. Educational Assess-ment, 17(2-3):132–161.
Richard Correnti, Lindsay Clare Matsumura, Laura SHamilton, and Elaine Wang. 2013. Assessing stu-dents’ skills at writing in response to texts. Elemen-tary School Journal, 114(2):142–177.
Scott A Crossley and Danielle S McNamara. 2011. Textcoherence and judgments of essay quality: Models ofquality and coherence. In Proceedings of the 29thAnnual Conference of the Cognitive Science Society,pages 1236–1241.
Peter W Foltz, Walter Kintsch, and Thomas K Landauer.1998. The measurement of textual coherence withlatent semantic analysis. Discourse processes, 25(2-3):285–307.
Michel Galley and Kathleen Mckeown. 2003. Improvingword sense disambiguation in lexical chaining. In InProceedings of IJCAI, pages 1486–1488.
Barbara J Grosz, Scott Weinstein, and Aravind K Joshi.1995. Centering: A framework for modeling the lo-cal coherence of discourse. Computational linguistics,21(2):203–225.
Derrick Higgins, Jill Burstein, Daniel Marcu, and Clau-dia Gentile. 2004. Evaluating multiple aspects of co-herence in student essays. In HLT-NAACL, pages 185–192.
Graeme Hirst and David St-Onge. 1998. Lexical chainsas representations of context for the detection and cor-rection of malapropisms. WordNet: An electronic lex-ical database, 305:305–332.
T.K. Landauer, P.W. Foltz, and D. Laham. 1998. An in-troduction to latent semantic analysis. Discourse pro-cesses, 25:259–284.
Ou Lydia Liu, Chris Brew, John Blackmore, Libby Ger-ard, Jacquie Madhok, and Marcia C Linn. 2014.Automated scoring of constructed-response scienceitems: Prospects and obstacles. Educational Measure-ment: Issues and Practice, 33(2):19–28.
Eleni Miltsakaki and Karen Kukich. 2000. Automatedevaluation of coherence in student essays. In Proceed-ings of LREC 2000.
Jane Morris and Graeme Hirst. 1991. Lexical cohesioncomputed by thesaural relations as an indicator of thestructure of text. Comput. Linguist., 17(1):21–48.
Emily Pitler and Ani Nenkova. 2009. Using syntaxto disambiguate explicit discourse connectives in text.In Proceedings of the ACL-IJCNLP 2009 ConferenceShort Papers, pages 13–16.
Zahra Rahimi, Diane J Litman, Richard Correnti, Lind-say Clare Matsumura, Elaine Wang, and Zahid Kisa.
29

2014. Automatic scoring of an analytical response-to-text assessment. In Intelligent Tutoring Systems, pages601–610. Springer.
Swapna Somasundaran, Jill Burstein, and MartinChodorow. 2014. Lexical chaining for measuringdiscourse coherence quality in test-taker essays. InProceedings of COLING 2014, the 25th InternationalConference on Computational Linguistics: TechnicalPapers, pages 950–961. Dublin City University andAssociation for Computational Linguistics.
30
Proceedings of the Tenth Workshop on Innovative Use of NLP for Building Educational Applications, 2015, pages 31–41,Denver, Colorado, June 4, 2015. c©2015 Association for Computational Linguistics
Automatic morphological analysis of learner Hungarian
Scott LedbetterIndiana University
Bloomington, IN, [email protected]
Markus DickinsonIndiana University
Bloomington, IN, [email protected]
Abstract
In this paper, we describe a morphologicalanalyzer for learner Hungarian, built uponlimited grammatical knowledge of Hungarian.The rule-based analyzer requires very few re-sources and is flexible enough to do both mor-phological analysis and error detection, in ad-dition to some unknown word handling. Asthis is work-in-progress, we demonstrate itscurrent capabilities, some areas where analy-sis needs to be improved, and an initial forayinto how the system output can support theanalysis of interlanguage grammars.
1 Introduction and Motivation
While much recent research has gone into grammat-ical error detection and correction (Leacock et al.,2014), this work has a few (admitted) limitations:1) it has largely focused on a few error types (e.g.,prepositions, articles, collocations); 2) it has largelybeen for English, with only a few explorations intoother languages (e.g., Basque (de Ilarraza et al.,2008), Korean (Israel et al., 2013)); and 3) it hasoften focused on errors to the exclusion of broaderpatterns of learner productions—a crucial link if onewants to develop intelligent computer-assisted lan-guage learning (ICALL) (Heift and Schulze, 2007)or proficiency classification (Vajjala and Loo, 2013;Hawkins and Buttery, 2010) applications or con-nect to second language acquisition (SLA) research(Ragheb, 2014). We focus on Hungarian morpho-logical analysis for learner language, attempting tobuild a system that: 1) works for a variety of mor-
phological errors, providing detailed information foreach; 2) is feasible for low-resource languages; and3) provides analyses for correct and incorrect forms,i.e., is both a morphological analyzer and an errordetector. Perhaps unsurprisingly, we find that thebest way to accomplish these goals is to hearkenback to the parsing ill-formed input literature (seeHeift and Schulze, 2007, ch. 2) and develop a rule-based system, underscoring the point that differentkinds of linguistic properties require different kindsof systems (see Leacock et al., 2014, ch. 7).
We hope to make the analysis of Hungarian mor-phology maximally useful. Consider ICALL systemdevelopment, for example: successful systems notonly provide meaningful feedback for learners butalso model learner behavior (e.g., Amaral and Meur-ers, 2008). To do this requires tracking correct andincorrect use of different linguistic phenomena (e.g.,case). Furthermore, one likely wants to keep trackof individual differences between learners as wellas to track general developmental trends—a pointrelevant to SLA research more generally (Dornyei,2010; Gass and Selinker, 2008).
In addition to providing a platform for ICALLdevelopment and SLA research, another long-termgoal of our project is to develop an annotated cor-pus of learner Hungarian, including both linguis-tic and error annotation. The exact delineation be-tween the two kinds of annotation is an open ques-tion (Ragheb and Dickinson, 2014), and building ananalyzer which does both can show the link for atleast certain types of errors. Additionally, the linkbetween corpus data and automatic analysis is part
31
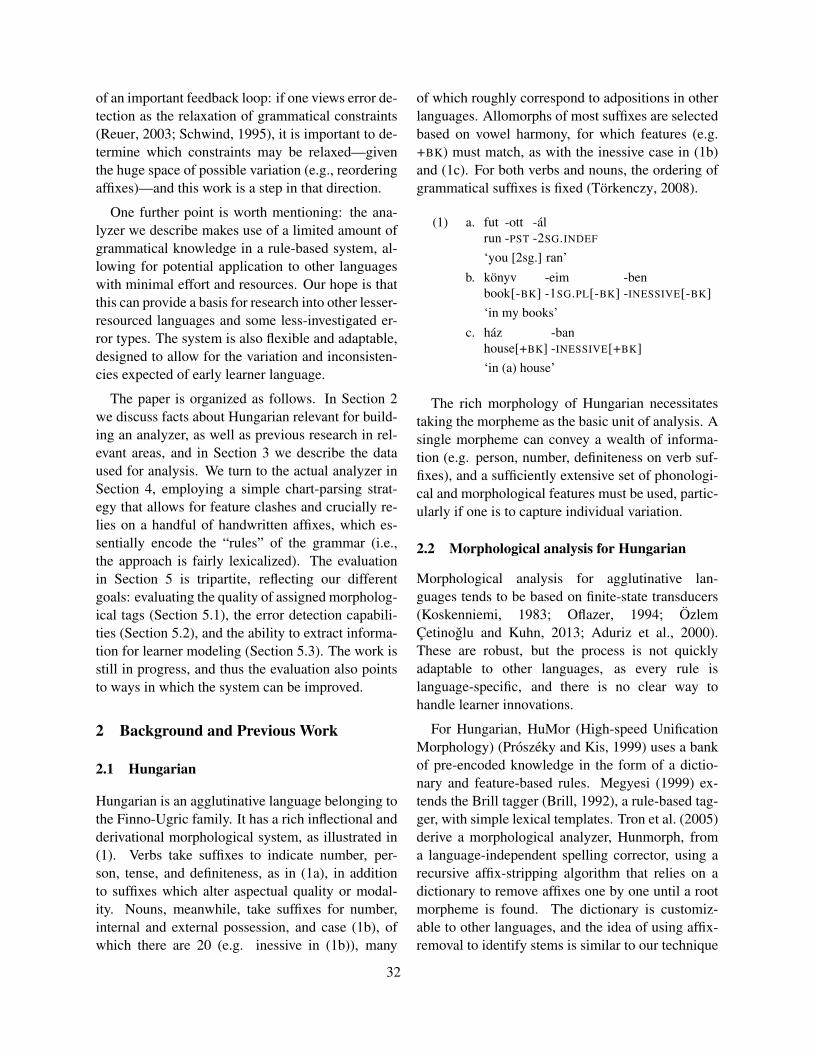
of an important feedback loop: if one views error de-tection as the relaxation of grammatical constraints(Reuer, 2003; Schwind, 1995), it is important to de-termine which constraints may be relaxed—giventhe huge space of possible variation (e.g., reorderingaffixes)—and this work is a step in that direction.
One further point is worth mentioning: the ana-lyzer we describe makes use of a limited amount ofgrammatical knowledge in a rule-based system, al-lowing for potential application to other languageswith minimal effort and resources. Our hope is thatthis can provide a basis for research into other lesser-resourced languages and some less-investigated er-ror types. The system is also flexible and adaptable,designed to allow for the variation and inconsisten-cies expected of early learner language.
The paper is organized as follows. In Section 2we discuss facts about Hungarian relevant for build-ing an analyzer, as well as previous research in rel-evant areas, and in Section 3 we describe the dataused for analysis. We turn to the actual analyzer inSection 4, employing a simple chart-parsing strat-egy that allows for feature clashes and crucially re-lies on a handful of handwritten affixes, which es-sentially encode the “rules” of the grammar (i.e.,the approach is fairly lexicalized). The evaluationin Section 5 is tripartite, reflecting our differentgoals: evaluating the quality of assigned morpholog-ical tags (Section 5.1), the error detection capabili-ties (Section 5.2), and the ability to extract informa-tion for learner modeling (Section 5.3). The work isstill in progress, and thus the evaluation also pointsto ways in which the system can be improved.
2 Background and Previous Work
2.1 Hungarian
Hungarian is an agglutinative language belonging tothe Finno-Ugric family. It has a rich inflectional andderivational morphological system, as illustrated in(1). Verbs take suffixes to indicate number, per-son, tense, and definiteness, as in (1a), in additionto suffixes which alter aspectual quality or modal-ity. Nouns, meanwhile, take suffixes for number,internal and external possession, and case (1b), ofwhich there are 20 (e.g. inessive in (1b)), many
of which roughly correspond to adpositions in otherlanguages. Allomorphs of most suffixes are selectedbased on vowel harmony, for which features (e.g.+BK) must match, as with the inessive case in (1b)and (1c). For both verbs and nouns, the ordering ofgrammatical suffixes is fixed (Torkenczy, 2008).
(1) a. futrun
-ott-PST
-al-2SG.INDEF
‘you [2sg.] ran’b. konyv
book[-BK]-eim-1SG.PL[-BK]
-ben-INESSIVE[-BK]
‘in my books’c. haz
house[+BK]-ban-INESSIVE[+BK]
‘in (a) house’
The rich morphology of Hungarian necessitatestaking the morpheme as the basic unit of analysis. Asingle morpheme can convey a wealth of informa-tion (e.g. person, number, definiteness on verb suf-fixes), and a sufficiently extensive set of phonologi-cal and morphological features must be used, partic-ularly if one is to capture individual variation.
2.2 Morphological analysis for Hungarian
Morphological analysis for agglutinative lan-guages tends to be based on finite-state transducers(Koskenniemi, 1983; Oflazer, 1994; OzlemCetinoglu and Kuhn, 2013; Aduriz et al., 2000).These are robust, but the process is not quicklyadaptable to other languages, as every rule islanguage-specific, and there is no clear way tohandle learner innovations.
For Hungarian, HuMor (High-speed UnificationMorphology) (Proszeky and Kis, 1999) uses a bankof pre-encoded knowledge in the form of a dictio-nary and feature-based rules. Megyesi (1999) ex-tends the Brill tagger (Brill, 1992), a rule-based tag-ger, with simple lexical templates. Tron et al. (2005)derive a morphological analyzer, Hunmorph, froma language-independent spelling corrector, using arecursive affix-stripping algorithm that relies on adictionary to remove affixes one by one until a rootmorpheme is found. The dictionary is customiz-able to other languages, and the idea of using affix-removal to identify stems is similar to our technique
32
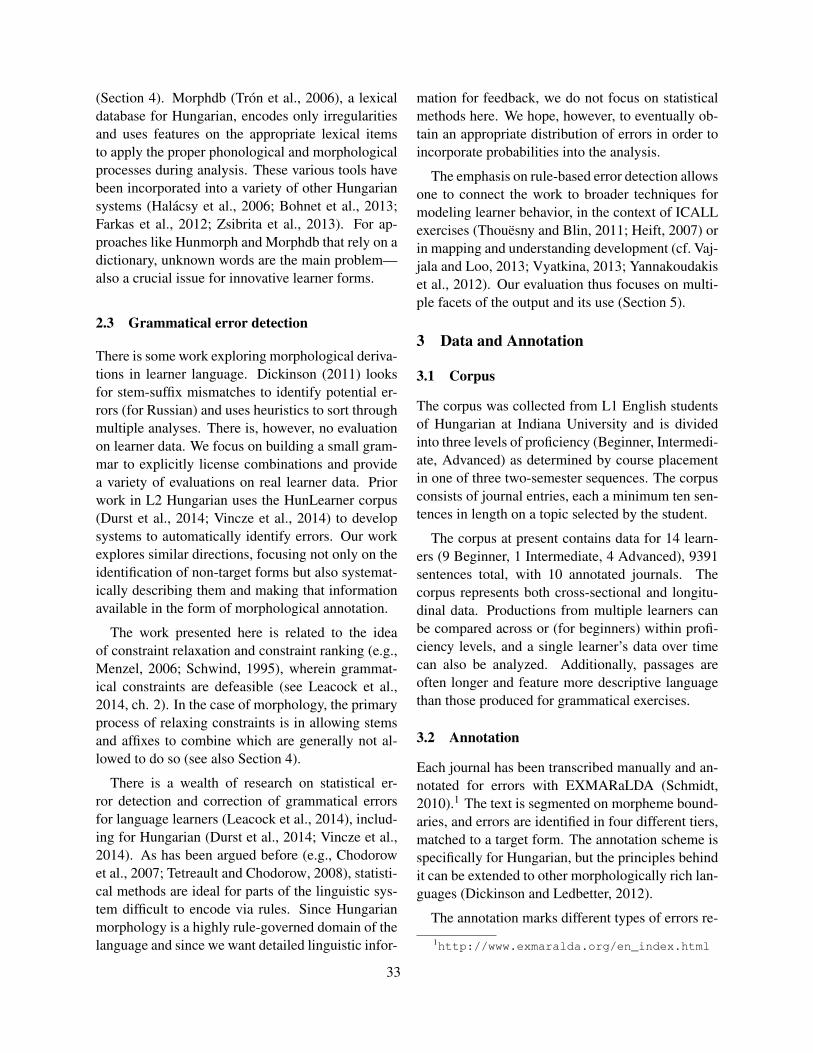
(Section 4). Morphdb (Tron et al., 2006), a lexicaldatabase for Hungarian, encodes only irregularitiesand uses features on the appropriate lexical itemsto apply the proper phonological and morphologicalprocesses during analysis. These various tools havebeen incorporated into a variety of other Hungariansystems (Halacsy et al., 2006; Bohnet et al., 2013;Farkas et al., 2012; Zsibrita et al., 2013). For ap-proaches like Hunmorph and Morphdb that rely on adictionary, unknown words are the main problem—also a crucial issue for innovative learner forms.
2.3 Grammatical error detection
There is some work exploring morphological deriva-tions in learner language. Dickinson (2011) looksfor stem-suffix mismatches to identify potential er-rors (for Russian) and uses heuristics to sort throughmultiple analyses. There is, however, no evaluationon learner data. We focus on building a small gram-mar to explicitly license combinations and providea variety of evaluations on real learner data. Priorwork in L2 Hungarian uses the HunLearner corpus(Durst et al., 2014; Vincze et al., 2014) to developsystems to automatically identify errors. Our workexplores similar directions, focusing not only on theidentification of non-target forms but also systemat-ically describing them and making that informationavailable in the form of morphological annotation.
The work presented here is related to the ideaof constraint relaxation and constraint ranking (e.g.,Menzel, 2006; Schwind, 1995), wherein grammat-ical constraints are defeasible (see Leacock et al.,2014, ch. 2). In the case of morphology, the primaryprocess of relaxing constraints is in allowing stemsand affixes to combine which are generally not al-lowed to do so (see also Section 4).
There is a wealth of research on statistical er-ror detection and correction of grammatical errorsfor language learners (Leacock et al., 2014), includ-ing for Hungarian (Durst et al., 2014; Vincze et al.,2014). As has been argued before (e.g., Chodorowet al., 2007; Tetreault and Chodorow, 2008), statisti-cal methods are ideal for parts of the linguistic sys-tem difficult to encode via rules. Since Hungarianmorphology is a highly rule-governed domain of thelanguage and since we want detailed linguistic infor-
mation for feedback, we do not focus on statisticalmethods here. We hope, however, to eventually ob-tain an appropriate distribution of errors in order toincorporate probabilities into the analysis.
The emphasis on rule-based error detection allowsone to connect the work to broader techniques formodeling learner behavior, in the context of ICALLexercises (Thouesny and Blin, 2011; Heift, 2007) orin mapping and understanding development (cf. Vaj-jala and Loo, 2013; Vyatkina, 2013; Yannakoudakiset al., 2012). Our evaluation thus focuses on multi-ple facets of the output and its use (Section 5).
3 Data and Annotation
3.1 Corpus
The corpus was collected from L1 English studentsof Hungarian at Indiana University and is dividedinto three levels of proficiency (Beginner, Intermedi-ate, Advanced) as determined by course placementin one of three two-semester sequences. The corpusconsists of journal entries, each a minimum ten sen-tences in length on a topic selected by the student.
The corpus at present contains data for 14 learn-ers (9 Beginner, 1 Intermediate, 4 Advanced), 9391sentences total, with 10 annotated journals. Thecorpus represents both cross-sectional and longitu-dinal data. Productions from multiple learners canbe compared across or (for beginners) within profi-ciency levels, and a single learner’s data over timecan also be analyzed. Additionally, passages areoften longer and feature more descriptive languagethan those produced for grammatical exercises.
3.2 Annotation
Each journal has been transcribed manually and an-notated for errors with EXMARaLDA (Schmidt,2010).1 The text is segmented on morpheme bound-aries, and errors are identified in four different tiers,matched to a target form. The annotation scheme isspecifically for Hungarian, but the principles behindit can be extended to other morphologically rich lan-guages (Dickinson and Ledbetter, 2012).
The annotation marks different types of errors re-
1http://www.exmaralda.org/en_index.html
33

flecting different levels of linguistic analysis. Forinstance, for (2), the annotation shows a CL (vowellength) error on the verb stem and an MAD (def-initeness) error on the verb suffix—i.e. the defi-nite suffix does not agree with the indefinite nouncomplements—as shown in Figure 1.
(2) Ajanlrecommend
-om1SG.DF
borwine
-tACC
,,
nemnot
sorbeer
-tACC
‘I recommend wine, not beer.’
TXT Ajanlom bort , nem sort .SEG Ajanl om bor t , nem sor t .CHA CLMOR MADTGT Ajanl ok bor t , nem sor t .
Figure 1: Error annotation for (2)
There are four basic error annotation categories,reflecting character (CHA, e.g., vowel harmony,phonological confusion), morphological (MOR,e.g., agreement in person, case), grammatical rela-tion (REL, e.g., case, root selection), and sentence(SNT, e.g., insertion, ordering) errors. A full list ofcategories can be found in Dickinson and Ledbetter(2012). Different categories of errors can be anno-tated for the same word, and error spans can over-lap if necessary. A target (TGT) sentence is alsoprovided. The morphological analyzer discussed insection 4 is designed to recognize errors within themorphological (MOR) and character (CHA) tiers.
4 Morphological Analysis
Our goal for analyzing a word is to provide itsderivation, in order to support morphological analy-sis, error detection, and learner modeling. A deriva-tion here refers to a breakdown of a word’s inter-nal structure into individual morphemes, i.e., a rootmorpheme plus affixes, and we want to provide asmuch of a derivation as we can even when: a) theroot is unknown, or b) the learner has misappliedan affix (e.g., it is inappropriate for the rest of theword). We discuss the knowledge base (Section 4.1),the basic algorithm (Section 4.2), and our first passat making the analyzer more robust (Section 4.3).
4.1 Knowledge base
There are two parts to the knowledge base, a hand-crafted suffix base and a dictionary obtained fromanother project. The dictionary is obtained from AMagyar Elektronikus Konyvtar.2 To model lesser-resourced situations, one can experiment with dif-fering sizes of this lexicon; in general, this type ofresource does not have to contain much information.
The suffix base, on the other hand, is where we en-code the rules for morphological combination, andit thus must be developed with more care. We use205 affixes, including those for noun case, plurals,verb conjugation, and possession. An affix corre-sponds to a set of possible categories, the encodinginspired by the Combinatory Categorial Grammar(CCG) framework (Steedman and Baldridge, 2011).For example, the accusative case marker -t has onepossible category KN\N, indicating that it wouldcreate a new category KN (cased noun phrase) if itwas combined with a noun (N) on the left.
Each affix category contains features describingrelevant linguistic properties. For example, featuresfor the entry for the affix -ot indicates that: a) it con-tains back vowels and b) it is accusative case whencombined with a noun stem. As another example,the plural noun suffix -ok also contains back vowels,but its features furthermore indicate a stem-loweringeffect—i.e. successive affixes must adhere to a re-stricted subset of allomorphs based on vowel har-mony. The suffix base represents our grammar engi-neering, but, as noted, it is quite small.
4.2 Building an analysis
To efficiently determine the correct combinations ofroot and affixes, we use a basic CYK chart pars-ing algorithm (Cocke and Schwartz, 1970), treatingeach letter as a unit of analysis; as suffixes drivethe analysis, we process from right to left. At eachpossible interval of starting and ending sequenceswithin a word, the system verifies if the sequenceis either attested in the affix base or in the dictio-nary of attested language forms. If the sequenceis found, a corresponding category is placed into
2http://www.mek.iif.hu/porta/szint/egyeb/szotar/ssa-dic/
34
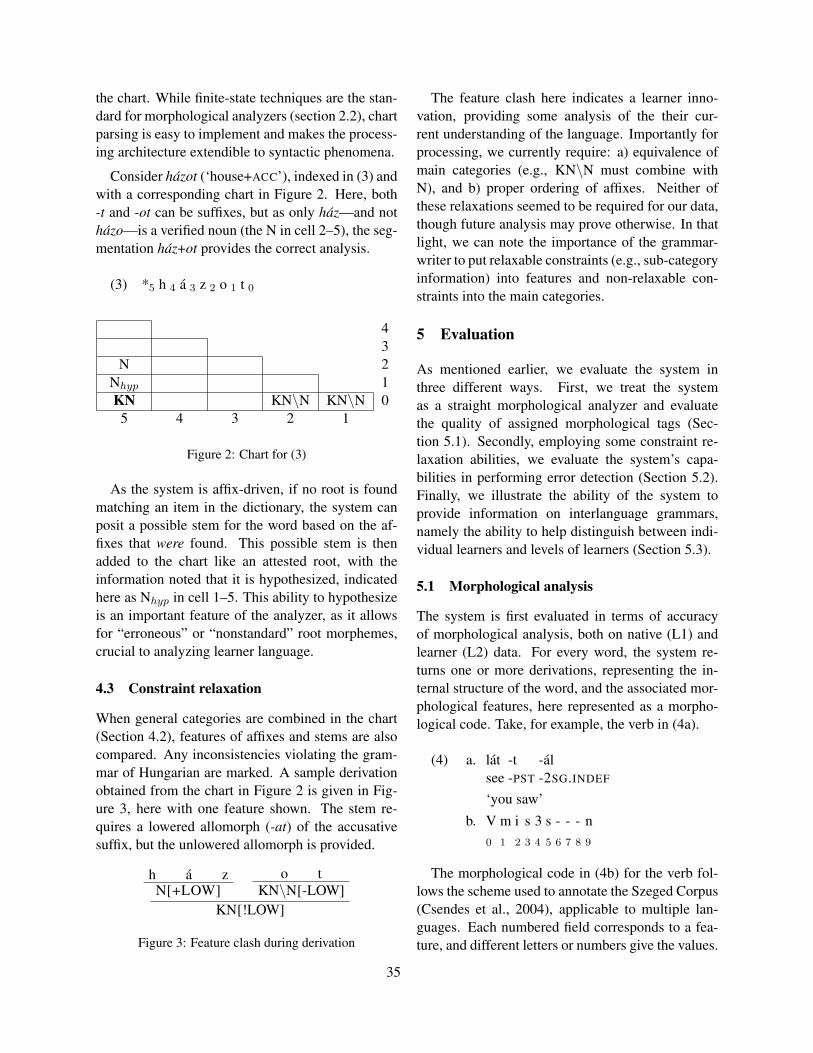
the chart. While finite-state techniques are the stan-dard for morphological analyzers (section 2.2), chartparsing is easy to implement and makes the process-ing architecture extendible to syntactic phenomena.
Consider hazot (‘house+ACC’), indexed in (3) andwith a corresponding chart in Figure 2. Here, both-t and -ot can be suffixes, but as only haz—and nothazo—is a verified noun (the N in cell 2–5), the seg-mentation haz+ot provides the correct analysis.
(3) *5 h 4 a 3 z 2 o 1 t 0
43
N 2Nhyp 1KN KN\N KN\N 0
5 4 3 2 1
Figure 2: Chart for (3)
As the system is affix-driven, if no root is foundmatching an item in the dictionary, the system canposit a possible stem for the word based on the af-fixes that were found. This possible stem is thenadded to the chart like an attested root, with theinformation noted that it is hypothesized, indicatedhere as Nhyp in cell 1–5. This ability to hypothesizeis an important feature of the analyzer, as it allowsfor “erroneous” or “nonstandard” root morphemes,crucial to analyzing learner language.
4.3 Constraint relaxation
When general categories are combined in the chart(Section 4.2), features of affixes and stems are alsocompared. Any inconsistencies violating the gram-mar of Hungarian are marked. A sample derivationobtained from the chart in Figure 2 is given in Fig-ure 3, here with one feature shown. The stem re-quires a lowered allomorph (-at) of the accusativesuffix, but the unlowered allomorph is provided.
h a zN[+LOW]
o tKN\N[-LOW]
KN[!LOW]
Figure 3: Feature clash during derivation
The feature clash here indicates a learner inno-vation, providing some analysis of the their cur-rent understanding of the language. Importantly forprocessing, we currently require: a) equivalence ofmain categories (e.g., KN\N must combine withN), and b) proper ordering of affixes. Neither ofthese relaxations seemed to be required for our data,though future analysis may prove otherwise. In thatlight, we can note the importance of the grammar-writer to put relaxable constraints (e.g., sub-categoryinformation) into features and non-relaxable con-straints into the main categories.
5 Evaluation
As mentioned earlier, we evaluate the system inthree different ways. First, we treat the systemas a straight morphological analyzer and evaluatethe quality of assigned morphological tags (Sec-tion 5.1). Secondly, employing some constraint re-laxation abilities, we evaluate the system’s capa-bilities in performing error detection (Section 5.2).Finally, we illustrate the ability of the system toprovide information on interlanguage grammars,namely the ability to help distinguish between indi-vidual learners and levels of learners (Section 5.3).
5.1 Morphological analysis
The system is first evaluated in terms of accuracyof morphological analysis, both on native (L1) andlearner (L2) data. For every word, the system re-turns one or more derivations, representing the in-ternal structure of the word, and the associated mor-phological features, here represented as a morpho-logical code. Take, for example, the verb in (4a).
(4) a. latsee
-t-PST
-al-2SG.INDEF
‘you saw’b. V
0
m1
i2
s3
34
s5
-6
-7
-8
n9
The morphological code in (4b) for the verb fol-lows the scheme used to annotate the Szeged Corpus(Csendes et al., 2004), applicable to multiple lan-guages. Each numbered field corresponds to a fea-ture, and different letters or numbers give the values.
35
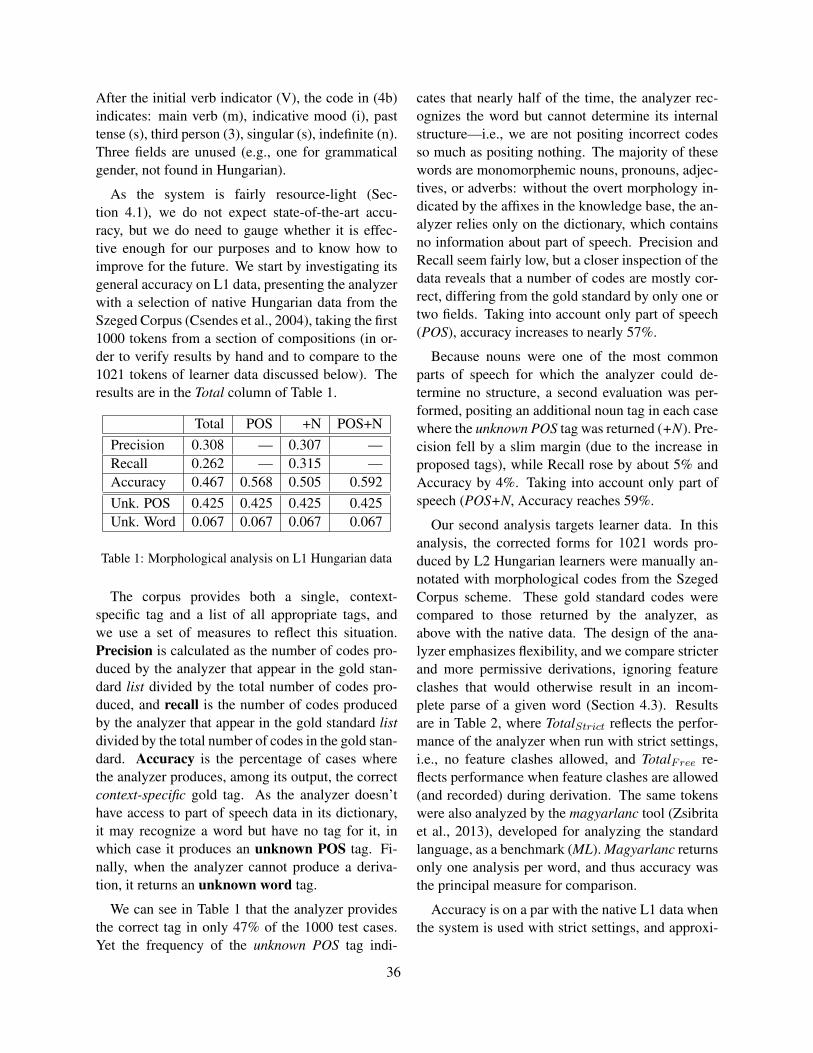
After the initial verb indicator (V), the code in (4b)indicates: main verb (m), indicative mood (i), pasttense (s), third person (3), singular (s), indefinite (n).Three fields are unused (e.g., one for grammaticalgender, not found in Hungarian).
As the system is fairly resource-light (Sec-tion 4.1), we do not expect state-of-the-art accu-racy, but we do need to gauge whether it is effec-tive enough for our purposes and to know how toimprove for the future. We start by investigating itsgeneral accuracy on L1 data, presenting the analyzerwith a selection of native Hungarian data from theSzeged Corpus (Csendes et al., 2004), taking the first1000 tokens from a section of compositions (in or-der to verify results by hand and to compare to the1021 tokens of learner data discussed below). Theresults are in the Total column of Table 1.
Total POS +N POS+NPrecision 0.308 — 0.307 —Recall 0.262 — 0.315 —Accuracy 0.467 0.568 0.505 0.592Unk. POS 0.425 0.425 0.425 0.425Unk. Word 0.067 0.067 0.067 0.067
Table 1: Morphological analysis on L1 Hungarian data
The corpus provides both a single, context-specific tag and a list of all appropriate tags, andwe use a set of measures to reflect this situation.Precision is calculated as the number of codes pro-duced by the analyzer that appear in the gold stan-dard list divided by the total number of codes pro-duced, and recall is the number of codes producedby the analyzer that appear in the gold standard listdivided by the total number of codes in the gold stan-dard. Accuracy is the percentage of cases wherethe analyzer produces, among its output, the correctcontext-specific gold tag. As the analyzer doesn’thave access to part of speech data in its dictionary,it may recognize a word but have no tag for it, inwhich case it produces an unknown POS tag. Fi-nally, when the analyzer cannot produce a deriva-tion, it returns an unknown word tag.
We can see in Table 1 that the analyzer providesthe correct tag in only 47% of the 1000 test cases.Yet the frequency of the unknown POS tag indi-
cates that nearly half of the time, the analyzer rec-ognizes the word but cannot determine its internalstructure—i.e., we are not positing incorrect codesso much as positing nothing. The majority of thesewords are monomorphemic nouns, pronouns, adjec-tives, or adverbs: without the overt morphology in-dicated by the affixes in the knowledge base, the an-alyzer relies only on the dictionary, which containsno information about part of speech. Precision andRecall seem fairly low, but a closer inspection of thedata reveals that a number of codes are mostly cor-rect, differing from the gold standard by only one ortwo fields. Taking into account only part of speech(POS), accuracy increases to nearly 57%.
Because nouns were one of the most commonparts of speech for which the analyzer could de-termine no structure, a second evaluation was per-formed, positing an additional noun tag in each casewhere the unknown POS tag was returned (+N). Pre-cision fell by a slim margin (due to the increase inproposed tags), while Recall rose by about 5% andAccuracy by 4%. Taking into account only part ofspeech (POS+N, Accuracy reaches 59%.
Our second analysis targets learner data. In thisanalysis, the corrected forms for 1021 words pro-duced by L2 Hungarian learners were manually an-notated with morphological codes from the SzegedCorpus scheme. These gold standard codes werecompared to those returned by the analyzer, asabove with the native data. The design of the ana-lyzer emphasizes flexibility, and we compare stricterand more permissive derivations, ignoring featureclashes that would otherwise result in an incom-plete parse of a given word (Section 4.3). Resultsare in Table 2, where TotalStrict reflects the perfor-mance of the analyzer when run with strict settings,i.e., no feature clashes allowed, and TotalFree re-flects performance when feature clashes are allowed(and recorded) during derivation. The same tokenswere also analyzed by the magyarlanc tool (Zsibritaet al., 2013), developed for analyzing the standardlanguage, as a benchmark (ML). Magyarlanc returnsonly one analysis per word, and thus accuracy wasthe principal measure for comparison.
Accuracy is on a par with the native L1 data whenthe system is used with strict settings, and approxi-
36

TotalStrict TotalFree MLAccuracy 0.499 0.509 0.846Unk. POS 0.499 0.499 —Unk. Word 0.109 0.097 0.027
Table 2: Morph. analysis on corrected L2 Hungarian data
mately half of the test cases were recognized by theanalyzer. With flexibility, accuracy increases by 1%and the unknown word rate decreases by about thesame margin. Magyarlanc outperforms the system,but even on corrected learner data, accuracy is 85%.
The final analysis is on raw learner data (the same1021 words with no corrections) to test the ana-lyzer’s flexibility with the idiosyncracies in authen-tic learner language. Results are in Table 3.
TotalStrict TotalFree MLAccuracy 0.464 0.478 0.753Unk. POS 0.456 0.456 —Unk. Word 0.137 0.119 0.074
Table 3: Morph. analysis on raw L2 Hungarian data
Accuracy is still fairly low, with a slim increasein performance with the more permissive settings.With magyarlanc, accuracy falls by about 10%. Forboth, the unknown word rate is higher than with cor-rected data. Again, a large proportion of the testcases involve monomorphemic words for which theanalyzer recognizes no internal structure. Access toPOS data, as with magyarlanc, would greatly im-prove performance. In general, however, an empha-sis on flexibility and adaptability seems to have ben-efits for describing learner language, decreasing un-known word rate and maintaining accuracy.
5.2 Error detection
The next evaluation assesses the system’s ability toautomatically detect errors in learner data. As dis-cussed in Section 4.3, an error occurs when featuresclash (cf. Figure 3). Feature clashes also arise fromunknown words, as the category of a word not in thedictionary is unspecified. Evaluation of the systemas a whole is given in the Total column of Table 4.
Precision is the number of correctly identified er-
Total Morph CharPrecision 0.380 0.380 0.380Recall 0.625 0.789 0.938F1 0.472 0.513 0.541F0.5 0.412 0.424 0.431
Table 4: Error detection using only dictionary stems
rors divided by the number of errors suggested bythe analyzer. Recall is the number of correctly iden-tified errors divided by the number of errors in thegold annotation. The F1 score is the harmonic meanof precision and recall; because precision is criti-cal when providing feedback to learners, F0.5 is alsogiven, weighing precision more heavily. Precision inTable 4 is very low, below 40%; i.e., 60% of the “er-rors” identified by the morphological analyzer arefalse positives. Recall is better, at over 60%.
The morphological analyzer is not currently de-signed to handle syntax errors or many agreementerrors, as it considers only one word at a time. Thus,additional scores are calculated for errors below thetier of syntax (see Section 3.2). In the Morph col-umn, only those errors from the morphological tierand below are considered (i.e., Morph and Char).For Char, only those errors from the character tierare considered. Recall improves considerably bythis restricted focus, up to nearly 94% for Char.
Considering the importance of precision, the an-alyzer needs much improvement. A closer analysisillustrates some of the problems with the algorithmand with the test data. The vast majority of false pos-itives (˜40%) are for proper names. Most named en-tities are obviously not in the dictionary (excepting,e.g., Magyarorszag ‘Hungary’), and the system can-not recognize them. As described in Section 4, theanalyzer can posit hypothetical stems to completea derivation, estimating words as they exist in thelearner’s vocabulary. A second evaluation was per-formed, allowing the system to hypothesize that anyunknown word may be a valid item in the learner’svocabulary. Results are in Table 5.
Precision sees a modest increase to 40%, whilerecall falls to less than 10%. Limiting the scope ofanalysis once more increases recall (to nearly 7%),but the F-scores remain less than half of those in the
37
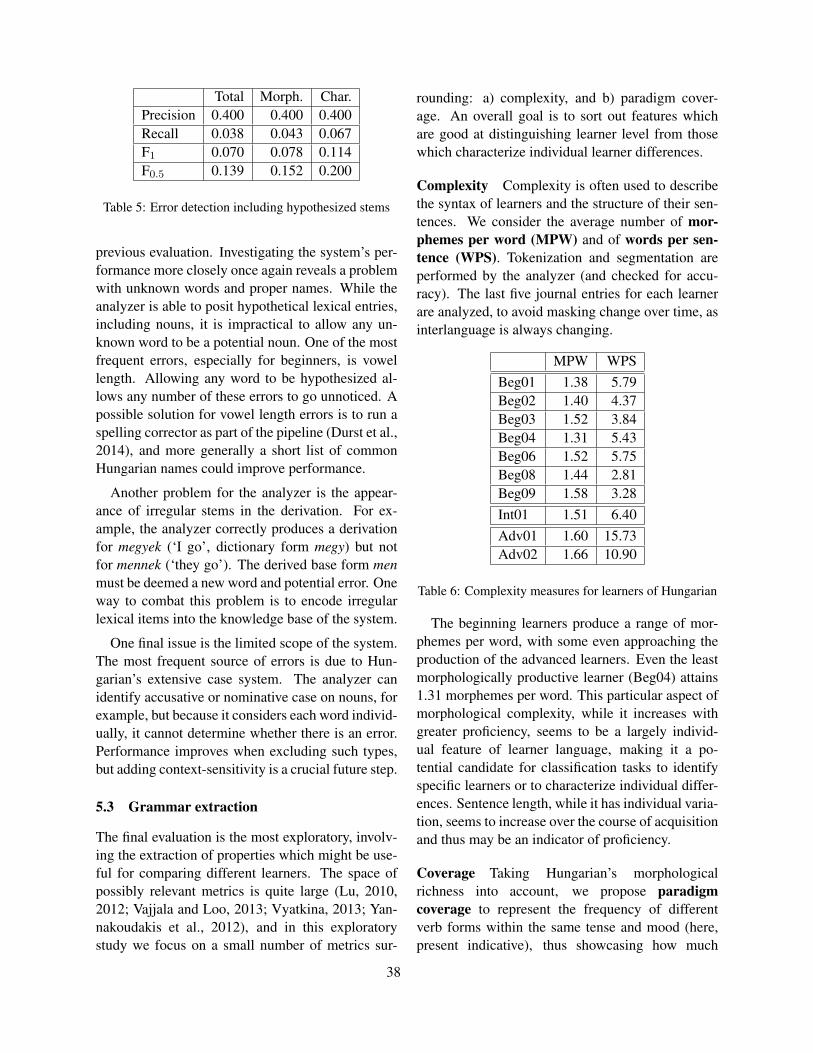
Total Morph. Char.Precision 0.400 0.400 0.400Recall 0.038 0.043 0.067F1 0.070 0.078 0.114F0.5 0.139 0.152 0.200
Table 5: Error detection including hypothesized stems
previous evaluation. Investigating the system’s per-formance more closely once again reveals a problemwith unknown words and proper names. While theanalyzer is able to posit hypothetical lexical entries,including nouns, it is impractical to allow any un-known word to be a potential noun. One of the mostfrequent errors, especially for beginners, is vowellength. Allowing any word to be hypothesized al-lows any number of these errors to go unnoticed. Apossible solution for vowel length errors is to run aspelling corrector as part of the pipeline (Durst et al.,2014), and more generally a short list of commonHungarian names could improve performance.
Another problem for the analyzer is the appear-ance of irregular stems in the derivation. For ex-ample, the analyzer correctly produces a derivationfor megyek (‘I go’, dictionary form megy) but notfor mennek (‘they go’). The derived base form menmust be deemed a new word and potential error. Oneway to combat this problem is to encode irregularlexical items into the knowledge base of the system.
One final issue is the limited scope of the system.The most frequent source of errors is due to Hun-garian’s extensive case system. The analyzer canidentify accusative or nominative case on nouns, forexample, but because it considers each word individ-ually, it cannot determine whether there is an error.Performance improves when excluding such types,but adding context-sensitivity is a crucial future step.
5.3 Grammar extraction
The final evaluation is the most exploratory, involv-ing the extraction of properties which might be use-ful for comparing different learners. The space ofpossibly relevant metrics is quite large (Lu, 2010,2012; Vajjala and Loo, 2013; Vyatkina, 2013; Yan-nakoudakis et al., 2012), and in this exploratorystudy we focus on a small number of metrics sur-
rounding: a) complexity, and b) paradigm cover-age. An overall goal is to sort out features whichare good at distinguishing learner level from thosewhich characterize individual learner differences.
Complexity Complexity is often used to describethe syntax of learners and the structure of their sen-tences. We consider the average number of mor-phemes per word (MPW) and of words per sen-tence (WPS). Tokenization and segmentation areperformed by the analyzer (and checked for accu-racy). The last five journal entries for each learnerare analyzed, to avoid masking change over time, asinterlanguage is always changing.
MPW WPSBeg01 1.38 5.79Beg02 1.40 4.37Beg03 1.52 3.84Beg04 1.31 5.43Beg06 1.52 5.75Beg08 1.44 2.81Beg09 1.58 3.28Int01 1.51 6.40Adv01 1.60 15.73Adv02 1.66 10.90
Table 6: Complexity measures for learners of Hungarian
The beginning learners produce a range of mor-phemes per word, with some even approaching theproduction of the advanced learners. Even the leastmorphologically productive learner (Beg04) attains1.31 morphemes per word. This particular aspect ofmorphological complexity, while it increases withgreater proficiency, seems to be a largely individ-ual feature of learner language, making it a po-tential candidate for classification tasks to identifyspecific learners or to characterize individual differ-ences. Sentence length, while it has individual varia-tion, seems to increase over the course of acquisitionand thus may be an indicator of proficiency.
Coverage Taking Hungarian’s morphologicalrichness into account, we propose paradigmcoverage to represent the frequency of differentverb forms within the same tense and mood (here,present indicative), thus showcasing how much
38
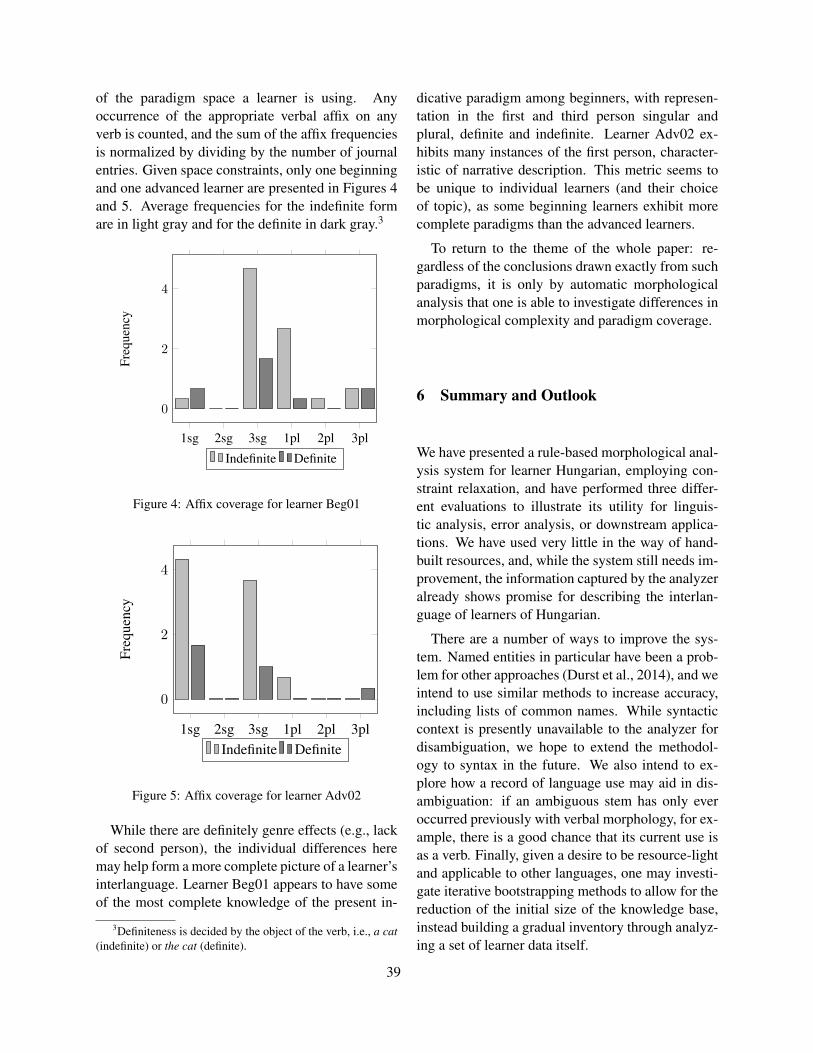
of the paradigm space a learner is using. Anyoccurrence of the appropriate verbal affix on anyverb is counted, and the sum of the affix frequenciesis normalized by dividing by the number of journalentries. Given space constraints, only one beginningand one advanced learner are presented in Figures 4and 5. Average frequencies for the indefinite formare in light gray and for the definite in dark gray.3
1sg 2sg 3sg 1pl 2pl 3pl
0
2
4
Freq
uenc
y
Indefinite Definite
Figure 4: Affix coverage for learner Beg01
1sg 2sg 3sg 1pl 2pl 3pl
0
2
4
Freq
uenc
y
Indefinite Definite
Figure 5: Affix coverage for learner Adv02
While there are definitely genre effects (e.g., lackof second person), the individual differences heremay help form a more complete picture of a learner’sinterlanguage. Learner Beg01 appears to have someof the most complete knowledge of the present in-
3Definiteness is decided by the object of the verb, i.e., a cat(indefinite) or the cat (definite).
dicative paradigm among beginners, with represen-tation in the first and third person singular andplural, definite and indefinite. Learner Adv02 ex-hibits many instances of the first person, character-istic of narrative description. This metric seems tobe unique to individual learners (and their choiceof topic), as some beginning learners exhibit morecomplete paradigms than the advanced learners.
To return to the theme of the whole paper: re-gardless of the conclusions drawn exactly from suchparadigms, it is only by automatic morphologicalanalysis that one is able to investigate differences inmorphological complexity and paradigm coverage.
6 Summary and Outlook
We have presented a rule-based morphological anal-ysis system for learner Hungarian, employing con-straint relaxation, and have performed three differ-ent evaluations to illustrate its utility for linguis-tic analysis, error analysis, or downstream applica-tions. We have used very little in the way of hand-built resources, and, while the system still needs im-provement, the information captured by the analyzeralready shows promise for describing the interlan-guage of learners of Hungarian.
There are a number of ways to improve the sys-tem. Named entities in particular have been a prob-lem for other approaches (Durst et al., 2014), and weintend to use similar methods to increase accuracy,including lists of common names. While syntacticcontext is presently unavailable to the analyzer fordisambiguation, we hope to extend the methodol-ogy to syntax in the future. We also intend to ex-plore how a record of language use may aid in dis-ambiguation: if an ambiguous stem has only everoccurred previously with verbal morphology, for ex-ample, there is a good chance that its current use isas a verb. Finally, given a desire to be resource-lightand applicable to other languages, one may investi-gate iterative bootstrapping methods to allow for thereduction of the initial size of the knowledge base,instead building a gradual inventory through analyz-ing a set of learner data itself.
39
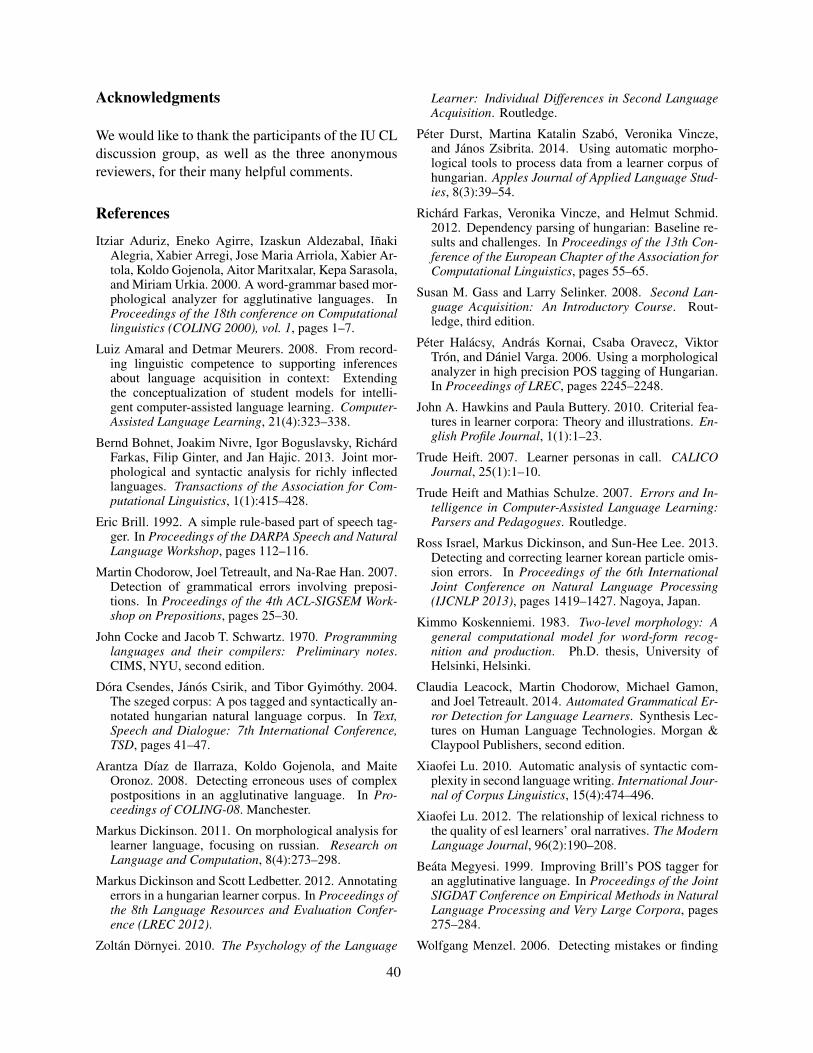
Acknowledgments
We would like to thank the participants of the IU CLdiscussion group, as well as the three anonymousreviewers, for their many helpful comments.
References
Itziar Aduriz, Eneko Agirre, Izaskun Aldezabal, InakiAlegria, Xabier Arregi, Jose Maria Arriola, Xabier Ar-tola, Koldo Gojenola, Aitor Maritxalar, Kepa Sarasola,and Miriam Urkia. 2000. A word-grammar based mor-phological analyzer for agglutinative languages. InProceedings of the 18th conference on Computationallinguistics (COLING 2000), vol. 1, pages 1–7.
Luiz Amaral and Detmar Meurers. 2008. From record-ing linguistic competence to supporting inferencesabout language acquisition in context: Extendingthe conceptualization of student models for intelli-gent computer-assisted language learning. Computer-Assisted Language Learning, 21(4):323–338.
Bernd Bohnet, Joakim Nivre, Igor Boguslavsky, RichardFarkas, Filip Ginter, and Jan Hajic. 2013. Joint mor-phological and syntactic analysis for richly inflectedlanguages. Transactions of the Association for Com-putational Linguistics, 1(1):415–428.
Eric Brill. 1992. A simple rule-based part of speech tag-ger. In Proceedings of the DARPA Speech and NaturalLanguage Workshop, pages 112–116.
Martin Chodorow, Joel Tetreault, and Na-Rae Han. 2007.Detection of grammatical errors involving preposi-tions. In Proceedings of the 4th ACL-SIGSEM Work-shop on Prepositions, pages 25–30.
John Cocke and Jacob T. Schwartz. 1970. Programminglanguages and their compilers: Preliminary notes.CIMS, NYU, second edition.
Dora Csendes, Janos Csirik, and Tibor Gyimothy. 2004.The szeged corpus: A pos tagged and syntactically an-notated hungarian natural language corpus. In Text,Speech and Dialogue: 7th International Conference,TSD, pages 41–47.
Arantza Dıaz de Ilarraza, Koldo Gojenola, and MaiteOronoz. 2008. Detecting erroneous uses of complexpostpositions in an agglutinative language. In Pro-ceedings of COLING-08. Manchester.
Markus Dickinson. 2011. On morphological analysis forlearner language, focusing on russian. Research onLanguage and Computation, 8(4):273–298.
Markus Dickinson and Scott Ledbetter. 2012. Annotatingerrors in a hungarian learner corpus. In Proceedings ofthe 8th Language Resources and Evaluation Confer-ence (LREC 2012).
Zoltan Dornyei. 2010. The Psychology of the Language
Learner: Individual Differences in Second LanguageAcquisition. Routledge.
Peter Durst, Martina Katalin Szabo, Veronika Vincze,and Janos Zsibrita. 2014. Using automatic morpho-logical tools to process data from a learner corpus ofhungarian. Apples Journal of Applied Language Stud-ies, 8(3):39–54.
Richard Farkas, Veronika Vincze, and Helmut Schmid.2012. Dependency parsing of hungarian: Baseline re-sults and challenges. In Proceedings of the 13th Con-ference of the European Chapter of the Association forComputational Linguistics, pages 55–65.
Susan M. Gass and Larry Selinker. 2008. Second Lan-guage Acquisition: An Introductory Course. Rout-ledge, third edition.
Peter Halacsy, Andras Kornai, Csaba Oravecz, ViktorTron, and Daniel Varga. 2006. Using a morphologicalanalyzer in high precision POS tagging of Hungarian.In Proceedings of LREC, pages 2245–2248.
John A. Hawkins and Paula Buttery. 2010. Criterial fea-tures in learner corpora: Theory and illustrations. En-glish Profile Journal, 1(1):1–23.
Trude Heift. 2007. Learner personas in call. CALICOJournal, 25(1):1–10.
Trude Heift and Mathias Schulze. 2007. Errors and In-telligence in Computer-Assisted Language Learning:Parsers and Pedagogues. Routledge.
Ross Israel, Markus Dickinson, and Sun-Hee Lee. 2013.Detecting and correcting learner korean particle omis-sion errors. In Proceedings of the 6th InternationalJoint Conference on Natural Language Processing(IJCNLP 2013), pages 1419–1427. Nagoya, Japan.
Kimmo Koskenniemi. 1983. Two-level morphology: Ageneral computational model for word-form recog-nition and production. Ph.D. thesis, University ofHelsinki, Helsinki.
Claudia Leacock, Martin Chodorow, Michael Gamon,and Joel Tetreault. 2014. Automated Grammatical Er-ror Detection for Language Learners. Synthesis Lec-tures on Human Language Technologies. Morgan &Claypool Publishers, second edition.
Xiaofei Lu. 2010. Automatic analysis of syntactic com-plexity in second language writing. International Jour-nal of Corpus Linguistics, 15(4):474–496.
Xiaofei Lu. 2012. The relationship of lexical richness tothe quality of esl learners’ oral narratives. The ModernLanguage Journal, 96(2):190–208.
Beata Megyesi. 1999. Improving Brill’s POS tagger foran agglutinative language. In Proceedings of the JointSIGDAT Conference on Empirical Methods in NaturalLanguage Processing and Very Large Corpora, pages275–284.
Wolfgang Menzel. 2006. Detecting mistakes or finding
40
misconceptions? diagnosing morpho-syntactic errorsin language learning. In Galia Angelova, Kiril Simov,and Milena Slavcheva, editors, Readings in Multilin-guality, pages 71–77. Incoma Ltd., Shoumen, Bul-garia.
Kemal Oflazer. 1994. Two-level description of turk-ish morphology. Literary and Linguistic Computing,9(2):137–148.
Ozlem Cetinoglu and Jonas Kuhn. 2013. Towards jointmorphological analysis and dependency parsing ofturkish. In Proceedings of the 2nd International Con-ference on Dependency Linguistics (DepLing 2013),pages 23–32.
Gabor Proszeky and Balazs Kis. 1999. A unification-based approach to morpho-syntactic parsing aggluti-native and other (highly) inflectional languages. InProceedings of the 37th annual meeting of the Associ-ation for Computational Linguistics on ComputationalLinguistics, pages 261–268.
Marwa Ragheb. 2014. Building a Syntactically-Annotated Corpus of Learner English. Ph.D. thesis,Indiana University, Bloomington, IN.
Marwa Ragheb and Markus Dickinson. 2014. Devel-oping a corpus of syntactically-annotated learner lan-guage for English. In Proceedings of the 13th Interna-tional Workshop on Treebanks and Linguistic Theories(TLT13), Poster Session. Tubingen, Germany.
Veit Reuer. 2003. Error recognition and feedbackwith lexical functional grammar. CALICO Journal,20(3):497–512.
Thomas Schmidt. 2010. Linguistic tool developmentbetween community practices and technology stan-dards. In Proceedings of the Workshop on LanguageResource and Language Technology Standards. Malta.
Camilla B. Schwind. 1995. Error analysis and explana-tion in knowledge based language tutoring. ComputerAssisted Language Learning, 8(4):295–324.
Mark Steedman and Jason Baldridge. 2011. Combi-natory categorial grammar. In Robert Borsley andKersti Borjars, editors, Non-Transformational Syn-tax: Formal and Explicit Models of Grammar. Wiley-Blackwell.
Joel Tetreault and Martin Chodorow. 2008. The ups anddowns of prepositions error detection in ESL writing.In Proceedings of the 22nd International Conferenceon Computational Linguistics (Coling 2008), pages865–872.
Sylvie Thouesny and Francoise Blin. 2011. Modelinglanguage learners’ knowledge: What information canbe inferred from learners’ free written texts? InM. Levy, F. Blin, C. Bradin Siskin, and O. Takeuchi,editors, WorldCALL: International Perspectives onComputer-Assisted Language Learning, pages 114–127. Routledge, New York.
Miklos Torkenczy. 2008. Hungarian Verbs and Essen-tials of Grammar, 2nd ed. McGraw-Hill, New York.
Viktor Tron, Gyogy Gyepesi, Peter Halacsky, Andras Ko-rnai, Laszlo Nemeth, and Daniel Varga. 2005. Hun-morph: Open source word analysis. In Proceedings ofthe Workshop on Software, pages 77–85. Associationfor Computational Linguistics.
Viktor Tron, Peter Halacsy, Peter Rebrus, Andras Rung,Peter Vajda, and Eszter Simon. 2006. Morphdb.hu:Hungarian lexical database and morphological gram-mar. In Proceedings of 5th International Confer-ence on Language Resources and Evaluation (LREC),pages 1670–1673.
Sowmya Vajjala and Kaidi Loo. 2013. Role of morpho-syntactic features in estonian proficiency classifica-tion. In Proceedings of the Eighth Workshop on In-novative Use of NLP for Building Educational Appli-cations, pages 63–72.
Veronika Vincze, Janos Zsibrita, Peter Durst, and Mar-tina Katalin Szabo. 2014. Automatic error detectionconcerning the definite and indefinite conjugation inthe hunlearner corpus. In Proceedings of the 9th Lan-guage Resources and Evaluation Conference (LREC2014).
Nina Vyatkina. 2013. Specific syntactic complexity: De-velopmental profiling of individuals based on an anno-tated learner corpus. The Modern Language Journal,97:11–30.
Helen Yannakoudakis, Ted Briscoe, and Theodora Alex-opoulou. 2012. Automating second language acqui-sition research: Integrating information visualisationand machine learning. In Proceedings of the EACL2012 Joint Workshop of LINGVIS & UNCLH, pages35–43.
Janos Zsibrita, Veronika Vincze, and Richard Farkas.2013. Magyarlanc: A toolkit for morphological anddependency parsing of hungarian. In Proceedings ofRANLP, pages 763–771.
41
Proceedings of the Tenth Workshop on Innovative Use of NLP for Building Educational Applications, 2015, pages 42–48,Denver, Colorado, June 4, 2015. c©2015 Association for Computational Linguistics
Automated Scoring of Picture-based Story Narration
Swapna Somasundaran1, Chong Min Lee1, Martin Chodorow2 and Xinhao Wang1
1Educational Testing Service, 660 Rosedale Road, Princeton, NJ 08541, USA2Hunter College and the Graduate Center, CUNY, New York, NY 10065, USA
{ssomasundaran,clee001,xwang002}@[email protected]
Abstract
This work investigates linguistically moti-vated features for automatically scoring a spo-ken picture-based narration task. Specifically,we build scoring models with features forstory development, language use and task rele-vance of the response. Results show that com-binations of these features outperform a base-line system that uses state of the art speech-based features, and that best results are ob-tained by combining the linguistic and speechfeatures.
1 Introduction
Story-telling has been used in evaluating the devel-opment of language skills (Sun and Nippold, 2012;McKeough and Malcolm, 2011; Botvin and Sutton-Smith, 1977). It has also been incorporated intoassessment of English language proficiency in testssuch as ETS’s TOEFL Junior Comprehensive Test1,where English language skills of non-native middle-school students are tested on a task designed to elicitstories based on pictures. The Six-Picture Narrationtask presents a series of six pictures (similar to acomic strip) to the test taker, who must orally pro-duce a story which incorporates the events depictedin the pictures. As the scoring guide2 for this task in-dicates, in addition to fluidity of speech and few pro-nunciation errors, high scoring responses must also
1Details of the task and sample can be found athttps://toefljr.caltesting.org/sampleQuestions/TOEFLJr/s-movietheater.html
2https://www.ets.org/s/toefl junior/pdf/toefl junior comprehensive speaking scoring guides.pdf
show good command of language conventions, in-cluding grammar and word usage, and must also berelevant to the task.
Previous work (Evanini and Wang, 2013) ex-plored automated assessment of the speech compo-nent of the spoken responses to the picture narra-tion task, but the linguistic and narrative aspects ofthe response have not received much attention. Inthis work, we investigate linguistic and construct-relevant aspects of the test such as (1) relevance andcompleteness of the content of the responses withrespect to the prompt pictures, (2) proper word us-age (3) use of narrative techniques such as detailingto enhance the story, and (4) sequencing strategiesto build a coherent story.
The contribution of this work is three-fold. First,we improve the construct coverage of the automatedscoring models by incorporating evaluation of ele-ments prescribed in the scoring rubric. Second, ourlinguistically motivated features allow for clear in-terpretation and explanation of scores, which is es-pecially important if the automated scoring is to beemployed for educational purposes. Finally, our re-sults are promising – we show that the combinationof linguistic and construct-relevant features whichwe explore in this work outperforms the state of theart baseline system, and that the best performance isobtained when the linguistic and construct-relevantfeatures are combined with the speech features.
2 Related Work
Evanini et al. (2013; 2014) use features extractedmainly from speech for scoring the picture narra-tion task. They employ measures capturing fluency,
42
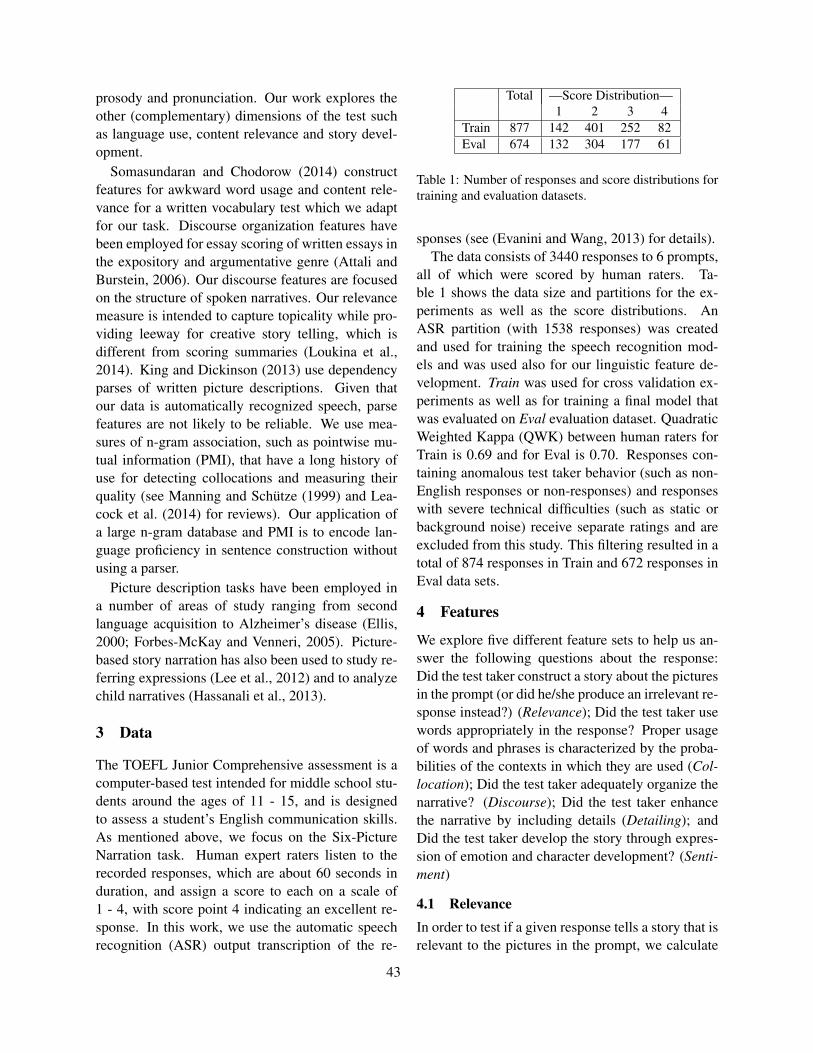
prosody and pronunciation. Our work explores theother (complementary) dimensions of the test suchas language use, content relevance and story devel-opment.
Somasundaran and Chodorow (2014) constructfeatures for awkward word usage and content rele-vance for a written vocabulary test which we adaptfor our task. Discourse organization features havebeen employed for essay scoring of written essays inthe expository and argumentative genre (Attali andBurstein, 2006). Our discourse features are focusedon the structure of spoken narratives. Our relevancemeasure is intended to capture topicality while pro-viding leeway for creative story telling, which isdifferent from scoring summaries (Loukina et al.,2014). King and Dickinson (2013) use dependencyparses of written picture descriptions. Given thatour data is automatically recognized speech, parsefeatures are not likely to be reliable. We use mea-sures of n-gram association, such as pointwise mu-tual information (PMI), that have a long history ofuse for detecting collocations and measuring theirquality (see Manning and Schutze (1999) and Lea-cock et al. (2014) for reviews). Our application ofa large n-gram database and PMI is to encode lan-guage proficiency in sentence construction withoutusing a parser.
Picture description tasks have been employed ina number of areas of study ranging from secondlanguage acquisition to Alzheimer’s disease (Ellis,2000; Forbes-McKay and Venneri, 2005). Picture-based story narration has also been used to study re-ferring expressions (Lee et al., 2012) and to analyzechild narratives (Hassanali et al., 2013).
3 Data
The TOEFL Junior Comprehensive assessment is acomputer-based test intended for middle school stu-dents around the ages of 11 - 15, and is designedto assess a student’s English communication skills.As mentioned above, we focus on the Six-PictureNarration task. Human expert raters listen to therecorded responses, which are about 60 seconds induration, and assign a score to each on a scale of1 - 4, with score point 4 indicating an excellent re-sponse. In this work, we use the automatic speechrecognition (ASR) output transcription of the re-
Total —Score Distribution—1 2 3 4
Train 877 142 401 252 82Eval 674 132 304 177 61
Table 1: Number of responses and score distributions fortraining and evaluation datasets.
sponses (see (Evanini and Wang, 2013) for details).The data consists of 3440 responses to 6 prompts,
all of which were scored by human raters. Ta-ble 1 shows the data size and partitions for the ex-periments as well as the score distributions. AnASR partition (with 1538 responses) was createdand used for training the speech recognition mod-els and was used also for our linguistic feature de-velopment. Train was used for cross validation ex-periments as well as for training a final model thatwas evaluated on Eval evaluation dataset. QuadraticWeighted Kappa (QWK) between human raters forTrain is 0.69 and for Eval is 0.70. Responses con-taining anomalous test taker behavior (such as non-English responses or non-responses) and responseswith severe technical difficulties (such as static orbackground noise) receive separate ratings and areexcluded from this study. This filtering resulted in atotal of 874 responses in Train and 672 responses inEval data sets.
4 Features
We explore five different feature sets to help us an-swer the following questions about the response:Did the test taker construct a story about the picturesin the prompt (or did he/she produce an irrelevant re-sponse instead?) (Relevance); Did the test taker usewords appropriately in the response? Proper usageof words and phrases is characterized by the proba-bilities of the contexts in which they are used (Col-location); Did the test taker adequately organize thenarrative? (Discourse); Did the test taker enhancethe narrative by including details (Detailing); andDid the test taker develop the story through expres-sion of emotion and character development? (Senti-ment)
4.1 RelevanceIn order to test if a given response tells a story that isrelevant to the pictures in the prompt, we calculate
43
the overlap of the content of the response and thecontent of the pictures similar to (Somasundaran andChodorow, 2014). To facilitate this, each prompt isassociated with a reference corpus containing a de-tailed description of each picture, and also an overallnarrative that ties together the events in the pictures.Each reference corpus was created by merging thepicture descriptions and narratives that were gener-ated independently by 10 annotators.3 To calculateoverlap, stop words were first removed from lem-matized versions of the response and the referencecorpus.
Because test-takers often use synonyms and otherwords related to the prompt, we expanded the con-tent words in the reference corpus by adding theirsynonyms, as provided in Lin’s thesaurus (Lin,1998) and in WordNet, and also included theirWordNet hypernyms and hyponyms. This gave usthe following 6 features which measure the over-lap, or coverage, between the lemmatized responseand the lemmatized (i) reference corpus (lemmas),(ii) reference corpus expanded using Lin’s the-saurus (cov-lin), (iii) reference corpus expanded us-ing WordNet Synonyms (cov-wn-syns), (iv) refer-ence corpus expanded using WordNet Hypernyms(cov-wn-hyper), (v) reference corpus expanded us-ing WordNet Hyponyms (cov-wn-hypo), and (vi)reference corpus expanded using all of the abovemethods (cov-all).
4.2 CollocationInexperienced use of language is often characterizedby inappropriate combinations of words, indicatingthe writer’s lack of knowledge of collocations. Inorder to detect this, we calculate the Pointwise Mu-tual Information (PMI) of all adjacent word pairs(bigrams), as well as all adjacent word triples (tri-grams) in the Google 1T web corpus (Brants andFranz, 2006). The higher the value of the PMI,the more common is the collocation for the wordpair/triple in well formed texts. On the other hand,negative values of PMI indicate that the given wordpair or triple is less likely than chance to occurtogether. We hypothesized that this would be agood indicator of awkward usage, as suggested in
3We do not calculate agreement as producing different de-scriptions and having variety was the goal of the task of refer-ence corpus creation.
Chodorow and Leacock (2000).The PMI values for adjacent words obtained over
the entire response are then assigned to bins, with 8bins for word pairs and another 8 for word triplesfollowing the procedure from (Somasundaran andChodorow, 2014). Each of the 8 bins representsa range of PMI : p > 20, 10 < p ≤ 20, 1 <p ≤ 10, 0 < p ≤ 1,−1 < p ≤ 0,−10 < p ≤−1,−20 < p ≤ −10, p ≤ −20.
We generate two sets of features based on the pro-portions of bigrams/trigrams falling into each bin,resulting in a total of 16 features. In addition tobinning, we also encode as features the maximum,minimum and median PMI value obtained over allbigrams and trigrams. These encode the best andthe worst word collocations in a response as well asthe overall general quality of the response.
4.3 DiscourseStories are characterized by events that are related(and ordered) temporally or causally. In order toform a coherent narrative, it is often necessary touse proper transition cues to organize the story. In-tuitively, coherent responses are more likely to havethese cues than less coherent responses.
In order to detect discourse organization cues, weuse two lexicons. The first was obtained from thePenn Discourse Treebank (PDTB) annotation man-ual (Prasad et al., 2008). The second was developedby manually mining websites giving advice on goodnarrative writing. The two lexicons gave us a total ofover 550 cues. From the PDTB and our lexicon, weextracted the number of times each connective wasencountered in a particular sense (sense informationsuch as “Temporal” or “Cause” is directly providedin the PDTB manual, and we added similar informa-tion to our manually collected lexicon) and used thefrequencies to construct a probability distributionover the senses for that cue. Then, for each response,we produced the following features: the number ofcues found in the response (totalCuesCount), thenumber of cues found in the response divided bythe number of words in the response (normalized-CuesCount), the number of cues belonging to thetemporal category (temporalCuesCount), the num-ber of cues belonging to the causal category (causal-CuesCount), the sum of the probabilities of belong-ing to the temporal category for each cue found in
44
the response (temporalCuesScore), the sum of theprobabilities of belonging to the causal category foreach cue found in the response (causalCuesScore).
4.4 Detailing
We hypothesized that better responses would showevidence of effective narrative techniques, such asproviding vivid descriptions of the events and pro-viding depth to the story. For example, one couldsay “In the afternoon a boy and a man went to thelibrary.”, or make the story more interesting by as-signing names to the characters and places as “Oneday John went to the Central Public Library be-cause he wanted to do some research for his scienceproject. An old man was walking behind him; hisname was Peter. ”
We observed that certain syntactic categories,such as adjectives and adverbs, come into play inthe process of detailing. Also, detailing by providingnames to the characters and places results in a highernumber of proper nouns (NNPs). Thus our detailingfeature set consists of the following features: a bi-nary value indicating whether the response containsany proper nouns (presenceNames), the number ofproper nouns in the response (countNames), a binaryvalue indicating whether the response contains anyadjectives (presenceAdj), the number of adjectivesin the response (countAdj), a binary value indicat-ing whether the response contains any adverbs (pres-enceAdv), the number of adverbs in the response(countAdv). We use separate features for counts andpresence of the syntactic category in order to balancethe trade-off between sparsity and informativeness.The count features are more informative, but theycan be sparse (especially for higher counts).
4.5 Sentiment
One common technique used in developing a storyis to reveal the character’s private states, emotionsand feelings. This requires the use of subjectivityand sentiment terms.
We use lexicons for annotating sentiment andsubjective words in the response. Specifically, weuse a sentiment lexicon (ASSESS) developed in pre-vious work in assessments (Beigman Klebanov etal., 2013) and the MPQA subjectivity lexicon (Wil-son et al., 2005). ASSESS lexicon assigns a pos-itive/negative/neutral polarity probability profile to
its entries, and MPQA lexicon associates a positive,negative or neutral polarity category to its entries.We consider a word from the ASSESS lexicon to bepolar if the sum of positive and negative probabili-ties is greater than 0.65 (we arrived at this numberafter manual inspection of the lexicon). This givesus the subjectivity feature set comprised of the fol-lowing features: A binary value indicating whetherthe response contains any polar words from the AS-SESS lexicon (presencePolarProfile), the number ofpolar words from the ASSESS lexicon found in theresponse (cntPolarProfile), a binary value indicatingwhether the response contains any polar words fromthe MPQA lexicon (presenceMpqaPolar), the num-ber of polar words from the MPQA lexicon found inthe response (cntMpqaPolar), a binary value indicat-ing whether the response contains any neutral wordsfrom the MPQA lexicon (presenceMpqaNeut), thenumber of neutral words from the MPQA lexiconfound in the response (cntMpqaNeut).
We construct separate features from the ASSESSlexicon and the MPQA lexicon because we foundthat the neutral category had different meanings inthe two lexicons – even the neutral entries in theMPQA lexicon are valuable as they may indicatespeech events and private states (e.g. view, assess,believe, cogitate, contemplate, feel, glean, thinketc.). On the other hand, words with a high prob-ability of being neutral in the ASSESS lexicon arenon-subjective words (e.g. woman, undergo, entire,technologies).
5 Experiments
For our experiments, we used a supervised learn-ing framework, with the data described above, tobuild scoring models based on our feature sets. Weevaluated several different learning algorithms andfound that a Random Forest Classifier consistentlyproduced the best results in cross-validation experi-ments on the training data when we used our featuresas well as when we used the baseline set of features.Hence, all of our results in this section are reportedusing this Random Forest learner. Performance wascalculated using Quadratic Weighted Kappa (QWK)(Cohen, 1968), which is the standard evaluationmetric used in automated scoring. QWK measuresthe agreement between the system score and the
45
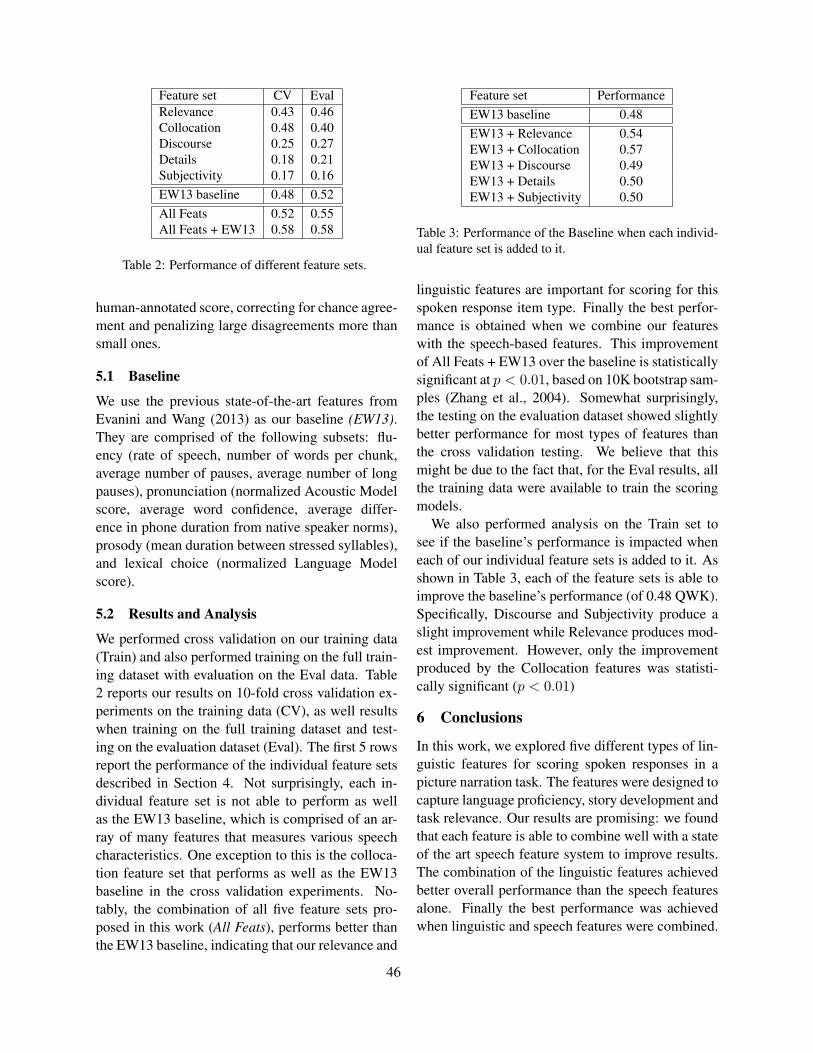
Feature set CV EvalRelevance 0.43 0.46Collocation 0.48 0.40Discourse 0.25 0.27Details 0.18 0.21Subjectivity 0.17 0.16EW13 baseline 0.48 0.52All Feats 0.52 0.55All Feats + EW13 0.58 0.58
Table 2: Performance of different feature sets.
human-annotated score, correcting for chance agree-ment and penalizing large disagreements more thansmall ones.
5.1 Baseline
We use the previous state-of-the-art features fromEvanini and Wang (2013) as our baseline (EW13).They are comprised of the following subsets: flu-ency (rate of speech, number of words per chunk,average number of pauses, average number of longpauses), pronunciation (normalized Acoustic Modelscore, average word confidence, average differ-ence in phone duration from native speaker norms),prosody (mean duration between stressed syllables),and lexical choice (normalized Language Modelscore).
5.2 Results and Analysis
We performed cross validation on our training data(Train) and also performed training on the full train-ing dataset with evaluation on the Eval data. Table2 reports our results on 10-fold cross validation ex-periments on the training data (CV), as well resultswhen training on the full training dataset and test-ing on the evaluation dataset (Eval). The first 5 rowsreport the performance of the individual feature setsdescribed in Section 4. Not surprisingly, each in-dividual feature set is not able to perform as wellas the EW13 baseline, which is comprised of an ar-ray of many features that measures various speechcharacteristics. One exception to this is the colloca-tion feature set that performs as well as the EW13baseline in the cross validation experiments. No-tably, the combination of all five feature sets pro-posed in this work (All Feats), performs better thanthe EW13 baseline, indicating that our relevance and
Feature set PerformanceEW13 baseline 0.48EW13 + Relevance 0.54EW13 + Collocation 0.57EW13 + Discourse 0.49EW13 + Details 0.50EW13 + Subjectivity 0.50
Table 3: Performance of the Baseline when each individ-ual feature set is added to it.
linguistic features are important for scoring for thisspoken response item type. Finally the best perfor-mance is obtained when we combine our featureswith the speech-based features. This improvementof All Feats + EW13 over the baseline is statisticallysignificant at p < 0.01, based on 10K bootstrap sam-ples (Zhang et al., 2004). Somewhat surprisingly,the testing on the evaluation dataset showed slightlybetter performance for most types of features thanthe cross validation testing. We believe that thismight be due to the fact that, for the Eval results, allthe training data were available to train the scoringmodels.
We also performed analysis on the Train set tosee if the baseline’s performance is impacted wheneach of our individual feature sets is added to it. Asshown in Table 3, each of the feature sets is able toimprove the baseline’s performance (of 0.48 QWK).Specifically, Discourse and Subjectivity produce aslight improvement while Relevance produces mod-est improvement. However, only the improvementproduced by the Collocation features was statisti-cally significant (p < 0.01)
6 Conclusions
In this work, we explored five different types of lin-guistic features for scoring spoken responses in apicture narration task. The features were designed tocapture language proficiency, story development andtask relevance. Our results are promising: we foundthat each feature is able to combine well with a stateof the art speech feature system to improve results.The combination of the linguistic features achievedbetter overall performance than the speech featuresalone. Finally the best performance was achievedwhen linguistic and speech features were combined.
46

ReferencesYigal Attali and Jill Burstein. 2006. Automated essay
scoring with e-rater v. 2.0. Journal of Technology,Learning, and Assessment, 4:3.
Beata Beigman Klebanov, Jill Burstein, and Nitin Mad-nani. 2013. Sentiment profiles of multi-word expres-sions in test-taker essays: The case of noun-noun com-pounds. In ACM Transactions on Speech and Lan-guage Processing, volume 10(3).
Gilbert J. Botvin and Brian Sutton-Smith. 1977. The de-velopment of structural complexity in children’s fan-tasy narratives. Developmental Psychology, 13(4):377– 388.
Thorsten Brants and Alex Franz. 2006. Web 1T 5-gramVersion 1. In Linguistic Data Consortium, Philadel-phia.
Martin Chodorow and Claudia Leacock. 2000. An unsu-pervised method for detecting grammatical errors. InProceedings of the Conference of the North AmericanChapter of the Association of Computational Linguis-tics (NAACL), pages 140–147.
Jacob Cohen. 1968. Weighted kappa: Nominal scaleagreement provision for scaled disagreement or partialcredit. Psychological Bulletin, 70(4).
Rod Ellis. 2000. Task-based research and language ped-agogy. Language teaching research, 4(3):193–220.
Keelan Evanini and Xinhao Wang. 2013. Automatedspeech scoring for non-native middle school studentswith multiple task types. In Proceedings of Inter-speech, pages 2435–2439.
Keelan Evanini, Michael Heilman, Xinhao Wang, andDaniel Blanchard. 2014. Automated scoring forTOEFL Junior comprehensive writing and speaking.Technical report, ETS, Princeton, NJ.
KE Forbes-McKay and Annalena Venneri. 2005. De-tecting subtle spontaneous language decline in earlyAlzheimers disease with a picture description task.Neurological sciences, 26(4):243–254.
Khairun-nisa Hassanali, Yang Liu, and Thamar Solorio.2013. Using Latent Dirichlet Allocation for child nar-rative analysis. In Proceedings of the 2013 Workshopon Biomedical Natural Language Processing. Associ-ation for Computational Linguistics.
Levi King and Markus Dickinson. 2013. Shallow seman-tic analysis of interactive learner sentences. In Pro-ceedings of the Eighth Workshop on Innovative Useof NLP for Building Educational Applications, pages11–21, Atlanta, Georgia, June. Association for Com-putational Linguistics.
Claudia Leacock, Martin Chodorow, Michael Gamon,and Joel Tetreault. 2014. Automated Grammatical Er-ror Detection for Language Learners. Synthesis Lec-tures on Human Language Technologies. Morgan &Claypool.
Choonkyu Lee, Smaranda Muresan, and KarinStromswold. 2012. Computational analysis ofreferring expressions in narratives of picture books.In Proceedings of the NAACL-HLT 2012 Work-shop on Computational Linguistics for Literature,pages 1–7, Montreal, Canada, June. Association forComputational Linguistics.
Dekang Lin. 1998. Automatic retrieval and cluster-ing of similar words. In Proceedings of the 17th in-ternational conference on Computational linguistics-Volume 2, pages 768–774. ACL.
Anastassia Loukina, Klaus Zechner, and Lei Chen. 2014.Automatic evaluation of spoken summaries: the caseof language assessment. In Proceedings of the NinthWorkshop on Innovative Use of NLP for Building Edu-cational Applications, pages 68–78, Baltimore, Mary-land, June. Association for Computational Linguistics.
Christopher Manning and Hinrich Schutze. 1999. Foun-dations of Statistical Natural Language Processing.MIT Press.
Anne McKeough and Jennifer Malcolm. 2011. Stories offamily, stories of self: Developmental pathways to in-terpretive thought during adolescence. New Directionsfor Child & Adolescent Development, 2011(131):59 –71.
Rashmi Prasad, Nikhil Dinesh, Alan Lee, Eleni Milt-sakaki, Livio Robaldo, Aravind Joshi, and BonnieWebber. 2008. The Penn Discourse Treebank 2.0. InProceedings of the Sixth International Conference onLanguage Resources and Evaluation (LREC’08), Mar-rakech, Morocco, May. European Language ResourcesAssociation (ELRA).
Swapna Somasundaran and Martin Chodorow. 2014.Automated measures of specific vocabulary knowl-edge from constructed responses (use these words towrite a sentence based on this picture). In Proceedingsof the Ninth Workshop on Innovative Use of NLP forBuilding Educational Applications, pages 1–11. Asso-ciation for Computational Linguistics.
Lei Sun and Marilyn A Nippold. 2012. Narrative writ-ing in children and adolescents: Examining the literatelexicon. Language, speech, and hearing services inschools, 43(1):2–13.
Theresa Wilson, Janyce Wiebe, and Paul Hoffmann.2005. Recognizing contextual polarity in phrase-levelsentiment analysis. In Proceedings of the conferenceon Human Language Technology and Empirical Meth-ods in Natural Language Processing (HLT-EMNLP),pages 347–354. Association for Computational Lin-guistics.
Ying Zhang, Stephan Vogel, and Alex Waibel. 2004. In-terpreting bleu/nist scores: How much improvementdo we need to have a better system? In Proceed-ings of the International Conference on Language Re-
47

sources and Evaluation (LREC). European LanguageResources Association (ELRA).
48
Proceedings of the Tenth Workshop on Innovative Use of NLP for Building Educational Applications, 2015, pages 49–55,Denver, Colorado, June 4, 2015. c©2015 Association for Computational Linguistics
Measuring Feature Diversity in Native Language Identification
Shervin MalmasiCentre for Language Technology
Macquarie UniversitySydney, NSW, Australia
Aoife CahillEducational Testing Service
660 Rosedale RdPrinceton, NJ 08541, [email protected]
Abstract
The task of Native Language Identification(NLI) is typically solved with machine learn-ing methods, and systems make use of a widevariety of features. Some preliminary studieshave been conducted to examine the effective-ness of individual features, however, no sys-tematic study of feature interaction has beencarried out. We propose a function to mea-sure feature independence and analyze its ef-fectiveness on a standard NLI corpus.
1 Introduction
Researchers in Second Language Acquisition (SLA)investigate the multiplex of factors that influence ourability to acquire new languages and chief amongthese is the role of the learner’s mother tongue.This core factor has recently been studied in thetask of Native Language Identification (NLI), whichaims to infer the native language (L1) of an au-thor based on texts written in a second language(L2). Machine Learning methods are usually usedto identify language use patterns common to speak-ers of the same L1 (Tetreault et al., 2012). WhileNLI has applications in security, most research hasa strong linguistic motivation relating to languageteaching and learning. In this context, by identifyingL1-specific language usage and error patterns, NLIcan be used to better understand SLA and developteaching methods, instructions and learner feedbackthat is tailored to their mother tongue (Malmasi andDras, 2014b).
Although researchers have employed tens of fea-ture types, no effort has been made to measure theoverlap of information they capture. Results fromprevious studies show that while some feature typesyield similar accuracies independently, combiningthem can improve performance (Brooke and Hirst,
2012). This indicates that the information they cap-ture is diverse, but how diverse are they and how canwe measure the level of independence between thefeature types?
This is a question that has not been tackled in NLI,despite researchers having examined numerous fea-ture types to date. We examine one approach to mea-suring the degree of diversity between features andperform several analyses based on the results.
2 Data and Methodology
We use the TOEFL11 corpus (Blanchard et al., 2013)released with the 2013 NLI shared task (Tetreault etal., 2013). It includes 12,100 learner texts from 11L1 groups, divided into train, dev. and test sets.
We use a linear Support Vector Machine1 to per-form multi-class classification in our experiments.
We experiment with a wide range of previ-ously used syntactic and lexical features: Adap-tor Grammars (AG) (Wong et al., 2012), charac-ter n-grams (Tsur and Rappoport, 2007),2 Func-tion word unigrams and bigrams (Malmasi et al.,2013), Lemma and Word n-grams, CFG Produc-tion Rules (Wong and Dras, 2011), Penn Tree-bank (PTB) part-of-speech n-grams, RASP part-of-speech n-grams (Malmasi et al., 2013), Stanford De-pendencies with POS transformations (Tetreault etal., 2012), and Tree Substitution Grammar (TSG)fragments (Swanson and Charniak, 2012). The in-dividual feature accuracies3 are shown in Figure 1.4
1We use LIBLINEAR. Additional preliminary experimentswith alternative learners yielded similar results.
2We treat character n-grams as lexical features in this workbut restrict our investigation to 1–3-grams. Recent work hasalso shown improvements from longer sequences (Jarvis et al.,2013; Ionescu et al., 2014).
3Obtained by training on the TOEFL11 train and develop-ment sets and evaluating on the test set.
4Listed in alphabetical order.
49
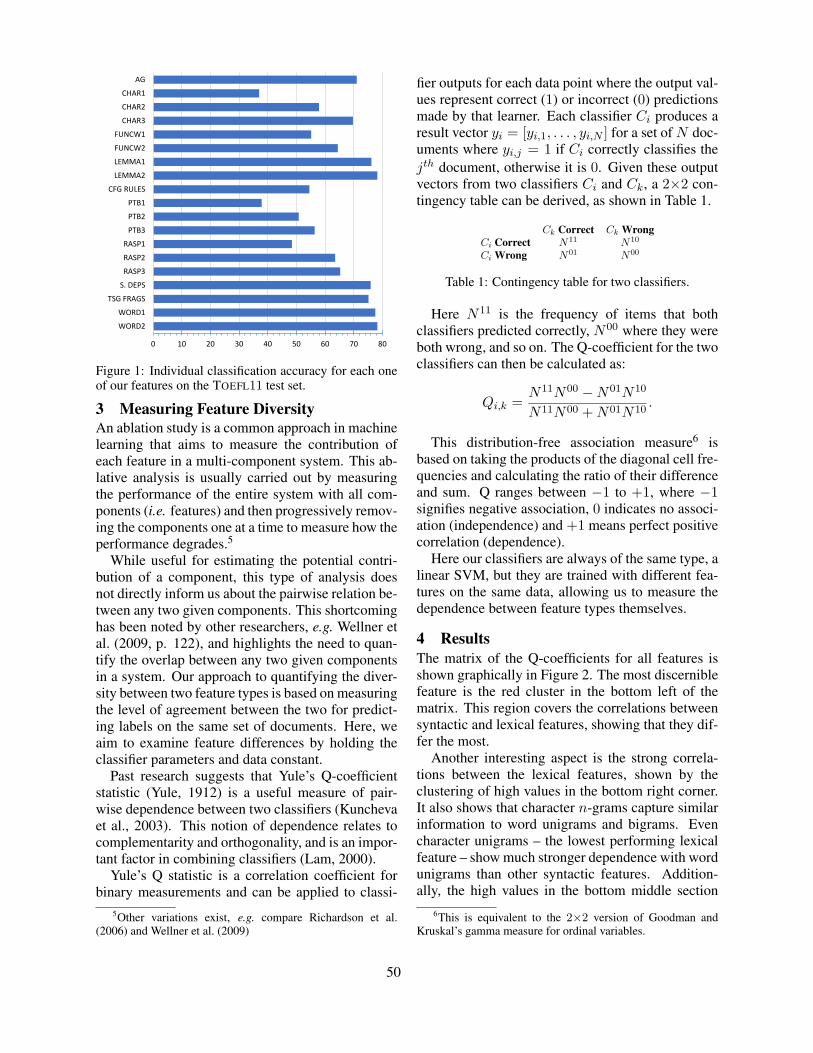
0 10 20 30 40 50 60 70 80
WORD2
WORD1
TSG FRAGS
S. DEPS
RASP3
RASP2
RASP1
PTB3
PTB2
PTB1
CFG RULES
LEMMA2
LEMMA1
FUNCW2
FUNCW1
CHAR3
CHAR2
CHAR1
AG
Classification Accuracy By Feature
Figure 1: Individual classification accuracy for each oneof our features on the TOEFL11 test set.
3 Measuring Feature DiversityAn ablation study is a common approach in machinelearning that aims to measure the contribution ofeach feature in a multi-component system. This ab-lative analysis is usually carried out by measuringthe performance of the entire system with all com-ponents (i.e. features) and then progressively remov-ing the components one at a time to measure how theperformance degrades.5
While useful for estimating the potential contri-bution of a component, this type of analysis doesnot directly inform us about the pairwise relation be-tween any two given components. This shortcominghas been noted by other researchers, e.g. Wellner etal. (2009, p. 122), and highlights the need to quan-tify the overlap between any two given componentsin a system. Our approach to quantifying the diver-sity between two feature types is based on measuringthe level of agreement between the two for predict-ing labels on the same set of documents. Here, weaim to examine feature differences by holding theclassifier parameters and data constant.
Past research suggests that Yule’s Q-coefficientstatistic (Yule, 1912) is a useful measure of pair-wise dependence between two classifiers (Kunchevaet al., 2003). This notion of dependence relates tocomplementarity and orthogonality, and is an impor-tant factor in combining classifiers (Lam, 2000).
Yule’s Q statistic is a correlation coefficient forbinary measurements and can be applied to classi-
5Other variations exist, e.g. compare Richardson et al.(2006) and Wellner et al. (2009)
fier outputs for each data point where the output val-ues represent correct (1) or incorrect (0) predictionsmade by that learner. Each classifier Ci produces aresult vector yi = [yi,1, . . . , yi,N ] for a set of N doc-uments where yi,j = 1 if Ci correctly classifies thejth document, otherwise it is 0. Given these outputvectors from two classifiers Ci and Ck, a 2×2 con-tingency table can be derived, as shown in Table 1.
Ck Correct Ck WrongCi Correct N11 N10
Ci Wrong N01 N00
Table 1: Contingency table for two classifiers.
Here N11 is the frequency of items that bothclassifiers predicted correctly, N00 where they wereboth wrong, and so on. The Q-coefficient for the twoclassifiers can then be calculated as:
Qi,k =N11N00 −N01N10
N11N00 + N01N10.
This distribution-free association measure6 isbased on taking the products of the diagonal cell fre-quencies and calculating the ratio of their differenceand sum. Q ranges between −1 to +1, where −1signifies negative association, 0 indicates no associ-ation (independence) and +1 means perfect positivecorrelation (dependence).
Here our classifiers are always of the same type, alinear SVM, but they are trained with different fea-tures on the same data, allowing us to measure thedependence between feature types themselves.
4 ResultsThe matrix of the Q-coefficients for all features isshown graphically in Figure 2. The most discerniblefeature is the red cluster in the bottom left of thematrix. This region covers the correlations betweensyntactic and lexical features, showing that they dif-fer the most.
Another interesting aspect is the strong correla-tions between the lexical features, shown by theclustering of high values in the bottom right corner.It also shows that character n-grams capture similarinformation to word unigrams and bigrams. Evencharacter unigrams – the lowest performing lexicalfeature – show much stronger dependence with wordunigrams than other syntactic features. Addition-ally, the high values in the bottom middle section
6This is equivalent to the 2×2 version of Goodman andKruskal’s gamma measure for ordinal variables.
50
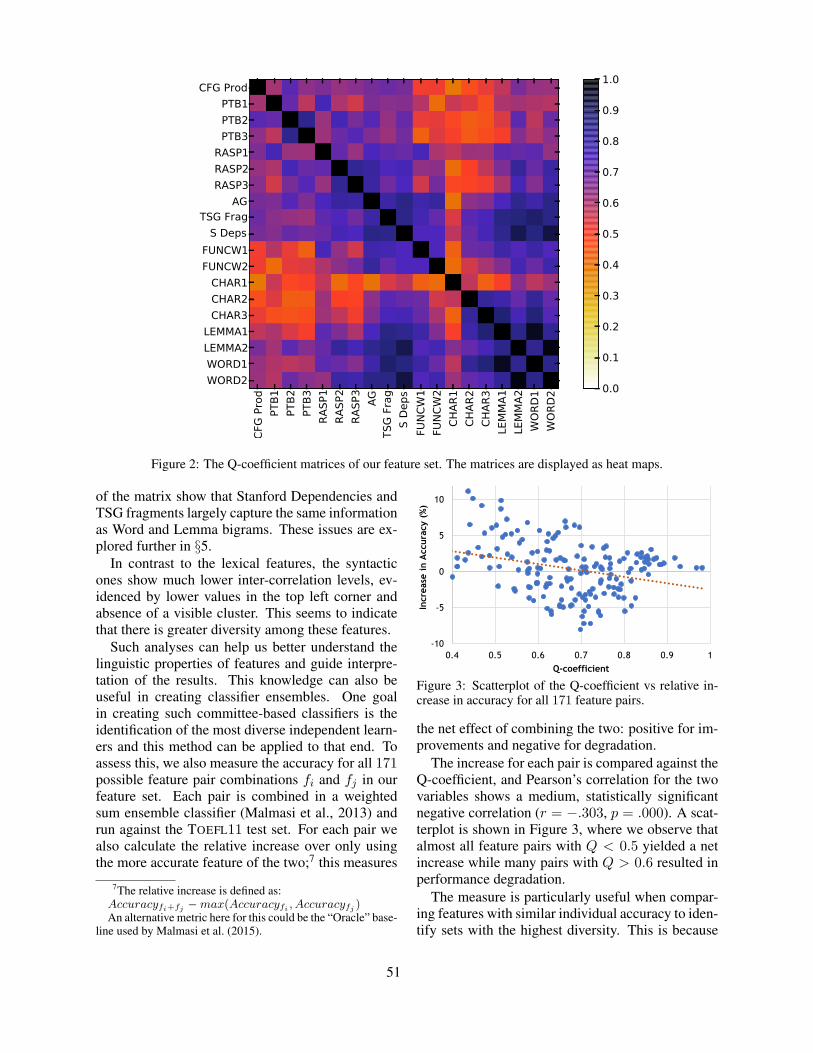
CFG
Pro
d
PTB
1
PTB
2
PTB
3
RA
SP1
RA
SP2
RA
SP3
AG
TSG
Fra
g
S D
eps
FUN
CW
1
FUN
CW
2
CH
AR
1
CH
AR
2
CH
AR
3
LEM
MA
1
LEM
MA
2
WO
RD
1
WO
RD
2
CFG Prod
PTB1
PTB2
PTB3
RASP1
RASP2
RASP3
AGTSG Frag
S Deps
FUNCW1
FUNCW2
CHAR1
CHAR2
CHAR3
LEMMA1
LEMMA2
WORD1
WORD20.0
0.1
0.2
0.3
0.4
0.5
0.6
0.7
0.8
0.9
1.0
Figure 2: The Q-coefficient matrices of our feature set. The matrices are displayed as heat maps.
of the matrix show that Stanford Dependencies andTSG fragments largely capture the same informationas Word and Lemma bigrams. These issues are ex-plored further in §5.
In contrast to the lexical features, the syntacticones show much lower inter-correlation levels, ev-idenced by lower values in the top left corner andabsence of a visible cluster. This seems to indicatethat there is greater diversity among these features.
Such analyses can help us better understand thelinguistic properties of features and guide interpre-tation of the results. This knowledge can also beuseful in creating classifier ensembles. One goalin creating such committee-based classifiers is theidentification of the most diverse independent learn-ers and this method can be applied to that end. Toassess this, we also measure the accuracy for all 171possible feature pair combinations fi and fj in ourfeature set. Each pair is combined in a weightedsum ensemble classifier (Malmasi et al., 2013) andrun against the TOEFL11 test set. For each pair wealso calculate the relative increase over only usingthe more accurate feature of the two;7 this measures
7The relative increase is defined as:Accuracyfi+fj −max(Accuracyfi , Accuracyfj )An alternative metric here for this could be the “Oracle” base-
line used by Malmasi et al. (2015).
-10
-5
0
5
10
0.4 0.5 0.6 0.7 0.8 0.9 1
Incre
ase
in A
ccura
cy (
%)
Q-coefficient
Figure 3: Scatterplot of the Q-coefficient vs relative in-crease in accuracy for all 171 feature pairs.
the net effect of combining the two: positive for im-provements and negative for degradation.
The increase for each pair is compared against theQ-coefficient, and Pearson’s correlation for the twovariables shows a medium, statistically significantnegative correlation (r = −.303, p = .000). A scat-terplot is shown in Figure 3, where we observe thatalmost all feature pairs with Q < 0.5 yielded a netincrease while many pairs with Q > 0.6 resulted inperformance degradation.
The measure is particularly useful when compar-ing features with similar individual accuracy to iden-tify sets with the highest diversity. This is because
51
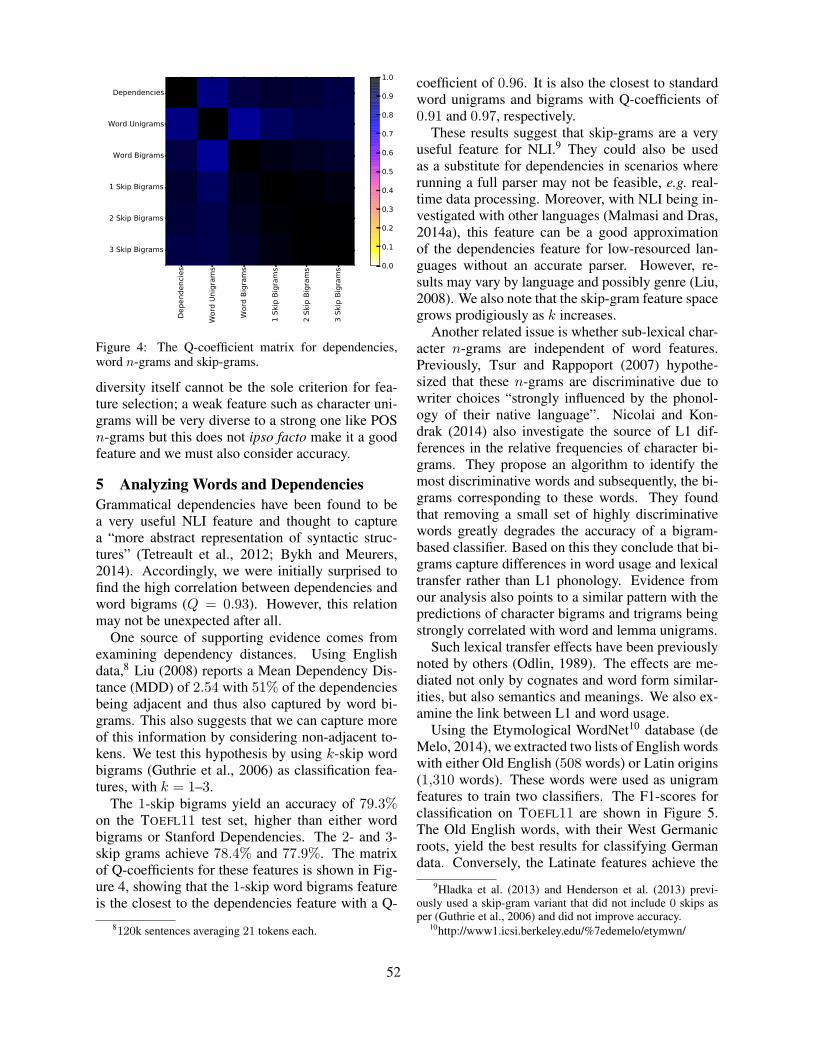
Dependenci
es
Word
Unig
ram
s
Word
Big
ram
s
1 S
kip B
igra
ms
2 S
kip B
igra
ms
3 S
kip B
igra
ms
Dependencies
Word Unigrams
Word Bigrams
1 Skip Bigrams
2 Skip Bigrams
3 Skip Bigrams
0.0
0.1
0.2
0.3
0.4
0.5
0.6
0.7
0.8
0.9
1.0
Figure 4: The Q-coefficient matrix for dependencies,word n-grams and skip-grams.
diversity itself cannot be the sole criterion for fea-ture selection; a weak feature such as character uni-grams will be very diverse to a strong one like POSn-grams but this does not ipso facto make it a goodfeature and we must also consider accuracy.
5 Analyzing Words and DependenciesGrammatical dependencies have been found to bea very useful NLI feature and thought to capturea “more abstract representation of syntactic struc-tures” (Tetreault et al., 2012; Bykh and Meurers,2014). Accordingly, we were initially surprised tofind the high correlation between dependencies andword bigrams (Q = 0.93). However, this relationmay not be unexpected after all.
One source of supporting evidence comes fromexamining dependency distances. Using Englishdata,8 Liu (2008) reports a Mean Dependency Dis-tance (MDD) of 2.54 with 51% of the dependenciesbeing adjacent and thus also captured by word bi-grams. This also suggests that we can capture moreof this information by considering non-adjacent to-kens. We test this hypothesis by using k-skip wordbigrams (Guthrie et al., 2006) as classification fea-tures, with k = 1–3.
The 1-skip bigrams yield an accuracy of 79.3%on the TOEFL11 test set, higher than either wordbigrams or Stanford Dependencies. The 2- and 3-skip grams achieve 78.4% and 77.9%. The matrixof Q-coefficients for these features is shown in Fig-ure 4, showing that the 1-skip word bigrams featureis the closest to the dependencies feature with a Q-
8120k sentences averaging 21 tokens each.
coefficient of 0.96. It is also the closest to standardword unigrams and bigrams with Q-coefficients of0.91 and 0.97, respectively.
These results suggest that skip-grams are a veryuseful feature for NLI.9 They could also be usedas a substitute for dependencies in scenarios whererunning a full parser may not be feasible, e.g. real-time data processing. Moreover, with NLI being in-vestigated with other languages (Malmasi and Dras,2014a), this feature can be a good approximationof the dependencies feature for low-resourced lan-guages without an accurate parser. However, re-sults may vary by language and possibly genre (Liu,2008). We also note that the skip-gram feature spacegrows prodigiously as k increases.
Another related issue is whether sub-lexical char-acter n-grams are independent of word features.Previously, Tsur and Rappoport (2007) hypothe-sized that these n-grams are discriminative due towriter choices “strongly influenced by the phonol-ogy of their native language”. Nicolai and Kon-drak (2014) also investigate the source of L1 dif-ferences in the relative frequencies of character bi-grams. They propose an algorithm to identify themost discriminative words and subsequently, the bi-grams corresponding to these words. They foundthat removing a small set of highly discriminativewords greatly degrades the accuracy of a bigram-based classifier. Based on this they conclude that bi-grams capture differences in word usage and lexicaltransfer rather than L1 phonology. Evidence fromour analysis also points to a similar pattern with thepredictions of character bigrams and trigrams beingstrongly correlated with word and lemma unigrams.
Such lexical transfer effects have been previouslynoted by others (Odlin, 1989). The effects are me-diated not only by cognates and word form similar-ities, but also semantics and meanings. We also ex-amine the link between L1 and word usage.
Using the Etymological WordNet10 database (deMelo, 2014), we extracted two lists of English wordswith either Old English (508 words) or Latin origins(1,310 words). These words were used as unigramfeatures to train two classifiers. The F1-scores forclassification on TOEFL11 are shown in Figure 5.The Old English words, with their West Germanicroots, yield the best results for classifying Germandata. Conversely, the Latinate features achieve the
9Hladka et al. (2013) and Henderson et al. (2013) previ-ously used a skip-gram variant that did not include 0 skips asper (Guthrie et al., 2006) and did not improve accuracy.
10http://www1.icsi.berkeley.edu/%7edemelo/etymwn/
52
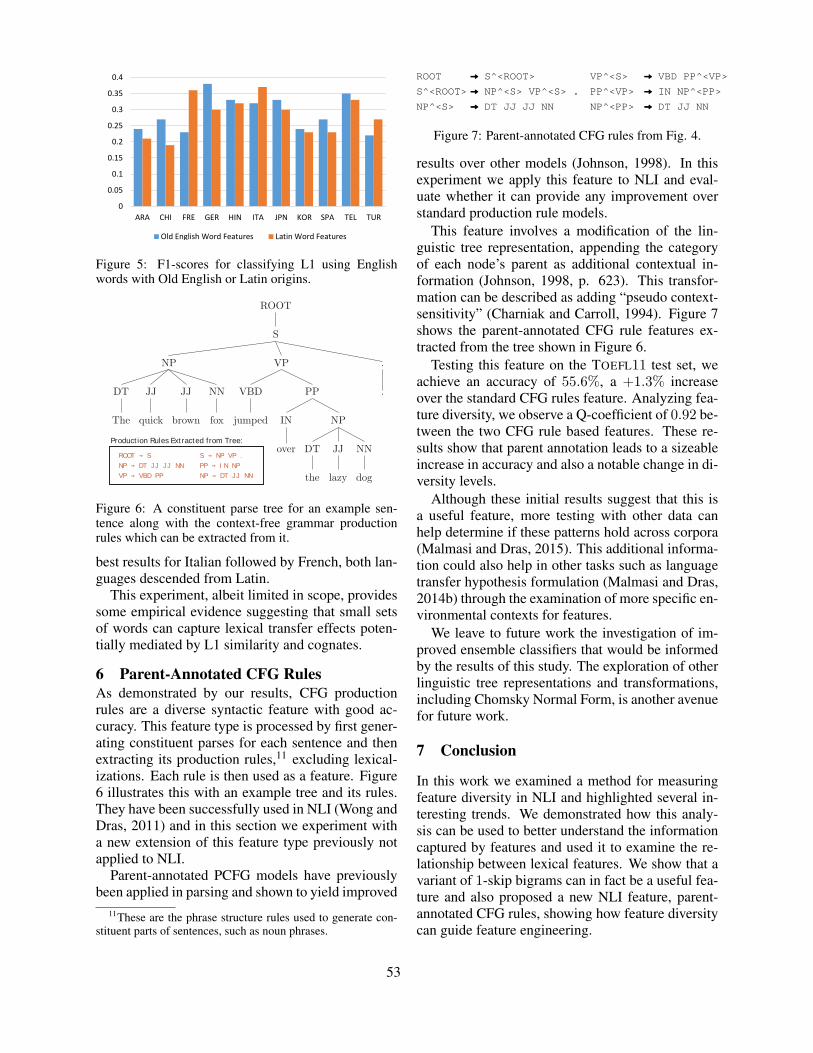
0
0.05
0.1
0.15
0.2
0.25
0.3
0.35
0.4
ARA CHI FRE GER HIN ITA JPN KOR SPA TEL TUR
Old English Word Features Latin Word Features
Figure 5: F1-scores for classifying L1 using Englishwords with Old English or Latin origins.
ROOT
S
.
.
VP
PP
NP
NN
dog
JJ
lazy
DT
the
IN
over
VBD
jumped
NP
NN
fox
JJ
brown
JJ
quick
DT
The
ROOT S S NP VP .
NP DT JJ JJ NN PP IN NP
VP VBD PP NP DT JJ NN
Production Rules Extracted from Tree:
Figure 6: A constituent parse tree for an example sen-tence along with the context-free grammar productionrules which can be extracted from it.
best results for Italian followed by French, both lan-guages descended from Latin.
This experiment, albeit limited in scope, providessome empirical evidence suggesting that small setsof words can capture lexical transfer effects poten-tially mediated by L1 similarity and cognates.
6 Parent-Annotated CFG RulesAs demonstrated by our results, CFG productionrules are a diverse syntactic feature with good ac-curacy. This feature type is processed by first gener-ating constituent parses for each sentence and thenextracting its production rules,11 excluding lexical-izations. Each rule is then used as a feature. Figure6 illustrates this with an example tree and its rules.They have been successfully used in NLI (Wong andDras, 2011) and in this section we experiment witha new extension of this feature type previously notapplied to NLI.
Parent-annotated PCFG models have previouslybeen applied in parsing and shown to yield improved
11These are the phrase structure rules used to generate con-stituent parts of sentences, such as noun phrases.
ROOT → S^<ROOT>
S^<ROOT> → NP^<S> VP^<S> .
NP^<S> → DT JJ JJ NN
VP^<S> → VBD PP^<VP>
PP^<VP> → IN NP^<PP>
NP^<PP> → DT JJ NN
Figure 7: Parent-annotated CFG rules from Fig. 4.
results over other models (Johnson, 1998). In thisexperiment we apply this feature to NLI and eval-uate whether it can provide any improvement overstandard production rule models.
This feature involves a modification of the lin-guistic tree representation, appending the categoryof each node’s parent as additional contextual in-formation (Johnson, 1998, p. 623). This transfor-mation can be described as adding “pseudo context-sensitivity” (Charniak and Carroll, 1994). Figure 7shows the parent-annotated CFG rule features ex-tracted from the tree shown in Figure 6.
Testing this feature on the TOEFL11 test set, weachieve an accuracy of 55.6%, a +1.3% increaseover the standard CFG rules feature. Analyzing fea-ture diversity, we observe a Q-coefficient of 0.92 be-tween the two CFG rule based features. These re-sults show that parent annotation leads to a sizeableincrease in accuracy and also a notable change in di-versity levels.
Although these initial results suggest that this isa useful feature, more testing with other data canhelp determine if these patterns hold across corpora(Malmasi and Dras, 2015). This additional informa-tion could also help in other tasks such as languagetransfer hypothesis formulation (Malmasi and Dras,2014b) through the examination of more specific en-vironmental contexts for features.
We leave to future work the investigation of im-proved ensemble classifiers that would be informedby the results of this study. The exploration of otherlinguistic tree representations and transformations,including Chomsky Normal Form, is another avenuefor future work.
7 Conclusion
In this work we examined a method for measuringfeature diversity in NLI and highlighted several in-teresting trends. We demonstrated how this analy-sis can be used to better understand the informationcaptured by features and used it to examine the re-lationship between lexical features. We show that avariant of 1-skip bigrams can in fact be a useful fea-ture and also proposed a new NLI feature, parent-annotated CFG rules, showing how feature diversitycan guide feature engineering.
53
Acknowledgments
We would like to thank the anonymous reviewersfor their helpful comments. We would also like tothank Keelan Evanini, Yoko Futagi and Jidong Taofor their thoughtful suggestions for improving thiswork.
References
Daniel Blanchard, Joel Tetreault, Derrick Higgins, AoifeCahill, and Martin Chodorow. 2013. TOEFL11: ACorpus of Non-Native English. Technical report, Ed-ucational Testing Service.
Julian Brooke and Graeme Hirst. 2012. Robust, Lexical-ized Native Language Identification. In Proceedingsof COLING 2012, pages 391–408, Mumbai, India, De-cember. The COLING 2012 Organizing Committee.
Serhiy Bykh and Detmar Meurers. 2014. ExploringSyntactic Features for Native Language Identification:A Variationist Perspective on Feature Encoding andEnsemble Optimization. In Proceedings of COLING2014, the 25th International Conference on Compu-tational Linguistics: Technical Papers, pages 1962–1973, Dublin, Ireland, August. Dublin City Universityand Association for Computational Linguistics.
Eugene Charniak and Glenn Carroll. 1994. Context-sensitive statistics for improved grammatical languagemodels. In AAAI, pages 728–733.
Gerard de Melo. 2014. Etymological wordnet: Trac-ing the history of words. In Proceedings of the NinthInternational Conference on Language Resources andEvaluation (LREC-2014). European Language Re-sources Association (ELRA).
David Guthrie, Ben Allison, Wei Liu, Louise Guthrie,and Yorick Wilks. 2006. A Closer Look at Skip-gramModelling. In Proceedings of the Fifth InternationalConference on Language Resources and Evaluation(LREC 2006), pages 1222–1225, Genoa, Italy.
John Henderson, Guido Zarrella, Craig Pfeifer, andJohn D. Burger. 2013. Discriminating Non-NativeEnglish with 350 Words. In Proceedings of the EighthWorkshop on Innovative Use of NLP for Building Edu-cational Applications, pages 101–110, Atlanta, Geor-gia, June. Association for Computational Linguistics.
Barbora Hladka, Martin Holub, and Vincent Kriz. 2013.Feature Engineering in the NLI Shared Task 2013:Charles University Submission Report. In Proceed-ings of the Eighth Workshop on Innovative Use of NLPfor Building Educational Applications, pages 232–241, Atlanta, Georgia, June. Association for Compu-tational Linguistics.
Radu Tudor Ionescu, Marius Popescu, and Aoife Cahill.2014. Can characters reveal your native language?A language-independent approach to native languageidentification. In Proceedings of the 2014 Conferenceon Empirical Methods in Natural Language Process-ing (EMNLP), pages 1363–1373, Doha, Qatar, Octo-ber. Association for Computational Linguistics.
Scott Jarvis, Yves Bestgen, and Steve Pepper. 2013.Maximizing Classification Accuracy in Native Lan-guage Identification. In Proceedings of the EighthWorkshop on Innovative Use of NLP for Building Edu-cational Applications, pages 111–118, Atlanta, Geor-gia, June. Association for Computational Linguistics.
Mark Johnson. 1998. PCFG models of linguis-tic tree representations. Computational Linguistics,24(4):613–632.
Ludmila I Kuncheva, Christopher J Whitaker, Cather-ine A Shipp, and Robert PW Duin. 2003. Limits onthe majority vote accuracy in classifier fusion. PatternAnalysis & Applications, 6(1):22–31.
Louisa Lam. 2000. Classifier combinations: implemen-tations and theoretical issues. In Multiple classifiersystems, pages 77–86. Springer.
Haitao Liu. 2008. Dependency distance as a metric oflanguage comprehension difficulty. Journal of Cogni-tive Science, 9(2):159–191.
Shervin Malmasi and Mark Dras. 2014a. Chinese NativeLanguage Identification. Proceedings of the 14th Con-ference of the European Chapter of the Association forComputational Linguistics.
Shervin Malmasi and Mark Dras. 2014b. LanguageTransfer Hypotheses with Linear SVM Weights. InProceedings of the 2014 Conference on EmpiricalMethods in Natural Language Processing (EMNLP),Doha, Qatar, October. Association for ComputationalLinguistics.
Shervin Malmasi and Mark Dras. 2015. Large-scale Na-tive Language Identification with Cross-Corpus Eval-uation. In Proceedings of NAACL-HLT 2015, Denver,Colorado, June. Association for Computational Lin-guistics.
Shervin Malmasi, Sze-Meng Jojo Wong, and Mark Dras.2013. NLI Shared Task 2013: MQ Submission. InProceedings of the Eighth Workshop on InnovativeUse of NLP for Building Educational Applications,pages 124–133, Atlanta, Georgia, June. Associationfor Computational Linguistics.
Shervin Malmasi, Joel Tetreault, and Mark Dras. 2015.Oracle and Human Baselines for Native LanguageIdentification. In Proceedings of the Tenth Workshopon Innovative Use of NLP for Building EducationalApplications, Denver, Colorado, June. Association forComputational Linguistics.
54
Garrett Nicolai and Grzegorz Kondrak. 2014. Does thephonology of L1 show up in L2 texts? In Proceed-ings of The 52nd Annual Meeting of the Associationfor Computational Linguistics (ACL), pages 854–859.
Terence Odlin. 1989. Language Transfer: Cross-linguistic Influence in Language Learning. CambridgeUniversity Press, Cambridge, UK.
Matthew Richardson, Amit Prakash, and Eric Brill.2006. Beyond PageRank: machine learning for staticranking. In Proceedings of the 15th international con-ference on World Wide Web, pages 707–715. ACM.
Benjamin Swanson and Eugene Charniak. 2012. Na-tive Language Detection with Tree Substitution Gram-mars. In Proceedings of the 50th Annual Meeting ofthe Association for Computational Linguistics (Vol-ume 2: Short Papers), pages 193–197, Jeju Island, Ko-rea, July. Association for Computational Linguistics.
Joel Tetreault, Daniel Blanchard, Aoife Cahill, and Mar-tin Chodorow. 2012. Native Tongues, Lost andFound: Resources and Empirical Evaluations in Na-tive Language Identification. In Proceedings of COL-ING 2012, pages 2585–2602, Mumbai, India, Decem-ber. The COLING 2012 Organizing Committee.
Joel Tetreault, Daniel Blanchard, and Aoife Cahill. 2013.A Report on the First Native Language IdentificationShared Task. In Proceedings of the Eighth Workshopon Innovative Use of NLP for Building EducationalApplications, pages 48–57, Atlanta, Georgia, June.Association for Computational Linguistics.
Oren Tsur and Ari Rappoport. 2007. Using ClassifierFeatures for Studying the Effect of Native Languageon the Choice of Written Second Language Words.In Proceedings of the Workshop on Cognitive Aspectsof Computational Language Acquisition, pages 9–16,Prague, Czech Republic, June. Association for Com-putational Linguistics.
Ben Wellner, James Pustejovsky, Catherine Havasi, AnnaRumshisky, and Roser Sauri. 2009. Classification ofdiscourse coherence relations: An exploratory studyusing multiple knowledge sources. In Proceedings ofthe 7th SIGdial Workshop on Discourse and Dialogue,pages 117–125. Association for Computational Lin-guistics.
Sze-Meng Jojo Wong and Mark Dras. 2011. ExploitingParse Structures for Native Language Identification.In Proceedings of the 2011 Conference on Empiri-cal Methods in Natural Language Processing, pages1600–1610, Edinburgh, Scotland, UK., July. Associa-tion for Computational Linguistics.
Sze-Meng Jojo Wong, Mark Dras, and Mark Johnson.2012. Exploring Adaptor Grammars for Native Lan-guage Identification. In Proc. Conf. Empirical Meth-ods in Natural Language Processing (EMNLP), pages699–709.
George Udny Yule. 1912. On the methods of measur-ing association between two attributes. Journal of theRoyal Statistical Society, pages 579–652.
55
Proceedings of the Tenth Workshop on Innovative Use of NLP for Building Educational Applications, 2015, pages 56–63,Denver, Colorado, June 4, 2015. c©2015 Association for Computational Linguistics
Automated Evaluation of Scientific Writing:AESW Shared Task Proposal
Vidas DaudaraviciusVTeX
Mokslininku st. 2aVilnius, Lithuania
Abstract
The goal of the Automated Evaluation of Sci-entific Writing (AESW) Shared Task is to an-alyze the linguistic characteristics of scientificwriting to promote the development of auto-mated writing evaluation tools that can assistauthors in writing scientific papers. The pro-posed task is to predict whether a given sen-tence requires editing to ensure its “fit” withthe scientific writing genre. We describe theproposed task, training, development, and testdata sets, and evaluation metrics.
Quality means doing it right when no one is looking.– Henry Ford
1 Introduction
De facto, English is the main language for writ-ing and publishing scientific papers. In reality, themother-tongue of many scientists is not English.Writing a scientific paper is likely to require moreeffort for researchers who are nonnative Englishspeakers compared to native speakers. The lackof authoring support tools available to nonnativespeakers for writing scientific papers in English isa formidable barrier nonnative English-speaking au-thors who are trying to publish, and this is becomingvisible in academic community. Many papers, af-ter acceptance to journals, require improvement inoverall writing quality which may be addressed bypublishers. However, this is not the case with mostconference proceedings.
The vast number of scientific papers being au-thored by nonnative English speakers creates a largedemand for effective computer-based writing tools
to help writers compose scientific articles. Severalshared tasks have been organized (Dale and Kil-garriff, 2011; Dale et al., 2012; Ng et al., 2013;Ng et al., 2014) which constituted a major steptoward evaluating the feasibility of building novelgrammar error correction technologies. English lan-guage learner (ELL) corpora were made availablefor research purposes (Dahlmeier et al., 2013; Yan-nakoudakis et al., 2011). An extensive overview ofthe feasibility of automated grammatical error de-tection for language learners was conducted by Lea-cock et al. (2010). While these achievements arecritical for language learners, we also need to de-velop tools that support genre-specific writing fea-tures. The shared task proposed here focuses on thegenre of scientific writing.
Above and beyond correct use of English conven-tions, the genre of scientific writing is characterizedby features, including, but not limited to declara-tive voice, and appropriate academic and discipline-specific terminology. There are many issues forwriters that are not necessarily related to grammarissues such as, vocabulary usage, and correct wordand phrase order among other issues. In addition,many ELL writers have a different way of thinkingand reasoning in their native language which may bereflected in their writing. For instance, it is likelythat ELLs and native English (EN) writers wouldwrite the same text in different ways:
1. ELL ”Completely different role of elastic inter-action occurs due to local variations in thestrain field...”
EN ”Elastic interaction takes on a completely
56
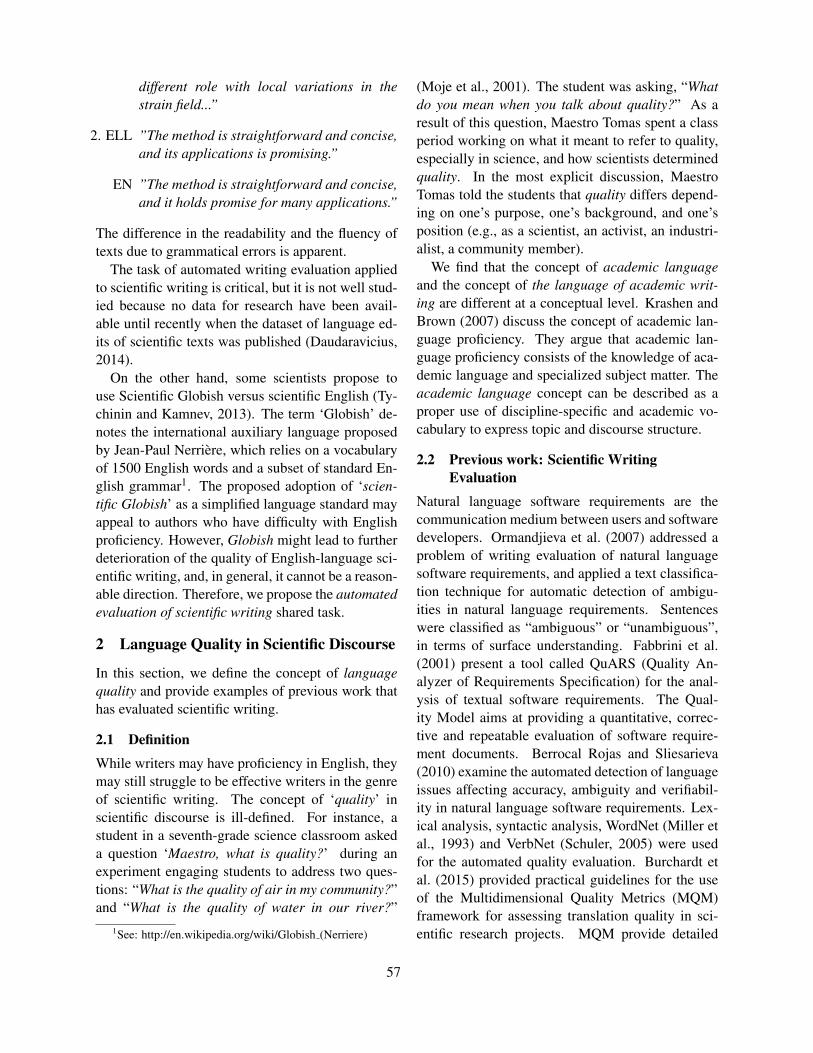
different role with local variations in thestrain field...”
2. ELL ”The method is straightforward and concise,and its applications is promising.”
EN ”The method is straightforward and concise,and it holds promise for many applications.”
The difference in the readability and the fluency oftexts due to grammatical errors is apparent.
The task of automated writing evaluation appliedto scientific writing is critical, but it is not well stud-ied because no data for research have been avail-able until recently when the dataset of language ed-its of scientific texts was published (Daudaravicius,2014).
On the other hand, some scientists propose touse Scientific Globish versus scientific English (Ty-chinin and Kamnev, 2013). The term ‘Globish’ de-notes the international auxiliary language proposedby Jean-Paul Nerriere, which relies on a vocabularyof 1500 English words and a subset of standard En-glish grammar1. The proposed adoption of ‘scien-tific Globish’ as a simplified language standard mayappeal to authors who have difficulty with Englishproficiency. However, Globish might lead to furtherdeterioration of the quality of English-language sci-entific writing, and, in general, it cannot be a reason-able direction. Therefore, we propose the automatedevaluation of scientific writing shared task.
2 Language Quality in Scientific Discourse
In this section, we define the concept of languagequality and provide examples of previous work thathas evaluated scientific writing.
2.1 Definition
While writers may have proficiency in English, theymay still struggle to be effective writers in the genreof scientific writing. The concept of ‘quality’ inscientific discourse is ill-defined. For instance, astudent in a seventh-grade science classroom askeda question ‘Maestro, what is quality?’ during anexperiment engaging students to address two ques-tions: “What is the quality of air in my community?”and “What is the quality of water in our river?”
1See: http://en.wikipedia.org/wiki/Globish (Nerriere)
(Moje et al., 2001). The student was asking, “Whatdo you mean when you talk about quality?” As aresult of this question, Maestro Tomas spent a classperiod working on what it meant to refer to quality,especially in science, and how scientists determinedquality. In the most explicit discussion, MaestroTomas told the students that quality differs depend-ing on one’s purpose, one’s background, and one’sposition (e.g., as a scientist, an activist, an industri-alist, a community member).
We find that the concept of academic languageand the concept of the language of academic writ-ing are different at a conceptual level. Krashen andBrown (2007) discuss the concept of academic lan-guage proficiency. They argue that academic lan-guage proficiency consists of the knowledge of aca-demic language and specialized subject matter. Theacademic language concept can be described as aproper use of discipline-specific and academic vo-cabulary to express topic and discourse structure.
2.2 Previous work: Scientific WritingEvaluation
Natural language software requirements are thecommunication medium between users and softwaredevelopers. Ormandjieva et al. (2007) addressed aproblem of writing evaluation of natural languagesoftware requirements, and applied a text classifica-tion technique for automatic detection of ambigu-ities in natural language requirements. Sentenceswere classified as “ambiguous” or “unambiguous”,in terms of surface understanding. Fabbrini et al.(2001) present a tool called QuARS (Quality An-alyzer of Requirements Specification) for the anal-ysis of textual software requirements. The Qual-ity Model aims at providing a quantitative, correc-tive and repeatable evaluation of software require-ment documents. Berrocal Rojas and Sliesarieva(2010) examine the automated detection of languageissues affecting accuracy, ambiguity and verifiabil-ity in natural language software requirements. Lex-ical analysis, syntactic analysis, WordNet (Miller etal., 1993) and VerbNet (Schuler, 2005) were usedfor the automated quality evaluation. Burchardt etal. (2015) provided practical guidelines for the useof the Multidimensional Quality Metrics (MQM)framework for assessing translation quality in sci-entific research projects. MQM provide detailed
57
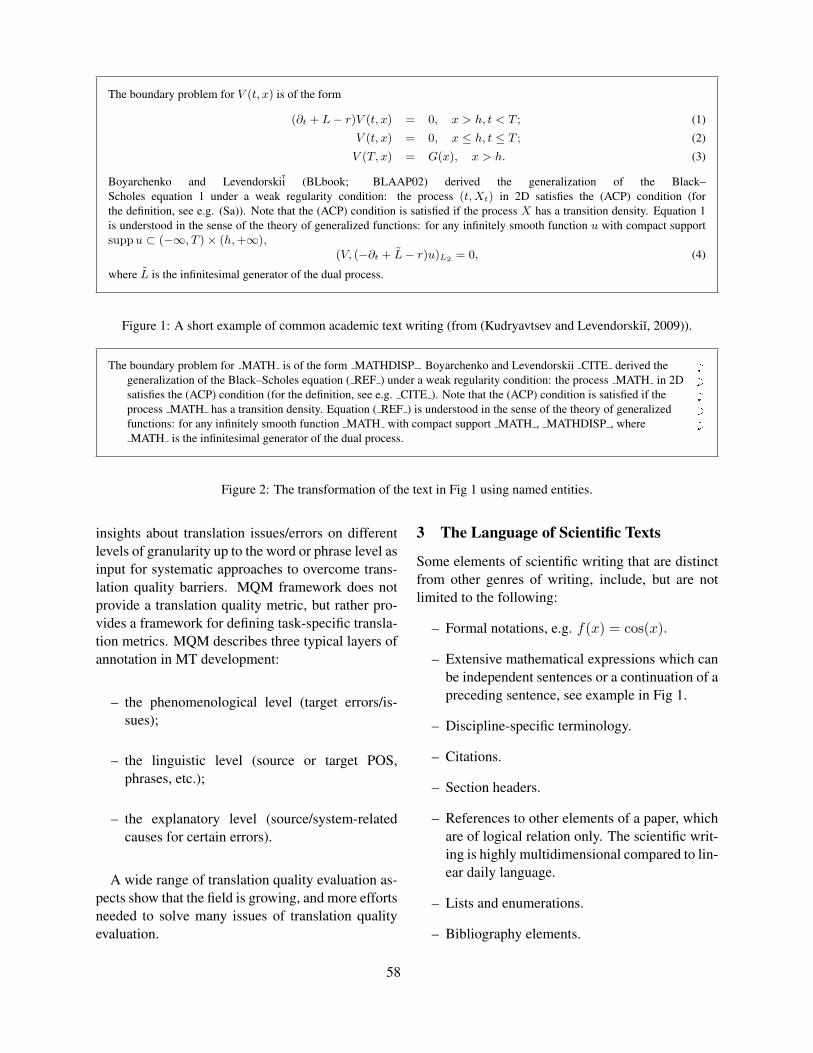
The boundary problem for V (t, x) is of the form
(∂t + L− r)V (t, x) = 0, x > h, t < T ; (1)
V (t, x) = 0, x ≤ h, t ≤ T ; (2)
V (T, x) = G(x), x > h. (3)
Boyarchenko and Levendorskii (BLbook; BLAAP02) derived the generalization of the Black–Scholes equation 1 under a weak regularity condition: the process (t, Xt) in 2D satisfies the (ACP) condition (forthe definition, see e.g. (Sa)). Note that the (ACP) condition is satisfied if the process X has a transition density. Equation 1is understood in the sense of the theory of generalized functions: for any infinitely smooth function u with compact supportsupp u ⊂ (−∞, T )× (h, +∞),
(V, (−∂t + L− r)u)L2 = 0, (4)
where L is the infinitesimal generator of the dual process.
Figure 1: A short example of common academic text writing (from (Kudryavtsev and Levendorskiı, 2009)).
The boundary problem for MATH is of the form MATHDISP . Boyarchenko and Levendorskii CITE derived the C
generalization of the Black–Scholes equation ( REF ) under a weak regularity condition: the process MATH in 2D C
satisfies the (ACP) condition (for the definition, see e.g. CITE ). Note that the (ACP) condition is satisfied if the C
process MATH has a transition density. Equation ( REF ) is understood in the sense of the theory of generalized C
functions: for any infinitely smooth function MATH with compact support MATH , MATHDISP , where C
MATH is the infinitesimal generator of the dual process.
Figure 2: The transformation of the text in Fig 1 using named entities.
insights about translation issues/errors on differentlevels of granularity up to the word or phrase level asinput for systematic approaches to overcome trans-lation quality barriers. MQM framework does notprovide a translation quality metric, but rather pro-vides a framework for defining task-specific transla-tion metrics. MQM describes three typical layers ofannotation in MT development:
– the phenomenological level (target errors/is-sues);
– the linguistic level (source or target POS,phrases, etc.);
– the explanatory level (source/system-relatedcauses for certain errors).
A wide range of translation quality evaluation as-pects show that the field is growing, and more effortsneeded to solve many issues of translation qualityevaluation.
3 The Language of Scientific Texts
Some elements of scientific writing that are distinctfrom other genres of writing, include, but are notlimited to the following:
– Formal notations, e.g. f(x) = cos(x).
– Extensive mathematical expressions which canbe independent sentences or a continuation of apreceding sentence, see example in Fig 1.
– Discipline-specific terminology.
– Citations.
– Section headers.
– References to other elements of a paper, whichare of logical relation only. The scientific writ-ing is highly multidimensional compared to lin-ear daily language.
– Lists and enumerations.
– Bibliography elements.
58
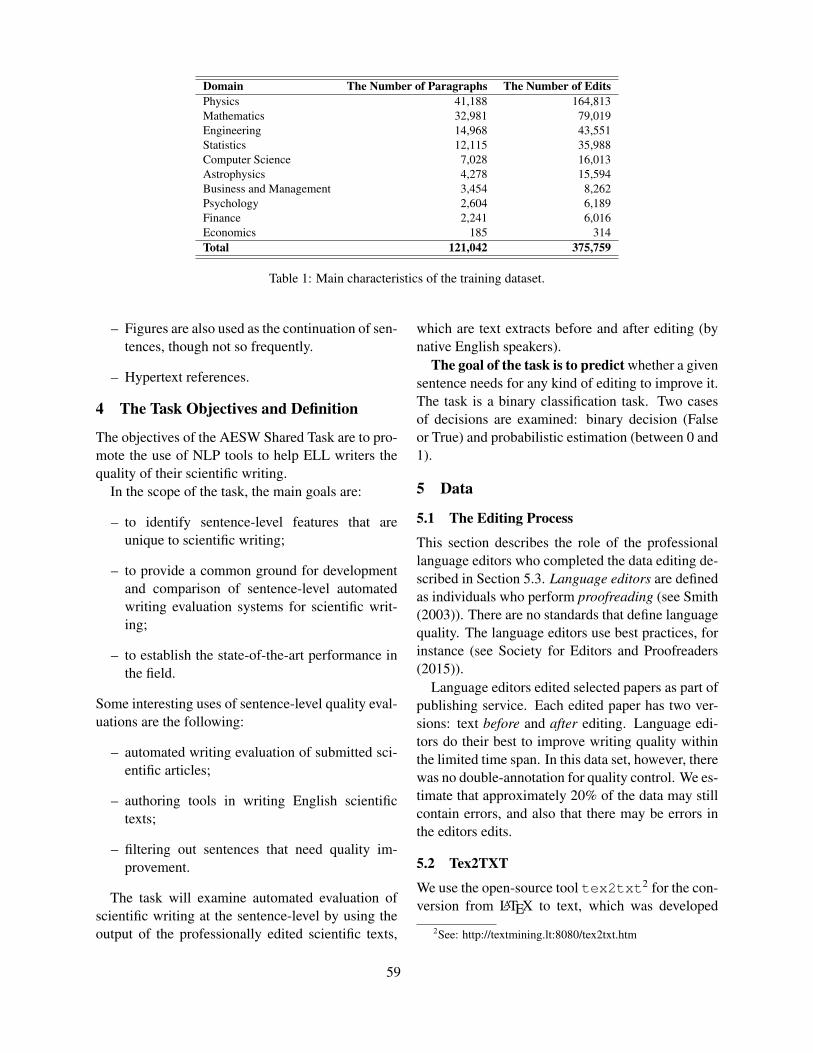
Domain The Number of Paragraphs The Number of EditsPhysics 41,188 164,813Mathematics 32,981 79,019Engineering 14,968 43,551Statistics 12,115 35,988Computer Science 7,028 16,013Astrophysics 4,278 15,594Business and Management 3,454 8,262Psychology 2,604 6,189Finance 2,241 6,016Economics 185 314Total 121,042 375,759
Table 1: Main characteristics of the training dataset.
– Figures are also used as the continuation of sen-tences, though not so frequently.
– Hypertext references.
4 The Task Objectives and Definition
The objectives of the AESW Shared Task are to pro-mote the use of NLP tools to help ELL writers thequality of their scientific writing.
In the scope of the task, the main goals are:
– to identify sentence-level features that areunique to scientific writing;
– to provide a common ground for developmentand comparison of sentence-level automatedwriting evaluation systems for scientific writ-ing;
– to establish the state-of-the-art performance inthe field.
Some interesting uses of sentence-level quality eval-uations are the following:
– automated writing evaluation of submitted sci-entific articles;
– authoring tools in writing English scientifictexts;
– filtering out sentences that need quality im-provement.
The task will examine automated evaluation ofscientific writing at the sentence-level by using theoutput of the professionally edited scientific texts,
which are text extracts before and after editing (bynative English speakers).
The goal of the task is to predict whether a givensentence needs for any kind of editing to improve it.The task is a binary classification task. Two casesof decisions are examined: binary decision (Falseor True) and probabilistic estimation (between 0 and1).
5 Data
5.1 The Editing Process
This section describes the role of the professionallanguage editors who completed the data editing de-scribed in Section 5.3. Language editors are definedas individuals who perform proofreading (see Smith(2003)). There are no standards that define languagequality. The language editors use best practices, forinstance (see Society for Editors and Proofreaders(2015)).
Language editors edited selected papers as part ofpublishing service. Each edited paper has two ver-sions: text before and after editing. Language edi-tors do their best to improve writing quality withinthe limited time span. In this data set, however, therewas no double-annotation for quality control. We es-timate that approximately 20% of the data may stillcontain errors, and also that there may be errors inthe editors edits.
5.2 Tex2TXT
We use the open-source tool tex2txt2 for the con-version from LATEX to text, which was developed
2See: http://textmining.lt:8080/tex2txt.htm
59
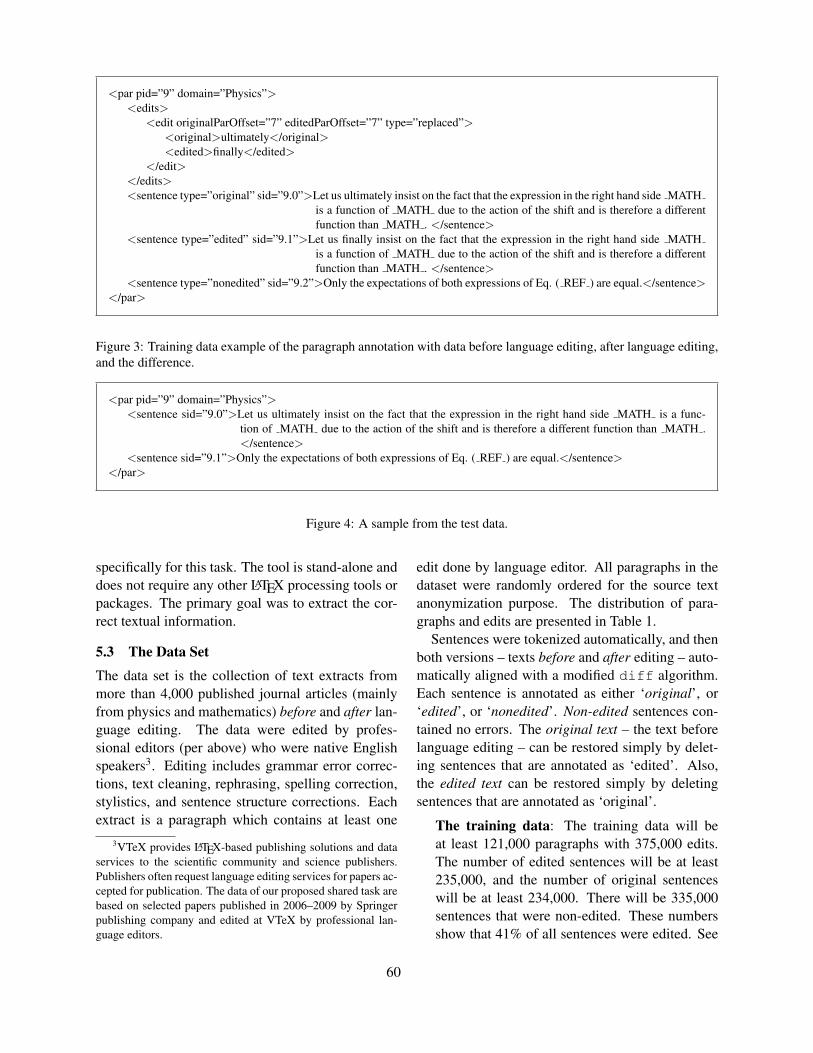
<par pid=”9” domain=”Physics”><edits>
<edit originalParOffset=”7” editedParOffset=”7” type=”replaced”><original>ultimately</original><edited>finally</edited>
</edit></edits><sentence type=”original” sid=”9.0”>Let us ultimately insist on the fact that the expression in the right hand side MATH
is a function of MATH due to the action of the shift and is therefore a differentfunction than MATH . </sentence>
<sentence type=”edited” sid=”9.1”>Let us finally insist on the fact that the expression in the right hand side MATHis a function of MATH due to the action of the shift and is therefore a differentfunction than MATH . </sentence>
<sentence type=”nonedited” sid=”9.2”>Only the expectations of both expressions of Eq. ( REF ) are equal.</sentence></par>
Figure 3: Training data example of the paragraph annotation with data before language editing, after language editing,and the difference.
<par pid=”9” domain=”Physics”><sentence sid=”9.0”>Let us ultimately insist on the fact that the expression in the right hand side MATH is a func-
tion of MATH due to the action of the shift and is therefore a different function than MATH .</sentence>
<sentence sid=”9.1”>Only the expectations of both expressions of Eq. ( REF ) are equal.</sentence></par>
Figure 4: A sample from the test data.
specifically for this task. The tool is stand-alone anddoes not require any other LATEX processing tools orpackages. The primary goal was to extract the cor-rect textual information.
5.3 The Data Set
The data set is the collection of text extracts frommore than 4,000 published journal articles (mainlyfrom physics and mathematics) before and after lan-guage editing. The data were edited by profes-sional editors (per above) who were native Englishspeakers3. Editing includes grammar error correc-tions, text cleaning, rephrasing, spelling correction,stylistics, and sentence structure corrections. Eachextract is a paragraph which contains at least one
3VTeX provides LATEX-based publishing solutions and dataservices to the scientific community and science publishers.Publishers often request language editing services for papers ac-cepted for publication. The data of our proposed shared task arebased on selected papers published in 2006–2009 by Springerpublishing company and edited at VTeX by professional lan-guage editors.
edit done by language editor. All paragraphs in thedataset were randomly ordered for the source textanonymization purpose. The distribution of para-graphs and edits are presented in Table 1.
Sentences were tokenized automatically, and thenboth versions – texts before and after editing – auto-matically aligned with a modified diff algorithm.Each sentence is annotated as either ‘original’, or‘edited’, or ‘nonedited’. Non-edited sentences con-tained no errors. The original text – the text beforelanguage editing – can be restored simply by delet-ing sentences that are annotated as ‘edited’. Also,the edited text can be restored simply by deletingsentences that are annotated as ‘original’.
The training data: The training data will beat least 121,000 paragraphs with 375,000 edits.The number of edited sentences will be at least235,000, and the number of original sentenceswill be at least 234,000. There will be 335,000sentences that were non-edited. These numbersshow that 41% of all sentences were edited. See
60
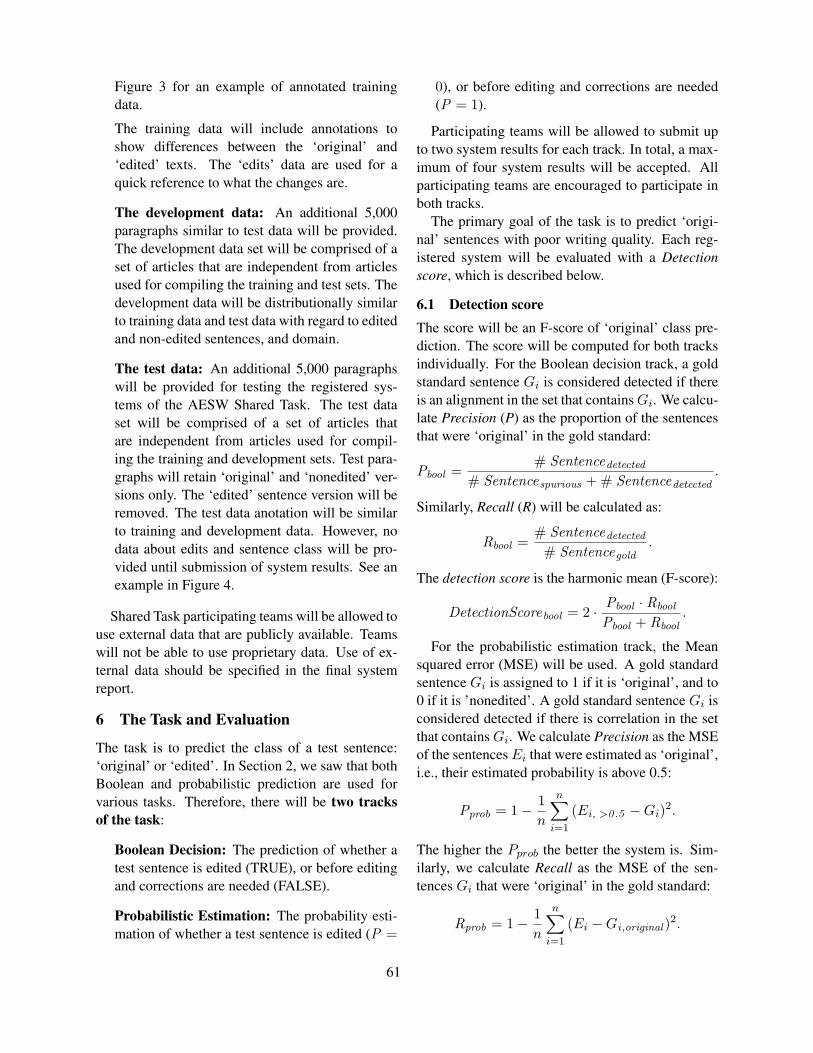
Figure 3 for an example of annotated trainingdata.
The training data will include annotations toshow differences between the ‘original’ and‘edited’ texts. The ‘edits’ data are used for aquick reference to what the changes are.
The development data: An additional 5,000paragraphs similar to test data will be provided.The development data set will be comprised of aset of articles that are independent from articlesused for compiling the training and test sets. Thedevelopment data will be distributionally similarto training data and test data with regard to editedand non-edited sentences, and domain.
The test data: An additional 5,000 paragraphswill be provided for testing the registered sys-tems of the AESW Shared Task. The test dataset will be comprised of a set of articles thatare independent from articles used for compil-ing the training and development sets. Test para-graphs will retain ‘original’ and ‘nonedited’ ver-sions only. The ‘edited’ sentence version will beremoved. The test data anotation will be similarto training and development data. However, nodata about edits and sentence class will be pro-vided until submission of system results. See anexample in Figure 4.
Shared Task participating teams will be allowed touse external data that are publicly available. Teamswill not be able to use proprietary data. Use of ex-ternal data should be specified in the final systemreport.
6 The Task and Evaluation
The task is to predict the class of a test sentence:‘original’ or ‘edited’. In Section 2, we saw that bothBoolean and probabilistic prediction are used forvarious tasks. Therefore, there will be two tracksof the task:
Boolean Decision: The prediction of whether atest sentence is edited (TRUE), or before editingand corrections are needed (FALSE).
Probabilistic Estimation: The probability esti-mation of whether a test sentence is edited (P =
0), or before editing and corrections are needed(P = 1).
Participating teams will be allowed to submit upto two system results for each track. In total, a max-imum of four system results will be accepted. Allparticipating teams are encouraged to participate inboth tracks.
The primary goal of the task is to predict ‘origi-nal’ sentences with poor writing quality. Each reg-istered system will be evaluated with a Detectionscore, which is described below.
6.1 Detection scoreThe score will be an F-score of ‘original’ class pre-diction. The score will be computed for both tracksindividually. For the Boolean decision track, a goldstandard sentence Gi is considered detected if thereis an alignment in the set that contains Gi. We calcu-late Precision (P) as the proportion of the sentencesthat were ‘original’ in the gold standard:
Pbool =# Sentencedetected
# Sentencespurious + # Sentencedetected.
Similarly, Recall (R) will be calculated as:
Rbool =# Sentencedetected
# Sentencegold.
The detection score is the harmonic mean (F-score):
DetectionScorebool = 2 · Pbool · Rbool
Pbool + Rbool.
For the probabilistic estimation track, the Meansquared error (MSE) will be used. A gold standardsentence Gi is assigned to 1 if it is ‘original’, and to0 if it is ’nonedited’. A gold standard sentence Gi isconsidered detected if there is correlation in the setthat contains Gi. We calculate Precision as the MSEof the sentences Ei that were estimated as ‘original’,i.e., their estimated probability is above 0.5:
Pprob = 1 − 1n
n∑i=1
(Ei , >0 .5 − Gi)2.
The higher the Pprob the better the system is. Sim-ilarly, we calculate Recall as the MSE of the sen-tences Gi that were ‘original’ in the gold standard:
Rprob = 1 − 1n
n∑i=1
(Ei − Gi ,original )2.
61
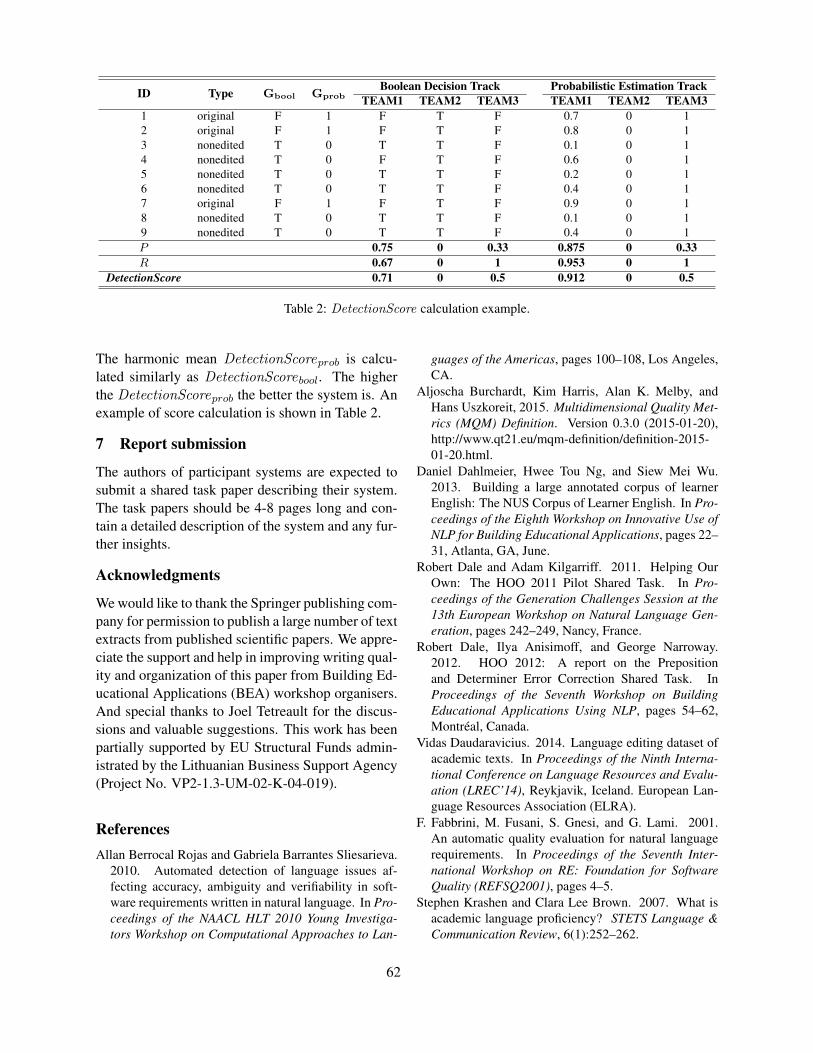
ID Type Gbool GprobBoolean Decision Track Probabilistic Estimation Track
TEAM1 TEAM2 TEAM3 TEAM1 TEAM2 TEAM31 original F 1 F T F 0.7 0 12 original F 1 F T F 0.8 0 13 nonedited T 0 T T F 0.1 0 14 nonedited T 0 F T F 0.6 0 15 nonedited T 0 T T F 0.2 0 16 nonedited T 0 T T F 0.4 0 17 original F 1 F T F 0.9 0 18 nonedited T 0 T T F 0.1 0 19 nonedited T 0 T T F 0.4 0 1P 0.75 0 0.33 0.875 0 0.33R 0.67 0 1 0.953 0 1
DetectionScore 0.71 0 0.5 0.912 0 0.5
Table 2: DetectionScore calculation example.
The harmonic mean DetectionScoreprob is calcu-lated similarly as DetectionScorebool. The higherthe DetectionScoreprob the better the system is. Anexample of score calculation is shown in Table 2.
7 Report submission
The authors of participant systems are expected tosubmit a shared task paper describing their system.The task papers should be 4-8 pages long and con-tain a detailed description of the system and any fur-ther insights.
Acknowledgments
We would like to thank the Springer publishing com-pany for permission to publish a large number of textextracts from published scientific papers. We appre-ciate the support and help in improving writing qual-ity and organization of this paper from Building Ed-ucational Applications (BEA) workshop organisers.And special thanks to Joel Tetreault for the discus-sions and valuable suggestions. This work has beenpartially supported by EU Structural Funds admin-istrated by the Lithuanian Business Support Agency(Project No. VP2-1.3-UM-02-K-04-019).
ReferencesAllan Berrocal Rojas and Gabriela Barrantes Sliesarieva.
2010. Automated detection of language issues af-fecting accuracy, ambiguity and verifiability in soft-ware requirements written in natural language. In Pro-ceedings of the NAACL HLT 2010 Young Investiga-tors Workshop on Computational Approaches to Lan-
guages of the Americas, pages 100–108, Los Angeles,CA.
Aljoscha Burchardt, Kim Harris, Alan K. Melby, andHans Uszkoreit, 2015. Multidimensional Quality Met-rics (MQM) Definition. Version 0.3.0 (2015-01-20),http://www.qt21.eu/mqm-definition/definition-2015-01-20.html.
Daniel Dahlmeier, Hwee Tou Ng, and Siew Mei Wu.2013. Building a large annotated corpus of learnerEnglish: The NUS Corpus of Learner English. In Pro-ceedings of the Eighth Workshop on Innovative Use ofNLP for Building Educational Applications, pages 22–31, Atlanta, GA, June.
Robert Dale and Adam Kilgarriff. 2011. Helping OurOwn: The HOO 2011 Pilot Shared Task. In Pro-ceedings of the Generation Challenges Session at the13th European Workshop on Natural Language Gen-eration, pages 242–249, Nancy, France.
Robert Dale, Ilya Anisimoff, and George Narroway.2012. HOO 2012: A report on the Prepositionand Determiner Error Correction Shared Task. InProceedings of the Seventh Workshop on BuildingEducational Applications Using NLP, pages 54–62,Montreal, Canada.
Vidas Daudaravicius. 2014. Language editing dataset ofacademic texts. In Proceedings of the Ninth Interna-tional Conference on Language Resources and Evalu-ation (LREC’14), Reykjavik, Iceland. European Lan-guage Resources Association (ELRA).
F. Fabbrini, M. Fusani, S. Gnesi, and G. Lami. 2001.An automatic quality evaluation for natural languagerequirements. In Proceedings of the Seventh Inter-national Workshop on RE: Foundation for SoftwareQuality (REFSQ2001), pages 4–5.
Stephen Krashen and Clara Lee Brown. 2007. What isacademic language proficiency? STETS Language &Communication Review, 6(1):252–262.
62
Oleg Kudryavtsev and Sergei Levendorskiı. 2009. Fastand accurate pricing of barrier options under Levy pro-cesses. Finance and Stochastics, 13(4):531–562.
Claudia Leacock, Martin Chodorow, Michael Gamon,and Joel Tetreault. 2010. Automated GrammaticalError Detection for Language Learners. Morgan andClaypool.
G. Miller, R. Beckwith, C. Fellbaum, D. Gross, andK. Miller. 1993. Introduction to WordNet: An onlinelexical database. Technical report.
Elizabeth B. Moje, Tehani Collazo, Rosario Carrillo, andRonald W. Marx. 2001. “Maestro, what is ‘qual-ity’?”: Language, literacy, and discourse in project-based science. Journal of Research in Science Teach-ing, 38(4):469–498.
Hwee Tou Ng, Siew Mei Wu, Yuanbin Wu, Chris-tian Hadiwinoto, and Joel Tetreault. 2013. TheCoNLL-2013 Shared Task on Grammatical Error Cor-rection. In Proceedings of the Seventeenth Confer-ence on Computational Natural Language Learning:Shared Task, pages 1–12, Sofia, Bulgaria.
Hwee Tou Ng, Siew Mei Wu, Ted Briscoe, ChristianHadiwinoto, Raymond Hendy Susanto, and Christo-pher Bryant. 2014. The CoNLL-2014 Shared Taskon Grammatical Error Correction. In Proceedings ofthe Eighteenth Conference on Computational NaturalLanguage Learning: Shared Task, pages 1–14, Balti-more, MD, USA.
Olga Ormandjieva, Ishrar Hussain, and Leila Kosseim.2007. Toward a text classification system for the qual-ity assessment of software requirements written in nat-ural language. In Fourth International Workshop onSoftware Quality Assurance: In Conjunction with the6th ESEC/FSE Joint Meeting, SOQUA ’07, pages 39–45, New York, NY, USA. ACM.
Karin Kipper Schuler. 2005. Verbnet: A Broad-coverage, Comprehensive Verb Lexicon. Ph.D. thesis,Philadelphia, PA, USA.
B. Smith. 2003. Proofreading, Revising & Editing SkillsSuccess in 20 Minutes a Day. Learning Express Li-brary. Learning Express.
Society for Editors and Proofreaders, 2015. Ensur-ing editorial excellence: The SfEP code of practice.http://www.sfep.org.uk/pub/bestprac/cop5.asp.
Dmitry N. Tychinin and Alexander A. Kamnev. 2013.Scientific Globish versus scientific English. Trends inMicrobiology, 21(10):504–505.
Helen Yannakoudakis, Ted Briscoe, and Ben Medlock.2011. A new dataset and method for automaticallygrading ESOL texts. In Proceedings of the 49th An-nual Meeting of the Association for ComputationalLinguistics: Human Language Technologies, pages180–189, Portland, OR, USA.
63
Proceedings of the Tenth Workshop on Innovative Use of NLP for Building Educational Applications, 2015, pages 64–74,Denver, Colorado, June 4, 2015. c©2015 Association for Computational Linguistics
Scoring Persuasive Essays Using Opinions and their Targets
Noura FarraColumbia UniversityNew York, NY 10027
Swapna SomasundaranEducational Testing Service
660 Rosedale RoadPrinceton, NJ 08540
Jill BursteinEducational Testing Service
660 Rosedale RoadPrinceton, NJ [email protected]
Abstract
In this work, we investigate whether the analy-sis of opinion expressions can help in scoringpersuasive essays. For this, we develop sys-tems that predict holistic essay scores based onfeatures extracted from opinion expressions,topical elements, and their combinations. Ex-periments on test taker essays show that essayscores produced using opinion features are in-deed correlated with human scores. Moreover,we find that combining opinions with their tar-gets (what the opinions are about) producesthe best result when compared to using onlyopinions or only topics.
1 Introduction
In a persuasive essay, test takers are asked to takea stance on a given topic and to write an essaysupporting their stance. Consider for example thefollowing essay question, also known as the prompt:
“A teacher’s ability to relate well with studentsis more important than excellent knowledge of thesubject being taught.”
Test takers have to write an essay describingwhether they agree or disagree with the givenprompt, using language expressing clear opinions.The scores for these essays are typically influencedby many factors, such as grammar, spelling errors,style and word usage, as well as the persuasivenesscomponent: how well does the writer argue in fa-vor of that writer’s position on the subject? In thiswork, we try to tackle this last aspect, by studying
how the expression of opinions influences the scoresof expert human graders.
A number of essay scoring systems which relyon Natural Language Processing methods have beendeveloped for automatically scoring persuasive es-says, most notably (Page, 1966; Foltz et al., 1999;Burstein, 2003; Rudner and Liang, 2002; Attali andBurstein, 2006). The principal features for auto-matic essay-scoring have traditionally been basedon grammar, usage, mechanics, and style, and haveadditionally included content-based features such asdiscourse and topic, as in Attali and Burstein (2006).These kind of features have been shown to have verystrong performance in scoring holistic essay scores,and are very highly correlated with expert humanscores (Bridgeman et al., 2012). However, in spite oftheir powerful predictive capability, these automatedscoring systems have been criticized for limited cov-erage of the construct (Deane, 2013; Ben-Simon andBennett, 2007; Williamson et al., 2012).
Our work addresses this concern by developingfeatures specific to the persuasive construct. In-corporating knowledge of the persuasiveness factorinto essay-scoring models can allow us to add fea-tures directly related to the scoring construct and tothe writing task, which typically asks test takers tostate and defend their opinion. Additionally, ourlinguistically motivated features encode intuitionswhich could allow for interpretable, useful and ex-plicit feedback to students, test takers and educatorsregarding the persuasive aspect of the essays.
We build simple essay scoring systems whichincorporate persuasiveness by engineering featuresbased on the analysis of opinions expressed in the
64

essay and whether these opinions are being ex-pressed about relevant topics. Specifically, the de-veloped systems are based on simple features cap-turing (1) Opinion expressions, (2) Topics, and (3)Opinion-Target pairs which combine opinions withwhat they are about. We consider different methodsfor finding opinion-target pairs, and extract featureswhich assess if the opinions in the essay are indeedrelevant to the persuasion, and if the stance taken inthe essay is consistently maintained. We find thatour system predictions are indeed correlated withhuman scores, and the system using opinion-targetinformation is the best.
The rest of the paper is organized as follows. Sec-tion 2 describes related work. In Section 3 we de-scribe how we find opinions, topics and opinion-targets in essays, and Section 4 describes the fea-tures used accordingly to build the persuasive es-say scoring systems. Section 5 describes our experi-ments, Section 6 presents analysis, and we concludein Section 7.
2 Related Work
Automated essay scorers rely on a number of fea-tures based on grammar, usage, and content. No-table systems are Project Essay Grader (Page, 1966)which grades essays based on fluency and gram-mar; IEA (Foltz et al., 1999) which uses both con-tent and mechanics-based features and relies on LSAword vector representations; e-rater (Burstein, 2003;Attali and Burstein, 2006) which combines syn-tactic, discourse, and topical components; and theBayesian Essay Test Scoring System (Rudner andLiang, 2002). For a comprehensive description ofthese automatic essay scoring systems, the readeris referred to Dikli’s survey (Dikli, 2006). Re-cently, there have been attempts to incorporate morenon-traditional features for essay scoring; such asBeigman Klebanov and Flor (2013) who examinedthe relationship between the quality of essay writingand the use of word associations, and accordinglybuilt a system to improve the prediction of holisticessay scores; and Somasundaran et al. (2014) whopredicted discourse coherence quality of persuasiveessays using lexical chaining techniques.
There has also been work on the study of argu-mentation in essays. Stab and Gurevych (2014a)
propose an annotation scheme and a corpus for an-notating different components of arguments and ar-gumentative relations in persuasive essays. In ad-dition, Stab and Gurevych (2014b) propose modelsfor automatically recognizing arguing componentsin persuasive essays, and identifying whether thearguing components reflect support or non-support.Madnani et al. (2012) proposed a system for distin-guishing the “shell” organizational elements of argu-ing expressions from actual argumentative content.Beigman Klebanov et al. (2013a) identify sentence-level sentiment in persuasive essays by consideringthe sentiment of multi-word expressions. In ourwork, we have used lexicons for identifying opin-ion expressions; however, our methods can be aug-mented by using such systems.
Opinion analysis has been applied to a number ofnatural language processing tasks and domains, suchas sentiment in movie reviews (Turney, 2002; Pangand Lee, 2004), product reviews (Hu and Liu, 2004;Liu et al., 2005), social media (Go et al., 2009; Agar-wal et al., 2011; Bollen et al., 2011), news, blogs,and political and online debates (Mullen and Mal-ouf, 2006; Godbole et al., 2007; Somasundaran andWiebe, 2009). The use of opinion and sentiment in-formation to predict holistic essay scores, however,has remained unstudied.
Targets of sentiment have been studied in the formof finding features in product reviews (Qiu et al.,2011; Liu et al., 2014) and for classifying onlinedebates (Somasundaran and Wiebe, 2010). The re-cent 2014 SemEval Task on aspect-based sentimentanalysis (Pontiki et al., 2014) was concerned withidentifying targets of sentiment in reviews of restau-rants and laptops. Jiang et al. (2011) and (Dong etal., 2014) have explored target-dependent classifica-tion of sentiment in Twitter. In our work, we takea simple approach to finding targets of opinion ex-pressions, since our focus is on determining whetheropinion analysis is useful for persuasive essay scor-ing, even when using approximate opinion-targets.
3 Opinions and Topics in PersuasiveEssays
Intuitively, well-written persuasive essays willclearly state the opinion of the writer and build sup-port for their stance by evoking ideas and concepts
65
that are relevant for the argument. Thus, we inves-tigate the role of opinions, topics, and their interac-tions in determining overall persuasive essay scores.
3.1 Opinion ExpressionsWe consider two distinct types of opinions importantfor persuasion: Sentiment and Arguing. Much workhas been done on defining these two types of opin-ions (Wilson, 2008; Ruppenhofer et al., 2008). Wefocus on sentiment and arguing because we expectthese types of expressions to be common in essayswhich require persuasion.
Sentiment Expressions Sentiment expressionsreveal a writer’s judgments, evaluations and feel-ings, and are likely to be employed to express apreference for a particular position, or to point outthe shortcomings of an alternative position. In thefollowing sentence, we see the sentiment expressionin bold, and the target in brackets. The writerhas a positive evaluation (“learning the most”) ofteachers’ encouragement.
Example 1At school, I always learned the most from [teacherswho encouraged me].
Arguing Expressions Arguing expressions revealthe writer’s beliefs and strong convictions, and isseen in the form of reasoning, justification, strongassertions, emphasis, and use of imperatives, neces-sities and conditionals (Wilson, 2008; Ruppenhoferet al., 2008). In the following sentence, we seethe arguing expression in bold, and the target inbrackets. Here, the writer clearly emphasizes theposition taken with respect to the topic.
Example 2For these reasons, I claim with confidence that [excel-lent knowledge of the subject being taught is secondaryto the teacher’s ability to relate well with their students].
We expect that persuasive essays where test takersclearly state their opinions will get better scores thanthe ones that do not.
3.2 Topical ElementsWe define topical elements as words or concepts thatare relevant to the topic of the essay, and which
usually get invoked in the process of stance-taking.They essentially correspond to “common topics”that test takers are expected to write about whenpresented with a prompt. For example, given theprompt in Section 1, while words which appear inthe prompt (prompt words), such as ‘teacher’, ‘stu-dent’, ‘subject’, and ‘knowledge’ are naturally ex-pected, we also expect general topical words suchas ‘class’ and ‘school’ to occur in response essays.Intuitively, we would expect essays containing suffi-cient topical elements to get higher scores.
3.3 Opinion Relevancy and ConsistencyWe expect that well-written persuasive essays willnot only express opinions and evoke common topics,but in fact express opinions about relevant topical el-ements. Specifically, we hypothesize that the opin-ions should be about artifacts relevant to the themeof the essay, and not about irrelevant topics. Forexample, for the prompt described in Section 1, itis important that there be opinions expressed abouttopics such as teachers, school, learning, and so on.In addition, the essay also has to reflect a clear at-tempt at persuasion and stance-taking in relevanceto the prompt statement and the underlying theme.We call this opinion relevancy.
We also expect that once a stance is taken, thereshould be sufficient elaboration and developmentsuch that the stance is consistently maintained. Wehypothesize that essays where test takers supporttheir stance will achieve higher scores than essayswhere they vacillate between options (for instance,in the example prompt in Section 1, the test takeris unable to decide whether the teachers’ ability torelate well is more important or not). We call thisopinion consistency.
These expectations are more stringent than thosediscussed in Sections 3.1 and 3.2, and we expect thata scoring system which captures these requirementswill likely perform better.
4 Essay Scoring Systems
In order to test the intuitions described in Section3, we build essay scoring systems based on featuresextracted from opinions, topics, and opinion-targetpairs. We construct three separate systems:
1. Opinion This system uses features based on
66

opinion expressions only, and tests whether ex-pressing opinions influences the essay score.
2. Topic This system uses features based on top-ical expressions alone, and tests whether evok-ing relevant topics associated with the promptinfluences the essay score.
3. Opinion-Target This system uses featuresbased on the combination of opinions and theirtargets, with the goal of measuring opinion rel-evancy and consistency. This system tests howwell the essay score can be predicted based onthe interactions of opinions with their targets.
4.1 Opinion System4.1.1 Finding sentiment and arguing
expressionsIn order to find sentiment expressions in the es-
says, we used a combination of two lexicons: theMPQA subjectivity lexicon (Wilson et al., 2005)(Lexicon 1), and the sentiment lexicon developed byBeigman Klebanov et al. (2013b) (Lexicon 2). Eachof these lexicons provides for each word, a senti-ment polarity (positive, negative, or neutral), alongwith an indicator of sentiment intensity: strongly orweakly subjective (Lexicon 1) or a probability dis-tribution over the polarity (Lexicon 2). For Lexicon2, the sentiment polarity for a word is obtained bychoosing the polarity corresponding to the highestprobability score.
For identifying arguing expressions in the essays,we used an Arguing lexicon developed as part of adiscourse lexicon (Burstein et al., 1998). The origi-nal lexicon has annotations for different types of ex-pressions, including claim initializations and devel-opment, structure, rhetoric, among others. For thiswork, since we are concerned with arguing expres-sions that specifically reveal support for or againstan idea, we used only lexicon entries which label anexpression as arguing-for or arguing-against. Forinstance, in Example 2, the writer argues for teach-ers’ ability to relate well with their students.
4.1.2 FeaturesWe extract three (global) features based on opin-
ion expressions:
1. The total count of sentiment words in the es-say that are found in Lexicon 1 and Lexicon 2
respectively. These counts also include wordswith subjective neutral polarity.
2. The total count of words in the essay found inthe arguing lexicon.
4.2 Topic System
4.2.1 Finding topical elements
In order to determine topical elements, we com-pute topic signatures (Lin and Hovy, 2000) over eachprompt. Topic Signatures are defined as
TS = {topic, signature}
= {prompt,< (t1, w1), (t2, w2)...(tn, wn) >}where topic in our case is the prompt. The signa-ture comprises a vector of related terms, where eachterm ti is highly correlated with the prompt with anassociation weight wi.
For each prompt, we use a corpus of high-scoringessays (that was separate from our training and test-ing data) to find its topic signature1. The top 500words with the highest signature scores are consid-ered as topical elements for that prompt.
For a given essay, we annotate all prompt wordsand topic signature words. Note that our topical ele-ments consist entirely of unigrams, but this need notnecessarily be the general case (as seen in examples1 and 2); extending the scope of topical elements tomulti-word concepts is a direction for future work.
4.2.2 Features
Based on the prompt words and topical words weextract the following features:
1. The total count of topical words in the essay
2. The total count of actual prompt words
We distinguished between prompt words and topi-cal words as the former measures whether the essayis clearly responding to the prompt, while the lattermeasures if thematic elements are indeed present inthe essay and its arguments.
1We used the topic signatures code provided athttp://homepages.inf.ed.ac.uk/alouis/topicS.html
67
4.3 Opinion-Target SystemThe opinion-target system relies on the extraction offeatures based on the opinion-target pairs found inthe essay. The first step towards building this sys-tem is the identification of opinion-target pairs, af-ter which we construct features which measure opin-ion relevancy and consistency. We investigated sim-ple heuristic-based approaches for finding targets ofopinions, described below.
4.3.1 Finding sentiment-target pairsWe explored three methods for finding targets of
sentiment expressions. Our simplest approach, all-sentence, finds all sentiment expressions in the sen-tence and assumes that all words are targets of eachexpression. This method introduces some noise as itresults in some words becoming targets of multipleopinions with possibly conflicting polarities.
Our second approach, resolve-sentence, resolvesthe sentiment at the sentence-level to a single po-larity, as in (Somasundaran and Wiebe, 2010), andthen assumes that all nouns, verbs, and adjectivesin the sentence are targets. If we consider Exam-ple 1, suppose the sentiment of the sentence is re-solved to positive, (due to the positive opinion wordslearned, most, and encouraged) then the wordsschool, teachers, learned and encouraged would beconsidered as the targets. Ideally, we would likeonly the words teachers and encouraged to be tar-gets. We note here that in our task a target can ac-tually be a sentiment-containing word such as en-couraged, which is why we don’t disregard senti-ment words when finding targets.
Our third method, resolve-constituent, resolvessentiment at the syntactic constituent level instead ofthe sentence level, and assumes that all nouns, verbsand adjectives in the constituent phrase are targets.For obtaining the phrases, we used the regular ex-pression parser from the Python NLTK toolkit (Bird,2006) to define a custom grammar that describesnoun, verb, and prepositional phrases. The parseruses regular expression rules for grouping words to-gether based on their part of speech tags. Consider-ing our example with this scenario, the phrases “atschool”, “I always”, and “learned the most from...”will be considered separately in our grammar, so theword school will likely not end up as a target.
To resolve sentence-level or constituent-level po-
larity, we use a heuristic that aggregates polarityscores from both sentiment lexicons, and choosesthe final polarity corresponding to the word with themaximum sentiment intensity.
While these methods are not exact and may leadto over-generating targets, for the purposes of thiswork (which is to determine whether a basic opin-ion system is effective in predicting essay scores),we are more interested in high recall of targets thenhigh precision because they will be aggregated at theessay level.
4.3.2 Finding arguing-target pairs
For resolving arguing-target pairs, we use the all-sentence method. Resolving the dominant arguingpolarity at the sentence level would be less straight-forward than for sentiment, given that the argumentlexicon does not provide us with scores for arguingintensity. Moreover, arguing targets are generallylonger (Ruppenhofer et al., 2008); we would expecttheir spans to extend beyond constituent phrases. Fi-nally, we observed that sentences generally do notcontain multiple arguing expressions, thus alleviat-ing the problem of spurious combinations.
4.3.3 Features
The features for the opinion-target system arebased on measuring relevancy and consistency ofopinions.
Relevancy Relevancy is measured by taking intoaccount how many opinions (or proportion of opin-ions) are about prompt or topical elements. Theseinclude global engineered features as follows:
1. The number of times that topical elements(topic and prompt words) appear as a target inthe essay’s opinion-target pairs.
2. The ratio of topic targets (opinion-topic pairs)to all opinion-target pairs.
We distinguished between topic targets andprompt targets and also between sentiments whichincluded subjective neutral versus only positive ornegative sentiments. We had separate features forsentiment-target pairs and arguing-target pairs, re-sulting in 13 relevancy features.
68
Consistency Consistency is measured by deter-mining how often the writer switches opinion polar-ity when referring to the same target. The consis-tency features included the following:
1. A binary feature indicating the presence of areversal (‘flip’) of opinion towards any target.
2. The number of unique targets which getflipped.
3. The proportion of all flips where the target is atopical element.
4. The proportion of all topical elements whichget flipped.
5. Statistics including max, mean, and mediannumber of flips over all targets.
We also separated sentiment-target and arguing-target features, as well as prompt word targets andtopic word targets, resulting in a total of 17 consis-tency features. We note that these features can onlycapture an approximate picture of consistency, be-cause it is well-known (Aull and Lancaster, 2014)that mature writers tend to state and describe oppos-ing arguments as well as their own.
5 Experiments
5.1 DataThe data used for this study consists of 58K es-says, covering 19 different prompts, obtained fromthe TOEFL® (Test of English as a Foreign Lan-guage) persuasive writing task which pertains to es-says written by undergraduate and graduate schoolapplicants who are non-native English speakers. Allessays are holistically scored by experts on an in-teger scale 0-5, with score point 5 assigned to ex-cellent essays. Detailed studies of human-humanagreement for this dataset can be found in Bridge-man et al. (2012). The holistic scores are assigned toessays based on English proficiency, and account forthe quality of (and errors in) grammar, language use,mechanics, style, in addition to quality of the persua-sive task. The scores for these essays are thus influ-enced by a number of factors other than the qualityof persuasion (essays can get a low score if they useincorrect grammar, even if they make good persua-sive arguments). However, we would like to test the
extent to which our hypothesis holds when predict-ing such holistically graded essays.
We split this dataset randomly into a training andtest set with proportions of 80% (46,404 essays) and20% (11,603 essays) respectively. Table 1 showsthe score distribution of essays for different scorepoints, in the training and test set respectively. Wenote that the distribution of scores is unbalanced,with essays having scores 3, 4, and 2 occupying themajority in that order.
5.2 Setup
We modeled the system with a number of differ-ent regression learners, which have generally beenshown to do well on the essay scoring task. Weused a number of learners available from the PythonScikit-learn toolkit (Pedregosa et al., 2011) and theScikit-learn-Laboratory (Blanchard et al., 2013): theLogistic Regression classifier (LO), which uses 6-way classification to predict integer essay scores inthe range 0-5, the Linear Regression learner (LR),which predicts real-valued scores that are rounded tointegers, and the Rescaled Linear Regression learner(RR), which rescales the predicted scores based onthe training data distribution. Given an input essay,the learners predict essay scores in the range 0-5,based on the features described in Section 4.
We considered a number of evaluation metrics totest for the predictive ability of opinion, topic, andopinion-target information in scoring the essays. Wetested if our proposed systems’ score predictions arecorrelated with human scores, by computing the hu-man score correlation (HSC) using Pearson’s coeffi-cient. As essay length is highly correlated with thehuman score (Attali and Burstein, 2006; Chodorowand Burstein, 2004), and as many of our features arebased on counts, they can be influenced by essaylength; so we also compute the partial correlations(HSC-Part) accounting for length, by partialing outthe length of the essay in words. For measuringthe performance of the system, we report Accuracy,F-measure – where we computed the weighted f-score (F-w) over the six score points – and QuadraticWeighted Kappa (QWK) (Cohen, 1968), which isthe standard metric for essay scoring. Accuracy andF-measure are standard NLP metrics and provide adirect, interpretable measure of system performancewhich reflects the precision and recall of different
69
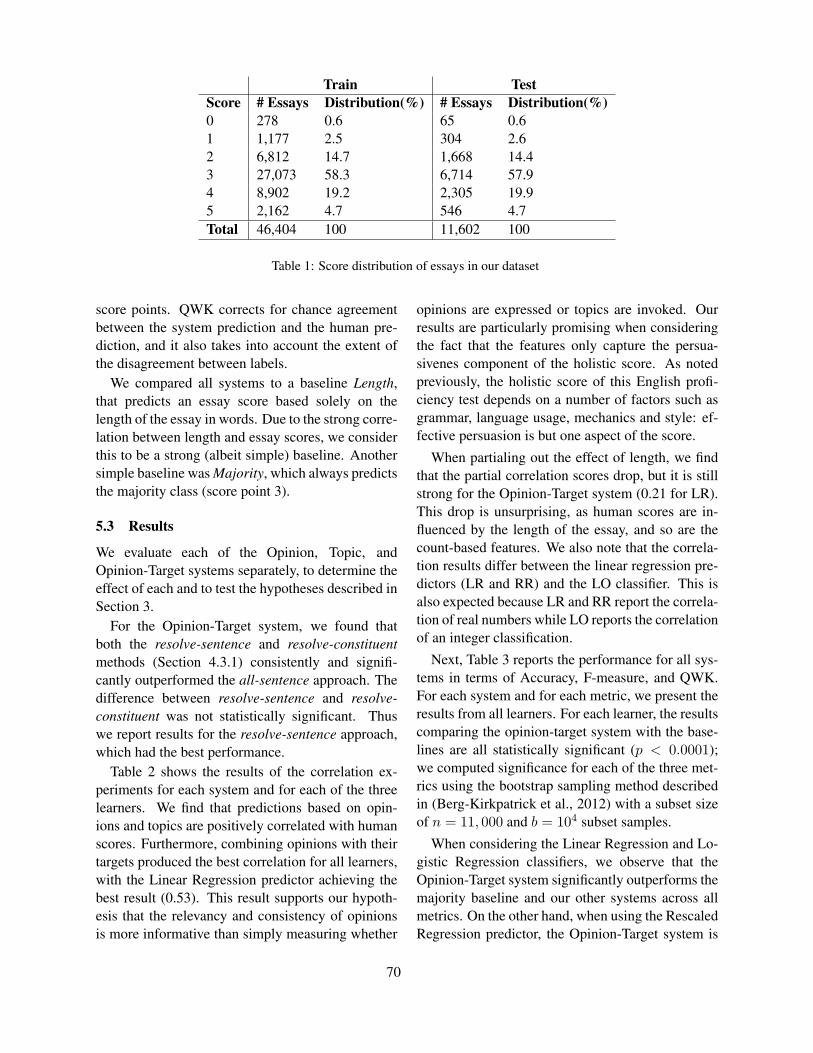
Train TestScore # Essays Distribution(%) # Essays Distribution(%)0 278 0.6 65 0.61 1,177 2.5 304 2.62 6,812 14.7 1,668 14.43 27,073 58.3 6,714 57.94 8,902 19.2 2,305 19.95 2,162 4.7 546 4.7Total 46,404 100 11,602 100
Table 1: Score distribution of essays in our dataset
score points. QWK corrects for chance agreementbetween the system prediction and the human pre-diction, and it also takes into account the extent ofthe disagreement between labels.
We compared all systems to a baseline Length,that predicts an essay score based solely on thelength of the essay in words. Due to the strong corre-lation between length and essay scores, we considerthis to be a strong (albeit simple) baseline. Anothersimple baseline was Majority, which always predictsthe majority class (score point 3).
5.3 Results
We evaluate each of the Opinion, Topic, andOpinion-Target systems separately, to determine theeffect of each and to test the hypotheses described inSection 3.
For the Opinion-Target system, we found thatboth the resolve-sentence and resolve-constituentmethods (Section 4.3.1) consistently and signifi-cantly outperformed the all-sentence approach. Thedifference between resolve-sentence and resolve-constituent was not statistically significant. Thuswe report results for the resolve-sentence approach,which had the best performance.
Table 2 shows the results of the correlation ex-periments for each system and for each of the threelearners. We find that predictions based on opin-ions and topics are positively correlated with humanscores. Furthermore, combining opinions with theirtargets produced the best correlation for all learners,with the Linear Regression predictor achieving thebest result (0.53). This result supports our hypoth-esis that the relevancy and consistency of opinionsis more informative than simply measuring whether
opinions are expressed or topics are invoked. Ourresults are particularly promising when consideringthe fact that the features only capture the persua-sivenes component of the holistic score. As notedpreviously, the holistic score of this English profi-ciency test depends on a number of factors such asgrammar, language usage, mechanics and style: ef-fective persuasion is but one aspect of the score.
When partialing out the effect of length, we findthat the partial correlation scores drop, but it is stillstrong for the Opinion-Target system (0.21 for LR).This drop is unsurprising, as human scores are in-fluenced by the length of the essay, and so are thecount-based features. We also note that the correla-tion results differ between the linear regression pre-dictors (LR and RR) and the LO classifier. This isalso expected because LR and RR report the correla-tion of real numbers while LO reports the correlationof an integer classification.
Next, Table 3 reports the performance for all sys-tems in terms of Accuracy, F-measure, and QWK.For each system and for each metric, we present theresults from all learners. For each learner, the resultscomparing the opinion-target system with the base-lines are all statistically significant (p < 0.0001);we computed significance for each of the three met-rics using the bootstrap sampling method describedin (Berg-Kirkpatrick et al., 2012) with a subset sizeof n = 11, 000 and b = 104 subset samples.
When considering the Linear Regression and Lo-gistic Regression classifiers, we observe that theOpinion-Target system significantly outperforms themajority baseline and our other systems across allmetrics. On the other hand, when using the RescaledRegression predictor, the Opinion-Target system is
70
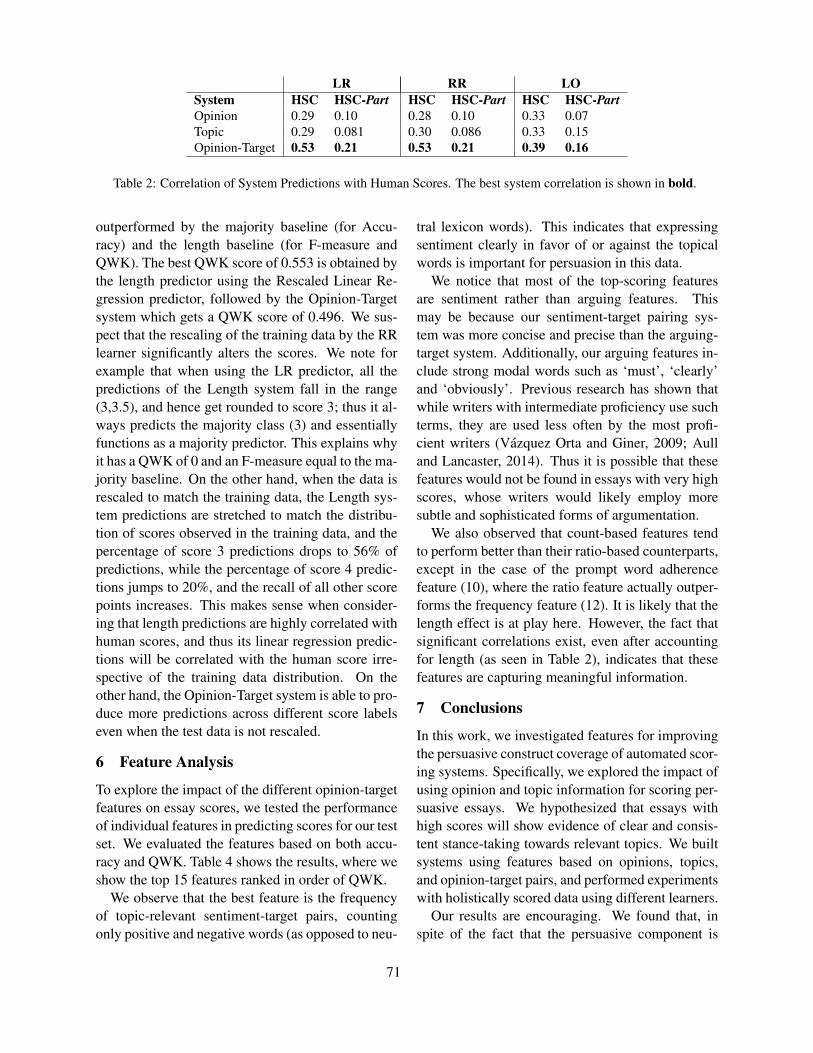
LR RR LOSystem HSC HSC-Part HSC HSC-Part HSC HSC-PartOpinion 0.29 0.10 0.28 0.10 0.33 0.07Topic 0.29 0.081 0.30 0.086 0.33 0.15Opinion-Target 0.53 0.21 0.53 0.21 0.39 0.16
Table 2: Correlation of System Predictions with Human Scores. The best system correlation is shown in bold.
outperformed by the majority baseline (for Accu-racy) and the length baseline (for F-measure andQWK). The best QWK score of 0.553 is obtained bythe length predictor using the Rescaled Linear Re-gression predictor, followed by the Opinion-Targetsystem which gets a QWK score of 0.496. We sus-pect that the rescaling of the training data by the RRlearner significantly alters the scores. We note forexample that when using the LR predictor, all thepredictions of the Length system fall in the range(3,3.5), and hence get rounded to score 3; thus it al-ways predicts the majority class (3) and essentiallyfunctions as a majority predictor. This explains whyit has a QWK of 0 and an F-measure equal to the ma-jority baseline. On the other hand, when the data isrescaled to match the training data, the Length sys-tem predictions are stretched to match the distribu-tion of scores observed in the training data, and thepercentage of score 3 predictions drops to 56% ofpredictions, while the percentage of score 4 predic-tions jumps to 20%, and the recall of all other scorepoints increases. This makes sense when consider-ing that length predictions are highly correlated withhuman scores, and thus its linear regression predic-tions will be correlated with the human score irre-spective of the training data distribution. On theother hand, the Opinion-Target system is able to pro-duce more predictions across different score labelseven when the test data is not rescaled.
6 Feature Analysis
To explore the impact of the different opinion-targetfeatures on essay scores, we tested the performanceof individual features in predicting scores for our testset. We evaluated the features based on both accu-racy and QWK. Table 4 shows the results, where weshow the top 15 features ranked in order of QWK.
We observe that the best feature is the frequencyof topic-relevant sentiment-target pairs, countingonly positive and negative words (as opposed to neu-
tral lexicon words). This indicates that expressingsentiment clearly in favor of or against the topicalwords is important for persuasion in this data.
We notice that most of the top-scoring featuresare sentiment rather than arguing features. Thismay be because our sentiment-target pairing sys-tem was more concise and precise than the arguing-target system. Additionally, our arguing features in-clude strong modal words such as ‘must’, ‘clearly’and ‘obviously’. Previous research has shown thatwhile writers with intermediate proficiency use suchterms, they are used less often by the most profi-cient writers (Vazquez Orta and Giner, 2009; Aulland Lancaster, 2014). Thus it is possible that thesefeatures would not be found in essays with very highscores, whose writers would likely employ moresubtle and sophisticated forms of argumentation.
We also observed that count-based features tendto perform better than their ratio-based counterparts,except in the case of the prompt word adherencefeature (10), where the ratio feature actually outper-forms the frequency feature (12). It is likely that thelength effect is at play here. However, the fact thatsignificant correlations exist, even after accountingfor length (as seen in Table 2), indicates that thesefeatures are capturing meaningful information.
7 Conclusions
In this work, we investigated features for improvingthe persuasive construct coverage of automated scor-ing systems. Specifically, we explored the impact ofusing opinion and topic information for scoring per-suasive essays. We hypothesized that essays withhigh scores will show evidence of clear and consis-tent stance-taking towards relevant topics. We builtsystems using features based on opinions, topics,and opinion-target pairs, and performed experimentswith holistically scored data using different learners.
Our results are encouraging. We found that, inspite of the fact that the persuasive component is
71
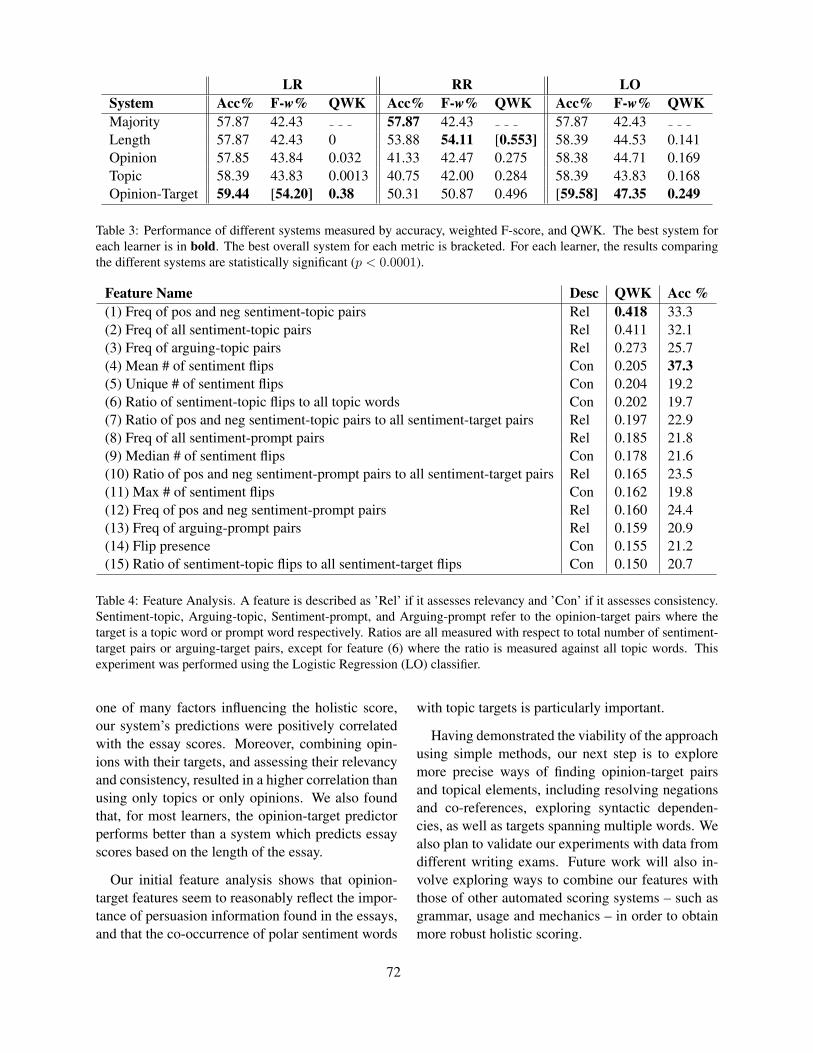
LR RR LOSystem Acc% F-w% QWK Acc% F-w% QWK Acc% F-w% QWKMajority 57.87 42.43 57.87 42.43 57.87 42.43Length 57.87 42.43 0 53.88 54.11 [0.553] 58.39 44.53 0.141Opinion 57.85 43.84 0.032 41.33 42.47 0.275 58.38 44.71 0.169Topic 58.39 43.83 0.0013 40.75 42.00 0.284 58.39 43.83 0.168Opinion-Target 59.44 [54.20] 0.38 50.31 50.87 0.496 [59.58] 47.35 0.249
Table 3: Performance of different systems measured by accuracy, weighted F-score, and QWK. The best system foreach learner is in bold. The best overall system for each metric is bracketed. For each learner, the results comparingthe different systems are statistically significant (p < 0.0001).
Feature Name Desc QWK Acc %(1) Freq of pos and neg sentiment-topic pairs Rel 0.418 33.3(2) Freq of all sentiment-topic pairs Rel 0.411 32.1(3) Freq of arguing-topic pairs Rel 0.273 25.7(4) Mean # of sentiment flips Con 0.205 37.3(5) Unique # of sentiment flips Con 0.204 19.2(6) Ratio of sentiment-topic flips to all topic words Con 0.202 19.7(7) Ratio of pos and neg sentiment-topic pairs to all sentiment-target pairs Rel 0.197 22.9(8) Freq of all sentiment-prompt pairs Rel 0.185 21.8(9) Median # of sentiment flips Con 0.178 21.6(10) Ratio of pos and neg sentiment-prompt pairs to all sentiment-target pairs Rel 0.165 23.5(11) Max # of sentiment flips Con 0.162 19.8(12) Freq of pos and neg sentiment-prompt pairs Rel 0.160 24.4(13) Freq of arguing-prompt pairs Rel 0.159 20.9(14) Flip presence Con 0.155 21.2(15) Ratio of sentiment-topic flips to all sentiment-target flips Con 0.150 20.7
Table 4: Feature Analysis. A feature is described as ’Rel’ if it assesses relevancy and ’Con’ if it assesses consistency.Sentiment-topic, Arguing-topic, Sentiment-prompt, and Arguing-prompt refer to the opinion-target pairs where thetarget is a topic word or prompt word respectively. Ratios are all measured with respect to total number of sentiment-target pairs or arguing-target pairs, except for feature (6) where the ratio is measured against all topic words. Thisexperiment was performed using the Logistic Regression (LO) classifier.
one of many factors influencing the holistic score,our system’s predictions were positively correlatedwith the essay scores. Moreover, combining opin-ions with their targets, and assessing their relevancyand consistency, resulted in a higher correlation thanusing only topics or only opinions. We also foundthat, for most learners, the opinion-target predictorperforms better than a system which predicts essayscores based on the length of the essay.
Our initial feature analysis shows that opinion-target features seem to reasonably reflect the impor-tance of persuasion information found in the essays,and that the co-occurrence of polar sentiment words
with topic targets is particularly important.
Having demonstrated the viability of the approachusing simple methods, our next step is to exploremore precise ways of finding opinion-target pairsand topical elements, including resolving negationsand co-references, exploring syntactic dependen-cies, as well as targets spanning multiple words. Wealso plan to validate our experiments with data fromdifferent writing exams. Future work will also in-volve exploring ways to combine our features withthose of other automated scoring systems – such asgrammar, usage and mechanics – in order to obtainmore robust holistic scoring.
72

Acknowledgments
We would like to thank all the reviewers for theirvaluable feedback and comments.
ReferencesApoorv Agarwal, Boyi Xie, Ilia Vovsha, Owen Rambow,
and Rebecca Passonneau. 2011. Sentiment analysisof twitter data. In Proceedings of the Workshop onLanguages in Social Media, pages 30–38. Associationfor Computational Linguistics.
Yigal Attali and Jill Burstein. 2006. Automated essayscoring with e-rater® v. 2. The Journal of Technology,Learning and Assessment, 4(3).
Laura L Aull and Zak Lancaster. 2014. Linguistic mark-ers of stance in early and advanced academic writinga corpus-based comparison. Written Communication,31(2):151–183.
Beata Beigman Klebanov and Michael Flor. 2013. Wordassociation profiles and their use for automated scoringof essays. In ACL (1), pages 1148–1158.
Beata Beigman Klebanov, Jill Burstein, and Nitin Mad-nani. 2013a. Sentiment profiles of multiword expres-sions in test-taker essays: The case of noun-noun com-pounds. ACM Transactions on Speech and LanguageProcessing (TSLP), 10(3):12.
Beata Beigman Klebanov, Nitin Madnani, and JillBurstein. 2013b. Using pivot-based paraphrasing andsentiment profiles to improve a subjectivity lexicon foressay data. TACL, 1:99–110.
Anat Ben-Simon and Randy Elliot Bennett. 2007. To-ward more substantively meaningful automated essayscoring. The Journal of Technology, Learning and As-sessment, 6(1).
Taylor Berg-Kirkpatrick, David Burkett, and Dan Klein.2012. An empirical investigation of statistical signifi-cance in nlp. In Proceedings of the 2012 Joint Confer-ence on Empirical Methods in Natural Language Pro-cessing and Computational Natural Language Learn-ing, pages 995–1005. Association for ComputationalLinguistics.
Steven Bird. 2006. Nltk: the natural language toolkit. InProceedings of the COLING/ACL on Interactive pre-sentation sessions, pages 69–72. Association for Com-putational Linguistics.
Daniel Blanchard, Michael Heilman, and Nitin Madnani.2013. Scikit-learn laboratory.
Johan Bollen, Huina Mao, and Alberto Pepe. 2011.Modeling public mood and emotion: Twitter sentimentand socio-economic phenomena. In ICWSM.
Brent Bridgeman, Catherine Trapani, and Yigal Attali.2012. Comparison of human and machine scoring of
essays: Differences by gender, ethnicity, and country.Applied Measurement in Education, 25(1):27–40.
Jill Burstein, Karen Kukich, Susanne Wolff, Ji Lu, andMartin Chodorow. 1998. Enriching automated essayscoring using discourse marking. In Workshop on Dis-course Relations and Discourse Marking. ERIC Clear-inghouse.
Jill Burstein. 2003. The e-rater® scoring engine: Auto-mated essay scoring with natural language processing.
Martin Chodorow and Jill Burstein. 2004. Beyond essaylength: Evaluating e-rater®’s performance on toefl®essays. ETS Research Report Series, 2004(1):i–38.
Jacob Cohen. 1968. Weighted kappa: Nominal scaleagreement provision for scaled disagreement or partialcredit. Psychological bulletin, 70(4):213.
Paul Deane. 2013. On the relation between automatedessay scoring and modern views of the writing con-struct. Assessing Writing, 18(1):7–24.
Semire Dikli. 2006. An overview of automated scoringof essays. The Journal of Technology, Learning andAssessment, 5(1).
Li Dong, Furu Wei, Chuanqi Tan, Duyu Tang, MingZhou, and Ke Xu. 2014. Adaptive recursive neuralnetwork for target-dependent twitter sentiment clas-sification. In Proceedings of the 52nd Annual Meet-ing of the Association for Computational Linguistics,pages 49–54.
Peter W Foltz, Darrell Laham, and Thomas K Landauer.1999. The intelligent essay assessor: Applications toeducational technology. Interactive Multimedia Elec-tronic Journal of Computer-Enhanced Learning, 1(2).
Alec Go, Richa Bhayani, and Lei Huang. 2009. Twit-ter sentiment classification using distant supervision.CS224N Project Report, Stanford, pages 1–12.
Namrata Godbole, Manja Srinivasaiah, and StevenSkiena. 2007. Large-scale sentiment analysis fornews and blogs. ICWSM, 7.
Minqing Hu and Bing Liu. 2004. Mining and summa-rizing customer reviews. In Proceedings of the tenthACM SIGKDD international conference on Knowl-edge discovery and data mining, pages 168–177.ACM.
Long Jiang, Mo Yu, Ming Zhou, Xiaohua Liu, and TiejunZhao. 2011. Target-dependent twitter sentiment clas-sification. In Proceedings of the 49th Annual Meet-ing of the Association for Computational Linguistics:Human Language Technologies-Volume 1, pages 151–160. Association for Computational Linguistics.
Chin-Yew Lin and Eduard Hovy. 2000. The automatedacquisition of topic signatures for text summarization.In Proceedings of the 18th conference on Computa-tional linguistics-Volume 1, pages 495–501. Associa-tion for Computational Linguistics.
73
Bing Liu, Minqing Hu, and Junsheng Cheng. 2005.Opinion observer: analyzing and comparing opinionson the web. In Proceedings of the 14th internationalconference on World Wide Web, pages 342–351. ACM.
Kang Liu, Liheng Xu, and Jun Zhao. 2014. Extractingopinion targets and opinion words from online reviewswith graph co-ranking.
Nitin Madnani, Michael Heilman, Joel Tetreault, andMartin Chodorow. 2012. Identifying high-level or-ganizational elements in argumentative discourse. InProceedings of the 2012 Conference of the NorthAmerican Chapter of the Association for Computa-tional Linguistics: Human Language Technologies,pages 20–28. Association for Computational Linguis-tics.
Tony Mullen and Robert Malouf. 2006. A preliminaryinvestigation into sentiment analysis of informal polit-ical discourse. In AAAI Spring Symposium: Computa-tional Approaches to Analyzing Weblogs, pages 159–162.
Ellis B Page. 1966. The imminence of... grading essaysby computer. Phi Delta Kappan, pages 238–243.
Bo Pang and Lillian Lee. 2004. A sentimental education:Sentiment analysis using subjectivity summarizationbased on minimum cuts. In Proceedings of the 42ndannual meeting on Association for Computational Lin-guistics, page 271. Association for Computational Lin-guistics.
Fabian Pedregosa, Gael Varoquaux, Alexandre Gram-fort, Vincent Michel, Bertrand Thirion, Olivier Grisel,Mathieu Blondel, Peter Prettenhofer, Ron Weiss, Vin-cent Dubourg, et al. 2011. Scikit-learn: Machinelearning in python. The Journal of Machine LearningResearch, 12:2825–2830.
Maria Pontiki, Haris Papageorgiou, Dimitrios Galanis,Ion Androutsopoulos, John Pavlopoulos, and SureshManandhar. 2014. Semeval-2014 task 4: Aspectbased sentiment analysis. In Proceedings of the 8thInternational Workshop on Semantic Evaluation (Se-mEval 2014), pages 27–35.
Guang Qiu, Bing Liu, Jiajun Bu, and Chun Chen.2011. Opinion word expansion and target extractionthrough double propagation. Computational linguis-tics, 37(1):9–27.
Lawrence M Rudner and Tahung Liang. 2002. Auto-mated essay scoring using bayes’ theorem. The Jour-nal of Technology, Learning and Assessment, 1(2).
Josef Ruppenhofer, Swapna Somasundaran, and JanyceWiebe. 2008. Finding the sources and targets of sub-jective expressions. In LREC.
Swapna Somasundaran and Janyce Wiebe. 2009. Rec-ognizing stances in online debates. In Proceedings ofthe Joint Conference of the 47th Annual Meeting of
the ACL and the 4th International Joint Conference onNatural Language Processing of the AFNLP: Volume1-Volume 1, pages 226–234. Association for Compu-tational Linguistics.
Swapna Somasundaran and Janyce Wiebe. 2010. Recog-nizing stances in ideological on-line debates. In Pro-ceedings of the NAACL HLT 2010 Workshop on Com-putational Approaches to Analysis and Generation ofEmotion in Text, pages 116–124. Association for Com-putational Linguistics.
Swapna Somasundaran, Jill Burstein, and MartinChodorow. 2014. Lexical chaining for measuring dis-course coherence quality in test-taker essays.
Christian Stab and Iryna Gurevych. 2014a. Annotatingargument components and relations in persuasive es-says. In Proceedings of the 25th International Confer-ence on Computational Linguistics (COLING 2014),pages 1501–1510.
Christian Stab and Iryna Gurevych. 2014b. Identify-ing argumentative discourse structures in persuasiveessays.
Peter D Turney. 2002. Thumbs up or thumbs down?:semantic orientation applied to unsupervised classifi-cation of reviews. In Proceedings of the 40th annualmeeting on association for computational linguistics,pages 417–424. Association for Computational Lin-guistics.
Ignacio Vazquez Orta and Diana Giner. 2009. Writingwith conviction: The use of boosters in modelling per-suasion in academic discourses.
David M Williamson, Xiaoming Xi, and F Jay Breyer.2012. A framework for evaluation and use of auto-mated scoring. Educational Measurement: Issues andPractice, 31(1):2–13.
Theresa Wilson, Janyce Wiebe, and Paul Hoffmann.2005. Recognizing contextual polarity in phrase-levelsentiment analysis. In Proceedings of the conferenceon human language technology and empirical methodsin natural language processing, pages 347–354. Asso-ciation for Computational Linguistics.
Theresa Ann Wilson. 2008. Fine-grained subjectivityand sentiment analysis: recognizing the intensity, po-larity, and attitudes of private states. ProQuest.
74
Proceedings of the Tenth Workshop on Innovative Use of NLP for Building Educational Applications, 2015, pages 75–80,Denver, Colorado, June 4, 2015. c©2015 Association for Computational Linguistics
Towards Automatic Description of Knowledge Components
Cyril GoutteNational Research Council
1200 Montreal Rd.Ottawa, ON [email protected]
Guillaume DurandNational Research Council
100 des Aboiteaux St.Moncton, NB E1A7R1
Serge LegerNational Research Council
100 des Aboiteaux St.Moncton, NB [email protected]
Abstract
A key aspect of cognitive diagnostic modelsis the specification of the Q-matrix associat-ing the items and some underlying studentattributes. In many data-driven approaches,test items are mapped to the underlying, la-tent knowledge components (KC) based onobserved student performance, and with littleor no input from human experts. As a result,these latent skills typically focus on model-ing the data accurately, but may be hard todescribe and interpret. In this paper, we fo-cus on the problem of describing these knowl-edge components. Using a simple probabilis-tic model, we extract, from the text of thetest items, some keywords that are most rel-evant to each KC. On a small dataset from thePSLC datashop, we show that this is surpris-ingly effective, retrieving unknown skill labelsin close to 50% of cases. We also show thatour method clearly outperforms typical base-lines in specificity and diversity.
1 Introduction
Recent years have seen significant advances in auto-matically identifying latent attributes useful for cog-nitive diagnostic assessment. For example, the Q-matrix (Tatsuoka, 1983) associates test items withskills of students taking the test. Data-driven meth-ods were introduced to automatically identify latentknowledge components (KCs) and map them to testitems, based on observed student performance, cf.Barnes (2005) and Section 2 below.
A crucial issue with these automatic methods isthat latent skills optimize some well defined objec-
tive function, but may be hard to describe and in-terpret. Even for manually-designed Q-matrices,knowledge components may not be described indetail by the designer. In that situation, a data-generated description can provide useful informa-tion. In this short paper, we show how to extractkeywords relevant to each KC, from the textual con-tent corresponding to each item. We build a simpleprobabilistic model, with which we score possiblekeywords. This proves surprisingly effective on asmall dataset obtained from the PSLC datashop.
After a quick overview of the automatic extrac-tion of latent attributes in Section 2, we describe ourkeyword extraction procedure in Section 3. The datais introduced in Section 4, and we present our exper-imental results and analysis in Section 5.
2 Extraction of Knowledge ComponentModels
The Rule Space model (Tatsuoka, 1983; Tatsuoka,1995) was introduced to statistically classify stu-dent’s item responses into a set of ideal responsepatterns associated with different cognitive skills. Amajor assumption of Rule Space is that students onlyneed to master specific skills in order to successfullycomplete items. Using the Rule Space model forcognitive diagnostics assessment requires experts tobuild and reduce an incidence or Q matrix encodingthe combination of skills, a.k.a. attributes, neededfor completing items (Birenbaum et al., 1992) andgenerating ideal item responses based on the re-duced Q matrix (Gierl et al., 2000). The ideal re-sponse patterns can then be used to analyze studentresponse patterns.
75

The requirement for extensive expert effort in thetraditional Q matrix design has motivated attemptsto discover the Q matrix from observed responsepatterns, in effect reverse engineering the designprocess. Barnes (2005) proposed a multi-start hill-climbing method to create the Q-matrix, but experi-mented only on limited number of skills. Desmaraiset al. (2011; 2014) refined expert Q matrices usingmatrix factorization, Although this proved useful toautomatically improve expert designed Q-matrices,non-negative matrix factorization is sensitive to ini-tialization and prone to local minima. Sun et al.(2014) generated binary Q-matrices using an alter-nate recursive method that automatically estimatesthe number of latent attributes, yielding high ma-trix coverage rates. Others (Liu et al., 2012; Chenet al., 2014) estimate the Q-matrix under the settingof well known psychometric models that integrateguess and slip parameters to model the variation be-tween ideal and observed response patterns. Theyformulate Q-matrix extraction as a latent variableselection problem solved by regularized maximumlikelihood, but require to know the number of latentattributes. Finally, Sparse Factor Analysis (Lan etal., 2014) was recently introduced to address datasparsity in a flexible probabilistic model. They re-quire setting the number of attributes and rely onuser-generated tags to facilitate the interpretabilityof estimated factors.
These approaches to the automatic extraction ofa Q-matrix address the problem from various anglesand an extensive comparison of their respective per-formance is still required. However, none of thesetechniques address the problem of providing a tex-tual description of the discovered attributes. Thismakes them hard to interpret and understand, andmay limit their practical usability.
3 Probabilistic Keyword Extraction
We focus on the textual content associated with eachitem in order to identify the salient terms as key-words. Textual content associated with an item maybe for example the body of the question, optionalhints or the text contained in the answers (Figure 1).
For each item i, we denote by di its textual content(e.g. body text in Figure 1). We also assume a bi-nary mapping of items to K skills ck, k = 1 . . . K.
Skills are typically latent skills obtained automati-cally (unsupervised) from data. They may also bedefined by a manually designed Q-matrix for whichskill descriptions are unknown. In analogy with textcategorization, textual content is a document di andeach skill is a class (or cluster) ck. Our goal is toidentify keywords from the documents that describethe classes.
For each KC ck, we estimate a unigram languagemodel based on all text di associated with that KC.This is essentially building a Naive Bayes classifier(McCallum and Nigam, 1998), estimating relativeword frequencies in each KC:
P (w|ck) =∑
i,di∈cknwi∑
i,di∈ck|di| , ∀k ∈ {1 . . . K}, (1)
where nwi is the number of occurrences of word win document di, and |di| is the length (in words) ofdocument |di|. In some models such as Naive Bayes,it is essential to smooth the probability estimates (1)appropriately. However more advanced multinomialmixture models (Gaussier et al., 2002), or for thepurpose of this paper, smoothing has little impact.Conditional probability estimates (1) may be seenas the profile of ck. Important words to describe aKC c ∈ {c1, . . . cK} have significantly higher prob-ability in c than in other KCs. One metric to evalu-ate how two distributions differ is the (symmetrized)Kullback-Leibler divergence:
KL(c, /c) =∑w
(P (w|c)−P (w|/c)) logP (w|c)P (w|/c)︸ ︷︷ ︸
k(w)
,
(2)where /c means all KCs except c, and P (w|/c) is esti-mated similarly to Eq. 1, P (w|/c) ∝∑i,di 6∈c nwi.
Note that Eq. (2) is an additive sum of posi-tive, word-specific contributions k(w). Large con-tributions come from significant differences eitherway between the profile of a KC, P (w|c), and theaverage profile of all other KCs, P (w|/c). As wewant to focus on keywords that have significantlyhigher probability for that KC, and diregard wordsthat have higher probability outside, we will use asigned score:
sc(w) = |P (w|c)− P (w|/c)| logP (w|c)P (w|/c) , (3)
76
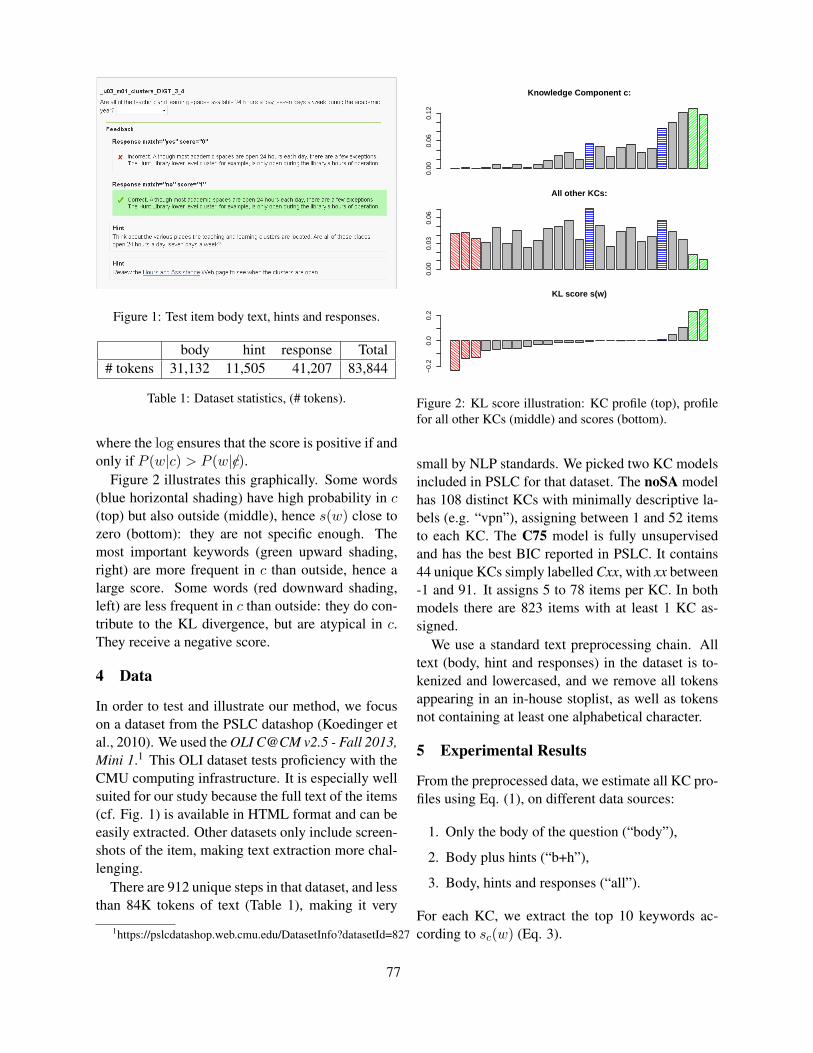
Figure 1: Test item body text, hints and responses.
body hint response Total# tokens 31,132 11,505 41,207 83,844
Table 1: Dataset statistics, (# tokens).
where the log ensures that the score is positive if andonly if P (w|c) > P (w|/c).
Figure 2 illustrates this graphically. Some words(blue horizontal shading) have high probability in c(top) but also outside (middle), hence s(w) close tozero (bottom): they are not specific enough. Themost important keywords (green upward shading,right) are more frequent in c than outside, hence alarge score. Some words (red downward shading,left) are less frequent in c than outside: they do con-tribute to the KL divergence, but are atypical in c.They receive a negative score.
4 Data
In order to test and illustrate our method, we focuson a dataset from the PSLC datashop (Koedinger etal., 2010). We used the OLI C@CM v2.5 - Fall 2013,Mini 1.1 This OLI dataset tests proficiency with theCMU computing infrastructure. It is especially wellsuited for our study because the full text of the items(cf. Fig. 1) is available in HTML format and can beeasily extracted. Other datasets only include screen-shots of the item, making text extraction more chal-lenging.
There are 912 unique steps in that dataset, and lessthan 84K tokens of text (Table 1), making it very
1https://pslcdatashop.web.cmu.edu/DatasetInfo?datasetId=827
Knowledge Component c:
0.00
0.06
0.12
All other KCs:
0.00
0.03
0.06
KL score s(w)
−0.
20.
00.
2
Figure 2: KL score illustration: KC profile (top), profilefor all other KCs (middle) and scores (bottom).
small by NLP standards. We picked two KC modelsincluded in PSLC for that dataset. The noSA modelhas 108 distinct KCs with minimally descriptive la-bels (e.g. “vpn”), assigning between 1 and 52 itemsto each KC. The C75 model is fully unsupervisedand has the best BIC reported in PSLC. It contains44 unique KCs simply labelled Cxx, with xx between-1 and 91. It assigns 5 to 78 items per KC. In bothmodels there are 823 items with at least 1 KC as-signed.
We use a standard text preprocessing chain. Alltext (body, hint and responses) in the dataset is to-kenized and lowercased, and we remove all tokensappearing in an in-house stoplist, as well as tokensnot containing at least one alphabetical character.
5 Experimental Results
From the preprocessed data, we estimate all KC pro-files using Eq. (1), on different data sources:
1. Only the body of the question (“body”),
2. Body plus hints (“b+h”),
3. Body, hints and responses (“all”).
For each KC, we extract the top 10 keywords ac-cording to sc(w) (Eq. 3).
77
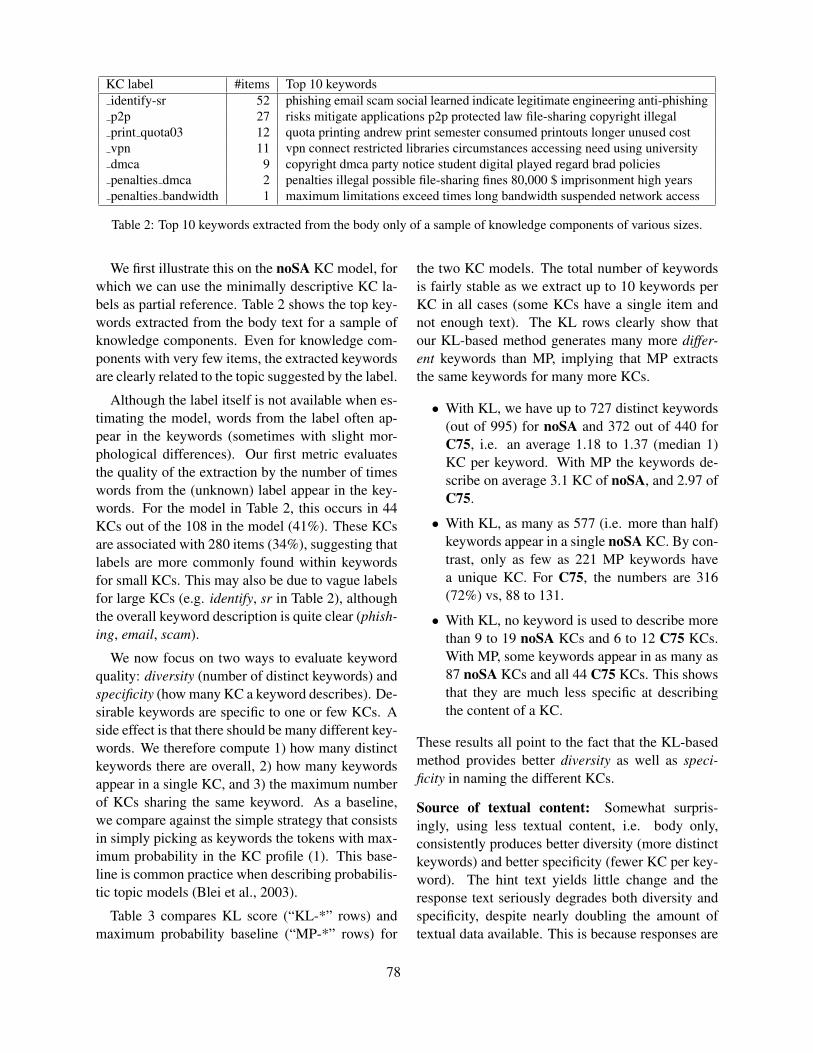
KC label #items Top 10 keywordsidentify-sr 52 phishing email scam social learned indicate legitimate engineering anti-phishingp2p 27 risks mitigate applications p2p protected law file-sharing copyright illegalprint quota03 12 quota printing andrew print semester consumed printouts longer unused costvpn 11 vpn connect restricted libraries circumstances accessing need using universitydmca 9 copyright dmca party notice student digital played regard brad policiespenalties dmca 2 penalties illegal possible file-sharing fines 80,000 $ imprisonment high yearspenalties bandwidth 1 maximum limitations exceed times long bandwidth suspended network access
Table 2: Top 10 keywords extracted from the body only of a sample of knowledge components of various sizes.
We first illustrate this on the noSA KC model, forwhich we can use the minimally descriptive KC la-bels as partial reference. Table 2 shows the top key-words extracted from the body text for a sample ofknowledge components. Even for knowledge com-ponents with very few items, the extracted keywordsare clearly related to the topic suggested by the label.
Although the label itself is not available when es-timating the model, words from the label often ap-pear in the keywords (sometimes with slight mor-phological differences). Our first metric evaluatesthe quality of the extraction by the number of timeswords from the (unknown) label appear in the key-words. For the model in Table 2, this occurs in 44KCs out of the 108 in the model (41%). These KCsare associated with 280 items (34%), suggesting thatlabels are more commonly found within keywordsfor small KCs. This may also be due to vague labelsfor large KCs (e.g. identify, sr in Table 2), althoughthe overall keyword description is quite clear (phish-ing, email, scam).
We now focus on two ways to evaluate keywordquality: diversity (number of distinct keywords) andspecificity (how many KC a keyword describes). De-sirable keywords are specific to one or few KCs. Aside effect is that there should be many different key-words. We therefore compute 1) how many distinctkeywords there are overall, 2) how many keywordsappear in a single KC, and 3) the maximum numberof KCs sharing the same keyword. As a baseline,we compare against the simple strategy that consistsin simply picking as keywords the tokens with max-imum probability in the KC profile (1). This base-line is common practice when describing probabilis-tic topic models (Blei et al., 2003).
Table 3 compares KL score (“KL-*” rows) andmaximum probability baseline (“MP-*” rows) for
the two KC models. The total number of keywordsis fairly stable as we extract up to 10 keywords perKC in all cases (some KCs have a single item andnot enough text). The KL rows clearly show thatour KL-based method generates many more differ-ent keywords than MP, implying that MP extractsthe same keywords for many more KCs.
• With KL, we have up to 727 distinct keywords(out of 995) for noSA and 372 out of 440 forC75, i.e. an average 1.18 to 1.37 (median 1)KC per keyword. With MP the keywords de-scribe on average 3.1 KC of noSA, and 2.97 ofC75.
• With KL, as many as 577 (i.e. more than half)keywords appear in a single noSA KC. By con-trast, only as few as 221 MP keywords havea unique KC. For C75, the numbers are 316(72%) vs, 88 to 131.
• With KL, no keyword is used to describe morethan 9 to 19 noSA KCs and 6 to 12 C75 KCs.With MP, some keywords appear in as many as87 noSA KCs and all 44 C75 KCs. This showsthat they are much less specific at describingthe content of a KC.
These results all point to the fact that the KL-basedmethod provides better diversity as well as speci-ficity in naming the different KCs.
Source of textual content: Somewhat surpris-ingly, using less textual content, i.e. body only,consistently produces better diversity (more distinctkeywords) and better specificity (fewer KC per key-word). The hint text yields little change and theresponse text seriously degrades both diversity andspecificity, despite nearly doubling the amount oftextual data available. This is because responses are
78

model total diff. uniq. maxKL-body 995 727 577 9KL-b+h 1005 722 558 10
noSA KL-all 1080 639 480 19MP-body 995 534 365 42MP-b+h 1005 521 340 34MP-all 1080 352 221 87KL-body 440 372 316 6
C75 KL-all 440 328 254 12MP-body 440 203 131 33MP-all 440 148 88 44KL-body 440 377 325 4
C75 KL-all 440 332 261 11(+sw) MP-body 440 76 43 43
MP-all 440 68 32 44
Table 3: Statistics on various keyword extraction meth-ods. KL (Kullback-Leibler score) and MP (maximumprobability) are tested on body only, body+hints (b+h)or all text. We report the total number of keywords ex-tracted (Total), the number of different keywords (diff.),keywords with unique KC (unique) and maximum num-ber of KC per keyword (max). “+sw” indicates stopwordsare included (not filtered).
very similar across items. They add textual informa-tion but tend to smooth out profiles. This is shown inthe comparison between “KL-body” and “MP-all”in Table 4. The latter extracts “correct” and “incor-rect” as keywords for most KCs in both models, be-cause these words frequently appear in the responsefeedback (Fig. 1). KL-based naming discards thesewords because they are almost equally frequent inall KCs and are not specific enough. Table 4 alsoshows that MP selects the same frequent words forboth KC models. By contrast, the most used KLkeywords for noSA are not so frequently used to de-scribe C75 KCs, suggeting that the descriptions aremore specific to the models.
Impact of stopwords: The bottom panel of table3 (indicated by “(+sw)”) shows the impact of notfiltering stopword on the keyword extraction met-rics (i.e. keeping stopwords). For KL the impact issmall: filtering out stopwords actually degrades per-formance slightly. The impact on MP is massive:there are up to three times less different keyword(76 vs. 203), and most are high-frequency functionwords (“to”, “of”, etc.). The extreme case is “the”,
KL-body MP-allKeyword #no #C Keyword #no #Cuse 9 1 incorrect 87 44following 8 1 correct 67 41access 7 - review 49 22andrew 7 2 information 30 20account 7 - module 29 9search 7 2 course 26 9
Table 4: Keywords associated with most KCs in noSA,with number of associated KC in noSA (#no) and C75(#C). Left: KL score on item body; Right: max. proba-bility on all text.
extracted for all 44 KCs. Results on noSA are simi-lar and not included for brievity.
6 Discussion
We described a simple probabilistic method forknowledge component naming using keywords.This simple method is effective at generating de-scriptive keywords that are both diverse and spe-cific. We show that our method clearly outperformsthe simple baseline that focuses on most probablewords, with no impact on computational cost.
Although we only extract key words from the tex-tual data, one straightforward improvement wouldbe to identify and extract either multiword terms,which may be more explanatory, or relevant snip-pets from the data. A related perspective would be tocombine our relevance scores with, for example, theoutput of a parser in order to extract more compli-cated linguistic structure such as subject-verb-objecttriples (Atapattu et al., 2014).
Our data-generated descriptions could also beuseful in the generation or the refinement of Q-Matrices. In addition to describing knowledge com-ponents, naming KCs could offer significant infor-mation on the consistency of the KC mapping. Thismay offer a new and complementary approach tothe existing refinement methods based on functionalmodels optimization (Desmarais et al., 2014). Itcould also complement or replace human input instudent model discovery and improvement (Stamperand Koedinger, 2011).
79

Acknowledgement
We used the ’OLI C@CM v2.5 - Fall 2013, Mini1 (100 students)’ dataset accessed via DataShop(Koedinger et al., 2010). We thank Alida Skogsholmfrom CMU for her help in choosing this dataset.
ReferencesT. Atapattu, K. Falkner, and N. Falkner. 2014. Acquisi-
tion of triples of knowledge from lecture notes: A nat-ural language processing approach. In 7th Intl. Conf.on Educational Data Mining, pages 193–196.
T. Barnes. 2005. The Q-matrix method: Mining studentresponse data for knowledge. In AAAI EducationalData Mining workshop, page 39.
M. Birenbaum, A. E. Kelly, and K. K. Tatsuoka. 1992.Diagnosing Knowledge States in Algebra Using theRule Space Model. Educational Testing ServicePrinceton, NJ: ETS research report. Educational Test-ing Service.
David M. Blei, Andrew Y. Ng, and Michael I. Jordan.2003. Latent dirichlet allocation. Journal of MachineLearning Research, 3(Jan):993–1022.
Y. Chen, J. Liu, G. Xu, and Z. Ying. 2014. Statisti-cal analysis of Q-matrix based diagnostic classificationmodels. Journal of the American Statistical Associa-tion.
M. Desmarais, B. Beheshti, and P. Xu. 2014. The re-finement of a Q-matrix: Assessing methods to validatetasks to skills mapping. In 7th Intl. Conf. on Educa-tional Data Mining, pages 308–311.
M. Desmarais. 2011. Mapping questions items to skillswith non-negative matrix factorization. ACM-KDD-Explorations, 13(2):30–36.
E. Gaussier, C. Goutte, K. Popat, and F. Chen. 2002. Ahierarchical model for clustering and categorising doc-uments. In Advances in Information Retrieval, pages229–247. Springer Berlin Heidelberg.
M.J. Gierl, J. P. Leighton, and S. M. Hunka. 2000. Ex-ploring the logic of Tatsuoka’s rule-space model fortest development and analysis. Educational Measure-ment: Issues and Practice, 19(3):34–44.
K.R. Koedinger, R.S.J.d. Baker, K. Cunningham,A. Skogsholm, B. Leber, and J. Stamper. 2010. Adata repository for the EDM community: The pslcdatashop. In C. Romero, S. Ventura, M. Pechenizkiy,and R.S.J.d. Baker, editors, Handbook of EducationalData Mining. CRC Press.
A.S. Lan, A.E. waters, C. Studer, and R.G. Baraniuk.2014. Sparse factor analysis for learning and con-tent analytics. Journal of Machine Learning Research,15:1959–2008, June.
J. Liu, G. Xu, and Z. Ying. 2012. Data-driven learn-ing of Q-matrix. Applied Psychological Measurement,36(7):548–564.
A. McCallum and K. Nigam. 1998. A comparison ofevent models for naive Bayes text classification. InAAAI-98 workshop on learning for text categorization,pages 41–48.
J.C. Stamper and K.R. Koedinger. 2011. Human-machine student model discovery and improvementusing DataShop. In Artificial Intelligence in Educa-tion, pages 353–360. Springer Berlin Heidelberg.
Y. Sun, S. Ye, S. Inoue, and Yi Sun. 2014. Alternatingrecursive method for Q-matrix learning. In 7th Intl.Conf. on Educational Data Mining, pages 14–20.
K.K. Tatsuoka. 1983. Rule space: an approach for deal-ing with misconceptions based on item response the-ory. Journal of Educational Measurement, 20(4):345–354.
K.K. Tatsuoka. 1995. Architecture of knowledge struc-tures and cognitive diagnosis: A statistical patternrecognition and classification approach. In P. D.Nichols, S. F. Chipman, and R. Brennan, editors, Cog-nitively Diagnostic Assessment, pages 327–359. Hills-dale, NJ: Lawrence Erlbaum Associates.
80

Proceedings of the Tenth Workshop on Innovative Use of NLP for Building Educational Applications, 2015, pages 81–85,Denver, Colorado, June 4, 2015. c©2015 Association for Computational Linguistics
The Impact of Training Data onAutomated Short Answer Scoring Performance∗
Michael Heilman and Nitin MadnaniEducational Testing Service
Princeton, NJ, USA
Abstract
Automatic evaluation of written responses tocontent-focused assessment items (automatedshort answer scoring) is a challenging educa-tional application of natural language process-ing. It is often addressed using supervised ma-chine learning by estimating models to predicthuman scores from detailed linguistic featuressuch as word n-grams. However, training data(i.e., human-scored responses) can be difficultto acquire. In this paper, we conduct exper-iments using scored responses to 44 promptsfrom 5 diverse datasets in order to better un-derstand how training set size and other fac-tors relate to system performance. We believethis will help future researchers and practition-ers working on short answer scoring to answerpractically important questions such as, “Howmuch training data do I need?”
1 Introduction
Automated short answer scoring is a challenging ed-ucational application of natural language process-ing that has received considerable attention in recentyears, including a SemEval shared task (Dzikovskaet al., 2013), a public competition on the Kaggle datascience website (https://www.kaggle.com/c/asap-sas), and various other research papers(Leacock and Chodorow, 2003; Nielsen et al., 2008;Mohler et al., 2011).
The goal of short answer scoring is to create a pre-dictive model that can take as input a text response toa given prompt (e.g., a question about a reading pas-sage) and produce a score representing the accuracy
∗Michael Heilman is now a data scientist at Civis Analytics.
or correctness of that response. One well-known ap-proach is to learn a prompt-specific model using de-tailed linguistic features such as word n-grams froma large training set of responses that have been pre-viously scored by humans.1
This approach works very well when large sets oftraining data are available, such as in the ASAP 2competition, where there were thousands of labeledresponses per prompt. However, little work has beendone to investigate the extent to which short answerscoring performance depends on the availability oflarge amounts of training data. This is important be-cause short answer scoring is different from taskswhere one dataset can be used to train models fora wide variety of inputs, such as syntactic parsing.2
Current short answer scoring approaches depend onhaving training data for each new prompt.
Here, we investigate the effects on performanceof training sample size and a few other factors,in order to help answer extremely practical ques-tions like, “How much data should I gather and la-bel before deploying automated scoring for a newprompt?” Specifically, we explore the following re-search questions:
• How strong is the association between train-ing sample size and automated scoring perfor-mance?
1Information from the scoring guidelines, such as exemplarsfor different score levels, can also be used in the scoring model,though in practice we have observed that this does not add muchpredictive power to a model that uses student responses (Sak-aguchi et al., 2015).
2Syntactic parsing performance varies considerably depend-ing on the domain, but most applications use parsing modelsthat depend almost exclusively on the Penn Treebank.
81
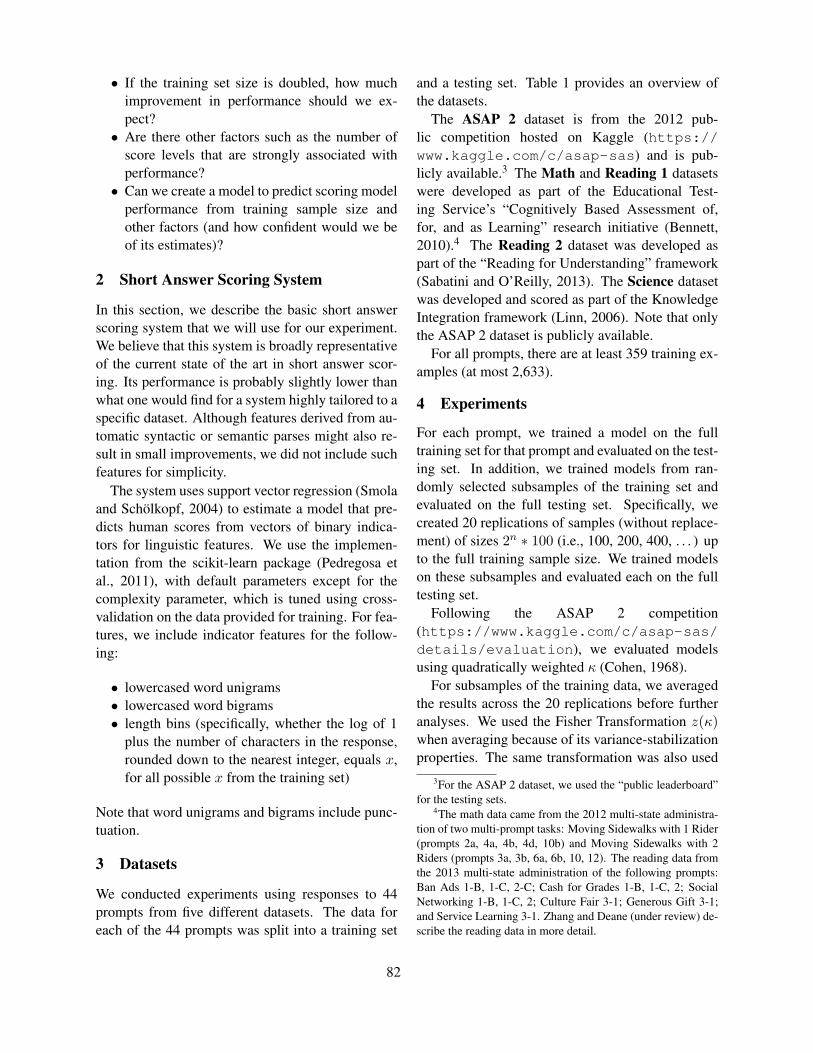
• If the training set size is doubled, how muchimprovement in performance should we ex-pect?
• Are there other factors such as the number ofscore levels that are strongly associated withperformance?
• Can we create a model to predict scoring modelperformance from training sample size andother factors (and how confident would we beof its estimates)?
2 Short Answer Scoring System
In this section, we describe the basic short answerscoring system that we will use for our experiment.We believe that this system is broadly representativeof the current state of the art in short answer scor-ing. Its performance is probably slightly lower thanwhat one would find for a system highly tailored to aspecific dataset. Although features derived from au-tomatic syntactic or semantic parses might also re-sult in small improvements, we did not include suchfeatures for simplicity.
The system uses support vector regression (Smolaand Scholkopf, 2004) to estimate a model that pre-dicts human scores from vectors of binary indica-tors for linguistic features. We use the implemen-tation from the scikit-learn package (Pedregosa etal., 2011), with default parameters except for thecomplexity parameter, which is tuned using cross-validation on the data provided for training. For fea-tures, we include indicator features for the follow-ing:
• lowercased word unigrams• lowercased word bigrams• length bins (specifically, whether the log of 1
plus the number of characters in the response,rounded down to the nearest integer, equals x,for all possible x from the training set)
Note that word unigrams and bigrams include punc-tuation.
3 Datasets
We conducted experiments using responses to 44prompts from five different datasets. The data foreach of the 44 prompts was split into a training set
and a testing set. Table 1 provides an overview ofthe datasets.
The ASAP 2 dataset is from the 2012 pub-lic competition hosted on Kaggle (https://www.kaggle.com/c/asap-sas) and is pub-licly available.3 The Math and Reading 1 datasetswere developed as part of the Educational Test-ing Service’s “Cognitively Based Assessment of,for, and as Learning” research initiative (Bennett,2010).4 The Reading 2 dataset was developed aspart of the “Reading for Understanding” framework(Sabatini and O’Reilly, 2013). The Science datasetwas developed and scored as part of the KnowledgeIntegration framework (Linn, 2006). Note that onlythe ASAP 2 dataset is publicly available.
For all prompts, there are at least 359 training ex-amples (at most 2,633).
4 Experiments
For each prompt, we trained a model on the fulltraining set for that prompt and evaluated on the test-ing set. In addition, we trained models from ran-domly selected subsamples of the training set andevaluated on the full testing set. Specifically, wecreated 20 replications of samples (without replace-ment) of sizes 2n ∗ 100 (i.e., 100, 200, 400, . . . ) upto the full training sample size. We trained modelson these subsamples and evaluated each on the fulltesting set.
Following the ASAP 2 competition(https://www.kaggle.com/c/asap-sas/details/evaluation), we evaluated modelsusing quadratically weighted κ (Cohen, 1968).
For subsamples of the training data, we averagedthe results across the 20 replications before furtheranalyses. We used the Fisher Transformation z(κ)when averaging because of its variance-stabilizationproperties. The same transformation was also used
3For the ASAP 2 dataset, we used the “public leaderboard”for the testing sets.
4The math data came from the 2012 multi-state administra-tion of two multi-prompt tasks: Moving Sidewalks with 1 Rider(prompts 2a, 4a, 4b, 4d, 10b) and Moving Sidewalks with 2Riders (prompts 3a, 3b, 6a, 6b, 10, 12). The reading data fromthe 2013 multi-state administration of the following prompts:Ban Ads 1-B, 1-C, 2-C; Cash for Grades 1-B, 1-C, 2; SocialNetworking 1-B, 1-C, 2; Culture Fair 3-1; Generous Gift 3-1;and Service Learning 3-1. Zhang and Deane (under review) de-scribe the reading data in more detail.
82
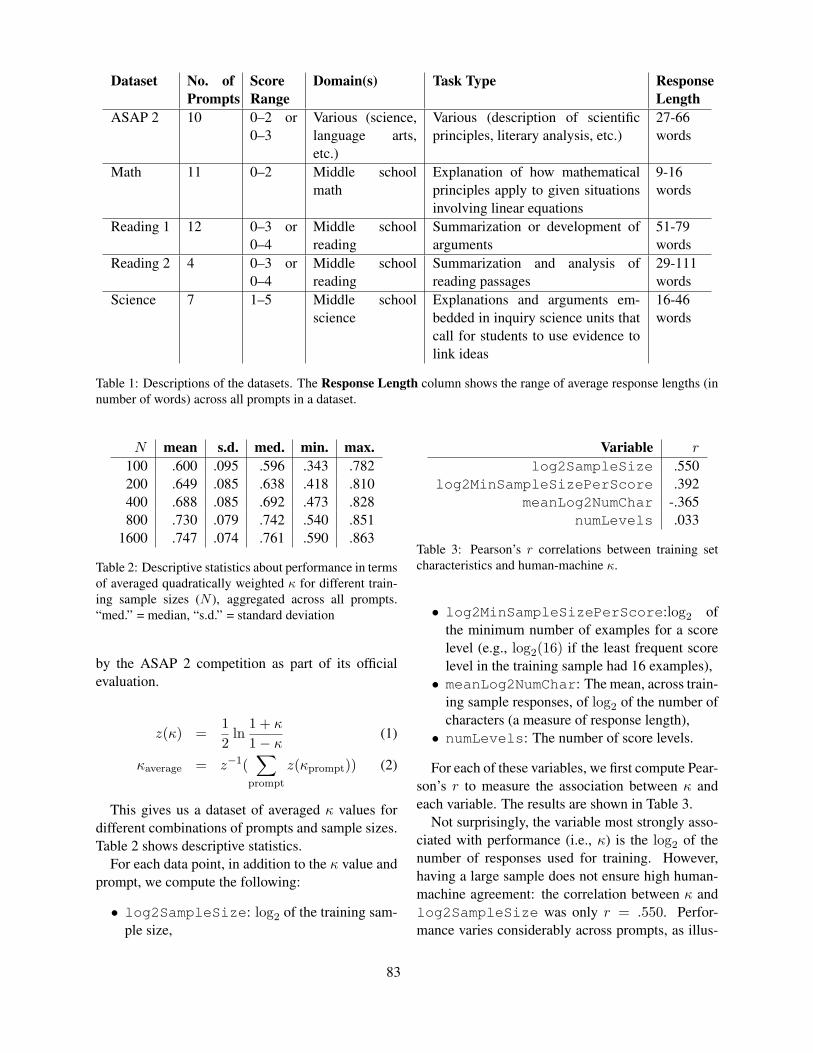
Dataset No. ofPrompts
ScoreRange
Domain(s) Task Type ResponseLength
ASAP 2 10 0–2 or0–3
Various (science,language arts,etc.)
Various (description of scientificprinciples, literary analysis, etc.)
27-66words
Math 11 0–2 Middle schoolmath
Explanation of how mathematicalprinciples apply to given situationsinvolving linear equations
9-16words
Reading 1 12 0–3 or0–4
Middle schoolreading
Summarization or development ofarguments
51-79words
Reading 2 4 0–3 or0–4
Middle schoolreading
Summarization and analysis ofreading passages
29-111words
Science 7 1–5 Middle schoolscience
Explanations and arguments em-bedded in inquiry science units thatcall for students to use evidence tolink ideas
16-46words
Table 1: Descriptions of the datasets. The Response Length column shows the range of average response lengths (innumber of words) across all prompts in a dataset.
N mean s.d. med. min. max.100 .600 .095 .596 .343 .782200 .649 .085 .638 .418 .810400 .688 .085 .692 .473 .828800 .730 .079 .742 .540 .851
1600 .747 .074 .761 .590 .863
Table 2: Descriptive statistics about performance in termsof averaged quadratically weighted κ for different train-ing sample sizes (N ), aggregated across all prompts.“med.” = median, “s.d.” = standard deviation
by the ASAP 2 competition as part of its officialevaluation.
z(κ) =12
ln1 + κ
1− κ(1)
κaverage = z−1(∑
prompt
z(κprompt)) (2)
This gives us a dataset of averaged κ values fordifferent combinations of prompts and sample sizes.Table 2 shows descriptive statistics.
For each data point, in addition to the κ value andprompt, we compute the following:
• log2SampleSize: log2 of the training sam-ple size,
Variable r
log2SampleSize .550log2MinSampleSizePerScore .392
meanLog2NumChar -.365numLevels .033
Table 3: Pearson’s r correlations between training setcharacteristics and human-machine κ.
• log2MinSampleSizePerScore:log2 ofthe minimum number of examples for a scorelevel (e.g., log2(16) if the least frequent scorelevel in the training sample had 16 examples),
• meanLog2NumChar: The mean, across train-ing sample responses, of log2 of the number ofcharacters (a measure of response length),
• numLevels: The number of score levels.
For each of these variables, we first compute Pear-son’s r to measure the association between κ andeach variable. The results are shown in Table 3.
Not surprisingly, the variable most strongly asso-ciated with performance (i.e., κ) is the log2 of thenumber of responses used for training. However,having a large sample does not ensure high human-machine agreement: the correlation between κ andlog2SampleSize was only r = .550. Perfor-mance varies considerably across prompts, as illus-
83
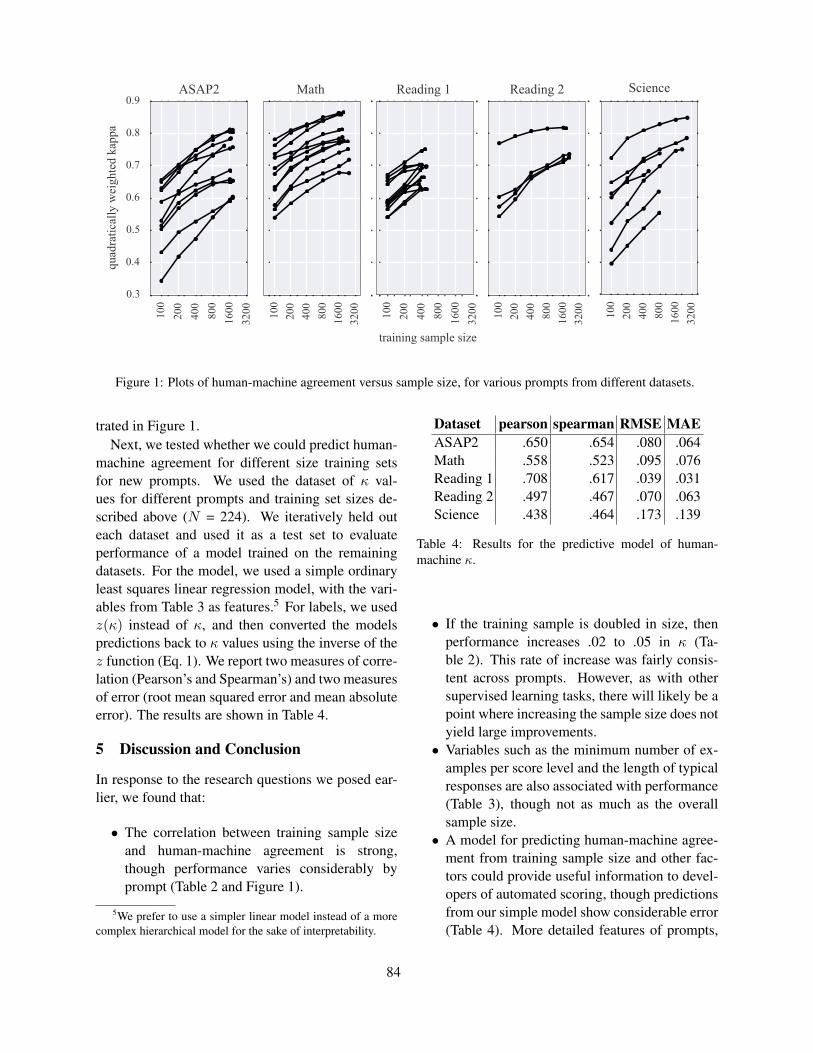
100
200
400
800
1600
3200
0.3
0.4
0.5
0.6
0.7
0.8
0.9qu
adra
tical
ly w
eigh
ted
kapp
a
Reading 1
100
200
400
800
1600
3200
Science
100
200
400
800
1600
3200
training sample size
ASAP2
100
200
400
800
1600
3200
Math
100
200
400
800
1600
3200
Reading 2
Figure 1: Plots of human-machine agreement versus sample size, for various prompts from different datasets.
trated in Figure 1.Next, we tested whether we could predict human-
machine agreement for different size training setsfor new prompts. We used the dataset of κ val-ues for different prompts and training set sizes de-scribed above (N = 224). We iteratively held outeach dataset and used it as a test set to evaluateperformance of a model trained on the remainingdatasets. For the model, we used a simple ordinaryleast squares linear regression model, with the vari-ables from Table 3 as features.5 For labels, we usedz(κ) instead of κ, and then converted the modelspredictions back to κ values using the inverse of thez function (Eq. 1). We report two measures of corre-lation (Pearson’s and Spearman’s) and two measuresof error (root mean squared error and mean absoluteerror). The results are shown in Table 4.
5 Discussion and Conclusion
In response to the research questions we posed ear-lier, we found that:
• The correlation between training sample sizeand human-machine agreement is strong,though performance varies considerably byprompt (Table 2 and Figure 1).
5We prefer to use a simpler linear model instead of a morecomplex hierarchical model for the sake of interpretability.
Dataset pearson spearman RMSE MAEASAP2 .650 .654 .080 .064Math .558 .523 .095 .076Reading 1 .708 .617 .039 .031Reading 2 .497 .467 .070 .063Science .438 .464 .173 .139
Table 4: Results for the predictive model of human-machine κ.
• If the training sample is doubled in size, thenperformance increases .02 to .05 in κ (Ta-ble 2). This rate of increase was fairly consis-tent across prompts. However, as with othersupervised learning tasks, there will likely be apoint where increasing the sample size does notyield large improvements.
• Variables such as the minimum number of ex-amples per score level and the length of typicalresponses are also associated with performance(Table 3), though not as much as the overallsample size.
• A model for predicting human-machine agree-ment from training sample size and other fac-tors could provide useful information to devel-opers of automated scoring, though predictionsfrom our simple model show considerable error(Table 4). More detailed features of prompts,
84

scoring rubrics, and student populations mightlead to better predictions.
In this paper, we investigated the impact of train-ing sample size on short answer scoring perfor-mance. Our results should help researchers andpractitioners of automated scoring answer the highlypractical question, “How much data do I need to getgood performance?”, for new short answer prompts.We conducted our experiments using a basic sys-tem with only n-gram and length features, thoughit is likely that the observed trends (e.g., the rate ofincrease in κ with more data) would be similar formany other systems. Future work could explore is-sues such as how much performance varies by tasktype or by the amount of linguistic variation in re-sponses at particular score levels.
Acknowledgements
We would like to thank Randy Bennett, Kietha Big-gers, Libby Gerard, Rene Lawless, Marcia Linn, Ly-dia Liu, and John Sabatini for providing us with thevarious datasets used in this paper. We would alsolike to thank Aoife Cahill and Martin Chodorow fortheir help with the research. Some of the materialused here is based upon work supported by the Na-tional Science Foundation under Grant No. 1119670and by the Institute of Education Sciences, U.S. De-partment of Education, under Grant R305F100005.Any opinions, findings, conclusions, or recommen-dations expressed in this material are those of the au-thors and do not necessarily reflect the views of theNational Science Foundation, the Institute of Educa-tion Sciences, or the U.S. Department of Education.
References
Randy Elliot Bennett. 2010. Cognitively based assess-ment of, for, and as learning (CBAL): A preliminarytheory of action for summative and formative assess-ment. Measurement: Interdisciplinary Research andPerspectives, 8(2–3):70–91.
J. Cohen. 1968. Weighted kappa: Nominal scale agree-ment with provision for scaled disagreement or partialcredit. Psychological Bulletin, 70(4).
Myroslava Dzikovska, Rodney Nielsen, Chris Brew,Claudia Leacock, Danilo Giampiccolo, Luisa Ben-tivogli, Peter Clark, Ido Dagan, and Hoa Trang Dang.
2013. SemEval-2013 Task 7: The Joint Student Re-sponse Analysis and 8th Recognizing Textual Entail-ment Challenge. In Second Joint Conference on Lexi-cal and Computational Semantics (*SEM), Volume 2:Proceedings of the Seventh International Workshop onSemantic Evaluation (SemEval 2013), pages 263–274,Atlanta, Georgia, USA, June.
C. Leacock and M. Chodorow. 2003. c-rater: Scoring ofshort-answer questions. Computers and the Humani-ties, 37.
Marcia C. Linn. 2006. The Knowledge Integration Per-spective on Learning and Instruction. Cambridge Uni-versity Press, Cambridge, MA.
Michael Mohler, Razvan Bunescu, and Rada Mihalcea.2011. Learning to Grade Short Answer Questionsusing Semantic Similarity Measures and DependencyGraph Alignments. In Proceedings of ACL:HLT,pages 752–762, Portland, Oregon, USA, June.
Rodney D. Nielsen, Wayne Ward, and James H. Martin.2008. Classification Errors in a Domain-IndependentAssessment System. In Proceedings of the ThirdWorkshop on Innovative Use of NLP for Building Edu-cational Applications, pages 10–18, Columbus, Ohio,June.
F. Pedregosa, G. Varoquaux, A. Gramfort, V. Michel,B. Thirion, O. Grisel, M. Blondel, P. Prettenhofer,R. Weiss, V. Dubourg, J. Vanderplas, A. Passos,D. Cournapeau, M. Brucher, M. Perrot, and E. Duches-nay. 2011. Scikit-learn: Machine learning in Python.Journal of Machine Learning Research, 12:2825–2830.
J. Sabatini and T. O’Reilly. 2013. Rationale for a newgeneration of reading comprehension assessments. InB. Miller, L. Cutting, and P. McCardle, editors, Un-raveling Reading Comprehension: Behavioral, Neu-robiological and Genetic Components. Paul H. BrooksPublishing Co.
Keisuke Sakaguchi, Michael Heilman, and Nitin Mad-nani. 2015. Effective Feature Integration for Au-tomated Short Answer Scoring. In Proceedings ofNAACL, Denver, Colorado, USA.
Alex J. Smola and Bernhard Scholkopf. 2004. A Tutorialon Support Vector Regression. Statistics and Comput-ing, 14(3):199–222.
Mo Zhang and Paul Deane. under review. Generaliz-ing automated scoring models in writing assessments.Submitted to the ETS Research Report Series.
85
Proceedings of the Tenth Workshop on Innovative Use of NLP for Building Educational Applications, 2015, pages 86–96,Denver, Colorado, June 4, 2015. c©2015 Association for Computational Linguistics
Interpreting Questions with a Log-Linear Ranking Modelin a Virtual Patient Dialogue System
Evan Jaffe and Michael White and William SchulerThe Ohio State UniversityDepartment of Linguistics
[email protected]{mwhite,schuler}@ling.osu.edu
Eric Fosler-LussierThe Ohio State University
Dept. of Computer Science and [email protected]
Alex RosenfeldUniversity of Texas at Austin
Department of [email protected]
Douglas DanforthThe Ohio State University
Department of Family [email protected]
Abstract
We present a log-linear ranking model for in-terpreting questions in a virtual patient dia-logue system and demonstrate that it substan-tially outperforms a more typical multiclassclassifier model using the same information.The full model makes use of weighted andconcept-based matching features that togetheryield a 15% error reduction over a strong lex-ical overlap baseline. The accuracy of theranking model approaches that of an exten-sively handcrafted pattern matching system,promising to reduce the authoring burden andmake it possible to use confidence estimationin choosing dialogue acts; at the same time,the effectiveness of the concept-based featuresindicates that manual development resourcescan be productively employed with the ap-proach in developing concept hierarchies.
1 Introduction
In this paper, we present a log-linear ranking modelfor interpreting questions in a virtual patient dia-logue system, along with initial experiments to de-termine effective sets of features with this model.
Learning to take a medical history is fundamentalto becoming a successful physician. Most methodsfor assessing history taking skills involve interactionwith Standardized Patients (SP) who are actors por-traying real patients. SP interviews are effective,but they require significant faculty effort and insti-tutional support. As an alternative, virtual standard-ized patients (VSPs) can be valuable tools that offera practical and accessible means of simulating stan-dardized patient encounters. VSP simulations have
the potential to allow students to practice their com-munication and history taking skills before workingwith Standardized Patients. Students can rehearseinterviewing skills in a risk-free environment, pro-viding additional opportunities for practice prior tostandardized or real-world patient encounters.
Our VSP system closely models the interactionbetween doctors and patients. Our virtual patientsare avatars representing standardized patients thatstudents can interview and communicate with us-ing natural language. Students take a medical his-tory and develop a differential diagnosis of the vir-tual standardized patient, much as they would a stan-dardized or actual patient. As shown in Figure 1, thedialogue system is embedded in an immersive learn-ing environment designed to provide student doctorswith a sense of presence, allowing them to “suspenddisbelief” and behave as if the virtual patient is a realpatient. The virtual world platform can be run in avariety of environments; here we focus on text-basedinteraction for laptops and mobile devices.
The current task is a question matching paradigmwhere user input is mapped to a set of predefinedquestions, which have scripted answers created bycontent authors, as in much previous work on ques-tion answering systems (Leuski and Traum, 2011).This approach allows for easier authoring than, forexample, systems that use deep natural languageunderstanding (Dzikovska et al., 2012; Dzikovskaet al., 2013) or semantic parsing (Artzi and Zettle-moyer, 2013; Berant and Liang, 2014), and yet stillachieves the desired learning objectives of the vir-tual patient system.
To date, the VSP system has been based on the
86
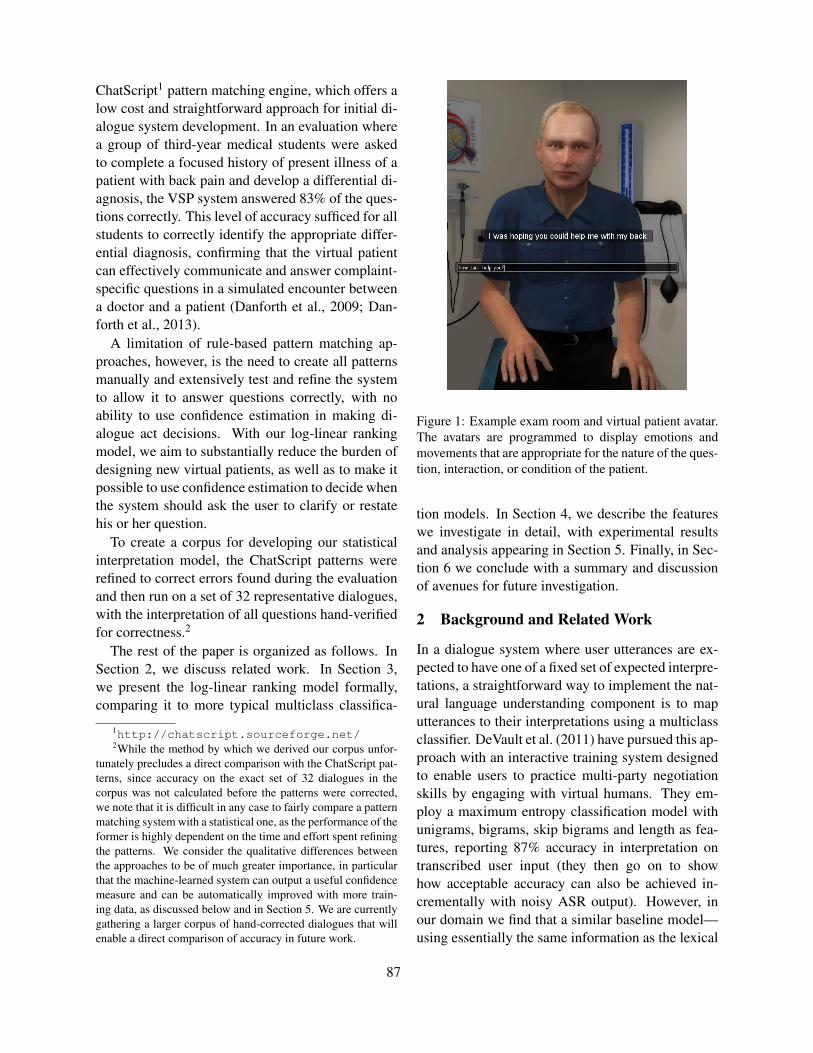
ChatScript1 pattern matching engine, which offers alow cost and straightforward approach for initial di-alogue system development. In an evaluation wherea group of third-year medical students were askedto complete a focused history of present illness of apatient with back pain and develop a differential di-agnosis, the VSP system answered 83% of the ques-tions correctly. This level of accuracy sufficed for allstudents to correctly identify the appropriate differ-ential diagnosis, confirming that the virtual patientcan effectively communicate and answer complaint-specific questions in a simulated encounter betweena doctor and a patient (Danforth et al., 2009; Dan-forth et al., 2013).
A limitation of rule-based pattern matching ap-proaches, however, is the need to create all patternsmanually and extensively test and refine the systemto allow it to answer questions correctly, with noability to use confidence estimation in making di-alogue act decisions. With our log-linear rankingmodel, we aim to substantially reduce the burden ofdesigning new virtual patients, as well as to make itpossible to use confidence estimation to decide whenthe system should ask the user to clarify or restatehis or her question.
To create a corpus for developing our statisticalinterpretation model, the ChatScript patterns wererefined to correct errors found during the evaluationand then run on a set of 32 representative dialogues,with the interpretation of all questions hand-verifiedfor correctness.2
The rest of the paper is organized as follows. InSection 2, we discuss related work. In Section 3,we present the log-linear ranking model formally,comparing it to more typical multiclass classifica-
1http://chatscript.sourceforge.net/2While the method by which we derived our corpus unfor-
tunately precludes a direct comparison with the ChatScript pat-terns, since accuracy on the exact set of 32 dialogues in thecorpus was not calculated before the patterns were corrected,we note that it is difficult in any case to fairly compare a patternmatching system with a statistical one, as the performance of theformer is highly dependent on the time and effort spent refiningthe patterns. We consider the qualitative differences betweenthe approaches to be of much greater importance, in particularthat the machine-learned system can output a useful confidencemeasure and can be automatically improved with more train-ing data, as discussed below and in Section 5. We are currentlygathering a larger corpus of hand-corrected dialogues that willenable a direct comparison of accuracy in future work.
Figure 1: Example exam room and virtual patient avatar.The avatars are programmed to display emotions andmovements that are appropriate for the nature of the ques-tion, interaction, or condition of the patient.
tion models. In Section 4, we describe the featureswe investigate in detail, with experimental resultsand analysis appearing in Section 5. Finally, in Sec-tion 6 we conclude with a summary and discussionof avenues for future investigation.
2 Background and Related Work
In a dialogue system where user utterances are ex-pected to have one of a fixed set of expected interpre-tations, a straightforward way to implement the nat-ural language understanding component is to maputterances to their interpretations using a multiclassclassifier. DeVault et al. (2011) have pursued this ap-proach with an interactive training system designedto enable users to practice multi-party negotiationskills by engaging with virtual humans. They em-ploy a maximum entropy classification model withunigrams, bigrams, skip bigrams and length as fea-tures, reporting 87% accuracy in interpretation ontranscribed user input (they then go on to showhow acceptable accuracy can also be achieved in-crementally with noisy ASR output). However, inour domain we find that a similar baseline model—using essentially the same information as the lexical
87
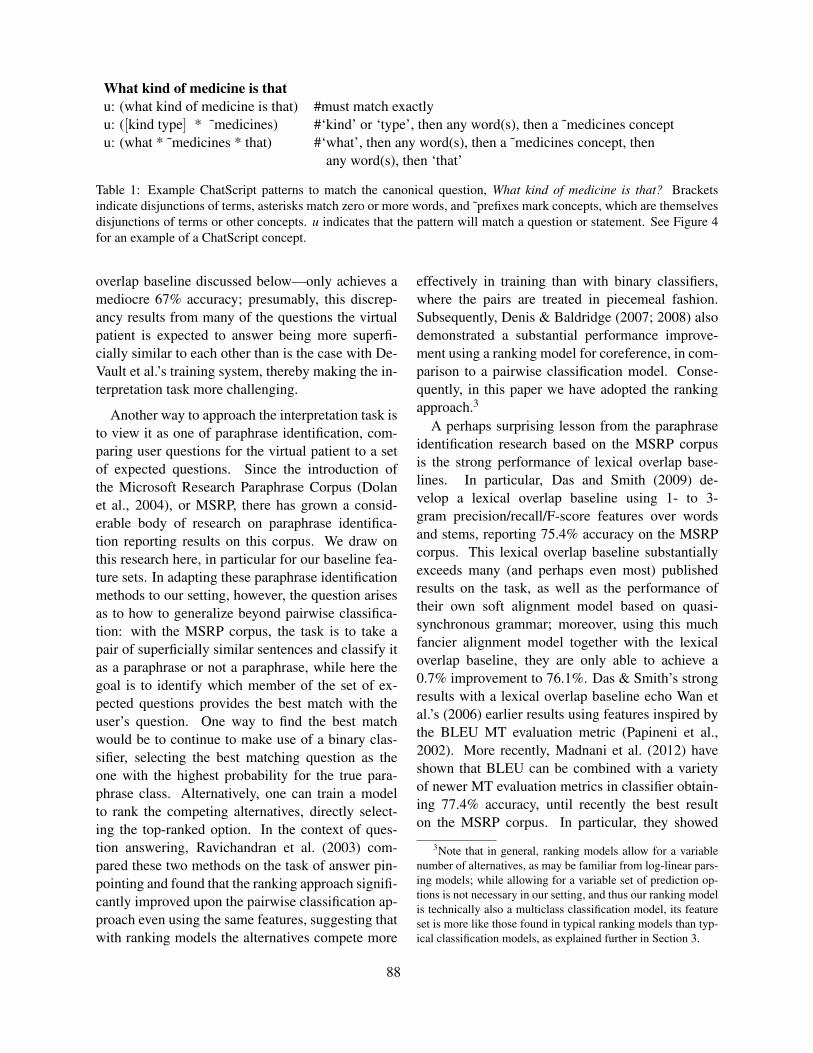
What kind of medicine is thatu: (what kind of medicine is that) #must match exactlyu: ([kind type] * ˜medicines) #‘kind’ or ‘type’, then any word(s), then a ˜medicines conceptu: (what * ˜medicines * that) #‘what’, then any word(s), then a ˜medicines concept, then
any word(s), then ‘that’
Table 1: Example ChatScript patterns to match the canonical question, What kind of medicine is that? Bracketsindicate disjunctions of terms, asterisks match zero or more words, and ˜prefixes mark concepts, which are themselvesdisjunctions of terms or other concepts. u indicates that the pattern will match a question or statement. See Figure 4for an example of a ChatScript concept.
overlap baseline discussed below—only achieves amediocre 67% accuracy; presumably, this discrep-ancy results from many of the questions the virtualpatient is expected to answer being more superfi-cially similar to each other than is the case with De-Vault et al.’s training system, thereby making the in-terpretation task more challenging.
Another way to approach the interpretation task isto view it as one of paraphrase identification, com-paring user questions for the virtual patient to a setof expected questions. Since the introduction ofthe Microsoft Research Paraphrase Corpus (Dolanet al., 2004), or MSRP, there has grown a consid-erable body of research on paraphrase identifica-tion reporting results on this corpus. We draw onthis research here, in particular for our baseline fea-ture sets. In adapting these paraphrase identificationmethods to our setting, however, the question arisesas to how to generalize beyond pairwise classifica-tion: with the MSRP corpus, the task is to take apair of superficially similar sentences and classify itas a paraphrase or not a paraphrase, while here thegoal is to identify which member of the set of ex-pected questions provides the best match with theuser’s question. One way to find the best matchwould be to continue to make use of a binary clas-sifier, selecting the best matching question as theone with the highest probability for the true para-phrase class. Alternatively, one can train a modelto rank the competing alternatives, directly select-ing the top-ranked option. In the context of ques-tion answering, Ravichandran et al. (2003) com-pared these two methods on the task of answer pin-pointing and found that the ranking approach signifi-cantly improved upon the pairwise classification ap-proach even using the same features, suggesting thatwith ranking models the alternatives compete more
effectively in training than with binary classifiers,where the pairs are treated in piecemeal fashion.Subsequently, Denis & Baldridge (2007; 2008) alsodemonstrated a substantial performance improve-ment using a ranking model for coreference, in com-parison to a pairwise classification model. Conse-quently, in this paper we have adopted the rankingapproach.3
A perhaps surprising lesson from the paraphraseidentification research based on the MSRP corpusis the strong performance of lexical overlap base-lines. In particular, Das and Smith (2009) de-velop a lexical overlap baseline using 1- to 3-gram precision/recall/F-score features over wordsand stems, reporting 75.4% accuracy on the MSRPcorpus. This lexical overlap baseline substantiallyexceeds many (and perhaps even most) publishedresults on the task, as well as the performance oftheir own soft alignment model based on quasi-synchronous grammar; moreover, using this muchfancier alignment model together with the lexicaloverlap baseline, they are only able to achieve a0.7% improvement to 76.1%. Das & Smith’s strongresults with a lexical overlap baseline echo Wan etal.’s (2006) earlier results using features inspired bythe BLEU MT evaluation metric (Papineni et al.,2002). More recently, Madnani et al. (2012) haveshown that BLEU can be combined with a varietyof newer MT evaluation metrics in classifier obtain-ing 77.4% accuracy, until recently the best resulton the MSRP corpus. In particular, they showed
3Note that in general, ranking models allow for a variablenumber of alternatives, as may be familiar from log-linear pars-ing models; while allowing for a variable set of prediction op-tions is not necessary in our setting, and thus our ranking modelis technically also a multiclass classification model, its featureset is more like those found in typical ranking models than typ-ical classification models, as explained further in Section 3.
88
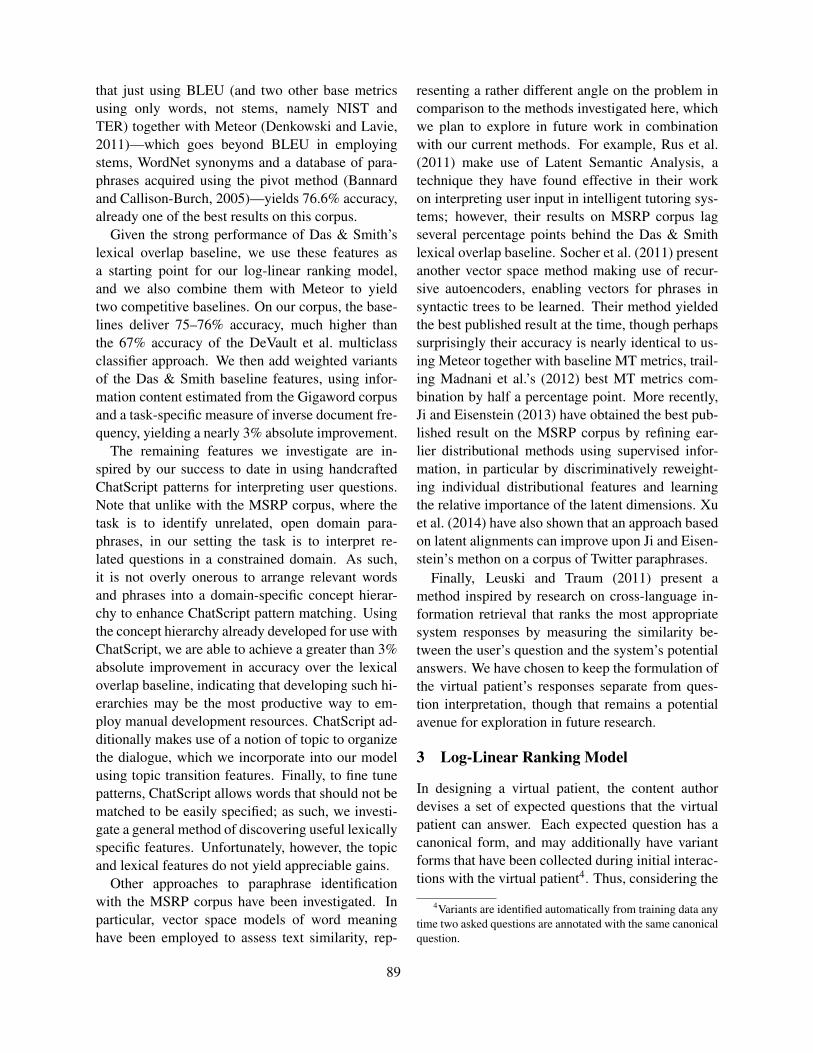
that just using BLEU (and two other base metricsusing only words, not stems, namely NIST andTER) together with Meteor (Denkowski and Lavie,2011)—which goes beyond BLEU in employingstems, WordNet synonyms and a database of para-phrases acquired using the pivot method (Bannardand Callison-Burch, 2005)—yields 76.6% accuracy,already one of the best results on this corpus.
Given the strong performance of Das & Smith’slexical overlap baseline, we use these features asa starting point for our log-linear ranking model,and we also combine them with Meteor to yieldtwo competitive baselines. On our corpus, the base-lines deliver 75–76% accuracy, much higher thanthe 67% accuracy of the DeVault et al. multiclassclassifier approach. We then add weighted variantsof the Das & Smith baseline features, using infor-mation content estimated from the Gigaword corpusand a task-specific measure of inverse document fre-quency, yielding a nearly 3% absolute improvement.
The remaining features we investigate are in-spired by our success to date in using handcraftedChatScript patterns for interpreting user questions.Note that unlike with the MSRP corpus, where thetask is to identify unrelated, open domain para-phrases, in our setting the task is to interpret re-lated questions in a constrained domain. As such,it is not overly onerous to arrange relevant wordsand phrases into a domain-specific concept hierar-chy to enhance ChatScript pattern matching. Usingthe concept hierarchy already developed for use withChatScript, we are able to achieve a greater than 3%absolute improvement in accuracy over the lexicaloverlap baseline, indicating that developing such hi-erarchies may be the most productive way to em-ploy manual development resources. ChatScript ad-ditionally makes use of a notion of topic to organizethe dialogue, which we incorporate into our modelusing topic transition features. Finally, to fine tunepatterns, ChatScript allows words that should not bematched to be easily specified; as such, we investi-gate a general method of discovering useful lexicallyspecific features. Unfortunately, however, the topicand lexical features do not yield appreciable gains.
Other approaches to paraphrase identificationwith the MSRP corpus have been investigated. Inparticular, vector space models of word meaninghave been employed to assess text similarity, rep-
resenting a rather different angle on the problem incomparison to the methods investigated here, whichwe plan to explore in future work in combinationwith our current methods. For example, Rus et al.(2011) make use of Latent Semantic Analysis, atechnique they have found effective in their workon interpreting user input in intelligent tutoring sys-tems; however, their results on MSRP corpus lagseveral percentage points behind the Das & Smithlexical overlap baseline. Socher et al. (2011) presentanother vector space method making use of recur-sive autoencoders, enabling vectors for phrases insyntactic trees to be learned. Their method yieldedthe best published result at the time, though perhapssurprisingly their accuracy is nearly identical to us-ing Meteor together with baseline MT metrics, trail-ing Madnani et al.’s (2012) best MT metrics com-bination by half a percentage point. More recently,Ji and Eisenstein (2013) have obtained the best pub-lished result on the MSRP corpus by refining ear-lier distributional methods using supervised infor-mation, in particular by discriminatively reweight-ing individual distributional features and learningthe relative importance of the latent dimensions. Xuet al. (2014) have also shown that an approach basedon latent alignments can improve upon Ji and Eisen-stein’s methon on a corpus of Twitter paraphrases.
Finally, Leuski and Traum (2011) present amethod inspired by research on cross-language in-formation retrieval that ranks the most appropriatesystem responses by measuring the similarity be-tween the user’s question and the system’s potentialanswers. We have chosen to keep the formulation ofthe virtual patient’s responses separate from ques-tion interpretation, though that remains a potentialavenue for exploration in future research.
3 Log-Linear Ranking Model
In designing a virtual patient, the content authordevises a set of expected questions that the virtualpatient can answer. Each expected question has acanonical form, and may additionally have variantforms that have been collected during initial interac-tions with the virtual patient4. Thus, considering the
4Variants are identified automatically from training data anytime two asked questions are annotated with the same canonicalquestion.
89
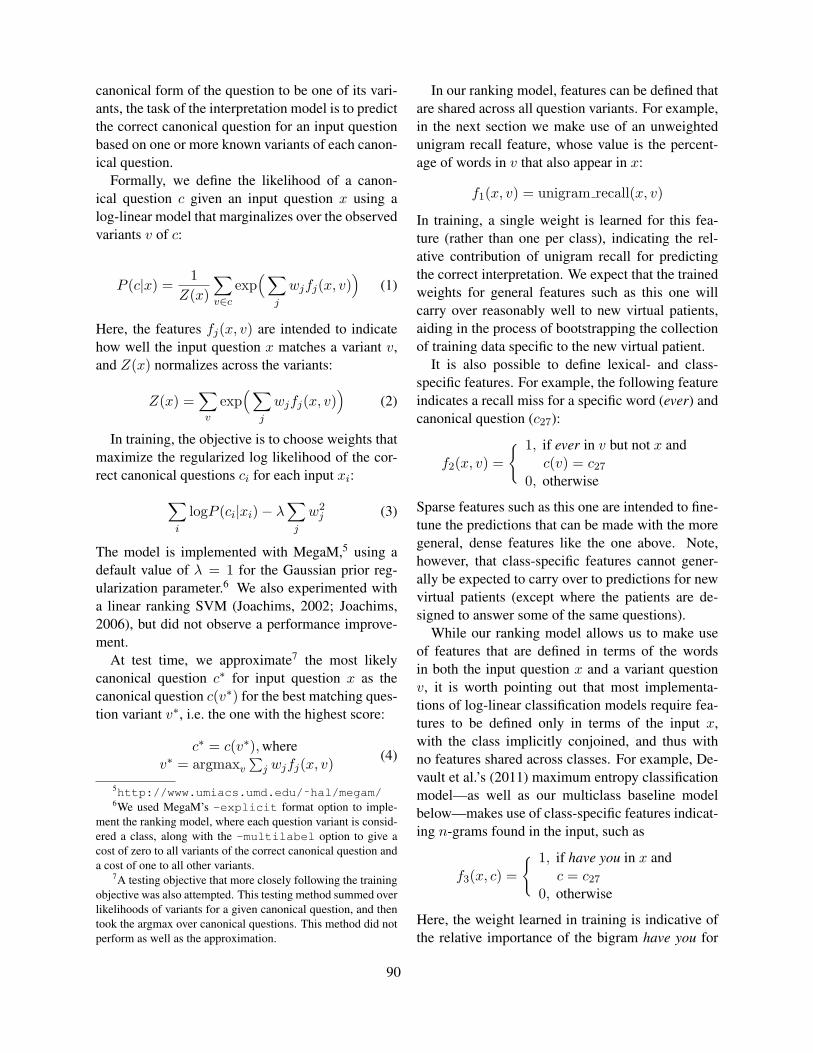
canonical form of the question to be one of its vari-ants, the task of the interpretation model is to predictthe correct canonical question for an input questionbased on one or more known variants of each canon-ical question.
Formally, we define the likelihood of a canon-ical question c given an input question x using alog-linear model that marginalizes over the observedvariants v of c:
P (c|x) =1
Z(x)
∑v∈c
exp(∑
j
wjfj(x, v))
(1)
Here, the features fj(x, v) are intended to indicatehow well the input question x matches a variant v,and Z(x) normalizes across the variants:
Z(x) =∑v
exp(∑
j
wjfj(x, v))
(2)
In training, the objective is to choose weights thatmaximize the regularized log likelihood of the cor-rect canonical questions ci for each input xi:∑
i
logP (ci|xi)− λ∑j
w2j (3)
The model is implemented with MegaM,5 using adefault value of λ = 1 for the Gaussian prior reg-ularization parameter.6 We also experimented witha linear ranking SVM (Joachims, 2002; Joachims,2006), but did not observe a performance improve-ment.
At test time, we approximate7 the most likelycanonical question c∗ for input question x as thecanonical question c(v∗) for the best matching ques-tion variant v∗, i.e. the one with the highest score:
c∗ = c(v∗),wherev∗ = argmaxv
∑j wjfj(x, v)
(4)
5http://www.umiacs.umd.edu/˜hal/megam/6We used MegaM’s -explicit format option to imple-
ment the ranking model, where each question variant is consid-ered a class, along with the -multilabel option to give acost of zero to all variants of the correct canonical question anda cost of one to all other variants.
7A testing objective that more closely following the trainingobjective was also attempted. This testing method summed overlikelihoods of variants for a given canonical question, and thentook the argmax over canonical questions. This method did notperform as well as the approximation.
In our ranking model, features can be defined thatare shared across all question variants. For example,in the next section we make use of an unweightedunigram recall feature, whose value is the percent-age of words in v that also appear in x:
f1(x, v) = unigram recall(x, v)
In training, a single weight is learned for this fea-ture (rather than one per class), indicating the rel-ative contribution of unigram recall for predictingthe correct interpretation. We expect that the trainedweights for general features such as this one willcarry over reasonably well to new virtual patients,aiding in the process of bootstrapping the collectionof training data specific to the new virtual patient.
It is also possible to define lexical- and class-specific features. For example, the following featureindicates a recall miss for a specific word (ever) andcanonical question (c27):
f2(x, v) =
{ 1, if ever in v but not x andc(v) = c27
0, otherwise
Sparse features such as this one are intended to fine-tune the predictions that can be made with the moregeneral, dense features like the one above. Note,however, that class-specific features cannot gener-ally be expected to carry over to predictions for newvirtual patients (except where the patients are de-signed to answer some of the same questions).
While our ranking model allows us to make useof features that are defined in terms of the wordsin both the input question x and a variant questionv, it is worth pointing out that most implementa-tions of log-linear classification models require fea-tures to be defined only in terms of the input x,with the class implicitly conjoined, and thus withno features shared across classes. For example, De-vault et al.’s (2011) maximum entropy classificationmodel—as well as our multiclass baseline modelbelow—makes use of class-specific features indicat-ing n-grams found in the input, such as
f3(x, c) =
{ 1, if have you in x andc = c27
0, otherwise
Here, the weight learned in training is indicative ofthe relative importance of the bigram have you for
90

predicting a specific class, i.e. the one for canonicalquestion c27. As noted above, such class-specificfeatures cannot generally be expected to carry overto predictions for new virtual patients, and thus amodel consisting of only such features will be of lit-tle value for new virtual patients.
4 Features
The features described below are used to create fea-ture subsets evaluated as models. Precision and re-call features are defined as being relative to eitherthe asked question or the compared question, respec-tively. Precision n-gram features, for example, arethe ratio of matched n-grams to total n-grams in theasked question. Matching can happen at the exact,stem, concept, or Meteor alignment level.
AlignScore the overall Meteor alignment score
LexOverlap 1- to 3-gram exact/stem unweightedprecision/recall/F-score features inspired byDas and Smith
Weighting 1- and 2-gram exact and stem lexicaloverlap features weighted by IDF and InfoCon-tent
Meteor 1- and 2-gram IDF/InfoContent weightedprecision/recall, matched on Meteor align-ments
Concept paraphrase-type features based on stem n-gram overlap, but using the concept hierar-chy to add further equivalences. Includes 1-and 2-gram precision/recall, weighted and un-weighted.
Lex lexical exact match features, as well asprecision/recall miss and canonical question-specific precision/recall misses
Topic topic start and transition features
Inverse document frequency weighting is imple-mented by taking the canonical question and its vari-ants as a document. A gram is weighted based on itsfrequency in documents, where a gram that only oc-curs in one or a few documents is more informativethan a word that occurs in many documents.
IDF(w) = log((N + 1)/(count(w) + 1))
concept: ˜medicines [˜drugs legal analgesia antibi-otics antidote claritin drug drugs hormone hormonalloratidine medication medications medicine medsnarcotic ‘pain killer’ ‘pain killers’ painkiller pill pre-scription ‘prescription medication’ ‘prescription med-ications’ remedy steroid tablet tums]
Figure 2: An example ChatScript concept. The˜medicines concept is defined in the figure, where antibi-otics is an instance of medicines, and ˜drugs legal is asubconcept of ˜medicines. Each concept is defined as adisjunction of terms, and can include subconcepts.
Asked: what kind of medicine is thatCompared: what type of tablet would that be
Asked: what ~anon of ~medicines is thatCompared: what ~anon of ~medicines would that be
Figure 3: Example sentence pair and derived conceptn-gram sequence. The words kind and type match inan anonymous concept (indicated here as ˜anon) derivedfrom a ChatScript pattern, while the words medicine andtablet match under the ˜medicines concept.
N is the total number of documents and count(w)is the number of documents the gram w appears in.
InfoContent weighting uses negative log probabil-ities of the Gigaword corpus. For bigrams, weight-ing is calculated as the product of probabilities of aunigram with the conditional probability of the sub-sequent gram, using Katz backoff.
Concept features are lexical overlap features thatuse domain-specific knowledge to allow for match-ing on more words than the exact or stem level.Concept matches occur when a stem matches an-other stem in a ChatScript concept hierarchy, de-fined by content authors as labeled classes of equiv-alent words or phrases.
See Figure 4 for an example. Concepts are used inChatscript to increase generalizability of the matchpatterns and reduce authoring burden. To calculateconcept features, stems are replaced with the con-cept name if the stem in the question is listed undera concept in the hierarchy.
Figure 3 shows an example sentence pair and itsresulting concept n-gram sequence, given conceptsthat include kind and type in an anonymous con-cept (i.e., an unlabeled disjunction) in one of theChatScript patterns, along with the words medicine
91

Lex:::whatLex:::ofLex:::thatLexMissPrec:::kindLexMissPrec:::medicineLexMissRec:::typeLexMissRec:::tabletLexMissRec:::wouldLexMissRec:::beLexMissRecClass:::what_kind_of_tablet_would_that_be:::tabletLexMissRecClass:::what_kind_of_tablet_would_that_be:::wouldLexMissRecClass:::what_kind_of_tablet_would_that_be:::be
Figure 4: Example lexical features. These binary featuresfire in the presence (or absence, in the case of a Miss) ofa specific word. Prec and Rec miss features fire whena word appears in one question, but not the other, andis defined in both directions. Here, LexMissPrec:::kindfires because kind appears in the asked question, but notthe compared question. Class miss features define lexicalmisses that are specific to a canonical question, and aresimilarly defined with Prec and Rec to refer to the askedand compared question, respectively.
and tablet being included under the medicines topic.Lexical overlap features are then computed on thisconcept-level n-gram sequence.
Lexical features are binary features that includean exact match or miss. A canonical question-specific miss feature is implemented for precisionand recall. See Figure 4 for example lexical fea-tures and descriptions, using the running examplesentence pair from the concept features.
Topic features keep track of the topic at each pointin the dialogue. They include binary transition fea-tures that track the current and previous topic, or elsethe current start topic in the case of the first line of adialogue. For example, Figure 5 shows the featuresgenerated from three example training data. Theprevious topics are taken from the gold annotationduring training and testing. If automatically classi-fied values were used instead of this oracle setting,performance would likely not suffer greatly, giventhat these features were not found to be very infor-mative and low weights were learned during train-ing.
5 Experiments
The corpus consists of 32 dialogues, which include918 user turns, with a mean dialogue length of 29turns. For each turn, the asked question, canonicalquestion, current topic and a question response are
Asked Correct Topic1. hello, mr. covington hello ~openingdialogue 2. What brings you in today what brings you in today ~chiefcomplaint3. Any health problems what brings you in today ~chiefcomplaint
1. TOPICSTART:::~openingdialogue2. TOPICTRANS:::~openingdialogue:::~chiefcomplaint3. SAMETOPIC
Figure 5: Example topic features
annotated. 193 total canonical questions were cre-ated by content authors as the fixed set of classes.Correct canonical questions were obtained by run-ning ChatScript, then hand-correcting the output.Any asked questions annotated with the same canon-ical question are considered variants of that canon-ical question. There are 787 variants, with a meanof 4.1 variants (standard deviation 4.7) per canoni-cal question. The median number of variants is 2.0,and the maximum number is 34.0.
System accuracy is measured by outputting thecorrect canonical question, given an input question.Cross-fold validation is run on a per-dialogue ba-sis.Total system accuracy is measured as the meanover all individual cross-fold accuracies.
Results of system accuracy by model are shownin Table 2. The weighted, concept-based, topic-based, and lexical features model (Full-no-meteor)shows a significant improvement over the LexOver-lap baseline model, using a McNemar paired chi-square test (chi-square=16.5, p=4.86e-05). At anoverall accuracy of 78.6%, this represents an er-ror reduction of 15% over the baseline and ap-proaches the performance of the handcrafted pat-terns. Of interest, the LexOverlap+concept showsa significant improvement over LexOverlap alone(chi-square=18.3, p=1.95e-05). Meteor features donot show a significant difference when comparingthe Full vs. Full-no-meteor model (chi-square=3.2,p=.073), indicating that the concept-based featureslargely suffice to supply the information providedby WordNet synsets and pivot-method paraphrasesin Meteor.
Training with variants as acceptable matches is auseful strategy for this domain, reducing error by47%, as compared to training without variants. Thisallows for comparison at test time to not only the
92
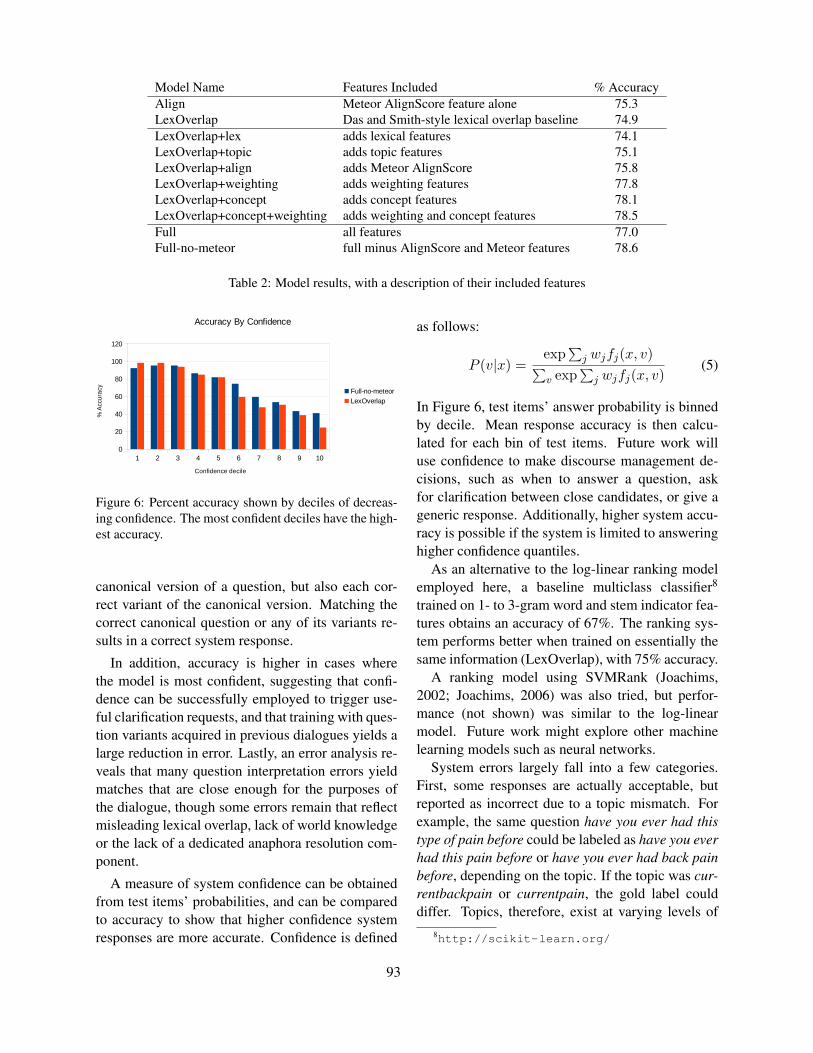
Model Name Features Included % AccuracyAlign Meteor AlignScore feature alone 75.3LexOverlap Das and Smith-style lexical overlap baseline 74.9LexOverlap+lex adds lexical features 74.1LexOverlap+topic adds topic features 75.1LexOverlap+align adds Meteor AlignScore 75.8LexOverlap+weighting adds weighting features 77.8LexOverlap+concept adds concept features 78.1LexOverlap+concept+weighting adds weighting and concept features 78.5Full all features 77.0Full-no-meteor full minus AlignScore and Meteor features 78.6
Table 2: Model results, with a description of their included featuresSheet1
Page 1
Full-no-meteor LexOverlap92.5 98.595.5 98.595.5 9486.6 85.182.1 82.174.6 59.759.7 47.853.7 50.743.3 38.841.1 24.7
1 2 3 4 5 6 7 8 9 100
20
40
60
80
100
120
Accuracy By Confidence
Full-no-meteor
LexOverlap
Confidence decile
% A
ccu
racy
Figure 6: Percent accuracy shown by deciles of decreas-ing confidence. The most confident deciles have the high-est accuracy.
canonical version of a question, but also each cor-rect variant of the canonical version. Matching thecorrect canonical question or any of its variants re-sults in a correct system response.
In addition, accuracy is higher in cases wherethe model is most confident, suggesting that confi-dence can be successfully employed to trigger use-ful clarification requests, and that training with ques-tion variants acquired in previous dialogues yields alarge reduction in error. Lastly, an error analysis re-veals that many question interpretation errors yieldmatches that are close enough for the purposes ofthe dialogue, though some errors remain that reflectmisleading lexical overlap, lack of world knowledgeor the lack of a dedicated anaphora resolution com-ponent.
A measure of system confidence can be obtainedfrom test items’ probabilities, and can be comparedto accuracy to show that higher confidence systemresponses are more accurate. Confidence is defined
as follows:
P (v|x) =exp
∑j wjfj(x, v)∑
v exp∑
j wjfj(x, v)(5)
In Figure 6, test items’ answer probability is binnedby decile. Mean response accuracy is then calcu-lated for each bin of test items. Future work willuse confidence to make discourse management de-cisions, such as when to answer a question, askfor clarification between close candidates, or give ageneric response. Additionally, higher system accu-racy is possible if the system is limited to answeringhigher confidence quantiles.
As an alternative to the log-linear ranking modelemployed here, a baseline multiclass classifier8
trained on 1- to 3-gram word and stem indicator fea-tures obtains an accuracy of 67%. The ranking sys-tem performs better when trained on essentially thesame information (LexOverlap), with 75% accuracy.
A ranking model using SVMRank (Joachims,2002; Joachims, 2006) was also tried, but perfor-mance (not shown) was similar to the log-linearmodel. Future work might explore other machinelearning models such as neural networks.
System errors largely fall into a few categories.First, some responses are actually acceptable, butreported as incorrect due to a topic mismatch. Forexample, the same question have you ever had thistype of pain before could be labeled as have you everhad this pain before or have you ever had back painbefore, depending on the topic. If the topic was cur-rentbackpain or currentpain, the gold label coulddiffer. Topics, therefore, exist at varying levels of
8http://scikit-learn.org/
93
specificity. Including nearly identical questions inmultiple topics promotes question reuse across vir-tual patients but can be a source of error if the topicis not tracked well.
A second class of errors comes from superficiallysimilar questions, where the most meaningful wordor words in the question are not matched. For exam-ple does the pain ever go away vs. does rest makethe pain go away would have high lexical overlap,but this does not reflect the fact that the most infor-mative words do not match. Interestingly, we ex-pect that questions that match primarily on commonn-grams and not on rarer n-grams have relativelylow confidence scores, since the common n-gramswould match multiple other questions. Using confi-dence scoring could help mitigate this error class.
For the previous example, the correct question isactually, is the pain constant, which highlights athird kind of error, where some inference or world-knowledge is necessary. Understanding that thingsthat go away are not constant is an entailment in-volving negation and is more complicated to capturethan using a paraphrase resource.
While room exists for absolute improvement inaccuracy, the results are encouraging, given the rel-atively small dataset and fact that the full model ap-proaches ChatScript pattern-matching system per-formance (83%). Larger datasets will likely improveaccuracy, but given the expense and limited avail-ability of large corpora, we focus on exploring fea-tures that maximize limited training data. Annota-tion is in progress for a larger corpus of 100 dia-logues with approximately 5500 user turns.
Qualitatively, the ranking system is less labor-intensive than ChatScript and can use confidencevalues to drive dialogue act decisions, such as ask-ing the user to rephrase, or to choose between multi-ple candidate question interpretations. Additionally,the ranking system could potentially be combinedwith ChatScript to provide ranking when multipleChatScript patterns match, or to provide a questionwhen no existing ChatScript pattern matches the in-put.
Better anaphor resolution could help address er-rors from uninformative pronouns that might notmatch the canonical question form. Zero-anaphorsare missed by the current features and could occurin a dialogue setting such as: What medications are
you taking, followed by ok, how often.
6 Conclusion
In this paper, we have presented a log-linear rank-ing model for interpreting questions in a virtual pa-tient dialogue system that substantially outperformsa vanilla multiclass classifier model using the sameinformation. In the full model, the most effectivefeatures turned out to be the concept-based match-ing features, which make use of an existing con-cept hierarchy developed for an extensively hand-crafted pattern matching system, and play a similar(but less error-prone) role as WordNet synsets andpivot-based paraphrases in tools such as Meteor. To-gether with weighted matching features, these fea-tures led to a 15% error reduction over a strong lexi-cal overlap baseline, approaching the accuracy of thehandcrafted pattern matching system, while promis-ing to reduce the authoring burden and make it pos-sible to use confidence estimation in choosing dia-logue acts. At the same time, the effectiveness ofthe concept-based features indicates that manual de-velopment resources can be productively employedin the ranking model by developing domain-specificconcept hierarchies.
The student-VSP interaction creates a compre-hensive record of questions and the order in whichthey are asked, which allows for student assessmentas well as the opportunity for focused practice andimprovement. Indeed, the primary goal of our cur-rent research is to leverage the advantages of theVSP system to provide for deliberate practice withimmediate feedback.
To better support student practice and assessment,we plan to investigate in future work the impact ofmore advanced methods for anaphora resolution, asour error analysis suggests that questions contain-ing anaphors are a frequent source of errors. In adialogue system that uses speech input, we expectautomatic speech recognition errors to hurt perfor-mance. The exact impact is left as an empiricalquestion for future work. Finally, we also plan to in-vestigate incorporating syntactically-informed vec-tor space models of word meaning into our system,which may help to boost accuracy, especially whenacquiring patient-specific training data during theearly phase of developing a new virtual patient.
94
Acknowledgments
We would like to acknowledge Kellen Maicher whocreated the virtual environment and Bruce Wilcoxwho authored ChatScript and customized the soft-ware for this project. We also acknowledge the ex-pert technical assistance of Laura Zimmerman whomanaged the laboratory and organized student in-volvement in this project.
This project was supported by funding from theDepartment of Health and Human Services HealthResources and Services Administration (HRSAD56HP020687) and the National Board of MedicalExaminers Edward J. Stemmler Education ResearchFund (NBME 1112-064).
ReferencesYoav Artzi and Luke Zettlemoyer. 2013. Weakly su-
pervised learning of semantic parsers for mapping in-structions to actions. Transactions of the Associationfor Computational Linguistics, 1(1):49–62.
Colin Bannard and Chris Callison-Burch. 2005. Para-phrasing with bilingual parallel corpora. In Proceed-ings of ACL, ACL ’05, pages 597–604.
Jonathan Berant and Percy Liang. 2014. Seman-tic parsing via paraphrasing. In Proceedings of the52nd Annual Meeting of the Association for Compu-tational Linguistics (Volume 1: Long Papers), pages1415–1425, Baltimore, Maryland, June. Associationfor Computational Linguistics.
D. R. Danforth, M. Procter, R. Heller, R. Chen, andM. Johnson. 2009. Development of virtual patientsimulations for medical education. Journal of VirtualWorlds Research, 2(2):4–11.
D. R. Danforth, A. Price, K. Maicher, D. Post, B. Lis-ton, D. Clinchot, C. Ledford, D. Way, and H. Cronau.2013. Can virtual standardized patients be used to as-sess communication skills in medical students? InProceedings of the 17th Annual IAMSE Meeting, St.Andrews, Scotland.
Dipanjan Das and Noah A. Smith. 2009. Paraphraseidentification as probabilistic quasi-synchronousrecognition. In Proceedings of the Joint Conferenceof the 47th Annual Meeting of the ACL and the 4thInternational Joint Conference on Natural LanguageProcessing of the AFNLP, pages 468–476, Suntec,Singapore, August. Association for ComputationalLinguistics.
Pascal Denis and Jason Baldridge. 2007. A ranking ap-proach to pronoun resolution. In In Proceedings ofIJCAI-2007, Hyderabad, India.
Pascal Denis and Jason Baldridge. 2008. Specializedmodels and ranking for coreference resolution. In Pro-ceedings of the 2008 Conference on Empirical Meth-ods in Natural Language Processing, pages 660–669,Honolulu, Hawaii, October. Association for Computa-tional Linguistics.
Michael Denkowski and Alon Lavie. 2011. Meteor 1.3:Automatic Metric for Reliable Optimization and Eval-uation of Machine Translation Systems. In Proceed-ings of the EMNLP 2011 Workshop on Statistical Ma-chine Translation.
David DeVault, Kenji Sagae, and David Traum. 2011.Incremental interpretation and prediction of utterancemeaning for interactive dialogue. Dialogue and Dis-course, 2(1):143–170.
Bill Dolan, Chris Quirk, and Chris Brockett. 2004. Un-supervised construction of large paraphrase corpora:Exploiting massively parallel news sources. In Pro-ceedings of Coling 2004, pages 350–356, Geneva,Switzerland, Aug 23–Aug 27. COLING.
Myroslava O. Dzikovska, Peter Bell, Amy Isard, and Jo-hanna D. Moore. 2012. Evaluating language under-standing accuracy with respect to objective outcomesin a dialogue system. In Proceedings of the 13th Con-ference of the European Chapter of the Association forComputational Linguistics, pages 471–481, Avignon,France, April. Association for Computational Linguis-tics.
Myroslava Dzikovska, Elaine Farrow, and JohannaMoore. 2013. Improving interpretation robustnessin a tutorial dialogue system. In Proceedings of theEighth Workshop on Innovative Use of NLP for Build-ing Educational Applications, pages 293–299, Atlanta,Georgia, June. Association for Computational Lin-guistics.
Yangfeng Ji and Jacob Eisenstein. 2013. Discrimina-tive improvements to distributional sentence similarity.In Proceedings of the 2013 Conference on EmpiricalMethods in Natural Language Processing, pages 891–896, Seattle, Washington, USA, October. Associationfor Computational Linguistics.
Thorsten Joachims. 2002. Optimizing search enginesusing clickthrough data. In Proc. KDD.
Thorsten Joachims. 2006. Training linear svms in lin-ear time. In Proceedings of the ACM Conference onKnowledge Discovery and Data Mining (KDD).
Anton Leuski and David Traum. 2011. Npceditor: Cre-ating virtual human dialogue using information re-trieval techniques. AI Magazine, 32(2):42–56.
Nitin Madnani, Joel Tetreault, and Martin Chodorow.2012. Re-examining machine translation metrics forparaphrase identification. In Proceedings of the 2012Conference of the North American Chapter of the
95
Association for Computational Linguistics: HumanLanguage Technologies, pages 182–190, Montreal,Canada, June. Association for Computational Linguis-tics.
Kishore Papineni, Salim Roukos, Todd Ward, and Wei-Jing Zhu. 2002. BLEU: a method for automatic eval-uation of machine translation. In Proceedings of the40th Annual Meeting of the Association for Computa-tional Linguistics (ACL), Philadelphia, PA.
Deepak Ravichandran, Eduard Hovy, and Franz JosefOch. 2003. Statistical QA — classifier vs. re-ranker:What’s the difference? In Proceedings of the ACL2003 Workshop on Multilingual Summarization andQuestion Answering, pages 69–75, Sapporo, Japan,July. Association for Computational Linguistics.
Richard Socher and Eric H. Huang and Jeffrey Penning-ton and Andrew Y. Ng and Christopher D. Manning.2011. Dynamic Pooling and Unfolding Recursive Au-toencoders for Paraphrase Detection. In Advances inNeural Information Processing Systems 24.
Vasile Rus, Mihai Lintean, Arthur C. Graesser, andDanielle S. McNamara. 2011. Text-to-text similar-ity of sentences. In Phillip McCarthy and ChutimaBoonthum-Denecke, editors, Applied Natural Lan-guage Processing. IGI Global.
Stephen Wan, Mark Dras, Robert Dale, and Cecile Paris.2006. Using dependency-based features to take the‘para-farce’ out of paraphrase. In Proceedings of theAustralasian Language Technology Workshop 2006,pages 131–138, Sydney, Australia, November.
Wei Xu, Alan Ritter, Chris Callison-Burch, William B.Dolan, and Yangfeng Ji. 2014. Extracting lexicallydivergent paraphrases from Twitter. Transactions ofthe Association for Computational Linguistics (TACL),2(1).
96

Proceedings of the Tenth Workshop on Innovative Use of NLP for Building Educational Applications, 2015, pages 97–106,Denver, Colorado, June 4, 2015. c©2015 Association for Computational Linguistics
Identifying Patterns For Short Answer ScoringUsing Graph-based Lexico-Semantic Text Matching
Lakshmi Ramachandran1, Jian Cheng2 and Peter Foltz1,3
1Pearson, 2Analytic Measures Inc., 3University of Colorado{lakshmi.ramachandran, peter.foltz}@pearson.com
Abstract
Short answer scoring systems typically useregular expressions, templates or logic expres-sions to detect the presence of specific termsor concepts among student responses. Pre-vious work has shown that manually devel-oped regular expressions can provide effectivescoring, however manual development can bequite time consuming. In this work we presenta new approach that uses word-order graphsto identify important patterns from human-provided rubric texts and top-scoring studentanswers. The approach also uses semanticmetrics to determine groups of related words,which can represent alternative answers. Weevaluate our approach on two datasets: (1) theKaggle Short Answer dataset (ASAP-SAS,2012), and (2) a short answer dataset providedby Mohler et al. (2011). We show that ourautomated approach performs better than thebest performing Kaggle entry and generalizesas a method to the Mohler dataset.
1 Introduction
In recent years there has been a significant rise in thenumber of approaches used to automatically scoreessays. These involve checking grammar, syntaxand lexical sophistication of student answers (Lan-dauer et al., 2003; Attali and Burstein, 2006; Foltz etal., 2013). While essays are evaluated for the qual-ity of writing, short answers are brief and evoke veryspecific responses (often restricted to specific termsor concepts) from students. Hence the use of fea-tures that check grammar, structure or organizationmay not be sufficient to grade short answers.
Regular expressions, text templates or patternshave been used to determine whether a student an-swer matches a specific word or a phrase presentin the rubric text. For example, Moodle (2011) al-lows for the use of a “Regular Expression Short-Answer question” type which allows instructors orquestion developers to code correct answers as reg-ular expressions. Consider the question: “What areblue, red and yellow?” This question can evoke avery specific response: “They are colors.” How-ever, there are several ways (with the term “color”spelled differently, for instance) to answer thisquestion. E.g. (1) they are colors; (2) theyare colours; (3) they’re colours; (4) they’re col-ors; (5) colours; or (6) colors. Instead of havingto enumerate all the alternatives to this question,the answer can be coded as a regular expression:(they(’|\s(a))re\s)?colo(u)?rs.
Manually generated regular expressions havebeen used as features in generating models that scoreshort answers in the Kaggle Short Answer Scoringcompetition (ASAP-SAS, 2012). Tandalla (2012)’sapproach, the best performing one of the competi-tion, achieved a Quadratic Weighted (QW) Kappaof 0.70 using just regular expressions as features.However, regular expression generation can be te-dious and time consuming, and the performance ofthese features is constrained by the ability of humansto generate good regular expressions. Automatingthis approach would ensure that the process is re-peatable, and the results consistent.
We propose an approach to identify patterns toscore short answers using the rubric text and top-scoring student responses. The approach involves
97
(1) identification of classes of semantically relatedwords or phrases that a human evaluator would ex-pect to see among the best answers, and (2) com-bining these semantic classes in a meaningful wayto generate patterns. These patterns help capture themain concepts or terms that are representative of agood student response. We use a word order graph(Ramachandran and Gehringer, 2012) to representthe rubric text. The graph captures order of tokensin the text. We use a lexico-semantic matching tech-nique to identify the degree of relatedness across to-kens or phrases. The matching process helps iden-tify alternate ways of expressing the response.
An answer containing the text dietof koalas would be coded as follows:(?=.*(diet|eat(s)?|grub).*) of (?=.*(koala(s)?|koala|opossum).*). Thepatterns generated contain (1) positional constraints(?=, which indicates that the search for the textshould start at the beginning, and (2) the choiceoperator (|), which captures alternate ways ofexpressing the same term, e.g. diet or eat orgrub. We look for match (or non-match) betweenthe set of generated patterns and new short answers.
We evaluate our patterns on short answers fromthe Kaggle Automated Student Assessment Prize(ASAP) competition, the largest publicly availableshort answer dataset (Higgins et al., 2014). We com-pare our results with the those from the competi-tion’s best model, which uses manually generatedregular expressions. Our aim with this experimentis to demonstrate that automatically generated pat-terns produce results that are comparable to man-ually generated patterns. We also tested our ap-proach on a different short answer dataset curatedby Mohler et al. (2011).
One of the main contributions of this paper is theuse of an automated approach to generate patternsthat can be used to grade short answers effectively,while spending less time and effort. The rest of thispaper is organized as follows: Section 2 discussesrelated work that use manually constructed patternsor answer templates to grade student responses. Sec-tion 3 contains a description of our approach to au-tomatically generate patterns to grade short answers.Sections 4 and 5 discuss the experiments conductedto evaluate the performance of our patterns in scor-ing short answers. Section 6 concludes the paper.
2 Related Work
Leacock and Chodorow (2003) developed the use ofa short-answer scoring system called C-rater, whichfocuses on semantic information in the text. Theyused a paraphrase-recognition based approach toscore answers.
Bachman et al. (2002) proposed the use of a shortanswer assessment system called WebLAS. Theyextracted regular expressions from a model answerto generate the scoring key. Regular expressions areformed with exact as well as near-matches of wordsor phrases. Student answers are scored based onthe degree of match between the answer and scor-ing key. Unlike Bachman et al., we do not use pat-terns to directly match and score student answers.In our approach, text patterns are supplied as fea-tures to a learning algorithm such as Random For-est (Breiman, 2001) in order to accurately predictscores.
Mitchell et al. (2003) used templates to identifythe presence of sample phrases or keywords amongstudent responses. Marking schemes were devel-oped based on keys specified by human item de-velopers. The templates contained lists of alter-native (stemmed) tokens for a word or phrase thatcould be used by the student. Pulman and Sukkarieh(2005) used hand-coded patterns to capture differentways of expressing the correct answer. They auto-mated the approach of template creation, but the au-tomated ones did not outperform the manually gen-erated templates. Makatchev and VanLehn (2007)used manually encoded first-order predicate repre-sentations of answers to score responses.
Brill et al. (2002) reformulated queries as declar-ative sentence segments to aid query-answer match-ing. Their approach worked under the conditionthat the (exact) content words appearing in a querywould also appear in the answer. Consider the sam-ple query “When was the paper clip invented?”, andthe sample answer: “The paper clip is a very usefuldevice. It was patented by Johan Vaaler in 1899.”The word patented is related in meaning to the terminvented, but since the exact word is not used in thequery, it will not match the answer. We proposea technique that uses related words as part of thepatterns in order to avoid overlooking semanticallyclose matches.
98
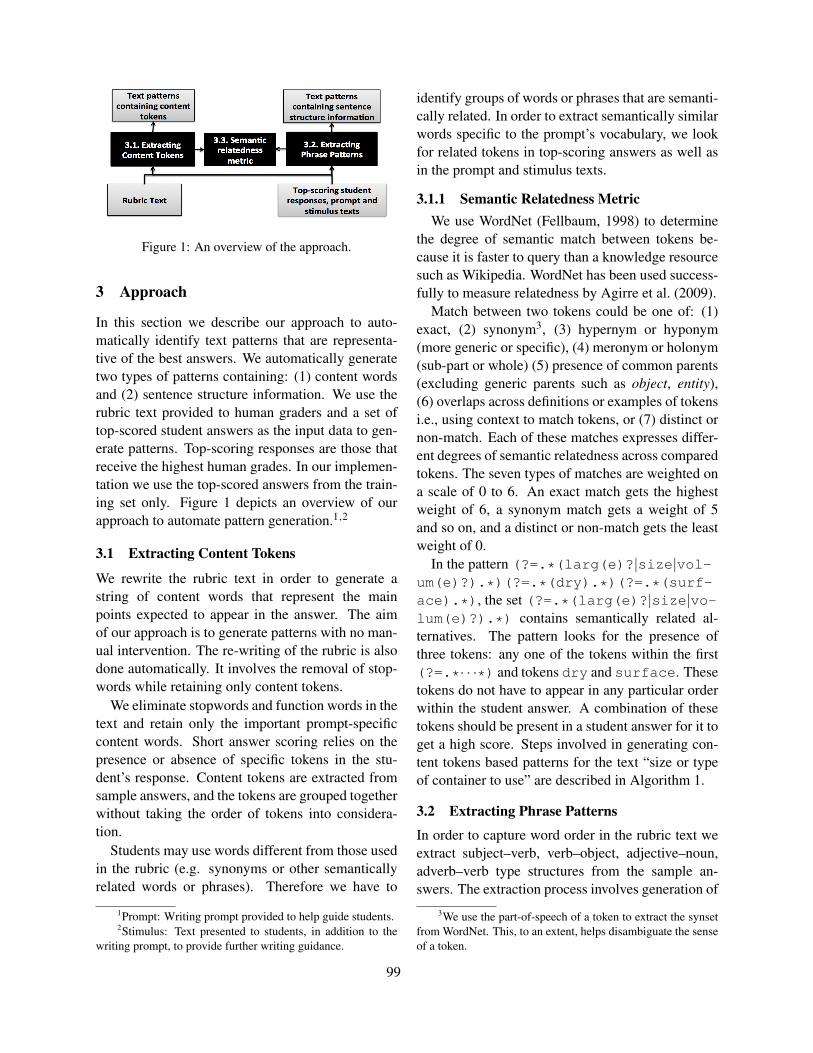
Figure 1: An overview of the approach.
3 Approach
In this section we describe our approach to auto-matically identify text patterns that are representa-tive of the best answers. We automatically generatetwo types of patterns containing: (1) content wordsand (2) sentence structure information. We use therubric text provided to human graders and a set oftop-scored student answers as the input data to gen-erate patterns. Top-scoring responses are those thatreceive the highest human grades. In our implemen-tation we use the top-scored answers from the train-ing set only. Figure 1 depicts an overview of ourapproach to automate pattern generation.1,2
3.1 Extracting Content Tokens
We rewrite the rubric text in order to generate astring of content words that represent the mainpoints expected to appear in the answer. The aimof our approach is to generate patterns with no man-ual intervention. The re-writing of the rubric is alsodone automatically. It involves the removal of stop-words while retaining only content tokens.
We eliminate stopwords and function words in thetext and retain only the important prompt-specificcontent words. Short answer scoring relies on thepresence or absence of specific tokens in the stu-dent’s response. Content tokens are extracted fromsample answers, and the tokens are grouped togetherwithout taking the order of tokens into considera-tion.
Students may use words different from those usedin the rubric (e.g. synonyms or other semanticallyrelated words or phrases). Therefore we have to
1Prompt: Writing prompt provided to help guide students.2Stimulus: Text presented to students, in addition to the
writing prompt, to provide further writing guidance.
identify groups of words or phrases that are semanti-cally related. In order to extract semantically similarwords specific to the prompt’s vocabulary, we lookfor related tokens in top-scoring answers as well asin the prompt and stimulus texts.
3.1.1 Semantic Relatedness MetricWe use WordNet (Fellbaum, 1998) to determine
the degree of semantic match between tokens be-cause it is faster to query than a knowledge resourcesuch as Wikipedia. WordNet has been used success-fully to measure relatedness by Agirre et al. (2009).
Match between two tokens could be one of: (1)exact, (2) synonym3, (3) hypernym or hyponym(more generic or specific), (4) meronym or holonym(sub-part or whole) (5) presence of common parents(excluding generic parents such as object, entity),(6) overlaps across definitions or examples of tokensi.e., using context to match tokens, or (7) distinct ornon-match. Each of these matches expresses differ-ent degrees of semantic relatedness across comparedtokens. The seven types of matches are weighted ona scale of 0 to 6. An exact match gets the highestweight of 6, a synonym match gets a weight of 5and so on, and a distinct or non-match gets the leastweight of 0.
In the pattern (?=.*(larg(e)?|size|vol-um(e)?).*)(?=.*(dry).*)(?=.*(surf-ace).*), the set (?=.*(larg(e)?|size|vo-lum(e)?).*) contains semantically related al-ternatives. The pattern looks for the presence ofthree tokens: any one of the tokens within the first(?=.*· · ·*) and tokens dry and surface. Thesetokens do not have to appear in any particular orderwithin the student answer. A combination of thesetokens should be present in a student answer for it toget a high score. Steps involved in generating con-tent tokens based patterns for the text “size or typeof container to use” are described in Algorithm 1.
3.2 Extracting Phrase Patterns
In order to capture word order in the rubric text weextract subject–verb, verb–object, adjective–noun,adverb–verb type structures from the sample an-swers. The extraction process involves generation of
3We use the part-of-speech of a token to extract the synsetfrom WordNet. This, to an extent, helps disambiguate the senseof a token.
99
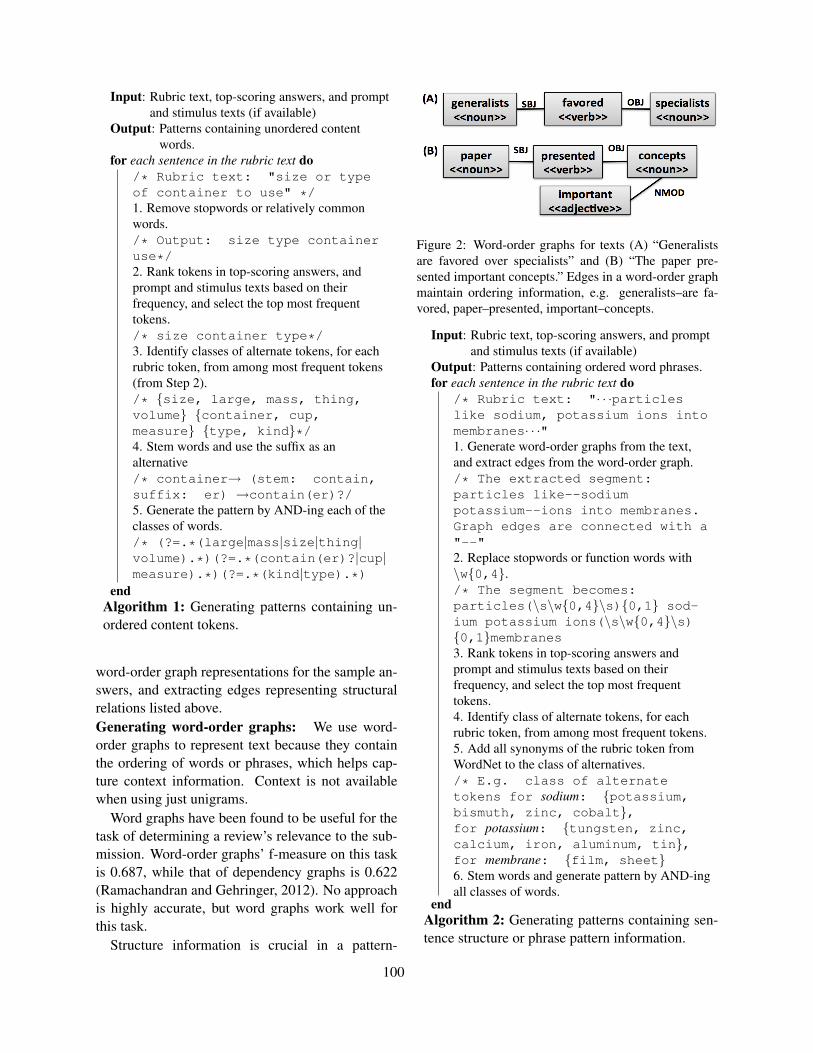
Input: Rubric text, top-scoring answers, and promptand stimulus texts (if available)
Output: Patterns containing unordered contentwords.
for each sentence in the rubric text do/* Rubric text: "size or typeof container to use" */1. Remove stopwords or relatively commonwords./* Output: size type containeruse*/2. Rank tokens in top-scoring answers, andprompt and stimulus texts based on theirfrequency, and select the top most frequenttokens./* size container type*/3. Identify classes of alternate tokens, for eachrubric token, from among most frequent tokens(from Step 2)./* {size, large, mass, thing,volume} {container, cup,measure} {type, kind}*/4. Stem words and use the suffix as analternative/* container→ (stem: contain,suffix: er) →contain(er)?/5. Generate the pattern by AND-ing each of theclasses of words./* (?=.*(large|mass|size|thing|volume).*)(?=.*(contain(er)?|cup|measure).*)(?=.*(kind|type).*)
endAlgorithm 1: Generating patterns containing un-ordered content tokens.
word-order graph representations for the sample an-swers, and extracting edges representing structuralrelations listed above.Generating word-order graphs: We use word-order graphs to represent text because they containthe ordering of words or phrases, which helps cap-ture context information. Context is not availablewhen using just unigrams.
Word graphs have been found to be useful for thetask of determining a review’s relevance to the sub-mission. Word-order graphs’ f-measure on this taskis 0.687, while that of dependency graphs is 0.622(Ramachandran and Gehringer, 2012). No approachis highly accurate, but word graphs work well forthis task.
Structure information is crucial in a pattern-
Figure 2: Word-order graphs for texts (A) “Generalistsare favored over specialists” and (B) “The paper pre-sented important concepts.” Edges in a word-order graphmaintain ordering information, e.g. generalists–are fa-vored, paper–presented, important–concepts.
Input: Rubric text, top-scoring answers, and promptand stimulus texts (if available)
Output: Patterns containing ordered word phrases.for each sentence in the rubric text do
/* Rubric text: "· · ·particleslike sodium, potassium ions intomembranes· · ·"1. Generate word-order graphs from the text,and extract edges from the word-order graph./* The extracted segment:particles like--sodiumpotassium--ions into membranes.Graph edges are connected with a"--"2. Replace stopwords or function words with\w{0,4}./* The segment becomes:particles(\s\w{0,4}\s){0,1} sod-ium potassium ions(\s\w{0,4}\s){0,1}membranes3. Rank tokens in top-scoring answers andprompt and stimulus texts based on theirfrequency, and select the top most frequenttokens.4. Identify class of alternate tokens, for eachrubric token, from among most frequent tokens.5. Add all synonyms of the rubric token fromWordNet to the class of alternatives./* E.g. class of alternatetokens for sodium: {potassium,bismuth, zinc, cobalt},for potassium: {tungsten, zinc,calcium, iron, aluminum, tin},for membrane: {film, sheet}6. Stem words and generate pattern by AND-ingall classes of words.
endAlgorithm 2: Generating patterns containing sen-tence structure or phrase pattern information.
100
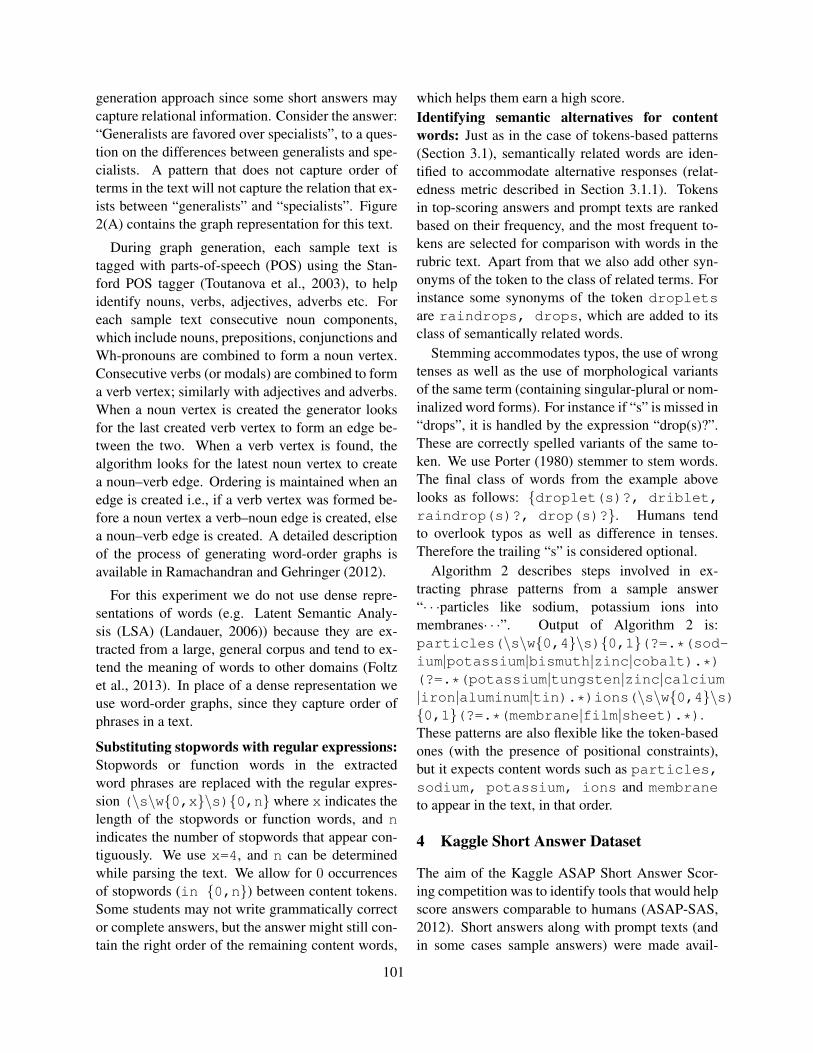
generation approach since some short answers maycapture relational information. Consider the answer:“Generalists are favored over specialists”, to a ques-tion on the differences between generalists and spe-cialists. A pattern that does not capture order ofterms in the text will not capture the relation that ex-ists between “generalists” and “specialists”. Figure2(A) contains the graph representation for this text.
During graph generation, each sample text istagged with parts-of-speech (POS) using the Stan-ford POS tagger (Toutanova et al., 2003), to helpidentify nouns, verbs, adjectives, adverbs etc. Foreach sample text consecutive noun components,which include nouns, prepositions, conjunctions andWh-pronouns are combined to form a noun vertex.Consecutive verbs (or modals) are combined to forma verb vertex; similarly with adjectives and adverbs.When a noun vertex is created the generator looksfor the last created verb vertex to form an edge be-tween the two. When a verb vertex is found, thealgorithm looks for the latest noun vertex to createa noun–verb edge. Ordering is maintained when anedge is created i.e., if a verb vertex was formed be-fore a noun vertex a verb–noun edge is created, elsea noun–verb edge is created. A detailed descriptionof the process of generating word-order graphs isavailable in Ramachandran and Gehringer (2012).
For this experiment we do not use dense repre-sentations of words (e.g. Latent Semantic Analy-sis (LSA) (Landauer, 2006)) because they are ex-tracted from a large, general corpus and tend to ex-tend the meaning of words to other domains (Foltzet al., 2013). In place of a dense representation weuse word-order graphs, since they capture order ofphrases in a text.
Substituting stopwords with regular expressions:Stopwords or function words in the extractedword phrases are replaced with the regular expres-sion (\s\w{0,x}\s){0,n} where x indicates thelength of the stopwords or function words, and nindicates the number of stopwords that appear con-tiguously. We use x=4, and n can be determinedwhile parsing the text. We allow for 0 occurrencesof stopwords (in {0,n}) between content tokens.Some students may not write grammatically corrector complete answers, but the answer might still con-tain the right order of the remaining content words,
which helps them earn a high score.Identifying semantic alternatives for contentwords: Just as in the case of tokens-based patterns(Section 3.1), semantically related words are iden-tified to accommodate alternative responses (relat-edness metric described in Section 3.1.1). Tokensin top-scoring answers and prompt texts are rankedbased on their frequency, and the most frequent to-kens are selected for comparison with words in therubric text. Apart from that we also add other syn-onyms of the token to the class of related terms. Forinstance some synonyms of the token dropletsare raindrops, drops, which are added to itsclass of semantically related words.
Stemming accommodates typos, the use of wrongtenses as well as the use of morphological variantsof the same term (containing singular-plural or nom-inalized word forms). For instance if “s” is missed in“drops”, it is handled by the expression “drop(s)?”.These are correctly spelled variants of the same to-ken. We use Porter (1980) stemmer to stem words.The final class of words from the example abovelooks as follows: {droplet(s)?, driblet,raindrop(s)?, drop(s)?}. Humans tendto overlook typos as well as difference in tenses.Therefore the trailing “s” is considered optional.
Algorithm 2 describes steps involved in ex-tracting phrase patterns from a sample answer“· · ·particles like sodium, potassium ions intomembranes· · ·”. Output of Algorithm 2 is:particles(\s\w{0,4}\s){0,1}(?=.*(sod-ium|potassium|bismuth|zinc|cobalt).*)(?=.*(potassium|tungsten|zinc|calcium|iron|aluminum|tin).*)ions(\s\w{0,4}\s){0,1}(?=.*(membrane|film|sheet).*).These patterns are also flexible like the token-basedones (with the presence of positional constraints),but it expects content words such as particles,sodium, potassium, ions and membraneto appear in the text, in that order.
4 Kaggle Short Answer Dataset
The aim of the Kaggle ASAP Short Answer Scor-ing competition was to identify tools that would helpscore answers comparable to humans (ASAP-SAS,2012). Short answers along with prompt texts (andin some cases sample answers) were made avail-
101
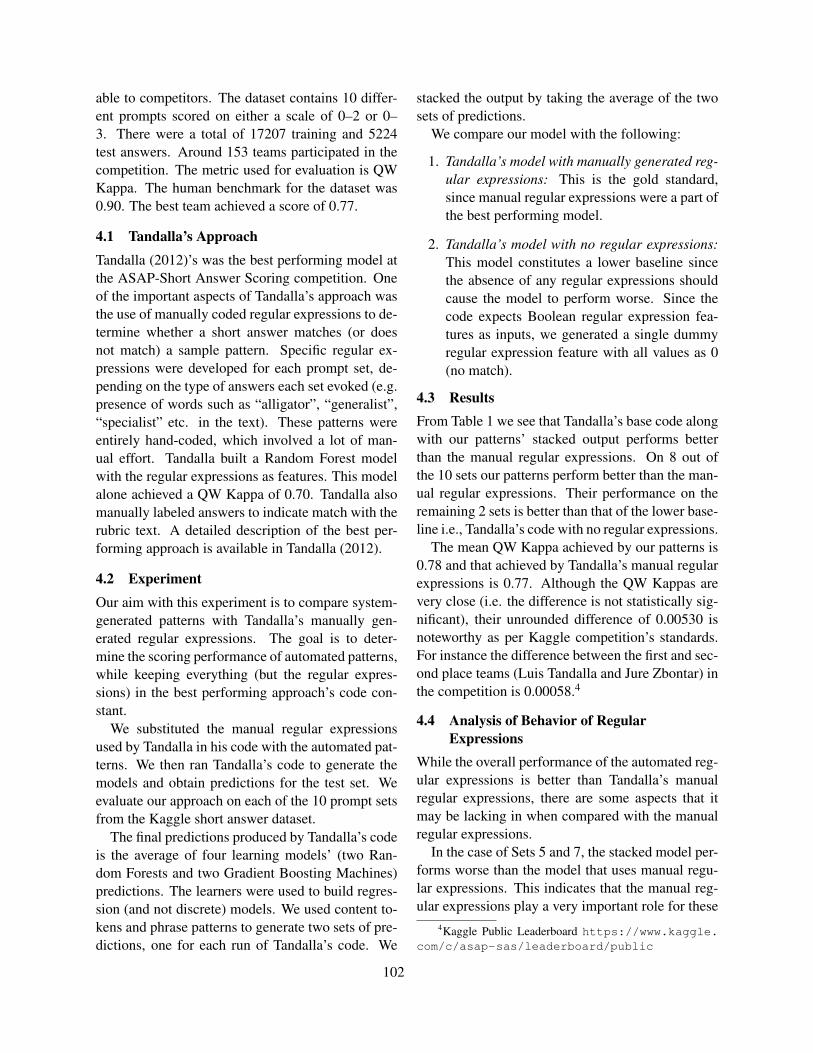
able to competitors. The dataset contains 10 differ-ent prompts scored on either a scale of 0–2 or 0–3. There were a total of 17207 training and 5224test answers. Around 153 teams participated in thecompetition. The metric used for evaluation is QWKappa. The human benchmark for the dataset was0.90. The best team achieved a score of 0.77.
4.1 Tandalla’s Approach
Tandalla (2012)’s was the best performing model atthe ASAP-Short Answer Scoring competition. Oneof the important aspects of Tandalla’s approach wasthe use of manually coded regular expressions to de-termine whether a short answer matches (or doesnot match) a sample pattern. Specific regular ex-pressions were developed for each prompt set, de-pending on the type of answers each set evoked (e.g.presence of words such as “alligator”, “generalist”,“specialist” etc. in the text). These patterns wereentirely hand-coded, which involved a lot of man-ual effort. Tandalla built a Random Forest modelwith the regular expressions as features. This modelalone achieved a QW Kappa of 0.70. Tandalla alsomanually labeled answers to indicate match with therubric text. A detailed description of the best per-forming approach is available in Tandalla (2012).
4.2 Experiment
Our aim with this experiment is to compare system-generated patterns with Tandalla’s manually gen-erated regular expressions. The goal is to deter-mine the scoring performance of automated patterns,while keeping everything (but the regular expres-sions) in the best performing approach’s code con-stant.
We substituted the manual regular expressionsused by Tandalla in his code with the automated pat-terns. We then ran Tandalla’s code to generate themodels and obtain predictions for the test set. Weevaluate our approach on each of the 10 prompt setsfrom the Kaggle short answer dataset.
The final predictions produced by Tandalla’s codeis the average of four learning models’ (two Ran-dom Forests and two Gradient Boosting Machines)predictions. The learners were used to build regres-sion (and not discrete) models. We used content to-kens and phrase patterns to generate two sets of pre-dictions, one for each run of Tandalla’s code. We
stacked the output by taking the average of the twosets of predictions.
We compare our model with the following:
1. Tandalla’s model with manually generated reg-ular expressions: This is the gold standard,since manual regular expressions were a part ofthe best performing model.
2. Tandalla’s model with no regular expressions:This model constitutes a lower baseline sincethe absence of any regular expressions shouldcause the model to perform worse. Since thecode expects Boolean regular expression fea-tures as inputs, we generated a single dummyregular expression feature with all values as 0(no match).
4.3 ResultsFrom Table 1 we see that Tandalla’s base code alongwith our patterns’ stacked output performs betterthan the manual regular expressions. On 8 out ofthe 10 sets our patterns perform better than the man-ual regular expressions. Their performance on theremaining 2 sets is better than that of the lower base-line i.e., Tandalla’s code with no regular expressions.
The mean QW Kappa achieved by our patterns is0.78 and that achieved by Tandalla’s manual regularexpressions is 0.77. Although the QW Kappas arevery close (i.e. the difference is not statistically sig-nificant), their unrounded difference of 0.00530 isnoteworthy as per Kaggle competition’s standards.For instance the difference between the first and sec-ond place teams (Luis Tandalla and Jure Zbontar) inthe competition is 0.00058.4
4.4 Analysis of Behavior of RegularExpressions
While the overall performance of the automated reg-ular expressions is better than Tandalla’s manualregular expressions, there are some aspects that itmay be lacking in when compared with the manualregular expressions.
In the case of Sets 5 and 7, the stacked model per-forms worse than the model that uses manual regu-lar expressions. This indicates that the manual reg-ular expressions play a very important role for these
4Kaggle Public Leaderboard https://www.kaggle.com/c/asap-sas/leaderboard/public
102

Table 1: Comparing performance of models on the test set from the Kaggle ASAP competition. The table containsQW Kappas for each of the ten prompts in the dataset. AutoP: Stacked patterns model. Tandalla’s: Tandalla’s modelwith manually generated regular expressions; Baseline: Tandalla’s model with no regular expressions.
Approach Set 1 Set 2 Set 3 Set 4 Set 5 Set 6 Set 7 Set 8 Set 9 Set 10 MeanAutoP 0.86 0.78 0.66 0.70 0.84 0.88 0.66 0.63 0.84 0.79 0.78Tandalla’s 0.85 0.77 0.64 0.65 0.85 0.88 0.69 0.62 0.84 0.78 0.77Baseline 0.82 0.76 0.64 0.66 0.80 0.86 0.63 0.59 0.82 0.76 0.75
prompts. In the case of set 5, the prompt evokesinformation on the movement of mRNA across thenucleus and ribosomes. We found that:
1. The answers discuss the movement of mRNAin a certain direction, e.g. out of (exit) the nu-cleus and into the (entry) ribosome. Althoughstudents may mention the content terms suchas nucleus and ribosome correctly, they tend tomiss the directionality (of the mRNA). Sinceterms such as into, out of etc. are prepositionsor function words, they get replaced, in our au-tomated approach by \w{0,x}. Hence, if thestudent answer mentions “the mRNA movedinto the nucleus” as opposed to saying “outof the nucleus”, our pattern would incorrectlymatch it.
2. Another reason why automated regular expres-sions do not perform well is that WordNettreats terms such as nucleus and ribosome assynonyms. As a result when students inter-change the two terms, the regular expressionfinds incorrect matches. For example an au-tomated pattern for the text “travels from thecytoplasm into the ribosome” is represented astravels(\s\w{0,4}\s){0,2}(?=.*(cytoplasm|endoplasm(ic)?).*)(\s\w{0,4}\s){0,2}(?=.*(riboso-m(e)?|nucleu(s)?).*). An incorrectstudent answer containing “· · · mRNA travelsfrom the cytoplasm into the nucleus · · ·” willmatch this pattern.
As described above we found that retaining stop-words (e.g. prepositions such as “into” or “out of”)in the regular expressions may be useful in the caseof some prompts. Our approach to regular expres-sion generation may be tweaked to allow the use ofstopwords for some prompts. However, our aim is toshow that with a generalized approach (in this case
one that excludes stopwords) our system performsbetter than Tandalla’s.
In the case of prompt 7, the answers are ex-pected to contain a description of the traits ofa character named Rose, as well as an expla-nation on why students thought that the char-acter was caring. An automated pattern such as:(?=.*(hard|difficult).*)(?=.*(work-(ing)?).*) captures some of Rose’s traits. Theanswer “Rose was a very hard working girl. Shefelt really lonely because her dad had just left andher mother worked most of the day.” matches theabove pattern. However the explanation providedby the student in the second sentence is not correct.This answer was awarded a score of 1 by thehuman grader, but was given a 2 by the system.Although the pattern succeeds in capturing partialinformation, it does not capture the explanationcorrectly for this prompt.
5 Mohler et al. (2011)’s Short AnswerDataset
In this section we evaluate our approach on an al-ternate short answer scoring dataset generated byMohler et al. (2011). The aim is to show thatour method is not specific to a single type of shortanswer, and could be used successfully on otherdatasets to build scoring models.
Mohler et al. use a combination of graph-basedalignment and lexical similarity measures to gradeshort answers. They evaluate their model on adataset containing 10 assignments and 2 examina-tions. The dataset contains 81 questions with a totalof 2273 answers. The dataset was graded by two hu-man judges on a scale of 0–5. Human judges havean agreement of 57.7%.
Mohler et al. apply a 12-fold cross validationover the entire dataset to evaluate their models. Onaverage, the train fold contains 1894 data points
103
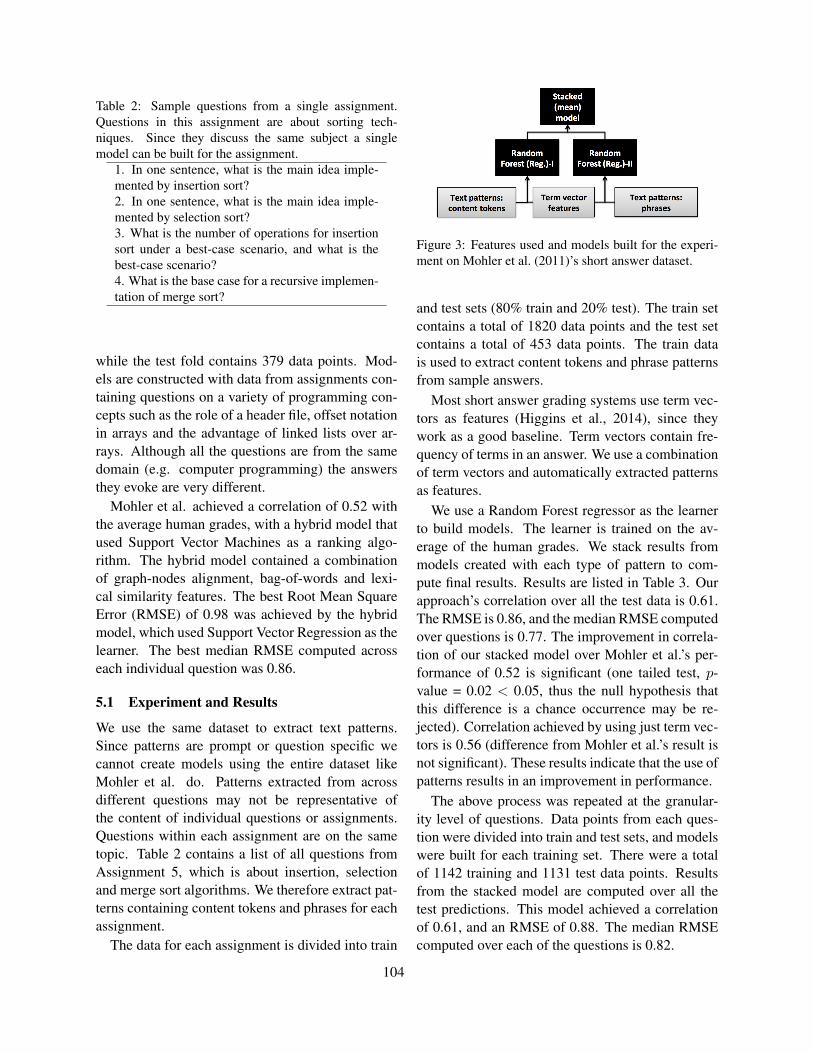
Table 2: Sample questions from a single assignment.Questions in this assignment are about sorting tech-niques. Since they discuss the same subject a singlemodel can be built for the assignment.
1. In one sentence, what is the main idea imple-mented by insertion sort?2. In one sentence, what is the main idea imple-mented by selection sort?3. What is the number of operations for insertionsort under a best-case scenario, and what is thebest-case scenario?4. What is the base case for a recursive implemen-tation of merge sort?
while the test fold contains 379 data points. Mod-els are constructed with data from assignments con-taining questions on a variety of programming con-cepts such as the role of a header file, offset notationin arrays and the advantage of linked lists over ar-rays. Although all the questions are from the samedomain (e.g. computer programming) the answersthey evoke are very different.
Mohler et al. achieved a correlation of 0.52 withthe average human grades, with a hybrid model thatused Support Vector Machines as a ranking algo-rithm. The hybrid model contained a combinationof graph-nodes alignment, bag-of-words and lexi-cal similarity features. The best Root Mean SquareError (RMSE) of 0.98 was achieved by the hybridmodel, which used Support Vector Regression as thelearner. The best median RMSE computed acrosseach individual question was 0.86.
5.1 Experiment and Results
We use the same dataset to extract text patterns.Since patterns are prompt or question specific wecannot create models using the entire dataset likeMohler et al. do. Patterns extracted from acrossdifferent questions may not be representative ofthe content of individual questions or assignments.Questions within each assignment are on the sametopic. Table 2 contains a list of all questions fromAssignment 5, which is about insertion, selectionand merge sort algorithms. We therefore extract pat-terns containing content tokens and phrases for eachassignment.
The data for each assignment is divided into train
Figure 3: Features used and models built for the experi-ment on Mohler et al. (2011)’s short answer dataset.
and test sets (80% train and 20% test). The train setcontains a total of 1820 data points and the test setcontains a total of 453 data points. The train datais used to extract content tokens and phrase patternsfrom sample answers.
Most short answer grading systems use term vec-tors as features (Higgins et al., 2014), since theywork as a good baseline. Term vectors contain fre-quency of terms in an answer. We use a combinationof term vectors and automatically extracted patternsas features.
We use a Random Forest regressor as the learnerto build models. The learner is trained on the av-erage of the human grades. We stack results frommodels created with each type of pattern to com-pute final results. Results are listed in Table 3. Ourapproach’s correlation over all the test data is 0.61.The RMSE is 0.86, and the median RMSE computedover questions is 0.77. The improvement in correla-tion of our stacked model over Mohler et al.’s per-formance of 0.52 is significant (one tailed test, p-value = 0.02 < 0.05, thus the null hypothesis thatthis difference is a chance occurrence may be re-jected). Correlation achieved by using just term vec-tors is 0.56 (difference from Mohler et al.’s result isnot significant). These results indicate that the use ofpatterns results in an improvement in performance.
The above process was repeated at the granular-ity level of questions. Data points from each ques-tion were divided into train and test sets, and modelswere built for each training set. There were a totalof 1142 training and 1131 test data points. Resultsfrom the stacked model are computed over all thetest predictions. This model achieved a correlationof 0.61, and an RMSE of 0.88. The median RMSEcomputed over each of the questions is 0.82.
104
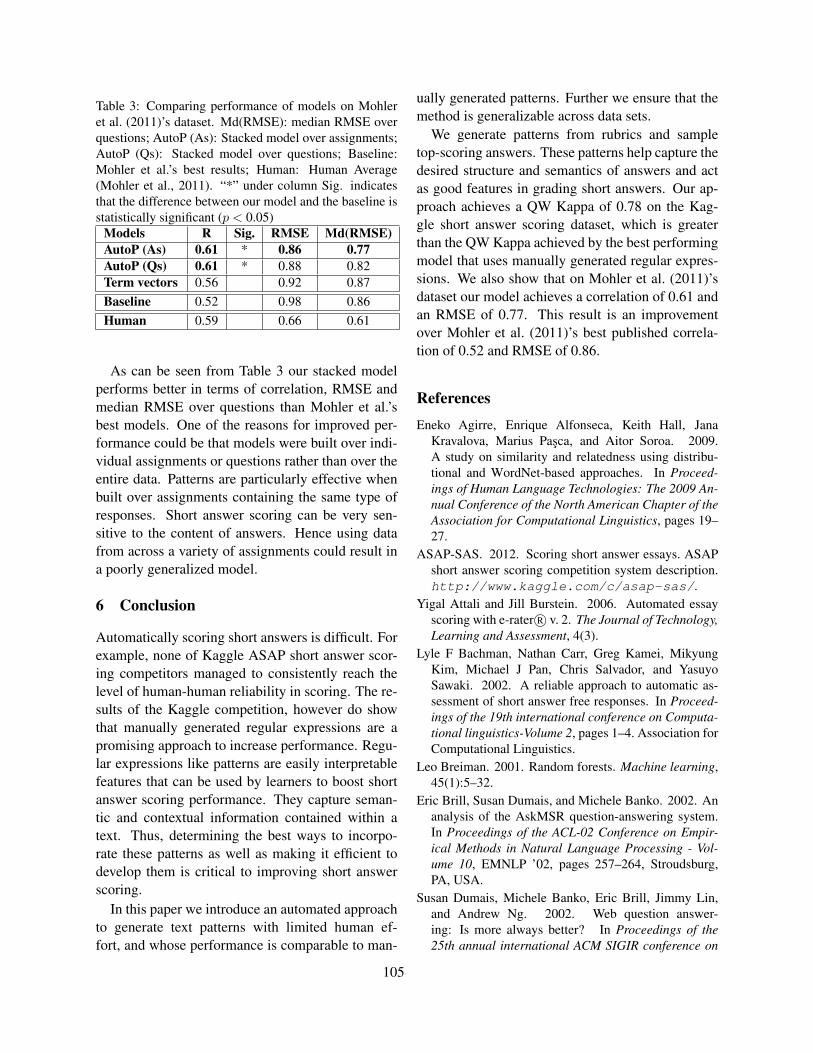
Table 3: Comparing performance of models on Mohleret al. (2011)’s dataset. Md(RMSE): median RMSE overquestions; AutoP (As): Stacked model over assignments;AutoP (Qs): Stacked model over questions; Baseline:Mohler et al.’s best results; Human: Human Average(Mohler et al., 2011). “*” under column Sig. indicatesthat the difference between our model and the baseline isstatistically significant (p < 0.05)
Models R Sig. RMSE Md(RMSE)AutoP (As) 0.61 * 0.86 0.77AutoP (Qs) 0.61 * 0.88 0.82Term vectors 0.56 0.92 0.87Baseline 0.52 0.98 0.86Human 0.59 0.66 0.61
As can be seen from Table 3 our stacked modelperforms better in terms of correlation, RMSE andmedian RMSE over questions than Mohler et al.’sbest models. One of the reasons for improved per-formance could be that models were built over indi-vidual assignments or questions rather than over theentire data. Patterns are particularly effective whenbuilt over assignments containing the same type ofresponses. Short answer scoring can be very sen-sitive to the content of answers. Hence using datafrom across a variety of assignments could result ina poorly generalized model.
6 Conclusion
Automatically scoring short answers is difficult. Forexample, none of Kaggle ASAP short answer scor-ing competitors managed to consistently reach thelevel of human-human reliability in scoring. The re-sults of the Kaggle competition, however do showthat manually generated regular expressions are apromising approach to increase performance. Regu-lar expressions like patterns are easily interpretablefeatures that can be used by learners to boost shortanswer scoring performance. They capture seman-tic and contextual information contained within atext. Thus, determining the best ways to incorpo-rate these patterns as well as making it efficient todevelop them is critical to improving short answerscoring.
In this paper we introduce an automated approachto generate text patterns with limited human ef-fort, and whose performance is comparable to man-
ually generated patterns. Further we ensure that themethod is generalizable across data sets.
We generate patterns from rubrics and sampletop-scoring answers. These patterns help capture thedesired structure and semantics of answers and actas good features in grading short answers. Our ap-proach achieves a QW Kappa of 0.78 on the Kag-gle short answer scoring dataset, which is greaterthan the QW Kappa achieved by the best performingmodel that uses manually generated regular expres-sions. We also show that on Mohler et al. (2011)’sdataset our model achieves a correlation of 0.61 andan RMSE of 0.77. This result is an improvementover Mohler et al. (2011)’s best published correla-tion of 0.52 and RMSE of 0.86.
References
Eneko Agirre, Enrique Alfonseca, Keith Hall, JanaKravalova, Marius Pasca, and Aitor Soroa. 2009.A study on similarity and relatedness using distribu-tional and WordNet-based approaches. In Proceed-ings of Human Language Technologies: The 2009 An-nual Conference of the North American Chapter of theAssociation for Computational Linguistics, pages 19–27.
ASAP-SAS. 2012. Scoring short answer essays. ASAPshort answer scoring competition system description.http://www.kaggle.com/c/asap-sas/.
Yigal Attali and Jill Burstein. 2006. Automated essayscoring with e-rater R© v. 2. The Journal of Technology,Learning and Assessment, 4(3).
Lyle F Bachman, Nathan Carr, Greg Kamei, MikyungKim, Michael J Pan, Chris Salvador, and YasuyoSawaki. 2002. A reliable approach to automatic as-sessment of short answer free responses. In Proceed-ings of the 19th international conference on Computa-tional linguistics-Volume 2, pages 1–4. Association forComputational Linguistics.
Leo Breiman. 2001. Random forests. Machine learning,45(1):5–32.
Eric Brill, Susan Dumais, and Michele Banko. 2002. Ananalysis of the AskMSR question-answering system.In Proceedings of the ACL-02 Conference on Empir-ical Methods in Natural Language Processing - Vol-ume 10, EMNLP ’02, pages 257–264, Stroudsburg,PA, USA.
Susan Dumais, Michele Banko, Eric Brill, Jimmy Lin,and Andrew Ng. 2002. Web question answer-ing: Is more always better? In Proceedings of the25th annual international ACM SIGIR conference on
105
Research and development in information retrieval,pages 291–298. ACM.
Christiane Fellbaum. 1998. Wordnet: An electronic lex-ical database. MIT Press.
Peter Foltz, Karen Lochbaum, and Mark Rosenstein.2011. Analysis of student writing for large scale im-plementation of formative assessment. In Paper pre-sented at the National Council for Measurement in Ed-ucation, New Orleans, LA.
Peter Foltz, Lynn A. Streeter, Karen Lochbaum, andThomas K. Landauer. 2013. Implementation and ap-plications of the Intelligent Essay Assessor. In M.Shermis & J. Burstein, (Eds.). Handbook of AutomatedEssay Evaluation, pages 68–88, Routledge, NY.
Evgeniy Gabrilovich and Shaul Markovitch. 2007. Com-puting semantic relatedness using Wikipedia-basedexplicit semantic analysis. In Proceedings of the 20thinternational joint conference on Artifical intelligence,IJCAI’07, pages 1606–1611.
Derrick Higgins, Chris Brew, Michael Heilman, RamonZiai, Lei Chen, Aoife Cahill, Michael Flor, Nitin Mad-nani, Joel Tetreault, Dan Blanchard, Diane Napoli-tano, Chong Min Lee, and John Blackmore. 2014. Isgetting the right answer just about choosing the rightwords? The role of syntactically-informed features inshort answer scoring. arXiv.
Thomas K. Landauer, Darrell Laham, and Peter W. Foltz.2003. Automated scoring and annotation of essayswith the Intelligent Essay Assessor. In Automated Es-say Scoring: A cross-disciplinary perspective, pages87–112, Mahwah, NJ: Lawrence Erlbaum Publishers.
Thomas K Landauer. 2006. Latent semantic analysis.Encyclopedia of Cognitive Science.
Claudia Leacock and Martin Chodorow. 2003. C-rater: Automated scoring of short-answer questions.In Computers and the Humanities, volume 37, pages389–405. Springer.
Maxim Makatchev and Kurt VanLehn. 2007. Combiningbayesian networks and formal reasoning for semanticclassification of student utterances. In Proceedings ofthe 2007 Conference on Artificial Intelligence in Ed-ucation: Building Technology Rich Learning ContextsThat Work, pages 307–314, Amsterdam, The Nether-lands.
Tom Mitchell, Nicola Aldridge, and Peter Broomhead.2003. Computerised marking of short-answer free-text responses. In Manchester IAEA conference.
Michael Mohler, Razvan Bunescu, and Rada Mihalcea.2011. Learning to grade short answer questions usingsemantic similarity measures and dependency graphalignments. Proceedings of the 49th Annual Meetingof the Association of Computational Linguistics - Hu-man Language Technologies (ACL HLT 2011), pages752–762.
Moodle. 2011. Regular expression short-answer ques-tion type. http://docs.moodle.org/20/en/Regular_Expression_Short-Answer_question_type.
Martin F Porter. 1980. An algorithm for suffix strip-ping. In Program: electronic library and informationsystems, volume 14, pages 130–137. MCB UP Ltd.
Stephen G Pulman and Jana Z Sukkarieh. 2005. Au-tomatic short answer marking. In Proceedings of thesecond workshop on Building Educational Applica-tions Using NLP, pages 9–16.
Lakshmi Ramachandran and Edward F. Gehringer. 2012.A word-order based graph representation for relevanceidentification (poster). Proceedings of the 21st ACMConference on Information and Knowledge Manage-ment, pages 2327–2330, October.
Lakshmi Ramachandran and Edward Gehringer. 2013.Graph-structures matching for review relevance identi-fication. In Proceedings of TextGraphs-8 Graph-basedMethods for Natural Language Processing, pages 53–60, Seattle, Washington, USA, October.
Luis Tandalla. 2012. Scoring short answer essays. ASAPshort answer scoring competition–Luis Tandalla’sapproach. https://kaggle2.blob.core.windows.net/competitions/kaggle/2959/media/TechnicalMethodsPaper.pdf.
Kristina Toutanova, Dan Klein, Christopher D. Manning,and Yoram Singer. 2003. Feature-rich part-of-speechtagging with a cyclic dependency network. In In Pro-ceedings of HLT-NAACL, pages 252–259.
Yu Wang, Yang Xiang, Wanlei Zhou, and Shunzheng Yu.2012. Generating regular expression signatures fornetwork traffic classification in trusted network man-agement. In Journal of Network and Computer Ap-plications, volume 35, pages 992–1000, London, UK,UK, May. Academic Press Ltd.
106
Proceedings of the Tenth Workshop on Innovative Use of NLP for Building Educational Applications, 2015, pages 107–117,Denver, Colorado, June 4, 2015. c©2015 Association for Computational Linguistics
Lark Trills for Language Drills:Text-to-speech technology for language learners
Elena Volodina Dijana PijetlovicUniversity of Gothenburg, Dpt of Swedish, Nuance Communications Switzerland AG
Swedish Language Bank (Språkbanken) Baslerstrasse 30Box 200, 405 30, Gothenburg, Sweden 8048 Zürich, [email protected] [email protected]
Abstract
This paper reports on the development and the initialevaluation of a dictation&spelling prototype exercisefor second language (L2) learners of Swedish basedon text-to-speech (TTS) technology. Implemented onan already existing Intelligent Computer-AssistedLanguage Learning (ICALL) platform, the exercisehas not only served as a test case for TTS in L2 envi-ronment, but has also shown a potential to train liste-ning and orthographic skills, as well as has become away of collecting learner-specific spelling errors intoa database. Exercise generation re-uses well-annotatedcorpora, lexical resources, and text-to-speech techno-logy with an accompanying talking head.
1 Introduction and background
ICALL – Intelligent Computer-Assisted LanguageLearning - is an intersection between Computer-Assisted Language Learning (CALL) and NaturalLanguage Processing (NLP) where interests of theone side and technical possibilities of the othermeet, e.g. automatic error detection and automaticessay scoring.
Multiple research projects worldwide explorethe benefits of NLP in educational applications(Mitkov & Ha 2003; Monaghan & Bridgeman2005; Heilman & Eskenazi, 2006; Antonsen 2012),some of them being exploited for real-life languageteaching (Amaral and Meurers, 2011; Heift, 2003;Nagata, 2009), most of them though staying wit-hin academic research not reaching actual users(Nilsson & Borin, 2002; François & Fairon, 2012)or remaining limited by commercial usage (Attali& Burstein, 2006; Burstein et al., 2007).
In the past five decades the area of NLP haswitnessed intensive development in Sweden.However, ICALL has remained rather on the perip-hery of NLP community interests. Among the di-rections in which ICALL research developed inSweden, one can name supportive writing systems(Bigert et al., 2005; Östling et al., 2013); exercisegenerators (Bick 2001, 2005; Borin & Saxena,2004; Volodina et al., 2014); tutoring systems (Wik2004, 2011; Wik & Hjalmarsson, 2009).
As can be seen, the number of directions forSwedish ICALL projects is relatively small. Giventhe potential that NLP holds for CALL community,this fact is rather surprising, if not remarkable.
1.1 Pedagogical Framework
More than a decade ago Council of Europe has ad-opted a new framework for language learning,teaching and assessment, the Common EuropeanFramework of Reference for Languages (CEFR;COE, 2001). The CEFR guidelines describe langu-age skills and competences at six proficiency le-vels (from beginner to proficient): A1, A2, B1, B2,C1, C2. Among those skills, orthographic skills,listening comprehension, vocabulary range andcontrol, and knowledge of lexical elements are rele-vant in the context of the exercise described in thepaper.
Orthographic control, as defined by theCEFR, is ranging from ”Can copy familiar wordsand short phrases ... used regularly” at the begin-ner level (A1) to ”Writing is orthographically freeof error” at the mastery level (C2) (COE,2001:118). The same applies to listening compre-hension which ranges from ”I can recognise fami-
107
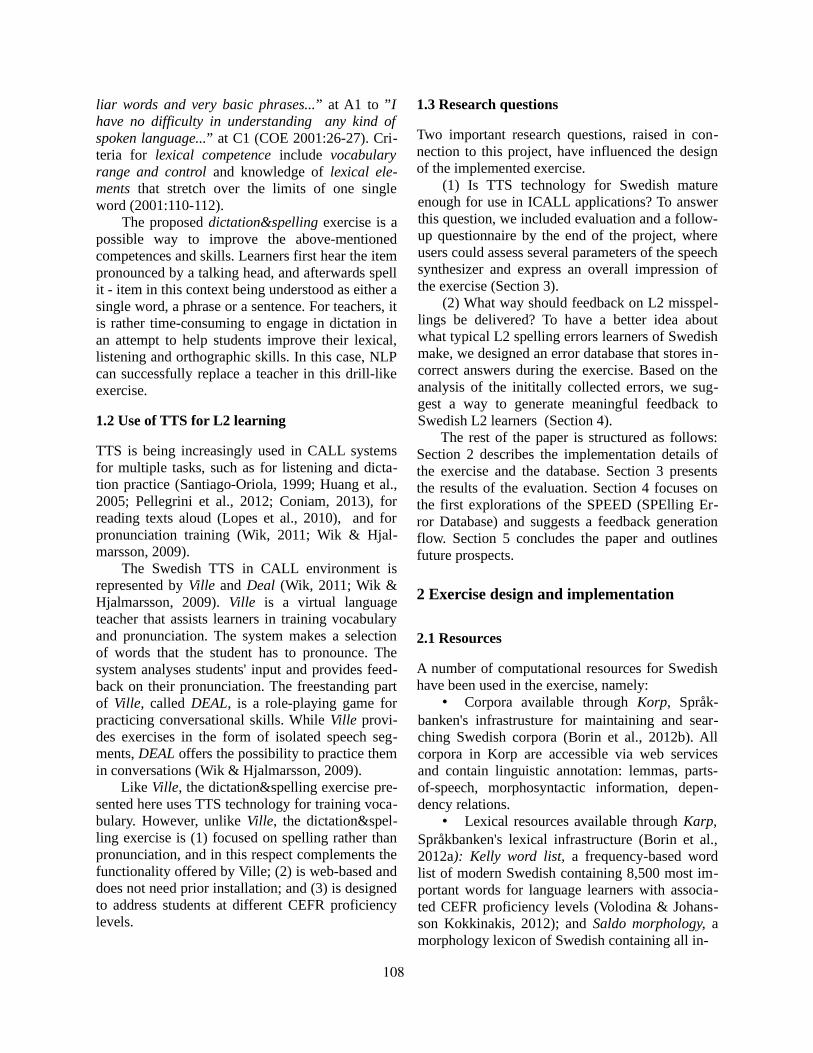
liar words and very basic phrases...” at A1 to ”Ihave no difficulty in understanding any kind ofspoken language...” at C1 (COE 2001:26-27). Cri-teria for lexical competence include vocabularyrange and control and knowledge of lexical ele-ments that stretch over the limits of one singleword (2001:110-112).
The proposed dictation&spelling exercise is apossible way to improve the above-mentionedcompetences and skills. Learners first hear the itempronounced by a talking head, and afterwards spellit - item in this context being understood as either asingle word, a phrase or a sentence. For teachers, itis rather time-consuming to engage in dictation inan attempt to help students improve their lexical,listening and orthographic skills. In this case, NLPcan successfully replace a teacher in this drill-likeexercise.
1.2 Use of TTS for L2 learning
TTS is being increasingly used in CALL systemsfor multiple tasks, such as for listening and dicta-tion practice (Santiago-Oriola, 1999; Huang et al.,2005; Pellegrini et al., 2012; Coniam, 2013), forreading texts aloud (Lopes et al., 2010), and forpronunciation training (Wik, 2011; Wik & Hjal-marsson, 2009).
The Swedish TTS in CALL environment isrepresented by Ville and Deal (Wik, 2011; Wik &Hjalmarsson, 2009). Ville is a virtual languageteacher that assists learners in training vocabularyand pronunciation. The system makes a selectionof words that the student has to pronounce. Thesystem analyses students' input and provides feed-back on their pronunciation. The freestanding partof Ville, called DEAL, is a role-playing game forpracticing conversational skills. While Ville provi-des exercises in the form of isolated speech seg-ments, DEAL offers the possibility to practice themin conversations (Wik & Hjalmarsson, 2009).
Like Ville, the dictation&spelling exercise pre-sented here uses TTS technology for training voca-bulary. However, unlike Ville, the dictation&spel-ling exercise is (1) focused on spelling rather thanpronunciation, and in this respect complements thefunctionality offered by Ville; (2) is web-based anddoes not need prior installation; and (3) is designedto address students at different CEFR proficiencylevels.
1.3 Research questions
Two important research questions, raised in con-nection to this project, have influenced the designof the implemented exercise.
(1) Is TTS technology for Swedish matureenough for use in ICALL applications? To answerthis question, we included evaluation and a follow-up questionnaire by the end of the project, whereusers could assess several parameters of the speechsynthesizer and express an overall impression ofthe exercise (Section 3).
(2) What way should feedback on L2 misspel-lings be delivered? To have a better idea aboutwhat typical L2 spelling errors learners of Swedishmake, we designed an error database that stores in-correct answers during the exercise. Based on theanalysis of the inititally collected errors, we sug-gest a way to generate meaningful feedback toSwedish L2 learners (Section 4).
The rest of the paper is structured as follows:Section 2 describes the implementation details ofthe exercise and the database. Section 3 presentsthe results of the evaluation. Section 4 focuses onthe first explorations of the SPEED (SPElling Er-ror Database) and suggests a feedback generationflow. Section 5 concludes the paper and outlinesfuture prospects.
2 Exercise design and implementation
2.1 Resources
A number of computational resources for Swedishhave been used in the exercise, namely:
• Corpora available through Korp, Språk-banken's infrastrusture for maintaining and sear-ching Swedish corpora (Borin et al., 2012b). Allcorpora in Korp are accessible via web servicesand contain linguistic annotation: lemmas, parts-of-speech, morphosyntactic information, depen-dency relations.
• Lexical resources available through Karp,Språkbanken's lexical infrastructure (Borin et al.,2012a): Kelly word list, a frequency-based wordlist of modern Swedish containing 8,500 most im-portant words for language learners with associa-ted CEFR proficiency levels (Volodina & Johans-son Kokkinakis, 2012); and Saldo morphology, amorphology lexicon of Swedish containing all in-
108
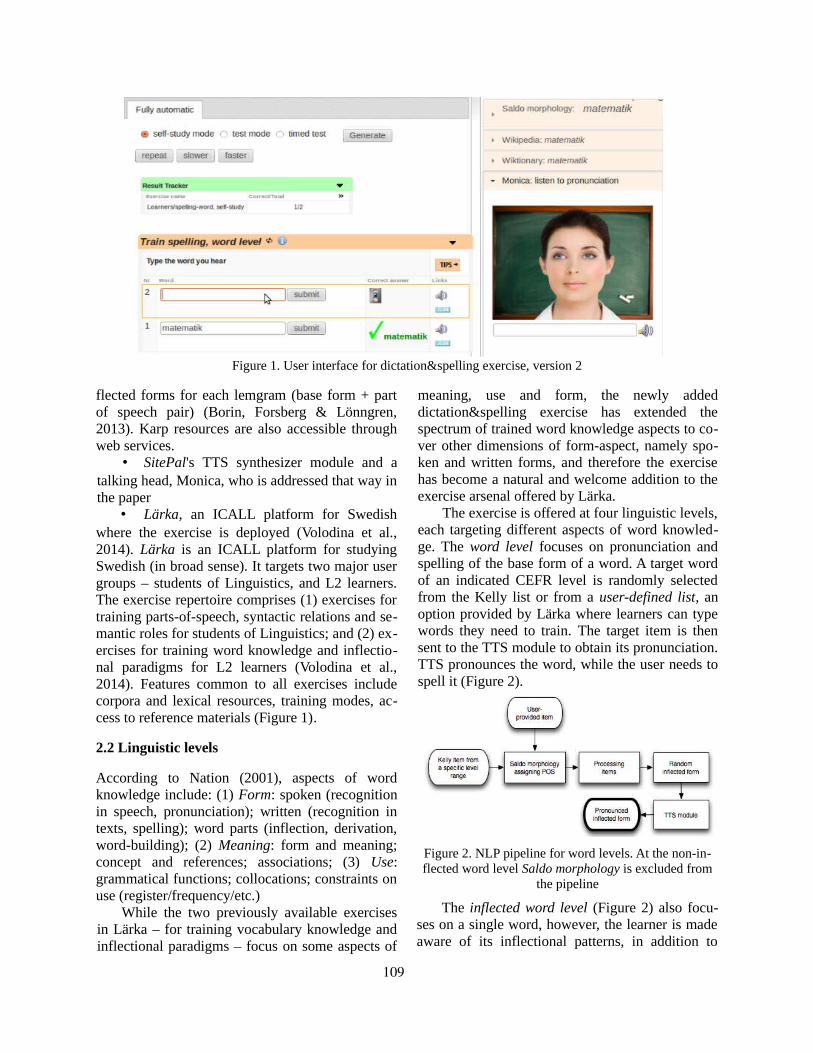
Figure 1. User interface for dictation&spelling exercise, version 2
flected forms for each lemgram (base form + partof speech pair) (Borin, Forsberg & Lönngren,2013). Karp resources are also accessible throughweb services.
• SitePal's TTS synthesizer module and atalking head, Monica, who is addressed that way inthe paper
• Lärka, an ICALL platform for Swedishwhere the exercise is deployed (Volodina et al.,2014). Lärka is an ICALL platform for studyingSwedish (in broad sense). It targets two major usergroups – students of Linguistics, and L2 learners.The exercise repertoire comprises (1) exercises fortraining parts-of-speech, syntactic relations and se-mantic roles for students of Linguistics; and (2) ex-ercises for training word knowledge and inflectio-nal paradigms for L2 learners (Volodina et al.,2014). Features common to all exercises includecorpora and lexical resources, training modes, ac-cess to reference materials (Figure 1).
2.2 Linguistic levels
According to Nation (2001), aspects of wordknowledge include: (1) Form: spoken (recognitionin speech, pronunciation); written (recognition intexts, spelling); word parts (inflection, derivation,word-building); (2) Meaning: form and meaning;concept and references; associations; (3) Use:grammatical functions; collocations; constraints onuse (register/frequency/etc.)
While the two previously available exercisesin Lärka – for training vocabulary knowledge andinflectional paradigms – focus on some aspects of
meaning, use and form, the newly addeddictation&spelling exercise has extended thespectrum of trained word knowledge aspects to co-ver other dimensions of form-aspect, namely spo-ken and written forms, and therefore the exercisehas become a natural and welcome addition to theexercise arsenal offered by Lärka.
The exercise is offered at four linguistic levels,each targeting different aspects of word knowled-ge. The word level focuses on pronunciation andspelling of the base form of a word. A target wordof an indicated CEFR level is randomly selectedfrom the Kelly list or from a user-defined list, anoption provided by Lärka where learners can typewords they need to train. The target item is thensent to the TTS module to obtain its pronunciation.TTS pronounces the word, while the user needs tospell it (Figure 2).
Figure 2. NLP pipeline for word levels. At the non-in-flected word level Saldo morphology is excluded from
the pipeline
The inflected word level (Figure 2) also focu-ses on a single word, however, the learner is madeaware of its inflectional patterns, in addition to
109

pronunciation and spelling (learners have to spellthe inflected form they hear). Analogous to theword level, the target word is randomly selectedfrom the Kelly list or the user-defined list. Beforethe item is sent to the TTS module, its different in-flected forms are checked in Saldo-morphology,whereas some of the forms, e.g. possessives, areexcluded as inappropriate for training through dic-tation. One random form is used for training.
The phrase level offers the target word in sometypical context, which alongside demonstrating theitem's collocational and distributional patterns, alsorequires the user to identify (via listening) thenumber of separate words constituting the phrase.While the implementation for the word and the in-flected word levels was straightforward, the imple-mentation for the phrase level needed some work-around to achieve the best phrase accuracy. In thisexercise version only noun and verb phrases havebeen taken into consideration.
For retrieval of the typical phrase patterns,word pictures associated with the target item areretrieved from Korp. A fragment of a word picturefor the noun ord [word], is shown in Figure 3. Thecolumns on top of Figure 4 provide the most dis-tinguished collocation patterns (prepositions, pre-modifiers, post-modifiers), underneath followed bythe actual lemmas alongside with the number ofhits in the corpora. Most typical prepositions usedwith the noun ord are (in translation): with, wit-hout, behind, against, beyond. Most typical pre-modifiers are: free, ugly, beautiful, hard, empty.
Figure 3. Word picture for the noun ord [word] in Korp
The number accompanying each of the collo-cates reflects the number of hits in the corpus. Forexample, fri 2353 on top of the second column me-ans that the phrase starting with a pre-modifier fri[free] has a pattern fri + ord and has been used2353 times in the corpora where we performed oursearch. To extract the actual phrase containing friord, another request is forwarded to Korp where
the actual corpus hits are returned (the 2353 ofthem). Then, any of the sentences can be used forextracting the actual phrase preserving inflectionsand words that come in-between, e.g. fria tankaroch ord [free thoughts and words]. After some ex-periments, we have set the limit at max 6 tokensper phrase.
Figure 4. NLP pipeline for the phrase level
The final flow of the exercise generation at thephrase level is shown in Figure 4: A random itemfrom the Kelly list is forwarded to the Korp's wordpicture web-service, one of the top frequent pat-terns is selected and the actual KWIC hits are con-sulted. After the phrase has been selected and adju-sted, it is sent to the TTS module for pronuncia-tion. In case of a user-defined word list, the ran-domly selected item is first sent to Saldo-morpho-logy to check possible word classes associatedwith the item, one is selected and sent further toKorp for extracting a word picture.
Figure 5. NLP pipeline for the sentence level.
The sentence level offers the target item in asentence context, which sets further demands onlistening comprehension and awareness of structu-res that the target word can be used in. The sen-tence level is the most challenging for the users,since sentences are usually long and it is difficultto remember all information. Programmatically,though, it is less challenging than the phrase level,
110
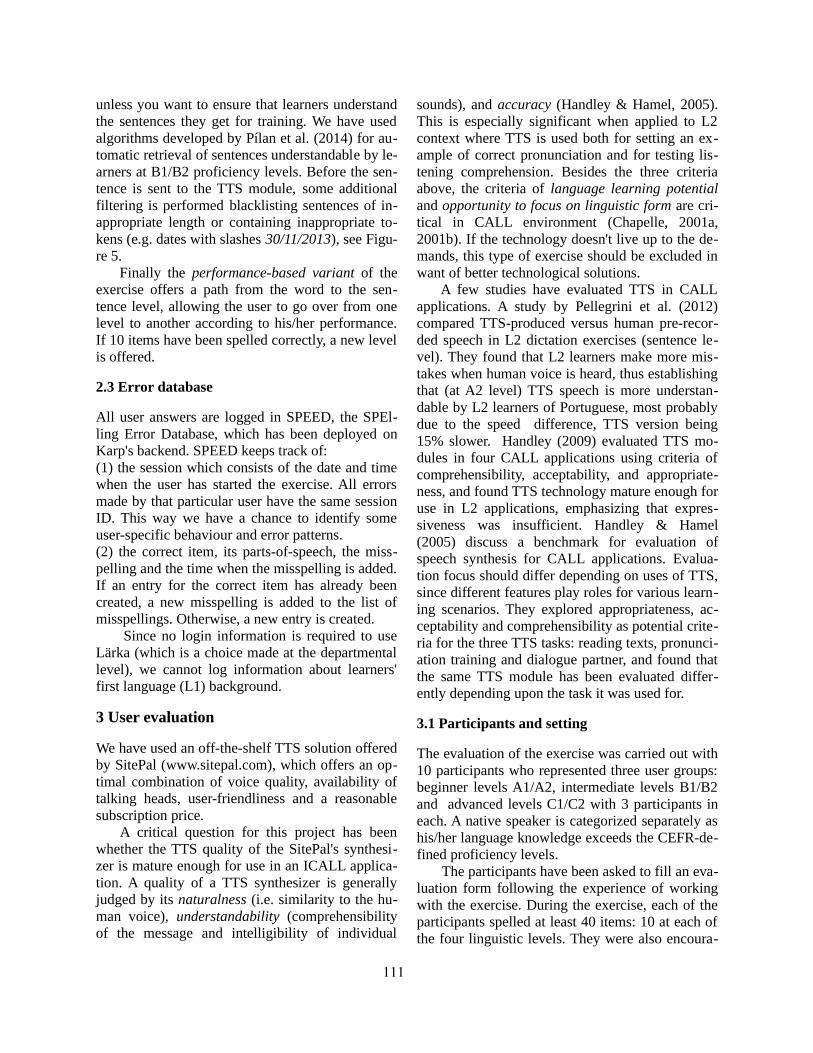
unless you want to ensure that learners understandthe sentences they get for training. We have usedalgorithms developed by Pílan et al. (2014) for au-tomatic retrieval of sentences understandable by le-arners at B1/B2 proficiency levels. Before the sen-tence is sent to the TTS module, some additionalfiltering is performed blacklisting sentences of in-appropriate length or containing inappropriate to-kens (e.g. dates with slashes 30/11/2013), see Figu-re 5.
Finally the performance-based variant of theexercise offers a path from the word to the sen-tence level, allowing the user to go over from onelevel to another according to his/her performance.If 10 items have been spelled correctly, a new levelis offered.
2.3 Error database
All user answers are logged in SPEED, the SPEl-ling Error Database, which has been deployed onKarp's backend. SPEED keeps track of: (1) the session which consists of the date and timewhen the user has started the exercise. All errorsmade by that particular user have the same sessionID. This way we have a chance to identify someuser-specific behaviour and error patterns. (2) the correct item, its parts-of-speech, the miss-pelling and the time when the misspelling is added.If an entry for the correct item has already beencreated, a new misspelling is added to the list ofmisspellings. Otherwise, a new entry is created.
Since no login information is required to useLärka (which is a choice made at the departmentallevel), we cannot log information about learners'first language (L1) background.
3 User evaluation
We have used an off-the-shelf TTS solution offeredby SitePal (www.sitepal.com), which offers an op-timal combination of voice quality, availability oftalking heads, user-friendliness and a reasonablesubscription price.
A critical question for this project has beenwhether the TTS quality of the SitePal's synthesi-zer is mature enough for use in an ICALL applica-tion. A quality of a TTS synthesizer is generallyjudged by its naturalness (i.e. similarity to the hu-man voice), understandability (comprehensibilityof the message and intelligibility of individual
sounds), and accuracy (Handley & Hamel, 2005).This is especially significant when applied to L2context where TTS is used both for setting an ex-ample of correct pronunciation and for testing lis-tening comprehension. Besides the three criteriaabove, the criteria of language learning potentialand opportunity to focus on linguistic form are cri-tical in CALL environment (Chapelle, 2001a,2001b). If the technology doesn't live up to the de-mands, this type of exercise should be excluded inwant of better technological solutions.
A few studies have evaluated TTS in CALLapplications. A study by Pellegrini et al. (2012)compared TTS-produced versus human pre-recor-ded speech in L2 dictation exercises (sentence le-vel). They found that L2 learners make more mis-takes when human voice is heard, thus establishingthat (at A2 level) TTS speech is more understan-dable by L2 learners of Portuguese, most probablydue to the speed difference, TTS version being15% slower. Handley (2009) evaluated TTS mo-dules in four CALL applications using criteria ofcomprehensibility, acceptability, and appropriate-ness, and found TTS technology mature enough foruse in L2 applications, emphasizing that expres-siveness was insufficient. Handley & Hamel(2005) discuss a benchmark for evaluation ofspeech synthesis for CALL applications. Evalua-tion focus should differ depending on uses of TTS,since different features play roles for various learn-ing scenarios. They explored appropriateness, ac-ceptability and comprehensibility as potential crite-ria for the three TTS tasks: reading texts, pronunci-ation training and dialogue partner, and found thatthe same TTS module has been evaluated differ-ently depending upon the task it was used for.
3.1 Participants and setting
The evaluation of the exercise was carried out with10 participants who represented three user groups:beginner levels A1/A2, intermediate levels B1/B2and advanced levels C1/C2 with 3 participants ineach. A native speaker is categorized separately ashis/her language knowledge exceeds the CEFR-de-fined proficiency levels.
The participants have been asked to fill an eva-luation form following the experience of workingwith the exercise. During the exercise, each of theparticipants spelled at least 40 items: 10 at each ofthe four linguistic levels. They were also encoura-
111
ged to test performance-based level. All along themisspellings have been saved to the error database.
3.2 Questionnaire
The purpose of the evaluation has been primarilyto evaluate the text-to-speech module and to assessthe usefulness of the exercise, based on L2 learnerpreferences. We have used criteria suggested byHandley and Hamel (2005) and Chapelle (2001a,2001b) as the basis for our evaluation adding somemore questions.
The questionnaire contained 15 questions, ofwhich five were focused on the TTS quality (ques-tions #3-7, Table 1), six - on the exercise and its ef-fectiveness (#8-14), one explicitly asking for thetype of feedback learners expect from the program(#15), and the rest were devoted to the user-friend-liness of the GUI (#1-2)1.
All questions (except #15) were evaluated ac-cording to a 5-grade scale, where 1 correspondedto very good and 5 to very poor. Additionally, theevaluators had the possibility to add comments forevery question and at the end of the questionnaire.
Table 1. Results by question & proficiency level, on thescale 1=very good … 5=very poor
3.3 Evaluation results and discussion
According to the evaluation results (Table 1), thetalking head (#5) appears to be the least effectiveelement in the spelling exercises. The unsatisfyingresults for the speaking head are based hypotheti-cally on the missing facial expression and on its lo-cation within the spelling game. Compared to thevirtual language teacher Ville, which was deve-loped specifically for educational purposes, the Si-tePal's talking head seems to have a rather entertai-ning function. The expressive lip movement that is1Full questionnaire form can be downloaded from http://spraakbanken.gu.se/eng/larka/tts
characteristic of Ville, is clearly missing from Mo-nica.
The pronunciation generated by the TTS mo-dule (#7), however, is regarded as good despitecomments on some smaller pronunciation errors.The user interface (#2) and the quality of pronunci-ation (#7) are the most satisfactory features. Thenaturalness of speech (#6) is perceived differentlyamong the participants. While the beginner groupfinds the TTS-produced speech natural and hu-man-like, the advanced group perceives it as leastnatural. This result is not very surprising as the be-ginner group is not familiar with the language andtherefore is not able to critically judge the natural-ness of speech. The native speaker is in generalvery positive towards the TTS system.
Table 1 shows clearly that the word/inflectedword levels (#9) are the most appropriate units fortraining spelling followed by the phrase level(#10). Phrases need to be adapted to the respectiveproficiency level in order to achieve the best lear-ning effect. The sentence level (#11) is assessed asthe least appropriate one, as the length and thespeed rate have been perceived unsuitable for trai-ning spelling and listening. The results demonstra-te that the learning potential at the word and phra-se levels is higher than at the sentence level, asperceived by L2 learners.
The results by proficiency level (Table 1) showthat there is an obvious tendency to become morecritical as the level grows. The proficiency groupC1/C2 is the least satisfied one, while the nativespeaker is the most positive. The reason for thatmight be that language learners from higher profi-ciency levels are more critical as their knowledgeof the language is better and therefore TTS mis-takes are more noticeable, while TTS mistakesmight not be that obvious to the learners withlower levels of proficiency. The vocabulary chosenfor training spelling and listening at lower levelsmay also be easier for the TTS system to pro-nounce. The native speaker shows in general a verypositive attitude towards the spelling game as (s)hemight be more aware of the difficulty of the lan-guage and is therefore more ‘forgiving’. Anotherreason might be that the native speaker does notassess the spelling exercise from the learner’s pointof view and might therefore be less critical.
When it comes to the word level (#9), with theincrease of learners' proficiency dissatisfaction alsoincreases (Figure 6). The reason for that might be
112
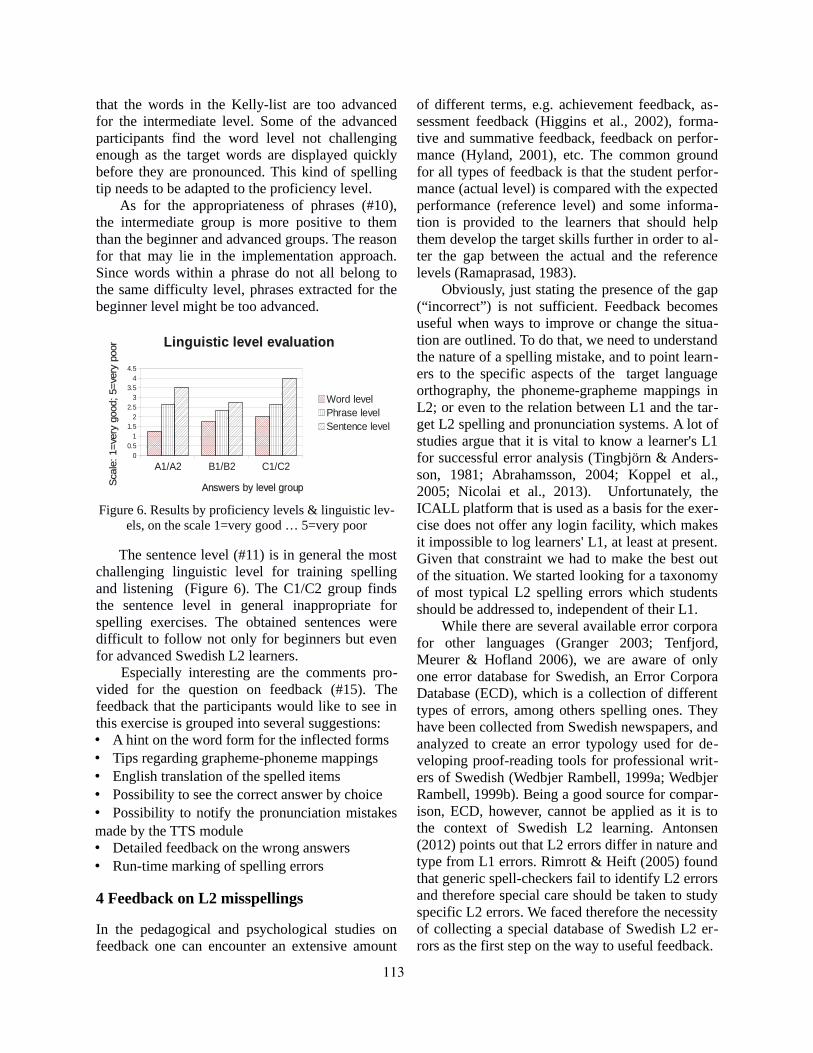
that the words in the Kelly-list are too advancedfor the intermediate level. Some of the advancedparticipants find the word level not challengingenough as the target words are displayed quicklybefore they are pronounced. This kind of spellingtip needs to be adapted to the proficiency level.
As for the appropriateness of phrases (#10),the intermediate group is more positive to themthan the beginner and advanced groups. The reasonfor that may lie in the implementation approach.Since words within a phrase do not all belong tothe same difficulty level, phrases extracted for thebeginner level might be too advanced.
A1/A2 B1/B2 C1/C20
0.51
1.52
2.53
3.54
4.5
Linguistic level evaluationLinguistic level evaluation
Word levelPhrase levelSentence level
Answers by level groupAnswers by level groupSca
le:
1=ve
ry g
ood;
5=ve
ry p
oor
Sca
le:
1=ve
ry g
ood;
5=ve
ry p
oor
Figure 6. Results by proficiency levels & linguistic lev-els, on the scale 1=very good … 5=very poor
The sentence level (#11) is in general the mostchallenging linguistic level for training spellingand listening (Figure 6). The C1/C2 group findsthe sentence level in general inappropriate forspelling exercises. The obtained sentences weredifficult to follow not only for beginners but evenfor advanced Swedish L2 learners.
Especially interesting are the comments pro-vided for the question on feedback (#15). Thefeedback that the participants would like to see inthis exercise is grouped into several suggestions:• A hint on the word form for the inflected forms• Tips regarding grapheme-phoneme mappings• English translation of the spelled items• Possibility to see the correct answer by choice• Possibility to notify the pronunciation mistakesmade by the TTS module• Detailed feedback on the wrong answers• Run-time marking of spelling errors
4 Feedback on L2 misspellings
In the pedagogical and psychological studies onfeedback one can encounter an extensive amount
of different terms, e.g. achievement feedback, as-sessment feedback (Higgins et al., 2002), forma-tive and summative feedback, feedback on perfor-mance (Hyland, 2001), etc. The common groundfor all types of feedback is that the student perfor-mance (actual level) is compared with the expectedperformance (reference level) and some informa-tion is provided to the learners that should helpthem develop the target skills further in order to al-ter the gap between the actual and the referencelevels (Ramaprasad, 1983).
Obviously, just stating the presence of the gap(“incorrect”) is not sufficient. Feedback becomesuseful when ways to improve or change the situa-tion are outlined. To do that, we need to understandthe nature of a spelling mistake, and to point learn-ers to the specific aspects of the target languageorthography, the phoneme-grapheme mappings inL2; or even to the relation between L1 and the tar-get L2 spelling and pronunciation systems. A lot ofstudies argue that it is vital to know a learner's L1for successful error analysis (Tingbjörn & Anders-son, 1981; Abrahamsson, 2004; Koppel et al.,2005; Nicolai et al., 2013). Unfortunately, theICALL platform that is used as a basis for the exer-cise does not offer any login facility, which makesit impossible to log learners' L1, at least at present.Given that constraint we had to make the best outof the situation. We started looking for a taxonomyof most typical L2 spelling errors which studentsshould be addressed to, independent of their L1.
While there are several available error corporafor other languages (Granger 2003; Tenfjord,Meurer & Hofland 2006), we are aware of onlyone error database for Swedish, an Error CorporaDatabase (ECD), which is a collection of differenttypes of errors, among others spelling ones. Theyhave been collected from Swedish newspapers, andanalyzed to create an error typology used for de-veloping proof-reading tools for professional writ-ers of Swedish (Wedbjer Rambell, 1999a; WedbjerRambell, 1999b). Being a good source for compar-ison, ECD, however, cannot be applied as it is tothe context of Swedish L2 learning. Antonsen(2012) points out that L2 errors differ in nature andtype from L1 errors. Rimrott & Heift (2005) foundthat generic spell-checkers fail to identify L2 errorsand therefore special care should be taken to studyspecific L2 errors. We faced therefore the necessityof collecting a special database of Swedish L2 er-rors as the first step on the way to useful feedback.
113
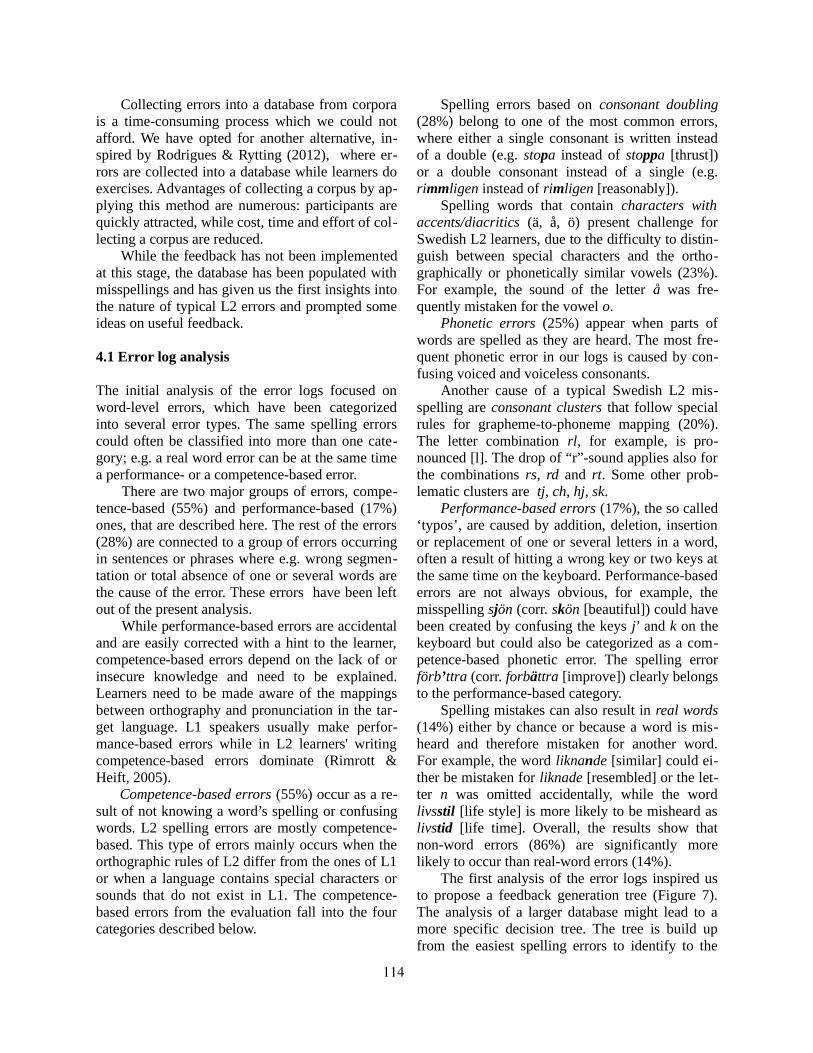
Collecting errors into a database from corporais a time-consuming process which we could notafford. We have opted for another alternative, in-spired by Rodrigues & Rytting (2012), where er-rors are collected into a database while learners doexercises. Advantages of collecting a corpus by ap-plying this method are numerous: participants arequickly attracted, while cost, time and effort of col-lecting a corpus are reduced.
While the feedback has not been implementedat this stage, the database has been populated withmisspellings and has given us the first insights intothe nature of typical L2 errors and prompted someideas on useful feedback.
4.1 Error log analysis
The initial analysis of the error logs focused onword-level errors, which have been categorizedinto several error types. The same spelling errorscould often be classified into more than one cate-gory; e.g. a real word error can be at the same timea performance- or a competence-based error.
There are two major groups of errors, compe-tence-based (55%) and performance-based (17%)ones, that are described here. The rest of the errors(28%) are connected to a group of errors occurringin sentences or phrases where e.g. wrong segmen-tation or total absence of one or several words arethe cause of the error. These errors have been leftout of the present analysis.
While performance-based errors are accidentaland are easily corrected with a hint to the learner,competence-based errors depend on the lack of orinsecure knowledge and need to be explained.Learners need to be made aware of the mappingsbetween orthography and pronunciation in the tar-get language. L1 speakers usually make perfor-mance-based errors while in L2 learners' writingcompetence-based errors dominate (Rimrott &Heift, 2005).
Competence-based errors (55%) occur as a re-sult of not knowing a word’s spelling or confusingwords. L2 spelling errors are mostly competence-based. This type of errors mainly occurs when theorthographic rules of L2 differ from the ones of L1or when a language contains special characters orsounds that do not exist in L1. The competence-based errors from the evaluation fall into the fourcategories described below.
Spelling errors based on consonant doubling(28%) belong to one of the most common errors,where either a single consonant is written insteadof a double (e.g. stopa instead of stoppa [thrust])or a double consonant instead of a single (e.g.rimmligen instead of rimligen [reasonably]).
Spelling words that contain characters withaccents/diacritics (ä, å, ö) present challenge forSwedish L2 learners, due to the difficulty to distin-guish between special characters and the ortho-graphically or phonetically similar vowels (23%).For example, the sound of the letter å was fre-quently mistaken for the vowel o.
Phonetic errors (25%) appear when parts ofwords are spelled as they are heard. The most fre-quent phonetic error in our logs is caused by con-fusing voiced and voiceless consonants.
Another cause of a typical Swedish L2 mis-spelling are consonant clusters that follow specialrules for grapheme-to-phoneme mapping (20%).The letter combination rl, for example, is pro-nounced [l]. The drop of “r”-sound applies also forthe combinations rs, rd and rt. Some other prob-lematic clusters are tj, ch, hj, sk.
Performance-based errors (17%), the so called‘typos’, are caused by addition, deletion, insertionor replacement of one or several letters in a word,often a result of hitting a wrong key or two keys atthe same time on the keyboard. Performance-basederrors are not always obvious, for example, themisspelling sjön (corr. skön [beautiful]) could havebeen created by confusing the keys j’ and k on thekeyboard but could also be categorized as a com-petence-based phonetic error. The spelling errorförb’ttra (corr. forbättra [improve]) clearly belongsto the performance-based category.
Spelling mistakes can also result in real words(14%) either by chance or because a word is mis-heard and therefore mistaken for another word.For example, the word liknande [similar] could ei-ther be mistaken for liknade [resembled] or the let-ter n was omitted accidentally, while the wordlivsstil [life style] is more likely to be misheard aslivstid [life time]. Overall, the results show thatnon-word errors (86%) are significantly morelikely to occur than real-word errors (14%).
The first analysis of the error logs inspired usto propose a feedback generation tree (Figure 7).The analysis of a larger database might lead to amore specific decision tree. The tree is build upfrom the easiest spelling errors to identify to the
114
more difficult ones. All along the error analysis,relevant feedback is provided. If multiple changesare necessary, they are advised step-wise. In casethe spelling error cannot be classified, the correctitem is shortly exposed.
Figure 7. Feedback generation tree
The proposed feedback generation flow wouldallow to offer the kind of information that can helplearners to fill the gap between the reference andthe actual level of the assessed spelling error.
5 Concluding remarks
The goals of this project have been, firstly, the im-plementation of a Swedish dictation&spelling ex-ercise that can provide L2 learners with a tool fortraining spelling and listening at different linguisticlevels; and secondly, the evaluation of the newlyimplemented module regarding its effectivenessand usefulness. The main focus of the evaluation,
in its turn, was to find out whether the TTS tech-nology is mature enough for the use in L2 contextand to suggest a way to provide useful feedback onL2 specific misspellings.
The state of TTS development looks verypromising for integration of the current TTS syn-thesizer for Swedish L2 learning. Some improve-ments might be in place on the Lärka side, espe-cially regarding the placement of the talking headon the screen and adjustment of the pronunciationspeed to the level of the learner. However, the nat-uralness and understandability of the SitePal's TTSmodule hold a very good level.
The issue of homophones should be solved atword levels, either by counting alternativespellings as correct ones (e.g. flour vs flower) orby offering learners an additional possibility tohear the item in a context of a phrase or a sentence.The latter should help distinguish errors that arisedue to learners' inability to recognize the word pro-nounced out of context versus their not knowinghow to spell the word.
Besides, a broader spectrum of lexical re-sources and detailed feedback are necessary. Thetaxonomy of spelling errors shows that generatingfeedback for easily identifiable spelling errors isstraightforward while more work is necessary tounderstand the nature of other types of errors.More detailed evaluations with larger number ofparticipants, and repeated analysis of more exten-sive error logs are necessary to refine the feedbackgeneration tree. Other suggestions on feedbackproposed by evaluation participants will be consid-ered for implementation.
The vocabulary for the word level needs to beexpanded with larger lexical resources and domainspecific vocabulary lists. The generation pace ofphrases has to be accelerated, and the phrase levelneeds to be adapted to the proficiency level. Sincethe sentence level is regarded as the least effectiveone, most improvements are due on this level. Thesentence length as well as the speech rate need tobe adapted to the proficiency level.
In order to assess the spelling exercises fromthe pedagogical point of view, an in-class evalua-tion with teachers needs to be carried out once anew version is in place.
115
References
Niclas Abrahamsson. 2004. Fonologiska aspekter på an-draspråksinlärning och svenska som andraspråk. In:Hyltenstam Kenneth & Lindberg Inger (eds.) Svenskasom andraspråk: i forskning, undervisning ochsamhälle. Lund: Studentlitteratur.
Luiz Amaral & Detmar Meurers. 2011. On using intelli-gent computer-assisted language learning in real-lifefor-eign language teaching and learning. ReCALL23(1): 4–24.
Lene Antonsen. 2012. Improving feedback on L2 mis-spellings – an FST approach. Proceedings of theSLTC 2012 workshop on NLP for CALL. LinköpingElectronic Conference Proceedings 80: 1–10.
Yigal Attali & Jill Burstein. 2006. Automated essayscoring with e-rater® V.2. The Journal of Technol-ogy, Learning and Assessment 4 (3).
Eckhard Bick. 2001. The VISL System: Research andApplicative Aspects of IT-based learning. Proceed-ings of NoDaLiDa. Uppsala, Sweden.
Eckhard Bick. 2005. Grammar for Fun: IT-based Gram-mar Learning with VISL. In: Henriksen, Peter Juel(ed.), CALL for the Nordic Languages. p.49-64.Copenhagen: Samfundslitteratur (Copenhagen Stud-ies in Language).
Johnny Bigert, Viggo Kann, Ola Knutsson & JonasSjöbergh. 2005. Grammar Checking for SwedishSecond Language Learners. Chapter in CALL for theNordic Languages p. 33-47. Copenhagen Studies inLanguage 30, Copenhagen Business School. Sam-fundslitteratur.
Lars Borin, Markus Forsberg & Lennart Lönngren.2013. SALDO: a touch of yin to WordNet’s yang.Language Resources and Evaluation, 1-21.
Lars Borin, Markus Forsberg, Leif-Jöran Olsson &Jonatan Uppström. 2012a. The open lexical infra-structure of Språkbanken. Proceedings of LREC2012. Istanbul: ELRA. 3598–3602.
Lars Borin, Markus Forsberg & Johan Roxendal. 2012b.Korp – the corpus infrastructure of Språkbanken.Proceedings of LREC 2012. Istanbul: ELRA. 474–478.
Lars Borin & Anju Saxena. 2004. Grammar, Incorpo-rated. In Peter Juel Henrichsen (ed.), CALL for theNordic Languages. Copenhagen Studies in Language30. p.125-145. Copenhagen: Samfundslitteratur.
Jill Burstein,Jane Shore, John Sabatini, Y Lee, MatthewVentura. 2007. Developing a reading support tool for
English language learners. Demo Proceedings ofNAACL-HLT.
Carol Chapelle. 2001a. Innovative language learning:Achieving the vision. ReCALL, 23(10), 3-14
Carol Chapelle. 2001b. Computer applications in sec-ond language acquisition: Foundations for teachingtesting and research. Cambridge, England: Cam-bridge University Press.
COE, Council of Europe. 2001. The Common EuropeanFramework of Reference for Languages: Learning,Teaching, Assessment. Cambridge University Press.
David Coniam. 2013. Computerized dictation for as-sessing listening proficiency. CALICO Journal,Vol.13., Nr 2&3.
Thomas François & Cedrik Fairon. 2012. An “AI read-ability” formula for French as a foreign language InProceedings of the 2012 Conference on EmpiricalMethods in Natural Language Processing (EMNLP2012), Jeju, 466-477.
Sylviane Granger. 2003. Error-tagged Learner Corporaand CALL: A Promising Synergy. CALICO Journal,20(3), p-p 465-480.
Zöe Handley. 2009. Is text-to-speech synthesis ready foruse in computer-assisted language learning? SpeechCommunication , vol. 51, no. 10, pp. 906–919, 2009.
Zöe Handley & Marie-Josée Hamel. 2005. Establishinga methodology for benchmarking speech synthesisfor Computer-Assisted Language Learning (CALL).Language Learning & Technology, Vol. 9, No. 3, pp.99-119
Trude Heift. 2003. Multiple learner errors and meaning-ful feedback: A challenge for ICALL systems.CALICO Journal, 20(3), 533–548.
Shang-Ming Huang, Chao-Lin Liu, and Zhao-MingGao. 2005. Computer-assisted item generation for lis-tening cloze tests and dictation practice in English.in Proc. of ICWL, pp. 197–208.
Michael Heilman, & Maxine Eskenazi. (2006). Lan-guage Learning: Challenges for Intelligent TutoringSystems. Workshop on Ill-defined Domains in Intelli-gent Tutoring, Taiwan
Richard Higgins, Peter Hartley & Alan Skelton. 2002.“The Conscientious Consumer: reconsidering the roleof assessment feedback in student learning”. Studiesin Higher Education, Vol.27, No.1, p.53-64
Fiona Hyland. 2001. Providing Effective Support: in-vestigating feedback to distance language learners.Open Learning, Vol.16. No.3, p.233-247.
116
Moshe Koppel, Jonathan Schler, & Kfir Zigdon. 2005.Determining an authors' native language by mining atext for errors. In Proceedings of the 11th ACMSIGKDD international conference, 624–628.
José Lopes, Isabel Trancoso, Rui Correia, Thomas Pel-legrini, Hugo Meinedo, Nuno Mamede, & MaxineEskenazi. 2010. Multimedia Learning Materials. InProc. IEEE Workshop on Spoken Language Technol-ogy SLT, Berkeley, pp. 109–114.
Ruslan Mitkov & Le An Ha. 2003. Computer-AidedGeneration of Multiple-Choice Tests. Proceedings ofthe HLT-NAACL 2003 Workshop on Building Educa-tional Applications Using Natural Language Process-ing, 17-22.
William Monaghan & Brent Bridgeman. 2005. E-Rateras a Quality Control on Human Scores. ETS R&DConnections: Princeton, NJ: ETS.
Noriko Nagata. 2009. Robo-Sensei‘s NLP-based errordetec-tion and feed-back generation. CALICO Jour-nal, 26(3), 562–579.
Paul Nation. 2001. Learning Vocabulary in AnotherLanguage, Cambridge University Press, p.477
Garrett Nicolai, Bradley Hauer, Mohammad Salameh,LeiYao, Grzegorz Kondrak. 2013. Cognate and Mis-spelling Features for Natural Language Identifica-tion. In Proceedings of NAACL-BEA8.
Kristina Nilsson & Lars Borin. 2002. Living off theLand: The Web as a Source of Practice Texts forLearners of Less Prevalent Languages. Proceedingsof LREC 2002, Third International Conference onLanguage Resources and Evaluation p.411-418. LasPalmas: ELRA.
Thomas Pellegrini, Ângela Costa, Isabel Trancoso.2012. Less errors with TTS? A dictation experimentwith foreign language learners. Thirteenth AnnualConference of the International Speech Communica-tion Association
Ildikó Pilán, Elena Volodina and Richard Johansson.2014. Rule-based and machine learning approachesfor second language sentence-level readability. Pro-ceedings of the 9th workshop on Building Educa-tional Applications Using NLP, ACL 2014.
Arkalgud Ramaprasad. 1983. On the definition of feed-back. Behavioural Science, Vol.28, p.4-13.
Anne Rimrott & Trude Heift. 2005. Language Learnersand Generic Spell Checkers in CALL. CALICO jour-nal, Vol.23, No.1.
Paul Rodrigues & C. Anton Rytting. 2012. Typing RaceGames as a Method to Create Spelling Error Corpora.LREC 2012.
C. Santiago-Oriola. 1999. Vocal synthesis in a comput-erized dictation exercise. In Proc. of Eurospeech,1999.
Gunnar Tingbjörn, Anders-Börje Andersson. 1981. In-vandrarbarnen och tvåspråkigheten : rapport från ettforskningsprojekt om hur invandrarbarn med olikaförstaspråk lär sig svenska. Liber: Skolöverstyrelsen.
Kari Tenfjord, Paul Meurer & Knut Hofland. 2006. TheASK corpus - A Language Learner Corpus of Norwe-gian as a Second Language. Proceedings of LREC2006.
Elena Volodina & Sofie Johansson Kokkinakis. 2012.Introducing Swedish Kelly-list, a new lexical e-re-source for Swedish. LREC 2012, Turkey.
Elena Volodina, Ildikó Pilán, Lars Borin & ThereseLindström Tiedemann. 2014. A flexible languagelearning platform based on language resources andweb services. LREC 2014, Iceland.
Olga Wedbjer Rambell. 1999a. Error Typology for Au-tomatic Proof-reading. Reports from the SCARRIEproject, Ed. Anna Sågvall Hein.
Olga Wedbjer Rambell. 1999b. An Error Database ofSwedish. Reports from the SCARRIE project, Ed.Anna Sågvall Hein.
Preben Wik. 2004. Designing a Virtual Language Tutor.In Proc. of The XVIIth Swedish Phonetics Confer-ence, Fonetik 2004. p. 136-139. Stockholm Univer-sity, Sweden.
Preben Wik. 2011. The Virtual Language Teacher:Models and applications for language learning usingembodied conversational agents. PhD Thesis. KTHRoyal Institute of Technology
Preben Wik & Anna Hjalmarsson. 2009. Embodied con-versational agents in computer assisted languagelearning. Speech communication 51 (10), 1024-1037
Robert Östling, Andre Smolentzov, Björn Tyrefors Hin-nerich & Erik Höglin. 2013. Automated Essay Scor-ing for Swedish. In Proceedings of the Eighth Work-shop on Innovative Use of NLP for Building Educa-tional Applications, pages 42–47, Atlanta, Georgia,June 13 2013. Association for Computational Lin-guistics.
117
Proceedings of the Tenth Workshop on Innovative Use of NLP for Building Educational Applications, 2015, pages 118–123,Denver, Colorado, June 4, 2015. c©2015 Association for Computational Linguistics
The Jinan Chinese Learner Corpus
Maolin Wang1, Shervin Malmasi2 and Mingxuan Huang3
1College of Chinese Language and Culture, Jinan University, Guangzhou, China2Centre for Language Technology, Macquarie University, Sydney, NSW, Australia
3Guangxi University of Finance and Economics, Nanning, China
[email protected], [email protected], [email protected]
Abstract
We present the Jinan Chinese Learner Cor-pus, a large collection of L2 Chinese texts pro-duced by learners that can be used for edu-cational tasks. The present work introducesthe data and provides a detailed description.Currently, the corpus contains approximately6 million Chinese characters written by stu-dents from over 50 different L1 backgrounds.This is a large-scale corpus of learner Chinesetexts which is freely available to researcherseither through a web interface or as a set ofraw texts. The data can be used in NLP tasksincluding automatic essay grading, languagetransfer analysis and error detection and cor-rection. It can also be used in applied and cor-pus linguistics to support Second LanguageAcquisition (SLA) research and the develop-ment of pedagogical resources. Practical ap-plications of the data and future directions arediscussed.
1 Introduction
Despite the rapid growth of learner corpus researchin recent years (Dıaz-Negrillo et al., 2013), no large-scale corpus of second language (L2) Chinese hasbeen made readily available to the research commu-nity.
Learner corpora are often used to investigatelearner language production in an exploratory man-ner in order to generate hypotheses about learnerlanguage. Recently, learner corpora have also beenutilized in various educational NLP tasks includ-ing error detection and correction (Gamon et al.,
2013), Native Language Identification (Tetreault etal., 2013) and language transfer hypothesis formula-tion (Swanson and Charniak, 2014).
While such corpus-based studies have become anaccepted standard in SLA research and relevant NLPtasks, there remains a paucity of large-scale L2 cor-pora. For L2 English, the two main datasets are theICLE (Granger, 2003) and TOEFL11 (Blanchard etal., 2013) corpora, with the latter being the largestpublicly available corpus of non-native English writ-ing.1 However, this data scarcity is far more acutefor L2 other than English and this has not goneunnoticed by the research community (Lozano andMendikoetxea, 2013; Abuhakema et al., 2008).
The present work attempts to address this gap bymaking available the Jinan Chinese Learner Corpus(JCLC), an L2 Chinese corpus designed for use inNLP, corpus linguistics and other educational do-mains. This corpus stands out for its considerablesize and breadth of data collection. Furthermore, thecorpus – an ongoing project since 2006 – continuesto be expanded with new data. In releasing this datawe hope to equip researchers with the data to sup-port numerous research directions2 going forward.
The JCLC is freely available to the research com-munity and accessible via our website.3 It can beused via a web-based interface for querying the data.Alternatively, the original texts can be downloadedin text format for more advanced tasks.
1TOEFL11 contains over 4 million tokens in 12,100 texts.2See section 5 for examples.3http://hwy.jnu.edu.cn/jclc/
118
2 Background
Interest in learning Chinese is rapidly growing, lead-ing to increased research in Teaching Chinese as aForeign Language (TCFL) and the development ofrelated resources such as learner corpora (Chen etal., 2010).
This booming growth in Chinese language learn-ing (Rose and Carson, 2014; Zhao and Huang,2010), related to the dramatic globalization of thepast few decades and a shift in the global languageorder (Tsung and Cruickshank, 2011), has broughtwith it learners from diverse backgrounds. Conse-quently, a key challenge here is the developmentof appropriate resources – language learning tools,assessments and pedagogical materials – driven bylanguage technology, applied linguistics and SLAresearch (Tsung and Cruickshank, 2011). The ap-plication of these tools and SLA research can greatlyassist researchers in creating effective teaching prac-tices and is an area of active research.
This pattern of growing interest in Chinese is alsoreflected in the NLP community, evidenced by thecontinuously increasing research focus on Chinesetools and resources (Wong et al., 2009).
A key application of such corpora is in the field ofSecond Language Acquisition (SLA) which aims tobuild models of language acquisition. One aspect ofSLA is to formulate and test hypotheses about par-ticularly common patterns of difficulty that impedeL2 production among students. This is usually doneusing the natural language produced by learners toidentify deficits in their interlanguage.
A criticism of SLA has been that its empiricalfoundation is weak (Granger, 2002), casting doubtson the generalizability of results. However, this isbeginning to change with the shift towards usinglarge learner corpora. The creation of such corporahas led to an efflorescence of empirical research intolanguage acquisition (Granger, 2002).
The use of NLP and machine learning methodshas also extended to SLA, with a new focus ona combined multidisciplinary approach to develop-ing methods for extracting ranked lists of languagetransfer candidates (Swanson and Charniak, 2014;Malmasi and Dras, 2014c).
3 Data Collection and Design
The JCLC project, started in 2006, aims to createa corpus of non-native Chinese texts, similar to theICLE. The majority of the data has been collectedfrom foreign students learning Chinese at variousuniversities in China, with some data coming fromuniversities outside China. This data includes bothexams and assignments. The texts are manuallytranscribed with all errors being maintained. Errorannotations are not available at this stage.
In order to be representative, the corpus includesstudent data from a wide range of countries and pro-ficiency levels. 59 different nationalities are repre-sented in the corpus. Proficiency levels are classifiedaccording to the length of study and include: begin-ners (less than 1 year), intermediate (2-3 years) andadvanced (3+ years). In selecting texts for inclusion,we strived to maximize representativeness across allproficiencies.
3.1 Data FormatThe learner texts are made available as Unicode(UTF-8) text files to ensure maximum compatibilitywith linguistic and NLP tools.
3.2 MetadataIn order to support different research directions, ex-tensive metadata about each text has been recorded.This metadata is available in text, CSV and Mi-crosoft Excel format. The variables are outlined be-low.
Writing ID A unique id assigned to each text.
Writing Type Either exam or assignment.
Student ID While student names are redacted,they are each assigned a unique ID which allows forthe analysis of longitudinal data in the corpus.
Date The submission date of the writing also en-ables longitudinal analysis of a student’s data.
Gender, Age and Education level This data al-lows the investigation of other research questions,e.g. the critical age hypothesis (Birdsong, 1999).
Native Language This variable is helpful instudying language transfer effects by taking into ac-count the author’s native language.
119
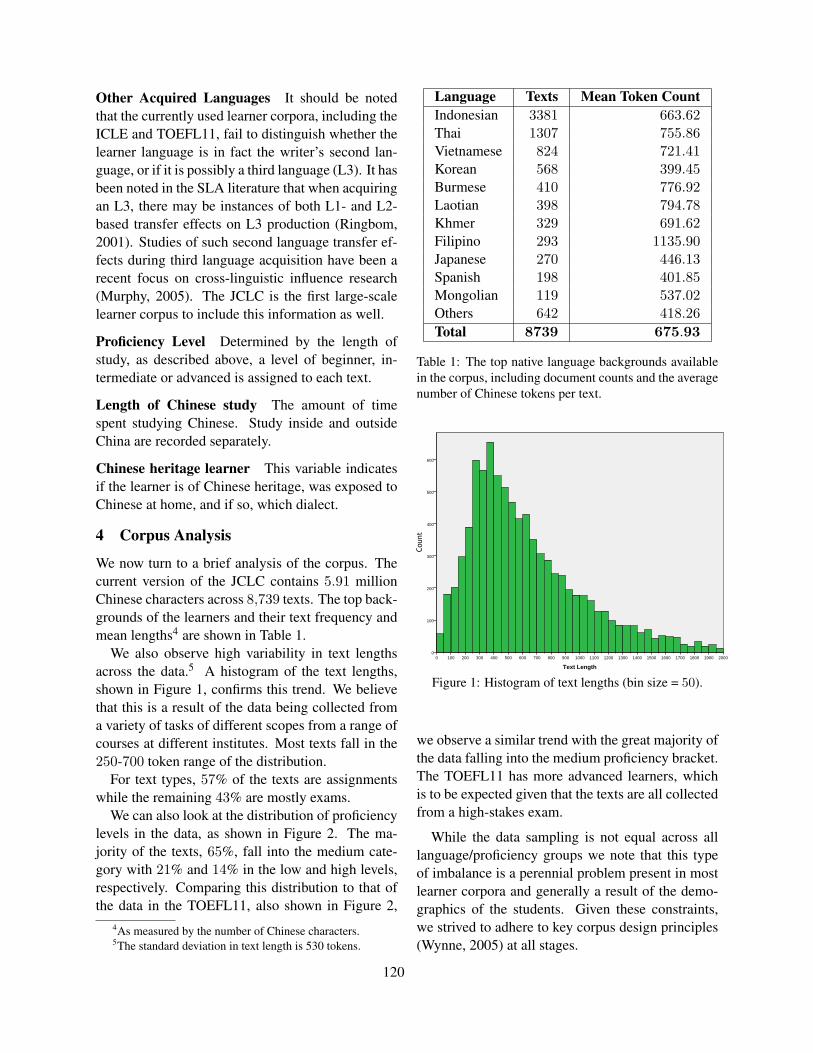
Other Acquired Languages It should be notedthat the currently used learner corpora, including theICLE and TOEFL11, fail to distinguish whether thelearner language is in fact the writer’s second lan-guage, or if it is possibly a third language (L3). It hasbeen noted in the SLA literature that when acquiringan L3, there may be instances of both L1- and L2-based transfer effects on L3 production (Ringbom,2001). Studies of such second language transfer ef-fects during third language acquisition have been arecent focus on cross-linguistic influence research(Murphy, 2005). The JCLC is the first large-scalelearner corpus to include this information as well.
Proficiency Level Determined by the length ofstudy, as described above, a level of beginner, in-termediate or advanced is assigned to each text.
Length of Chinese study The amount of timespent studying Chinese. Study inside and outsideChina are recorded separately.
Chinese heritage learner This variable indicatesif the learner is of Chinese heritage, was exposed toChinese at home, and if so, which dialect.
4 Corpus Analysis
We now turn to a brief analysis of the corpus. Thecurrent version of the JCLC contains 5.91 millionChinese characters across 8,739 texts. The top back-grounds of the learners and their text frequency andmean lengths4 are shown in Table 1.
We also observe high variability in text lengthsacross the data.5 A histogram of the text lengths,shown in Figure 1, confirms this trend. We believethat this is a result of the data being collected froma variety of tasks of different scopes from a range ofcourses at different institutes. Most texts fall in the250-700 token range of the distribution.
For text types, 57% of the texts are assignmentswhile the remaining 43% are mostly exams.
We can also look at the distribution of proficiencylevels in the data, as shown in Figure 2. The ma-jority of the texts, 65%, fall into the medium cate-gory with 21% and 14% in the low and high levels,respectively. Comparing this distribution to that ofthe data in the TOEFL11, also shown in Figure 2,
4As measured by the number of Chinese characters.5The standard deviation in text length is 530 tokens.
Language Texts Mean Token CountIndonesian 3381 663.62Thai 1307 755.86Vietnamese 824 721.41Korean 568 399.45Burmese 410 776.92Laotian 398 794.78Khmer 329 691.62Filipino 293 1135.90Japanese 270 446.13Spanish 198 401.85Mongolian 119 537.02Others 642 418.26Total 8739 675.93
Table 1: The top native language backgrounds availablein the corpus, including document counts and the averagenumber of Chinese tokens per text.
Coun
t
600
500
400
300
200
100
0
Text Length
200019001800170016001500140013001200110010009008007006005004003002001000
Page 1
Figure 1: Histogram of text lengths (bin size = 50).
we observe a similar trend with the great majority ofthe data falling into the medium proficiency bracket.The TOEFL11 has more advanced learners, whichis to be expected given that the texts are all collectedfrom a high-stakes exam.
While the data sampling is not equal across alllanguage/proficiency groups we note that this typeof imbalance is a perennial problem present in mostlearner corpora and generally a result of the demo-graphics of the students. Given these constraints,we strived to adhere to key corpus design principles(Wynne, 2005) at all stages.
120
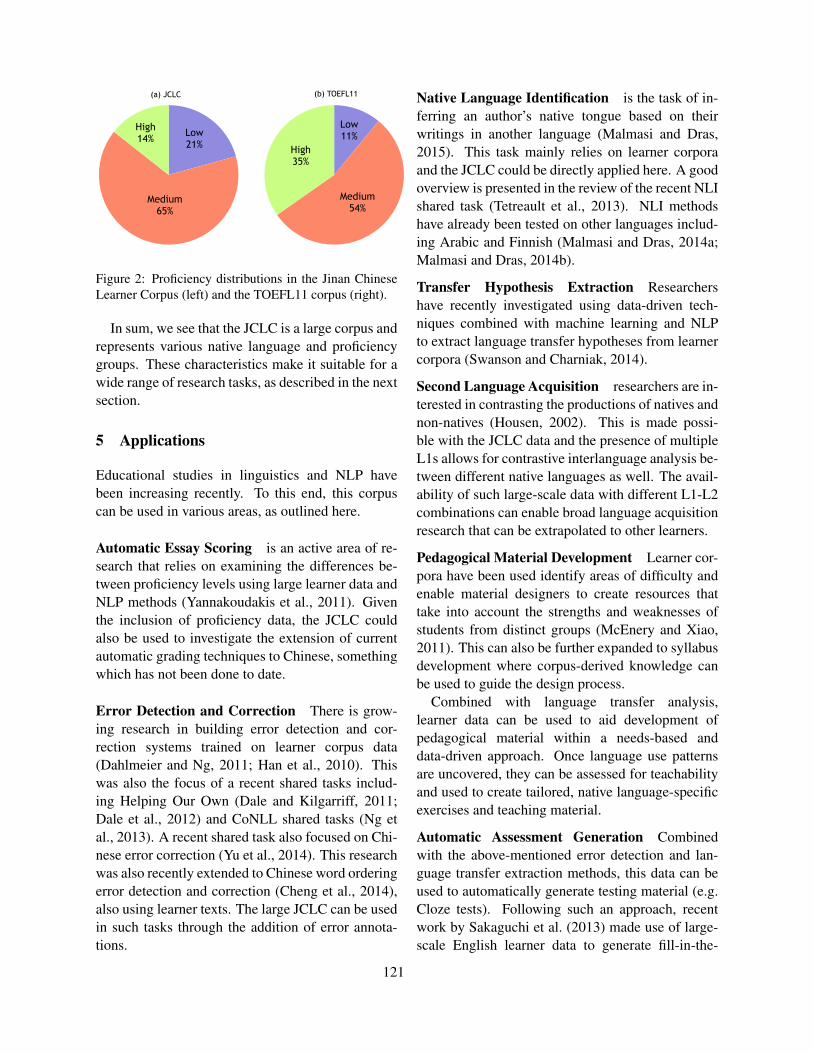
Low21%
Medium65%
High14%
Low11%
Medium54%
High35%
(a) JCLC (b) TOEFL11
Figure 2: Proficiency distributions in the Jinan ChineseLearner Corpus (left) and the TOEFL11 corpus (right).
In sum, we see that the JCLC is a large corpus andrepresents various native language and proficiencygroups. These characteristics make it suitable for awide range of research tasks, as described in the nextsection.
5 Applications
Educational studies in linguistics and NLP havebeen increasing recently. To this end, this corpuscan be used in various areas, as outlined here.
Automatic Essay Scoring is an active area of re-search that relies on examining the differences be-tween proficiency levels using large learner data andNLP methods (Yannakoudakis et al., 2011). Giventhe inclusion of proficiency data, the JCLC couldalso be used to investigate the extension of currentautomatic grading techniques to Chinese, somethingwhich has not been done to date.
Error Detection and Correction There is grow-ing research in building error detection and cor-rection systems trained on learner corpus data(Dahlmeier and Ng, 2011; Han et al., 2010). Thiswas also the focus of a recent shared tasks includ-ing Helping Our Own (Dale and Kilgarriff, 2011;Dale et al., 2012) and CoNLL shared tasks (Ng etal., 2013). A recent shared task also focused on Chi-nese error correction (Yu et al., 2014). This researchwas also recently extended to Chinese word orderingerror detection and correction (Cheng et al., 2014),also using learner texts. The large JCLC can be usedin such tasks through the addition of error annota-tions.
Native Language Identification is the task of in-ferring an author’s native tongue based on theirwritings in another language (Malmasi and Dras,2015). This task mainly relies on learner corporaand the JCLC could be directly applied here. A goodoverview is presented in the review of the recent NLIshared task (Tetreault et al., 2013). NLI methodshave already been tested on other languages includ-ing Arabic and Finnish (Malmasi and Dras, 2014a;Malmasi and Dras, 2014b).
Transfer Hypothesis Extraction Researchershave recently investigated using data-driven tech-niques combined with machine learning and NLPto extract language transfer hypotheses from learnercorpora (Swanson and Charniak, 2014).
Second Language Acquisition researchers are in-terested in contrasting the productions of natives andnon-natives (Housen, 2002). This is made possi-ble with the JCLC data and the presence of multipleL1s allows for contrastive interlanguage analysis be-tween different native languages as well. The avail-ability of such large-scale data with different L1-L2combinations can enable broad language acquisitionresearch that can be extrapolated to other learners.
Pedagogical Material Development Learner cor-pora have been used identify areas of difficulty andenable material designers to create resources thattake into account the strengths and weaknesses ofstudents from distinct groups (McEnery and Xiao,2011). This can also be further expanded to syllabusdevelopment where corpus-derived knowledge canbe used to guide the design process.
Combined with language transfer analysis,learner data can be used to aid development ofpedagogical material within a needs-based anddata-driven approach. Once language use patternsare uncovered, they can be assessed for teachabilityand used to create tailored, native language-specificexercises and teaching material.
Automatic Assessment Generation Combinedwith the above-mentioned error detection and lan-guage transfer extraction methods, this data can beused to automatically generate testing material (e.g.Cloze tests). Following such an approach, recentwork by Sakaguchi et al. (2013) made use of large-scale English learner data to generate fill-in-the-
121

blank quiz items for language learners. Previousresearch in this space had also considered the au-tomatic generation of multiple-choice questions forlanguage testing (Hoshino and Nakagawa, 2005),but without learner data. The use of learner cor-pora containing naturally produced errors providesa much more promising synergy, enabling the as-sessment of more complex linguistic errors beyondarticles, prepositions and synonyms. With furtherannotations of the present errors, the JCLC could beused for such tasks.
6 Conclusion and Future Work
The JCLC, a sizeable project that has been ongoingfor the last 8 years, has yielded a large-scale lan-guage resource for researchers – the first of its kind.As the only such corpus of this size, the JCLC is avaluable resource to support research in various ar-eas, some of which we outlined here.
Research in most of the tasks described in section5 has focused on English. The availability of theJCLC will enable much of this work to be extendedto Chinese, potentially opening new research areasfor the community.
The JCLC is an ongoing project and new datacontinues to be collected and added to the corpus.No fixed target size has been set and it is anticipatedthat the corpus will grow to be much larger than thecurrent size.
Several directions for future work are under con-sideration. One avenue is the the creation of fur-ther annotation layers over the data to include addi-tional linguistic information such as Chinese wordsegmentation boundaries, part-of-speech tags, con-stituency parses and grammatical dependencies. Theinclusion of error annotations and manual correc-tions is another potential avenue for future work.
Another possibility is the addition of a new sub-corpus of native texts that can be used as a con-trol group for comparing native and non-native data.This would enable further analysis of learner inter-language.
Acknowledgments
We would like to thank the three anonymous review-ers for their insightful comments.
References
Ghazi Abuhakema, Reem Faraj, Anna Feldman, andEileen Fitzpatrick. 2008. Annotating an ArabicLearner Corpus for Error. In LREC.
David Birdsong. 1999. Second Language Acquisitionand the Critical Period Hypothesis. Routledge.
Daniel Blanchard, Joel Tetreault, Derrick Higgins, AoifeCahill, and Martin Chodorow. 2013. TOEFL11: ACorpus of Non-Native English. Technical report, Ed-ucational Testing Service.
Jianguo Chen, Chuang Wang, and Jinfa Cai. 2010.Teaching and learning Chinese: Issues and perspec-tives. IAP.
Shuk-Man Cheng, Chi-Hsin Yu, and Hsin-Hsi Chen.2014. Chinese Word Ordering Errors Detection andCorrection for Non-Native Chinese Language Learn-ers. Proceedings of COLING 2014, pages 279–289.
Daniel Dahlmeier and Hwee Tou Ng. 2011. Gram-matical error correction with alternating structure op-timization. In Proceedings of the 49th Annual Meet-ing of the Association for Computational Linguistics:Human Language Technologies-Volume 1, pages 915–923. Association for Computational Linguistics.
Robert Dale and Adam Kilgarriff. 2011. Helping ourown: The HOO 2011 pilot shared task. In Proceedingsof the 13th European Workshop on Natural LanguageGeneration, pages 242–249. Association for Compu-tational Linguistics.
Robert Dale, Ilya Anisimoff, and George Narroway.2012. HOO 2012: A report on the preposition anddeterminer error correction shared task. In Proceed-ings of the Seventh Workshop on Building EducationalApplications Using NLP, pages 54–62. Association forComputational Linguistics.
Ana Dıaz-Negrillo, Nicolas Ballier, and Paul Thompson.2013. Automatic treatment and analysis of learnercorpus data, volume 59. John Benjamins PublishingCompany.
Michael Gamon, Martin Chodorow, Claudia Leacock,Joel Tetreault, N Ballier, A Dıaz-Negrillo, andP Thompson. 2013. Using learner corpora for auto-matic error detection and correction. Automatic treat-ment and analysis of learner corpus data, pages 127–150.
Sylviane Granger. 2002. A bird’s-eye view of learnercorpus research. Computer learner corpora, secondlanguage acquisition and foreign language teaching,pages 3–33.
Sylviane Granger. 2003. The International Corpus ofLearner English: a new resource for foreign languagelearning and teaching and second language acquisitionresearch. Tesol Quarterly, 37(3):538–546.
122
Na-Rae Han, Joel R Tetreault, Soo-Hwa Lee, and Jin-Young Ha. 2010. Using an error-annotated learnercorpus to develop an esl/efl error correction system. InLREC.
Ayako Hoshino and Hiroshi Nakagawa. 2005. A real-time multiple-choice question generation for languagetesting: a preliminary study. In Proceedings of the sec-ond workshop on Building Educational ApplicationsUsing NLP, pages 17–20. Association for Computa-tional Linguistics.
Alex Housen. 2002. A corpus-based study of the L2-acquisition of the English verb system. Computerlearner corpora, second language acquisition and for-eign language teaching, 6:2002–77.
Cristobal Lozano and Amaya Mendikoetxea. 2013.Learner corpora and second language acquisition. Au-tomatic Treatment and Analysis of Learner CorpusData, 59.
Shervin Malmasi and Mark Dras. 2014a. Arabic NativeLanguage Identification. In Proceedings of the Ara-bic Natural Language Processing Workshop (EMNLP2014), pages 180–186, Doha, Qatar, October. Associ-ation for Computational Linguistics.
Shervin Malmasi and Mark Dras. 2014b. Finnish Na-tive Language Identification. In Proceedings of theAustralasian Language Technology Workshop (ALTA),pages 139–144, Melbourne, Australia.
Shervin Malmasi and Mark Dras. 2014c. LanguageTransfer Hypotheses with Linear SVM Weights. Pro-ceedings of the 2014 Conference on Empirical Meth-ods in Natural Language Processing (EMNLP).
Shervin Malmasi and Mark Dras. 2015. Large-scale Na-tive Language Identification with Cross-Corpus Eval-uation. In Proceedings of NAACL-HLT 2015, Denver,Colorado, June. Association for Computational Lin-guistics.
Tony McEnery and Richard Xiao. 2011. What corporacan offer in language teaching and learning. Hand-book of research in second language teaching andlearning. London: Routledge, pages 364–380.
Shirin Murphy. 2005. Second language transfer dur-ing third language acquisition. Teachers College,Columbia University Working Papers in TESOL & Ap-plied Linguistics, 3(1).
Hwee Tou Ng, Siew Mei Wu, Yuanbin Wu, ChristianHadiwinoto, and Joel Tetreault. 2013. The CoNLL-2013 Shared Task on Grammatical Error Correction.In Proceedings of CoNLL.
Hakan Ringbom. 2001. Lexical transfer in L3 produc-tion. volume 31, pages 59–68. Multilingual Matters.
Heath Rose and Lorna Carson. 2014. Introduction. Lan-guage Learning in Higher Education, 4(2):257–269.
Keisuke Sakaguchi, Yuki Arase, and Mamoru Komachi.2013. Discriminative Approach to Fill-in-the-BlankQuiz Generation for Language Learners. In Proceed-ings of the 51st Annual Meeting of the Association forComputational Linguistics, pages 238–242.
Ben Swanson and Eugene Charniak. 2014. Data DrivenLanguage Transfer Hypotheses. EACL 2014, page169.
Joel Tetreault, Daniel Blanchard, and Aoife Cahill. 2013.A Report on the First Native Language IdentificationShared Task. In Proceedings of the Eighth Workshopon Innovative Use of NLP for Building EducationalApplications, pages 48–57, Atlanta, Georgia, June.Association for Computational Linguistics.
Linda Tsung and Ken Cruickshank. 2011. Teaching andLearning Chinese in Global Contexts: CFL World-wide. Bloomsbury Publishing.
Kam-Fai Wong, Wenjie Li, Ruifeng Xu, and Zheng-sheng Zhang. 2009. Introduction to Chinese NaturalLanguage Processing. Synthesis Lectures on HumanLanguage Technologies, 2(1):1–148.
Martin Wynne, editor. 2005. Developing Linguistic Cor-pora: A Guide to Good Practice. Oxbow Books Ox-ford.
Helen Yannakoudakis, Ted Briscoe, and Ben Medlock.2011. A new dataset and method for automaticallygrading ESOL texts. In Proceedings of the 49th An-nual Meeting of the Association for ComputationalLinguistics: Human Language Technologies-Volume1, pages 180–189. Association for Computational Lin-guistics.
Liang-Chih Yu, Lung-Hao Lee, and Li-Ping Chang.2014. Overview of Grammatical Error Diagnosis forLearning Chinese as a Foreign Language. In Proceed-ings of the 22nd International Conference on Comput-ers in Education, Nara, Japan.
Hongqin Zhao and Jianbin Huang. 2010. Chinas policyof Chinese as a foreign language and the use of over-seas Confucius Institutes. Educational Research forPolicy and Practice, 9(2):127–142.
123
Proceedings of the Tenth Workshop on Innovative Use of NLP for Building Educational Applications, 2015, pages 124–132,Denver, Colorado, June 4, 2015. c©2015 Association for Computational Linguistics
Reducing Annotation Efforts in Supervised Short Answer Scoring
Torsten ZeschLanguage Technology Lab
University of Duisburg-Essen
Michael Heilman∗ Aoife CahillEducational Testing Service
660 Rosedale RdPrinceton, NJ 08541, USA
Abstract
Automated short answer scoring is increas-ingly used to give students timely feedbackabout their learning progress. Building scor-ing models comes with high costs, as state-of-the-art methods using supervised learningrequire large amounts of hand-annotated data.We analyze the potential of recently proposedmethods for semi-supervised learning basedon clustering. We find that all examined meth-ods (centroids, all clusters, selected pure clus-ters) are mainly effective for very short an-swers and do not generalize well to several-sentence responses.
1 Introduction
Automated short answer scoring is getting more andmore important, e.g. in the context of large-scale as-sessment in MOOCs or PISA (OECD, 2010). Thestate of the art is currently to use supervised systemsthat are trained for a certain assessment item usingmanually annotated student responses. For high-stakes assessments like PISA, the effort that goesinto manually scoring a large number of responsesin order to train a good model might be justified, butit becomes a large obstacle in settings where newitems need to be generated more frequently, like inMOOCs. Thus, in this paper we explore ways toreduce the number of annotated training instancesrequired to train a model for a new item.
In the traditional setting, human annotators scoreresponses until a certain total or score distribution isreached that is deemed sufficient to train the model.
∗Michael Heilman is now a Data Scientist at Civis Analyt-ics.
As long as responses are randomly chosen for man-ual scoring, it is inevitable that annotators will seea lot of similar answers that will not add much newknowledge to the trained model. Another drawbackis that the class distribution in the data is often highlyskewed (e.g. because there are only very few excel-lent answers). Thus, the number of responses thatneed to be manually scored is much higher than itperhaps needs to be. It should be possible to replacethe random selection of responses to be annotatedwith a more informed approach. In this paper, weexplore two approaches: (i) annotating single se-lected instances, and (ii) annotating whole answerclusters. The difference between the two approachesis visualized in Figure 1.
In the first approach, we try to maximize lexicaldiversity based on the assumption that the classifieris best informed by responses that are as different aspossible (i.e. in the words used). In the second ap-proach, we simulate letting annotators score wholeclusters with a label that is used for all instances inthis cluster. The main advantage of this method isthat it yields multiple training instances with just onedecision from the annotator. At the same time, judg-ing whole clusters – especially if they are large – ismore difficult than judging a single response, so weneed to take this into consideration when comparingthe results.
2 Related Work
Basu et al. (2013) describe a related study on Power-grading, an approach for computer-assisted scoringof short-answer questions. They carry out experi-ments using crowd-sourced responses to questionsfrom the US citizenship test. The end goal of that
124
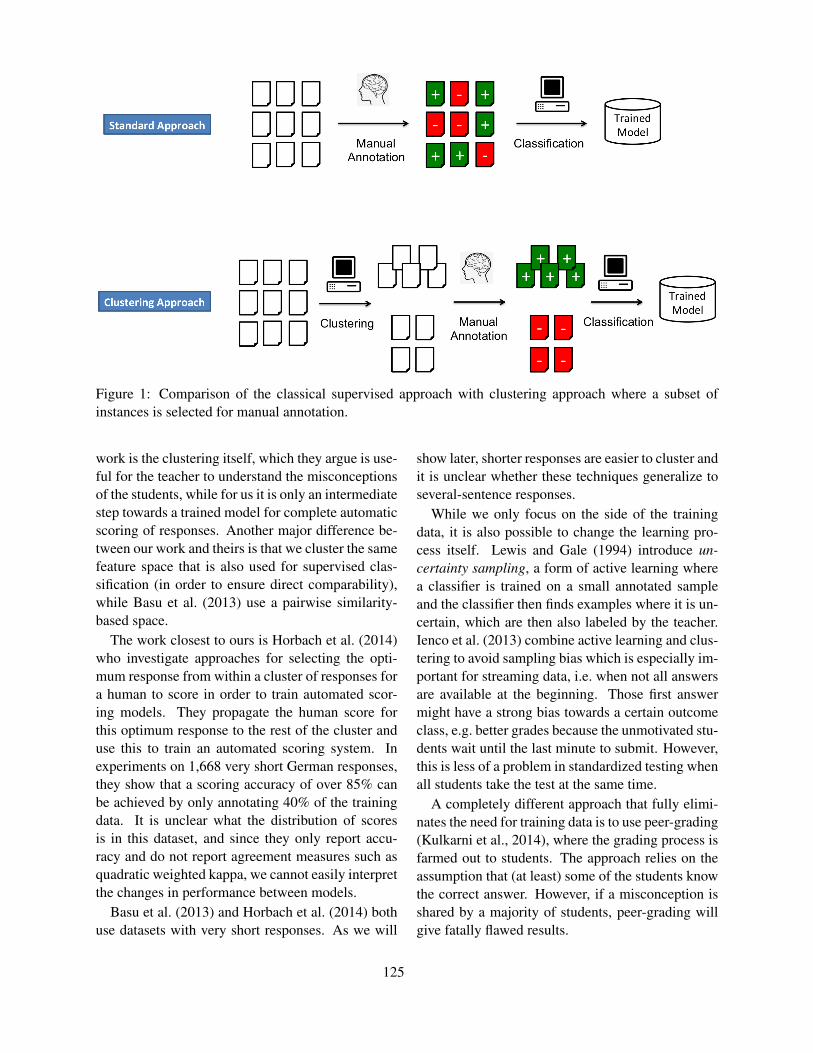
Figure 1: Comparison of the classical supervised approach with clustering approach where a subset ofinstances is selected for manual annotation.
work is the clustering itself, which they argue is use-ful for the teacher to understand the misconceptionsof the students, while for us it is only an intermediatestep towards a trained model for complete automaticscoring of responses. Another major difference be-tween our work and theirs is that we cluster the samefeature space that is also used for supervised clas-sification (in order to ensure direct comparability),while Basu et al. (2013) use a pairwise similarity-based space.
The work closest to ours is Horbach et al. (2014)who investigate approaches for selecting the opti-mum response from within a cluster of responses fora human to score in order to train automated scor-ing models. They propagate the human score forthis optimum response to the rest of the cluster anduse this to train an automated scoring system. Inexperiments on 1,668 very short German responses,they show that a scoring accuracy of over 85% canbe achieved by only annotating 40% of the trainingdata. It is unclear what the distribution of scoresis in this dataset, and since they only report accu-racy and do not report agreement measures such asquadratic weighted kappa, we cannot easily interpretthe changes in performance between models.
Basu et al. (2013) and Horbach et al. (2014) bothuse datasets with very short responses. As we will
show later, shorter responses are easier to cluster andit is unclear whether these techniques generalize toseveral-sentence responses.
While we only focus on the side of the trainingdata, it is also possible to change the learning pro-cess itself. Lewis and Gale (1994) introduce un-certainty sampling, a form of active learning wherea classifier is trained on a small annotated sampleand the classifier then finds examples where it is un-certain, which are then also labeled by the teacher.Ienco et al. (2013) combine active learning and clus-tering to avoid sampling bias which is especially im-portant for streaming data, i.e. when not all answersare available at the beginning. Those first answermight have a strong bias towards a certain outcomeclass, e.g. better grades because the unmotivated stu-dents wait until the last minute to submit. However,this is less of a problem in standardized testing whenall students take the test at the same time.
A completely different approach that fully elimi-nates the need for training data is to use peer-grading(Kulkarni et al., 2014), where the grading process isfarmed out to students. The approach relies on theassumption that (at least) some of the students knowthe correct answer. However, if a misconception isshared by a majority of students, peer-grading willgive fatally flawed results.
125

# items # classes ∅ # responses ∅ # tokens type/token ratio
ASAP 10 3-4 1,704 (±157) 48 (±12) .040 (±.016)PG 10 2 486 (±157) 4 (±2) .100 (±.005)
Table 1: Overview of datasets
3 Experimental Setup
In this section, we describe the datasets used forevaluation as well as the principal setup of our su-pervised scoring system.
3.1 Evaluation DatasetsWe use two publicly available datasets. Table 1 givesan overview of their properties.
Automated Student Assessment Prize (ASAP)This dataset was used to run the 2012 short answerscoring competition. See Higgins et al. (2014) for agood overview of the challenge and the results. Thedataset contains 10 items with approximately 20,000graded student answers. All responses were writtenby students primarily in grade 10 and mostly consistof multiple sentences. The responses were gradedon a 0-2 or 0-3 scale (i.e. 3–4 classes).
Powergrading (PG) The dataset was created byBasu et al. (2013) and contains about 5,000 crowd-sourced responses to 10 questions from the US citi-zenship test.1 As can be quickly seen from Table 1,the responses in this dataset are rather short with onaverage 4 tokens. Looking into the data, it quicklybecomes clear that there is relatively little variancein the answers. We thus expect clustering to workrather well on this dataset.
We are not aware of any supervised systems usingthe PG dataset before. In order to have a point of ref-erence for the performance of the automatic scoring,we computed an average pairwise inter-annotator-agreement of .86 (quadratic weighted kappa) for thethree human annotators.
3.2 Scoring SystemIn order to allow for a fair comparison of all ap-proaches, we implement a basic short answer scor-ing system using the DKPro TC (Daxenberger et al.,
1In all our experiments, we excluded item #13 as it has mul-tiple correct answers and is thus an anomaly amongst all theother items.
2014) framework. We preprocess the answers usingthe ClearNLP tools2 (segmenter, POS-tagger, lem-matizer, and dependency parser). As we are not in-terested in tuning every last bit of performance, weuse a standard feature set (length, ngrams, depen-dencies) described in more detail in Table 2. Weuse the DKPro TC wrapper for Weka and apply theSMO learning algorithm in standard configuration.
3.3 Evaluation MetricWe use the evaluation metric that was also used inthe ASAP challenge: quadratic weighted kappa κ.We follow the ASAP challenge procedure by apply-ing Fisher-Z transformation when averaging kappas.According to Bridgeman (2013), quadratic weightedkappa is very similar to Pearson correlation r in sucha setting.
4 Baseline Results
Applying our basic scoring system and using allavailable training data, we get a kappa of .67 forthe ASAP dataset and .96 for the PG dataset. Theextraordinaryly high result on the PG dataset (evenmuch higher than the inter-annotator agreement) im-mediately stands out. As we have already discussedabove, the answers in the PG dataset are very shortand show very limited lexical variance making itquite easy to learn a good model.
Our results on the ASAP dataset are about 10 per-centage points lower than the best results from theliterature (Higgins et al., 2014). This is due to ourfeature set and classifier not being tuned directly onthis dataset. The results are in line with what similarsystems achieved in the original competition. Re-sults closer to the best results in the literature canbe reached by using more specialized features (Tan-dalla, 2012) or by ensembling multiple scoring mod-els (Zbontar, 2012).
With our system, we get quite consistent resultson all ASAP items, while attempts to tune the sys-
2http://clearnlp.wikispaces.com
126

Name Configuration Description
length Number of words in the response Longer responses are often better.ngrams 1-3 grams of words Which word sequences appear in good or bad responses.skipNgrams 2-3 skip grams of words, 2 tokens
maximum skipThis accounts for non adjacent token combinations.
charNgrams 3-5 grams of characters This mainly accounts for spelling errors as also partiallycorrect word fragments can influence the score.
dependencies All dependencies, no threshold Like skipNgrams this measures whether a certain combi-nation of tokens appears in the document, but also makessure they are in the same dependency relation.
Table 2: List of features
tem on a certain item led to decreased performanceon the others. For our experiments consistency ismore important than especially good baseline re-sults, and so we choose to run the same system onall ten items rather than developing ten separate sys-tems that require individual tuning.
Impact of Training Data Size The main questionthat we are exploring in this paper is whether someanswers are more valuable for training than others(Lewis and Gale, 1994; Horbach et al., 2014). Bycarefully selecting the training instances, we shouldbe able to train a model with performance compara-ble to the full model that uses less training data andthus is cheaper to create. In order to assess the po-tential of this approach, it will be useful to compareagainst the upper and lower bound in performance.For this purpose, we need to find the best and worstsubset of graded answers. As the number of possi-ble combinations of k instances from n answers ismuch too high to search in its entirety, we test 1,000random samples while making sure that all outcomeclasses are found in the sample. In Figure 2, weshow the performance of the best and worst subset,as well as the mean over all subsets. In order to avoidclutter, we show averaged curves over all items in adataset.
Looking at the ASAP dataset first, we see thatin the average case doubling the amount of trainingdata yields a steady performance increase, but withdiminishing returns. Using about 100 (27) answersmeans sacrificing more than 10 percentage points ofperformance compared with using about 1,000 (210)answers. However, it should be noted that in an av-erage practical setting annotating 1,000 answers is
next to impossible and 100 still means a consider-able effort even if one is willing to live with the sub-optimal performance.
For the PG dataset, the pattern is similar in theaverage case, but we need more training examplesin the worst case to get up and running, while theASAP worst case has a much steeper climb.
We see that the selection of instances actually hasan enormous effect for both datasets. Especially forsmall numbers of training instances, depending onhow lucky or unlucky we are in picking instancesto score, we might end up with performance nearzero, or performance very close to what we can ex-pect when training on all instances. When inspectingthe selected subsets it becomes clear that one crucialfactor is the lexical variance that we see in instances.We explore this in more detail in the next section.
5 Selecting Answers for Annotation
The idea behind this approach is that given a limitedamount of training instances, we should only anno-tate answers that inform the machine learner in anoptimal way. Our hypothesis is that the learning al-gorithm should gain more from a lexically diversesample than from a sample of very similar answers.For example, if we have already scored an answerlike Edison invented the light bulb, rating anothervery similar one like The light bulb was inventedby Edison adds little additional information to themodel.
Setup We cluster all answers and then select thecentroid of each cluster for manual annotation. Weuse Weka k-means clustering and set the k to the
127
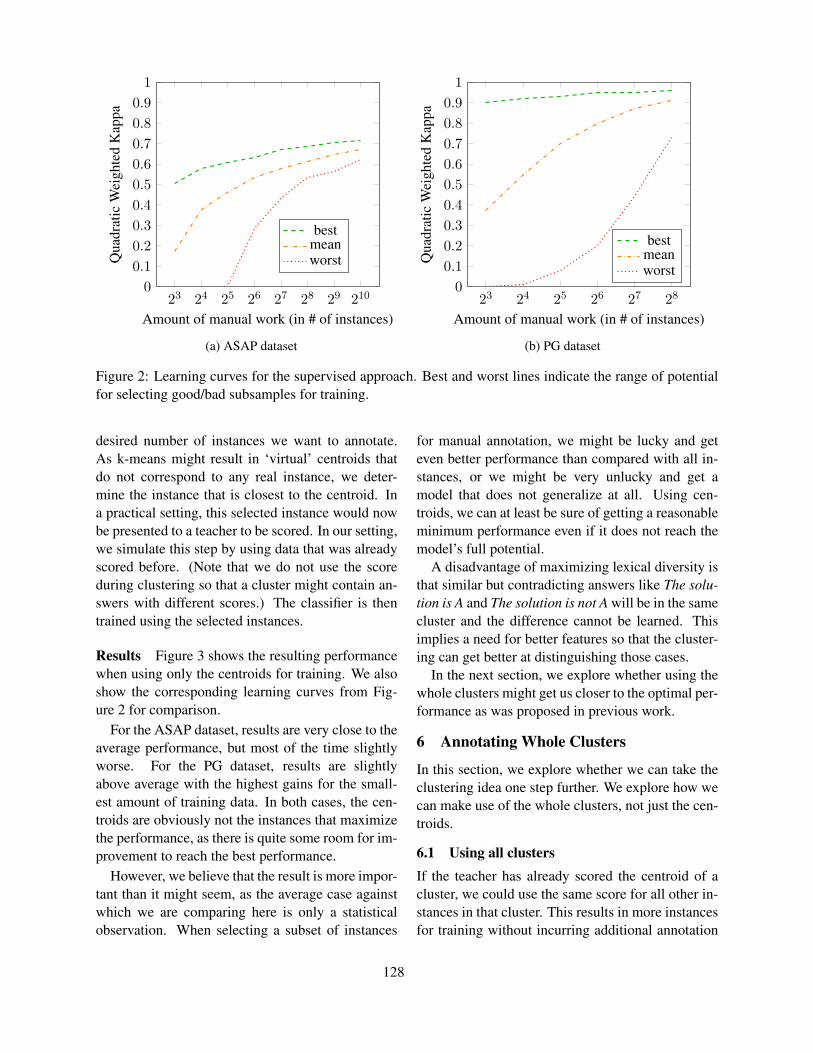
23 24 25 26 27 28 29 2100
0.10.20.30.40.50.60.70.80.9
1
Amount of manual work (in # of instances)
Qua
drat
icW
eigh
ted
Kap
pa
bestmeanworst
(a) ASAP dataset
23 24 25 26 27 280
0.10.20.30.40.50.60.70.80.9
1
Amount of manual work (in # of instances)
Qua
drat
icW
eigh
ted
Kap
pa
bestmeanworst
(b) PG dataset
Figure 2: Learning curves for the supervised approach. Best and worst lines indicate the range of potentialfor selecting good/bad subsamples for training.
desired number of instances we want to annotate.As k-means might result in ‘virtual’ centroids thatdo not correspond to any real instance, we deter-mine the instance that is closest to the centroid. Ina practical setting, this selected instance would nowbe presented to a teacher to be scored. In our setting,we simulate this step by using data that was alreadyscored before. (Note that we do not use the scoreduring clustering so that a cluster might contain an-swers with different scores.) The classifier is thentrained using the selected instances.
Results Figure 3 shows the resulting performancewhen using only the centroids for training. We alsoshow the corresponding learning curves from Fig-ure 2 for comparison.
For the ASAP dataset, results are very close to theaverage performance, but most of the time slightlyworse. For the PG dataset, results are slightlyabove average with the highest gains for the small-est amount of training data. In both cases, the cen-troids are obviously not the instances that maximizethe performance, as there is quite some room for im-provement to reach the best performance.
However, we believe that the result is more impor-tant than it might seem, as the average case againstwhich we are comparing here is only a statisticalobservation. When selecting a subset of instances
for manual annotation, we might be lucky and geteven better performance than compared with all in-stances, or we might be very unlucky and get amodel that does not generalize at all. Using cen-troids, we can at least be sure of getting a reasonableminimum performance even if it does not reach themodel’s full potential.
A disadvantage of maximizing lexical diversity isthat similar but contradicting answers like The solu-tion is A and The solution is not A will be in the samecluster and the difference cannot be learned. Thisimplies a need for better features so that the cluster-ing can get better at distinguishing those cases.
In the next section, we explore whether using thewhole clusters might get us closer to the optimal per-formance as was proposed in previous work.
6 Annotating Whole Clusters
In this section, we explore whether we can take theclustering idea one step further. We explore how wecan make use of the whole clusters, not just the cen-troids.
6.1 Using all clustersIf the teacher has already scored the centroid of acluster, we could use the same score for all other in-stances in that cluster. This results in more instancesfor training without incurring additional annotation
128
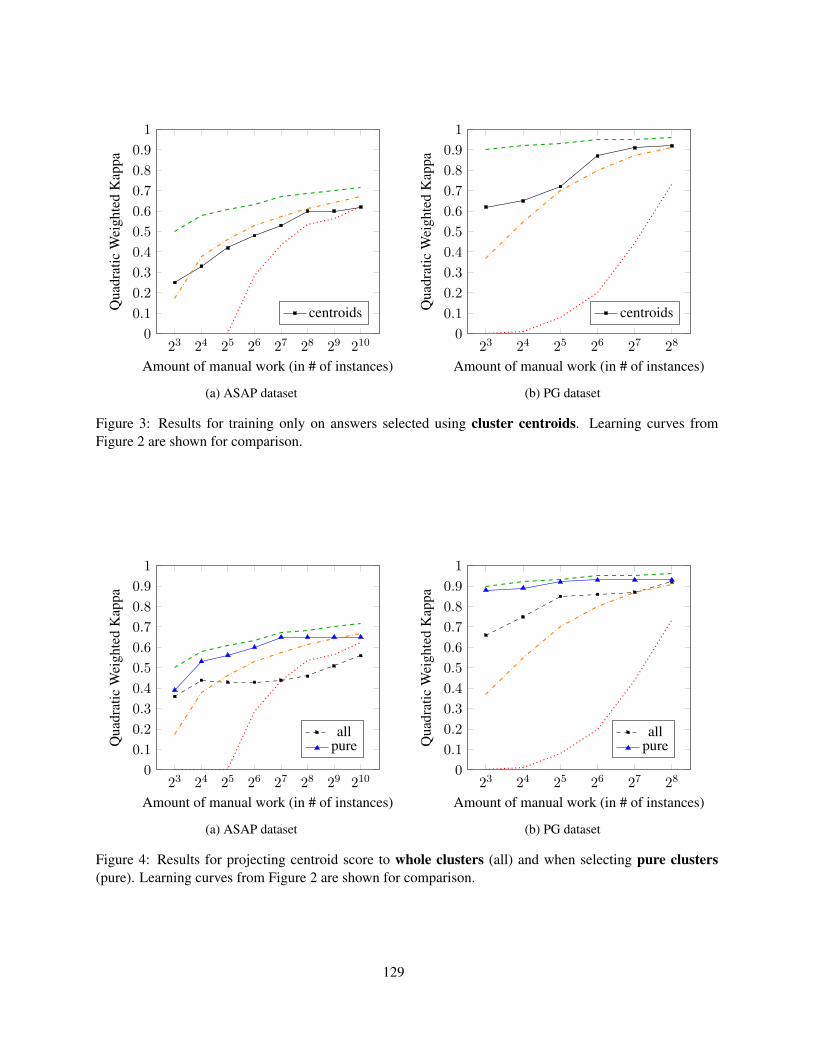
23 24 25 26 27 28 29 2100
0.10.20.30.40.50.60.70.80.9
1
Amount of manual work (in # of instances)
Qua
drat
icW
eigh
ted
Kap
pa
centroids
(a) ASAP dataset
23 24 25 26 27 280
0.10.20.30.40.50.60.70.80.9
1
Amount of manual work (in # of instances)
Qua
drat
icW
eigh
ted
Kap
pa
centroids
(b) PG dataset
Figure 3: Results for training only on answers selected using cluster centroids. Learning curves fromFigure 2 are shown for comparison.
23 24 25 26 27 28 29 2100
0.10.20.30.40.50.60.70.80.9
1
Amount of manual work (in # of instances)
Qua
drat
icW
eigh
ted
Kap
pa
allpure
(a) ASAP dataset
23 24 25 26 27 280
0.10.20.30.40.50.60.70.80.9
1
Amount of manual work (in # of instances)
Qua
drat
icW
eigh
ted
Kap
pa
allpure
(b) PG dataset
Figure 4: Results for projecting centroid score to whole clusters (all) and when selecting pure clusters(pure). Learning curves from Figure 2 are shown for comparison.
129

costs. However, this might obviously also result ina large training error if the clusters are not pure, aswe would assign incorrect labels to some instancesin that case.
Following Horbach et al. (2014), we use the scoreassigned to the centroid for the whole cluster andobtain the results shown in Figure 4. For the ASAPdataset, the curve is almost flat, i.e. no matter howmany cluster centroids the teacher annotates, predic-tion results do not improve. The results even dip be-low the ‘worst’ line which can be explained by thefact that we are using a lot of noisy training data inthis case instead of fewer correct instances. For thePG dataset, results are better due to the much eas-ier clustering. In this case, we can get a significantperformance increase compared to just using cen-troids especially for smaller amounts of annotatedinstances.
As we are always clustering the whole set of an-swers, selecting a small number of clusters and at thesame time asking for noise-free clusters is equivalentto finding a perfect solution for the scoring prob-lem. For example, if we have 4 scores (0,1,2,3) and4 clusters, than the clusters can only be pure if allthe answers for each score are in their own cluster.This is unlikely to happen. If the number of clustersgrows, we expect to have some smaller, purer clus-ters where similar answers are grouped together, andsome larger clusters with a lot of noise.3 We thusneed to find a way to minimize the impact of noisein our training data.
6.2 Using only pure clustersOne possible approach to reduce noise in the clus-tered data would be to have the teacher look at thewhole clusters instead of individual answers only.The teacher would then select only those clustersthat are relatively pure, i.e. only contain answers cor-responding to the same score. We simulate this stepby computing the purity of each cluster using thealready known scores for each answer. The solidline in Figure 4 shows the result for this scenario.We see that for both datasets, the results are sig-nificantly above average, getting close to the opti-mal performance. We believe that this is due to
3Note that, if we ask for as many clusters as there are an-swers in the set, each answer gets its own cluster and we get thebaseline results.
23 24 25 26 27 28 29 2100
0.10.20.30.40.50.60.70.80.9
1
Amount of manual work (in # of instances)
Qua
drat
icW
eigh
ted
Kap
pa
1:12:14:1
Figure 5: Results annotating pure clusters for differ-ent ‘exchange rates’, where 1:1 means that annotat-ing a cluster and a single answer takes the same time,2:1 a cluster takes twice as long as a single answer,etc.
the pure clusters representing frequent correct an-swers or frequent misconceptions shared betweenstudents, while impure clusters represent noisy an-swers that lead to overfitting in the learned model.
Annotation Difficulty One obvious criticism ofthis approach is that scoring a large cluster takesmuch longer than scoring a single answer. As a con-sequence, the ‘exchange rate’ between scoring anindividual answer and a cluster is not 1:1. For ex-ample, a 4:1 rate would mean that it takes 4 longerto annotate a cluster compared to a single answer,or in other terms, while annotating a single cluster ateacher could annotate 4 single answers in the sametime. In Figure 5, we plot the results on the ASAPdataset for the pure clusters using exchange rates of1:1, 2:1, and 4:1. With a 2:1 ratio, the pure ASAPclusters are still somewhat ahead of the average per-formance, with a 4:1 ratio slightly below. While es-timating the exact exchange ratio is left to future an-notation studies with real teachers annotating clus-ters, it seems safe to argue that it will be closer to 4:1than to 1:1, thus resulting in no benefit to the methodon the ASAP dataset in terms of manual work to besaved. For the PG dataset, the results are obviouslyabove average and very close to the optimal perfor-mance no matter what exchange rate is used. We can
130
thus conclude that the effectiveness of this methodstrongly depends on how well the answers can beclustered. This in turn depends on both the nature ofthe answers and the quality of the feature space (orsimilarity function for graph clustering). As we areusing the same feature set for both datasets, the goodresults on PG can only be explained with the rathershort answers and the low lexical variance. How-ever, a better baseline model of answer similaritymight also push results on the ASAP dataset moretowards the optimal result.
7 Conclusions
In this paper, we explored approaches for minimiz-ing the required amount of annotated instances whentraining supervised short answer scoring systems.Instead of letting a teacher annotate all instances inadvance, we argue that by carefully selecting theinstances we might be able to train a comparablemodel at much lower costs. We do this by cluster-ing the answers and having the teacher only annotatethe cluster centroids. We find that – especially forsmall amounts of instances to be annotated – usingcentroids yields results comparable to the averagerandom selection of the same number of instances.This means that centroids provide a convenient wayto select suitable instances for annotation instead ofrandom selection, but only if one is comfortable withsignificantly sacrificing scoring quality.
In a second experiment, we follow Horbach et al.(2014) projecting the score assigned to the centroidto the whole cluster. Especially for longer answersthat doesn’t work well due to the noise introducedby imperfect clustering. Having the teacher selectand annotate only pure clusters counters the noiseproblem, but introduces quite high annotation coststhat probably negate any gains.
To summarize: the results indicate that clusteringhas limited potential for reducing the annotation ef-fort if the answers are short enough to be partitionedwell, but is not well suited for longer answers. Itremains an open question whether better clusteringbased on a deeper understanding of multiple sen-tence answers could change that picture. We makethe full source code publicly available so that ourexperiments can be easily replicated.4
4https://github.com/zesch/exp-grading-bea2015
Acknowledgements
We thank Nitin Madnani for helpful discussions. Wealso thank Keelan Evanini, Matthew Mulholland andthe anonymous reviewers for thoughtful commentsand suggestions.
References
Sumit Basu, Chuck Jacobs, and Lucy Vanderwende.2013. Powergrading: a Clustering Approach to Am-plify Human Effort for Short Answer Grading. Trans-actions of the Association for Computational Linguis-tics (TACL), 1:391–402.
Brent Bridgeman. 2013. Human Ratings and Auto-mated Essay Evaluation. In Mark D Shermis andJill Burstein, editors, Handbook of Automated EssayEvaluation: Current Applications and New Directions,chapter 13, pages 221–232. Routledge, New York.
Johannes Daxenberger, Oliver Ferschke, Iryna Gurevych,and Torsten Zesch. 2014. DKPro TC: A Java-basedFramework for Supervised Learning Experiments onTextual Data. In Proceedings of the 52nd AnnualMeeting of the Association for Computational Linguis-tics. System Demonstrations, pages 61–66, Baltimore,MD, USA, June.
Derrick Higgins, Chris Brew, Michael Heilman, RamonZiai, Lei Chen, Aoife Cahill, Michael Flor, NitinMadnani, Joel R Tetreault, Daniel Blanchard, DianeNapolitano, Chong Min Lee, and John Blackmore.2014. Is getting the right answer just about choosingthe right words? The role of syntactically-informedfeatures in short answer scoring. Computation andLanguage.
Andrea Horbach, Alexis Palmer, and Magdalena Wol-ska. 2014. Finding a Tradeoff between Accuracyand Rater’s Workload in Grading Clustered Short An-swers. In Proceedings of the Ninth InternationalConference on Language Resources and Evaluation(LREC’14), pages 588–595, Reykjavik.
Dino Ienco, Albert Bifet, Indre Zliobaite, and BernhardPfahringer. 2013. Clustering based active learning forevolving data streams. In Proceedings of DiscoveryScience - 16th International Conference, pages 79–93.
Chinmay E. Kulkarni, Richard Socher, Michael S. Bern-stein, and Scott R. Klemmer. 2014. Scaling short-answer grading by combining peer assessment with al-gorithmic scoring. In Proceedings of the first ACMconference on Learning @ scale conference - L@S’14, pages 99–108. ACM Press.
David D. Lewis and William A. Gale. 1994. A sequentialalgorithm for training text classifiers. In Proceedings
131
of the 17th Annual International ACM SIGIR Confer-ence on Research and Development in Information Re-trieval, SIGIR ’94, pages 3–12.
OECD. 2010. PISA 2009 Assessment Framework: KeyCompetencies in Reading, Mathematics and Science.PISA, OECD Publishing.
Luis Tandalla. 2012. Scoring short answer es-says. Technical report, ASAP Short Answer ScoringCompetition System Description. Downloaded fromhttp://kaggle.com/asap-sas/.
Jure Zbontar. 2012. Short answer scoring by stack-ing. Technical report, ASAP Short Answer ScoringCompetition System Description. Downloaded fromhttp://kaggle.com/asap-sas/.
132
Proceedings of the Tenth Workshop on Innovative Use of NLP for Building Educational Applications, 2015, pages 133–143,Denver, Colorado, June 4, 2015. c©2015 Association for Computational Linguistics
Annotation and Classification of Argumentative Writing Revisions
Fan ZhangUniversity of PittsburghPittsburgh, PA, 15260
Diane LitmanUniversity of PittsburghPittsburgh, PA, 15260
Abstract
This paper explores the annotation and classi-fication of students’ revision behaviors in ar-gumentative writing. A sentence-level revi-sion schema is proposed to capture why andhow students make revisions. Based on theproposed schema, a small corpus of studentessays and revisions was annotated. Stud-ies show that manual annotation is reliablewith the schema and the annotated informa-tion helpful for revision analysis. Further-more, features and methods are explored forthe automatic classification of revisions. In-trinsic evaluations demonstrate promising per-formance in high-level revision classification(surface vs. text-based). Extrinsic evaluationsdemonstrate that our method for automatic re-vision classification can be used to predict awriter’s improvement.
1 Introduction
Rewriting is considered as an important factor ofsuccessful writing. Research shows that expert writ-ers revise in ways different from inexperienced writ-ers (Faigley and Witte, 1981). Recognizing the im-portance of rewriting, more and more efforts are be-ing made to understand and utilize revisions. Thereare rewriting suggestions made by instructors (Wellset al., 2013), studies modeling revisions for errorcorrection (Xue and Hwa, 2010; Mizumoto et al.,2011) and tools aiming to help students with rewrit-ing (Elireview, 2014; Lightside, 2014).
While there is increasing interest in the improve-ment of writers’ rewriting skills, there is still a lackof study on the details of revisions. First, to find
out what has been changed (defined as revision ex-traction in this paper), a typical approach is to ex-tract and analyze revisions at the word/phrase levelbased on edits extracted with character-level textcomparison (Bronner and Monz, 2012; Daxenbergerand Gurevych, 2012). The semantic informationof sentences is not considered in the character-leveltext comparison, which can lead to errors and lossof information in revision extraction. Second, thedifferentiation of different types of revisions (de-fined as revision categorization) is typically notfine-grained. A common categorization is a binaryclassification of revisions according to whether theinformation of the essay is changed or not (e.g.text-based vs. surface as defined by Faigley andWitte (1981)). This categorization ignores poten-tially important differences between revisions underthe same high-level category. For example, chang-ing the evidence of a claim and changing the rea-soning of a claim are both considered as text-basedchanges. Usually changing the evidence makes a pa-per more grounded, while changing the reasoninghelps with the paper’s readability. This could indi-cate different levels of improvement to the originalpaper. Finally, for the automatic differentiation ofrevisions (defined as revision classification), whilethere are works on the classification of Wikipediarevisions (Adler et al., 2011; Bronner and Monz,2012; Daxenberger and Gurevych, 2013), there isa lack of work on revision classification in otherdatasets such as student writings. It is not clearwhether current features and methods can still beadapted or new features and methods are required.
To address the issues above, this paper makes
133
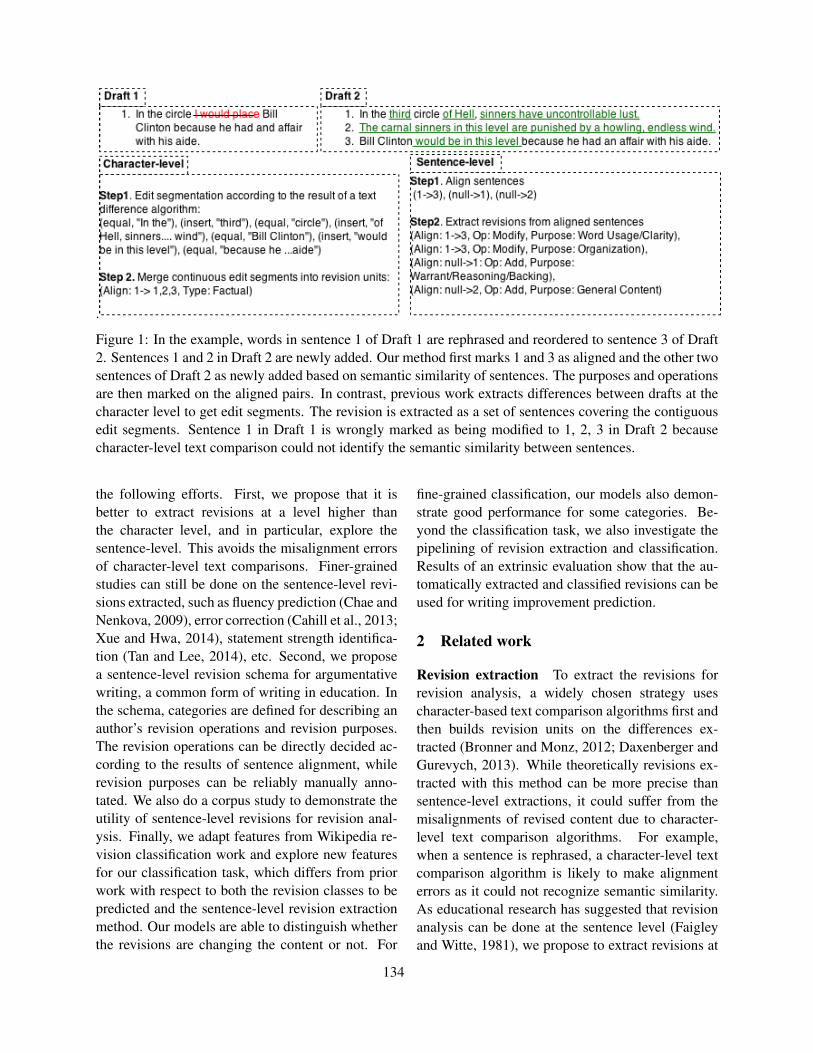
.
Figure 1: In the example, words in sentence 1 of Draft 1 are rephrased and reordered to sentence 3 of Draft2. Sentences 1 and 2 in Draft 2 are newly added. Our method first marks 1 and 3 as aligned and the other twosentences of Draft 2 as newly added based on semantic similarity of sentences. The purposes and operationsare then marked on the aligned pairs. In contrast, previous work extracts differences between drafts at thecharacter level to get edit segments. The revision is extracted as a set of sentences covering the contiguousedit segments. Sentence 1 in Draft 1 is wrongly marked as being modified to 1, 2, 3 in Draft 2 becausecharacter-level text comparison could not identify the semantic similarity between sentences.
the following efforts. First, we propose that it isbetter to extract revisions at a level higher thanthe character level, and in particular, explore thesentence-level. This avoids the misalignment errorsof character-level text comparisons. Finer-grainedstudies can still be done on the sentence-level revi-sions extracted, such as fluency prediction (Chae andNenkova, 2009), error correction (Cahill et al., 2013;Xue and Hwa, 2014), statement strength identifica-tion (Tan and Lee, 2014), etc. Second, we proposea sentence-level revision schema for argumentativewriting, a common form of writing in education. Inthe schema, categories are defined for describing anauthor’s revision operations and revision purposes.The revision operations can be directly decided ac-cording to the results of sentence alignment, whilerevision purposes can be reliably manually anno-tated. We also do a corpus study to demonstrate theutility of sentence-level revisions for revision anal-ysis. Finally, we adapt features from Wikipedia re-vision classification work and explore new featuresfor our classification task, which differs from priorwork with respect to both the revision classes to bepredicted and the sentence-level revision extractionmethod. Our models are able to distinguish whetherthe revisions are changing the content or not. For
fine-grained classification, our models also demon-strate good performance for some categories. Be-yond the classification task, we also investigate thepipelining of revision extraction and classification.Results of an extrinsic evaluation show that the au-tomatically extracted and classified revisions can beused for writing improvement prediction.
2 Related work
Revision extraction To extract the revisions forrevision analysis, a widely chosen strategy usescharacter-based text comparison algorithms first andthen builds revision units on the differences ex-tracted (Bronner and Monz, 2012; Daxenberger andGurevych, 2013). While theoretically revisions ex-tracted with this method can be more precise thansentence-level extractions, it could suffer from themisalignments of revised content due to character-level text comparison algorithms. For example,when a sentence is rephrased, a character-level textcomparison algorithm is likely to make alignmenterrors as it could not recognize semantic similarity.As educational research has suggested that revisionanalysis can be done at the sentence level (Faigleyand Witte, 1981), we propose to extract revisions at
134
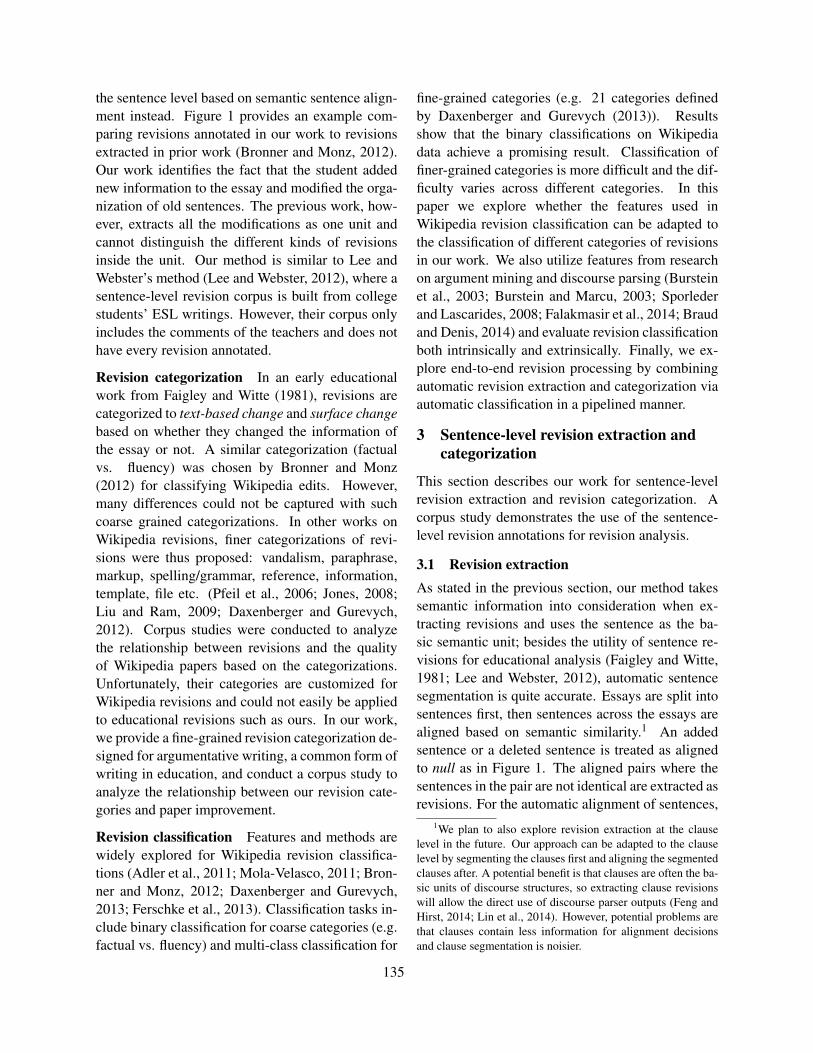
the sentence level based on semantic sentence align-ment instead. Figure 1 provides an example com-paring revisions annotated in our work to revisionsextracted in prior work (Bronner and Monz, 2012).Our work identifies the fact that the student addednew information to the essay and modified the orga-nization of old sentences. The previous work, how-ever, extracts all the modifications as one unit andcannot distinguish the different kinds of revisionsinside the unit. Our method is similar to Lee andWebster’s method (Lee and Webster, 2012), where asentence-level revision corpus is built from collegestudents’ ESL writings. However, their corpus onlyincludes the comments of the teachers and does nothave every revision annotated.
Revision categorization In an early educationalwork from Faigley and Witte (1981), revisions arecategorized to text-based change and surface changebased on whether they changed the information ofthe essay or not. A similar categorization (factualvs. fluency) was chosen by Bronner and Monz(2012) for classifying Wikipedia edits. However,many differences could not be captured with suchcoarse grained categorizations. In other works onWikipedia revisions, finer categorizations of revi-sions were thus proposed: vandalism, paraphrase,markup, spelling/grammar, reference, information,template, file etc. (Pfeil et al., 2006; Jones, 2008;Liu and Ram, 2009; Daxenberger and Gurevych,2012). Corpus studies were conducted to analyzethe relationship between revisions and the qualityof Wikipedia papers based on the categorizations.Unfortunately, their categories are customized forWikipedia revisions and could not easily be appliedto educational revisions such as ours. In our work,we provide a fine-grained revision categorization de-signed for argumentative writing, a common form ofwriting in education, and conduct a corpus study toanalyze the relationship between our revision cate-gories and paper improvement.
Revision classification Features and methods arewidely explored for Wikipedia revision classifica-tions (Adler et al., 2011; Mola-Velasco, 2011; Bron-ner and Monz, 2012; Daxenberger and Gurevych,2013; Ferschke et al., 2013). Classification tasks in-clude binary classification for coarse categories (e.g.factual vs. fluency) and multi-class classification for
fine-grained categories (e.g. 21 categories definedby Daxenberger and Gurevych (2013)). Resultsshow that the binary classifications on Wikipediadata achieve a promising result. Classification offiner-grained categories is more difficult and the dif-ficulty varies across different categories. In thispaper we explore whether the features used inWikipedia revision classification can be adapted tothe classification of different categories of revisionsin our work. We also utilize features from researchon argument mining and discourse parsing (Bursteinet al., 2003; Burstein and Marcu, 2003; Sporlederand Lascarides, 2008; Falakmasir et al., 2014; Braudand Denis, 2014) and evaluate revision classificationboth intrinsically and extrinsically. Finally, we ex-plore end-to-end revision processing by combiningautomatic revision extraction and categorization viaautomatic classification in a pipelined manner.
3 Sentence-level revision extraction andcategorization
This section describes our work for sentence-levelrevision extraction and revision categorization. Acorpus study demonstrates the use of the sentence-level revision annotations for revision analysis.
3.1 Revision extractionAs stated in the previous section, our method takessemantic information into consideration when ex-tracting revisions and uses the sentence as the ba-sic semantic unit; besides the utility of sentence re-visions for educational analysis (Faigley and Witte,1981; Lee and Webster, 2012), automatic sentencesegmentation is quite accurate. Essays are split intosentences first, then sentences across the essays arealigned based on semantic similarity.1 An addedsentence or a deleted sentence is treated as alignedto null as in Figure 1. The aligned pairs where thesentences in the pair are not identical are extracted asrevisions. For the automatic alignment of sentences,
1We plan to also explore revision extraction at the clauselevel in the future. Our approach can be adapted to the clauselevel by segmenting the clauses first and aligning the segmentedclauses after. A potential benefit is that clauses are often the ba-sic units of discourse structures, so extracting clause revisionswill allow the direct use of discourse parser outputs (Feng andHirst, 2014; Lin et al., 2014). However, potential problems arethat clauses contain less information for alignment decisionsand clause segmentation is noisier.
135
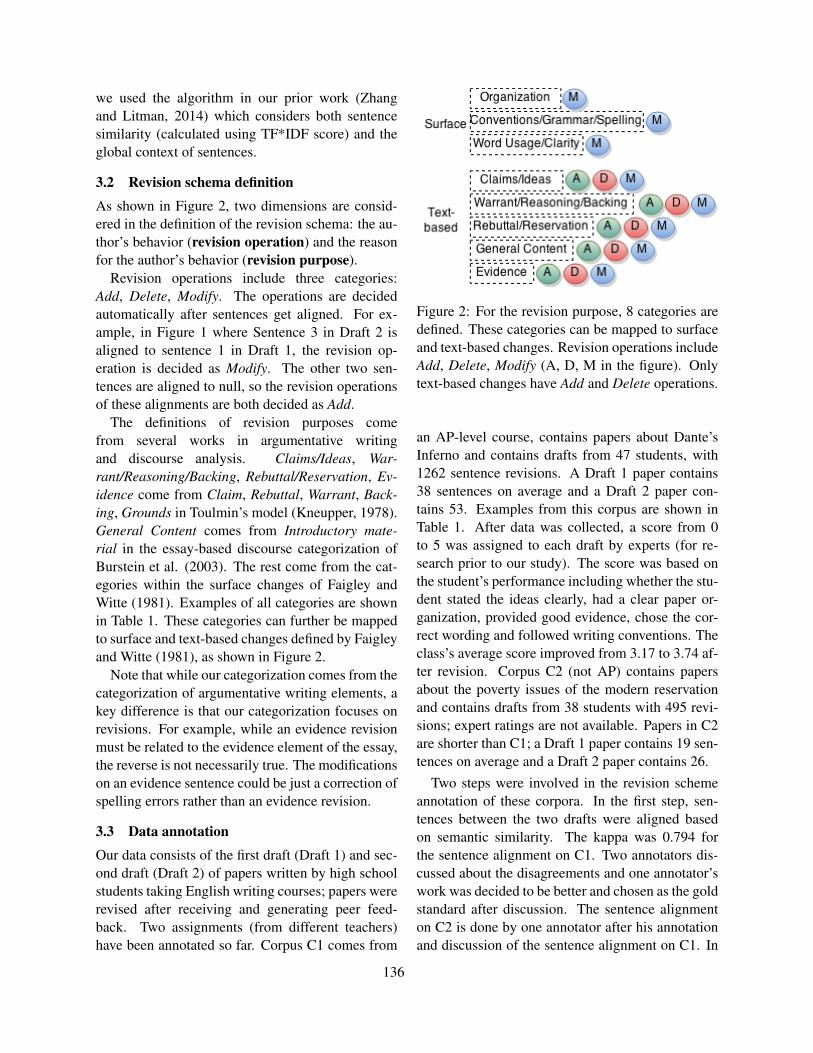
we used the algorithm in our prior work (Zhangand Litman, 2014) which considers both sentencesimilarity (calculated using TF*IDF score) and theglobal context of sentences.
3.2 Revision schema definitionAs shown in Figure 2, two dimensions are consid-ered in the definition of the revision schema: the au-thor’s behavior (revision operation) and the reasonfor the author’s behavior (revision purpose).
Revision operations include three categories:Add, Delete, Modify. The operations are decidedautomatically after sentences get aligned. For ex-ample, in Figure 1 where Sentence 3 in Draft 2 isaligned to sentence 1 in Draft 1, the revision op-eration is decided as Modify. The other two sen-tences are aligned to null, so the revision operationsof these alignments are both decided as Add.
The definitions of revision purposes comefrom several works in argumentative writingand discourse analysis. Claims/Ideas, War-rant/Reasoning/Backing, Rebuttal/Reservation, Ev-idence come from Claim, Rebuttal, Warrant, Back-ing, Grounds in Toulmin’s model (Kneupper, 1978).General Content comes from Introductory mate-rial in the essay-based discourse categorization ofBurstein et al. (2003). The rest come from the cat-egories within the surface changes of Faigley andWitte (1981). Examples of all categories are shownin Table 1. These categories can further be mappedto surface and text-based changes defined by Faigleyand Witte (1981), as shown in Figure 2.
Note that while our categorization comes from thecategorization of argumentative writing elements, akey difference is that our categorization focuses onrevisions. For example, while an evidence revisionmust be related to the evidence element of the essay,the reverse is not necessarily true. The modificationson an evidence sentence could be just a correction ofspelling errors rather than an evidence revision.
3.3 Data annotationOur data consists of the first draft (Draft 1) and sec-ond draft (Draft 2) of papers written by high schoolstudents taking English writing courses; papers wererevised after receiving and generating peer feed-back. Two assignments (from different teachers)have been annotated so far. Corpus C1 comes from
Figure 2: For the revision purpose, 8 categories aredefined. These categories can be mapped to surfaceand text-based changes. Revision operations includeAdd, Delete, Modify (A, D, M in the figure). Onlytext-based changes have Add and Delete operations.
an AP-level course, contains papers about Dante’sInferno and contains drafts from 47 students, with1262 sentence revisions. A Draft 1 paper contains38 sentences on average and a Draft 2 paper con-tains 53. Examples from this corpus are shown inTable 1. After data was collected, a score from 0to 5 was assigned to each draft by experts (for re-search prior to our study). The score was based onthe student’s performance including whether the stu-dent stated the ideas clearly, had a clear paper or-ganization, provided good evidence, chose the cor-rect wording and followed writing conventions. Theclass’s average score improved from 3.17 to 3.74 af-ter revision. Corpus C2 (not AP) contains papersabout the poverty issues of the modern reservationand contains drafts from 38 students with 495 revi-sions; expert ratings are not available. Papers in C2are shorter than C1; a Draft 1 paper contains 19 sen-tences on average and a Draft 2 paper contains 26.
Two steps were involved in the revision schemeannotation of these corpora. In the first step, sen-tences between the two drafts were aligned basedon semantic similarity. The kappa was 0.794 forthe sentence alignment on C1. Two annotators dis-cussed about the disagreements and one annotator’swork was decided to be better and chosen as the goldstandard after discussion. The sentence alignmenton C2 is done by one annotator after his annotationand discussion of the sentence alignment on C1. In
136
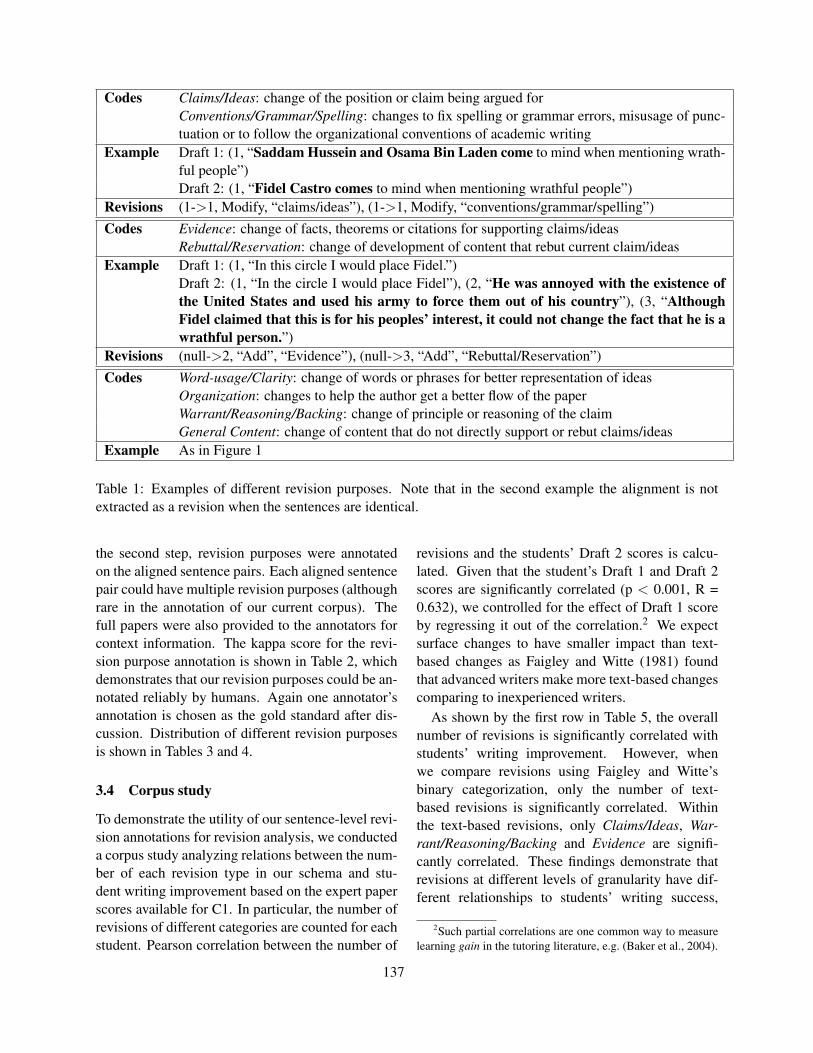
Codes Claims/Ideas: change of the position or claim being argued forConventions/Grammar/Spelling: changes to fix spelling or grammar errors, misusage of punc-tuation or to follow the organizational conventions of academic writing
Example Draft 1: (1, “Saddam Hussein and Osama Bin Laden come to mind when mentioning wrath-ful people”)Draft 2: (1, “Fidel Castro comes to mind when mentioning wrathful people”)
Revisions (1->1, Modify, “claims/ideas”), (1->1, Modify, “conventions/grammar/spelling”)Codes Evidence: change of facts, theorems or citations for supporting claims/ideas
Rebuttal/Reservation: change of development of content that rebut current claim/ideasExample Draft 1: (1, “In this circle I would place Fidel.”)
Draft 2: (1, “In the circle I would place Fidel”), (2, “He was annoyed with the existence ofthe United States and used his army to force them out of his country”), (3, “AlthoughFidel claimed that this is for his peoples’ interest, it could not change the fact that he is awrathful person.”)
Revisions (null->2, “Add”, “Evidence”), (null->3, “Add”, “Rebuttal/Reservation”)Codes Word-usage/Clarity: change of words or phrases for better representation of ideas
Organization: changes to help the author get a better flow of the paperWarrant/Reasoning/Backing: change of principle or reasoning of the claimGeneral Content: change of content that do not directly support or rebut claims/ideas
Example As in Figure 1
Table 1: Examples of different revision purposes. Note that in the second example the alignment is notextracted as a revision when the sentences are identical.
the second step, revision purposes were annotatedon the aligned sentence pairs. Each aligned sentencepair could have multiple revision purposes (althoughrare in the annotation of our current corpus). Thefull papers were also provided to the annotators forcontext information. The kappa score for the revi-sion purpose annotation is shown in Table 2, whichdemonstrates that our revision purposes could be an-notated reliably by humans. Again one annotator’sannotation is chosen as the gold standard after dis-cussion. Distribution of different revision purposesis shown in Tables 3 and 4.
3.4 Corpus study
To demonstrate the utility of our sentence-level revi-sion annotations for revision analysis, we conducteda corpus study analyzing relations between the num-ber of each revision type in our schema and stu-dent writing improvement based on the expert paperscores available for C1. In particular, the number ofrevisions of different categories are counted for eachstudent. Pearson correlation between the number of
revisions and the students’ Draft 2 scores is calcu-lated. Given that the student’s Draft 1 and Draft 2scores are significantly correlated (p < 0.001, R =0.632), we controlled for the effect of Draft 1 scoreby regressing it out of the correlation.2 We expectsurface changes to have smaller impact than text-based changes as Faigley and Witte (1981) foundthat advanced writers make more text-based changescomparing to inexperienced writers.
As shown by the first row in Table 5, the overallnumber of revisions is significantly correlated withstudents’ writing improvement. However, whenwe compare revisions using Faigley and Witte’sbinary categorization, only the number of text-based revisions is significantly correlated. Withinthe text-based revisions, only Claims/Ideas, War-rant/Reasoning/Backing and Evidence are signifi-cantly correlated. These findings demonstrate thatrevisions at different levels of granularity have dif-ferent relationships to students’ writing success,
2Such partial correlations are one common way to measurelearning gain in the tutoring literature, e.g. (Baker et al., 2004).
137
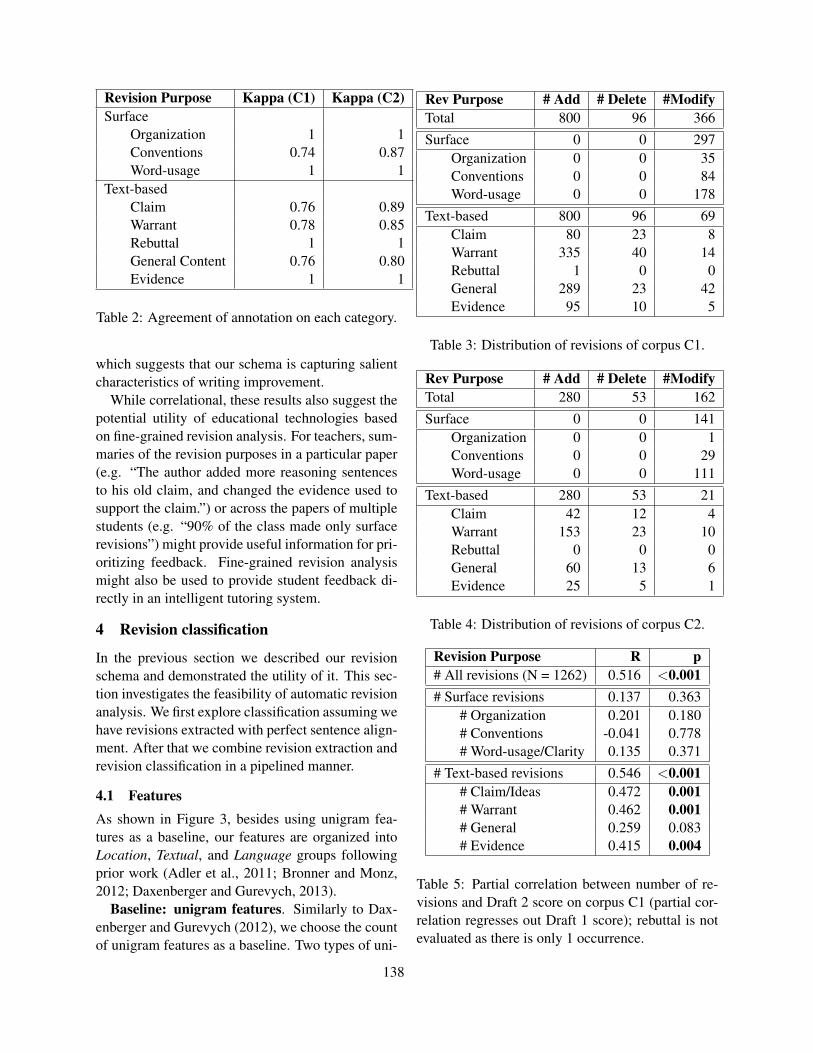
Revision Purpose Kappa (C1) Kappa (C2)Surface
Organization 1 1Conventions 0.74 0.87Word-usage 1 1
Text-basedClaim 0.76 0.89Warrant 0.78 0.85Rebuttal 1 1General Content 0.76 0.80Evidence 1 1
Table 2: Agreement of annotation on each category.
which suggests that our schema is capturing salientcharacteristics of writing improvement.
While correlational, these results also suggest thepotential utility of educational technologies basedon fine-grained revision analysis. For teachers, sum-maries of the revision purposes in a particular paper(e.g. “The author added more reasoning sentencesto his old claim, and changed the evidence used tosupport the claim.”) or across the papers of multiplestudents (e.g. “90% of the class made only surfacerevisions”) might provide useful information for pri-oritizing feedback. Fine-grained revision analysismight also be used to provide student feedback di-rectly in an intelligent tutoring system.
4 Revision classification
In the previous section we described our revisionschema and demonstrated the utility of it. This sec-tion investigates the feasibility of automatic revisionanalysis. We first explore classification assuming wehave revisions extracted with perfect sentence align-ment. After that we combine revision extraction andrevision classification in a pipelined manner.
4.1 FeaturesAs shown in Figure 3, besides using unigram fea-tures as a baseline, our features are organized intoLocation, Textual, and Language groups followingprior work (Adler et al., 2011; Bronner and Monz,2012; Daxenberger and Gurevych, 2013).
Baseline: unigram features. Similarly to Dax-enberger and Gurevych (2012), we choose the countof unigram features as a baseline. Two types of uni-
Rev Purpose # Add # Delete #ModifyTotal 800 96 366Surface 0 0 297
Organization 0 0 35Conventions 0 0 84Word-usage 0 0 178
Text-based 800 96 69Claim 80 23 8Warrant 335 40 14Rebuttal 1 0 0General 289 23 42Evidence 95 10 5
Table 3: Distribution of revisions of corpus C1.
Rev Purpose # Add # Delete #ModifyTotal 280 53 162Surface 0 0 141
Organization 0 0 1Conventions 0 0 29Word-usage 0 0 111
Text-based 280 53 21Claim 42 12 4Warrant 153 23 10Rebuttal 0 0 0General 60 13 6Evidence 25 5 1
Table 4: Distribution of revisions of corpus C2.
Revision Purpose R p# All revisions (N = 1262) 0.516 <0.001# Surface revisions 0.137 0.363
# Organization 0.201 0.180# Conventions -0.041 0.778# Word-usage/Clarity 0.135 0.371
# Text-based revisions 0.546 <0.001# Claim/Ideas 0.472 0.001# Warrant 0.462 0.001# General 0.259 0.083# Evidence 0.415 0.004
Table 5: Partial correlation between number of re-visions and Draft 2 score on corpus C1 (partial cor-relation regresses out Draft 1 score); rebuttal is notevaluated as there is only 1 occurrence.
138
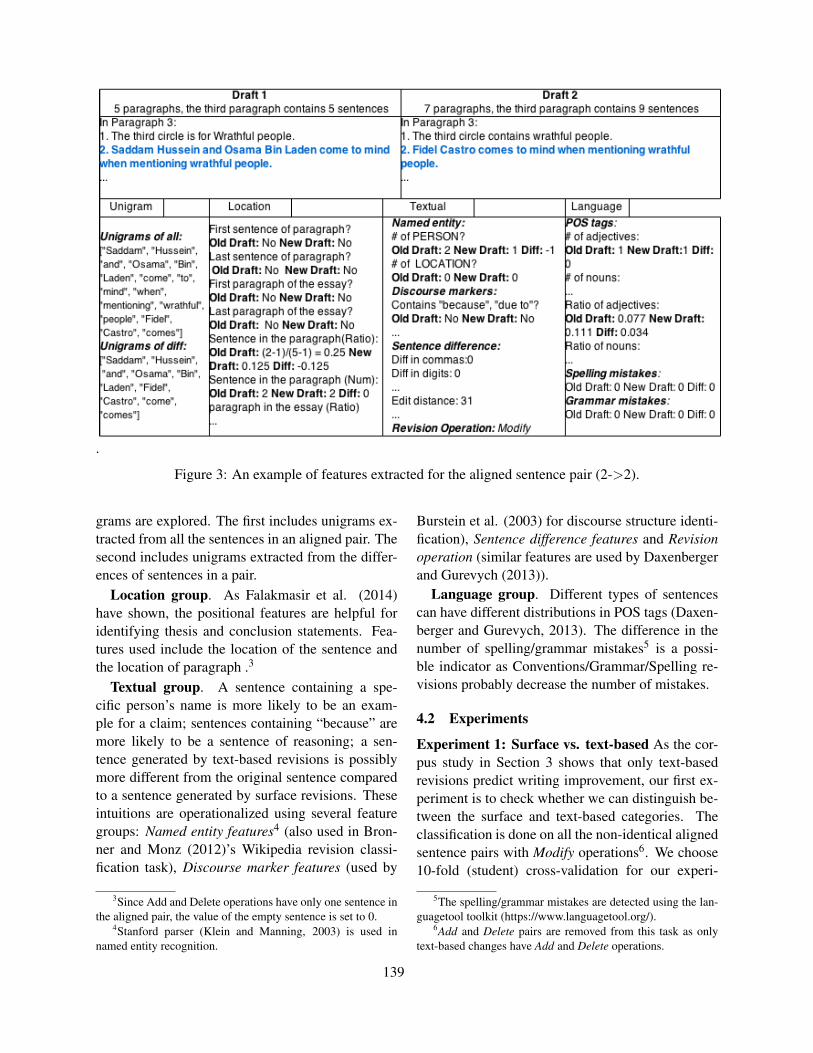
.
Figure 3: An example of features extracted for the aligned sentence pair (2->2).
grams are explored. The first includes unigrams ex-tracted from all the sentences in an aligned pair. Thesecond includes unigrams extracted from the differ-ences of sentences in a pair.
Location group. As Falakmasir et al. (2014)have shown, the positional features are helpful foridentifying thesis and conclusion statements. Fea-tures used include the location of the sentence andthe location of paragraph .3
Textual group. A sentence containing a spe-cific person’s name is more likely to be an exam-ple for a claim; sentences containing “because” aremore likely to be a sentence of reasoning; a sen-tence generated by text-based revisions is possiblymore different from the original sentence comparedto a sentence generated by surface revisions. Theseintuitions are operationalized using several featuregroups: Named entity features4 (also used in Bron-ner and Monz (2012)’s Wikipedia revision classi-fication task), Discourse marker features (used by
3Since Add and Delete operations have only one sentence inthe aligned pair, the value of the empty sentence is set to 0.
4Stanford parser (Klein and Manning, 2003) is used innamed entity recognition.
Burstein et al. (2003) for discourse structure identi-fication), Sentence difference features and Revisionoperation (similar features are used by Daxenbergerand Gurevych (2013)).
Language group. Different types of sentencescan have different distributions in POS tags (Daxen-berger and Gurevych, 2013). The difference in thenumber of spelling/grammar mistakes5 is a possi-ble indicator as Conventions/Grammar/Spelling re-visions probably decrease the number of mistakes.
4.2 Experiments
Experiment 1: Surface vs. text-based As the cor-pus study in Section 3 shows that only text-basedrevisions predict writing improvement, our first ex-periment is to check whether we can distinguish be-tween the surface and text-based categories. Theclassification is done on all the non-identical alignedsentence pairs with Modify operations6. We choose10-fold (student) cross-validation for our experi-
5The spelling/grammar mistakes are detected using the lan-guagetool toolkit (https://www.languagetool.org/).
6Add and Delete pairs are removed from this task as onlytext-based changes have Add and Delete operations.
139
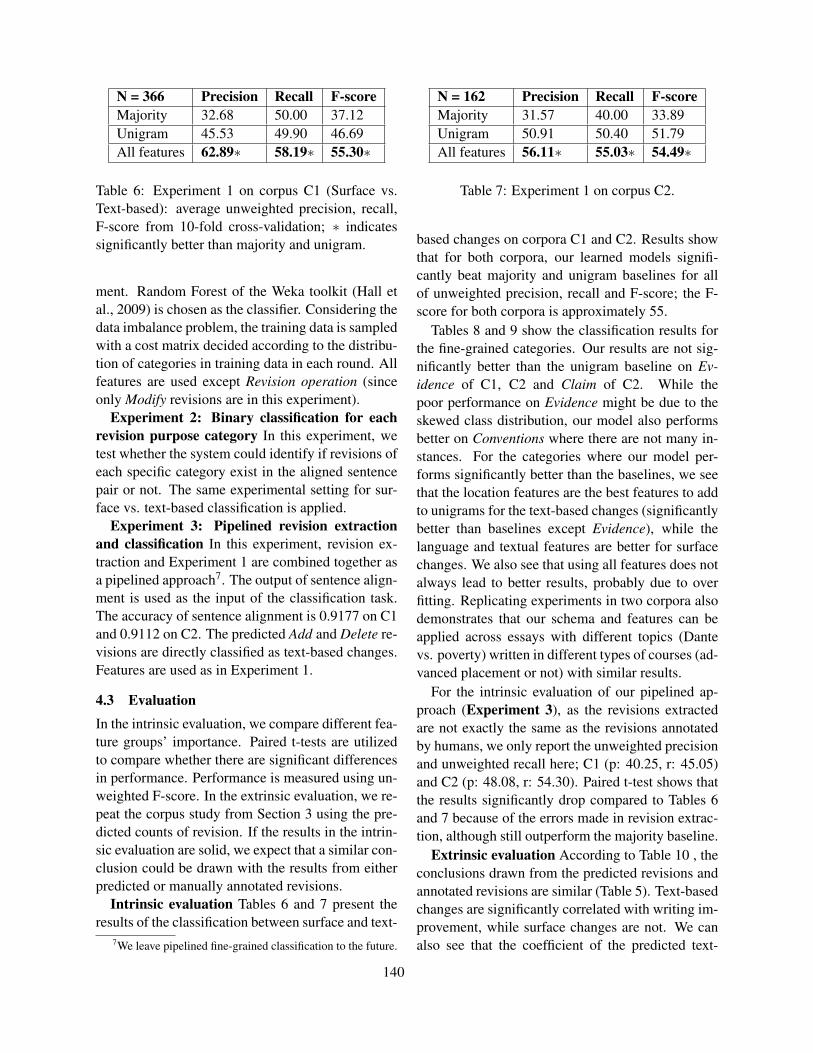
N = 366 Precision Recall F-scoreMajority 32.68 50.00 37.12Unigram 45.53 49.90 46.69All features 62.89∗ 58.19∗ 55.30∗
Table 6: Experiment 1 on corpus C1 (Surface vs.Text-based): average unweighted precision, recall,F-score from 10-fold cross-validation; ∗ indicatessignificantly better than majority and unigram.
ment. Random Forest of the Weka toolkit (Hall etal., 2009) is chosen as the classifier. Considering thedata imbalance problem, the training data is sampledwith a cost matrix decided according to the distribu-tion of categories in training data in each round. Allfeatures are used except Revision operation (sinceonly Modify revisions are in this experiment).
Experiment 2: Binary classification for eachrevision purpose category In this experiment, wetest whether the system could identify if revisions ofeach specific category exist in the aligned sentencepair or not. The same experimental setting for sur-face vs. text-based classification is applied.
Experiment 3: Pipelined revision extractionand classification In this experiment, revision ex-traction and Experiment 1 are combined together asa pipelined approach7. The output of sentence align-ment is used as the input of the classification task.The accuracy of sentence alignment is 0.9177 on C1and 0.9112 on C2. The predicted Add and Delete re-visions are directly classified as text-based changes.Features are used as in Experiment 1.
4.3 EvaluationIn the intrinsic evaluation, we compare different fea-ture groups’ importance. Paired t-tests are utilizedto compare whether there are significant differencesin performance. Performance is measured using un-weighted F-score. In the extrinsic evaluation, we re-peat the corpus study from Section 3 using the pre-dicted counts of revision. If the results in the intrin-sic evaluation are solid, we expect that a similar con-clusion could be drawn with the results from eitherpredicted or manually annotated revisions.
Intrinsic evaluation Tables 6 and 7 present theresults of the classification between surface and text-
7We leave pipelined fine-grained classification to the future.
N = 162 Precision Recall F-scoreMajority 31.57 40.00 33.89Unigram 50.91 50.40 51.79All features 56.11∗ 55.03∗ 54.49∗
Table 7: Experiment 1 on corpus C2.
based changes on corpora C1 and C2. Results showthat for both corpora, our learned models signifi-cantly beat majority and unigram baselines for allof unweighted precision, recall and F-score; the F-score for both corpora is approximately 55.
Tables 8 and 9 show the classification results forthe fine-grained categories. Our results are not sig-nificantly better than the unigram baseline on Ev-idence of C1, C2 and Claim of C2. While thepoor performance on Evidence might be due to theskewed class distribution, our model also performsbetter on Conventions where there are not many in-stances. For the categories where our model per-forms significantly better than the baselines, we seethat the location features are the best features to addto unigrams for the text-based changes (significantlybetter than baselines except Evidence), while thelanguage and textual features are better for surfacechanges. We also see that using all features does notalways lead to better results, probably due to overfitting. Replicating experiments in two corpora alsodemonstrates that our schema and features can beapplied across essays with different topics (Dantevs. poverty) written in different types of courses (ad-vanced placement or not) with similar results.
For the intrinsic evaluation of our pipelined ap-proach (Experiment 3), as the revisions extractedare not exactly the same as the revisions annotatedby humans, we only report the unweighted precisionand unweighted recall here; C1 (p: 40.25, r: 45.05)and C2 (p: 48.08, r: 54.30). Paired t-test shows thatthe results significantly drop compared to Tables 6and 7 because of the errors made in revision extrac-tion, although still outperform the majority baseline.
Extrinsic evaluation According to Table 10 , theconclusions drawn from the predicted revisions andannotated revisions are similar (Table 5). Text-basedchanges are significantly correlated with writing im-provement, while surface changes are not. We canalso see that the coefficient of the predicted text-
140

N = 1261 Text-based SurfaceExperiments Claim Warrant General Evidence Org. Word ConventionsMajority 39.24 32.25 29.38 27.47 25.49 27.75 31.23Unigram 65.64 63.24 69.21 60.40 49.23 62.07 56.05All features 66.20 70.76∗ 72.65∗ 60.57 54.01∗ 73.79∗ 70.95∗Textual+unigram 71.54∗ 68.13∗ 70.76 59.73 52.62∗ 75.92∗ 71.98∗Language+unigram 67.76∗ 66.27∗ 69.23 59.81 49.21 65.01∗ 69.62∗Location+unigram 69.90∗ 67.78∗ 72.94∗ 59.14 49.25 62.40 66.85∗
Table 8: Experiment 2 on corpus C1: average unweighted F-score from 10-fold cross-validation; ∗ indicatessignificantly better than majority and unigram baselines. Rebuttal is removed as it only occurred once.
N = 494 Text-based SurfaceExperiments Claim Warrant General Evidence Word ConventionsMajority 24.89 32.05 28.21 27.02 13.00 32.67Unigram 54.34 64.06 55.00 56.99 49.56 60.09All features 50.22 67.50∗ 56.50 53.90 56.07∗ 77.78∗Textual+unigram 52.19 65.79 55.74 56.08 54.19∗ 76.08∗Language+unigram 50.54 68.24∗ 56.42 56.15 58.83∗ 78.92∗Location+unigram 53.20 66.45∗ 58.08∗ 52.57 51.55 75.39∗
Table 9: Experiment 2 on corpus C2; Organization is removed as it only occurred once.
Predicted purposes R p#All revisions (N = 1262) 0.516 <0.001#Surface revisions 0.175 0.245#Text-based revisions 0.553 <0.001Pipeline predicted purposes R p#All (predicted N = 1356) 0.509 <0.001#Surface revisions 0.230 0.124#Text-based revisions 0.542 <0.001
Table 10: Partial correlation between number of pre-dicted revisions and Draft 2 score on corpus C1.(Upper: Experiment 1, Lower: Experiment 3)
based change correlation is close to the coefficientof the manually annotated results.
5 Conclusion and current directions
This paper contributes to the study of revisions forargumentative writing. A revision schema is definedfor revision categorization. Two corpora are anno-tated based on the schema. The agreement studydemonstrates that the categories defined can be re-liably annotated by humans. Study of the annotated
corpus demonstrates the utility of the annotation forrevision analysis. For automatic revision classifica-tion, our system can beat the unigram baseline inthe classification of higher level categories (surfacevs. text-based). However, the difficulty increases forfine-grained category classification. Results showthat different feature groups are required for differ-ent purpose classifications. Results of extrinsic eval-uations show that the automatically analyzed revi-sions can be used for writer improvement prediction.
In the future, we plan to annotate revisionsfrom different student levels (college-level, grad-uate level, etc.) as our current annotations lackfull coverage of all revision purposes (e.g., “Re-buttal/Reservation” rarely occurs in our high schoolcorpora). We also plan to annotate data from othereducational genres (e.g. technical reports, sciencepapers, etc.) to see if the schema generalizes, and toexplore more category-specific features to improvethe fine-grained classification results. In the longer-term, we plan to apply our revision predictions ina summarization or learning analytics systems forteachers or a tutoring system for students.
141
Acknowledgments
We would like to thank Wencan Luo, ChristianSchunn, Amanda Godley, Kevin Ashley and othermembers of the SWoRD group for their helpful feed-back and all the anonymous reviewers for their sug-gestions.
This research is funded by IES AwardR305A120370 and NSF Award #1416980.
ReferencesB. Thomas Adler, Luca De Alfaro, Santiago M. Mola-
Velasco, Paolo Rosso, and Andrew G. West. 2011.Wikipedia vandalism detection: Combining naturallanguage, metadata, and reputation features. In Pro-ceedings of the 12th International Conference onComputational Linguistics and Intelligent Text Pro-cessing - Volume Part II, CICLing’11, pages 277–288,Berlin, Heidelberg. Springer-Verlag.
Ryan Shaun Baker, Albert T Corbett, Kenneth RKoedinger, and Angela Z Wagner. 2004. Off-task be-havior in the cognitive tutor classroom: when studentsgame the system. In Proceedings of the SIGCHI con-ference on Human factors in computing systems, pages383–390.
Chloe Braud and Pascal Denis. 2014. Combining nat-ural and artificial examples to improve implicit dis-course relation identification. In Proceedings of COL-ING 2014, the 25th International Conference on Com-putational Linguistics: Technical Papers, pages 1694–1705, Dublin, Ireland, August. Dublin City Universityand Association for Computational Linguistics.
Amit Bronner and Christof Monz. 2012. User editsclassification using document revision histories. InProceedings of the 13th Conference of the EuropeanChapter of the Association for Computational Lin-guistics, EACL ’12, pages 356–366, Stroudsburg, PA,USA. Association for Computational Linguistics.
Jill Burstein and Daniel Marcu. 2003. A machine learn-ing approach for identification of thesis and conclusionstatements in student essays. Computers and the Hu-manities, 37(4):pp. 455–467.
Jill Burstein, Daniel Marcu, and Kevin Knight. 2003.Finding the write stuff: Automatic identification ofdiscourse structure in student essays. Intelligent Sys-tems, IEEE, 18(1):32–39.
Aoife Cahill, Nitin Madnani, Joel Tetreault, and DianeNapolitano. 2013. Robust systems for preposition er-ror correction using wikipedia revisions. In Proceed-ings of the 2013 Conference of the North AmericanChapter of the Association for Computational Linguis-tics: Human Language Technologies, pages 507–517,
Atlanta, Georgia, June. Association for ComputationalLinguistics.
Jieun Chae and Ani Nenkova. 2009. Predicting the flu-ency of text with shallow structural features: case stud-ies of machine translation and human-written text. InProceedings of the 12th Conference of the EuropeanChapter of the Association for Computational Linguis-tics, pages 139–147. Association for ComputationalLinguistics.
Johannes Daxenberger and Iryna Gurevych. 2012. Acorpus-based study of edit categories in featured andnon-featured Wikipedia articles. In Proceedings ofCOLING 2012, pages 711–726, Mumbai, India, De-cember. The COLING 2012 Organizing Committee.
Johannes Daxenberger and Iryna Gurevych. 2013. Auto-matically classifying edit categories in Wikipedia re-visions. In Proceedings of the 2013 Conference onEmpirical Methods in Natural Language Processing,pages 578–589, Seattle, Washington, USA, October.Association for Computational Linguistics.
Elireview. 2014. Eli review. http://elireview.com/support/. [Online; accessed 11-17-2014].
Lester Faigley and Stephen Witte. 1981. Analyzing revi-sion. College composition and communication, pages400–414.
Mohammad Hassan Falakmasir, Kevin D Ashley, Chris-tian D Schunn, and Diane J Litman. 2014. Identifyingthesis and conclusion statements in student essays toscaffold peer review. In Intelligent Tutoring Systems,pages 254–259. Springer.
Vanessa Wei Feng and Graeme Hirst. 2014. A linear-time bottom-up discourse parser with constraints andpost-editing. In Proceedings of The 52nd AnnualMeeting of the Association for Computational Linguis-tics (ACL 2014), Baltimore, USA, June.
Oliver Ferschke, Johannes Daxenberger, and IrynaGurevych. 2013. A survey of nlp methods and re-sources for analyzing the collaborative writing processin wikipedia. In The Peoples Web Meets NLP, pages121–160. Springer.
Mark Hall, Eibe Frank, Geoffrey Holmes, BernhardPfahringer, Peter Reutemann, and Ian H Witten. 2009.The weka data mining software: an update. ACMSIGKDD explorations newsletter, 11(1):10–18.
John Jones. 2008. Patterns of revision in online writinga study of wikipedia’s featured articles. Written Com-munication, 25(2):262–289.
Dan Klein and Christopher D Manning. 2003. Ac-curate unlexicalized parsing. In Proceedings of the41st Annual Meeting on Association for Computa-tional Linguistics-Volume 1, pages 423–430. Associ-ation for Computational Linguistics.
142
Charles W Kneupper. 1978. Teaching argument: An in-troduction to the toulmin model. College Compositionand Communication, pages 237–241.
John Lee and Jonathan Webster. 2012. A corpus of tex-tual revisions in second language writing. In Proceed-ings of the 50th Annual Meeting of the Associationfor Computational Linguistics: Short Papers-Volume2, pages 248–252. Association for Computational Lin-guistics.
Lightside. 2014. lightside revision assistant. http://lightsidelabs.com/ra/. [Online; accessed11-17-2014].
Ziheng Lin, Hwee Tou Ng, and Min-Yen Kan. 2014. Apdtb-styled end-to-end discourse parser. Natural Lan-guage Engineering, pages 1–34.
Jun Liu and Sudha Ram. 2009. Who does what: Collab-oration patterns in the wikipedia and their impact ondata quality. In 19th Workshop on Information Tech-nologies and Systems, pages 175–180.
Tomoya Mizumoto, Mamoru Komachi, Masaaki Nagata,and Yuji Matsumoto. 2011. Mining revision log oflanguage learning sns for automated japanese errorcorrection of second language learners. In Proceed-ings of 5th International Joint Conference on NaturalLanguage Processing, pages 147–155. Asian Federa-tion of Natural Language Processing.
Santiago M Mola-Velasco. 2011. Wikipedia vandalismdetection. In Proceedings of the 20th internationalconference companion on World wide web, pages 391–396. ACM.
Ulrike Pfeil, Panayiotis Zaphiris, and Chee Siang Ang.2006. Cultural differences in collaborative authoringof wikipedia. Journal of Computer-Mediated Commu-nication, 12(1):88–113.
Caroline Sporleder and Alex Lascarides. 2008. Usingautomatically labelled examples to classify rhetoricalrelations: An assessment. Nat. Lang. Eng., 14(3):369–416, July.
Chenhao Tan and Lillian Lee. 2014. A corpus ofsentence-level revisions in academic writing: A steptowards understanding statement strength in commu-nication. In Proceedings of the 52nd Annual Meet-ing of the Association for Computational Linguistics(Volume 2: Short Papers), pages 403–408, Baltimore,Maryland, June. Association for Computational Lin-guistics.
Jaclyn M. Wells, Morgan Sousa, Mia Martini, andAllen Brizee. 2013. Steps for revising yourpaper. http://owl.english.purdue.edu/owl/resource/561/05.
Huichao Xue and Rebecca Hwa. 2010. Syntax-driven machine translation as a model of esl revision.In Proceedings of the 23rd International Conference
on Computational Linguistics: Posters, pages 1373–1381. Association for Computational Linguistics.
Huichao Xue and Rebecca Hwa. 2014. Improved cor-rection detection in revised esl sentences. In Proceed-ings of the 52nd Annual Meeting of the Association forComputational Linguistics (Volume 2: Short Papers),pages 599–604, Baltimore, Maryland, June. Associa-tion for Computational Linguistics.
Fan Zhang and Diane Litman. 2014. Sentence-levelrewriting detection. In Proceedings of the Ninth Work-shop on Innovative Use of NLP for Building Educa-tional Applications, pages 149–154, Baltimore, Mary-land, June. Association for Computational Linguistics.
143
Proceedings of the Tenth Workshop on Innovative Use of NLP for Building Educational Applications, 2015, pages 144–153,Denver, Colorado, June 4, 2015. c©2015 Association for Computational Linguistics
Embarrassed or Awkward?
Ranking Emotion Synonyms for ESL Learners' Appropriate Wording
Wei-Fan Chen
Academia Sinica
Mei-Hua Chen
Department of Foreign Language and
Literature,
Tunghai University
Lun-Wei Ku
Academia Sinica
Abstract
We introduce a novel framework based on the
probabilistic model for emotion wording as-
sistance. The example sentences from the on-
line dictionary, Vocabulary.com are utilized as
the training data; and the writings in a de-
signed ESL’s writing task are the testing cor-
pus. The emotion events are captured by
extracting patterns of the example sentences.
Our approach learns the joint probability of
contextual emotion events and the emotion
words from the training corpus. After extract-
ing patterns in the testing corpus, we then ag-
gregate their probabilities to suggest the
emotion word that describes the ESL’s con-
text most appropriately. We evaluate the pro-
posed approach by the NDCG@5 of the
suggested words for the writings in the testing
corpus. The experiment result shows our ap-
proach can more appropriately suggest the
emotion words compared to SVM, PMI and
two representative on-line reference tools,
PIGAI and Thesaurus.com.
1 Introduction
Most English-as-a-second-language (ESL) learners
have been found to have difficulties in emotion
vocabulary (Pavlenko, 2008). With limited lexical
knowledge, learners tend to use common emotion
words such as angry and happy to describe their
feelings. Moreover, the learner’s first language
seems to lead to inappropriate word choices (Altar-
riba and Basnight-Brown, 2012). Many learners
consult the thesaurus for synonyms of emotion
words; typically, the synonyms suggested come
with little or no definition or usage information.
Moreover, the suggested synonyms seldom take
into account contextual information. As a result,
the thesaurus does not always help language learn-
ers select appropriately nuanced emotion words,
and can even mislead learners into choosing im-
proper words that sometimes convey the wrong
message (Chen et al., 2013). Take embarrassed
and awkward for example: although they both de-
scribe situations where people feel uneasy or un-
comfortable, in practice they are used in different
scenarios. According to Vocabulary.com, embar-
rassed is more self-conscious and can result from
shame or wounded pride: for instance, He was too
embarrassed to say hello to his drunken father on
the street. On the other hand, awkward would be
“socially uncomfortable” or “unsure and con-
strained in manner”: He felt awkward and reserved
at parties. These examples illustrate not only the
nuances between synonymous emotion words, but
also the difficulty for language learners in deter-
mining proper words. There is a pressing need for
a reference resource providing a sufficient number
of emotion words and their corresponding usage
information to help language learners expand their
knowledge of emotion words and learn proper
emotional expressions.
To address this issue, we propose a novel ap-
proach to help differentiate synonyms of emotion
words based on contextual clues—Ranking Emo-
tional SynOnyms for language Learners’ Vocabu-
lary Expansion (RESOLVE). This involves first
the learning of emotion event scores between an
event and an emotion word from a corpus: these
144

scores quantify how appropriate an emotion word
is to describe a given event. Subsequently, based
on the emotion event in the learner’s text,
RESOLVE suggests a list of ranked emotion words.
2 Related Work
Previous studies related to RESOLVE can be di-
vided into four groups: paraphrasing, emotion
classification, word suggestion and writing as-
sessment. The aim of paraphrasing research is how
to express the same information in various ways.
Such alternative expressions of the same infor-
mation rely on paraphrase pairs which map an ex-
pression to a previously learned counterpart, or
inference rules that re-structure the original sen-
tences. Most work uses machine translation tech-
niques such as statistical machine translation or
multiple-sequence alignment to extract paraphrase
pairs from monolingual corpora (Barzilay and
McKeown, 2001; Keshtkar and Inkpen, 2010), or
bilingual corpora (Bannard and Callison-Burch,
2005; Callison-Burch, 2008; Chen et al., 2012).
Approaches based on inference rules, on the other
hand, derive these rules by analyzing the depend-
ency relations of paraphrase sentences (Lin and
Pantel, 2001; Dinu and Lapata, 2010). Alternative
expressions can be achieved by applying inference
rules to rephrase the original sentence. In general,
the focus of paraphrasing is sentence variation,
which involves sentence re-structuring, phrase al-
ternation and word substitution. Generating an al-
ternative sentence without changing the sentence’s
original meaning is the main concern. For
RESOLVE, in contrast, rather than attempting
preservation, the focus is on appropriate in-context
word substitution. There are several online para-
phrasing tools. PREFER1 (Chen et al., 2012) is an
online paraphrase reference interface that generates
phrase-level paraphrases using a combination of
graph and PageRank techniques. Chen shows a
significant improvement in learner paraphrase
writing performance. For RESOLVE, instead of
pursuing participant improvements in semantically
equivalent rephrasing, the aim is to suggest contex-
tually appropriate wording. Microsoft Contextual
Thesaurus2 (MCT) is similar to PREFER: it is an
online reference tool that smartly rephrases an in-
1 http://service.nlpweb.org/PREFER 2 http://labs.microsofttranslator.com/thesaurus/
put sentence into various alternative expressions,
using both word-level and phrase-level substitution.
However, we know of no study that evaluates
learning effectiveness when using MCT. Finally,
SPIDER (Barreiro, 2011) targets document-level
editing; it relies on derivations from dictionaries
and grammars to paraphrase sentences, aiming at
reducing wordiness and clarifying vague or impre-
cise terms. In short, rather than offering better sug-
gestions, paraphrasing tools provide equivalent
expressions.
Emotion classification concerns approaches to
detect the underlying emotion of a text. Related
work typically attempts this using classifiers.
These classifiers are trained with features such as
n-grams (Tokuhisa et al., 2008), word-level
pointwise mutual information (PMI) values
(Agrawal et al., 2012; Bullinaria et al., 2007; and
Church et al., 1990) or a combination of word POS
and sentence dependency relations (Ghazi et al.,
2012). The remained works of emotion classifica-
tion in above mentioned research to deal with emo-
tions aroused by events inspires us to relate events
to emotion words in RESOLVE. In addition, in
terms of emotion classification, RESOLVE classi-
fies texts into fine-grained classes where each
emotion word can be viewed as a single class; in
contrast, most emotion classification work focuses
only on coarse-grained (6 to 10 classes) emotion
labeling. It is a challenging work.
Word suggestion involves guessing a possible
replacement for a given word in a sentence, or
finding word collocations. A representative re-
search task for word suggestion is the SemEval
2007 English Lexical Substitution task: the prob-
lem is to find a word substitute for the designated
word given a sentence. Zhao et al. (2007) first uses
rules to find possible candidates from WordNet
and verifies the sentence after substitution using
Web search results; Dahl et al. (2007) utilizes a
more traditional n-gram model but uses statistics
from web 5-grams. Although closely related to our
work, this task is different in several ways. First,
the word for which a substitute is required is al-
ready an appropriate word, as it appears in a sen-
tence from a well-written English corpus, the
Internet Corpus of English3. However, the goal of
our work is to determine whether a word selected
by ESL learners is appropriate, and if necessary to
3 http://corpus.leeds.ac.uk/internet.html
145
suggest appropriate alternatives. Observation of
our corpus has shown that typically, the word se-
lected by ESL learners is not the most appropriate
one. This is in contrast to the cited related works in
which the original in-context wording is usually
the most appropriate one. However, in our research
the context often does not support the way the ESL
learner’s word(s) are used. Second, the context of
the given word in SemEval is a sentence, while in
this work it is a document. Third, annotators for
SemEval were limited to at most three possible
substitutions, all of which were to be equally ap-
propriate, while in our work annotators are asked
to assign ranks to all candidates (synonyms of the
given word). Fourth, in SemEval the words to be
substituted come from various syntactic or seman-
tic categories, while we only suggest appropriate
emotion words to the learners.
For writing assessment, existing works are
known as automatic essay assessment (AEA) sys-
tems, which analyze user compositions in terms of
wording, grammar and organization. PIGAI4, tar-
geted at generating suggested revisions, suggests
unranked synonyms for words. However, unranked
synonyms easily confuse Chinese learners (Ma,
2013). E-rater (Leading et al. 2005), a writing
evaluation system developed by the Educational
Testing Service (ETS), offers a prompt-specific
vocabulary usage score, a scoring feature which
evaluates the word choice and compares words in
the writing with samples in low- to high-quality
writings. Ma shows that students’ scores on PIGAI
increase after using PIGAI, and that these results
are in proportion to the frequency they use PIGAI.
As for E-rater, to our best knowledge, its focus is
on helping judges to score writing rather than on
assisting learners. In contrast, the purpose of
RESOLVE is to directly assist language learners in
finding appropriate wording, especially for emo-
tion words.
As context and events are crucial to appropriate
emotion wording, both have been taken into ac-
count in the development of RESOLVE. For con-
text, learner writings describing emotions have
been utilized to extract contextual clues. For events,
Jeong and Myaeng (2012) find that in the well-
annotated TimeBank corpus, 65% of the event
conveyance was accomplished using verbs; thus
we detect events from verb phrases. In contrast to
4 http://www.pigai.org
paraphrasing and emotion analysis, the goal of
RESOLVE is to distinguish the nuances among
emotion synonyms in order to aid in language
learning: this makes it a novel research problem.
3 Method
We postulate that patterns can describe emotion
events, and that event conveyance is accomplished
primarily using verbs (Jeong and Myaeng, 2012).
In RESOLVE, verb-phrase patterns are selected for
use in differentiating emotion word synonyms, that
is, candidate emotion words, using their relation-
ships with these patterns. Figure 1 shows the two-
stage RESOLVE framework. First we learn corpus
patterns (patterns extracted from the corpus) and
their emotion event scores, EES, for all emotion
words, and then, given the target emotion word, we
rank the candidate emotion words to suggest ap-
propriate wording using the writing patterns (pat-
terns extracted from learner writing) and associated
emotion event scores learned in the first stage. To
determine the similarity between corpus patterns
and writing patterns, we also propose a pattern
matching algorithm which takes into account the
cost of wildcard matching. Finally, to verify the
effectiveness of RESOLVE in aiding precise word-
ing, a learning experiment is designed. In an ex-
ample RESOLVE scenario, the learner writes the
following: “I love guava but one day I ate a rotten
guava with a maggot inside, which made me dis-
gust.” She is not sure about the wording so she
turns to RESOLVE for help. She is given a ranked
word suggestion list: repugnance, disgust, repul-
sion, loathing and revulsion; which are more ap-
propriate than the list Theasurus.com provides:
antipathy, dislike, distaste, hatred and loathing.
146
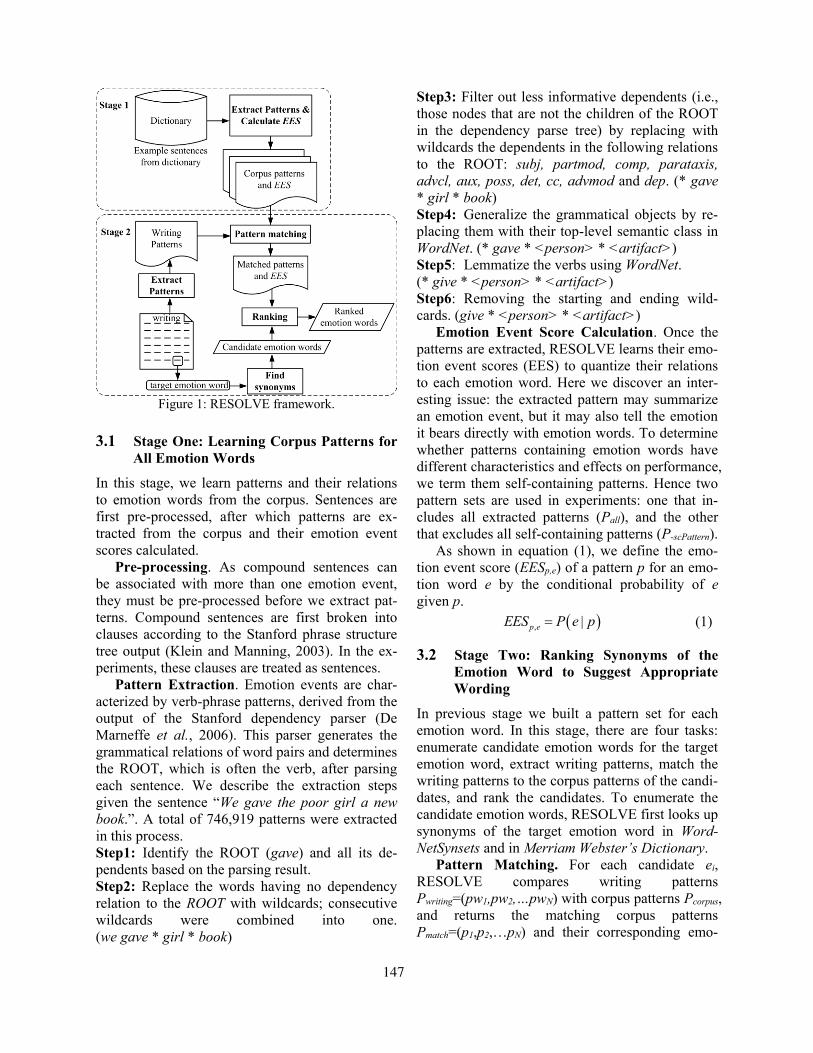
Figure 1: RESOLVE framework.
3.1 Stage One: Learning Corpus Patterns for
All Emotion Words
In this stage, we learn patterns and their relations
to emotion words from the corpus. Sentences are
first pre-processed, after which patterns are ex-
tracted from the corpus and their emotion event
scores calculated.
Pre-processing. As compound sentences can
be associated with more than one emotion event,
they must be pre-processed before we extract pat-
terns. Compound sentences are first broken into
clauses according to the Stanford phrase structure
tree output (Klein and Manning, 2003). In the ex-
periments, these clauses are treated as sentences.
Pattern Extraction. Emotion events are char-
acterized by verb-phrase patterns, derived from the
output of the Stanford dependency parser (De
Marneffe et al., 2006). This parser generates the
grammatical relations of word pairs and determines
the ROOT, which is often the verb, after parsing
each sentence. We describe the extraction steps
given the sentence “We gave the poor girl a new
book.”. A total of 746,919 patterns were extracted
in this process.
Step1: Identify the ROOT (gave) and all its de-
pendents based on the parsing result.
Step2: Replace the words having no dependency
relation to the ROOT with wildcards; consecutive
wildcards were combined into one.
(we gave * girl * book)
Step3: Filter out less informative dependents (i.e., those nodes that are not the children of the ROOT
in the dependency parse tree) by replacing with
wildcards the dependents in the following relations
to the ROOT: subj, partmod, comp, parataxis,
advcl, aux, poss, det, cc, advmod and dep. (* gave
* girl * book)
Step4: Generalize the grammatical objects by re-
placing them with their top-level semantic class in
WordNet. (* gave * <person> * <artifact>)
Step5: Lemmatize the verbs using WordNet.
(* give * <person> * <artifact>)
Step6: Removing the starting and ending wild-
cards. (give * <person> * <artifact>)
Emotion Event Score Calculation. Once the
patterns are extracted, RESOLVE learns their emo-
tion event scores (EES) to quantize their relations
to each emotion word. Here we discover an inter-
esting issue: the extracted pattern may summarize
an emotion event, but it may also tell the emotion
it bears directly with emotion words. To determine
whether patterns containing emotion words have
different characteristics and effects on performance,
we term them self-containing patterns. Hence two
pattern sets are used in experiments: one that in-
cludes all extracted patterns (Pall), and the other
that excludes all self-containing patterns (P-scPattern).
As shown in equation (1), we define the emo-
tion event score (EESp,e) of a pattern p for an emo-
tion word e by the conditional probability of e
given p.
, |p eEES P e p (1)
3.2 Stage Two: Ranking Synonyms of the
Emotion Word to Suggest Appropriate
Wording
In previous stage we built a pattern set for each
emotion word. In this stage, there are four tasks:
enumerate candidate emotion words for the target
emotion word, extract writing patterns, match the
writing patterns to the corpus patterns of the candi-
dates, and rank the candidates. To enumerate the
candidate emotion words, RESOLVE first looks up
synonyms of the target emotion word in Word-
NetSynsets and in Merriam Webster’s Dictionary.
Pattern Matching. For each candidate ei,
RESOLVE compares writing patterns
Pwriting=(pw1,pw2,…pwN) with corpus patterns Pcorpus,
and returns the matching corpus patterns
Pmatch=(p1,p2,…pN) and their corresponding emo-
147
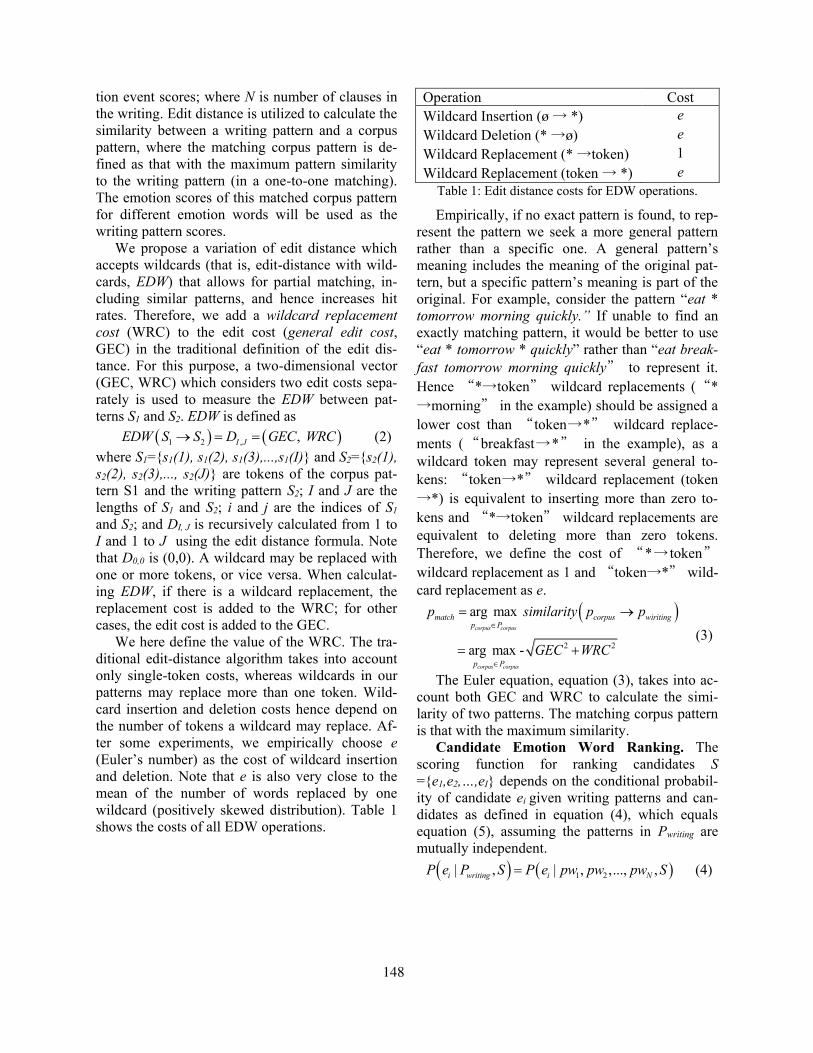
tion event scores; where N is number of clauses in
the writing. Edit distance is utilized to calculate the
similarity between a writing pattern and a corpus
pattern, where the matching corpus pattern is de-
fined as that with the maximum pattern similarity
to the writing pattern (in a one-to-one matching).
The emotion scores of this matched corpus pattern
for different emotion words will be used as the
writing pattern scores.
We propose a variation of edit distance which
accepts wildcards (that is, edit-distance with wild-
cards, EDW) that allows for partial matching, in-
cluding similar patterns, and hence increases hit
rates. Therefore, we add a wildcard replacement
cost (WRC) to the edit cost (general edit cost,
GEC) in the traditional definition of the edit dis-
tance. For this purpose, a two-dimensional vector
(GEC, WRC) which considers two edit costs sepa-
rately is used to measure the EDW between pat-
terns S1 and S2. EDW is defined as
,1 2 , I JE D GECDW S WS RC
(2)
where S1={s1(1), s1(2), s1(3),...,s1(I)} and S2={s2(1),
s2(2), s2(3),..., s2(J)} are tokens of the corpus pat-
tern S1 and the writing pattern S2; I and J are the
lengths of S1 and S2; i and j are the indices of S1
and S2; and DI, J is recursively calculated from 1 to
I and 1 to J using the edit distance formula. Note
that D0,0 is (0,0). A wildcard may be replaced with
one or more tokens, or vice versa. When calculat-
ing EDW, if there is a wildcard replacement, the
replacement cost is added to the WRC; for other
cases, the edit cost is added to the GEC.
We here define the value of the WRC. The tra-
ditional edit-distance algorithm takes into account
only single-token costs, whereas wildcards in our
patterns may replace more than one token. Wild-
card insertion and deletion costs hence depend on
the number of tokens a wildcard may replace. Af-
ter some experiments, we empirically choose e
(Euler’s number) as the cost of wildcard insertion
and deletion. Note that e is also very close to the
mean of the number of words replaced by one
wildcard (positively skewed distribution). Table 1
shows the costs of all EDW operations.
Operation Cost
Wildcard Insertion (ø → *) e
Wildcard Deletion (* →ø) e
Wildcard Replacement (* →token) 1
Wildcard Replacement (token → *) e
Table 1: Edit distance costs for EDW operations.
Empirically, if no exact pattern is found, to rep-
resent the pattern we seek a more general pattern
rather than a specific one. A general pattern’s
meaning includes the meaning of the original pat-
tern, but a specific pattern’s meaning is part of the
original. For example, consider the pattern “eat *
tomorrow morning quickly.” If unable to find an
exactly matching pattern, it would be better to use
“eat * tomorrow * quickly” rather than “eat break-
fast tomorrow morning quickly” to represent it.
Hence “*→token” wildcard replacements (“*
→morning” in the example) should be assigned a
lower cost than “token→*” wildcard replace-
ments (“breakfast→*” in the example), as a
wildcard token may represent several general to-
kens: “token→*” wildcard replacement (token
→*) is equivalent to inserting more than zero to-
kens and “*→token” wildcard replacements are
equivalent to deleting more than zero tokens.
Therefore, we define the cost of “*→ token”
wildcard replacement as 1 and “token→*” wild-
card replacement as e.
2 2
arg max
arg max -
corpus corpus
corpus corpus
match corpus wiritingp P
p P
p similarity p p
GEC WRC
(3)
The Euler equation, equation (3), takes into ac-
count both GEC and WRC to calculate the simi-
larity of two patterns. The matching corpus pattern
is that with the maximum similarity.
Candidate Emotion Word Ranking. The
scoring function for ranking candidates S
={e1,e2,…,eI} depends on the conditional probabil-
ity of candidate ei given writing patterns and can-
didates as defined in equation (4), which equals
equation (5), assuming the patterns in Pwriting are
mutually independent.
1 2| , | , ,..., ,i writing i NP e P S P e pw pw pw S (4)
148
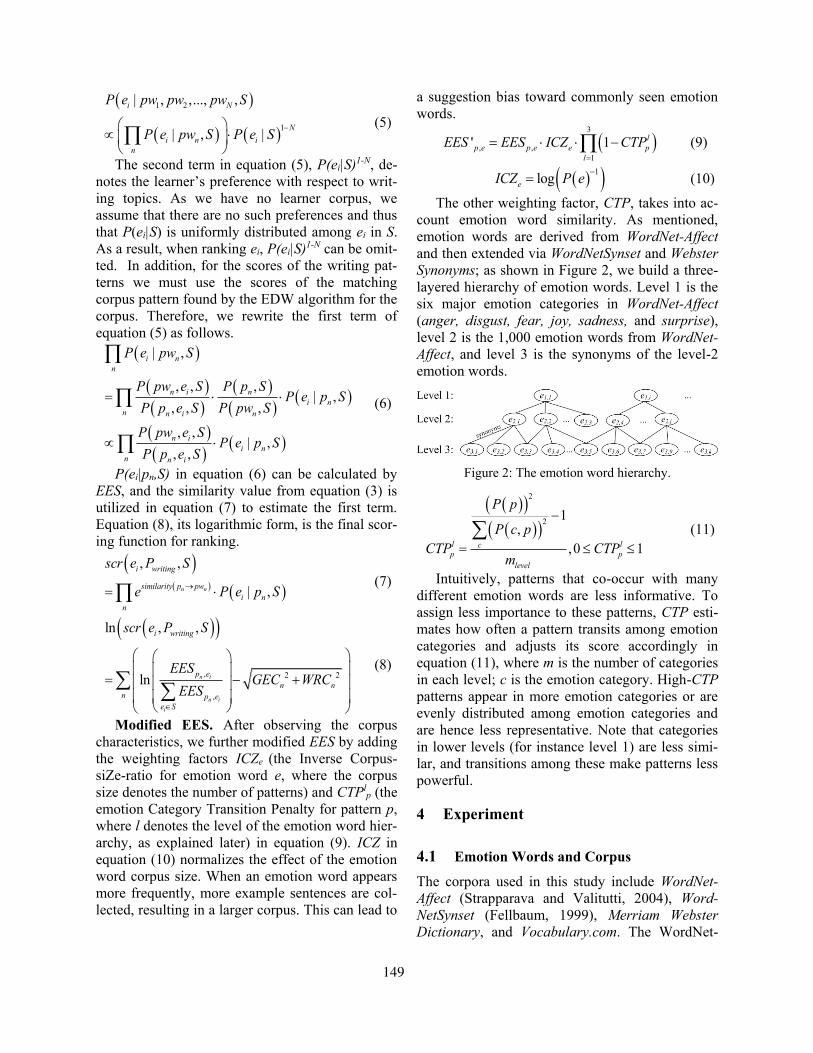
1 2
1
| , ,..., ,
| , |
i N
N
i n i
n
P e pw pw pw S
P e pw S P e S
(5)
The second term in equation (5), P(ei|S)1-N, de-
notes the learner’s preference with respect to writ-
ing topics. As we have no learner corpus, we
assume that there are no such preferences and thus
that P(ei|S) is uniformly distributed among ei in S.
As a result, when ranking ei, P(ei|S)1-N can be omit-
ted. In addition, for the scores of the writing pat-
terns we must use the scores of the matching
corpus pattern found by the EDW algorithm for the
corpus. Therefore, we rewrite the first term of
equation (5) as follows.
| ,
, , ,| ,
, , ,
, ,| ,
, ,
i n
n
n i n
i n
n n i n
n i
i n
n n i
P e pw S
P pw e S P p SP e p S
P p e S P pw S
P pw e SP e p S
P p e S
(6)
P(ei|pn,S) in equation (6) can be calculated by
EES, and the similarity value from equation (3) is
utilized in equation (7) to estimate the first term.
Equation (8), its logarithmic form, is the final scor-
ing function for ranking.
, ,
| ,n n
i writing
similarity p pw
i n
n
scr e P S
e P e p S
(7)
, 2 2
,
ln , ,
ln n i
n i
i
i writing
p e
n n
n p e
e S
scr e P S
EESGEC WRC
EES
(8)
Modified EES. After observing the corpus
characteristics, we further modified EES by adding
the weighting factors ICZe (the Inverse Corpus-
siZe-ratio for emotion word e, where the corpus
size denotes the number of patterns) and CTPlp (the
emotion Category Transition Penalty for pattern p,
where l denotes the level of the emotion word hier-
archy, as explained later) in equation (9). ICZ in
equation (10) normalizes the effect of the emotion
word corpus size. When an emotion word appears
more frequently, more example sentences are col-
lected, resulting in a larger corpus. This can lead to
a suggestion bias toward commonly seen emotion
words.
3
, ,
1
' 1 l
p e p e e p
l
EES EES ICZ CTP
(9)
1logeICZ P e
(10)
The other weighting factor, CTP, takes into ac-
count emotion word similarity. As mentioned,
emotion words are derived from WordNet-Affect
and then extended via WordNetSynset and Webster
Synonyms; as shown in Figure 2, we build a three-
layered hierarchy of emotion words. Level 1 is the
six major emotion categories in WordNet-Affect
(anger, disgust, fear, joy, sadness, and surprise),
level 2 is the 1,000 emotion words from WordNet-
Affect, and level 3 is the synonyms of the level-2
emotion words.
Figure 2: The emotion word hierarchy.
2
21
,
,0 1l lcp p
level
P p
P c p
CTP CTPm
(11)
Intuitively, patterns that co-occur with many
different emotion words are less informative. To
assign less importance to these patterns, CTP esti-
mates how often a pattern transits among emotion
categories and adjusts its score accordingly in
equation (11), where m is the number of categories
in each level; c is the emotion category. High-CTP
patterns appear in more emotion categories or are
evenly distributed among emotion categories and
are hence less representative. Note that categories
in lower levels (for instance level 1) are less simi-
lar, and transitions among these make patterns less
powerful.
4 Experiment
4.1 Emotion Words and Corpus
The corpora used in this study include WordNet-
Affect (Strapparava and Valitutti, 2004), Word-
NetSynset (Fellbaum, 1999), Merriam Webster
Dictionary, and Vocabulary.com. The WordNet-
149
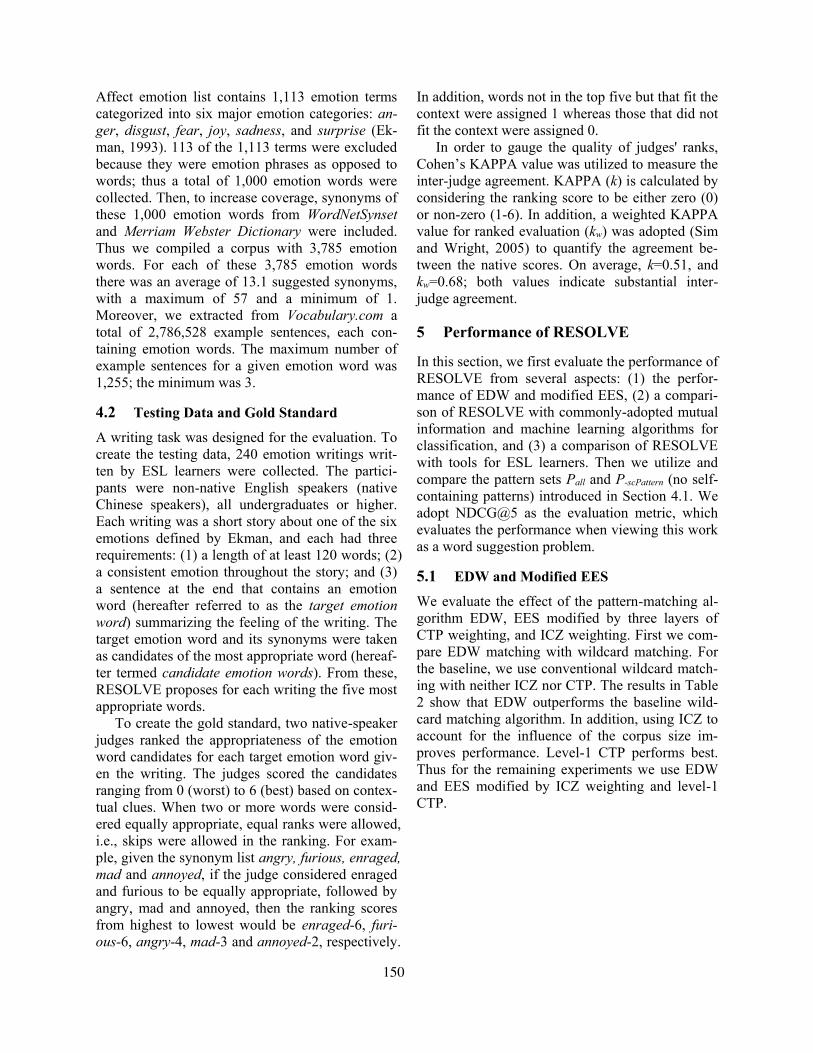
Affect emotion list contains 1,113 emotion terms
categorized into six major emotion categories: an-
ger, disgust, fear, joy, sadness, and surprise (Ek-
man, 1993). 113 of the 1,113 terms were excluded
because they were emotion phrases as opposed to
words; thus a total of 1,000 emotion words were
collected. Then, to increase coverage, synonyms of
these 1,000 emotion words from WordNetSynset
and Merriam Webster Dictionary were included.
Thus we compiled a corpus with 3,785 emotion
words. For each of these 3,785 emotion words
there was an average of 13.1 suggested synonyms,
with a maximum of 57 and a minimum of 1.
Moreover, we extracted from Vocabulary.com a
total of 2,786,528 example sentences, each con-
taining emotion words. The maximum number of
example sentences for a given emotion word was
1,255; the minimum was 3.
4.2 Testing Data and Gold Standard
A writing task was designed for the evaluation. To
create the testing data, 240 emotion writings writ-
ten by ESL learners were collected. The partici-
pants were non-native English speakers (native
Chinese speakers), all undergraduates or higher.
Each writing was a short story about one of the six
emotions defined by Ekman, and each had three
requirements: (1) a length of at least 120 words; (2)
a consistent emotion throughout the story; and (3)
a sentence at the end that contains an emotion
word (hereafter referred to as the target emotion
word) summarizing the feeling of the writing. The
target emotion word and its synonyms were taken
as candidates of the most appropriate word (hereaf-
ter termed candidate emotion words). From these,
RESOLVE proposes for each writing the five most
appropriate words.
To create the gold standard, two native-speaker
judges ranked the appropriateness of the emotion
word candidates for each target emotion word giv-
en the writing. The judges scored the candidates
ranging from 0 (worst) to 6 (best) based on contex-
tual clues. When two or more words were consid-
ered equally appropriate, equal ranks were allowed,
i.e., skips were allowed in the ranking. For exam-
ple, given the synonym list angry, furious, enraged,
mad and annoyed, if the judge considered enraged
and furious to be equally appropriate, followed by
angry, mad and annoyed, then the ranking scores
from highest to lowest would be enraged-6, furi-
ous-6, angry-4, mad-3 and annoyed-2, respectively.
In addition, words not in the top five but that fit the
context were assigned 1 whereas those that did not
fit the context were assigned 0.
In order to gauge the quality of judges' ranks,
Cohen’s KAPPA value was utilized to measure the
inter-judge agreement. KAPPA (k) is calculated by
considering the ranking score to be either zero (0)
or non-zero (1-6). In addition, a weighted KAPPA
value for ranked evaluation (kw) was adopted (Sim
and Wright, 2005) to quantify the agreement be-
tween the native scores. On average, k=0.51, and
kw=0.68; both values indicate substantial inter-
judge agreement.
5 Performance of RESOLVE
In this section, we first evaluate the performance of
RESOLVE from several aspects: (1) the perfor-
mance of EDW and modified EES, (2) a compari-
son of RESOLVE with commonly-adopted mutual
information and machine learning algorithms for
classification, and (3) a comparison of RESOLVE
with tools for ESL learners. Then we utilize and
compare the pattern sets Pall and P-scPattern (no self-
containing patterns) introduced in Section 4.1. We
adopt NDCG@5 as the evaluation metric, which
evaluates the performance when viewing this work
as a word suggestion problem.
5.1 EDW and Modified EES
We evaluate the effect of the pattern-matching al-
gorithm EDW, EES modified by three layers of
CTP weighting, and ICZ weighting. First we com-
pare EDW matching with wildcard matching. For
the baseline, we use conventional wildcard match-
ing with neither ICZ nor CTP. The results in Table
2 show that EDW outperforms the baseline wild-
card matching algorithm. In addition, using ICZ to
account for the influence of the corpus size im-
proves performance. Level-1 CTP performs best.
Thus for the remaining experiments we use EDW
and EES modified by ICZ weighting and level-1
CTP.
150
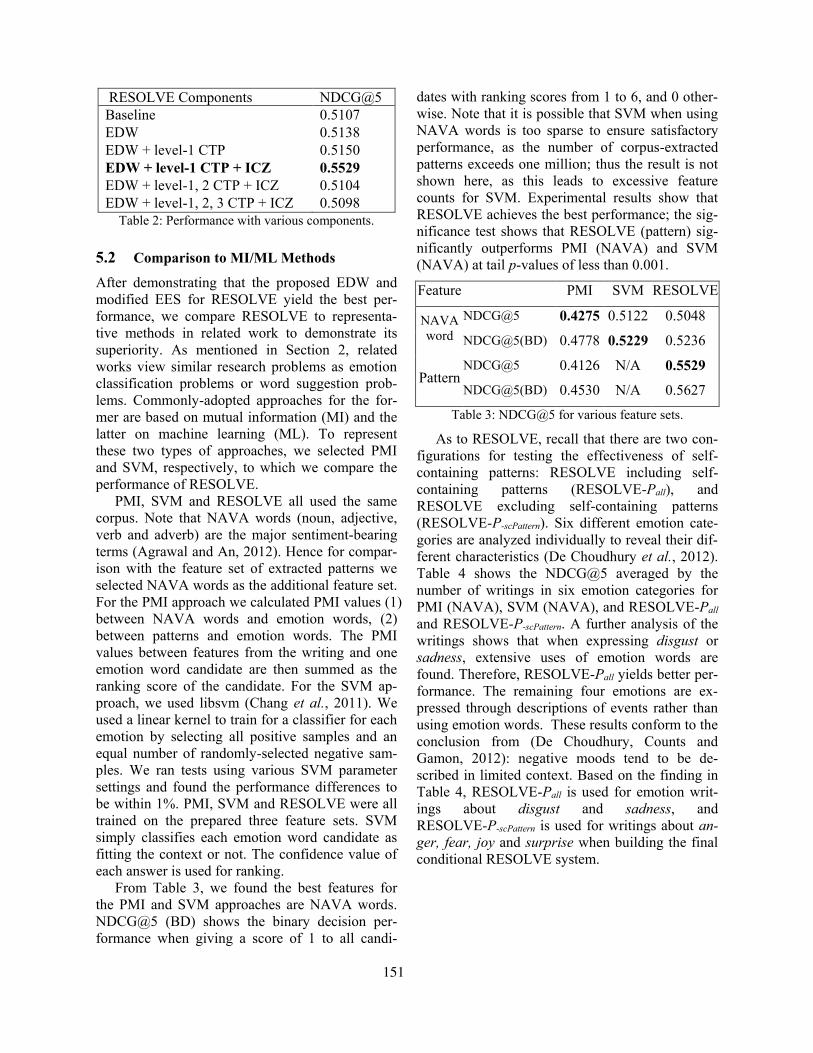
RESOLVE Components NDCG@5
Baseline 0.5107
EDW 0.5138
EDW + level-1 CTP 0.5150
EDW + level-1 CTP + ICZ 0.5529
EDW + level-1, 2 CTP + ICZ 0.5104
EDW + level-1, 2, 3 CTP + ICZ 0.5098
Table 2: Performance with various components.
5.2 Comparison to MI/ML Methods
After demonstrating that the proposed EDW and
modified EES for RESOLVE yield the best per-
formance, we compare RESOLVE to representa-
tive methods in related work to demonstrate its
superiority. As mentioned in Section 2, related
works view similar research problems as emotion
classification problems or word suggestion prob-
lems. Commonly-adopted approaches for the for-
mer are based on mutual information (MI) and the
latter on machine learning (ML). To represent
these two types of approaches, we selected PMI
and SVM, respectively, to which we compare the
performance of RESOLVE.
PMI, SVM and RESOLVE all used the same
corpus. Note that NAVA words (noun, adjective,
verb and adverb) are the major sentiment-bearing
terms (Agrawal and An, 2012). Hence for compar-
ison with the feature set of extracted patterns we
selected NAVA words as the additional feature set.
For the PMI approach we calculated PMI values (1)
between NAVA words and emotion words, (2)
between patterns and emotion words. The PMI
values between features from the writing and one
emotion word candidate are then summed as the
ranking score of the candidate. For the SVM ap-
proach, we used libsvm (Chang et al., 2011). We
used a linear kernel to train for a classifier for each
emotion by selecting all positive samples and an
equal number of randomly-selected negative sam-
ples. We ran tests using various SVM parameter
settings and found the performance differences to
be within 1%. PMI, SVM and RESOLVE were all
trained on the prepared three feature sets. SVM
simply classifies each emotion word candidate as
fitting the context or not. The confidence value of
each answer is used for ranking.
From Table 3, we found the best features for
the PMI and SVM approaches are NAVA words.
NDCG@5 (BD) shows the binary decision per-
formance when giving a score of 1 to all candi-
dates with ranking scores from 1 to 6, and 0 other-
wise. Note that it is possible that SVM when using
NAVA words is too sparse to ensure satisfactory
performance, as the number of corpus-extracted
patterns exceeds one million; thus the result is not
shown here, as this leads to excessive feature
counts for SVM. Experimental results show that
RESOLVE achieves the best performance; the sig-
nificance test shows that RESOLVE (pattern) sig-
nificantly outperforms PMI (NAVA) and SVM
(NAVA) at tail p-values of less than 0.001.
Feature PMI SVM RESOLVE
NAVA
word
NDCG@5 0.4275 0.5122 0.5048
NDCG@5(BD) 0.4778 0.5229 0.5236
Pattern NDCG@5 0.4126 N/A 0.5529
NDCG@5(BD) 0.4530 N/A 0.5627
Table 3: NDCG@5 for various feature sets.
As to RESOLVE, recall that there are two con-
figurations for testing the effectiveness of self-
containing patterns: RESOLVE including self-
containing patterns (RESOLVE-Pall), and
RESOLVE excluding self-containing patterns
(RESOLVE-P-scPattern). Six different emotion cate-
gories are analyzed individually to reveal their dif-
ferent characteristics (De Choudhury et al., 2012).
Table 4 shows the NDCG@5 averaged by the
number of writings in six emotion categories for
PMI (NAVA), SVM (NAVA), and RESOLVE-Pall
and RESOLVE-P-scPattern. A further analysis of the
writings shows that when expressing disgust or
sadness, extensive uses of emotion words are
found. Therefore, RESOLVE-Pall yields better per-
formance. The remaining four emotions are ex-
pressed through descriptions of events rather than
using emotion words. These results conform to the
conclusion from (De Choudhury, Counts and
Gamon, 2012): negative moods tend to be de-
scribed in limited context. Based on the finding in
Table 4, RESOLVE-Pall is used for emotion writ-
ings about disgust and sadness, and
RESOLVE-P-scPattern is used for writings about an-
ger, fear, joy and surprise when building the final
conditional RESOLVE system.
151

Emotion PMI
(NAVA)
SVM
(NAVA)
RESOLVE
-Pall
RESOLVE
-P-scPattern
Anger 0.3295 0.4706 0.4886 0.5071
Disgust 0.3103 0.3738 0.3773 0.2584
Fear 0.4064 0.5381 0.5168 0.6152
Joy 0.4849 0.5764 0.4456 0.5708
Sadness 0.2863 0.3495 0.3999 0.3194
Surprise 0.7346 0.7651 0.8037 0.8400 Table 4 NDCG@5 for six emotion categories.
5.3 Comparison to Tools for ESL Learners
In the final part of the system evaluation, we show
the effectiveness of RESOLVE by evaluating the
performance of the most commonly-used tools by
ESL learners. One traditional and handy tool is the
thesaurus. For this evaluation we selected Roget’s
Thesaurus5. Another tool is online language learn-
ing systems, of which PIGAI is the most well-
known online rating system for writing for Chinese
ESL learners. This system can also suggest to
learners several easily-confused words as substi-
tutes for several system-selected words. For evalu-
ation, we posted the experimental writing to PIGAI
to check whether there were any suggested substi-
tutes for the target emotion word. Replacement
suggestions were found for the target emotion
word in 71 out of 240 writings. Therefore, we
compared the performance of PIGAI and
RESOLVE on these 71 writings. Note that what
the thesaurus and PIGAI suggested are both appro-
priate word sets, where words are listed in alpha-
betic order. Learners must select by themselves (or
most conveniently, simply select the first one). Ta-
ble 5 shows that RESOLVE provides a better set of
top-5 suggestions than both the thesaurus and
PIGAI.
Tool NDCG@5
NDCG@5
(BD)
Precision@5
(BD)
PIGAI
(71/240) 0.3300 0.3095 0.8732
RESOLVE
(71/240) 0.4755 0.4728 0.9789
Thesaurus 0.3708 0.4237 0.9146
RESOLVE 0.5529 0.5627 0.9479 Table 5: Performance using ESL learner tools.
5 http://Thesaurus.com
6 Conclusion
We presented a probabilistic model that can sug-
gest emotion word based on the context. The mod-
ified EES that considered the distribution of
emotion word help our algorithm rank the candi-
date emotion words better. Besides, the matching
algorithm, EDW, can find the most similar emo-
tional event from the writings. Furthermore, the
example sentences can be used as our training cor-
pus without any handcraft annotations. The evalua-
tion shows that the proposed approach can more
appropriately suggest emotion words than other
models and reference tools like PIGAI and Thesau-
rus.
Acknowledgements Research of this paper was partially supported by
National Science Council, Taiwan, under the con-
tract MOST 101-2628-E-001-005-MY3.
References Agrawal, A., and An, A. 2012. Unsupervised Emotion
Detection from Text using Semantic and Syntactic
Relations. In Web Intelligence and Intelligent Agent
Technology (WI-IAT), 2012 IEEE/WIC/ACM Interna-
tional Conferences on (Vol. 1, pp. 346-353). IEEE.
Altarriba, J., and Basnight-Brown, D. M. 2012. The
acquisition of concrete, abstract, and emotion words
in a second language. International Journal of Bilin-
gualism, 16(4), 446-452.
Bannard, C., and Callison-Burch, C. 2005. Paraphrasing
with bilingual parallel corpora. In Proceedings of the
43rd Annual Meeting on Association for Computa-
tional Linguistics (pp. 597-604). Association for
Computational Linguistics.
Barreiro, A. 2011. SPIDER: A System for Paraphrasing
in Document Editing and Revision—Applicability in
Machine Translation Pre-editing. In Computational
Linguistics and Intelligent Text Processing (pp. 365-
376). Springer Berlin Heidelberg.
Barzilay, R., and Lee, L. 2003. Learning to paraphrase:
an unsupervised approach using multiple-sequence
alignment. In Proceedings of the 2003 Conference of
the North American Chapter of the Association for
Computational Linguistics on Human Language
Technology-Volume 1 (pp. 16-23). Association for
Computational Linguistics.
Barzilay, R., and McKeown, K. R. 2001. Extracting
paraphrases from a parallel corpus. In Proceedings of
the 39th Annual Meeting on Association for Compu-
tational Linguistics (pp. 50-57). Association for
Computational Linguistics.
152
Bullinaria, J. A., and Levy, J. P. 2007. Extracting se-
mantic representations from word co-occurrence sta-
tistics: A computational study. Behavior research
methods, 39(3), 510-526.
Callison-Burch, C. 2008. Syntactic constraints on para-
phrases extracted from parallel corpora.
In Proceedings of the Conference on Empirical
Methods in Natural Language Processing (pp. 196-
205). Association for Computational Linguistics.
Chang, C. C., and Lin, C. J. 2011. LIBSVM: a library
for support vector machines. ACM Transactions on
Intelligent Systems and Technology (TIST), 2 (3), 27.
Chen, M. H., Huang, S. T., Chang, J. S., and Liou, H. C.
2013. Developing a corpus-based paraphrase tool to
improve EFL learners' writing skills. Computer As-
sisted Language Learning, (ahead-of-print), 1-19.
Chen, M. H., Huang, S. T., Huang, C. C., Liou, H. C.,
and Chang, J. S. 2012. PREFER: using a graph-based
approach to generate paraphrases for language learn-
ing. In Proceedings of the Seventh Workshop on
Building Educational Applications Using NLP (pp.
80-85). Association for Computational Linguistics.
Church, K. W., and Hanks, P. 1990. Word association
norms, mutual information, and lexicogra-
phy. Computational linguistics, 16(1),
Dahl, G., Frassica, A. M., and Wicentowski, R. (2007,
June). SW-AG: Local context matching for English
lexical substitution. In Proceedings of the 4th Inter-
national Workshop on Semantic Evaluations (pp.
304-307). Association for Computational Linguistics.
22-29.
De Choudhury, M., Counts, S., and Gamon, M. 2012.
Not all moods are created equal! exploring human
emotional states in social media. In Sixth Interna-
tional AAAI Conference on Weblogs and Social Me-
dia.
De Marneffe, M. C., MacCartney, B., and Manning, C.
D. 2006. Generating typed dependency parses from
phrase structure parses. In Proceedings of LREC (Vol.
6, pp. 449-454).
Dinu, G., and Lapata, M. 2010. Topic models for mean-
ing similarity in context. In Proceedings of the 23rd
International Conference on Computational Linguis-
tics: Posters (pp. 250-258). Association for Compu-
tational Linguistics.
Ekman, P. 1993. Facial expression and emo-
tion. American Psychologist, 48 (4), 384.
Fellbaum, C. 1999. WordNet. Blackwell Publishing Ltd.
Ghazi, D., Inkpen, D., and Szpakowicz, S. 2012. Prior
versus Contextual Emotion of a Word in a Sentence.
In Proceedings of the 3rd Workshop in Computation-
al Approaches to Subjectivity and Sentiment Analy-
sis (pp. 70-78). Association for Computational
Linguistic
Jeong, Y., and Myaeng, S. H. 2012. Using Syntactic
Dependencies and WordNet Classes for Noun Event
Recognition. In The 2nd Workhop on Detection, Rep-
resentation, and Exploitation of Events in the Seman-
tic Web in Conjunction with the 11th International
Semantic Web Conference (pp. 41-50).
Keshtkar, F., and Inkpen, D. 2010. A corpus-based
method for extracting paraphrases of emotion terms.
In Proceedings of the NAACL HLT 2010 Workshop
on Computational approaches to Analysis and Gen-
eration of emotion in Text (pp. 35-44). Association
for Computational Linguistics.
Klein, D., and Manning, C. D. 2003. Accurate unlexi-
calized parsing. In Proceedings of the 41st Annual
Meeting on Association for Computational Linguis-
tics-Volume 1 (pp. 423-430). Association for Compu-
tational Linguistics.
Leading, L. L., Monaghan, W., and Bridgeman, B. 2005.
E-rater as a Quality Control on Human Scores.
Lin, D. 1998. An information-theoretic definition of
similarity. In ICML (Vol. 98, pp. 296-304).
Lin, D., and Pantel, P. 2001. DIRT—discovery of infer-
ence rules from text. In Proceedings of the seventh
ACM SIGKDD international conference on
Knowledge discovery and data mining (pp. 323-328).
ACM.
Ma, K. (2013). Improving EFL Graduate Students' Pro-
ficiency in Writing through an Online Automated Es-
say Assessing System. English Language
Teaching, 6(7).
Pavlenko, A. 2008. Emotion and emotion-laden words
in the bilingual lexicon. BILINGUALISM
LANGUAGE AND COGNITION, 11(2), 147.
Sim, J., and Wright, C. C. 2005. The kappa statistic in
reliability studies: use, interpretation, and sample size
requirements. Physical therapy, 85(3), 257-268.
Strapparava, C., and Valitutti, A. 2004. WordNet Affect:
an Affective Extension of WordNet. In LREC (Vol. 4,
pp. 1083-1086).
Tokuhisa, R., Inui, K., and Matsumoto, Y. 2008. Emo-
tion classification using massive examples extracted
from the web. In Proceedings of the 22nd Interna-
tional Conference on Computational Linguistics-
Volume 1 (pp. 881-888). Association for Computa-
tional Linguistics.
Zhao, S., Zhao, L., Zhang, Y., Liu, T., and Li, S. (2007,
June). Hit: Web based scoring method for english
lexical substitution. In Proceedings of the 4th Inter-
national Workshop on Semantic Evaluations (pp.
173-176). Association for Computational Linguistics.
153
Proceedings of the Tenth Workshop on Innovative Use of NLP for Building Educational Applications, 2015, pages 154–161,Denver, Colorado, June 4, 2015. c©2015 Association for Computational Linguistics
RevUP: Automatic Gap-Fill Question Generation from Educational Texts
Girish KumarNUS High School of Math and Science
Singapore [email protected]
Rafael E. Banchs, Luis F. D’HaroInstitute for Infocomm Research
Singapore 138632{rembanchs,luisdhe}@i2r.a-star.edu.sg
Abstract
This paper describes RevUP which deals withautomatically generating gap-fill questions.RevUP consists of 3 parts: Sentence Se-lection, Gap Selection & Multiple ChoiceDistractor Selection. To select topically-important sentences from texts, we proposea novel sentence ranking method based ontopic distributions obtained from topic mod-els. To select gap-phrases from each selectedsentence, we collected human annotations, us-ing the Amazon Mechanical Turk, on the rel-ative relevance of candidate gaps. This data isused to train a discriminative classifier to pre-dict the relevance of gaps, achieving an accu-racy of 81.0%. Finally, we propose a novelmethod to choose distractors that are semanti-cally similar to the gap-phrase and have con-textual fit to the gap-fill question. By crowd-sourcing the evaluation of our method throughthe Amazon Mechanical Turk, we found that94% of the distractors selected were good. Re-vUP fills the semantic gap left open by pre-vious work in this area, and represents a sig-nificant step towards automatically generatingquality tests for teachers and self-motivatedlearners.
1 Introduction
In today’s educational systems, a student needs torecall and apply major concepts from study materialto perform competently in assessments. Crucialto this is practice and self-assessment throughquestions. King [1992] found that questioningis an effective method of helping students learnbetter. However, the continued crafting of varied
questions is extremely time consuming for teachersas mentioned in Mitkov et al. [2006]. Further-more, learners are increasingly moving from thetraditional classroom setting to an independentlearning setting online. Here, there is a need forleveraging upon online educational texts to providepractice material for students. Automatic QuestionGeneration (AQG) shows promise for both theseuse-cases.
1.1 Related Work
Work in Automatic Question Generation(AQG)has mostly involved transforming sentences intoquestions and can be divided into two categories:Wh-Question Generation (WQG) and Gap-FillQuestion Generation (GFQG). Most work in WQGhas involved transforming sentences into gram-matically correct Wh-questions (Why, What, How,etc.) with little attention given to the semantics andeducational relevance of the questions (Heilmanand Smith [2009], Mitkov et al. [2006], Mostowand Chen [2009], Wolfe et al. [1975], Wyse andPiwek [2009]). On the other hand, previous worksin GFQG have generally worked with vocabulary-testing and language learning (Smith et al. [2010],Sumita et al. [2005]). Smith et al. presented Ted-Clogg which took gap-phrases as input and foundmultiple choice distractors from a distributionalthesaurus. 53.3% of the questions generated wereacceptable. Our work aligns more closely to that ofAggarwal et al. where a weighted sum of lexical,syntactic features were utilised to select sentences,gaps and distractors from informative texts (Agar-
154
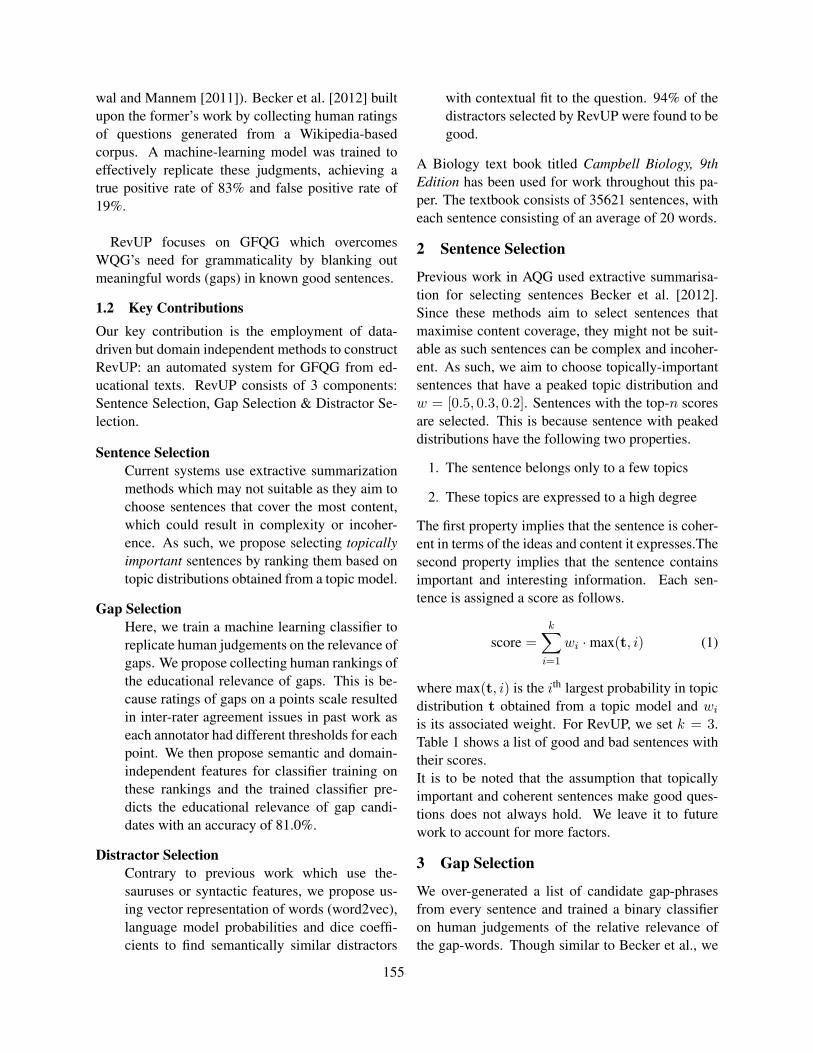
wal and Mannem [2011]). Becker et al. [2012] builtupon the former’s work by collecting human ratingsof questions generated from a Wikipedia-basedcorpus. A machine-learning model was trained toeffectively replicate these judgments, achieving atrue positive rate of 83% and false positive rate of19%.
RevUP focuses on GFQG which overcomesWQG’s need for grammaticality by blanking outmeaningful words (gaps) in known good sentences.
1.2 Key ContributionsOur key contribution is the employment of data-driven but domain independent methods to constructRevUP: an automated system for GFQG from ed-ucational texts. RevUP consists of 3 components:Sentence Selection, Gap Selection & Distractor Se-lection.
Sentence SelectionCurrent systems use extractive summarizationmethods which may not suitable as they aim tochoose sentences that cover the most content,which could result in complexity or incoher-ence. As such, we propose selecting topicallyimportant sentences by ranking them based ontopic distributions obtained from a topic model.
Gap SelectionHere, we train a machine learning classifier toreplicate human judgements on the relevance ofgaps. We propose collecting human rankings ofthe educational relevance of gaps. This is be-cause ratings of gaps on a points scale resultedin inter-rater agreement issues in past work aseach annotator had different thresholds for eachpoint. We then propose semantic and domain-independent features for classifier training onthese rankings and the trained classifier pre-dicts the educational relevance of gap candi-dates with an accuracy of 81.0%.
Distractor SelectionContrary to previous work which use the-sauruses or syntactic features, we propose us-ing vector representation of words (word2vec),language model probabilities and dice coeffi-cients to find semantically similar distractors
with contextual fit to the question. 94% of thedistractors selected by RevUP were found to begood.
A Biology text book titled Campbell Biology, 9thEdition has been used for work throughout this pa-per. The textbook consists of 35621 sentences, witheach sentence consisting of an average of 20 words.
2 Sentence Selection
Previous work in AQG used extractive summarisa-tion for selecting sentences Becker et al. [2012].Since these methods aim to select sentences thatmaximise content coverage, they might not be suit-able as such sentences can be complex and incoher-ent. As such, we aim to choose topically-importantsentences that have a peaked topic distribution andw = [0.5, 0.3, 0.2]. Sentences with the top-n scoresare selected. This is because sentence with peakeddistributions have the following two properties.
1. The sentence belongs only to a few topics
2. These topics are expressed to a high degree
The first property implies that the sentence is coher-ent in terms of the ideas and content it expresses.Thesecond property implies that the sentence containsimportant and interesting information. Each sen-tence is assigned a score as follows.
score =k∑
i=1
wi ·max(t, i) (1)
where max(t, i) is the ith largest probability in topicdistribution t obtained from a topic model and wi
is its associated weight. For RevUP, we set k = 3.Table 1 shows a list of good and bad sentences withtheir scores.It is to be noted that the assumption that topicallyimportant and coherent sentences make good ques-tions does not always hold. We leave it to futurework to account for more factors.
3 Gap Selection
We over-generated a list of candidate gap-phrasesfrom every sentence and trained a binary classifieron human judgements of the relative relevance ofthe gap-words. Though similar to Becker et al., we
155
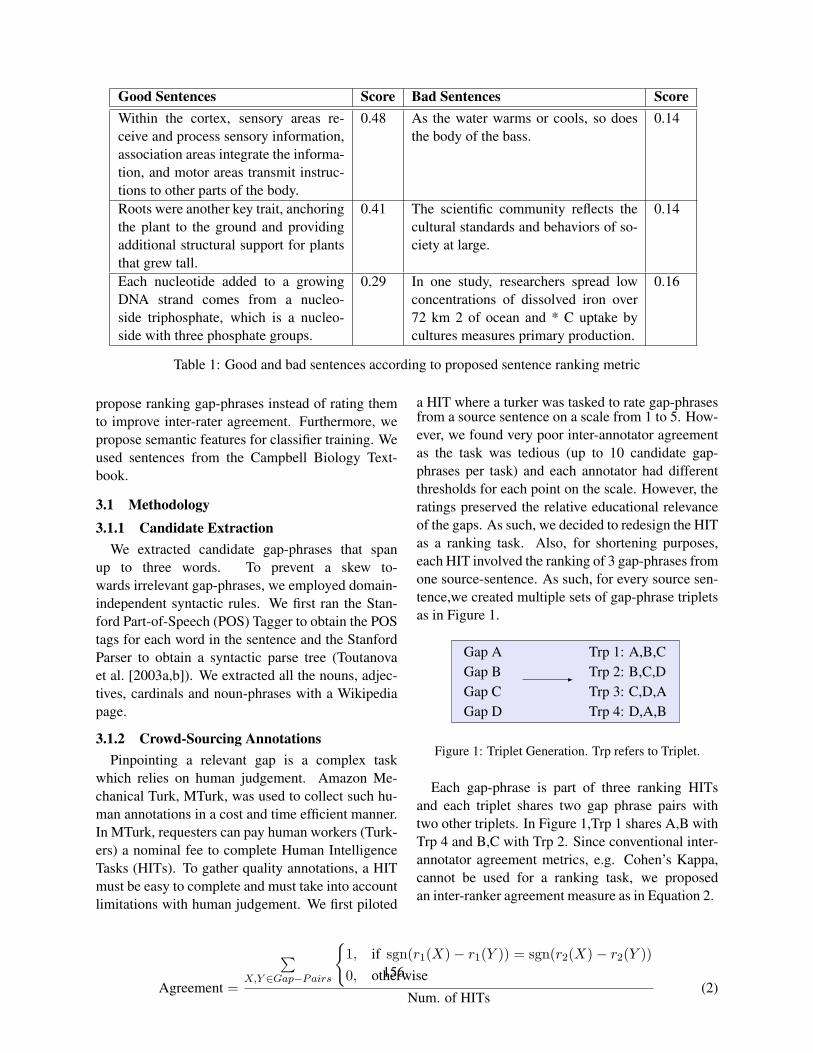
Good Sentences Score Bad Sentences ScoreWithin the cortex, sensory areas re-ceive and process sensory information,association areas integrate the informa-tion, and motor areas transmit instruc-tions to other parts of the body.
0.48 As the water warms or cools, so doesthe body of the bass.
0.14
Roots were another key trait, anchoringthe plant to the ground and providingadditional structural support for plantsthat grew tall.
0.41 The scientific community reflects thecultural standards and behaviors of so-ciety at large.
0.14
Each nucleotide added to a growingDNA strand comes from a nucleo-side triphosphate, which is a nucleo-side with three phosphate groups.
0.29 In one study, researchers spread lowconcentrations of dissolved iron over72 km 2 of ocean and * C uptake bycultures measures primary production.
0.16
Table 1: Good and bad sentences according to proposed sentence ranking metric
propose ranking gap-phrases instead of rating themto improve inter-rater agreement. Furthermore, wepropose semantic features for classifier training. Weused sentences from the Campbell Biology Text-book.
3.1 Methodology3.1.1 Candidate Extraction
We extracted candidate gap-phrases that spanup to three words. To prevent a skew to-wards irrelevant gap-phrases, we employed domain-independent syntactic rules. We first ran the Stan-ford Part-of-Speech (POS) Tagger to obtain the POStags for each word in the sentence and the StanfordParser to obtain a syntactic parse tree (Toutanovaet al. [2003a,b]). We extracted all the nouns, adjec-tives, cardinals and noun-phrases with a Wikipediapage.
3.1.2 Crowd-Sourcing AnnotationsPinpointing a relevant gap is a complex task
which relies on human judgement. Amazon Me-chanical Turk, MTurk, was used to collect such hu-man annotations in a cost and time efficient manner.In MTurk, requesters can pay human workers (Turk-ers) a nominal fee to complete Human IntelligenceTasks (HITs). To gather quality annotations, a HITmust be easy to complete and must take into accountlimitations with human judgement. We first piloted
a HIT where a turker was tasked to rate gap-phrasesfrom a source sentence on a scale from 1 to 5. How-ever, we found very poor inter-annotator agreementas the task was tedious (up to 10 candidate gap-phrases per task) and each annotator had differentthresholds for each point on the scale. However, theratings preserved the relative educational relevanceof the gaps. As such, we decided to redesign the HITas a ranking task. Also, for shortening purposes,each HIT involved the ranking of 3 gap-phrases fromone source-sentence. As such, for every source sen-tence,we created multiple sets of gap-phrase tripletsas in Figure 1.
Gap AGap BGap CGap D
Trp 1: A,B,CTrp 2: B,C,DTrp 3: C,D,ATrp 4: D,A,B
Figure 1: Triplet Generation. Trp refers to Triplet.
Each gap-phrase is part of three ranking HITsand each triplet shares two gap phrase pairs withtwo other triplets. In Figure 1,Trp 1 shares A,B withTrp 4 and B,C with Trp 2. Since conventional inter-annotator agreement metrics, e.g. Cohen’s Kappa,cannot be used for a ranking task, we proposedan inter-ranker agreement measure as in Equation 2.
Agreement =
∑X,Y ∈Gap−Pairs
{1, if sgn(r1(X)− r1(Y )) = sgn(r2(X)− r2(Y ))0, otherwise
Num. of HITs(2)
156
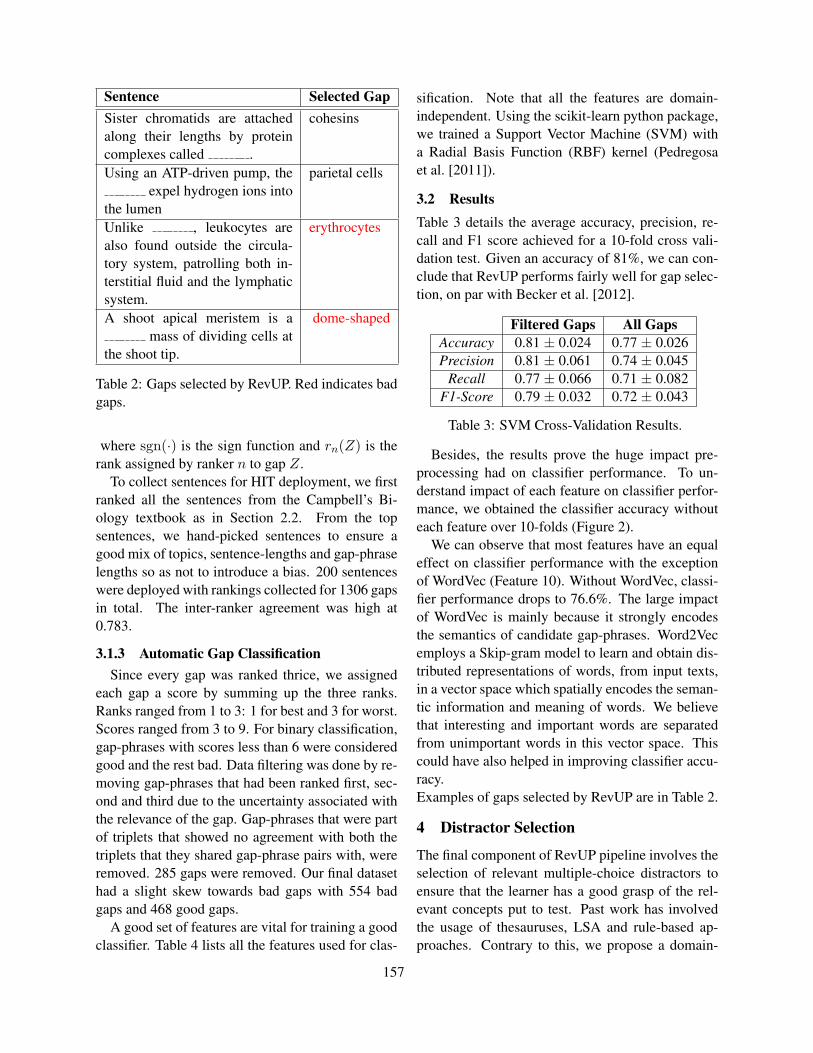
Sentence Selected GapSister chromatids are attachedalong their lengths by proteincomplexes called .
cohesins
Using an ATP-driven pump, theexpel hydrogen ions into
the lumen
parietal cells
Unlike , leukocytes arealso found outside the circula-tory system, patrolling both in-terstitial fluid and the lymphaticsystem.
erythrocytes
A shoot apical meristem is amass of dividing cells at
the shoot tip.
dome-shaped
Table 2: Gaps selected by RevUP. Red indicates badgaps.
where sgn(·) is the sign function and rn(Z) is therank assigned by ranker n to gap Z.
To collect sentences for HIT deployment, we firstranked all the sentences from the Campbell’s Bi-ology textbook as in Section 2.2. From the topsentences, we hand-picked sentences to ensure agood mix of topics, sentence-lengths and gap-phraselengths so as not to introduce a bias. 200 sentenceswere deployed with rankings collected for 1306 gapsin total. The inter-ranker agreement was high at0.783.
3.1.3 Automatic Gap ClassificationSince every gap was ranked thrice, we assigned
each gap a score by summing up the three ranks.Ranks ranged from 1 to 3: 1 for best and 3 for worst.Scores ranged from 3 to 9. For binary classification,gap-phrases with scores less than 6 were consideredgood and the rest bad. Data filtering was done by re-moving gap-phrases that had been ranked first, sec-ond and third due to the uncertainty associated withthe relevance of the gap. Gap-phrases that were partof triplets that showed no agreement with both thetriplets that they shared gap-phrase pairs with, wereremoved. 285 gaps were removed. Our final datasethad a slight skew towards bad gaps with 554 badgaps and 468 good gaps.
A good set of features are vital for training a goodclassifier. Table 4 lists all the features used for clas-
sification. Note that all the features are domain-independent. Using the scikit-learn python package,we trained a Support Vector Machine (SVM) witha Radial Basis Function (RBF) kernel (Pedregosaet al. [2011]).
3.2 ResultsTable 3 details the average accuracy, precision, re-call and F1 score achieved for a 10-fold cross vali-dation test. Given an accuracy of 81%, we can con-clude that RevUP performs fairly well for gap selec-tion, on par with Becker et al. [2012].
Filtered Gaps All GapsAccuracy 0.81 ± 0.024 0.77 ± 0.026Precision 0.81 ± 0.061 0.74 ± 0.045
Recall 0.77 ± 0.066 0.71 ± 0.082F1-Score 0.79 ± 0.032 0.72 ± 0.043
Table 3: SVM Cross-Validation Results.
Besides, the results prove the huge impact pre-processing had on classifier performance. To un-derstand impact of each feature on classifier perfor-mance, we obtained the classifier accuracy withouteach feature over 10-folds (Figure 2).
We can observe that most features have an equaleffect on classifier performance with the exceptionof WordVec (Feature 10). Without WordVec, classi-fier performance drops to 76.6%. The large impactof WordVec is mainly because it strongly encodesthe semantics of candidate gap-phrases. Word2Vecemploys a Skip-gram model to learn and obtain dis-tributed representations of words, from input texts,in a vector space which spatially encodes the seman-tic information and meaning of words. We believethat interesting and important words are separatedfrom unimportant words in this vector space. Thiscould have also helped in improving classifier accu-racy.Examples of gaps selected by RevUP are in Table 2.
4 Distractor Selection
The final component of RevUP pipeline involves theselection of relevant multiple-choice distractors toensure that the learner has a good grasp of the rel-evant concepts put to test. Past work has involvedthe usage of thesauruses, LSA and rule-based ap-proaches. Contrary to this, we propose a domain-
157
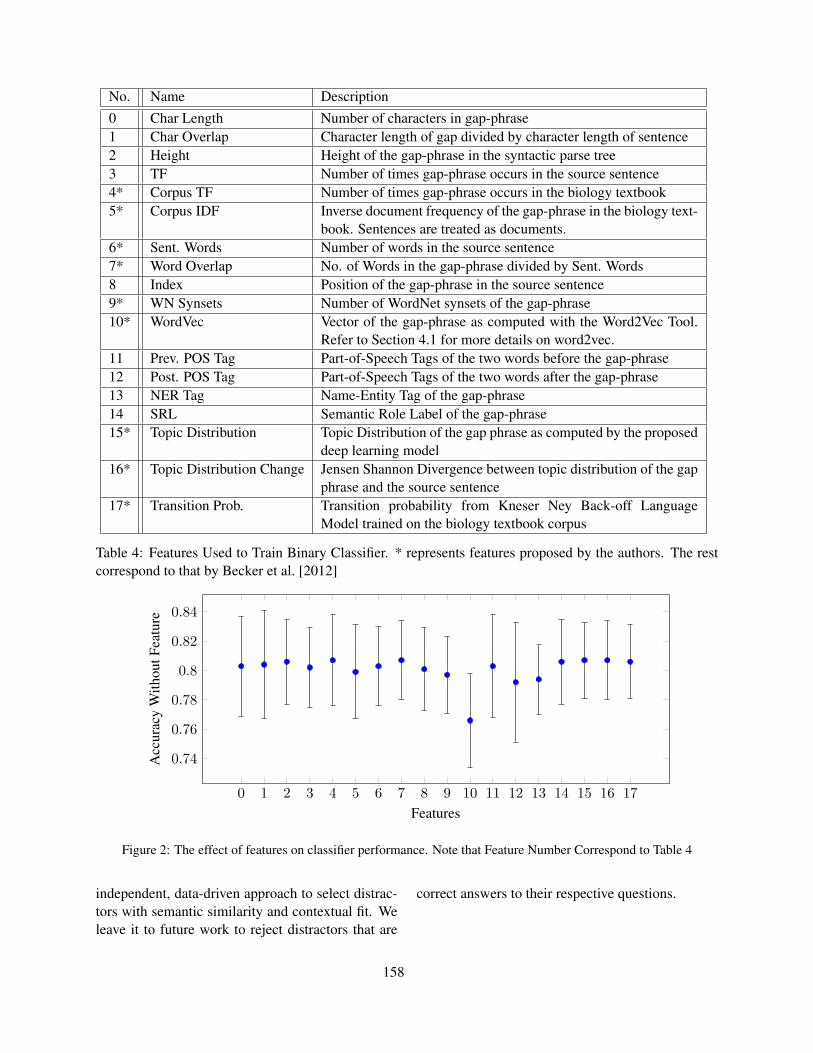
No. Name Description0 Char Length Number of characters in gap-phrase1 Char Overlap Character length of gap divided by character length of sentence2 Height Height of the gap-phrase in the syntactic parse tree3 TF Number of times gap-phrase occurs in the source sentence4* Corpus TF Number of times gap-phrase occurs in the biology textbook5* Corpus IDF Inverse document frequency of the gap-phrase in the biology text-
book. Sentences are treated as documents.6* Sent. Words Number of words in the source sentence7* Word Overlap No. of Words in the gap-phrase divided by Sent. Words8 Index Position of the gap-phrase in the source sentence9* WN Synsets Number of WordNet synsets of the gap-phrase10* WordVec Vector of the gap-phrase as computed with the Word2Vec Tool.
Refer to Section 4.1 for more details on word2vec.11 Prev. POS Tag Part-of-Speech Tags of the two words before the gap-phrase12 Post. POS Tag Part-of-Speech Tags of the two words after the gap-phrase13 NER Tag Name-Entity Tag of the gap-phrase14 SRL Semantic Role Label of the gap-phrase15* Topic Distribution Topic Distribution of the gap phrase as computed by the proposed
deep learning model16* Topic Distribution Change Jensen Shannon Divergence between topic distribution of the gap
phrase and the source sentence17* Transition Prob. Transition probability from Kneser Ney Back-off Language
Model trained on the biology textbook corpus
Table 4: Features Used to Train Binary Classifier. * represents features proposed by the authors. The restcorrespond to that by Becker et al. [2012]
0 1 2 3 4 5 6 7 8 9 10 11 12 13 14 15 16 17
0.74
0.76
0.78
0.8
0.82
0.84
Features
Acc
urac
yW
ithou
tFea
ture
Figure 2: The effect of features on classifier performance. Note that Feature Number Correspond to Table 4
independent, data-driven approach to select distrac-tors with semantic similarity and contextual fit. Weleave it to future work to reject distractors that are
correct answers to their respective questions.
158
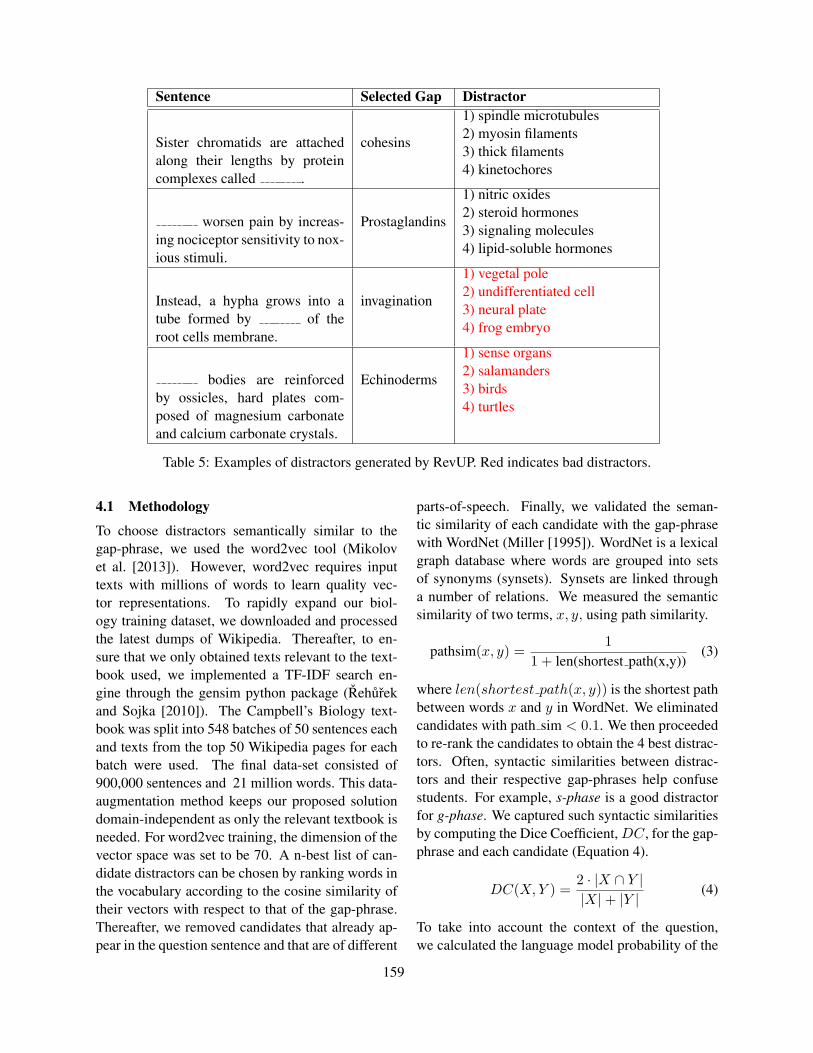
Sentence Selected Gap Distractor
Sister chromatids are attachedalong their lengths by proteincomplexes called .
cohesins
1) spindle microtubules2) myosin filaments3) thick filaments4) kinetochores
worsen pain by increas-ing nociceptor sensitivity to nox-ious stimuli.
Prostaglandins
1) nitric oxides2) steroid hormones3) signaling molecules4) lipid-soluble hormones
Instead, a hypha grows into atube formed by of theroot cells membrane.
invagination
1) vegetal pole2) undifferentiated cell3) neural plate4) frog embryo
bodies are reinforcedby ossicles, hard plates com-posed of magnesium carbonateand calcium carbonate crystals.
Echinoderms
1) sense organs2) salamanders3) birds4) turtles
Table 5: Examples of distractors generated by RevUP. Red indicates bad distractors.
4.1 Methodology
To choose distractors semantically similar to thegap-phrase, we used the word2vec tool (Mikolovet al. [2013]). However, word2vec requires inputtexts with millions of words to learn quality vec-tor representations. To rapidly expand our biol-ogy training dataset, we downloaded and processedthe latest dumps of Wikipedia. Thereafter, to en-sure that we only obtained texts relevant to the text-book used, we implemented a TF-IDF search en-gine through the gensim python package (Rehurekand Sojka [2010]). The Campbell’s Biology text-book was split into 548 batches of 50 sentences eachand texts from the top 50 Wikipedia pages for eachbatch were used. The final data-set consisted of900,000 sentences and 21 million words. This data-augmentation method keeps our proposed solutiondomain-independent as only the relevant textbook isneeded. For word2vec training, the dimension of thevector space was set to be 70. A n-best list of can-didate distractors can be chosen by ranking words inthe vocabulary according to the cosine similarity oftheir vectors with respect to that of the gap-phrase.Thereafter, we removed candidates that already ap-pear in the question sentence and that are of different
parts-of-speech. Finally, we validated the seman-tic similarity of each candidate with the gap-phrasewith WordNet (Miller [1995]). WordNet is a lexicalgraph database where words are grouped into setsof synonyms (synsets). Synsets are linked througha number of relations. We measured the semanticsimilarity of two terms, x, y, using path similarity.
pathsim(x, y) =1
1 + len(shortest path(x,y))(3)
where len(shortest path(x, y)) is the shortest pathbetween words x and y in WordNet. We eliminatedcandidates with path sim < 0.1. We then proceededto re-rank the candidates to obtain the 4 best distrac-tors. Often, syntactic similarities between distrac-tors and their respective gap-phrases help confusestudents. For example, s-phase is a good distractorfor g-phase. We captured such syntactic similaritiesby computing the Dice Coefficient, DC, for the gap-phrase and each candidate (Equation 4).
DC(X,Y ) =2 · |X ∩ Y ||X|+ |Y | (4)
To take into account the context of the question,we calculated the language model probability of the
159
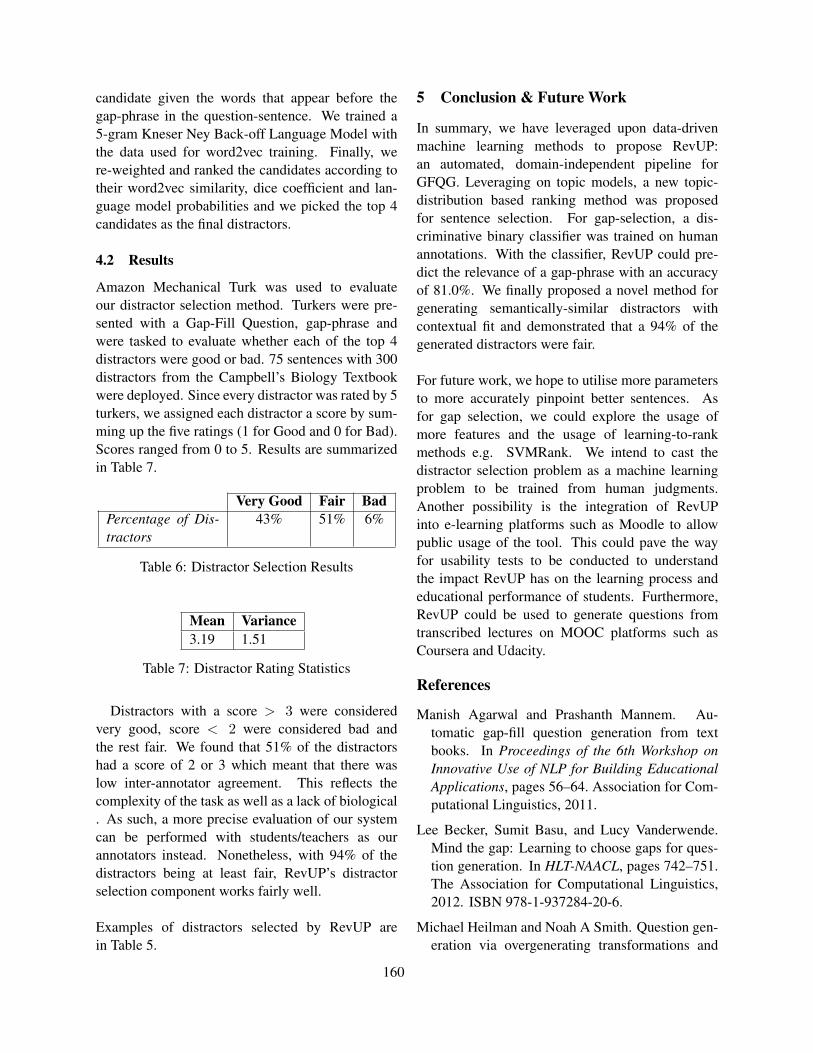
candidate given the words that appear before thegap-phrase in the question-sentence. We trained a5-gram Kneser Ney Back-off Language Model withthe data used for word2vec training. Finally, were-weighted and ranked the candidates according totheir word2vec similarity, dice coefficient and lan-guage model probabilities and we picked the top 4candidates as the final distractors.
4.2 Results
Amazon Mechanical Turk was used to evaluateour distractor selection method. Turkers were pre-sented with a Gap-Fill Question, gap-phrase andwere tasked to evaluate whether each of the top 4distractors were good or bad. 75 sentences with 300distractors from the Campbell’s Biology Textbookwere deployed. Since every distractor was rated by 5turkers, we assigned each distractor a score by sum-ming up the five ratings (1 for Good and 0 for Bad).Scores ranged from 0 to 5. Results are summarizedin Table 7.
Very Good Fair BadPercentage of Dis-tractors
43% 51% 6%
Table 6: Distractor Selection Results
Mean Variance3.19 1.51
Table 7: Distractor Rating Statistics
Distractors with a score > 3 were consideredvery good, score < 2 were considered bad andthe rest fair. We found that 51% of the distractorshad a score of 2 or 3 which meant that there waslow inter-annotator agreement. This reflects thecomplexity of the task as well as a lack of biological. As such, a more precise evaluation of our systemcan be performed with students/teachers as ourannotators instead. Nonetheless, with 94% of thedistractors being at least fair, RevUP’s distractorselection component works fairly well.
Examples of distractors selected by RevUP arein Table 5.
5 Conclusion & Future Work
In summary, we have leveraged upon data-drivenmachine learning methods to propose RevUP:an automated, domain-independent pipeline forGFQG. Leveraging on topic models, a new topic-distribution based ranking method was proposedfor sentence selection. For gap-selection, a dis-criminative binary classifier was trained on humanannotations. With the classifier, RevUP could pre-dict the relevance of a gap-phrase with an accuracyof 81.0%. We finally proposed a novel method forgenerating semantically-similar distractors withcontextual fit and demonstrated that a 94% of thegenerated distractors were fair.
For future work, we hope to utilise more parametersto more accurately pinpoint better sentences. Asfor gap selection, we could explore the usage ofmore features and the usage of learning-to-rankmethods e.g. SVMRank. We intend to cast thedistractor selection problem as a machine learningproblem to be trained from human judgments.Another possibility is the integration of RevUPinto e-learning platforms such as Moodle to allowpublic usage of the tool. This could pave the wayfor usability tests to be conducted to understandthe impact RevUP has on the learning process andeducational performance of students. Furthermore,RevUP could be used to generate questions fromtranscribed lectures on MOOC platforms such asCoursera and Udacity.
References
Manish Agarwal and Prashanth Mannem. Au-tomatic gap-fill question generation from textbooks. In Proceedings of the 6th Workshop onInnovative Use of NLP for Building EducationalApplications, pages 56–64. Association for Com-putational Linguistics, 2011.
Lee Becker, Sumit Basu, and Lucy Vanderwende.Mind the gap: Learning to choose gaps for ques-tion generation. In HLT-NAACL, pages 742–751.The Association for Computational Linguistics,2012. ISBN 978-1-937284-20-6.
Michael Heilman and Noah A Smith. Question gen-eration via overgenerating transformations and
160
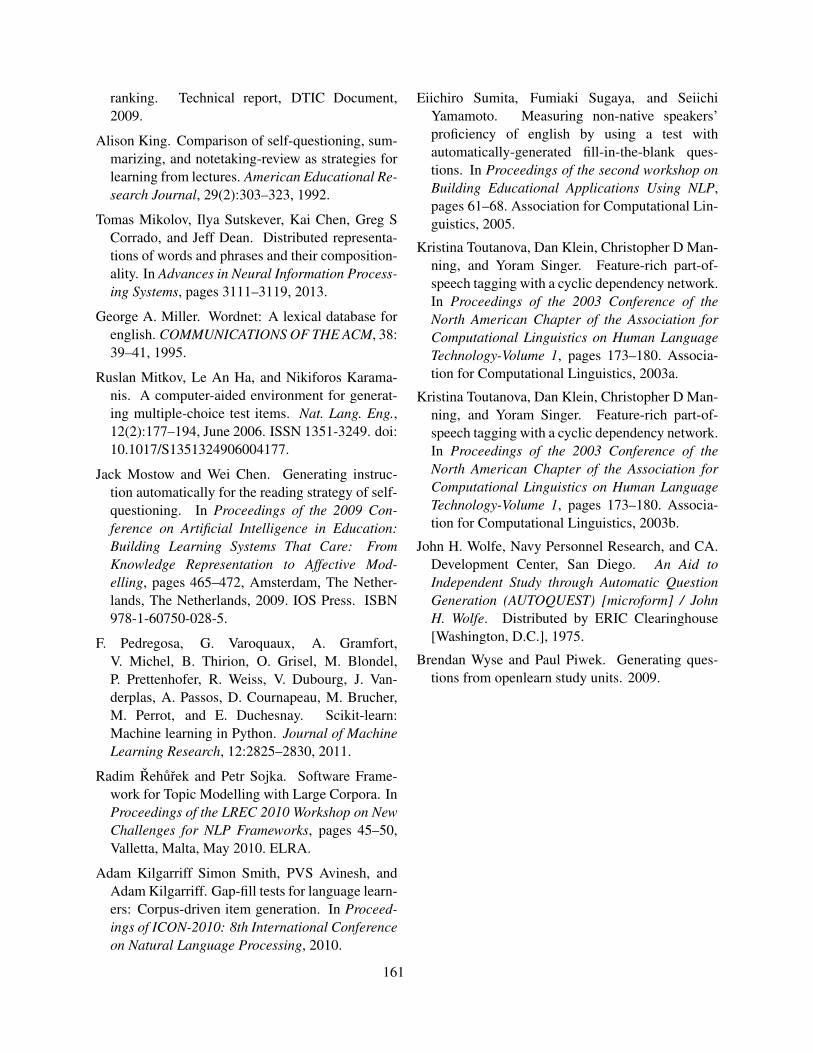
ranking. Technical report, DTIC Document,2009.
Alison King. Comparison of self-questioning, sum-marizing, and notetaking-review as strategies forlearning from lectures. American Educational Re-search Journal, 29(2):303–323, 1992.
Tomas Mikolov, Ilya Sutskever, Kai Chen, Greg SCorrado, and Jeff Dean. Distributed representa-tions of words and phrases and their composition-ality. In Advances in Neural Information Process-ing Systems, pages 3111–3119, 2013.
George A. Miller. Wordnet: A lexical database forenglish. COMMUNICATIONS OF THE ACM, 38:39–41, 1995.
Ruslan Mitkov, Le An Ha, and Nikiforos Karama-nis. A computer-aided environment for generat-ing multiple-choice test items. Nat. Lang. Eng.,12(2):177–194, June 2006. ISSN 1351-3249. doi:10.1017/S1351324906004177.
Jack Mostow and Wei Chen. Generating instruc-tion automatically for the reading strategy of self-questioning. In Proceedings of the 2009 Con-ference on Artificial Intelligence in Education:Building Learning Systems That Care: FromKnowledge Representation to Affective Mod-elling, pages 465–472, Amsterdam, The Nether-lands, The Netherlands, 2009. IOS Press. ISBN978-1-60750-028-5.
F. Pedregosa, G. Varoquaux, A. Gramfort,V. Michel, B. Thirion, O. Grisel, M. Blondel,P. Prettenhofer, R. Weiss, V. Dubourg, J. Van-derplas, A. Passos, D. Cournapeau, M. Brucher,M. Perrot, and E. Duchesnay. Scikit-learn:Machine learning in Python. Journal of MachineLearning Research, 12:2825–2830, 2011.
Radim Rehurek and Petr Sojka. Software Frame-work for Topic Modelling with Large Corpora. InProceedings of the LREC 2010 Workshop on NewChallenges for NLP Frameworks, pages 45–50,Valletta, Malta, May 2010. ELRA.
Adam Kilgarriff Simon Smith, PVS Avinesh, andAdam Kilgarriff. Gap-fill tests for language learn-ers: Corpus-driven item generation. In Proceed-ings of ICON-2010: 8th International Conferenceon Natural Language Processing, 2010.
Eiichiro Sumita, Fumiaki Sugaya, and SeiichiYamamoto. Measuring non-native speakers’proficiency of english by using a test withautomatically-generated fill-in-the-blank ques-tions. In Proceedings of the second workshop onBuilding Educational Applications Using NLP,pages 61–68. Association for Computational Lin-guistics, 2005.
Kristina Toutanova, Dan Klein, Christopher D Man-ning, and Yoram Singer. Feature-rich part-of-speech tagging with a cyclic dependency network.In Proceedings of the 2003 Conference of theNorth American Chapter of the Association forComputational Linguistics on Human LanguageTechnology-Volume 1, pages 173–180. Associa-tion for Computational Linguistics, 2003a.
Kristina Toutanova, Dan Klein, Christopher D Man-ning, and Yoram Singer. Feature-rich part-of-speech tagging with a cyclic dependency network.In Proceedings of the 2003 Conference of theNorth American Chapter of the Association forComputational Linguistics on Human LanguageTechnology-Volume 1, pages 173–180. Associa-tion for Computational Linguistics, 2003b.
John H. Wolfe, Navy Personnel Research, and CA.Development Center, San Diego. An Aid toIndependent Study through Automatic QuestionGeneration (AUTOQUEST) [microform] / JohnH. Wolfe. Distributed by ERIC Clearinghouse[Washington, D.C.], 1975.
Brendan Wyse and Paul Piwek. Generating ques-tions from openlearn study units. 2009.
161
Proceedings of the Tenth Workshop on Innovative Use of NLP for Building Educational Applications, 2015, pages 162–171,Denver, Colorado, June 4, 2015. c©2015 Association for Computational Linguistics
Preliminary Experiments on CrowdsourcedEvaluation of Feedback Granularity
Nitin Madnani1, Martin Chodorow2, Aoife Cahill1, Melissa Lopez1, Yoko Futagi1 and Yigal Attali1
1Educational Testing Service, Princeton, NJ2Hunter College and the Graduate Center, City University of New York, NY
Abstract
Providing writing feedback to English lan-guage learners (ELLs) helps them learn towrite better, but it is not clear what type or howmuch information should be provided. Therehave been few experiments directly comparingthe effects of different types of automaticallygenerated feedback on ELL writing. Suchstudies are difficult to conduct because theyrequire participation and commitment fromactual students and their teachers, over ex-tended periods of time, and in real classroomsettings. In order to avoid such difficulties,we instead conduct a crowdsourced study onAmazon Mechanical Turk to answer questionsconcerning the effects of type and amount ofwriting feedback. We find that our experimenthas several serious limitations but still yieldssome interesting results.
1 Introduction
A core feature of learning to write is receiving feed-back and making revisions based on the informationprovided (Li and Hegelheimer, 2013; Biber et al.,2011; Lipnevich and Smith, 2008; Truscott, 2007;Rock, 2007). However, an important question to an-swer before building automated feedback systems iswhat type of feedback (and degree of interactivity)can best support learning and retention. Is it betterto restrict the system to providing feedback whichindicates that an error has been made but does notsuggest a possible correction? Or is it better for thelearner to receive feedback, which provides a clearindication of the error location as well as the correc-tion itself, or even an explanation of the underlying
grammatical rule? In this study, we refer to the firsttype of feedback as implicit feedback and to the sec-ond type as explicit feedback.
To the best of our knowledge, there is no em-pirical study that directly compares several differ-ent amounts of detail (granularities) in automaticallygenerated feedback in terms of their impact on learn-ing outcomes for language learners. This is not sur-prising since the ideal study would involve conduct-ing controlled experiments in a classroom setting,requiring participation from actual language learn-ers and teachers.
In this paper, we examine whether a large-scalecrowdsourcing study conducted on Amazon Me-chanical Turk, instead of in classrooms, can provideany answers about the effect of feedback granularityon learning. Our experiments are preliminary in na-ture but nevertheless yield results that — despite notbeing directly applicable to ELLs — are interesting.We also report on lessons we have learned about thedeficiencies in our study and suggest possible waysto overcome them in future work.
For the purpose of this study, we define an “im-provement in learning outcome” as an improvementin the performance of the Turkers on a specific task:detecting and correcting preposition selection errorsin written text. Obviously, learning to use the cor-rect preposition in a given context is only one, albeitan important, aspect of better writing. However, weconcentrate on this single error type since: (a) doingso will allow us to remove any unintended effectsof interactions among multiple errors, ensuring thatthe feedback message is the only variable in our ex-periment, and (b) automated systems for correcting
162
preposition selection errors have been studied anddeveloped for many years. Reason (b) is importantsince we can use the output of these automated sys-tems as part of the feedback.
Briefly, a high-level description of the study is asfollows:
1. Over multiple sessions, Turkers detect and cor-rect preposition errors in sentences.
2. We provide sub-groups of Turkers with differ-ent types of feedback as they proceed throughthe sessions.
3. We measure the differences in Turker perfor-mance and see if the differences vary acrossfeedback types.
Section 2 describes related work. Section 3 de-scribes the experimental design of our study in moredetail. Section 4 presents our analysis of the resultsfrom the study and, finally, Section 5 concludes witha summary of the study along with the lessons welearned from conducting it.
2 Related Work
One automated writing evaluation tool that helpsstudents plan, write and revise their essays guided byinstant diagnostic feedback and a score is Criterion.Attali (2004) and Shermis et al. (2004) examine theeffect of feedback in general in the Criterion systemand find that students presented with feedback areable to improve the overall quality of their writing.Those studies do not investigate different feedbacktypes; they look at the issue of whether feedback ingeneral is a useful tool. We propose to look at vary-ing levels of detail in feedback messages to see whateffect this has on student learning.
We have found no large-scale empirical studiescomparing the types of feedback on grammatical er-rors in the field of second language acquisition, andno work at all on using computer-generated correc-tions. In the field of second language acquisition, themain focus has been on explicit vs. implicit feed-back in a general sense.
The major focus of studies on Corrective Feed-back, or “CF”, for grammatical errors has been onwhether CF is effective or not following the contro-versial claim by Truscott (1996) that it may actuallybe harmful to a learner’s writing ability.
Russell and Spada (2006) used 56 studies in theirmeta-analysis of CF research, and of those, 22 fo-cused on written errors and one looked at both oraland written errors. Meihami and Meihami (2013)list a few more studies, almost all of which are from2006 or later. Some of the studies were conductedin classroom settings, while others were in “labora-tory” settings. In all of the studies, corrective feed-back was given by humans (teachers, researchers,peers, other native speakers), so the sample sizesare most likely limited (unfortunately, that informa-tion is missing from the Russell and Spada meta-analysis).
Doughty and Williams (1998) summarize thefindings of the Lyster and Ranta (1997) classroomstudy of the effectiveness of various feedback tech-niques. Lyster and Ranta (1997) found that oneof the effective types of feedback for stimulatinglearner-generated repairs was a repaired responsefrom the teacher. There were also several other feed-back types that were found to be effective includingmeta-linguistic cues, clarification requests and repe-tition of the learner error. Carroll and Swain (1993)found that in general some kind of feedback is betterthan no feedback.
There are very few studies that have comparedthe effectiveness of different types of written cor-rective feedback. Bitchener et al. (2005) and Bitch-ener (2008) seem to show that direct feedback (oralor written) is more effective than indirect, while in(Bitchener and Knoch, 2008; Bitchener and Knoch,2009), which have larger sample sizes, the differ-ence disappeared. Bitchener and Knoch (2010)investigated different types of corrective feedbackover a 10-month period and also show that there areno differences among different types of feedback.However, Sheen (2007) found that the group re-ceiving meta-linguistic explanations performed bet-ter than the one who received direct error correctionsin the delayed post-test 2 months later. All of thesestudies focused only on English articles.
Biber et al. (2011) present a synthesis of existingwork on the influences of feedback for writing de-velopment. One point from this report that is veryrelevant to our current work is that “Truscott (2007)focuses on the quite restricted question of the extentto which error correction influences writing accu-racy for L2-English students. This study concluded
163
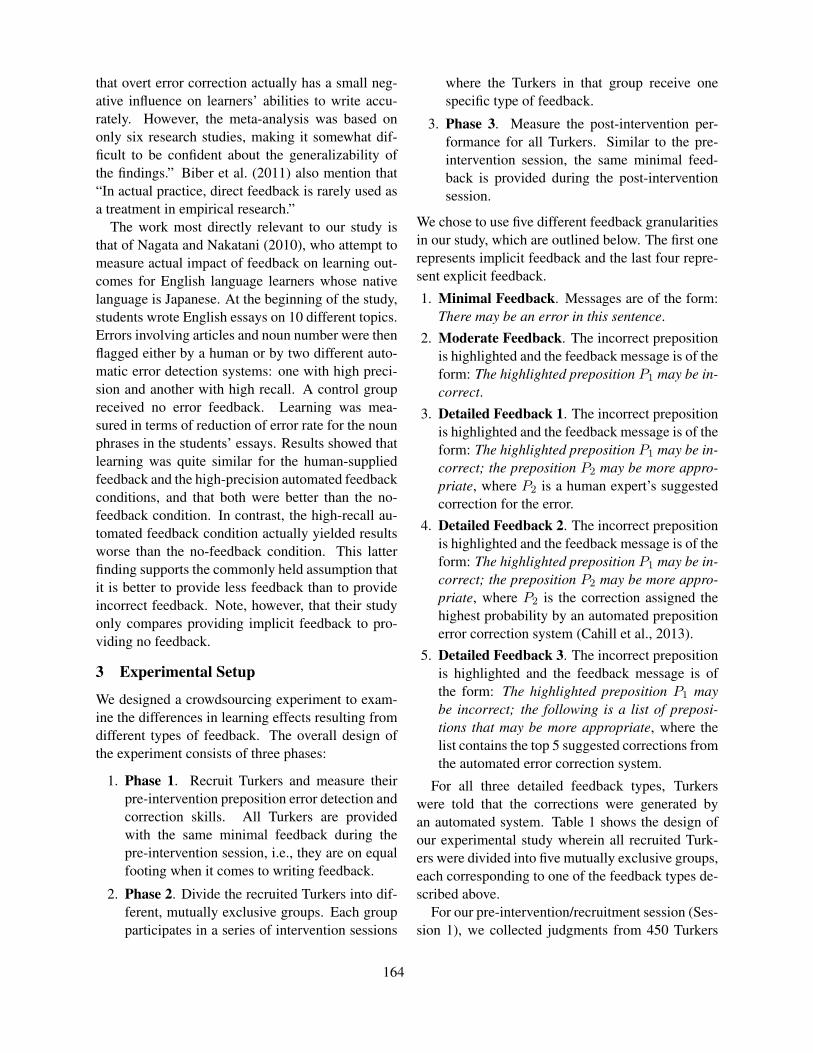
that overt error correction actually has a small neg-ative influence on learners’ abilities to write accu-rately. However, the meta-analysis was based ononly six research studies, making it somewhat dif-ficult to be confident about the generalizability ofthe findings.” Biber et al. (2011) also mention that“In actual practice, direct feedback is rarely used asa treatment in empirical research.”
The work most directly relevant to our study isthat of Nagata and Nakatani (2010), who attempt tomeasure actual impact of feedback on learning out-comes for English language learners whose nativelanguage is Japanese. At the beginning of the study,students wrote English essays on 10 different topics.Errors involving articles and noun number were thenflagged either by a human or by two different auto-matic error detection systems: one with high preci-sion and another with high recall. A control groupreceived no error feedback. Learning was mea-sured in terms of reduction of error rate for the nounphrases in the students’ essays. Results showed thatlearning was quite similar for the human-suppliedfeedback and the high-precision automated feedbackconditions, and that both were better than the no-feedback condition. In contrast, the high-recall au-tomated feedback condition actually yielded resultsworse than the no-feedback condition. This latterfinding supports the commonly held assumption thatit is better to provide less feedback than to provideincorrect feedback. Note, however, that their studyonly compares providing implicit feedback to pro-viding no feedback.
3 Experimental Setup
We designed a crowdsourcing experiment to exam-ine the differences in learning effects resulting fromdifferent types of feedback. The overall design ofthe experiment consists of three phases:
1. Phase 1. Recruit Turkers and measure theirpre-intervention preposition error detection andcorrection skills. All Turkers are providedwith the same minimal feedback during thepre-intervention session, i.e., they are on equalfooting when it comes to writing feedback.
2. Phase 2. Divide the recruited Turkers into dif-ferent, mutually exclusive groups. Each groupparticipates in a series of intervention sessions
where the Turkers in that group receive onespecific type of feedback.
3. Phase 3. Measure the post-intervention per-formance for all Turkers. Similar to the pre-intervention session, the same minimal feed-back is provided during the post-interventionsession.
We chose to use five different feedback granularitiesin our study, which are outlined below. The first onerepresents implicit feedback and the last four repre-sent explicit feedback.
1. Minimal Feedback. Messages are of the form:There may be an error in this sentence.
2. Moderate Feedback. The incorrect prepositionis highlighted and the feedback message is of theform: The highlighted preposition P1 may be in-correct.
3. Detailed Feedback 1. The incorrect prepositionis highlighted and the feedback message is of theform: The highlighted preposition P1 may be in-correct; the preposition P2 may be more appro-priate, where P2 is a human expert’s suggestedcorrection for the error.
4. Detailed Feedback 2. The incorrect prepositionis highlighted and the feedback message is of theform: The highlighted preposition P1 may be in-correct; the preposition P2 may be more appro-priate, where P2 is the correction assigned thehighest probability by an automated prepositionerror correction system (Cahill et al., 2013).
5. Detailed Feedback 3. The incorrect prepositionis highlighted and the feedback message is ofthe form: The highlighted preposition P1 maybe incorrect; the following is a list of preposi-tions that may be more appropriate, where thelist contains the top 5 suggested corrections fromthe automated error correction system.
For all three detailed feedback types, Turkerswere told that the corrections were generated byan automated system. Table 1 shows the design ofour experimental study wherein all recruited Turk-ers were divided into five mutually exclusive groups,each corresponding to one of the feedback types de-scribed above.
For our pre-intervention/recruitment session (Ses-sion 1), we collected judgments from 450 Turkers
164
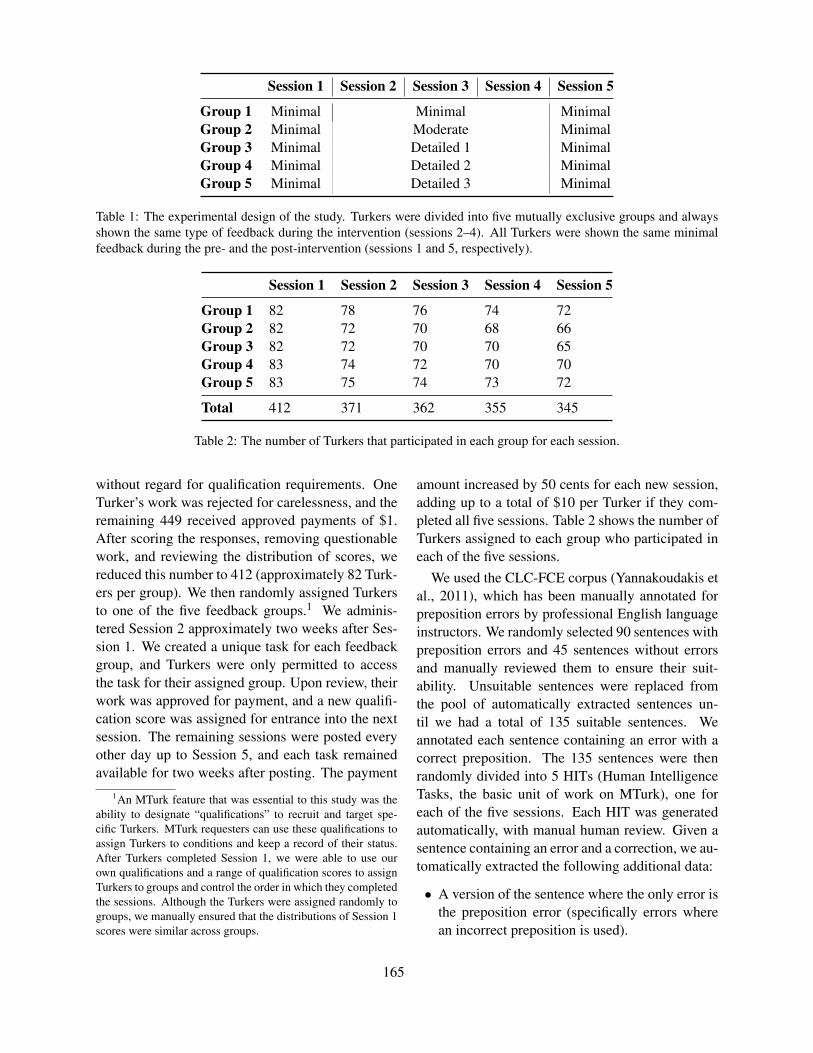
Session 1 Session 2 Session 3 Session 4 Session 5
Group 1 Minimal Minimal MinimalGroup 2 Minimal Moderate MinimalGroup 3 Minimal Detailed 1 MinimalGroup 4 Minimal Detailed 2 MinimalGroup 5 Minimal Detailed 3 Minimal
Table 1: The experimental design of the study. Turkers were divided into five mutually exclusive groups and alwaysshown the same type of feedback during the intervention (sessions 2–4). All Turkers were shown the same minimalfeedback during the pre- and the post-intervention (sessions 1 and 5, respectively).
Session 1 Session 2 Session 3 Session 4 Session 5
Group 1 82 78 76 74 72Group 2 82 72 70 68 66Group 3 82 72 70 70 65Group 4 83 74 72 70 70Group 5 83 75 74 73 72
Total 412 371 362 355 345
Table 2: The number of Turkers that participated in each group for each session.
without regard for qualification requirements. OneTurker’s work was rejected for carelessness, and theremaining 449 received approved payments of $1.After scoring the responses, removing questionablework, and reviewing the distribution of scores, wereduced this number to 412 (approximately 82 Turk-ers per group). We then randomly assigned Turkersto one of the five feedback groups.1 We adminis-tered Session 2 approximately two weeks after Ses-sion 1. We created a unique task for each feedbackgroup, and Turkers were only permitted to accessthe task for their assigned group. Upon review, theirwork was approved for payment, and a new qualifi-cation score was assigned for entrance into the nextsession. The remaining sessions were posted everyother day up to Session 5, and each task remainedavailable for two weeks after posting. The payment
1An MTurk feature that was essential to this study was theability to designate “qualifications” to recruit and target spe-cific Turkers. MTurk requesters can use these qualifications toassign Turkers to conditions and keep a record of their status.After Turkers completed Session 1, we were able to use ourown qualifications and a range of qualification scores to assignTurkers to groups and control the order in which they completedthe sessions. Although the Turkers were assigned randomly togroups, we manually ensured that the distributions of Session 1scores were similar across groups.
amount increased by 50 cents for each new session,adding up to a total of $10 per Turker if they com-pleted all five sessions. Table 2 shows the number ofTurkers assigned to each group who participated ineach of the five sessions.
We used the CLC-FCE corpus (Yannakoudakis etal., 2011), which has been manually annotated forpreposition errors by professional English languageinstructors. We randomly selected 90 sentences withpreposition errors and 45 sentences without errorsand manually reviewed them to ensure their suit-ability. Unsuitable sentences were replaced fromthe pool of automatically extracted sentences un-til we had a total of 135 suitable sentences. Weannotated each sentence containing an error with acorrect preposition. The 135 sentences were thenrandomly divided into 5 HITs (Human IntelligenceTasks, the basic unit of work on MTurk), one foreach of the five sessions. Each HIT was generatedautomatically, with manual human review. Given asentence containing an error and a correction, we au-tomatically extracted the following additional data:
• A version of the sentence where the only error isthe preposition error (specifically errors wherean incorrect preposition is used).
165
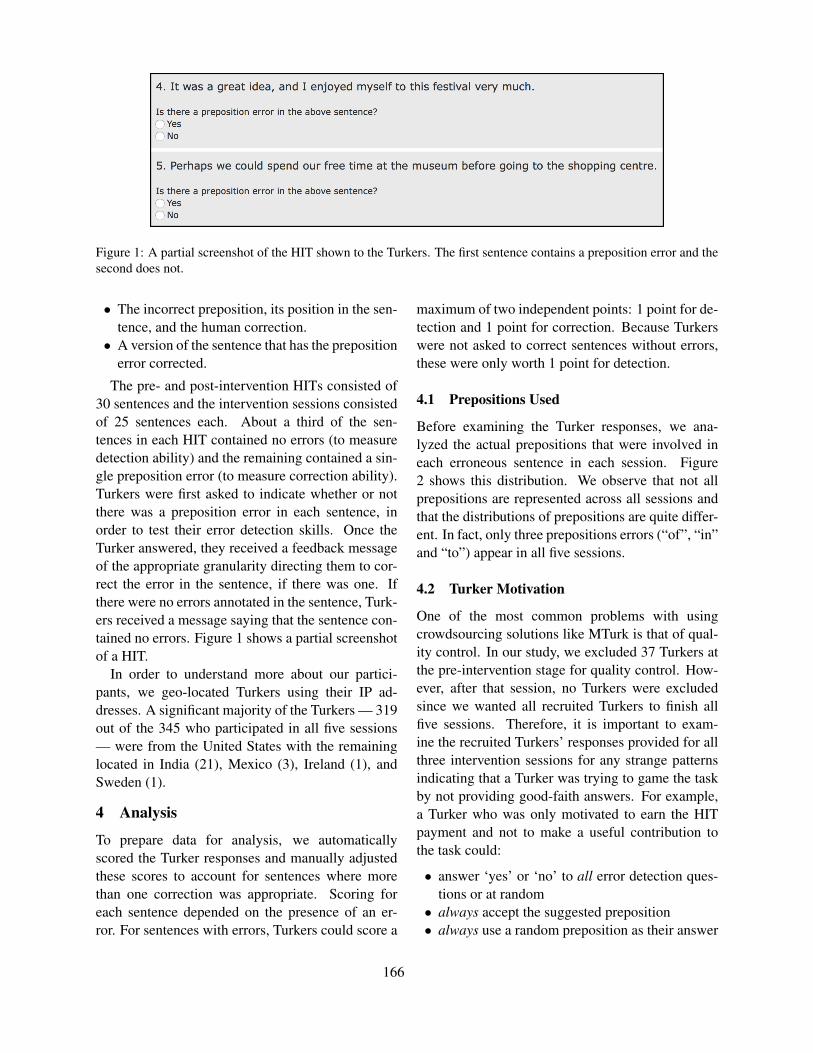
Figure 1: A partial screenshot of the HIT shown to the Turkers. The first sentence contains a preposition error and thesecond does not.
• The incorrect preposition, its position in the sen-tence, and the human correction.• A version of the sentence that has the preposition
error corrected.
The pre- and post-intervention HITs consisted of30 sentences and the intervention sessions consistedof 25 sentences each. About a third of the sen-tences in each HIT contained no errors (to measuredetection ability) and the remaining contained a sin-gle preposition error (to measure correction ability).Turkers were first asked to indicate whether or notthere was a preposition error in each sentence, inorder to test their error detection skills. Once theTurker answered, they received a feedback messageof the appropriate granularity directing them to cor-rect the error in the sentence, if there was one. Ifthere were no errors annotated in the sentence, Turk-ers received a message saying that the sentence con-tained no errors. Figure 1 shows a partial screenshotof a HIT.
In order to understand more about our partici-pants, we geo-located Turkers using their IP ad-dresses. A significant majority of the Turkers — 319out of the 345 who participated in all five sessions— were from the United States with the remaininglocated in India (21), Mexico (3), Ireland (1), andSweden (1).
4 Analysis
To prepare data for analysis, we automaticallyscored the Turker responses and manually adjustedthese scores to account for sentences where morethan one correction was appropriate. Scoring foreach sentence depended on the presence of an er-ror. For sentences with errors, Turkers could score a
maximum of two independent points: 1 point for de-tection and 1 point for correction. Because Turkerswere not asked to correct sentences without errors,these were only worth 1 point for detection.
4.1 Prepositions Used
Before examining the Turker responses, we ana-lyzed the actual prepositions that were involved ineach erroneous sentence in each session. Figure2 shows this distribution. We observe that not allprepositions are represented across all sessions andthat the distributions of prepositions are quite differ-ent. In fact, only three prepositions errors (“of”, “in”and “to”) appear in all five sessions.
4.2 Turker Motivation
One of the most common problems with usingcrowdsourcing solutions like MTurk is that of qual-ity control. In our study, we excluded 37 Turkers atthe pre-intervention stage for quality control. How-ever, after that session, no Turkers were excludedsince we wanted all recruited Turkers to finish allfive sessions. Therefore, it is important to exam-ine the recruited Turkers’ responses provided for allthree intervention sessions for any strange patternsindicating that a Turker was trying to game the taskby not providing good-faith answers. For example,a Turker who was only motivated to earn the HITpayment and not to make a useful contribution tothe task could:
• answer ‘yes’ or ‘no’ to all error detection ques-tions or at random• always accept the suggested preposition• always use a random preposition as their answer
166
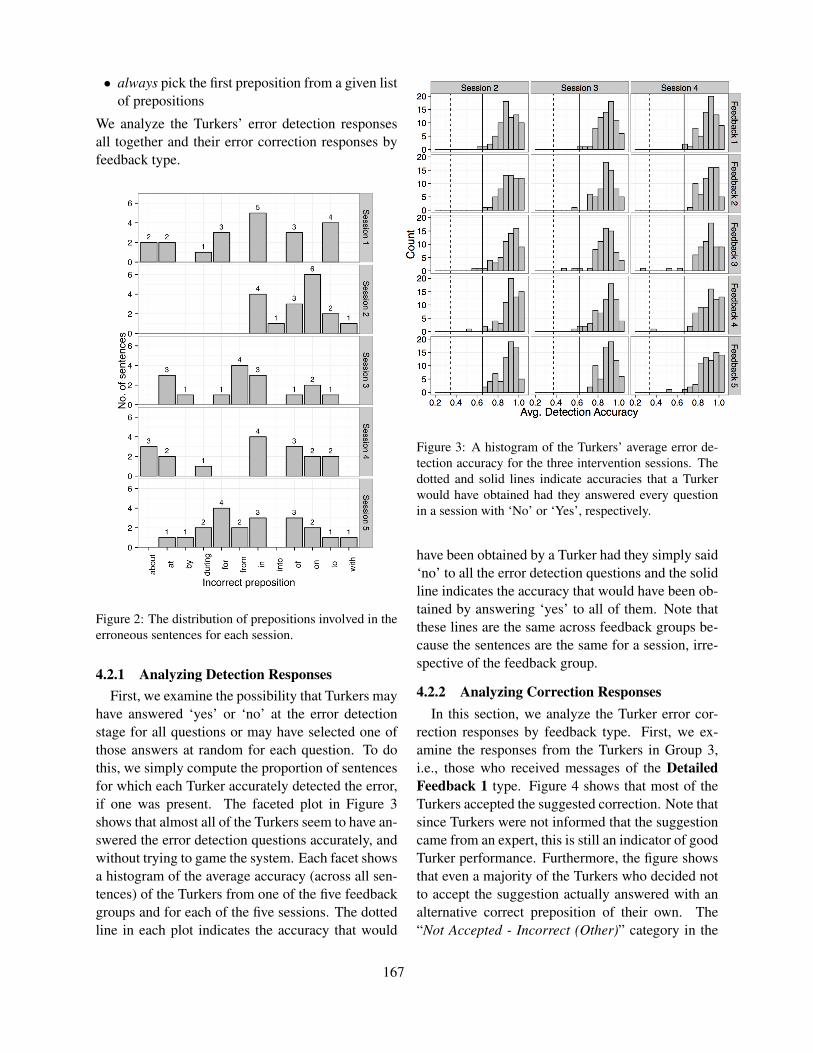
• always pick the first preposition from a given listof prepositions
We analyze the Turkers’ error detection responsesall together and their error correction responses byfeedback type.
Figure 2: The distribution of prepositions involved in theerroneous sentences for each session.
4.2.1 Analyzing Detection ResponsesFirst, we examine the possibility that Turkers may
have answered ‘yes’ or ‘no’ at the error detectionstage for all questions or may have selected one ofthose answers at random for each question. To dothis, we simply compute the proportion of sentencesfor which each Turker accurately detected the error,if one was present. The faceted plot in Figure 3shows that almost all of the Turkers seem to have an-swered the error detection questions accurately, andwithout trying to game the system. Each facet showsa histogram of the average accuracy (across all sen-tences) of the Turkers from one of the five feedbackgroups and for each of the five sessions. The dottedline in each plot indicates the accuracy that would
Figure 3: A histogram of the Turkers’ average error de-tection accuracy for the three intervention sessions. Thedotted and solid lines indicate accuracies that a Turkerwould have obtained had they answered every questionin a session with ‘No’ or ‘Yes’, respectively.
have been obtained by a Turker had they simply said‘no’ to all the error detection questions and the solidline indicates the accuracy that would have been ob-tained by answering ‘yes’ to all of them. Note thatthese lines are the same across feedback groups be-cause the sentences are the same for a session, irre-spective of the feedback group.
4.2.2 Analyzing Correction ResponsesIn this section, we analyze the Turker error cor-
rection responses by feedback type. First, we ex-amine the responses from the Turkers in Group 3,i.e., those who received messages of the DetailedFeedback 1 type. Figure 4 shows that most of theTurkers accepted the suggested correction. Note thatsince Turkers were not informed that the suggestioncame from an expert, this is still an indicator of goodTurker performance. Furthermore, the figure showsthat even a majority of the Turkers who decided notto accept the suggestion actually answered with analternative correct preposition of their own. The“Not Accepted - Incorrect (Other)” category in the
167
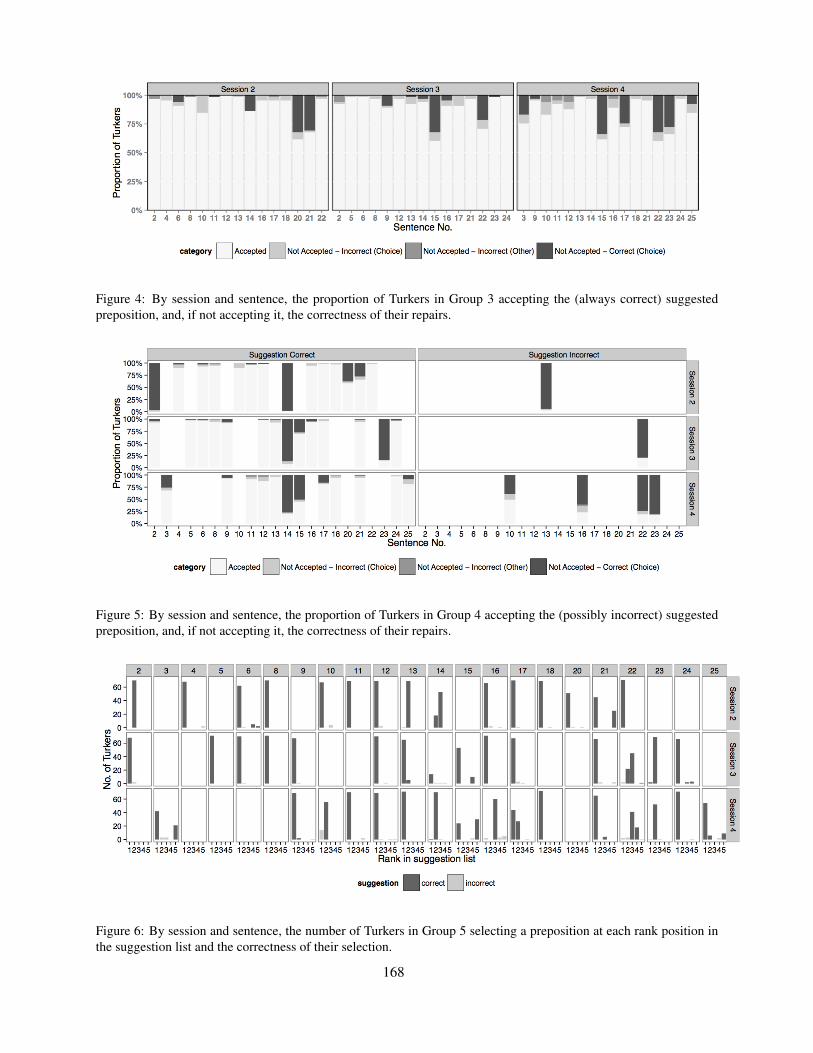
Figure 4: By session and sentence, the proportion of Turkers in Group 3 accepting the (always correct) suggestedpreposition, and, if not accepting it, the correctness of their repairs.
Figure 5: By session and sentence, the proportion of Turkers in Group 4 accepting the (possibly incorrect) suggestedpreposition, and, if not accepting it, the correctness of their repairs.
Figure 6: By session and sentence, the number of Turkers in Group 5 selecting a preposition at each rank position inthe suggestion list and the correctness of their selection.
168

figure refers to rare cases where the Turkers deletedthe erroneous preposition or made other changes inthe sentence instead of fixing the preposition error.
Next, we examine responses from Turkers inGroup 4. Figure 5 shows – similar to Figure 4 –the proportion of Turkers that simply accepted thesuggestion provided as compared to those who didnot. However, in this case, we have the additionalpossibility of the suggested preposition being incor-rect, since it is generated by an automated system.Again, we see that most Turkers accept the sug-gested preposition when it’s correct, but when it’sincorrect, they answer with a different correct prepo-sition of their own.
Our analysis for Group 5 shows similar trends,i.e., most Turkers take the time to find a contextuallyaccurate answer even if it’s not on the list of sug-gested prepositions. Therefore, we do not include acorresponding plot for Group 5 in the paper.
Instead, we thought it would be interesting toexamine the Turkers’ responses from another an-gle. Since a correct suggestion may not always bethe top-ranked preposition in the suggestion list, itwould be interesting to include suggestion ranks intothe analysis. Figure 6 shows, for each sentence ineach session, the number of Turkers that acceptedeach ranked suggestion. The color of the bar indi-cates whether that particular suggestion was corrector incorrect. Note that there may be multiple cor-rect suggestions in a list. Again, we observe that,although there are some Turkers who accepted thetop ranked answer even if it was incorrect, the greatmajority took the time to select a correct preposi-tion no matter what its rank was. Note that the blankfacets in the figure represent sentences for a sessionthat did not contain any errors.
4.3 Learning EffectsIn this section, we attempt to answer the primaryquestion for the study, i.e., assuming that sessions2-4 constitute the intervention, is there a signif-icant difference in the pre-intervention and post-intervention Turker performance across the variousfeedback conditions?
To answer this question, we first compute thelog-odds of Turkers accurately detecting (and cor-recting) errors for the pre-intervention and post-intervention sessions — sessions 1 and 5 respec-
tively — and plot them in Figure 7. We observe thatfor detection, the changes in performance betweenpre- and post-intervention are similar across feed-back groups and no group seems to have performedbetter than Group 1, post-intervention. As far as cor-rection is concerned, there is improvement across allfeedback conditions, but the change in Group 3’sperformance seems much more dramatic than thatfor the other groups.
However, we need to determine whether these im-provements are statistically significant or instead cansimply be explained away by sampling error due torandom variation among the Turkers or among thesentences. To do so, we use a linear mixed-effectsmodel.2 The advantages of using such a model arethat, in addition to modeling the fixed effects ofthe intervention and the type of feedback, it canalso model the random effects represented by theTurker ID (Turkers have different English proficien-cies) and the sentence (a sentence may be easier ormore difficult than another). In addition, it can alsohelp us account for further random effects, e.g., theeffect of Turkers in different groups learning at dif-ferent rates and the sentences being affected differ-ently by the different feedback conditions. Specifi-cally, we fit the following mixed-effects logistic re-gression model using the lme4 package in R:
accurate ∼ group ∗ session+ (1 + session | mturkid)+ (1 + group | sentnum)
where accurate (0 or 1) represents whether aTurker accurately detected or corrected the errorin the sentence, group represents the feedbacktype, and session is either the pre- or the post-intervention session (1 or 5). The ∗ in the modelindicates the inclusion of the interaction betweengroup and session, which is necessary since ourmodel is focused on a second order measure (the dif-ferences between changes in performance). We fittwo models of this form, one for detection and onefor correction. Examination of the results indicates:
1. In the detection model, there was a significanteffect of session (p < 0.05). However, neitherthe effect of group nor any of the interactions of
2cf. Chapter 7, Baayen (2008).
169
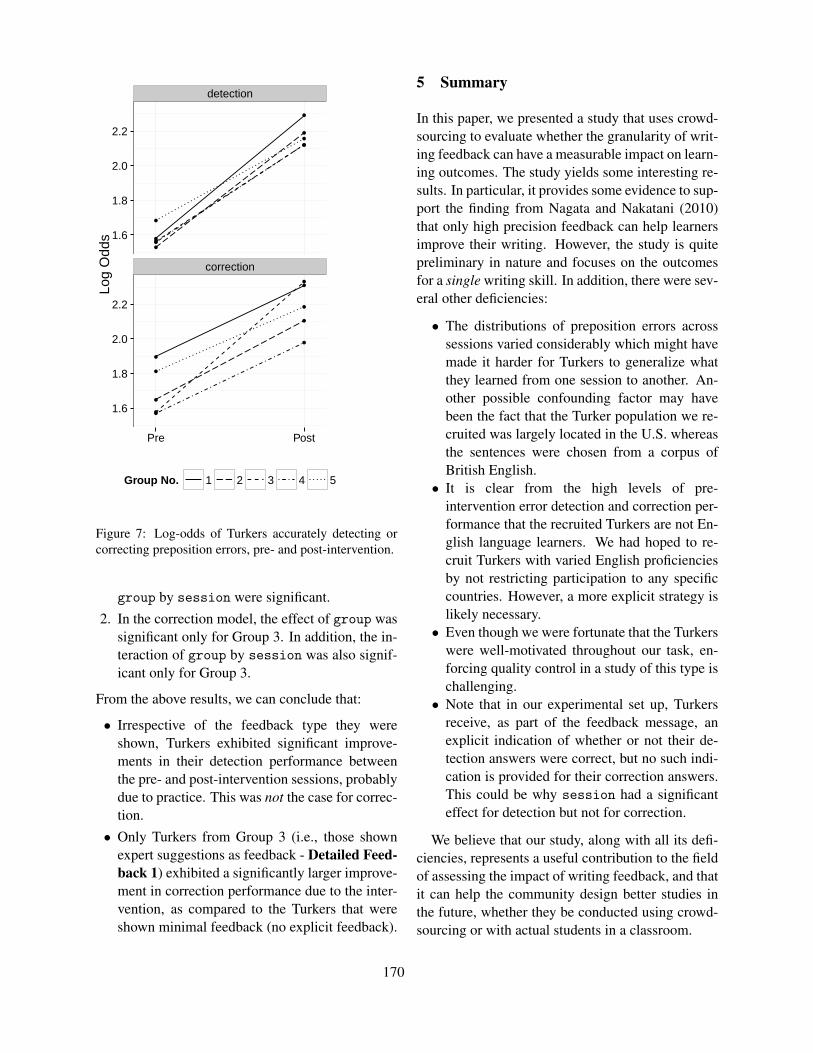
detection
correction
1.6
1.8
2.0
2.2
1.6
1.8
2.0
2.2
Pre Post
Log
Odd
s
Group No. 1 2 3 4 5
Figure 7: Log-odds of Turkers accurately detecting orcorrecting preposition errors, pre- and post-intervention.
group by session were significant.2. In the correction model, the effect of group was
significant only for Group 3. In addition, the in-teraction of group by session was also signif-icant only for Group 3.
From the above results, we can conclude that:
• Irrespective of the feedback type they wereshown, Turkers exhibited significant improve-ments in their detection performance betweenthe pre- and post-intervention sessions, probablydue to practice. This was not the case for correc-tion.• Only Turkers from Group 3 (i.e., those shown
expert suggestions as feedback - Detailed Feed-back 1) exhibited a significantly larger improve-ment in correction performance due to the inter-vention, as compared to the Turkers that wereshown minimal feedback (no explicit feedback).
5 Summary
In this paper, we presented a study that uses crowd-sourcing to evaluate whether the granularity of writ-ing feedback can have a measurable impact on learn-ing outcomes. The study yields some interesting re-sults. In particular, it provides some evidence to sup-port the finding from Nagata and Nakatani (2010)that only high precision feedback can help learnersimprove their writing. However, the study is quitepreliminary in nature and focuses on the outcomesfor a single writing skill. In addition, there were sev-eral other deficiencies:
• The distributions of preposition errors acrosssessions varied considerably which might havemade it harder for Turkers to generalize whatthey learned from one session to another. An-other possible confounding factor may havebeen the fact that the Turker population we re-cruited was largely located in the U.S. whereasthe sentences were chosen from a corpus ofBritish English.• It is clear from the high levels of pre-
intervention error detection and correction per-formance that the recruited Turkers are not En-glish language learners. We had hoped to re-cruit Turkers with varied English proficienciesby not restricting participation to any specificcountries. However, a more explicit strategy islikely necessary.• Even though we were fortunate that the Turkers
were well-motivated throughout our task, en-forcing quality control in a study of this type ischallenging.• Note that in our experimental set up, Turkers
receive, as part of the feedback message, anexplicit indication of whether or not their de-tection answers were correct, but no such indi-cation is provided for their correction answers.This could be why session had a significanteffect for detection but not for correction.
We believe that our study, along with all its defi-ciencies, represents a useful contribution to the fieldof assessing the impact of writing feedback, and thatit can help the community design better studies inthe future, whether they be conducted using crowd-sourcing or with actual students in a classroom.
170
Acknowledgments
We would like to thank the three anonymous review-ers. We would also like to thank Keelan Evanini,Beata Beigman Klebanov and Lin Gu for their com-ments.
References
Yigal Attali. 2004. Exploring the Feedback and RevisionFeatures of Criterion. Paper presented at the NationalCouncil on Measurement in Education (NCME), Edu-cational Testing Service, Princeton, NJ.
R. H. Baayen. 2008. Analyzing Linguistic Data: A Prac-tical Introduction to Statistics using R. CambridgeUniversity Press.
Douglas Biber, Tatiana Nekrasova, and Brad Horn. 2011.The Effectiveness of Feedback for L1-English andL2-Writing Development: A Meta-Analysis. Re-search Report RR-11-05, Educational Testing Service,Princeton, NJ.
J. Bitchener and U. Knoch. 2008. The Value ofWritten Corrective Feedback for Migrant and Interna-tional Students. Language Teaching Research Jour-nal, 12(3):409–431.
J. Bitchener and U. Knoch. 2009. The Relative Effec-tiveness of Different Types of Direct Written Correc-tive Feedback. System, 37(2):322–329.
J. Bitchener and U. Knoch. 2010. The Contributionof Written Corrective Feedback to Language Develop-ment: A Ten Month Investigation.
J. Bitchener, S. Young, and D. Cameron. 2005. The Ef-fect of Different Types of Corrective Feedback on ESLStudent Writing. Journal of Second language Writing.
J. Bitchener. 2008. Evidence in Support of Written Cor-rective Feedback. Journal of Second Language Writ-ing, 17:69–124.
Aoife Cahill, Nitin Madnani, Joel Tetreault, and Di-ane Napolitano. 2013. Robust Systems for Preposi-tion Error Correction Using Wikipedia Revisions. InProceedings of NAACL, pages 507–517, Atlanta, GA,USA.
S. Carroll and M. Swain. 1993. Explicit and ImplicitNegative Feedback. Studies in Second Language Ac-quisition, 15:357–386.
C. Doughty and J Williams. 1998. Pedagogical Choicesin Focus on Form.
Z. Li and V. Hegelheimer. 2013. Mobile-assisted Gram-mar Exercises: Effects on Self-editing in L2 Writing.Language Learning & Technology, 17(3):135–156.
Anastasiya A. Lipnevich and Jeffrey K. Smith. 2008.Response to Assessment Feedback: The Effects of
Grades, Praise, and Source of Information. Re-search Report RR-08-30, Educational Testing Service,Princeton, NJ.
R. Lyster and L. Ranta. 1997. Corrective Feedback andLearner Uptake. Studies in Second Language Acquisi-tion, 19:37–66.
B. Meihami and H. Meihami. 2013. Correct I or I DontCorrect Myself: Corrective Feedback on EFL StudentsWriting. In International Letters of Social and Hu-manistic Sciences, page 8695.
Ryo Nagata and Kazuhide Nakatani. 2010. EvaluatingPerformance of Grammatical Error Detection to Max-imize Learning Effect. In Proceedings of COLING(Posters), pages 894–900, Beijing, China.
JoAnn Leah Rock. 2007. The Impact of Short-Term Useof Criterion on Writing Skills in Ninth Grade. Re-search Report RR-07-07, Educational Testing Service,Princeton, NJ.
J. Russell and N. Spada. 2006. The Effectiveness ofCorrective Feedback for the Acquisition of L2 Gram-mar: A Meta-analysis of the Research. In J. D. Norrisand L. Ortega, editors, Synthesizing Research on Lan-guage Learning and Teaching, pages 133–164. JohnBenjamins, Philadelphia.
Y. Sheen. 2007. The Effect of Focused Written Cor-rective Feedback and Language Aptitude on ESLLearners Acquisition of Articles. TESOL Quarterly,41:255–283.
Mark D. Shermis, Jill C. Burstein, and Leonard Bliss.2004. The Impact of Automated Essay Scoring onHigh Stakes Writing Assessments. In Annual Meetingof the National Council on Measurement in Education.
J. Truscott. 1996. The Case against Grammar Correctionin L2 Writing Classes. Language Learning, 46:327–369.
John Truscott. 2007. The Effect of Error Correction onLearners’ Ability to Write Accurately. Journal of Sec-ond Language Writing, 16(4):255–272.
Helen Yannakoudakis, Ted Briscoe, and Ben Medlock.2011. A New Dataset and Method for AutomaticallyGrading ESOL Texts. In Proceedings of the ACL:HLT, pages 180–189, Portland, OR, USA.
171
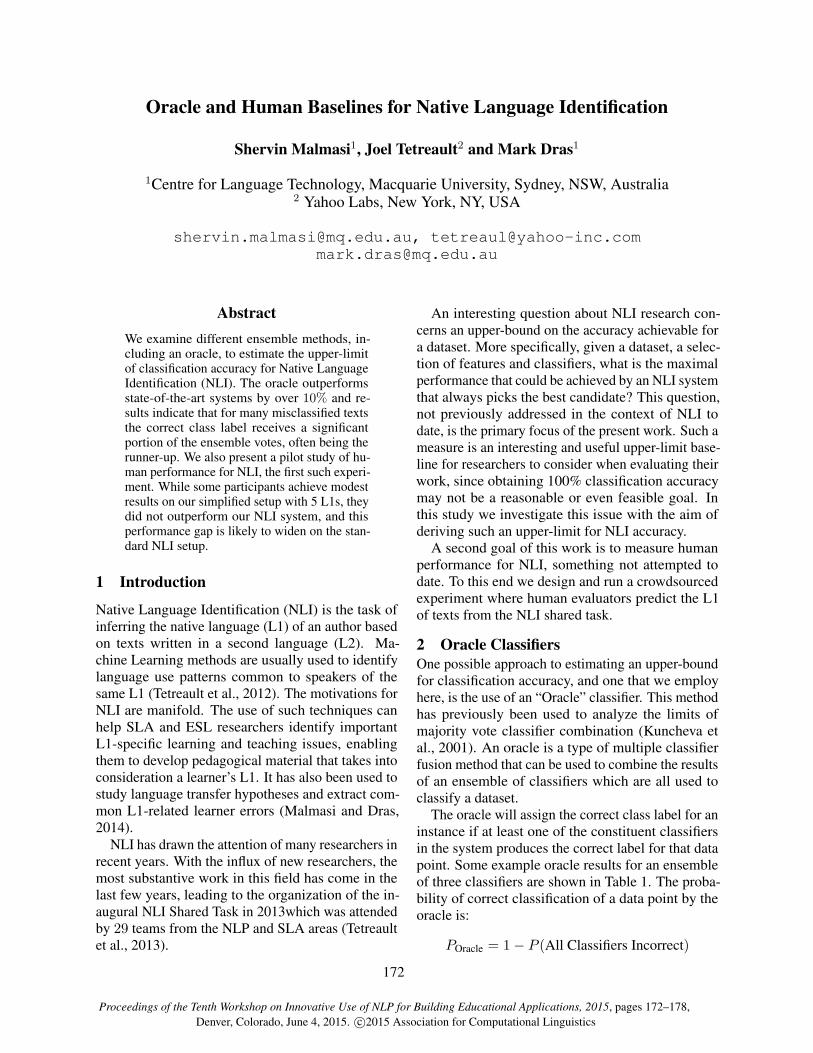
Proceedings of the Tenth Workshop on Innovative Use of NLP for Building Educational Applications, 2015, pages 172–178,Denver, Colorado, June 4, 2015. c©2015 Association for Computational Linguistics
Oracle and Human Baselines for Native Language Identification
Shervin Malmasi1, Joel Tetreault2 and Mark Dras1
1Centre for Language Technology, Macquarie University, Sydney, NSW, Australia2 Yahoo Labs, New York, NY, USA
[email protected], [email protected]@mq.edu.au
AbstractWe examine different ensemble methods, in-cluding an oracle, to estimate the upper-limitof classification accuracy for Native LanguageIdentification (NLI). The oracle outperformsstate-of-the-art systems by over 10% and re-sults indicate that for many misclassified textsthe correct class label receives a significantportion of the ensemble votes, often being therunner-up. We also present a pilot study of hu-man performance for NLI, the first such experi-ment. While some participants achieve modestresults on our simplified setup with 5 L1s, theydid not outperform our NLI system, and thisperformance gap is likely to widen on the stan-dard NLI setup.
1 Introduction
Native Language Identification (NLI) is the task ofinferring the native language (L1) of an author basedon texts written in a second language (L2). Ma-chine Learning methods are usually used to identifylanguage use patterns common to speakers of thesame L1 (Tetreault et al., 2012). The motivations forNLI are manifold. The use of such techniques canhelp SLA and ESL researchers identify importantL1-specific learning and teaching issues, enablingthem to develop pedagogical material that takes intoconsideration a learner’s L1. It has also been used tostudy language transfer hypotheses and extract com-mon L1-related learner errors (Malmasi and Dras,2014).
NLI has drawn the attention of many researchers inrecent years. With the influx of new researchers, themost substantive work in this field has come in thelast few years, leading to the organization of the in-augural NLI Shared Task in 2013which was attendedby 29 teams from the NLP and SLA areas (Tetreaultet al., 2013).
An interesting question about NLI research con-cerns an upper-bound on the accuracy achievable fora dataset. More specifically, given a dataset, a selec-tion of features and classifiers, what is the maximalperformance that could be achieved by an NLI systemthat always picks the best candidate? This question,not previously addressed in the context of NLI todate, is the primary focus of the present work. Such ameasure is an interesting and useful upper-limit base-line for researchers to consider when evaluating theirwork, since obtaining 100% classification accuracymay not be a reasonable or even feasible goal. Inthis study we investigate this issue with the aim ofderiving such an upper-limit for NLI accuracy.
A second goal of this work is to measure humanperformance for NLI, something not attempted todate. To this end we design and run a crowdsourcedexperiment where human evaluators predict the L1of texts from the NLI shared task.
2 Oracle ClassifiersOne possible approach to estimating an upper-boundfor classification accuracy, and one that we employhere, is the use of an “Oracle” classifier. This methodhas previously been used to analyze the limits ofmajority vote classifier combination (Kuncheva etal., 2001). An oracle is a type of multiple classifierfusion method that can be used to combine the resultsof an ensemble of classifiers which are all used toclassify a dataset.
The oracle will assign the correct class label for aninstance if at least one of the constituent classifiersin the system produces the correct label for that datapoint. Some example oracle results for an ensembleof three classifiers are shown in Table 1. The proba-bility of correct classification of a data point by theoracle is:
POracle = 1− P (All Classifiers Incorrect)
172
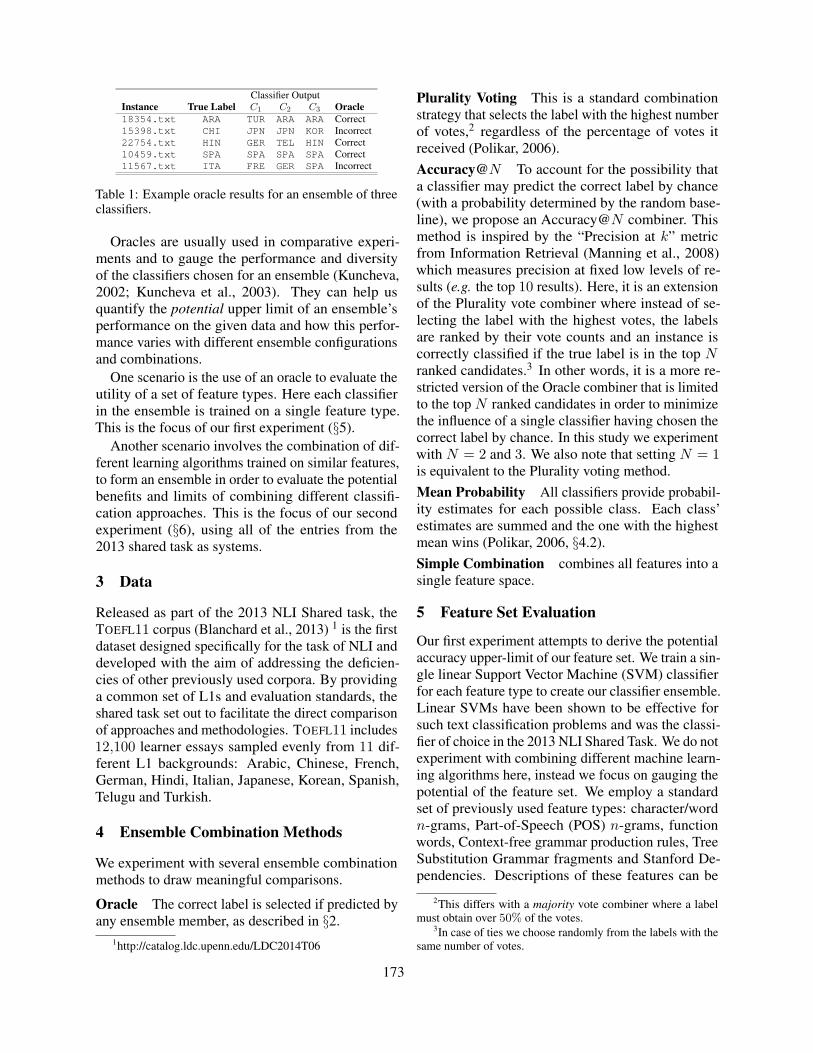
Classifier OutputInstance True Label C1 C2 C3 Oracle18354.txt ARA TUR ARA ARA Correct15398.txt CHI JPN JPN KOR Incorrect22754.txt HIN GER TEL HIN Correct10459.txt SPA SPA SPA SPA Correct11567.txt ITA FRE GER SPA Incorrect
Table 1: Example oracle results for an ensemble of threeclassifiers.
Oracles are usually used in comparative experi-ments and to gauge the performance and diversityof the classifiers chosen for an ensemble (Kuncheva,2002; Kuncheva et al., 2003). They can help usquantify the potential upper limit of an ensemble’sperformance on the given data and how this perfor-mance varies with different ensemble configurationsand combinations.
One scenario is the use of an oracle to evaluate theutility of a set of feature types. Here each classifierin the ensemble is trained on a single feature type.This is the focus of our first experiment (§5).
Another scenario involves the combination of dif-ferent learning algorithms trained on similar features,to form an ensemble in order to evaluate the potentialbenefits and limits of combining different classifi-cation approaches. This is the focus of our secondexperiment (§6), using all of the entries from the2013 shared task as systems.
3 Data
Released as part of the 2013 NLI Shared task, theTOEFL11 corpus (Blanchard et al., 2013) 1 is the firstdataset designed specifically for the task of NLI anddeveloped with the aim of addressing the deficien-cies of other previously used corpora. By providinga common set of L1s and evaluation standards, theshared task set out to facilitate the direct comparisonof approaches and methodologies. TOEFL11 includes12,100 learner essays sampled evenly from 11 dif-ferent L1 backgrounds: Arabic, Chinese, French,German, Hindi, Italian, Japanese, Korean, Spanish,Telugu and Turkish.
4 Ensemble Combination Methods
We experiment with several ensemble combinationmethods to draw meaningful comparisons.
Oracle The correct label is selected if predicted byany ensemble member, as described in §2.
1http://catalog.ldc.upenn.edu/LDC2014T06
Plurality Voting This is a standard combinationstrategy that selects the label with the highest numberof votes,2 regardless of the percentage of votes itreceived (Polikar, 2006).Accuracy@N To account for the possibility thata classifier may predict the correct label by chance(with a probability determined by the random base-line), we propose an Accuracy@N combiner. Thismethod is inspired by the “Precision at k” metricfrom Information Retrieval (Manning et al., 2008)which measures precision at fixed low levels of re-sults (e.g. the top 10 results). Here, it is an extensionof the Plurality vote combiner where instead of se-lecting the label with the highest votes, the labelsare ranked by their vote counts and an instance iscorrectly classified if the true label is in the top Nranked candidates.3 In other words, it is a more re-stricted version of the Oracle combiner that is limitedto the top N ranked candidates in order to minimizethe influence of a single classifier having chosen thecorrect label by chance. In this study we experimentwith N = 2 and 3. We also note that setting N = 1is equivalent to the Plurality voting method.Mean Probability All classifiers provide probabil-ity estimates for each possible class. Each class’estimates are summed and the one with the highestmean wins (Polikar, 2006, §4.2).Simple Combination combines all features into asingle feature space.
5 Feature Set Evaluation
Our first experiment attempts to derive the potentialaccuracy upper-limit of our feature set. We train a sin-gle linear Support Vector Machine (SVM) classifierfor each feature type to create our classifier ensemble.Linear SVMs have been shown to be effective forsuch text classification problems and was the classi-fier of choice in the 2013 NLI Shared Task. We do notexperiment with combining different machine learn-ing algorithms here, instead we focus on gauging thepotential of the feature set. We employ a standardset of previously used feature types: character/wordn-grams, Part-of-Speech (POS) n-grams, functionwords, Context-free grammar production rules, TreeSubstitution Grammar fragments and Stanford De-pendencies. Descriptions of these features can be
2This differs with a majority vote combiner where a labelmust obtain over 50% of the votes.
3In case of ties we choose randomly from the labels with thesame number of votes.
173
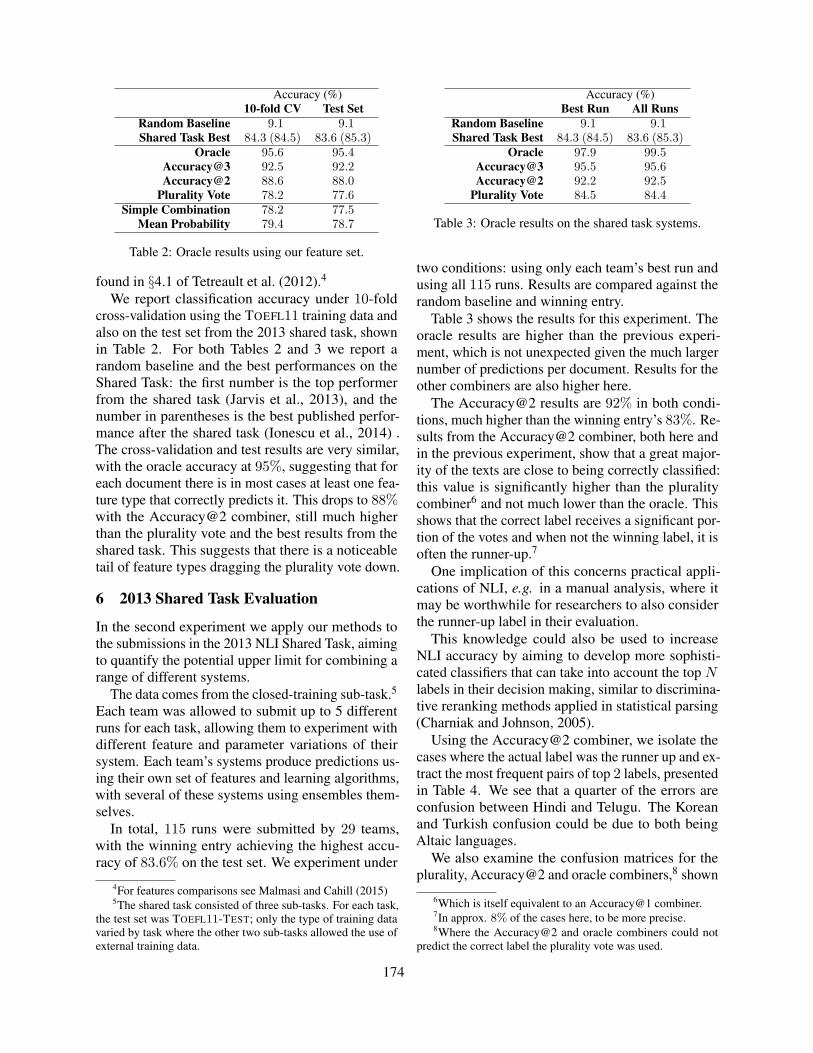
Accuracy (%)10-fold CV Test Set
Random Baseline 9.1 9.1Shared Task Best 84.3 (84.5) 83.6 (85.3)
Oracle 95.6 95.4Accuracy@3 92.5 92.2Accuracy@2 88.6 88.0
Plurality Vote 78.2 77.6Simple Combination 78.2 77.5
Mean Probability 79.4 78.7
Table 2: Oracle results using our feature set.
found in §4.1 of Tetreault et al. (2012).4
We report classification accuracy under 10-foldcross-validation using the TOEFL11 training data andalso on the test set from the 2013 shared task, shownin Table 2. For both Tables 2 and 3 we report arandom baseline and the best performances on theShared Task: the first number is the top performerfrom the shared task (Jarvis et al., 2013), and thenumber in parentheses is the best published perfor-mance after the shared task (Ionescu et al., 2014) .The cross-validation and test results are very similar,with the oracle accuracy at 95%, suggesting that foreach document there is in most cases at least one fea-ture type that correctly predicts it. This drops to 88%with the Accuracy@2 combiner, still much higherthan the plurality vote and the best results from theshared task. This suggests that there is a noticeabletail of feature types dragging the plurality vote down.
6 2013 Shared Task Evaluation
In the second experiment we apply our methods tothe submissions in the 2013 NLI Shared Task, aimingto quantify the potential upper limit for combining arange of different systems.
The data comes from the closed-training sub-task.5
Each team was allowed to submit up to 5 differentruns for each task, allowing them to experiment withdifferent feature and parameter variations of theirsystem. Each team’s systems produce predictions us-ing their own set of features and learning algorithms,with several of these systems using ensembles them-selves.
In total, 115 runs were submitted by 29 teams,with the winning entry achieving the highest accu-racy of 83.6% on the test set. We experiment under
4For features comparisons see Malmasi and Cahill (2015)5The shared task consisted of three sub-tasks. For each task,
the test set was TOEFL11-TEST; only the type of training datavaried by task where the other two sub-tasks allowed the use ofexternal training data.
Accuracy (%)Best Run All Runs
Random Baseline 9.1 9.1Shared Task Best 84.3 (84.5) 83.6 (85.3)
Oracle 97.9 99.5Accuracy@3 95.5 95.6Accuracy@2 92.2 92.5
Plurality Vote 84.5 84.4
Table 3: Oracle results on the shared task systems.
two conditions: using only each team’s best run andusing all 115 runs. Results are compared against therandom baseline and winning entry.
Table 3 shows the results for this experiment. Theoracle results are higher than the previous experi-ment, which is not unexpected given the much largernumber of predictions per document. Results for theother combiners are also higher here.
The Accuracy@2 results are 92% in both condi-tions, much higher than the winning entry’s 83%. Re-sults from the Accuracy@2 combiner, both here andin the previous experiment, show that a great major-ity of the texts are close to being correctly classified:this value is significantly higher than the pluralitycombiner6 and not much lower than the oracle. Thisshows that the correct label receives a significant por-tion of the votes and when not the winning label, it isoften the runner-up.7
One implication of this concerns practical appli-cations of NLI, e.g. in a manual analysis, where itmay be worthwhile for researchers to also considerthe runner-up label in their evaluation.
This knowledge could also be used to increaseNLI accuracy by aiming to develop more sophisti-cated classifiers that can take into account the top Nlabels in their decision making, similar to discrimina-tive reranking methods applied in statistical parsing(Charniak and Johnson, 2005).
Using the Accuracy@2 combiner, we isolate thecases where the actual label was the runner up and ex-tract the most frequent pairs of top 2 labels, presentedin Table 4. We see that a quarter of the errors areconfusion between Hindi and Telugu. The Koreanand Turkish confusion could be due to both beingAltaic languages.
We also examine the confusion matrices for theplurality, Accuracy@2 and oracle combiners,8 shown
6Which is itself equivalent to an Accuracy@1 combiner.7In approx. 8% of the cases here, to be more precise.8Where the Accuracy@2 and oracle combiners could not
predict the correct label the plurality vote was used.
174

ARA
CH
I
FRE
GER HIN ITA
JPN
KOR
SPA
TEL
TUR
Predicted label
ARA
CHI
FRE
GER
HIN
ITA
JPN
KOR
SPA
TEL
TUR
Tru
e label
Plurality Vote
0
10
20
30
40
50
60
70
80
90
ARA
CH
I
FRE
GER HIN ITA
JPN
KOR
SPA
TEL
TUR
Predicted label
ARA
CHI
FRE
GER
HIN
ITA
JPN
KOR
SPA
TEL
TUR
Tru
e label
Accuracy@2
0
10
20
30
40
50
60
70
80
90
ARA
CH
I
FRE
GER HIN ITA
JPN
KOR
SPA
TEL
TUR
Predicted label
ARA
CHI
FRE
GER
HIN
ITA
JPN
KOR
SPA
TEL
TUR
Tru
e label
Oracle
0
10
20
30
40
50
60
70
80
90
100
Figure 1: Confusion matrices for the plurality (L), Accuracy@2 (M) and oracle (R) combiners..
Confused Pair Percent Cumulative PercentHIN–TEL 15.9 15.9TEL–HIN 10.2 26.1CHI–KOR 6.8 33.0JPN–KOR 6.8 39.8
KOR–TUR 4.5 44.3
Table 4: Most commonly predicted top 2 label pairs wherethe runner-up is the true label.
in Figure 1. They show that Hindi–Telugu is themost commonly confused pair and confirm the di-rectionality of the confusion: more Telugu texts aremisclassified as Hindi than vice versa.
7 Human NLI Performance
While most NLI work has focused on improvingsystem performance, to our knowledge there has notbeen any corresponding study which looks at humanperformance for this task. To give our precedingresults more context, as well as the results of thefield, we ran an exploratory study to determine howaccurate humans are for this task.
7.1 Experiment DesignOur initial hypothesis was to use the Amazon Me-chanical Turk to collect crowdsourced judgments.However, unlike simpler NLP tasks, e.g. sentimentanalysis and word sense disambiguation, which canbe effectively annotated by untrained Turkers (Snowet al., 2008), NLI requires raters with knowledge andexposure to writers with different L1s. Optimally,one would use a set of ESL teachers and researcherswho have experience in working with ESL writersfrom all of the 11 L1s, though such people are rar-ity. As a reasonable compromise, we chose 10 pro-fessors and researchers who have varied linguisticbackgrounds, speak multiple languages, and have hadexposure with the particular L1s, either as a speakeror through working with ESL students. We also con-strained the task from 11 L1s to 5 (Arabic, Chinese,German, Hindi, and Spanish) as we believed that
0
10
20
30
40
50
60
70
1 2 3 4 5 6 7 8 9 10
ACCURACY
PARTICIPANT
HARD EASY
Figure 2: Prediction accuracy for each of our 10 partici-pants under both easy and hard conditions.
11 L1s would be too much of an overload on thejudges. The 5 L1s were selected since they all belongto separate language families.
The experiment consisted of rating 30 essays fromTOEFL11-TEST, 15 of which most Shared Task sys-tems could predict correctly (easy), and the remain-ing 15 were essays in which the Shared Task systemshad difficulty (hard). The L1s were distributed evenlyover the essays and easy/hard conditions (3 “easy”and 3 “hard” essays per L1).
7.2 ResultsFigure 2 shows the accuracy for each rater in this pilotstudy. The top rater accurately identified 16 out of 30L1s (53.3%), with the lowest raters at 30.0% overalland an average of 37.3%. All raters did better on the“easy” cases than on the “hard.” A paired-samplest-test was conducted to compare human accuracy inthe easy and hard conditions. A significant differencewas found for easy (M=45.33, SD=11.67) and hard(M=30, SD=10.06), t(9)=−3.851, p = .004.
Next, we compared human accuracy with our NLIsystem, which we re-trained using only the five se-lected L1s. Results are shown in Table 5. All ensem-bles outperform human raters and a plurality votecomposed of the human raters. Interestingly, the hu-man plurality vote was only 3% higher than the tophuman score, suggesting that the raters tended to getthe same essays correct.
175
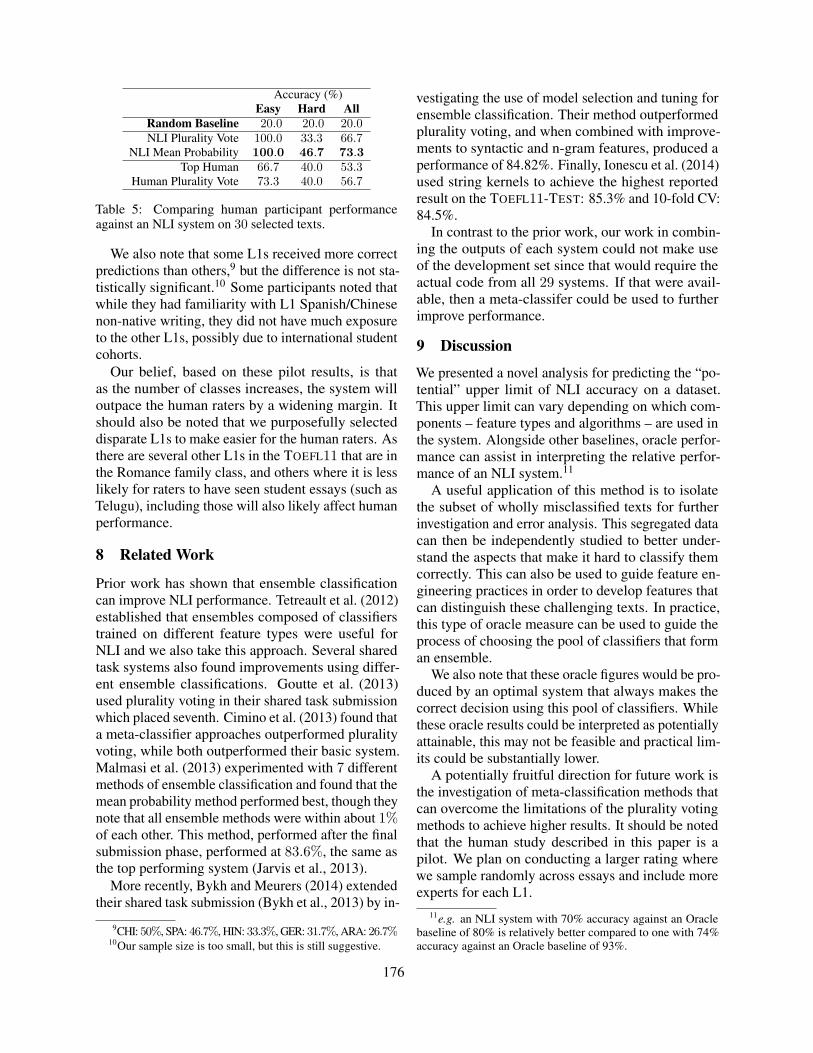
Accuracy (%)Easy Hard All
Random Baseline 20.0 20.0 20.0NLI Plurality Vote 100.0 33.3 66.7
NLI Mean Probability 100.0 46.7 73.3Top Human 66.7 40.0 53.3
Human Plurality Vote 73.3 40.0 56.7
Table 5: Comparing human participant performanceagainst an NLI system on 30 selected texts.
We also note that some L1s received more correctpredictions than others,9 but the difference is not sta-tistically significant.10 Some participants noted thatwhile they had familiarity with L1 Spanish/Chinesenon-native writing, they did not have much exposureto the other L1s, possibly due to international studentcohorts.
Our belief, based on these pilot results, is thatas the number of classes increases, the system willoutpace the human raters by a widening margin. Itshould also be noted that we purposefully selecteddisparate L1s to make easier for the human raters. Asthere are several other L1s in the TOEFL11 that are inthe Romance family class, and others where it is lesslikely for raters to have seen student essays (such asTelugu), including those will also likely affect humanperformance.
8 Related Work
Prior work has shown that ensemble classificationcan improve NLI performance. Tetreault et al. (2012)established that ensembles composed of classifierstrained on different feature types were useful forNLI and we also take this approach. Several sharedtask systems also found improvements using differ-ent ensemble classifications. Goutte et al. (2013)used plurality voting in their shared task submissionwhich placed seventh. Cimino et al. (2013) found thata meta-classifier approaches outperformed pluralityvoting, while both outperformed their basic system.Malmasi et al. (2013) experimented with 7 differentmethods of ensemble classification and found that themean probability method performed best, though theynote that all ensemble methods were within about 1%of each other. This method, performed after the finalsubmission phase, performed at 83.6%, the same asthe top performing system (Jarvis et al., 2013).
More recently, Bykh and Meurers (2014) extendedtheir shared task submission (Bykh et al., 2013) by in-
9CHI: 50%, SPA: 46.7%, HIN: 33.3%, GER: 31.7%, ARA: 26.7%10Our sample size is too small, but this is still suggestive.
vestigating the use of model selection and tuning forensemble classification. Their method outperformedplurality voting, and when combined with improve-ments to syntactic and n-gram features, produced aperformance of 84.82%. Finally, Ionescu et al. (2014)used string kernels to achieve the highest reportedresult on the TOEFL11-TEST: 85.3% and 10-fold CV:84.5%.
In contrast to the prior work, our work in combin-ing the outputs of each system could not make useof the development set since that would require theactual code from all 29 systems. If that were avail-able, then a meta-classifer could be used to furtherimprove performance.
9 Discussion
We presented a novel analysis for predicting the “po-tential” upper limit of NLI accuracy on a dataset.This upper limit can vary depending on which com-ponents – feature types and algorithms – are used inthe system. Alongside other baselines, oracle perfor-mance can assist in interpreting the relative perfor-mance of an NLI system.11
A useful application of this method is to isolatethe subset of wholly misclassified texts for furtherinvestigation and error analysis. This segregated datacan then be independently studied to better under-stand the aspects that make it hard to classify themcorrectly. This can also be used to guide feature en-gineering practices in order to develop features thatcan distinguish these challenging texts. In practice,this type of oracle measure can be used to guide theprocess of choosing the pool of classifiers that forman ensemble.
We also note that these oracle figures would be pro-duced by an optimal system that always makes thecorrect decision using this pool of classifiers. Whilethese oracle results could be interpreted as potentiallyattainable, this may not be feasible and practical lim-its could be substantially lower.
A potentially fruitful direction for future work isthe investigation of meta-classification methods thatcan overcome the limitations of the plurality votingmethods to achieve higher results. It should be notedthat the human study described in this paper is apilot. We plan on conducting a larger rating wherewe sample randomly across essays and include moreexperts for each L1.
11e.g. an NLI system with 70% accuracy against an Oraclebaseline of 80% is relatively better compared to one with 74%accuracy against an Oracle baseline of 93%.
176

Acknowledgments
We would like to thank the three anonymous re-viewers as well as our raters: Martin Chodorow,Carla Parra Escartin, Marte Kvamme, Aasish Pappu,Dragomir Radev, Patti Spinner, Robert Stine, KapilThadani, Alissa Vik and Gloria Zen.
ReferencesDaniel Blanchard, Joel Tetreault, Derrick Higgins, Aoife
Cahill, and Martin Chodorow. 2013. TOEFL11: ACorpus of Non-Native English. Technical report, Edu-cational Testing Service.
Serhiy Bykh and Detmar Meurers. 2014. ExploringSyntactic Features for Native Language Identification:A Variationist Perspective on Feature Encoding andEnsemble Optimization. In Proceedings of COLING2014, the 25th International Conference on Computa-tional Linguistics: Technical Papers, pages 1962–1973,Dublin, Ireland, August. Dublin City University andAssociation for Computational Linguistics.
Serhiy Bykh, Sowmya Vajjala, Julia Krivanek, and DetmarMeurers. 2013. Combining Shallow and LinguisticallyMotivated Features in Native Language Identification.In Proceedings of the Eighth Workshop on InnovativeUse of NLP for Building Educational Applications,pages 197–206, Atlanta, Georgia, June. Associationfor Computational Linguistics.
Eugene Charniak and Mark Johnson. 2005. Coarse-to-fine n-best parsing and MaxEnt discriminative rerank-ing. In Proceedings of the 43rd Annual Meeting onAssociation for Computational Linguistics, pages 173–180. Association for Computational Linguistics.
Andrea Cimino, Felice Dell’Orletta, Giulia Venturi, andSimonetta Montemagni. 2013. Linguistic Profilingbased on General–purpose Features and Native Lan-guage Identification. In Proceedings of the EighthWorkshop on Innovative Use of NLP for Building Edu-cational Applications, pages 207–215, Atlanta, Geor-gia, June. Association for Computational Linguistics.
Cyril Goutte, Serge Leger, and Marine Carpuat. 2013.Feature Space Selection and Combination for NativeLanguage Identification. In Proceedings of the EighthWorkshop on Innovative Use of NLP for Building Edu-cational Applications, pages 96–100, Atlanta, Georgia,June. Association for Computational Linguistics.
Radu Tudor Ionescu, Marius Popescu, and Aoife Cahill.2014. Can characters reveal your native language?a language-independent approach to native languageidentification. In Proceedings of the 2014 Conferenceon Empirical Methods in Natural Language Processing(EMNLP), pages 1363–1373, Doha, Qatar, October.Association for Computational Linguistics.
Scott Jarvis, Yves Bestgen, and Steve Pepper. 2013. Max-imizing Classification Accuracy in Native LanguageIdentification. In Proceedings of the Eighth Workshopon Innovative Use of NLP for Building EducationalApplications, pages 111–118, Atlanta, Georgia, June.Association for Computational Linguistics.
Ludmila I Kuncheva, James C Bezdek, and Robert PWDuin. 2001. Decision templates for multiple classifierfusion: an experimental comparison. Pattern Recogni-tion, 34(2):299–314.
Ludmila I Kuncheva, Christopher J Whitaker, Catherine AShipp, and Robert PW Duin. 2003. Limits on themajority vote accuracy in classifier fusion. PatternAnalysis & Applications, 6(1):22–31.
Ludmila I Kuncheva. 2002. A theoretical study on sixclassifier fusion strategies. IEEE Transactions on pat-tern analysis and machine intelligence, 24(2):281–286.
Shervin Malmasi and Aoife Cahill. 2015. MeasuringFeature Diversity in Native Language Identification. InProceedings of the Tenth Workshop on Innovative Useof NLP for Building Educational Applications, Den-ver, Colorado, June. Association for ComputationalLinguistics.
Shervin Malmasi and Mark Dras. 2014. Language Trans-fer Hypotheses with Linear SVM Weights. In Proceed-ings of the 2014 Conference on Empirical Methods inNatural Language Processing (EMNLP), Doha, Qatar,October. Association for Computational Linguistics.
Shervin Malmasi, Sze-Meng Jojo Wong, and Mark Dras.2013. NLI Shared Task 2013: MQ Submission. InProceedings of the Eighth Workshop on Innovative Useof NLP for Building Educational Applications, pages124–133, Atlanta, Georgia, June. Association for Com-putational Linguistics.
Christopher D Manning, Prabhakar Raghavan, and Hin-rich Schutze. 2008. Evaluation in information retrieval.In Introduction to Information Retrieval, pages 151–175. Cambridge university press Cambridge.
Robi Polikar. 2006. Ensemble based systems in decisionmaking. Circuits and systems magazine, IEEE, 6(3):21–45.
Rion Snow, Brendan O’Connor, Daniel Jurafsky, and An-drew Ng. 2008. Cheap and Fast – But is it Good?Evaluating Non-Expert Annotations for Natural Lan-guage Tasks. In Proceedings of the 2008 Conferenceon Empirical Methods in Natural Language Processing,pages 254–263, Honolulu, Hawaii, October. Associa-tion for Computational Linguistics.
Joel Tetreault, Daniel Blanchard, Aoife Cahill, and MartinChodorow. 2012. Native Tongues, Lost and Found: Re-sources and Empirical Evaluations in Native LanguageIdentification. In Proceedings of COLING 2012, pages2585–2602, Mumbai, India, December. The COLING2012 Organizing Committee.
177

Joel Tetreault, Daniel Blanchard, and Aoife Cahill. 2013.A Report on the First Native Language IdentificationShared Task. In Proceedings of the Eighth Workshopon Innovative Use of NLP for Building EducationalApplications, pages 48–57, Atlanta, Georgia, June. As-sociation for Computational Linguistics.
178
Proceedings of the Tenth Workshop on Innovative Use of NLP for Building Educational Applications, 2015, pages 179–189,Denver, Colorado, June 4, 2015. c©2015 Association for Computational Linguistics
Using PEGWriting® to Support the Writing Motivation and Writing
Quality of Eighth-Grade Students: A Quasi-Experimental Study
Joshua Wilson
University of Delaware
213E Willard Hall
Newark, DE 19716
Trish Martin
Measurement Incorporated
423 Morris Street
Durham, NC 27701
Abstract A quasi-experimental study compared the effects
of feedback condition on eighth-grade students’
writing motivation and writing achievement. Four
classes of eighth-graders were assigned to a
combined feedback condition in which they
received feedback on their writing from their
teacher and from an automated essay evaluation
(AEE) system called PEGWriting®. Four other
eighth-grade classes were assigned to a teacher
feedback condition, in which they solely received
feedback from their teacher via GoogleDocs.
Results indicated that students in the combined
PEGWriting+Teacher Feedback condition
received feedback more quickly and indicated that
they were more likely to solve problems in their
writing. Equal writing quality was achieved
between feedback groups even though teachers in
the PEGWriting condition spent less time
providing feedback to students than in the
GoogleDocs condition. Results suggest that
PEGWriting enabled teachers to offload certain
aspects of the feedback process and promoted
greater independence and persistence for students.
1. Introduction
In the 21st century, possessing strong writing skills
is essential for success in K-12 education, college
acceptance and completion, and stable gainful
employment (National Commission on Writing,
2004, 2005). Yet, more than two-thirds of students
in grades four, eight, and twelve fail to achieve
grade-level proficiency in writing, as indicated by
recent performance on the National Assessment of
Educational Progress (NCES, 2012; Salahu-Din,
Persky, & Miller, 2008). Without sufficient writing
skills, students are at-risk of performing worse in
school, suffering lower grades, and experiencing
school dropout (Graham & Perin, 2007).
One effective method for improving students’
writing skills is providing instructional feedback
(Graham, McKeown, Kiuhara, & Harris, 2012;
Graham & Perin, 2007). Struggling writers, in
particular, need targeted instructional feedback
because they tend to produce shorter, less-
developed, and more error-filled texts than their
peers (Troia, 2006). However, instructional
feedback is often difficult and time-consuming for
teachers to provide. Indeed, educators in the
primary and secondary grades report that the time-
costs of evaluating writing are so prohibitive that
they rarely assign more than one or two paragraphs
of writing (Cutler & Graham, 2008; Kiuhara,
Graham, & Hawken, 2009). Consequently,
educators are increasingly relying on automated
essay evaluation (AEE) systems (Warschauer &
Grimes, 2008) to provide students with immediate
feedback in the form of essay ratings and
individualized suggestions for improving an
essay—i.e., automated feedback.
Previous research on AEE indicates that, in
isolation of teacher feedback, automated feedback
appears to support modest improvements in
students’ writing quality. Findings from studies of
ETS’s Criterion® (Kellogg, Whiteford, & Quinlan;
Shermis, Wilson Garvan, & Diao, 2008), Pearson’s
Summary Street (Franzke, Kintsch, Caccamise,
Johnson, & Dooley, 2005; Wade-Stein & Kintsch,
2004), and Measurement Incorporated’s
PEGWriting® system (Wilson & Andrada, in press;
Wilson, Olinghouse, & Andrada, 2014), indicate
that automated feedback assists students in
improving the overall quality of their essays while
concomitantly reducing the frequency of their
mechanical errors.
Less research has explored the effects of AEE
on writing motivation. However, in two studies,
Warschauer and Grimes (2008; 2010), found that
179
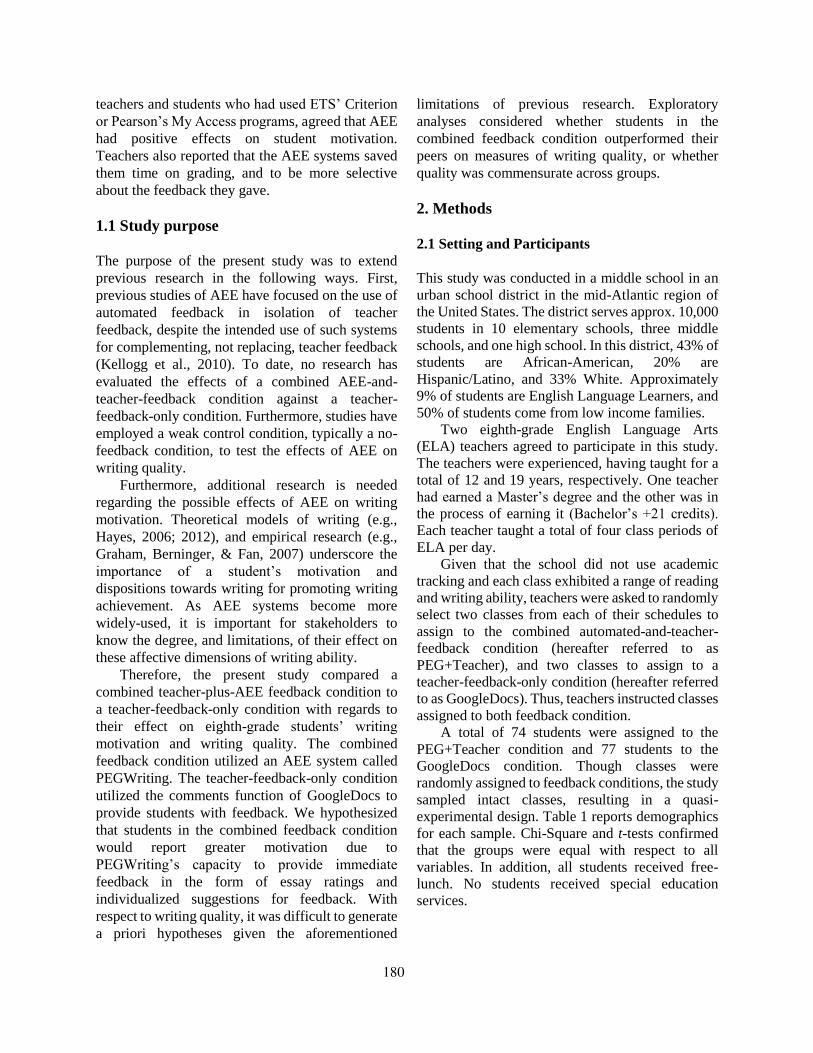
teachers and students who had used ETS’ Criterion
or Pearson’s My Access programs, agreed that AEE
had positive effects on student motivation.
Teachers also reported that the AEE systems saved
them time on grading, and to be more selective
about the feedback they gave.
1.1 Study purpose
The purpose of the present study was to extend
previous research in the following ways. First,
previous studies of AEE have focused on the use of
automated feedback in isolation of teacher
feedback, despite the intended use of such systems
for complementing, not replacing, teacher feedback
(Kellogg et al., 2010). To date, no research has
evaluated the effects of a combined AEE-and-
teacher-feedback condition against a teacher-
feedback-only condition. Furthermore, studies have
employed a weak control condition, typically a no-
feedback condition, to test the effects of AEE on
writing quality.
Furthermore, additional research is needed
regarding the possible effects of AEE on writing
motivation. Theoretical models of writing (e.g.,
Hayes, 2006; 2012), and empirical research (e.g.,
Graham, Berninger, & Fan, 2007) underscore the
importance of a student’s motivation and
dispositions towards writing for promoting writing
achievement. As AEE systems become more
widely-used, it is important for stakeholders to
know the degree, and limitations, of their effect on
these affective dimensions of writing ability.
Therefore, the present study compared a
combined teacher-plus-AEE feedback condition to
a teacher-feedback-only condition with regards to
their effect on eighth-grade students’ writing
motivation and writing quality. The combined
feedback condition utilized an AEE system called
PEGWriting. The teacher-feedback-only condition
utilized the comments function of GoogleDocs to
provide students with feedback. We hypothesized
that students in the combined feedback condition
would report greater motivation due to
PEGWriting’s capacity to provide immediate
feedback in the form of essay ratings and
individualized suggestions for feedback. With
respect to writing quality, it was difficult to generate
a priori hypotheses given the aforementioned
limitations of previous research. Exploratory
analyses considered whether students in the
combined feedback condition outperformed their
peers on measures of writing quality, or whether
quality was commensurate across groups.
2. Methods
2.1 Setting and Participants
This study was conducted in a middle school in an
urban school district in the mid-Atlantic region of
the United States. The district serves approx. 10,000
students in 10 elementary schools, three middle
schools, and one high school. In this district, 43% of
students are African-American, 20% are
Hispanic/Latino, and 33% White. Approximately
9% of students are English Language Learners, and
50% of students come from low income families.
Two eighth-grade English Language Arts
(ELA) teachers agreed to participate in this study.
The teachers were experienced, having taught for a
total of 12 and 19 years, respectively. One teacher
had earned a Master’s degree and the other was in
the process of earning it (Bachelor’s +21 credits).
Each teacher taught a total of four class periods of
ELA per day.
Given that the school did not use academic
tracking and each class exhibited a range of reading
and writing ability, teachers were asked to randomly
select two classes from each of their schedules to
assign to the combined automated-and-teacher-
feedback condition (hereafter referred to as
PEG+Teacher), and two classes to assign to a
teacher-feedback-only condition (hereafter referred
to as GoogleDocs). Thus, teachers instructed classes
assigned to both feedback condition.
A total of 74 students were assigned to the
PEG+Teacher condition and 77 students to the
GoogleDocs condition. Though classes were
randomly assigned to feedback conditions, the study
sampled intact classes, resulting in a quasi-
experimental design. Table 1 reports demographics
for each sample. Chi-Square and t-tests confirmed
that the groups were equal with respect to all
variables. In addition, all students received free-
lunch. No students received special education
services.
180

PEG +
Teacher GoogleDocs
Gender (n)
Male 41 38
Female 33 39
Race (n)
Hispanic/Latino 20 20
African
American 31 24
White 22 30
Asian 1 1
Unreported 0 2
ELL (n) 2 0
Age (months)
M 169.03 169.51
SD 5.90 4.90
Table 1: Demographics of Study Participants
2.2 Description of PEGWriting
PEGWriting is a web-based formative writing
assessment program developed by Measurement
Incorporated (MI). It is designed to provide students
and teachers with an efficient and reliable method
of scoring student writing in order to promote
students’ writing skills.
PEGWriting is built around an automated essay
scoring engine called PEG, or Project Essay Grade.
PEG was developed by Ellis Batten Page (Page,
1966; 1994; 2003) and acquired by MI in 2002. PEG
uses a combination of techniques such as natural
language processing, syntactic analysis, and
semantic analysis to measure more than 500
variables that are combined in a regression-based
algorithm that predicts human holistic and analytic
essay ratings. A number of empirical studies have
established the reliability and criterion validity of
PEG’s essay ratings (Kieth, 2003; Shermis, 2014;
Shermis, Koch, Page, Keith, & Harrington, 2002).
Students and teachers access PEGWriting by
visiting www.pegwriting.com and inputting their
individual username and passwords. Teachers can
assign system-created prompts in narrative,
argumentative, or informative genres. They can also
create and embed their own prompts, which can use
words, documents, images, videos, or even music as
stimuli.
Once a prompt is assigned, students can select
from several embedded graphic organizers to
support their brainstorming and prewriting
activities. After prewriting, students have up to 60
minutes to complete and submit their drafts for
evaluation by PEG. Once submitted, students
immediately receive essay ratings for six traits of
writing ability: idea development, organization,
style, sentence structure, word choice, and
conventions. Each of these traits is scored on a 1-5
scale and combined to form an Overall Score
ranging from 6-30. In addition, students receive
feedback on grammar and spelling, as well as trait-
specific feedback that encourages students to review
and evaluate their text with regard to the features of
that specific trait. Students also receive customized
links to PEGWriting’s skill-building mini-lessons.
These lessons are multimedia interactive lessons on
specific writing skills such as elaboration,
organization, or sentence variety.
Once students receive their feedback, they may
revise and resubmit their essays up to a total of 99
times—the default limit is 30—and receive new
essay ratings, error corrections, and trait-specific
feedback. Teachers are also able to provide students
with feedback by embedding comments within the
students’ essays or through summary comments
located in a text box following the PEG-generated
trait-specific feedback. Students may also leave
comments for their teacher using a similar function.
2.3 Study Procedures
After classes were assigned to feedback conditions,
all students completed a pretest writing motivation
survey (Piazza & Siebert, 2008; see Section 2.4).
Then, teachers began instruction in their district-
assigned curriculum module on memoir writing.
Teachers introduced the key features of memoir
writing to all their classes. During this initial
instructional phase, students in the PEG+Teacher
condition were given an opportunity to learn how to
use PEGWriting. Earlier in the school year, the first
author trained the two teachers on the use
PEGWriting during three 30 minute training
sessions. Then, teachers subsequently trained their
students how to use the program in one 45 minute
class period following completion of the pretest
writing motivation survey.
Teachers then assigned their district-created
writing prompt for the memoir unit, which read:
We have all had interesting life experiences.
Some are good, funny, or exciting, while
181

others are bad, sad, or devastating. Choose
one experience from your life and tell the
story. Once you have chosen your topic, you
may choose to turn it into a scary story,
drama, elaborate fiction, science fiction,
comedy, or just tell it how it is. Be sure to
organize your story and elaborate on your
details. Your audience wasn’t there so you
need to tell them every little detail.
Students then proceeded to brainstorm,
organize their ideas, and draft their memoirs using
the technology available to them. Students in the
PEG+Teacher condition used the built-in graphic
organizers to plan out their memoirs. Students in
the GoogleDocs condition used teacher-provided
graphic organizers. Subsequent class periods were
devoted to drafting, revising, and editing the
memoirs. During this time, teachers delivered
mini-lessons on features of memoir writing such as
“Show, not tell,” “Using dialogue in memoirs,”
and “Using transitions.” Both teachers kept a log
of their instructional activities, documenting that
they delivered the same instruction as each other
and to each of the classes they taught.
Teachers were instructed to review and
provide feedback on their students’ writing a
minimum of one, and a maximum of two times,
across both conditions. Teachers were allowed to
provide feedback as they normally would,
commenting on those aspects of students’ text
which they deemed necessary. They gave feedback
to students in the GoogleDocs condition by (a)
directly editing students’ texts, and (b) providing
comments similar to the comment feature in
Microsoft Word. Since students in the
PEG+Teacher feedback condition were already
receiving feedback from PEG, teachers could
supplement the feedback with additional
comments as they deemed necessary. Feedback
was delivered in the form of embedded comments
(similar to the GoogleDocs condition) and in the
form of summary comments. Students in this
condition were allowed to receive as much
feedback from PEG as they wished by revising and
resubmitting their memoir to PEG for evaluation.
But, the amount of teacher feedback was held
constant across conditions.
At the conclusion of the instructional period
(approx. three weeks), students submitted the final
drafts of their memoir. Then, students were
administered a post-test writing motivation survey
that mirrored the initial survey with additional
items that specifically asked about their
perceptions of the feedback they received.
Teachers also completed a brief survey regarding
their experiences providing feedback via
PEGWriting and GoogleDocs.
2.4 Study Measures
Writing Motivation was assessed using the Writing
Disposition Scale (WDS; Piazza & Siebert, 2008),
which consisted of 11 Likert-scale items that are
combined to form three subscales measuring the
constructs of confidence, persistence, and passion.
Cronbach’s Alpha was reported as .89 for the entire
instrument, and .81, .75, and .91, respectively for
the three subscales (Piazza & Siebert, 2008). The
WDS was administered at pretest and at posttest.
The posttest administration of the WDS also include
additional researcher-developed items asking
students to share their perceptions of the feedback
they received. These items included Likert-scale
ratings followed by an open-ended response option.
Writing quality was assessed using the PEG
Overall Score, PEG trait scores, and teacher grades.
Details on the PEG Overall Score and the PEG trait
scores are found in Section 2.2. Teacher grades were
generated by using a primary trait narrative rubric
developed by the local school district. The rubric
evaluated ten traits of personal narrative writing,
each on a 0-10 scale. Final grades were assigned by
totaling students’ scores on each of the ten traits
(range: 0-100). Traits assessed included: the
presence of a compelling introduction; logical
organization; establishment of a setting, narrator,
and point of view; effective conclusion which
reflects on the life event; sufficient details and
description; effective use of figurative language and
dialogue; presence of accurate sentence structure;
strong and vivid word choice; and absence of errors
of spelling, punctuation, and usage.
2.5 Data Analysis
Non-parametric analyses were used to estimate
differences between feedback conditions on
individual items of the Writing Dispositions Scale
(WDS). A series of one-way analysis of variance
(ANOVA) were used to estimate differences
between groups on the Confidence, Persistence, and
182
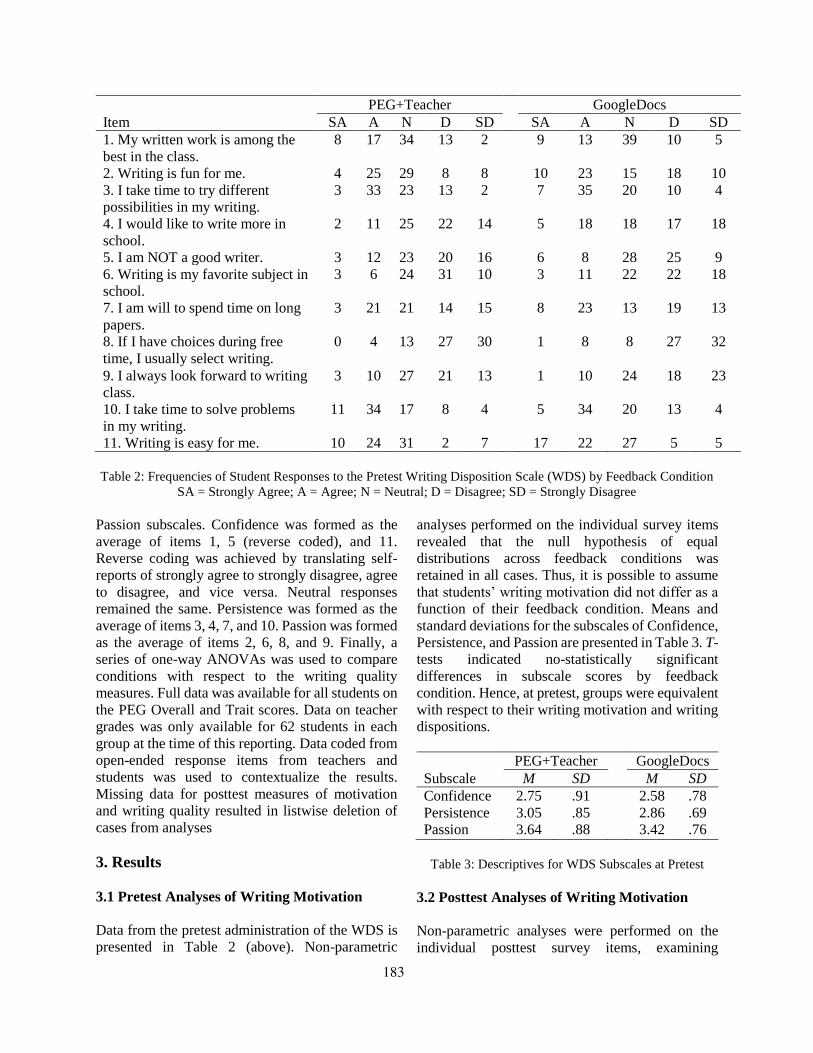
PEG+Teacher GoogleDocs
Item SA A N D SD SA A N D SD
1. My written work is among the
best in the class.
8 17 34 13 2 9 13 39 10 5
2. Writing is fun for me. 4 25 29 8 8 10 23 15 18 10
3. I take time to try different
possibilities in my writing.
3 33 23 13 2 7 35 20 10 4
4. I would like to write more in
school.
2 11 25 22 14 5 18 18 17 18
5. I am NOT a good writer. 3 12 23 20 16 6 8 28 25 9
6. Writing is my favorite subject in
school.
3 6 24 31 10 3 11 22 22 18
7. I am will to spend time on long
papers.
3 21 21 14 15 8 23 13 19 13
8. If I have choices during free
time, I usually select writing.
0 4 13 27 30 1 8 8 27 32
9. I always look forward to writing
class.
3 10 27 21 13 1 10 24 18 23
10. I take time to solve problems
in my writing.
11 34 17 8 4 5 34 20 13 4
11. Writing is easy for me. 10 24 31 2 7 17 22 27 5 5
Table 2: Frequencies of Student Responses to the Pretest Writing Disposition Scale (WDS) by Feedback Condition
SA = Strongly Agree; A = Agree; N = Neutral; D = Disagree; SD = Strongly Disagree
Passion subscales. Confidence was formed as the
average of items 1, 5 (reverse coded), and 11.
Reverse coding was achieved by translating self-
reports of strongly agree to strongly disagree, agree
to disagree, and vice versa. Neutral responses
remained the same. Persistence was formed as the
average of items 3, 4, 7, and 10. Passion was formed
as the average of items 2, 6, 8, and 9. Finally, a
series of one-way ANOVAs was used to compare
conditions with respect to the writing quality
measures. Full data was available for all students on
the PEG Overall and Trait scores. Data on teacher
grades was only available for 62 students in each
group at the time of this reporting. Data coded from
open-ended response items from teachers and
students was used to contextualize the results.
Missing data for posttest measures of motivation
and writing quality resulted in listwise deletion of
cases from analyses
3. Results
3.1 Pretest Analyses of Writing Motivation
Data from the pretest administration of the WDS is
presented in Table 2 (above). Non-parametric
analyses performed on the individual survey items
revealed that the null hypothesis of equal
distributions across feedback conditions was
retained in all cases. Thus, it is possible to assume
that students’ writing motivation did not differ as a
function of their feedback condition. Means and
standard deviations for the subscales of Confidence,
Persistence, and Passion are presented in Table 3. T-
tests indicated no-statistically significant
differences in subscale scores by feedback
condition. Hence, at pretest, groups were equivalent
with respect to their writing motivation and writing
dispositions.
PEG+Teacher GoogleDocs
Subscale M SD M SD
Confidence 2.75 .91 2.58 .78
Persistence 3.05 .85 2.86 .69
Passion 3.64 .88 3.42 .76
Table 3: Descriptives for WDS Subscales at Pretest
3.2 Posttest Analyses of Writing Motivation
Non-parametric analyses were performed on the
individual posttest survey items, examining
183
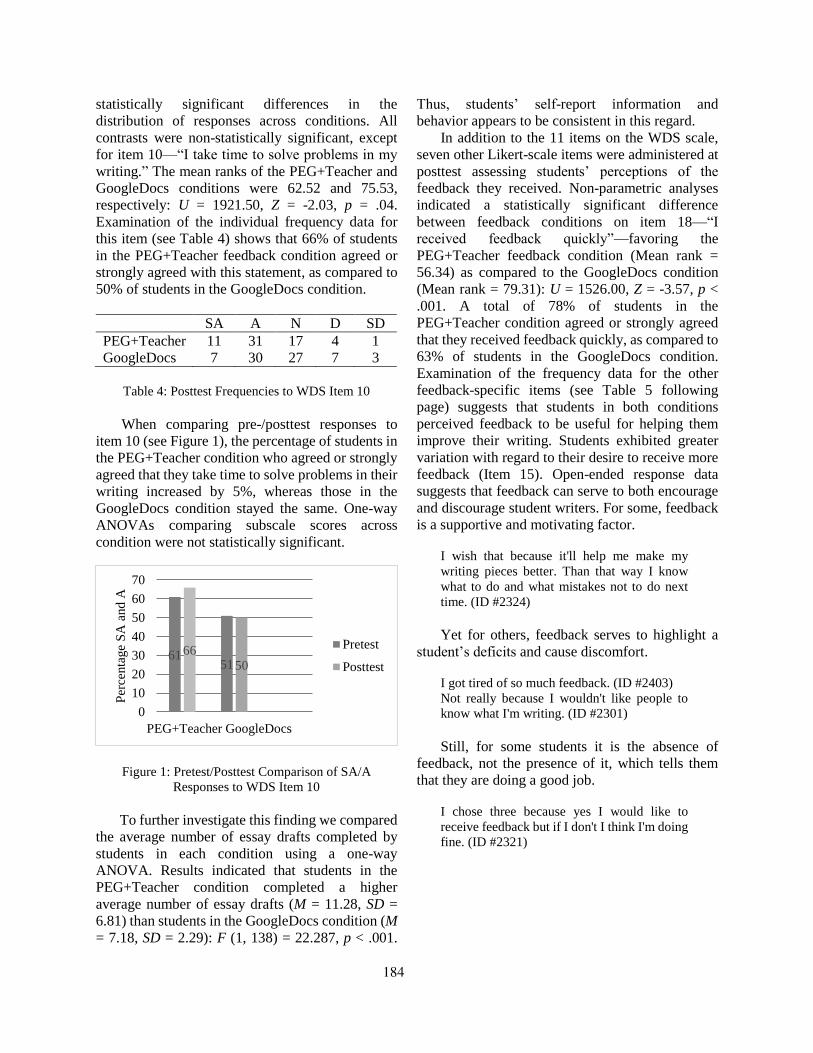
statistically significant differences in the
distribution of responses across conditions. All
contrasts were non-statistically significant, except
for item 10—“I take time to solve problems in my
writing.” The mean ranks of the PEG+Teacher and
GoogleDocs conditions were 62.52 and 75.53,
respectively: U = 1921.50, Z = -2.03, p = .04.
Examination of the individual frequency data for
this item (see Table 4) shows that 66% of students
in the PEG+Teacher feedback condition agreed or
strongly agreed with this statement, as compared to
50% of students in the GoogleDocs condition.
SA A N D SD
PEG+Teacher 11 31 17 4 1
GoogleDocs 7 30 27 7 3
Table 4: Posttest Frequencies to WDS Item 10
When comparing pre-/posttest responses to
item 10 (see Figure 1), the percentage of students in
the PEG+Teacher condition who agreed or strongly
agreed that they take time to solve problems in their
writing increased by 5%, whereas those in the
GoogleDocs condition stayed the same. One-way
ANOVAs comparing subscale scores across
condition were not statistically significant.
Figure 1: Pretest/Posttest Comparison of SA/A
Responses to WDS Item 10
To further investigate this finding we compared
the average number of essay drafts completed by
students in each condition using a one-way
ANOVA. Results indicated that students in the
PEG+Teacher condition completed a higher
average number of essay drafts (M = 11.28, SD =
6.81) than students in the GoogleDocs condition (M
= 7.18, SD = 2.29): F (1, 138) = 22.287, p < .001.
Thus, students’ self-report information and
behavior appears to be consistent in this regard.
In addition to the 11 items on the WDS scale,
seven other Likert-scale items were administered at
posttest assessing students’ perceptions of the
feedback they received. Non-parametric analyses
indicated a statistically significant difference
between feedback conditions on item 18—“I
received feedback quickly”—favoring the
PEG+Teacher feedback condition (Mean rank =
56.34) as compared to the GoogleDocs condition
(Mean rank = 79.31): U = 1526.00, Z = -3.57, p <
.001. A total of 78% of students in the
PEG+Teacher condition agreed or strongly agreed
that they received feedback quickly, as compared to
63% of students in the GoogleDocs condition.
Examination of the frequency data for the other
feedback-specific items (see Table 5 following
page) suggests that students in both conditions
perceived feedback to be useful for helping them
improve their writing. Students exhibited greater
variation with regard to their desire to receive more
feedback (Item 15). Open-ended response data
suggests that feedback can serve to both encourage
and discourage student writers. For some, feedback
is a supportive and motivating factor.
I wish that because it'll help me make my
writing pieces better. Than that way I know
what to do and what mistakes not to do next
time. (ID #2324)
Yet for others, feedback serves to highlight a
student’s deficits and cause discomfort.
I got tired of so much feedback. (ID #2403)
Not really because I wouldn't like people to
know what I'm writing. (ID #2301)
Still, for some students it is the absence of
feedback, not the presence of it, which tells them
that they are doing a good job.
I chose three because yes I would like to
receive feedback but if I don't I think I'm doing
fine. (ID #2321)
6151
66
50
0
10
20
30
40
50
60
70
Per
centa
ge
SA
and
A
PEG+Teacher GoogleDocs
Pretest
Posttest
184
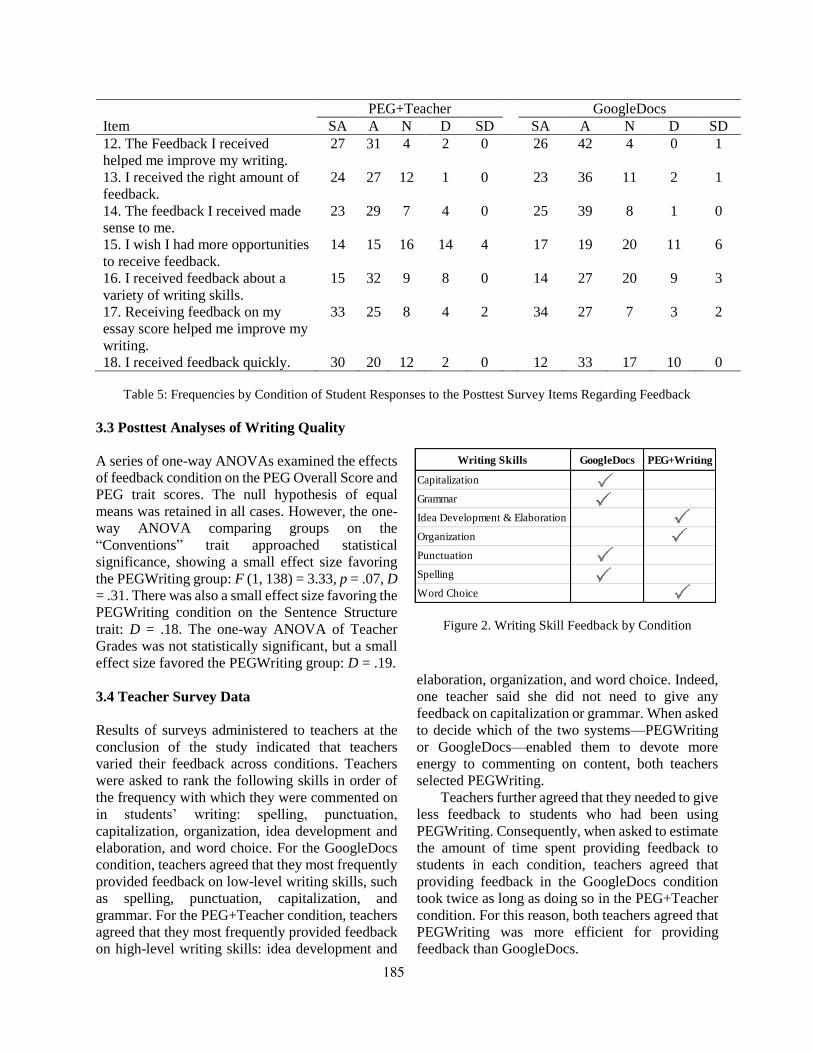
Table 5: Frequencies by Condition of Student Responses to the Posttest Survey Items Regarding Feedback
3.3 Posttest Analyses of Writing Quality
A series of one-way ANOVAs examined the effects
of feedback condition on the PEG Overall Score and
PEG trait scores. The null hypothesis of equal
means was retained in all cases. However, the one-
way ANOVA comparing groups on the
“Conventions” trait approached statistical
significance, showing a small effect size favoring
the PEGWriting group: F (1, 138) = 3.33, p = .07, D
= .31. There was also a small effect size favoring the
PEGWriting condition on the Sentence Structure
trait: D = .18. The one-way ANOVA of Teacher
Grades was not statistically significant, but a small
effect size favored the PEGWriting group: D = .19.
Figure 2. Writing Skill Feedback by Condition
3.4 Teacher Survey Data
Results of surveys administered to teachers at the
conclusion of the study indicated that teachers
varied their feedback across conditions. Teachers
were asked to rank the following skills in order of
the frequency with which they were commented on
in students’ writing: spelling, punctuation,
capitalization, organization, idea development and
elaboration, and word choice. For the GoogleDocs
condition, teachers agreed that they most frequently
provided feedback on low-level writing skills, such
as spelling, punctuation, capitalization, and
grammar. For the PEG+Teacher condition, teachers
agreed that they most frequently provided feedback
on high-level writing skills: idea development and
elaboration, organization, and word choice. Indeed,
one teacher said she did not need to give any
feedback on capitalization or grammar. When asked
to decide which of the two systems—PEGWriting
or GoogleDocs—enabled them to devote more
energy to commenting on content, both teachers
selected PEGWriting.
Teachers further agreed that they needed to give
less feedback to students who had been using
PEGWriting. Consequently, when asked to estimate
the amount of time spent providing feedback to
students in each condition, teachers agreed that
providing feedback in the GoogleDocs condition
took twice as long as doing so in the PEG+Teacher
condition. For this reason, both teachers agreed that
PEGWriting was more efficient for providing
feedback than GoogleDocs.
PEG+Teacher GoogleDocs
Item SA A N D SD SA A N D SD
12. The Feedback I received
helped me improve my writing.
27 31 4 2 0 26 42 4 0 1
13. I received the right amount of
feedback.
24 27 12 1 0 23 36 11 2 1
14. The feedback I received made
sense to me.
23 29 7 4 0 25 39 8 1 0
15. I wish I had more opportunities
to receive feedback.
14 15 16 14 4 17 19 20 11 6
16. I received feedback about a
variety of writing skills.
15 32 9 8 0 14 27 20 9 3
17. Receiving feedback on my
essay score helped me improve my
writing.
33 25 8 4 2 34 27 7 3 2
18. I received feedback quickly. 30 20 12 2 0 12 33 17 10 0
Writing Skills GoogleDocs PEG+Writing
Capitalization
Grammar
Idea Development & Elaboration
Organization
Punctuation
Spelling
Word Choice
185

When asked to select which system was easier
for teachers and students to use, teachers agreed that
GoogleDocs was easier for teachers, but
PEGWriting and GoogleDocs were equally easy for
students to use. However, both teachers agreed that
PEGWriting was more motivating for students and
that it promoted greater student independence.
4. Discussion
This study was the first of its kind to compare the
effects of a combined automated feedback and
teacher feedback condition and a teacher-feedback-
only condition (GoogleDocs) on writing motivation
and writing quality. Students in the combined
feedback condition composed memoirs with the aid
of feedback from an AEE system called
PEGWriting® and their teacher (provided within
the environment of PEGWriting). Students in the
teacher-feedback-only condition composed their
texts using GoogleDocs which enabled their teacher
to edit their text and embed comments.
Based on prior research (Grimes & Warschauer,
2010; Warschauer & Grimes, 2008), we
hypothesized that students would report greater
writing motivation in the PEG+Teacher feedback
condition. However, we were unable to generate an
a priori hypothesis regarding the effects of feedback
condition on writing quality since prior research has
not contrasted feedback conditions in the manner
investigated in the current study.
With respect to writing motivation, our
hypothesis was partially confirmed. Students in the
PEG+Teacher feedback condition reported stronger
agreement with Item 10 of the WDS—“I take time
to solve problems in my writing”—than did students
in the GoogleDocs condition. This self-report data
was confirmed with a statistically significant
difference, favoring the PEG+Teacher feedback
condition, in the number of drafts students
completed. However, effects on broader constructs
of writing motivation—confidence, persistence, and
passion—were not found. This may have been due,
in part, to the duration of the study. The study
spanned just over three weeks; hence, it is likely that
additional exposure and engagement with
PEGWriting is needed to register effects on these
broader constructs.
Nevertheless, it is encouraging that students
reported greater agreement with Item 10. Revision
is a challenging and cognitively-demanding task
(Flower & Hayes, 1980; Hayes, 2012), requiring
students to re-read, evaluate, diagnose, and select
the appropriate action to repair the problem. Many
struggling writers lack the motivation to engage in
this process, and consequently make few revisions
to their text (MacArthur, Graham, & Schwartz,
1991; Troia, 2006). Perhaps, the use of an AEE
system, such as PEGWriting, provides sufficient
motivation for students to persist in the face of the
substantial cognitive demands of revision. Future
research should explore the use of AEE systems
over extended timeframes. It may be possible that
these initial gains in persistence are leveraged to
increase writing motivation more broadly.
With respect to writing quality, results showed
no statistically significant differences between
conditions for the PEG Overall Score or PEG trait
scores. While on this surface this may appear to
indicate that the feedback provided by PEGWriting
yielded no value-added over simply receiving
teacher feedback in the form of edits and comments
via GoogleDocs, we do not believe this to be the
case.
First, though AEE systems are designed and
marketed as supporting and complementing teacher
feedback, previous research has solely examined the
use of automated feedback in isolation from teacher
feedback. Furthermore, prior studies have typically
employed weak control conditions, such as a no-
feedback condition (Kellogg et al., 2010) or a
spelling-and-text-length condition (Franzke et al.,
2005; Wade-Stein & Kintsch, 2004). While these
studies provide important initial evidence of the
effects of automated feedback and AEE, their
design lacks ecological validity as they do not
reflect the intended use of such systems. Lack of
statistically significant effects on our measures of
writing quality may simply be due to the presence
of a stronger counterfactual. Thus, the presence of a
stronger control condition in our study should not
be confused with absence of value-added.
Second, results from the additional posttest
survey items administered to students (see Table 5)
and from the survey administered to teachers may
point to where the value added by AEE. The
provision of immediate feedback in the form of
essay ratings, error correction, and trait-specific
feedback appears to have enabled students to
increase their persistence and independence in
solving problems in their writing. Consequently,
teachers spent half the amount of time providing
186

feedback to students as they did to students in the
GoogleDocs condition. Moreover, the use of
PEGWriting enabled teachers to devote attention to
higher-level skills such as idea development and
elaboration, organization, and word choice, while
offloading feedback on lower-level skills to the
AEE system.
Thus, the value-added of PEGWriting appears
to be its ability to promote an equivalent level of
writing quality as is achieved using a more time
consuming and effortful method of providing
feedback (i.e., teacher-feedback-only). In other
words, by enabling teachers to be more selective
and focused in their comments, PEGWriting saved
teachers time and effort without sacrificing the
quality of students’ writing. Forthcoming analyses
will determine whether this hypothesis holds true
across other measures of writing quality.
4.1 Limitations and Future Research
Study findings and implications must be interpreted
in light of the following limitations. First, though
teachers randomly assigned classes to feedback
conditions, in absence of a pretest measure of
writing ability it is not possible to test whether
groups were truly equivalent in terms of prior
writing ability. Nevertheless, the pretest measure of
writing motivation indicated equivalence across
conditions with regards to specific writing
dispositions and subscales of confidence,
persistence, and passion. It is likely, that if one
condition exhibited significantly greater writing
achievement this would also have been reflected in
the disposition ratings (see Graham et al., 2007).
Second, the study examined the effects of
feedback on just a single writing assignment:
memoir writing. Furthermore, the prompt allowed
for substantial student choice, both in terms of the
content of their memoir and the form. Students had
the freedom to turn their memoir into a comedy, a
drama, a science fiction story, or simply recount the
events as they happened. It is unclear whether
similar results would have been found had a prompt
been assigned that was more restrictive in terms of
student choice and that placed greater demands on
students in terms of background knowledge. Given
the literature on prompt and task effects in writing
(Baker, Abedi, Linn, & Niemi, 1995; Chen, Niemi,
Wang, Wang, & Mirocha, 2007), it is important that
future research attempt to replicate results across
different writing tasks.
Finally, the sample was drawn from classes
taught by two teachers in a single middle school in
a school district in the mid-Atlantic region of the
United States. Therefore, it is unclear the degree to
which study results reflect generalizable or local
trends. Nonetheless, study findings on the utility of
AEE are consistent with prior research which has
used much larger samples (Warschauer & Grimes,
2008). Further, since the study utilized a novel
design—comparing a combined AEE and teacher
feedback condition to teacher-feedback-only
condition—it is logical to initially test the design
using smaller samples. Future research should seek
to utilize similar feedback conditions in larger
samples.
5. Conclusion
The increasing application of AEE in classroom
settings necessitates careful understanding of its
effects on students’ writing motivation and writing
quality. Research should continue to illustrate
methods of how AEE can complement, not replace,
teacher instruction and teacher feedback. The
current study provides initial evidence that when
such a combination occurs, teachers save time and
effort and they provide greater amounts of feedback
relating to students’ content and ideas. In addition,
students receive feedback more quickly, report
increases in their persistence to solve problems in
their writing. In sum, AEE may afford the
opportunity to shift the balance of energy from
teachers to students without sacrificing the final
quality of students’ writing.
Acknowledgements
This research was supported in part by a Delegated
Authority contract from Measurement
Incorporated® to University of Delaware
(EDUC432914).
187

References
Baker, E. L., Abedi, J., Linn, R. L., & Niemi, D. (1995).
Dimensionality and generalizability of domain
independent performance assessments. Journal of
Educational Research, 89(4), 197-205.
Chen, E., Niemie, D., Wang, J., Wang, H., & Mirocha,
J. (2007). Examining the generalizability of direct
writing assessment tasks. CSE Technical Report 718.
Los Angeles, CA: National Center for Research on
Evaluation, Standards, and Student Testing
(CRESST).
Cutler, L., & Graham, S. (2008). Primary grade writing
instruction: A national survey. Journal of
Educational Psychology, 100, 907-919.
Flower, L. S., & Hayes, J. R. (1980). The dynamics of
composing: making plans and juggling constraints.
In L.W. Gregg, & E.R. Sternberg (Eds.), Cognitive
processes in writing (pp. 3- 29). Hillsdale, NJ:
Lawrence Erlbaum Associates.
Franzke, M., Kintsch, E., Caccamise, D., Johnson, N.,
and Dooley, S. (2005). Summary Street®: Computer
support for comprehension and writing. Journal of
Educational Computing Research, 33, 53–80
Graham, S., Berninger, V., & Fan, W. (2007). The
structural relationship between writing attitude and
writing achievement in first and third grade students.
Contemporary Educational Psychology, 32(3), 516-
536.
Graham, S., McKeown, D., Kiuhara, S., & Harris, K. R.
(2012). A meta-analysis of writing instruction for
students in the elementary grades. Journal of
Educational Psychology, 104, 879-896.
Graham, S., & Perin, D. (2007). Writing next: Effective
strategies to improve writing of adolescents in
middle and high schools – A report to Carnegie
Corporation of New York. Washington, DC:
Alliance for Excellent Education.
Grimes, D. & Warschauer, M. (2010). Utility in a
fallible tool: A multi-site case study of automated
writing evaluation. Journal of Technology, Learning,
and Assessment, 8(6), 1-44. Retrieved December 12,
2014 from http://www.jtla.org.
Hayes, J. R. (2006). New directions in writing theory. In
C. MacArthur, S. Graham, J. Fitzgerald (Eds.),
Handbook of writing research (pp. 28-40). New
York: Guilford Press.
Hayes, J. R. (2012). Modeling and remodeling writing.
Written Communication, 29(3), 369-388.
Keith, T. Z. (2003). Validity and automated essay
scoring systems. In M. D. Shermis, & J. C. Burstein
(Eds.), Automated essay scoring: A cross-
disciplinary perspective (pp.147-167). Mahwah, NJ:
Lawrence Erlbaum Associates, Inc.
Kellogg, R. T., Whiteford, A. P., & Quinlan, T. (2010).
Does automated feedback help students learn to
write? Journal of Educational Computing Research,
42(2), 173-196.
Kiuhara, S. A., Graham, S., & Hawken, L. S. (2009).
Teaching writing to high school students: A national
survey. Journal of Educational Psychology, 101,
136-160.
MacArthur, C. A., Graham, S., & Schwartz, S. (1991).
Knowledge of revision and revising behavior among
students with learning disabilities. Learning
Disability Quarterly, 14, 61-73.
McNamara, D.S., Louwerse, M.M., Cai, Z., & Graesser,
A. (2013). Coh-Metrix version 3.0. Retrieved from
http://cohmetrix.com.
National Center for Education Statistics (2012).The
Nation’s Report Card: Writing 2011(NCES 2012–
470). Institute of Education Sciences, U.S.
Department of Education, Washington, D.C.
National Commission on Writing for America’s
Families, Schools, and Colleges. (2004). Writing: A
ticket to work…or a ticket out. A survey of business
leaders. Iowa City, IA: The College Board.
National Commission on Writing for America’s
Families, Schools, and Colleges. (2005). Writing: A
powerful message from state government. Iowa City,
IA: The College Board.
Page, E. B. (1994). Computer grading of student prose,
using modern concepts and software. The Journal of
Experimental Education, 62(2), 127-142.
Page, E. B. (1966). The imminence of grading essays by
computer. Phi Delta Kappan, 48, 238-243.
Page, E. B. (2003). Project Essay Grade: PEG. In M. D.
Shermis, & J. C. Burstein (Eds.), Automated essay
scoring: A cross-disciplinary perspective (pp.43-54).
Mahwah, NJ: Lawrence Erlbaum Associates, Inc.
Piazza, C. L., & Siebert, C. F. (2008). Development and
validation of a writing dispositions scale for
elementary and middle school students. The Journal
of Educational Research, 101(5), 275-286.
Salahu-Din, D., Persky, H., and Miller, J. (2008). The
Nation’s Report Card: Writing 2007 (NCES 2008–
468). National Center for Education Statistics,
Institute of Education Sciences, U.S. Department of
Education, Washington, D.C.
Shermis, M. D. (2014). State-of-the-art automated essay
scoring: Competition, results, and future directions
from a United States demonstration. Assessing
Writing, 20, 53-76.
Shermis, M. D., Koch, C. M., Page, E. B., Keith, T. Z.,
& Harrington, S. (2002). Trait ratings for automated
essay grading. Educational and Psychological
Measurement, 62, 5-18.
Shermis, M. D., Wilson Garvan, C., & Diao, Y. (2008,
March). The impact of automated essay scoring on
writing outcomes. Paper presented at the annual
meeting of the National Council on Measurement in
Education, New York, NY.
188

Troia, G. A. (2006). Writing instruction for students
with learning disabilities. In C. A. MacArthur, S.
Graham, & J. Fitzgerald (Eds.), Handbook of
Writing Research (pp. 324-336. New York, NY:
Guilford.
Wade-Stein, D., & Kintsch, E. (2004). Summary Street:
Interactive computer support for writing. Cognition
and Instruction, 22, 333-362.
Warschauer, M., & Grimes, D. (2008). Automated
writing assessment in the classroom. Pedagogies: An
International Journal, 3, 22-36.
Wilson, J., & Andrada, G. N. (in press). Using
automated feedback to improve writing quality:
Opportunities and challenges. In In Y. Rosen, S.
Ferrara, & M. Mosharraf (Eds.), Handbook of
Research on Computational Tools for Real-World
Skill Development. IGI Global.
Wilson, J., Olinghouse N. G., & Andrada, G. N. (2014).
Does automated feedback improve writing quality?
Learning Disabilities: A Contemporary Journal, 12,
93-118.
189

Proceedings of the Tenth Workshop on Innovative Use of NLP for Building Educational Applications, 2015, pages 190–195,Denver, Colorado, June 4, 2015. c©2015 Association for Computational Linguistics
Towards Creating Pedagogic Views from Encyclopedic Resources
Ditty Mathew, Dhivya Eswaran, Sutanu Chakraborti
Department of Computer Science and EngineeringIndian Institute of Technology Madras
Chennai 600 036, India{ditty, dhivyae, sutanuc }@cse.iitm.ac.in
Abstract
This paper identifies computational challengesin restructuring encyclopedic resources (likeWikipedia or thesauri) to reorder conceptswith the goal of helping learners navigatethrough a concept network without gettingtrapped in circular dependencies between con-cepts. We present approaches that can helpcontent authors identify regions in the conceptnetwork, that after editing, would have maxi-mal impact in terms of enhancing the utility ofthe resource to learners.
1 Introduction
The digital age opens up the possibility of using amix of online resources for self-study. Not all ofthese resources have rich pedagogical content, tai-lored to suit the user’s learning goals. Therefore,while greedily looking out for pages of interest, alearner often finds a stop gap solution using a re-source like Wikipedia, but may need to put in sub-stantial effort to stitch together a set of content pagesto address her learning needs. In this paper, we dis-tinguish between two kinds of resources: encyclo-pedic and pedagogic. Encyclopedic resources likeWikipedia or thesauri have good reference value andbroad coverage, but are not necessarily structuredwith the goal of assisting learning of concepts. Anonline textbook, in contrast, is a pedagogic resourcein that it has its content organized to realize specifictutoring goals. However, textbooks in their currentform have definite limitations. Firstly, the contentis often not dynamic, and does not adapt to learnerrequirements. Second, unlike Wikipedia, textbooks
are often not collaboratively authored, some are ex-pensive, and many subjects have no structured learn-ing resources at all. This paper is motivated by thecentral question - ”How can we effectively createa pedagogic view of content from encyclopedic re-sources?”
At the current state of the art, it would be am-bitious to conceive of fully automated solutions tothis question. The more pragmatic goal would beto examine the extent to which tools can be devisedthat can effectively aid humans in (a) constructingsuch views (b) facilitating the learner in navigatingthrough such views. For the purpose of analysis, wepresent an abstraction of an encyclopedic resourcein the form of a concept network, and show howgraph theoretic approaches can be used to restruc-ture such a network with the goal of making it ped-agogically useful. While the formal development ofthis idea is detailed in Section 2, the central idea isas follows. Consider a concept network constructedusing Wikipedia articles as concept nodes and hy-perlinks as directed edges. Since Wikipedia articlesare authored independently, it is not unusual that theauthor of an article A assumes that a concept B isknown when the reader is on the Wikipedia page ofA, while the author of concept B assumes exactlythe opposite. This results in a circular definitionof concepts, thus making the learner flip back andforth between these articles. A pedagogical resourceovercomes this bottleneck by ensuring that the cor-responding concept network is a directed acyclicgraph. A textbook, for example, structures conceptsin a way that ensures that no concept is used beforebeing defined (Agrawal et al., 2012) (an exception
190
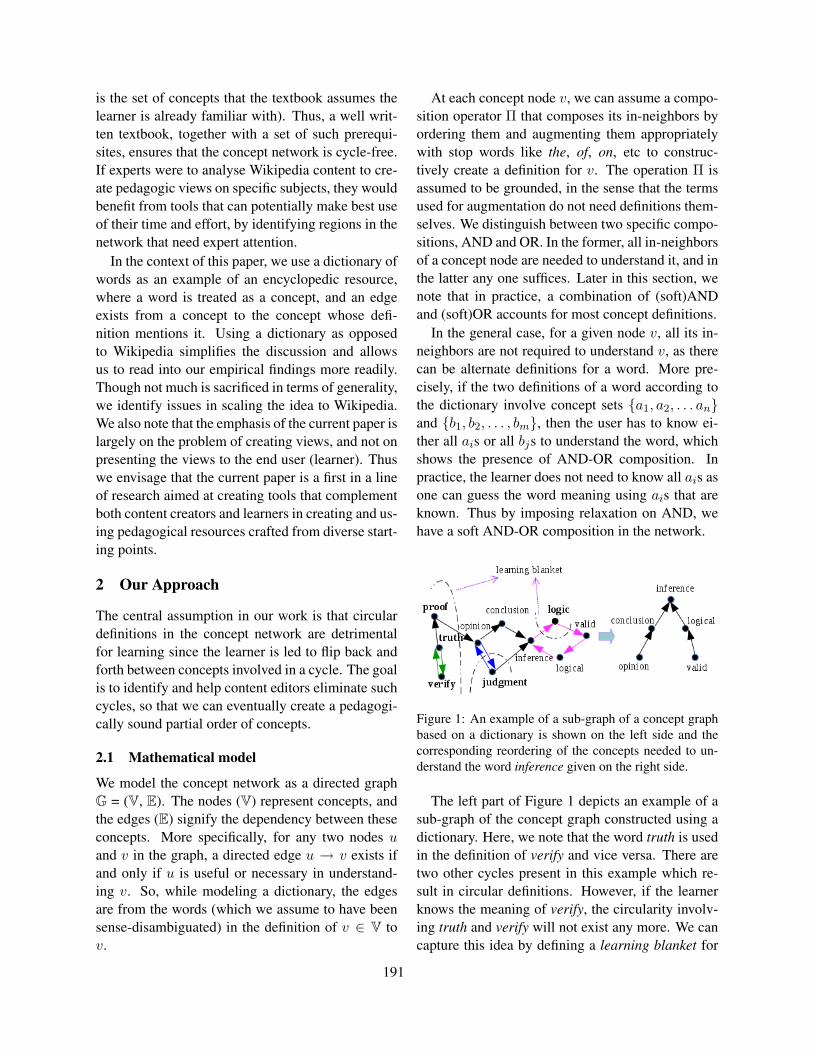
is the set of concepts that the textbook assumes thelearner is already familiar with). Thus, a well writ-ten textbook, together with a set of such prerequi-sites, ensures that the concept network is cycle-free.If experts were to analyse Wikipedia content to cre-ate pedagogic views on specific subjects, they wouldbenefit from tools that can potentially make best useof their time and effort, by identifying regions in thenetwork that need expert attention.
In the context of this paper, we use a dictionary ofwords as an example of an encyclopedic resource,where a word is treated as a concept, and an edgeexists from a concept to the concept whose defi-nition mentions it. Using a dictionary as opposedto Wikipedia simplifies the discussion and allowsus to read into our empirical findings more readily.Though not much is sacrificed in terms of generality,we identify issues in scaling the idea to Wikipedia.We also note that the emphasis of the current paper islargely on the problem of creating views, and not onpresenting the views to the end user (learner). Thuswe envisage that the current paper is a first in a lineof research aimed at creating tools that complementboth content creators and learners in creating and us-ing pedagogical resources crafted from diverse start-ing points.
2 Our Approach
The central assumption in our work is that circulardefinitions in the concept network are detrimentalfor learning since the learner is led to flip back andforth between concepts involved in a cycle. The goalis to identify and help content editors eliminate suchcycles, so that we can eventually create a pedagogi-cally sound partial order of concepts.
2.1 Mathematical model
We model the concept network as a directed graphG = (V, E). The nodes (V) represent concepts, andthe edges (E) signify the dependency between theseconcepts. More specifically, for any two nodes uand v in the graph, a directed edge u → v exists ifand only if u is useful or necessary in understand-ing v. So, while modeling a dictionary, the edgesare from the words (which we assume to have beensense-disambiguated) in the definition of v ∈ V tov.
At each concept node v, we can assume a compo-sition operator Π that composes its in-neighbors byordering them and augmenting them appropriatelywith stop words like the, of, on, etc to construc-tively create a definition for v. The operation Π isassumed to be grounded, in the sense that the termsused for augmentation do not need definitions them-selves. We distinguish between two specific compo-sitions, AND and OR. In the former, all in-neighborsof a concept node are needed to understand it, and inthe latter any one suffices. Later in this section, wenote that in practice, a combination of (soft)ANDand (soft)OR accounts for most concept definitions.
In the general case, for a given node v, all its in-neighbors are not required to understand v, as therecan be alternate definitions for a word. More pre-cisely, if the two definitions of a word according tothe dictionary involve concept sets {a1, a2, . . . an}and {b1, b2, . . . , bm}, then the user has to know ei-ther all ais or all bjs to understand the word, whichshows the presence of AND-OR composition. Inpractice, the learner does not need to know all ais asone can guess the word meaning using ais that areknown. Thus by imposing relaxation on AND, wehave a soft AND-OR composition in the network.
Figure 1: An example of a sub-graph of a concept graphbased on a dictionary is shown on the left side and thecorresponding reordering of the concepts needed to un-derstand the word inference given on the right side.
The left part of Figure 1 depicts an example of asub-graph of the concept graph constructed using adictionary. Here, we note that the word truth is usedin the definition of verify and vice versa. There aretwo other cycles present in this example which re-sult in circular definitions. However, if the learnerknows the meaning of verify, the circularity involv-ing truth and verify will not exist any more. We cancapture this idea by defining a learning blanket for
191
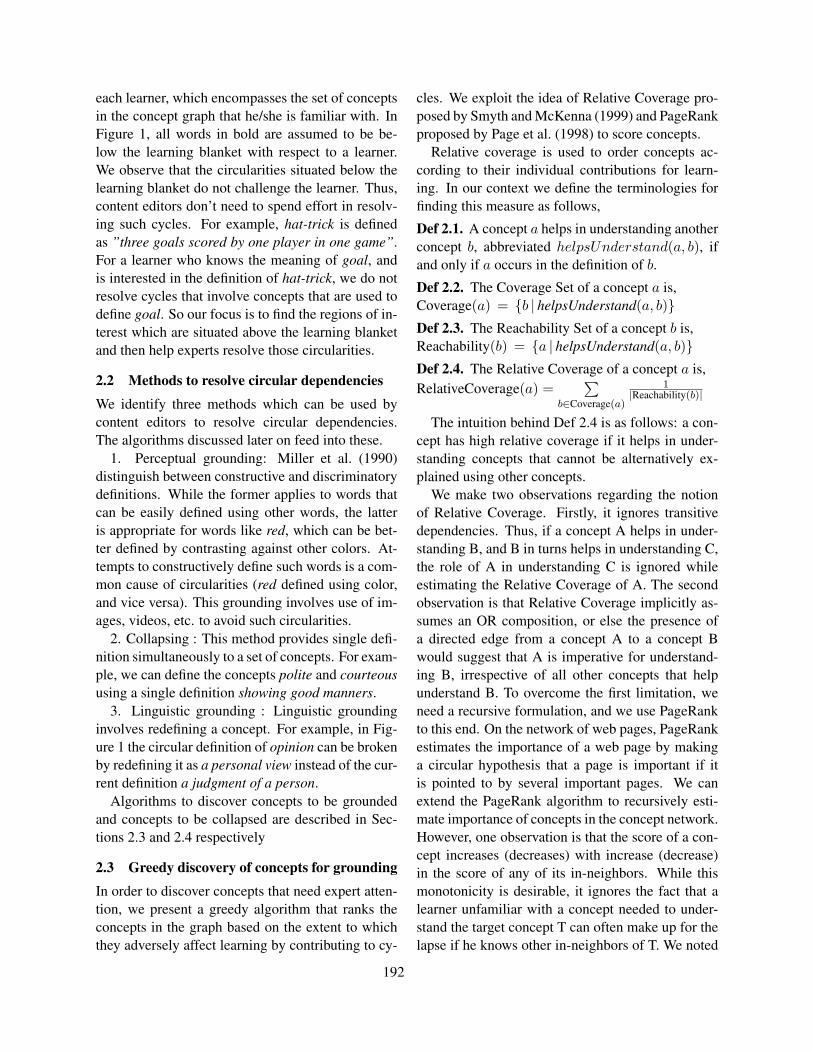
each learner, which encompasses the set of conceptsin the concept graph that he/she is familiar with. InFigure 1, all words in bold are assumed to be be-low the learning blanket with respect to a learner.We observe that the circularities situated below thelearning blanket do not challenge the learner. Thus,content editors don’t need to spend effort in resolv-ing such cycles. For example, hat-trick is definedas ”three goals scored by one player in one game”.For a learner who knows the meaning of goal, andis interested in the definition of hat-trick, we do notresolve cycles that involve concepts that are used todefine goal. So our focus is to find the regions of in-terest which are situated above the learning blanketand then help experts resolve those circularities.
2.2 Methods to resolve circular dependenciesWe identify three methods which can be used bycontent editors to resolve circular dependencies.The algorithms discussed later on feed into these.
1. Perceptual grounding: Miller et al. (1990)distinguish between constructive and discriminatorydefinitions. While the former applies to words thatcan be easily defined using other words, the latteris appropriate for words like red, which can be bet-ter defined by contrasting against other colors. At-tempts to constructively define such words is a com-mon cause of circularities (red defined using color,and vice versa). This grounding involves use of im-ages, videos, etc. to avoid such circularities.
2. Collapsing : This method provides single defi-nition simultaneously to a set of concepts. For exam-ple, we can define the concepts polite and courteoususing a single definition showing good manners.
3. Linguistic grounding : Linguistic groundinginvolves redefining a concept. For example, in Fig-ure 1 the circular definition of opinion can be brokenby redefining it as a personal view instead of the cur-rent definition a judgment of a person.
Algorithms to discover concepts to be groundedand concepts to be collapsed are described in Sec-tions 2.3 and 2.4 respectively
2.3 Greedy discovery of concepts for groundingIn order to discover concepts that need expert atten-tion, we present a greedy algorithm that ranks theconcepts in the graph based on the extent to whichthey adversely affect learning by contributing to cy-
cles. We exploit the idea of Relative Coverage pro-posed by Smyth and McKenna (1999) and PageRankproposed by Page et al. (1998) to score concepts.
Relative coverage is used to order concepts ac-cording to their individual contributions for learn-ing. In our context we define the terminologies forfinding this measure as follows,
Def 2.1. A concept a helps in understanding anotherconcept b, abbreviated helpsUnderstand(a, b), ifand only if a occurs in the definition of b.
Def 2.2. The Coverage Set of a concept a is,Coverage(a) = {b | helpsUnderstand(a, b)}Def 2.3. The Reachability Set of a concept b is,Reachability(b) = {a | helpsUnderstand(a, b)}Def 2.4. The Relative Coverage of a concept a is,RelativeCoverage(a) =
∑b∈Coverage(a)
1|Reachability(b)|
The intuition behind Def 2.4 is as follows: a con-cept has high relative coverage if it helps in under-standing concepts that cannot be alternatively ex-plained using other concepts.
We make two observations regarding the notionof Relative Coverage. Firstly, it ignores transitivedependencies. Thus, if a concept A helps in under-standing B, and B in turns helps in understanding C,the role of A in understanding C is ignored whileestimating the Relative Coverage of A. The secondobservation is that Relative Coverage implicitly as-sumes an OR composition, or else the presence ofa directed edge from a concept A to a concept Bwould suggest that A is imperative for understand-ing B, irrespective of all other concepts that helpunderstand B. To overcome the first limitation, weneed a recursive formulation, and we use PageRankto this end. On the network of web pages, PageRankestimates the importance of a web page by makinga circular hypothesis that a page is important if itis pointed to by several important pages. We canextend the PageRank algorithm to recursively esti-mate importance of concepts in the concept network.However, one observation is that the score of a con-cept increases (decreases) with increase (decrease)in the score of any of its in-neighbors. While thismonotonicity is desirable, it ignores the fact that alearner unfamiliar with a concept needed to under-stand the target concept T can often make up for thelapse if he knows other in-neighbors of T. We noted
192
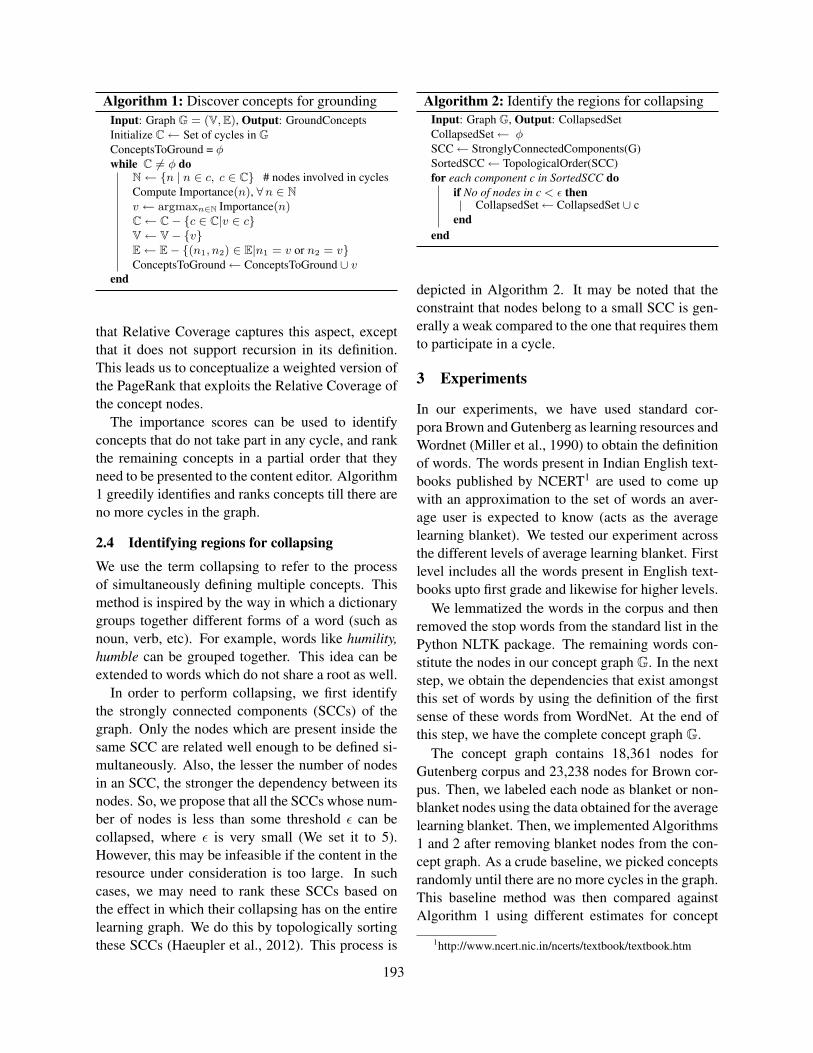
Algorithm 1: Discover concepts for groundingInput: Graph G = (V,E), Output: GroundConceptsInitialize C← Set of cycles in GConceptsToGround = φwhile C 6= φ do
N← {n | n ∈ c, c ∈ C} # nodes involved in cyclesCompute Importance(n), ∀n ∈ Nv ← argmaxn∈N Importance(n)C← C− {c ∈ C|v ∈ c}V← V− {v}E← E− {(n1, n2) ∈ E|n1 = v or n2 = v}ConceptsToGround← ConceptsToGround ∪ v
end
that Relative Coverage captures this aspect, exceptthat it does not support recursion in its definition.This leads us to conceptualize a weighted version ofthe PageRank that exploits the Relative Coverage ofthe concept nodes.
The importance scores can be used to identifyconcepts that do not take part in any cycle, and rankthe remaining concepts in a partial order that theyneed to be presented to the content editor. Algorithm1 greedily identifies and ranks concepts till there areno more cycles in the graph.
2.4 Identifying regions for collapsing
We use the term collapsing to refer to the processof simultaneously defining multiple concepts. Thismethod is inspired by the way in which a dictionarygroups together different forms of a word (such asnoun, verb, etc). For example, words like humility,humble can be grouped together. This idea can beextended to words which do not share a root as well.
In order to perform collapsing, we first identifythe strongly connected components (SCCs) of thegraph. Only the nodes which are present inside thesame SCC are related well enough to be defined si-multaneously. Also, the lesser the number of nodesin an SCC, the stronger the dependency between itsnodes. So, we propose that all the SCCs whose num-ber of nodes is less than some threshold ε can becollapsed, where ε is very small (We set it to 5).However, this may be infeasible if the content in theresource under consideration is too large. In suchcases, we may need to rank these SCCs based onthe effect in which their collapsing has on the entirelearning graph. We do this by topologically sortingthese SCCs (Haeupler et al., 2012). This process is
Algorithm 2: Identify the regions for collapsingInput: Graph G, Output: CollapsedSetCollapsedSet← φSCC← StronglyConnectedComponents(G)SortedSCC← TopologicalOrder(SCC)for each component c in SortedSCC do
if No of nodes in c < ε thenCollapsedSet← CollapsedSet ∪ c
endend
depicted in Algorithm 2. It may be noted that theconstraint that nodes belong to a small SCC is gen-erally a weak compared to the one that requires themto participate in a cycle.
3 Experiments
In our experiments, we have used standard cor-pora Brown and Gutenberg as learning resources andWordnet (Miller et al., 1990) to obtain the definitionof words. The words present in Indian English text-books published by NCERT1 are used to come upwith an approximation to the set of words an aver-age user is expected to know (acts as the averagelearning blanket). We tested our experiment acrossthe different levels of average learning blanket. Firstlevel includes all the words present in English text-books upto first grade and likewise for higher levels.
We lemmatized the words in the corpus and thenremoved the stop words from the standard list in thePython NLTK package. The remaining words con-stitute the nodes in our concept graph G. In the nextstep, we obtain the dependencies that exist amongstthis set of words by using the definition of the firstsense of these words from WordNet. At the end ofthis step, we have the complete concept graph G.
The concept graph contains 18,361 nodes forGutenberg corpus and 23,238 nodes for Brown cor-pus. Then, we labeled each node as blanket or non-blanket nodes using the data obtained for the averagelearning blanket. Then, we implemented Algorithms1 and 2 after removing blanket nodes from the con-cept graph. As a crude baseline, we picked conceptsrandomly until there are no more cycles in the graph.This baseline method was then compared againstAlgorithm 1 using different estimates for concept
1http://www.ncert.nic.in/ncerts/textbook/textbook.htm
193
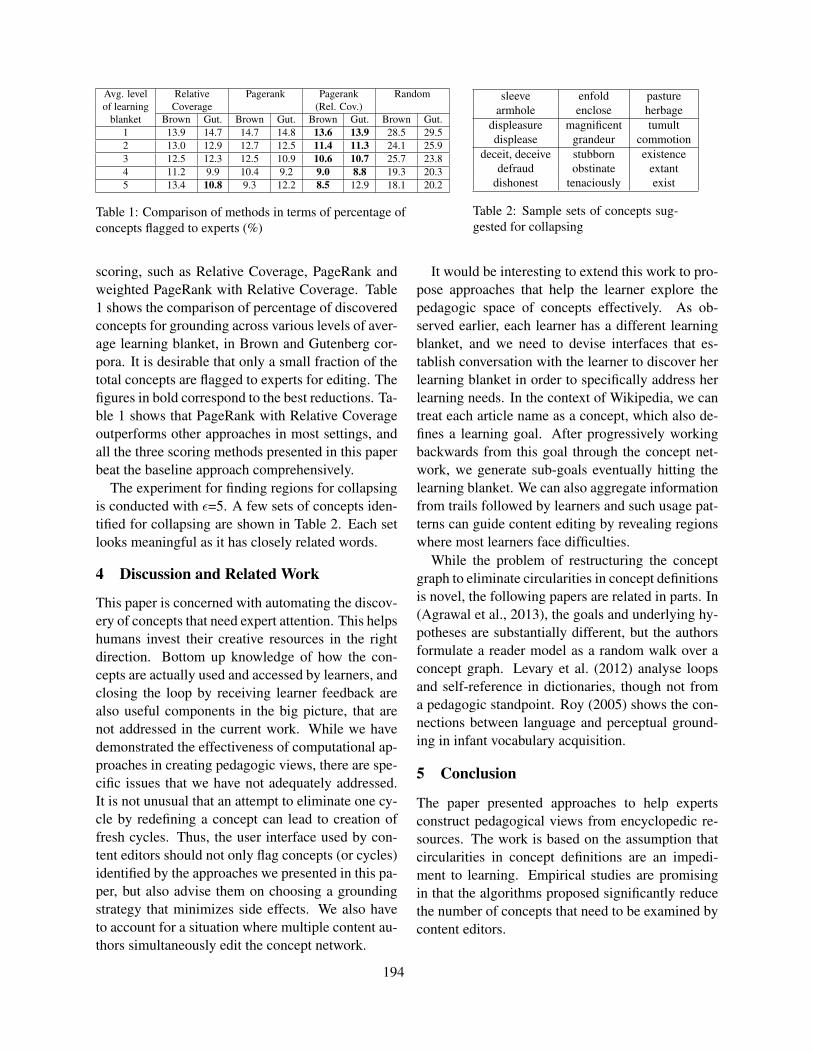
Avg. level Relative Pagerank Pagerank Randomof learning Coverage (Rel. Cov.)
blanket Brown Gut. Brown Gut. Brown Gut. Brown Gut.1 13.9 14.7 14.7 14.8 13.6 13.9 28.5 29.52 13.0 12.9 12.7 12.5 11.4 11.3 24.1 25.93 12.5 12.3 12.5 10.9 10.6 10.7 25.7 23.84 11.2 9.9 10.4 9.2 9.0 8.8 19.3 20.35 13.4 10.8 9.3 12.2 8.5 12.9 18.1 20.2
Table 1: Comparison of methods in terms of percentage ofconcepts flagged to experts (%)
sleeve enfold pasturearmhole enclose herbage
displeasure magnificent tumultdisplease grandeur commotion
deceit, deceive stubborn existencedefraud obstinate extant
dishonest tenaciously exist
Table 2: Sample sets of concepts sug-gested for collapsing
scoring, such as Relative Coverage, PageRank andweighted PageRank with Relative Coverage. Table1 shows the comparison of percentage of discoveredconcepts for grounding across various levels of aver-age learning blanket, in Brown and Gutenberg cor-pora. It is desirable that only a small fraction of thetotal concepts are flagged to experts for editing. Thefigures in bold correspond to the best reductions. Ta-ble 1 shows that PageRank with Relative Coverageoutperforms other approaches in most settings, andall the three scoring methods presented in this paperbeat the baseline approach comprehensively.
The experiment for finding regions for collapsingis conducted with ε=5. A few sets of concepts iden-tified for collapsing are shown in Table 2. Each setlooks meaningful as it has closely related words.
4 Discussion and Related Work
This paper is concerned with automating the discov-ery of concepts that need expert attention. This helpshumans invest their creative resources in the rightdirection. Bottom up knowledge of how the con-cepts are actually used and accessed by learners, andclosing the loop by receiving learner feedback arealso useful components in the big picture, that arenot addressed in the current work. While we havedemonstrated the effectiveness of computational ap-proaches in creating pedagogic views, there are spe-cific issues that we have not adequately addressed.It is not unusual that an attempt to eliminate one cy-cle by redefining a concept can lead to creation offresh cycles. Thus, the user interface used by con-tent editors should not only flag concepts (or cycles)identified by the approaches we presented in this pa-per, but also advise them on choosing a groundingstrategy that minimizes side effects. We also haveto account for a situation where multiple content au-thors simultaneously edit the concept network.
It would be interesting to extend this work to pro-pose approaches that help the learner explore thepedagogic space of concepts effectively. As ob-served earlier, each learner has a different learningblanket, and we need to devise interfaces that es-tablish conversation with the learner to discover herlearning blanket in order to specifically address herlearning needs. In the context of Wikipedia, we cantreat each article name as a concept, which also de-fines a learning goal. After progressively workingbackwards from this goal through the concept net-work, we generate sub-goals eventually hitting thelearning blanket. We can also aggregate informationfrom trails followed by learners and such usage pat-terns can guide content editing by revealing regionswhere most learners face difficulties.
While the problem of restructuring the conceptgraph to eliminate circularities in concept definitionsis novel, the following papers are related in parts. In(Agrawal et al., 2013), the goals and underlying hy-potheses are substantially different, but the authorsformulate a reader model as a random walk over aconcept graph. Levary et al. (2012) analyse loopsand self-reference in dictionaries, though not froma pedagogic standpoint. Roy (2005) shows the con-nections between language and perceptual ground-ing in infant vocabulary acquisition.
5 Conclusion
The paper presented approaches to help expertsconstruct pedagogical views from encyclopedic re-sources. The work is based on the assumption thatcircularities in concept definitions are an impedi-ment to learning. Empirical studies are promisingin that the algorithms proposed significantly reducethe number of concepts that need to be examined bycontent editors.
194

ReferencesDavid Levary, Jean-Pierre Eckmann, Elisha Moses and
Tsvi Tlusty. 2012. Loops and Self-Reference in theConstruction of Dictionaries Physical Review X 2,031018
Barry Smyth and Elizabeth McKenna. 1999. Footprint-Based Retrieval Proceedings of the Third Interna-tional Conference on Case-Based Reasoning andDevelopment, Pages 343 - 357
Deb Roy. 2005. Grounding words in perception andaction: computational insights Trends in CognitiveSciences, Vol.9 No.8, Pages 389 - 396
Rakesh Agrawal, Sunandan Chakraborty, Sreenivas Gol-lapudi, Anitha Kannan, Krishnaram Kenthapadi.2012. Quality of textbooks: an empirical study ACMSymposium on Computing for Development (ACMDEV), ACM.
Larry Page, Sergey Brin, R. Motwani, T. Winograd. 2012. The PageRank Citation Ranking: BringingOrder to the Web In Stanford InfoLab.
Rakesh Agrawal, Sreenivas Gollapudi, Anitha Kannan,Krishnaram Kenthapadi. 2013. Studying fromElectronic Textbooks 22nd ACM International Con-ference on Information and Knowledge Management,CIKM’13, Pages 1715 - 1720
George A. Miller, Richard Beckwith, Christiane Fell-baum, Derek Gross, and Katherine Miller. 1990.Introduction to WordNet: An On-line LexicalDatabase International Journal of Lexicography,Vol.3 No.4, Pages 235 - 244.
Taher H. Haveliwala. 2002. Topic-sensitive PageRankProceedings of the 11th international conference onWorld Wide Web, Pages 517 - 526.
Bernhard Haeupler, Telikepalli Kavitha, Rogers Mathew,Siddhartha Sen, and Robert E Tarjan. 2012. In-cremental Cycle Detection, Topological Ordering,and Strong Component Maintenance ACM Trans.Algorithms, Vol.8 No.1, Article 3.
195

Proceedings of the Tenth Workshop on Innovative Use of NLP for Building Educational Applications, 2015, pages 196–206,Denver, Colorado, June 4, 2015. c©2015 Association for Computational Linguistics
Judging the Quality of Automatically Generated Gap-fill Question usingActive Learning
Nobal B. Niraula and Vasile RusDepartment of Computer Science and Institute for Intelligent Systems
The University of MemphisMemphis, TN, 38152, USA
{nbnraula,vrus}@memphis.edu
Abstract
In this paper, we propose to use active learn-ing for training classifiers to judge the qual-ity of gap-fill questions. Gap-fill questions arewidely used for assessments in education con-texts because they can be graded automaticallywhile offering reliable assessment of learners’knowledge level if appropriately calibrated.Active learning is a machine learning frame-work which is typically used when unlabeleddata is abundant but manual annotation is slowand expensive. This is the case in many Nat-ural Language Processing tasks, including au-tomated question generation, which is our fo-cus. A key task in automated question gen-eration is judging the quality of the generatedquestions. Classifiers can be built to addressthis task which typically are trained on humanlabeled data. Our evaluation results suggestthat the use of active learning leads to accurateclassifiers for judging the quality of gap-fillquestions while keeping the annotation costsin check. We are not aware of any previous ef-fort that uses active learning for question eval-uation.
1 Introduction
Recent explosion of massive open online courses(MOOCs) such as Coursera1 and Udacity2 and thesuccess of Intelligent Tutoring Systems (ITSs), e.g.AutoTutor (Graesser et al., 2004) and DeepTutor(Rus et al., 2013), at inducing learning gains compa-rable to human tutors indicate great opportunities for
1http://www.coursera.org2http://www.udacity.com
online education platforms. These systems typicallydeliver knowledge to learners via video streamingor direct interaction with the system, e.g. dialoguebased interaction. If adaptive to individual learners,such online platforms for learning must assess learn-ers’ knowledge before, during, and after students’interaction with the platform. For instance, in or-der to identify knowledge deficits before and/or af-ter a session a pre- and/or post-test can be used. Theknowledge deficits discovered based on the pre-testcan guide the online platform to select appropriateinstructional tasks for the learner. Furthermore, thepre- and post-test can be used to measure the learn-ing gains with the online platform, e.g. by subtrac-tic the pre-test score from the post-test score. Thebottom line is that assessment is critical for adap-tive instruction. Various kinds of questions are usedto assess students’ knowledge levels varying fromTrue/False questions to multiple choice questions toopen answer questions.
Indeed, a main challenge in online learning plat-forms such as MOOCs and ITSs is test construc-tion (assessment question generation). Automatedtest construction is a demanding task requiring sig-nificant resources. Any level of automation inquestion generation would therefore be very use-ful for this expensive and time-consuming process.In fact, it has been proven that computer-assistedtest construction can dramatically reduce costs as-sociated with test construction activities (Pollocket al., 2000). Besides test construction, automaticquestion generation are very useful in several otherapplications such as reading comprehension (Ea-son et al., 2012), vocabulary assessment (Brown et
196
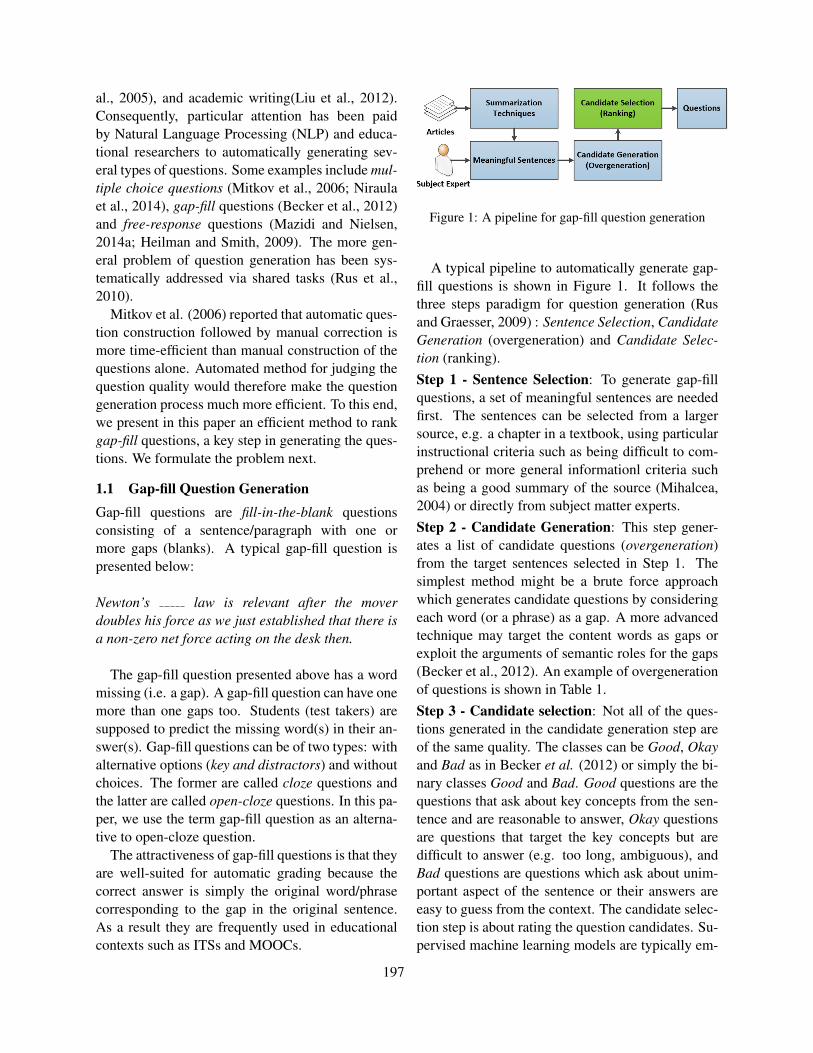
al., 2005), and academic writing(Liu et al., 2012).Consequently, particular attention has been paidby Natural Language Processing (NLP) and educa-tional researchers to automatically generating sev-eral types of questions. Some examples include mul-tiple choice questions (Mitkov et al., 2006; Niraulaet al., 2014), gap-fill questions (Becker et al., 2012)and free-response questions (Mazidi and Nielsen,2014a; Heilman and Smith, 2009). The more gen-eral problem of question generation has been sys-tematically addressed via shared tasks (Rus et al.,2010).
Mitkov et al. (2006) reported that automatic ques-tion construction followed by manual correction ismore time-efficient than manual construction of thequestions alone. Automated method for judging thequestion quality would therefore make the questiongeneration process much more efficient. To this end,we present in this paper an efficient method to rankgap-fill questions, a key step in generating the ques-tions. We formulate the problem next.
1.1 Gap-fill Question GenerationGap-fill questions are fill-in-the-blank questionsconsisting of a sentence/paragraph with one ormore gaps (blanks). A typical gap-fill question ispresented below:
Newton’s law is relevant after the moverdoubles his force as we just established that there isa non-zero net force acting on the desk then.
The gap-fill question presented above has a wordmissing (i.e. a gap). A gap-fill question can have onemore than one gaps too. Students (test takers) aresupposed to predict the missing word(s) in their an-swer(s). Gap-fill questions can be of two types: withalternative options (key and distractors) and withoutchoices. The former are called cloze questions andthe latter are called open-cloze questions. In this pa-per, we use the term gap-fill question as an alterna-tive to open-cloze question.
The attractiveness of gap-fill questions is that theyare well-suited for automatic grading because thecorrect answer is simply the original word/phrasecorresponding to the gap in the original sentence.As a result they are frequently used in educationalcontexts such as ITSs and MOOCs.
Figure 1: A pipeline for gap-fill question generation
A typical pipeline to automatically generate gap-fill questions is shown in Figure 1. It follows thethree steps paradigm for question generation (Rusand Graesser, 2009) : Sentence Selection, CandidateGeneration (overgeneration) and Candidate Selec-tion (ranking).Step 1 - Sentence Selection: To generate gap-fillquestions, a set of meaningful sentences are neededfirst. The sentences can be selected from a largersource, e.g. a chapter in a textbook, using particularinstructional criteria such as being difficult to com-prehend or more general informationl criteria suchas being a good summary of the source (Mihalcea,2004) or directly from subject matter experts.Step 2 - Candidate Generation: This step gener-ates a list of candidate questions (overgeneration)from the target sentences selected in Step 1. Thesimplest method might be a brute force approachwhich generates candidate questions by consideringeach word (or a phrase) as a gap. A more advancedtechnique may target the content words as gaps orexploit the arguments of semantic roles for the gaps(Becker et al., 2012). An example of overgenerationof questions is shown in Table 1.Step 3 - Candidate selection: Not all of the ques-tions generated in the candidate generation step areof the same quality. The classes can be Good, Okayand Bad as in Becker et al. (2012) or simply the bi-nary classes Good and Bad. Good questions are thequestions that ask about key concepts from the sen-tence and are reasonable to answer, Okay questionsare questions that target the key concepts but aredifficult to answer (e.g. too long, ambiguous), andBad questions are questions which ask about unim-portant aspect of the sentence or their answers areeasy to guess from the context. The candidate selec-tion step is about rating the question candidates. Su-pervised machine learning models are typically em-
197

Bad ........ net force is equal to the mass times its acceleration.Good The ........ force is equal to the mass times its acceleration.Good The net ........ is equal to the mass times its acceleration.Good ........ is equal to the mass times its acceleration.Bad The net force ........ equal to the mass times its acceleration.Okay The net force is ........ to the mass times its acceleration.Bad The net force is equal ........ the mass times its acceleration.Good The net force is equal to the ........ times its acceleration.Okay The net force is equal to the mass ........ its acceleration.Bad The net force is equal to the mass times ........ acceleration.
Table 1: Typical overgenerated questions from a sentence with their ratings Good, Okay and Bad.
ployed in the form of classifiers to label the candi-date questions as Good, Okay, or Bad.
1.2 Question Quality
Question quality can be judged linguistically or ped-agogically. In linguistic evaluation, questions areevaluated with respect to whether they are grammat-ically and semantically correct. In pedagogical eval-uation, questions are evaluated to see whether theyare helpful for understanding and learning the targetconcepts. Our focus here is on the pedagogical eval-uation of automatically generated gap-fill questionssince they are always linguistically correct.
The third step i.e. candidate selection is expen-sive when supervised approaches are used becausemodel building in supervised learning requires largeamount of human annotated examples. The advan-tage of supervised methods, however, is that theirperformances are in general better than, for instance,that of unsupervised methods. As such, ideally,we would like to keep the advantages of supervisedmethods while reducing the costs of annotating data.Such a method that offers a good compromise be-tween annotation costs and performance is activelearning, which we adopt in this work. Such modelsare always attractive choices especially when thereis a limited budget e.g. fixed annotation time / cost,a highly probable case.
Active learning and interactive learning are twowell-known approaches that maximize performanceof machine learning methods for a given budget.They are successfully applied for rapidly scaling di-alog systems (Williams et al., 2015), parts-of-speechtagging (Ringger et al., 2007), sequence labeling
(Settles and Craven, 2008), word sense disambigua-tion (Chen et al., 2006), named entity tagging (Shenet al., 2004), etc. Instead of selecting and present-ing to an annotator a random sample of unlabeledinstances to annotate, these approaches intelligentlyrank the set of unlabeled instances using certain cri-teria (see Section 3) and present to the annotatorthe best candidate(s). This characteristic of activelearning and interactive labeling hopefully demandsfewer instances than random sampling to obtain thesame level of performance.
In this paper, we propose an active learning basedapproach to judge the quality of gap-fill questionswith the goal of reducing the annotation costs. Weare not aware of any previous effort that uses activelearning for question generation. We chose activelearning particularly because it is well-suited whenunlabeled data is abundant but manual annotation istedious and expensive. As mentioned, this is thecase in gap-fill question question generation in over-generation approaches when plenty of questions areavailable but their quality needs to be specified. Theremaining challenge is to judge the quality of thesequestions. Our plan is to build a probabilistic classi-fier at reduced costs that would automatically labeleach candidate questions as good or bad using anactive learnign approach.
The rest of the paper is organized as follows. InSection 2, we present the relevant works. In Sec-tion 3, we present the active learning techniques thatwe are going to employ. In Section 4 and Section5, we describe our experiments and results respec-tively. We present the conclusions in Section 6.
198
2 Related Works
Currently, statistical and machine learning based ap-proaches are the most popular approaches that areused to rank the automatically generated questionsof various kinds e.g. free-response (e.g. What,When etc.) and gap-fill questions. For example,Heilman et al. (2010) used logistic regression, asupervised method, to predict the acceptability ofeach free-response question candidate. The candi-date questions were automatically generated by us-ing a set of rules. They used fifteen native English-speaking university students for the construction oftraining examples required for building the logisticregression model.
Hoshino and Nakagawa (2005) proposed a ma-chine learning approach to generate multiple-choicequestions for language testing. They formed a ques-tion sentence by deciding the position of the gap i.e.missing word(s). To decide whether a given wordcan be left blank (i.e. serve as a gap) in the declar-ative stem, they trained classifiers using the traininginstances which were generated by collecting fill-in-the-blank questions from a TOEIC preparationbook. The positive examples were the exact blankpositions in the question from the book whereas thenegative examples were generated by shifting theblank position.
Similarly, Becker et al. (2012) proposed Mind theGap system that applied logistic regression to rankautomatically generated gap-fill questions. Theyused text summarization technique to select usefulsentences from text articles for which gap-fill ques-tions are to be generated. From each of the selectedsentence, it generated potential gap-fill candidatesusing semantic constraints. Each candidate ques-tion was then labeled by four Amazon’s Mechani-cal Turkers to one of Good, Bad and Okay classes.In total, 85 unique Turkers were involved in the an-notation. The data set was used to build a logisticregression classifier and ranked the candidate ques-tions. They reported that the classifier largely agreedwith the human judgment on question quality.
In recent works Mazidi and Nielsen (2014a;2014b) generated free-response questions from sen-tences by using the patterns which were manu-ally authored by exploiting the semantic role labels.They evaluated the questions linguistically and ped-
agogically using human annotators and reported thattheir systems produced higher quality questions thancomparable systems. The main limitation of theirapproaches is that they do not exploit the examplesobtained from the annotation process to evaluate un-seen (or not yet evaluated) questions. Moreover,their approaches do not provide any ranking for thequestions they generated using those patterns.
3 Active Learning for Judging QuestionQuality
As mentioned before, active learning fits well whenabundant data can be available but manual labelingcosts are high. As a result, the technique has beenapplied to many NLP tasks such as text classifica-tion, Word Sense Disambiguation, sequence label-ing, and parsing. We use active learning for guidingour annotation process for judging the quality of au-tomatically generated gap-fill questions.
3.1 Active Learning Algorithms
An active learning system mainly consists of a clas-sification model and querying algorithm. Typicallythe classification models are the probabilistic classi-fiers such as Naıve Bayes and Logistic Regressionwhich provide a class probability distribution for agiven instance. Querying algorithms/functions ac-tively choose unlabeled instance samples by exploit-ing these probabilities.
We follow the standard pool-based active learningalgorithm as shown in Algorithm 1. It starts with aset of initially labeled instances (seed examples) anda set of unlabeled instances (U ). A new model isbuilt using the labeled examples in L. Next, a batchof instances are extracted from the unlabeled set Uusing a query function f(.) and then the selected in-stances are labeled by human judges. The new la-beled instances are added to the labeled list L. Theprocess repeats until a stopping criterion is met. Thecriteria could be the number of examples labeled,expected accuracy of the model, or something else.
3.1.1 Querying AlgorithmsMany query functions exist. They differ on how
they utilize the class probability distributions. Weuse two variants of query functions: uncertaintysampling and query by committee sampling.
199
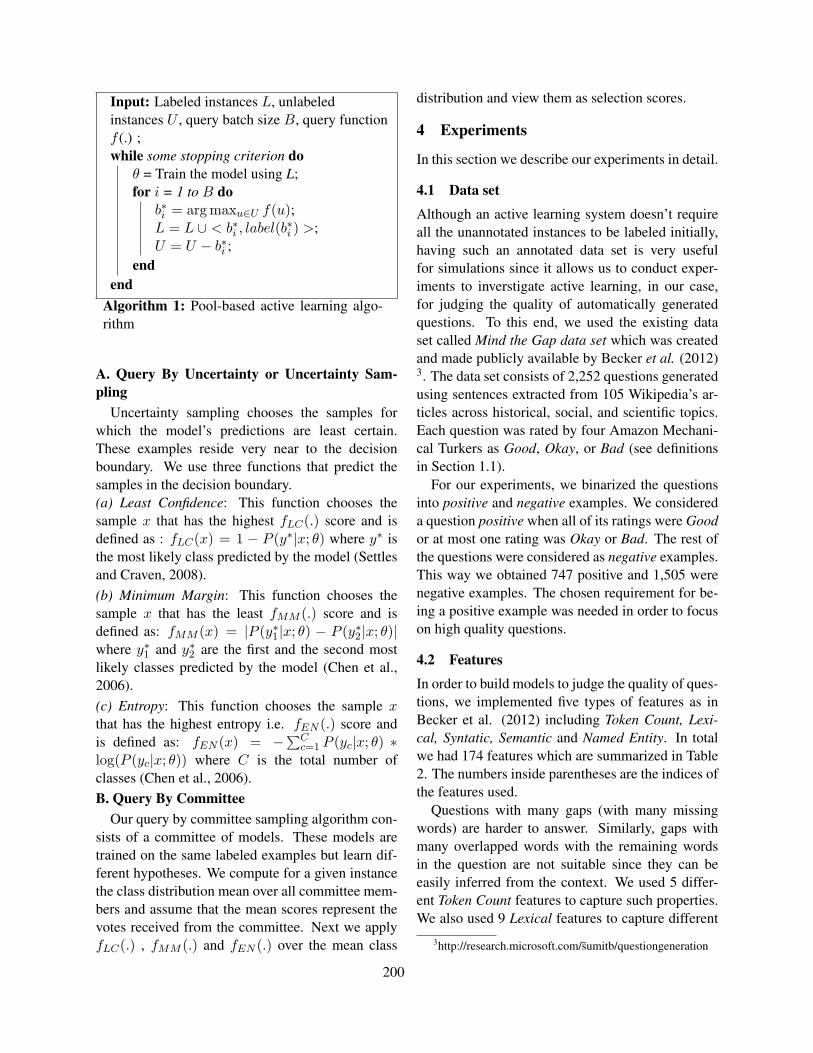
Input: Labeled instances L, unlabeledinstances U , query batch size B, query functionf (.) ;while some stopping criterion do
θ = Train the model using L;for i = 1 to B do
b∗i = arg maxu∈U f(u);L = L ∪ < b∗i , label(b∗i ) >;U = U − b∗i ;
endend
Algorithm 1: Pool-based active learning algo-rithm
A. Query By Uncertainty or Uncertainty Sam-pling
Uncertainty sampling chooses the samples forwhich the model’s predictions are least certain.These examples reside very near to the decisionboundary. We use three functions that predict thesamples in the decision boundary.(a) Least Confidence: This function chooses thesample x that has the highest fLC(.) score and isdefined as : fLC(x) = 1 − P (y∗|x; θ) where y∗ isthe most likely class predicted by the model (Settlesand Craven, 2008).(b) Minimum Margin: This function chooses thesample x that has the least fMM (.) score and isdefined as: fMM (x) = |P (y∗1|x; θ) − P (y∗2|x; θ)|where y∗1 and y∗2 are the first and the second mostlikely classes predicted by the model (Chen et al.,2006).(c) Entropy: This function chooses the sample xthat has the highest entropy i.e. fEN (.) score andis defined as: fEN (x) = −∑C
c=1 P (yc|x; θ) ∗log(P (yc|x; θ)) where C is the total number ofclasses (Chen et al., 2006).B. Query By Committee
Our query by committee sampling algorithm con-sists of a committee of models. These models aretrained on the same labeled examples but learn dif-ferent hypotheses. We compute for a given instancethe class distribution mean over all committee mem-bers and assume that the mean scores represent thevotes received from the committee. Next we applyfLC(.) , fMM (.) and fEN (.) over the mean class
distribution and view them as selection scores.
4 Experiments
In this section we describe our experiments in detail.
4.1 Data set
Although an active learning system doesn’t requireall the unannotated instances to be labeled initially,having such an annotated data set is very usefulfor simulations since it allows us to conduct exper-iments to inverstigate active learning, in our case,for judging the quality of automatically generatedquestions. To this end, we used the existing dataset called Mind the Gap data set which was createdand made publicly available by Becker et al. (2012)3. The data set consists of 2,252 questions generatedusing sentences extracted from 105 Wikipedia’s ar-ticles across historical, social, and scientific topics.Each question was rated by four Amazon Mechani-cal Turkers as Good, Okay, or Bad (see definitionsin Section 1.1).
For our experiments, we binarized the questionsinto positive and negative examples. We considereda question positive when all of its ratings were Goodor at most one rating was Okay or Bad. The rest ofthe questions were considered as negative examples.This way we obtained 747 positive and 1,505 werenegative examples. The chosen requirement for be-ing a positive example was needed in order to focuson high quality questions.
4.2 Features
In order to build models to judge the quality of ques-tions, we implemented five types of features as inBecker et al. (2012) including Token Count, Lexi-cal, Syntatic, Semantic and Named Entity. In totalwe had 174 features which are summarized in Table2. The numbers inside parentheses are the indices ofthe features used.
Questions with many gaps (with many missingwords) are harder to answer. Similarly, gaps withmany overlapped words with the remaining wordsin the question are not suitable since they can beeasily inferred from the context. We used 5 differ-ent Token Count features to capture such properties.We also used 9 Lexical features to capture different
3http://research.microsoft.com/sumitb/questiongeneration
200
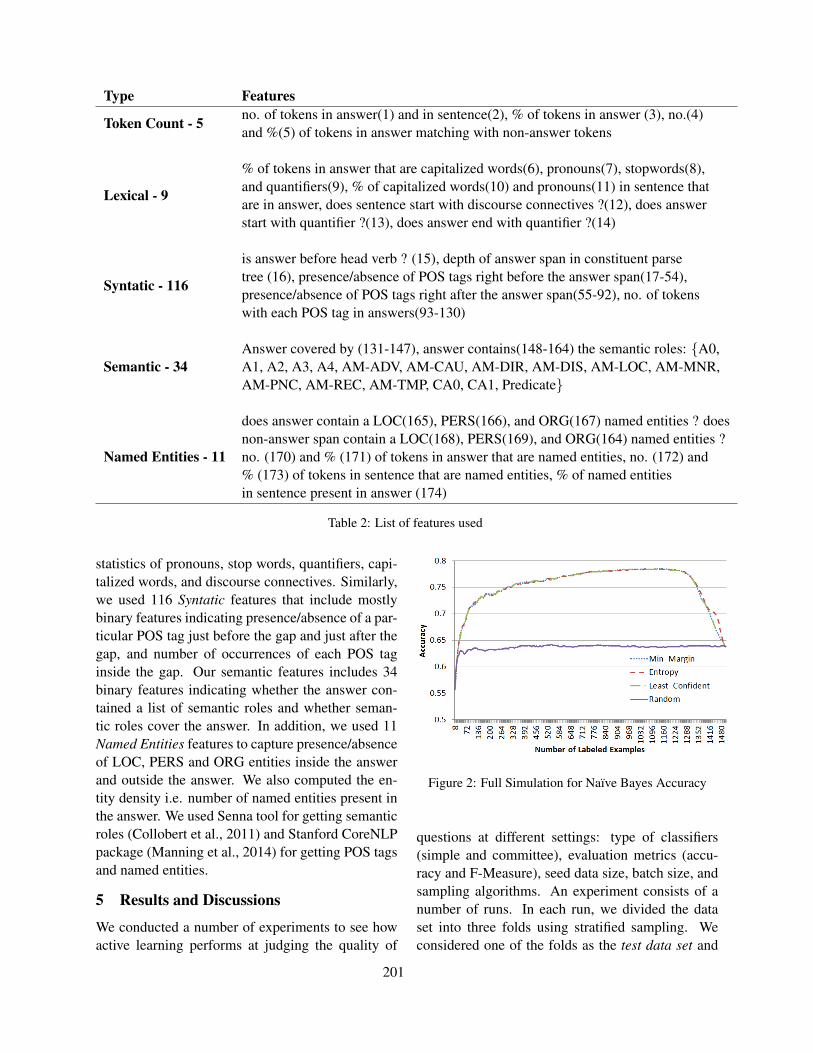
Type Features
Token Count - 5 no. of tokens in answer(1) and in sentence(2), % of tokens in answer (3), no.(4)and %(5) of tokens in answer matching with non-answer tokens
Lexical - 9
% of tokens in answer that are capitalized words(6), pronouns(7), stopwords(8),and quantifiers(9), % of capitalized words(10) and pronouns(11) in sentence thatare in answer, does sentence start with discourse connectives ?(12), does answerstart with quantifier ?(13), does answer end with quantifier ?(14)
Syntatic - 116
is answer before head verb ? (15), depth of answer span in constituent parsetree (16), presence/absence of POS tags right before the answer span(17-54),presence/absence of POS tags right after the answer span(55-92), no. of tokenswith each POS tag in answers(93-130)
Semantic - 34Answer covered by (131-147), answer contains(148-164) the semantic roles: {A0,A1, A2, A3, A4, AM-ADV, AM-CAU, AM-DIR, AM-DIS, AM-LOC, AM-MNR,AM-PNC, AM-REC, AM-TMP, CA0, CA1, Predicate}
Named Entities - 11
does answer contain a LOC(165), PERS(166), and ORG(167) named entities ? doesnon-answer span contain a LOC(168), PERS(169), and ORG(164) named entities ?no. (170) and % (171) of tokens in answer that are named entities, no. (172) and% (173) of tokens in sentence that are named entities, % of named entitiesin sentence present in answer (174)
Table 2: List of features used
statistics of pronouns, stop words, quantifiers, capi-talized words, and discourse connectives. Similarly,we used 116 Syntatic features that include mostlybinary features indicating presence/absence of a par-ticular POS tag just before the gap and just after thegap, and number of occurrences of each POS taginside the gap. Our semantic features includes 34binary features indicating whether the answer con-tained a list of semantic roles and whether seman-tic roles cover the answer. In addition, we used 11Named Entities features to capture presence/absenceof LOC, PERS and ORG entities inside the answerand outside the answer. We also computed the en-tity density i.e. number of named entities present inthe answer. We used Senna tool for getting semanticroles (Collobert et al., 2011) and Stanford CoreNLPpackage (Manning et al., 2014) for getting POS tagsand named entities.
5 Results and Discussions
We conducted a number of experiments to see howactive learning performs at judging the quality of
Figure 2: Full Simulation for Naıve Bayes Accuracy
questions at different settings: type of classifiers(simple and committee), evaluation metrics (accu-racy and F-Measure), seed data size, batch size, andsampling algorithms. An experiment consists of anumber of runs. In each run, we divided the dataset into three folds using stratified sampling. Weconsidered one of the folds as the test data set and
201
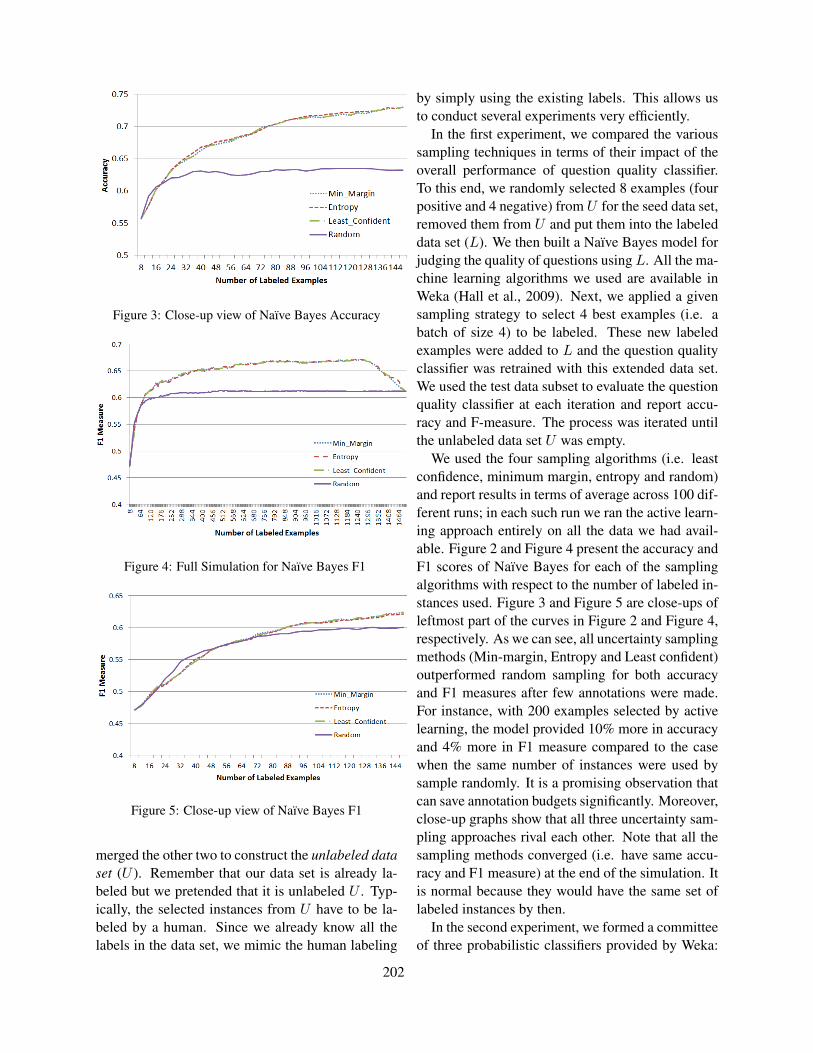
Figure 3: Close-up view of Naıve Bayes Accuracy
Figure 4: Full Simulation for Naıve Bayes F1
Figure 5: Close-up view of Naıve Bayes F1
merged the other two to construct the unlabeled dataset (U ). Remember that our data set is already la-beled but we pretended that it is unlabeled U . Typ-ically, the selected instances from U have to be la-beled by a human. Since we already know all thelabels in the data set, we mimic the human labeling
by simply using the existing labels. This allows usto conduct several experiments very efficiently.
In the first experiment, we compared the varioussampling techniques in terms of their impact of theoverall performance of question quality classifier.To this end, we randomly selected 8 examples (fourpositive and 4 negative) from U for the seed data set,removed them from U and put them into the labeleddata set (L). We then built a Naıve Bayes model forjudging the quality of questions using L. All the ma-chine learning algorithms we used are available inWeka (Hall et al., 2009). Next, we applied a givensampling strategy to select 4 best examples (i.e. abatch of size 4) to be labeled. These new labeledexamples were added to L and the question qualityclassifier was retrained with this extended data set.We used the test data subset to evaluate the questionquality classifier at each iteration and report accu-racy and F-measure. The process was iterated untilthe unlabeled data set U was empty.
We used the four sampling algorithms (i.e. leastconfidence, minimum margin, entropy and random)and report results in terms of average across 100 dif-ferent runs; in each such run we ran the active learn-ing approach entirely on all the data we had avail-able. Figure 2 and Figure 4 present the accuracy andF1 scores of Naıve Bayes for each of the samplingalgorithms with respect to the number of labeled in-stances used. Figure 3 and Figure 5 are close-ups ofleftmost part of the curves in Figure 2 and Figure 4,respectively. As we can see, all uncertainty samplingmethods (Min-margin, Entropy and Least confident)outperformed random sampling for both accuracyand F1 measures after few annotations were made.For instance, with 200 examples selected by activelearning, the model provided 10% more in accuracyand 4% more in F1 measure compared to the casewhen the same number of instances were used bysample randomly. It is a promising observation thatcan save annotation budgets significantly. Moreover,close-up graphs show that all three uncertainty sam-pling approaches rival each other. Note that all thesampling methods converged (i.e. have same accu-racy and F1 measure) at the end of the simulation. Itis normal because they would have the same set oflabeled instances by then.
In the second experiment, we formed a committeeof three probabilistic classifiers provided by Weka:
202
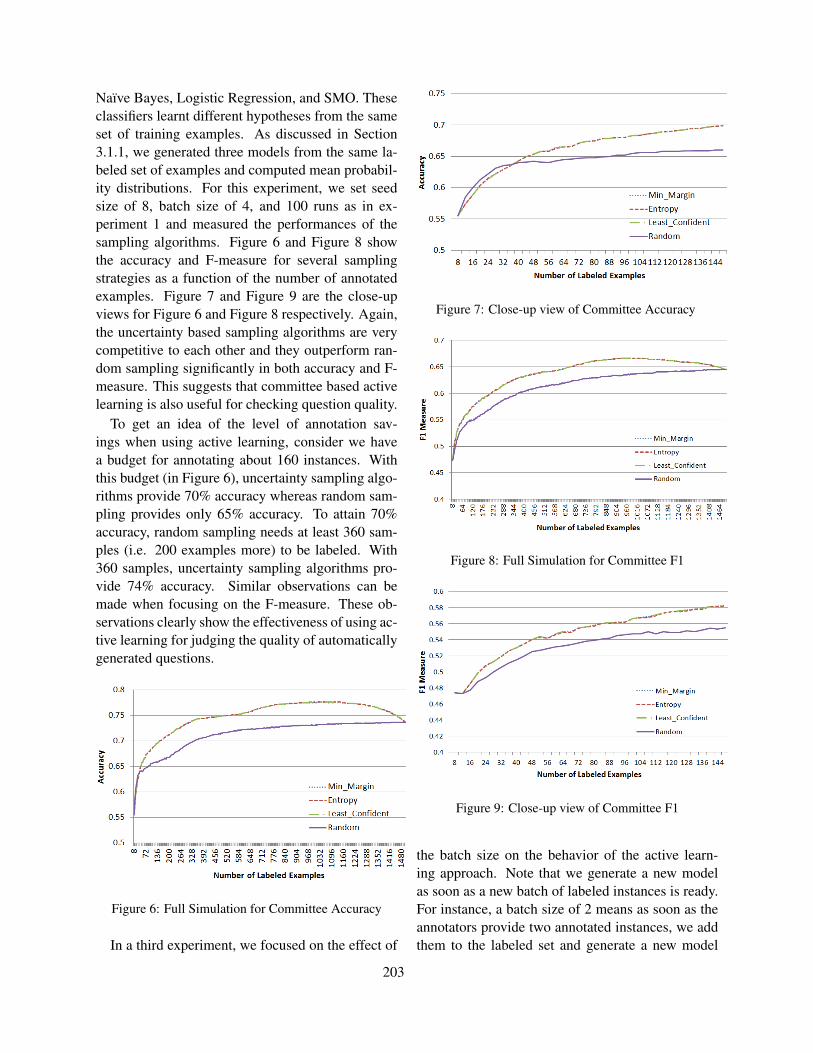
Naıve Bayes, Logistic Regression, and SMO. Theseclassifiers learnt different hypotheses from the sameset of training examples. As discussed in Section3.1.1, we generated three models from the same la-beled set of examples and computed mean probabil-ity distributions. For this experiment, we set seedsize of 8, batch size of 4, and 100 runs as in ex-periment 1 and measured the performances of thesampling algorithms. Figure 6 and Figure 8 showthe accuracy and F-measure for several samplingstrategies as a function of the number of annotatedexamples. Figure 7 and Figure 9 are the close-upviews for Figure 6 and Figure 8 respectively. Again,the uncertainty based sampling algorithms are verycompetitive to each other and they outperform ran-dom sampling significantly in both accuracy and F-measure. This suggests that committee based activelearning is also useful for checking question quality.
To get an idea of the level of annotation sav-ings when using active learning, consider we havea budget for annotating about 160 instances. Withthis budget (in Figure 6), uncertainty sampling algo-rithms provide 70% accuracy whereas random sam-pling provides only 65% accuracy. To attain 70%accuracy, random sampling needs at least 360 sam-ples (i.e. 200 examples more) to be labeled. With360 samples, uncertainty sampling algorithms pro-vide 74% accuracy. Similar observations can bemade when focusing on the F-measure. These ob-servations clearly show the effectiveness of using ac-tive learning for judging the quality of automaticallygenerated questions.
Figure 6: Full Simulation for Committee Accuracy
In a third experiment, we focused on the effect of
Figure 7: Close-up view of Committee Accuracy
Figure 8: Full Simulation for Committee F1
Figure 9: Close-up view of Committee F1
the batch size on the behavior of the active learn-ing approach. Note that we generate a new modelas soon as a new batch of labeled instances is ready.For instance, a batch size of 2 means as soon as theannotators provide two annotated instances, we addthem to the labeled set and generate a new model
203
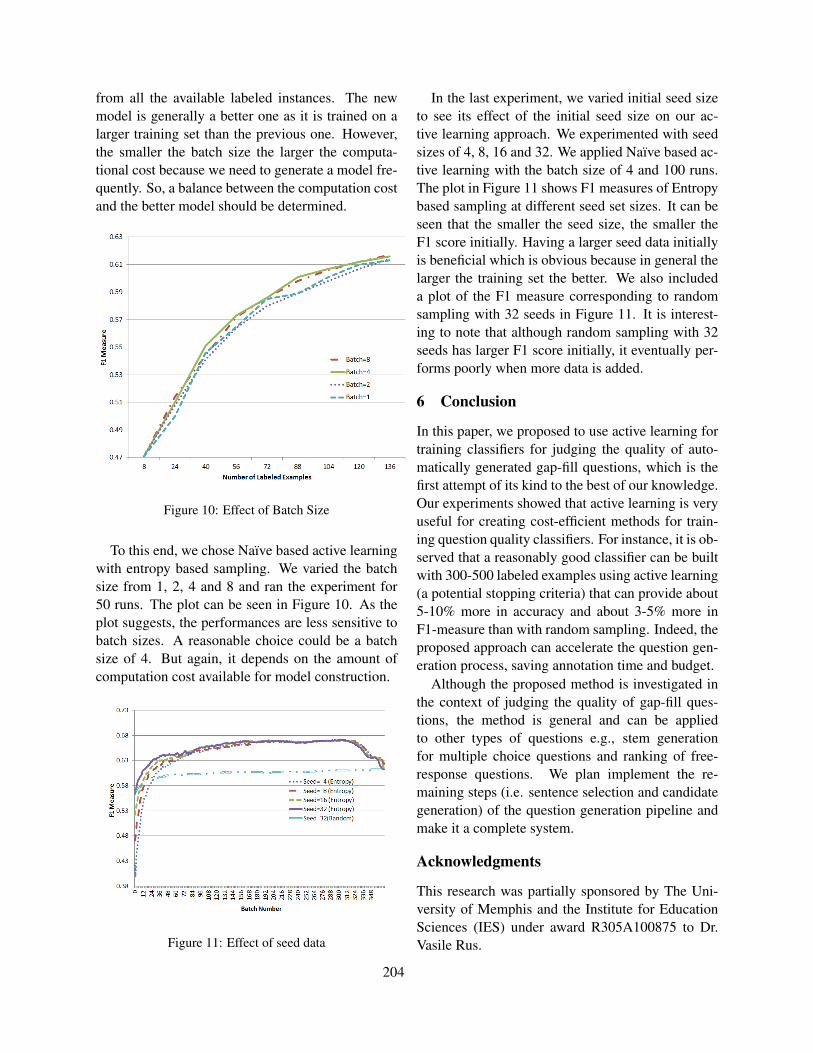
from all the available labeled instances. The newmodel is generally a better one as it is trained on alarger training set than the previous one. However,the smaller the batch size the larger the computa-tional cost because we need to generate a model fre-quently. So, a balance between the computation costand the better model should be determined.
Figure 10: Effect of Batch Size
To this end, we chose Naıve based active learningwith entropy based sampling. We varied the batchsize from 1, 2, 4 and 8 and ran the experiment for50 runs. The plot can be seen in Figure 10. As theplot suggests, the performances are less sensitive tobatch sizes. A reasonable choice could be a batchsize of 4. But again, it depends on the amount ofcomputation cost available for model construction.
Figure 11: Effect of seed data
In the last experiment, we varied initial seed sizeto see its effect of the initial seed size on our ac-tive learning approach. We experimented with seedsizes of 4, 8, 16 and 32. We applied Naıve based ac-tive learning with the batch size of 4 and 100 runs.The plot in Figure 11 shows F1 measures of Entropybased sampling at different seed set sizes. It can beseen that the smaller the seed size, the smaller theF1 score initially. Having a larger seed data initiallyis beneficial which is obvious because in general thelarger the training set the better. We also includeda plot of the F1 measure corresponding to randomsampling with 32 seeds in Figure 11. It is interest-ing to note that although random sampling with 32seeds has larger F1 score initially, it eventually per-forms poorly when more data is added.
6 Conclusion
In this paper, we proposed to use active learning fortraining classifiers for judging the quality of auto-matically generated gap-fill questions, which is thefirst attempt of its kind to the best of our knowledge.Our experiments showed that active learning is veryuseful for creating cost-efficient methods for train-ing question quality classifiers. For instance, it is ob-served that a reasonably good classifier can be builtwith 300-500 labeled examples using active learning(a potential stopping criteria) that can provide about5-10% more in accuracy and about 3-5% more inF1-measure than with random sampling. Indeed, theproposed approach can accelerate the question gen-eration process, saving annotation time and budget.
Although the proposed method is investigated inthe context of judging the quality of gap-fill ques-tions, the method is general and can be appliedto other types of questions e.g., stem generationfor multiple choice questions and ranking of free-response questions. We plan implement the re-maining steps (i.e. sentence selection and candidategeneration) of the question generation pipeline andmake it a complete system.
Acknowledgments
This research was partially sponsored by The Uni-versity of Memphis and the Institute for EducationSciences (IES) under award R305A100875 to Dr.Vasile Rus.
204

ReferencesLee Becker, Sumit Basu, and Lucy Vanderwende. 2012.
Mind the gap: learning to choose gaps for questiongeneration. In Proceedings of the 2012 Conferenceof the North American Chapter of the Association forComputational Linguistics: Human Language Tech-nologies, pages 742–751. Association for Computa-tional Linguistics.
Jonathan C Brown, Gwen A Frishkoff, and Maxine Es-kenazi. 2005. Automatic question generation for vo-cabulary assessment. In Proceedings of the conferenceon Human Language Technology and Empirical Meth-ods in Natural Language Processing, pages 819–826.Association for Computational Linguistics.
Jinying Chen, Andrew Schein, Lyle Ungar, and MarthaPalmer. 2006. An empirical study of the behaviorof active learning for word sense disambiguation. InProceedings of the main conference on Human Lan-guage Technology Conference of the North AmericanChapter of the Association of Computational Linguis-tics, pages 120–127. Association for ComputationalLinguistics.
Ronan Collobert, Jason Weston, Leon Bottou, MichaelKarlen, Koray Kavukcuoglu, and Pavel Kuksa. 2011.Natural language processing (almost) from scratch.The Journal of Machine Learning Research, 12:2493–2537.
Sarah H Eason, Lindsay F Goldberg, Katherine M Young,Megan C Geist, and Laurie E Cutting. 2012. Reader–text interactions: How differential text and questiontypes influence cognitive skills needed for readingcomprehension. Journal of educational psychology,104(3):515.
Arthur C Graesser, Shulan Lu, George Tanner Jackson,Heather Hite Mitchell, Mathew Ventura, Andrew Ol-ney, and Max M Louwerse. 2004. Autotutor: A tutorwith dialogue in natural language. Behavior ResearchMethods, Instruments, & Computers, 36(2):180–192.
Mark Hall, Eibe Frank, Geoffrey Holmes, BernhardPfahringer, Peter Reutemann, and Ian H Witten. 2009.The weka data mining software: an update. ACMSIGKDD explorations newsletter, 11(1):10–18.
Michael Heilman and Noah A Smith. 2009. Ques-tion generation via overgenerating transformations andranking. Technical report, DTIC Document.
Michael Heilman and Noah A Smith. 2010. Goodquestion! statistical ranking for question generation.In Human Language Technologies: The 2010 AnnualConference of the North American Chapter of the As-sociation for Computational Linguistics, pages 609–617. Association for Computational Linguistics.
Ayako Hoshino and Hiroshi Nakagawa. 2005. A real-time multiple-choice question generation for language
testing: a preliminary study. In Proceedings of the sec-ond workshop on Building Educational ApplicationsUsing NLP, pages 17–20. Association for Computa-tional Linguistics.
Ming Liu, Rafael A Calvo, and Vasile Rus. 2012. G-asks: An intelligent automatic question generationsystem for academic writing support. Dialogue & Dis-course, 3(2):101–124.
Christopher D Manning, Mihai Surdeanu, John Bauer,Jenny Finkel, Steven J Bethard, and David McClosky.2014. The stanford corenlp natural language process-ing toolkit. In Proceedings of 52nd Annual Meeting ofthe Association for Computational Linguistics: SystemDemonstrations, pages 55–60.
Karen Mazidi and Rodney D Nielsen. 2014a. Linguis-tic considerations in automatic question generation.In Proceedings of Association for Computational Lin-guistics, pages 321–326.
Karen Mazidi and Rodney D Nielsen. 2014b. Pedagogi-cal evaluation of automatically generated questions. InIntelligent Tutoring Systems, pages 294–299. Springer.
Rada Mihalcea. 2004. Graph-based ranking algorithmsfor sentence extraction, applied to text summarization.In Proceedings of the ACL 2004 on Interactive posterand demonstration sessions, page 20. Association forComputational Linguistics.
Ruslan Mitkov, Le An Ha, and Nikiforos Karamanis.2006. A computer-aided environment for generatingmultiple-choice test items. Natural Language Engi-neering, 12(2):177–194.
Nobal B Niraula, Vasile Rus, Dan Stefanescu, andArthur C Graesser. 2014. Mining gap-fill questionsfrom tutorial dialogues. pages 265–268.
MJ Pollock, CD Whittington, and GF Doughty. 2000.Evaluating the costs and benefits of changing to caa.In Proceedings of the 4th CAA Conference.
Eric Ringger, Peter McClanahan, Robbie Haertel, GeorgeBusby, Marc Carmen, James Carroll, Kevin Seppi, andDeryle Lonsdale. 2007. Active learning for part-of-speech tagging: Accelerating corpus annotation. InProceedings of the Linguistic Annotation Workshop,pages 101–108. Association for Computational Lin-guistics.
Vasile Rus and Arthur C Graesser. 2009. The questiongeneration shared task and evaluation challenge. InThe University of Memphis. National Science Founda-tion.
Vasile Rus, Brendan Wyse, Paul Piwek, Mihai Lin-tean, Svetlana Stoyanchev, and Cristian Moldovan.2010. The first question generation shared task eval-uation challenge. In Proceedings of the 6th Inter-national Natural Language Generation Conference,pages 251–257. Association for Computational Lin-guistics.
205
Vasile Rus, Nobal Niraula, Mihai Lintean, Rajen-dra Banjade, Dan Stefanescu, and William Baggett.2013. Recommendations for the generalized intelli-gent framework for tutoring based on the developmentof the deeptutor tutoring service. In AIED 2013 Work-shops Proceedings, volume 7, page 116.
Burr Settles and Mark Craven. 2008. An analysis of ac-tive learning strategies for sequence labeling tasks. InProceedings of the Conference on Empirical Methodsin Natural Language Processing, pages 1070–1079.Association for Computational Linguistics.
Dan Shen, Jie Zhang, Jian Su, Guodong Zhou, and Chew-Lim Tan. 2004. Multi-criteria-based active learningfor named entity recognition. In Proceedings of the42nd Annual Meeting on Association for Computa-tional Linguistics, page 589. Association for Compu-tational Linguistics.
Jason D Williams, Nobal B Niraula, Pradeep Dasigi,Aparna Lakshmiratan, Carlos Garcia Jurado Suarez,Mouni Reddy, and Geoff Zweig. 2015. Rapidly scal-ing dialog systems with interactive learning.
206
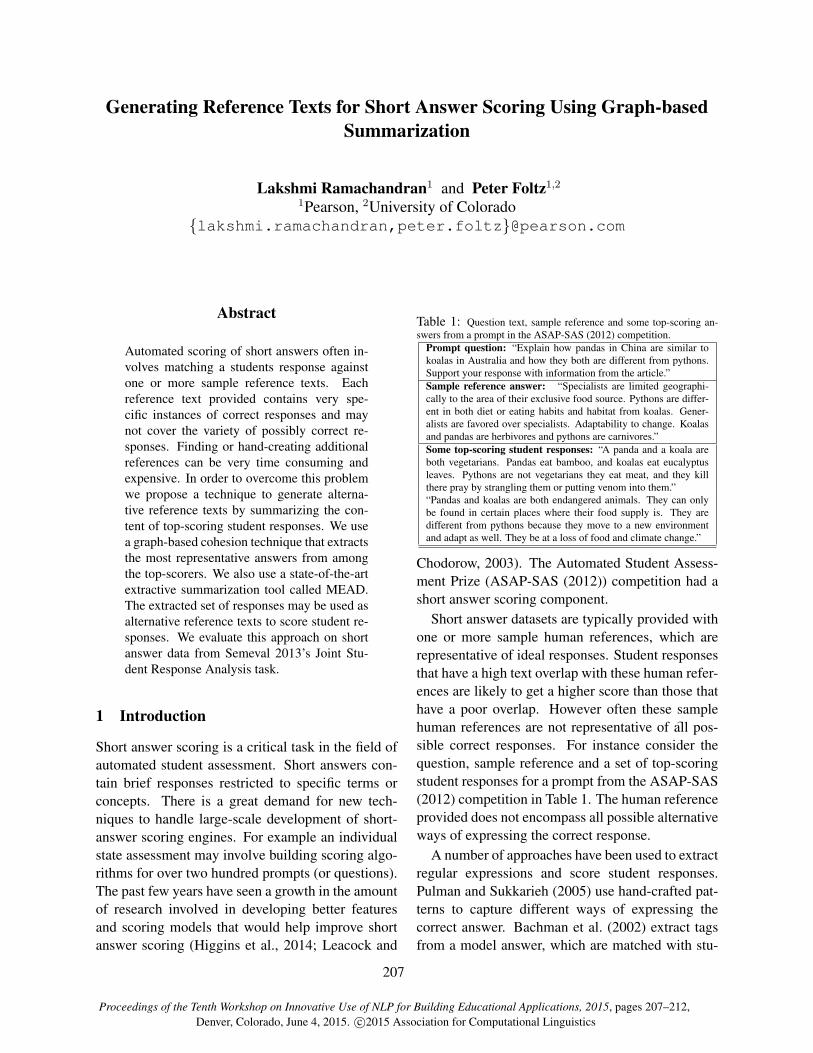
Proceedings of the Tenth Workshop on Innovative Use of NLP for Building Educational Applications, 2015, pages 207–212,Denver, Colorado, June 4, 2015. c©2015 Association for Computational Linguistics
Generating Reference Texts for Short Answer Scoring Using Graph-basedSummarization
Lakshmi Ramachandran1 and Peter Foltz1,2
1Pearson, 2University of Colorado{lakshmi.ramachandran,peter.foltz}@pearson.com
Abstract
Automated scoring of short answers often in-volves matching a students response againstone or more sample reference texts. Eachreference text provided contains very spe-cific instances of correct responses and maynot cover the variety of possibly correct re-sponses. Finding or hand-creating additionalreferences can be very time consuming andexpensive. In order to overcome this problemwe propose a technique to generate alterna-tive reference texts by summarizing the con-tent of top-scoring student responses. We usea graph-based cohesion technique that extractsthe most representative answers from amongthe top-scorers. We also use a state-of-the-artextractive summarization tool called MEAD.The extracted set of responses may be used asalternative reference texts to score student re-sponses. We evaluate this approach on shortanswer data from Semeval 2013’s Joint Stu-dent Response Analysis task.
1 Introduction
Short answer scoring is a critical task in the field ofautomated student assessment. Short answers con-tain brief responses restricted to specific terms orconcepts. There is a great demand for new tech-niques to handle large-scale development of short-answer scoring engines. For example an individualstate assessment may involve building scoring algo-rithms for over two hundred prompts (or questions).The past few years have seen a growth in the amountof research involved in developing better featuresand scoring models that would help improve shortanswer scoring (Higgins et al., 2014; Leacock and
Table 1: Question text, sample reference and some top-scoring an-swers from a prompt in the ASAP-SAS (2012) competition.
Prompt question: “Explain how pandas in China are similar tokoalas in Australia and how they both are different from pythons.Support your response with information from the article.”Sample reference answer: “Specialists are limited geographi-cally to the area of their exclusive food source. Pythons are differ-ent in both diet or eating habits and habitat from koalas. Gener-alists are favored over specialists. Adaptability to change. Koalasand pandas are herbivores and pythons are carnivores.”Some top-scoring student responses: “A panda and a koala areboth vegetarians. Pandas eat bamboo, and koalas eat eucalyptusleaves. Pythons are not vegetarians they eat meat, and they killthere pray by strangling them or putting venom into them.”“Pandas and koalas are both endangered animals. They can onlybe found in certain places where their food supply is. They aredifferent from pythons because they move to a new environmentand adapt as well. They be at a loss of food and climate change.”
Chodorow, 2003). The Automated Student Assess-ment Prize (ASAP-SAS (2012)) competition had ashort answer scoring component.
Short answer datasets are typically provided withone or more sample human references, which arerepresentative of ideal responses. Student responsesthat have a high text overlap with these human refer-ences are likely to get a higher score than those thathave a poor overlap. However often these samplehuman references are not representative of �all pos-sible correct responses. For instance consider thequestion, sample reference and a set of top-scoringstudent responses for a prompt from the ASAP-SAS(2012) competition in Table 1. The human referenceprovided does not encompass all possible alternativeways of expressing the correct response.
A number of approaches have been used to extractregular expressions and score student responses.Pulman and Sukkarieh (2005) use hand-crafted pat-terns to capture different ways of expressing thecorrect answer. Bachman et al. (2002) extract tagsfrom a model answer, which are matched with stu-
207
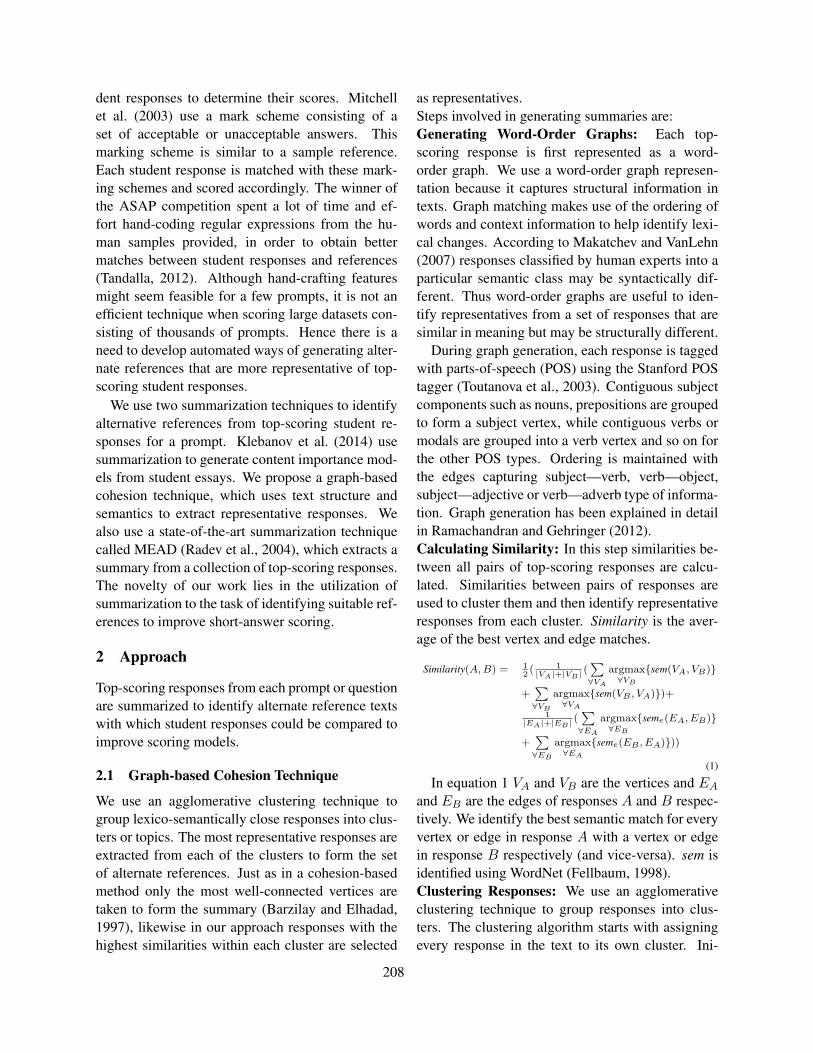
dent responses to determine their scores. Mitchellet al. (2003) use a mark scheme consisting of aset of acceptable or unacceptable answers. Thismarking scheme is similar to a sample reference.Each student response is matched with these mark-ing schemes and scored accordingly. The winner ofthe ASAP competition spent a lot of time and ef-fort hand-coding regular expressions from the hu-man samples provided, in order to obtain bettermatches between student responses and references(Tandalla, 2012). Although hand-crafting featuresmight seem feasible for a few prompts, it is not anefficient technique when scoring large datasets con-sisting of thousands of prompts. Hence there is aneed to develop automated ways of generating alter-nate references that are more representative of top-scoring student responses.
We use two summarization techniques to identifyalternative references from top-scoring student re-sponses for a prompt. Klebanov et al. (2014) usesummarization to generate content importance mod-els from student essays. We propose a graph-basedcohesion technique, which uses text structure andsemantics to extract representative responses. Wealso use a state-of-the-art summarization techniquecalled MEAD (Radev et al., 2004), which extracts asummary from a collection of top-scoring responses.The novelty of our work lies in the utilization ofsummarization to the task of identifying suitable ref-erences to improve short-answer scoring.
2 Approach
Top-scoring responses from each prompt or questionare summarized to identify alternate reference textswith which student responses could be compared toimprove scoring models.
2.1 Graph-based Cohesion Technique
We use an agglomerative clustering technique togroup lexico-semantically close responses into clus-ters or topics. The most representative responses areextracted from each of the clusters to form the setof alternate references. Just as in a cohesion-basedmethod only the most well-connected vertices aretaken to form the summary (Barzilay and Elhadad,1997), likewise in our approach responses with thehighest similarities within each cluster are selected
as representatives.Steps involved in generating summaries are:Generating Word-Order Graphs: Each top-scoring response is first represented as a word-order graph. We use a word-order graph represen-tation because it captures structural information intexts. Graph matching makes use of the ordering ofwords and context information to help identify lexi-cal changes. According to Makatchev and VanLehn(2007) responses classified by human experts into aparticular semantic class may be syntactically dif-ferent. Thus word-order graphs are useful to iden-tify representatives from a set of responses that aresimilar in meaning but may be structurally different.
During graph generation, each response is taggedwith parts-of-speech (POS) using the Stanford POStagger (Toutanova et al., 2003). Contiguous subjectcomponents such as nouns, prepositions are groupedto form a subject vertex, while contiguous verbs ormodals are grouped into a verb vertex and so on forthe other POS types. Ordering is maintained withthe edges capturing subject—verb, verb—object,subject—adjective or verb—adverb type of informa-tion. Graph generation has been explained in detailin Ramachandran and Gehringer (2012).Calculating Similarity: In this step similarities be-tween all pairs of top-scoring responses are calcu-lated. Similarities between pairs of responses areused to cluster them and then identify representativeresponses from each cluster. Similarity is the aver-age of the best vertex and edge matches.
Similarity(A, B) = 12( 1|VA|+|VB | (
∑∀VA
argmax∀VB
{sem(VA, VB)}
+∑∀VB
argmax∀VA
{sem(VB , VA)})+1
|EA|+|EB | (∑∀EA
argmax∀EB
{seme(EA, EB)}
+∑∀EB
argmax∀EA
{seme(EB , EA)}))
(1)
In equation 1 VA and VB are the vertices and EA
and EB are the edges of responses A and B respec-tively. We identify the best semantic match for everyvertex or edge in response A with a vertex or edgein response B respectively (and vice-versa). sem isidentified using WordNet (Fellbaum, 1998).Clustering Responses: We use an agglomerativeclustering technique to group responses into clus-ters. The clustering algorithm starts with assigningevery response in the text to its own cluster. Ini-
208

tially every cluster’s similarity is set to 0. A cluster’ssimilarity is the average of the similarity between allpairs of responses it contains.
We rank response pairs based on their similarity(highest to lowest) using merge sort, and assign oneresponse in a pair to the other’s cluster provided itsatisfies the condition in Equation 2. The conditionensures that a response (S) that is added to a cluster(C) has high similarity, i.e., is close in meaning andcontext to that cluster’s responses (SC).(C.clusterSimilarity−
∑∀SC∈C
Similarity(S, SC)|C|
)≤ α (2)
The choice of cluster to which a response is addeddepends on the cluster’s similarity, i.e., a response isadded to the cluster with higher similarity. If bothresponses (in the pair) have same cluster similari-ties, then the larger cluster is chosen as the target.If cluster similarity and the number of responses arethe same, then the target is selected randomly.Identifying Representatives: In this step the mostrepresentative responses from each cluster are iden-tified. The aim is to identify the smallest set of rep-resentatives that cover every other response in thecluster. We use a list heuristic to handle this prob-lem (Avis and Imamura, 2007). We order responsesin every cluster based on (a) decreasing order of theiraverage similarity values, and (b) decreasing orderof the number of responses they are adjacent to.
Our approach ensures that responses with thehighest semantic similarity that cover previouslyuncovered responses are selected. Representativesfrom all clusters are grouped together to generate therepresentative responses for a prompt.
2.2 MEAD
We use MEAD as an alternative summarization ap-proach. Radev et al. (2004) proposed the use an au-tomated multi-document summarization techniquecalled MEAD. MEAD was developed at the Univer-sity of Michigan as a centroid-based summarizationapproach. MEAD is an extractive summarizationapproach that relies on three features: position, cen-troid and the length of sentences to identify the sum-mary. MEAD’s classifier computes a score for eachsentence in the document using a linear combinationof these three features. Sentences are then ranked
based on their scores and the top ranking sentencesare extracted to generate summaries. The extractioncan be restricted to the top N words to generate asummary of specified length.
In our study each document contains a list of top-scoring responses from the dataset, i.e., each top-scoring response would constitute a sentence. Forour study we use MEAD1 to extract summaries oflength that match the lengths of the summaries gen-erated by the graph-based cohesion technique.
3 Experiment
3.1 Data
Semeval’s Student Response Analysis (SRA) corpuscontains short answers from two different sources:Beetle and SciEntsBank (Dzikovska et al., 2013)2.Beetle contains responses extracted from transcriptsof interactions between students and the Beetle II tu-toring system (Dzikovska et al., 2010). The SciEnts-Bank dataset contains short responses to questionscollected by Nielsen et al. (2008).
Beetle contains 47 questions and 4380 student re-sponses, and SciEntsBank contains 135 questionsand 5509 student responses (Dzikovska et al., 2013).Each dataset is classified as: (1) 5-way, (2) 3-way and (3) 2-way. The data in the SRA corpuswas annotated as follows for the 5-way classifica-tion: correct: student response that is correct, par-tially correct incomplete: response that is correctbut does not contain all the information in the ref-erence text, contradictory: response that contradictsthe reference answer, irrelevant: response that is rel-evant to the domain but does not contain informationin the reference, non domain: response is not rele-vant to the domain. The 3-way classification con-tains the contradictory, correct and incorrect classes,while the 2-way classification contains correct andincorrect classes.
Dzikovska et al. (2013) provide a summary of theresults achieved by teams that participated in thistask. Apart from the dataset, the organizing com-mittee also released code for a baseline, which in-cluded lexical overlap measures. These measures
1We use the code for MEAD (version 3.10) available athttp://www.summarization.com/mead/.
2The data is available at http://www.cs.york.ac.uk/semeval-2013/task7/index.php?id=data
209
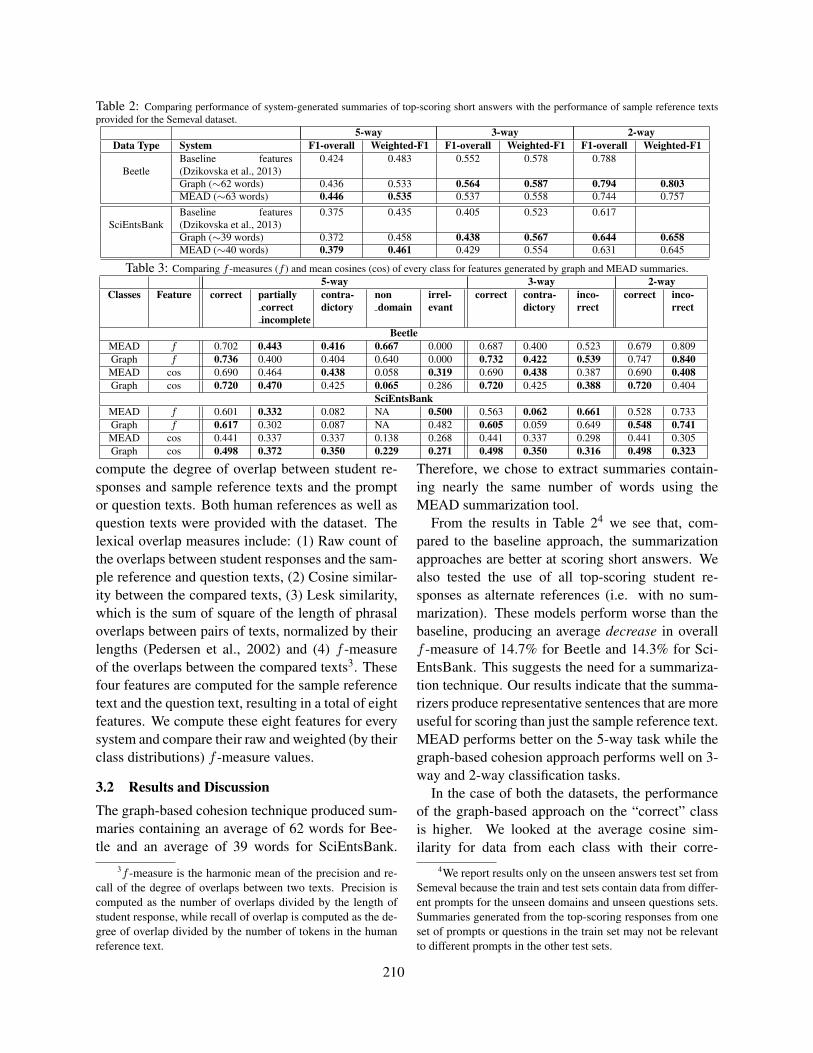
Table 2: Comparing performance of system-generated summaries of top-scoring short answers with the performance of sample reference textsprovided for the Semeval dataset.
5-way 3-way 2-wayData Type System F1-overall Weighted-F1 F1-overall Weighted-F1 F1-overall Weighted-F1
BeetleBaseline features(Dzikovska et al., 2013)
0.424 0.483 0.552 0.578 0.788
Graph (∼62 words) 0.436 0.533 0.564 0.587 0.794 0.803MEAD (∼63 words) 0.446 0.535 0.537 0.558 0.744 0.757
SciEntsBankBaseline features(Dzikovska et al., 2013)
0.375 0.435 0.405 0.523 0.617
Graph (∼39 words) 0.372 0.458 0.438 0.567 0.644 0.658MEAD (∼40 words) 0.379 0.461 0.429 0.554 0.631 0.645
Table 3: Comparing f -measures (f ) and mean cosines (cos) of every class for features generated by graph and MEAD summaries.5-way 3-way 2-way
Classes Feature correct partiallycorrectincomplete
contra-dictory
nondomain
irrel-evant
correct contra-dictory
inco-rrect
correct inco-rrect
BeetleMEAD f 0.702 0.443 0.416 0.667 0.000 0.687 0.400 0.523 0.679 0.809Graph f 0.736 0.400 0.404 0.640 0.000 0.732 0.422 0.539 0.747 0.840MEAD cos 0.690 0.464 0.438 0.058 0.319 0.690 0.438 0.387 0.690 0.408Graph cos 0.720 0.470 0.425 0.065 0.286 0.720 0.425 0.388 0.720 0.404
SciEntsBankMEAD f 0.601 0.332 0.082 NA 0.500 0.563 0.062 0.661 0.528 0.733Graph f 0.617 0.302 0.087 NA 0.482 0.605 0.059 0.649 0.548 0.741MEAD cos 0.441 0.337 0.337 0.138 0.268 0.441 0.337 0.298 0.441 0.305Graph cos 0.498 0.372 0.350 0.229 0.271 0.498 0.350 0.316 0.498 0.323
compute the degree of overlap between student re-sponses and sample reference texts and the promptor question texts. Both human references as well asquestion texts were provided with the dataset. Thelexical overlap measures include: (1) Raw count ofthe overlaps between student responses and the sam-ple reference and question texts, (2) Cosine similar-ity between the compared texts, (3) Lesk similarity,which is the sum of square of the length of phrasaloverlaps between pairs of texts, normalized by theirlengths (Pedersen et al., 2002) and (4) f -measureof the overlaps between the compared texts3. Thesefour features are computed for the sample referencetext and the question text, resulting in a total of eightfeatures. We compute these eight features for everysystem and compare their raw and weighted (by theirclass distributions) f -measure values.
3.2 Results and DiscussionThe graph-based cohesion technique produced sum-maries containing an average of 62 words for Bee-tle and an average of 39 words for SciEntsBank.
3f -measure is the harmonic mean of the precision and re-call of the degree of overlaps between two texts. Precision iscomputed as the number of overlaps divided by the length ofstudent response, while recall of overlap is computed as the de-gree of overlap divided by the number of tokens in the humanreference text.
Therefore, we chose to extract summaries contain-ing nearly the same number of words using theMEAD summarization tool.
From the results in Table 24 we see that, com-pared to the baseline approach, the summarizationapproaches are better at scoring short answers. Wealso tested the use of all top-scoring student re-sponses as alternate references (i.e. with no sum-marization). These models perform worse than thebaseline, producing an average decrease in overallf -measure of 14.7% for Beetle and 14.3% for Sci-EntsBank. This suggests the need for a summariza-tion technique. Our results indicate that the summa-rizers produce representative sentences that are moreuseful for scoring than just the sample reference text.MEAD performs better on the 5-way task while thegraph-based cohesion approach performs well on 3-way and 2-way classification tasks.
In the case of both the datasets, the performanceof the graph-based approach on the “correct” classis higher. We looked at the average cosine sim-ilarity for data from each class with their corre-
4We report results only on the unseen answers test set fromSemeval because the train and test sets contain data from differ-ent prompts for the unseen domains and unseen questions sets.Summaries generated from the top-scoring responses from oneset of prompts or questions in the train set may not be relevantto different prompts in the other test sets.
210
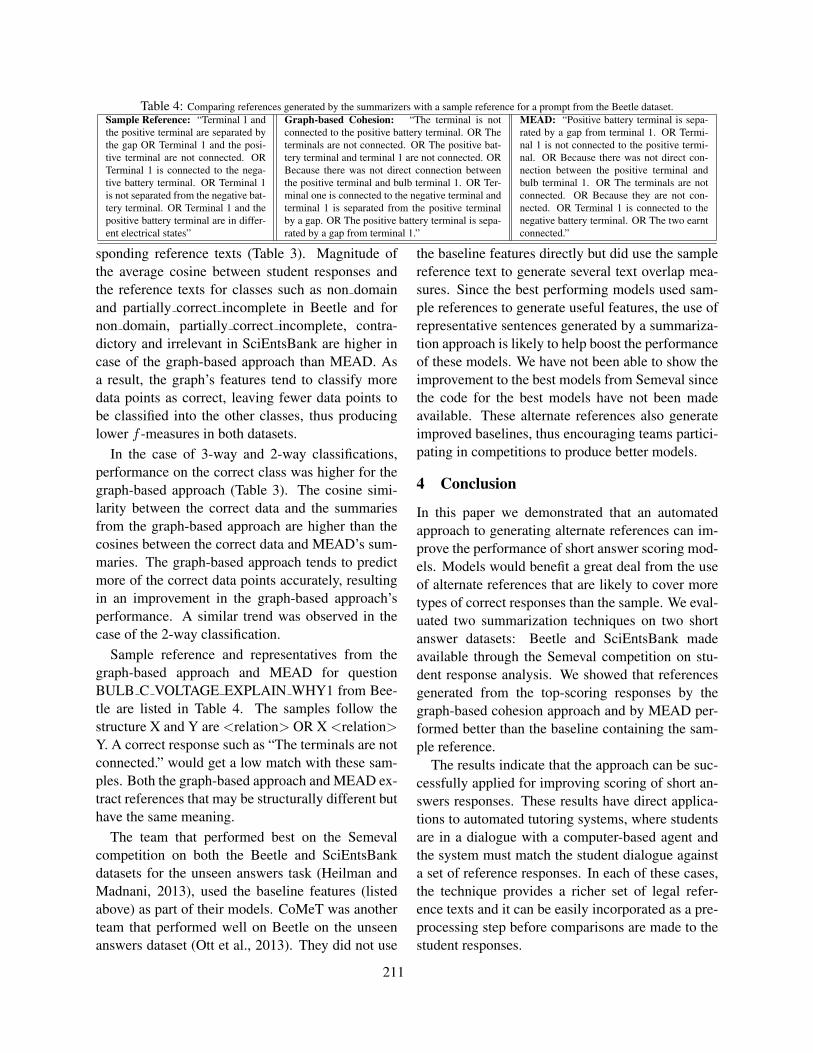
Table 4: Comparing references generated by the summarizers with a sample reference for a prompt from the Beetle dataset.Sample Reference: “Terminal 1 andthe positive terminal are separated bythe gap OR Terminal 1 and the posi-tive terminal are not connected. ORTerminal 1 is connected to the nega-tive battery terminal. OR Terminal 1is not separated from the negative bat-tery terminal. OR Terminal 1 and thepositive battery terminal are in differ-ent electrical states”
Graph-based Cohesion: “The terminal is notconnected to the positive battery terminal. OR Theterminals are not connected. OR The positive bat-tery terminal and terminal 1 are not connected. ORBecause there was not direct connection betweenthe positive terminal and bulb terminal 1. OR Ter-minal one is connected to the negative terminal andterminal 1 is separated from the positive terminalby a gap. OR The positive battery terminal is sepa-rated by a gap from terminal 1.”
MEAD: “Positive battery terminal is sepa-rated by a gap from terminal 1. OR Termi-nal 1 is not connected to the positive termi-nal. OR Because there was not direct con-nection between the positive terminal andbulb terminal 1. OR The terminals are notconnected. OR Because they are not con-nected. OR Terminal 1 is connected to thenegative battery terminal. OR The two earntconnected.”
sponding reference texts (Table 3). Magnitude ofthe average cosine between student responses andthe reference texts for classes such as non domainand partially correct incomplete in Beetle and fornon domain, partially correct incomplete, contra-dictory and irrelevant in SciEntsBank are higher incase of the graph-based approach than MEAD. Asa result, the graph’s features tend to classify moredata points as correct, leaving fewer data points tobe classified into the other classes, thus producinglower f -measures in both datasets.
In the case of 3-way and 2-way classifications,performance on the correct class was higher for thegraph-based approach (Table 3). The cosine simi-larity between the correct data and the summariesfrom the graph-based approach are higher than thecosines between the correct data and MEAD’s sum-maries. The graph-based approach tends to predictmore of the correct data points accurately, resultingin an improvement in the graph-based approach’sperformance. A similar trend was observed in thecase of the 2-way classification.
Sample reference and representatives from thegraph-based approach and MEAD for questionBULB C VOLTAGE EXPLAIN WHY1 from Bee-tle are listed in Table 4. The samples follow thestructure X and Y are <relation> OR X <relation>Y. A correct response such as “The terminals are notconnected.” would get a low match with these sam-ples. Both the graph-based approach and MEAD ex-tract references that may be structurally different buthave the same meaning.
The team that performed best on the Semevalcompetition on both the Beetle and SciEntsBankdatasets for the unseen answers task (Heilman andMadnani, 2013), used the baseline features (listedabove) as part of their models. CoMeT was anotherteam that performed well on Beetle on the unseenanswers dataset (Ott et al., 2013). They did not use
the baseline features directly but did use the samplereference text to generate several text overlap mea-sures. Since the best performing models used sam-ple references to generate useful features, the use ofrepresentative sentences generated by a summariza-tion approach is likely to help boost the performanceof these models. We have not been able to show theimprovement to the best models from Semeval sincethe code for the best models have not been madeavailable. These alternate references also generateimproved baselines, thus encouraging teams partici-pating in competitions to produce better models.
4 Conclusion
In this paper we demonstrated that an automatedapproach to generating alternate references can im-prove the performance of short answer scoring mod-els. Models would benefit a great deal from the useof alternate references that are likely to cover moretypes of correct responses than the sample. We eval-uated two summarization techniques on two shortanswer datasets: Beetle and SciEntsBank madeavailable through the Semeval competition on stu-dent response analysis. We showed that referencesgenerated from the top-scoring responses by thegraph-based cohesion approach and by MEAD per-formed better than the baseline containing the sam-ple reference.
The results indicate that the approach can be suc-cessfully applied for improving scoring of short an-swers responses. These results have direct applica-tions to automated tutoring systems, where studentsare in a dialogue with a computer-based agent andthe system must match the student dialogue againsta set of reference responses. In each of these cases,the technique provides a richer set of legal refer-ence texts and it can be easily incorporated as a pre-processing step before comparisons are made to thestudent responses.
211
ReferencesASAP-SAS. 2012. Scoring short answer essays. ASAP
short answer scoring competition system description.http://www.kaggle.com/c/asap-sas/.
David Avis and Tomokazu Imamura. 2007. A list heuris-tic for vertex cover. volume 35, pages 201–204. Else-vier.
Lyle F Bachman, Nathan Carr, Greg Kamei, MikyungKim, Michael J Pan, Chris Salvador, and YasuyoSawaki. 2002. A reliable approach to automatic as-sessment of short answer free responses. In Proceed-ings of the 19th international conference on Computa-tional linguistics-Volume 2, pages 1–4. Association forComputational Linguistics.
Regina Barzilay and Michael Elhadad. 1997. Using lex-ical chains for text summarization. In In Proceedingsof the ACL Workshop on Intelligent Scalable Text Sum-marization, pages 10–17.
Myroslava O Dzikovska, Johanna D Moore, NatalieSteinhauser, Gwendolyn Campbell, Elaine Farrow,and Charles B Callaway. 2010. Beetle ii: a sys-tem for tutoring and computational linguistics exper-imentation. In Proceedings of the ACL 2010 SystemDemonstrations, pages 13–18. Association for Com-putational Linguistics.
Myroslava O Dzikovska, Rodney D Nielsen, Chris Brew,Claudia Leacock, Danilo Giampiccolo, Luisa Ben-tivogli, Peter Clark, Ido Dagan, and Hoa T Dang.2013. Semeval-2013 task 7: The joint student re-sponse analysis and 8th recognizing textual entailmentchallenge. Technical report, DTIC Document.
Christiane Fellbaum. 1998. Wordnet: An electronic lex-ical database. MIT Press.
Michael Heilman and Nitin Madnani. 2013. ETS: Do-main adaptation and stacking for short answer scoring.In Proceedings of the 2nd joint conference on lexicaland computational semantics, volume 2.
Derrick Higgins, Chris Brew, Michael Heilman, RamonZiai, Lei Chen, Aoife Cahill, Michael Flor, Nitin Mad-nani, Joel Tetreault, Dan Blanchard, Diane Napoli-tano, Chong Min Lee, and John Blackmore. 2014. Isgetting the right answer just about choosing the rightwords? The role of syntactically-informed features inshort answer scoring. arXiv.
Beata Beigman Klebanov, Nitin Madnani, Swapna Soma-sundaran, and Jill Burstein. 2014. Content importancemodels for scoring writing from sources. In Proceed-ings of the 52nd Annual Meeting of the Associationfor Computational Linguistics (Volume 2: Short Pa-pers), pages 247–252. Association for ComputationalLinguistics.
Claudia Leacock and Martin Chodorow. 2003. C-rater: Automated scoring of short-answer questions.
In Computers and the Humanities, volume 37, pages389–405. Springer.
Maxim Makatchev and Kurt VanLehn. 2007. Combiningbayesian networks and formal reasoning for semanticclassification of student utterances. In Proceedings ofthe 2007 Conference on Artificial Intelligence in Ed-ucation: Building Technology Rich Learning ContextsThat Work, pages 307–314, Amsterdam, The Nether-lands.
Tom Mitchell, Nicola Aldridge, and Peter Broomhead.2003. Computerised marking of short-answer free-text responses. In Manchester IAEA conference.
Rodney D Nielsen, Wayne Ward, James H Martin, andMartha Palmer. 2008. Annotating students’ under-standing of science concepts. In LREC.
Niels Ott, Ramon Ziai, Michael Hahn, and Detmar Meur-ers. 2013. Comet: integrating different levels of lin-guistic modeling for meaning assessment.
Ted Pedersen, Satanjeev Banerjee, and Siddharth Pat-wardhan. 2002. Lesk similarity. http://search.cpan.org/dist/Text-Similarity/lib/Text/Similarity/Overlaps.pm.
Stephen G Pulman and Jana Z Sukkarieh. 2005. Au-tomatic short answer marking. In Proceedings of thesecond workshop on Building Educational Applica-tions Using NLP, pages 9–16.
Dragomir R Radev, Hongyan Jing, Małgorzata Stys, andDaniel Tam. 2004. Centroid-based summarization ofmultiple documents. Information Processing & Man-agement, 40(6):919–938.
Lakshmi Ramachandran and Edward F. Gehringer. 2012.A word-order based graph representation for relevanceidentification (poster). Proceedings of the 21st ACMConference on Information and Knowledge Manage-ment, pages 2327–2330, October.
Luis Tandalla. 2012. Scoring short answer essays. ASAPshort answer scoring competition–Luis Tandalla’sapproach. https://kaggle2.blob.core.windows.net/competitions/kaggle/2959/media/TechnicalMethodsPaper.pdf.
Kristina Toutanova, Dan Klein, Christopher D. Manning,and Yoram Singer. 2003. Feature-rich part-of-speechtagging with a cyclic dependency network. In In Pro-ceedings of HLT-NAACL, pages 252–259.
212
Proceedings of the Tenth Workshop on Innovative Use of NLP for Building Educational Applications, 2015, pages 213–223,Denver, Colorado, June 4, 2015. c©2015 Association for Computational Linguistics
Evaluating the performance of Automated Text Scoring systems
Helen YannakoudakisThe ALTA Institute
Computer LaboratoryUniversity of Cambridge
Ronan CumminsThe ALTA Institute
Computer LaboratoryUniversity of Cambridge
Abstract
Various measures have been used to evalu-ate the effectiveness of automated text scor-ing (ATS) systems with respect to a humangold standard. However, there is no system-atic study comparing the efficacy of these met-rics under different experimental conditions.In this paper we first argue that measures ofagreement are more appropriate than mea-sures of association (i.e., correlation) for mea-suring the effectiveness of ATS systems. Wethen present a thorough review and analysis offrequently used measures of agreement. Weoutline desirable properties for measuring theeffectiveness of an ATS system, and experi-mentally demonstrate using both synthetic andreal ATS data, that some commonly used mea-sures (e.g., Cohen’s kappa) lack these prop-erties. Finally, we identify the most ap-propriate measures of agreement and presentgeneral recommendations for best evaluationpractices.
1 Introduction
Automated assessment of text was introduced in theearly 1960s in an attempt to address several issueswith manual assessment (e.g., expense, speed, andconsistency). Further advantages become more pro-nounced when it comes to scoring extended textssuch as essays, a task prone to an element of subjec-tivity. Automated systems enable rigid applicationof scoring criteria, thus reducing the inconsistencieswhich may arise, in particular, when many humanexaminers are employed for large-scale assessment.
There is a substantial literature describing andevaluating ATS systems (Page, 1968; Powers et al.,2002; Rudner and Liang, 2002; Burstein et al., 2003;Landauer et al., 2003; Higgins et al., 2004; Attaliand Burstein, 2006; Attali et al., 2008; Williamson,2009; Briscoe et al., 2010; Chen and He, 2013).Such systems are increasingly used but remain con-troversial. Although a comprehensive comparisonof the capabilities of eight existing commercial es-say scoring systems (Shermis and Hamner, 2012)across five different performance metrics in the re-cent ATS competition organised by Kaggle1 claimedthat ATS systems grade similarly to humans, critics(Wang and Brown, 2007; Wang and Brown, 2008;Perelman, 2013) have continued to dispute this.
For the evaluation of ATS systems (Williamson,2009; Williamson et al., 2012), emphasis hasbeen given to the “agreement” of machine-predictedscores (ordinal grades) with that of a human goldstandard; that is, scores assigned by human exam-iners to the same texts that the machine is eval-uated on. Various metrics have been used, themost prominent being Pearson’s correlation, per-centage of agreement, and variations of Cohen’skappa statistic. Inconsistencies in the reporting of,and misconceptions in the interpretation of, thesemetrics in published work makes cross-system com-parisons on publicly-available datasets more diffi-cult. The lack of careful motivation of any metricfuels opposition to the deployment of ATS. To date,several ATS systems are being used operationallyfor high-stakes assessment in addition to them be-ing part of self-assessment and self-tutoring sys-
1https://www.kaggle.com/c/asap-aes
213

tems, underscoring the need for common and well-motivated metrics that establish true system perfor-mance.
In this paper, we define the task of ATS as theaccurate prediction of gold-standard scores (pre-defined ordinal grades), and we experimentally ex-amine the robustness and efficacy of measures ofagreement for a number of different conditions un-der two different experimental setups. First, we usesynthetic data to simulate various experimental con-ditions, and second, we use real ATS data to assessthe effectiveness of the metrics under realistic sce-narios. For the latter, we run a series of experimentson the output of state-of-the-art ATS systems. Weoutline some deficiencies in commonly used met-rics that have been previously overlooked, and con-sequently we propose more appropriate metrics forevaluating ATS systems focusing primarily on op-timising system effectiveness and facilitating cross-system comparison.
The focus on measures of agreement is motivatedby their use as the primary metric for evaluating sys-tem effectiveness in the recent Kaggle essay scoringcompetition. To the best of our knowledge, there isno systematic study comparing the efficacy of dif-ferent measures of agreement under different exper-imental conditions. Although we focus on the taskof ATS, the recommendations regarding the metricscovered in this paper extend naturally to many sim-ilar NLP tasks, i.e., those where the task is to accu-rately predict a gold-standard score.
The remainder of the paper is structured as fol-lows: Section 2 defines our task and objectives. Sec-tion 3 reviews a number of performance metrics rel-evant to the ATS task. Section 4 describes a set ofdesired metric properties and presents an analysis ofsome prominently used metrics for the ATS task thatuses the output of both simulated and real systems.Section 5 concludes with a discussion, general rec-ommendations for evaluation practices and an out-line of future work.
2 Task Definition
In the standard ATS evaluation, there exists a set of ntexts where each text is indexed t1 to tn. Each text tiis assigned a gold standard score gs(ti) by a humanassessor (or group of human assessors). This score
is one of g ordinal scores, which for convenience weindex 1 to g. It is worth noting that, in general, it isnot a requirement that the differences in scores areuniform. Furthermore, there exists some number ofATS systems atsj indexed j = 1 to j = m thatpredict scores atsj(ti) for each of the n texts.
Given two ATS systems ats1 and ats2, we wouldlike to determine a metric M that returns a mea-sure of performance for ats1 and ats2 for whichM(ats1, gs, t) > M(ats2, gs, t) when ats1 is abetter system than ats2. Note that we have not de-fined what “better” means at this stage. We will re-turn to describing some desirable properties ofM inSection 4.
From an educational point of view, our task isto ascertain whether the writing abilities required towarrant a particular score/grade have been attained.From this perspective, measures of agreement seemthe appropriate type of measurement to apply to theoutput of ATS systems to address the accuracy of the(numerical) solution compared to the gold standard.
3 Measuring Performance of ATS systems
In this section, we review and critique metrics thathave been frequently used in the literature to ascer-tain the performance of ATS systems. These per-formance metrics can be broadly categorised intomeasures of association and measures of agreement(e.g., see Williamson et al. (2012)).
3.1 Measures of Association
Measures of association (i.e., correlation coeffi-cients) have been widely used in ATS (e.g., Yan-nakoudakis et al. (2011)), with Pearson’s product-moment correlation coefficient being the most com-mon. Pearson’s correlation is a parametric measureof association that quantifies the degree of linear de-pendence between two variables and, more specif-ically, describes the extent to which the variablesco-vary relative to the degree to which they vary in-dependently. The greater the association, the moreaccurately one can use the value of one variableto predict the other. As the data depart from thecoefficient’s assumptions (e.g., unequal marginals),its maximum values may not be attainable (Carroll,1961). For ordinal data, unequal marginals will al-
214
ways involve ties.2 As the number of ties increasesrelative to the number of observations, its appropri-ateness largely diminishes.3
Spearman’s rank correlation coefficient is a non-parametric measure of association that has the samerange as Pearson, and it is calculated by ranking thevariables and computing Pearson on the ranks ratherthan the raw values. In contrast to Pearson, it as-sesses the strength of a monotonic rather than lin-ear relation between two variables, and has the ad-vantage of independence from various assumptions.Unlike Pearson, it exhibits robustness to outliers;however, its reliability also decreases as the num-ber of ties increases. It is worth noting at this pointKendall’s τb, which is a more effective tie-adjustednon-parametric bivariate coefficient that quantifiesthe degree of agreement between rankings, and it isdefined in terms of concordant and discordant pairs,although ties also affect its reliability.
3.1.1 DiscussionIn essence, non-parametric measures are mea-
sures of rank correlation. In the context of the eval-uation of ATS, they measure agreement with respectto the ranks, that is, whether an ATS system rankstexts similarly to the gold standard. However, thisis not an appropriate type of measurement given thetask definition in Section 2, where we would liketo ascertain actual agreement with respect to thescores. Furthermore, correlation coefficients do notaccount for any systematic biases in the data; for ex-ample, a high correlation can be observed even ifthe predicted scores are consistently n points higherthan the gold standard.
In the presence of outliers, the coefficient can bemisleading and pulled in either direction. For ex-ample, for Pearson’s correlation an outlier can influ-ence the value of the correlation to the extent thata high correlation is observed even though the datamay not be linearly dependent. Furthermore, it iswell known that the value of the correlation will begreater if there is more variability in the data thanif there is less. This is caused by the mathematical
2Of course, ties exist even when the marginals are identi-cal if the number of observations is larger than the number ofscores.
3For more details see (Maimon et al., 1986; Goodwin andLeech, 2006; Hauke and Kossowski, 2011) among others.
constraints in their formulation, and does not nec-essarily reflect the true relationship of predicted togold standard scores. Finally, their reliability de-creases as the number of ties increases. We comeback to the appropriateness and recommended useof correlation metrics in Section 5.
In summary, (non-parametric) correlation mea-sures are more apt at measuring the ability of theATS system to correctly rank texts (i.e., placing awell written text above a poorly written text), ratherthan the ability of the ATS system to correctly as-sign a score/grade. In other words, correlation mea-sures do not reward ATS systems for their abil-ity to correctly identify the thresholds that separatescore/grade boundaries (1 : 2 to g − 1 : g).
3.2 Measures of AgreementA simple way of gauging the agreement betweengold and predicted scores is to use percentage agree-ment, calculated as the number of times the gold andpredicted scores are the same, divided by the totalnumber of texts assessed. A closely-related variantis percentage of adjacent agreement, in which agree-ment is based on the number of times the gold andpredicted scores are no more than n points apart.
Despite its simplicity, it has been argued (Cohen,1960) that this measure can be misleading as it doesnot exclude the percentage of agreement that is ex-pected on the basis of pure chance. That is, a cer-tain amount of agreement can occur even if there isno systematic tendency for the gold and predictedscores to agree. The kappa coefficient (Cκ) was in-troduced by Cohen (1960) as a measure of agree-ment adjusted for chance. Let Pa denote the percent-age of observed agreement and Pe the percentage ofagreement expected by chance, Cohen’s kappa coef-ficient is calculated as the ratio between the “true”observed agreement and its maximum value:
Cκ =Pa − Pe(κ)1− Pe(κ) (1)
where Pe(κ) is the estimated agreement due tochance, and is calculated as the inner-product of themarginal distribution of each assessor (a worked ex-ample of this follows in Section 3.2.1). The valuesof the coefficient range between −1 and 1, where1 represents perfect agreement and 0 represents noagreement beyond that occurring by chance. Most
215
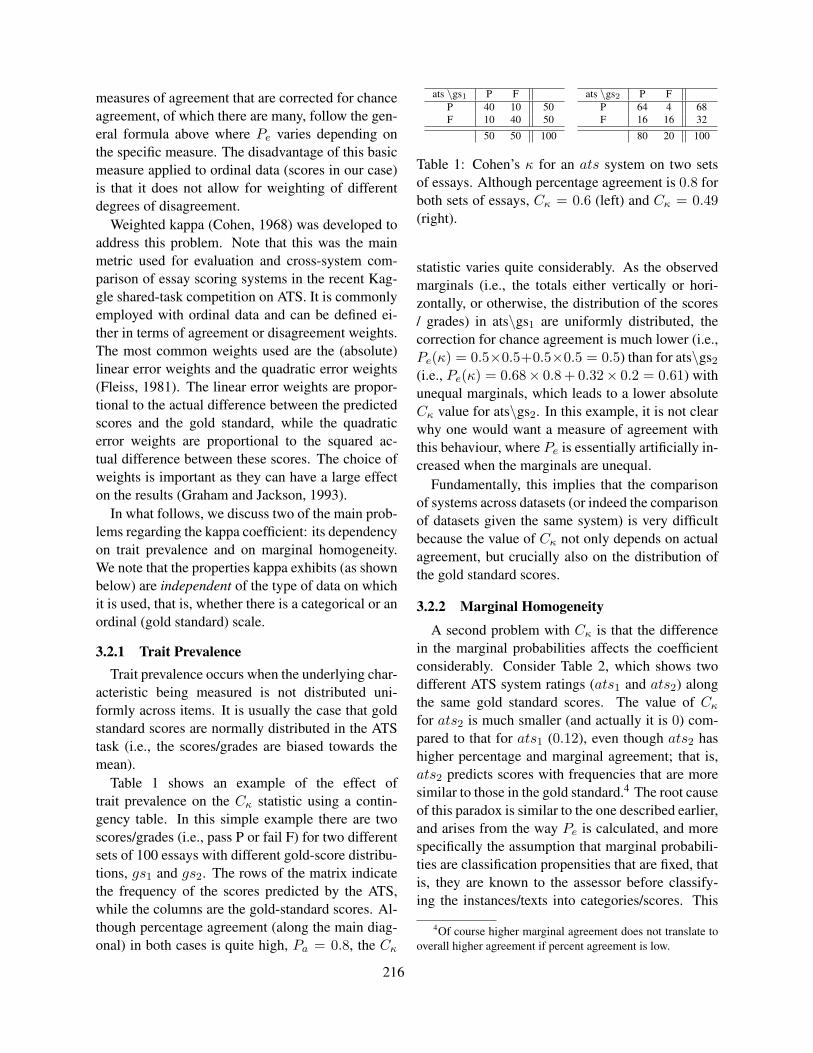
measures of agreement that are corrected for chanceagreement, of which there are many, follow the gen-eral formula above where Pe varies depending onthe specific measure. The disadvantage of this basicmeasure applied to ordinal data (scores in our case)is that it does not allow for weighting of differentdegrees of disagreement.
Weighted kappa (Cohen, 1968) was developed toaddress this problem. Note that this was the mainmetric used for evaluation and cross-system com-parison of essay scoring systems in the recent Kag-gle shared-task competition on ATS. It is commonlyemployed with ordinal data and can be defined ei-ther in terms of agreement or disagreement weights.The most common weights used are the (absolute)linear error weights and the quadratic error weights(Fleiss, 1981). The linear error weights are propor-tional to the actual difference between the predictedscores and the gold standard, while the quadraticerror weights are proportional to the squared ac-tual difference between these scores. The choice ofweights is important as they can have a large effecton the results (Graham and Jackson, 1993).
In what follows, we discuss two of the main prob-lems regarding the kappa coefficient: its dependencyon trait prevalence and on marginal homogeneity.We note that the properties kappa exhibits (as shownbelow) are independent of the type of data on whichit is used, that is, whether there is a categorical or anordinal (gold standard) scale.
3.2.1 Trait PrevalenceTrait prevalence occurs when the underlying char-
acteristic being measured is not distributed uni-formly across items. It is usually the case that goldstandard scores are normally distributed in the ATStask (i.e., the scores/grades are biased towards themean).
Table 1 shows an example of the effect oftrait prevalence on the Cκ statistic using a contin-gency table. In this simple example there are twoscores/grades (i.e., pass P or fail F) for two differentsets of 100 essays with different gold-score distribu-tions, gs1 and gs2. The rows of the matrix indicatethe frequency of the scores predicted by the ATS,while the columns are the gold-standard scores. Al-though percentage agreement (along the main diag-onal) in both cases is quite high, Pa = 0.8, the Cκ
ats \gs1 P FP 40 10 50F 10 40 50
50 50 100
ats \gs2 P FP 64 4 68F 16 16 32
80 20 100
Table 1: Cohen’s κ for an ats system on two setsof essays. Although percentage agreement is 0.8 forboth sets of essays, Cκ = 0.6 (left) and Cκ = 0.49(right).
statistic varies quite considerably. As the observedmarginals (i.e., the totals either vertically or hori-zontally, or otherwise, the distribution of the scores/ grades) in ats\gs1 are uniformly distributed, thecorrection for chance agreement is much lower (i.e.,Pe(κ) = 0.5×0.5+0.5×0.5 = 0.5) than for ats\gs2
(i.e., Pe(κ) = 0.68× 0.8 + 0.32× 0.2 = 0.61) withunequal marginals, which leads to a lower absoluteCκ value for ats\gs2. In this example, it is not clearwhy one would want a measure of agreement withthis behaviour, where Pe is essentially artificially in-creased when the marginals are unequal.
Fundamentally, this implies that the comparisonof systems across datasets (or indeed the comparisonof datasets given the same system) is very difficultbecause the value of Cκ not only depends on actualagreement, but crucially also on the distribution ofthe gold standard scores.
3.2.2 Marginal HomogeneityA second problem with Cκ is that the difference
in the marginal probabilities affects the coefficientconsiderably. Consider Table 2, which shows twodifferent ATS system ratings (ats1 and ats2) alongthe same gold standard scores. The value of Cκfor ats2 is much smaller (and actually it is 0) com-pared to that for ats1 (0.12), even though ats2 hashigher percentage and marginal agreement; that is,ats2 predicts scores with frequencies that are moresimilar to those in the gold standard.4 The root causeof this paradox is similar to the one described earlier,and arises from the way Pe is calculated, and morespecifically the assumption that marginal probabili-ties are classification propensities that are fixed, thatis, they are known to the assessor before classify-ing the instances/texts into categories/scores. This
4Of course higher marginal agreement does not translate tooverall higher agreement if percent agreement is low.
216
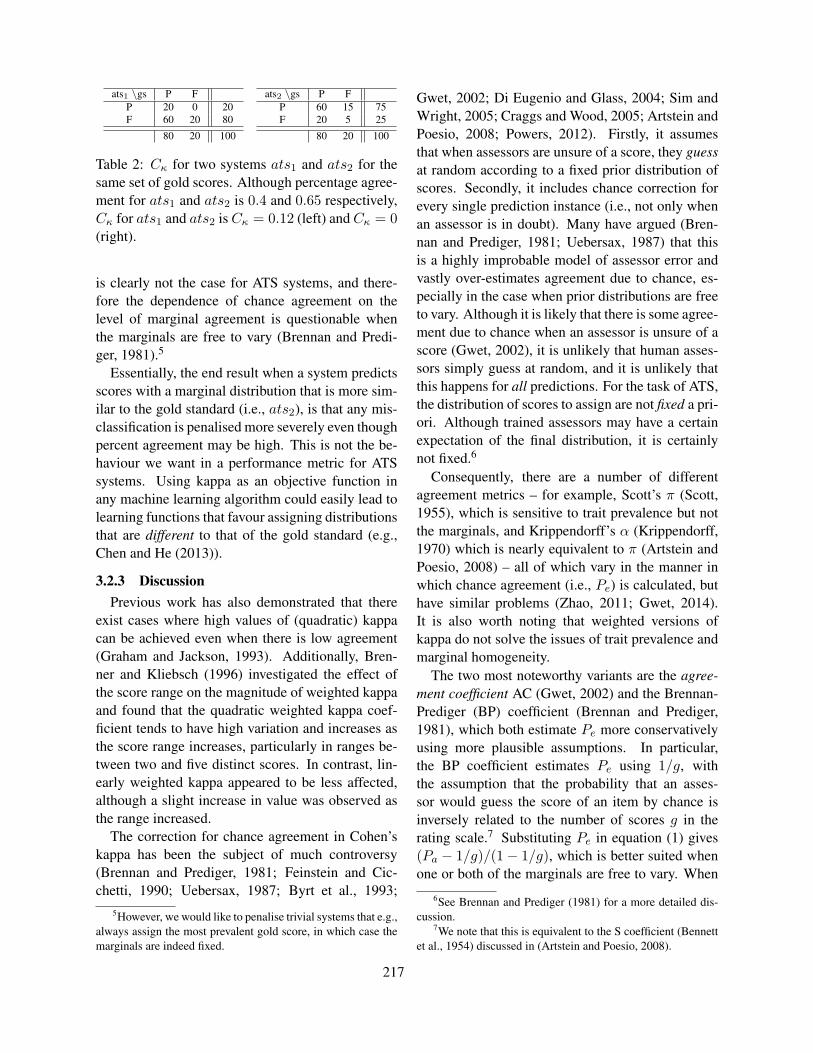
ats1 \gs P FP 20 0 20F 60 20 80
80 20 100
ats2 \gs P FP 60 15 75F 20 5 25
80 20 100
Table 2: Cκ for two systems ats1 and ats2 for thesame set of gold scores. Although percentage agree-ment for ats1 and ats2 is 0.4 and 0.65 respectively,Cκ for ats1 and ats2 isCκ = 0.12 (left) andCκ = 0(right).
is clearly not the case for ATS systems, and there-fore the dependence of chance agreement on thelevel of marginal agreement is questionable whenthe marginals are free to vary (Brennan and Predi-ger, 1981).5
Essentially, the end result when a system predictsscores with a marginal distribution that is more sim-ilar to the gold standard (i.e., ats2), is that any mis-classification is penalised more severely even thoughpercent agreement may be high. This is not the be-haviour we want in a performance metric for ATSsystems. Using kappa as an objective function inany machine learning algorithm could easily lead tolearning functions that favour assigning distributionsthat are different to that of the gold standard (e.g.,Chen and He (2013)).
3.2.3 DiscussionPrevious work has also demonstrated that there
exist cases where high values of (quadratic) kappacan be achieved even when there is low agreement(Graham and Jackson, 1993). Additionally, Bren-ner and Kliebsch (1996) investigated the effect ofthe score range on the magnitude of weighted kappaand found that the quadratic weighted kappa coef-ficient tends to have high variation and increases asthe score range increases, particularly in ranges be-tween two and five distinct scores. In contrast, lin-early weighted kappa appeared to be less affected,although a slight increase in value was observed asthe range increased.
The correction for chance agreement in Cohen’skappa has been the subject of much controversy(Brennan and Prediger, 1981; Feinstein and Cic-chetti, 1990; Uebersax, 1987; Byrt et al., 1993;
5However, we would like to penalise trivial systems that e.g.,always assign the most prevalent gold score, in which case themarginals are indeed fixed.
Gwet, 2002; Di Eugenio and Glass, 2004; Sim andWright, 2005; Craggs and Wood, 2005; Artstein andPoesio, 2008; Powers, 2012). Firstly, it assumesthat when assessors are unsure of a score, they guessat random according to a fixed prior distribution ofscores. Secondly, it includes chance correction forevery single prediction instance (i.e., not only whenan assessor is in doubt). Many have argued (Bren-nan and Prediger, 1981; Uebersax, 1987) that thisis a highly improbable model of assessor error andvastly over-estimates agreement due to chance, es-pecially in the case when prior distributions are freeto vary. Although it is likely that there is some agree-ment due to chance when an assessor is unsure of ascore (Gwet, 2002), it is unlikely that human asses-sors simply guess at random, and it is unlikely thatthis happens for all predictions. For the task of ATS,the distribution of scores to assign are not fixed a pri-ori. Although trained assessors may have a certainexpectation of the final distribution, it is certainlynot fixed.6
Consequently, there are a number of differentagreement metrics – for example, Scott’s π (Scott,1955), which is sensitive to trait prevalence but notthe marginals, and Krippendorff’s α (Krippendorff,1970) which is nearly equivalent to π (Artstein andPoesio, 2008) – all of which vary in the manner inwhich chance agreement (i.e., Pe) is calculated, buthave similar problems (Zhao, 2011; Gwet, 2014).It is also worth noting that weighted versions ofkappa do not solve the issues of trait prevalence andmarginal homogeneity.
The two most noteworthy variants are the agree-ment coefficient AC (Gwet, 2002) and the Brennan-Prediger (BP) coefficient (Brennan and Prediger,1981), which both estimate Pe more conservativelyusing more plausible assumptions. In particular,the BP coefficient estimates Pe using 1/g, withthe assumption that the probability that an asses-sor would guess the score of an item by chance isinversely related to the number of scores g in therating scale.7 Substituting Pe in equation (1) gives(Pa − 1/g)/(1− 1/g), which is better suited whenone or both of the marginals are free to vary. When
6See Brennan and Prediger (1981) for a more detailed dis-cussion.
7We note that this is equivalent to the S coefficient (Bennettet al., 1954) discussed in (Artstein and Poesio, 2008).
217
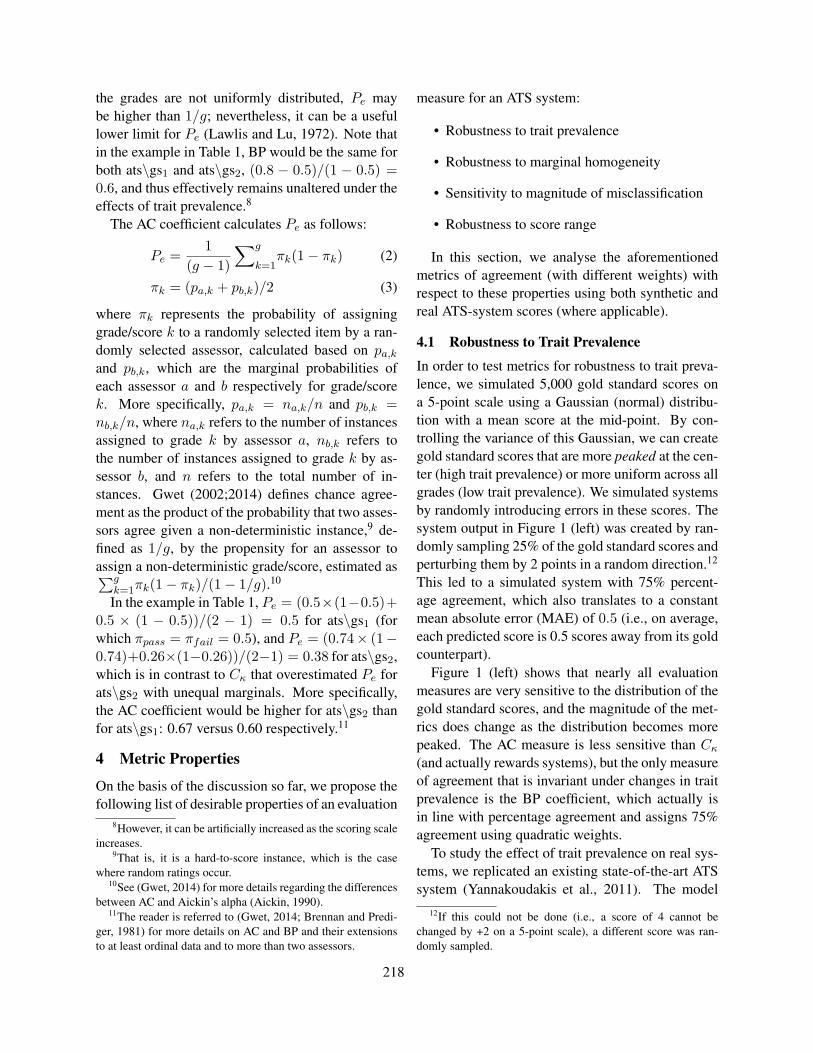
the grades are not uniformly distributed, Pe maybe higher than 1/g; nevertheless, it can be a usefullower limit for Pe (Lawlis and Lu, 1972). Note thatin the example in Table 1, BP would be the same forboth ats\gs1 and ats\gs2, (0.8 − 0.5)/(1 − 0.5) =0.6, and thus effectively remains unaltered under theeffects of trait prevalence.8
The AC coefficient calculates Pe as follows:
Pe =1
(g − 1)
∑g
k=1πk(1− πk) (2)
πk = (pa,k + pb,k)/2 (3)
where πk represents the probability of assigninggrade/score k to a randomly selected item by a ran-domly selected assessor, calculated based on pa,kand pb,k, which are the marginal probabilities ofeach assessor a and b respectively for grade/scorek. More specifically, pa,k = na,k/n and pb,k =nb,k/n, where na,k refers to the number of instancesassigned to grade k by assessor a, nb,k refers tothe number of instances assigned to grade k by as-sessor b, and n refers to the total number of in-stances. Gwet (2002;2014) defines chance agree-ment as the product of the probability that two asses-sors agree given a non-deterministic instance,9 de-fined as 1/g, by the propensity for an assessor toassign a non-deterministic grade/score, estimated as∑g
k=1πk(1− πk)/(1− 1/g).10
In the example in Table 1, Pe = (0.5×(1−0.5)+0.5 × (1 − 0.5))/(2 − 1) = 0.5 for ats\gs1 (forwhich πpass = πfail = 0.5), and Pe = (0.74× (1−0.74)+0.26×(1−0.26))/(2−1) = 0.38 for ats\gs2,which is in contrast to Cκ that overestimated Pe forats\gs2 with unequal marginals. More specifically,the AC coefficient would be higher for ats\gs2 thanfor ats\gs1: 0.67 versus 0.60 respectively.11
4 Metric Properties
On the basis of the discussion so far, we propose thefollowing list of desirable properties of an evaluation
8However, it can be artificially increased as the scoring scaleincreases.
9That is, it is a hard-to-score instance, which is the casewhere random ratings occur.
10See (Gwet, 2014) for more details regarding the differencesbetween AC and Aickin’s alpha (Aickin, 1990).
11The reader is referred to (Gwet, 2014; Brennan and Predi-ger, 1981) for more details on AC and BP and their extensionsto at least ordinal data and to more than two assessors.
measure for an ATS system:
• Robustness to trait prevalence
• Robustness to marginal homogeneity
• Sensitivity to magnitude of misclassification
• Robustness to score range
In this section, we analyse the aforementionedmetrics of agreement (with different weights) withrespect to these properties using both synthetic andreal ATS-system scores (where applicable).
4.1 Robustness to Trait Prevalence
In order to test metrics for robustness to trait preva-lence, we simulated 5,000 gold standard scores ona 5-point scale using a Gaussian (normal) distribu-tion with a mean score at the mid-point. By con-trolling the variance of this Gaussian, we can creategold standard scores that are more peaked at the cen-ter (high trait prevalence) or more uniform across allgrades (low trait prevalence). We simulated systemsby randomly introducing errors in these scores. Thesystem output in Figure 1 (left) was created by ran-domly sampling 25% of the gold standard scores andperturbing them by 2 points in a random direction.12
This led to a simulated system with 75% percent-age agreement, which also translates to a constantmean absolute error (MAE) of 0.5 (i.e., on average,each predicted score is 0.5 scores away from its goldcounterpart).
Figure 1 (left) shows that nearly all evaluationmeasures are very sensitive to the distribution of thegold standard scores, and the magnitude of the met-rics does change as the distribution becomes morepeaked. The AC measure is less sensitive than Cκ(and actually rewards systems), but the only measureof agreement that is invariant under changes in traitprevalence is the BP coefficient, which actually isin line with percentage agreement and assigns 75%agreement using quadratic weights.
To study the effect of trait prevalence on real sys-tems, we replicated an existing state-of-the-art ATSsystem (Yannakoudakis et al., 2011). The model
12If this could not be done (i.e., a score of 4 cannot bechanged by +2 on a 5-point scale), a different score was ran-domly sampled.
218
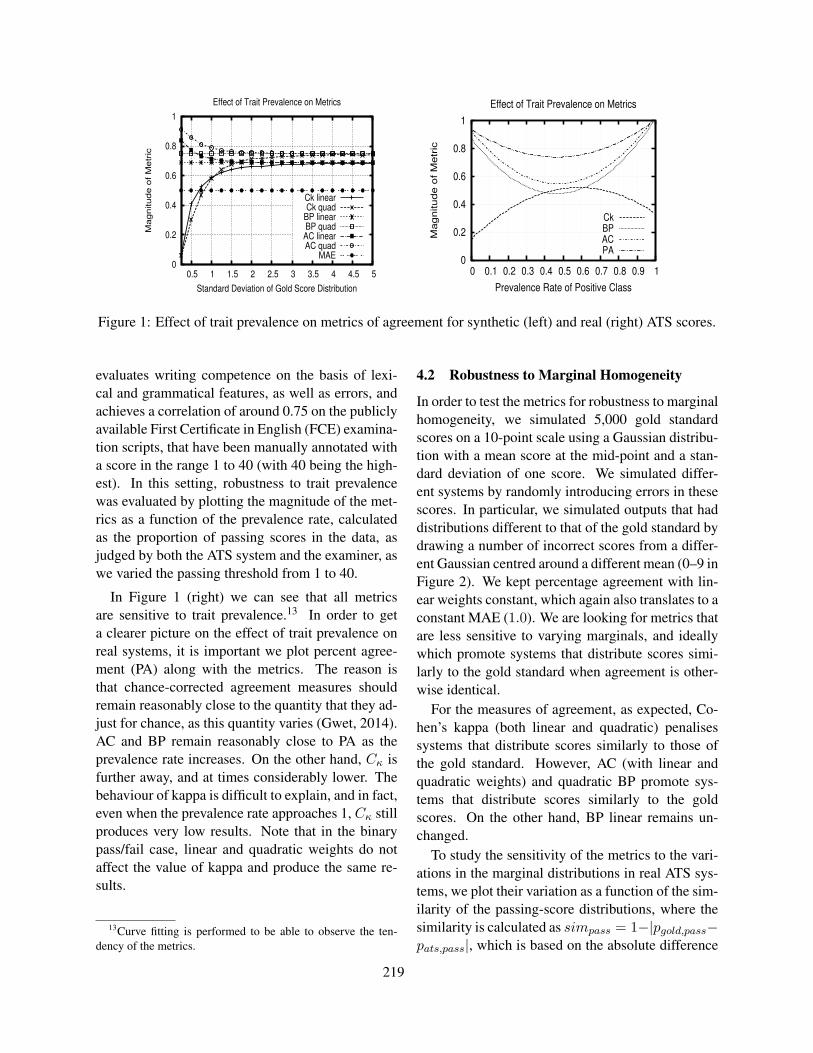
0
0.2
0.4
0.6
0.8
1
0.5 1 1.5 2 2.5 3 3.5 4 4.5 5
Ma
gn
itu
de
of
Me
tric
Standard Deviation of Gold Score Distribution
Effect of Trait Prevalence on Metrics
Ck linearCk quad
BP linearBP quadAC linearAC quad
MAE 0
0.2
0.4
0.6
0.8
1
0 0.1 0.2 0.3 0.4 0.5 0.6 0.7 0.8 0.9 1
Magnitude o
f M
etr
ic
Prevalence Rate of Positive Class
Effect of Trait Prevalence on Metrics
CkBPACPA
Figure 1: Effect of trait prevalence on metrics of agreement for synthetic (left) and real (right) ATS scores.
evaluates writing competence on the basis of lexi-cal and grammatical features, as well as errors, andachieves a correlation of around 0.75 on the publiclyavailable First Certificate in English (FCE) examina-tion scripts, that have been manually annotated witha score in the range 1 to 40 (with 40 being the high-est). In this setting, robustness to trait prevalencewas evaluated by plotting the magnitude of the met-rics as a function of the prevalence rate, calculatedas the proportion of passing scores in the data, asjudged by both the ATS system and the examiner, aswe varied the passing threshold from 1 to 40.
In Figure 1 (right) we can see that all metricsare sensitive to trait prevalence.13 In order to geta clearer picture on the effect of trait prevalence onreal systems, it is important we plot percent agree-ment (PA) along with the metrics. The reason isthat chance-corrected agreement measures shouldremain reasonably close to the quantity that they ad-just for chance, as this quantity varies (Gwet, 2014).AC and BP remain reasonably close to PA as theprevalence rate increases. On the other hand, Cκ isfurther away, and at times considerably lower. Thebehaviour of kappa is difficult to explain, and in fact,even when the prevalence rate approaches 1, Cκ stillproduces very low results. Note that in the binarypass/fail case, linear and quadratic weights do notaffect the value of kappa and produce the same re-sults.
13Curve fitting is performed to be able to observe the ten-dency of the metrics.
4.2 Robustness to Marginal Homogeneity
In order to test the metrics for robustness to marginalhomogeneity, we simulated 5,000 gold standardscores on a 10-point scale using a Gaussian distribu-tion with a mean score at the mid-point and a stan-dard deviation of one score. We simulated differ-ent systems by randomly introducing errors in thesescores. In particular, we simulated outputs that haddistributions different to that of the gold standard bydrawing a number of incorrect scores from a differ-ent Gaussian centred around a different mean (0–9 inFigure 2). We kept percentage agreement with lin-ear weights constant, which again also translates to aconstant MAE (1.0). We are looking for metrics thatare less sensitive to varying marginals, and ideallywhich promote systems that distribute scores simi-larly to the gold standard when agreement is other-wise identical.
For the measures of agreement, as expected, Co-hen’s kappa (both linear and quadratic) penalisessystems that distribute scores similarly to those ofthe gold standard. However, AC (with linear andquadratic weights) and quadratic BP promote sys-tems that distribute scores similarly to the goldscores. On the other hand, BP linear remains un-changed.
To study the sensitivity of the metrics to the vari-ations in the marginal distributions in real ATS sys-tems, we plot their variation as a function of the sim-ilarity of the passing-score distributions, where thesimilarity is calculated as simpass = 1−|pgold,pass−pats,pass|, which is based on the absolute difference
219
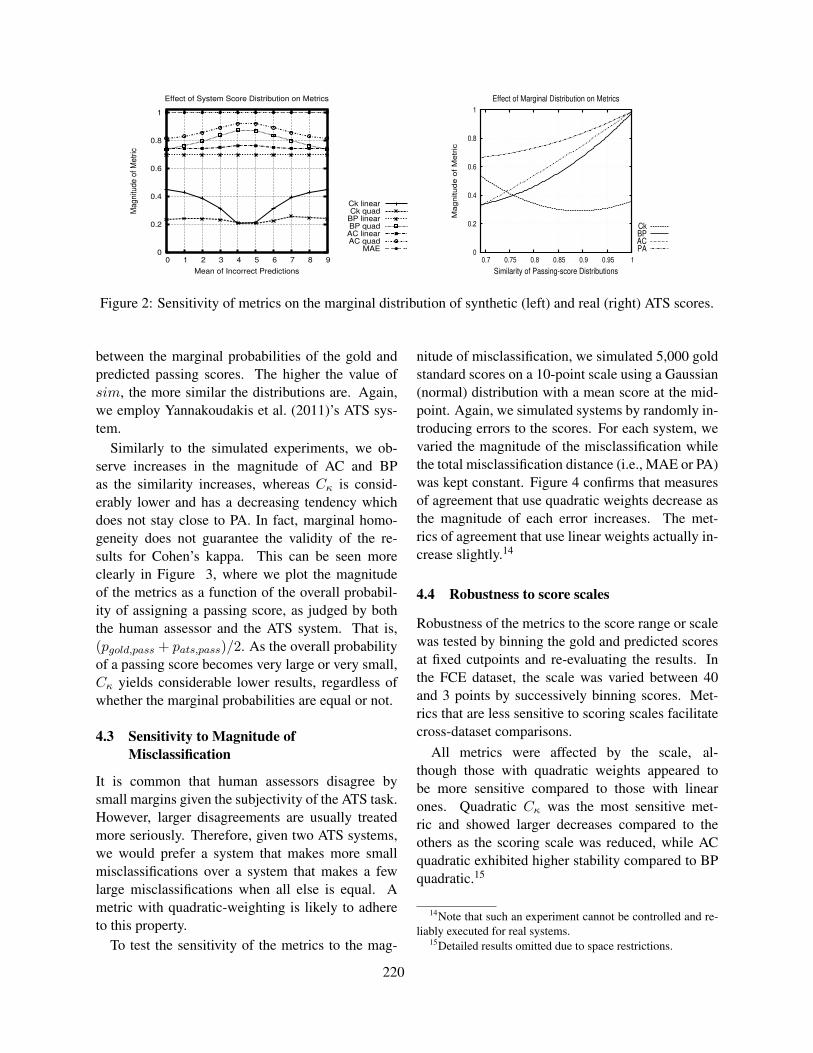
0
0.2
0.4
0.6
0.8
1
0 1 2 3 4 5 6 7 8 9
Ma
gn
itud
e o
f M
etr
ic
Mean of Incorrect Predictions
Effect of System Score Distribution on Metrics
Ck linearCk quad
BP linearBP quadAC linearAC quad
MAE 0
0.2
0.4
0.6
0.8
1
0.7 0.75 0.8 0.85 0.9 0.95 1
Magnitude o
f M
etr
ic
Similarity of Passing-score Distributions
Effect of Marginal Distribution on Metrics
CkBPACPA
Figure 2: Sensitivity of metrics on the marginal distribution of synthetic (left) and real (right) ATS scores.
between the marginal probabilities of the gold andpredicted passing scores. The higher the value ofsim, the more similar the distributions are. Again,we employ Yannakoudakis et al. (2011)’s ATS sys-tem.
Similarly to the simulated experiments, we ob-serve increases in the magnitude of AC and BPas the similarity increases, whereas Cκ is consid-erably lower and has a decreasing tendency whichdoes not stay close to PA. In fact, marginal homo-geneity does not guarantee the validity of the re-sults for Cohen’s kappa. This can be seen moreclearly in Figure 3, where we plot the magnitudeof the metrics as a function of the overall probabil-ity of assigning a passing score, as judged by boththe human assessor and the ATS system. That is,(pgold,pass + pats,pass)/2. As the overall probabilityof a passing score becomes very large or very small,Cκ yields considerable lower results, regardless ofwhether the marginal probabilities are equal or not.
4.3 Sensitivity to Magnitude ofMisclassification
It is common that human assessors disagree bysmall margins given the subjectivity of the ATS task.However, larger disagreements are usually treatedmore seriously. Therefore, given two ATS systems,we would prefer a system that makes more smallmisclassifications over a system that makes a fewlarge misclassifications when all else is equal. Ametric with quadratic-weighting is likely to adhereto this property.
To test the sensitivity of the metrics to the mag-
nitude of misclassification, we simulated 5,000 goldstandard scores on a 10-point scale using a Gaussian(normal) distribution with a mean score at the mid-point. Again, we simulated systems by randomly in-troducing errors to the scores. For each system, wevaried the magnitude of the misclassification whilethe total misclassification distance (i.e., MAE or PA)was kept constant. Figure 4 confirms that measuresof agreement that use quadratic weights decrease asthe magnitude of each error increases. The met-rics of agreement that use linear weights actually in-crease slightly.14
4.4 Robustness to score scales
Robustness of the metrics to the score range or scalewas tested by binning the gold and predicted scoresat fixed cutpoints and re-evaluating the results. Inthe FCE dataset, the scale was varied between 40and 3 points by successively binning scores. Met-rics that are less sensitive to scoring scales facilitatecross-dataset comparisons.
All metrics were affected by the scale, al-though those with quadratic weights appeared tobe more sensitive compared to those with linearones. Quadratic Cκ was the most sensitive met-ric and showed larger decreases compared to theothers as the scoring scale was reduced, while ACquadratic exhibited higher stability compared to BPquadratic.15
14Note that such an experiment cannot be controlled and re-liably executed for real systems.
15Detailed results omitted due to space restrictions.
220
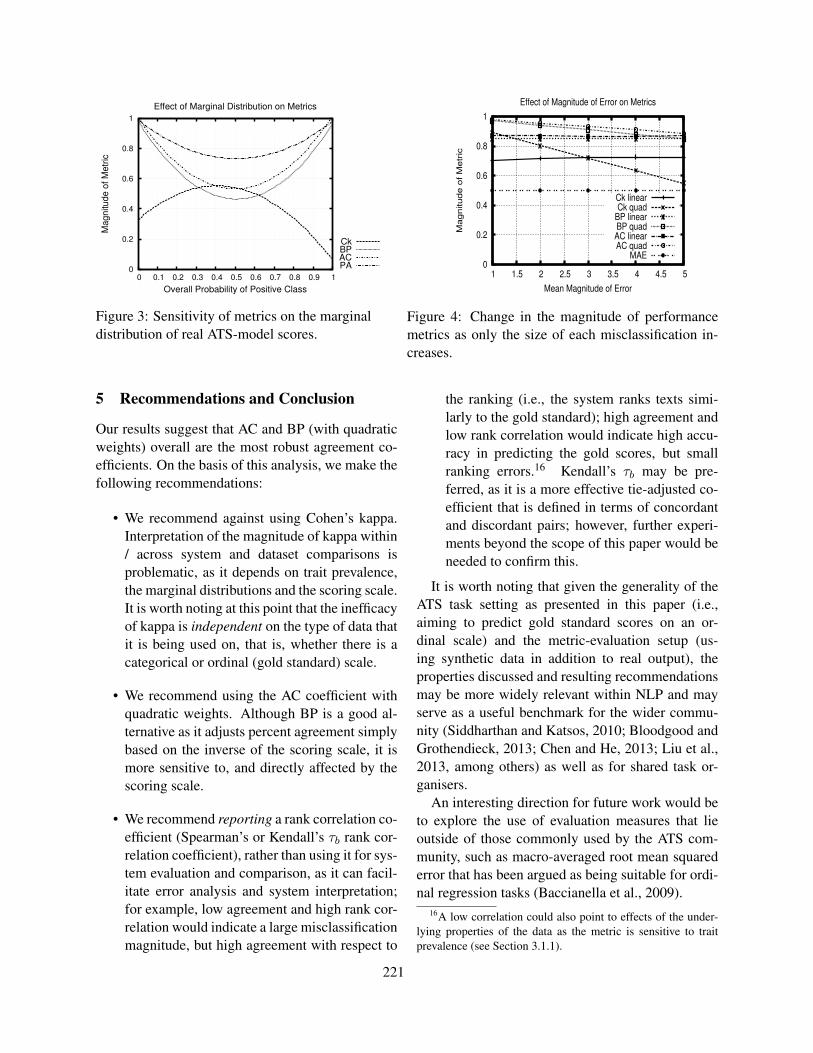
0
0.2
0.4
0.6
0.8
1
0 0.1 0.2 0.3 0.4 0.5 0.6 0.7 0.8 0.9 1
Ma
gn
itu
de
of
Me
tric
Overall Probability of Positive Class
Effect of Marginal Distribution on Metrics
CkBPACPA
Figure 3: Sensitivity of metrics on the marginaldistribution of real ATS-model scores.
0
0.2
0.4
0.6
0.8
1
1 1.5 2 2.5 3 3.5 4 4.5 5
Ma
gn
itu
de
of
Me
tric
Mean Magnitude of Error
Effect of Magnitude of Error on Metrics
Ck linearCk quad
BP linearBP quadAC linearAC quad
MAE
Figure 4: Change in the magnitude of performancemetrics as only the size of each misclassification in-creases.
5 Recommendations and Conclusion
Our results suggest that AC and BP (with quadraticweights) overall are the most robust agreement co-efficients. On the basis of this analysis, we make thefollowing recommendations:
• We recommend against using Cohen’s kappa.Interpretation of the magnitude of kappa within/ across system and dataset comparisons isproblematic, as it depends on trait prevalence,the marginal distributions and the scoring scale.It is worth noting at this point that the inefficacyof kappa is independent on the type of data thatit is being used on, that is, whether there is acategorical or ordinal (gold standard) scale.
• We recommend using the AC coefficient withquadratic weights. Although BP is a good al-ternative as it adjusts percent agreement simplybased on the inverse of the scoring scale, it ismore sensitive to, and directly affected by thescoring scale.
• We recommend reporting a rank correlation co-efficient (Spearman’s or Kendall’s τb rank cor-relation coefficient), rather than using it for sys-tem evaluation and comparison, as it can facil-itate error analysis and system interpretation;for example, low agreement and high rank cor-relation would indicate a large misclassificationmagnitude, but high agreement with respect to
the ranking (i.e., the system ranks texts simi-larly to the gold standard); high agreement andlow rank correlation would indicate high accu-racy in predicting the gold scores, but smallranking errors.16 Kendall’s τb may be pre-ferred, as it is a more effective tie-adjusted co-efficient that is defined in terms of concordantand discordant pairs; however, further experi-ments beyond the scope of this paper would beneeded to confirm this.
It is worth noting that given the generality of theATS task setting as presented in this paper (i.e.,aiming to predict gold standard scores on an or-dinal scale) and the metric-evaluation setup (us-ing synthetic data in addition to real output), theproperties discussed and resulting recommendationsmay be more widely relevant within NLP and mayserve as a useful benchmark for the wider commu-nity (Siddharthan and Katsos, 2010; Bloodgood andGrothendieck, 2013; Chen and He, 2013; Liu et al.,2013, among others) as well as for shared task or-ganisers.
An interesting direction for future work would beto explore the use of evaluation measures that lieoutside of those commonly used by the ATS com-munity, such as macro-averaged root mean squarederror that has been argued as being suitable for ordi-nal regression tasks (Baccianella et al., 2009).
16A low correlation could also point to effects of the under-lying properties of the data as the metric is sensitive to traitprevalence (see Section 3.1.1).
221
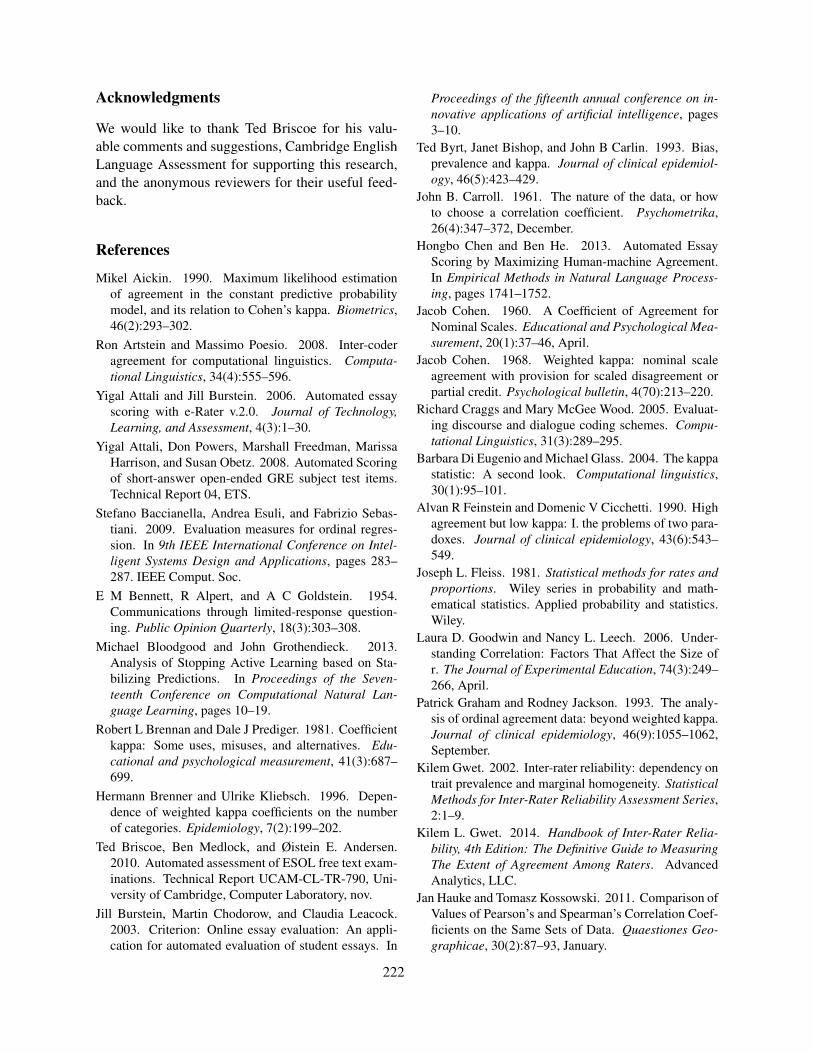
Acknowledgments
We would like to thank Ted Briscoe for his valu-able comments and suggestions, Cambridge EnglishLanguage Assessment for supporting this research,and the anonymous reviewers for their useful feed-back.
References
Mikel Aickin. 1990. Maximum likelihood estimationof agreement in the constant predictive probabilitymodel, and its relation to Cohen’s kappa. Biometrics,46(2):293–302.
Ron Artstein and Massimo Poesio. 2008. Inter-coderagreement for computational linguistics. Computa-tional Linguistics, 34(4):555–596.
Yigal Attali and Jill Burstein. 2006. Automated essayscoring with e-Rater v.2.0. Journal of Technology,Learning, and Assessment, 4(3):1–30.
Yigal Attali, Don Powers, Marshall Freedman, MarissaHarrison, and Susan Obetz. 2008. Automated Scoringof short-answer open-ended GRE subject test items.Technical Report 04, ETS.
Stefano Baccianella, Andrea Esuli, and Fabrizio Sebas-tiani. 2009. Evaluation measures for ordinal regres-sion. In 9th IEEE International Conference on Intel-ligent Systems Design and Applications, pages 283–287. IEEE Comput. Soc.
E M Bennett, R Alpert, and A C Goldstein. 1954.Communications through limited-response question-ing. Public Opinion Quarterly, 18(3):303–308.
Michael Bloodgood and John Grothendieck. 2013.Analysis of Stopping Active Learning based on Sta-bilizing Predictions. In Proceedings of the Seven-teenth Conference on Computational Natural Lan-guage Learning, pages 10–19.
Robert L Brennan and Dale J Prediger. 1981. Coefficientkappa: Some uses, misuses, and alternatives. Edu-cational and psychological measurement, 41(3):687–699.
Hermann Brenner and Ulrike Kliebsch. 1996. Depen-dence of weighted kappa coefficients on the numberof categories. Epidemiology, 7(2):199–202.
Ted Briscoe, Ben Medlock, and Øistein E. Andersen.2010. Automated assessment of ESOL free text exam-inations. Technical Report UCAM-CL-TR-790, Uni-versity of Cambridge, Computer Laboratory, nov.
Jill Burstein, Martin Chodorow, and Claudia Leacock.2003. Criterion: Online essay evaluation: An appli-cation for automated evaluation of student essays. In
Proceedings of the fifteenth annual conference on in-novative applications of artificial intelligence, pages3–10.
Ted Byrt, Janet Bishop, and John B Carlin. 1993. Bias,prevalence and kappa. Journal of clinical epidemiol-ogy, 46(5):423–429.
John B. Carroll. 1961. The nature of the data, or howto choose a correlation coefficient. Psychometrika,26(4):347–372, December.
Hongbo Chen and Ben He. 2013. Automated EssayScoring by Maximizing Human-machine Agreement.In Empirical Methods in Natural Language Process-ing, pages 1741–1752.
Jacob Cohen. 1960. A Coefficient of Agreement forNominal Scales. Educational and Psychological Mea-surement, 20(1):37–46, April.
Jacob Cohen. 1968. Weighted kappa: nominal scaleagreement with provision for scaled disagreement orpartial credit. Psychological bulletin, 4(70):213–220.
Richard Craggs and Mary McGee Wood. 2005. Evaluat-ing discourse and dialogue coding schemes. Compu-tational Linguistics, 31(3):289–295.
Barbara Di Eugenio and Michael Glass. 2004. The kappastatistic: A second look. Computational linguistics,30(1):95–101.
Alvan R Feinstein and Domenic V Cicchetti. 1990. Highagreement but low kappa: I. the problems of two para-doxes. Journal of clinical epidemiology, 43(6):543–549.
Joseph L. Fleiss. 1981. Statistical methods for rates andproportions. Wiley series in probability and math-ematical statistics. Applied probability and statistics.Wiley.
Laura D. Goodwin and Nancy L. Leech. 2006. Under-standing Correlation: Factors That Affect the Size ofr. The Journal of Experimental Education, 74(3):249–266, April.
Patrick Graham and Rodney Jackson. 1993. The analy-sis of ordinal agreement data: beyond weighted kappa.Journal of clinical epidemiology, 46(9):1055–1062,September.
Kilem Gwet. 2002. Inter-rater reliability: dependency ontrait prevalence and marginal homogeneity. StatisticalMethods for Inter-Rater Reliability Assessment Series,2:1–9.
Kilem L. Gwet. 2014. Handbook of Inter-Rater Relia-bility, 4th Edition: The Definitive Guide to MeasuringThe Extent of Agreement Among Raters. AdvancedAnalytics, LLC.
Jan Hauke and Tomasz Kossowski. 2011. Comparison ofValues of Pearson’s and Spearman’s Correlation Coef-ficients on the Same Sets of Data. Quaestiones Geo-graphicae, 30(2):87–93, January.
222

Derrick Higgins, Jill Burstein, Daniel Marcu, and Clau-dia Gentile. 2004. Evaluating multiple aspects of co-herence in student essays. In Proceedings of the Hu-man Language Technology Conference of the NorthAmerican Chapter of the Association for Computa-tional Linguistics.
Klaus Krippendorff. 1970. Estimating the reliabil-ity, systematic error and random er- ror of intervaldata. Educational and Psychological Measurement,30(1):61–70.
Thomas K. Landauer, Darrell Laham, and Peter W. Foltz.2003. Automated scoring and annotation of essayswith the Intelligent Essay Assessor. In M.D. Shermisand J. C. Burstein, editors, Automated essay scoring:A cross-disciplinary perspective, pages 87–112.
G Frank Lawlis and Elba Lu. 1972. Judgment of coun-seling process: reliability, agreement, and error. Psy-chological bulletin, 78(1):17–20, July.
Tsun-Jui Liu, Shu-Kai Hsieh, and Laurent PREVOT.2013. Observing Features of PTT Neologisms: ACorpus-driven Study with N-gram Model. In Twenty-Fifth Conference on Computational Linguistics andSpeech Processing (ROCLING 2013), pages 250–259.
Zvi Maimon, Adi Raveh, and Gur Mosheiov. 1986. Ad-ditional cautionary notes about the Pearson’s correla-tion coefficient. Quality and Quantity, 20(4).
Ellis B. Page. 1968. The use of the computer in analyz-ing student essays. International Review of Education,14(2):210–225, June.
L Perelman. 2013. Critique (ver. 3.4) of mark d. sher-mis and ben hammer,contrasting state-of-the-art auto-mated scoring of essays: Analysis. New York Times.
Donald E. Powers, Jill C. Burstein, Martin Chodorow,Mary E. Fowles, and Karen Kukich. 2002. Stump-ing e-rater: challenging the validity of automated essayscoring. Computers in Human Behavior, 18(2):103–134.
David M W Powers. 2012. The problem with kappa. In13th Conference of the European Chapter of the Asso-ciation for Computational Linguistics, pages 345–355.
Lawrence M. Rudner and Tahung Liang. 2002. Auto-mated essay scoring using Bayes’ theorem. The Jour-nal of Technology, Learning and Assessment, 1(2):3–21.
William A Scott. 1955. Reliability of content analy-sis: The case of nominal scale coding. Public opinionquarterly, 19(3):321–325.
Mark D Shermis and Ben Hamner. 2012. Contrastingstate-of-the-art automated scoring of essays: Analysis.In Annual National Council on Measurement in Edu-cation Meeting, pages 14–16.
Advaith Siddharthan and Napoleon Katsos. 2010. Re-formulating Discourse Connectives for Non-Expert
Readers. In North American Chapter of the ACL,pages 1002–1010.
Julius Sim and Chris C Wright. 2005. The KappaStatistic in Reliability Studies: Use, Interpretation,and Sample Size Requirements. Physical Therapy,85(3):257–268, March.
John S Uebersax. 1987. Diversity of decision-makingmodels and the measurement of interrater agreement.Psychological Bulletin, 101(1):140.
Jinhao Wang and Michelle Stallone Brown. 2007. Auto-mated Essay Scoring Versus Human Scoring: A Com-parative Study. The Journal of Technology, Learningand Assessment, 6(2).
Jinhao Wang and Michelle Stallone Brown. 2008. Auto-mated Essay Scoring Versus Human Scoring: A Cor-relational Study. Contemporary Issues in Technologyand Teacher Education, 8(4):310–325.
David M. Williamson, Xiaoming Xi, and Jay F. Breyer.2012. A framework for evaluation and use of auto-mated scoring. Educational Measurement: Issues andPractice, 31(1):2–13.
David M. Williamson. 2009. A Framework for Im-plementing Automated Scoring. In Proceedings ofthe Annual Meeting of the American Educational Re-search Association and the National Council on Mea-surement in Education, San Diego, CA.
Helen Yannakoudakis, Ted Briscoe, and Ben Medlock.2011. A New Dataset and Method for AutomaticallyGrading ESOL Texts. In Proceedings of the 49th An-nual Meeting of the Association for ComputationalLinguistics: Human Language Technologies.
Xinshu Zhao. 2011. When to use scott’s π or krippen-dorff’s α, if ever? In The annual Conference of the As-sociation for Education in Journalism and Mass Com-munication.
223
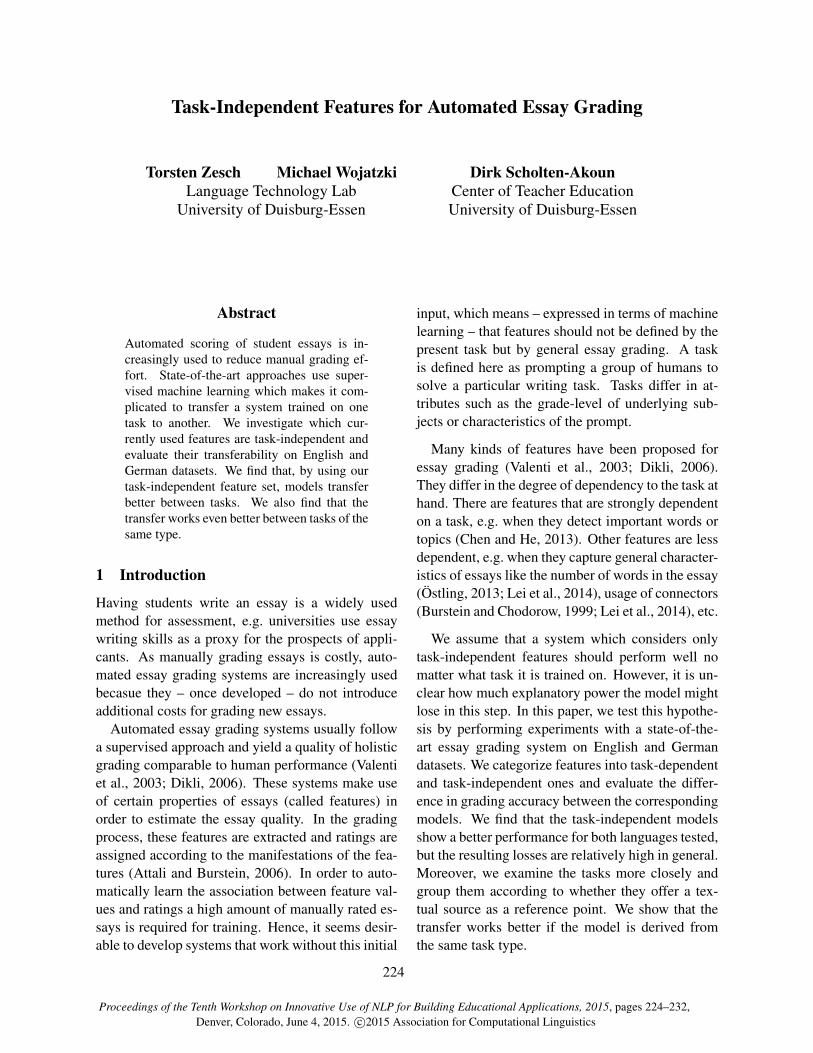
Proceedings of the Tenth Workshop on Innovative Use of NLP for Building Educational Applications, 2015, pages 224–232,Denver, Colorado, June 4, 2015. c©2015 Association for Computational Linguistics
Task-Independent Features for Automated Essay Grading
Torsten Zesch Michael WojatzkiLanguage Technology Lab
University of Duisburg-Essen
Dirk Scholten-AkounCenter of Teacher EducationUniversity of Duisburg-Essen
Abstract
Automated scoring of student essays is in-creasingly used to reduce manual grading ef-fort. State-of-the-art approaches use super-vised machine learning which makes it com-plicated to transfer a system trained on onetask to another. We investigate which cur-rently used features are task-independent andevaluate their transferability on English andGerman datasets. We find that, by using ourtask-independent feature set, models transferbetter between tasks. We also find that thetransfer works even better between tasks of thesame type.
1 Introduction
Having students write an essay is a widely usedmethod for assessment, e.g. universities use essaywriting skills as a proxy for the prospects of appli-cants. As manually grading essays is costly, auto-mated essay grading systems are increasingly usedbecasue they – once developed – do not introduceadditional costs for grading new essays.
Automated essay grading systems usually followa supervised approach and yield a quality of holisticgrading comparable to human performance (Valentiet al., 2003; Dikli, 2006). These systems make useof certain properties of essays (called features) inorder to estimate the essay quality. In the gradingprocess, these features are extracted and ratings areassigned according to the manifestations of the fea-tures (Attali and Burstein, 2006). In order to auto-matically learn the association between feature val-ues and ratings a high amount of manually rated es-says is required for training. Hence, it seems desir-able to develop systems that work without this initial
input, which means – expressed in terms of machinelearning – that features should not be defined by thepresent task but by general essay grading. A taskis defined here as prompting a group of humans tosolve a particular writing task. Tasks differ in at-tributes such as the grade-level of underlying sub-jects or characteristics of the prompt.
Many kinds of features have been proposed foressay grading (Valenti et al., 2003; Dikli, 2006).They differ in the degree of dependency to the task athand. There are features that are strongly dependenton a task, e.g. when they detect important words ortopics (Chen and He, 2013). Other features are lessdependent, e.g. when they capture general character-istics of essays like the number of words in the essay(Östling, 2013; Lei et al., 2014), usage of connectors(Burstein and Chodorow, 1999; Lei et al., 2014), etc.
We assume that a system which considers onlytask-independent features should perform well nomatter what task it is trained on. However, it is un-clear how much explanatory power the model mightlose in this step. In this paper, we test this hypothe-sis by performing experiments with a state-of-the-art essay grading system on English and Germandatasets. We categorize features into task-dependentand task-independent ones and evaluate the differ-ence in grading accuracy between the correspondingmodels. We find that the task-independent modelsshow a better performance for both languages tested,but the resulting losses are relatively high in general.Moreover, we examine the tasks more closely andgroup them according to whether they offer a tex-tual source as a reference point. We show that thetransfer works better if the model is derived fromthe same task type.
224

2 Features
In this section, we describe state-of-the-art featuresand how they relate to the quality of an essay. Foreach feature, we discuss whether it belongs to thestrongly task-dependent or weakly task-dependentgroup.
2.1 Length Features
This very simple but quite valuable feature dealswith the essay length (Mahana et al., 2012; Chenand He, 2013; Östling, 2013; Lei et al., 2014). Thecore idea is that essays are usually written under atime limit. So the amount of produced text can be auseful predictor of the productivity of the writer andthus the quality of the essay (Shermis and Burstein,2002). Therefore, we measure the text length bycounting all tokens and sentences in an essay. Thedegree of task-dependence of this feature is directlyconnected to the time limit.
The average sentence length in words and wordlength in characters can be an indicator for the de-gree of complexity a writer can master (Attali andBurstein, 2006; Mahana et al., 2012; Chen and He,2013; Östling, 2013). As this is not particularly tiedto a specific task, these features are weakly task-dependent.
2.2 Occurrence Features
According to Mahana et al. (2012) the occurrencesof linguistic phenomena such as commas, quota-tions, or exclamation marks can serve as valuablefeatures in a grade prediction. These features fo-cus more on the structuring of an essay and are thusweakly task-dependent.
For tasks that are source-based (i.e. a source textis provided on which the task is based), we augmentthis approach by also counting formal referenceslike citations and line references. Source-based fea-tures are obviously strongly task-dependent.
Using third party sources to support an argu-ment can be a valuable hint for evidence (Bergler,2006). Therefore, we use the approach of Krestel etal. (2008) to detect direct, indirect, and reportedspeech in essays. The approach relies on set of re-porting verbs and rules to identify and distinguishthese forms.
If a task is based on a certain text source, the oc-currence of core concepts in the essay should be anindicator for high quality (Foltz et al., 1999). We de-termine core concepts from the source using wordsor phrases with a high tf.idf weight. Again these fea-tures are just meaningful if the related task offers atextual source.
2.3 Syntax Features
Variation in the syntactic structures used in an essaymay indicate proficiency in writing (Burstein et al.,1998). Following Chen and He (2013), we opera-tionalize this by measuring the ratio of distinct parsetrees to all the trees and the average depths of thetrees to compute syntactic variation features.
Further, the parsing trees are used to measure theproportion of subordinate, causal and temporalclauses. Causal and temporal clauses are detectedby causal or temporal conjunctions that could befound in subordinate-clauses. For example, a sub-ordinate clause beginning with when is consideredas temporal. The detection of causal- and temporalclauses is used to enrich the syntactic variability bya discourse element (Burstein et al., 1998; Chen andHe, 2013; Lei et al., 2014). As syntactic featuresare relatively independent of the task, we categorizethem as weakly task-dependent.
2.4 Style Features
Another important aspect of essay quality is anappropriate style. Following Östling (2013), weuse the relative ratio of POS-tags to detect stylepreferences of writers. We complemented this by afeature that measures the formality F of an essay(Heylighen and Dewaele, 2002) defined as:
F =
∑i∈A
c(i)n
− ∑j∈B
c(j)n
+ 100
2
where A = {N, ADJ, PP, DET}, B = {PR, V,ADV, UH}, and n is the number of tokens in thetext. The formality-feature should be strongly task-dependent, as the correct style depends on the taskand the target audience.
The words used in the essay tell us somethingabout the vocabulary the writer actively uses. In ac-cordance with Chen and He (2013), we measure the
225

type-token-ratio to estimate whether an essay has arelatively rich or rather poor vocabulary.
As noted by Breland et al. (1994), word knowl-edge of a writer is highly tied to the corpus fre-quency of the words used. The lower the frequencythe higher the writer’s language proficiency. Wemodel this idea by calculating the average wordfrequency in the Web1T-corpus (Brants and Franz,2006). We expect this average frequency to berelatively stable and thus categorize the feature asweakly task-dependent.
2.5 Cohesion Features
The structure of an essay reflects the writer’s abil-ity to organize her ideas and compose a cohesive re-sponse to the task. Following Lei et al. (2014) theuse of connectives (like therefore or accordingly)can be a hint for a cohesive essay. We count oc-currences of connectives (from a fixed list) and nor-malize by the total number of tokens. As cohesionis relatively independent from the topic of an essay,we categorize this feature as weakly task-dependent.
2.6 Coherence Features
In order to make an essay understandable, writersneed to ensure that the whole text is coherent and thereader can follow the argumentation (Chen and He,2013; Lei et al., 2014). Features based on Rhetori-cal Structure Theory (William and Thompson, 1988)could be used (Burstein et al., 2001), but there areno reliable parsers available for German and per-formance is also not yet robust enough for English.Instead, we operationalize coherence measuring thetopical overlap between adjacent sentences. We usesimilarity measures based on n-gram overlap and re-dundancy (e.g. of nouns). This operationalization ofcoherence is weakly task-dependent, as the degreeof topical overlap is independent of the actual topic.
2.7 Error Features
Grammatical or spelling errors are one of the mostobvious indicators of bad essays, but have beenfound to have only little impact on scoring quality(Chen and He, 2013; Östling, 2013). We add a sim-ple rule-based grammar error feature in our systembased on LanguageTool.1 We do not expect gram-
1https://www.languagetool.org
mar errors to be bound to specific topics and catego-rize the feature as weakly task-dependent.
2.8 Readability Features
We use a set of established readability fea-tures (Flesch, Coleman-Liau, ARI, Kincaid, FOG,Lix, and SMOG), that rely on normalized countsof words, letters, syllables or other phenomena(like abbreviations) which affect the readability(McLaughlin, 1969; McCallum and Peterson, 1982;Smith and Taffler, 1992). Depending on which writ-ing style is considered as appropriate, high scoringessays might be associated with different levels ofreadability. However, a certain level of formal writ-ing is required for most essays and very simple orvery complex writing are both indicators for bad es-says. Thus, we categorize the features as weaklytask-dependent.
2.9 Task-Similarity Features
For source-based essays, we can determine the tasksimilarity of an essay by computing the similaritybetween essay and the task specific source (Östling,2013). There should be a certain degree of simi-larity between the source and the essay, but if thesimilarity is too high the essay might be plagia-rized. We use Kullback–Leibler divergence betweensource and essay.
A variant of this feature computes the corpussimilarity to a neutral background corpus (Browncorpus (Marcus et al., 1993) in our case) in orderto determine whether the essay was written specificenough.
While the corpus similarity should be weaklytask-dependent, the task similarity is of coursestrongly dependent on the task.
2.10 Set-Dependent Features
So far, all features have only used the characteris-tics of a single essay, but it is also useful to take thewhole set of essays into account. Instead of detect-ing characteristics of an individual essay the differ-ences between essays in the set is examined. Set-based features can be based on topics (Burstein etal., 1998) or n-grams (Chen and He, 2013). We useword n-gram features for the 1,000 most frequentuni-, bi- and tri-grams in the essay set. Following
226
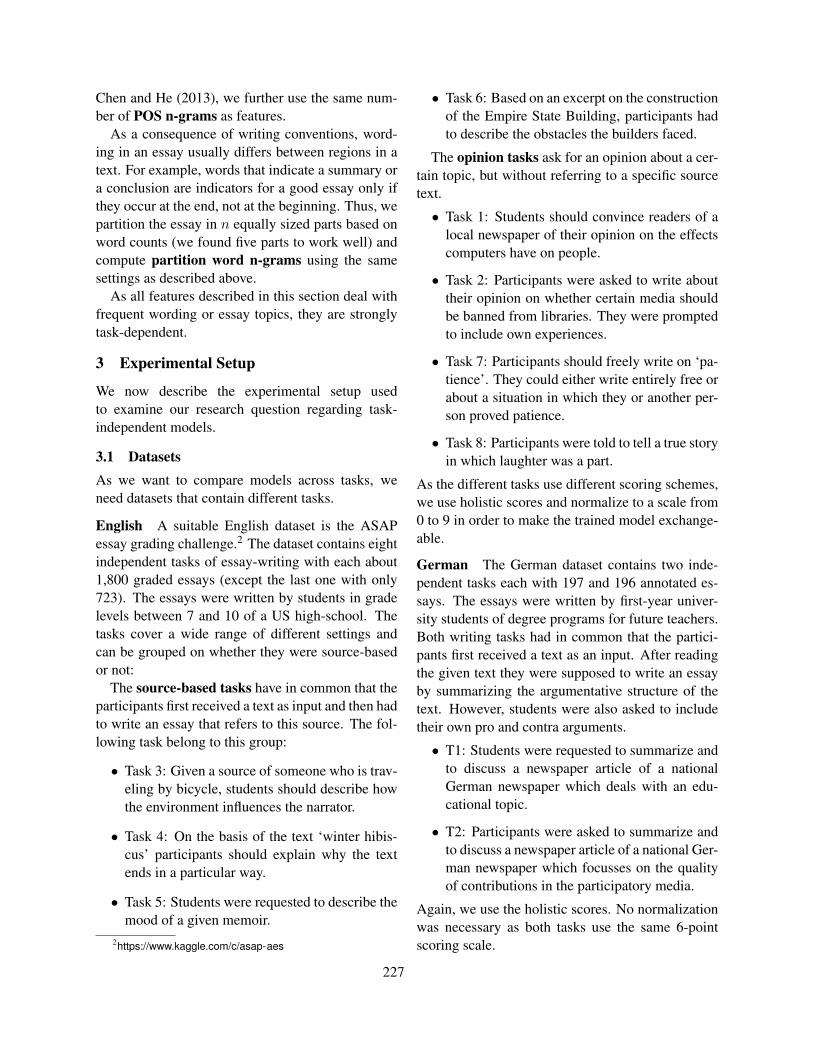
Chen and He (2013), we further use the same num-ber of POS n-grams as features.
As a consequence of writing conventions, word-ing in an essay usually differs between regions in atext. For example, words that indicate a summary ora conclusion are indicators for a good essay only ifthey occur at the end, not at the beginning. Thus, wepartition the essay in n equally sized parts based onword counts (we found five parts to work well) andcompute partition word n-grams using the samesettings as described above.
As all features described in this section deal withfrequent wording or essay topics, they are stronglytask-dependent.
3 Experimental Setup
We now describe the experimental setup usedto examine our research question regarding task-independent models.
3.1 DatasetsAs we want to compare models across tasks, weneed datasets that contain different tasks.
English A suitable English dataset is the ASAPessay grading challenge.2 The dataset contains eightindependent tasks of essay-writing with each about1,800 graded essays (except the last one with only723). The essays were written by students in gradelevels between 7 and 10 of a US high-school. Thetasks cover a wide range of different settings andcan be grouped on whether they were source-basedor not:
The source-based tasks have in common that theparticipants first received a text as input and then hadto write an essay that refers to this source. The fol-lowing task belong to this group:
• Task 3: Given a source of someone who is trav-eling by bicycle, students should describe howthe environment influences the narrator.
• Task 4: On the basis of the text ‘winter hibis-cus’ participants should explain why the textends in a particular way.
• Task 5: Students were requested to describe themood of a given memoir.
2https://www.kaggle.com/c/asap-aes
• Task 6: Based on an excerpt on the constructionof the Empire State Building, participants hadto describe the obstacles the builders faced.
The opinion tasks ask for an opinion about a cer-tain topic, but without referring to a specific sourcetext.
• Task 1: Students should convince readers of alocal newspaper of their opinion on the effectscomputers have on people.
• Task 2: Participants were asked to write abouttheir opinion on whether certain media shouldbe banned from libraries. They were promptedto include own experiences.
• Task 7: Participants should freely write on ‘pa-tience’. They could either write entirely free orabout a situation in which they or another per-son proved patience.
• Task 8: Participants were told to tell a true storyin which laughter was a part.
As the different tasks use different scoring schemes,we use holistic scores and normalize to a scale from0 to 9 in order to make the trained model exchange-able.
German The German dataset contains two inde-pendent tasks each with 197 and 196 annotated es-says. The essays were written by first-year univer-sity students of degree programs for future teachers.Both writing tasks had in common that the partici-pants first received a text as an input. After readingthe given text they were supposed to write an essayby summarizing the argumentative structure of thetext. However, students were also asked to includetheir own pro and contra arguments.
• T1: Students were requested to summarize andto discuss a newspaper article of a nationalGerman newspaper which deals with an edu-cational topic.
• T2: Participants were asked to summarize andto discuss a newspaper article of a national Ger-man newspaper which focusses on the qualityof contributions in the participatory media.
Again, we use the holistic scores. No normalizationwas necessary as both tasks use the same 6-pointscoring scale.
227
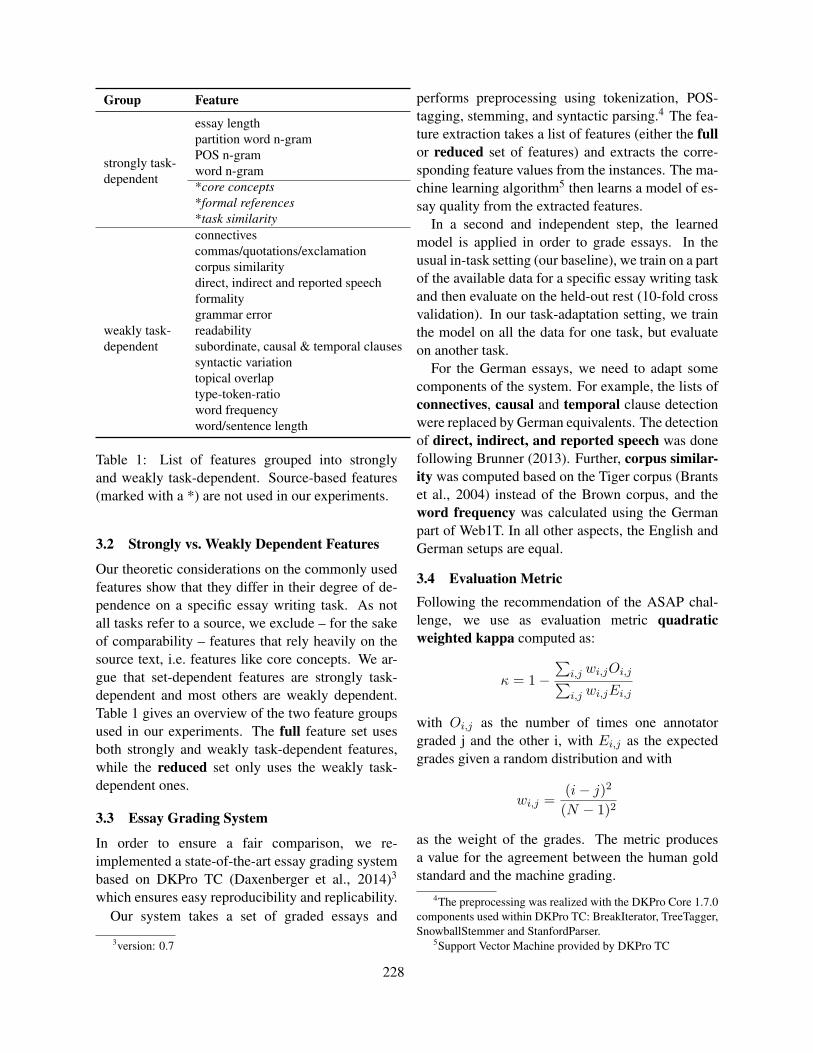
Group Feature
strongly task-dependent
essay lengthpartition word n-gramPOS n-gramword n-gram*core concepts*formal references*task similarity
weakly task-dependent
connectivescommas/quotations/exclamationcorpus similaritydirect, indirect and reported speechformalitygrammar errorreadabilitysubordinate, causal & temporal clausessyntactic variationtopical overlaptype-token-ratioword frequencyword/sentence length
Table 1: List of features grouped into stronglyand weakly task-dependent. Source-based features(marked with a *) are not used in our experiments.
3.2 Strongly vs. Weakly Dependent Features
Our theoretic considerations on the commonly usedfeatures show that they differ in their degree of de-pendence on a specific essay writing task. As notall tasks refer to a source, we exclude – for the sakeof comparability – features that rely heavily on thesource text, i.e. features like core concepts. We ar-gue that set-dependent features are strongly task-dependent and most others are weakly dependent.Table 1 gives an overview of the two feature groupsused in our experiments. The full feature set usesboth strongly and weakly task-dependent features,while the reduced set only uses the weakly task-dependent ones.
3.3 Essay Grading System
In order to ensure a fair comparison, we re-implemented a state-of-the-art essay grading systembased on DKPro TC (Daxenberger et al., 2014)3
which ensures easy reproducibility and replicability.Our system takes a set of graded essays and
3version: 0.7
performs preprocessing using tokenization, POS-tagging, stemming, and syntactic parsing.4 The fea-ture extraction takes a list of features (either the fullor reduced set of features) and extracts the corre-sponding feature values from the instances. The ma-chine learning algorithm5 then learns a model of es-say quality from the extracted features.
In a second and independent step, the learnedmodel is applied in order to grade essays. In theusual in-task setting (our baseline), we train on a partof the available data for a specific essay writing taskand then evaluate on the held-out rest (10-fold crossvalidation). In our task-adaptation setting, we trainthe model on all the data for one task, but evaluateon another task.
For the German essays, we need to adapt somecomponents of the system. For example, the lists ofconnectives, causal and temporal clause detectionwere replaced by German equivalents. The detectionof direct, indirect, and reported speech was donefollowing Brunner (2013). Further, corpus similar-ity was computed based on the Tiger corpus (Brantset al., 2004) instead of the Brown corpus, and theword frequency was calculated using the Germanpart of Web1T. In all other aspects, the English andGerman setups are equal.
3.4 Evaluation MetricFollowing the recommendation of the ASAP chal-lenge, we use as evaluation metric quadraticweighted kappa computed as:
κ = 1−∑
i,j wi,jOi,j∑i,j wi,jEi,j
with Oi,j as the number of times one annotatorgraded j and the other i, with Ei,j as the expectedgrades given a random distribution and with
wi,j =(i− j)2
(N − 1)2
as the weight of the grades. The metric producesa value for the agreement between the human goldstandard and the machine grading.
4The preprocessing was realized with the DKPro Core 1.7.0components used within DKPro TC: BreakIterator, TreeTagger,SnowballStemmer and StanfordParser.
5Support Vector Machine provided by DKPro TC
228
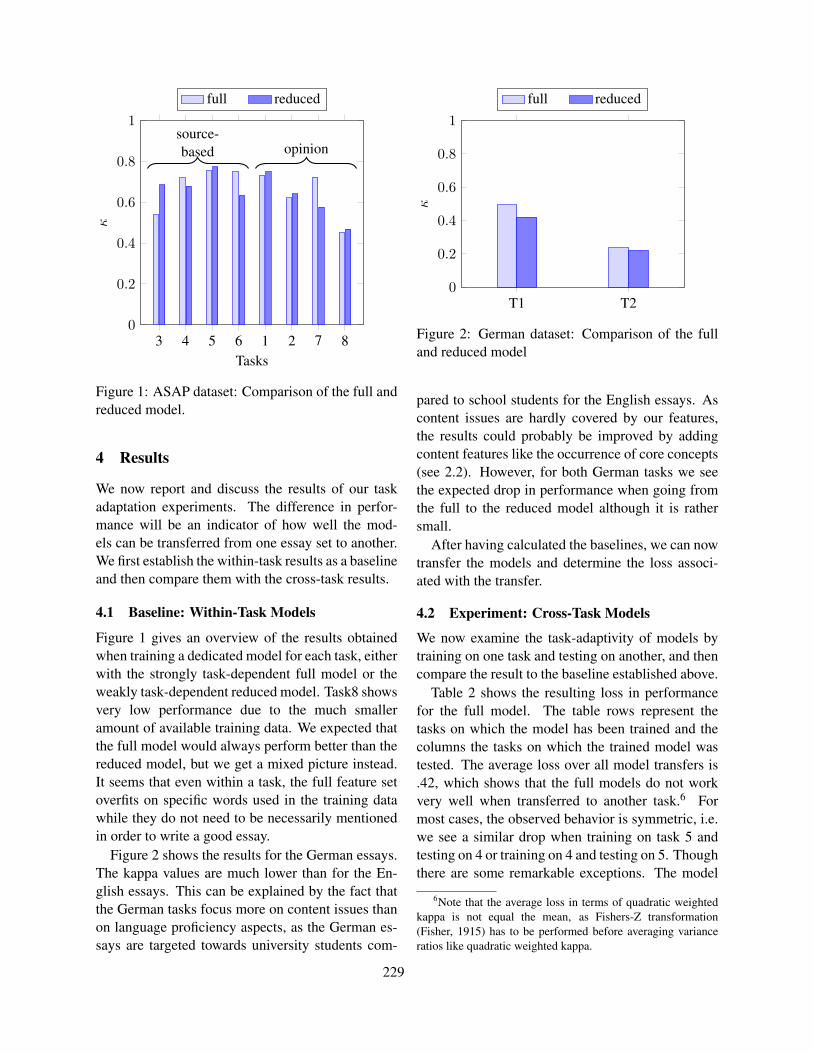
3 4 5 6 1 2 7 80
0.2
0.4
0.6
0.8
1source-based opinion
Tasks
κfull reduced
Figure 1: ASAP dataset: Comparison of the full andreduced model.
4 Results
We now report and discuss the results of our taskadaptation experiments. The difference in perfor-mance will be an indicator of how well the mod-els can be transferred from one essay set to another.We first establish the within-task results as a baselineand then compare them with the cross-task results.
4.1 Baseline: Within-Task Models
Figure 1 gives an overview of the results obtainedwhen training a dedicated model for each task, eitherwith the strongly task-dependent full model or theweakly task-dependent reduced model. Task8 showsvery low performance due to the much smalleramount of available training data. We expected thatthe full model would always perform better than thereduced model, but we get a mixed picture instead.It seems that even within a task, the full feature setoverfits on specific words used in the training datawhile they do not need to be necessarily mentionedin order to write a good essay.
Figure 2 shows the results for the German essays.The kappa values are much lower than for the En-glish essays. This can be explained by the fact thatthe German tasks focus more on content issues thanon language proficiency aspects, as the German es-says are targeted towards university students com-
T1 T20
0.2
0.4
0.6
0.8
1
κ
full reduced
Figure 2: German dataset: Comparison of the fulland reduced model
pared to school students for the English essays. Ascontent issues are hardly covered by our features,the results could probably be improved by addingcontent features like the occurrence of core concepts(see 2.2). However, for both German tasks we seethe expected drop in performance when going fromthe full to the reduced model although it is rathersmall.
After having calculated the baselines, we can nowtransfer the models and determine the loss associ-ated with the transfer.
4.2 Experiment: Cross-Task Models
We now examine the task-adaptivity of models bytraining on one task and testing on another, and thencompare the result to the baseline established above.
Table 2 shows the resulting loss in performancefor the full model. The table rows represent thetasks on which the model has been trained and thecolumns the tasks on which the trained model wastested. The average loss over all model transfers is.42, which shows that the full models do not workvery well when transferred to another task.6 Formost cases, the observed behavior is symmetric, i.e.we see a similar drop when training on task 5 andtesting on 4 or training on 4 and testing on 5. Thoughthere are some remarkable exceptions. The model
6Note that the average loss in terms of quadratic weightedkappa is not equal the mean, as Fishers-Z transformation(Fisher, 1915) has to be performed before averaging varianceratios like quadratic weighted kappa.
229
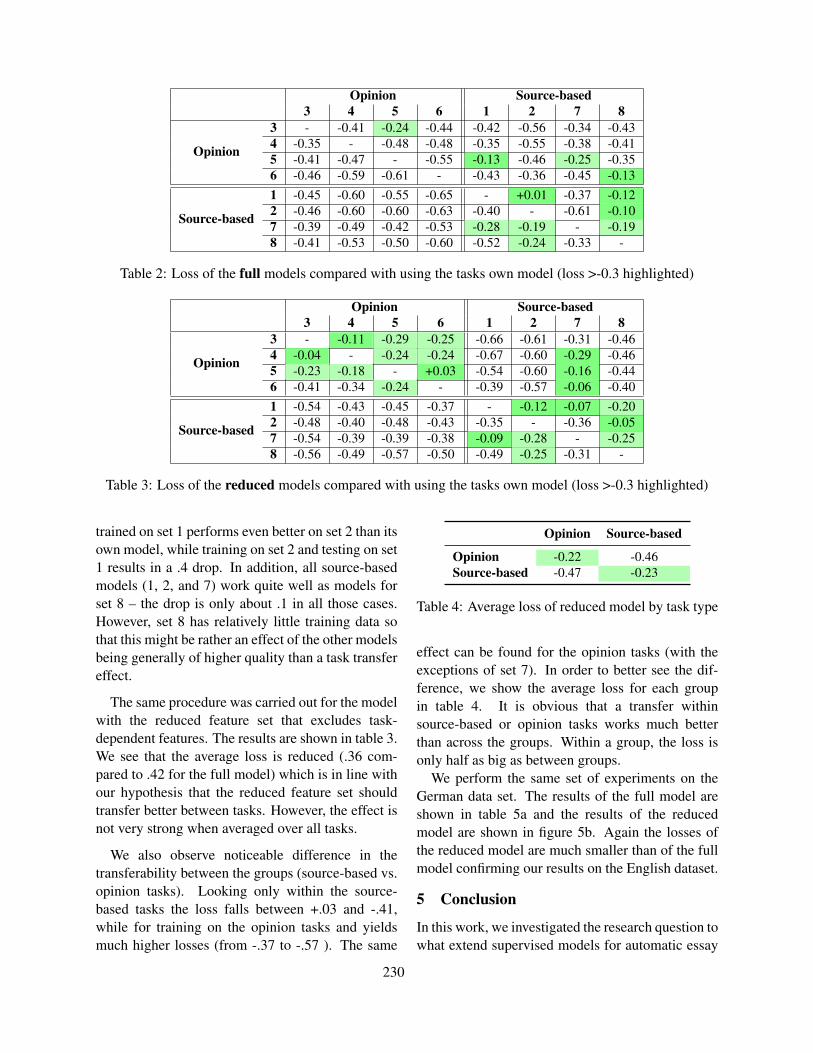
Opinion Source-based3 4 5 6 1 2 7 8
Opinion
3 - -0.41 -0.24 -0.44 -0.42 -0.56 -0.34 -0.434 -0.35 - -0.48 -0.48 -0.35 -0.55 -0.38 -0.415 -0.41 -0.47 - -0.55 -0.13 -0.46 -0.25 -0.356 -0.46 -0.59 -0.61 - -0.43 -0.36 -0.45 -0.13
Source-based
1 -0.45 -0.60 -0.55 -0.65 - +0.01 -0.37 -0.122 -0.46 -0.60 -0.60 -0.63 -0.40 - -0.61 -0.107 -0.39 -0.49 -0.42 -0.53 -0.28 -0.19 - -0.198 -0.41 -0.53 -0.50 -0.60 -0.52 -0.24 -0.33 -
Table 2: Loss of the full models compared with using the tasks own model (loss >-0.3 highlighted)
Opinion Source-based3 4 5 6 1 2 7 8
Opinion
3 - -0.11 -0.29 -0.25 -0.66 -0.61 -0.31 -0.464 -0.04 - -0.24 -0.24 -0.67 -0.60 -0.29 -0.465 -0.23 -0.18 - +0.03 -0.54 -0.60 -0.16 -0.446 -0.41 -0.34 -0.24 - -0.39 -0.57 -0.06 -0.40
Source-based
1 -0.54 -0.43 -0.45 -0.37 - -0.12 -0.07 -0.202 -0.48 -0.40 -0.48 -0.43 -0.35 - -0.36 -0.057 -0.54 -0.39 -0.39 -0.38 -0.09 -0.28 - -0.258 -0.56 -0.49 -0.57 -0.50 -0.49 -0.25 -0.31 -
Table 3: Loss of the reduced models compared with using the tasks own model (loss >-0.3 highlighted)
trained on set 1 performs even better on set 2 than itsown model, while training on set 2 and testing on set1 results in a .4 drop. In addition, all source-basedmodels (1, 2, and 7) work quite well as models forset 8 – the drop is only about .1 in all those cases.However, set 8 has relatively little training data sothat this might be rather an effect of the other modelsbeing generally of higher quality than a task transfereffect.
The same procedure was carried out for the modelwith the reduced feature set that excludes task-dependent features. The results are shown in table 3.We see that the average loss is reduced (.36 com-pared to .42 for the full model) which is in line withour hypothesis that the reduced feature set shouldtransfer better between tasks. However, the effect isnot very strong when averaged over all tasks.
We also observe noticeable difference in thetransferability between the groups (source-based vs.opinion tasks). Looking only within the source-based tasks the loss falls between +.03 and -.41,while for training on the opinion tasks and yieldsmuch higher losses (from -.37 to -.57 ). The same
Opinion Source-based
Opinion -0.22 -0.46Source-based -0.47 -0.23
Table 4: Average loss of reduced model by task type
effect can be found for the opinion tasks (with theexceptions of set 7). In order to better see the dif-ference, we show the average loss for each groupin table 4. It is obvious that a transfer withinsource-based or opinion tasks works much betterthan across the groups. Within a group, the loss isonly half as big as between groups.
We perform the same set of experiments on theGerman data set. The results of the full model areshown in table 5a and the results of the reducedmodel are shown in figure 5b. Again the losses ofthe reduced model are much smaller than of the fullmodel confirming our results on the English dataset.
5 Conclusion
In this work, we investigated the research question towhat extend supervised models for automatic essay
230
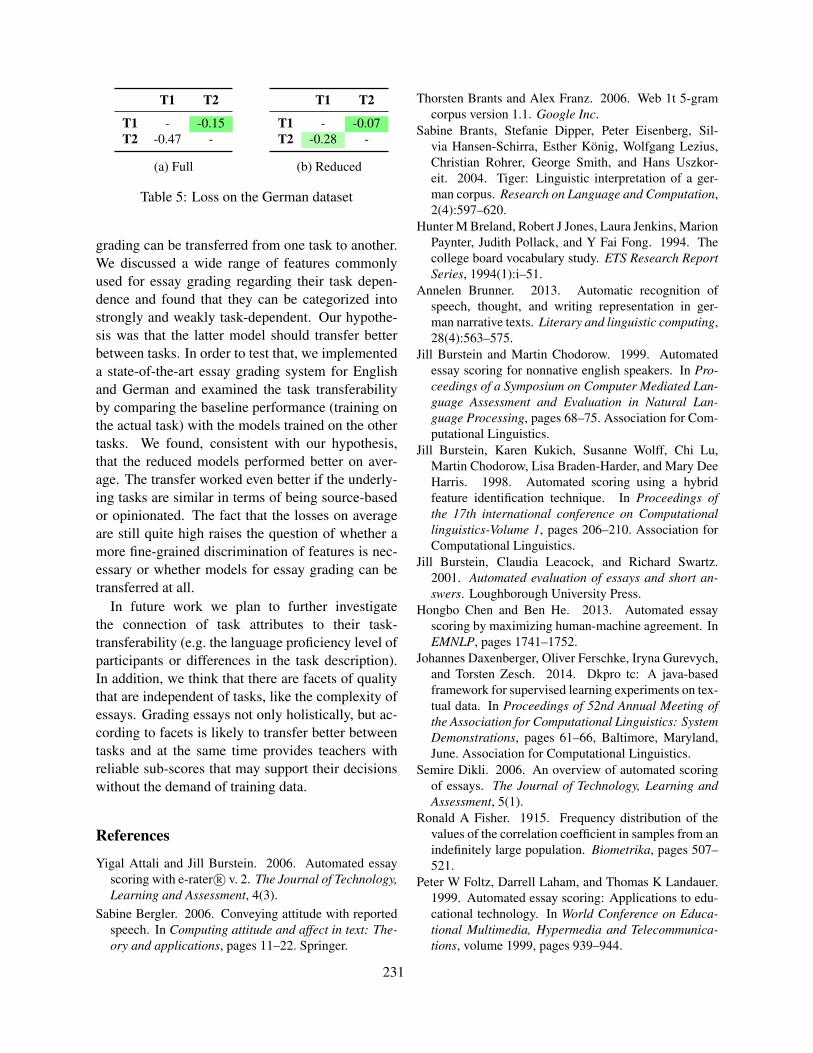
T1 T2
T1 - -0.15T2 -0.47 -
(a) Full
T1 T2
T1 - -0.07T2 -0.28 -
(b) Reduced
Table 5: Loss on the German dataset
grading can be transferred from one task to another.We discussed a wide range of features commonlyused for essay grading regarding their task depen-dence and found that they can be categorized intostrongly and weakly task-dependent. Our hypothe-sis was that the latter model should transfer betterbetween tasks. In order to test that, we implementeda state-of-the-art essay grading system for Englishand German and examined the task transferabilityby comparing the baseline performance (training onthe actual task) with the models trained on the othertasks. We found, consistent with our hypothesis,that the reduced models performed better on aver-age. The transfer worked even better if the underly-ing tasks are similar in terms of being source-basedor opinionated. The fact that the losses on averageare still quite high raises the question of whether amore fine-grained discrimination of features is nec-essary or whether models for essay grading can betransferred at all.
In future work we plan to further investigatethe connection of task attributes to their task-transferability (e.g. the language proficiency level ofparticipants or differences in the task description).In addition, we think that there are facets of qualitythat are independent of tasks, like the complexity ofessays. Grading essays not only holistically, but ac-cording to facets is likely to transfer better betweentasks and at the same time provides teachers withreliable sub-scores that may support their decisionswithout the demand of training data.
References
Yigal Attali and Jill Burstein. 2006. Automated essayscoring with e-rater R© v. 2. The Journal of Technology,Learning and Assessment, 4(3).
Sabine Bergler. 2006. Conveying attitude with reportedspeech. In Computing attitude and affect in text: The-ory and applications, pages 11–22. Springer.
Thorsten Brants and Alex Franz. 2006. Web 1t 5-gramcorpus version 1.1. Google Inc.
Sabine Brants, Stefanie Dipper, Peter Eisenberg, Sil-via Hansen-Schirra, Esther König, Wolfgang Lezius,Christian Rohrer, George Smith, and Hans Uszkor-eit. 2004. Tiger: Linguistic interpretation of a ger-man corpus. Research on Language and Computation,2(4):597–620.
Hunter M Breland, Robert J Jones, Laura Jenkins, MarionPaynter, Judith Pollack, and Y Fai Fong. 1994. Thecollege board vocabulary study. ETS Research ReportSeries, 1994(1):i–51.
Annelen Brunner. 2013. Automatic recognition ofspeech, thought, and writing representation in ger-man narrative texts. Literary and linguistic computing,28(4):563–575.
Jill Burstein and Martin Chodorow. 1999. Automatedessay scoring for nonnative english speakers. In Pro-ceedings of a Symposium on Computer Mediated Lan-guage Assessment and Evaluation in Natural Lan-guage Processing, pages 68–75. Association for Com-putational Linguistics.
Jill Burstein, Karen Kukich, Susanne Wolff, Chi Lu,Martin Chodorow, Lisa Braden-Harder, and Mary DeeHarris. 1998. Automated scoring using a hybridfeature identification technique. In Proceedings ofthe 17th international conference on Computationallinguistics-Volume 1, pages 206–210. Association forComputational Linguistics.
Jill Burstein, Claudia Leacock, and Richard Swartz.2001. Automated evaluation of essays and short an-swers. Loughborough University Press.
Hongbo Chen and Ben He. 2013. Automated essayscoring by maximizing human-machine agreement. InEMNLP, pages 1741–1752.
Johannes Daxenberger, Oliver Ferschke, Iryna Gurevych,and Torsten Zesch. 2014. Dkpro tc: A java-basedframework for supervised learning experiments on tex-tual data. In Proceedings of 52nd Annual Meeting ofthe Association for Computational Linguistics: SystemDemonstrations, pages 61–66, Baltimore, Maryland,June. Association for Computational Linguistics.
Semire Dikli. 2006. An overview of automated scoringof essays. The Journal of Technology, Learning andAssessment, 5(1).
Ronald A Fisher. 1915. Frequency distribution of thevalues of the correlation coefficient in samples from anindefinitely large population. Biometrika, pages 507–521.
Peter W Foltz, Darrell Laham, and Thomas K Landauer.1999. Automated essay scoring: Applications to edu-cational technology. In World Conference on Educa-tional Multimedia, Hypermedia and Telecommunica-tions, volume 1999, pages 939–944.
231
Francis Heylighen and Jean-Marc Dewaele. 2002. Vari-ation in the contextuality of language: An empiricalmeasure. Foundations of Science, 7(3):293–340.
Ralf Krestel, Sabine Bergler, René Witte, et al. 2008.Minding the source: Automatic tagging of reportedspeech in newspaper articles. Reporter, 1(5):4.
Chi-Un Lei, Ka Lok Man, and TO Ting. 2014. Usinglearning analytics to analyze writing skills of students:A case study in a technological common core curricu-lum course. IAENG International Journal of Com-puter Science, 41(3).
Manvi Mahana, Mishel Johns, and Ashwin Apte. 2012.Automated essay grading using machine learning.Mach. Learn. Session, Stanford University.
Mitchell P Marcus, Mary Ann Marcinkiewicz, and Beat-rice Santorini. 1993. Building a large annotated cor-pus of english: The penn treebank. Computational lin-guistics, 19(2):313–330.
Douglas R McCallum and James L Peterson. 1982.Computer-based readability indexes. In Proceedingsof the ACM’82 Conference, pages 44–48. ACM.
G Harry McLaughlin. 1969. Smog grading: A new read-ability formula. Journal of reading, 12(8):639–646.
Robert Östling. 2013. Automated essay scoring forswedish. In Proceedings of the Eighth Workshop onInnovative Use of NLP for Building Educational Ap-plications, pages 42–47.
Mark D Shermis and Jill C Burstein. 2002. Automatedessay scoring: A cross-disciplinary perspective. Rout-ledge.
Malcolm Smith and Richard Taffler. 1992. Readabilityand understandability: Different measures of the tex-tual complexity of accounting narrative. Accounting,Auditing & Accountability Journal, 5(4):0–0.
Salvatore Valenti, Francesca Neri, and Alessandro Cuc-chiarelli. 2003. An overview of current researchon automated essay grading. Journal of InformationTechnology Education: Research, 2(1):319–330.
Mann William and Sandra Thompson. 1988. Rhetoricalstructure theory: Towards a functional theory of textorganization. Text, 8(3):243–281.
232

Proceedings of the Tenth Workshop on Innovative Use of NLP for Building Educational Applications, 2015, pages 233–242,Denver, Colorado, June 4, 2015. c©2015 Association for Computational Linguistics
Using Learner Data to Improve Error Correctionin Adjective–Noun Combinations
Ekaterina KochmarAlta Institute
Computer LaboratoryUniversity of [email protected]
Ted BriscoeAlta Institute
Computer LaboratoryUniversity of [email protected]
Abstract
This paper presents a novel approach to errorcorrection in content words in learner writingfocussing on adjective–noun (AN) combina-tions. We show how error patterns can be usedto improve the performance of the error cor-rection system, and demonstrate that our ap-proach is capable of suggesting an appropri-ate correction within the top two alternativesin half of the cases and within top 10 alterna-tives in 71% of the cases, performing with anMRR of 0.5061. We then integrate our errorcorrection system with a state-of-the-art con-tent word error detection system and discussthe results.
1 Introduction
The task of error detection and correction (EDC) onnon-native texts, as well as research on learner lan-guage in general, has attracted much attention re-cently (Leacock et al., 2014; Ng et al., 2014; Ng etal., 2013; Dale et al., 2012). The field has been dom-inated by EDC for grammatical errors and errors inthe use of articles and prepositions (Ng et al., 2013;Rozovskaya and Roth, 2011; Chodorow et al., 2010;Gamon et al., 2008; Brockett et al., 2006; Han et al.,2006).
More recently, however, the need to addressother error types has been recognised (Kochmar andBriscoe, 2014; Ng et al., 2014; Rozovskaya et al.,2014; Sawai et al., 2013; Dahlmeier and Ng, 2011).Among these, errors in content words are the thirdmost frequent error type after errors in articles andprepositions (Leacock et al., 2014; Ng et al., 2014).
The correct use of content words is notoriously hardfor language learners to master, while importanceof the correct word choice for successful writinghas long been recognised (Leacock and Chodorow,2003; Johnson, 2000; Santos, 1988).
The major difficulty is that correct word choiceis not governed by any strictly defined rules: nativespeakers know that powerful computer is preferredover strong computer, while strong tea is preferredover powerful tea (Leacock et al., 2014), but lan-guage learners often find themselves unsure of howto choose an appropriate word. As a result, theyoften confuse words that are similar in meaning orspelling, overuse words with general meaning, or se-lect words based on their L1s (Kochmar and Briscoe,2014; Dahlmeier and Ng, 2011).
Previous work on EDC for content words has alsodemonstrated that since these error types are sub-stantially different from errors with function words,they require different approaches. The most widelyadopted approach to EDC for function words relieson availability of finite confusion sets. The taskcan then be cast as multi-class classification withthe number of classes equal to the number of pos-sible alternatives. Detection and correction can bedone simultaneously: if the alternative chosen by theclassifier is different from the original word, this isflagged as an error. However, content word errorscannot be defined in terms of a general and finite setof confusion pairs, and the set of alternatives in eachcase depends on the choice of original word. More-over, it has been argued that error detection for con-tent words should be performed independently fromerror correction (Kochmar and Briscoe, 2014).
233
In this work, we focus on error correction in con-tent words and, in particular, investigate error cor-rection in adjective–noun (AN) combinations usingseveral publicly-available learner error datasets forthis type of construction. At the same time, we be-lieve that a similar approach can be applied to othertypes of content word combinations. Specifically,we make the following contributions:
1. We explore different ways to construct the cor-rection sets and to rank the alternatives with re-spect to their appropriateness. We report thecoverage of different resources and assess theranked lists of suggestions.
2. We show that learner text is a useful source ofpossible corrections for content words. In ad-dition, we demonstrate how error patterns ex-tracted from learner text can be used to improvethe ranking of the alternatives.
3. We present an EDC system for AN combina-tions which compares favourably to the pre-vious published approaches of which we areaware.
4. We explore the usefulness of self-propagatingfor an error correction system.
2 Related work
Leacock et al. (2014) note that the usual approachto EDC in content words relies on the idea of com-paring the writer’s choice to possible alternatives, sothat if any of the alternatives score higher than theoriginal combination then the original combinationis flagged as a possible error and one or more alter-natives are suggested as possible corrections. Theperformance of an EDC algorithm that uses this ap-proach depends on:
• the choice of the source of alternatives;
• the choice of the metric for ranking the alterna-tives.
The source of alternatives defines the coverage ofthe error correction algorithm, while the quality ofthe system suggestions depends on the choice of anappropriate metric for ranking the alternatives.
Early work on EDC for content words (Wibleet al., 2003; Shei and Pain, 2000) relied on theuse of reference databases of known learner errorsand their corrections. While such approaches canachieve good quality, they cannot provide good cov-erage.
Previous research considered semantically relatedconfusions between content words as the most fre-quent type of confusion in learner writing and usedWordNet (Miller, 1995), dictionaries and thesauri tosearch for alternatives (Ostling and Knutsson, 2009;Futagi et al., 2008; Shei and Pain, 2000). Sincethese resources cannot cover alternatives that are notsemantically related to the original words, other re-sources have been considered as well: for example,Dahlmeier and Ng (2011) consider spelling alterna-tives and homophones as possible corrections.
L1-specific confusions have been reported tocover a substantial portion of errors in content wordsfor some groups of language learners (Chang etal., 2008; Liu, 2002), and some previous EDC ap-proaches have considered using parallel corpora andbilingual dictionaries to generate and rank alterna-tives (Dahlmeier and Ng, 2011; Chang et al., 2008).L1-specific approaches have shown the best resultsin EDC for content words so far, but it should benoted that their success relies on availability of high-quality L1-specific resources which is hard to guar-antee for the full variety of learner L1s.
At the same time, good performance demon-strated by L1-specific approaches shows the impor-tance of taking learner background into considera-tion. In contrast to the other resources like Word-Net and thesauri, which can only cover confusionsbetween words in the L2, use of parallel corporaand bilingual dictionaries gives access to the typesof confusions which cannot be captured by any L2resources. Learner corpora and databases of text re-visions can be used to similar effect.
For example, Rozovskaya and Roth (2011) showthat performance of an EDC algorithm applied to ar-ticles and prepositions can be improved if the classi-fier uses L1-specific priors, with the priors being setusing the distribution of confusion pairs in learnertexts. Sawai et al. (2013) show that an EDC sys-tem that uses a large learner corpus to extract confu-sion sets outperforms systems that use WordNet androundtrip translations. Madnani and Cahill (2014)
234

use a corpus of Wikipedia revisions containing an-notated errors in the use of prepositions and theircorrections to improve the ranking of the sugges-tions.
Finally, we note that a number of previous ap-proaches to errors in content words have combinederror detection and correction, flagging an originalchoice as an error if an EDC algorithm is able to finda more frequent or fluent combination (Ostling andKnutsson, 2009; Chang et al., 2008; Futagi et al.,2008; Shei and Pain, 2000), while some focussedon error correction only (Dahlmeier and Ng, 2011;Liu et al., 2009). Kochmar and Briscoe (2014) arguethat error detection and correction should be per-formed separately. They show that an EDC algo-rithm is prone to overcorrection, flagging originallycorrect combinations as errors, if error detection isdependent on the set of alternatives and if some ofthese alternatives are judged to be more fluent thanthe original combination.
We follow Kochmar and Briscoe (2014) and treaterror detection and error correction in content wordsas separate steps. We focus on the correction step,and first implement a simple error correction algo-rithm that replicates previous approaches to EDC forcontent words. We believe that performance of thisalgorithm on our data reflects the state-of-the-art incontent error correction. Next, we show how learnerdata and distribution of confusion pairs can be usedto improve the performance of this algorithm.
3 Data
In our experiments, we use three publicly-availabledatasets of learner errors in AN combinations: theAN dataset extracted from the Cambridge LearnerCorpus (CLC)1 and annotated with respect to thelearner errors in the choice of adjectives andnouns;2 the AN dataset extracted from the CLC-FCE dataset;3 and the set of errors in ANs that wehave extracted for the purposes of this work from the
1http://www.cup.cam.ac.uk/gb/elt/catalogue/subject/custom/item3646603/Cambridge-International-Corpus-Cambridge-Learner-Corpus/
2http://ilexir.co.uk/media/an-dataset.xml
3http://ilexir.co.uk/applications/adjective-noun-dataset/
training and development sets used in the CoNLL-2014 Shared Task on Grammatical Error Correc-tion.4 We discuss these datasets below.
3.1 Annotated dataset
We use the dataset of AN combinations released byKochmar and Briscoe (2014). This dataset presentstypical learner errors in the use of 61 adjectives thatare most problematic for language learners. The ex-amples are annotated with respect to the types of er-rors committed in the use of adjectives and nouns,and corrections are provided.
Kochmar and Briscoe note that learners often con-fuse semantically related words (e.g., synonyms,near-synonyms, hypo-/hypernyms). Examples (1)and (2) from Kochmar and Briscoe (2014) illustratethe confusion between the adjective big and seman-tically similar adjectives large and great:
(1) big*/largequantity
(2) big*/great im-portance
In addition, in Kochmar and Briscoe (2014) wenote that the adjectives with quite general meaninglike big, large and great are often overused by lan-guage learners instead of more specific ones, as isillustrated by examples (3) to (6):
(3) big*/longhistory
(4) bigger*/widervariety
(5)greatest*/highestrevenue
(6) large*/broadknowledge
Words that seem to be similar in form (either re-lated morphologically or through similar pronuncia-tion) are also often confused by learners. Examples(7) and (8) illustrate this type of confusions:
(7)classic*/classicaldance
(8)economical*/economiccrisis
The dataset contains 798 annotated AN combina-tions, with 340 unique errors.
Table 1 presents the statistics on the error typesdetected in this dataset. The majority of the errors
4http://www.comp.nus.edu.sg/˜nlp/conll14st.html
235

Error type DistributionS 56.18%F 25.88%N 17.94%
Table 1: Distribution of error types in the annotateddataset.
involve semantically related words (type S). Form-related confusions occur in 25.88% of the cases(type F); while 17.94% are annotated as errors com-mitted due to other reasons (type N), possibly relatedto learners’ L1s.
3.2 CLC-FCE dataset
The CLC-FCE AN dataset is extracted from thepublicly-available CLC-FCE subset of the CLC re-leased by Yannakoudakis et al. (2011). The CLCerror coding (Nicholls, 2003) has been used to ex-tract the correctly used ANs and those that are an-notated as errors due to inappropriate choice of anadjective or/and noun, but the error subtypes for theAN errors are not further specified. We have ex-tracted 456 combinations that have adjective–nouncombinations as corrections.
3.3 NUCLE dataset
We have also used the training and development setsfrom the CoNLL-2014 Shared Task on GrammaticalError Correction (Ng et al., 2014) to extract the in-correct AN combinations. The data for the sharedtask has been extracted from the NUCLE corpus, theNUS Corpus of Learner English (Dahlmeier et al.,2013). Unlike the other two datasets it represents asmaller range of L1s, and similarly to the CLC-FCEdataset the errors are not further annotated with re-spect to their subtypes.
We have preprocessed the data using the RASPparser (Briscoe et al., 2006), and used the error an-notation provided to extract the AN combinationsthat contain errors in the choice of either one or bothwords. Additionally, we have also checked that thesuggested corrections are represented by AN combi-nations. The extracted dataset contains 369 ANs.
Table 2 reports the distribution of the errors withrespect to the incorrect choice of an adjective, nounor both words within AN combinations in all threedatasets.
Word Ann. data CLC-FCE NUCLEA 63.24% 43.20% 34.15%N 30.29% 52.63% 60.16%Both 6.47% 4.17% 5.69%
Table 2: Distribution of errors in the choice of adjectives(A), nouns (N) or both words in the datasets.
4 Error Correction Algorithm
First, we implement a basic error correction algo-rithm that replicates the previous approaches to er-ror correction overviewed in §2, and investigate thefollowing aspects of the algorithm:
1. We explore different resources to retrieve alter-natives for the adjectives and nouns within in-correct ANs and report the coverage of theseresources;
2. The alternative ANs are generated by crossingthe sets of alternatives for the individual words,and ranked using a metric assessing AN fre-quency or fluency in native English. We assessthe quality of the ranking using mean recipro-cal rank (MRR) by comparing the system sug-gestions to the gold standard corrections;
3. Finally, we also show how the confusion setsextracted from the learner data can help im-prove the ranking and the quality of the sug-gested corrections.
When reporting the results, we specifically focuson two aspects of the error correction algorithm: thecoverage estimated as the proportion of gold stan-dard corrections that can be found in any of the re-sources considered, and the ability of the algorithmto rank the more appropriate corrections higher thanthe less appropriate ones measured by MRR of thegold standard corrections in the system output.
4.1 Word alternativesWe extract word alternatives using three resources:
1. We use the notion of Levenshtein distance(henceforth, Lv) (Levenshtein, 1966) to findthe words that learners might have acciden-tally confused or misspelled. These alterna-tives can cover errors annotated as form re-lated. To avoid introducing too much change
236
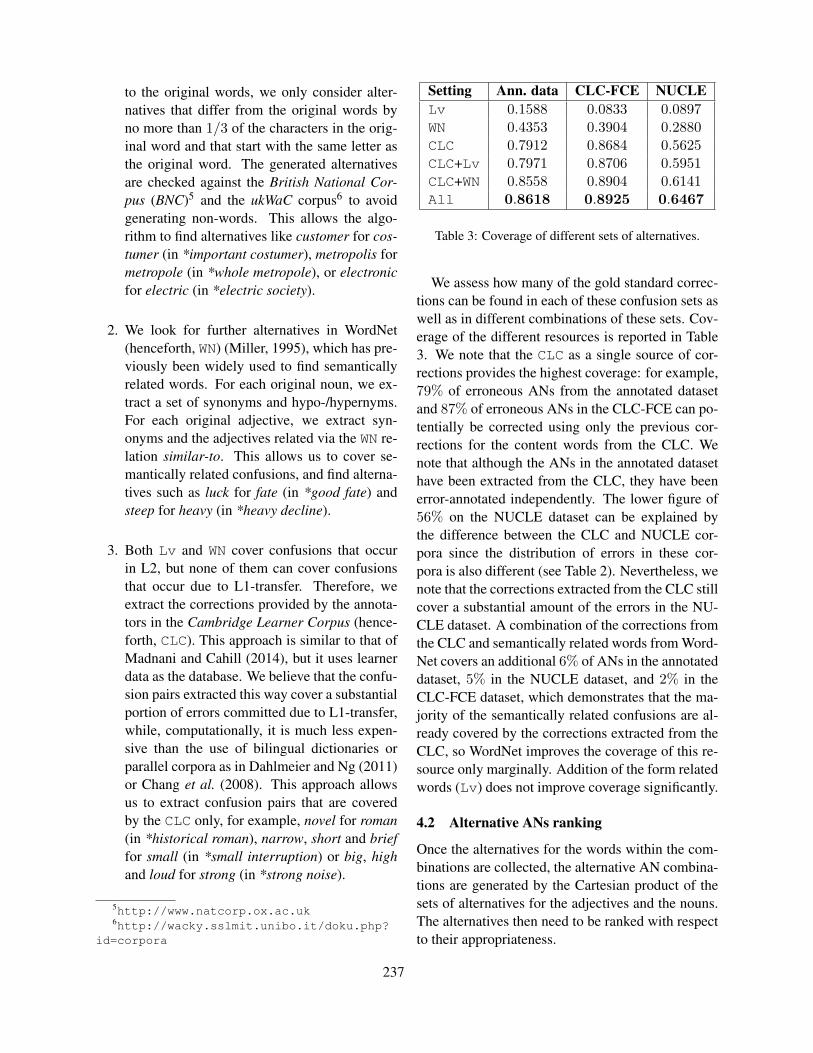
to the original words, we only consider alter-natives that differ from the original words byno more than 1/3 of the characters in the orig-inal word and that start with the same letter asthe original word. The generated alternativesare checked against the British National Cor-pus (BNC)5 and the ukWaC corpus6 to avoidgenerating non-words. This allows the algo-rithm to find alternatives like customer for cos-tumer (in *important costumer), metropolis formetropole (in *whole metropole), or electronicfor electric (in *electric society).
2. We look for further alternatives in WordNet(henceforth, WN) (Miller, 1995), which has pre-viously been widely used to find semanticallyrelated words. For each original noun, we ex-tract a set of synonyms and hypo-/hypernyms.For each original adjective, we extract syn-onyms and the adjectives related via the WN re-lation similar-to. This allows us to cover se-mantically related confusions, and find alterna-tives such as luck for fate (in *good fate) andsteep for heavy (in *heavy decline).
3. Both Lv and WN cover confusions that occurin L2, but none of them can cover confusionsthat occur due to L1-transfer. Therefore, weextract the corrections provided by the annota-tors in the Cambridge Learner Corpus (hence-forth, CLC). This approach is similar to that ofMadnani and Cahill (2014), but it uses learnerdata as the database. We believe that the confu-sion pairs extracted this way cover a substantialportion of errors committed due to L1-transfer,while, computationally, it is much less expen-sive than the use of bilingual dictionaries orparallel corpora as in Dahlmeier and Ng (2011)or Chang et al. (2008). This approach allowsus to extract confusion pairs that are coveredby the CLC only, for example, novel for roman(in *historical roman), narrow, short and brieffor small (in *small interruption) or big, highand loud for strong (in *strong noise).
5http://www.natcorp.ox.ac.uk6http://wacky.sslmit.unibo.it/doku.php?
id=corpora
Setting Ann. data CLC-FCE NUCLELv 0.1588 0.0833 0.0897WN 0.4353 0.3904 0.2880CLC 0.7912 0.8684 0.5625CLC+Lv 0.7971 0.8706 0.5951CLC+WN 0.8558 0.8904 0.6141All 0.8618 0.8925 0.6467
Table 3: Coverage of different sets of alternatives.
We assess how many of the gold standard correc-tions can be found in each of these confusion sets aswell as in different combinations of these sets. Cov-erage of the different resources is reported in Table3. We note that the CLC as a single source of cor-rections provides the highest coverage: for example,79% of erroneous ANs from the annotated datasetand 87% of erroneous ANs in the CLC-FCE can po-tentially be corrected using only the previous cor-rections for the content words from the CLC. Wenote that although the ANs in the annotated datasethave been extracted from the CLC, they have beenerror-annotated independently. The lower figure of56% on the NUCLE dataset can be explained bythe difference between the CLC and NUCLE cor-pora since the distribution of errors in these cor-pora is also different (see Table 2). Nevertheless, wenote that the corrections extracted from the CLC stillcover a substantial amount of the errors in the NU-CLE dataset. A combination of the corrections fromthe CLC and semantically related words from Word-Net covers an additional 6% of ANs in the annotateddataset, 5% in the NUCLE dataset, and 2% in theCLC-FCE dataset, which demonstrates that the ma-jority of the semantically related confusions are al-ready covered by the corrections extracted from theCLC, so WordNet improves the coverage of this re-source only marginally. Addition of the form relatedwords (Lv) does not improve coverage significantly.
4.2 Alternative ANs ranking
Once the alternatives for the words within the com-binations are collected, the alternative AN combina-tions are generated by the Cartesian product of thesets of alternatives for the adjectives and the nouns.The alternatives then need to be ranked with respectto their appropriateness.
237
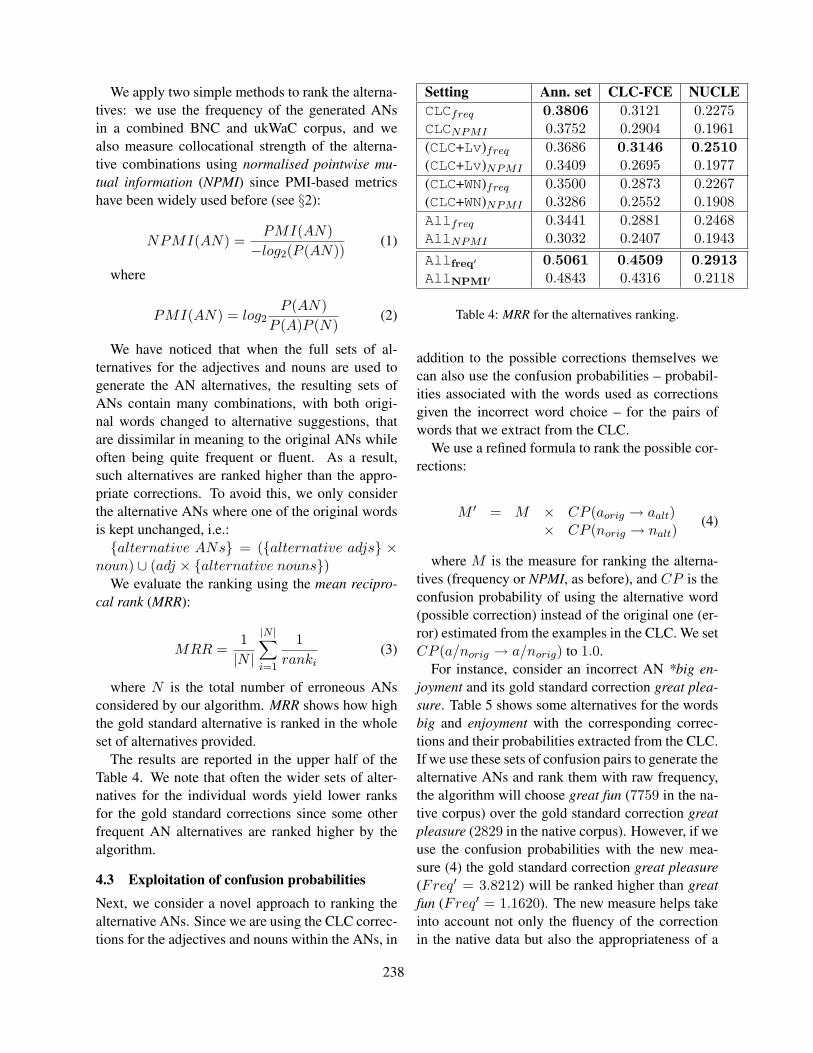
We apply two simple methods to rank the alterna-tives: we use the frequency of the generated ANsin a combined BNC and ukWaC corpus, and wealso measure collocational strength of the alterna-tive combinations using normalised pointwise mu-tual information (NPMI) since PMI-based metricshave been widely used before (see §2):
NPMI(AN) =PMI(AN)−log2(P (AN))
(1)
where
PMI(AN) = log2P (AN)
P (A)P (N)(2)
We have noticed that when the full sets of al-ternatives for the adjectives and nouns are used togenerate the AN alternatives, the resulting sets ofANs contain many combinations, with both origi-nal words changed to alternative suggestions, thatare dissimilar in meaning to the original ANs whileoften being quite frequent or fluent. As a result,such alternatives are ranked higher than the appro-priate corrections. To avoid this, we only considerthe alternative ANs where one of the original wordsis kept unchanged, i.e.:{alternative ANs} = ({alternative adjs} ×
noun) ∪ (adj × {alternative nouns})We evaluate the ranking using the mean recipro-
cal rank (MRR):
MRR =1|N |
|N |∑i=1
1ranki
(3)
where N is the total number of erroneous ANsconsidered by our algorithm. MRR shows how highthe gold standard alternative is ranked in the wholeset of alternatives provided.
The results are reported in the upper half of theTable 4. We note that often the wider sets of alter-natives for the individual words yield lower ranksfor the gold standard corrections since some otherfrequent AN alternatives are ranked higher by thealgorithm.
4.3 Exploitation of confusion probabilitiesNext, we consider a novel approach to ranking thealternative ANs. Since we are using the CLC correc-tions for the adjectives and nouns within the ANs, in
Setting Ann. set CLC-FCE NUCLECLCfreq 0.3806 0.3121 0.2275CLCNPMI 0.3752 0.2904 0.1961(CLC+Lv)freq 0.3686 0.3146 0.2510(CLC+Lv)NPMI 0.3409 0.2695 0.1977(CLC+WN)freq 0.3500 0.2873 0.2267(CLC+WN)NPMI 0.3286 0.2552 0.1908Allfreq 0.3441 0.2881 0.2468AllNPMI 0.3032 0.2407 0.1943Allfreq′ 0.5061 0.4509 0.2913AllNPMI′ 0.4843 0.4316 0.2118
Table 4: MRR for the alternatives ranking.
addition to the possible corrections themselves wecan also use the confusion probabilities – probabil-ities associated with the words used as correctionsgiven the incorrect word choice – for the pairs ofwords that we extract from the CLC.
We use a refined formula to rank the possible cor-rections:
M ′ = M × CP (aorig → aalt)× CP (norig → nalt)
(4)
where M is the measure for ranking the alterna-tives (frequency or NPMI, as before), and CP is theconfusion probability of using the alternative word(possible correction) instead of the original one (er-ror) estimated from the examples in the CLC. We setCP (a/norig → a/norig) to 1.0.
For instance, consider an incorrect AN *big en-joyment and its gold standard correction great plea-sure. Table 5 shows some alternatives for the wordsbig and enjoyment with the corresponding correc-tions and their probabilities extracted from the CLC.If we use these sets of confusion pairs to generate thealternative ANs and rank them with raw frequency,the algorithm will choose great fun (7759 in the na-tive corpus) over the gold standard correction greatpleasure (2829 in the native corpus). However, if weuse the confusion probabilities with the new mea-sure (4) the gold standard correction great pleasure(Freq′ = 3.8212) will be ranked higher than greatfun (Freq′ = 1.1620). The new measure helps takeinto account not only the fluency of the correctionin the native data but also the appropriateness of a
238
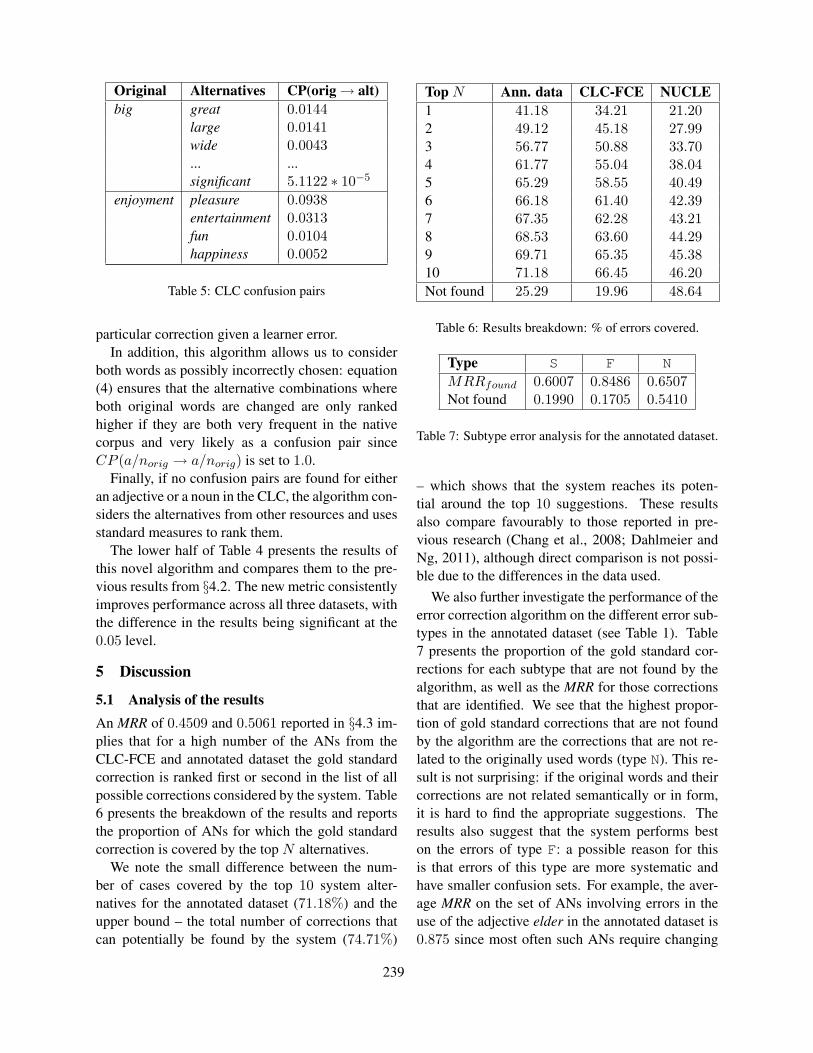
Original Alternatives CP(orig→ alt)big great 0.0144
large 0.0141wide 0.0043... ...significant 5.1122 ∗ 10−5
enjoyment pleasure 0.0938entertainment 0.0313fun 0.0104happiness 0.0052
Table 5: CLC confusion pairs
particular correction given a learner error.In addition, this algorithm allows us to consider
both words as possibly incorrectly chosen: equation(4) ensures that the alternative combinations whereboth original words are changed are only rankedhigher if they are both very frequent in the nativecorpus and very likely as a confusion pair sinceCP (a/norig → a/norig) is set to 1.0.
Finally, if no confusion pairs are found for eitheran adjective or a noun in the CLC, the algorithm con-siders the alternatives from other resources and usesstandard measures to rank them.
The lower half of Table 4 presents the results ofthis novel algorithm and compares them to the pre-vious results from §4.2. The new metric consistentlyimproves performance across all three datasets, withthe difference in the results being significant at the0.05 level.
5 Discussion
5.1 Analysis of the resultsAn MRR of 0.4509 and 0.5061 reported in §4.3 im-plies that for a high number of the ANs from theCLC-FCE and annotated dataset the gold standardcorrection is ranked first or second in the list of allpossible corrections considered by the system. Table6 presents the breakdown of the results and reportsthe proportion of ANs for which the gold standardcorrection is covered by the top N alternatives.
We note the small difference between the num-ber of cases covered by the top 10 system alter-natives for the annotated dataset (71.18%) and theupper bound – the total number of corrections thatcan potentially be found by the system (74.71%)
Top N Ann. data CLC-FCE NUCLE1 41.18 34.21 21.202 49.12 45.18 27.993 56.77 50.88 33.704 61.77 55.04 38.045 65.29 58.55 40.496 66.18 61.40 42.397 67.35 62.28 43.218 68.53 63.60 44.299 69.71 65.35 45.3810 71.18 66.45 46.20Not found 25.29 19.96 48.64
Table 6: Results breakdown: % of errors covered.
Type S F NMRRfound 0.6007 0.8486 0.6507Not found 0.1990 0.1705 0.5410
Table 7: Subtype error analysis for the annotated dataset.
– which shows that the system reaches its poten-tial around the top 10 suggestions. These resultsalso compare favourably to those reported in pre-vious research (Chang et al., 2008; Dahlmeier andNg, 2011), although direct comparison is not possi-ble due to the differences in the data used.
We also further investigate the performance of theerror correction algorithm on the different error sub-types in the annotated dataset (see Table 1). Table7 presents the proportion of the gold standard cor-rections for each subtype that are not found by thealgorithm, as well as the MRR for those correctionsthat are identified. We see that the highest propor-tion of gold standard corrections that are not foundby the algorithm are the corrections that are not re-lated to the originally used words (type N). This re-sult is not surprising: if the original words and theircorrections are not related semantically or in form,it is hard to find the appropriate suggestions. Theresults also suggest that the system performs beston the errors of type F: a possible reason for thisis that errors of this type are more systematic andhave smaller confusion sets. For example, the aver-age MRR on the set of ANs involving errors in theuse of the adjective elder in the annotated dataset is0.875 since most often such ANs require changing
239
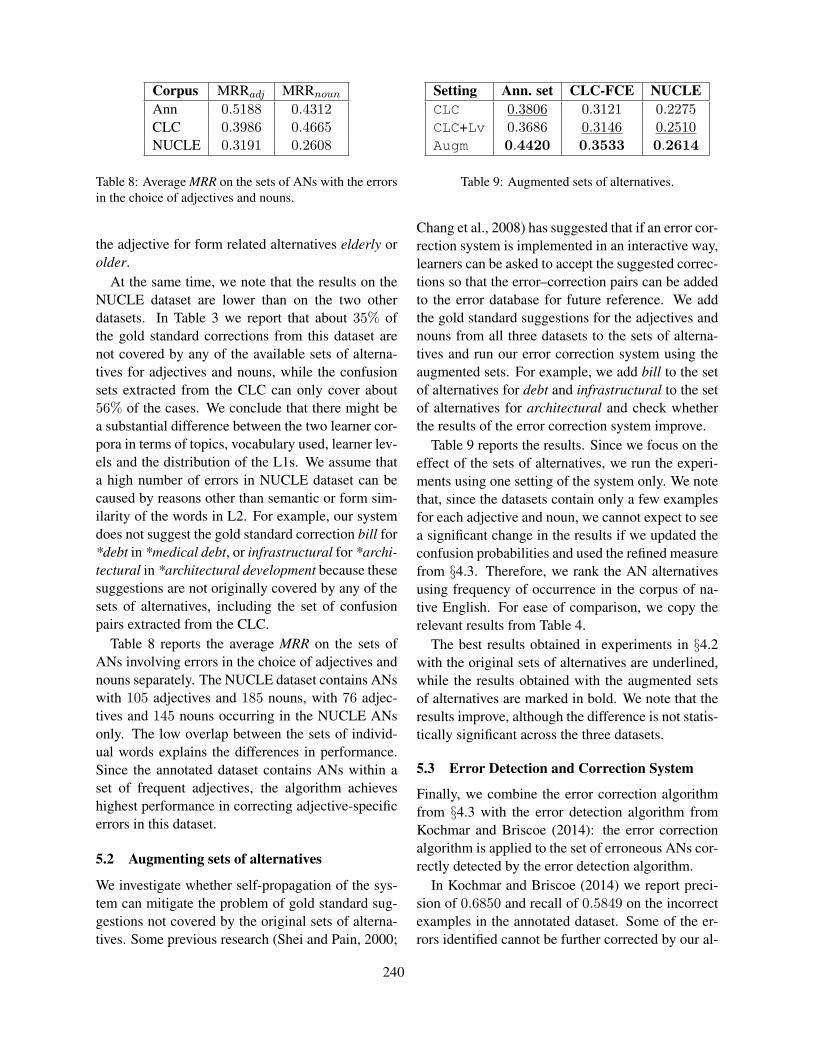
Corpus MRRadj MRRnoun
Ann 0.5188 0.4312CLC 0.3986 0.4665NUCLE 0.3191 0.2608
Table 8: Average MRR on the sets of ANs with the errorsin the choice of adjectives and nouns.
the adjective for form related alternatives elderly orolder.
At the same time, we note that the results on theNUCLE dataset are lower than on the two otherdatasets. In Table 3 we report that about 35% ofthe gold standard corrections from this dataset arenot covered by any of the available sets of alterna-tives for adjectives and nouns, while the confusionsets extracted from the CLC can only cover about56% of the cases. We conclude that there might bea substantial difference between the two learner cor-pora in terms of topics, vocabulary used, learner lev-els and the distribution of the L1s. We assume thata high number of errors in NUCLE dataset can becaused by reasons other than semantic or form sim-ilarity of the words in L2. For example, our systemdoes not suggest the gold standard correction bill for*debt in *medical debt, or infrastructural for *archi-tectural in *architectural development because thesesuggestions are not originally covered by any of thesets of alternatives, including the set of confusionpairs extracted from the CLC.
Table 8 reports the average MRR on the sets ofANs involving errors in the choice of adjectives andnouns separately. The NUCLE dataset contains ANswith 105 adjectives and 185 nouns, with 76 adjec-tives and 145 nouns occurring in the NUCLE ANsonly. The low overlap between the sets of individ-ual words explains the differences in performance.Since the annotated dataset contains ANs within aset of frequent adjectives, the algorithm achieveshighest performance in correcting adjective-specificerrors in this dataset.
5.2 Augmenting sets of alternatives
We investigate whether self-propagation of the sys-tem can mitigate the problem of gold standard sug-gestions not covered by the original sets of alterna-tives. Some previous research (Shei and Pain, 2000;
Setting Ann. set CLC-FCE NUCLECLC 0.3806 0.3121 0.2275CLC+Lv 0.3686 0.3146 0.2510Augm 0.4420 0.3533 0.2614
Table 9: Augmented sets of alternatives.
Chang et al., 2008) has suggested that if an error cor-rection system is implemented in an interactive way,learners can be asked to accept the suggested correc-tions so that the error–correction pairs can be addedto the error database for future reference. We addthe gold standard suggestions for the adjectives andnouns from all three datasets to the sets of alterna-tives and run our error correction system using theaugmented sets. For example, we add bill to the setof alternatives for debt and infrastructural to the setof alternatives for architectural and check whetherthe results of the error correction system improve.
Table 9 reports the results. Since we focus on theeffect of the sets of alternatives, we run the experi-ments using one setting of the system only. We notethat, since the datasets contain only a few examplesfor each adjective and noun, we cannot expect to seea significant change in the results if we updated theconfusion probabilities and used the refined measurefrom §4.3. Therefore, we rank the AN alternativesusing frequency of occurrence in the corpus of na-tive English. For ease of comparison, we copy therelevant results from Table 4.
The best results obtained in experiments in §4.2with the original sets of alternatives are underlined,while the results obtained with the augmented setsof alternatives are marked in bold. We note that theresults improve, although the difference is not statis-tically significant across the three datasets.
5.3 Error Detection and Correction System
Finally, we combine the error correction algorithmfrom §4.3 with the error detection algorithm fromKochmar and Briscoe (2014): the error correctionalgorithm is applied to the set of erroneous ANs cor-rectly detected by the error detection algorithm.
In Kochmar and Briscoe (2014) we report preci-sion of 0.6850 and recall of 0.5849 on the incorrectexamples in the annotated dataset. Some of the er-rors identified cannot be further corrected by our al-
240
gorithm since the corrections are longer than twowords. MRR of the error correction system ap-plied to the set of detected errors is 0.2532, whilefor 24.28% of the cases the system does not finda gold standard correction. If these cases are notconsidered, MRRfound = 0.6831. We believe thatthese results reflect state-of-the-art performance forthe combined EDC system for AN combinations.
6 Conclusion
In this paper, we have addressed error correction inadjective–noun combinations in learner writing us-ing three publicly available datasets. In particular,we have explored different ways to construct the cor-rection sets and to rank the suggested corrections,and showed that the confusion patterns extracted di-rectly from the learner data not only provide thehighest coverage for the system, but can also be usedto derive confusion probabilities and improve theoverall ranking of the suggestions. We have shownthat an error correction system can reach an MRRof 0.5061 which compares favourably to the resultsreported previously.
Further analysis shows that the majority of er-rors not covered by the algorithm involve confusionbetween words that are not related semantically orin form and, therefore, cannot be found in L2 re-sources like WordNet. Our experiments with theaugmented sets of alternatives, where we use knownlearner confusion pairs to further extend the sets ofcorrection candidates, show improvement in the re-sults and suggest that extension of the learner corpuscan help system find appropriate corrections. At thesame time, the difference in the results obtained onthe datasets extracted from the CLC and the NU-CLE corpora can be explained by the difference inthe topics, learner levels and L1s represented by thetwo learner corpora. Future research should explorefurther ways to extend the learner data.
We also note that in the current work we do notconsider the wider context for error detection andcorrection in ANs. In future work we plan to inves-tigate the use of surrounding context for EDC forANs.
Finally, we have integrated our error correctionsystem with a state-of-the-art content word error de-tection system. To the best of our knowledge, this
is the first attempt to combine two such systems,and we believe that the results obtained – an MRRof 0.2532 on the set of errors identified by the errordetection algorithm – reflect state-of-the-art perfor-mance on the EDC task for AN combinations. Ourfuture work will also extend this approach to othertypes of content word combinations.
Acknowledgments
We are grateful to Cambridge English Language As-sessment and Cambridge University Press for sup-porting this research and for granting us access tothe CLC for research purposes. We also thank theanonymous reviewers for their valuable comments.
ReferencesTed Briscoe, John Carroll, and Rebecca Watson. 2006.
The second release of the RASP system. In ACL-Coling06 Interactive Presentation Session, pp. 77–80.
Chris Brockett, William B. Dolan, and Michael Gamon.2006. Correcting ESL errors using phrasal SMT tech-niques. In Proceedings of the 21st International Con-ference on Computational Linguistics and the 44th an-nual meeting of the Association for ComputationalLinguistics, pp. 249–256.
Yu-Chia Chang, Jason S. Chang, Hao-Jan Chen, andHsien-Chin Liou. 2008. An automatic collocationwriting assistant for Taiwanese EFL learners: A caseof corpus-based NLP technology. Computer AssistedLanguage Learning, 21(3), pp. 283–299.
Martin Chodorow, Michael Gamon, and Joel Tetreault.2010. The utility of grammatical error detection sys-tems for English language learners: Feedback and As-sessment. Language Testing, 27(3):335–353.
Daniel Dahlmeier, Hwee Tou Ng, and Siew Mei Wu.2012. Building a large annotated corpus of learnerEnglish: The NUS Corpus of Learner English. In Pro-ceedings of the Eighth Workshop on Innovative Use ofNLP for Building Educational Applications, pp. 22–31.
Daniel Dahlmeier and Hwee Tou Ng. 2011. CorrectingSemantic Collocation Errors with L1-induced Para-phrases. In Proceedings of the EMNLP-2011, pp.107–117.
Robert Dale, Ilya Anisimoff, and George Narroway.2012. HOO 2012: A Report on the Preposition andDeterminer Error Correction Shared Task. In Pro-ceedings of the 7th Workshop on the Innovative Useof NLP for Building Educational Applications, pp. 54–62.
241
Yoko Futagi, Paul Deane, Martin Chodorow and JoelTetreault. 2009. A computational approach to de-tecting collocation errors in the writing of non-nativespeakers of English. Computer Assisted LanguageLearning, 21(4), pp. 353–367.
Michael Gamon, Jianfeng Gao, Chris Brockett, Alexan-der Klementiev, William Dolan, Dmitriy Be- lenko,and Lucy Vanderwende. 2008. Using contextualspeller techniques and language modeling for ESL er-ror correction. In Proceedings of IJCNLP, pp. 491–511.
Na-Rae Han, Martin Chodorow, and Claudia Leacock.2006. Detecting errors in English article usage bynon-native speakers. Journal of Natural Language En-gineering, 12(2):115–129.
Dale D. Johnson. 2000. Just the Right Word: Vocabularyand Writing. In R. Indrisano & J. Squire (Eds.), Per-spectives on Writing: Research, Theory, and Practice,pp. 162–186.
Ekaterina Kochmar and Ted Briscoe. 2014. DetectingLearner Errors in the Choice of Content Words UsingCompositional Distributional Semantics. In Proceed-ings of COLING 2014, the 25th International Confer-ence on Computational Linguistics: Technical Papers,pp. 1740–1751.
Claudia Leacock and Martin Chodorow. 2003. Auto-mated Grammatical Error Detection. In M. D. Sher-mis and J. C. Burstein (eds.), Automated Essay Scor-ing: A Cross-Disciplinary Perspective, pp. 195–207.
Claudia Leacock, Martin Chodorow, Michael Gamon andJoel Tetreault. 2014. Automated Grammatical Er-ror Detection for Language Learners, Second Edi-tion. Synthesis Lectures on Human Language Tech-nologies, Morgan & Claypool Publishers.
Vladimir I. Levenshtein. 1966. Binary codes capable ofcorrecting deletions, insertions, and reversals. SovietPhysics Doklady, 10(8):707–710.
Anne Li-E Liu. 2002. A corpus-based lexical semanticinvestigation of verb-noun miscollocations in Taiwanlearners English. Masters thesis, Tamkang University,Taipei.
Anne Li-E Liu, David Wible and Nai-Lung Tsao. 2009.Automated suggestions for miscollocations. In Pro-ceedings of the 4th Workshop on Innovative Use ofNLP for Building Educational Applications, pp. 47–50.
Nitin Madnani and Aoife Cahill. 2014. An ExplicitFeedback System for Preposition Errors based onWikipedia Revisions. In Proceedings of the NinthWorkshop on Innovative Use of NLP for Building Ed-ucational Applications, pp. 79–88.
George A. Miller. 1995. WordNet: A Lexical Databasefor English. Communications of the ACM, 38(11):39–41.
Hwee Tou Ng, Siew Mei Wu, Yuanbin Wu, Chris-tian Hadiwinoto, and Joel Tetreault. 2013. TheCoNLL- 2013 Shared Task on Grammatical Error Cor-rection. In Proceedings of the Seventeenth Conferenceon Computational Natural Language Learning: SharedTask (CoNLL-2013 Shared Task), pp. 1–12.
Hwee Tou Ng, Siew Mei Wu, Ted Briscoe, Chris-tian Hadiwinoto, Raymond Hendy Susanto, andChristopher Bryant. 2014. The CoNLL-2014 SharedTask on Grammatical Error Correction. In Proceed-ings of the Eighteenth Conference on ComputationalNatural Language Learning: Shared Task, pp. 1–14.
Diane Nicholls. 2003. The Cambridge Learner Corpus:Error coding and analysis for lexicography and ELT.In Proceedings of the Corpus Linguistics 2003 confer-ence, pp. 572–581.
Robert Ostling and Ola Knutsson. 2009. A corpus-basedtool for helping writers with Swedish collocations. InProceedings of the Workshop on Extracting and UsingConstructions in NLP, pp. 28–33.
Alla Rozovskaya and Dan Roth. 2011. Algorithm Selec-tion and Model Adaptation for ESL Correction Tasks.In Proceedings of the 49th Annual Meeting of the As-sociation for Computational Linguistics: Human Lan-guage Technologies - Volume 1, pp. 924–933.
Alla Rozovskaya, Kai-Wei Chang, Mark Sammons, DanRoth, and Nizar Habash. 2014. Correcting Grammat-ical Verb Errors. In Proceedings of the 14th Confer-ence of the European Chapter of the Association forComputational Linguistics, pp. 358–367.
Terry Santos. 1988. Professors’ reaction to the academicwriting of nonnative speaking students. TESOL Quar-terly, 22(1):69–90.
Yu Sawai, Mamoru Komachi, and Yuji Matsumoto.2013. A Learner Corpus-based Approach to Verb Sug-gestion for ESL. In Proceedings of the 51st AnnualMeeting of the Association for Computational Lin-guistics, pp. 708–713.
Chi-Chiang Shei and Helen Pain. 2000. An ESL Writer’sCollocation Aid. Computer Assisted Language Learn-ing, 13(2), pp. 167–182.
David Wible, Chin-Hwa Kuo, Nai-Lung Tsao, Anne Liuand H.-L. Lin. 2003. Bootstrapping in a language-learning environment. Journal of Computer AssistedLearning, 19(4), pp. 90–102.
Helen Yannakoudakis, Ted Briscoe, and Ben Medlock.2011. A New Dataset and Method for AutomaticallyGrading ESOL Texts. In Proceedings of the 49th An-nual Meeting of the Association for ComputationalLinguistics: Human Language Technologies, pp. 180–189.
242

Proceedings of the Tenth Workshop on Innovative Use of NLP for Building Educational Applications, 2015, pages 243–253,Denver, Colorado, June 4, 2015. c©2015 Association for Computational Linguistics
Using NLP to Support Scalable Assessment of Short Free Text Responses
Alistair WillisDepartment of Computing and Communications
The Open UniversityMilton Keynes, UK
Abstract
Marking student responses to short answerquestions raises particular issues for humanmarkers, as well as for automatic marking sys-tems. In this paper we present the Amati sys-tem, which aims to help human markers im-prove the speed and accuracy of their marking.Amati supports an educator in incrementallydeveloping a set of automatic marking rules,which can then be applied to larger questionsets or used for automatic marking. We showthat using this system allows markers to de-velop mark schemes which closely match thejudgements of a human expert, with the ben-efits of consistency, scalability and traceabil-ity afforded by an automated marking system.We also consider some difficult cases for auto-matic marking, and look at some of the com-putational and linguistic properties of thesecases.
1 Introduction
In developing systems for automatic marking,Mitchell et al. (2002) observed that assessmentbased on short answer, free text input from stu-dents demands very different skills from assessmentbased upon multiple-choice questions. Free textquestions require a student to present the appropri-ate information in their own words, and without thecues sometimes provided by multiple choice ques-tions (described respectively as improved verbalisa-tion and recall (Gay, 1980)). Work by Jordan andMitchell (2009) has demonstrated that automatic,online marking of student responses is both feasible(in that marking rules can be developed which mark
at least as accurately as a human marker), and help-ful to students, who find the online questions a valu-able and enjoyable part of the assessment process.Such automatic marking is also an increasingly im-portant part of assessment in Massive Open OnlineCourses (MOOCs) (Balfour, 2013; Kay et al., 2013).
However, the process of creating marking rulesis known to be difficult and time consum-ing (Sukkarieh and Pulman, 2005; Perez-Marın etal., 2009). The rules should usually be hand-craftedby a tutor who is a domain expert, as small differ-ences in the way an answer is expressed can be sig-nificant in determining whether responses are cor-rect or incorrect. Curating sets of answers to buildmark schemes can prove to be a highly labour-intensive process. Given this requirement, and thecurrent lack of availability of training data, a valu-able progression from existing work in automatic as-sessment may be to investigate whether NLP tech-niques can be used to support the manual creation ofsuch marking rules.
In this paper, we present the Amati system, whichsupports educators in creating mark schemes for au-tomatic assessment of short answer questions. Am-ati uses information extraction-style templates to en-able a human marker to rapidly develop automaticmarking rules, and inductive logic programming topropose new rules to the marker. Having been devel-oped, the rules can be used either for marking furtherunseen student responses, or for online assessment.
Automatic marking also brings with it further ad-vantages. Because rules are applied automatically,it improves the consistency of marking; Williamsonet al. (2012) have noted the potential of automated
243

marking to improve the reliability of test scores. Inaddition, because Amati uses symbolic/logical rulesrather than stochastic rules, it improves the trace-ability of the marks (that is, the marker can give anexplanation of why a mark was awarded, or not), andincreases the maintainability of the mark scheme,because the educator can modify the rules in thecontext of better understanding of student responses.The explanatory nature of symbolic mark schemesalso support issues of auditing marks awarded in as-sessment. Bodies such as the UK’s Quality Assur-ance Agency1 require that assessment be fully openfor the purposes of external examination. Tech-niques which can show exactly why a particularmark was awarded (or not) for a given response fitwell with existing quality assurance requirements.
All experiments in this paper were carried out us-ing student responses collected from a first year in-troductory science module.
2 Mark Scheme Authoring
Burrows et al. (2015) have identified several differ-ent eras of automatic marking of free text responses.One era they have identified has treated automaticmarking as essentially a form of information extrac-tion. The many different ways that a student cancorrectly answer a question can make it difficult toaward correct marks2. For example:
A snowflake falls vertically with a con-stant speed. What can you say about theforces acting on the snowflake?
Three student responses to this question were:
(1) there is no net force
(2) gravitational force is in equilibrium with air re-sistance
(3) no force balanced with gravity
The question author considered both responses(1) and (2) correct. However, they share no com-mon words (except force which already appears in
1http://www.qaa.ac.uk2Compared with multiple choice questions, which are easy
to mark, although constructing suitable questions in the firstplace is far from straightforward (Mitkov et al., 2006).
the question, and is). And while balance and equi-librium have closely related meanings, response (3)was not considered a correct answer to the ques-tion3. These examples suggest that bag of wordstechniques are unlikely to be adequate for the task ofshort answer assessment. Without considering wordorder, it would be very hard to write a mark schemethat gave the correct mark to responses (1)-(3), par-ticularly when these occur in the context of severalhundred other responses, all using similar terms.
In fact, techniques such as Latent Semantic Anal-ysis (LSA) have been shown to be accurate in grad-ing longer essays (Landauer et al., 2003), but thissuccess does not appear to transfer to short answerquestions. Haley’s (2008) work suggests that LSAperforms poorly when applied to short answers, withThomas et al. (2004) demonstrating that LSA-basedmarking systems for short answers did not givean acceptable correlation with an equivalent humanmarker, although they do highlight the small size oftheir available dataset.
Sukkarieh and Pulman (Sukkarieh and Pulman,2005) and Mitchell et al. (2002) have demonstratedthat hand-crafted rules containing more syntacticstructure can be valuable for automatic assessment,but both papers note the manual effort required todevelop the set of rules in the first place. To ad-dress this, we have started to investigate techniquesto develop systems which can support a subject spe-cialist (rather than a computing specialist) in devel-oping a set of marking rules for a given collection ofstudent responses. In addition, because it has beendemonstrated (Butcher and Jordan, 2010) that mark-ing rules based on regular expressions can mark ac-curately, we have also investigated the use of a sym-bolic learning algorithm to propose further markingrules to the author.
Enabling such markers to develop computationalmarking rules should yield the subsequent benefitsof speed and consistency noted by Williamson et al.,and the potential for embedding in an online systemsto provide immediate marks for student submissions(Jordan and Mitchell, 2009). This proposal fits withthe observation of Burrows et al. (2015), who sug-gest that rule based systems are desirable for “re-
3As with all examples in this paper, the “correctness” of an-swers was judged with reference to the students’ level of studyand provided teaching materials.
244
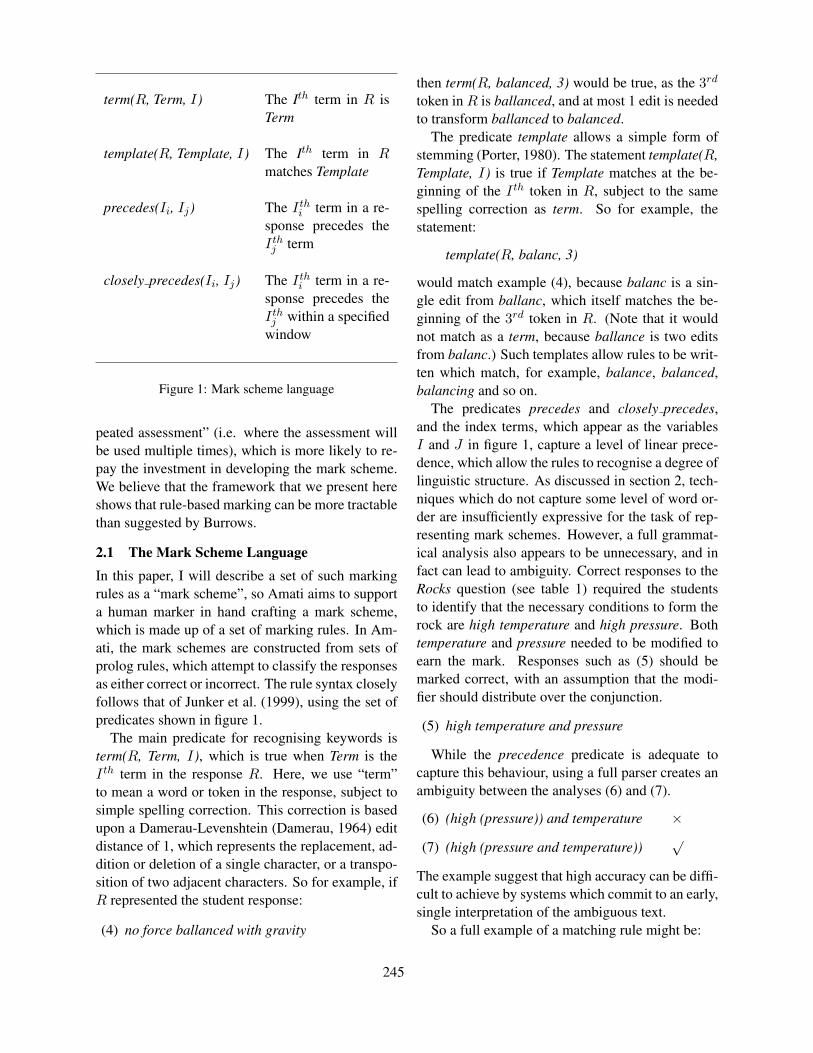
term(R, Term, I) The Ith term in R isTerm
template(R, Template, I) The Ith term in Rmatches Template
precedes(Ii, Ij) The Ithi term in a re-
sponse precedes theIthj term
closely precedes(Ii, Ij) The Ithi term in a re-
sponse precedes theIthj within a specified
window
Figure 1: Mark scheme language
peated assessment” (i.e. where the assessment willbe used multiple times), which is more likely to re-pay the investment in developing the mark scheme.We believe that the framework that we present hereshows that rule-based marking can be more tractablethan suggested by Burrows.
2.1 The Mark Scheme LanguageIn this paper, I will describe a set of such markingrules as a “mark scheme”, so Amati aims to supporta human marker in hand crafting a mark scheme,which is made up of a set of marking rules. In Am-ati, the mark schemes are constructed from sets ofprolog rules, which attempt to classify the responsesas either correct or incorrect. The rule syntax closelyfollows that of Junker et al. (1999), using the set ofpredicates shown in figure 1.
The main predicate for recognising keywords isterm(R, Term, I), which is true when Term is theIth term in the response R. Here, we use “term”to mean a word or token in the response, subject tosimple spelling correction. This correction is basedupon a Damerau-Levenshtein (Damerau, 1964) editdistance of 1, which represents the replacement, ad-dition or deletion of a single character, or a transpo-sition of two adjacent characters. So for example, ifR represented the student response:
(4) no force ballanced with gravity
then term(R, balanced, 3) would be true, as the 3rd
token in R is ballanced, and at most 1 edit is neededto transform ballanced to balanced.
The predicate template allows a simple form ofstemming (Porter, 1980). The statement template(R,Template, I) is true if Template matches at the be-ginning of the Ith token in R, subject to the samespelling correction as term. So for example, thestatement:
template(R, balanc, 3)
would match example (4), because balanc is a sin-gle edit from ballanc, which itself matches the be-ginning of the 3rd token in R. (Note that it wouldnot match as a term, because ballance is two editsfrom balanc.) Such templates allow rules to be writ-ten which match, for example, balance, balanced,balancing and so on.
The predicates precedes and closely precedes,and the index terms, which appear as the variablesI and J in figure 1, capture a level of linear prece-dence, which allow the rules to recognise a degree oflinguistic structure. As discussed in section 2, tech-niques which do not capture some level of word or-der are insufficiently expressive for the task of rep-resenting mark schemes. However, a full grammat-ical analysis also appears to be unnecessary, and infact can lead to ambiguity. Correct responses to theRocks question (see table 1) required the studentsto identify that the necessary conditions to form therock are high temperature and high pressure. Bothtemperature and pressure needed to be modified toearn the mark. Responses such as (5) should bemarked correct, with an assumption that the modi-fier should distribute over the conjunction.
(5) high temperature and pressure
While the precedence predicate is adequate tocapture this behaviour, using a full parser creates anambiguity between the analyses (6) and (7).
(6) (high (pressure)) and temperature ×(7) (high (pressure and temperature))
√
The example suggest that high accuracy can be diffi-cult to achieve by systems which commit to an early,single interpretation of the ambiguous text.
So a full example of a matching rule might be:
245
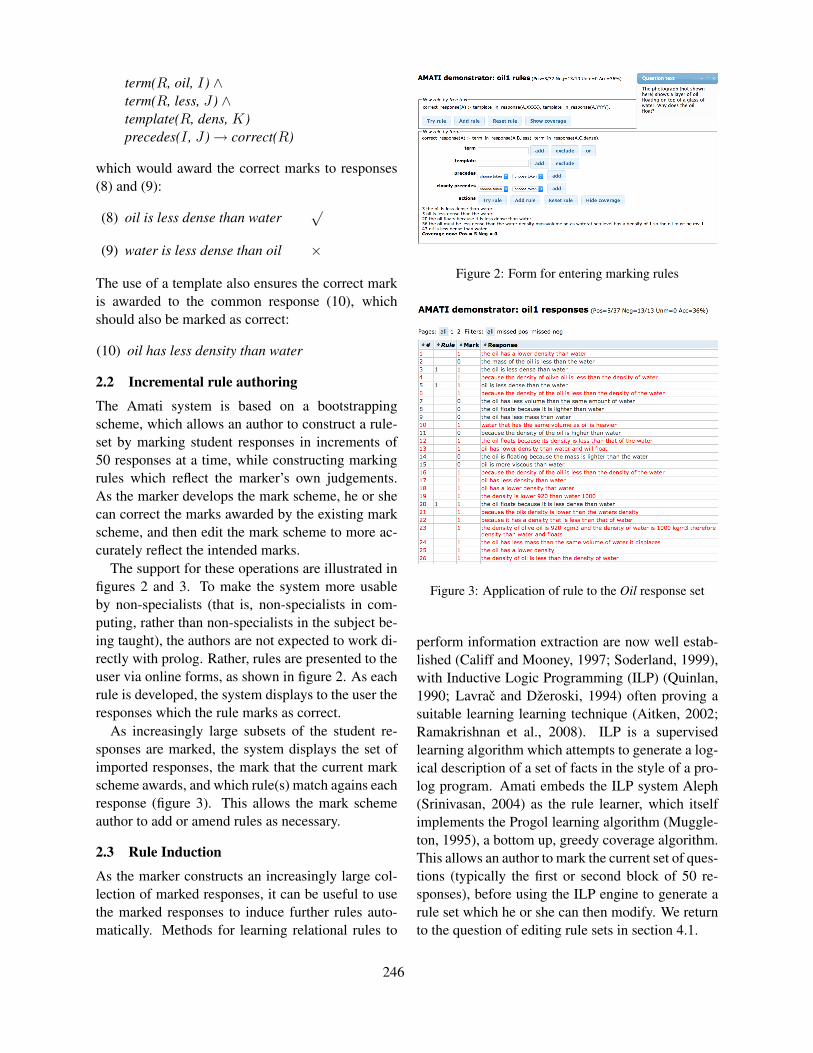
term(R, oil, I) ∧term(R, less, J) ∧template(R, dens, K)precedes(I , J)→ correct(R)
which would award the correct marks to responses(8) and (9):
(8) oil is less dense than water√
(9) water is less dense than oil ×
The use of a template also ensures the correct markis awarded to the common response (10), whichshould also be marked as correct:
(10) oil has less density than water
2.2 Incremental rule authoring
The Amati system is based on a bootstrappingscheme, which allows an author to construct a rule-set by marking student responses in increments of50 responses at a time, while constructing markingrules which reflect the marker’s own judgements.As the marker develops the mark scheme, he or shecan correct the marks awarded by the existing markscheme, and then edit the mark scheme to more ac-curately reflect the intended marks.
The support for these operations are illustrated infigures 2 and 3. To make the system more usableby non-specialists (that is, non-specialists in com-puting, rather than non-specialists in the subject be-ing taught), the authors are not expected to work di-rectly with prolog. Rather, rules are presented to theuser via online forms, as shown in figure 2. As eachrule is developed, the system displays to the user theresponses which the rule marks as correct.
As increasingly large subsets of the student re-sponses are marked, the system displays the set ofimported responses, the mark that the current markscheme awards, and which rule(s) match agains eachresponse (figure 3). This allows the mark schemeauthor to add or amend rules as necessary.
2.3 Rule Induction
As the marker constructs an increasingly large col-lection of marked responses, it can be useful to usethe marked responses to induce further rules auto-matically. Methods for learning relational rules to
Figure 2: Form for entering marking rules
Figure 3: Application of rule to the Oil response set
perform information extraction are now well estab-lished (Califf and Mooney, 1997; Soderland, 1999),with Inductive Logic Programming (ILP) (Quinlan,1990; Lavrac and Dzeroski, 1994) often proving asuitable learning learning technique (Aitken, 2002;Ramakrishnan et al., 2008). ILP is a supervisedlearning algorithm which attempts to generate a log-ical description of a set of facts in the style of a pro-log program. Amati embeds the ILP system Aleph(Srinivasan, 2004) as the rule learner, which itselfimplements the Progol learning algorithm (Muggle-ton, 1995), a bottom up, greedy coverage algorithm.This allows an author to mark the current set of ques-tions (typically the first or second block of 50 re-sponses), before using the ILP engine to generate arule set which he or she can then modify. We returnto the question of editing rule sets in section 4.1.
246
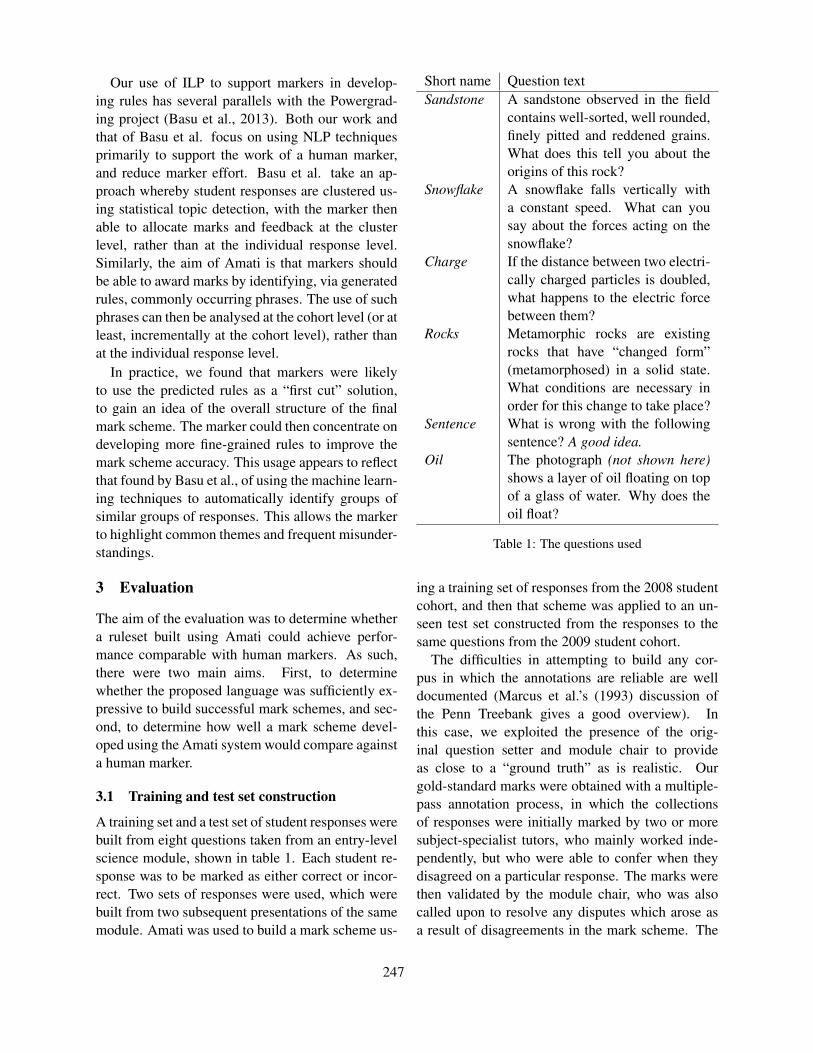
Our use of ILP to support markers in develop-ing rules has several parallels with the Powergrad-ing project (Basu et al., 2013). Both our work andthat of Basu et al. focus on using NLP techniquesprimarily to support the work of a human marker,and reduce marker effort. Basu et al. take an ap-proach whereby student responses are clustered us-ing statistical topic detection, with the marker thenable to allocate marks and feedback at the clusterlevel, rather than at the individual response level.Similarly, the aim of Amati is that markers shouldbe able to award marks by identifying, via generatedrules, commonly occurring phrases. The use of suchphrases can then be analysed at the cohort level (or atleast, incrementally at the cohort level), rather thanat the individual response level.
In practice, we found that markers were likelyto use the predicted rules as a “first cut” solution,to gain an idea of the overall structure of the finalmark scheme. The marker could then concentrate ondeveloping more fine-grained rules to improve themark scheme accuracy. This usage appears to reflectthat found by Basu et al., of using the machine learn-ing techniques to automatically identify groups ofsimilar groups of responses. This allows the markerto highlight common themes and frequent misunder-standings.
3 Evaluation
The aim of the evaluation was to determine whethera ruleset built using Amati could achieve perfor-mance comparable with human markers. As such,there were two main aims. First, to determinewhether the proposed language was sufficiently ex-pressive to build successful mark schemes, and sec-ond, to determine how well a mark scheme devel-oped using the Amati system would compare againsta human marker.
3.1 Training and test set construction
A training set and a test set of student responses werebuilt from eight questions taken from an entry-levelscience module, shown in table 1. Each student re-sponse was to be marked as either correct or incor-rect. Two sets of responses were used, which werebuilt from two subsequent presentations of the samemodule. Amati was used to build a mark scheme us-
Short name Question textSandstone A sandstone observed in the field
contains well-sorted, well rounded,finely pitted and reddened grains.What does this tell you about theorigins of this rock?
Snowflake A snowflake falls vertically witha constant speed. What can yousay about the forces acting on thesnowflake?
Charge If the distance between two electri-cally charged particles is doubled,what happens to the electric forcebetween them?
Rocks Metamorphic rocks are existingrocks that have “changed form”(metamorphosed) in a solid state.What conditions are necessary inorder for this change to take place?
Sentence What is wrong with the followingsentence? A good idea.
Oil The photograph (not shown here)shows a layer of oil floating on topof a glass of water. Why does theoil float?
Table 1: The questions used
ing a training set of responses from the 2008 studentcohort, and then that scheme was applied to an un-seen test set constructed from the responses to thesame questions from the 2009 student cohort.
The difficulties in attempting to build any cor-pus in which the annotations are reliable are welldocumented (Marcus et al.’s (1993) discussion ofthe Penn Treebank gives a good overview). Inthis case, we exploited the presence of the orig-inal question setter and module chair to provideas close to a “ground truth” as is realistic. Ourgold-standard marks were obtained with a multiple-pass annotation process, in which the collectionsof responses were initially marked by two or moresubject-specialist tutors, who mainly worked inde-pendently, but who were able to confer when theydisagreed on a particular response. The marks werethen validated by the module chair, who was alsocalled upon to resolve any disputes which arose asa result of disagreements in the mark scheme. The
247
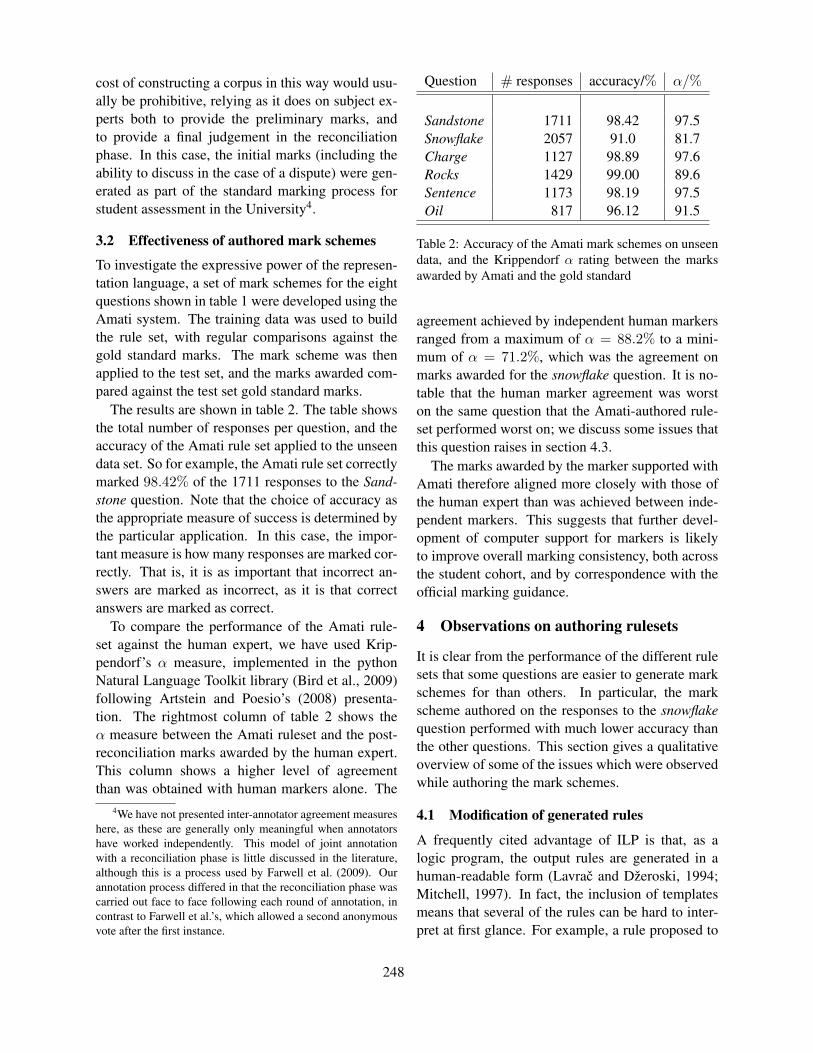
cost of constructing a corpus in this way would usu-ally be prohibitive, relying as it does on subject ex-perts both to provide the preliminary marks, andto provide a final judgement in the reconciliationphase. In this case, the initial marks (including theability to discuss in the case of a dispute) were gen-erated as part of the standard marking process forstudent assessment in the University4.
3.2 Effectiveness of authored mark schemes
To investigate the expressive power of the represen-tation language, a set of mark schemes for the eightquestions shown in table 1 were developed using theAmati system. The training data was used to buildthe rule set, with regular comparisons against thegold standard marks. The mark scheme was thenapplied to the test set, and the marks awarded com-pared against the test set gold standard marks.
The results are shown in table 2. The table showsthe total number of responses per question, and theaccuracy of the Amati rule set applied to the unseendata set. So for example, the Amati rule set correctlymarked 98.42% of the 1711 responses to the Sand-stone question. Note that the choice of accuracy asthe appropriate measure of success is determined bythe particular application. In this case, the impor-tant measure is how many responses are marked cor-rectly. That is, it is as important that incorrect an-swers are marked as incorrect, as it is that correctanswers are marked as correct.
To compare the performance of the Amati rule-set against the human expert, we have used Krip-pendorf’s α measure, implemented in the pythonNatural Language Toolkit library (Bird et al., 2009)following Artstein and Poesio’s (2008) presenta-tion. The rightmost column of table 2 shows theα measure between the Amati ruleset and the post-reconciliation marks awarded by the human expert.This column shows a higher level of agreementthan was obtained with human markers alone. The
4We have not presented inter-annotator agreement measureshere, as these are generally only meaningful when annotatorshave worked independently. This model of joint annotationwith a reconciliation phase is little discussed in the literature,although this is a process used by Farwell et al. (2009). Ourannotation process differed in that the reconciliation phase wascarried out face to face following each round of annotation, incontrast to Farwell et al.’s, which allowed a second anonymousvote after the first instance.
Question # responses accuracy/% α/%
Sandstone 1711 98.42 97.5Snowflake 2057 91.0 81.7Charge 1127 98.89 97.6Rocks 1429 99.00 89.6Sentence 1173 98.19 97.5Oil 817 96.12 91.5
Table 2: Accuracy of the Amati mark schemes on unseendata, and the Krippendorf α rating between the marksawarded by Amati and the gold standard
agreement achieved by independent human markersranged from a maximum of α = 88.2% to a mini-mum of α = 71.2%, which was the agreement onmarks awarded for the snowflake question. It is no-table that the human marker agreement was worston the same question that the Amati-authored rule-set performed worst on; we discuss some issues thatthis question raises in section 4.3.
The marks awarded by the marker supported withAmati therefore aligned more closely with those ofthe human expert than was achieved between inde-pendent markers. This suggests that further devel-opment of computer support for markers is likelyto improve overall marking consistency, both acrossthe student cohort, and by correspondence with theofficial marking guidance.
4 Observations on authoring rulesets
It is clear from the performance of the different rulesets that some questions are easier to generate markschemes for than others. In particular, the markscheme authored on the responses to the snowflakequestion performed with much lower accuracy thanthe other questions. This section gives a qualitativeoverview of some of the issues which were observedwhile authoring the mark schemes.
4.1 Modification of generated rules
A frequently cited advantage of ILP is that, as alogic program, the output rules are generated in ahuman-readable form (Lavrac and Dzeroski, 1994;Mitchell, 1997). In fact, the inclusion of templatesmeans that several of the rules can be hard to inter-pret at first glance. For example, a rule proposed to
248
mark the Rocks question was:
template(R, bur,I) ∧template(R, hea,J)→ correct(R)
As the official marking guidance suggests that Hightemperature and pressure is an acceptable response,hea can easily be interpreted as heat. However, it isnot immediately clear what bur represents. In fact,a domain expert would probably recognise this as ashortened form of buried (as the high pressure, thesecond required part of the solution, can result fromburial in rock). As the training set does not containterms with the same first characters as burial, such asburnished, Burghundy or burlesque, then this termmatches. However, a mark scheme author might pre-fer to edit the rule slightly into something more read-able and so maintainable:
template(R, buri,I) ∧term(R, heat,J)→ correct(R)
so that either buried or burial would be matched, andto make the recognition of heat more explicit.
A more complex instance of the same phe-nomenon is illustrated by the generated rule:
term(R, high,I) ∧term(R, temperature,J)→ correct(R)
Although the requirement for the terms high andtemperature is clear enough, there is no part of thisrule that requires that the student also mention highpressure. This has come about because all the stu-dent responses that mention high temperature alsoexplicitly mention pressure. Because Progol andAleph use a greedy coverage algorithm, in this caseAmati did not need to add an additional rule to cap-ture . Again, the mark scheme author would proba-bly wish to edit this rule to give:
term(R, high,I) ∧term(R, temperature,J) ∧term(R, pressure,K) ∧precedes(I ,J)→ correct(R)
which covers the need for high to precede temper-ature, and also contain a reference to pressure. Asimilar case, raised by the same question, is the fol-lowing proposed rule:
term(R, high,I) ∧term(R, pressure,J) ∧term(R, and,K) ∧precedes(I ,K)→ correct(R)
which requires a conjunction, but makes no mentionof temperature (or heat or some other equivalent).In this case, the responses (11) and (12):
(11) (high (pressure and temperature))√
(12) (high (pressure and heat))√
are both correct, and both appeared amongst the stu-dent responses. However, there were no incorrectresponses following a similar syntactic pattern, suchas, for example, (13) or (14):
(13) high pressure and altitude ×
(14) high pressure and bananas ×
Students who recognised that high pressure andsomething else were required, always got the some-thing else right. Therefore, the single rule above hadgreater coverage than rules that looked individuallyfor high pressure and temperature or high pressureand heat.
This example again illustrates the Amati philoso-phy that the technology is best used to support hu-man markers. By hand-editing the proposed solu-tions, the marker ensures that the rules are more in-tuitive, and so can be more robust, and more main-tainable in the longer term. In this case, an authormight reasonably rewrite the single rule into two:
term(R, high,I) ∧term(R, pressure,J) ∧term(R, temperature,K) ∧precedes(I ,K)→ correct(R)
term(R, high,I) ∧term(R, pressure,J) ∧term(R, heat,K) ∧precedes(I ,K)→ correct(R)
removing the unnecessary conjunction, and provid-ing explicit rules for heat and temperature.
249
4.2 Spelling correctionIt is questionable whether spelling correction is al-ways appropriate. A question used to assess knowl-edge of organic chemistry might require the termbutane to appear in the solution. It would not beappropriate to mark a response containing the to-ken butene (a different compound) as correct, eventhough butene would be an allowable misspelling ofbutane according to the given rules. On the otherhand, a human marker would probably be inclined tomark responses containing buttane or butan as cor-rect. These are also legitimate misspellings accord-ing the table, but are less likely to be misspellings ofbutene.
The particular templates generated reflect the lin-guistic variation in the specific datasets. A templatesuch as temp, intended to cover responses contain-ing temperature (for example), would also poten-tially cover temporary, tempestuous, temperamen-tal and so on. In fact, when applied to large setsof homogenous response-types (such as multiple re-sponses to a single question), the vocabulary usedacross the complete set of responses turns out tobe sufficiently restricted for meaningful templates tobe generated. It does not follow that this hypoth-esis language would continue to be appropriate fordatasets with a wider variation in vocabulary.
4.3 Diversity of correct responsesAs illustrated in table 2, the Snowflake question wasvery tricky to handle, with lower accuracy than theother questions, and lower agreement with the goldstandard. The following are some of the student re-sponses:
(15) they are balanced
(16) the force of gravity is in balance with air resis-tance
(17) friction is balancing the force of gravity
(18) only the force of gravity is acting on the hail-stone and all forces are balanced
The module chair considered responses (15), (16)and (17) to be correct, and response (18) to be incor-rect.
The most straightforward form of the answer isalong the lines of response (15). In this case, thereare no particular forces mentioned; only a generalcomment about the forces in question. Similar caseswere there are no net forces, all forces balance, theforces are in equilibrium and so on.
However, responses (16) and (17) illustrate thatin many cases, the student will present particularexamples to attempt to answer the question. Inthese cases, both responses identify gravity as oneof the acting forces, but describe the counteractingforce differently (as air resistance and friction re-spectively). A major difficulty in marking this typeof question is predicting the (correct) examples thatstudents will use in their responses, as each correctpair needs to be incorporated in the mark schemes.A response suggesting that air resistance counter-acts drag would be marked incorrect. As stated pre-viously, developing robust mark schemes requiresthat mark scheme authors use large sets of previousstudent responses, which can provide guidance onthe range of possible responses.
Finally, response (18) illustrates a difficult re-sponse to mark (for both pattern matchers and lin-guistic solutions). The response consists of two con-joined clauses, the second of which, all forces arebalanced, is in itself a correct answer. It is onlyin the context of the first clause that the response ismarked incorrect, containing the error that it is onlythe force of gravity which acts.
This question highlights that the ease with whicha question can be marked automatically can dependas much on the question being asked as the answersreceived. Of course, this also applies to questionsintended to be marked by a human; some questionslead to easier responses to grade. So a good eval-uation of a marking system needs to consider thequestions (and the range of responses provided byreal students) being asked; the performance of thesystem is meaningful only in the context of the na-ture of the questions being assessed, and an under-standing of the diversity of correct responses. In thiscase, it appears that questions which can be correctlyanswered by using a variety of different examplesshould be avoided. We anticipate that with increas-ing maturity of the use of automatic marking sys-tems, examiners would develop skills in setting ap-propriate questions for the marking system, just as
250
experienced authors develop skills in setting ques-tions which are appropriate for human markers.
4.4 Anaphora Ambiguity
The examples raise some interesting questions abouthow anaphora resolution should be dealt with. Tworesponses to the oil question are:
(19) The oil floats on the water because it is lighter
(20) The oil floats on the water because it is heavier
These two responses appear to have contradictorymeanings, but in fact are both marked as correct.This initially surprising result arises from the am-biguity in the possible resolutions of the pronoun it:
(21) [The oil]i floats on the water because iti islighter.
(22) The oil floats on [the water]j because itj isheavier.
When marking these responses, the human mark-ers followed a general policy of giving the benefit ofthe doubt, and, within reasonable limits, will mark aresponse as correct if any of the possible interpreta-tions would be correct relative to the mark scheme.
As with the ambiguous modifier attachment seenin responses (6) and (7), this example illustrates thatusing a different (possibly better) parser is unlikelyto improve the overall system performance. Re-sponses such (21) and (22) are hard for many parsersto handle, because an early commitment to a singleinterpretation can assume that it must refer to theoil or the water. Again, this example demonstratesthat a more sophisticated approach to syntactic am-biguity is necessary if a parsing-based system is tobe used. (One possible approach might be to use un-derspecification techniques (Konig and Reyle, 1999;van Deemter and Peters, 1996) and attempt to reasonwith the ambiguous forms.)
5 Discussion and Conclusions
We have presented a system which uses informa-tion extraction techniques and machine learning tosupport human markers in the task of marking freetext responses to short answer questions. The results
suggest that a system such as Amati can help mark-ers create accurate, reusable mark schemes.
The user interface to Amati was developed in col-laboration with experienced markers from the OpenUniversity’s Computing department and Science de-partment, who both gave input into the requirementsfor an effective marking system. We intend to carryout more systematic analyses of the value of us-ing such systems for marking, but informally, wehave found that a set of around 500-600 responseswas enough for an experienced marker to feel satis-fied with the performance of her own authored markscheme, and to be prepared to use it on further un-seen cases. (This number was for the Snowflakequestion, which contained approximately half cor-rect responses. For the other questions, the markertypically required fewer responses.)
The work described in this paper contrasts withthe approach commonly taken in automatic mark-ing, of developing mechanisms which assign marksby comparing student responses to one or more tar-get responses created by the subject specialist (Ziaiet al., 2012). Such systems have proven effectivewhere suitable linguistic information is compared,such as the predicate argument structure used by c-rater (Leacock and Chodorow, 2003), or similaritybetween dependency relationships, as used by Au-toMark (now FreeText (Mitchell et al., 2002)) andMohler et al. (2011). Our own experiments withFreeText found that incorrect marks were often a re-sult of an inappropriate parse by the embedded Stan-ford parser (Klein and Manning, 2003)), as illus-trated by the parses (6) and (7). In practice, we havefound that for the short answers we have been con-sidering, pattern based rules tend to be more robustin the face of such ambiguity than a full parser.
A question over this work is how to extend thetechnique to more linguistically complex responses.The questions used here are all for a single mark,all or nothing. A current direction of our researchis looking at how to provide support for more com-plicated questions which would require the studentto mention two or more separate pieces of infor-mation, or to reason about causal relationships. Afurther area of interest is how the symbolic analysisof the students’ responses can be used to generatemeaningful feedback to support them as part of theirlearning process.
251
Acknowledgments
The author would like to thank Sally Jordan for herhelp in collecting the students’ data, for answeringquestions about marking as they arose and for mak-ing the data available for use in this work. Also,David King who developed the Amati system, andRita Tingle who provided feedback on the usabil-ity of the system from a marker’s perspective. Wewould also like to thank the anonymous reviewersfor their valuable suggestions on an earlier draft ofthe paper.
ReferencesJames Stuart Aitken. 2002. Learning information extrac-
tion rules: An inductive logic programming approach.In ECAI, pages 355–359.
Ron Artstein and Massimo Poesio. 2008. Inter-coderagreement for computational linguistics. Computa-tional Linguistics, 34(4):555–596.
Stephen P Balfour. 2013. Assessing writing in MOOCs:Automated essay scoring and calibrated peer review.Research & Practice in Assessment, 8(1):40–48.
Sumit Basu, Chuck Jacobs, and Lucy Vanderwende.2013. Powergrading: A clustering approach to am-plify human effort for short answer grading. Transac-tions of the Association for Computational Linguistics,1:391–402.
Steven Bird, Ewan Klein, and Edward Loper. 2009. Nat-ural Language Processing with Python. O’Reilly Me-dia.
Steven Burrows, Iryana Gurevych, and Benno Stein.2015. The eras and trends of automatic short an-swer grading. International Journal of Artificial In-telligence in Education, 25(1):60–117.
Philip G. Butcher and Sally E. Jordan. 2010. A compari-son of human and computer marking of short free-textstudent responses. Computers and Education.
Mary Elaine Califf and Raymond J. Mooney. 1997. Re-lational learning of pattern-match rules for informa-tion extraction. In T.M. Ellison, editor, ComputationalNatural Language Learning, pages 9–15. Associationfor Computational Linguistics.
F. J. Damerau. 1964. Technique for computer detectionand correction of spelling errors. Communications ofthe Association of Computing Machinery, 7(3):171–176.
David Farwell, Bonnie Dorr, Rebecca Green, NizarHabash, Stephen Helmreich, Eduard Hovy, LoriLevin, Keith Miller, Teruko Mitamura, Owen Ram-bow, Florence Reeder, and Advaith Siddharthan.
2009. Interlingual annotation of multilingual text cor-pora and framenet. In Hans C. Boas, editor, Multi-lingual FrameNets in Computational Lexicography :Methods and Applications. Mouton de Gruyter, Berlin.
Lorraine R Gay. 1980. The comparative effects ofmultiple-choice versus short-answer tests on retention.Journal of Educational Measurement, 17(1):45–50.
Debra T. Haley. 2008. Applying Latent Semantic Analy-sis to Computer Assisted Assessment in the ComputerScience Domain: A Framework, a Tool, and an Evalu-ation. Ph.D. thesis, The Open University.
Sally Jordan and Tom Mitchell. 2009. E-assessment forlearning? The potential of short free-text questionswith tailored feedback. British Journal of EducationalTechnology, 40(2):371–385.
Markus Junker, Michael Sintek, and Matthias Rinck.1999. Learning for text categorization and informa-tion extraction with ILP. In J. Cussens, editor, Pro-ceedings of the First Workshop Learning Language inLogic, pages 84–93.
Judy Kay, Peter Reimann, Elliot Diebold, and Bob Kum-merfeld. 2013. MOOCs: So Many Learners, So MuchPotential. . . . IEEE Intelligent Systems, 3:70–77.
Dan Klein and Christopher D. Manning. 2003. Accu-rate unlexicalized parsing. In Proceedings of the 41stMeeting of the Association for Computational Linguis-tics, pages 423–430. Association for ComputationalLinguistics.
Esther Konig and Uwe Reyle. 1999. A general rea-soning scheme for underspecified representations. InHans Jurgen Ohlbach and U. Reyle, editors, Logic,Language and Reasoning. Essays in Honour of DovGabbay, volume 5 of Trends in Logic. Kluwer.
T. K. Landauer, D. Laham, and P. W. Foltz. 2003. Auto-mated scoring and annotation of essays with the intel-ligent essay assessor. In M. Shermis and J. Burstein,editors, Automated essay scoring: a cross-disciplinaryapproach, pages 87–112. Lawrence Erlbaum Asso-ciates, Inc.
Nada Lavrac and Saso Dzeroski. 1994. Inductive LogicProgramming. Ellis Horwood, New York.
Claudia Leacock and Martin Chodorow. 2003. C-rater:Automated scoring of short-answer questions. Com-puters and the Humanities, 37(4):389–405.
Mitchell P Marcus, Mary Ann Marcinkiewicz, and Beat-rice Santorini. 1993. Building a large annotated cor-pus of English: The Penn Treebank. Computationallinguistics, 19(2):313–330.
Tom Mitchell, Terry Russell, Peter Broomhead, andNicola Aldridge. 2002. Towards robust comput-erised marking of free-text responses. In 6th In-ternational Computer Aided Assessment Conference,Loughbrough.
252
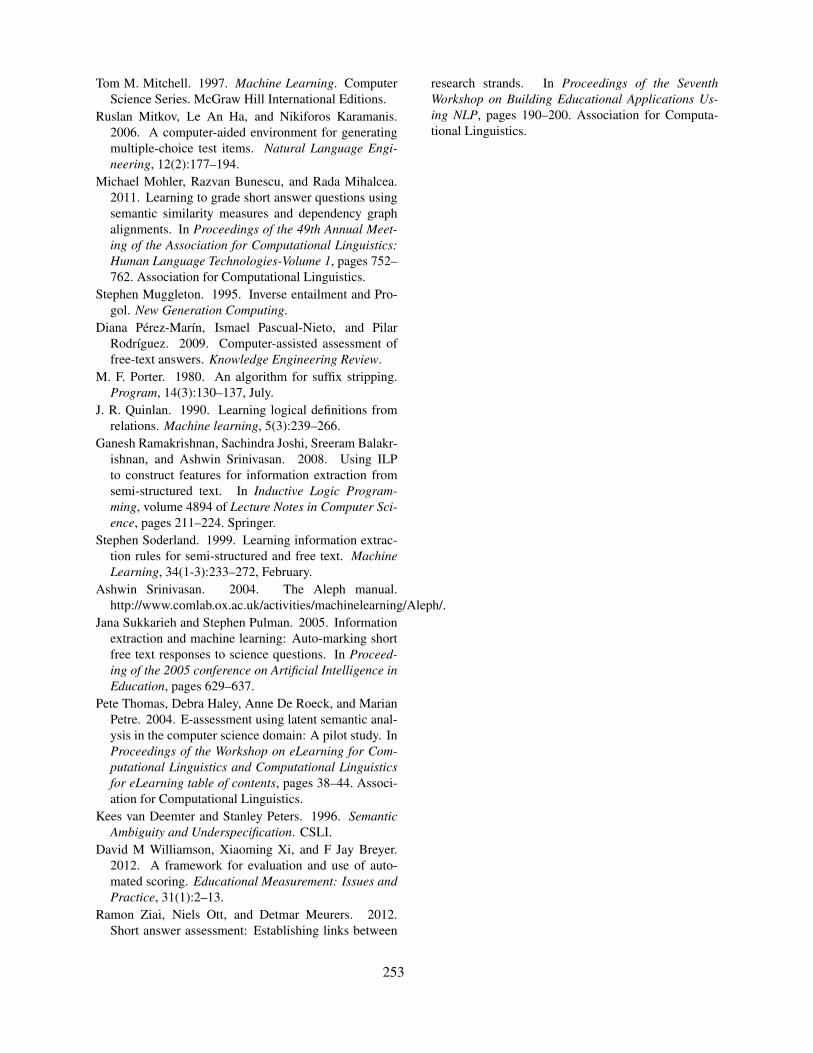
Tom M. Mitchell. 1997. Machine Learning. ComputerScience Series. McGraw Hill International Editions.
Ruslan Mitkov, Le An Ha, and Nikiforos Karamanis.2006. A computer-aided environment for generatingmultiple-choice test items. Natural Language Engi-neering, 12(2):177–194.
Michael Mohler, Razvan Bunescu, and Rada Mihalcea.2011. Learning to grade short answer questions usingsemantic similarity measures and dependency graphalignments. In Proceedings of the 49th Annual Meet-ing of the Association for Computational Linguistics:Human Language Technologies-Volume 1, pages 752–762. Association for Computational Linguistics.
Stephen Muggleton. 1995. Inverse entailment and Pro-gol. New Generation Computing.
Diana Perez-Marın, Ismael Pascual-Nieto, and PilarRodrıguez. 2009. Computer-assisted assessment offree-text answers. Knowledge Engineering Review.
M. F. Porter. 1980. An algorithm for suffix stripping.Program, 14(3):130–137, July.
J. R. Quinlan. 1990. Learning logical definitions fromrelations. Machine learning, 5(3):239–266.
Ganesh Ramakrishnan, Sachindra Joshi, Sreeram Balakr-ishnan, and Ashwin Srinivasan. 2008. Using ILPto construct features for information extraction fromsemi-structured text. In Inductive Logic Program-ming, volume 4894 of Lecture Notes in Computer Sci-ence, pages 211–224. Springer.
Stephen Soderland. 1999. Learning information extrac-tion rules for semi-structured and free text. MachineLearning, 34(1-3):233–272, February.
Ashwin Srinivasan. 2004. The Aleph manual.http://www.comlab.ox.ac.uk/activities/machinelearning/Aleph/.
Jana Sukkarieh and Stephen Pulman. 2005. Informationextraction and machine learning: Auto-marking shortfree text responses to science questions. In Proceed-ing of the 2005 conference on Artificial Intelligence inEducation, pages 629–637.
Pete Thomas, Debra Haley, Anne De Roeck, and MarianPetre. 2004. E-assessment using latent semantic anal-ysis in the computer science domain: A pilot study. InProceedings of the Workshop on eLearning for Com-putational Linguistics and Computational Linguisticsfor eLearning table of contents, pages 38–44. Associ-ation for Computational Linguistics.
Kees van Deemter and Stanley Peters. 1996. SemanticAmbiguity and Underspecification. CSLI.
David M Williamson, Xiaoming Xi, and F Jay Breyer.2012. A framework for evaluation and use of auto-mated scoring. Educational Measurement: Issues andPractice, 31(1):2–13.
Ramon Ziai, Niels Ott, and Detmar Meurers. 2012.Short answer assessment: Establishing links between
research strands. In Proceedings of the SeventhWorkshop on Building Educational Applications Us-ing NLP, pages 190–200. Association for Computa-tional Linguistics.
253
Proceedings of the Tenth Workshop on Innovative Use of NLP for Building Educational Applications, 2015, pages 254–263,Denver, Colorado, June 4, 2015. c©2015 Association for Computational Linguistics
Automatically Scoring Freshman Writing: A Preliminary Investigation
Courtney Napoles1 and Chris Callison-Burch2
1Center for Language and Speech ProcessingJohns Hopkins University, Baltimore, MD
2Computer and Information Science DepartmentUniversity of Pennsylvania, Philadelphia, PA
Abstract
In this work, we explore applications of auto-matic essay scoring (AES) to a corpus of es-says written by college freshmen and discussthe challenges we faced. While most AES sys-tems evaluate highly constrained writing, wedeveloped a system that handles open-ended,long-form writing. We present a novel corpusfor this task, containing more than 3,000 es-says and drafts written for a freshman writingcourse. We describe statistical analysis of thecorpus and identify problems with automati-cally scoring this type of data. Finally, wedemonstrate how to overcome grader bias byusing a multi-task setup, and predict scores aswell as human graders on a different dataset.Finally, we discuss how AES can help teach-ers assign more uniform grades.
1 Introduction
Automatic essay scoring (AES) is the task of au-tomatically predicting the scores of written essays.AES has primarily focused on high-stakes standard-ized tests and statewide evaluation exams. In thispaper, we consider a classroom application of AESto evaluate a novel corpus of more than 3,000 essayswritten for a first-year writing program.
Many colleges have first-year writing programs,which are typically large courses divided into mul-tiple sections taught by different teachers. Theseessays are more representative of college writingthan assessment-based datasets used for AES, andwe wish to examine how AES can help students andteachers in the classroom. These preliminary experi-
ments could help teachers evaluate students and col-leges gain insight into variance across instructors.
This corpus may be more difficult to model com-pared to previous datasets because it lacks multiplegrades to establish validity and the essays are notconstrained by a prompt. Foltz et al. (2013) reportedthat prompt-independent scoring generally had 10%lower reliability than prompt-specific scoring.
We address several issues surrounding automati-cally scoring essays of this nature:
1. Is it possible to model essays graded by severaldifferent teachers with no overlapping grades?
2. ...even when scores given by each teacher havedifferent distributions?
3. Can a single model predict the scores of longessays that are (a) not constrained by an essayprompt and (b) written in different styles?
4. How can AES provide constructive feedback toteachers and administrators?
In this work, we describe how multi-task learningcan accommodate the differences in teacher scoringpatterns by jointly modeling the scores of individualteachers, while sharing information across all teach-ers. Our multi-task model correlates strongly withactual grades. We also provide an example of howto provide feedback to help teachers grade more uni-formly, using the weights learned by a linear model.
Our corpus is described in Section 3. In Section 4we describe our experimental setup and the featuresused. Section 5 presents results from our system thatachieve human-like levels of correlation. Section 6discusses our results and proposes a new way to pro-vide feedback to teachers about their grading.
254

Target wordProject count Description
1 600-770 A personal narrative that describes an experience and uses that experience totell readers something important about the writer.
2 600 A bibliographic essay that asks you to understand the conversation surround-ing your chosen topic by examining four relevant sources. Two of thesesources must be at least ten years apart so that you can see how interpreta-tions of an event, concept, or person evolve over time and that textual schol-arship is an ongoing conversation.
3 600–800 A reflection that asks you to think carefully about how audience and purpose,as well as medium and genre, affect your choices as composers and reflectcarefully on a new dimension of your topic.
4 1000–1200 A polished essay that asserts an arguable thesis that is supported by researchand sound reasoning.
Table 1: Brief description of the assignments in the FWC, as provided by the syllabus.
2 Related Work
While AES has traditionally been used for gradingtests, there are some previous applications of AESin a non-testing environment. For example, Elliotet al. (2012) used AES to assist with placement andChali and Hasan (2012) automatically graded essayswritten for an occupational therapy course by com-paring them to the course material.
Corpora for AES include English-languagelearner writing, specifically the First CertificationExam corpus (FCE), a portion of the CambridgeLearner Corpus consisting of 1,244 essays writtenfor an English-language certification exam (Yan-nakoudakis et al., 2011), and the International Cor-pus of Learner English (ICLE), 6,085 essays writ-ten by university students across the world (Granger,2003). The Kaggle ASAP–AES dataset has pri-marily native-English writing, with 22,000 short es-says written by middle- and high-school students theUnited States (Shermis and Hamner, 2013). TheFCE and Kaggle data were collected during exam-inations while the ICLE data was written during anexam or as part of a class assignment.
Student writing collections not suitable for AESinclude the Michigan Corpus of Upper-level StudentPapers, with 829 academic papers that received an Agrade, written by college seniors and graduate stu-dents across several disciplines (Mic, 2009). A sep-arate corpus of freshman writing was collected atUniversity of Michigan containing 3,500 ungradedpre-entrance essays (Gere and Aull, 2010).
Methods previously used for AES include lin-
Draft Tokens Sentences ParagraphsIntermed. 840.3 35.6 5.2
Final 938.5 39.6 5.7
Table 2: Average length of essays from the Fall 2011semester.
ear regression (Attali and Burstein, 2006), rank al-gorithms (Yannakoudakis et al., 2011; Chen andHe, 2013), LSA (Pearson, 2010; Chali and Hasan,2012), and Bayesian models (Rudner and Liang,2002). Recent approaches focus on predicting spe-cific aspect of the score by using targeted featuressuch as coherence (McNamara et al., 2010; Yan-nakoudakis and Briscoe, 2012).
Multi-task learning jointly models separate tasksin a single model using a shared representation. Ithas been used in NLP for tasks such as domainadaptation (Finkel and Manning, 2009), relation ex-traction (Jiang, 2009), and modeling annotator bias(Cohn and Specia, 2013).
3 Data
The Freshman Writing Corpus (FWC) is a new cor-pus for AES that contains essays written by collegestudents in a first-year writing program. The uniquefeatures of this corpus are multiple essay drafts,teacher grades on a detailed rubric, and teacher feed-back. The FWC contains approximately 23,000 es-says collected over 6 semesters. To our knowledge,this is the first collection of take-home writing as-signments that can be used for AES.
In this work, we consider one semester of es-
255
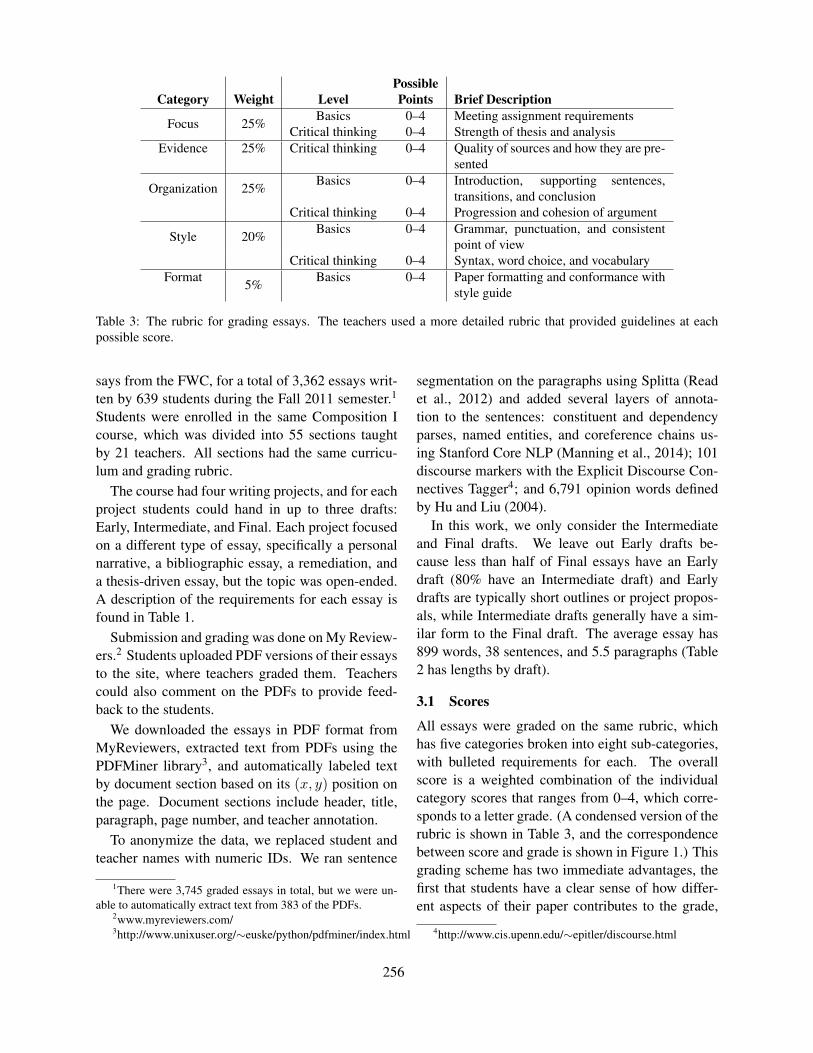
PossibleCategory Weight Level Points Brief Description
Focus 25% Basics 0–4 Meeting assignment requirementsCritical thinking 0–4 Strength of thesis and analysis
Evidence 25% Critical thinking 0–4 Quality of sources and how they are pre-sented
Organization 25% Basics 0–4 Introduction, supporting sentences,transitions, and conclusion
Critical thinking 0–4 Progression and cohesion of argument
Style 20% Basics 0–4 Grammar, punctuation, and consistentpoint of view
Critical thinking 0–4 Syntax, word choice, and vocabularyFormat 5% Basics 0–4 Paper formatting and conformance with
style guide
Table 3: The rubric for grading essays. The teachers used a more detailed rubric that provided guidelines at eachpossible score.
says from the FWC, for a total of 3,362 essays writ-ten by 639 students during the Fall 2011 semester.1
Students were enrolled in the same Composition Icourse, which was divided into 55 sections taughtby 21 teachers. All sections had the same curricu-lum and grading rubric.
The course had four writing projects, and for eachproject students could hand in up to three drafts:Early, Intermediate, and Final. Each project focusedon a different type of essay, specifically a personalnarrative, a bibliographic essay, a remediation, anda thesis-driven essay, but the topic was open-ended.A description of the requirements for each essay isfound in Table 1.
Submission and grading was done on My Review-ers.2 Students uploaded PDF versions of their essaysto the site, where teachers graded them. Teacherscould also comment on the PDFs to provide feed-back to the students.
We downloaded the essays in PDF format fromMyReviewers, extracted text from PDFs using thePDFMiner library3, and automatically labeled textby document section based on its (x, y) position onthe page. Document sections include header, title,paragraph, page number, and teacher annotation.
To anonymize the data, we replaced student andteacher names with numeric IDs. We ran sentence
1There were 3,745 graded essays in total, but we were un-able to automatically extract text from 383 of the PDFs.
2www.myreviewers.com/3http://www.unixuser.org/∼euske/python/pdfminer/index.html
segmentation on the paragraphs using Splitta (Readet al., 2012) and added several layers of annota-tion to the sentences: constituent and dependencyparses, named entities, and coreference chains us-ing Stanford Core NLP (Manning et al., 2014); 101discourse markers with the Explicit Discourse Con-nectives Tagger4; and 6,791 opinion words definedby Hu and Liu (2004).
In this work, we only consider the Intermediateand Final drafts. We leave out Early drafts be-cause less than half of Final essays have an Earlydraft (80% have an Intermediate draft) and Earlydrafts are typically short outlines or project propos-als, while Intermediate drafts generally have a sim-ilar form to the Final draft. The average essay has899 words, 38 sentences, and 5.5 paragraphs (Table2 has lengths by draft).
3.1 Scores
All essays were graded on the same rubric, whichhas five categories broken into eight sub-categories,with bulleted requirements for each. The overallscore is a weighted combination of the individualcategory scores that ranges from 0–4, which corre-sponds to a letter grade. (A condensed version of therubric is shown in Table 3, and the correspondencebetween score and grade is shown in Figure 1.) Thisgrading scheme has two immediate advantages, thefirst that students have a clear sense of how differ-ent aspects of their paper contributes to the grade,
4http://www.cis.upenn.edu/∼epitler/discourse.html
256
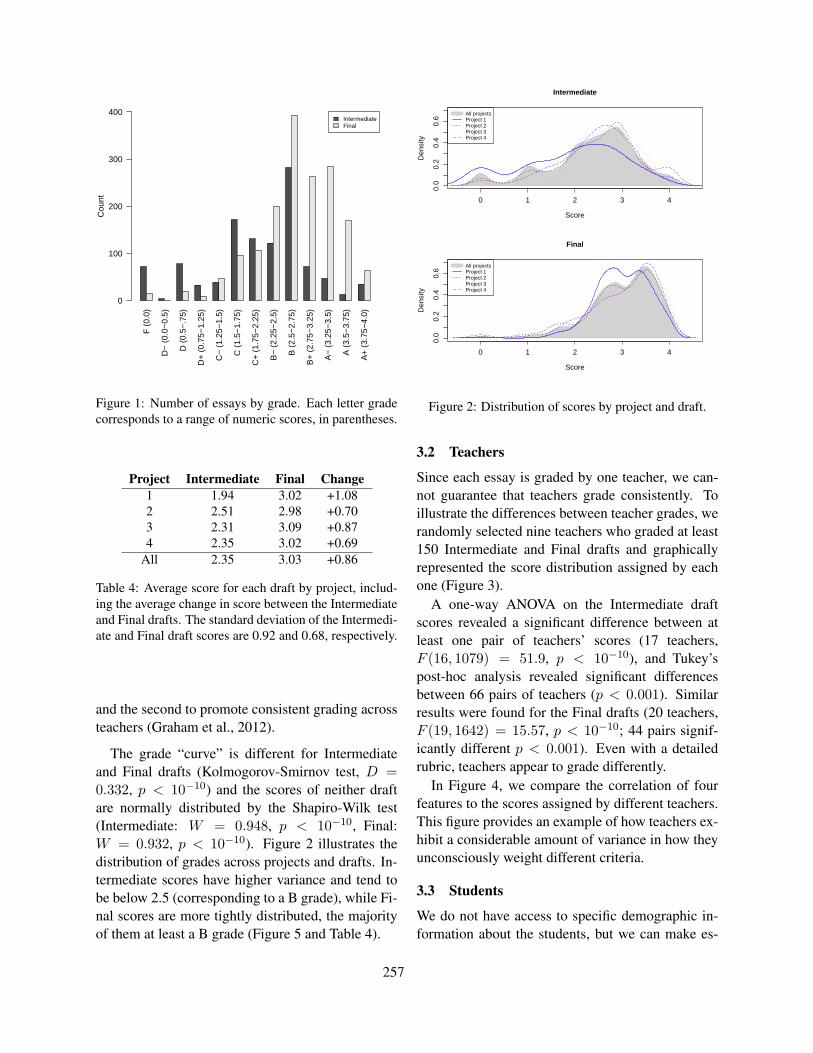
F (
0.0)
D−
(0.
0−0.
5)
D (
0.5−
.75)
D+
(0.
75−
1.25
)
C−
(1.
25−
1.5)
C (
1.5−
1.75
)
C+
(1.
75−
2.25
)
B−
(2.
25−
2.5)
B (
2.5−
2.75
)
B+
(2.
75−
3.25
)
A−
(3.
25−
3.5)
A (
3.5−
3.75
)
A+
(3.
75−
4.0)
Cou
nt
0
100
200
300
400IntermediateFinal
Figure 1: Number of essays by grade. Each letter gradecorresponds to a range of numeric scores, in parentheses.
Project Intermediate Final Change1 1.94 3.02 +1.082 2.51 2.98 +0.703 2.31 3.09 +0.874 2.35 3.02 +0.69
All 2.35 3.03 +0.86
Table 4: Average score for each draft by project, includ-ing the average change in score between the Intermediateand Final drafts. The standard deviation of the Intermedi-ate and Final draft scores are 0.92 and 0.68, respectively.
and the second to promote consistent grading acrossteachers (Graham et al., 2012).
The grade “curve” is different for Intermediateand Final drafts (Kolmogorov-Smirnov test, D =0.332, p < 10−10) and the scores of neither draftare normally distributed by the Shapiro-Wilk test(Intermediate: W = 0.948, p < 10−10, Final:W = 0.932, p < 10−10). Figure 2 illustrates thedistribution of grades across projects and drafts. In-termediate scores have higher variance and tend tobe below 2.5 (corresponding to a B grade), while Fi-nal scores are more tightly distributed, the majorityof them at least a B grade (Figure 5 and Table 4).
0.0
0.2
0.4
0.6
Intermediate
Score
Den
sity
0 1 2 3 4
All projectsProject 1Project 2Project 3Project 4
0.0
0.2
0.4
0.6
Final
Score
Den
sity
0 1 2 3 4
All projectsProject 1Project 2Project 3Project 4
Figure 2: Distribution of scores by project and draft.
3.2 Teachers
Since each essay is graded by one teacher, we can-not guarantee that teachers grade consistently. Toillustrate the differences between teacher grades, werandomly selected nine teachers who graded at least150 Intermediate and Final drafts and graphicallyrepresented the score distribution assigned by eachone (Figure 3).
A one-way ANOVA on the Intermediate draftscores revealed a significant difference between atleast one pair of teachers’ scores (17 teachers,F (16, 1079) = 51.9, p < 10−10), and Tukey’spost-hoc analysis revealed significant differencesbetween 66 pairs of teachers (p < 0.001). Similarresults were found for the Final drafts (20 teachers,F (19, 1642) = 15.57, p < 10−10; 44 pairs signif-icantly different p < 0.001). Even with a detailedrubric, teachers appear to grade differently.
In Figure 4, we compare the correlation of fourfeatures to the scores assigned by different teachers.This figure provides an example of how teachers ex-hibit a considerable amount of variance in how theyunconsciously weight different criteria.
3.3 Students
We do not have access to specific demographic in-formation about the students, but we can make es-
257

All A B C D E F G H I
Teacher
rAvg. tokens per sent.Word countLongest coref. chain% proper nouns
−0.2
0.0
0.2
0.4
0.6
Figure 4: The correlation of four different features with Final draft scores, compared across nine teachers.
● 01
23
4
Intermediate
Teacher
Sco
re
All A B C D E F G H I
● 01
23
4
Final
Teacher
Sco
re
All A B C D E F G H I
Figure 3: Distribution of scores given by nine teachers.
timates of their writing ability and native language.The writing course is a university requirement thatstudents can place out of if they have completeda comparable course or received a sufficient gradein any number of pre-college standardized tests.5
Therefore, we assume that the students in this course
5For example, students need a 4 in an English Language/Lit-erature AP course, or a 5 in an IB English course to place out.
require additional support to develop college-levelwriting skills.
We also assume that the majority of students inthis course are native English speakers. Because na-tive English speakers and English language learnersgenerally have different difficulties with writing, wewished to estimate how many of the students in thecourse were native English speakers. 96% the stu-dent body as a whole are American citizens, whomwe assume are native English speakers. If the de-mographics of the writing course are the same as theuniversity as a whole, then at most 4% of the stu-dents are non-native English speakers, which is ourlower-bound estimate.
We arrive at an upper bound if we assume that ev-ery international student in the freshman class (168out of 4,200 total students) is in the writing class,or at most 26% of the writing class are non-nativespeakers. In reality, the number is probably some-where between 4–26%.
4 Experiments
We separated 3,362 essays by draft, Intermediateand Final (1,400 and 1,962 essays, respectively,skipping 31 Intermediate drafts that had no grade as-signed). We randomly selected 100 essays for devel-opment and 100 for testing from each draft type and
258
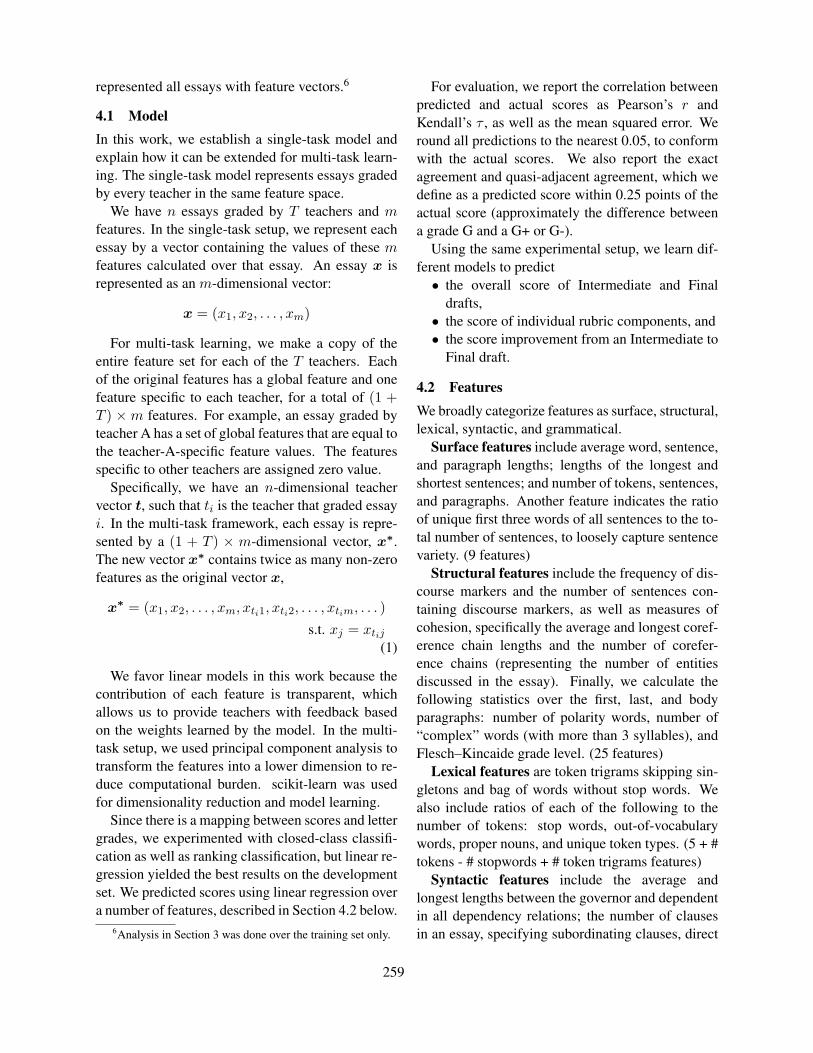
represented all essays with feature vectors.6
4.1 ModelIn this work, we establish a single-task model andexplain how it can be extended for multi-task learn-ing. The single-task model represents essays gradedby every teacher in the same feature space.
We have n essays graded by T teachers and mfeatures. In the single-task setup, we represent eachessay by a vector containing the values of these mfeatures calculated over that essay. An essay x isrepresented as an m-dimensional vector:
x = (x1, x2, . . . , xm)
For multi-task learning, we make a copy of theentire feature set for each of the T teachers. Eachof the original features has a global feature and onefeature specific to each teacher, for a total of (1 +T ) ×m features. For example, an essay graded byteacher A has a set of global features that are equal tothe teacher-A-specific feature values. The featuresspecific to other teachers are assigned zero value.
Specifically, we have an n-dimensional teachervector t, such that ti is the teacher that graded essayi. In the multi-task framework, each essay is repre-sented by a (1 + T ) × m-dimensional vector, x∗.The new vector x∗ contains twice as many non-zerofeatures as the original vector x,
x∗ = (x1, x2, . . . , xm, xti1, xti2, . . . , xtim, . . . )s.t. xj = xtij
(1)
We favor linear models in this work because thecontribution of each feature is transparent, whichallows us to provide teachers with feedback basedon the weights learned by the model. In the multi-task setup, we used principal component analysis totransform the features into a lower dimension to re-duce computational burden. scikit-learn was usedfor dimensionality reduction and model learning.
Since there is a mapping between scores and lettergrades, we experimented with closed-class classifi-cation as well as ranking classification, but linear re-gression yielded the best results on the developmentset. We predicted scores using linear regression overa number of features, described in Section 4.2 below.
6Analysis in Section 3 was done over the training set only.
For evaluation, we report the correlation betweenpredicted and actual scores as Pearson’s r andKendall’s τ , as well as the mean squared error. Weround all predictions to the nearest 0.05, to conformwith the actual scores. We also report the exactagreement and quasi-adjacent agreement, which wedefine as a predicted score within 0.25 points of theactual score (approximately the difference betweena grade G and a G+ or G-).
Using the same experimental setup, we learn dif-ferent models to predict• the overall score of Intermediate and Final
drafts,• the score of individual rubric components, and• the score improvement from an Intermediate to
Final draft.
4.2 FeaturesWe broadly categorize features as surface, structural,lexical, syntactic, and grammatical.
Surface features include average word, sentence,and paragraph lengths; lengths of the longest andshortest sentences; and number of tokens, sentences,and paragraphs. Another feature indicates the ratioof unique first three words of all sentences to the to-tal number of sentences, to loosely capture sentencevariety. (9 features)
Structural features include the frequency of dis-course markers and the number of sentences con-taining discourse markers, as well as measures ofcohesion, specifically the average and longest coref-erence chain lengths and the number of corefer-ence chains (representing the number of entitiesdiscussed in the essay). Finally, we calculate thefollowing statistics over the first, last, and bodyparagraphs: number of polarity words, number of“complex” words (with more than 3 syllables), andFlesch–Kincaide grade level. (25 features)
Lexical features are token trigrams skipping sin-gletons and bag of words without stop words. Wealso include ratios of each of the following to thenumber of tokens: stop words, out-of-vocabularywords, proper nouns, and unique token types. (5 + #tokens - # stopwords + # token trigrams features)
Syntactic features include the average andlongest lengths between the governor and dependentin all dependency relations; the number of clausesin an essay, specifying subordinating clauses, direct
259
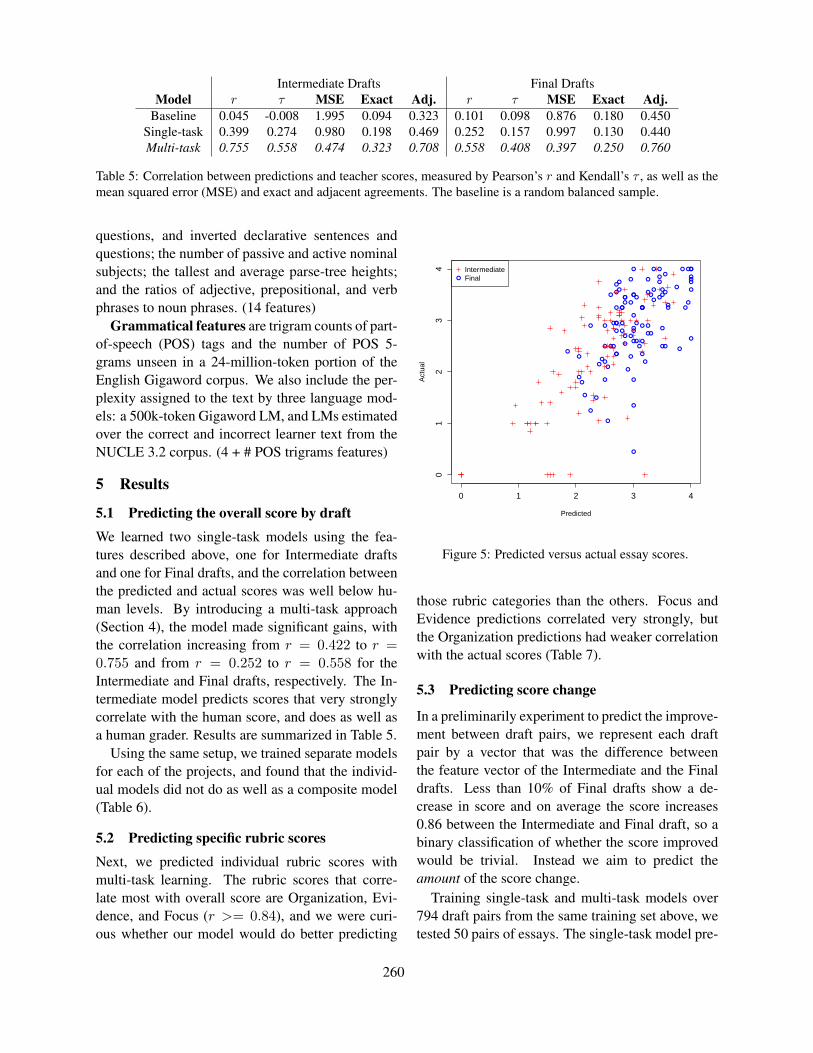
Intermediate Drafts Final DraftsModel r τ MSE Exact Adj. r τ MSE Exact Adj.
Baseline 0.045 -0.008 1.995 0.094 0.323 0.101 0.098 0.876 0.180 0.450Single-task 0.399 0.274 0.980 0.198 0.469 0.252 0.157 0.997 0.130 0.440Multi-task 0.755 0.558 0.474 0.323 0.708 0.558 0.408 0.397 0.250 0.760
Table 5: Correlation between predictions and teacher scores, measured by Pearson’s r and Kendall’s τ , as well as themean squared error (MSE) and exact and adjacent agreements. The baseline is a random balanced sample.
questions, and inverted declarative sentences andquestions; the number of passive and active nominalsubjects; the tallest and average parse-tree heights;and the ratios of adjective, prepositional, and verbphrases to noun phrases. (14 features)
Grammatical features are trigram counts of part-of-speech (POS) tags and the number of POS 5-grams unseen in a 24-million-token portion of theEnglish Gigaword corpus. We also include the per-plexity assigned to the text by three language mod-els: a 500k-token Gigaword LM, and LMs estimatedover the correct and incorrect learner text from theNUCLE 3.2 corpus. (4 + # POS trigrams features)
5 Results
5.1 Predicting the overall score by draft
We learned two single-task models using the fea-tures described above, one for Intermediate draftsand one for Final drafts, and the correlation betweenthe predicted and actual scores was well below hu-man levels. By introducing a multi-task approach(Section 4), the model made significant gains, withthe correlation increasing from r = 0.422 to r =0.755 and from r = 0.252 to r = 0.558 for theIntermediate and Final drafts, respectively. The In-termediate model predicts scores that very stronglycorrelate with the human score, and does as well asa human grader. Results are summarized in Table 5.
Using the same setup, we trained separate modelsfor each of the projects, and found that the individ-ual models did not do as well as a composite model(Table 6).
5.2 Predicting specific rubric scores
Next, we predicted individual rubric scores withmulti-task learning. The rubric scores that corre-late most with overall score are Organization, Evi-dence, and Focus (r >= 0.84), and we were curi-ous whether our model would do better predicting
●
●
●
●
●
●
●
●
●●
●
●●
●●
●
●
●
●
●
●
●
●
●
●
●●
●
●
●
●
●
●
●
●●
●
●
●
●
●●
●●
●
●
●
●
●●
●
●
●
●
●
●
●
●
●
●
●
●
●
●
●
●
●
●●
●
●
●
●
●
●
●
●
●
●
●
●
●
●
●
●
●
●
●
●
●
●
●
●
●
●
●
●
●
●
●
0 1 2 3 4
01
23
4
Predicted
Act
ual
●
IntermediateFinal
Figure 5: Predicted versus actual essay scores.
those rubric categories than the others. Focus andEvidence predictions correlated very strongly, butthe Organization predictions had weaker correlationwith the actual scores (Table 7).
5.3 Predicting score change
In a preliminarily experiment to predict the improve-ment between draft pairs, we represent each draftpair by a vector that was the difference betweenthe feature vector of the Intermediate and the Finaldrafts. Less than 10% of Final drafts show a de-crease in score and on average the score increases0.86 between the Intermediate and Final draft, so abinary classification of whether the score improvedwould be trivial. Instead we aim to predict theamount of the score change.
Training single-task and multi-task models over794 draft pairs from the same training set above, wetested 50 pairs of essays. The single-task model pre-
260

Project Intermediate FinalP1 0.859 0.511P2 0.706 0.483P3 0.571 0.463P4 0.591 0.382
P1–4 0.704 0.454
Table 6: The correlation (Pearson’s r) of actual scoresto predictions made by individual models for eachproject/draft pair. P1–4 represents predictions of allproject models.
Model r MSEBaseline 0.067 0.815
Single-task 0.346 4.304Single-task, no content 0.087 0.399
Multi-task -0.027 5.841Multi-task, no content 0.356 1.702
Table 8: Correlation between the predicted and actualchange between Intermediate and Final draft scores.
dicted the change much better than the multi-task,(r = 0.346 versus r = −0.027, which is worse thana random balanced baseline). When we removedcontent features (unigrams and trigrams), the multi-task model outperformed the single-task model withcontent, both by correlation and MSE. Removingcontent features significantly degraded the perfor-mance of the single-task model (Table 8).
5.4 Potential for providing feedback
We trained individual models for each of 17 teach-ers over Intermediate drafts, without dimensionalityreduction. The predicted scores correlated stronglywith the instructor scores (r = 0.650). We isolatedthe features with the heaviest average weights acrossall 17 models to examine whether teachers weightedthese features differently in the individual models,and found that these weights varied by magnitudeand polarity (Figure 6).
A graphical representation of this type could pro-vide useful feedback to teachers. For example, thelongest sentence feature has a high negative weightfor teachers C and G, but is positively weighted forthe other teachers. Given this information, teachersC and G could slightly alter their grading practicesto better match the other teachers. However, beforesuch a technology is deployed, we would need to de-
All A B C D E F G H I
Teacher
wei
ght
# sent. with discourseAvg. tokens per sent.Longest sent.# paragraphsAvg. coref. chain length
−0.
004
−0.
002
0.00
0.00
20.
004
0.00
60.
008
0.01
0
Figure 6: A comparison of feature weights learned in in-dividual, teacher-specific models.
velop more reliable models, examine the essays tocheck that the features is not a proxy for some otheraspect of the text, and perform pilot testing.
6 Discussion and Future Work
One of the primary challenges of our dataset is thelack of multiple annotations. We only have onescore for each essay, and the scores are provided by21 different teachers whose grades are from differentdistributions. Modeling scores from different distri-butions in a single task yields predictions that onlyweakly correlate with the actual scores.
A joint model across all teachers and all projectsdoes better than individual models for predicting es-say scores. The multi-task setup enables us to jointlymodel characteristics of individual teachers whiletaking advantage of shared information across allteachers, and the models’ predictions strongly corre-late with human scores. On the Intermediate drafts,the correlation is very strong and within the range ofhuman–human correlation (inter-human correlationsranged from 0.61 to 0.85 on the Kaggle ASAP–AESdata (Shermis and Hamner, 2013)).
Unlike the Kaggle data, these essays are openended, and open-ended topics are thought to be moredifficult to score (Foltz et al., 2013). Furthermore,
261
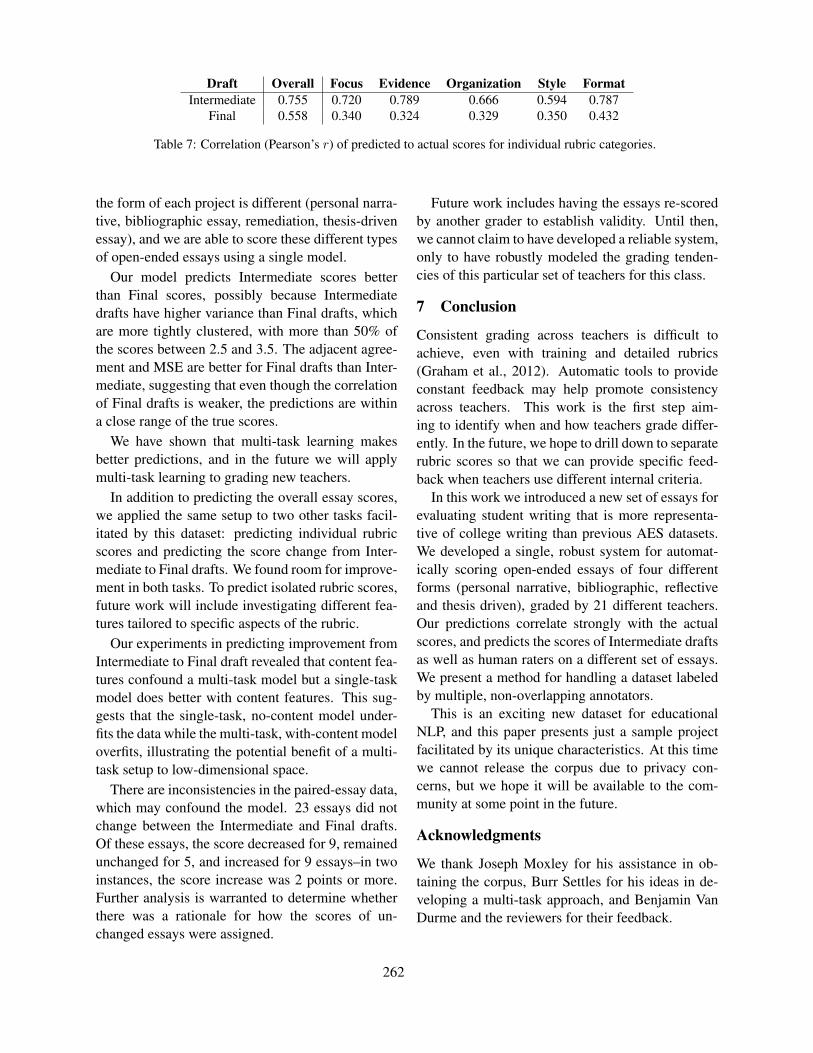
Draft Overall Focus Evidence Organization Style FormatIntermediate 0.755 0.720 0.789 0.666 0.594 0.787
Final 0.558 0.340 0.324 0.329 0.350 0.432
Table 7: Correlation (Pearson’s r) of predicted to actual scores for individual rubric categories.
the form of each project is different (personal narra-tive, bibliographic essay, remediation, thesis-drivenessay), and we are able to score these different typesof open-ended essays using a single model.
Our model predicts Intermediate scores betterthan Final scores, possibly because Intermediatedrafts have higher variance than Final drafts, whichare more tightly clustered, with more than 50% ofthe scores between 2.5 and 3.5. The adjacent agree-ment and MSE are better for Final drafts than Inter-mediate, suggesting that even though the correlationof Final drafts is weaker, the predictions are withina close range of the true scores.
We have shown that multi-task learning makesbetter predictions, and in the future we will applymulti-task learning to grading new teachers.
In addition to predicting the overall essay scores,we applied the same setup to two other tasks facil-itated by this dataset: predicting individual rubricscores and predicting the score change from Inter-mediate to Final drafts. We found room for improve-ment in both tasks. To predict isolated rubric scores,future work will include investigating different fea-tures tailored to specific aspects of the rubric.
Our experiments in predicting improvement fromIntermediate to Final draft revealed that content fea-tures confound a multi-task model but a single-taskmodel does better with content features. This sug-gests that the single-task, no-content model under-fits the data while the multi-task, with-content modeloverfits, illustrating the potential benefit of a multi-task setup to low-dimensional space.
There are inconsistencies in the paired-essay data,which may confound the model. 23 essays did notchange between the Intermediate and Final drafts.Of these essays, the score decreased for 9, remainedunchanged for 5, and increased for 9 essays–in twoinstances, the score increase was 2 points or more.Further analysis is warranted to determine whetherthere was a rationale for how the scores of un-changed essays were assigned.
Future work includes having the essays re-scoredby another grader to establish validity. Until then,we cannot claim to have developed a reliable system,only to have robustly modeled the grading tenden-cies of this particular set of teachers for this class.
7 Conclusion
Consistent grading across teachers is difficult toachieve, even with training and detailed rubrics(Graham et al., 2012). Automatic tools to provideconstant feedback may help promote consistencyacross teachers. This work is the first step aim-ing to identify when and how teachers grade differ-ently. In the future, we hope to drill down to separaterubric scores so that we can provide specific feed-back when teachers use different internal criteria.
In this work we introduced a new set of essays forevaluating student writing that is more representa-tive of college writing than previous AES datasets.We developed a single, robust system for automat-ically scoring open-ended essays of four differentforms (personal narrative, bibliographic, reflectiveand thesis driven), graded by 21 different teachers.Our predictions correlate strongly with the actualscores, and predicts the scores of Intermediate draftsas well as human raters on a different set of essays.We present a method for handling a dataset labeledby multiple, non-overlapping annotators.
This is an exciting new dataset for educationalNLP, and this paper presents just a sample projectfacilitated by its unique characteristics. At this timewe cannot release the corpus due to privacy con-cerns, but we hope it will be available to the com-munity at some point in the future.
Acknowledgments
We thank Joseph Moxley for his assistance in ob-taining the corpus, Burr Settles for his ideas in de-veloping a multi-task approach, and Benjamin VanDurme and the reviewers for their feedback.
262
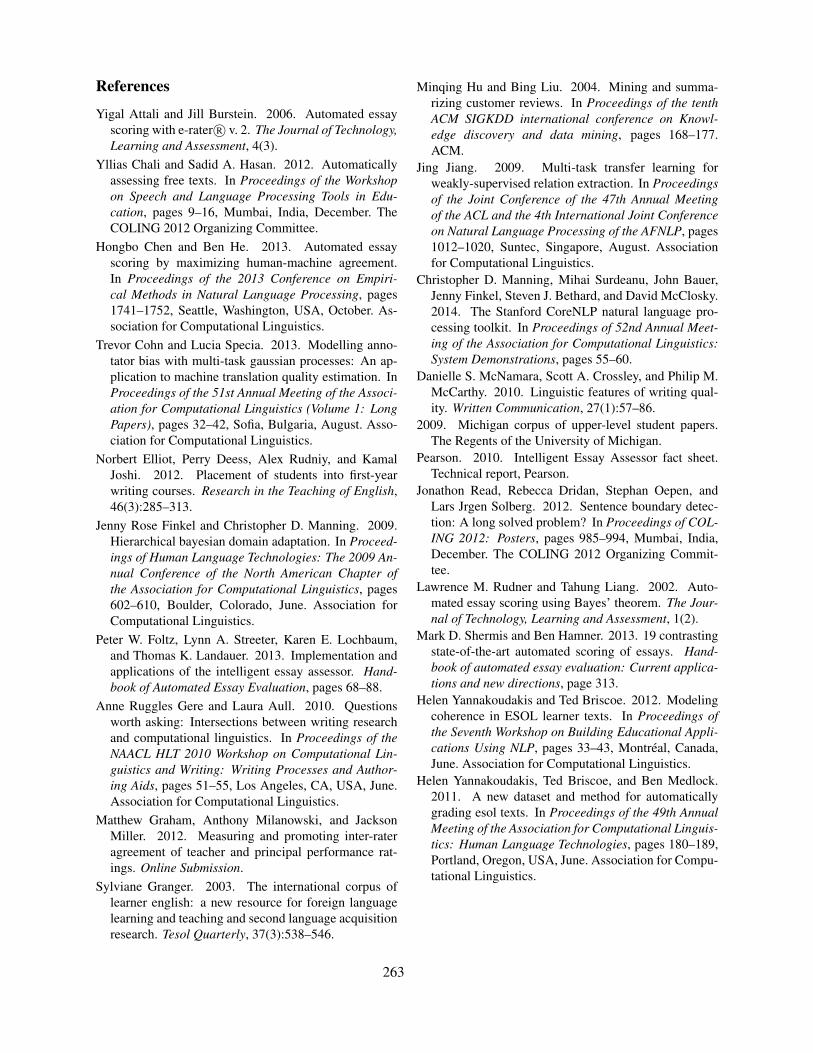
References
Yigal Attali and Jill Burstein. 2006. Automated essayscoring with e-rater R© v. 2. The Journal of Technology,Learning and Assessment, 4(3).
Yllias Chali and Sadid A. Hasan. 2012. Automaticallyassessing free texts. In Proceedings of the Workshopon Speech and Language Processing Tools in Edu-cation, pages 9–16, Mumbai, India, December. TheCOLING 2012 Organizing Committee.
Hongbo Chen and Ben He. 2013. Automated essayscoring by maximizing human-machine agreement.In Proceedings of the 2013 Conference on Empiri-cal Methods in Natural Language Processing, pages1741–1752, Seattle, Washington, USA, October. As-sociation for Computational Linguistics.
Trevor Cohn and Lucia Specia. 2013. Modelling anno-tator bias with multi-task gaussian processes: An ap-plication to machine translation quality estimation. InProceedings of the 51st Annual Meeting of the Associ-ation for Computational Linguistics (Volume 1: LongPapers), pages 32–42, Sofia, Bulgaria, August. Asso-ciation for Computational Linguistics.
Norbert Elliot, Perry Deess, Alex Rudniy, and KamalJoshi. 2012. Placement of students into first-yearwriting courses. Research in the Teaching of English,46(3):285–313.
Jenny Rose Finkel and Christopher D. Manning. 2009.Hierarchical bayesian domain adaptation. In Proceed-ings of Human Language Technologies: The 2009 An-nual Conference of the North American Chapter ofthe Association for Computational Linguistics, pages602–610, Boulder, Colorado, June. Association forComputational Linguistics.
Peter W. Foltz, Lynn A. Streeter, Karen E. Lochbaum,and Thomas K. Landauer. 2013. Implementation andapplications of the intelligent essay assessor. Hand-book of Automated Essay Evaluation, pages 68–88.
Anne Ruggles Gere and Laura Aull. 2010. Questionsworth asking: Intersections between writing researchand computational linguistics. In Proceedings of theNAACL HLT 2010 Workshop on Computational Lin-guistics and Writing: Writing Processes and Author-ing Aids, pages 51–55, Los Angeles, CA, USA, June.Association for Computational Linguistics.
Matthew Graham, Anthony Milanowski, and JacksonMiller. 2012. Measuring and promoting inter-rateragreement of teacher and principal performance rat-ings. Online Submission.
Sylviane Granger. 2003. The international corpus oflearner english: a new resource for foreign languagelearning and teaching and second language acquisitionresearch. Tesol Quarterly, 37(3):538–546.
Minqing Hu and Bing Liu. 2004. Mining and summa-rizing customer reviews. In Proceedings of the tenthACM SIGKDD international conference on Knowl-edge discovery and data mining, pages 168–177.ACM.
Jing Jiang. 2009. Multi-task transfer learning forweakly-supervised relation extraction. In Proceedingsof the Joint Conference of the 47th Annual Meetingof the ACL and the 4th International Joint Conferenceon Natural Language Processing of the AFNLP, pages1012–1020, Suntec, Singapore, August. Associationfor Computational Linguistics.
Christopher D. Manning, Mihai Surdeanu, John Bauer,Jenny Finkel, Steven J. Bethard, and David McClosky.2014. The Stanford CoreNLP natural language pro-cessing toolkit. In Proceedings of 52nd Annual Meet-ing of the Association for Computational Linguistics:System Demonstrations, pages 55–60.
Danielle S. McNamara, Scott A. Crossley, and Philip M.McCarthy. 2010. Linguistic features of writing qual-ity. Written Communication, 27(1):57–86.
2009. Michigan corpus of upper-level student papers.The Regents of the University of Michigan.
Pearson. 2010. Intelligent Essay Assessor fact sheet.Technical report, Pearson.
Jonathon Read, Rebecca Dridan, Stephan Oepen, andLars Jrgen Solberg. 2012. Sentence boundary detec-tion: A long solved problem? In Proceedings of COL-ING 2012: Posters, pages 985–994, Mumbai, India,December. The COLING 2012 Organizing Commit-tee.
Lawrence M. Rudner and Tahung Liang. 2002. Auto-mated essay scoring using Bayes’ theorem. The Jour-nal of Technology, Learning and Assessment, 1(2).
Mark D. Shermis and Ben Hamner. 2013. 19 contrastingstate-of-the-art automated scoring of essays. Hand-book of automated essay evaluation: Current applica-tions and new directions, page 313.
Helen Yannakoudakis and Ted Briscoe. 2012. Modelingcoherence in ESOL learner texts. In Proceedings ofthe Seventh Workshop on Building Educational Appli-cations Using NLP, pages 33–43, Montreal, Canada,June. Association for Computational Linguistics.
Helen Yannakoudakis, Ted Briscoe, and Ben Medlock.2011. A new dataset and method for automaticallygrading esol texts. In Proceedings of the 49th AnnualMeeting of the Association for Computational Linguis-tics: Human Language Technologies, pages 180–189,Portland, Oregon, USA, June. Association for Compu-tational Linguistics.
263

Author Index
Attali, Yigal, 162
Banchs, Rafael, 154Beinborn, Lisa, 1Briscoe, Ted, 233Burstein, Jill, 64
Cahill, Aoife, 49, 124, 162Callison-Burch, Chris, 254Chakraborti, Sutanu, 190Chen, Lei, 12Chen, MeiHua, 144Chen, Wei-Fan, 144Cheng, Jian, 97Chodorow, Martin, 42, 162Correnti, Richard, 20Cummins, Ronan, 213
D’Haro, Luis Fernando, 154Danforth, Douglas, 86Daudaravicius, Vidas, 56Dickinson, Markus, 31Dras, Mark, 172Durand, Guillaume, 75
Eswaran, Dhivya, 190
Farra, Noura, 64Foltz, Peter, 97, 207Fosler-Lussier, Eric, 86Futagi, Yoko, 162
Goutte, Cyril, 75Gurevych, Iryna, 1
Heilman, Michael, 12, 81, 124Huang, Mingxuan, 118
Jaffe, Evan, 86
Kochmar, Ekaterina, 233
Ku, Lun-Wei, 144Kumar, Girish, 154
Ledbetter, Scott, 31Lee, Chong Min, 42Leger, Serge, 75Litman, Diane, 20, 133Lopez, Melissa, 162Loukina, Anastassia, 12
Madnani, Nitin, 81, 162Malmasi, Shervin, 49, 118, 172Martin, Trish, 179Mathew, Ditty, 190
Napoles, Courtney, 254Niraula, Nobal Bikram, 196
Pijetlovic, Dijana, 107
Rahimi, Zahra, 20Ramachandran, Lakshmi, 97, 207Rosenfeld, Alex, 86Rus, Vasile, 196
Scholten-Akoun, Dirk, 224Schuler, William, 86Somasundaran, Swapna, 42, 64
Tetreault, Joel, 172
Volodina, Elena, 107
Wang, Elaine, 20Wang, Maolin, 118Wang, Xinhao, 42White, Michael, 86Willis, Alistair, 243Wilson, Joshua, 179Wojatzki, Michael, 224
265

Yannakoudakis, Helen, 213
Zechner, Klaus, 12Zesch, Torsten, 1, 124, 224Zhang, Fan, 133