Sensor arrays based on nanoparticles for early detection of kidney injury by breath samples
10
Sensor arrays based on nanoparticles for early detection of kidney injury by breath samples Morad K. Nakhleh, MSc a , Haitham Amal, MSc a , Hoda Awad, BSc b , A'laa Gharra, BSc a , Niroz Abu-Saleh, MSc b , Raneen Jeries, BSc a , Hossam Haick, PhD a, ⁎ , Zaid Abassi, PhD b,c a Department of Chemical Engineering and Russell Berrie Nanotechnology Institute, Technion–Israel Institute of Technology, Haifa, Israel b Department of Physiology and Biophysics, Faculty of Medicine, Technion–Israel Institute of Technology, Haifa, Israel c Research Unit, Rambam Health Campus, Hiafa, Israel Received 24 December 2013; accepted 11 June 2014 Abstract The outcomes of acute kidney injury (AKI) could be severe and even lethal, if not diagnosed in its early stages and treated appropriately. Blood and urine biomarkers, currently in use as indicators for kidney function, are either inaccurate in various cases or not timely. We report on dramatic changes in exhaled breath composition, associated with kidney dysfunction after ischemic insult in rat models. Gas chromatography linked mass spectrometry examination of breath samples indicated significant elevations in the concentration of three exhaled volatile organic compounds, two to six hours after AKI was surgically induced. Relying on these findings, we introduce an array of sensors, based on organic- layer capped gold nanoparticles, sensitive to odor changes. The ability of the array to detect AKI via breath testing was examined and scored a sensitivity of 96%, only one hour after disease induction. © 2014 Elsevier Inc. All rights reserved. Key words: Acute kidney injury; Detection; Gold nanoparticles; Breath test; Volatile organic compound Acute kidney injury (AKI) is a common clinical problem affecting about 2% to 7% of hospitalized patients and 5% to 10% of critically ill patients. 1,2 AKI occurs in response to a large number of insults that damage the nephron with adverse functional consequences such as metabolic acidosis, hyperkale- mia, abnormal body fluid balance and adverse effects on other organ systems. 3,4 Renal ischemia/reperfusion (I/R) injury is the leading cause for intrinsic AKI. 2–5 The mechanisms underlying renal I/R injury are complex, including, decreased oxygen delivery, depletion of cellular energy stores and accumulation of toxic metabolites. 2–4 However, reperfusion of ischemic tissue, being necessary as a reparative mechanism, has been shown to exacerbate acute ischemic injury through the generation of reactive oxygen and nitrogen species. 2–4,6,7 Despite the advances in medicine in general and critical care medicine in particular, AKI is still associated with high morbidity, causing an overall in-hospital mortality of approximately 20% and more than 50% in Intensive Care Unit (ICU) patients. 8,9 Urinalysis and urine volume are invaluable tools for the diagnosis of kidney dysfunction. However, both tools suffer from limited sensitivity and specificity. 10 Specifically, a reduction in urine output (oliguria) usually denotes more significant AKI than when urine output is maintained. However, preserved and even enhanced urine output is noted in AKI of various etiologies including I/R AKI. Sodium excretion suffers from a few shortcomings, which could be altered by rhabdomy- losis, radio contrast or sepsis-induced AKI. 10 Other criteria for diagnosis and classification of AKI are highly dependent on changes in serum creatinine (SCr). 1,2 However, rapid, major loss of kidney function could be associated with small changes in SCr levels, particularly in the early phases of AKI, so this could cause a delay in the diagnosis and intervention. 11 Biomarkers such as neutrophil gelatinase-associated lipocalin (NGAL) and kidney injury molecule-1 (KIM-1) were also suggested for AKI detection. 12–14 NGAL increased in urine very early after renal Nanomedicine: Nanotechnology, Biology, and Medicine xx (2014) xxx – xxx nanomedjournal.com Support: This study was supported by a NOFAR grant. Disclosure: No coauthor declares any conflict of interest. The authors acknowledge Dr. Yoav Broza and Dr. Ulrike Tisch (both from Technion-IIT, Haifa, Israel) for helpful discussion and script review. The authors also acknowledge Dr. Viki Kloper for her assistance in the preparation of the graphical images. ⁎ Corresponding author. E-mail address: [email protected] (H. Haick). http://dx.doi.org/10.1016/j.nano.2014.06.007 1549-9634/© 2014 Elsevier Inc. All rights reserved.
Transcript of Sensor arrays based on nanoparticles for early detection of kidney injury by breath samples
Nanomedicine: Nanotechnology, Biology, and Medicinexx (2014) xxx–xxx
nanomedjournal.com
Sensor arrays based on nanoparticles for early detection of kidney injuryby breath samples
Morad K. Nakhleh, MSca, Haitham Amal, MSca, Hoda Awad, BScb, A'laa Gharra, BSca,Niroz Abu-Saleh, MScb, Raneen Jeries, BSca, Hossam Haick, PhDa,⁎, Zaid Abassi, PhDb,c
aDepartment of Chemical Engineering and Russell Berrie Nanotechnology Institute, Technion–Israel Institute of Technology, Haifa, IsraelbDepartment of Physiology and Biophysics, Faculty of Medicine, Technion–Israel Institute of Technology, Haifa, Israel
cResearch Unit, Rambam Health Campus, Hiafa, Israel
Received 24 December 2013; accepted 11 June 2014
Abstract
The outcomes of acute kidney injury (AKI) could be severe and even lethal, if not diagnosed in its early stages and treated appropriately.Blood and urine biomarkers, currently in use as indicators for kidney function, are either inaccurate in various cases or not timely. We report ondramatic changes in exhaled breath composition, associated with kidney dysfunction after ischemic insult in rat models. Gas chromatographylinked mass spectrometry examination of breath samples indicated significant elevations in the concentration of three exhaled volatile organiccompounds, two to six hours after AKI was surgically induced. Relying on these findings, we introduce an array of sensors, based on organic-layer capped gold nanoparticles, sensitive to odor changes. The ability of the array to detect AKI via breath testing was examined and scored asensitivity of 96%, only one hour after disease induction.© 2014 Elsevier Inc. All rights reserved.
Key words: Acute kidney injury; Detection; Gold nanoparticles; Breath test; Volatile organic compound
Acute kidney injury (AKI) is a common clinical problemaffecting about 2% to 7% of hospitalized patients and 5% to 10%of critically ill patients.1,2 AKI occurs in response to a largenumber of insults that damage the nephron with adversefunctional consequences such as metabolic acidosis, hyperkale-mia, abnormal body fluid balance and adverse effects on otherorgan systems.3,4 Renal ischemia/reperfusion (I/R) injury is theleading cause for intrinsic AKI.2–5 The mechanisms underlyingrenal I/R injury are complex, including, decreased oxygendelivery, depletion of cellular energy stores and accumulation oftoxic metabolites.2–4 However, reperfusion of ischemic tissue,being necessary as a reparative mechanism, has been shown toexacerbate acute ischemic injury through the generation of
Support: This study was supported by a NOFAR grant.Disclosure: No coauthor declares any conflict of interest.The authors acknowledge Dr. Yoav Broza and Dr. Ulrike Tisch (both
from Technion-IIT, Haifa, Israel) for helpful discussion and script review.The authors also acknowledge Dr. Viki Kloper for her assistance in thepreparation of the graphical images.
⁎Corresponding author.E-mail address: [email protected] (H. Haick).
http://dx.doi.org/10.1016/j.nano.2014.06.0071549-9634/© 2014 Elsevier Inc. All rights reserved.
reactive oxygen and nitrogen species.2–4,6,7 Despite theadvances in medicine in general and critical care medicine inparticular, AKI is still associated with high morbidity, causing anoverall in-hospital mortality of approximately 20% and morethan 50% in Intensive Care Unit (ICU) patients.8,9
Urinalysis and urine volume are invaluable tools for thediagnosis of kidney dysfunction. However, both tools sufferfrom limited sensitivity and specificity.10 Specifically, areduction in urine output (oliguria) usually denotes moresignificant AKI than when urine output is maintained. However,preserved and even enhanced urine output is noted in AKI ofvarious etiologies including I/R AKI. Sodium excretion suffersfrom a few shortcomings, which could be altered by rhabdomy-losis, radio contrast or sepsis-induced AKI.10 Other criteria fordiagnosis and classification of AKI are highly dependent onchanges in serum creatinine (SCr).1,2 However, rapid, major lossof kidney function could be associated with small changes in SCrlevels, particularly in the early phases of AKI, so this could causea delay in the diagnosis and intervention.11 Biomarkers such asneutrophil gelatinase-associated lipocalin (NGAL) and kidneyinjury molecule-1 (KIM-1) were also suggested for AKIdetection.12–14 NGAL increased in urine very early after renal
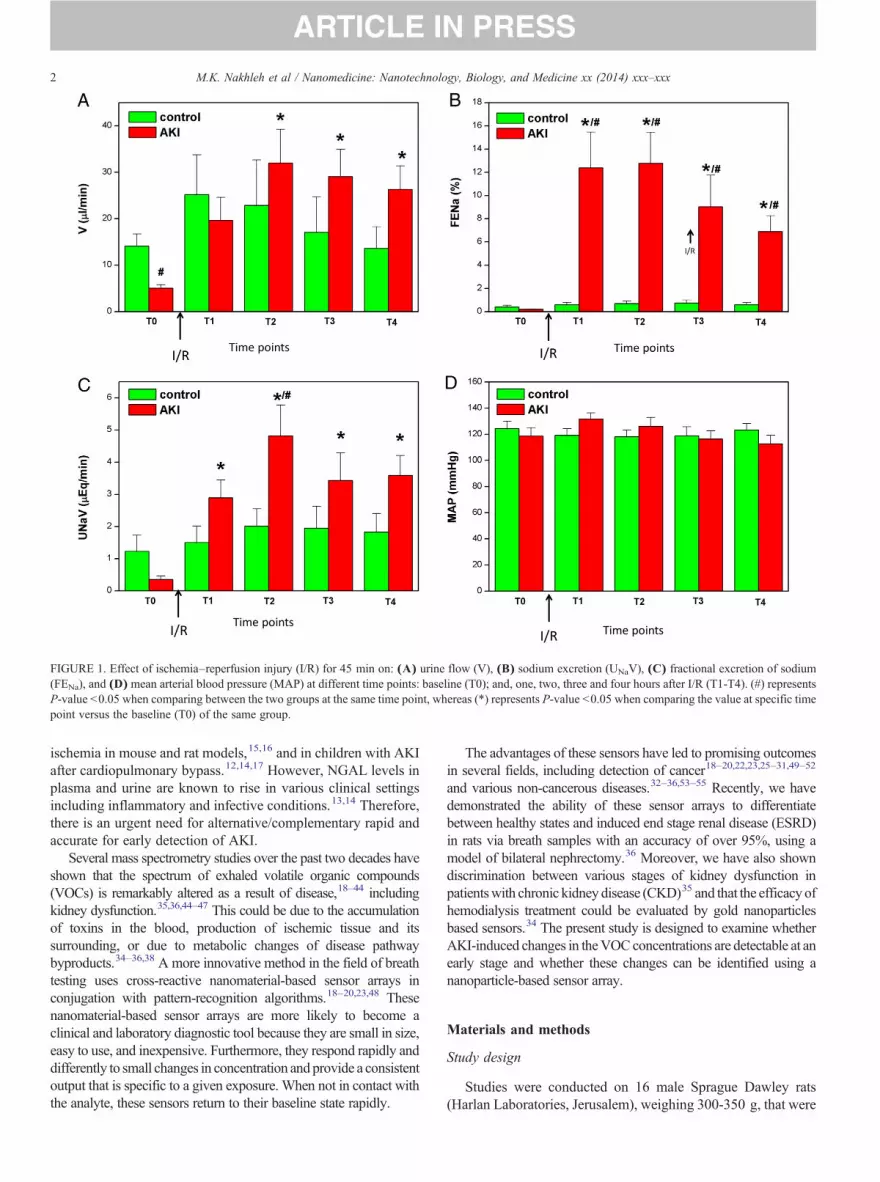
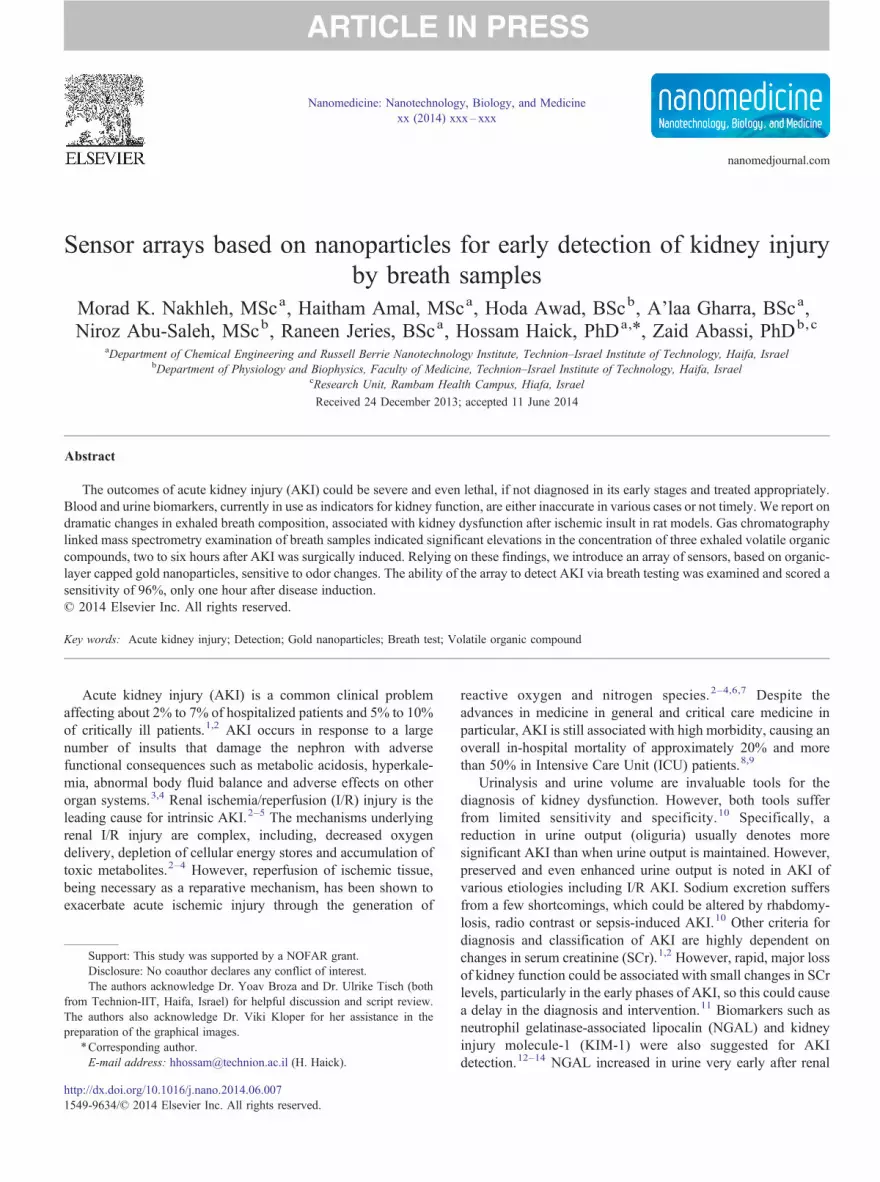
FIGURE 1. Effect of ischemia–reperfusion injury (I/R) for 45 min on: (A) urine flow (V), (B) sodium excretion (UNaV), (C) fractional excretion of sodium(FENa), and (D) mean arterial blood pressure (MAP) at different time points: baseline (T0); and, one, two, three and four hours after I/R (T1-T4). (#) representsP-value b0.05 when comparing between the two groups at the same time point, whereas (*) represents P-value b0.05 when comparing the value at specific timepoint versus the baseline (T0) of the same group.
2 M.K. Nakhleh et al / Nanomedicine: Nanotechnology, Biology, and Medicine xx (2014) xxx–xxx
ischemia in mouse and rat models,15,16 and in children with AKIafter cardiopulmonary bypass.12,14,17 However, NGAL levels inplasma and urine are known to rise in various clinical settingsincluding inflammatory and infective conditions.13,14 Therefore,there is an urgent need for alternative/complementary rapid andaccurate for early detection of AKI.
Several mass spectrometry studies over the past two decades haveshown that the spectrum of exhaled volatile organic compounds(VOCs) is remarkably altered as a result of disease,18–44 includingkidney dysfunction.35,36,44–47 This could be due to the accumulationof toxins in the blood, production of ischemic tissue and itssurrounding, or due to metabolic changes of disease pathwaybyproducts.34–36,38 A more innovative method in the field of breathtesting uses cross-reactive nanomaterial-based sensor arrays inconjugation with pattern-recognition algorithms.18–20,23,48 Thesenanomaterial-based sensor arrays are more likely to become aclinical and laboratory diagnostic tool because they are small in size,easy to use, and inexpensive. Furthermore, they respond rapidly anddifferently to small changes in concentration and provide a consistentoutput that is specific to a given exposure. When not in contact withthe analyte, these sensors return to their baseline state rapidly.
The advantages of these sensors have led to promising outcomesin several fields, including detection of cancer18–20,22,23,25–31,49–52
and various non-cancerous diseases.32–36,53–55 Recently, we havedemonstrated the ability of these sensor arrays to differentiatebetween healthy states and induced end stage renal disease (ESRD)in rats via breath samples with an accuracy of over 95%, using amodel of bilateral nephrectomy.36 Moreover, we have also showndiscrimination between various stages of kidney dysfunction inpatientswith chronic kidney disease (CKD)35 and that the efficacy ofhemodialysis treatment could be evaluated by gold nanoparticlesbased sensors.34 The present study is designed to examine whetherAKI-induced changes in theVOCconcentrations are detectable at anearly stage and whether these changes can be identified using ananoparticle-based sensor array.
Materials and methods
Study design
Studies were conducted on 16 male Sprague Dawley rats(Harlan Laboratories, Jerusalem), weighing 300-350 g, that were

FIGURE 2. Effect of ischemia-reperfusion injury (I/R) on: (A) glomerularfiltration rate (GFR) and (B) urine NGAL levels at the different time points:baseline (T0); and, one, two, three and four hours after I/R (T1-T4). (#)represents P-value b0.05 when comparing between the two groups at thesame time point, whereas (*) represents P-value b0.05 when comparing thevalue at specific time point versus the baseline (T0) of the same group.
FIGURE 3. Effect of I/R for 45 min on: (A) serumNGAL, (B) serum creatinine.(#) representsP-valueb0.05when comparing between the two groups at the sametime point, whereas (*) represents P-value b0.05 when comparing the value atspecific time point versus the baseline (T0) of the same group.
3M.K. Nakhleh et al / Nanomedicine: Nanotechnology, Biology, and Medicine xx (2014) xxx–xxx
maintained on standard rat chow (0.5% NaCl) and water adlibitum. The investigation was conducted according to theguidelines of the Animal Use and Care Committee, Technion–Israel Institute of Technology. AKI was surgically induced in 8of the animals, while the remaining 8 animals served as a shamoperated control group.
AKI induction, blood and urine sampling
All animals (n = 16) were housed under standardized condi-tions for 2–3 days. Following an overnight fast, the animals wereanaesthetized with inactin anesthesia (100 mg/kg, IP) and placedon a controlled heating (thermo-regulated) table (37 °C). Polyeth-ylene tubes (PE50) were jugular vein for blood sampling andinfusion of 0.9% normal saline (0.9% NaCl) at a 1.5 ml/h rate.After that, an upper abdominal midline incision was made andrenal blood vessels were isolated bilaterally. The area was coveredwith saline-soaked gauze to minimize dehydration. Baseline (T0)breath and blood samples were collected at this stage. Then, AKIwas surgically induced in only 8 of the animals. In this surgery, weremoved the right kidney (nephrectomy) and immediately afterthat, we occluded the left renal artery, occluded for 45 min. At the
end of the 45-min period, we allowed a reperfusion for 15 min(so called T1).
Breath and blood samples were obtained at T0 and T1 as wellas 2 h, 4 h, and 6 h after the nephrectomy process (denoted asT2, T4 and T6, respectively). Rats that underwent the sameprocedure with the exception of right nephrectomy and left renalischemia served as controls. Two rats (one AKI and the othersham operated) were examined per day. The experiments wereconducted over a period of 4 weeks. Blood samples werecentrifuged and the separated serum was stored at −20 °C.Serum samples were analyzed for NGAL and creatinine.
In an additional group of animals, a catheter (PE50) wasinserted into the bladder for urine collection; saline was infusedat a rate of 1% of body weight per hour (~3.0 ml/h) throughoutthe experiment. Urine samples were collected at T0, T1, T2, andT4. Blood and urine were chemically analyzed in order toevaluate kidney function using conventional biomarkers such asInulin clearance, urine NGAL, urine flow and sodium excretion.For further details regarding the sampling and analysisprocedure, see Supplementary Materials (Sections 1.1. and 1.2.).
Breath collection
Tracheo-tubes were inserted into all rats after anesthesia. Acustom-madeairwaysystemwasused(SupplementaryFigureS1-A),
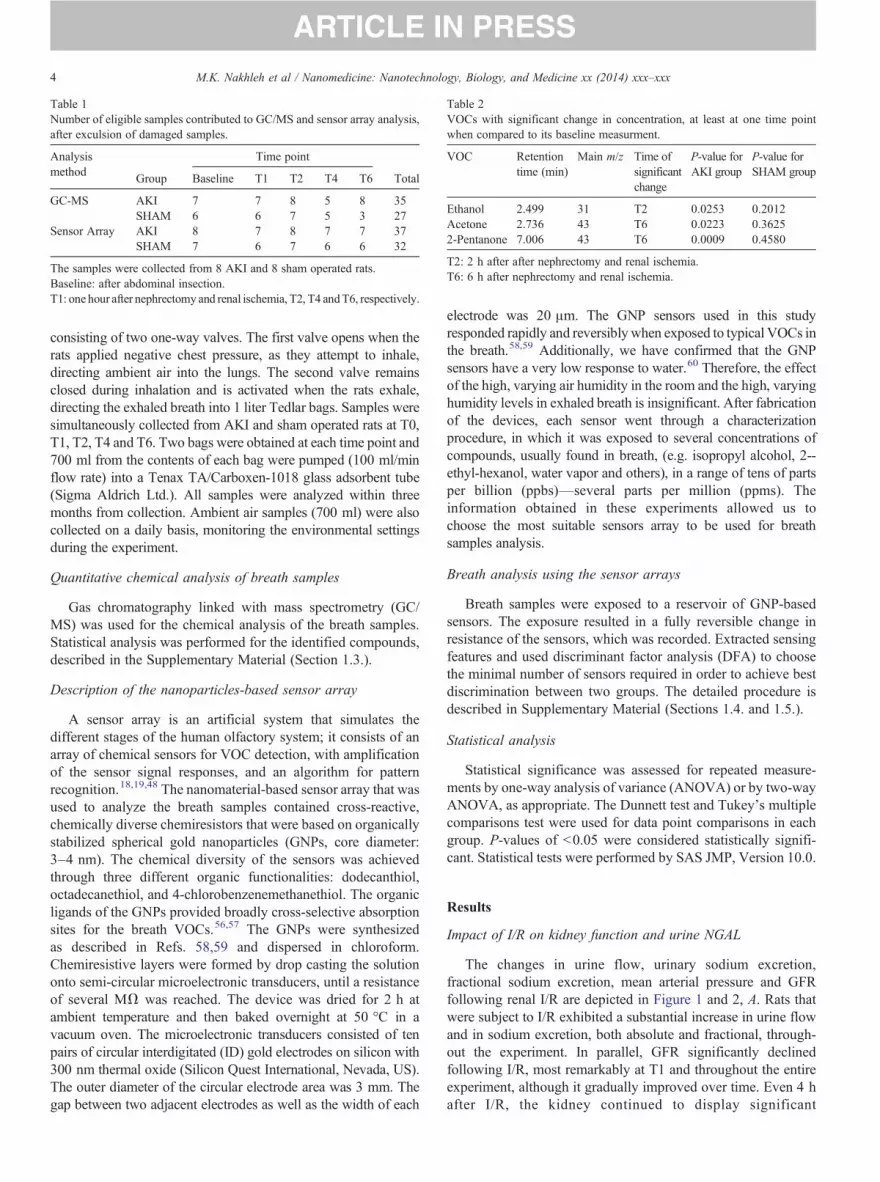
Table 1Number of eligible samples contributed to GC/MS and sensor array analysis,after exculsion of damaged samples.
Analysismethod
Time point
Group Baseline T1 T2 T4 T6 Total
GC-MS AKI 7 7 8 5 8 35SHAM 6 6 7 5 3 27
Sensor Array AKI 8 7 8 7 7 37SHAM 7 6 7 6 6 32
The samples were collected from 8 AKI and 8 sham operated rats.Baseline: after abdominal insection.T1: one hour after nephrectomy and renal ischemia, T2, T4 andT6, respectively.
Table 2VOCs with significant change in concentration, at least at one time pointwhen compared to its baseline measurment.
VOC Retentiontime (min)
Main m/z Time ofsignificantchange
P-value forAKI group
P-value forSHAM group
Ethanol 2.499 31 T2 0.0253 0.2012Acetone 2.736 43 T6 0.0223 0.36252-Pentanone 7.006 43 T6 0.0009 0.4580
T2: 2 h after after nephrectomy and renal ischemia.T6: 6 h after nephrectomy and renal ischemia.
4 M.K. Nakhleh et al / Nanomedicine: Nanotechnology, Biology, and Medicine xx (2014) xxx–xxx
consisting of two one-way valves. The first valve opens when therats applied negative chest pressure, as they attempt to inhale,directing ambient air into the lungs. The second valve remainsclosed during inhalation and is activated when the rats exhale,directing the exhaled breath into 1 liter Tedlar bags. Samples weresimultaneously collected from AKI and sham operated rats at T0,T1, T2, T4 and T6. Two bags were obtained at each time point and700 ml from the contents of each bag were pumped (100 ml/minflow rate) into a Tenax TA/Carboxen-1018 glass adsorbent tube(Sigma Aldrich Ltd.). All samples were analyzed within threemonths from collection. Ambient air samples (700 ml) were alsocollected on a daily basis, monitoring the environmental settingsduring the experiment.
Quantitative chemical analysis of breath samples
Gas chromatography linked with mass spectrometry (GC/MS) was used for the chemical analysis of the breath samples.Statistical analysis was performed for the identified compounds,described in the Supplementary Material (Section 1.3.).
Description of the nanoparticles-based sensor array
A sensor array is an artificial system that simulates thedifferent stages of the human olfactory system; it consists of anarray of chemical sensors for VOC detection, with amplificationof the sensor signal responses, and an algorithm for patternrecognition.18,19,48 The nanomaterial-based sensor array that wasused to analyze the breath samples contained cross-reactive,chemically diverse chemiresistors that were based on organicallystabilized spherical gold nanoparticles (GNPs, core diameter:3–4 nm). The chemical diversity of the sensors was achievedthrough three different organic functionalities: dodecanthiol,octadecanethiol, and 4-chlorobenzenemethanethiol. The organicligands of the GNPs provided broadly cross-selective absorptionsites for the breath VOCs.56,57 The GNPs were synthesizedas described in Refs. 58,59 and dispersed in chloroform.Chemiresistive layers were formed by drop casting the solutiononto semi-circular microelectronic transducers, until a resistanceof several MΩ was reached. The device was dried for 2 h atambient temperature and then baked overnight at 50 °C in avacuum oven. The microelectronic transducers consisted of tenpairs of circular interdigitated (ID) gold electrodes on silicon with300 nm thermal oxide (Silicon Quest International, Nevada, US).The outer diameter of the circular electrode area was 3 mm. Thegap between two adjacent electrodes as well as the width of each
electrode was 20 μm. The GNP sensors used in this studyresponded rapidly and reversibly when exposed to typical VOCs inthe breath.58,59 Additionally, we have confirmed that the GNPsensors have a very low response to water.60 Therefore, the effectof the high, varying air humidity in the room and the high, varyinghumidity levels in exhaled breath is insignificant. After fabricationof the devices, each sensor went through a characterizationprocedure, in which it was exposed to several concentrations ofcompounds, usually found in breath, (e.g. isopropyl alcohol, 2--ethyl-hexanol, water vapor and others), in a range of tens of partsper billion (ppbs)—several parts per million (ppms). Theinformation obtained in these experiments allowed us tochoose the most suitable sensors array to be used for breathsamples analysis.
Breath analysis using the sensor arrays
Breath samples were exposed to a reservoir of GNP-basedsensors. The exposure resulted in a fully reversible change inresistance of the sensors, which was recorded. Extracted sensingfeatures and used discriminant factor analysis (DFA) to choosethe minimal number of sensors required in order to achieve bestdiscrimination between two groups. The detailed procedure isdescribed in Supplementary Material (Sections 1.4. and 1.5.).
Statistical analysis
Statistical significance was assessed for repeated measure-ments by one-way analysis of variance (ANOVA) or by two-wayANOVA, as appropriate. The Dunnett test and Tukey's multiplecomparisons test were used for data point comparisons in eachgroup. P-values of b0.05 were considered statistically signifi-cant. Statistical tests were performed by SAS JMP, Version 10.0.
Results
Impact of I/R on kidney function and urine NGAL
The changes in urine flow, urinary sodium excretion,fractional sodium excretion, mean arterial pressure and GFRfollowing renal I/R are depicted in Figure 1 and 2, A. Rats thatwere subject to I/R exhibited a substantial increase in urine flowand in sodium excretion, both absolute and fractional, through-out the experiment. In parallel, GFR significantly declinedfollowing I/R, most remarkably at T1 and throughout the entireexperiment, although it gradually improved over time. Even 4 hafter I/R, the kidney continued to display significant
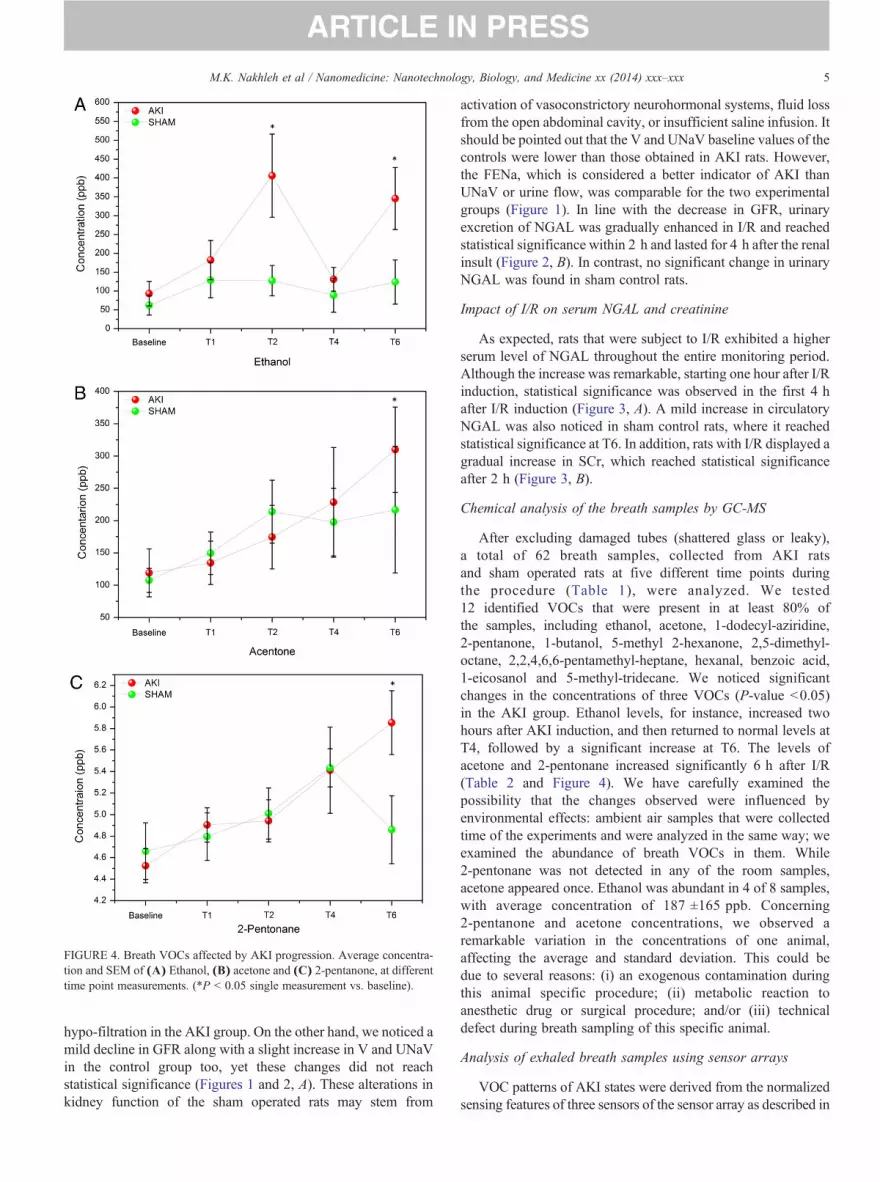
FIGURE 4. Breath VOCs affected by AKI progression. Average concentra-tion and SEM of (A) Ethanol, (B) acetone and (C) 2-pentanone, at differenttime point measurements. (*P b 0.05 single measurement vs. baseline).
5M.K. Nakhleh et al / Nanomedicine: Nanotechnology, Biology, and Medicine xx (2014) xxx–xxx
hypo-filtration in the AKI group. On the other hand, we noticed amild decline in GFR along with a slight increase in V and UNaVin the control group too, yet these changes did not reachstatistical significance (Figures 1 and 2, A). These alterations inkidney function of the sham operated rats may stem from
activation of vasoconstrictory neurohormonal systems, fluid lossfrom the open abdominal cavity, or insufficient saline infusion. Itshould be pointed out that the V and UNaV baseline values of thecontrols were lower than those obtained in AKI rats. However,the FENa, which is considered a better indicator of AKI thanUNaV or urine flow, was comparable for the two experimentalgroups (Figure 1). In line with the decrease in GFR, urinaryexcretion of NGAL was gradually enhanced in I/R and reachedstatistical significance within 2 h and lasted for 4 h after the renalinsult (Figure 2, B). In contrast, no significant change in urinaryNGAL was found in sham control rats.
Impact of I/R on serum NGAL and creatinine
As expected, rats that were subject to I/R exhibited a higherserum level of NGAL throughout the entire monitoring period.Although the increase was remarkable, starting one hour after I/Rinduction, statistical significance was observed in the first 4 hafter I/R induction (Figure 3, A). A mild increase in circulatoryNGAL was also noticed in sham control rats, where it reachedstatistical significance at T6. In addition, rats with I/R displayed agradual increase in SCr, which reached statistical significanceafter 2 h (Figure 3, B).
Chemical analysis of the breath samples by GC-MS
After excluding damaged tubes (shattered glass or leaky),a total of 62 breath samples, collected from AKI ratsand sham operated rats at five different time points duringthe procedure (Table 1), were analyzed. We tested12 identified VOCs that were present in at least 80% ofthe samples, including ethanol, acetone, 1-dodecyl-aziridine,2-pentanone, 1-butanol, 5-methyl 2-hexanone, 2,5-dimethyl-octane, 2,2,4,6,6-pentamethyl-heptane, hexanal, benzoic acid,1-eicosanol and 5-methyl-tridecane. We noticed significantchanges in the concentrations of three VOCs (P-value b0.05)in the AKI group. Ethanol levels, for instance, increased twohours after AKI induction, and then returned to normal levels atT4, followed by a significant increase at T6. The levels ofacetone and 2-pentonane increased significantly 6 h after I/R(Table 2 and Figure 4). We have carefully examined thepossibility that the changes observed were influenced byenvironmental effects: ambient air samples that were collectedtime of the experiments and were analyzed in the same way; weexamined the abundance of breath VOCs in them. While2-pentonane was not detected in any of the room samples,acetone appeared once. Ethanol was abundant in 4 of 8 samples,with average concentration of 187 ±165 ppb. Concerning2-pentanone and acetone concentrations, we observed aremarkable variation in the concentrations of one animal,affecting the average and standard deviation. This could bedue to several reasons: (i) an exogenous contamination duringthis animal specific procedure; (ii) metabolic reaction toanesthetic drug or surgical procedure; and/or (iii) technicaldefect during breath sampling of this specific animal.
Analysis of exhaled breath samples using sensor arrays
VOC patterns of AKI states were derived from the normalizedsensing features of three sensors of the sensor array as described in
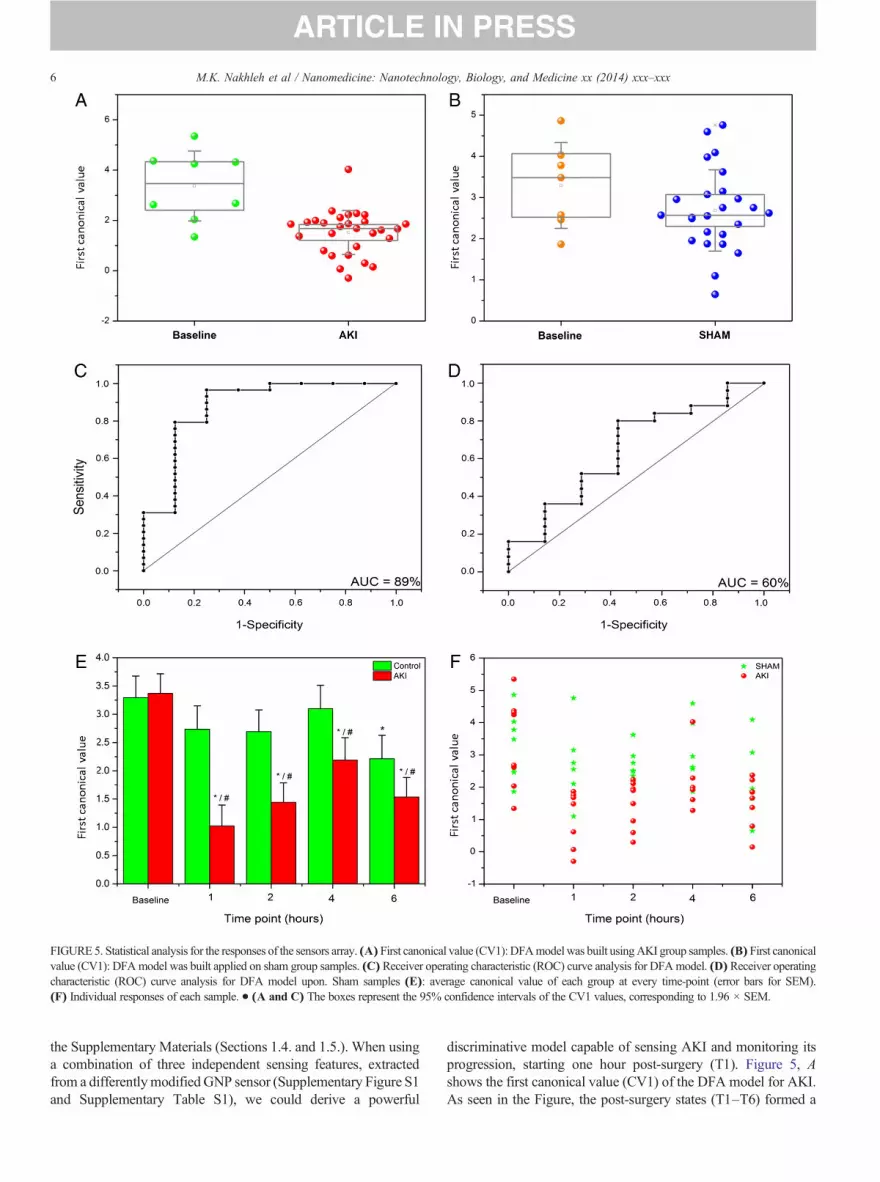
FIGURE5. Statistical analysis for the responses of the sensors array. (A) First canonical value (CV1): DFAmodelwas built usingAKI group samples. (B) First canonicalvalue (CV1): DFAmodel was built applied on sham group samples. (C) Receiver operating characteristic (ROC) curve analysis for DFAmodel. (D)Receiver operatingcharacteristic (ROC) curve analysis for DFA model upon. Sham samples (E): average canonical value of each group at every time-point (error bars for SEM).(F) Individual responses of each sample. • (A and C) The boxes represent the 95% confidence intervals of the CV1 values, corresponding to 1.96 × SEM.
6 M.K. Nakhleh et al / Nanomedicine: Nanotechnology, Biology, and Medicine xx (2014) xxx–xxx
the Supplementary Materials (Sections 1.4. and 1.5.). When usinga combination of three independent sensing features, extractedfrom a differentlymodified GNP sensor (Supplementary Figure S1and Supplementary Table S1), we could derive a powerful
discriminative model capable of sensing AKI and monitoring itsprogression, starting one hour post-surgery (T1). Figure 5, Ashows the first canonical value (CV1) of the DFA model for AKI.As seen in the Figure, the post-surgery states (T1–T6) formed a
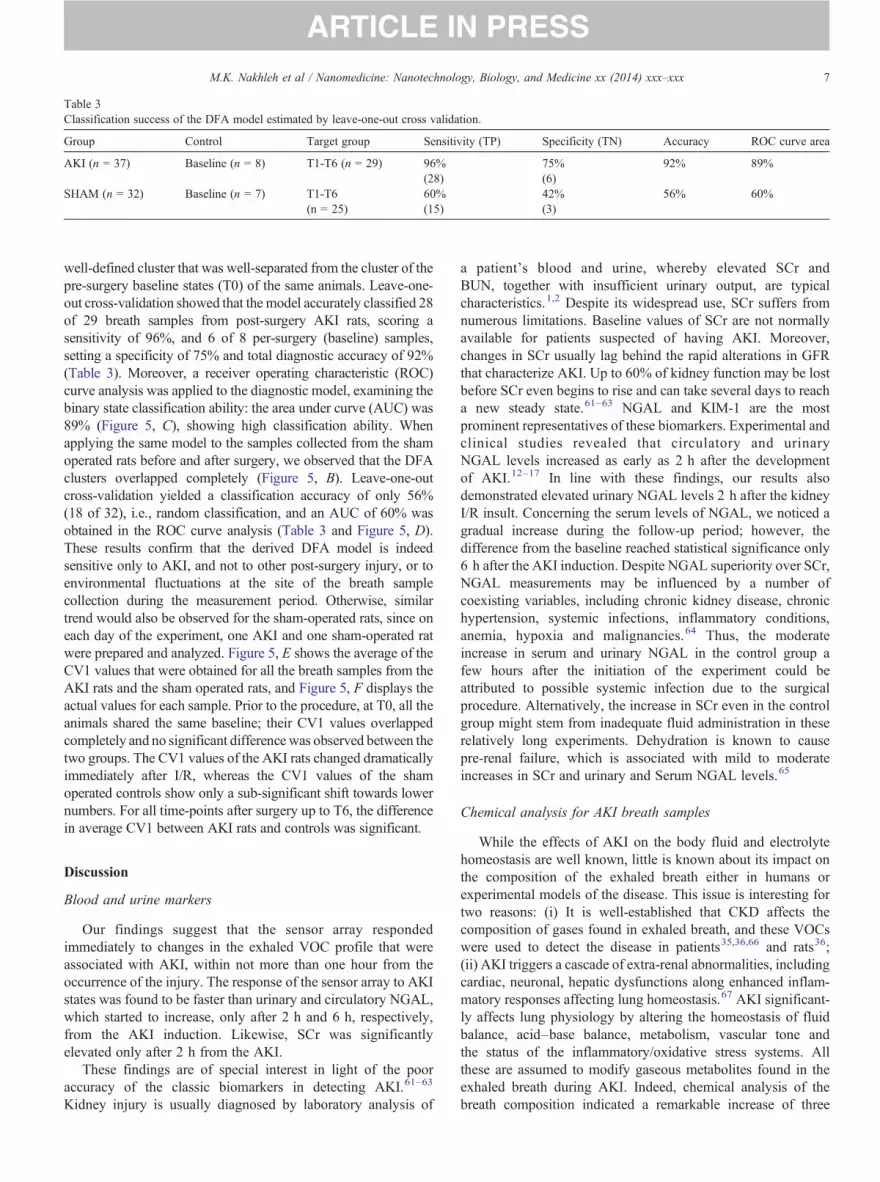
Table 3Classification success of the DFA model estimated by leave-one-out cross validation.
Group Control Target group Sensitivity (TP) Specificity (TN) Accuracy ROC curve area
AKI (n = 37) Baseline (n = 8) T1-T6 (n = 29) 96% 75% 92% 89%(28) (6)
SHAM (n = 32) Baseline (n = 7) T1-T6 60% 42% 56% 60%(n = 25) (15) (3)
7M.K. Nakhleh et al / Nanomedicine: Nanotechnology, Biology, and Medicine xx (2014) xxx–xxx
well-defined cluster that was well-separated from the cluster of thepre-surgery baseline states (T0) of the same animals. Leave-one-out cross-validation showed that the model accurately classified 28of 29 breath samples from post-surgery AKI rats, scoring asensitivity of 96%, and 6 of 8 per-surgery (baseline) samples,setting a specificity of 75% and total diagnostic accuracy of 92%(Table 3). Moreover, a receiver operating characteristic (ROC)curve analysis was applied to the diagnostic model, examining thebinary state classification ability: the area under curve (AUC) was89% (Figure 5, C), showing high classification ability. Whenapplying the same model to the samples collected from the shamoperated rats before and after surgery, we observed that the DFAclusters overlapped completely (Figure 5, B). Leave-one-outcross-validation yielded a classification accuracy of only 56%(18 of 32), i.e., random classification, and an AUC of 60% wasobtained in the ROC curve analysis (Table 3 and Figure 5, D).These results confirm that the derived DFA model is indeedsensitive only to AKI, and not to other post-surgery injury, or toenvironmental fluctuations at the site of the breath samplecollection during the measurement period. Otherwise, similartrend would also be observed for the sham-operated rats, since oneach day of the experiment, one AKI and one sham-operated ratwere prepared and analyzed. Figure 5, E shows the average of theCV1 values that were obtained for all the breath samples from theAKI rats and the sham operated rats, and Figure 5, F displays theactual values for each sample. Prior to the procedure, at T0, all theanimals shared the same baseline; their CV1 values overlappedcompletely and no significant difference was observed between thetwo groups. The CV1 values of the AKI rats changed dramaticallyimmediately after I/R, whereas the CV1 values of the shamoperated controls show only a sub-significant shift towards lowernumbers. For all time-points after surgery up to T6, the differencein average CV1 between AKI rats and controls was significant.
Discussion
Blood and urine markers
Our findings suggest that the sensor array respondedimmediately to changes in the exhaled VOC profile that wereassociated with AKI, within not more than one hour from theoccurrence of the injury. The response of the sensor array to AKIstates was found to be faster than urinary and circulatory NGAL,which started to increase, only after 2 h and 6 h, respectively,from the AKI induction. Likewise, SCr was significantlyelevated only after 2 h from the AKI.
These findings are of special interest in light of the pooraccuracy of the classic biomarkers in detecting AKI.61–63
Kidney injury is usually diagnosed by laboratory analysis of
a patient's blood and urine, whereby elevated SCr andBUN, together with insufficient urinary output, are typicalcharacteristics.1,2 Despite its widespread use, SCr suffers fromnumerous limitations. Baseline values of SCr are not normallyavailable for patients suspected of having AKI. Moreover,changes in SCr usually lag behind the rapid alterations in GFRthat characterize AKI. Up to 60% of kidney function may be lostbefore SCr even begins to rise and can take several days to reacha new steady state.61–63 NGAL and KIM-1 are the mostprominent representatives of these biomarkers. Experimental andclinical studies revealed that circulatory and urinaryNGAL levels increased as early as 2 h after the developmentof AKI.12–17 In line with these findings, our results alsodemonstrated elevated urinary NGAL levels 2 h after the kidneyI/R insult. Concerning the serum levels of NGAL, we noticed agradual increase during the follow-up period; however, thedifference from the baseline reached statistical significance only6 h after the AKI induction. Despite NGAL superiority over SCr,NGAL measurements may be influenced by a number ofcoexisting variables, including chronic kidney disease, chronichypertension, systemic infections, inflammatory conditions,anemia, hypoxia and malignancies.64 Thus, the moderateincrease in serum and urinary NGAL in the control group afew hours after the initiation of the experiment could beattributed to possible systemic infection due to the surgicalprocedure. Alternatively, the increase in SCr even in the controlgroup might stem from inadequate fluid administration in theserelatively long experiments. Dehydration is known to causepre-renal failure, which is associated with mild to moderateincreases in SCr and urinary and Serum NGAL levels.65
Chemical analysis for AKI breath samples
While the effects of AKI on the body fluid and electrolytehomeostasis are well known, little is known about its impact onthe composition of the exhaled breath either in humans orexperimental models of the disease. This issue is interesting fortwo reasons: (i) It is well-established that CKD affects thecomposition of gases found in exhaled breath, and these VOCswere used to detect the disease in patients35,36,66 and rats36;(ii) AKI triggers a cascade of extra-renal abnormalities, includingcardiac, neuronal, hepatic dysfunctions along enhanced inflam-matory responses affecting lung homeostasis.67 AKI significant-ly affects lung physiology by altering the homeostasis of fluidbalance, acid–base balance, metabolism, vascular tone andthe status of the inflammatory/oxidative stress systems. Allthese are assumed to modify gaseous metabolites found in theexhaled breath during AKI. Indeed, chemical analysis of thebreath composition indicated a remarkable increase of three

8 M.K. Nakhleh et al / Nanomedicine: Nanotechnology, Biology, and Medicine xx (2014) xxx–xxx
oxygen-containing compounds; acetone, 2-pentanone and etha-nol. Aldehydes, in general, and ethanol, in particular, mightoriginate by alcohol metabolism in the body. However, in ourcase, it is more likely to be produced by reduction ofhydroperoxide by cytochrome p-450, as secondary product oflipid peroxidation process in the kidney.21 As mentioned earlier,we have used an ischemic model to induce acute tubularnecrosis–ischemic AKI. Specifically, we blocked blood supplyfor 45 min to the remnant kidney, after removing the first one.During this period, cells suffer from a lack of oxygen andnutrients. However, with circulation restoration, we find anexcessive production of reactive oxygen species by inflamma-tory cells, stealing electrons from the lipids in cell membrane,damaging the surrounding tissue, all as part of the reperfusioninjury process.21,68
The ketones (acetone and 2-pentanoneare) are known to beelevated in ketonemic patients, for example, in the cases ofprolonged fasting or uncontrolled diabetes, in which an extremelipolysis process occurs. Similar conditions could be found insevere and rapid AKI, due to an imbalance of blood glucosehomeostasis. Moreover, it is well known that ketone-formationcould be secondary to lipid peroxidation and fatty acidsoxidation.21,68 However, further in-vitro studies are required inorder to determine the origin of these compounds. Moreover,blood glucose and insulin levels should also be monitored inorder to examine ketonomic effect of AKI. Although the ethanollevels change two hours after AKI, we don't suggest it as anoptimal biomarker for early detection of AKI, mainly becausethe multiple possible sources of ethanol, such as alcoholconsumption or production by GI tract bacteria.69 Consistentwith previous publications in the field of kidney failure, ethanol,acetone and 2-pentanone, were found in both breath and fecalsamples..38,40,66 Ethanol was found to be lower in both breathand feces of chronic kidney disease inducted in the rat model.Acetone was lower in the feces but higher in the breath of CKDrats when compared to control group. It was also reported that2-pentanone levels were higher in the breath of CKD rats.66
Sensor array for AKI detection
As indicated earlier in the introduction the GC/MS analysishas several disadvantages, including the complicity of operation,the high cost and the need of sample treatment prior to analysiswhich might insert a bias to it or cause a data loss.24Thedescribed sensor array constitutes a more robust and moresensitive detection system than GC/MS, mainly because thesensors monitor the collective changes in the overall breath-VOCcomposition, rather than examining each compounds' concen-tration. Moreover, it could be used for online point-of-careanalysis, which would be helpful especially among mechanicallyventilated patients.
Several types42,70,71 of chemical sensors were tested aspotential tools to monitor kidney function, and some scoredrelatively high correlation to GFR for accuracy of kidneydysfunction detection. However, some types require hightemperatures (N200 °C) in order to analyze the samples71;others use blood samples, which require invasive procedures andcould be hazardous.70 In few instances sensors39,43 were used for
the selective sensing of breath ammonia levels. Some of themshowed correlation between blood and breath ammonia levels;moreover, breath ammonia was significantly decreased afterhemodialysis.39 However, ammonia is not a stable biomarker forkidney diseases since ammonia levels are easily altered and notspecific to kidney disease. Ammoni was also found elevated inHelicobacter pylori infection,43 encephalopathy,43 and pulmo-nary artery hypertension.37 In contrast to these studies, ourapproach relies on the detection of a VOC mixtures for detectionof AKI conditions, thus decreasing the chances to find similarpatterns in other confounding diseases and/or environmentalconditions.
At present, physicians rely on ranges of healthy population asthe normal baseline. The same concept could be applied to oursystem, in which we establish a database of breath samples fromnumerous healthy subjects as a baseline reference for futurecomparisons when AKI is suspected. As a result, we are able totrack their behavior with regard to VOCs and normalize theresults in a way that prevents baseline and response drift. Themethod could also be translated to real world clinical conditionsby simple daily exposure of the sensors to specific mixtureof compounds.
Such an array of three sensors could be easily adapted as areusable kit for fast testing. The patient would breathe into anopening at one end of the device, after removing a sterile seal.Mounted on an electronic chip for signal readout and datastorage, the sensors' readout and the software for the dataanalysis could be loaded to any computer, and the data could beanalyzed on-site within few minutes.
Conclusions
The results of the current study show that AKI ischaracterized by very rapid metabolic alterations in bloodstream, as expressed in the concentrations of VOCs present inexhaled air, just one hour after disease induction. We present asimple, non-invasive breath test with a nanoparticle-based sensorarray that is capable of early detection of AKI. The sensor arraycan be used as a complementary tool for early diagnosis andmonitoring AKI progression. Further studies are needed toexplore whether this approach is reliable in early detection ofclinical AKI.
Appendix A. Supplementary data
Supplementary data to this article can be found online athttp://dx.doi.org/10.1016/j.nano.2014.06.007.
References
1. Lameire N, Hoste E. Reflections on the definition, classification, anddiagnostic evaluation of acute renal failure. Curr Opin Crit Care2004;10:468-75.
2. Schrier R, et al. Acute renal failure: definitions, diagnosis, pathogenesis,and therapy. J Clin Invest 2004;114:5-14.
3. Bonventre J, Yang L. Cellular pathophysiology of ischemic acute kidneyinjury. J Clin Invest 2011;121:4210-21.

9M.K. Nakhleh et al / Nanomedicine: Nanotechnology, Biology, and Medicine xx (2014) xxx–xxx
4. Sheridan A, Bonventre J. Pathophysiology of ischemic acute renalfailure. Contrib Nephrol 2001;132:7-21.
5. Lameire N, Van Biesen W, Vanholder R. Acute renal failure. Lancet2005;365:417-30.
6. Agarwal A, Nick H. Renal response to tissue injury: lessons from hemeoxygenase-1 gene ablation and expression. J Am Soc Nephrol2000;11:965-73.
7. Chatterjee P. Novel pharmacological approaches to the treatment ofrenal ischemia–reperfusion injury: a comprehensive review. NaunynSchmiedebergs Arch Pharmacol 2007;376:1-43.
8. Chertow G, et al. Acute kidney injury, mortality, length of stay, and costsin hospitalized patients. J Am Soc Nephrol 2005;16:3365-70.
9. Li P, Burdmann E, Mehta R. Acute kidney injury: global health alert.Kidney Int 2013;83:372-6.
10. Harrison's Principles of Internal Medicine. 18th ed: The McGraw-HillCompanies ; 2012 [Chapter 79: acute kidney injury].
11. Moran S, Myers B. Course of acute renal failure studied by a model ofcreatinine kinetics. Kidney Int 1985;27:928-37.
12. de Geus H, Betjes M, Bakker J. Biomarkers for the prediction of acutekidney injury: a narrative review on current status and future challenges.Clin Kidney J 2012;5:102-8.
13. Devarajan P. Review: neutrophil gelatinase-associated lipocalin: atroponin-like biomarker for human acute kidney injury. Nephrology2010;15:419-28.
14. Vaidya V, Ferguson M, Bonventre J. Biomarkers of acute kidney injury.Annu Rev Pharmacol Toxicol 2008;48:463-93.
15. Mishra J, et al. Identification of neutrophil gelatinase-associatedlipocalin as a novel early urinary biomarker for ischemic renal injury.J Am Soc Nephrol 2003;14:2534-43.
16. Mishra J, et al. Neutrophil gelatinase-associated lipocalin (NGAL) as abiomarker for acute renal injury after cardiac surgery. Lancet2005;365:1231-8.
17. Singer E, et al. Neutrophil gelatinase-associated lipocalin: pathophys-iology and clinical applications. Acta Physiol 2013;207:663-72.
18. Haick H, et al. Assessment, origin, and implementation of breath volatilecancer markers. Chem Soc Rev 2014;43:1423-49.
19. Konvalina G, Haick H. Sensors for breath testing: from nanomaterials tocomprehensive disease detection. Acc Chem Res 2014;47:66-76.
20. Broza Y, Haick H. Nanomaterial-based sensors for detection ofdisease by volatile organic compounds. Nanomedicine (Future Med)2013;8:785-806.
21. Hakim M, et al. Volatile organic compounds of lung cancer and possiblebiochemical pathways. Chem Rev 2012;112:5949-66.
22. Tisch U, et al. Volatile organic compounds in the exhaled breathas biomarkers for the early detection and screening of lung cancer.CML - Lung Cancer 2012;5:107-17.
23. Tisch U, Haick H. Arrays of chemisensitive monolayer-cappedmetallic nanoparticles for diagnostic breath testing. Rev Chem Eng2011;26:171-9.
24. Amann A, et al. Chapter 7: methodological issues of sample collection andanalysis of exhaled breath. Eur Respir Soc Monogr 2010;49:96-114.
25. Xu ZQ, et al. A nanomaterial-based breath test for distinguishing gastriccancer from benign gastric conditions. Br J Cancer 2013;108:941-50.
26. Peled N, et al. Non-invasive breath analysis of pulmonary nodules.J Thorac Oncol 2012;7:1528-33.
27. BrozaY, et al. A nanomaterial-based breath test for short-term follow-up afterlung tumor resection. Nanomedicine (New York, NY, US) 2013;9:15-21.
28. HakimM, et al. Diagnosis of head-and-neck cancer from exhaled breath.Br J Cancer 2011;104:1649-55.
29. Leja ML, Haick H. Breath testing: the future for digestive cancerdetection. Expert Rev Gastroenterol Hepatol 2013;7:389-91.
30. Peng G, et al. Detection of lung, breast, colorectal, and prostate cancersfrom exhaled breath using a single array of nanosensors. Br J Cancer2010;103:542-51.
31. Peng G, et al. Diagnosing lung cancer in exhaled breath using goldnanoparticles. Nat Nanotechnol 2009;4:669-73.
32. Tisch U, et al. Detection of asymptomatic nigrostriatal dopaminergiclesion in rats by exhaled air analysis using carbon nanotube sensors. ACSChem Neurosci 2011;3:161-6.
33. Tisch U, et al. Detection of Alzheimer's and Parkinson's disease fromexhaled breath using nanomaterial-based sensors. Nanomedicine (FutureMed) 2013;8:43-56.
34. Assady S, et al. Impact of hemodialysis on exhaled volatile organiccompounds in end-stage renal disease: a pilot study. Nanomedicine(Future Med) 2013, http://dx.doi.org/10.2217/nnm.13.85.
35. Marom O, et al. Gold nanoparticle sensors for detecting chronic kidneydisease and disease progression.Nanomedicine (FutureMed) 2012;7:639-50.
36. Haick H, et al. Sniffing chronic renal failure in rat model by an array ofrandom networks of single-walled carbon nanotubes. ACS Nano2009;3:1258-66.
37. Cikach FSJ, et al. Breath analysis in pulmonary arterial hypertension.Chest 2014;145:551-8.
38. Grabowska-Polanowska B, et al. Detection of potential chronic kidneydisease markers in breath using gas chromatography with mass-spectraldetection coupled with thermal desorption method. J Chromatogr A2013;1301:179-89.
39. Hibbard T, et al. Point of care monitoring of hemodialysis patients with abreath ammonia measurement device based on printed polyanilinenanoparticle sensors. Anal Chem 2013;85:12158-65.
40. Kohl I, et al. First observation of a potential non-invasive breath gasbiomarker for kidney function. J Breath Res 2013;7:1752-7155.
41. Miekisch W, Schubert JK, Noeldge-Schomburg GFE. Diagnosticpotential of breath analysis—focus on volatile organic compounds.Clin Chim Acta 2004;347:25-39.
42. Moorhead KT, et al. Modelling acute renal failure using blood and breathbiomarkers in rats. Comput Methods Prog Biomed 2011;101:173-82.
43. Owen K, Farooq A. A calibration-free ammonia breath sensor using aquantum cascade laser with WMS 2f/1f. Appl Phys B 2013, http://dx.doi.org/10.1007/s00340-013-5701-1.
44. Simenhoff M, et al. Biochemical profile or uremic breath. N Engl J Med1977;297:132-5.
45. Moorhead K, et al. Modelling acute renal failure using blood andbreath biomarkers in rats. Comput Methods Programs Biomed2011;101:173-82.
46. Lin Y, et al. Application of the electronic nose for uremia diagnosis.Sensors Actuators B 2001;76:177-80.
47. Wang P, et al. A novel method for diabetes diagnosis based on electronicnose. Biosens Bioelectron 1997;12:1031-6.
48. Tisch U, Haick H. Nanomaterials for cross-reactive sensor arrays. MRSBull 2010;35:797-803.
49. Amal H, et al. The scent fingerprint of hepatocarcinoma: in-vitrometastasis prediction with volatile organic compounds (VOCs). Int JNanomedicine 2012;7:4135-46.
50. Barash O, et al. Sniffing the unique “odor print” of non-small-cell lungcancer with gold nanoparticles. Small 2009;5:2618-24.
51. Barash O, et al. Classification of lung cancer histology by goldnanoparticle sensors. Nanomedicine (New York, NY, US) 2012;8:580-9.
52. Peled N, et al. Volatile fingerprints of cancer specific genetic mutations.Nanomedicine (New York, NY, US) 2013;9:758-66.
53. Bayn A, et al. Field effect transistors based on polycyclic aromatichydrocarbons for the detection and classification of volatile organiccompounds. ACS Appl Mater Interfaces 2013;5:3431-40.
54. Ionescu R, et al. Detection of multiple sclerosis from exhaled breathusing bilayers of polycyclic aromatic hydrocarbons and single-wallcarbon nanotubes. ACS Chem Neurosci 2012;2:687-93.
55. Peled N, et al. Detection of volatile organic compounds in cattlenaturally infected with Mycobacterium bovis. Sensors Actuators B2012;171–172:588-94.
56. Tisch U, Haick H. Arrays of chemisensitive monolayer-capped metallicnanoparticles for diagnostic breath testing. Rev Chem Eng 2011;26:171-9.
57. Haick H. Chemical sensors based molecularly modified metallicnanoparticles. J Phys D 2007;40:7173-86.
10 M.K. Nakhleh et al / Nanomedicine: Nanotechnology, Biology, and Medicine xx (2014) xxx–xxx
58. Peng G, et al. Diagnosing lung cancer in exhaled breath using goldnanoparticles. Nat Nanotechnol 2009;4(10):669-73.
59. Dovgolevsky E, Konvalina G, Tisch U, Haick H. Monolayer-cappedcubic platinum nanoparticles for sensing nonpolar analytes in highlyhumid atmospheres. J Phys Chem C 2010;114(33):14042-9.
60. Konvalina G, Haick H. Effect of humidity on nanoparticle-basedchemiresistors: a comparison between synthetic and real-world samples.ACS Appl Mater Interfaces 2012;4(1):317-25.
61. Waikar S, Betensky R, Bonventre J. Creatinine as the gold standard forkidney injury biomarker studies? Nephrol Dial Transplant 2009:3263-5.
62. Waikar S, et al. Imperfect gold standards for kidney injury biomarkerevaluation. J Am Soc Nephrol 2012;23:13-21.
63. Waikar S, Bonventre J. Creatinine kinetics and the definition of acutekidney injury. J Am Soc Nephrol 2009;20:672-9.
64. Devarajan P. Neutrophil gelatinase-associated lipocalin: a promisingbiomarker for human acute kidney injury. Biomark Med 2010;4:265-80.
65. Doi K, et al. Mild elevation of urinary biomarkers in prerenal acutekidney injury. Kidney Int 2012;82:1114-20.
66. Meinardi S, et al. Exhaled breath and fecal volatile organicbiomarkers of chronic kidney disease. Biochim Biophys Acta2013;3:2531-7.
67. Basu R, Wheeler D. Kidney-lung cross-talk and acute kidney injury.Pediatr Nephrol 2013;20:20-30.
68. Miekisch W, Schubert J, Noeldge-Schomburg G. Diagnostic potential ofbreath analysis—focus on volatile organic compounds. Clin Chim Acta2004;347:25-39.
69. Buszewski B, et al. Human exhaled air analytics: biomarkers of diseases.Biomed Chromatogr 2007;21:553-66.
70. Fend R, et al. Monitoring haemodialysis using electronic nose andchemometrics. Biosens Bioelectron 2004;19:1581-90.
71. Voss A, et al. Smelling renal dysfunction via electronic nose. AnnBiomed Eng 2005;33:656-60.