EEG ALPHA SENSITIZATION IN INDIVIDUALIZED HOMEOPATHIC TREATMENT OF FIBROMYALGIA
Upload
independentCategory
view
2download
0
This article appeared in a journal published by Elsevier. The attachedcopy is furnished to the author for internal non-commercial researchand education use, including for instruction at the authors institution
and sharing with colleagues.
Other uses, including reproduction and distribution, or selling orlicensing copies, or posting to personal, institutional or third party
websites are prohibited.
In most cases authors are permitted to post their version of thearticle (e.g. in Word or Tex form) to their personal website orinstitutional repository. Authors requiring further information
regarding Elsevier’s archiving and manuscript policies areencouraged to visit:
http://www.elsevier.com/authorsrights
Author's personal copy
Sensitization of CdS nanoparticles onto reduced graphene oxide (RGO)fabricated by chemical bath deposition method for effective removalof Cr(VI)
Rajendra C. Pawar, Caroline Sunyong Lee*
Department of Materials Engineering, Hanyang University, Ansan 426-791, Gyeonggi-do, South Korea
h i g h l i g h t s g r a p h i c a l a b s t r a c t
� Chemical bath deposition was usedto deposit CdS nanoparticles overgraphene sheets.
� RGO/CdS shows effective photo-catalytic reduction of Cr(VI) undervisible light.
� High photocurrent of RGO/CdSproved reduction in recombinationdue to graphene.
� High specific surface area (47.44 m2 g�1) of RGO/CdS improves Cr(VI)adsorption.
a r t i c l e i n f o
Article history:Received 15 January 2013Received in revised form29 April 2013Accepted 22 May 2013
Keywords:Chemical synthesisThin filmsChalcogenidesNanostructures
a b s t r a c t
RGO (Reduced Graphene Oxide)eCdS composites were successfully synthesized by chemical bathdeposition (CBD) method onto soda lime glass substrate at low temperature (70 �C). Their structural,optical and morphological properties were studied using X-ray diffraction, UVeVis spectrophotometer,Raman spectroscopy, BrunauereEmmetteTeller, Field emission scanning electron microscope andtransmission electron microscope. It is clearly seen that spherically shaped CdS nanoparticles with anaverage diameter 30 nm are uniformly coated over the entire graphene sheet. Further, synthesized CdSnanoparticles and RGOeCdS nanocomposites were investigated for the reduction of Cr(VI) under visiblelight. The photocatalytic results show that photodegradation rate of RGOeCdS composites is two timeshigher than that of CdS nanoparticles toward reduction of Cr(VI). The improved photocatalytic perfor-mance by combining RGO with CdS nanoparticles, is attributed to its increased specific surface area(47.44 m2 g�1), efficient transportation of photoelectrons and improved absorbance of CdS nanoparticles.Therefore, it was found that RGO in RGOeCdS composites makes a significant impact on photocatalyticactivity toward reduction of Cr(VI), making an excellent candidate for water refiner.
� 2013 Elsevier B.V. All rights reserved.
1. Introduction
Graphene is the most important form of carbon due to its variousfascinating electrical, optical andmechanical properties [1,2]. It can be
used in several applications such as photocatalysis, solar cells, super-capacitor, batteries, field emission, anti-bacterial activity, fuel cells,chemical detectors and many others [3e8]. Particularly, it is mostsuitable in photocatalysis because of its strong electron capture abilityand excellent transportation capability, and high specific surface areafor adsorption of organic pollutants [9e12]. Hence, it has been com-bined with various semiconductors such as TiO2, ZnO, SnO2 Fe3O4,BiVO4 and CdS using hydrothermal method, microwave assisted
* Corresponding author.E-mail addresses: [email protected], [email protected] (C.S. Lee).
Contents lists available at SciVerse ScienceDirect
Materials Chemistry and Physics
journal homepage: www.elsevier .com/locate/matchemphys
0254-0584/$ e see front matter � 2013 Elsevier B.V. All rights reserved.http://dx.doi.org/10.1016/j.matchemphys.2013.05.062
Materials Chemistry and Physics 141 (2013) 686e693

Author's personal copy
method, solvothermal method and anodization method, for thephotodegradation of organic pollutants under UV and visible light[13e18]. The aforementioned semiconductors and graphene nano-composites have been used successfully to degrade several toxic andhazardous pollutants such as lead,mercury, cadmium and hexavalentchromium (Cr(VI)), presented inwastewater. Among these pollutants,Cr(VI) is known to be highly toxic due to its carcinogenic property inhexavalent form [19,20]. Various research groups have been investi-gated regarding Cr(VI) reduction into Cr(III) which is less toxic phase.Liu et al. reportedmicrowave assisted synthesis of ZnO, TiO2, CdS andits composites with graphene for photocatalytic reduction of Cr(VI)[21,22]. They found that graphene improves photocatalytic perfor-mance due to its fast electron transfer property and increased ab-sorption. Hailong et al. prepared phthalic acid which modified TiO2using chemisorption method to reduce Cr(VI) in aqueous solution[23]. Dozzi et al. studied the effect of different TiO2 phase combina-tions on reduction of Cr(VI) in presence of organic dyes [24]. Althoughthese groups successfully reduced Cr(VI) using above mentionedtechniques, the main limitation of these catalysts is its poor perfor-mance. Further, few of them used hydrogen peroxide and UV light forCr(VI) reduction which is not suitable for the sun light. Hence, it isnecessary to fabricate graphene based composites with visible bandgap semiconductors for excellent reduction of Cr(VI). Liu et al. fabri-cated RGOeCdS composites for reduction of Cr(VI) under visible lightusing microwave assisted method and found that these compositesare suitable for the development of visible photocatalysis based de-vices [25]. There are several other groups reported RGOeCdS com-posites using different methods [26e28]. However, the RGOeCdScomposites prepared by these methods, are not suitable forcommercialization due to low photocatalytic performance and com-plex synthesis process. Further, these methods involve several steps,requiring high temperature, high cost, sophisticated equipments andvigorous experimental conditions. Therefore, in the present work,authors would like to introduce a facile chemical bath deposition(CBD) method to fabricate RGOeCdS composites at low temperature.This method has several advantages as compared with that of othermethods, such as lowcost and temperature, single step solution basedmethod without any catalysis and surfactant, easy control over thegrowth, crystallinity, film thickness, and deposition rate of materialsby adjusting concentration of precursor, and easy control over depo-sition temperature and pH of growth solution [29e32]. Furthermore,low temperature deposition minimizes corrosion and oxidation ofmetallic substrates [33]. In our previous reports, authors have sensi-tizedCdSnanoparticles ontoZnOnanorodsusingCBDmethodat 70 �Cand found that CBD is themost convenientmethod for the depositionof CdSnanoparticles [34]. Hence,we explored deposition of RGOeCdScomposites using CBD method for reduction of Cr(VI) under visiblelight. Further, structural and optical properties of these compositeswere studied.
2. Experimental details
2.1. Reduced graphene oxide (RGO) preparation
The modified Hummers method was employed to prepare gra-phene oxide (GO) powders [34]. In brief, 2 g of graphite powders inthe flakes, were added into 100 ml sulfuric acid (H2SO4) withconstant stirring below 10 �C. Then 8 g of potassium permanganate(KMnO4) powders were added gradually while keeping the sametemperature, followed by 2 h of constant stirring. After that, themixture was kept at room temperature and stirred for 1 h. Again,the mixture was kept inside low temperature bath and subse-quently diluted with 100 ml of distilled water. Further, 20 ml (30%)of hydrogen peroxide (H2O2) was added into the mixture todissolve residual permanganate. The large amount of bubble
released and color of mixture changed into brilliant yellow. Thecolored suspensionwas filtered and washed with 1 M hydrochloricacid (HCl) and distilled water several times. Final residue was driedin oven at 60 �C for 12 h and stored in vacuum oven.
Further, the collected GO powders were reduced by ultra-sonicating 100mg of GO powders into 100ml of distilled water firstfor dispersion, followed by adding 20 ml of hydrazine monohydratedrop-by-drop and then refluxed at 90 �C for 2 h. The refluxed so-lution was filtered and powders were collected in petri-dish.Finally, the petri-dish with the collected reduced graphene oxide(RGO) was kept inside the oven at 60 �C for 12 h and then stored invacuum oven. RGO powders were re-dispersed in distilled waterunder ultrasonication for 1 h. The black color of re-dispersed RGOsolution indicated that GO has been reduced completely.
2.2. Deposition of CdS nanoparticles
CdS thin films were deposited onto glass substrates using CBD atoptimized temperature of 70 �C. The substrates used for thedeposition of CdS thin films, were commercial soda lime glass slideswith its dimension of 35 � 25 � 1 mm. Before the deposition, thesubstrates must be cleaned using chromic acid for 30 min, followedby distilled water and finally dried in air. Aqueous solutions of0.02 M cadmium acetate (3CdSO4$8H2O) with 0.05 M thiourea((NH2)2CS) were mixed in 100 ml of distilled water. Then ammoniasolution was added to the solution to adjust the pH value of thebath to w10. The solution was continuously stirred. Solution wasmixed with a magnetic stirrer and after obtaining a clear homog-enized bath, the glass slides were placed in the bath vertically. Thesolution temperature was kept constant at 70 �C for given time ofdeposition which is about 5 h. After the deposition, the sampleswere washed with distilled water and dried in air.
2.3. RGO/CdS fabrication
For the fabrication of RGO/CdS nanocomposites, 0.20 wt% ofRGO powders were dispersed in distilled water using ultra-sonication for 1 h. Here, 0.20 wt% of RGO powders is the optimizedratio between RGO and CdS. Then cadmium sulfate, thiourea andammonia solution was added as mentioned above under constantstirring. Subsequently, cleaned glass/FTO (Fluorine-doped tinoxide) coated glass substrate was dipped into dispersed RGO andcadmium solution at 70 �C for 5 h. Finally, the deposited substratewas removed and rinsed in distilled water, and dried in air at roomtemperature. Further, the same was used for characterization.
2.4. Characterization
X-ray diffraction (XRD) of the prepared nanostructures wascarried out in diffractometer (Rigaku, D/MAX-2500/PC Cu Ka line,USA). Raman spectroscopy of CdS and RGO/CdS samples were per-formed at room temperature using Renishaw spectrometer withlaser excitation at 632.8 nm. The microstructural analysis wasstudied using Field emission scanning electron microscope (FESEM,Tescan, JMIRA3 LMmodel, USA). Transmission electron microscopy(TEM) has been used to confirm the size of CdS nanoparticles whichare uniformly coated onto graphene sheets (TEM, JEM-2100Fmodel,Japan). The specific surface area of the ZnOnanostructured powdersweremeasured by BET (AS-1; Quantachrome Instruments, BoyntonBeach, FL, USA) using nitrogen adsorptionedesorption.
2.5. Photocatalytic reduction of Cr(VI)
The photocatalytic performance of synthesized CdS and RGO/CdS samples was measured by Cr(VI) reduction (K2Cr2O7,1.0 � 10�5 M, 100 ml) under halogen lamp (Halogen, 100 W).
R.C. Pawar, C.S. Lee / Materials Chemistry and Physics 141 (2013) 686e693 687

Author's personal copy
Powders (0.0025 g L�1) were dispersed in Cr(VI) solution to obtainadsorptionedesorption equilibrium of photocatalyst while theCr(VI) solutionwas stirred at room temperature for an hour in dark.Then, the catalyst dispersed Cr(VI) solution was illuminated byvisible light (Power incident ¼ 50 mW cm�2) while being contin-uously stirred. During measurement after 20 min of irradiation,5 ml aliquots of the solution were withdrawn and analyzed usingUVeVis spectrophotometer (Jasco, V-600 model). The reduction ofCr(VI) was monitored by comparing absorption band at 372 nmduring measurement. Further, the photocatalytic activity of Cr(VI)solutionwithout catalysis, was measured under the same conditionfor comparison. Photoelectrochemical (PEC) measurement wasperformed in standard three electrode cell in round-shaped Quartzbeaker, comprised of deposited CdS and RGO/CdS thin film (areaw1 cm2) as a working electrode, graphite as a counter electrodeand a saturated calomel electrode (SCE) as a reference electrode. Anaqueous solution of 0.5 M Na2SO4 was used as a redox electrolyte.Halogen lamp was used to illuminate the electrode at a light in-tensity of 5 mW cm�2. Photocurrent-time curves were monitoredand recorded during oneoff cycles using a potentiostat (EG and E175). The chemical stability of RGO/CdS composite was measuredby collecting dispersed photocatalysts after first cycle throughcentrifuge.
3. Results and discussion
The crystallographic structure and phase purity of RGO andRGO/CdS samples were examined by X-ray powder diffraction(XRD), and results are shown in Fig. 1. It is seen that RGO patternexhibits peak at 20.66� and 42.53� along (002) and (100) planesrespectively, confirming the complete reduction of graphene oxide[35e37]. In case of RGO/CdS sample, almost all diffraction peaksmatch with hexagonal crystal structure of CdS with P63mc spacegroup (JCPDS#01-070-2553). The absence of RGO peak in RGO/CdSsamples is attributed to small quantity of RGO and relatively lowdiffraction intensity. The similar kind of trend is reported in theliterature [38].
The surface morphology of RGO and RGO/CdS samples wasevaluated by FESEM. As shown in Fig. 2a, the RGO sheets are formedwith a several micrometers in size and few nanometers in thick-ness. The magnified image of RGO sample showing its thickness of70 nm, indicates overlapping of several graphene sheets on eachother. For RGO/CdS sample as shown in Fig. 2b, it is found thatspherical shaped CdS nanoparticles are distributed onto surface ofgraphene sheet. All nanoparticles are found to be sparsely coatedover entire graphene sheet. Further, the microscopic structure ofRGO and RGO/CdS samples is observed using transmission electronmicroscopy (TEM), as shown in Fig. 3. It was observed that gra-phene nanosheets are covered with CdS nanoparticles completely.All spherically shaped CdS nanoparticles withw30 nm in diameterare distributed onto graphene sheets without any aggregation(Fig. 3A), which agrees well with the results of FESEM analysis. TheRGO/CdS sample was also studied by high-resolution transmissionelectron microscopy (HR-TEM) (Fig. 3B). From HR-TEM analysis, thed-spacing was found to be 0.33 nm, oriented along (002) plane andthis result is consistent with XRD analysis [39]. The nanoparticlesare distributed on the graphene surface because of strong electro-static and electron transfer interactions between CdS and graphenesheet. The selected area electron diffraction (SAED) pattern in-dicates that the RGO/CdS sample (inset of Fig. 3B) is polycrystallinestructure of CdS nanoparticles. The SAED pattern exhibits threerings oriented along (002), (100) and (101) planes of the hexagonalphase for CdS nanoparticles respectively [40]. The elementalcomposition of RGO/CdS sample was determined by using spotenergy dispersive X-ray spectroscopy (EDX). The EDS results
(Fig. 3C) give signals of C, Cd and S elements which confirm thesuccessful formation of RGO/CdS nanocomposite.
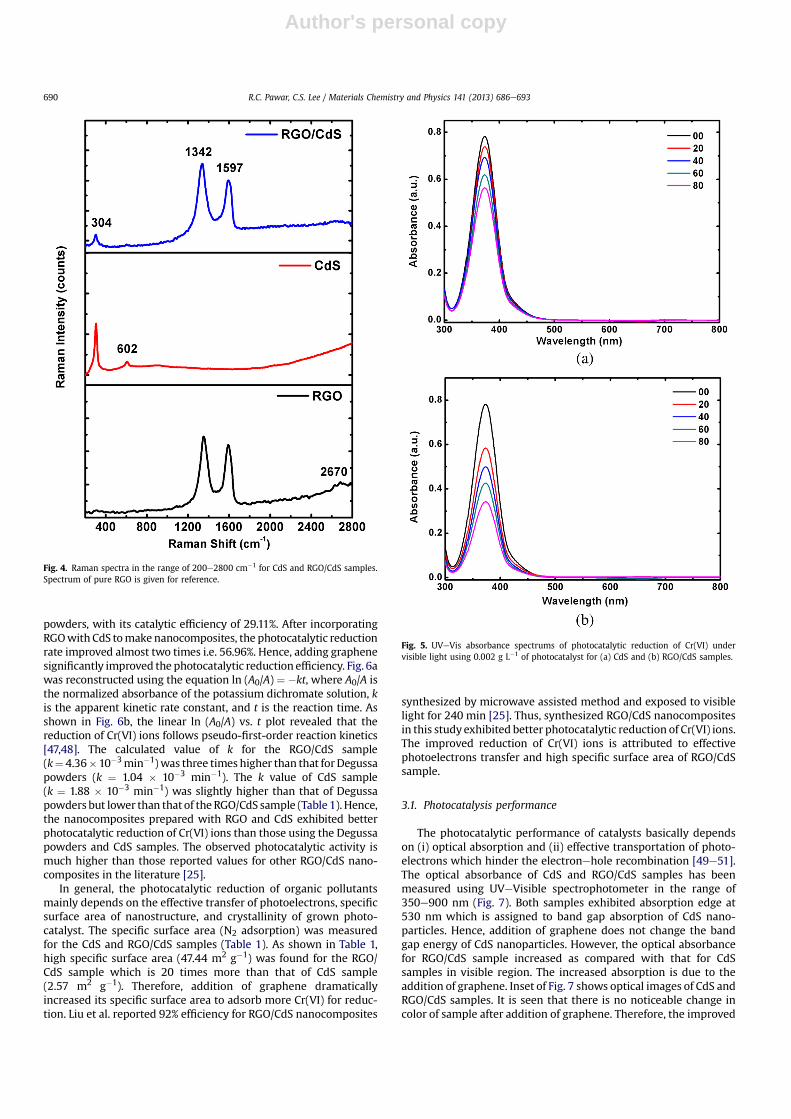
Raman spectroscopy is the best nondestructive tool to deter-mine the quality of crystalline materials and formation of nano-composites. The RGO, CdS and RGO/CdS samples were studied byRaman spectroscopy (Fig. 4). The Raman spectrum for RGO wasused to clarify the Raman shifts of the bands observed for thenanocomposites. The existence of two strong peaks for RGO atabout 1334 cm�1 (D band) and 1602 cm�1 (G band) are attributed todisordered sp2-bonded carbon and to breathing vibrations of six-membered sp2 carbon rings (E2g and A1g modes) in reduced gra-phene [41]. In addition to these peaks, there is one more low in-tensity peak at w2670 cm�1 (2D) due to double phonon resonanceprocess [42]. The variation in 2D peak can reveal number ofstacking layers of graphene [43]. The lower intensity of 2D peakindicates that the synthesized graphene sheets are stacked withfew layers of graphene [44,45]. For CdS sample, Raman spectrashowing the two peaks at 304 cm�1 and 602 cm�1, correspond tolongitudinal optical phonon modes [46]. Finally, in case of RGO/CdSsample, a single peak at about 304 cm�1 is the optical phonon LOmode of CdS, and two more peaks at 1334 cm�1 and 1602 cm�1
correspond to RGO. Hence, the existence of peaks related toRGO and CdS indicate the successful formation of RGO/CdSnanocomposite.
The photocatalytic reduction of Cr(VI) was evaluated bymeasuring the absorbance from UVeVisible spectrophotometer.Photocatalytic performancewas estimatedbymonitoring the changein absorbance over irradiation time for potassium dichromate solu-tion at 372 nm. The absorption spectrum of the dichromate solution
Fig. 1. XRD patterns of RGO and RGO/CdS samples.
R.C. Pawar, C.S. Lee / Materials Chemistry and Physics 141 (2013) 686e693688

Author's personal copy
after 80min of irradiation is shown in Fig. 5. The absorption peak forthe potassium dichromate decreased gradually with increasingirradiation due to degradation of Cr(VI) ions. The rate of decrease inabsorption within 80 min for the RGO/CdS sample is found to berapid as compared with that for CdS sample. The change in absor-bance of the potassium dichromate solution with time in the pres-ence of different catalysts under visible light irradiation is shown in
Fig. 6a; the relative absorbance is A0/A*100, where A is the absor-bance of the potassium dichromate solution at the irradiation time tand A0 is the absorbance of the solution before irradiation (t¼ 0). It isobserved that Cr(VI) cannot be reduced under visible light withoutphotocatalyst and a slight reduction of Cr(VI) ions was found forDegussa powders with its reduction rate of 11.39%. However, pho-tocatalytic reduction rate occurred faster after the addition of CdS
Fig. 3. TEM image of (A) CdS nanoparticles coated over entire RGO sheet, (B) HR-TEM image with an interplanar spacing of 0.33 nm and orientation along (002) direction and (C)EDS spectra of RGO/CdS sample.
Fig. 2. FESEM images of (a) RGO sheets with a size in micrometer scale at �50 K magnification (left) and magnified view of RGO sheets with its thickness of 70 nm at �150 K (right),and (b) RGO/CdS composite sample at �50 K (left) and its magnified view show the uniform coverage of CdS nanoparticles onto surface of RGO sheet at �150 K (right).
R.C. Pawar, C.S. Lee / Materials Chemistry and Physics 141 (2013) 686e693 689
Author's personal copy
powders, with its catalytic efficiency of 29.11%. After incorporatingRGOwith CdS tomakenanocomposites, the photocatalytic reductionrate improved almost two times i.e. 56.96%. Hence, adding graphenesignificantly improved the photocatalytic reduction efficiency. Fig. 6awas reconstructed using the equation ln (A0/A) ¼ �kt, where A0/A isthe normalized absorbance of the potassium dichromate solution, kis the apparent kinetic rate constant, and t is the reaction time. Asshown in Fig. 6b, the linear ln (A0/A) vs. t plot revealed that thereduction of Cr(VI) ions follows pseudo-first-order reaction kinetics[47,48]. The calculated value of k for the RGO/CdS sample(k¼ 4.36�10�3min�1)was three times higher than that forDegussapowders (k ¼ 1.04 � 10�3 min�1). The k value of CdS sample(k ¼ 1.88 � 10�3 min�1) was slightly higher than that of Degussapowders but lower than that of the RGO/CdS sample (Table 1). Hence,the nanocomposites prepared with RGO and CdS exhibited betterphotocatalytic reduction of Cr(VI) ions than those using the Degussapowders and CdS samples. The observed photocatalytic activity ismuch higher than those reported values for other RGO/CdS nano-composites in the literature [25].
In general, the photocatalytic reduction of organic pollutantsmainly depends on the effective transfer of photoelectrons, specificsurface area of nanostructure, and crystallinity of grown photo-catalyst. The specific surface area (N2 adsorption) was measuredfor the CdS and RGO/CdS samples (Table 1). As shown in Table 1,high specific surface area (47.44 m2 g�1) was found for the RGO/CdS sample which is 20 times more than that of CdS sample(2.57 m2 g�1). Therefore, addition of graphene dramaticallyincreased its specific surface area to adsorb more Cr(VI) for reduc-tion. Liu et al. reported 92% efficiency for RGO/CdS nanocomposites
synthesized by microwave assisted method and exposed to visiblelight for 240 min [25]. Thus, synthesized RGO/CdS nanocompositesin this study exhibited better photocatalytic reduction of Cr(VI) ions.The improved reduction of Cr(VI) ions is attributed to effectivephotoelectrons transfer and high specific surface area of RGO/CdSsample.
3.1. Photocatalysis performance
The photocatalytic performance of catalysts basically dependson (i) optical absorption and (ii) effective transportation of photo-electrons which hinder the electronehole recombination [49e51].The optical absorbance of CdS and RGO/CdS samples has beenmeasured using UVeVisible spectrophotometer in the range of350e900 nm (Fig. 7). Both samples exhibited absorption edge at530 nm which is assigned to band gap absorption of CdS nano-particles. Hence, addition of graphene does not change the bandgap energy of CdS nanoparticles. However, the optical absorbancefor RGO/CdS sample increased as compared with that for CdSsamples in visible region. The increased absorption is due to theaddition of graphene. Inset of Fig. 7 shows optical images of CdS andRGO/CdS samples. It is seen that there is no noticeable change incolor of sample after addition of graphene. Therefore, the improved
Fig. 5. UVeVis absorbance spectrums of photocatalytic reduction of Cr(VI) undervisible light using 0.002 g L�1 of photocatalyst for (a) CdS and (b) RGO/CdS samples.
Fig. 4. Raman spectra in the range of 200e2800 cm�1 for CdS and RGO/CdS samples.Spectrum of pure RGO is given for reference.
R.C. Pawar, C.S. Lee / Materials Chemistry and Physics 141 (2013) 686e693690

Author's personal copy
absorbance was found to be one of the reasons for effective pho-tocatalytic reduction of Cr(VI) under visible light.
The suitable energy levels of RGO and CdS are playing crucialrole for fast photoelectrons transfer. The conduction band positionof CdS (�3.6 eV) and graphene work function (�4.42 eV) arebeneficial for effective separation of photogenerated electroneholepairs [52]. This improves photoelectron transfer, and the highelectron mobility of graphene transfers the injected electronsquickly from the interface to the sheets, minimizing recombinationlosses (Schematic shown in Fig. 8). Hence, photocatalytic activityimproved significantly with RGO addition to CdS. The following
series show reaction processes involved in the reduction of Cr(VI) toCr(III) by photoelectrons [53e56]:
CdSþ hvð� 2:42 eVÞ/CdS�hþVB þ e�CB
�(1)
CdS�hþVB þ e�CB
�þ RGO/CdS
�hþVB
�þ RGO
�e�CB
�(2)
Cr2O72� þ 14Hþ þ 6e�/2Cr3þ þ 7H2O (3)
2H2Oþ 4hþ/O2 þ 4hþ (4)
Under visible light with an energy�2.42 eV, electronehole pairsare generated, and then photogenerated electrons are transferredto RGO nanosheets as described in Equations (1) and (2). Afterelectronehole pairs are separated, the photoelectrons can reduceCr(VI) to Cr(III) as shown in Equations (3) and (4). Thus, grapheneplays a crucial role in separation of photoelectrons, leading to low
Table 1Summary of the measured specific surface area (m2 g�1) and reaction rate constants(min�1) for Degussa powders, CdS and RGOeCdS samples.
Sample BET specific surfacearea (m2 g�1)
Kinetic rate constant(min�1) � 10�3
Cr(VI) solution e 0.06Degussa powders 18e20 1.04CdS 2.57 1.88RGOeCdS 47.44 4.36
Fig. 7. Optical absorbance spectra of CdS and RGO/CdS samples in visible region. Insetshows photographs of CdS and RGOeCdS samples.
Fig. 6. (a) Relative absorbance for Degussa powders, CdS and RGOeCdS samples withrespect to visible light irradiation time. The absorbance of Cr(VI) solution under visiblelight irradiation without catalysis is also shown for comparison and (b) ln (A0/A) vs. tcurves of Cr(VI) photocatalytic reduction without catalyst, with CdS only and RGO/CdScatalysts.
Fig. 8. Schematic diagram of RGO/CdS sample showing the electron transfer mecha-nism under visible light and photocatalytic reduction of Cr(VI).
R.C. Pawar, C.S. Lee / Materials Chemistry and Physics 141 (2013) 686e693 691

Author's personal copy
recombination losses and thereby increasing photocatalyticreduction of Cr(VI) to Cr(III) under visible light.
To confirm the role of RGO in photocatalytic improvement,photocurrent transient responses were measured for CdS and RGO/CdS samples. Fig. 9 show photocurrentetime (Iet) response of CdSand RGO/CdS samples under intermittent illumination of visiblelight. It was found that both electrodes showed good reproduc-ibility and stability after number of cycles. The photocurrentbecame zero once lamp was off and came back close to originalvalue once lamp was on. Interestingly, the photocurrent density ofRGO/CdS sample (1.13 mA cm�2) is significantly higher than that ofCdS sample (0.20 mA cm�2). The improvement in photocurrent isattributed to electron capture and transfer ability of RGO resultingin high photocatalytic performance of RGO/CdS as compared withthat of CdS sample only.
Photocatalytic stability is one of the important factors in pho-tocatalysis for the practical use of fabricated photocatalysts. Hence,in the present study, authors have investigated stability of RGO/CdSsample over 4 cycles. As shown in Fig. 10, the photocatalytic effi-ciency of RGO/CdS sample remains almost the same upto 4 cycles.Therefore, synthesized RGO/CdS composite is stable and suitablefor practical application.
4. Conclusions
In summary, the present work demonstrated that the RGO/CdSnanocomposite was successfully deposited onto glass substrates
using chemical bath deposition method at low temperature forthe application of photocatalysts. Raman spectroscopy, XRDpattern and EDS spectroscopy confirmed the successful formationof RGO/CdS nanocomposites. The uniform distribution of CdSnanoparticles over entire graphene nanosheets is due to strongelectrostatic interactions between CdS and graphene. The RGO/CdSnanocomposites showed excellent photocatalytic reduction ofCr(VI) under visible light. Therefore, an efficient photocatalyst wasfabricated successfully using the facile chemical method. Theimproved photocatalytic performance is the results of effectiveseparation of photogenerated electroehole pairs due to electroncapture ability of reduced graphene oxide. Finally good stability ofRGO/CdS nanocomposite revealed that the composite is applicablein water purification devices.
Acknowledgments
This research was supported by the Basic Science ResearchProgram through the National Research Foundation of Korea (NRF)funded by the Ministry of Education, Science and Technology(2012032560), by the Human Resources Development of theKorean Institute of Energy Technology Evaluation and Planning(KETEP) grant funded by the Ministry of Knowledge Economy, Re-public of Korea (No. 2012-4030200130) and by the NRF grantfunded by the Korean Government (MEST) (No. 2011-0029862).
References
[1] S. Park, R.S. Ruoff, Nat. Nanotechnol. 4 (2009) 217.[2] K.P. Loh, Q. Bao, P.K. Ang, J. Yang, J. Mater. Chem. 20 (2010) 2277.[3] Y. Sun, Q. Wu, G. Shi, Energy Environ. Sci. 4 (2011) 1113.[4] Q. Xiang, J. Yu, M. Jaroniec, Chem. Soc. Rev. 41 (2012) 782.[5] G. Ning, Z. Fan, G. Wang, J. Gao, W. Qianc, F. Wei, Chem. Commun. 47 (2011)
5976.[6] M.Q. Yang, N. Zhang, Y.J. Xu, ACS Appl. Mater. Interfaces 5 (2013) 1156.[7] Y. Zhang, Z.R. Tang, X. Fu, Y.J. Xu, ACS Nano 4 (2010) 7303.[8] N. Zhang, Y. Zhang, X. Pan, M.Q. Yang, Y.J. Xu, J. Phys. Chem. C 116 (2012)
18023.[9] L.L. Zhang, R. Zhou, X.S. Zhao, J. Mater. Chem. 20 (2010) 5983.
[10] G. Srinivas, J.W. Burress, J. Ford, T. Yildirim, J. Mater. Chem. 21 (2011) 11323.[11] Y. Zhang, N. Zhang, Z.R. Tang, Y.J. Xu, ACS Nano 6 (2012) 9777.[12] N. Zhang, Y. Zhang, M.Q. Yang, Z.R. Tang, Y.J. Xu, J. Catal. 299 (2013) 210.[13] X.Y. Zhang, H.P. Li, X.L. Cui, Y. Lin, J. Mater. Chem. 20 (2010) 2801.[14] J. Ding, X. Yan, J. Li, B. Shen, J. Yang, J. Chen, Q. Xue, ACS Appl. Mater. Interfaces
3 (2011) 4299.[15] T. Dufaux, J. Boettcher, M. Burghard, K. Kern, Small 6 (2010) 1868.[16] D. Depan, J. Shah, R.D.K. Misra, Mater. Sci. Eng. C 31 (2011) 1305.[17] N. Zhang, Y. Zhang, Y.J. Xu, Nanoscale 4 (2012) 5792.[18] Y. Zhang, Z.R. Tang, X. Fu, Y.J. Xu, ACS Nano 5 (2011) 7426.[19] L. Yang, Y. Xiao, S. Liu, Y. Li, Q. Cai, S. Luo, G. Zeng, Appl. Catal. B Environ. 94
(2010) 142.[20] L. Wang, N. Wang, L. Zhu, H. Yu, H. Tang, J. Hazard. Mater. 152 (2008) 93.[21] X. Liu, L. Pan, T. Lv, Z. Sun, C. Sun, J. Mol. Catal. A Chem. 363 (2012) 417.[22] X. Liu, L. Pan, Q. Zhao, T. Lv, G. Zhu, T. Chen, T. Lu, Z. Sun, C. Sun, Chem. Eng. J.
183 (2012) 238.[23] H. Liu, Y. Zhou, H. Huang, Y. Feng, Desalination 278 (2011) 434.[24] M.V. Dozzi, A. Saccomanni, E. Selli, J. Hazard. Mater. 211 (2012) 188.[25] X. Liu, L. Pan, T. Lv, G. Zhu, Z. Sun, C. Sun, Chem. Commun. 47 (2011) 11984.[26] P. Zeng, Q. Zhang, T. Peng, X. Zhang, Phys. Chem. Chem. Phys. 13 (2011)
21496.[27] K. Zhang, Z. Liu, Appl. Surf. Sci. 257 (2011) 10379.[28] J. Chu, X. Li, J. Qi, Cryst. Eng. Commun. 14 (2012) 1881.[29] A.S. Kamble, R.C. Pawar, J.Y. Patil, S.S. Suryavanshi, P.S. Patil, J. Alloys Compd.
509 (2011) 1035.[30] S.A. Vanalakar, S.S. Mali, R.C. Pawar, N.L. Tarwal, A.V. Moholkar, J.A. Kim,
Y. Kwon, J.H. Kim, P.S. Patil, Electrochim. Acta 56 (2011) 2762.[31] S.A. Vanalakar, S.S. Mali, R.C. Pawar, N.L. Tarwal, A.V. Moholkar, J.H. Kim,
P.S. Patil, J. Appl. Phys. 112 (2012) 044302.[32] R.C. Pawar, J.Y. Lee, E.J. Kim, H. Kim, C.S. Lee, Korean J. Mater. Res. 22 (2012) 504.[33] Y.J. Chang, C.L. Munsee, G.S. Herman, J.F. Wager, P. Mugdur, D.H. Lee,
C.H. Chang, Surf. Interface Anal. 37 (2005) 398.[34] S.A. Vanalakar, R.C. Pawar, M.P. Suryawanshi, S.S. Mali, D.S. Dalavi,
A.V.Moholkar, K.U. Sim, Y.B. Kown, J.H. Kim, P.S. Patil, Mater. Lett. 65 (2011) 548.[35] J. Shen, M. Shi, H. Ma, B.Y. Na, M. Ye, Mater. Res. Bull. 46 (2011) 2077.[36] E.B. Nursanto, A. Nugroho, S.A. Hong, S.J. Kim, K.Y. Chung, J. Kim, Green Chem.
13 (2011) 2714.
Fig. 9. Photocurrent transient responses of CdS and RGO/CdS samples recorded undervisible light in 0.5 M Na2SO4 electrolyte.
Fig. 10. Photocatalytic stability of RGO/CdS sample over 4 cycles.
R.C. Pawar, C.S. Lee / Materials Chemistry and Physics 141 (2013) 686e693692

Author's personal copy
[37] Z. Xu, H. Gao, H. Guoxin, Carbon 49 (2011) 4731.[38] Q. Li, B. Guo, J. Yu, J. Ran, B. Zhang, H. Yan, J.R. Gong, J. Am. Chem. Soc. 133
(2011) 10878.[39] C. Li, J. Yuan, B. Han, W. Shangguan, Int. J. Hydrogen Energy 36 (2011) 4271.[40] A. Phuruangrat, T. Thongtem, S. Thongtem, Mater. Lett. 63 (2009) 1538.[41] S. Stankovich, D.A. Dikin, R.D. Piner, K.A. Kohlhaas, A. Kleinhammes, Y. Jia,
Y. Wu, S.T. Nguyen, R.S. Ruoff, Carbon 45 (2007) 1558.[42] Z. Ni, Y. Wang, T. Yu, Z. Shen, Nano Res. 1 (2008) 273.[43] Z. Ni, Y. Wang, T. Yu, Y. You, Z. Shen, Phys. Rev. B 77 (2008) 235403.[44] A.C. Ferrari, J.C. Meyer, V. Scardaci, C. Casiraghi, M. Lazzeri, F. Mauri,
S. Piscanec, D. Jiang, K.S. Novoselov, S. Roth, A.K. Geim, Phys. Rev. Lett. 97(2006) 187401.
[45] O. Frank, M. Mohr, J. Maultzsch, C. Thomsen, I. Riaz, R. Jalil, K.S. Novoselov,G. Tsoukleri, J. Parthenios, K. Papagelis, L. Kavan, C. Galiotis, ACS Nano 5 (2011)2231.
[46] D. Zhang, M. Wen, B. Jiang, J. Zhu, Y. Huo, G. Li, J. SoleGel Sci. Technol. 62(2012) 140.
[47] R.C. Pawar, H. Kim, C.S. Lee, Scripta Mater. 68 (2013) 142.[48] R.C. Pawar, D. Cho, C.S. Lee, Curr. Appl. Phys. (2013), http://dx.doi.org/
10.1016/j.cap.2012.12.031.[49] K. Zhou, Y. Zhu, X. Yang, X. Jiang, C. Li, New J. Chem. 35 (2011) 353.[50] T. Lv, L. Pan, X. Liu, T. Lu, G. Zhu, Z. Sun, C.Q. Sun, Catal. Sci. Technol. 2 (2012) 754.[51] N. Zhang, Y. Zhang, X. Pan, X. Fu, S. Liu, Y.J. Xu, J. Phys. Chem. C 115 (2011)
23501.[52] Y.J. Yu, Y. Zhao, S. Ryu, L.E. Brus, K.S. Kim, P. Kim, Nano Lett. 9 (2009) 3430.[53] S. Bai, X. Shen, X. Zhong, Y. Liu, G. Zhu, X. Xu, K. Chen, Carbon 50 (2012) 2337.[54] X. Liu, L. Pan, T. Lv, T. Lu, G. Zhu, Z. Sun, C. Sun, Catal. Sci. Technol. 1 (2011)
1189.[55] N. Nasrallah, M. Kebir, Z. Koudri, M. Trari, J. Hazard. Mater. 185 (2011) 1398.[56] H.H. Mohamed, D.W. Bahnemann, Appl. Catal. B Environ. 128 (2012) 91.
R.C. Pawar, C.S. Lee / Materials Chemistry and Physics 141 (2013) 686e693 693
Copyright © 2022 FDOKUMEN