FA report dealing with SCC and sensitization in stainless steel tubesheet.
37
v Industrial Inspection & Consulting Tel: (281) 658-3195 1812 E. 122 nd St. Email: [email protected] Jenks, OK 74037 FAILURE ANALYSIS REPORT Report No.: 14-324-SBR-v1 Project No.: 14-97 Date Received: July 9, 2014 Date Reported: August 7, 2014 DISCLAIMER This report is submitted solely for your use and benefit and is not submitted with knowledge of belief that it is to be relied upon by any other party. Reliance upon this report by other parties will be done at their risk without liability to I2C. All conclusions, opinions, test results, inspection results, etc. presented in this report relate only to the items examined or analyzed by I2C. I2C makes no representations or conclusions regarding any items not specifically examined or analyzed by I2C or otherwise referred to in this report. You agree to keep I2C's report confidential and agree not to reproduce or distribute the report to any third party without the express written consent of I2C. The transmittal of counterfeit, fabricated, or falsified statements within this document is a punishable offense under federal and state law. The electric transmission of this report is provided as a convenience to the client and I2C is not liable in any way for any changes or degradation of information during the transmittal. The electronic copy is not the official or controlling document. The certified report of I2C which will be provided on I2C's letterhead, in hard copy form, is the official report and will control for all legal purposes. Unless expressly provided herein, I2C shall not be liable for consequential, incidental, punitive, exemplary or indirect damages, lost profits, or other business interruption damages by statute, in tort, or contract. It is the intent of the parties that the limitations imposed herein on remedies and the measures of damages be without regard to the cause or causes related thereto, including the negligence of I2C, whether such negligence be sole, joint or concurrent, or active or passive. Page 1 of 37 Background Industrial Inspection & Consulting (I2C) received a tube sheet from (Client) that was removed from the A2-115-C exchanger for evaluation. Internal surface of tube sheet exhibited numerous indications as revealed by a liquid penetrant (LP) examination that had been performed by (Subcontractor). I2C Report Number 14-323-SBR-v1, dated August 4, 2014 presented results of testing performed on previously delivered tubes and deposits that had been removed from same exchanger. (Client) requested that I2C define the root cause of damage that was found through liquid penetrant of internal side of tubesheet.
-
Upload
independent -
Category
Documents
-
view
0 -
download
0
Transcript of FA report dealing with SCC and sensitization in stainless steel tubesheet.

v
Industrial Inspection & Consulting Tel: (281) 658-3195 1812 E. 122nd St. Email: [email protected] Jenks, OK 74037
FAILURE ANALYSIS REPORT Report No.: 14-324-SBR-v1
Project No.: 14-97 Date Received: July 9, 2014 Date Reported: August 7, 2014
DISCLAIMER This report is submitted solely for your use and benefit and is not submitted with knowledge of belief that it is to be relied upon by any other party. Reliance upon this report by other parties will be done at their risk without liability to I2C. All conclusions, opinions, test results, inspection results, etc. presented in this report relate only to the items examined or analyzed by I2C. I2C makes no representations or conclusions regarding any items not specifically examined or analyzed by I2C or otherwise referred to in this report. You agree to keep I2C's report confidential and agree not to reproduce or distribute the report to any third party without the express written consent of I2C. The transmittal of counterfeit, fabricated, or falsified statements within this document is a punishable offense under federal and state law. The electric transmission of this report is provided as a convenience to the client and I2C is not liable in any way for any changes or degradation of information during the transmittal. The electronic copy is not the official or controlling document. The certified report of I2C which will be provided on I2C's letterhead, in hard copy form, is the official report and will control for all legal purposes. Unless expressly provided herein, I2C shall not be liable for consequential, incidental, punitive, exemplary or indirect damages, lost profits, or other business interruption damages by statute, in tort, or contract. It is the intent of the parties that the limitations imposed herein on remedies and the measures of damages be without regard to the cause or causes related thereto, including the negligence of I2C, whether such negligence be sole, joint or concurrent, or active or passive.
Page 1 of 37
Background Industrial Inspection & Consulting (I2C) received a tube sheet from (Client) that was removed from the A2-115-C exchanger for evaluation. Internal surface of tube sheet exhibited numerous indications as revealed by a liquid penetrant (LP) examination that had been performed by (Subcontractor). I2C Report Number 14-323-SBR-v1, dated August 4, 2014 presented results of testing performed on previously delivered tubes and deposits that had been removed from same exchanger. (Client) requested that I2C define the root cause of damage that was found through liquid penetrant of internal side of tubesheet.

(Client) Report #: 14-324-SBR-v1 August 7, 2014
Note Disclaimer Page 1 Page 2 of 37
Findings and Conclusions Following findings and conclusions were derived from tests and analyses performed on tubesheet: 1. Liquid penetrant indications on internal surface of delivered tubesheet were result of stress
corrosion cracking (SCC) as indicated by results of metallographic examination.
2. Although visual examination did not reveal any large cracks, liquid penetrant (LP) examination performed in laboratory produced thousands of linear indications located on hot side of internal surface. Return side of internal surface did not exhibit any indications.
3. Scanning electron microscopy (SEM) showed that the surface of a crack that resulted in LP indication exhibited transgranular, feathered morphology indicative of SCC.
4. Energy-dispersive X-ray spectroscopy (EDS) showed that deposits on crack surface contained
metal oxides, elevated sulfur content, and traces of other contaminants. Surface only contained a trace amount of chlorine (chloride), a major cause of SCC in austenitic stainless steel; however, it is not unusual for chlorides to be eliminated by post failure cleaning and handling.
5. Metallographic examination showed that cracks propagated radially, were transgranular,
branched, and were comprised of intersecting fissures, characteristics of SCC. Microstructure consisted of mixed-sized austenite and carbide precipitates along grain boundaries. Varying grain size is indicative of exposure to elevated temperatures or inappropriate slow cooling during manufacture. Although tubesheet did not exhibit intergranular oxidation/ corrosion, carbide precipitates along austenitic grain boundaries and varying grain size, indicative of sensitization, would have made tubesheet susceptible to such damage, as explained in Discussion section of this report.
6. Material specification to which tubesheet had been manufactured was not provided to I2C; however, chemical analyses showed that the tubesheet was manufactured from low-carbon, chromium-nickel steel whose chemical composition satisfied the requirements of ASTM A182 Grade F304L.
7. Tension testing showed that the tensile properties of the tubesheet satisfied requirements of
ASTM A182 Grade F304L; however, ductility in longitudinal direction (parallel to holes), as indicated by elongation and reduction of area properties, was half that of transverse orientation. Reduction of ductility in longitudinal direction can be attributed to the preferential direction of elongated austenitic grains.

(Client) Report #: 14-324-SBR-v1 August 7, 2014
Note Disclaimer Page 1 Page 3 of 37
Procedure and Results Visual Examination I2C visually examined and photographed the internal surface of the delivered tube sheet, as shown in Figure 1. Parallel marks that were made by grinding in an attempt to remove the LP indications were evident. Liquid Penetrant Examination I2C re-examined the internal surface with liquid penetrant, in order to locate indications that had been revealed by the previously performed examination. Although thousands of indications were detected on bore and internal surfaces on hot side of the tube sheet, none were detected on the return side. Table 1 reports and Figure 2 illustrates the locations, as defined by tube row and number, where there were no indications. As demonstrated in Figure 2, portion of internal surface that did not exhibit LP indications appeared to have been concentrated on right side (towards tubes with higher identification numbers) and towards center of tube sheet. A photograph showing the orientation and severity of typical LP indications on bore and internal surface of tubesheet is present in Figure 3. Scanning Electron Microscopy and Energy-dispersive X-ray Spectroscopy (SEM/EDS) In order to expose a typical LP indication, a strip was saw cut from the tubesheet and placed on two supports. A compressive load was applied at midpoint on opposite side, as indicated in Figure 4 and illustrated in Figure 5. Load was applied to side opposite the internal surface to avoid compressive damage to the surfaces of the LP indication as the load was being applied. As indicated by arrows in Figure 5 and shown in Figure 6, the three-point compressive load opened up pre-existing cracks at the internal surface and on the bore surface. After rinsing in acetone to remove traces of the liquid penetrant developer, the exposed crack that is indicated by yellow arrow and in Figure 6, was microscopically examined with a scanning electron microscope (SEM) equipped with an energy-dispersive X-ray spectrometer (EDS) microprobe. EDS is capable of semi-quantitatively determining elemental compositions of material whose atomic number is greater than 5 (boron). Although considered reliable, EDS analysis results would not necessarily coincide with bulk analysis results. Extensive analyses were performed to ensure that all relevant information was captured. Images were captured to document representative results of SEM examination. EDS results are tabulated beneath the SEM images that show the locations of the analyses.

(Client) Report #: 14-324-SBR-v1 August 7, 2014
Note Disclaimer Page 1 Page 4 of 37
As shown in SEM images presented in Figure 7, cracks at internal surface (yellow arrow) and in bore surface were longitudinal and parallel to each other. Locations of Figure 8 and 10 are indicated in Figure 7. Elemental compositions of surface at enumerated areas in Figures 8 and 10 were determined by EDS. Results, in weight percent, are presented in Figures 9, 11, 12, 13, and 14 and summarized as follows: Element
Location 1, Figure 8
Location 1, Figure 11
Location 2, Figure 12
Location 3, Figure 13
Location 4, Figure 14
Carbon ND 3.7 1.5 2.6 2.9 Oxygen 19.3 43.9 12.1 26.3 18.2 Silicon 0.8 4.4 0.7 1.6 0.8 Phosphorus 0.1 ND ND ND ND Sulfur 1.4 2.0 0.7 1.4 0.8 Chlorine 0.3 ND ND ND ND Calcium ND 0.4 ND 0.3 0.1 Chromium 23.8 37.0 25.6 29.8 20.7 Iron 46.2 4.5 52.9 32.7 49.9 Nickel 8.2 4.1 6.6 5.2 6.6 ND= none detected Subsequent to initial SEM/EDS analyses of crack surface, sample was ultrasonically cleaned in a solution of soap (Alconox) and water and re-examined. As shown in Figures 15 and 17, morphology of crack surface was transgranular and exhibited a “feathered’ appearance. These features are characteristic of stress corrosion cracking (SCC). EDS analyses were performed on the thoroughly cleaned surface at location indicated in Figure 15. Results, in weight percent, are present in Figure 16 and as listed below.
Element
Location 1, Figure 16
Carbon 1.8 Oxygen 17.0 Silicon 0.8 Sulfur 1.0 Calcium 0.1 Chromium 23.7 Iron 47.6 Nickel 8.0
Elemental composition of deposits adhered to crack surface consisted of metal oxides as indicated by elevated levels of oxygen which would be in form of oxide since EDS cannot detect gases, in addition to alloying elements or chromium, iron, and nickel. Deposits also contained significant amount of sulfur and silicon and trace amounts of phosphorus, chlorine, and calcium. Sulfur bearing material was tenaciously adhered as evidenced by its presence even after thorough cleaning. Other than sulfur content and trace amount of chlorine (chloride) there were no aggressive elements detected by EDS analyses.

(Client) Report #: 14-324-SBR-v1 August 7, 2014
Note Disclaimer Page 1 Page 5 of 37
Metallographic Examination Two sections, identified as 1-1 and 2-2 in Figure 18, were cut through LP crack indications and prepared for metallographic examination in accordance with ASTM E3, Standard Guide for Preparation of Metallographic Specimens. Orientation of metallographic specimen 1 was perpendicular to tube hole axis and orientation of metallographic specimen 2 was perpendicular to internal surface. Prepared specimens were examined before and after etching in Kalling’s reagent. Photomacrographs of specimen 1, before and after etching, are presented in Figure 19. Cracks emanating from bore at locations indicated by yellow, green, red, and orange boxes in Figure 19 are shown at higher magnifications in Figures 20 through 25. All cracks were primarily transverse (propagated through grains rather than along grain boundaries) and branched. Branched transgranular cracks are characteristic of SCC. Microstructure consisted of austenite with carbide precipitates along their grain boundaries, as typified by arrows in Figure 22. Austenitic grain sizes varied from medium to large. Photomacrograph of specimen 2, before and after etching, are presented in Figure 26 with a yellow and green boxes indicating location of Figures 27 through 30. As indicated by blue arrows in bottom photomacrograph presented in Figure 26, some grains were large and longitudinally elongated. As indicated by colored arrows in Figure 27, cracks at the examined plane of specimen 2, were comprised of intersecting offset branched transgranular cracks, characteristic of SCC. Austenitic grain size varied. Largest longitudinally-oriented grains were evident, as indicated by arrow in Figure 29. Austenitic matrix with carbide precipitates along grain boundaries of specimen 2, as shown in Figures 31 and 32 was similar to that of specimen 1. Carbide precipitation along grain boundaries and varying grain size indicated that the internal surface of the tubesheet was exposed to temperatures within the sensitization range for austenitic stainless steel, as explained in Discussion section of this report. Chemical Analysis Chemical composition of tube sheet was determined by optical emission spectroscopy. Results, in weight percent, are presented in Table 2. Chemical compositions of ASTM A182 grade F304L are listed for reference. As tabulated in Table 2, chemical composition satisfied requirements specified in ASTM A182 grade F304L. Mechanical Properties Four tension test specimens were prepared and tested in accordance with ASTM E8, Standard Test Methods for Tension Testing of Metallic Materials. As indicated in Figure 33, transverse specimens were prepared near each surface and midwall and a longitudinal specimen was machined so that its reduced section would be at midwall of tube sheet. Results are presented in Table 3. Tensile properties of ASTM A182 gradeF304L are listed for reference. As tabulated in Table 3, mechanical properties of the tube sheet satisfied requirements specified in ASTM A182 grade F304L.

(Client) Report #: 14-324-SBR-v1 August 7, 2014
Note Disclaimer Page 1 Page 6 of 37
Discussion Root cause of the LP indications on internal surface of tubesheet was stress corrosion cracking (SCC), as indicated by the branched transgranular offset cracks detected by metallographic examination. SCC is caused by a combination of corrosion and stress and is always perpendicular to principle stress direction. Orientation of SCC in the submitted tubesheet indicated that primary stress was radial. SCC produces tight branched cracks that are often difficult to see with an unaided eye. Stresses may be applied or residual and less than steel’s tensile strength. Particular alloys are susceptible to SCC by specific corrodents. Austenitic stainless steels, for instance, are highly susceptible to SCC by chlorides but not ammonia. Only a trace amount of chlorine was detected by EDS; however, because chlorides are very soluble it is common that they are washed away subsequent to attack or during handling. In addition to stress and specific corrodent, other factors contribute to SCC, such as temperature, pH, time, concentration of corrodent, presence of oxidizing agents, and alternating wetting and drying. Although there was no intergranular oxidation/corrosion observed, metallographic examination showed that the tubesheet exhibited carbide precipitation along its austenitic grain boundaries which is indicative of sensitization. Sensitization which makes stainless steels susceptible to intergranular oxidation/corrosion happens when the material is held too long within the temperature range of 500°C (932°F) and 850°C (1562°F) and chromium carbides precipitate at grain boundaries. The chromium that precipitates into chromium carbides diffuses from the surrounding metal next to the grain boundaries; thus as a result of chromium carbide precipitation, chromium depletion zone develops along the grain boundaries. Depleted areas exhibit less resistance to aggressive and/or oxidizing environments. Their resistance is generally equivalent to non-stainless steel. Mixed grain size also indicated that tubesheet was exposed to temperatures within the sensitization range, either by inappropriate cooling during manufacturing or by exposure to elevated temperatures during service. Normally, great care is given during manufacturing and welding not to allow austenitic stainless steels to remain within the sensitizing temperature range long enough to cause sensitization. Equal care must be given during service not to permit sensitization. Chemical analysis and tension testing showed that tubesheet was manufactured with austenitic stainless steel whose chemical composition and tensile properties satisfied requirements specified in ASTM A182 for Grade F304L.

(Client) Report #: 14-324-SBR-v1 August 7, 2014
Note Disclaimer Page 1 Page 7 of 37
Table 1 Results of Liquid Penetrant Examination
Row Number
No of Tubes in Row
Tube Numbers That Did Not Exhibit LP Indications
1 38 29, 30 2 41 34, 36, 37 3 43 22, 31, 32, 33, 35, 36, 37, 38 4 43 1, 37, 38, 39 5 43 14, 16, 17, 20, 21, 22, 30, 31, 36, 37, 38, 41 6 43 15, 20, 21, 23, 33, 34, 35, 36, 37, 38, 43 7 41 1, 6, 16, 20, 21, 23, 27, 30, 31, 32, 33, 34, 36, 37, 39, 40, 41 8 41 5, 20, 27, 28, 31, 32, 33, 34, 35, 36, 37, 41 9 39 5, 14, 15, 24, 27, 30, 32, 33, 34, 35 10 39 6, 19, 20, 21, 22, 23, 26, 27, 31, 33 11 37 3, 4, 23, 24, 25 12 35 None 13 35 None 14 33 17, 21, 24, 29 15 31 16, 20, 23, 24 16 29 24, 25, 26, 27 17 25 13, 18, 25 18 13 10
Table 2 Results of Chemical Analysis of Tube Sheet
Element Tube Sheet ASTM A182 Grade F304L Carbon 0.024 0.03 max. Manganese 1.72 2.00 max. Phosphorus 0.034 0.045 max. Sulfur 0.001 0.030 max. Silicon 0.35 1.0 max. Chromium 18.25 18.0 – 20.0 Nickel 8.56 8.00 – 11.00 Molybdenum 0.40 NS Nitrogen NT 0.10 - 0.16 Copper 0.038 NS Vanadium 0.06 NS
NT = Not Tested NS = Not Specified

(Client) Report #: 14-324-SBR-v1 August 7, 2014
Note Disclaimer Page 1 Page 8 of 37
Table 3 Results of Tension Test of Tube Sheet
Location
Orientation
Yield Strength*, psi
Tensile Strength, psi
Elongation in 2” gage length, %
Reduction of Area %
1 Transverse 33,100 81,000 64.0 76 2 Transverse 31,800 81,000 64.0 76 3 Transverse 32,900 79,500 65.5 73 4 Longitudinal 32,200 79,500 47.0 49
ASTM A182 Grade F304L 25,000 70,000 30 50 *at 0.2% offset

(Client) Report #: 14-324-SBR-v1 August 7, 2014
Note Disclaimer Page 1 Page 9 of 37
Figure 1: Photograph of internal surface of tube sheet, as received.
(Client) Report #: 14-324-SBR-v1 August 7, 2014
Note Disclaimer Page 1 Page 10 of 37
Figure 2: Drawing of internal surface of tube sheet. Inside surface of hot side of tube sheet exhibited LP indications in all areas except around tube holes indicated in black. There were no LP indications on the return side of the tube sheet.
Hot Side
Return Side
Row 1
Row 18
Row 18
Row 1

(Client) Report #: 14-324-SBR-v1 August 7, 2014
Note Disclaimer Page 1 Page 11 of 37
Figure 3: Photograph showing typical LP indications on bore and hot side of internal tubesheet surface.

(Client) Report #: 14-324-SBR-v1 August 7, 2014
Note Disclaimer Page 1 Page 12 of 37
Figure 4: Drawing illustrating three point loading configuration used to break open crack that was detected by LP examination.

(Client) Report #: 14-324-SBR-v1 August 7, 2014
Note Disclaimer Page 1 Page 13 of 37
Figure 5: Drawing illustrating intentionally exposed crack surface. LP crack indications on bore surface opened up during course of three-point loading as shown in Figure 6.
Freshly exposed fracture surface. Exposed LP indication
LP crack indications on bore surface up during three point loading

(Client) Report #: 14-324-SBR-v1 August 7, 2014
Note Disclaimer Page 1 Page 14 of 37
Figure 6: Photograph of exposed surface of LP indication. Yellow arrows point to LP indications that were intentionally opened by three-point loading and shown in Figures 7 (right side), 8, 10, 15, and 17. Longitudinal offset and parallel cracks that were exposed on bore surface as a result of three-point loading are indicated by green arrows and shown at higher magnification on left side of Figure 7.

(Client) Report #: 14-324-SBR-v1 August 7, 2014
Note Disclaimer Page 1 Page 15 of 37
Figure 7: SEM montage images of cracks in bore surface (left) and surface of intentionally exposed LP crack indication (right). Yellow arrows point to cracks that were revealed by LP examination. Location of Figure 8 is indicated by yellow box. Individual images of both montages were captured at 20X magnification.

(Client) Report #: 14-324-SBR-v1 August 7, 2014
Note Disclaimer Page 1 Page 16 of 37
Figure 8: SEM image of exposed crack surface (LP indication) after cleaning with acetone. EDS analysis was performed where indicated. Results are presented in Figure 9. Image captured at 35X magnification.
Figure 9: Results of EDS analysis performed on crack surface at location indicated in Figure 8.

(Client) Report #: 14-324-SBR-v1 August 7, 2014
Note Disclaimer Page 1 Page 17 of 37
Figure 10: SEM image of intentionally exposed crack surface (LP indication) after rinsing in acetone. EDS analyses were performed at enumerated locations. Image captured at 300X magnification.
Figure 11: Results of EDS analysis performed on crack surface at location 1, as indicated in Figure 10.

(Client) Report #: 14-324-SBR-v1 August 7, 2014
Note Disclaimer Page 1 Page 18 of 37
Figure 12: Results of EDS analysis performed on crack surface at location 2, as indicated in Figure 10.
Figure 13: Results of EDS analysis performed on crack surface at location 3, as indicated in Figure 10.

(Client) Report #: 14-324-SBR-v1 August 7, 2014
Note Disclaimer Page 1 Page 19 of 37
Figure 14: Results of EDS analysis performed on crack surface at location 4, as indicated in Figure 10.

(Client) Report #: 14-324-SBR-v1 August 7, 2014
Note Disclaimer Page 1 Page 20 of 37
Figure 15: SEM image of exposed crack (LP indication) after thorough cleaning. EDS analyses performed at location indicated above. Image captured at 35X magnification.
Figure 16: Results of EDS analysis performed on crack surface at location indicated in Figure 15.

(Client) Report #: 14-324-SBR-v1 August 7, 2014
Note Disclaimer Page 1 Page 21 of 37
100X magnification
300X magnification
Figure 17: SEM images of crack (LP indication) surface at location indicated in Figure 15. Feathered transgranular morphology is characteristic of SCC. Images captured at magnifications indicated above.

(Client) Report #: 14-324-SBR-v1 August 7, 2014
Note Disclaimer Page 1 Page 22 of 37
Figure 18: Drawing showing locations and orientation of prepared metallographic specimens 1 and 2.
1 1
2 2
Internal Surface
Edge of Internal Surface
Bore Surface
Edge of Bore Surface

(Client) Report #: 14-324-SBR-v1 August 7, 2014
Note Disclaimer Page 1 Page 23 of 37
As polished
Kalling’s reagent
Figure 19: Photomacrograph of metallographic specimen 1, as polished and after being etched. Locations of Figures 20 through 25 are indicated by colored boxes.
Figure 20
Figure 23
Figures 21 and 22
Figures 24 through 25

(Client) Report #: 14-324-SBR-v1 August 7, 2014
Note Disclaimer Page 1 Page 24 of 37
50X magnification
200X magnification
Figure 20: Photomicrographs showing branched cracks at location indicated in Figure 19 by yellow box. Images captured at magnifications indicated above.

(Client) Report #: 14-324-SBR-v1 August 7, 2014
Note Disclaimer Page 1 Page 25 of 37
Figure 21: Photomicrograph of specimen 1 after etching at location indicated by red box in Figure 19. Branched transgranular cracks are characteristic of SCC. Location of Figure 22 is indicated by blue box. Image captured at 50X magnification.

(Client) Report #: 14-324-SBR-v1 August 7, 2014
Note Disclaimer Page 1 Page 26 of 37
100X magnification
200X magnification.
Figure 22: Photomicrographs showing transgranular branched cracks at location that is indicated by blue box in Figure 21. Arrows point to carbide precipitates along grain boundaries. Images captured at magnifications indicated above.

(Client) Report #: 14-324-SBR-v1 August 7, 2014
Note Disclaimer Page 1 Page 27 of 37
50X magnification
200X magnification
Figure 23: Photomicrographs showing branched cracks at location indicated by green box in Figure 19. Images captured at magnifications indicated above.

(Client) Report #: 14-324-SBR-v1 August 7, 2014
Note Disclaimer Page 1 Page 28 of 37
50X magnification
Figure 24: Photomicrographs showing branched cracks at location indicated by orange box in Figure 19. Images captured at magnifications indicated above. Location of Figure 25 is indicated by blue box.

(Client) Report #: 14-324-SBR-v1 August 7, 2014
Note Disclaimer Page 1 Page 29 of 37
Figure 25: Photomicrograph of branched transgranular branched crack and carbide precipitates along grain boundaries at area indicated by blue box in Figure 24. Image captured at 200X magnification.

(Client) Report #: 14-324-SBR-v1 August 7, 2014
Note Disclaimer Page 1 Page 30 of 37
As polished
Kalling’s reagent
Figure 26: Photomacrograph of metallographic specimen 2, as polished and after being etched. Locations of Figures 20 through 25 are indicated by colored boxes.

(Client) Report #: 14-324-SBR-v1 August 7, 2014
Note Disclaimer Page 1 Page 31 of 37
Figure 27: Montage photomicrograph of cracks at location indicated by yellow box in Figure 26. Location of Figure 28 is indicated by blue box. Overall crack, at examined plane, was comprised of individual branched cracks, indicated by colored arrows. Individual photomicrographs captured at 50X magnification. As polished.
(Client) Report #: 14-324-SBR-v1 August 7, 2014
Note Disclaimer Page 1 Page 32 of 37
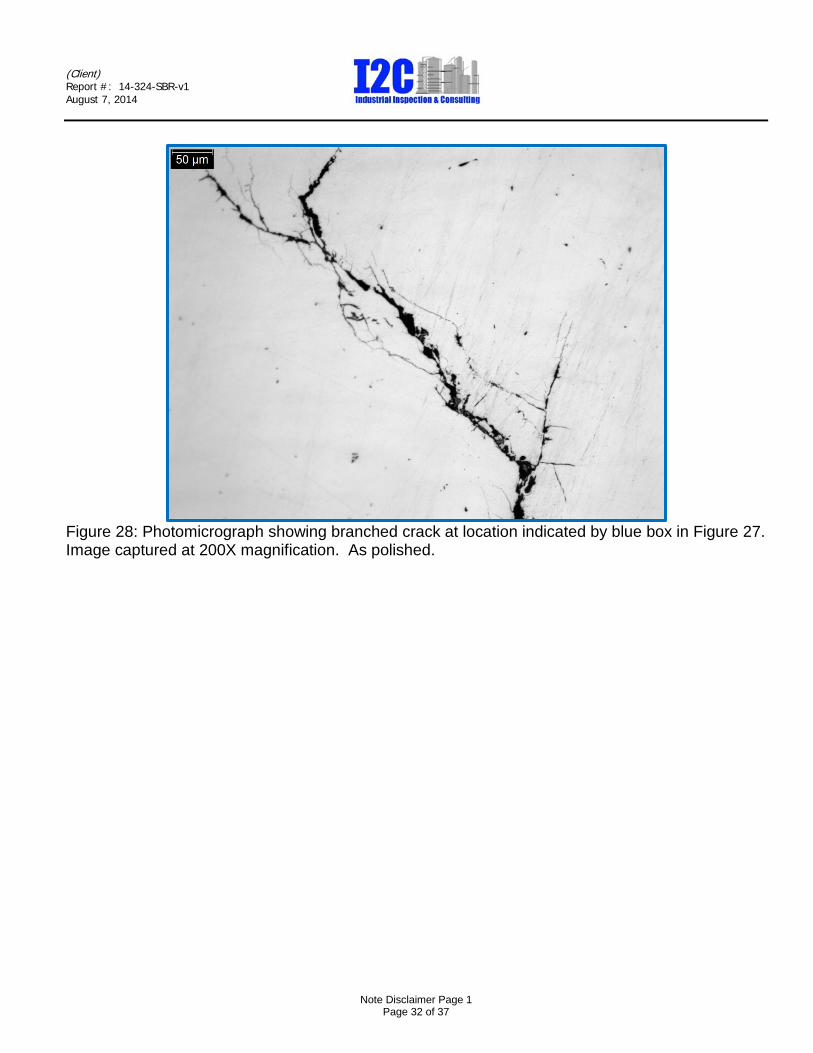
Figure 28: Photomicrograph showing branched crack at location indicated by blue box in Figure 27. Image captured at 200X magnification. As polished.

(Client) Report #: 14-324-SBR-v1 August 7, 2014
Note Disclaimer Page 1 Page 33 of 37
Figure 29: Same as Figure 27 after etching in Kalling’s reagent. Note enlarged grain size (blue arrow) and intergranular crack propagation. Crack on left did not extend to surface at examined plane. Location of Figures 30, 31, and 32 are indicated by blue, yellow, and green boxes.

(Client) Report #: 14-324-SBR-v1 August 7, 2014
Note Disclaimer Page 1 Page 34 of 37
100X magnification
200X magnification
Figure 30: Photomicrographs showing branched transgranular cracks and carbide precipitates along grain boundaries.
(Client) Report #: 14-324-SBR-v1 August 7, 2014
Note Disclaimer Page 1 Page 35 of 37
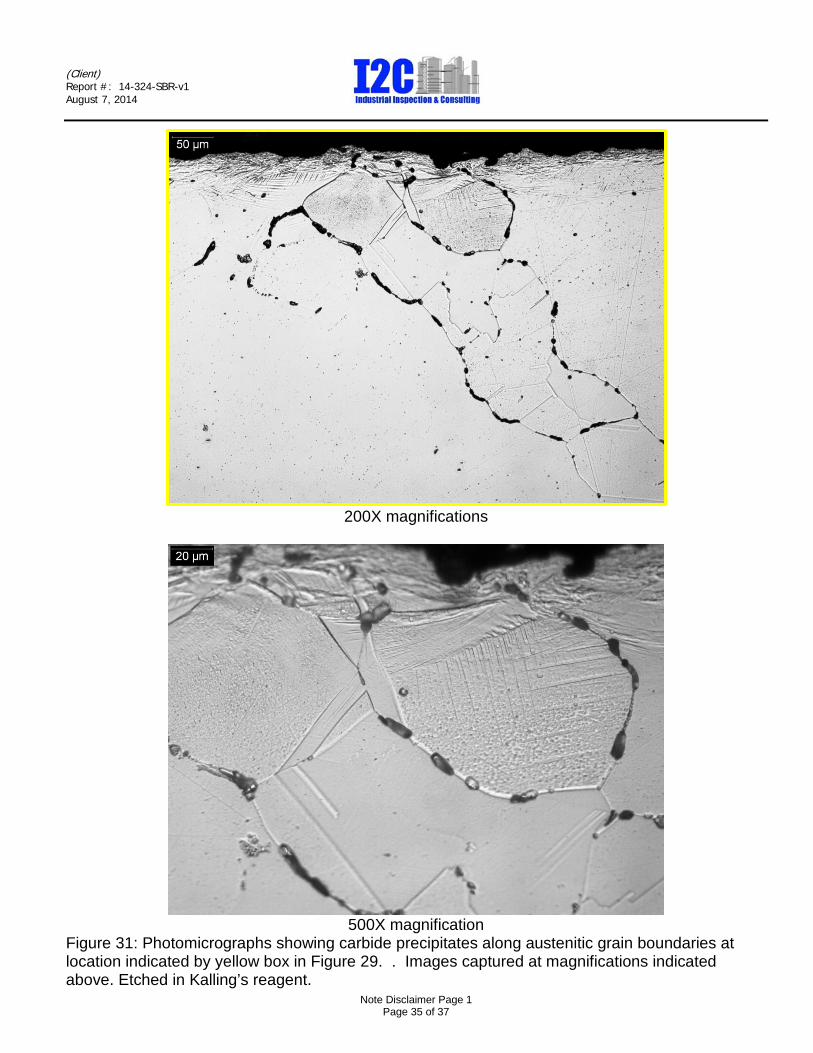
200X magnifications
500X magnification
Figure 31: Photomicrographs showing carbide precipitates along austenitic grain boundaries at location indicated by yellow box in Figure 29. . Images captured at magnifications indicated above. Etched in Kalling’s reagent.

(Client) Report #: 14-324-SBR-v1 August 7, 2014
Note Disclaimer Page 1 Page 36 of 37
200X magnification
500X magnification
Figure 32: Photomicrographs showing carbide precipitates along austenitic grain boundaries at location indicated by green box in Figure 29. Images captured at magnifications indicated above. Etched in Kalling’s reagent.

(Client) Report #: 14-324-SBR-v1 August 7, 2014
Note Disclaimer Page 1 Page 37 of 37
Figure 33: Drawing showing locations of tension test specimens.
Hot Side
Return Side
Edge of Internal Surface