Sensitivity of the bank stock returns distribution to changes in the level and volatility of...
29
Sensitivity of the bank stock returns distribution to changes in the level and volatility of interest rate: A GARCH-M model Elyas Elyasiani a, * , Iqbal Mansur b,1 a Department of Finance, School of Business & Management, Temple University, Speakman Hall, Philadelphia, PA 19122, USA b School of Management, Widener University, One University Place, Chester, PA 19013, USA Received 11 March 1995; accepted 12 January 1998 Abstract The objective of this paper is to employ the generalized autoregressive conditionally heteroskedastic in the mean (GARCH-M) methodology to investigate the eect of inte- rest rate and its volatility on the bank stock return generation process. This framework discards the restrictive assumptions of linearity, independence, and constant conditional variance in modeling bank stock returns. The model presented here allows for shifts in the volatility equation in response to the changes in monetary policy regime in 1979 and 1982 to be estimated. ARCH, GARCH, and volatility feed back eects are found to be significant. Interest rate and interest rate volatility are found to directly impact the first and the second moments of the bank stock returns distribution, respectively. The latter also aects the risk premia indirectly. The degree of persistence in shocks is substantial for all the three bank portfolios and sensitive to the nature of the bank portfolio and the prevailing monetary policy regime. Ó 1998 Elsevier Science B.V. All rights reserved. JEL classification: G12; G21; C52 Keywords: Bank stocks; GARCH; Interest rate risk Journal of Banking & Finance 22 (1998) 535–563 * Corresponding author. Tel.: 1 215 204 5881; fax: 1 215 204 5698; e-mail: [email protected] ple.edu. 1 Tel.: 1 610 499 4321. 0378-4266/98/$19.00 Ó 1998 Elsevier Science B.V. All rights reserved. PII S0378-4266(98)00003-X
Transcript of Sensitivity of the bank stock returns distribution to changes in the level and volatility of...

Sensitivity of the bank stock returns
distribution to changes in the level and
volatility of interest rate: A GARCH-M model
Elyas Elyasiani a,*, Iqbal Mansur b,1
a Department of Finance, School of Business & Management, Temple University, Speakman Hall,
Philadelphia, PA 19122, USAb School of Management, Widener University, One University Place, Chester, PA 19013, USA
Received 11 March 1995; accepted 12 January 1998
Abstract
The objective of this paper is to employ the generalized autoregressive conditionally
heteroskedastic in the mean (GARCH-M) methodology to investigate the e�ect of inte-
rest rate and its volatility on the bank stock return generation process. This framework
discards the restrictive assumptions of linearity, independence, and constant conditional
variance in modeling bank stock returns. The model presented here allows for shifts in
the volatility equation in response to the changes in monetary policy regime in 1979 and
1982 to be estimated. ARCH, GARCH, and volatility feed back e�ects are found to be
signi®cant. Interest rate and interest rate volatility are found to directly impact the ®rst
and the second moments of the bank stock returns distribution, respectively. The latter
also a�ects the risk premia indirectly. The degree of persistence in shocks is substantial
for all the three bank portfolios and sensitive to the nature of the bank portfolio and the
prevailing monetary policy regime. Ó 1998 Elsevier Science B.V. All rights reserved.
JEL classi®cation: G12; G21; C52
Keywords: Bank stocks; GARCH; Interest rate risk
Journal of Banking & Finance 22 (1998) 535±563
* Corresponding author. Tel.: 1 215 204 5881; fax: 1 215 204 5698; e-mail: [email protected]
ple.edu.1 Tel.: 1 610 499 4321.
0378-4266/98/$19.00 Ó 1998 Elsevier Science B.V. All rights reserved.
PII S 0 3 7 8 - 4 2 6 6 ( 9 8 ) 0 0 0 0 3 - X

1. Introduction
The issue of interest rate risk is of major interest to the banking, regulatory,and academic communities. In the 1970s and 1980s this issue attracted atremendous amount of attention because of the near collapse of the S&L indus-try and numerous bank failures brought about largely by high volatility ofinterest rates and strong interest rate sensitivity of the banking institutions.More recently, this issue has found new signi®cance because bank portfolioshave shifted away from commercial loans and toward securities at a dramaticpace. 2
As a step toward reducing their interest rate risk exposure, banks haveshortened their duration gaps, securitized loans, switched to o� balance sheetactivities, and taken positions in derivative products, changing the nature ofthe banking enterprise in the process. Concerns of the regulators over interestrate risk culminated in the passage of the FDIC Improvement Act (FDICIA)of 1991 which requires a revision of the risk-based capital standards to take ad-equate account of the interest rate risk. 3 Concomitant with these develop-ments, academic research assessing the interest rate risk exposure ofdepository institutions has proliferated. Although the literature in this area isvast, the ®ndings are dissimilar in terms of both magnitude and direction ofthe e�ect. Akella and Chen (1990) have attributed the dissimilarities in ®ndingsof the extant studies to di�erences in the choice of the interest rate variable andsample period, model speci®cation, and/or structural shifts. However, it is alsopossible that these di�erences have resulted from the limitations of the assetpricing frameworks adopted, including restrictive assumptions concerningthe functional form and distributional properties of the ®rst and secondmoments of the return generating process. For example, the assumptions oflinearity and returns independence, made in the extant studies, are challengedby Tinic and West (1986), Carroll and Wei (1988), and Akgiray (1989), whilePerry (1982), Pindyck (1984), Poterba and Summers (1986), Akgiray andBooth (1988), and Carroll et al. (1992), present evidence inconsistent withthe assumption of constant conditional variance of returns over time.Relaxation of these restrictive assumptions has been shown to alter theconclusions reached concerning the properties of the return generatingprocess in general (Akgiray, 1989) and may have a similar e�ect in the bankingsector.
The objective of this paper is to employ the generalized autoregressive con-ditionally heteroskedastic in the mean (GARCH-M) methodology to investi-
2 Neuberger (1993) reports that between 1990 and 1993 holdings of securities grew over 35%
while loans to businesses actually declined.3 This provision is included in Section 305 of FDICIA.
536 E. Elyasiani, I. Mansur / Journal of Banking & Finance 22 (1998) 535±563

gate the e�ect of interest rate and its volatility on the bank stock return gener-ation process. This framework discards the restrictive assumptions of linearity,independence, and constant conditional variance. In addition, this frameworkallows an extension of the literature by investigating the e�ect of changes in theinterest rate volatility on the second, and indirectly on the ®rst, moment of thereturn generating process and delineating the time-varying nature of risk pre-mia. These e�ects are generally overlooked in the banking literature. 4 Al-though the analysis of the interest rate e�ect on bank stock returns withoutconsidering its e�ect on bank riskiness can produce misleading policy conclu-sions, the latter e�ect is also overlooked in the banking literature. The paperunfolds as follows. In Section 2 the literature on interest sensitivity of bankstock returns is reviewed. Section 3 presents the data and the methodology,and Section 4 is allocated to discussion of empirical results. Section 5 presentsthe conclusions.
2. Literature review
Early studies of bank interest rate sensitivity include the works of Stone(1974), Lloyd and Shick (1977), Chance and Lane (1980), Lynge and Zumwalt(1980), Flannery and James (1984), Booth and O�cer (1985), Scott and Peter-son (1986), and Bae (1990). These authors all apply a two-index model (marketand interest rate factors) to bank equity returns under the assumption of con-stant variance error terms. The ®ndings of these studies are dissimilar in termsof both the magnitude and direction of the e�ects.
Some of the recent studies provide evidence against constancy of the condi-tional variance and in favor of time-varying risk premia. Using a switching re-gression technique, Kane and Unal (1988) report that interest rate sensitivity ofbank stock returns varies signi®cantly over time. In particular, they ®nd thatthe interest rate beta shifted down sharply in the early 1980s and went backup a few years later. Kwan (1991) develops a two-index random coe�cientmodel of bank stock returns to investigate the time-varying interest rate sensi-tivity of banks. He reports that bank stock returns are related to unanticipatedchanges in the level of interest rate and that the time-varying magnitude of thee�ect can be explained by the maturity composition of bank assets and liabil-ities.
Saunders and Yourougou (1990) and Yourougou (1990) contrast thee�ect of interest rate changes on bank and non-bank ®rms during periods of rel-ative interest rate stability (pre-October 1979) and high interest rate volatility
4 For a detailed review of ARCH type modeling in ®nance, see Bollesrev et al. (1992).
E. Elyasiani, I. Mansur / Journal of Banking & Finance 22 (1998) 535±563 537

(post-October 1979) and report that interest rate e�ects vary substantially overtime. Speci®cally, Yourougou (1990) ®nds that, during the period of relativeinterest rate stability, interest rate sensitivity was low and insigni®cant for bothbanks and non-bank ®rms, while in the post-October 1979 period, interest raterisk exerted a signi®cant impact on common stocks of ®nancial intermediariesbut not the industrial ®rms. Choi et al. (1992) extend the existing models to in-clude exchange rate risk and ®nd that interest rate and exchange rate sensitiv-ities di�er in the pre- and post-1979 periods. Wetmore and Brick (1994), usingthe Choi et al. (1992) methodology also ®nd that the coe�cients of market risk,interest rate risk, and foreign exchange risk are time dependent and di�er bybank type.
Song (1994) was the ®rst study to employ the ARCH-type methodology inbanking. Song ®nds that ARCH-type modeling is the appropriate frameworkfor analysis of bank stock returns. According to his results, market and interestrate risk measures of banks do vary signi®cantly over time; while these mea-sures did not change signi®cantly around October 1979 in response to the shiftin the monetary policy strategy, they did increase around the end of 1982 whenthe Fed switched to targeting borrowed reserve. Neuberger (1994) employs aGARCH model to estimate factor volatilities as determinants of risk premia.He estimates a ®ve-factor model of individual bank holding company stock re-turns, where the factors are proxied by sub-sample portfolios of assets as wellas excess returns on market and interest rates. Neuberger's paper is based onthe econometric model put forward by Engle et al. (1990b) and Ng et al.(1992) and allows for a system estimation of returns on a number of assets.He ®nds evidence in favor of equity market contagion pervading bank stocks.Especially, he ®nds evidence of strong industry e�ects in the market for bankequities indicating prevalence of common risks among banking ®rms and across-over e�ect mostly from large banks to smaller banks.
Flannery et al. (1997) demonstrate that both the market risk and interestrate risk are priced factors. However, the e�ect of the interest rate risk is foundto be less strong when the authors test the joint hypotheses that the linear fac-tor pricing is valid and that interest rate risk is priced. In addition, these au-thors ®nd that the market factor volatility varies signi®cantly through timeand its variation is priced into the expected returns of di�erent securities.The equilibrium price for bearing interest rate risk is also found to vary overtime in tandem with interest rate volatility.
The work of Kane and Unal (1988), Kwan (1991), Yourougou (1990), Song(1994), Neuberger (1994) and Flannery et al. (1997) provide strong evidencethat the bank stock return generating process is time-dependent and shouldbe modeled as such. Hence, to avoid possible bias and inconsistency in modelparameters, risk measures should be allowed to vary over time and to be re¯ec-tive of the observed time variations in bank stock volatility. The GARCH-Mmodeling followed here satis®es this requirement. The advantages of this mod-
538 E. Elyasiani, I. Mansur / Journal of Banking & Finance 22 (1998) 535±563

el over the ARCH and GARCH techniques will be discussed in the next sec-tion. 5
3. Data and methodology
3.1. Data description
The sample consists of 56 commercial bank stocks traded on the New Yorkand American stock exchanges. The time period of the study is from January1970 to December 1992. Monthly returns, including dividend yields, are ob-tained from the Compustat PDE tapes. The ten-year Treasury Composite yieldis utilized as the long-term interest rate index and is obtained from the Citibasedata tape. Interest rate volatility is measured by the conditional variance of thelong-term interest rate which is generated using an ARCH(1) model. The orderof the ARCH process is determined by a procedure based on the Lagrangemultiplier principle, proposed by Engle (1983). 6
Along the lines followed by Song (1994), the sample is disaggregated by sizeinto three portfolios ± the Money Center bank portfolio (10 banks), the Largebank portfolio (14 banks) and the Regional bank portfolio (32 banks). 7 For-mation of portfolios provides an e�cient way for condensing a substantialamount of information about bank stock return behavior and it has the advan-tage of smoothing out the noisiness in the data, due to transitory shocks to in-dividual ®rms. These shocks may, otherwise, distort the results signi®cantly.The disadvantage of this approach, however, is that it masks the dissimilaritiesamong banks within each portfolio. The advantages of using monthly data aretwofold. First, with monthly data a longer historical period may be manage-ably included in the sample and that tends to better re¯ect long-term move-ments in volatility. Second, with monthly data, settlements and clearing
5 Neuberger and Flannery et al. studies were unpublished when this paper was written. The latter
was published at the time of the ®nal submission of this paper.6 To construct the conditional variance of the interest rate, the interest rate index is modeled as
an ARCH process. An AR(12) model is determined to be optimal as the mean equation for this
process. The residuals from this process are free from serial correlation, as shown by statistically
insigni®cant v2 values (the v2 values are: Q(12)� 2.24, Q(18)� 8.81, and Q(24)� 18.09).
Additionally, the skewness, kurtosis and Jarque and Bera (1981) Lagrange Multiplier values are
all signi®cant. The skewness and kurtosis values are 5.45 and 44.69, respectively. Jarque and Bera
(1981) Lagrange Multiplier value is found to be 20429. The order of the ARCH process is
determined by the procedure, based on the Lagrange Multiplier principle, proposed by Engle
(1983). The test values for orders 1, 4, 8, and 12 are 6.85, 27.34, 30.37, and 37.02, respectively.
Based on these results, the conditional variance of interest rate is modeled as an ARCH(1) process.7 Appendix A contains the bank names.
E. Elyasiani, I. Mansur / Journal of Banking & Finance 22 (1998) 535±563 539

delays, which are found to be a signi®cant determinant of returns in the dailydata, are less relevant and can be safely ignored (Baillie and DeGennaro, 1990).
The sample consists of the largest US banks with complete data over thesample period. As a result, it excludes ®rms which failed, were acquired, orhave missing data during this period. A survivorship bias may exist in the dataif the excluded banks are the failing and poorly performing ®rms. This is be-cause in this case the returns on the high performance banks are and thoseof the failed banks are not included in the sample. Mergers and acquisitionsof large banks in the 1980s, however, were neither limited to nor dominatedby acquisition of poorly performing banks. On the contrary, many banks wereacquired exactly because they were performing well and many more were ac-quired mostly for the purposes of cost economies, complementarities, marketdiversi®cation, and strength to withstand domestic and global competition. 8
Under this condition, it is likely that stock returns of the high and low perfor-mance banks acquired during this period average out, making the magnitudeof the bias scant and ignorable. In addition, many ®rms have missing datafor reasons quite unrelated to size, performance, and hence, survivorship bias.In any case, since no precision can be attached to survivorship bias, makingassumptions about the behavioral patterns of the bias and how it a�ectsperformance may be as bad as ignoring it (Blitzer, 1995; Garcia and Gould,1993).
3.2. Methodology
3.2.1. Features of ARCH and GARCH type modelsA growing body of research has recently been directed towards investigation
of conditional variance models of stock market behavior. These models includethe autoregressive conditional heteroskedastic model (ARCH) introduced byEngle (1982), the generalized autoregressive conditional heteroskedastic model(GARCH) proposed by Bollerslev (1986), and the ARCH and GARCH in themean (ARCH-M, GARCH-M) extensions introduced by Engle et al. (1987).
The general GARCH (p, q)-M model can be described by the system ofequations (1)±(3) below:
yt � /xt � cht � et; �1�
8 It is generally agreed that survivorship bias is particularly relevant to the small and poorly
performing ®rms. For example, Malkiel (1995) points out that in analysis of the mutual funds
industry, survival bias is mostly due to attrition of small funds that performed poorly and were shut
down or merged into other funds. Consolidation of healthy large ®rms in recent years (outside the
sample) includes the merger of Chemical and Chase. Along these lines, Blitzer (1995) points out
that ``many of the best stocks of the 1980s, in performance terms, cannot be bought in the 1990s
because they were taken over in mergers and LBOs''.
540 E. Elyasiani, I. Mansur / Journal of Banking & Finance 22 (1998) 535±563

ht � a0 �Xp
i�1
aie2tÿi �
Xq
i�1
bihtÿi; �2�
ej;tjXtÿ1 � N�0; ht�; �3�
where yt is the excess return or risk premium, xt is an exogenous, or predeter-mined, vector of variables, et is a random error, ht is the conditional variance ofet, and X is the information set. /, c, a0, ai, and bi are parameter vectors or sca-lars with appropriate dimensions, and t is a time index. The GARCH (p, q)-Mmodel described by Eqs. (1)±(3) allows for excess returns yt to be determinedby the vector xt and own conditional variances. The conditional variance (ht)is linearly dependent on the past behavior of the squared errors and a movingaverage of the past conditional variances. The use of squared error terms im-plies that if innovations have been large in absolute value, they are likely tobe large also in the future. The ai values determine the weights attached tothe lagged innovations. To ensure a well de®ned process, parameters a0, ai,and bi must be non-negative. The above set up is very general and allows fora variety of heteroskedasticity parameterizations. For example, when c is setto equal zero, the model reduces to GARCH. If, in addition, all the coe�cientsin Eq. (2), except the intercept term a0, are zero (ai� bi� 0), the model will re-duce to the traditional constant variance speci®cation. The parameter a0 is thetime independent component of risk and is shared by all the models discussedabove.
The common feature of ARCH and GARCH models is that they specify theconditional variance as a function of the past shocks allowing volatility toevolve over time and permitting volatility shocks to persist. The distinction be-tween these two methodologies is that while ARCH incorporates a limitednumber of lags in derivation of the conditional variance, GARCH allows alllags to exert an in¯uence by including the past value of the conditional varianceitself, in addition to the past values of the squared errors. Thus, ARCH modelsare considered to be short memory models while GARCH models are of thelong memory category.
In the ARCH-M and GARCH-M models the mean of the returns series isspeci®ed as an explicit function of the conditional variance of the process, allow-ing for a ``velocity feed back'' e�ect and consideration of time varying risk pre-mia. The importance of this family of models is that, unlike the basic ARCHand GARCH models, they portray the fundamental trade-o� relationship be-tween expected returns and the volatility measure (ht), with the coe�cient c cap-turing the dynamic pattern of the changing risk premium over time. Injusti®cation of this framework, Engle et al. (1987) introduced a theoretical mod-el that establishes a link between mean returns and the volatility measure (ht).Incorporation of this link in model speci®cation is clearly a step forward inbringing the empirical models closer to asset pricing theories such as the CAPM
E. Elyasiani, I. Mansur / Journal of Banking & Finance 22 (1998) 535±563 541

and the APT in which ex-ante returns are related to the conditional variance ofreturns (Sharp, 1964; Lintner, 1965; Mossin, 1966; Ross, 1976). Neuberger(1994) has pointed out that inclusion of ht in the mean equation is intuitivelyappealing because investors are not indi�erent to the volatility of the stocks theyhold; as uncertainty in stock returns varies, the risk premia required by investorswill also change. Incorporation of this e�ect has also been emphasized by Pin-dyck (1984) and French et al. (1987). The case for inclusion of ht in the meanequation has been strengthened in the recent decades due to the fact that returnvolatility has ¯uctuated over a much wider range during this period and it is es-pecially important in banking because in this industry the high leverage ratioand the prevalence of the contagion e�ect makes investors more sensitive tochanges in volatility than in the case of non-®nancial ®rms.
The trade-o� parameter c is interpreted as the coe�cient of relative riskaversion by Merton (1980) and Campbell and Hentschel (1992). Engle et al.(1987) show that the sign and the magnitude of this parameter depends on util-ity functions of the agents and the supply conditions of the assets. Hence, basedon these characteristics, c can take a positive, a negative, or a zero value. TheGARCH-M model has two advantages over the GARCH speci®cation. First,the basic GARCH model is based on the implicit assumption that the averagerisk premium is constant for the sample period. The GARCH-M speci®cationrelaxes this restriction by allowing the velocity feed back e�ect to become op-erational. In this framework, when c is statistically signi®cant, volatility (ht)does contribute to the risk premium so that the premia may di�er between pe-riods of relative instability and periods of tranquillity. Second, the GARCH-Mspeci®cation is a generalization of the GARCH, ARCH, and the traditionalconstant variance models commonly used. The GARCH-M model nests thelatter models as its special cases and allows a test of their validity, rather thanarbitrarily assuming that they are or are not valid. This ¯exibility feature is crit-ical for accuracy of the results because arbitrary imposition of the restriction(c� 0) implicit in the simpler models is likely to distort the ®ndings.
The degree of persistence in shocks to volatility is an important factor in de-termining the relationship between returns and volatility since only persistentvolatility changes warrant adjustment to the risk premium. All ARCH typemodels capture the tendency for shock persistence. A succinct measure ofthe shock persistence, as measured by the GARCH process, is the sum ofthe coe�cients ai + bi which must be less than or equal to unity for stabilityto hold. If the magnitude of this sum is close to unity, the process is said tobe integrated-in-variance, where the current information remains importantfor the forecasts of the conditional variance for all horizons (Engle and Boller-slev, 1986).
The economic theory explaining the intertemporal variations in conditionalvariances is limited. Lamoureux and Lastrapes (1990) argue that, on the microlevel, ARCH e�ects are manifestations of clustering in trading volumes. On the
542 E. Elyasiani, I. Mansur / Journal of Banking & Finance 22 (1998) 535±563
macro level, nominal interest rate, dividend yield, money supply, oil price, mar-gin requirement, business cycle and information patterns have all been pro-posed as the sources of volatility clustering (Bollesrev et al., 1992). Inparticular, Engle et al. (1990a) provide two possible explanations for volatilityclustering; news arrival process, and market dynamics in response to the news.First, if information arrives in clusters, returns may exhibit clustering even ifmarket incorporates the information perfectly and immediately. Second, if par-ticipants have heterogeneous priors and take time to digest the informationshocks and to resolve their expectational di�erences, market dynamics can leadto volatility clustering. As pointed out by Bollesrev et al. (1988), ``the GARCHspeci®cation does not arise directly out of any economic theory, but as in thetraditional autoregressive and moving average time series analogue, it providesa close parsimonious approximation to the form of heteroskedasticity typicallyencountered with economic time series data''.
3.3. Model speci®cation
The capital asset pricing model (CAPM) and the arbitrage pricing theory(APT) establish a theoretical foundation for an ex-ante trade-o� relationshipbetween risk and excess return. In theory, risk is to be measured by the condi-tional covariance of returns with the market, or the conditional variance of re-turns (Sharp, 1964; Lintner, 1965; Mossin, 1966; Ross, 1976). In practice,however, the actual (ex-post) values of excess return and risk, based on uncon-ditional distribution of returns, are used to carry out the empirical estimation,introducing a deviation from the theory. Application of the GARCH-M meth-odology to capital asset pricing theories presents an improvement in speci®ca-tion of asset pricing models as it allows measurement of the conditionalvariance of returns as the measure of risk hence, permitting risk to vary overtime and delineating the interdependence of risk and return. Bollerslev et al.(1992) consider the ARCH-M model as the ideal choice ``for handling ques-tions in a time series context where conditional variances of asset returns aretime-varying''.
Applications of ARCH-type methodology to the ®eld of ®nance in generaland to stock return modeling in particular are abundant. Glosten et al.(1993), Laux and Ng (1993), Campbell and Hentschel (1992), Ng et al.(1992), Engle et al. (1990b), Baillie and DeGennaro (1990), Lamoureux andLastrapes (1990), Bollesrev et al. (1988), Chou (1988), Diebold and Nerlove(1989), Mc Curdy and Morgan (1985), Milhoj (1987), and French et al.(1987), are only some examples. Application of ARCH-type models to bank-ing, however, remains a rarity. This paper is an attempt to ®ll the void in thisarea of the literature.
The model used here relates bank stock excess returns to their conditionalvariance and is consistent with the intertemporal capital asset pricing models
E. Elyasiani, I. Mansur / Journal of Banking & Finance 22 (1998) 535±563 543

of Merton (1973), Merton (1980), French et al. (1987), and the APT frame-work. Speci®cally, this model may be considered a two-factor APT model withrisk (volatility) and interest rate as its factors. Following Baillie and DeGen-naro (1990), the GARCH(1, 1)-M speci®cation of the general model intro-duced earlier is utilized. As Laux and Ng (1993) point out, the GARCH(1,1)-M speci®cation achieves parsimony while simultaneously allowing for longmemory in the volatility process. Bollerslev (1987) also shows that theGARCH(1, 1) adequately ®ts most economic time series data. The GARCH-M model is extended here to include additional explanatory variables in thevolatility equation. The model used for estimation is as follows:
ERj;t � /0 �Xn
i�1
/iERj;tÿi � hDrltÿ1 � c log �hj;t� � ej;t; �4�
hj;t � a0 � d2D2 � d3D3 � a1e2j;tÿ1 � bhj;tÿ1 � dCVLtÿ1; �5�
ej;tjXtÿ1 � N�0; ht�: �6�In this model, ERj;t is the excess return on the jth portfolio ( j� 1, 2, 3; Mon-
ey Center, Large and Regional bank portfolios, respectively), Drl is the changein the ten-year Treasury composite yield, and D2 and D3 are dummy variablesfor shifts in the volatility equation due to the changes in the monetary policyregime in 1979 and 1982, respectively. Excess returns are de®ned as excess ofthe stock returns over the one-year Treasury Bill rate. The variable (ht) mea-sures the stock return volatility (risk), CVL is the conditional interest rate vol-atility, and /0, /i, h, c, a0; a1, b, d, d2, and d3 are parameters. 9 In the meanequation, the optimal lag structure is determined to be 1 (n� 1) for the MoneyCenter bank and Large bank portfolios and to be 4 (n� 4) for the Regionalbank portfolio. Akgiray (1989) also ®nds an autoregressive lag of 1 in his mod-el. Speci®cation of volatility (ht) in logarithmic form is based on Engle et al.(1987) who report that log(ht) is a better representation of risk than the stan-dard deviation or variance. Baillie and DeGennaro (1990) use a speci®cationquite similar to the one used here and include interest rate and volatility as fac-tors in the mean equation.
The use of the long-term interest rate is consistent with Song (1994) andKane and Unal (1988) studies. Kane and Unal ®nd the stocks of commercialbanks to be more sensitive to changes in the long-term, rather than theshort-term interest rate. The use of the ®rst di�erence of the long-term interestrate follows Sweeny and Warga (1986) who employ this measure as a proxy for
9 The monthly excess return on bank portfolio, ERt, is calculated as ERt � [(Pt ) Pt ÿ 1 + DIVt)/
Pt ÿ 1] ) RTBt, where P is the price, DIV is the level of dividends and RTB is the monthly rate for
the one-year Treasury bills.
544 E. Elyasiani, I. Mansur / Journal of Banking & Finance 22 (1998) 535±563

the innovation in the interest rate. 10 The change in interest rate is introducedwith a lag in order to avoid the error in the variable problem and consequentestimator inconsistency which may result from contemporaneous correlation ofthe shocks to the ®nancial markets (the error term) and the innovations in theinterest rate. 11
The model presented here o�ers two advantages over the extant bankingstudies. First, the use of the GARCH-M, as opposed to the basic ARCH,GARCH, or the traditional constant variance models provides a unique frame-work to examine whether volatility is a signi®cant factor in determination ofrisk premia. Second, investigation of the e�ect of interest rate volatility onbank stock volatility and risk premia provides new insights about the behaviorof banks in response to interest rate ¯uctuation. Incorporation of the interestrate volatility e�ect on bank stock return distribution is important because thisvariable conveys critical information about the overall volatility of the ®nancialmarkets and it in¯uences the volatility of the bank stock returns also at themicro level. In regard to the overall market volatility, interest rate volatility re-¯ects the uncertainty about the stance of monetary policy and the e�ectivenessof the Fed in hitting its interest rate target. Hence, it can serve as a good proxyfor volatility in the overall market, which is in turn a determinant of the bankstock volatility. 12 At the micro level, Deshmukh et al. (1983) have shown the-oretically that interest rate uncertainty leads to a reduction in the ®nancial in-termediary's choice of risk exposure, measured here by volatility (ht). Thise�ect is strengthened by a possible agency problem on the part of the bankmanagement. As interest rate uncertainty increases, bank managers, concernedwith a higher probability of loan default, bank insolvency, and consequent lossof their job, will have an incentive to reduce asset risk (and/or to increase cap-ital) to counterbalance the increased interest rate risk. Empirical signi®cance of
10 A two-index model with short-term interest rate was also tried as an alternative. The results
were not changed substantially but the order of signi®cance of some coe�cients was reduced. The
long-term rate produced a much better ®t.11 We would like to thank a referee for suggesting the use of lagged instead of the
contemporaneous values. The contemporaneous value of the interest rate would not satisfy the
exogeneity requirement for the regressors because it could be a�ected by the shocks to the market,
which also a�ect the disturbance term.12 Glosten et al. (1993) have argued that the level of risk-free interest rate can be included in the
variance equation as a proxy for the mean excess return and its inclusion incorporates the mutual
interdependence of the mean and the variance equations. Christie (1982) and Du�ee (1995) argue
that the level of interest rate should be included in the volatility equation on the basis of leverage.
Singleton (1989) also examines the ability of interest rate in predicting the changes in the volatility
of stock returns. For a review of the leverage issue, see Bollesrev et al. (1992). For an analysis of the
e�ects of interest rate volatility on bonds, see Engle et al. (1990b). For a theoretical defense of
in¯ation volatility e�ects, see Buono (1989). Although when shocks to volatility are transitory they
may not be priced by the market, permanent shocks are more likely to be priced.
E. Elyasiani, I. Mansur / Journal of Banking & Finance 22 (1998) 535±563 545

this e�ect has been established by Shrieves and Dahl (1992). Yet another chan-nel is the leverage mechanism. Increased interest rate volatility a�ects the pro-cess through which information about interest rates is translated intoexpectation of future interest rates and hence, the discount rate for pricingstocks and bonds and debt and equity values (Flannery et al., 1997). The dif-ferential e�ect of uncertainty on stock and bond values alters the bank leverageratio, which is in turn known to a�ect stock return volatility (Christie, 1982;Kim and Kon, 1994).13, 14 The magnitude and the direction of the net (overall)e�ect of interest rate volatility are to be determined empirically.
The shifts in the monetary policy regime which occurred during the periodof the study, may have altered the stochastic process generating bank stock re-turns. Hence, failing to address these e�ects may produce unreliable results. Toavoid this problem, the model allows idiosyncratic intercepts for each policyperiod by incorporating two non-overlapping time dummy variables in the vol-atility equation and also investigates the e�ect of the shift on the slope of theinterest rate volatility variable. 15 Among the policy regimes distinguished, the®rst regime runs from January 1970 to October 1979 and is used as the base.During this period the Fed followed the federal funds rate strategy. Duringthe second regime (November 1979 to September 1982), the Fed engaged intargeting monetary aggregates (non-borrowed reserves), and during the thirdregime (October 1982 to December 1992) the Fed targeted borrowed reserves.The second policy period is marked as a period of high interest rate volatilitywhile during the other two policy periods interest rates were relatively stable.The second and third policy periods also witnessed a dramatic pace of bankderegulation and ®nancial innovation, making the latter periods further dis-
13 Several other forces link interest rate volatility to the banks' stock return distribution.
Aharony et al. (1986) argue that, due to limited liability and the mispriced deposit insurance
arrangement prevailing in the US banking system during the sample period, there exists a potential
relationship between bank stock returns and interest rate volatility. Flannery et al. (1997) also
reason that, given that interest rate volatility a�ects expected bond returns, it must also a�ect the
returns on competing assets including stocks. Elyasiani et al. (1995) introduce a transaction cost
channel and demonstrate that banks adjust deposit and loan quantities in light of the expectations
of all relevant interest rates. As interest rate volatility increases, expectations change more
frequently, resulting in more frequent adjustments in deposits and loans. The transaction costs
involved in such adjustments will inevitably a�ect bank stock returns. It is not clear, however,
whether these forces a�ect the stock returns directly or through the volatility feed back mechanism.14 It may be argued that market volatility should also be included in the information set Xtÿ1.
However, high multicollinearity between interest rate and market volatilities makes it necessary to
exclude the latter from the volatility equation. The condition number for multicollinearity exceeds
155 indicating a sever degree of multicollinearity.15 Lastrapes (1989) and Song (1994) follow a similar procedure in testing the e�ect of the
monetary policy regime changes on exchange rate volatility and stock return volatility, respectively.
546 E. Elyasiani, I. Mansur / Journal of Banking & Finance 22 (1998) 535±563

tinct from the ®rst sub-period. Each dummy variable takes the unit value dur-ing the corresponding policy regime and stands at zero otherwise.
Existing studies provide support for the inclusion of time dummy variablesin the model. For example, Lastrapes (1989) reports that incorporation ofmonetary policy regime changes into the ARCH process for exchange ratessubstantially decreases the persistence of shocks to volatility. Diebold(1986) also points out that the appearance of integrated-in-variance featurein the ARCH process may be caused by the changes in the monetary policy re-gimes.
3.4. Hypotheses
Several hypotheses are developed and tested within the context of the modeldiscussed above. These hypotheses are presented below and are tested for theMoney Center, Large, and Regional bank portfolios:
H1: Volatility is not a signi®cant factor in bank asset pricing: c� 0. This im-plies that there is no intertemporal trade-o� between volatility and return. Thisalso provides a test of non-linearity in risk premia, as ht is the second momentof the returns.
H2: Return volatility is time invariant: a1� b� d� 0. Under this hypothesis,the return distribution is homoskedistic and no ARCH or GARCH e�ects ex-ist. The existing studies are generally based on this basic assumption.
H3: Return generating process follows an ARCH speci®cation: b� d� c� 0.In this case, volatility is time variant but it has a short memory. Only a limitednumber of lags in the squared error impact the return volatility. In addition,volatility is not a signi®cant factor in asset pricing.
H4: Return generating process follows an ARCH-M speci®cation: b� d� 0.In this case also, volatility is time variant, but it is a signi®cant factor in assetpricing.
H5: Return generating process follows a GARCH speci®cation: c� d� 0. Un-der this hypothesis, the return generating process has a long memory, interestrate volatility has no e�ect on returns, and volatility is not a signi®cant factorin asset pricing.
H6: Shifts in the monetary policy strategy in 1979 and 1982 had no impact onthe bank stock risk and return: d2� d3� 0. In this case, the volatility generationprocess is robust to the choice of monetary policy strategy by the Fed, ratherthan being strategy-speci®c.
H7: Interest rate volatility has no e�ect on bank stock risk and return: d� 0.In this case the GARCH-M speci®cation holds but the volatility equation isnot extended to include other factors such as interest rate volatility.
H8: There is no interest rate e�ects: h� d� 0. Under this hypothesis, changesin the interest rate level and/or interest rate volatility have no impact on thereturn generating process.
E. Elyasiani, I. Mansur / Journal of Banking & Finance 22 (1998) 535±563 547
4. Empirical results
4.1. Properties of the data
To investigate the appropriateness of the GARCH framework certain prop-erties of the data such as normality, white noise, skewness, and kurtosis have tobe examined. The extant literature generally assumes that the error term is nor-mal and that it follows a strict white noise process. These two assumptions aretested here using the Lagrange multiplier (LM) test and the Box±Pierce±Ljungportmanteau test, respectively. Descriptive statistics associated with the bankstock excess returns and the statistics for the test procedures are presented inTable 1.
According to the ®gures in Table 1 (and graphical displays, not shown here)excess returns on bank stocks exhibit high volatility during the sample periodand alternate in signs over time. The annual mean excess return was 6%, 6%,and 12%, respectively for the MCB, Large bank, and Regional banks. The vol-atility of the returns during this period, however, was too high for statisticalsigni®cance to be revealed. This is not surprising, because this sample periodwas a turbulent period in banking. 16 The unconditional sample skewness mea-sures for all three portfolios are close to zero, as is the case with the normaldistribution, but the sample kurtosis exceeds the normal value of three. TheLM test statistics for the joint hypothesis of zero skewness and zero excesskurtosis rejects the normality assumption for each of the portfolio return serieswith much of the non-normality being due to leptokurtosis. 17
The Box±Pierce±Ljung portmanteau statistics cannot reject the null hypoth-esis of strict white noise hypothesis for any of the three portfolios, with the ex-ception of lag 12 for the Regional bank portfolio, indicating that the series isuncorrelated in all three cases. The rejection of the normality assumption is in-consistent with linearity and constancy of the conditional variance which isfundamental to the existing models of bank equity returns. The non-linear de-pendence and the excess kurtosis exhibited by the excess return series suggestthat the appropriate framework for analyzing bank equity returns and risk isthe ARCH type modeling strategy.
16 Along these lines, Economist (1990) reported that ``1980s did not add up to the best times for
American commercial banks''. Deregulation, recession, LDC loan problems, and general market
volatility made this period one of challenge for survival for US banks, lowering their nominal
return to a mere 2% by 1987.17 The LM statistics for the Money Center, Large, and Regional bank portfolios are 55.80, 46.95,
and 4883.58, respectively. This ®nding is consistent with Bollerslev (1987) and Lastrapes (1989),
and Cochran and Mansur (1993) whose models also failed to account for the leptokurtic
disturbances of market excess returns.
548 E. Elyasiani, I. Mansur / Journal of Banking & Finance 22 (1998) 535±563

4.2. Interpretation of the results
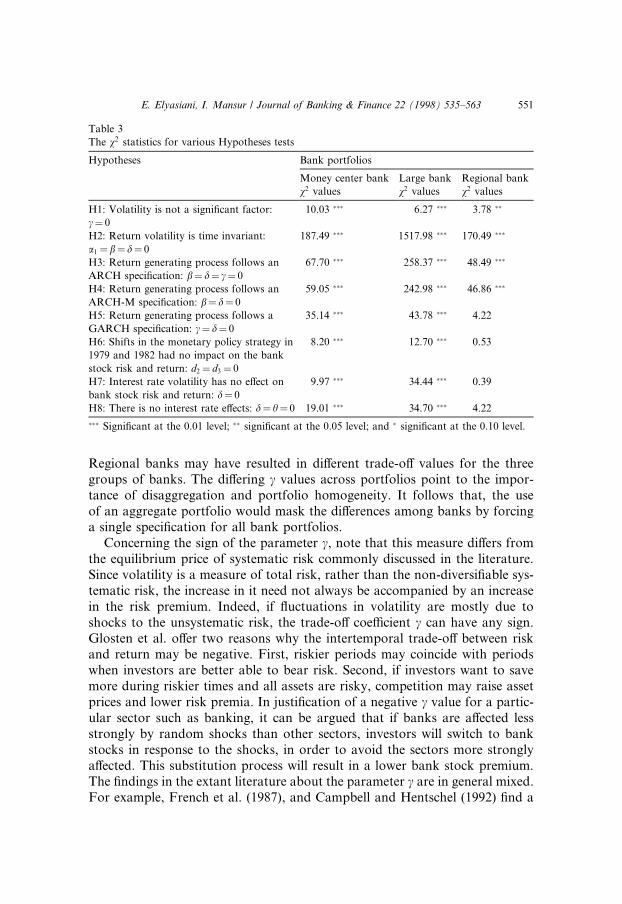
The coe�cient estimates for the model with the intercept dummy variablesin the volatility equation are presented in Table 2 and the likelihood ratio teststatistics for the hypotheses H1±H8 are displayed in Table 3. Table 4 containsthe results on slope dummy variables. The ®ndings based on these tables arediscussed below.
4.2.1. The risk±return trade-o�The hypothesis examined here is whether volatility is a signi®cant factor in
bank stock pricing or, equivalently, whether an intertemporal risk return trade-o� exists (H1: c� 0). For all three bank portfolios estimated (MCB, Large, andRegional banks), the coe�cient c, describing the intertemporal relation be-tween risk and return, is found to be negative and statistically signi®cantand to vary in magnitude across the three portfolios (Table 2). The likelihoodratio test of the null hypothesis of c� 0 is also rejected for all portfolios at the5% level or better (Table 3). The implication of this ®nding is that volatilityrisk premia are portfolio-speci®c in magnitude and display an adverse risk±re-turn trade-o� over time. As pointed out by Engle et al. (1987), the sign andmagnitude of the trade-o� parameter c depends on the investors' utility func-tion e.g. risk preference, and the net supply condition of each asset. The heter-ogenous nature of investors' expectations about the future of MCB, Large, and
Table 1
Sample statistics on monthly bank portfolio excess returns a
Bank Portfolios
Money center bank Large bank Regional bank
No. of observations 275.0 275.0 275.0
Mean 0.005 0.005 0.010
Variance 0.005 0.004 0.003
Minimum )0.264 )0.207 )0.231
Maximum 0.286 0.245 0.203
Skewness 0.199 0.187 )0.059
Kurtosis 1.292 ��� 1.425 ��� 1.539 ���
LM(v2) 34.984 ��� 29.805 ��� 24.433 ���
Q(12) 12.961 16.403 30.958 ���
Q(24) 15.704 19.533 33.404
Q(36) 22.700 23.254 35.720
a LM is a Lagrange multiplier test for normality under the null hypothesis that the coe�cients of
skewness and kurtosis are jointly equal to zero and three, respectively. This statistic is distributed as
a v2 with two degrees of freedom. The critical value at the 5% level is 5.99. Q is the Box±Pierce±
Ljung statistic at a lag of n, distributed as a v2 with n degrees of freedom. Critical values of 12°, 18°,
and 24° of freedom are 21.02, 28.86, and 36.41 at the 5% level. The standard errors for skewness
and kurtosis are (6/T)0:5� 0.147 and (24/T)0:5� 0.295, respectively, where T is the number of ob-
servations. �, ��, and ��� represent signi®cance at the 0.10, 0.05 and 0.01 levels, respectively.
E. Elyasiani, I. Mansur / Journal of Banking & Finance 22 (1998) 535±563 549

Table 2
Maximum likelihood estimates of GARCH(1, 1)-M models of excess returns level and conditional
volatility of long-term interest rate over di�erent monetary policy regimes (January 1970 to Decem-
ber 1992) a
Bank portfolios
Money center bank Large bank Regional bank
c (´10ÿ2) )1.31 )1.42 )1.00
()3.16) ��� ()2.50) ��� ()1.94) �
h )26.69 )29.35 )21.49
()2.00) �� ()2.08) �� (1.32)
a0(´10ÿ3) 1.35 2.07 0.87
(1.89) � (5.88) ��� (1.08)
d2(´10ÿ3) 0.41 1.33 0.25
(2.17) �� (2.99) ��� (0.64)
d3(´10ÿ3) 0.26 0.58 0.11
(2.04) �� (2.62) ��� (0.66)
a1 0.06 0.23 0.14
(1.89) � (3.80) ��� (1.96) ��
b 0.78 0.76 0.74
(7.50) ��� (14.92) ��� (6.40) ���
d(´10ÿ2) )1.38 )2.80 )0.65
()3.15) ��� ()5.87) ��� ()0.63)
(a1 + b) 0.84 0.99 0.85
Log likelihood 655.49 461.27 640.07
k (e/p
h) 0.99 53.85 0.40
MSL, k� 0 0.00 0.00 0.00
s (e/p
h) 0.13 )4.96 0.40
MSL, s� 0 0.37 0.00 0.00
a The GARCH(1, 1)-M models estimated are as follows:
ERj;t � /0 �Xn
i�1
/iERj;tÿi � hDrltÿ1 � c log�hj;t� � ej;t;
hj;t � a0 � d2D2 � d3D3 � a1e2j;tÿ1 � bhj;tÿ1 � dCVLtÿ1;
ej;tjXtÿ1 � N�0; ht�;where ERj;t is the excess return on the jth portfolio (j� 1, 2 and 3; Money Center bank, Large bank
and Regional bank, respectively) at time t. ERj;tÿ1 is the lagged excess return on the jth portfolio.
The optimal lag structure for the Money Center and Large bank portfolios were determined to be 1
and the Regional bank portfolio to be 4. Drlt is the change in the long-term interest rate (10 year
Treasury Composite yield) at time t. ej;t denotes the error term which is dependent on the informa-
tion set Xtÿ1. hj;t is the conditional variance of return at time t. The changes in monetary policy
regimes are denoted by dummy variables D2 (November 1979±September 1982) and D3 (October
1983±December 1992). CVLt is the conditional variance of long-term interest rate at time t. k
and s are the sample kurtosis and skewness, respectively of (e/p
h). MSL denotes the marginal sig-
ni®cance level of the corresponding test statistic under the null hypothesis.
Values in parentheses are those of t statistic. �, ��, and ��� represent signi®cance at the 0.10, 0.05 and
0.01 levels, respectively.
550 E. Elyasiani, I. Mansur / Journal of Banking & Finance 22 (1998) 535±563
Regional banks may have resulted in di�erent trade-o� values for the threegroups of banks. The di�ering c values across portfolios point to the impor-tance of disaggregation and portfolio homogeneity. It follows that, the useof an aggregate portfolio would mask the di�erences among banks by forcinga single speci®cation for all bank portfolios.
Concerning the sign of the parameter c, note that this measure di�ers fromthe equilibrium price of systematic risk commonly discussed in the literature.Since volatility is a measure of total risk, rather than the non-diversi®able sys-tematic risk, the increase in it need not always be accompanied by an increasein the risk premium. Indeed, if ¯uctuations in volatility are mostly due toshocks to the unsystematic risk, the trade-o� coe�cient c can have any sign.Glosten et al. o�er two reasons why the intertemporal trade-o� between riskand return may be negative. First, riskier periods may coincide with periodswhen investors are better able to bear risk. Second, if investors want to savemore during riskier times and all assets are risky, competition may raise assetprices and lower risk premia. In justi®cation of a negative c value for a partic-ular sector such as banking, it can be argued that if banks are a�ected lessstrongly by random shocks than other sectors, investors will switch to bankstocks in response to the shocks, in order to avoid the sectors more stronglya�ected. This substitution process will result in a lower bank stock premium.The ®ndings in the extant literature about the parameter c are in general mixed.For example, French et al. (1987), and Campbell and Hentschel (1992) ®nd a
Table 3
The v2 statistics for various Hypotheses tests
Hypotheses Bank portfolios
Money center bank Large bank Regional bank
v2 values v2 values v2 values
H1: Volatility is not a signi®cant factor:
c� 0
10.03 ��� 6.27 ��� 3.78 ��
H2: Return volatility is time invariant:
a1�b� d� 0
187.49 ��� 1517.98 ��� 170.49 ���
H3: Return generating process follows an
ARCH speci®cation: b� d� c� 0
67.70 ��� 258.37 ��� 48.49 ���
H4: Return generating process follows an
ARCH-M speci®cation: b� d� 0
59.05 ��� 242.98 ��� 46.86 ���
H5: Return generating process follows a
GARCH speci®cation: c� d� 0
35.14 ��� 43.78 ��� 4.22
H6: Shifts in the monetary policy strategy in
1979 and 1982 had no impact on the bank
stock risk and return: d2� d3� 0
8.20 ��� 12.70 ��� 0.53
H7: Interest rate volatility has no e�ect on
bank stock risk and return: d� 0
9.97 ��� 34.44 ��� 0.39
H8: There is no interest rate e�ects: d� h� 0 19.01 ��� 34.70 ��� 4.22
��� Signi®cant at the 0.01 level; �� signi®cant at the 0.05 level; and � signi®cant at the 0.10 level.
E. Elyasiani, I. Mansur / Journal of Banking & Finance 22 (1998) 535±563 551

positive relationship between conditional excess returns and conditional vari-ance (c > 0), whereas Fama and Schwert (1977), Campbell (1987), Bree et al.(1989), and Glosten et al. (1993) ®nd a negative association (c < 0). Baillieand DeGennaro (1990) ®nd c to be insigni®cant in seven out of their eight spec-i®cations, indicating the lack of a trade-o�.
4.2.2. ARCH and GARCH e�ects and shock persistenceResults of several hypotheses tests are presented in this section. These in-
clude time-variability of return volatility and the functional forms describingthe returns generating process (ARCH, ARCH-M, and GARCH). The likeli-hood ratio test statistics, reported in Table 3, reject the null hypothesis of timeinvariability of return volatility (H2: a1� b� d� 0) at any traditional level ofsigni®cance for all three portfolios. This ®nding, combined with rejection of azero value for parameter c, indicates that the appropriate model for all threeportfolios is the GARCH-M, rather the GARCH, ARCH, or time-invariantvolatility models, with the only exception being the Regional banks for whichthe GARCH speci®cation is acceptable. The likelihood ratio test results alsoreject the null hypotheses of ARCH, ARCH-M, and GARCH speci®cations(H3: b� d� c� 0, H4: b� d� 0, H5: c� d� 0) strongly, again with the excep-tion of the Regional banks. These results make the ®ndings in the literaturebased on the latter speci®cation suspect.
Note that the rejection of a hypothesis is a su�cient condition for rejectionof any other hypothesis which is more restrictive in nature, namely one that im-poses more constraints than implied by the former. Three examples of this con-dition are applicable here. Adding the constraint a1� 0 to the H3 or the H4hypothesis, or adding the constraint a1� b� 0 to the H5 hypothesis producesthe traditional constant variance model with the volatility variable ht takingonly three values to accommodate the shifts in 1979 and 1982. In this case,the dummy coe�cients d2 and d3 cannot be estimated within the GARCHframework due to the limited number of observations (3 observations). How-ever, given that H3, H4, and H5 are rejected by the data, clearly the more re-strictive constant variance speci®cation must be rejected as well.
The intercept term, a0, in the volatility equation, constitutes the time-inde-pendent component of volatility; it re¯ects the volatility measure if no ARCHor GARCH elements, or conditioning variables are signi®cant (a1� b� d� 0).As the ®gures in Table 2 show, a0 is positive for all three portfolios but insig-ni®cant for the Regional bank portfolio, indicating that volatility of the latterportfolio has no time-independent component. The ®nding related to the Re-gional bank portfolio is consistent with Neuberger (1994) who also ®nds a zerointercept in the volatility equation.
The ARCH parameter (a1) and the GARCH parameter (b), are positive andsigni®cant in all three portfolios, satisfying the speci®cation requirement ofnon-negativity for all of the models. The magnitude of a1, which shows the ef-
552 E. Elyasiani, I. Mansur / Journal of Banking & Finance 22 (1998) 535±563

fect of the last period's shock directly, is found to be much smaller than that ofthe parameter b, which embodies the e�ect of the previous surprises. The im-plication is that the market has a memory longer than one period and that vol-atility is more sensitive to its own lagged values than it is to new surprises in themarket place.
The sum (a1 + b) is the measure of volatility persistence. This sum is foundto be less than unity for all three portfolios indicating that the models are sec-ond order stationary. The large value of the persistence measure is an evidencethat shocks to the banking sector have highly persistent e�ects and that the re-sponse function of volatility decays at a relatively slow pace. For example, forthe MCB portfolio, the persistence measure (a1 + b) is approximately 0.84.Hence, the proportion of the initial shock to these banks remaining after asix month period is (0.84)6 or 35%. Based on these parameter values even afterone full year, still 12% of the initial shock persists. It is noteworthy that for theLarge and Regional bank portfolios shocks persist even for a longer periodthan for the MCB portfolio. The latter group of banks seem to be better ableto absorb the shocks to which they are subjected. This may be explained by thedominant role of o� balance sheet activities and wholesale orientation of thesebanks.
The dynamic pattern of the e�ect of the shocks on the risk premium can beexplained as follows. According to our ®ndings, a shock to the returns intro-duces a change in the error term and alters the contemporaneous risk premiumin the same direction. In the next two periods, however, the risk premium willrevert back, with the magnitude of the reversion depending on the values of a1
and c in the next period, and b and c in the period after. These latter two e�ectsoccur through the persistence mechanism introduced in the volatility equation.
4.2.3. Shifts in the monetary policy strategyThe e�ect of the shift in the monetary policy strategy in 1979, and 1982 on
bank stock return volatility may be manifested in the form of a one time dis-placement in the intercept of the volatility equation or as a change in the sen-sitivity of the stock return volatility to one or more variables on the right-handside. The results of the t-tests for individual intercept dummy coe�cients, andthe results of the likelihood ratio tests for joint signi®cance of these coe�cients,are reported in Tables 2 and 3, respectively. These tests allow two sets of com-parisons; (i) comparison of stock return volatility of each portfolio over thethree policy periods (1970±1979, 1979±1982, 1982±1992), and (ii) comparisonof the volatilities of separate portfolios during a given policy period.
Comparison of stock return volatilities (intercepts) of each of the portfoliosover the three policy periods is made by testing the hypothesis of identicalintercepts for each portfolio across policy regimes (H6: d2� d3� 0). The likeli-hood ratio test statistic for this hypothesis is found to be highly signi®cant forall bank portfolios, indicating that the volatility generation process is sensitive
E. Elyasiani, I. Mansur / Journal of Banking & Finance 22 (1998) 535±563 553

to the choice of the monetary policy strategy by the Fed. Concerning the indi-vidual t-test results for the intercept shift, the coe�cients (d2, d3) for the dum-my variables are positive for all three portfolios but signi®cant only for theMCBs and the Large banks. This indicates that although all portfolios showedan upward shift in the intercept in response to the Fed's switch in its monetarypolicy strategy, the shift for the Regional banks was not statistically signi®cant.One possible explanation is that Regional banks were more risk averse andhedged against interest rate ¯uctuations to a larger extent than the MCBand the Large banks, hence remaining una�ected by the switch. In terms ofthe relative magnitude of the e�ect across bank portfolios, the shift in volatilityis found to be larger for the Large banks than the MCBs. It seems that MCBswere better able to weather the e�ect of the policy switch and were more im-mune from the Fed's choice of monetary policy strategy, than the former groupof banks. This may be due to the non-traditional nature of the MCB bankingactivity and their greater access to ®nancial markets. It is noteworthy that thecomposite (joint) test d2� d3� 0 and the simple tests d2� 0 or d3� 0 discussedabove cannot be derived from one another and are not substitutes for each oth-er Gujarati (1988).
Comparison of volatility intercepts across policy periods reveals that theMCBs and Large bank portfolios were, ceteris paribus, more volatile duringthe second period (interest rate instability) than the other two periods (interestrate stability). In addition, these two portfolios were more volatile during thethird period (1982±1992) than the ®rst period (1970±1979). In both cases, thedi�erences are statistically insigni®cant for the Regional bank portfolio. In oth-er words, after the Fed switched back to focus on targeting borrowed reservesin 1982, bank stock return volatility did subside, but it did not revert to the ini-tial pre-1979 period. The di�erential e�ect found here on the three portfoliosreinforces the ®nding earlier that the aggregate sample may produce unreliableresults; the intra-sample dissimilarity of the e�ects highlights the importance ofgroup homogeneity.
Contrasting the intercepts in the volatility models of the three bank portfo-lios with each other during a given monetary policy strategy period reveals an-other interesting result. The volatility of the Large bank portfolio is found tobe, ceteris paribus, more pronounced (to have a larger intercept) than that ofthe MCB and Regional bank portfolios both during periods of interest rate in-stability (1979±1982) and interest rate stability (1982±1992). The nature of thebanking activities undertaken by the MCBs (e.g. the overwhelming role ofwholesale banking and o�-balance sheet activities) and risk aversion and hedg-ing policies of the Regional banks are very likely to have contributed to thisphenomenon. Note that shifts in the stock return volatility in response to chan-ges in the monetary policy strategy are examined for a given shock in the im-mediate past and a given value of interest rate volatility. The e�ect of variationsin the interest rate volatility are discussed next. The e�ect of the shift in the
554 E. Elyasiani, I. Mansur / Journal of Banking & Finance 22 (1998) 535±563

monetary policy strategy on the slope of the interest rate volatility will be dis-cussed further below.
4.2.4. The interest rate e�ectsOf important concern to this study are the magnitude and the direction of
the e�ect of interest rate and its volatility on the distribution of bank stock re-turns. These e�ects are tested by the hypotheses of no interest rate volatility ef-fect (H7: d� 0) and no overall interest rate e�ect (H8: d� h� 0) and the resultsare reported in Tables 2 and 3. The parameter h, which measures the e�ect ofchanges in the long-term interest rate on the risk premium, is negative in allcases and statistically signi®cant for the MCB and Large bank portfolios. Thismanifests signi®cant interest rate risk exposure of these two groups of banksand is consistent with the ®ndings in the existing literature.
The coe�cient d, which measures the e�ect of the lagged interest rate vola-tility on bank stock return volatility, is negative in all cases and signi®cant forthe MCB and Large bank portfolios. This indicates that, if interest rates be-come more volatile, bank stock returns will stabilize in the following periodfor the MCBs and Large banks, and remains una�ected for the Regionalbanks. A possible explanation for the decline in the stock return volatility ofthe MCB and Large banks is that, in response to an increase in interest ratevolatility, these banks seek shelter from interest rate risk and are capable ofachieving this objective within one period (month), e.g. by holding derivativesand matching duration's of assets and liabilities. This, in turn, results in lowerbank stock volatility in the following period. 18 This result is in accord withDeshmukh et al. (1983) and Shrieves and Dahl (1992). In terms of the magni-tude, the Large bank portfolio shows a stronger reaction to increased interestrate volatility than the MCB portfolio.
The e�ect of interest rate volatility on risk premia can be measured indirectlythrough the ``feedback e�ect'' parameter c. According to the ®gures displayedin Table 2, the e�ect of the interest rate volatility on the risk premia is similarin sign across bank portfolios but varies in magnitude. For the MCB and Largebank portfolios, the risk premium will increase when interest rates becomemore volatile, while for the Regional bank portfolio the risk premium will re-main una�ected. The magnitude of the e�ect is larger for the Large bank port-folio than the MCBs. The results based on the likelihood ratio tests areconsistent with and reinforce the individual t-test results. The lack of signi®-cance of the interest rate volatility e�ect on risk premia for the Regional banks
18 Note that this ®nding does not preclude (contemporaneous) movement of ht and CVLt in the
same direction. Indeed, if CVL is negatively autocorrelated (and d is negative) the two variables will
move together.
E. Elyasiani, I. Mansur / Journal of Banking & Finance 22 (1998) 535±563 555

may indicate insigni®cant exposure to interest rate risk due to stronger riskaversion and hedging action on the part of this group of banks.
The results concerning interest rate volatility extend the literature in two im-portant ways. First, by showing the e�ect of the changes in the second momentof the interest rate distribution on the mean bank stock returns, they highlightthe importance of incorporating the volatility e�ects in asset pricing models.Second, they portray the dependence of the bank stock riskiness on the vola-tility of the interest rate and highlight the importance of estimating the riskand return equations jointly. Both of these e�ects are generally overlookedin the literature. The interest rate e�ects found here also indicate that informa-tion acquisition by investors is not a futile activity; publicly available informa-tion can be used to carry out pro®table trades.
The slope of the interest rate volatility measure (CVL) may be non-robust tothe change in the monetary policy strategy. In order to investigate this possi-bility, the dummy variables introduced earlier are used to test the hypothesisof identical slopes across policy regimes. The results for this hypothesis, report-ed in Table 4, indicate that the e�ect on the slope coe�cient for the interest ratevolatility is in the same direction as that on the intercept. More speci®cally,stock return volatility is found to become signi®cantly more sensitive to the in-terest rate volatility after the Fed switched to targeting monetary aggregates in1979 and allowed interest rates to ¯uctuate. Later in 1982, when the Fedswitched backed to target borrowed reserves, the sensitivity of bank stock re-turn volatility to interest rate volatility did moderate but it never returned tothe level prevailing prior to the 1979 regime shift. In other words, the increasein interest rate sensitivity relative to the pre-1979 period is both larger in mag-nitude and more stringent in terms of statistical signi®cance in the 1979±1982period than in the post-1982 period. In terms of the order of the magnitude, thee�ect was larger for the Regional banks, Large banks, and MCBs, respectively.
5. Conclusions
Application of time-varying risk models to banking is of special importancebecause in recent decades both interest rate level and volatility have varied sub-stantially as a result of the shifts in the monetary policy regime, ®nancial andtechnological innovations, and international market integration. Knowledge ofthe properties of the equity return process, and in particular how the process isa�ected by changes in the monetary policy regime, is crucial to bank managersin designing their interest rate risk management strategies, and to all marketparticipants for pricing derivatives and designing dynamic hedging strategies.
This study extends previous works in two directions. First, unlike previousstudies which limited their scope to interest rate levels, the current study intro-duces the volatility of the interest rate into the bank stock return generating
556 E. Elyasiani, I. Mansur / Journal of Banking & Finance 22 (1998) 535±563

process. Second, this study employs a GARCH-M methodology which dis-cards some of the untenable assumptions in the existing studies, allows for vol-atility to vary with time, and relates the risk premia to the bank stock returnvolatility. The model estimates the interest rate sensitivity of bank stock returnswhile simultaneously considering possible e�ects of the changes in monetarypolicy regime on volatility. The data support the appropriateness of the
Table 4
GARCH(1, 1)-M models of excess returns: Maximum likelihood estimates with slope dummy vari-
ables (January 1970 to December 1992) a
Bank portfolios
Money center bank Large bank Regional bank
c (´10ÿ2) )1.33 )0.89 )0.47
()2.38) �� ()2.16) �� ()1.88) �
h )36.58 )29.47 )46.57
()2.62) ��� ()2.36) �� ()4.03) ���
a0(´10ÿ3) 0.83 0.71 1.02
(2.84) ��� (3.23) ��� (3.61) ���
a1 0.18 0.16 0.12
(4.10) ��� (5.28) ��� (3.69) ���
b 0.81 0.82 0.84
(19.66) ��� (25.79) ��� (22.56) ���
d1 (´10ÿ2) )1.13 )0.96 )1.38
()2.82) ��� ()3.24) ��� ()3.62) ���
d2 (´10ÿ2) 0.52 0.39 0.47
(2.21) �� (2.27) �� (3.04) ���
d3 (´10ÿ2) 0.40 0.20 0.29
(1.67) � (1.86) � (2.22) ��
(a1 + b) 0.99 0.98 0.96
Log likelihood 481.36 593.70 647.67
a The GARCH(1, 1)-M models estimated are as follows:
ERj;t � /0 �Xn
i�1
/iERj;tÿi � hDrltÿ1 � c log�hj;t� � ej;t;
hj;t � a0 � a1e2j;tÿ1 � bhj;tÿ1 � d1CVLtÿ1 � d2CVL�tÿ1D2 � d3CVL�tÿ1D3;
ej;tjXtÿ1 � N�0; ht�;where ERj;t is the excess return on the jth portfolio ( j� 1, 2 and 3; Money Center, Large, and Re-
gional bank, respectively) at time t. The optimal lag structure for the Money Center and Large
bank portfolios were determined to be 1 and for the Regional bank portfolio to be 4. Drlt is the
change in the long-term interest rate (ten-year Treasury Composite yield) at time t. ej;t denotes
the error term which is dependent on the information set Xtÿ1. hj;t is the conditional variance of
return at time t. The changes in monetary policy regimes are denoted by dummy variables D2 (No-
vember 1979±September 1982) and D3 (October 1982±December 1992). CVLt is the conditional
variance of long-term interest rate at time t.
Figures in parentheses are t statistics. �, ��, and ��� represent signi®cance at the 0.10, 0.05 and 0.01
levels, respectively.
E. Elyasiani, I. Mansur / Journal of Banking & Finance 22 (1998) 535±563 557

GARCH-M process indicating that volatility is a determinant of the bankstock return. The data fail to support the irrelevance hypothesis concerningthe e�ect of the monetary policy strategy, suggesting that the return generatingprocess is not independent of the shifts in the US monetary policy regime. Itfollows that monetary policy regime shifts play an important role in describingthe return generating process and should be included in empirical analysis ofbank equity returns.
According to our ®ndings, the long-term interest rate has a negative and sig-ni®cant impact on the bank stock return. In addition, interest rate volatility isfound to be an important determinant of the bank stock return volatility andbank stock risk premium, for the MCB and Large bank portfolios, though notfor the Regional bank portfolio. It follows that in the periods immediately fol-lowing relatively unstable interest rate conditions, the distribution of the MCBsand Large bank portfolio returns become less dispersed and will have a largermean, while that of the Regional bank stock returns remains unaltered. In oth-er words, when interest rates become more volatile the risk premium on theMCB and Large bank portfolios will increase with them in tandem. The degreeof persistence in shocks is sensitive to the nature of the bank portfolio. Persis-tence is found to be stronger for the Large bank portfolio than the Regionaland MCB portfolios. For the MCBs, shocks manifest least persistence.
Acknowledgements
We would like to thank Venkat Gangadharan, Tribhuvan Puri, JahangirSultan, and four anonymous referees and an associate editor of the Journalfor very helpful comments and suggestions. Any remaining errors are ours. Au-thors' names are in alphabetic order. Please address any correspondence to the®rst author. An earlier version of the paper was presented in the FinancialManagement Association meeting of 1994 in Saint Louis.
Appendix A. Sample banks and asset size
Institution Asset size($000 at theend of 1991)
Money Center banks1 BANKAMERICA CORP 115,509,0002 BANKERS TRUST NEW YORK CORP 63,958,0003 CHASE MANHATTAN CORP 98,197,000
558 E. Elyasiani, I. Mansur / Journal of Banking & Finance 22 (1998) 535±563

4 CHEMICAL BANKING CORP 138,930,0005 CITICORP 216,922,0006 CONTINENTAL BANK CORP 24,008,0007 FIRST CHICAGO CORP 48,963,0008 MORGAN (J.P.) & CO 103,468,0009 NATIONSBANK CORP 110,319,000
10 WELLS FARGO & CO 53,547,000
Large banks1 BANK OF BOSTON CORP 32,700,2432 BANK OF NEW YORK CO INC 39,426,1453 BARNETT BANKS INC 32,720,5494 FIRST FID BANCORPORATION 30,215,2295 FIRST INTERSTATE BANCORP 48,922,0776 FIRST UNION CORP (N.C.) 46,084,8537 FLEET FINANCIAL GROUP INC 45,537,2948 MELLON BANK CORP 29,355,0009 NATIONAL CITY CORP 24,169,746
10 NBD BANCORP INC 29,513,45911 NORWEST CORP 38,501,60012 PNC FINANCIAL CORP 44,891,68813 REPUBLIC NEW YORK CORP 31,220,80514 WACHOVIA CORP 33,158,320
Regional banks1 AMSOUTH BANCORPORATION 9,459,2692 BANCORP HAWAII INC 11,409,3413 BANPONCE CORP-NEW 8,780,2824 BAYBANKS INC 9,515,7885 COLORADO NATL BANKSHARES 3,000,0006 COMERICA INC 14,450,7917 CORESTATES FINANCIAL CORP 21,623,9398 CRESTAR FINANCIAL CORP 11,828,2619 DOMINION BANKSHARES CORP 9,710,955
10 EQUIMARK CORP 3,000,00011 FIRST BANK SYSTEM INC 18,301,00012 FIRST CITY BANCORP TEX-DEL 9,943,46713 FIRST SECURITY CORP-UTAH 7,015,07514 FIRST TENNESSEE NATL CORP 7,903,67615 FIRST VIRGINIA BANKS INC 6,119,26016 FIRSTAR CORP 12,309,00017 KEYCORP 23,155,54918 MERCANTILE BANCORPORATION 8,088,943
E. Elyasiani, I. Mansur / Journal of Banking & Finance 22 (1998) 535±563 559

References
Aharony, J., Saunders, A., Swary, I., 1986. The e�ect of shift in monetary policy regime on the
pro®tability and risk of commercial banks. Journal of Monetary Economics 17, 363±377.
Akella, S.R., Chen, S.J., 1990. Interest rate sensitivity of bank stock returns: Speci®cation e�ects
and structural changes. Journal of Financial Research 13, 147±154.
Akgiray, V., 1989. Conditional heteroscedasticity in time series of stock returns: Evidence and
forecasts. Journal of Business 62, 55±80.
Akgiray, V., Booth, G.G., 1988. The stable law model of stock returns. Journal of Business and
Economic Statistics 6, 51±57.
Bae, S.C., 1990. Interest rate changes and common stock returns of ®nancial institutions: Revisited.
Journal of Financial Research 13, 71±79.
Baillie, R.T., DeGennaro, R.P., 1990. Stock returns and volatility. Journal of Financial and
Quantitative Analysis 25, 203±214.
Banking Agencies, 1993, Federal Reserve Section 305 NPR on Interest Rate Risk, Federal Register.
Blitzer, D., 1995. Survivorship bias: Comment. The Journal of Portfolio Management, 102±107.
Bollerslev, T., 1986. Generalized autoregressive conditional heteroscedasticity. Journal of Econo-
metrics 31, 307±327.
Bollerslev, T., 1987. A conditional heteroscedistic time series model for speculative prices and rates
of return. Review of Economics and Statistics 69, 542±547.
Bollesrev, T.R., Chou, Y., Kroner, K.F., 1992. ARCH modeling in ®nance: A review of the theory
and empirical evidence. Journal of Econometrics 52, 5±59.
Bollesrev, T., Engle, R.F., Wooldridge, J.M., 1988. A capital asset pricing model with time varying
covariances. Journal of Political Economy 96, 116±131.
Booth, J., O�cer, D.T., 1985. Expectations, interest rates, and commercial bank stocks. Journal of
Financial Research 8, 51±58.
Bree, W., Glosten, L.R., Jagannathan, R., 1989. Economic signi®cance of predictable variations in
stock index returns. Journal of Finance 44, 1177±1189.
Buono, M.J., 1989. The relationship between the variability of in¯ation and stocks: An empirical
investigation. Journal of Financial Research 12, 329±339.
Campbell, J.Y., 1987. Stock returns and the term structure. Journal of Financial Economics 18,
373±399.
19 MICHIGAN NATIONAL CORP 10,650,23120 MNC FINANCIAL INC 17,438,17121 NORTHERN TRUST CORP 13,192,50022 RIGGS NATL CORP WASH D C 5,536,68023 SHAWMUT NATIONAL CORP 22,815,52024 SIGNET BANKING CORP 11,238,80025 SOCIETY CORP 15,404,52826 STAR BANC CORP 6,645,90527 STATE STREET BOSTON CORP 15,046,30128 U S BANCORP 18,875,13729 UJB FINL CORP 13,377,71930 VALLEY NATIONAL CORP ARIZONA 10,651,65931 U S TRUST CORP 2,917,00032 UNION PLANTERS CORP 3,786,837
560 E. Elyasiani, I. Mansur / Journal of Banking & Finance 22 (1998) 535±563

Campbell, J.Y., Hentschel, L., 1992. No news is good news: An asymmetric model of changing
volatility in stock returns. Journal of Financial Economics 31, 281±318.
Carroll, C., Thistle, P.D., Wei, K.C.J., 1992. The robustness of risk±return nonlinearities to the
normality assumption. Journal of Financial and Quantitative Analysis 27, 419±435.
Carroll, C., Wei, K.C.J., 1988. Risk return and equilibrium: An extension. Journal of Business 61,
485±499.
Chance, D.M., Lane, W.R., 1980. A re-examination of interest rate sensitivity in the common
stocks of ®nancial institutions. Journal of Financial Research 3, 49±55.
Choi, J.J., Elyasiani, E., Kopecky, K., 1992. The sensitivity of bank stock returns to market,
interest, and exchange rate risks. Journal of Banking and Finance 16, 983±1004.
Chou, R.Y., 1988. Volatility persistence and stock valuations: some empirical evidence using
GARCH. Journal of Applied Econometrics 3, 279±294.
Christie, A.A., 1982. The stochastic behavior of common stock variances: Value, leverage, and
interest rate e�ects. Journal of Financial Economics 10, 407±432.
Deshmukh, S.D., Greenbaum, S.I., Kanatas, G., 1983. Interest rate uncertainty and the ®nancial
intermediary's choice of exposure. Journal of Finance 38 1, 141±147.
Diebold, F.X., 1986. Modeling persistence in conditional variance: A comment. Econometric
Review 5, 51±56.
Diebold, F.X., Nerlove, M., 1989. The dynamics of exchange rate volatility: A multivariate latent
factor ARCH model. Journal of Applied Econometrics 4, 1±22.
Du�ee, G.R., 1995. Stock returns and volatility: A ®rm level analysis. Journal of Financial
Economics 37, 399±420.
Economist, A Survey of International Banking, 7 April 1990.
Elyasiani, E., Kopecky, K., Vanhoose, D., 1995. Cost of adjustment, portfolio separation, and the
dynamic behavior of bank loans and deposits . Journal of Money, Credit, and Banking 27 (1),
955±974.
Engle, R.F., 1982. Autoregressive conditional heteroscedasticity with estimates of the variance of
United Kingdom in¯ation. Econometrica 50, 987±1007.
Engle, R.F., 1983. Estimates of the variance of US in¯ation based upon the ARCH model. Journal
of Money, Credit, and Banking 15, 286±301.
Engle, R.F., Bollerslev, T., 1986. Modeling the persistence of conditional variance. Econometric
Review 5, 1±50.
Engle, R.F., Ito, T., Lin, W.L., 1990a. Meteor showers or heat waves? Hetroskedastic intra-daily
volatility in the foreign exchange market. Econometrica 58, 525±542.
Engle, R.F., Lilien, D.M., Robins, R.P., 1987. Estimating time varying risk premia in the term
structure: The ARCH-M model. Econometrica 55, 391±407.
Engle, R.F., Ng, V., Rothschild, M., 1990b. Asset pricing with a factor-ARCH covariance
structure: Empirical estimates for treasury bills. Journal of Econometrics 45, 213±237.
Fama, E.F., Schwert, G.W., 1977. Asset returns and in¯ation. Journal of Financial Economics 5,
115±146.
Flannery, M.J., Hameed, A.S., Harjes, R.H., 1997. Asset pricing, time-varying risk premia, and
interest rate risk. Journal of Banking and Finance 21, 315±335.
Flannery, M.J., James, C.M., 1984. The e�ect of interest rate changes on the common stock returns
of ®nancial institutions. Journal of Finance 39, 1141±1153.
French, K.R., Schwert, G.W., Stambaugh, R.F., 1987. Expected stock returns and volatility.
Journal of Financial Economics 19, 3±29.
Garcia, C.B., Gould, F.J., 1993. Survivorship bias. The Journal of Portfolio Management, 52±56.
Glosten, L.R., Jagannathan, R., Runkle, D., 1993. On the relationship between the expected value
and the volatility on the nominal excess returns on stocks. Journal of Finance 48, 1779±1801.
Gujarati, D., 1988. N. Basic Econometrics. McGaw-Hill, New York.
E. Elyasiani, I. Mansur / Journal of Banking & Finance 22 (1998) 535±563 561

Jarque, C.M., Bera, A.K., 1981. An e�cient large sample test of normality of observations and
regression residuals. Unpublished manuscript. Australian National University, Canberra.
Kane, E.J., Unal, H., 1988. Change in market assessment of deposit institution riskiness. Journal of
Financial Services Research 2, 201±229.
Kim, D., Kon, S.J., 1994. Alternative models for the conditional heteroskedasticity of stock
returns. Journal of Business 67, 563±597.
Kwan, S.H., 1991. Reexamination of interest rate sensitivity of commercial bank stock returns
using a random coe�cient model. Journal of Financial Services Research 5, 61±76.
Lamoureux, C.G., Lastrapes, W.D., 1990. Heteroskedasticity in stock return data: Volume versus
GARCH e�ects. Journal of Finance 45, 221±229.
Lastrapes, W.D., 1989. Exchange rate volatility and US monetary policy. Journal of Money,
Credit, and Banking 21, 66±77.
Laux, P.A., Ng, L.K., 1993. The sources of GARCH: Empirical evidence from an intraday returns
model incorporating systematic and unique risk. Journal of International Money and Finance,
543±560.
Lintner, J., 1965. The valuation of risk assets and the selection of risky investments in stock
portfolio and capital budgets. Review of Economics and Statistics 45, 13±37.
Lloyd, W.P., Shick, R.A., 1977. A test of stone's two-index model of returns. Journal of Financial
and Quantitative Analysis 12, 363±376.
Lynge, M.J., Zumwalt, J.K., 1980. An empirical study of the interest rate sensitivity of commercial
bank returns: A multi-index approach. Journal of Financial and Quantitative Analysis 15, 731±
742.
Mc Curdy, T.H., Morgan, I.G., 1985. Testing the Martingale hypothesis in deutsch futures with
models specifying the form of heteroskedasticity. Journal of Applied Econometrics 3, 187±202.
Malkiel, B., 1995. Returns from investing in equity mutual funds 1971±1991. Journal of Finance 50,
549±572.
Merton, R., 1973. An intertemporal capital asset pricing model, Econometrica, 867±887.
Merton, R., 1980. On estimating the expected return on the market: An exploratory investigation.
Journal of Financial Economics 8, 326±361.
Milhoj, A., 1987. A conditional variance model for daily deviations of an exchange rate. Journal of
Business and Economic Statistics 5, 99±103.
Mossin, J., 1966. Equilibrium in a capital asset market. Econometrica 34, 768±783.
Neuberger, J.A., 1993. Interest rate risk at US commercial banks, Federal Reserve Bank of San
Francisco, Weekly Letters.
Neuberger, J.A., 1994. Interest rate risk at US commercial banks, Working paper Federal Reserve
Bank of San Francisco.
Ng, V., Engle, R.F., Rothschild, M., 1992. A multi-dynamic-factor model for stock returns.
Journal of Econometrics 52, 245±266.
Perry, P.R., 1982. The time-variance relationship of security returns: Implications for the return-
generating stochastic process. Journal of Finance 37, 857±870.
Pindyck, R.S., 1984. Risk, in¯ation, and the stock market. American Economic Review 74, 335±
351.
Poterba, J.M., Summers, L.H., 1986. The persistence of volatility and stock market ¯uctuations.
American Economic Review 76, 1141±1151.
Ross, S., 1976. The arbitrage theory of capital asset pricing. Journal of Economic Theory 13, 341±
360.
Saunders, A., Yourougou, P., 1990. Are banks special? The separation of banking from commerce
and interest rate risk. Journal of Economics and Business, 171±182.
Scott, W.L., Peterson, R.L., 1986. Interest rate risk and equity values of hedged and unhedged
®nancial intermediaries. Journal of Financial Research 9, 325±329.
562 E. Elyasiani, I. Mansur / Journal of Banking & Finance 22 (1998) 535±563

Sharp, W., 1964. Capital market prices: A theory of market equilibrium under conditions of risk.
Journal of Finance 19, 425±442.
Shrieves, R., Dahl, D., 1992. The relationship between risk and capital in commercial banks.
Journal of Banking and Finance 16, 439±457.
Singleton, K.J., 1989. Disentangling the e�ects of noise and aggregate economic disturbances on
daily stock price volatility. Unpublished manuscript. Stanford University.
Song, F., 1994. A two factor ARCH model for deposit-institution stock returns. Journal of Money,
Credit and Banking 26, 323±340.
Stone, B.K., 1974. Systematic interest rate risk in a two-index model of returns. Journal of
Financial and Quantitative Analysis 9, 709±721.
Sweeny, R., Warga, A., 1986. The pricing of interest rate risk: Evidence from the stock market.
Journal of Finance 41, 393±410.
Tinic, S.M., West, R.R., 1986. Risk, return and equilibrium: A revisit. Journal of Political
Economy 94, 126±147.
Wetmore, J.L., Brick, J.R., 1994. Commercial bank risk: Market interest rate, foreign exchange.
Journal of Financial Research 17, 585±596.
Yourougou, P., 1990. Interest rate and the pricing of depository ®nancial intermediary common
stock: Empirical evidence. Journal of Banking and Finance 14, 803±820.
E. Elyasiani, I. Mansur / Journal of Banking & Finance 22 (1998) 535±563 563