Sensitivity of summer precipitation simulated by the CLM with respect to initial and boundary...
11
Meteorologische Zeitschrift, Vol. 17, No. 4, 421-431 (August 2008) Article c by Gebr ¨ uder Borntraeger 2008 Sensitivity of summer precipitation simulated by the CLM with respect to initial and boundary conditions KERSTIN EBELL 1,2∗ ,S USANNE BACHNER 2 ,ALICE KAPALA 2 and CLEMENS S IMMER 2 1 University of Cologne, Institute for Geophysics and Meteorology, Cologne, Germany 2 University of Bonn, Meteorological Institute, Bonn, Germany (Manuscript received October 31, 2007; in revised form March 3, 2008; accepted March 3, 2008) Abstract The knowledge of the uncertainty resulting from the sensitivity of a regional climate model to physical parameterisation schemes, horizontal resolution, domain size and location, as well as to initial and boundary conditions is crucial for the interpretation of model results, e.g. for dynamical downscaling of global climate predictions. In this study, we assess some of these aspects by investigating daily precipitation statistics simulated by the regional climate model CLM (Climate version of the Local Model). Different sensitivity experiments related to initialisation date, domain size and location and to the lateral boundary forcing have been performed for the summer of 1974. The evaluation domain is Germany, located approximately in the centre of the model domain. Comparisons to the control run show that the spatially averaged precipitation statistics can be significantly affected by this modification, not only in specific regions, but also in entire Germany. The results also indicate that the strength of the lateral boundary forcing has a crucial influence on the simulated characteristics. Zusammenfassung Die Kenntnis der Sensitivit¨ at regionaler Klimamodelle in Bezug auf die Parametrisierung physikalischer Prozesse, horizontale Aufl¨ osung, Gr¨ oße und Lage des Modellgebiets, sowie Anfangs- und Randbedingun- gen und der damit verbundenen Unsicherheit ist entscheidend f¨ ur die Interpretation von Modellergebnissen, z.B. f¨ ur das dynamische Downscaling von globalen Klimamodelll¨ aufen. In der vorliegenden Arbeit werden einige dieser Aspekte quantitativ abgesch¨ atzt. Dazu werden statistische Gr¨ oßen des t¨ aglichen Niederschlags aus Simulationen des regionalen Klimamodells CLM (Climate version of the Local Model) abgeleitet und un- tersucht. F¨ ur den Sommer 1974 wurden verschiedene Studien zur Sensitivit¨ at bez¨ uglich des Initialisierungs- datums, der Gr¨ oße und Lage des Modellgebiets und der seitlichen Randbedingungen durchgef¨ uhrt. Das Un- tersuchungsgebiet Deutschland liegt zentral im Modellgebiet. Der Vergleich mit dem Kontrolllauf zeigt, dass r¨ aumlich gemittelte statistische Gr¨ oßen durch die genannten Modifikationen nicht nur f¨ ur bestimmte Regio- nen, sondern auch f ¨ ur ganz Deutschland signifikant beeinflusst werden k ¨ onnen. Die Ergebnisse deuten ferner darauf hin, dass der Antrieb durch die seitlichen Randbedingungen einen entscheidenden Einfluss auf die simulierten Werte hat. 1 Introduction Global and regional climate model simulations play a crucial role in the understanding of climate variability and change. In the last decade, progress has been made in the development and improvement of regional cli- mate modelling techniques (e.g. GIORGI and MEARNS, 1999; WANG et al., 2004). Such regional climate models (RCMs) are forced by large scale fields of Atmosphere- Ocean General Circulation Models (AOGCM) or global reanalyses. They are intended to reproduce the large scale patterns of the driving model and to add infor- mation of climatic variables on finer scales. The value added by dynamical downscaling, however, is still an important topic which has to be addressed (CASTRO et al., 2005; LO et al., 2008; ROCKEL et al., 2008). Many studies dealing with RCMs are focused on the evaluation of models and the understanding of physical processes * Corresponding author: Kerstin Ebell, Institute for Geophysics and Meteo- rology, University of Cologne, Kerpener Str. 13, 50937 Cologne, Germany, e-mail: [email protected] as a necessary first step for climate change simulations (e.g. CHRISTENSEN et al., 1998; ACHBERGER et al., 2003; FREI et al., 2003). Biases in the important climatic variables temperature and precipitation pose still a prob- lem (B ¨ OHM et al., 2006; J ¨ AGER et al., 2008). Several of these studies have also examined the sensitivity of regional climate models to modified initial and bound- ary conditions (e.g. JACOB and PODZUN, 1997; SETH and GIORGI, 1998; WU et al., 2005). These studies in- dicate that due to non-linear physics and dynamics of the models, even small changes in the initial conditions or in the boundary forcing can lead to quite different model results. JACOB and PODZUN (1997), for exam- ple, performed sensitivity studies with the hydrostatic regional climate model REMO, in which the dependence of model results on domain size, horizontal resolution, initial conditions and lateral boundaries was examined. They conclude that the results of the regional model are not only strongly dependent on the forcing fields but also on the domain size and simulation length. 0941-2948/2008/0305 $ 4.95 DOI 10.1127/0941-2948/2008/0305 c Gebr¨ uder Borntraeger, Berlin, Stuttgart 2008
Transcript of Sensitivity of summer precipitation simulated by the CLM with respect to initial and boundary...

Meteorologische Zeitschrift Vol 17 No 4 421-431 (August 2008) Articleccopy by Gebruder Borntraeger 2008
Sensitivity of summer precipitation simulated by the CLMwith respect to initial and boundary conditions
KERSTIN EBELL12lowast SUSANNE BACHNER2 ALICE KAPALA2 and CLEMENS SIMMER2
1University of Cologne Institute for Geophysics and Meteorology Cologne Germany2University of Bonn Meteorological Institute Bonn Germany
(Manuscript received October 31 2007 in revised form March 3 2008 accepted March 3 2008)
Abstract
The knowledge of the uncertainty resulting from the sensitivity of a regional climate model to physicalparameterisation schemes horizontal resolution domain size and location as well as to initial and boundaryconditions is crucial for the interpretation of model results eg for dynamical downscaling of global climatepredictions In this study we assess some of these aspects by investigating daily precipitation statisticssimulated by the regional climate model CLM (Climate version of the Local Model) Different sensitivityexperiments related to initialisation date domain size and location and to the lateral boundary forcing havebeen performed for the summer of 1974 The evaluation domain is Germany located approximately in thecentre of the model domain Comparisons to the control run show that the spatially averaged precipitationstatistics can be significantly affected by this modification not only in specific regions but also in entireGermany The results also indicate that the strength of the lateral boundary forcing has a crucial influence onthe simulated characteristics
Zusammenfassung
Die Kenntnis der Sensitivitat regionaler Klimamodelle in Bezug auf die Parametrisierung physikalischerProzesse horizontale Auflosung Groszlige und Lage des Modellgebiets sowie Anfangs- und Randbedingun-gen und der damit verbundenen Unsicherheit ist entscheidend fur die Interpretation von ModellergebnissenzB fur das dynamische Downscaling von globalen Klimamodelllaufen In der vorliegenden Arbeit werdeneinige dieser Aspekte quantitativ abgeschatzt Dazu werden statistische Groszligen des taglichen Niederschlagsaus Simulationen des regionalen Klimamodells CLM (Climate version of the Local Model) abgeleitet und un-tersucht Fur den Sommer 1974 wurden verschiedene Studien zur Sensitivitat bezuglich des Initialisierungs-datums der Groszlige und Lage des Modellgebiets und der seitlichen Randbedingungen durchgefuhrt Das Un-tersuchungsgebiet Deutschland liegt zentral im Modellgebiet Der Vergleich mit dem Kontrolllauf zeigt dassraumlich gemittelte statistische Groszligen durch die genannten Modifikationen nicht nur fur bestimmte Regio-nen sondern auch fur ganz Deutschland signifikant beeinflusst werden konnen Die Ergebnisse deuten fernerdarauf hin dass der Antrieb durch die seitlichen Randbedingungen einen entscheidenden Einfluss auf diesimulierten Werte hat
1 Introduction
Global and regional climate model simulations play acrucial role in the understanding of climate variabilityand change In the last decade progress has been madein the development and improvement of regional cli-mate modelling techniques (eg GIORGI and MEARNS1999 WANG et al 2004) Such regional climate models(RCMs) are forced by large scale fields of Atmosphere-Ocean General Circulation Models (AOGCM) or globalreanalyses They are intended to reproduce the largescale patterns of the driving model and to add infor-mation of climatic variables on finer scales The valueadded by dynamical downscaling however is still animportant topic which has to be addressed (CASTRO etal 2005 LO et al 2008 ROCKEL et al 2008) Manystudies dealing with RCMs are focused on the evaluationof models and the understanding of physical processes
lowastCorresponding author Kerstin Ebell Institute for Geophysics and Meteo-
rology University of Cologne Kerpener Str 13 50937 Cologne Germany
e-mail kebellmeteouni-koelnde
as a necessary first step for climate change simulations(eg CHRISTENSEN et al 1998 ACHBERGER et al2003 FREI et al 2003) Biases in the important climaticvariables temperature and precipitation pose still a prob-lem (BOHM et al 2006 JAGER et al 2008) Severalof these studies have also examined the sensitivity ofregional climate models to modified initial and bound-ary conditions (eg JACOB and PODZUN 1997 SETH
and GIORGI 1998 WU et al 2005) These studies in-dicate that due to non-linear physics and dynamics ofthe models even small changes in the initial conditionsor in the boundary forcing can lead to quite differentmodel results JACOB and PODZUN (1997) for exam-ple performed sensitivity studies with the hydrostaticregional climate model REMO in which the dependenceof model results on domain size horizontal resolutioninitial conditions and lateral boundaries was examinedThey conclude that the results of the regional model arenot only strongly dependent on the forcing fields but alsoon the domain size and simulation length
0941-294820080305 $ 495
DOI 1011270941-294820080305 ccopy Gebruder Borntraeger Berlin Stuttgart 2008
422 K Ebell et al Sensitivity of summer precipitation Meteorol Z 17 2008
500
500500
500500
500
500
500
500
500500
500
500
500
500
500
500
500
500
500
500
500
500
500
500
1000
10001000
1000
1000
1000
1000
1000
1000
1000
1000
1000
1000
20002000
2000
Figure 1 Coastlines of model domain with 500 1000 and 2000 m
height contour intervals
These studies can unveil deficiencies in the perfor-mance of models and may eventually lead to improve-ments in the model formulation The knowledge of theperformance and the magnitude of uncertainty of the cli-mate models in present climate simulations are of keyimportance in order to accurately interpret the results offuture climate scenarios
In the assessment of present-day climate variabilityand future climate change the modelling of precipita-tion is of particular importance since precipitation de-termines a variety of interactions in natural processes aswell as many socio-economic activities Furthermore itis presumed that the risk of extreme events like floodsand droughts which are directly linked to precipitationincreases in the future (CHRISTENSEN et al 2007)Such events occur on regional scales In this context thequestion arises if precipitation properties such as inten-sity or extreme events and their distribution in space andtime can be well simulated by a regional climate modelTherefore we focus on precipitation as the evaluationvariable
The formation of precipitation is the result of a com-plex chain of chemical and physical processes leadingto complex precipitation patterns in time and space Thecorrect simulation of such patterns is therefore a chal-lenging task not only in regional climate modelling butalso for numerical weather prediction This is becausethe processes leading to precipitation often occur onsmall scales especially in convective situations whichcannot be resolved by the model Thus the implementedphysical parameterisations of a model play a crucialrole for the quality of precipitation simulations Previ-ous studies indicate that the simulation of summer pre-cipitation in particular is a challenge compared to thatof other seasons not least because of its convective na-ture Model biases for the summer months June Julyand August (JJA) seem to be larger (FREI et al 2003)
and the results of different regional climate models devi-ate stronger from each other (KOTLARSKI et al 2005)VIDALE et al (2003) suggest that the predictability ofthe regional climate is generally weaker during summer
In this context our study gives insight into the abil-ity of a particular regional climate model the CLM tosimulate daily variability of summer precipitation and itsstatistical properties The CLM has been and is appliedin various evaluation studies These studies include theevaluation of different atmospheric variables in termsof comparisons between model and observations andorthe forcing data itself (BOHM et al 2004 BOHM etal 2006 JAGER et al 2008) as well as in terms ofsensitivity experiments with respect to different physi-cal parameterisations (eg BACHNER et al 2008) Inmost of these studies the CLM is validated in respectto annual or monthly mean conditions and larger spatialscales (eg JAGER et al 2008) In contrast we focus onthe simulation and validation of JJA precipitation statis-tics in Germany and in single subregions and assess thesensitivity of different precipitation statistics to modifiedinitial and boundary conditions Our work supplementsthe studies by BACHNER et al (2008) who concentrateon another sensitivity of CLM simulations namely thesensitivity to physical parameterisation schemes usingthe same model configuration
Such sensitivity studies are useful for the interpre-tation of model results particularly with regard to theCLM regional present day and future climate scenariosforced by the AOGCM ECHAM5 (BOHM et al 2006LEGUTKE et al submitted)
The paper is organised as follows In chapter 2 a shortdescription of the model the applied configurations andan overview of the performed simulations are givenChapter 3 summarises our investigation strategy whilechapter 4 contains the results of the different model runsincluding a discussion A summary and an outlook arepresented in chapter 5
2 Model and simulations
The CLM has been developed from the limited areamodel COSMO formerly known as the Local Modelof the Deutscher Wetterdienst (DWD) A descriptionof the general model features can be found in WILL
et al (submitted) we focus thus on the chosen modelconfigurations The model domain comprises wide partsof Europe (Figure 1) with a horizontal grid spacing of16 (about 18 km) and a vertical resolution of 20 at-mospheric layers and 9 soil layers Grid-scale clouds andprecipitation are parameterised by a Kessler-type bulkwater continuity scheme (KESSLER 1969) The schemeapplied in our studies includes four water classes wa-ter vapour cloud water precipitation water and precip-itation ice Moist convection is described by a Tiedtkemass-flux convection scheme (TIEDTKE 1989) Initialand boundary data are provided by the ERA40 data set
Meteorol Z 17 2008 K Ebell et al Sensitivity of summer precipitation 423
Table 1 Overview of simulations performed for JJA 1974 with the corresponding modifications with respect to the control run BASE
Name of
simulation
Parameter changed Value in run
BASE
Value in this run
APRIL-21
Initialisation date 2 May 1974
21 April 1974
APRIL-29 29 April 1974
MAY-07 7 May 1974
MAY-09 9 May 1974
PLUS15GP Number of grid points in
x-direction 132 147
SHIFTDOM
Geographical coordinates of the
lower left grid point of the model
domain
-724degE
3872degN
-546degE
4113degN
WEIGHT-A Weighting curve parameters
(see Eq 21) a = 05 b = 075
a = 025 b = 1
WEIGHT-B a = 0125 b = 1
(UPPALA et al 2005) This data has a spatial resolu-tion of 1125 and is available four times a day (00 0612 18 UTC) It was customised to the finer CLM gridin a pre-processing step and fed to the model every sixhours The boundary information is assigned at the lat-eral boundaries and at the upper boundary and relaxedtowards the model domain using the relaxation tech-nique by DAVIES and TURNER (1977)
In a first step a control run (simulation BASE) wasperformed for JJA 1974 The summer season of 1974has been chosen because it shows average conditionsin summer precipitation in Germany BACHNER et al(2008) also investigated rainfall statistics for this partic-ular summer Furthermore they analysed precipitationstatistics of extreme summer seasons ie five wet andfive dry summers
Due to the spin-up time of the model the simula-tion was started on 2 May 1974 In the second step asmall ensemble of simulations was created by changingthe model configuration in different ways (Table 1) Toassess the impact of different initial conditions on theprecipitation statistics we varied the initialisation dateof the model To obtain the maximal amplitude of vari-ation due to the influence of the initial conditions interms of the initialisation date days on which the syn-optic condition is quite different from that of the con-trol simulation were selected ie compared to the con-trol run the selected days show low spatial correlationin temperature and circulation pattern The result is aset of four simulations APRIL-21 APRIL-29 MAY-07 and MAY-09 Lateral boundary conditions are indi-rectly changed by a modification of the model domainie a slight enlargement (simulation PLUS15GP) and adisplacement (simulation SHIFTDOM) The strength ofthe boundary forcing was varied (simulations WEIGHT-A and WEIGHT-B) by changing the relaxation weightsα according to HERZOG et al (2002) The α-weight of agrid point depends on the distance of the grid point to theboundary Let j be the index which labels the grid pointsof a grid row inwards with the boundary point j = 0
0 5 10 15 20 250
01
02
03
04
05
06
07
08
09
1
j
w
eig
hts
a=05 (BASE)
a=025 (WEIGHT A)
a=0125 (WEIGHT B)
Figure 2 Boundary weight curve as a function of distance of a
gridpoint j for three different slope parameters a = 05 025 and
0125 For a = 05 b is 075 otherwise it is set to 1
then the α-weights are calculated by
α (j) = b middot (1 minus tanh (aj)) (21)
Our modifications of the slope parameter a and the in-tercept parameter b result in the boundary weight curvesshown in Figure 2 In the simulations WEIGHT-A andWEIGHT-B these parameters are chosen such that theboundary information can penetrate deeper into the in-terior of the model domain than in the control run
3 Observations and evaluation strategy
We evaluate the model results by comparing them todaily precipitation measurements from rain gauge sta-tions of the DWD measurement network Only thosestations with continuous records from 1 June to 31 Au-gust 1974 were chosen leading to a set of 4365 rain
424 K Ebell et al Sensitivity of summer precipitation Meteorol Z 17 2008
Table 2 BIASbase of MEAN (mmday) and FREQ () for different sensitivity experiments (JJA1974) Biases significant at the 5 -level
are indicated by an asteriskrdquo
MEAN (mmday) FREQ ()
Germ WEST ODER BF BAV Germ WEST ODER BF BAV
APRIL-21 -013 -013 -025 -012 -027 -130 -152 -092 -017 -187
APRIL-29 -002 001 -011 015 010 006 037 095 -040 -013
MAY-07 -003 -003 -016 -031 010 -008 055 020 -034 013
MAY-09 -001 010 -019 -020 -002 080 189 130 046 030
PLUS15GP -005 006 -027 -018 -028 -020 048 -078 -024 -017
SHIFTDOM -015 004 -056 -041 007 -213 -177 -450 000 154
WEIGHT-A -003 024 -052 023 033 -039 -082 -297 006 239
WEIGHT-B -004 -006 -055 -082 072 -088 -074 -642 -109 637
longitude
latitu
de
6degE 7degE 8degE 9degE 10degE
48degN
49degN
50degN
51degN
52degN
53degN
54degN
55degN
0
2
4
6
8
10
12
14
16
18
Figure 3 Location of continuously measuring stations (dots) in JJA
1974 and corresponding number of stations per grid box (shaded
areas) in the evaluation domain (Germany)
gauge time series We note that the types of data com-pared to each other ie rain gauge observations and themodelled precipitation sums are of different nature be-cause rain gauge measurements are point measurementsand model values might be interpreted as averages overthe modelrsquos grid box In addition rain gauge measure-ments tend to underestimate the precipitation amountdue to wind drift of precipitation wetting and evapo-ration while the precipitation variability within a gridbox especially over complex terrain is not taken intoaccount by the model To compare model and observa-tions we compute the arithmetic mean of all rain gaugesin one grid box Figure 3 shows the station density inGermany which achieves an average value of about 4stations(18 km)2
longitude
latitu
de
mmday
6degE 7degE 8degE 9degE 10degE
48degN
49degN
50degN
51degN
52degN
53degN
54degN
55degN
minus4
minus3
minus2
minus1
0
1
2
3
4
WEST
ODER
BF
BAV
Figure 4 Differences in MEAN (mmday) for JJA 1974 control run
minus observations The chosen subregions WEST ODER BF and
BAV are indicated by frames
The following statistics of daily precipitation werecompared for JJA 1974ndash Mean precipitation (MEAN mmday) total rainfall
amount of JJA divided by the number of days in thisanalysis period
ndash Mean precipitation intensity (INT mmday) averageprecipitation per wet day
ndash 90 -quantile of the empirical distribution of wet-day amounts (Q90 mmday) and
ndash Frequency of wet days (FREQ )
To distinguish between wet and dry days a thresholdof 1 mmday is chosen This value seems to be adequatesince a smaller value would make the evaluation too sen-sitive to the measurementobserver accuracy and to the
Meteorol Z 17 2008 K Ebell et al Sensitivity of summer precipitation 425
tendency of some models to simulate very frequentlyvery low precipitation amounts (FREI et al 2003)
To quantify the deviation between the control runand a run with a modified model setup two distancemeasures are applied the root-mean-square difference(RMSD) and the average difference (BIAS) in accor-dance with the study of GIORGI and BI (2000) For themean precipitation for example the RMSD is given by
RMSD =
radic
radic
radic
radic
sum
i
(
MEAN sensi minus MEAN base
i
)2
N
(31)where MEAN base is the result of the control run andMEAN sens the result of a sensitivity experiment Thesummation is carried out over the number of grid boxesN within a given region The BIAS is defined by
BIASbaseobs =sum
i
MEAN sensi minus MEAN
baseobsi
N
(32)To avoid confusion BIASbase will be used if resultsof a sensitivity experiment are compared to those ofthe control run and BIASobs if the model results arerelated to observations To test the significance of a biasa two-sided Studentrsquos t-test is performed at the 5 -level(95 significance)
The correspondence of the modelled and observedspatial structure of the precipitation indices is assessedby means of the Spearmanrsquos rank correlation coefficientFor MEAN for example the correlation is calculated by
ρ = 1 minus 6
sum
id2
i
N(N2minus1)with
di = rank(
MEANCLMi
)
minus rank(
MEANobsi
)
(33)Again the summation is carried out over the number ofgrid boxes
The evaluation of the model results and the intercom-parison of the different simulations are performed forvarious regions of interest The statistics are calculatedfor entire Germany ie those grid boxes in Germanywhich contain at least one rain gauge (cf Figure 3) aswell as for a set of subregions For dynamical downscal-ing of future climate scenarios the effects on regionalscales might be of particular interest Figure 4 depictsthe difference in MEAN between modelled (control run)and observed values The indicated subregions WESTODER BF and BAV have been selected with regard tothe varying capability of the model to simulate the re-gional precipitation statistics of JJA 1974 (see section42) and to their difference in orography and climatol-ogy In the region WEST moderate westerly winds fromthe Atlantic Ocean prevail leading to moderate temper-atures The terrain is rather flat with the Rhine valley inthe south-west of the region and hills in the north-eastnot exceeding 300 m
The region ODER is dominated by a continental cli-mate with a large seasonal temperature variance Thisregion is among the driest regions in Germany Hillswith elevations of up to 500 m can only be found atthe southern most grid boxes The Black Forest (BF)is one of the wettest regions in Germany affected by amostly southwesterly flow The simulation of precipita-tion in this low mountain range is much more complexsince orographically-induced and convective precipita-tion systems dominate the precipitation climate Thusthe westward-facing slopes receive the highest rainfallfrom maritime air masses The region BAV comprisessome parts of the Alpine foreland and the Alpine regionThe highest elevations in Germany where the modeltopography shows values up to 1500 m can be found inthis region
4 Results
The evaluation of the precipitation variability in summer1974 simulated by the control run and eight sensitivityexperiments focuses on two aspects (i) the model un-certainty in different characteristics of daily precipita-tion resulting from the sensitivity to the modification ofthe initial and boundary conditions in respect to the con-trol run and (ii) the model capability to simulate thesecharacteristics with respect to the observations
41 Model sensitivity
First we will focus on the model sensitivity to the ini-tialisation date the model domain size and location andto the lateral boundary forcing In the control run thelargest MEAN values of about 9 mmday can be found inthe Alpine region in Southern Bavaria Regions with en-hanced simulated precipitation are the Black Forest (upto 6 mmday) and other low mountain ranges in Ger-many as well as Eastern Germany along the border toPoland Precipitation amounts are generally low in theSouth-West and in some parts of Eastern Germany Inprinciple the mean precipitation intensity and the 90 -quantiles go along with MEAN The spatial structureof simulated precipitation frequency differs from thespatial patterns of the other statistics with the highestprecipitation frequencies in Bavaria especially in theAlpine region and in Eastern Germany along the OreMountains (gt60 ) Precipitation events also often oc-cur in parts of North-Western and Western GermanyThese main features of the precipitation statistics can begenerally found for the various model experiments al-though on smaller scales pattern and amounts can differsignificantly Since a meaningful comparison of the spa-tial patterns of the different simulations is hardly possi-ble by visual judgement the results of a Studentrsquos t-testapplied to the BIASbase of the precipitation statisticsMEAN and FREQ are summarised in Table 2 This testreveals that significant differences between the control
426 K Ebell et al Sensitivity of summer precipitation Meteorol Z 17 2008
Figure 5 RMSD of MEAN (mmday) INT (mmday) Q90 (mmday) FREQ () for entire Germany and the four subregions WEST
ODER BF and BAV The left column shows the absolute RMSD the right panel the relative RMSD The relative RMSD is the RMSD
divided by the corresponding spatial standard deviation of the control run
run and the sensitivity experiments can be found for en-tire Germany and also on smaller scales The mean pre-cipitation amount in Germany is significantly changed insimulations APRIL-21 and SHIFTDOM For nearly allsensitivity experiments significant differences in MEANcan be found for the region ODER One reason for therelatively large sensitivity in this area ie the large num-ber of significant changes might be the short distance tothe eastern model boundary The model solution in thisregion may be affected by the lateral boundary forcingmore strongly than in other regions of interest For INTand Q90 similar results have been found (not shown)Regarding the precipitation frequency significant differ-ences can be found for entire Germany in four simula-tions (APRIL-21 MAY-09 SHIFTDOM WEIGHT-B)In contrast to MEAN significant deviations occur alsoin the region BAV In region BF solely an enhancedboundary forcing (simulation WEIGHT-B) caused sig-nificant differences not only in MEAN but also in INTand Q90 (not shown) Summarising our results each ofthe modifications even the shift of the initialisation date
by a few days led to significant changes in the summerprecipitation statistics in at least one of the investigatedregions compared to the control run
Absolute and relative RMSD values of the precipita-tion statistics were calculated for the different regions(Figure 5) The absolute values were divided by the spa-tial standard deviation of MEAN INT Q90 and FREQof simulation BASE in the corresponding region in or-der to obtain relative measures These relative values aremore useful to identify possible regions and precipita-tion statistics of highest or lowest sensitivity to modifiedinitial and lateral boundary conditions
Regardless of variable and region differences due tothe modified model domain or due to modified lateralboundary conditions are larger than those due to dif-ferent initialisation dates The finding that the lateralboundary forcing has a strong influence on the modelsolution is in agreement with JONES et al (1995) andJACOB and PODZUN (1997) who investigated the ef-fects of the domain size and the location of the lat-eral boundaries on regional climate model results Note
Meteorol Z 17 2008 K Ebell et al Sensitivity of summer precipitation 427
MEAN
0 02 04 06 08 1 12 14
0
1
02
1
04
1
06
1
08
1
09
1
095
1
099
1
Sta
nd
ard
De
via
tio
n (
No
rma
lise
d)
Pattern Correlation
INT
0 02 04 06 08 1 12 14
0
1
02
1
04
1
06
1
08
1
09
1
095
1
099
1
Sta
nd
ard
De
via
tio
n (
No
rma
lise
d)
Pattern Correlation
Q90
0 02 04 06 08 1 12 14
0
1
02
1
04
1
06
1
08
1
09
1
095
1
099
1
Sta
nd
ard
De
via
tio
n (
No
rma
lise
d)
Pattern Correlation
FREQ
0 02 04 06 08 1 12 14
0
1
02
1
04
1
06
1
08
1
09
1
095
1
099
1
Sta
nd
ard
De
via
tio
n (
No
rma
lise
d)
Pattern Correlation
OBS
BASE
APRIL 21
APRIL 29
MAY 07
MAY 09
PLUS15GP
SHIFTDOM
WEIGHT A
WEIGHT B
Figure 6 Taylor diagrams for different statistics MEAN INT Q90 and FREQ The pattern correlation is given as the angle from the
abscissa and the normalised standard deviation (modelled value divided by observed) as the radial distance from the origin The thick
dashed line indicates the observed standard deviation
however that the derived sensitivities presented in ourwork cannot be directly compared to each other sincethe variation amplitude for initial and boundary condi-tions differs among the different sensitivity experimentsGIORGI and BI (2000) applied small random pertur-bations with a prescribed maximum perturbation ampli-tude on the initial and lateral boundary data With theirnormalisation they found that both types of modifica-tion lead to similar effects in daily precipitation and tem-perature of the lower troposphere in a regional climatemodel Due to the different types of modification theseresults are not contradicted by our investigations
The spread of the RMSD values provides informa-tion about the extent of the model uncertainty related todifferent initial and boundary conditions In general theRMSD values are of a similar magnitude as the spatialvariability of the corresponding precipitation statisticsThe largest effect can be found on the mean precipita-tion and the mean precipitation intensity with relativeRMSD values between 02 and 2 The regions WESTand ODER exhibit the highest sensitivity to the modified
Table 3 BIASobs of MEAN (mmday) INT (mmday) Q90
(mmday) and FREQ () for entire Germany and the four subre-
gions (JJA 1974) Significant biases at the 5 -level are indicated by
an asterisk
Germany WEST ODER BF BAV
MEAN (mmday) -014 -015 095 142 -153
INT (mmday) -069 -070 148 109 -317
Q90 (mmday) -107 -108 157 744 -917
FREQ () -003 133 601 475 -043
initial and boundary data and to the type of the modifi-cation For the region ODER this might be explained byits location near to the eastern boundary A small spreadcan generally be found for the region BAV indicatingthat this region is less sensitive to the different types ofmodification
428 K Ebell et al Sensitivity of summer precipitation Meteorol Z 17 2008
42 Model performance
In the next step we will answer the question howwell the observed precipitation characteristics in sum-mer 1974 can be simulated by the CLM and in whichextend they vary depending on the different sensitivityexperiments SETH and GIORGI (1998) have shown thatmodels are in better agreement with observations whenthe influence of the lateral boundary conditions the re-analysis data is enhanced However we assume that theinitialisation date has not a noticeable effect on the qual-ity of the model results compared to the control run
Table 3 shows that the control run underestimates sig-nificantly the observed indices MEAN INT and Q90 inentire Germany and in the regions WEST and BAV Inthe region BAV these indices fall below the observedvalues in the order of about 30 (ie by ndash 27 ndash27 and ndash34 for MEAN INT and Q90 respectively) Inthe region WEST however the negative biases are con-siderably lower than in the region BAV In contrast sig-nificant overestimation of the indices MEAN INT andQ90 occurs in the region BF and ODER The highestpositive bias can be noted in heavy precipitation (Q90)in region BF
The precipitation frequency (FREQ) for entire Ger-many and in region BAV is not significantly lower thanin the observations while in the other regions especiallyin region ODER the modelled FREQ is significantlyoverestimated
A reason for the underestimation of the indicesMEAN INT and Q90 might be that the forcing dataitself has a dry bias This has already been recognisedfor Europe by HAGEMANN et al (2005) Howeverthe model performance exhibits a strong regional vari-ability (Figure 4 Table 3) The underestimation couldalso originate from the fact that the occurrence of pre-cipitation events is correctly simulated but with toosmall amounts yielding a significant underestimation ofMEAN INT and Q90 but not of FREQ
The overestimation of all precipitation indices in theregions ODER and BF may be attributed to two ef-fects (i) the overestimation of precipitation at single(individual) days at which rainfall has also been ob-served and (ii) the generation of spurious precipitationevents which have not been observed at all The last ef-fect would lead to an overestimation of the precipitationfrequency which is obviously the case for the regionsODER and BAV First studies to support these expla-nations have been carried out in form of an analysis oftime series of daily precipitation All these results indi-cate that the performance of the CLM standard config-uration (control run) to simulate correctly the observedprecipitation characteristics for different regions in theone selected summer is low
If we compare the results of the control run and of theeight sensitivity experiments with the observed precipi-tation indices for entire Germany we can in general con-clude that the applied modifications even a strengthen-
ing of the boundary forcing do not affect the skill of themodel on the indices related to precipitation intensitywhile the frequency index is affected (Table 4) In allsimulations the MEAN INT and Q90 are significantlyunderestimated In most cases this is also valid for theprecipitation frequency (FREQ) In general the mostevident effects of the applied modifications are visiblein FREQ Here the model capability strongly dependson the performed simulation Four simulations (APRIL-29 MAY-07 SHIFTDOM WEIGHT-B) reveal a signif-icant BIASobs in the precipitation frequency The ap-plied modifications even have an effect on the sign ofthe BIASobs value
The results of the analysis of spatial variability andof pattern correspondence of the modelled and observedprecipitation indices are summarised in Taylor-diagrams(TAYLOR 2001) Figure 6 shows the normalised spatialstandard deviation and the pattern correlation the ob-servations are always represented as a point at unit dis-tance to the origin on the abscissa and well-performingsimulations are close to this point The normalised stan-dard deviation is the ratio between the modelled andthe observed standard deviation which is a measure forthe spatial variability of a precipitation statistic If thenormalised standard deviation of a simulation is larger(smaller) than 1 the spatial variance of the precipita-tion statistic is overestimated (underestimated) The di-agrams reveal that the pattern correlation is low in allsimulations The results do not differ much among thedifferent simulations Only for FREQ the pattern cor-relation in simulation WEIGHT-B is about 25 higherthan in the other simulations The spatial variances ofMEAN INT and Q90 are slightly underestimated in al-most all simulations while the spatial variance of FREQis overestimated especially for simulation WEIGHT-BThis means that the spatial structure within the regionsis not well simulated by the CLM
5 Summary and outlook
In the presented study we wanted to provide an insightinto the ability of the CLM in representing the statisti-cal properties of JJA precipitation in Germany Further-more sensitivity studies demonstrated the dependenceof the simulated precipitation statistics on changes ofinitial conditions domain size and location and bound-ary forcing and therefore the uncertainty of the precipi-tation statistics in this respect Neither the model perfor-mance of the CLM in simulating summer precipitationstatistics nor the according sensitivity has been evalu-ated in such a way before The sensitivity experimentsrevealed significant inter-simulation differences in theprecipitation statistics for entire Germany as well as onsmaller scales Obviously the lateral boundary forcinghas a strong influence on the model solution Compar-isons between simulated and observed values demon-strated that the ability of the CLM to simulate the mean
Meteorol Z 17 2008 K Ebell et al Sensitivity of summer precipitation 429
Table 4 BIASobs of MEAN (mmday) INT (mmday) Q90 (mmday) and FREQ () for all simulations for entire Germany Significant
biases at the 5 -level are indicated by an asterisk
MEAN (mmday) INT (mmday) Q90 (mmday) FREQ ()
BASE -014 -069 -107 -003
APRIL-21 -014 -066 -112 -011
APRIL-29 -012 -079 -135 077
MAY-07 -024 -072 -127 -132
MAY-09 -014 -065 -101 004
PLUS15GP -016 -069 -125 -023
SHIFTDOM -026 -084 -123 -215
WEIGHT-A -014 -080 -086 -042
WEIGHT-B -015 -097 -122 -090
summer precipitation statistics is not satisfying yet Ourstudy detected some deficiencies which can be sum-marised as follows
ndash significant underestimation of mean precipitationmean precipitation intensity and extreme precipita-tion in Germany
ndash strong regional variability of model performance(over- or underestimation of precipitation statisticsdepends on considered region)
ndash low correspondence of the spatial structure and
ndash possible spurious generation of extreme events incertain subregions
Since the main focus of this paper was not to findreasons for the discrepancies between modelled and ob-served precipitation but rather to get an insight in themodel performance and sensitivity this topic should beaddressed in future studies These studies could includean analysis of specific events leading to extreme precip-itation For this purpose a dataset with high spatial andtemporal resolution would be needed so that the evo-lution of single events can be analysed in more detailWith a data set of higher temporal resolution an inves-tigation of the diurnal cycle would also be an interest-ing subject since regional models often exhibit prob-lems in this respect (see eg VAN LIPZIG et al 2005 forthe COSMO model) Differences between modelled andobserved precipitation may have many sources of errorTo unveil these deficiencies a thorough investigation ofother variables is needed This demanding task was notthe main focus of this study since we wanted to get aninsight in the simulation of the statistics of daily precip-itation and not only of long-term means As mentionedbefore other quantities than precipitation have been in-vestigated for the CLM eg by BOHM et al (2006) andJAGER et al (2008)
Because of the potential randomness of the resultsof one single summer simulation our evidence of themodel deficiencies should be considered with cautionIn a next step simulations of more summer seasons areneeded to establish a representative data basis for a de-tailed validation of the model performance
It has to be verified whether discrepancies similar tothose found for 1974 also occur in other summer sea-sons Our results indicate that studies of other summerseasons should also include sensitivity studies concern-ing for example the boundary forcing The model do-main size should be chosen large enough so that theinfluence of the boundary forcing on the investigatedregions is not too strong as it might have been thecase for the region ODER Other studies with the CLM(ROCKEL et al 2008 JAGER et al 2008) also inves-tigate the effect of the spectral nudging instead of therelaxation technique JAGER et al (2008) performed asensitivity study with additional spectral nudging andshowed that in contrast to applying the relaxation tech-nique by DAVIES and TURNER (1977) alone the use ofspectral nudging improves the simulated large-scale cir-culation but not precipitation and temperature More-over ROCKEL et al (2008) found indications that inthe CLM the large-scale variability is not retained whenusing the relaxation technique by DAVIES and TURNER
(1977) alone The additional application of a 4D gridnudging technique retains the large scale variability butROCKEL et al (2008) also show that more added vari-ability at smaller scales is achieved when applying spec-tral nudgingrdquo The application of a 4D internal nudgingtechnique retains the large scale variability but ROCKEL
et al (2008) also show that more added variability atsmaller scales is achieved when applying spectral nudg-ing This suggests that if an internal nudging is appliedin addition to the standard boundary relaxation the use ofspectral nudging instead of a 4D grid nudging techniqueshould also be studied in future simulations Because ofthe strong regional variability of the model performance
430 K Ebell et al Sensitivity of summer precipitation Meteorol Z 17 2008
the analysis should not only focus on mean statistics forlarge scales (Germany) but also for smaller subregions
Nevertheless our results give a first impression of theability of the CLM as a tool for climate downscalingand might therefore assist in analysing the results of thefuture climate scenarios (BOHM et al 2006 LEGUTKE
and LAUTENSCHLAGER 2008) It seems to be problem-atic to make statements for regional scales because themodel performance and the model sensitivity exhibit astrong regional variability making model results less re-liable on small spatial scales The assessment and over-coming of such deficiencies will enhance the ability ofthe CLM to serve as a tool for climate change impactstudies in future
Acknowledgments
The authors would like to thank the DWD for providingthe observational data and computational resources TheCLM-Community is acknowledged for providing themodel and for its support during the completion of thework We would also like to thank the reviewers for theirhelpful comments
References
ACHBERGER C M-L LINDERSON D CHEN 2003 Per-formance of the Rossby Centre regional atmospheric modelin Southern Sweden Comparison of simulated and ob-served precipitation ndash Theor Appl Climatol 76 219ndash234
BACHNER S A KAPALA C SIMMER 2008 Evaluationof daily precipitation characteristics in the CLM and theirsensitivity to parameterizations ndash Meteorol Z 17 407ndash419
BOHM U M KUCKEN D HAUFFE F-W GERSTEN-GARBE PC WERNER M FLECHSIG K KEULER ABLOCK W AHRENS TH NOCKE 2004 Reliability ofregional climate model simulations of extremes and oflong-term climate ndash Nat Hazards Earth Syst Sci 4 417ndash431
BOHM U M KUCKEN W AHRENS A BLOCK DHAUFFE K KEULER B ROCKEL AWILL 2006 CLMndash The Climate Version of LM Brief Description and LongndashTerm Applications ndash COSMO Newsletter No 6 GermanWeather Service (DWD) PO Box 100465 63004 Offen-bach Germany 225ndash235
CASTRO CL RA PIELKE SR G LEONCINI 2005Dynamical downscaling Assessment of value retainedand added using the Regional Atmospheric ModelingSystem (RAMS) ndash J Geophys Res 110 D05108DOI1010292004JD004721
CHRISTENSEN JH B HEWITSON A BUSUIOC ACHEN X GAO I HELD R JONES RK KOLLI W-TKWON R LAPRISE V MAGAA RUEDA L MEARNSCG MENNDEZ J RISNEN A RINKE A SARR PWHETTON 2007 Regional Climate Projections ndash In Cli-mate Change 2007 The Physical Science Basis Contri-bution of Working Group I to the Fourth Assessment Re-port of the Intergovernmental Panel on Climate ChangeSOLOMON S D QIN M MANNING Z CHEN MMARQUIS KB AVERYT M TIGNOR HL MILLER
(Eds) Cambridge University Press Cambridge UnitedKingdom and New York NY USA
CHRISTENSEN O B J H CHRISTENSEN B MACHEN-HAUER M BOTZET 1998 Very high-resolution regionalclimate simulations over Scandinavia ndash Present climate ndashJ Climate 11 3204ndash3229
DAVIES H C R E TURNER 1977 Updating predictionmodels by dynamical relaxation An examination of thetechnique ndash Quart J Roy Meteor Soc 103 225ndash245
FREI C J H CHRISTENSEN M DEQUE D JACOB RG JONES P L VIDALE 2003 Daily precipitation statis-tics in regional climate models Evaluation and intercom-parison for the European Alps ndash J Geophys Res 108(D3) 4124 DOI 1010292002JD002287
GIORGI F X BI 2000 A study of internal variability ofa regional climate model ndash J Geophys Res 105 29503ndash29521
GIORGI F L O MEARNS 1999 Introduction to specialsection Regional climate modeling revisited ndash J GeophysRes 104 6335ndash6352
HAGEMANN S K ARPE L BENGTSSON 2005Validation of hydrological cycle of ERA-40 ndashERA-40 Project Report No 24 42 pp available athttpwwwecmwfintpublications
HERZOG H-J USCHUBERT G VOGEL A FIEDLER RKIRCHNER 2002 LLM ndash the high-resolving nonhydrosta-tic simulation model in the DWD ndash Project LITFASS PartI Modelling technique and simulation method ndash TechnicalReport No 4 German Weather Service (DWD) PO Box100465 63004 Offenbach Germany
JACOB D R PODZUN 1997 Sensitivity studies with theregional climate model REMO ndash Meteor Atmos Phys 63119ndash129
JAGER EB I ANDERS D LUTHI B ROCKEL CSCHAR SI SENEVIATNE 2008 Analysis of ERA40-driven CLM simulations for Europe ndash Meteorol Z 17349ndash367
JONES RG JM MURPHY M NOGUER 1995 Simula-tion of climate change over Europe using a nested regional-climate model I Assessment of control climate includingsensitivity to location of lateral boundaries ndash Quart J RoyMeteor Soc 121 1413ndash1449
KESSLER E 1969 On the distribution and continuity ofwater substance in atmospheric circulations ndash MeteorMonogr 10 84 pp
KOTLARSKI S A BLOCK U BOHM D JACOB KKEULER R KNOCHE D RECHID A WALTER 2005Regional climate model simulations as input for hydro-logical applications evaluation of uncertainties ndash AdvanGeosci 5 119ndash125
LEGUTKE S H-D HOLLWEG M LAUTEN-SCHLAGER I FAST B HENNEMUTH EKEUP-THIEL M SCHUBERT C WUNRAM
submitted Transient Ensemble Climate Simula-tions over Europe with the RCM CLM forcedby ECHAM5MPI-OM IPCC AR4 Projections ndashMeteorol Z
Lo JC-F Z-L Yang RA Pielke Sr 2008 Assessmentof three dynamical climate downscaling methods using theWeather Research and Forecasting (WRF) model ndash J Geo-phys Res 113 D09112 DOI1010292007JD009216
ROCKEL B CL CASTRO RA PIELKE SR H VON
STORCH G LEONCINI 2008 Dynamical downscalingassessment of model system dependent retained and addedvariability for two different Regional Climate ModelsndashJournal of Geophysical Research accepted
SETH A F GIORGI 1998 The effect of domain choice
Meteorol Z 17 2008 K Ebell et al Sensitivity of summer precipitation 431
on summer precipitation simulation and sensitivity in aregional climate model ndash J Climate 11 2698ndash2712
TAYLOR KE 2001 Summarizing multiple aspects ofmodel performance in a single diagram ndash J Geophys Res106 (D7) 7183ndash7192
TIEDTKE M 1989 A comprehensive mass flux scheme forcumulus parameterization in large-scale models ndash MonthWea Rev 117 1779ndash1800
UPPALA SM PW KALLBERG AJ SIMMONS U AN-DRAE V DA COSTA BECHTOLD M FIORINO JKGIBSON J HASELER A HERNANDEZ GA KELLYX LI K ONOGI S SAARINEN N SOKKA RP AL-LAN E ANDERSSON K ARPE MA BALMASEDAACM BELJAARS L VAN DE BERG J BIDLOT NBORMANN S CAIRES F CHEVALLIER A DETHOFM DRAGOSAVAC M FISHER M FUENTES S HAGE-MANN E HOLM BJ HOSKINS L ISAKSEN PAEMJANSSEN R JENNE AP MCNALLY J-F MAHFOUFJ-J MORCRETTE NA RAYNER RW SAUNDERS PSIMON A STERL KE TRENBERTH A UNTCH DVASILJEVIC P VITERBO J WOOLLEN 2005 The ERA-
40 re-analysis ndash Quart J Roy Meteor Soc 131 2961ndash3012 DOI101256qj04176
VAN LIPZIG NPM H WERNLI S CREWELL L GANT-NER A BEHRENDT 2005 Synthesis of preliminary re-sults of SPP verification projects ndash Newsletter PP1167lsquoQuantitative Niederschlagsvorhersagersquo 26082005 Nr12005b 25 pp
VIDALE P L D LUTHI C FREI S I SENEVIRATNEC SCHAR 2003 Predictability and uncertainty in a re-gional climate model ndash J Geophys Res 108 (D18) 4586DOI1010292002JD002810
WANG Y L R LEUNG J L MCGREGOR D-K LEEW-C WANG Y DING F KIMURA 2004 Regional cli-mate modeling Progress challenges and prospects ndash JMeteor Soc Japan 82 1599ndash1628
WILL A M BALDAUF B ROCKEL A SEIFERT submit-ted Physics and Dynamics of the CLM ndash Meteorol Z
WU W A H LYNCH A RIVERS 2005 Estimating theuncertainty in a regional climate model related to initial andlateral boundary conditions ndash J Climate 18 917ndash933
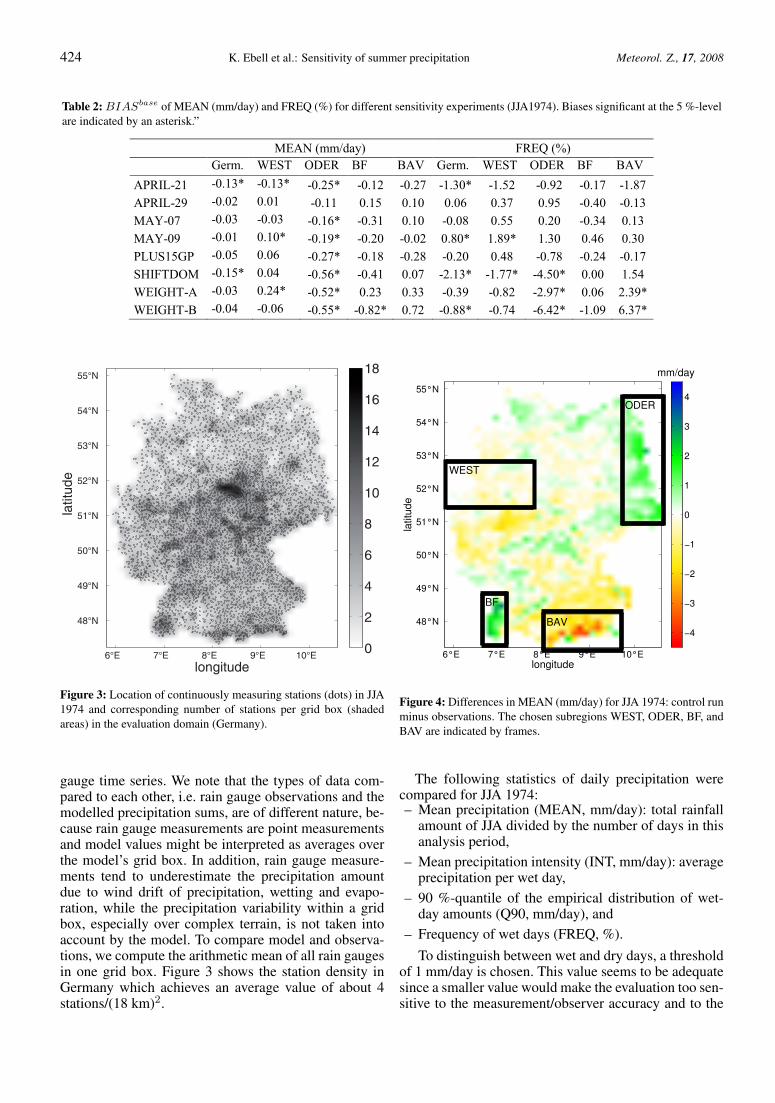
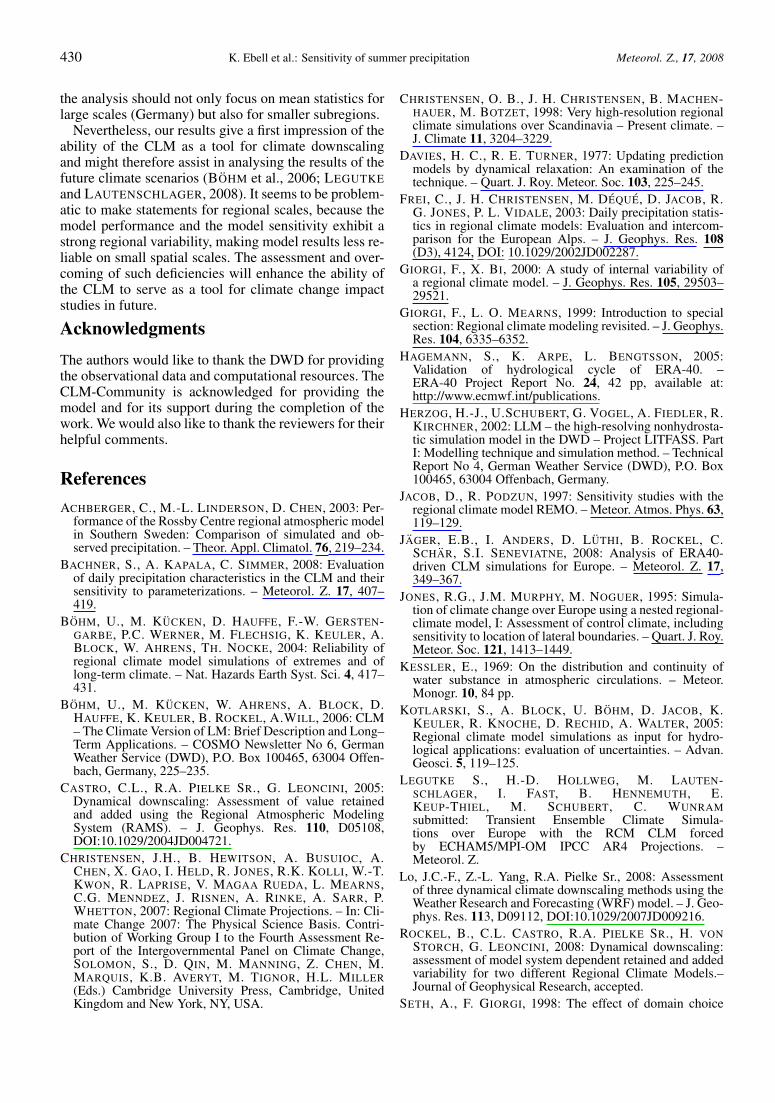