
Sensitivity analysis of a UV radiation transfer model and experimental photolysis rates of NO 2 in...
12
Pergamon Atmospheric Environment Vol. 31, No. 4, pp. 609 620, 1997 Copyright © 1996 Elsevier Science Ltd Printed in Great Britain. All rights reserved PII: S1352--2310(96)00199--9 1352-2310/97 $17.00 + 0.130 SENSITIVITY ANALYSIS OF A UV RADIATION TRANSFER MODEL AND EXPERIMENTAL PHOTOLYSIS RATES OF NO2 IN THE ATMOSPHERE OF MEXICO CITY T. CASTRO,* L. G. RUIZ-SUAREZ,*t J. C. RUIZ-SUAREZ,~" M. J. MOLINA:~ and M. MONTERO* * Centro de Ciencias de la Atm6sfera, UNAM. Circuito Exterior de Cd. Universitaria, M6xico, D.F. 04510; t Departamento de Fisiea, CINVESTAV-IPN, Unidad M6rida, AP 73, CORDEMEX 97310, M6rida Yuc., M6xico; and ~ Chemistry Department, MIT, Cambridge, MA 02139, U.S.A. (First received 19 December 1995 and in final form 19 June 1996) Abstract--Photolysis of key species such as nitrogen dioxide, ozone and aldehydes, are the elementary reactions leading to the formation of photochemical smog. Calculations and experimental measurements (in particular, nitrogen dioxide) of these key reactions are reported, as well as, the sensitivity of them to the ozone column, local albedo and properties of the urban aerosol layer in Mexico City. A radiation transfer model (RTM), based on the delta-Eddington approximation, was used in the calculations. The results show the importartce of providing local resolution for photolysis rates by considering different local conditions within the modeling domain of air quality models. Copyright © 1996 Elsevier Science Ltd Key word index: Nitrogen dioxide, ozone, formaldehyde, photolysis rates, Mexico City. ]INTRODUCTION Air quality models require among other parameters, of the specification of photolysis rate constants (the so-called "J value~¢') of reactions occurring in the troposphere. The most important reactions are: 0 3 "~- hv --* 0 2 -~- O(1D) (R1) NOz + hv ---, NO + O (R2) HCHO + hv --* CO + H2 (R3) HCHO + hv --* HCO + HO2. (R4) These reactions take place in several regions of the solar spectra, mainly between 280 and 420 nm. The constants of dissociation of reactions (R1) and (R2) have been studied experimentally under various at- mospheric conditions. In such experiments a gas mix- ture, placed inside a quartz tube, is exposed to UV radiation. The change of gas concentration after the reaction and the products of secondary reactions are measured following the exposure to solar radiation. The rate of reaction is determined by the time of exposure, the initial concentration of the gas, the concentration of secondary products and by the stan- dard chemical kinetics considerations. In this way, the rates of reactions (R1) and (R2) have been measured in the past, under several atmospheric conditions by several workers (Jackson et al., 1975; Harvey et al., 1977; Zafonte et al., 1977; Sickles et al., 1978; Dickerson et al., 1982; Parrish et al., 1983; Mad- ronich et al., 1983; Junkermann et al., 1989; Shetter et al., 1992; Brauers and Hofzumahaus, 1992). On the other hand, the calculation of J's by radiation transfer models requires major simplifications which usually introduce uncertainties as large as 20% (Madronich, 1987). In these models the transfer equation is solved and the actinic flux is thus obtained (Demerjian et al., 1980; Ruggager et at., 1993, 1994). Recently, prelimi- nary calculations of solar irradianee and photolysis rates for NO2, 03 and HCHO under Mexico City conditions were reported for the first time (Ruiz- Sufirez et al., 1993 a, b). This work has three aims: (a) perform a sensitivity analysis of calculated J's to changes in albedo, to load and refraction index of aerosols, and ozone column. This analysis is used to select possible scenarios for the experiments and to understand the underlying behavior of rate constants when different atmospheric conditions are present, (b) carry out an experimental program to obtain the nitrogen dioxide photolysis rates around the city and (e) adjust our model by comparing the theoretical results with these experimental measurements. In this way, more realis- tic routine calculations of J's can be done for Mexico City. Furthermore, an additional comparison is done against two models reported by (Madronieh, 1987): J = C[f -1 + 2AL]E (1) 609
-
Upload
independent -
Category
Documents
-
view
4 -
download
0
Transcript of Sensitivity analysis of a UV radiation transfer model and experimental photolysis rates of NO 2 in...

Pergamon Atmospheric Environment Vol. 31, No. 4, pp. 609 620, 1997 Copyright © 1996 Elsevier Science Ltd
Printed in Great Britain. All rights reserved P I I : S1352--2310(96)00199--9 1352-2310/97 $17.00 + 0.130
SENSITIVITY ANALYSIS OF A UV RADIATION TRANSFER MODEL AND EXPERIMENTAL PHOTOLYSIS RATES OF NO2
IN THE ATMOSPHERE OF MEXICO CITY
T. C A S T R O , * L. G. R U I Z - S U A R E Z , * t J. C. RUIZ-SUAREZ,~" M. J. MOLINA:~ and M. M O N T E R O *
* Centro de Ciencias de la Atm6sfera, UNAM. Circuito Exterior de Cd. Universitaria, M6xico, D.F. 04510; t Departamento de Fisiea, CINVESTAV-IPN, Unidad M6rida, AP 73, CORDEMEX 97310, M6rida Yuc.,
M6xico; and ~ Chemistry Department, MIT, Cambridge, MA 02139, U.S.A.
(First received 19 December 1995 and in final form 19 June 1996)
Abstract--Photolysis of key species such as nitrogen dioxide, ozone and aldehydes, are the elementary reactions leading to the formation of photochemical smog. Calculations and experimental measurements (in particular, nitrogen dioxide) of these key reactions are reported, as well as, the sensitivity of them to the ozone column, local albedo and properties of the urban aerosol layer in Mexico City. A radiation transfer model (RTM), based on the delta-Eddington approximation, was used in the calculations. The results show the importartce of providing local resolution for photolysis rates by considering different local conditions within the modeling domain of air quality models. Copyright © 1996 Elsevier Science Ltd
Key word index: Nitrogen dioxide, ozone, formaldehyde, photolysis rates, Mexico City.
] I N T R O D U C T I O N
Air quality models require among other parameters, of the specification of photolysis rate constants (the so-called "J value~¢') of reactions occurring in the troposphere. The most important reactions are:
0 3 "~- hv --* 0 2 -~- O(1D) (R1)
NOz + hv ---, NO + O (R2)
HCHO + hv --* CO + H2 (R3)
HCHO + hv --* HCO + HO2. (R4)
These reactions take place in several regions of the solar spectra, mainly between 280 and 420 nm. The constants of dissociation of reactions (R1) and (R2) have been studied experimentally under various at- mospheric conditions. In such experiments a gas mix- ture, placed inside a quartz tube, is exposed to UV radiation. The change of gas concentration after the reaction and the products of secondary reactions are measured following the exposure to solar radiation. The rate of reaction is determined by the time of exposure, the initial concentration of the gas, the concentration of secondary products and by the stan- dard chemical kinetics considerations.
In this way, the rates of reactions (R1) and (R2) have been measured in the past, under several atmospheric conditions by several workers (Jackson et al., 1975; Harvey et al., 1977; Zafonte et al., 1977; Sickles et al.,
1978; Dickerson et al., 1982; Parrish et al., 1983; Mad- ronich et al., 1983; Junkermann et al., 1989; Shetter et al., 1992; Brauers and Hofzumahaus, 1992). On the other hand, the calculation of J's by radiation transfer models requires major simplifications which usually introduce uncertainties as large as 20% (Madronich, 1987). In these models the transfer equation is solved and the actinic flux is thus obtained (Demerjian et al., 1980; Ruggager et at., 1993, 1994). Recently, prelimi- nary calculations of solar irradianee and photolysis rates for NO2, 03 and HCHO under Mexico City conditions were reported for the first time (Ruiz- Sufirez et al., 1993 a, b).
This work has three aims: (a) perform a sensitivity analysis of calculated J 's to changes in albedo, to load and refraction index of aerosols, and ozone column. This analysis is used to select possible scenarios for the experiments and to understand the underlying behavior of rate constants when different atmospheric conditions are present, (b) carry out an experimental program to obtain the nitrogen dioxide photolysis rates around the city and (e) adjust our model by comparing the theoretical results with these experimental measurements. In this way, more realis- tic routine calculations of J 's can be done for Mexico City.
Furthermore, an additional comparison is done against two models reported by (Madronieh, 1987):
J = C [ f -1 + 2AL]E (1)
609

610 T. CASTRO et al.
and
1.35E d ~ (2)
(0.56 + O.03z)cos Oo + 0.21
where C is a constant, f - 1 is a function of the direct and the diffuse downward light, AL is the local albedo, z the altitude, 0o the zenith angle and E the irradiance.
SENSITIVITY ANALYSIS
The radiation transfer model (RTM) is designed to calculate irradiance, actinic flux and photolysis rate constants (Ruiz-Sufirez et al., 1993a, b). The input data for the model are: the concentration profile for some atmospheric components, the absorption and disper- sion coefficients as a function of wavelength (290--400 nm), the spectral quantum efficiencies and the spectral irradiance at the top of the atmosphere (Montero, 1993). We considered an atmosphere of 50 km height, composed of air, nitrogen dioxide, ozone and aerosols. The atmosphere is divided into five layers, the first from 50 to 35 km, the second from 35 to 20 km, the third from 20 to 5 km, the fourth from 5 to 1 km and the fifth from 1 km to the surface. The optical thickness and the albedo for simple dis- persion are calculated in each layer. Aerosols are considered only in the fifth layer.
We measured UV surface albedo in differents parts of Mexico City and found, for asphalted surfaces, an albedo of 0.05, and for gray cement surfaces, an al- bedo of 0.10, in the region of UV. A value of 0.15 corresponds to forested areas (Dickerson, 1980). With
respect to the ozone column and according to the work reported by Bravo (1984), we used 240, 270, 290 and 300 DU. Dust aerosols could be formed of clay with a typical refractive index value of 1.6 + 0.005i. On the other hand, urban aerosols are particles with high organic content and a refractive index of 1.4 + 0.005i could be used (Finlayson-Pitts and Pitts, 1986). The aerosol size distribution for the atmo- sphere of Mexico City (Fig. 1), can vary from 0.05 to 1 #m (Montafiez and Garcia-Garcia, 1993). According to Junge (1969), the size average distribution for aero- sols larger than 0.1/~m of radius can be described by
AN - - = c r ~ (3) Ar
where A N / A r is the particle concentration per size interval, r is the radius of the particles and, c and ~ are constants. For r > 0.09, Junge's functional form is satisfied for the set of analyzed data by Montafiez and Garcia-Garcia (1993). Thus, the equation could be written as
Ar = n (4)
where N is the concentration of particles with radius larger than r (ro--0.05 is the minimum value for which equation (4) is valid). The values they reported for :t are: 3 for a polluted urban atmosphere, 4 for a clean urban atmosphere and 5 for a continental atmosphere, which agrees with Junge (1969) and some results found in this work.
Tables 1-3 summarize the results of the sensitivity analysis for (R1), (R2) and (R4) with the RTM model
1 x E+8
1 x E+7
I
E 1 x E+6
I
E 1 x E+5
¢~: 1 x E+4
Z 1 x E+3 Z
0
I x E+2
1 x E+I
0.001
i I
- i i .
[ ".,| = | ~ ~
: : : : : : : : . : : : : : : : : ; :
o.o i 0.1
RADIUS (# , . )
• • • • ¢ i ¢ I
1
Fig. 1. Aerosols size distribution in Mexico City (Montafiez and Gareia-Garcia, 1993).

UV radiation transfer model
Table 1. Sensitivity of ozone photolysis rates to changes in albedo, ozone column, load
refraction index and aerosol
611
Dobson units Dobson units Dobson units
24C, 270 290 300 240 270 290 300 240 270 290 300 R index
a 0.05 25./ 2.2 - 11.8 - 23.1 49.9 25.8 12.6 6.7 47.8 24.1 11.0 5.2 1.4 1 47.6 24.1 l l . l 5.4 49.3 25.2 11.1 6.2 48.8 25.0 11.8 6.0 1.6 b 0.10 39.9 14.3 0.0 - 6 . 6 63.6 37.3 22.8 16.4 61.1 24 .1 21.0 14.7 1.4 e 60..'; 34.9 20.8 14.6 62.9 36.7 22.2 15.9 62.3 36.3 21.9 15.6 1.6 d 0.15 54.4. 26.5 11.2 4.4 77.6 49.0 33.3 6.7 74.9 46.9 31.4 24.5 1 . 4 o 73.~; 46.1 30.8 24.1 76.9 48.4 32.7 25.8 76.1 47.9 32.3 25.4 1.6
~ = 3 ~ = 4 ~t=5
to changes in the above-ment ioned parameters and a zeni th angle of 688, which corresponds to summer solistice at 1 pm in~ Mexico City. The small boxes in the mat r ix conta in percentage changes related to the reference case (albedo 0.10, refract ion index 1.4 + 0.005i, 290 D U and ~ = 3), which represent a mean u r b a n albedo, me~n annua l ozone column with the mean u r b a n ozone included and high pol lut ion case.
Table 1 shows tha t the ozone photolysis cons tan t decreases 12% when the surface a lbedo is decreased from 0.10 to 0.05 and increases 11% when moving to an area out of the city with a lbedo 0.15. As we can see, a change of approximate ly 23% in the values of the ozone rate cons tants m ay be ob ta ined when moving from one par t of the city to ano the r main ta in ing all the o ther parameters the same. Ni t rogen dioxide and formaldehyde have similar behavior as ozone (Tables 2 and 3). Wi th respect to the ozone column, it can be observed that the ozone photolysis cons tan t decreases a lmost 7 % when passing from 290 to 300 D U (which represents the annua l m a x i m u m at Mexico City latit- udes) and increases 40% when going from 290 to 240 D U (annual m i n i m u m and clean atmosphere) . For - maldehyde and ni t rogen dioxide are less sensitive to these changes. Moreover , under these condi t ions a change on the aerosol refractive index from 1.4 (organic) to 1.6 (dust) leads to an increase of a lmost 20% in the ozone photolysis rate constant . O the r scenarios may be analyzed; winds s t rong enough to swap away the smog layer (270 D U and ~t = 4), may lead to an increas,~ of 37.3%. Wi th the d o m i n a n t presence of dust aerosols, the increase may be smaller (36.7%). U n d e r similar condi t ions but with a more reflective surface, such as is found southwest of the city, the ozone photolysis rate may increase by 48.4%.
The above results lead us to carry out a series of experiments in order to measure the photolysis con- s tants of the (RI~IR4) react ions in several Mexico City places. The second par t of this work reports only exper imenta l da ta for n i t rogen dioxide.
EXPERIMENTAL SECTION
A full description of the experimental set up is given elsewhere (Castro et al., 1995), here a brief description is
provided. A constant flow of diluted N O 2 (45.3 ppm) in nitrogen (ALPHAGAZ) was passed through a cylindrical quartz reactor and measured with an NO x monitor. Expo- sure time was controlled by covering part of the reactor tube from sunlight. All gas tubing was made of teflon covered with black tape. The reactor was supported by a metal frame (30 cm high) painted black. Underneath the frame a black cloth was placed extending about 2 m each side. Simulta- neous recording of the outputs from the NOx monitor an UV radiometer, a J termopar and a pressure transducer placed at the end of the reactor, were made every minute from 7 to 10 h depending on the measurement period using an A/D card in a PC.
Measurements at the Estadio Ol~mpico The Estadio Olimpico is located at the University Cam-
pus, south of Mexico City (19 ° 19' 50" north latitude, 99 ° 11' 03" longitude and 2280 m above sea level) and it is sur- rounded by trees, gardens and volcanic lava. The surface albedo we considered was 0.13 (Finlayson-Pitts and Pitts, 1986; Dickerson, 1980). The measurements were carried out on 30 November, 1, 3 and 4 December 1993. There were clear skies during these days with exception of the last day, which was partially foggy. The solar zenith angle in this site was 41.66 ° at 12:30 h (local time).
The experimental values of J(NO~) (solid triangles) and the Eppley irradiance measurements (solid line) at the Es- tadio Olimpico are shown in Fig. 2. We observe that the minimum and maximum values in both curves are well correlated. However, after 13 : 30 the curves show a displace- ment, which could be caused by the presence of a roof structure (increasing the local albedo) near to the experiment and the cosine response of the radiometer with zenith angle. This construction was located 70 m southeast of reactor axis, which in turn was oriented perpendicular to the sun traject- ory plane during the day. In this location the reactor and the radiometer were placed on the top of a mobile laboratory, the instruments and the roof structure were almost on the same plane. At large zenith angles, particularly in the after- noon, the horizontally placed reactor tube would get more light than the upward facing radiometer window. Therefore, the radiation measurements would drop faster than the J values, As it is observed from the displacement of the cu rv es .
Theoretical values of the nitrogen dioxide photolysis con- stants were calculated in clear sky conditions, 2240 m above sea level, regional albedo of 0.13 for 2 < 410 nm, 290 DU (the mean ozone column at this latitude is 270 DU but 20 DU are added to account for the impact of urban ozone which in 1989 was found to contribute with 18 DU (Ju~trez et al., 1994), ~ = 3 and refractive index of 1.4 + 0.005i.
In general, direct light as well as downward and upward diffuse light are considered when calculating J's. However, in order to compare with the experimental values, the upward diffuse light is not considered in the calculations.

Tab
le 2
. Se
nsit
ivit
y of
nit
roge
n di
oxid
e ph
otol
ysis
ra
tes
to c
hang
es
in a
lbed
o,
ozon
e co
lum
n,
refr
acti
on i
ndex
and
ae
roso
l lo
ad
Dob
son
unit
s D
obso
n un
its
Dob
son
unit
s
240
270
290
300
240
270
290
300
240
270
290
300
R in
dex
0.05
-
8.22
-
8.43
-
8.56
-
8.63
-
8.40
-
8.18
-
8.74
-
8.80
-
9.22
-
9.42
-
9.55
-
9.61
1.
4 -
6.96
-
7.16
-
7.29
-
7.35
-
7.97
-
7.29
-
7.35
-
8.38
-
8.91
-
9.12
-
9.25
-
9.31
1.
6
0.10
0.
38
0.15
0.
0 -
0.07
0.
27
0.04
-
0.10
-
0.17
-
0.56
-
9.42
-
0.93
-
1.00
1.
4 1.
33
1.12
0.
98
0.91
0.
69
0.46
0.
31
0.25
-
0.25
-
0.48
-
0.62
-
0.69
1.
6
0.15
9.
17
8.92
8.
76
8.68
9.
14
8.89
8.
73
- 8.
80
8.31
8.
07
7.91
7.
84
1.4
9.86
9.
62
9.47
9.
40
9.56
9.
31
9.15
9.
08
8.63
8.
39
8.23
8.
15
1.6
~=3
ct=4
ct
=5
Tab
le
3.
Sens
itiv
ity
of f
orm
alde
hyde
ph
otol
ysis
ra
tes
(rea
ctio
n R
4) t
o ch
ange
s in
alb
edo,
oz
one
colu
mn,
re
frac
tion
ind
ex a
nd
aero
sol
load
¢3
-]
©
Dob
son
unit
s D
obso
n un
its
Dob
son
unit
s
240
270
290
300
240
270
290
300
240
270
290
300
R in
dex
0.05
--
0.9
5 -
5.87
--
8.9
2 -
10.3
9 1.
03
- 3.
76
- 6.
72
- 8.
10
- 0.
05
- 4.
78
-- 7
.71
-- 9
.07
1.4
- 1.
19
-- 5
.81
- 8.
67
- I0
.01
1.15
-
3.65
--
8.6
7 -
8.00
0.
41
- 4.
34
- 7.
28
- 8.
65
1.6
0.10
8.
70
3.33
0.
0 -
1.56
9.
68
5.20
1.
96
0.45
9.
28
-- 4
.78
0.90
-
0.60
1.
4 7.
52
2.49
-
0.62
-
2.08
10
.55
5.30
2.
05
0.54
9.
75
4.55
1.
33
-- 0
.17
1.6
0.15
18
.64
12.7
9 9.
17
7.48
20
.15
14.4
4 10
.91
- 8.
10
18.9
4 13
.28
9.79
8.
16
1.4
16.5
5 11
.09
7.72
6.
14
20.2
5 14
.53
10.9
9 9.
34
19.4
2 13
.75
10.2
4 8.
61
1.6
ct=3
~=
4 ct
=5

UV radiation transfer model 613
~0
¢:,
>t
0 Z
Estadio Olimpico, Mexico City
0 I r J ~ t I E J 8 9 10 11 12 13 14 16 16 17 18
local time (h)
-4 A
E 3 o
E 2
¢J
1 S , m
0
Fig. 2. Experimental values for J(NO2) and readings in the Eppley radiometer as a function of time (continuous line), Estadio Olimpico, Mexico.
Estadio Olimpico, Mexico City
.-)
0.002
0 8 9 10 11 12 13 14 15 16 17 18
local time (h)
Fig. 3. Comparison between experimental and theoretical values of the nitrogen dioxide photolysis constant at the Estadio Olimpico; (a) experimental (solid triangles); (b) calculated (solid squares), (c) cal- culated without the contribution of upward diffuse light (empty squares); (d) calculated with equation (1)
(solid circles) and (e) calculated with equation (2) (empty circles).
Figure 3 shows experimental values in intervals of 30 rain (solid triangles), the v~Jues calculated with all contributions, direct, upward and downward light (solid squares) and the ones calculated without the contribution of the upward diffuse light (empty squares). Values calculated with equa- tion (1) are also shown (solid circles), where f is calculated with our model (Monlero, 1993) and E is the UV irradiance measured in situ with the Eppley radiometer. It is clear that the best agreement between experimental and theoretical J values is the one corresponding to empty squares (without upward diffuse light). Both Madronich models agree well with the experimenteL1 values before noon and strongly underestimate the exl:¢rimental values of J(NOz) whereas the RTM model with all light contributions yields in general larger values for J(NO2).
Measurements at the Palacio de Mineria The experiment was carried out on the roof of the Palacio
de Mineria, located downtown Mexico City (19 ° 25' 59"
north latitude, 99 ° 07' 58" longitude and 2233 m a.s.l). It is surrounded by buildings and concrete streets. The surface albedo considered for this place is 0.10. The measurements were carried out on 9-13 February 1994, days of high con- tamination (visibility between 500-700 m), clear sky (except day 11 which had few high cirrus clouds). The zenith angle in this period was 34.06 ° at 12:30 h (local time). The concentra- tion of particles with diameters of 0.4-1 were also registered at this place.
Figure 4 shows the J(NO2) experimental values (solid triangles) and the Eppley measurements (with intervals of 1 min). As in Fig. 2, the curves are in good correlation, but compared to the irradiance curve (continuous line) a dis- placement is noticeable between 14:00 and 16:00 h. This behavior can be explained by the presence of large buildings located southeast of the radiometer. Although these build- ings did not obstruct the direct sun light arriving to the reactor they had influence on the photolysis constant measurements (the multiple reflections from these buildings and structures may increase the diffuse light reaching the

614 T. CASTRO et al.
reactor compared to that arriving at the flat surface of the radiometer).
Theoretical values of J(NO2) were calculated for the following conditions: regional albedo of 0.10, ozone column of 290 DU, aerosols refractive index of 1.4 + 0.005i and ~ = 3. Upon analyzing the aerosol concentration (Fig. 5) we find that this value of ct is in good agreement with the value presented by Montafiez and Garcia-Garcia (1993).
Figure 6 shows the J(NO2) experimental values (solid triangles), the calculated ones (solid squares), and the cal- culated values without the contribution of the upward dif- fuse light (empty squares). The solid and empty circles are the values calculated with Madronich's formula and Mad- ronich's parameterized formula, respectively. Again Mad- ronich models agree well with the experimental values before noon and in this location agreement with the experimental
data was better. It can be seen that our model overestimates the J's, especially during the first hours of the day and in the afternoon, when attenuated or modified light arrives to the reactor (the presence of buildings are not accounted for in the model).
Measurements at the Instituto Mexicano del Petrebleo (IMP)
The experiment was located on the roof of the Geophysics department in the IMP located north Mexico City (19 ° 28' 48" north latitude, 99 ° 11' 07" longitude and 2277 m a.s.l.) surrounded by buildings, gardens and asphalt streets. The regional albedo considered for this place is 0.10. The measurements were carried out during 23-27 March 1994. There were clear skies during these days, high pollution during the mornings (visibility between 500 and 700 m) but low pollution during the afternoons due to winds. The
8
w " - " 6
c? o
4 x
Z 2
0 8
Palacio de Mineria, Mexico City
/ I I
9 10 11
4
.............. ..... t I I I
12 13 14 15 16 17 18 local time (h)
Fig. 4. Experimental values of ,](NO2) and Eppley radiometer readings as function of the time, 10-13 February 1994, Palacio de Mineria, Mexico City.
1 E+07
E IE+06 ?
L:: 1E+05 ¢3
1E+04 .o
1E+03 q),a
q) 1 E+02 u c 0
1E+01
1 E+O0
Palacio de Mineria
0.1 1 radius (pm)
Fig. 5. Particle concentration profile, Palacio de Mineria, Mexico City.
[ ]
,, i! j!iiii! III I!I!II! I I I I L I I I I I I I I I L ~ 1
10

UV radiation transfer model 615
Palacio de Mineria, Mexico City © .010 I
0.008 . . . . . . . . . . . . . . . . . . . . . . . . . . . . . . . . . . . . . . . . . . . . . . . . . . . . . . . . . . . . . . . . . . . . . . . . . . . . . . . . . . . . . . . . . . . . . . . . . . . . . . . . . . . . . . . . . . . . . . . . . . . . . . . . . . . . . . . . . . . . . . . . . . . . . . . . . . . . . . . . . . . . . . . . . . . .
- 0.006
0.OO4
0 . 0 0 2
0 . 0 0 0 8 9 10 11 12 13 14 15 16 17 18
local time (h) Fig. 6. Experimental and theoretical values of the nitrogen dioxide photolysis constant at the Palacio de Mineria; (a) experimental (solid triangles); (b) calculated (solid squares); (c) calculated without the contri- bution of upward diffuse light (empty squares); (d) calculated with the equation (1) (solid circles); and
(e) calculated with equation (2) (empty circles).
4" E
? E o
e =
.o E < . i c o t... 0 o
Instituto Mexicano del Petr61eo 1 E+06
1 E+O5
1 E+04
1 E+03
1E+02
1 E+01
1 E+O0 0 . 1
[ ] D
iili iil i i iiiiii ii! !i!i!!iiiiiiiiiiiiiiiiiiiiiiiiiiiiill iiiiiiiiiiiii ii iiiiiiiiiii i iiii i ii i iiiiiii i iiiii iiiiiiiiiiii i iiiiiiiii I ) I ) I I I l l I I I I I I I I
1 10 radius (pm)
Fig. 7. Particle concentration profile, Instituto Mexieano del Petr61eo, Mexico City.
zenith angle was 17.90 ° at 12:30 h (local time). The particle concentration profile is shown in Fig. 7.
Figure 8 shows the J(NO2) experimental values (solid triangles) and the irradiances. The curves are correlated well, al though a small displacement is observed in the afternoon.
The J(NO2) theoretical values were found with the follow- ing conditions: regional albedo o f 0.10, ozone column of 290DU, particle refraction index of 1.4 +0.005i and
= 3.24. Figure 9 shows the experimental data (solid tri- angles) and the calculated ones.
Measurement at Tres Marias, Morelos, Mexico
Tres Marias is a town near Mexico City (19 ° 03' north latitude, 99 ° 14' longitude and 2810 m a.s.l.). The landscape is mainly grassland, trees and pines. The considered regional sur- face albedo was 0.15 (Finlayson-Pitts and Pitts, 1986). Meas- urements were carried out on 11-15 April 1994. There were clear skies and a clean atmosphere. The zenith angle was 11.13 ° at 12:30 h (local time). Figure 10 shows particle profile here.
As in the other experiments, Fig. 11 shows the J(NO2) the experimental values (solid triangles) and the measured
616 T. CASTRO et al.
Inst i tuto M e x i c a n o del Petr61eo M e x i c o Ci ty
10
8 4 "
. 6 ? o
x 4
0 Z
. . . . . . . . . . . . . . . . . . . . . . . . . . 1
~ - - ~ + - ~ b q q ~ 0 6 9 10 11 12 13 14 15 16 17 18
local time (h)
A o/, E o
E Q- o
.m_ "O
Fig. 8. Experimental values of J(NO2) and readings from the Eppley radiometer as function of time, 24-27 March 1994, Instituto Mexicano del Petr61eo, Mexico City.
0 .010
, - , 0 .008 "7,
0~
. 0 . 006
0 Z 0.0O4
0 .002
I n s t i t u t o M e x i c a n o de l P e t r 6 1 e o Mexico City
0 .000 I I I I I I I I I 8 9 10 11 12 13 14 18 16 17 18
local t ime (h)
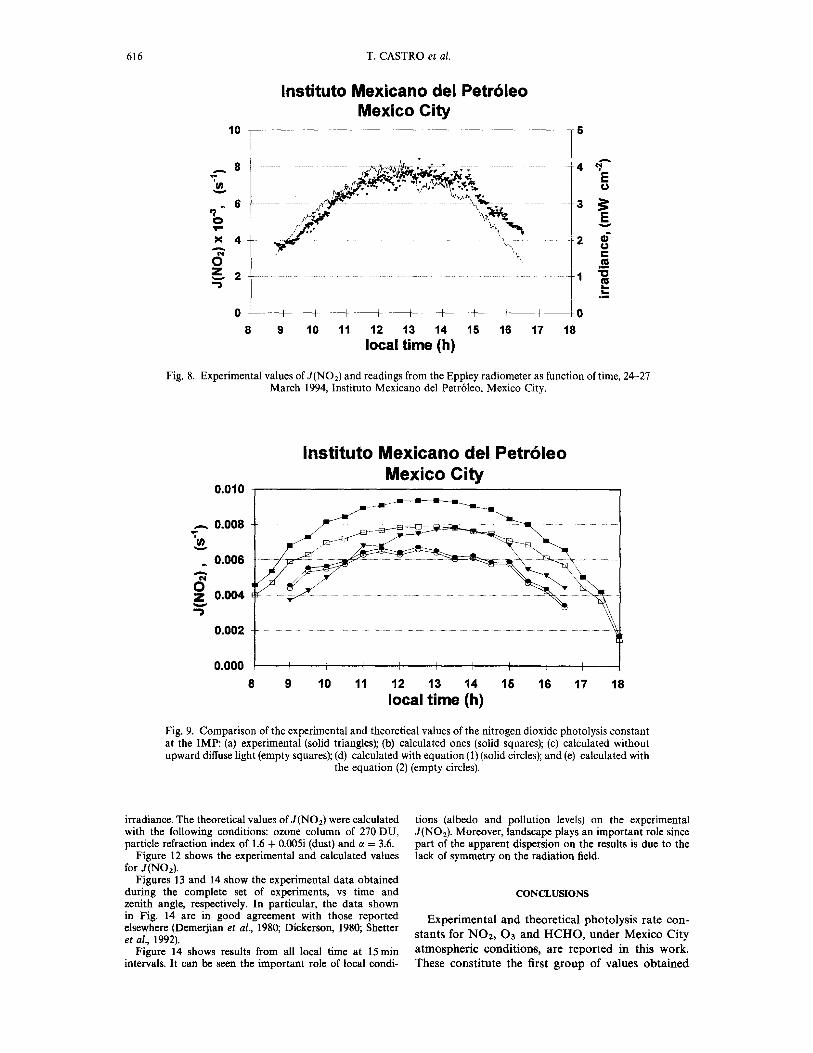
Fig. 9. Comparison of the experimental and theoretical values of the nitrogen dioxide photolysis constant at the IMP: (a) experimental (solid triangles); (b) calculated ones (solid squares); (c) calculated without upward diffuse light (empty squares); (d) calculated with equation (1) (solid circles); and (e) calculated with
the equation (2) (empty circles).
irradiance. The theoretical values of J(NO2) were calculated with the following conditions: ozone column of 270 DU, particle refraction index of 1.6 + 0.005i (dust) and ct -- 3.6.
Figure 12 shows the experimental and calculated values for J(NO2).
Figures 13 and 14 show the experimental data obtained during the complete set of experiments, vs time and zenith angle, respectively. In particular, the data shown in Fig. 14 are in good agreement with those reported elsewhere (Demerjian et al., 1980; Dickerson, 1980; Shetter et al., 1992).
Figure 14 shows results from all local time at 15 min intervals. It can be seen the important role of local condi-
tions (albedo and pollution levels) on the experimental J(NO2). Moreover, landscape plays an important role since part of the apparent dispersion on the results is due to the lack of symmetry on the radiation field.
CONCLUSIONS
Experimental and theoretical photolysis rate con- stants for NOz, 03 and H C H O , under Mexico City atmospheric conditions, are reported in this work. These constitute the first group of values obtained

UV radiation transfer model 617
E
E r j
c- O
( -
0
' IE+06
Tres Marias, Morelos, Mexico
'1E.H)5
' IE+04
' IE+03
'1E+02
'1E+01
1E+O0 0.1 1 10
radius (pro)
Fig. 10. Particle concentration profile, Tres Marias, Morelos, Mexico.
12
10 A "7, U) " " 8
0 ~-- 6 X
" ~ 4 0 Z " ) 2
/-"
Tres Marias, Morelos, Mexico
8 9 10 t l 12 13 14 lS 16 17 local time (h)
6
s _=
- 4
E - - - 3
o .......... 2 t- .m "o
1 t*
- - - O
18
Fig. ll. Experimental values of J(NO2) and readings from Eppley radiometer as function of the time (continuos line), 12-15 April 1994, Tres Marias, Morelos, Mexico.
under real conditions which clearly could be used in air quality models (AQM) for the city. Our radiation transfer model for Mexico City was calibrated by direct comparisons with experimental photolysis rates of nitrogen dioxide. In all cases the higher J(NO2) values provided by the model at sunrise and sunset could be explained by the fact that currently the model does not consider the presence of high moun- tains to the east, south and west of the city. The west
mountains are much nearer to the city that the east ones. The model is oblivious to the presence of the mountains; the reactor gets more diffuse light than the zenith facing radiometer, thus, this one, it is more sensitive to the presence of mountains and buildings. This fact may also explain the better agreement of Madronich models with the experimental values before noon and the strong underestimation in the afternoon as J is a function of E. The results show the

618 T. CASTRO et al.
Tres Marias, Morelos, Mexico 0"012 t
~ 0.010 ................................................................................ ~ " ~ ~ ~- ...................................................................................................................................................
0 . 0 o 6 ..................... i . . . . . . . . . . . . . . . . . . . .
zO ~ 0"006
0.004
0.002
0.000
"7
8 9 10 11 12 13 14 15 16 17 18 local time (h)
Fig. 12. Comparison of the experimental and theoretical values of the nitrogen dioxide photolysis constant at Tres Marias, Morelos: (a) experimental (solid triangles); (b) calculated (solid squares); (c) calculated with no upward diffuse light (empty squares); (d) calculated with equation (1) (solid circles); and
(e) calculated with equation (2) (empty circles).
0.010
0.008
0.006
O 0.004 Z
0 . 0 O 2
0.000 I I I I t I I f J 8 9 10 11 12 13 14 15 t8 17 18
local time (h)
Fig. 13. Experimental values of J(NO2) in four different locations in Mexico. Estadio Olimpico (circles), Palacio de Mineria (squares), Instituto Mexicano del Petrbleo (triangles), Tres Marias (crosses).
importance of providing local resolution for photoly- sis rates by considering different local conditions within the modeling domain of an AQM. Our calcu- lations also show that ozone photolysis is more sensitive to local conditions than NO2 photolysis. Experimental measurements for ozone are under way.
Acknowledgements--The authors wish to thank Dr Carlos Gay for his comments, and also to Bertha Mar and Alfredo Rodrlguez for his help in the experimental part and Agustin Muhlia and Vidal Valderrama for his help in obtaining the aerosol records. This work was supported by Programs PAPID and PADEP of UNAM and Instituto Mexicano del Petr61eo.

UV radiation transfer model 619
0.010
0.1)08
"7 0.1)06
~ 0.1)04 Z
0.1)02
0.000
-N- + 4-
4- _~_ +
......................................... ~-e ............. ; ........................... • ....................................................................................................................................................
v ~ oo [] ~ 4 7 ° o
o [ ]
. . . . . . . . . . . . . . . . . . . . . . . . . . . . . . . . . . . . . . . . . . . . . . . . . . . . . . . . . . . . . . . . . . . . . . . . . . . . . . . . . . . . . . . . . . . . . . . . . . . . . . . . . . ~ a ~ s" '~-o . . . . . . . . . . . . . . . . . . . . . . . . . . . . . . . . . . . . . . . . . . . . . . . . . . . . . . . . . . . . . . . . . . . . . . . . . . . . . . . . . . . . . . . . . . . . . . . . . . .
[ ] o v ~ + o a-~ v nO~
[ ]
E?E] o
0 30 60 90 z e n i t h angle (degrees)
Fig. 14. J(NO2) vs zenith angle. Estadio Olimpico (circles), Palacio de Minefia (squares), Instituto Mexiacno del Petr61eo (triangles), Tres Marias (crosses).
REFERENCES
Brauers T. and Hofzuraahaus A. (1992) Latitudinal variation of measured NO2 photolysis frequencies over the Atlantic Ocean between 50°N and 30°S. J. atmos. Chem. 15, 269-282.
Bravo C. J. (1984) Delerminacibn del espesor de la capa de ozono con un espectrofotbmetro de Dobson en una at- mbsfera urbanaa. Tesis de Maestria, Fac. de Ciencias, UNAM, M6x.
Castro T., Ruiz Sufirez L. G., Gay C., Helguera M. and Ruiz Su~rez J. C. (1995) r)irect measurements of NO2 photoly- sis for Mexico City. ATMOSFERA 8, 137-142.
Demerjian L. K., Schere L. K. and Peterson T. J. (1980) Theoretical estimates of actinic (spherically integrated) flux and photolytic rate constant of atmo- spheric species in tile lower troposphere. In Advances in Environmental Sciences and Techology, Vol. 10. Wiley, New York.
Dickerson R. R. (1980) Direct measurement of ozone and nitrogen dioxide photolysis rates in the atmosphere. Ph. D. thesis, Univ. of Michgan, Ann Arbor.
Dickerson R. R. and Sledman D. H. (1980) Precision of NO2 photolysis rate measurements. Envir. Sci. Technol. 14, 1261-1262.
Dickerson R. R., Stedman H. D. and Delany C. A. (1982) Direct measurements of ozone and nitrogen dioxide photolysis rates in 1:he troposphere. J. geophys. Res. 87, 4933-4946.
Finlayson-Pitts B. and Pitts J. (1986) Atmospheric Chemistry. Wiley, New York.
Harvey R. B., Stedman D. H. and Chameides W. (1977) Determination of the absolute rate of solar photolysis of NO2. J. Air Pollut. Control Ass. 27, 663.
Jackson J. O., Stedmar. D. H., Smith R. G., Hecker L. H. and Warner P. O. (1975) Direct NO2 photolysis rate monitor. Rev. Sci. Instrum. 4~;, 376-378.
Jufirez A., Gay C. and Bravo J. L. (1994) Influence of urban ozone in the measurements of the total ozone column in Mexico City. ATM¢)FERA 8, 35-43.
Junge C. E. (t969) Comments on concentration and size distribution measurements of atmospheric aerosols and test of theory of self-preserving size distributions. J. atmos. Sci. 26, 603-608.
Junkermann W., Platt U. and Volz-Thomas A. (1989) A photoelectric detector for the measurement of photoly- sis frequencies of ozone and other atmospheric molecules. J. atmos. Chem. $, 203-227.
Madronieh S., Hastie D. R., Ridley B. A. and Shift H. I. (1983) Measurement of the photodissociation coeficient of NO2 in the atmosphere: I. Method and surface measure- ments. J. atmos. Chem. 1, 3-25.
Madronich S. (1987a) Photodissociation in atmosphere, 2. Actinic flux and the effects of ground reflections and clouds. J. geophys. Res. 92, 9740-9752.
Madronich S. (1987b) Intercomparison of NO2 photodis- sociation and U.V. radiometer measurements. Atmo- spheric Environment 21, 569-578.
Montafiez R. A. and Garcia-Garcia F. (1993) Some urban and meteorological effects on the production of cloud condensa- tion nuclei in Mexico city. ATMOSFERA 6, 39-49.
Montero M. M. (1993) Determinacibn te6rica de coeficientes de correlaci6n entre irradiancia en superficie y, razones fotoliticas del NO2. Master thesis, Fac. de Ciencias, UNAM. Mexico.
Parrish D. D., Murphy P. C., Albritton D. L. and Fehsenfeld F. C. (1983) The measurement of the photodissociation rate of NO2 in the atmosphere. Atmospheric Environment 17, 1365-1379.
Ruggaber A., Forkel R. and Dlugi R. (1993) Spectral actinic flux and its ratio to spectral irradiance by radiation trans- fer calculations. J. geophys. Res. 98, i 151-1162.
Ruggaber A., Dlugir R. and Nakajima T. (1994) Modelling radiation quantities and photolysis frequencies in the troposphere. J. atmos. Chem. 18, 171-210.
Ruiz-Sufirez J. C., Ruiz-Sufirez L. G., Gay C., Castro T., Montero M., Eidels-Dubovoi S. and Muhlia A. (1993a) Photolytic rates for NO2, 03 and HCHO in the atmo- sphere of Mexico City. Atmospheric Environment 27A, 427-430.

620 T. CASTRO et al.
Ruiz Sufirez J. C., Ruiz-Sufirez L. G., Castro T., Gay C. and Eidels-Dubovoi S. (1993b) Photolysis of nitogen dioxide and ozone in the atmosphere of Mexico City. In Air Pollution. Computational Mechanics Publications.
Shetter E. R., McDaniel H. A., Cantrell A. Ch., Madronich S. and Calvert J. G. (1992) Actinometer and eppley radiometer measurements of the NO2 photolysis rate coef- ficient during Mlopex. J. geophys. Res. 97, 10349-10359.
Sickles J. E. II, Ripperton L. A,, Eaton W. C. and Wriht R. S. (1978) Nitrogen dioxide photolytic radiometric and me- teorological field data. EPA-600/7-78-053, EPA, Research Triangle Park, North Carolina.
Zafonte L., Rieger P. L. and Holmes J. R. (1977) Nitrogen dioxide photolysis in the Los Angeles atmosphere. Envir. Sci. Technol. 11, 483-487.